Orrtanna, PA Map & Demographics
Orrtanna Map
Orrtanna Overview
$29,383
PER CAPITA INCOME
$38,750
AVG HOUSEHOLD INCOME
0.32
INEQUALITY / GINI INDEX
81
TOTAL POPULATION
30
MALE POPULATION
51
FEMALE POPULATION
58.82
MALES / 100 FEMALES
170.00
FEMALES / 100 MALES
52.4
MEDIAN AGE
3.2
AVG FAMILY SIZE
1.9
AVG HOUSEHOLD SIZE
27
LABOR FORCE [ PEOPLE ]
42.9%
PERCENT IN LABOR FORCE
18.5%
UNEMPLOYMENT RATE
Orrtanna Zip Codes
Orrtanna Area Codes
Income in Orrtanna
Income Overview in Orrtanna
| Characteristic | Number | Measure |
| Per Capita Income | 81 | $29,383 |
| Median Family Income | 16 | $0 |
| Mean Family Income | 16 | $72,813 |
| Median Household Income | 42 | $38,750 |
| Mean Household Income | 42 | $54,893 |
| Income Deficit | 16 | $0 |
| Wage / Income Gap (%) | 81 | 0.00% |
| Wage / Income Gap ($) | 81 | 100.00¢ per $1 |
| Gini / Inequality Index | 81 | 0.32 |
Earnings by Sex in Orrtanna
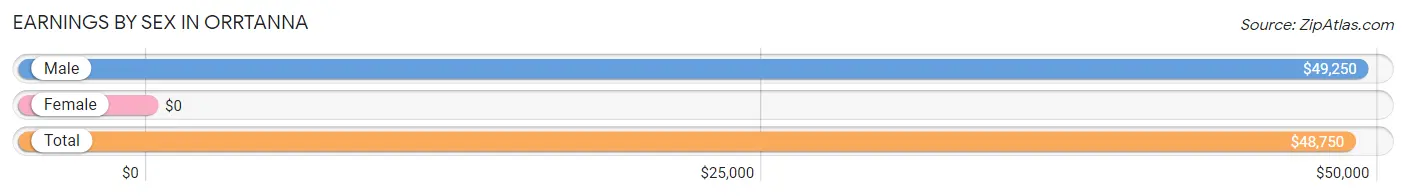
| Sex | Number | Average Earnings |
| Male | 13 (52.0%) | $49,250 |
| Female | 12 (48.0%) | $0 |
| Total | 25 (100.0%) | $48,750 |
Earnings by Sex by Income Bracket in Orrtanna
The most common earnings brackets in Orrtanna are $45,000 to $49,999 for men (8 | 61.5%) and $55,000 to $64,999 for women (5 | 41.7%).
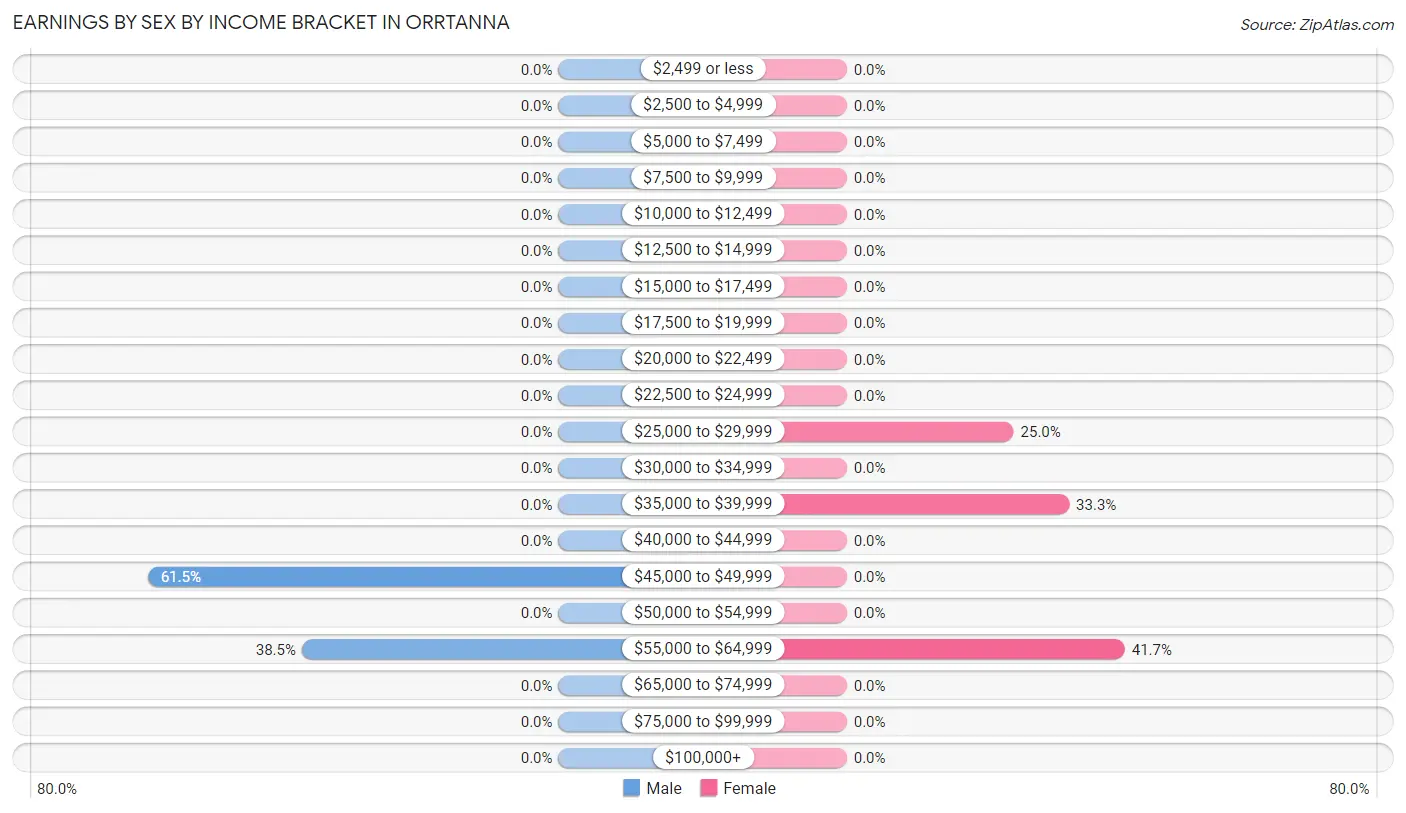
| Income | Male | Female |
| $2,499 or less | 0 (0.0%) | 0 (0.0%) |
| $2,500 to $4,999 | 0 (0.0%) | 0 (0.0%) |
| $5,000 to $7,499 | 0 (0.0%) | 0 (0.0%) |
| $7,500 to $9,999 | 0 (0.0%) | 0 (0.0%) |
| $10,000 to $12,499 | 0 (0.0%) | 0 (0.0%) |
| $12,500 to $14,999 | 0 (0.0%) | 0 (0.0%) |
| $15,000 to $17,499 | 0 (0.0%) | 0 (0.0%) |
| $17,500 to $19,999 | 0 (0.0%) | 0 (0.0%) |
| $20,000 to $22,499 | 0 (0.0%) | 0 (0.0%) |
| $22,500 to $24,999 | 0 (0.0%) | 0 (0.0%) |
| $25,000 to $29,999 | 0 (0.0%) | 3 (25.0%) |
| $30,000 to $34,999 | 0 (0.0%) | 0 (0.0%) |
| $35,000 to $39,999 | 0 (0.0%) | 4 (33.3%) |
| $40,000 to $44,999 | 0 (0.0%) | 0 (0.0%) |
| $45,000 to $49,999 | 8 (61.5%) | 0 (0.0%) |
| $50,000 to $54,999 | 0 (0.0%) | 0 (0.0%) |
| $55,000 to $64,999 | 5 (38.5%) | 5 (41.7%) |
| $65,000 to $74,999 | 0 (0.0%) | 0 (0.0%) |
| $75,000 to $99,999 | 0 (0.0%) | 0 (0.0%) |
| $100,000+ | 0 (0.0%) | 0 (0.0%) |
| Total | 13 (100.0%) | 12 (100.0%) |
Earnings by Sex by Educational Attainment in Orrtanna
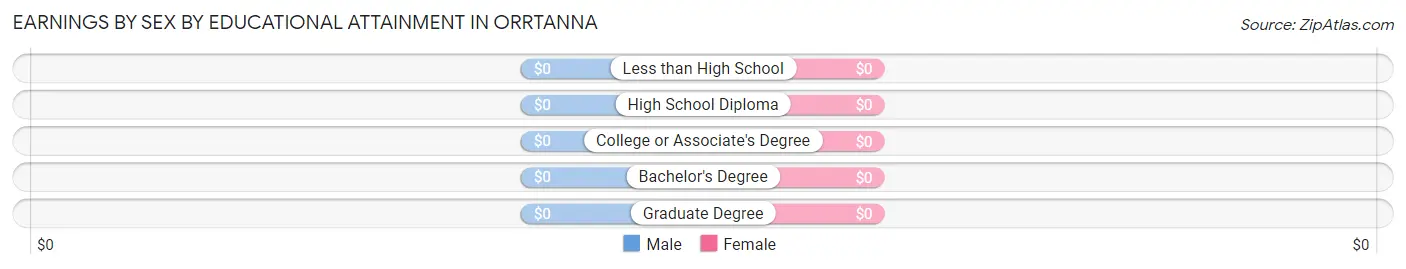
| Educational Attainment | Male Income | Female Income |
| Less than High School | - | - |
| High School Diploma | - | - |
| College or Associate's Degree | - | - |
| Bachelor's Degree | - | - |
| Graduate Degree | - | - |
| Total | $49,250 | $0 |
Family Income in Orrtanna
Family Income Brackets in Orrtanna
According to the Orrtanna family income data, there are 7 families falling into the $100,000 to $149,999 income range, which is the most common income bracket and makes up 43.8% of all families.
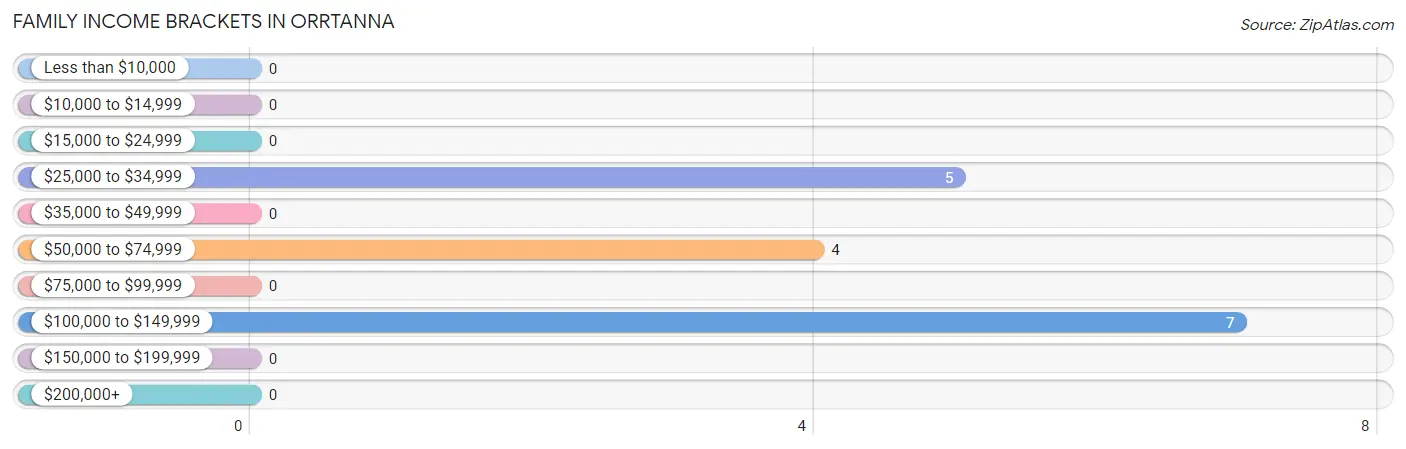
| Income Bracket | # Families | % Families |
| Less than $10,000 | 0 | 0.0% |
| $10,000 to $14,999 | 0 | 0.0% |
| $15,000 to $24,999 | 0 | 0.0% |
| $25,000 to $34,999 | 5 | 31.3% |
| $35,000 to $49,999 | 0 | 0.0% |
| $50,000 to $74,999 | 4 | 25.0% |
| $75,000 to $99,999 | 0 | 0.0% |
| $100,000 to $149,999 | 7 | 43.8% |
| $150,000 to $199,999 | 0 | 0.0% |
| $200,000+ | 0 | 0.0% |
Family Income by Famaliy Size in Orrtanna
| Income Bracket | # Families | Median Income |
| 2-Person Families | 9 (56.2%) | $0 |
| 3-Person Families | 5 (31.2%) | $0 |
| 4-Person Families | 0 (0.0%) | $0 |
| 5-Person Families | 2 (12.5%) | $0 |
| 6-Person Families | 0 (0.0%) | $0 |
| 7+ Person Families | 0 (0.0%) | $0 |
| Total | 16 (100.0%) | $0 |
Family Income by Number of Earners in Orrtanna
| Number of Earners | # Families | Median Income |
| No Earners | 7 (43.8%) | $0 |
| 1 Earner | 4 (25.0%) | $0 |
| 2 Earners | 5 (31.2%) | $0 |
| 3+ Earners | 0 (0.0%) | $0 |
| Total | 16 (100.0%) | $0 |
Household Income in Orrtanna
Household Income Brackets in Orrtanna
With 9 households falling in the category, the $35,000 to $49,999 income range is the most frequent in Orrtanna, accounting for 21.4% of all households.
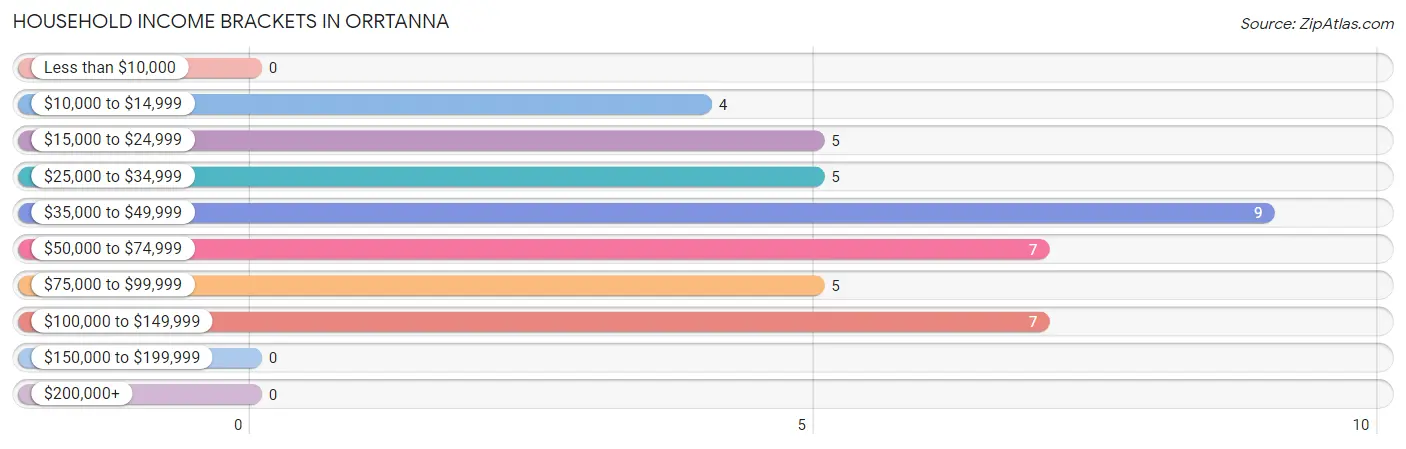
| Income Bracket | # Households | % Households |
| Less than $10,000 | 0 | 0.0% |
| $10,000 to $14,999 | 4 | 9.5% |
| $15,000 to $24,999 | 5 | 11.9% |
| $25,000 to $34,999 | 5 | 11.9% |
| $35,000 to $49,999 | 9 | 21.4% |
| $50,000 to $74,999 | 7 | 16.7% |
| $75,000 to $99,999 | 5 | 11.9% |
| $100,000 to $149,999 | 7 | 16.7% |
| $150,000 to $199,999 | 0 | 0.0% |
| $200,000+ | 0 | 0.0% |
Household Income by Householder Age in Orrtanna
The median household income in Orrtanna is $38,750, with the highest median household income of $92,500 found in the 25 to 44 years age bracket for the primary householder. A total of 10 households (23.8%) fall into this category.
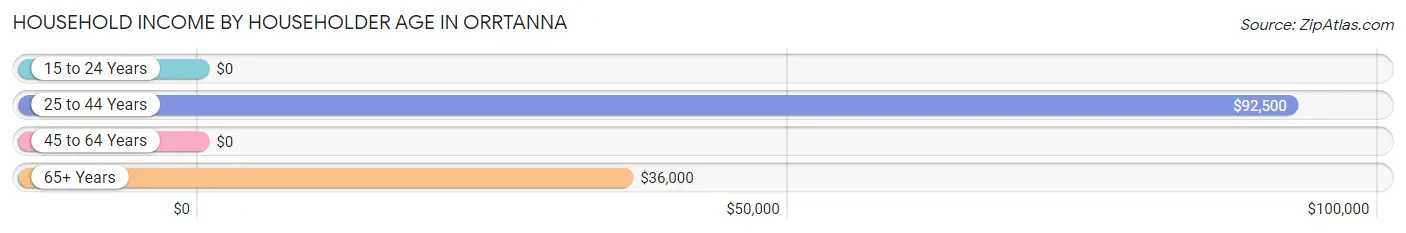
| Income Bracket | # Households | Median Income |
| 15 to 24 Years | 0 (0.0%) | $0 |
| 25 to 44 Years | 10 (23.8%) | $92,500 |
| 45 to 64 Years | 8 (19.1%) | $0 |
| 65+ Years | 24 (57.1%) | $36,000 |
| Total | 42 (100.0%) | $38,750 |
Poverty in Orrtanna
Income Below Poverty by Sex and Age in Orrtanna
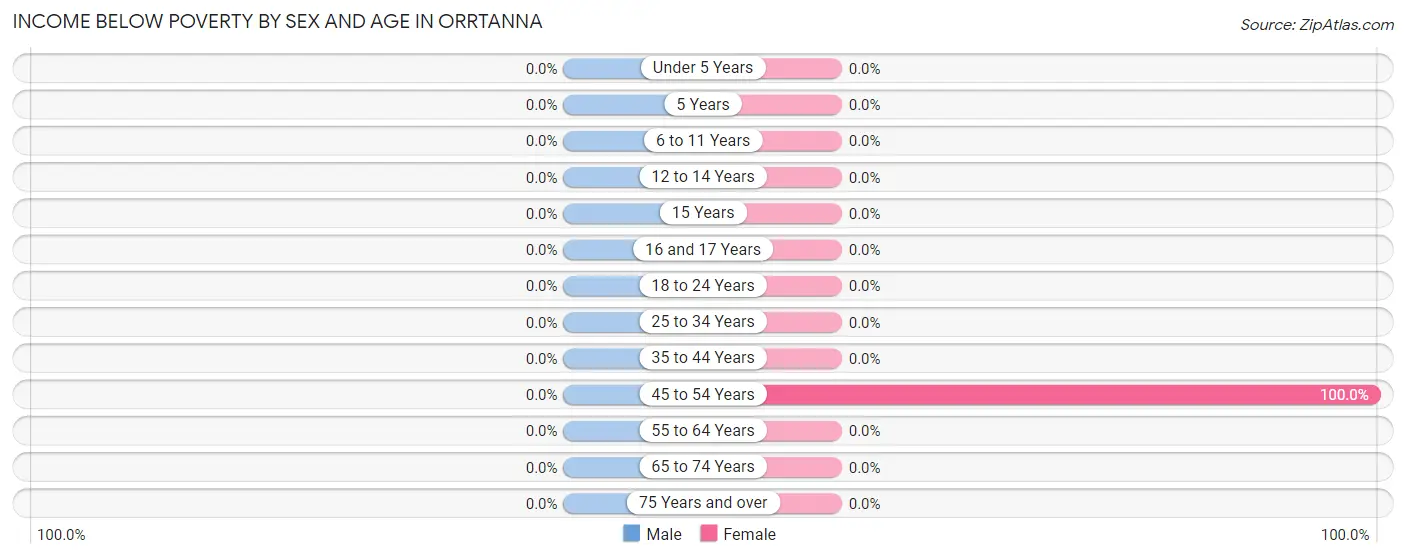
| Age Bracket | Male | Female |
| Under 5 Years | 0 (0.0%) | 0 (0.0%) |
| 5 Years | 0 (0.0%) | 0 (0.0%) |
| 6 to 11 Years | 0 (0.0%) | 0 (0.0%) |
| 12 to 14 Years | 0 (0.0%) | 0 (0.0%) |
| 15 Years | 0 (0.0%) | 0 (0.0%) |
| 16 and 17 Years | 0 (0.0%) | 0 (0.0%) |
| 18 to 24 Years | 0 (0.0%) | 0 (0.0%) |
| 25 to 34 Years | 0 (0.0%) | 0 (0.0%) |
| 35 to 44 Years | 0 (0.0%) | 0 (0.0%) |
| 45 to 54 Years | 0 (0.0%) | 4 (100.0%) |
| 55 to 64 Years | 0 (0.0%) | 0 (0.0%) |
| 65 to 74 Years | 0 (0.0%) | 0 (0.0%) |
| 75 Years and over | 0 (0.0%) | 0 (0.0%) |
| Total | 0 (0.0%) | 4 (7.8%) |
Income Above Poverty by Sex and Age in Orrtanna
According to the poverty statistics in Orrtanna, males aged 6 to 11 years and females aged 6 to 11 years are the age groups that are most secure financially, with 100.0% of males and 100.0% of females in these age groups living above the poverty line.
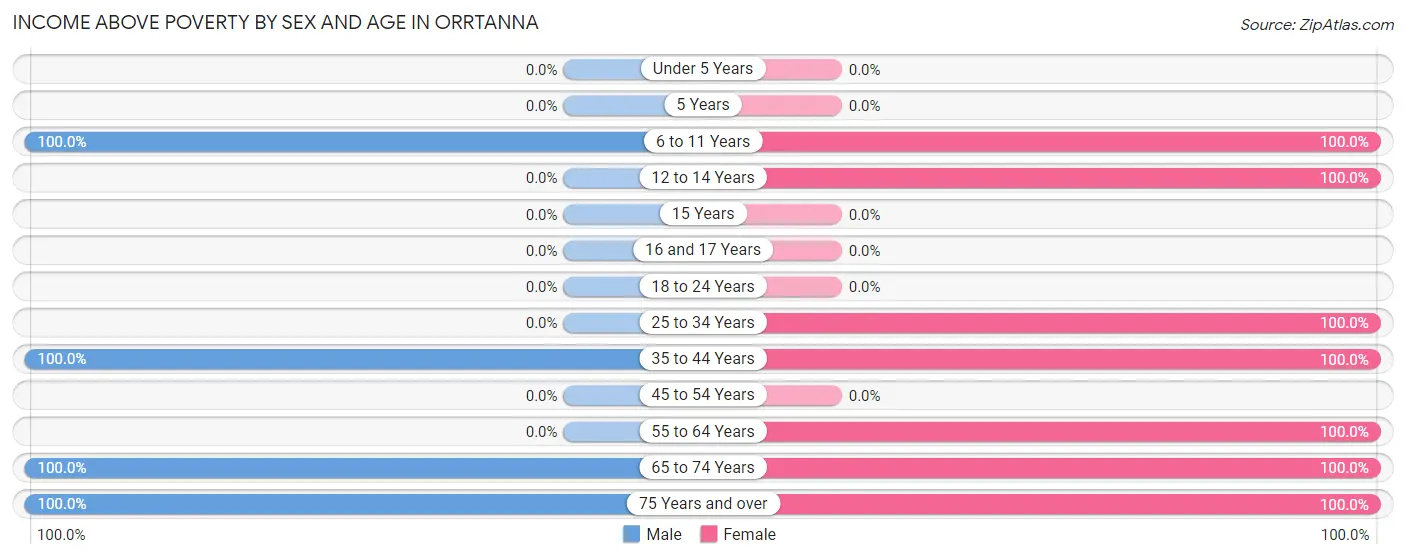
| Age Bracket | Male | Female |
| Under 5 Years | 0 (0.0%) | 0 (0.0%) |
| 5 Years | 0 (0.0%) | 0 (0.0%) |
| 6 to 11 Years | 5 (100.0%) | 5 (100.0%) |
| 12 to 14 Years | 0 (0.0%) | 8 (100.0%) |
| 15 Years | 0 (0.0%) | 0 (0.0%) |
| 16 and 17 Years | 0 (0.0%) | 0 (0.0%) |
| 18 to 24 Years | 0 (0.0%) | 0 (0.0%) |
| 25 to 34 Years | 0 (0.0%) | 5 (100.0%) |
| 35 to 44 Years | 11 (100.0%) | 5 (100.0%) |
| 45 to 54 Years | 0 (0.0%) | 0 (0.0%) |
| 55 to 64 Years | 0 (0.0%) | 4 (100.0%) |
| 65 to 74 Years | 9 (100.0%) | 5 (100.0%) |
| 75 Years and over | 5 (100.0%) | 15 (100.0%) |
| Total | 30 (100.0%) | 47 (92.2%) |
Income Below Poverty Among Married-Couple Families in Orrtanna
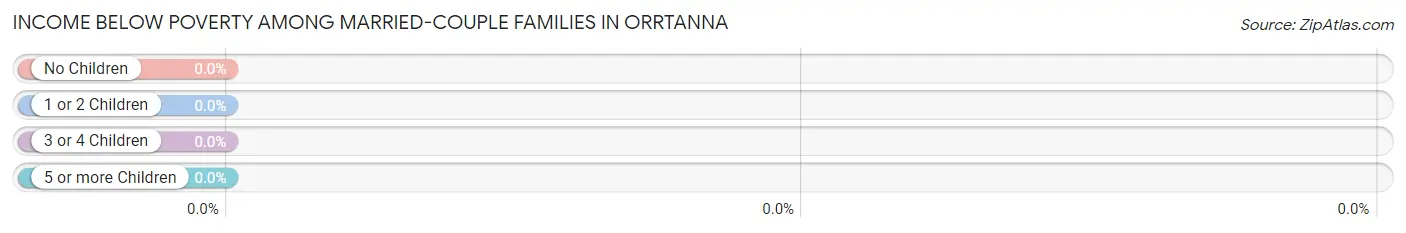
| Children | Above Poverty | Below Poverty |
| No Children | 9 (100.0%) | 0 (0.0%) |
| 1 or 2 Children | 5 (100.0%) | 0 (0.0%) |
| 3 or 4 Children | 2 (100.0%) | 0 (0.0%) |
| 5 or more Children | 0 (0.0%) | 0 (0.0%) |
| Total | 16 (100.0%) | 0 (0.0%) |
Income Below Poverty Among Single-Parent Households in Orrtanna
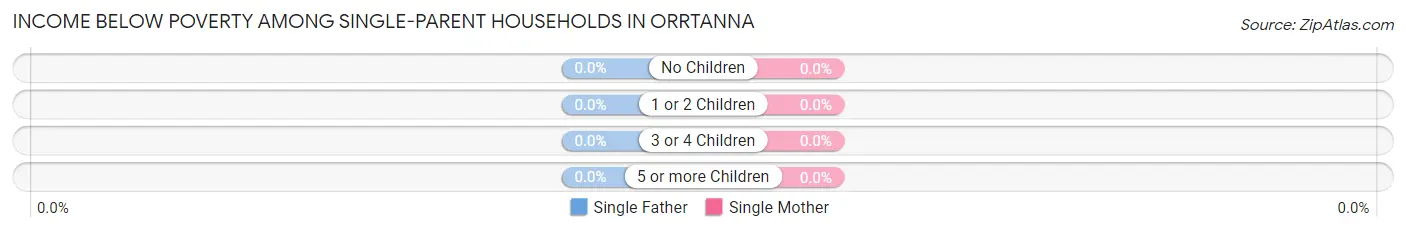
| Children | Single Father | Single Mother |
| No Children | 0 (0.0%) | 0 (0.0%) |
| 1 or 2 Children | 0 (0.0%) | 0 (0.0%) |
| 3 or 4 Children | 0 (0.0%) | 0 (0.0%) |
| 5 or more Children | 0 (0.0%) | 0 (0.0%) |
| Total | 0 (0.0%) | 0 (0.0%) |
Income Below Poverty Among Married-Couple vs Single-Parent Households in Orrtanna
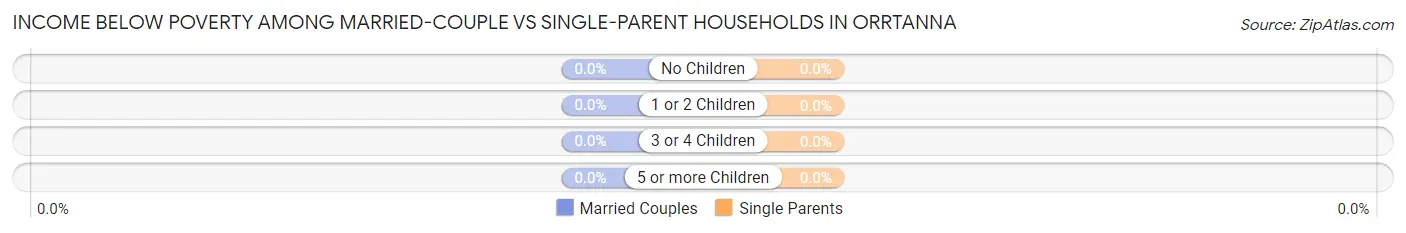
| Children | Married-Couple Families | Single-Parent Households |
| No Children | 0 (0.0%) | 0 (0.0%) |
| 1 or 2 Children | 0 (0.0%) | 0 (0.0%) |
| 3 or 4 Children | 0 (0.0%) | 0 (0.0%) |
| 5 or more Children | 0 (0.0%) | 0 (0.0%) |
| Total | 0 (0.0%) | 0 (0.0%) |
Race in Orrtanna
The most populous races in Orrtanna are , and White / Caucasian (81 | 100.0%).
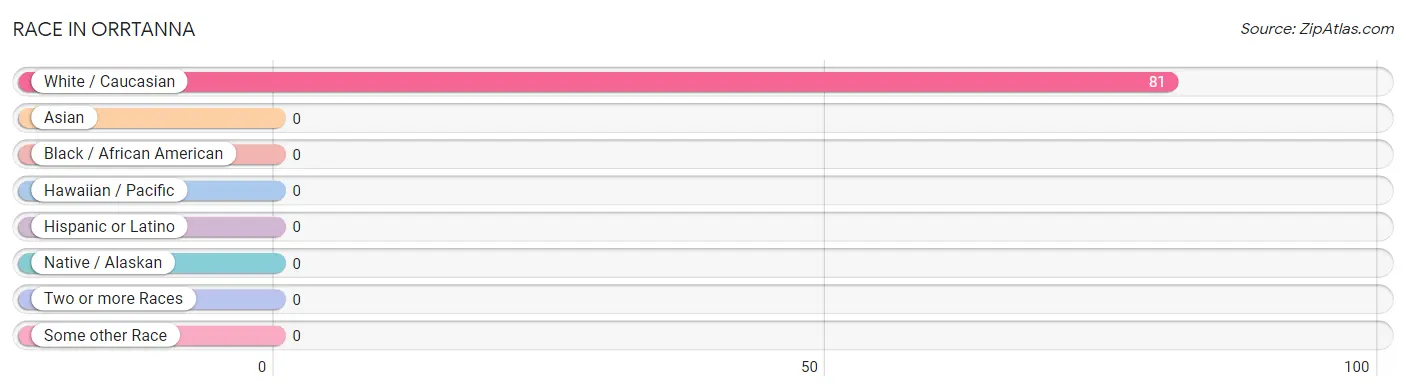
| Race | # Population | % Population |
| Asian | 0 | 0.0% |
| Black / African American | 0 | 0.0% |
| Hawaiian / Pacific | 0 | 0.0% |
| Hispanic or Latino | 0 | 0.0% |
| Native / Alaskan | 0 | 0.0% |
| White / Caucasian | 81 | 100.0% |
| Two or more Races | 0 | 0.0% |
| Some other Race | 0 | 0.0% |
| Total | 81 | 100.0% |
Ancestry in Orrtanna
The most populous ancestries reported in Orrtanna are Irish (12 | 14.8%), American (10 | 12.3%), German (10 | 12.3%), Polish (5 | 6.2%), and Slavic (5 | 6.2%), together accounting for 51.8% of all Orrtanna residents.
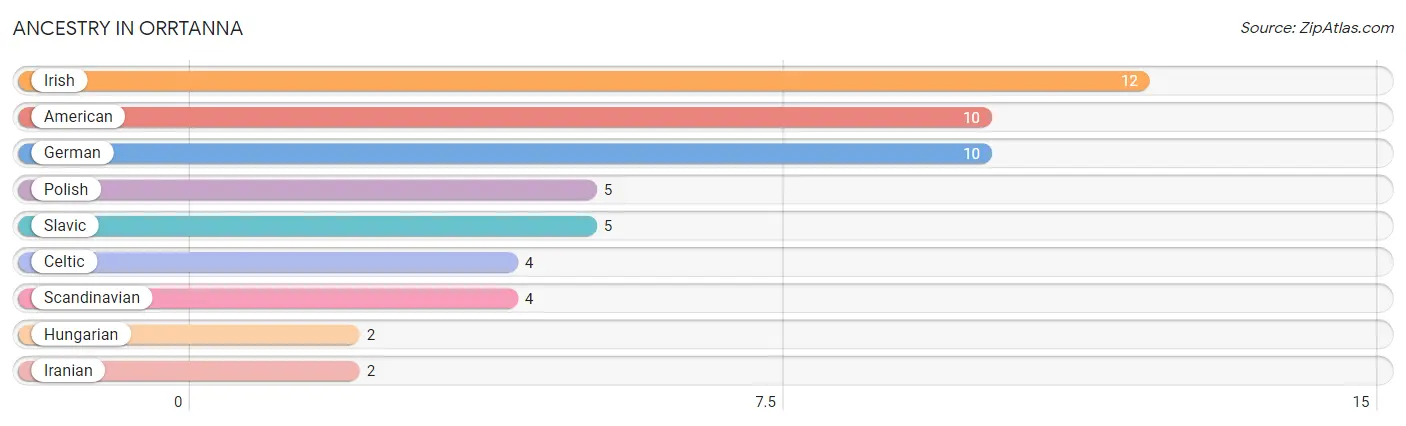
| Ancestry | # Population | % Population |
| American | 10 | 12.3% |
| Celtic | 4 | 4.9% |
| German | 10 | 12.3% |
| Hungarian | 2 | 2.5% |
| Iranian | 2 | 2.5% |
| Irish | 12 | 14.8% |
| Polish | 5 | 6.2% |
| Scandinavian | 4 | 4.9% |
| Slavic | 5 | 6.2% | View All 9 Rows |
Immigrants in Orrtanna
The most numerous immigrant groups reported in Orrtanna came from Asia (2 | 2.5%), Iran (2 | 2.5%), and South Central Asia (2 | 2.5%), together accounting for 7.4% of all Orrtanna residents.
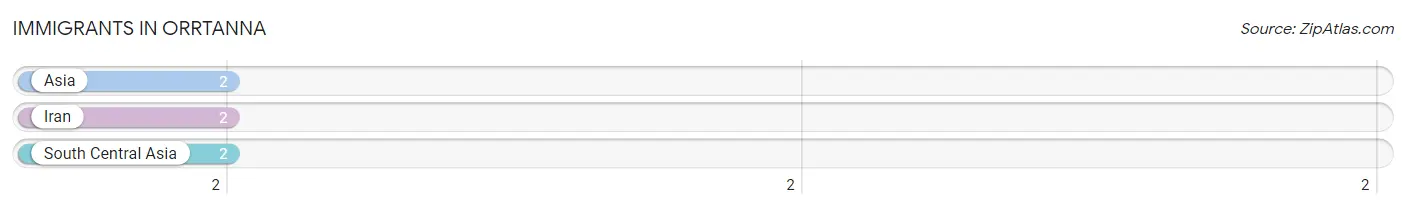
| Immigration Origin | # Population | % Population |
| Asia | 2 | 2.5% |
| Iran | 2 | 2.5% |
| South Central Asia | 2 | 2.5% | View All 3 Rows |
Sex and Age in Orrtanna
Sex and Age in Orrtanna
The most populous age groups in Orrtanna are 70 to 74 Years (9 | 30.0%) for men and 10 to 14 Years (13 | 25.5%) for women.
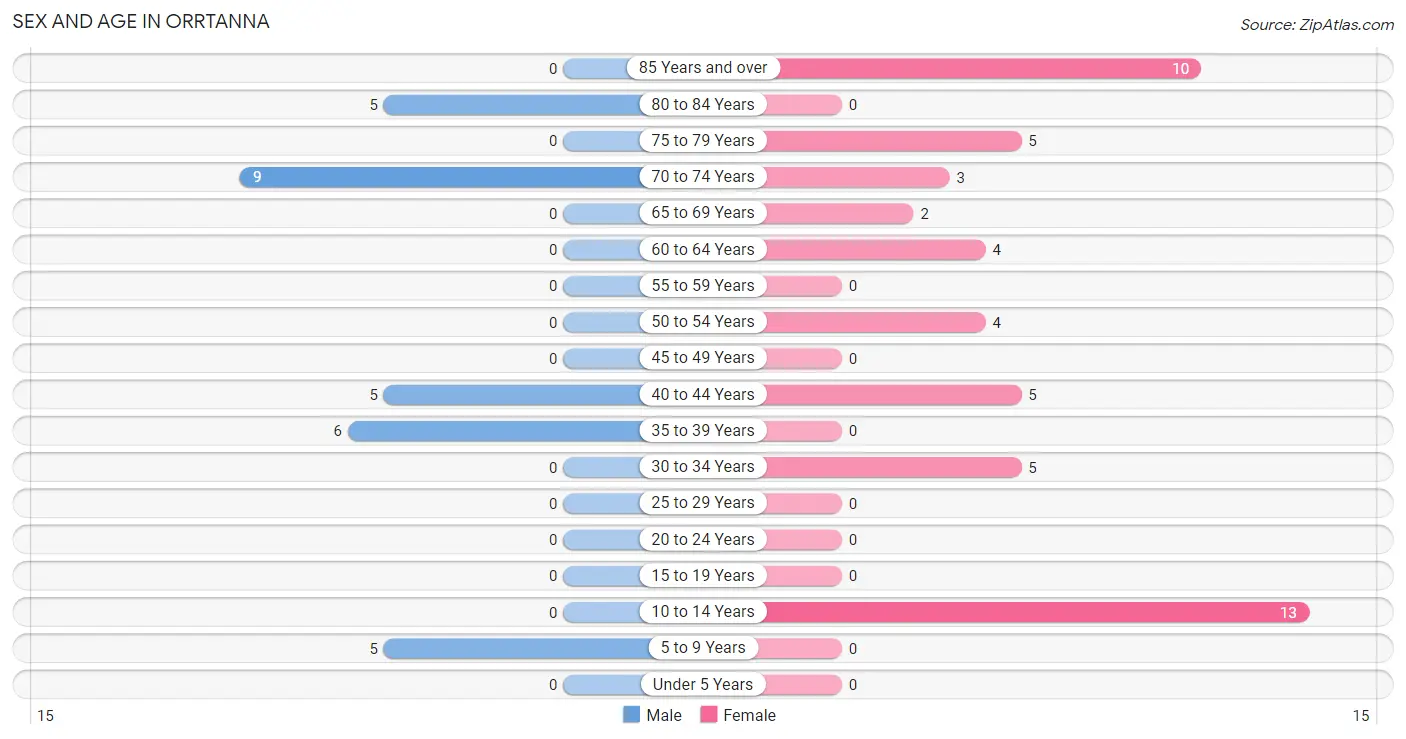
| Age Bracket | Male | Female |
| Under 5 Years | 0 (0.0%) | 0 (0.0%) |
| 5 to 9 Years | 5 (16.7%) | 0 (0.0%) |
| 10 to 14 Years | 0 (0.0%) | 13 (25.5%) |
| 15 to 19 Years | 0 (0.0%) | 0 (0.0%) |
| 20 to 24 Years | 0 (0.0%) | 0 (0.0%) |
| 25 to 29 Years | 0 (0.0%) | 0 (0.0%) |
| 30 to 34 Years | 0 (0.0%) | 5 (9.8%) |
| 35 to 39 Years | 6 (20.0%) | 0 (0.0%) |
| 40 to 44 Years | 5 (16.7%) | 5 (9.8%) |
| 45 to 49 Years | 0 (0.0%) | 0 (0.0%) |
| 50 to 54 Years | 0 (0.0%) | 4 (7.8%) |
| 55 to 59 Years | 0 (0.0%) | 0 (0.0%) |
| 60 to 64 Years | 0 (0.0%) | 4 (7.8%) |
| 65 to 69 Years | 0 (0.0%) | 2 (3.9%) |
| 70 to 74 Years | 9 (30.0%) | 3 (5.9%) |
| 75 to 79 Years | 0 (0.0%) | 5 (9.8%) |
| 80 to 84 Years | 5 (16.7%) | 0 (0.0%) |
| 85 Years and over | 0 (0.0%) | 10 (19.6%) |
| Total | 30 (100.0%) | 51 (100.0%) |
Families and Households in Orrtanna
Median Family Size in Orrtanna
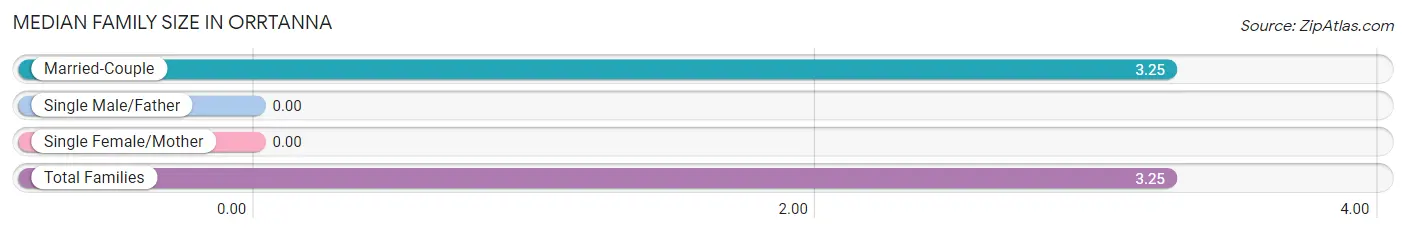
| Family Type | # Families | Family Size |
| Married-Couple | 16 (100.0%) | 3.25 |
| Single Male/Father | 0 (0.0%) | - |
| Single Female/Mother | 0 (0.0%) | - |
| Total Families | 16 (100.0%) | 3.25 |
Median Household Size in Orrtanna
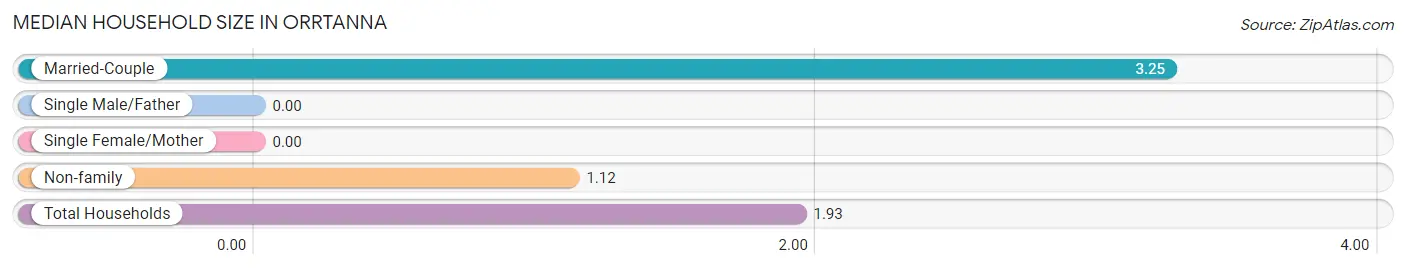
| Household Type | # Households | Household Size |
| Married-Couple | 16 (38.1%) | 3.25 |
| Single Male/Father | 0 (0.0%) | - |
| Single Female/Mother | 0 (0.0%) | - |
| Non-family | 26 (61.9%) | 1.12 |
| Total Households | 42 (100.0%) | 1.93 |
Household Size by Marriage Status in Orrtanna
Out of a total of 42 households in Orrtanna, 16 (38.1%) are family households, while 26 (61.9%) are nonfamily households. The most numerous type of family households are 2-person households, comprising 9, and the most common type of nonfamily households are 1-person households, comprising 23.
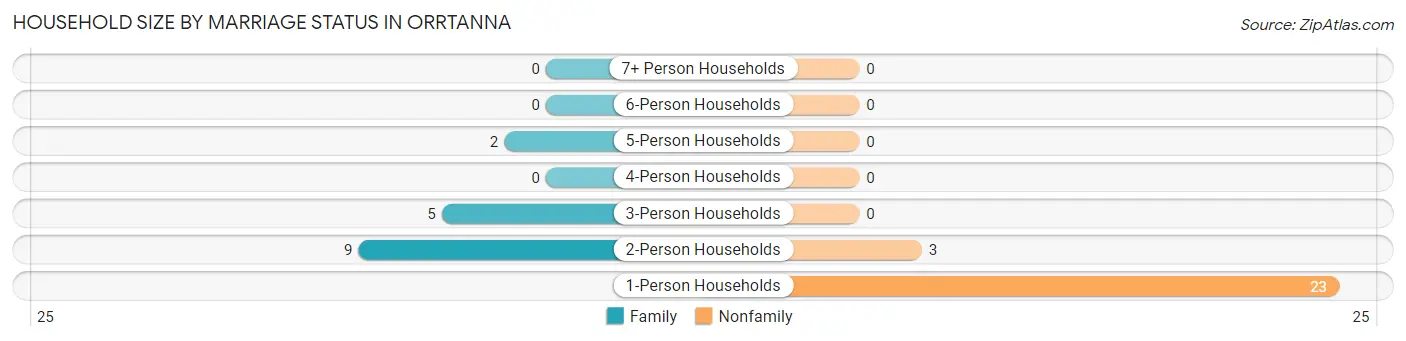
| Household Size | Family Households | Nonfamily Households |
| 1-Person Households | - | 23 (54.8%) |
| 2-Person Households | 9 (21.4%) | 3 (7.1%) |
| 3-Person Households | 5 (11.9%) | 0 (0.0%) |
| 4-Person Households | 0 (0.0%) | 0 (0.0%) |
| 5-Person Households | 2 (4.8%) | 0 (0.0%) |
| 6-Person Households | 0 (0.0%) | 0 (0.0%) |
| 7+ Person Households | 0 (0.0%) | 0 (0.0%) |
| Total | 16 (38.1%) | 26 (61.9%) |
Female Fertility in Orrtanna
Fertility by Age in Orrtanna
| Age Bracket | Women with Births | Births / 1,000 Women |
| 15 to 19 years | 0 (0.0%) | 0.0 |
| 20 to 34 years | 0 (0.0%) | 0.0 |
| 35 to 50 years | 0 (0.0%) | 0.0 |
| Total | 0 (0.0%) | 0.0 |
Fertility by Age by Marriage Status in Orrtanna
| Age Bracket | Married | Unmarried |
| 15 to 19 years | 0 (0.0%) | 0 (0.0%) |
| 20 to 34 years | 0 (0.0%) | 0 (0.0%) |
| 35 to 50 years | 0 (0.0%) | 0 (0.0%) |
| Total | 0 (0.0%) | 0 (0.0%) |
Fertility by Education in Orrtanna
| Educational Attainment | Women with Births | Births / 1,000 Women |
| Less than High School | 0 (0.0%) | 0.0 |
| High School Diploma | 0 (0.0%) | 0.0 |
| College or Associate's Degree | 0 (0.0%) | 0.0 |
| Bachelor's Degree | 0 (0.0%) | 0.0 |
| Graduate Degree | 0 (0.0%) | 0.0 |
| Total | 0 (0.0%) | 0.0 |
Fertility by Education by Marriage Status in Orrtanna
| Educational Attainment | Married | Unmarried |
| Less than High School | 0 (0.0%) | 0 (0.0%) |
| High School Diploma | 0 (0.0%) | 0 (0.0%) |
| College or Associate's Degree | 0 (0.0%) | 0 (0.0%) |
| Bachelor's Degree | 0 (0.0%) | 0 (0.0%) |
| Graduate Degree | 0 (0.0%) | 0 (0.0%) |
| Total | 0 (0.0%) | 0 (0.0%) |
Employment Characteristics in Orrtanna
Employment by Class of Employer in Orrtanna
Among the 22 employed individuals in Orrtanna, not-for-profit organizations (10 | 45.5%), private company employees (8 | 36.4%), and federal government employees (4 | 18.2%) make up the most common classes of employment.
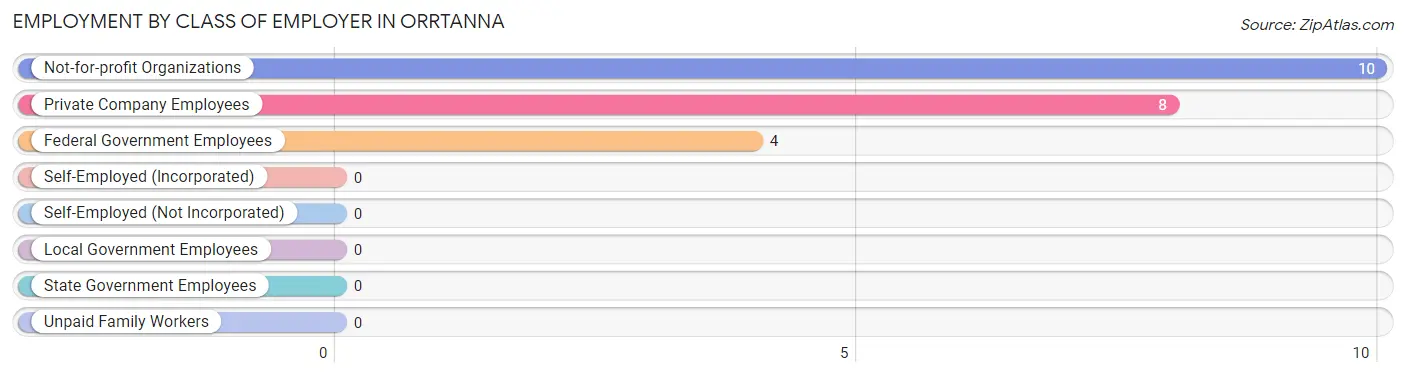
| Employer Class | # Employees | % Employees |
| Private Company Employees | 8 | 36.4% |
| Self-Employed (Incorporated) | 0 | 0.0% |
| Self-Employed (Not Incorporated) | 0 | 0.0% |
| Not-for-profit Organizations | 10 | 45.5% |
| Local Government Employees | 0 | 0.0% |
| State Government Employees | 0 | 0.0% |
| Federal Government Employees | 4 | 18.2% |
| Unpaid Family Workers | 0 | 0.0% |
| Total | 22 | 100.0% |
Employment Status by Age in Orrtanna
According to the labor force statistics for Orrtanna, out of the total population over 16 years of age (63), 42.9% or 27 individuals are in the labor force, with 18.5% or 5 of them unemployed. The age group with the highest labor force participation rate is 30 to 34 years, with 100.0% or 5 individuals in the labor force. Within the labor force, the 30 to 34 years age range has the highest percentage of unemployed individuals, with 100.0% or 5 of them being unemployed.
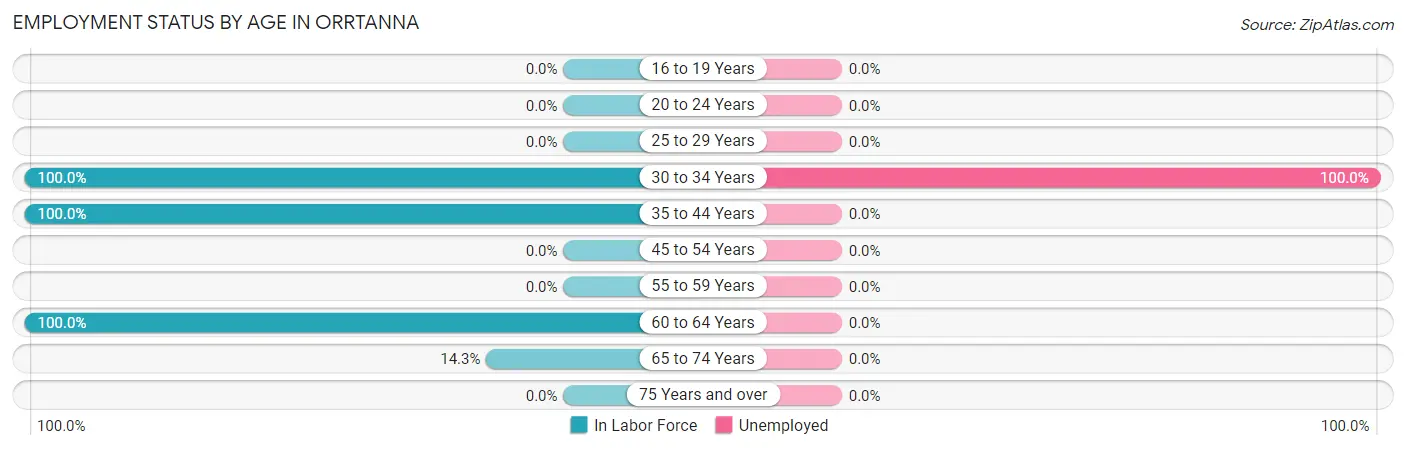
| Age Bracket | In Labor Force | Unemployed |
| 16 to 19 Years | 0 (0.0%) | 0 (0.0%) |
| 20 to 24 Years | 0 (0.0%) | 0 (0.0%) |
| 25 to 29 Years | 0 (0.0%) | 0 (0.0%) |
| 30 to 34 Years | 5 (100.0%) | 5 (100.0%) |
| 35 to 44 Years | 16 (100.0%) | 0 (0.0%) |
| 45 to 54 Years | 0 (0.0%) | 0 (0.0%) |
| 55 to 59 Years | 0 (0.0%) | 0 (0.0%) |
| 60 to 64 Years | 4 (100.0%) | 0 (0.0%) |
| 65 to 74 Years | 2 (14.3%) | 0 (0.0%) |
| 75 Years and over | 0 (0.0%) | 0 (0.0%) |
| Total | 27 (42.9%) | 5 (18.5%) |
Employment Status by Educational Attainment in Orrtanna
According to labor force statistics for Orrtanna, 86.2% of individuals (25) out of the total population between 25 and 64 years of age (29) are in the labor force, with 20.0% or 5 of them being unemployed. The group with the highest labor force participation rate are those with the educational attainment of less than high school, with 100.0% or 4 individuals in the labor force. Within the labor force, individuals with college / associate degree education have the highest percentage of unemployment, with 50.0% or 3 of them being unemployed.
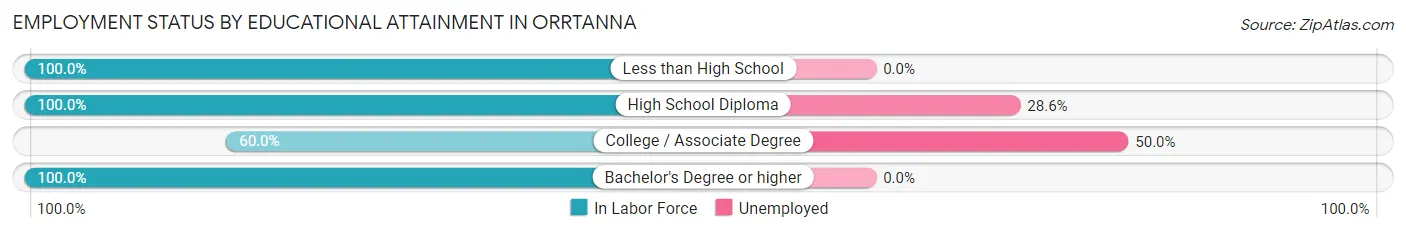
| Educational Attainment | In Labor Force | Unemployed |
| Less than High School | 4 (100.0%) | 0 (0.0%) |
| High School Diploma | 7 (100.0%) | 2 (28.6%) |
| College / Associate Degree | 6 (60.0%) | 5 (50.0%) |
| Bachelor's Degree or higher | 8 (100.0%) | 0 (0.0%) |
| Total | 25 (86.2%) | 6 (20.0%) |
Employment Occupations by Sex in Orrtanna
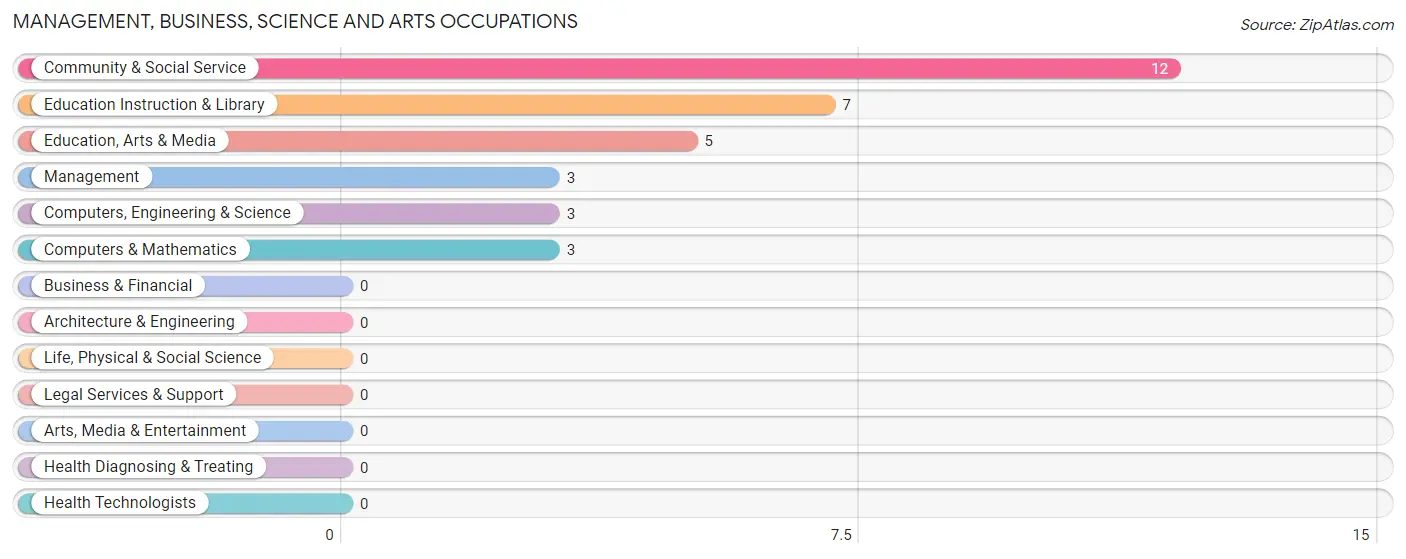
Management, Business, Science and Arts Occupations
The most common Management, Business, Science and Arts occupations in Orrtanna are Community & Social Service (12 | 54.5%), Education Instruction & Library (7 | 31.8%), Education, Arts & Media (5 | 22.7%), Management (3 | 13.6%), and Computers, Engineering & Science (3 | 13.6%).
Management, Business, Science and Arts Occupations by Sex
Within the Management, Business, Science and Arts occupations in Orrtanna, the most male-oriented occupations are Management (100.0%), Computers, Engineering & Science (100.0%), and Computers & Mathematics (100.0%), while the most female-oriented occupations are Education Instruction & Library (71.4%), and Community & Social Service (41.7%).
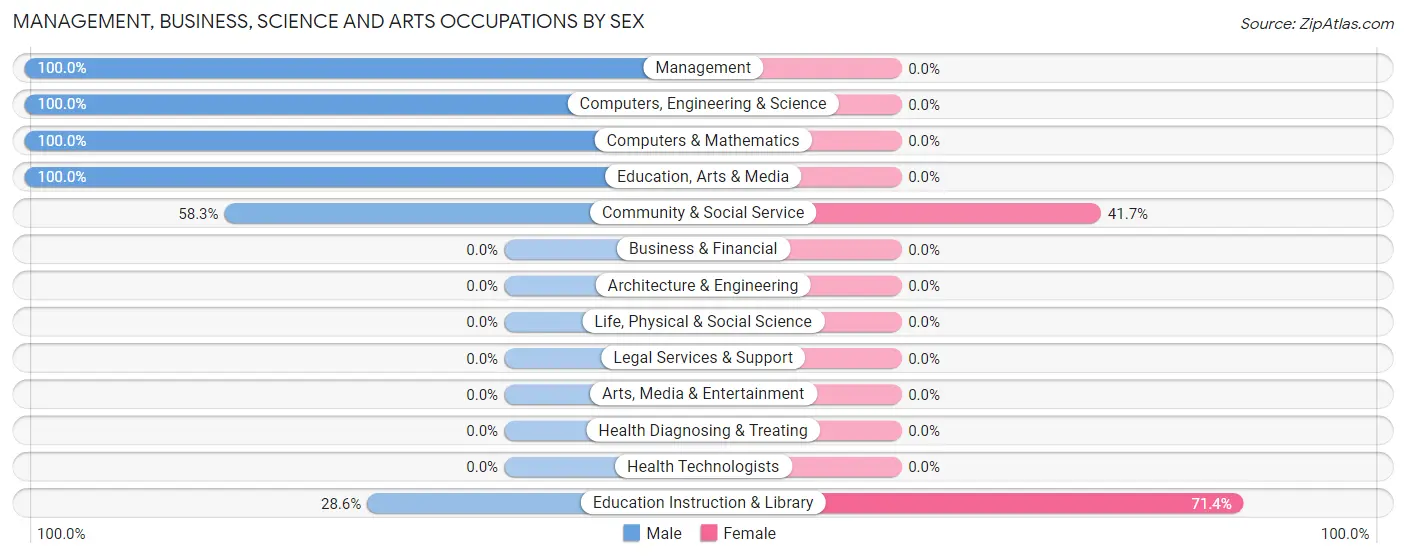
| Occupation | Male | Female |
| Management | 3 (100.0%) | 0 (0.0%) |
| Business & Financial | 0 (0.0%) | 0 (0.0%) |
| Computers, Engineering & Science | 3 (100.0%) | 0 (0.0%) |
| Computers & Mathematics | 3 (100.0%) | 0 (0.0%) |
| Architecture & Engineering | 0 (0.0%) | 0 (0.0%) |
| Life, Physical & Social Science | 0 (0.0%) | 0 (0.0%) |
| Community & Social Service | 7 (58.3%) | 5 (41.7%) |
| Education, Arts & Media | 5 (100.0%) | 0 (0.0%) |
| Legal Services & Support | 0 (0.0%) | 0 (0.0%) |
| Education Instruction & Library | 2 (28.6%) | 5 (71.4%) |
| Arts, Media & Entertainment | 0 (0.0%) | 0 (0.0%) |
| Health Diagnosing & Treating | 0 (0.0%) | 0 (0.0%) |
| Health Technologists | 0 (0.0%) | 0 (0.0%) |
| Total (Category) | 13 (72.2%) | 5 (27.8%) |
| Total (Overall) | 13 (59.1%) | 9 (40.9%) |
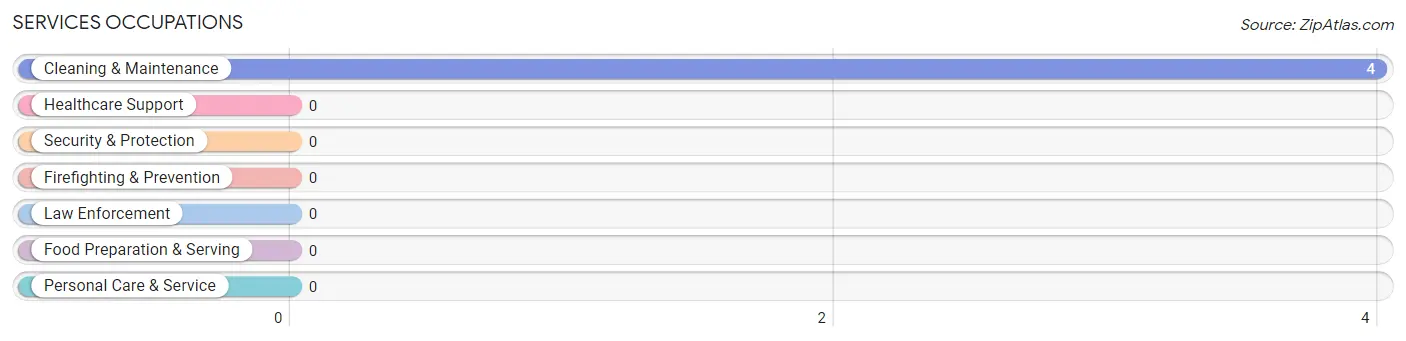
Services Occupations
The most common Services occupations in Orrtanna are , and Cleaning & Maintenance (4 | 18.2%).
Services Occupations by Sex
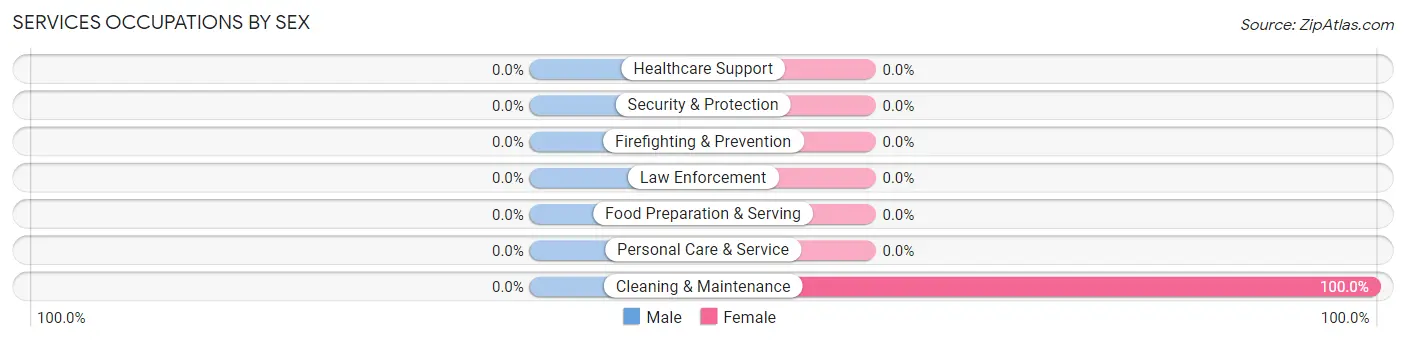
| Occupation | Male | Female |
| Healthcare Support | 0 (0.0%) | 0 (0.0%) |
| Security & Protection | 0 (0.0%) | 0 (0.0%) |
| Firefighting & Prevention | 0 (0.0%) | 0 (0.0%) |
| Law Enforcement | 0 (0.0%) | 0 (0.0%) |
| Food Preparation & Serving | 0 (0.0%) | 0 (0.0%) |
| Cleaning & Maintenance | 0 (0.0%) | 4 (100.0%) |
| Personal Care & Service | 0 (0.0%) | 0 (0.0%) |
| Total (Category) | 0 (0.0%) | 4 (100.0%) |
| Total (Overall) | 13 (59.1%) | 9 (40.9%) |
Sales and Office Occupations
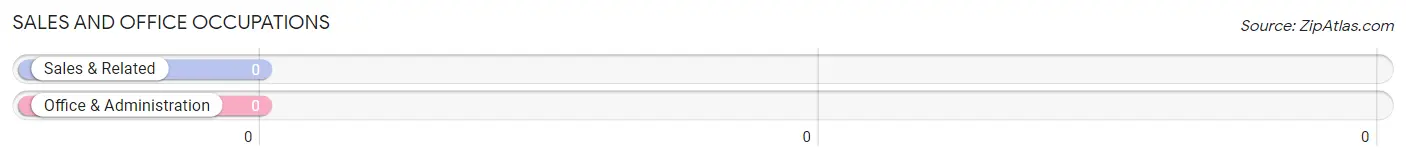
Sales and Office Occupations by Sex
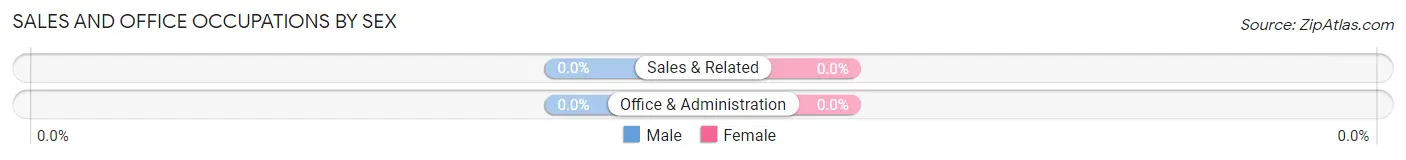
| Occupation | Male | Female |
| Sales & Related | 0 (0.0%) | 0 (0.0%) |
| Office & Administration | 0 (0.0%) | 0 (0.0%) |
| Total (Category) | 0 (0.0%) | 0 (0.0%) |
| Total (Overall) | 13 (59.1%) | 9 (40.9%) |
Natural Resources, Construction and Maintenance Occupations
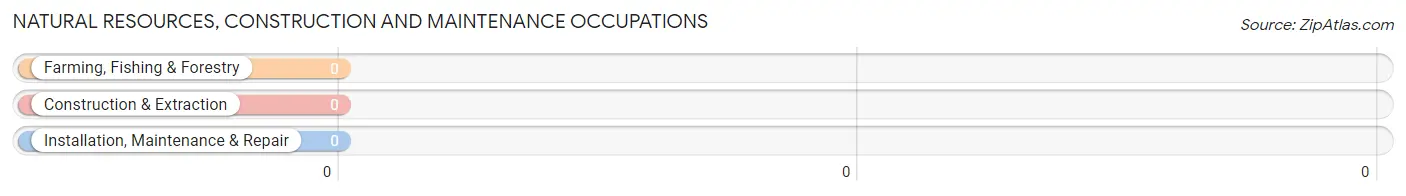
Natural Resources, Construction and Maintenance Occupations by Sex
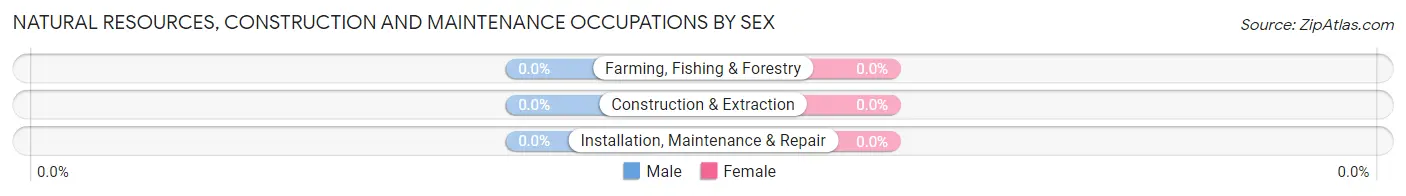
| Occupation | Male | Female |
| Farming, Fishing & Forestry | 0 (0.0%) | 0 (0.0%) |
| Construction & Extraction | 0 (0.0%) | 0 (0.0%) |
| Installation, Maintenance & Repair | 0 (0.0%) | 0 (0.0%) |
| Total (Category) | 0 (0.0%) | 0 (0.0%) |
| Total (Overall) | 13 (59.1%) | 9 (40.9%) |
Production, Transportation and Moving Occupations
Production, Transportation and Moving Occupations by Sex
| Occupation | Male | Female |
| Production | 0 (0.0%) | 0 (0.0%) |
| Transportation | 0 (0.0%) | 0 (0.0%) |
| Material Moving | 0 (0.0%) | 0 (0.0%) |
| Total (Category) | 0 (0.0%) | 0 (0.0%) |
| Total (Overall) | 13 (59.1%) | 9 (40.9%) |
Employment Industries by Sex in Orrtanna
Employment Industries in Orrtanna
The major employment industries in Orrtanna include Educational Services (7 | 31.8%), Health Care & Social Assistance (5 | 22.7%), Public Administration (4 | 18.2%), Construction (3 | 13.6%), and Information (3 | 13.6%).
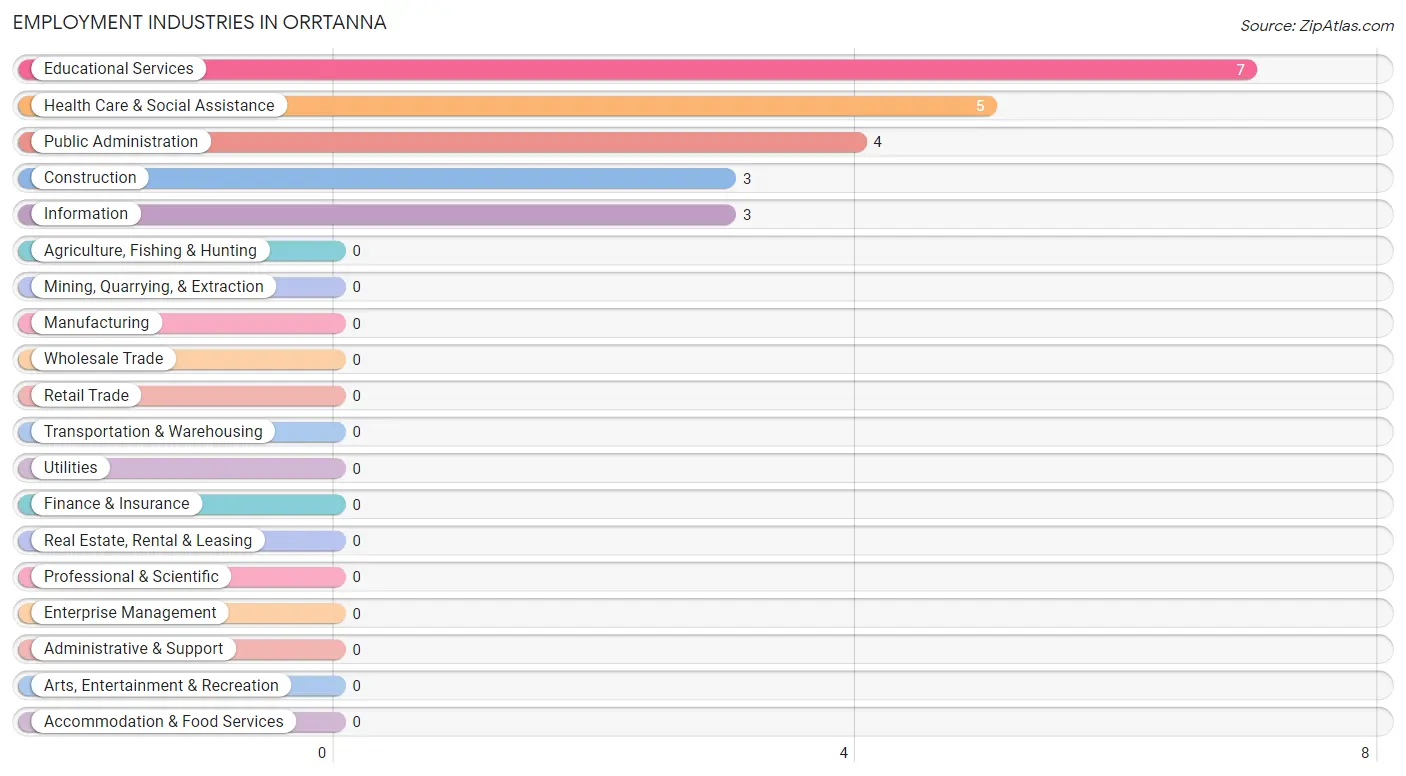
Employment Industries by Sex in Orrtanna
The Orrtanna industries that see more men than women are Construction (100.0%), Information (100.0%), and Health Care & Social Assistance (100.0%), whereas the industries that tend to have a higher number of women are Public Administration (100.0%), and Educational Services (71.4%).
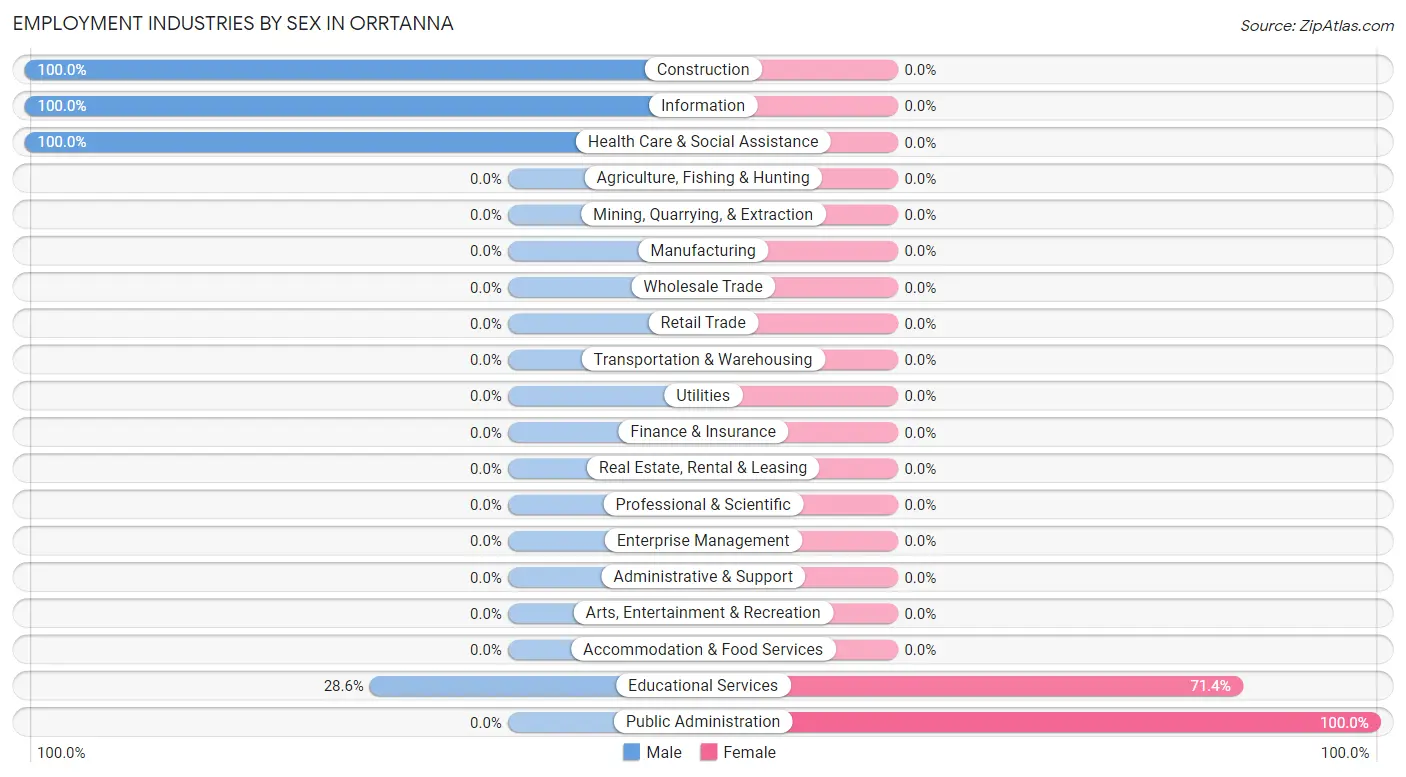
| Industry | Male | Female |
| Agriculture, Fishing & Hunting | 0 (0.0%) | 0 (0.0%) |
| Mining, Quarrying, & Extraction | 0 (0.0%) | 0 (0.0%) |
| Construction | 3 (100.0%) | 0 (0.0%) |
| Manufacturing | 0 (0.0%) | 0 (0.0%) |
| Wholesale Trade | 0 (0.0%) | 0 (0.0%) |
| Retail Trade | 0 (0.0%) | 0 (0.0%) |
| Transportation & Warehousing | 0 (0.0%) | 0 (0.0%) |
| Utilities | 0 (0.0%) | 0 (0.0%) |
| Information | 3 (100.0%) | 0 (0.0%) |
| Finance & Insurance | 0 (0.0%) | 0 (0.0%) |
| Real Estate, Rental & Leasing | 0 (0.0%) | 0 (0.0%) |
| Professional & Scientific | 0 (0.0%) | 0 (0.0%) |
| Enterprise Management | 0 (0.0%) | 0 (0.0%) |
| Administrative & Support | 0 (0.0%) | 0 (0.0%) |
| Educational Services | 2 (28.6%) | 5 (71.4%) |
| Health Care & Social Assistance | 5 (100.0%) | 0 (0.0%) |
| Arts, Entertainment & Recreation | 0 (0.0%) | 0 (0.0%) |
| Accommodation & Food Services | 0 (0.0%) | 0 (0.0%) |
| Public Administration | 0 (0.0%) | 4 (100.0%) |
| Total | 13 (59.1%) | 9 (40.9%) |
Education in Orrtanna
School Enrollment in Orrtanna
The most common levels of schooling among the 18 students in Orrtanna are middle school (13 | 72.2%), and elementary school (5 | 27.8%).
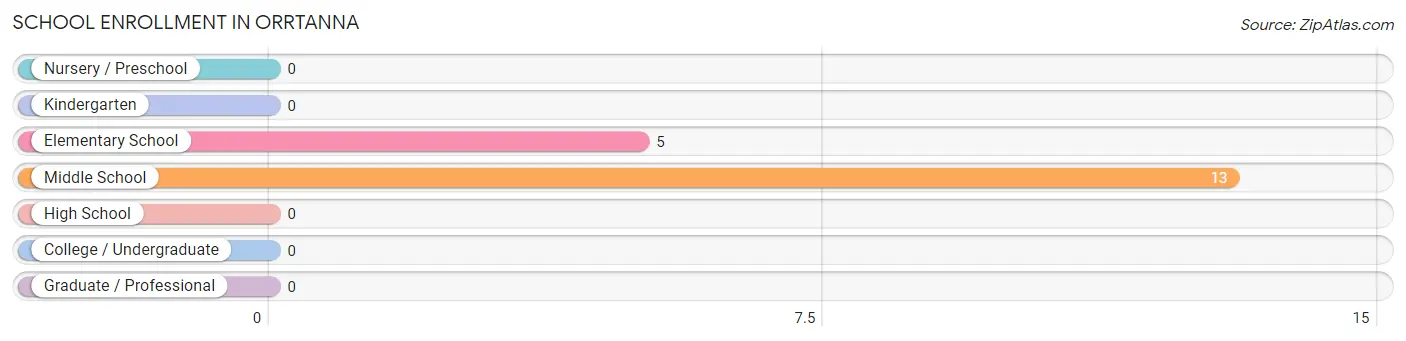
| School Level | # Students | % Students |
| Nursery / Preschool | 0 | 0.0% |
| Kindergarten | 0 | 0.0% |
| Elementary School | 5 | 27.8% |
| Middle School | 13 | 72.2% |
| High School | 0 | 0.0% |
| College / Undergraduate | 0 | 0.0% |
| Graduate / Professional | 0 | 0.0% |
| Total | 18 | 100.0% |
School Enrollment by Age by Funding Source in Orrtanna
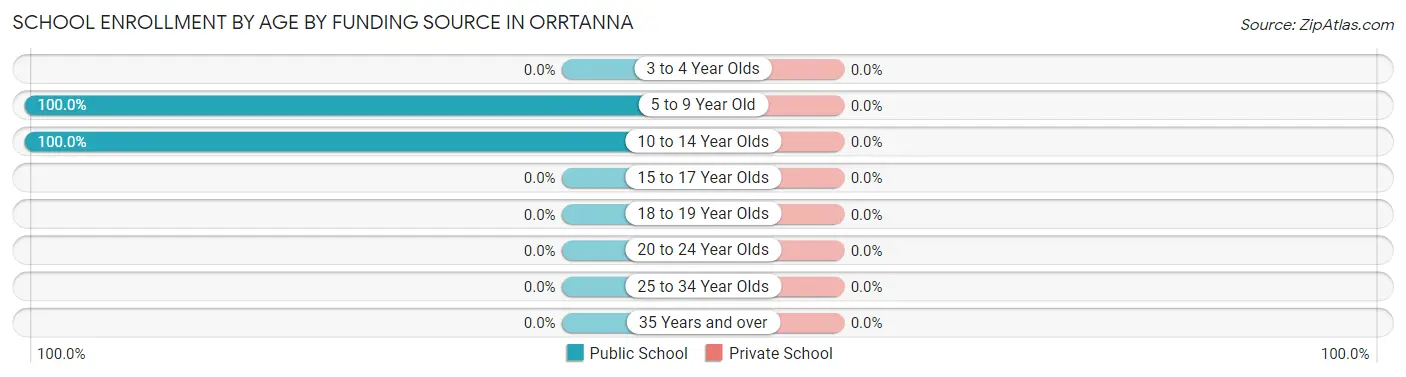
| Age Bracket | Public School | Private School |
| 3 to 4 Year Olds | 0 (0.0%) | 0 (0.0%) |
| 5 to 9 Year Old | 5 (100.0%) | 0 (0.0%) |
| 10 to 14 Year Olds | 13 (100.0%) | 0 (0.0%) |
| 15 to 17 Year Olds | 0 (0.0%) | 0 (0.0%) |
| 18 to 19 Year Olds | 0 (0.0%) | 0 (0.0%) |
| 20 to 24 Year Olds | 0 (0.0%) | 0 (0.0%) |
| 25 to 34 Year Olds | 0 (0.0%) | 0 (0.0%) |
| 35 Years and over | 0 (0.0%) | 0 (0.0%) |
| Total | 18 (100.0%) | 0 (0.0%) |
Educational Attainment by Field of Study in Orrtanna
Education (8 | 36.4%), literature & languages (7 | 31.8%), business (3 | 13.6%), social sciences (2 | 9.1%), and liberal arts & history (2 | 9.1%) are the most common fields of study among 22 individuals in Orrtanna who have obtained a bachelor's degree or higher.
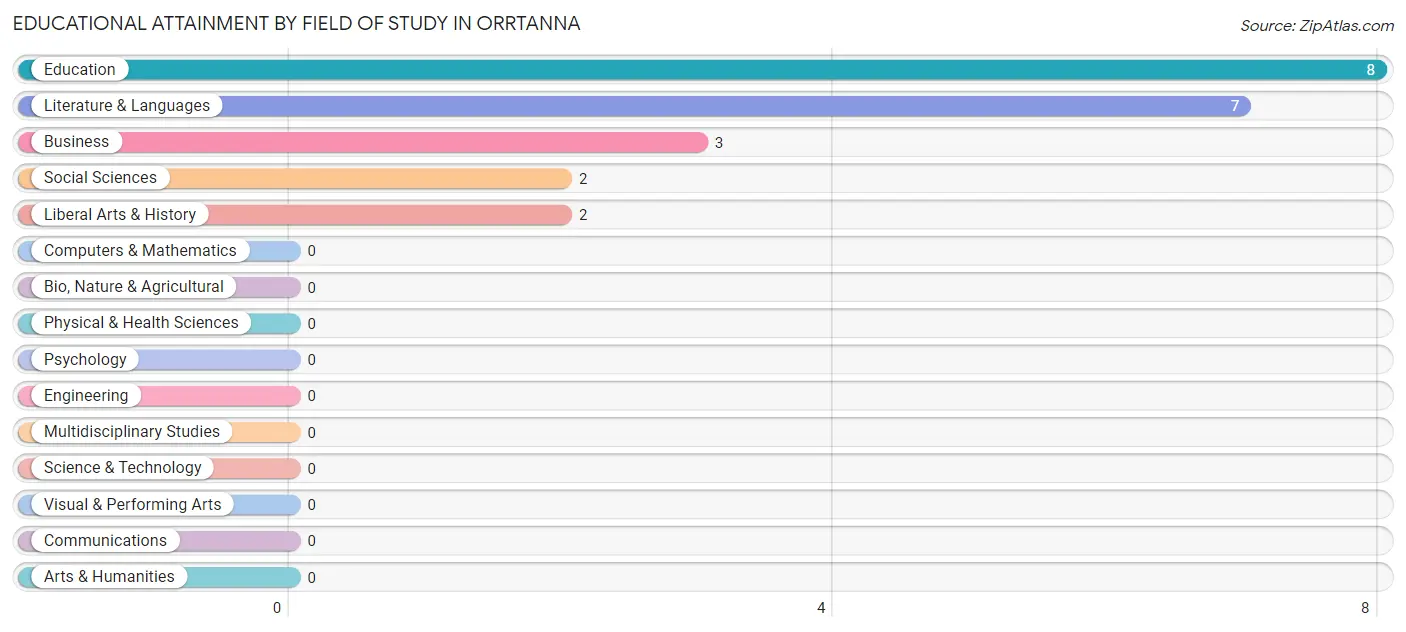
| Field of Study | # Graduates | % Graduates |
| Computers & Mathematics | 0 | 0.0% |
| Bio, Nature & Agricultural | 0 | 0.0% |
| Physical & Health Sciences | 0 | 0.0% |
| Psychology | 0 | 0.0% |
| Social Sciences | 2 | 9.1% |
| Engineering | 0 | 0.0% |
| Multidisciplinary Studies | 0 | 0.0% |
| Science & Technology | 0 | 0.0% |
| Business | 3 | 13.6% |
| Education | 8 | 36.4% |
| Literature & Languages | 7 | 31.8% |
| Liberal Arts & History | 2 | 9.1% |
| Visual & Performing Arts | 0 | 0.0% |
| Communications | 0 | 0.0% |
| Arts & Humanities | 0 | 0.0% |
| Total | 22 | 100.0% |
Transportation & Commute in Orrtanna
Vehicle Availability by Sex in Orrtanna
The most prevalent vehicle ownership categories in Orrtanna are males with 2 vehicles (10, accounting for 76.9%) and females with 2 vehicles (5, making up 111.1%).
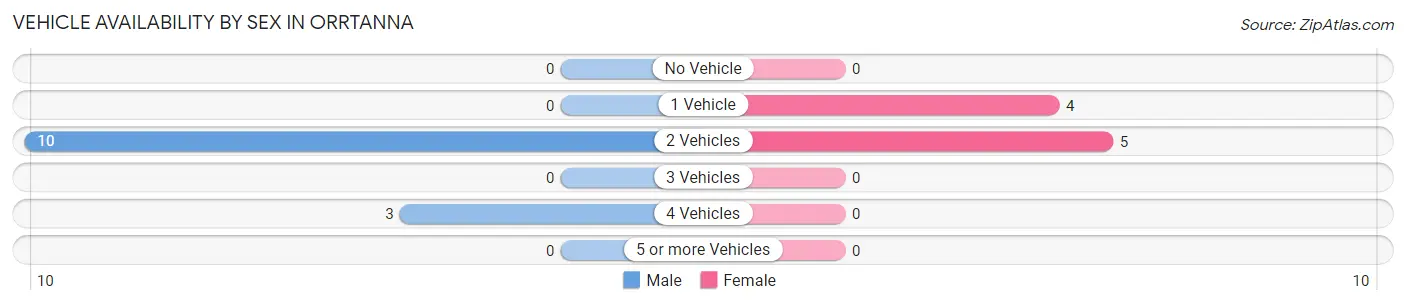
| Vehicles Available | Male | Female |
| No Vehicle | 0 (0.0%) | 0 (0.0%) |
| 1 Vehicle | 0 (0.0%) | 4 (44.4%) |
| 2 Vehicles | 10 (76.9%) | 5 (55.6%) |
| 3 Vehicles | 0 (0.0%) | 0 (0.0%) |
| 4 Vehicles | 3 (23.1%) | 0 (0.0%) |
| 5 or more Vehicles | 0 (0.0%) | 0 (0.0%) |
| Total | 13 (100.0%) | 9 (100.0%) |
Commute Time in Orrtanna
The most frequently occuring commute durations in Orrtanna are 20 to 24 minutes (9 commuters, 64.3%), 60 to 89 minutes (5 commuters, 35.7%), and less than 5 minutes (0 commuters, 0.0%).
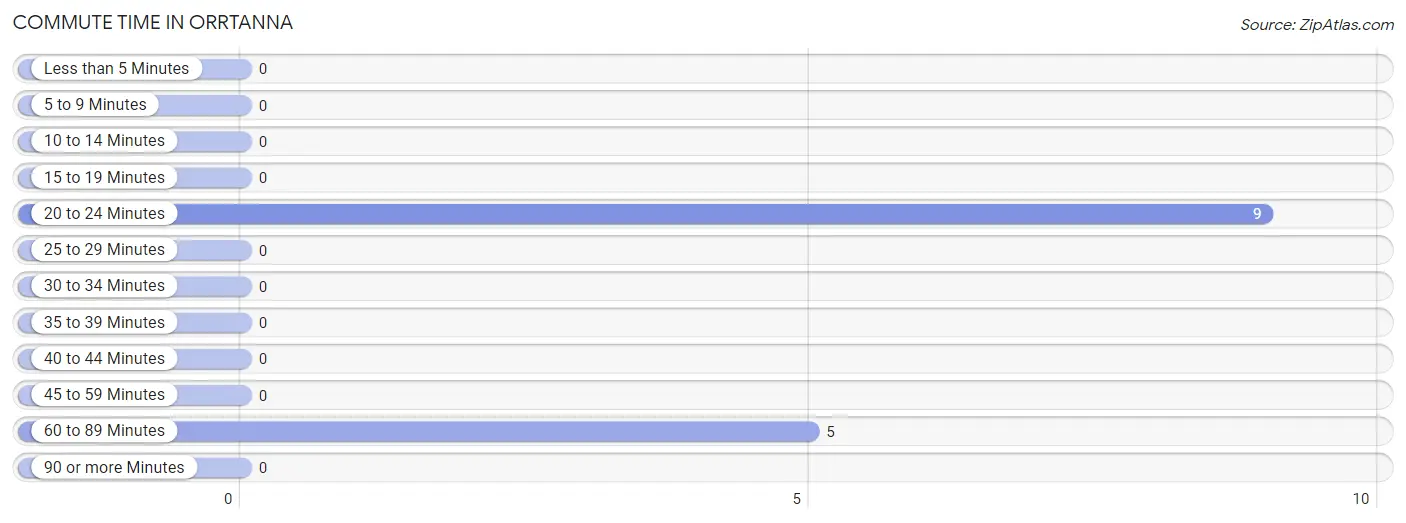
| Commute Time | # Commuters | % Commuters |
| Less than 5 Minutes | 0 | 0.0% |
| 5 to 9 Minutes | 0 | 0.0% |
| 10 to 14 Minutes | 0 | 0.0% |
| 15 to 19 Minutes | 0 | 0.0% |
| 20 to 24 Minutes | 9 | 64.3% |
| 25 to 29 Minutes | 0 | 0.0% |
| 30 to 34 Minutes | 0 | 0.0% |
| 35 to 39 Minutes | 0 | 0.0% |
| 40 to 44 Minutes | 0 | 0.0% |
| 45 to 59 Minutes | 0 | 0.0% |
| 60 to 89 Minutes | 5 | 35.7% |
| 90 or more Minutes | 0 | 0.0% |
Commute Time by Sex in Orrtanna
The most common commute times in Orrtanna are 20 to 24 minutes (5 commuters, 100.0%) for males and 60 to 89 minutes (5 commuters, 55.6%) for females.
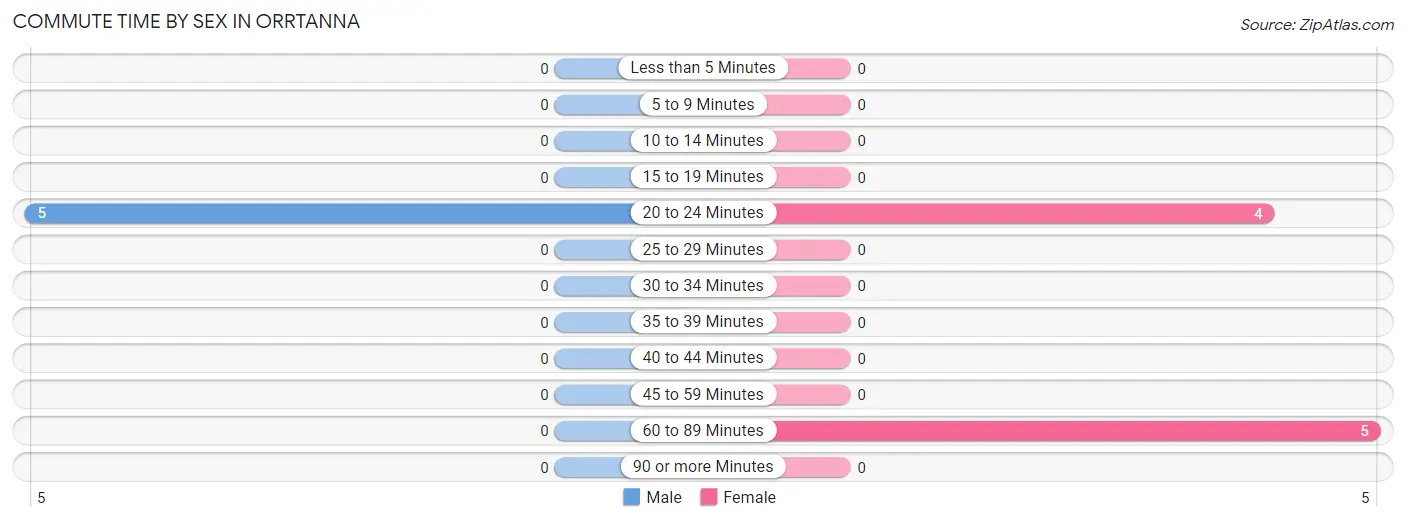
| Commute Time | Male | Female |
| Less than 5 Minutes | 0 (0.0%) | 0 (0.0%) |
| 5 to 9 Minutes | 0 (0.0%) | 0 (0.0%) |
| 10 to 14 Minutes | 0 (0.0%) | 0 (0.0%) |
| 15 to 19 Minutes | 0 (0.0%) | 0 (0.0%) |
| 20 to 24 Minutes | 5 (100.0%) | 4 (44.4%) |
| 25 to 29 Minutes | 0 (0.0%) | 0 (0.0%) |
| 30 to 34 Minutes | 0 (0.0%) | 0 (0.0%) |
| 35 to 39 Minutes | 0 (0.0%) | 0 (0.0%) |
| 40 to 44 Minutes | 0 (0.0%) | 0 (0.0%) |
| 45 to 59 Minutes | 0 (0.0%) | 0 (0.0%) |
| 60 to 89 Minutes | 0 (0.0%) | 5 (55.6%) |
| 90 or more Minutes | 0 (0.0%) | 0 (0.0%) |
Time of Departure to Work by Sex in Orrtanna
The most frequent times of departure to work in Orrtanna are 5:30 AM to 5:59 AM (5, 100.0%) for males and 6:00 AM to 6:29 AM (5, 55.6%) for females.
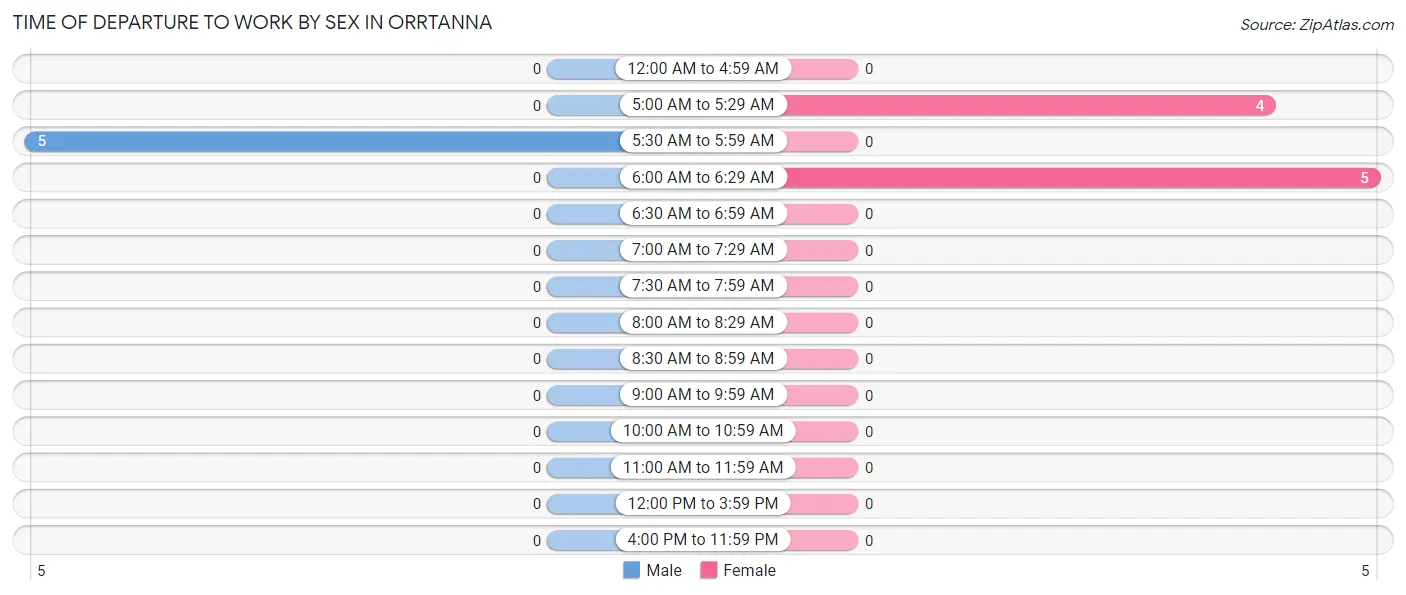
| Time of Departure | Male | Female |
| 12:00 AM to 4:59 AM | 0 (0.0%) | 0 (0.0%) |
| 5:00 AM to 5:29 AM | 0 (0.0%) | 4 (44.4%) |
| 5:30 AM to 5:59 AM | 5 (100.0%) | 0 (0.0%) |
| 6:00 AM to 6:29 AM | 0 (0.0%) | 5 (55.6%) |
| 6:30 AM to 6:59 AM | 0 (0.0%) | 0 (0.0%) |
| 7:00 AM to 7:29 AM | 0 (0.0%) | 0 (0.0%) |
| 7:30 AM to 7:59 AM | 0 (0.0%) | 0 (0.0%) |
| 8:00 AM to 8:29 AM | 0 (0.0%) | 0 (0.0%) |
| 8:30 AM to 8:59 AM | 0 (0.0%) | 0 (0.0%) |
| 9:00 AM to 9:59 AM | 0 (0.0%) | 0 (0.0%) |
| 10:00 AM to 10:59 AM | 0 (0.0%) | 0 (0.0%) |
| 11:00 AM to 11:59 AM | 0 (0.0%) | 0 (0.0%) |
| 12:00 PM to 3:59 PM | 0 (0.0%) | 0 (0.0%) |
| 4:00 PM to 11:59 PM | 0 (0.0%) | 0 (0.0%) |
| Total | 5 (100.0%) | 9 (100.0%) |
Housing Occupancy in Orrtanna
Occupancy by Ownership in Orrtanna
Of the total 42 dwellings in Orrtanna, owner-occupied units account for 38 (90.5%), while renter-occupied units make up 4 (9.5%).
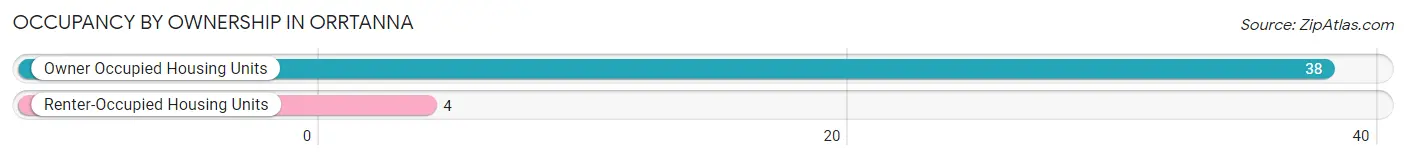
| Occupancy | # Housing Units | % Housing Units |
| Owner Occupied Housing Units | 38 | 90.5% |
| Renter-Occupied Housing Units | 4 | 9.5% |
| Total Occupied Housing Units | 42 | 100.0% |
Occupancy by Household Size in Orrtanna
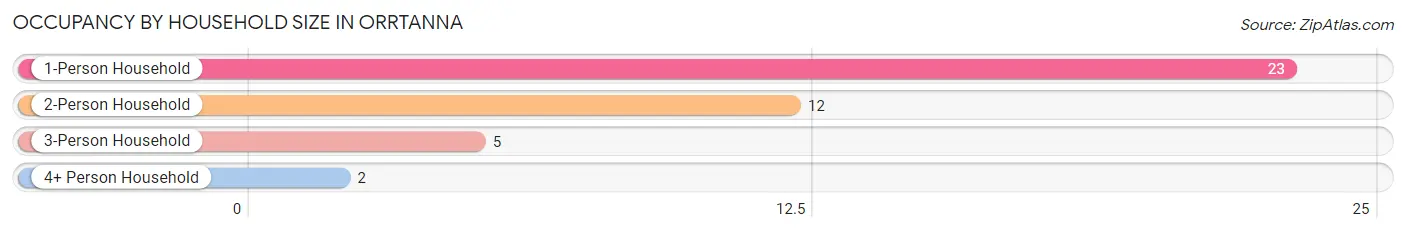
| Household Size | # Housing Units | % Housing Units |
| 1-Person Household | 23 | 54.8% |
| 2-Person Household | 12 | 28.6% |
| 3-Person Household | 5 | 11.9% |
| 4+ Person Household | 2 | 4.8% |
| Total Housing Units | 42 | 100.0% |
Occupancy by Ownership by Household Size in Orrtanna
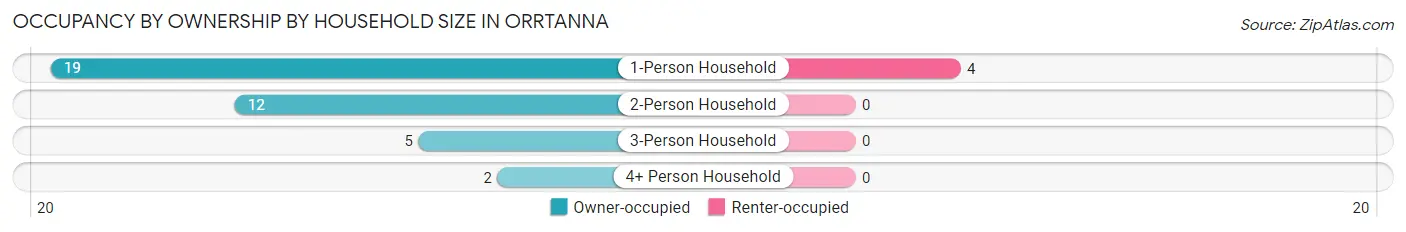
| Household Size | Owner-occupied | Renter-occupied |
| 1-Person Household | 19 (82.6%) | 4 (17.4%) |
| 2-Person Household | 12 (100.0%) | 0 (0.0%) |
| 3-Person Household | 5 (100.0%) | 0 (0.0%) |
| 4+ Person Household | 2 (100.0%) | 0 (0.0%) |
| Total Housing Units | 38 (90.5%) | 4 (9.5%) |
Occupancy by Educational Attainment in Orrtanna
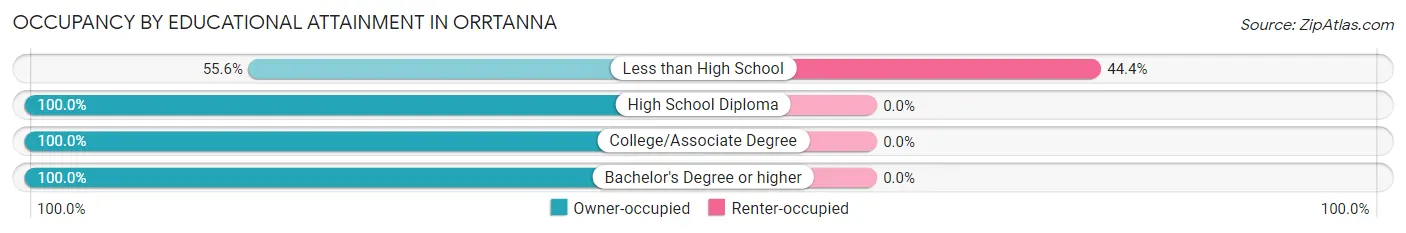
| Household Size | Owner-occupied | Renter-occupied |
| Less than High School | 5 (55.6%) | 4 (44.4%) |
| High School Diploma | 12 (100.0%) | 0 (0.0%) |
| College/Associate Degree | 7 (100.0%) | 0 (0.0%) |
| Bachelor's Degree or higher | 14 (100.0%) | 0 (0.0%) |
Occupancy by Age of Householder in Orrtanna
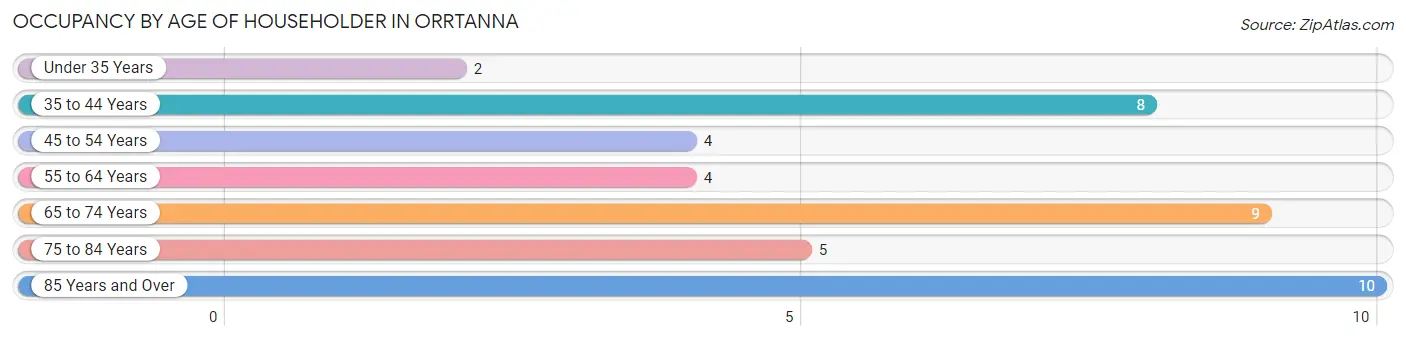
| Age Bracket | # Households | % Households |
| Under 35 Years | 2 | 4.8% |
| 35 to 44 Years | 8 | 19.1% |
| 45 to 54 Years | 4 | 9.5% |
| 55 to 64 Years | 4 | 9.5% |
| 65 to 74 Years | 9 | 21.4% |
| 75 to 84 Years | 5 | 11.9% |
| 85 Years and Over | 10 | 23.8% |
| Total | 42 | 100.0% |
Housing Finances in Orrtanna
Median Income by Occupancy in Orrtanna
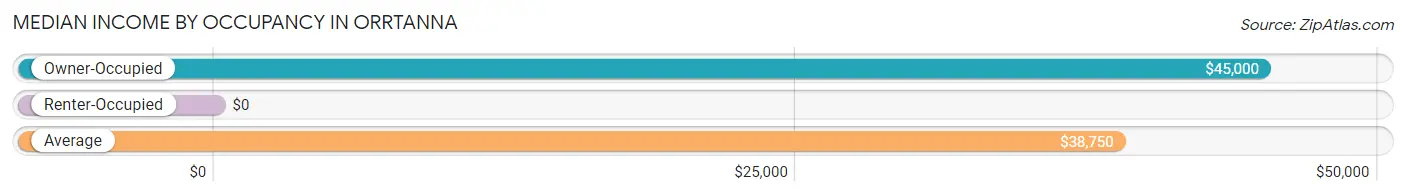
| Occupancy Type | # Households | Median Income |
| Owner-Occupied | 38 (90.5%) | $45,000 |
| Renter-Occupied | 4 (9.5%) | $0 |
| Average | 42 (100.0%) | $38,750 |
Occupancy by Householder Income Bracket in Orrtanna
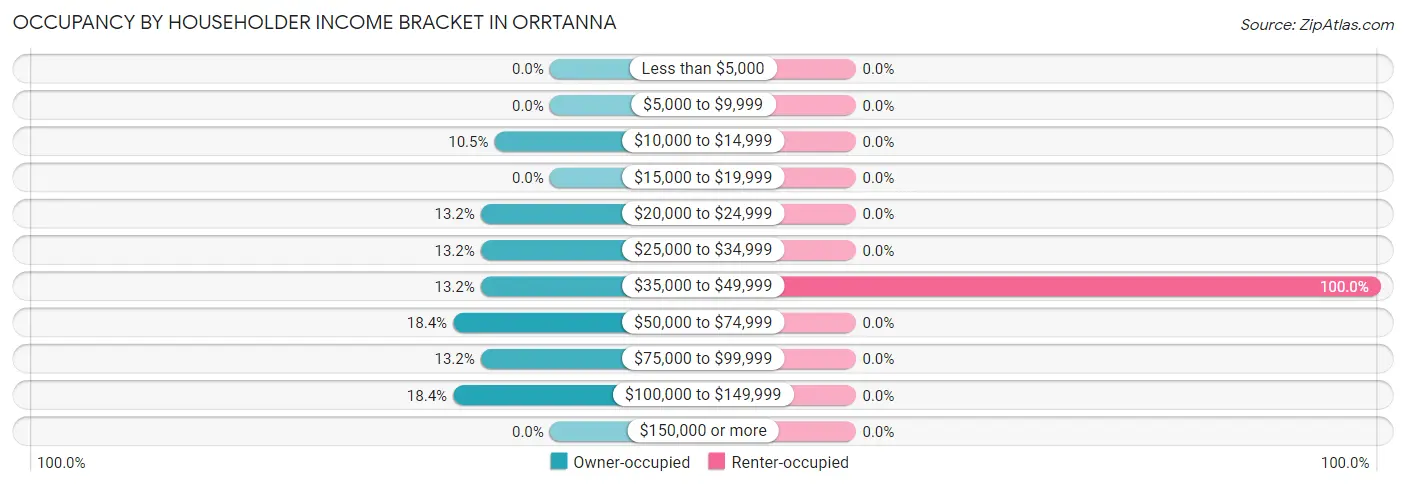
| Income Bracket | Owner-occupied | Renter-occupied |
| Less than $5,000 | 0 (0.0%) | 0 (0.0%) |
| $5,000 to $9,999 | 0 (0.0%) | 0 (0.0%) |
| $10,000 to $14,999 | 4 (10.5%) | 0 (0.0%) |
| $15,000 to $19,999 | 0 (0.0%) | 0 (0.0%) |
| $20,000 to $24,999 | 5 (13.2%) | 0 (0.0%) |
| $25,000 to $34,999 | 5 (13.2%) | 0 (0.0%) |
| $35,000 to $49,999 | 5 (13.2%) | 4 (100.0%) |
| $50,000 to $74,999 | 7 (18.4%) | 0 (0.0%) |
| $75,000 to $99,999 | 5 (13.2%) | 0 (0.0%) |
| $100,000 to $149,999 | 7 (18.4%) | 0 (0.0%) |
| $150,000 or more | 0 (0.0%) | 0 (0.0%) |
| Total | 38 (100.0%) | 4 (100.0%) |
Monthly Housing Cost Tiers in Orrtanna
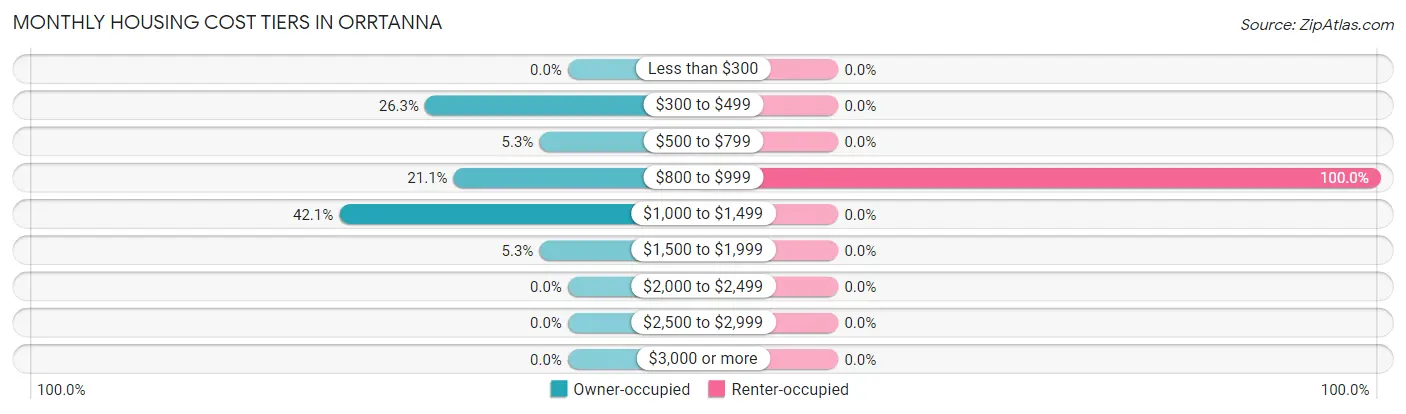
| Monthly Cost | Owner-occupied | Renter-occupied |
| Less than $300 | 0 (0.0%) | 0 (0.0%) |
| $300 to $499 | 10 (26.3%) | 0 (0.0%) |
| $500 to $799 | 2 (5.3%) | 0 (0.0%) |
| $800 to $999 | 8 (21.0%) | 4 (100.0%) |
| $1,000 to $1,499 | 16 (42.1%) | 0 (0.0%) |
| $1,500 to $1,999 | 2 (5.3%) | 0 (0.0%) |
| $2,000 to $2,499 | 0 (0.0%) | 0 (0.0%) |
| $2,500 to $2,999 | 0 (0.0%) | 0 (0.0%) |
| $3,000 or more | 0 (0.0%) | 0 (0.0%) |
| Total | 38 (100.0%) | 4 (100.0%) |
Physical Housing Characteristics in Orrtanna
Housing Structures in Orrtanna
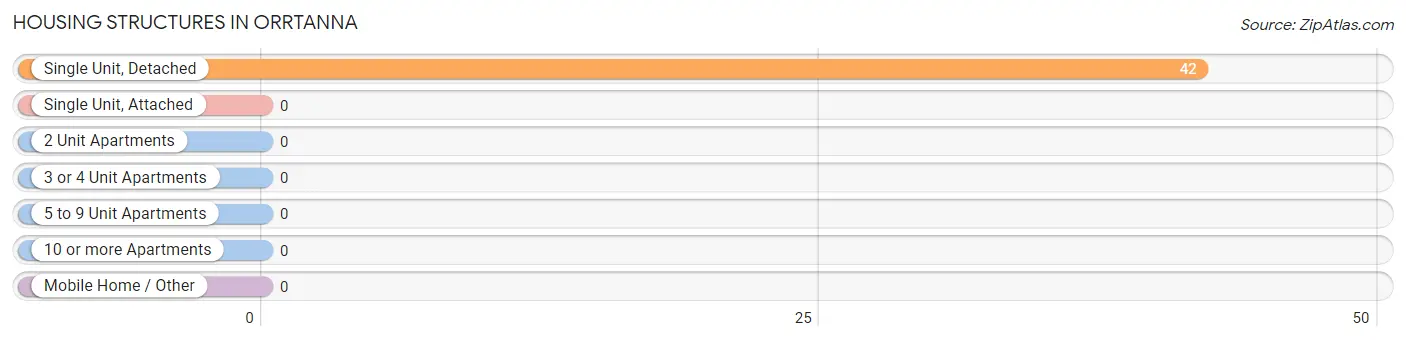
| Structure Type | # Housing Units | % Housing Units |
| Single Unit, Detached | 42 | 100.0% |
| Single Unit, Attached | 0 | 0.0% |
| 2 Unit Apartments | 0 | 0.0% |
| 3 or 4 Unit Apartments | 0 | 0.0% |
| 5 to 9 Unit Apartments | 0 | 0.0% |
| 10 or more Apartments | 0 | 0.0% |
| Mobile Home / Other | 0 | 0.0% |
| Total | 42 | 100.0% |
Housing Structures by Occupancy in Orrtanna
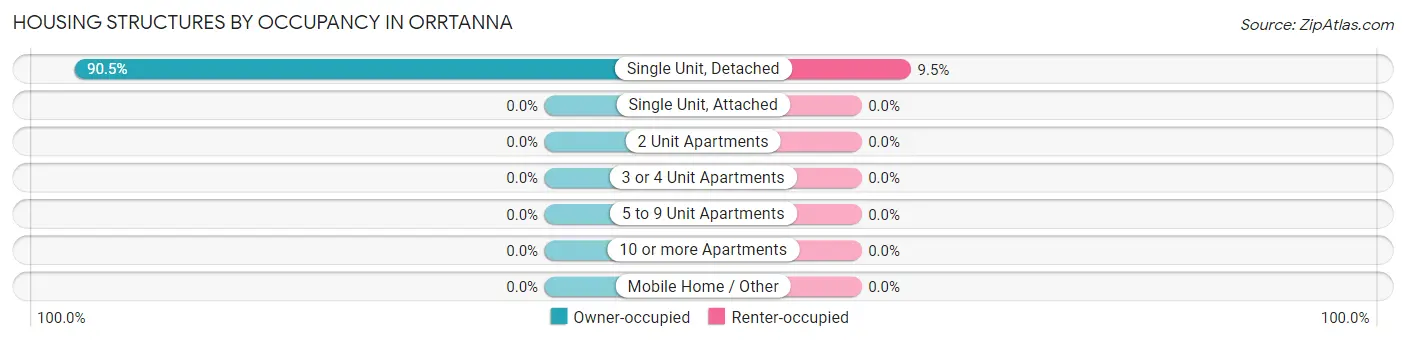
| Structure Type | Owner-occupied | Renter-occupied |
| Single Unit, Detached | 38 (90.5%) | 4 (9.5%) |
| Single Unit, Attached | 0 (0.0%) | 0 (0.0%) |
| 2 Unit Apartments | 0 (0.0%) | 0 (0.0%) |
| 3 or 4 Unit Apartments | 0 (0.0%) | 0 (0.0%) |
| 5 to 9 Unit Apartments | 0 (0.0%) | 0 (0.0%) |
| 10 or more Apartments | 0 (0.0%) | 0 (0.0%) |
| Mobile Home / Other | 0 (0.0%) | 0 (0.0%) |
| Total | 38 (90.5%) | 4 (9.5%) |
Housing Structures by Number of Rooms in Orrtanna
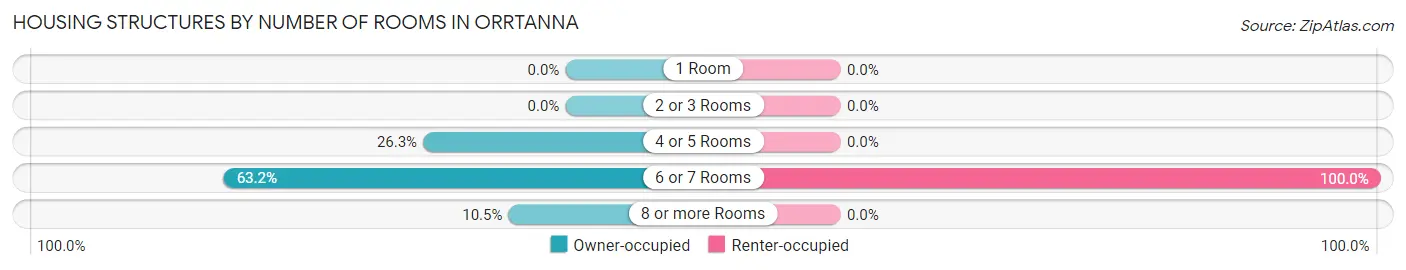
| Number of Rooms | Owner-occupied | Renter-occupied |
| 1 Room | 0 (0.0%) | 0 (0.0%) |
| 2 or 3 Rooms | 0 (0.0%) | 0 (0.0%) |
| 4 or 5 Rooms | 10 (26.3%) | 0 (0.0%) |
| 6 or 7 Rooms | 24 (63.2%) | 4 (100.0%) |
| 8 or more Rooms | 4 (10.5%) | 0 (0.0%) |
| Total | 38 (100.0%) | 4 (100.0%) |
Housing Structure by Heating Type in Orrtanna
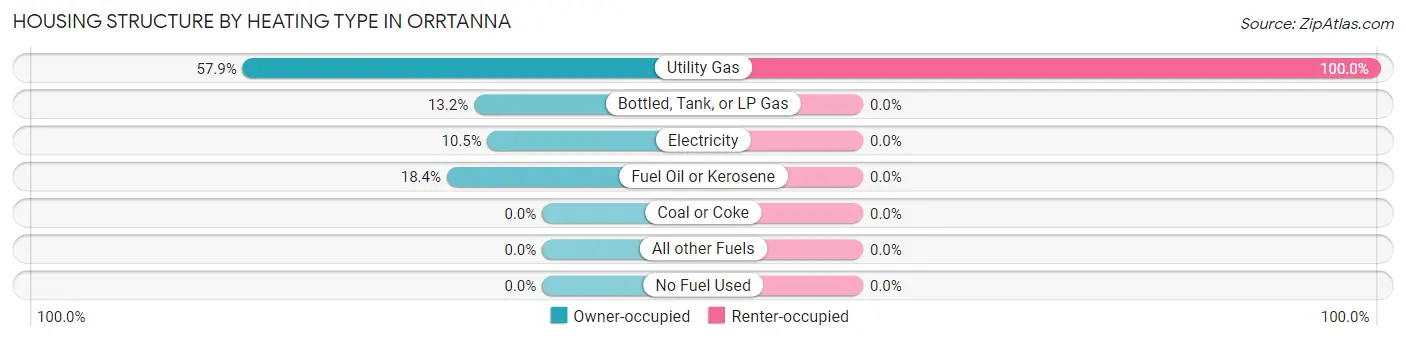
| Heating Type | Owner-occupied | Renter-occupied |
| Utility Gas | 22 (57.9%) | 4 (100.0%) |
| Bottled, Tank, or LP Gas | 5 (13.2%) | 0 (0.0%) |
| Electricity | 4 (10.5%) | 0 (0.0%) |
| Fuel Oil or Kerosene | 7 (18.4%) | 0 (0.0%) |
| Coal or Coke | 0 (0.0%) | 0 (0.0%) |
| All other Fuels | 0 (0.0%) | 0 (0.0%) |
| No Fuel Used | 0 (0.0%) | 0 (0.0%) |
| Total | 38 (100.0%) | 4 (100.0%) |
Household Vehicle Usage in Orrtanna
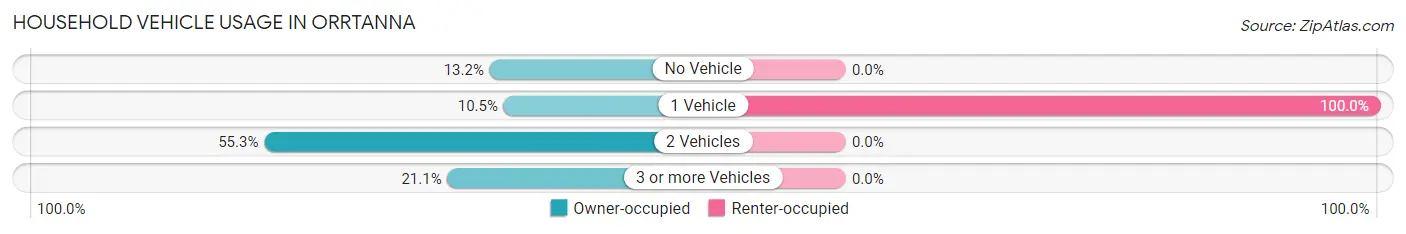
| Vehicles per Household | Owner-occupied | Renter-occupied |
| No Vehicle | 5 (13.2%) | 0 (0.0%) |
| 1 Vehicle | 4 (10.5%) | 4 (100.0%) |
| 2 Vehicles | 21 (55.3%) | 0 (0.0%) |
| 3 or more Vehicles | 8 (21.0%) | 0 (0.0%) |
| Total | 38 (100.0%) | 4 (100.0%) |
Real Estate & Mortgages in Orrtanna
Real Estate and Mortgage Overview in Orrtanna
| Characteristic | Without Mortgage | With Mortgage |
| Housing Units | 12 | 26 |
| Median Property Value | - | - |
| Median Household Income | - | - |
| Monthly Housing Costs | $330 | $0 |
| Real Estate Taxes | $1,600 | $0 |
Property Value by Mortgage Status in Orrtanna
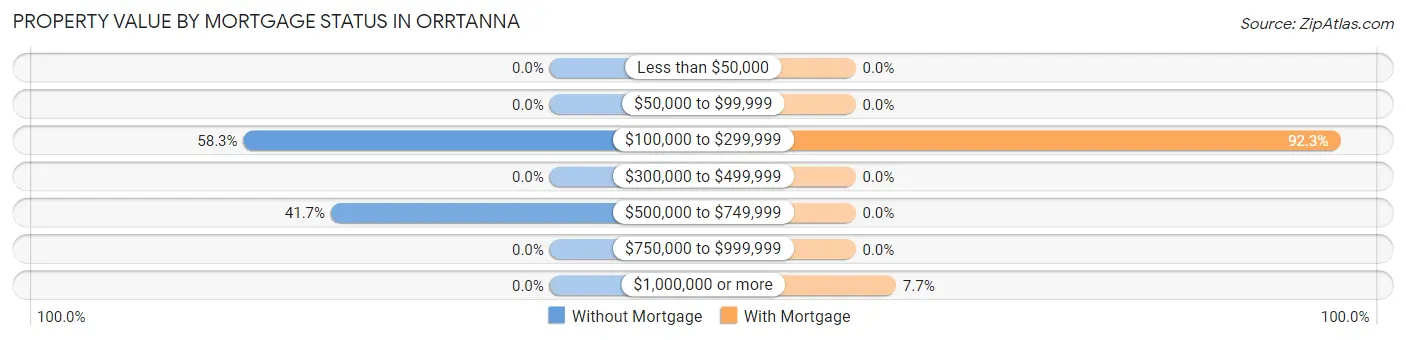
| Property Value | Without Mortgage | With Mortgage |
| Less than $50,000 | 0 (0.0%) | 0 (0.0%) |
| $50,000 to $99,999 | 0 (0.0%) | 0 (0.0%) |
| $100,000 to $299,999 | 7 (58.3%) | 24 (92.3%) |
| $300,000 to $499,999 | 0 (0.0%) | 0 (0.0%) |
| $500,000 to $749,999 | 5 (41.7%) | 0 (0.0%) |
| $750,000 to $999,999 | 0 (0.0%) | 0 (0.0%) |
| $1,000,000 or more | 0 (0.0%) | 2 (7.7%) |
| Total | 12 (100.0%) | 26 (100.0%) |
Household Income by Mortgage Status in Orrtanna
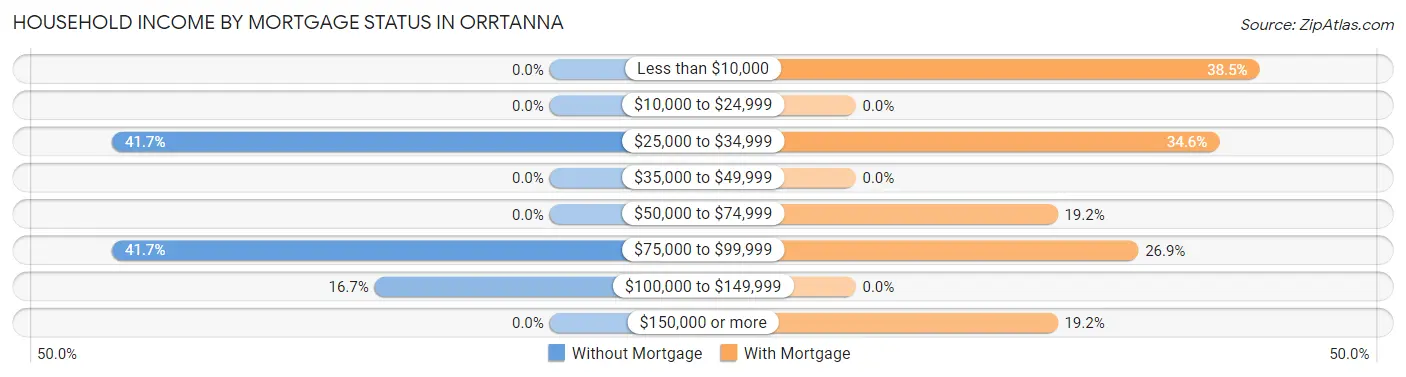
| Household Income | Without Mortgage | With Mortgage |
| Less than $10,000 | 0 (0.0%) | 10 (38.5%) |
| $10,000 to $24,999 | 0 (0.0%) | 0 (0.0%) |
| $25,000 to $34,999 | 5 (41.7%) | 9 (34.6%) |
| $35,000 to $49,999 | 0 (0.0%) | 0 (0.0%) |
| $50,000 to $74,999 | 0 (0.0%) | 5 (19.2%) |
| $75,000 to $99,999 | 5 (41.7%) | 7 (26.9%) |
| $100,000 to $149,999 | 2 (16.7%) | 0 (0.0%) |
| $150,000 or more | 0 (0.0%) | 5 (19.2%) |
| Total | 12 (100.0%) | 26 (100.0%) |
Property Value to Household Income Ratio in Orrtanna
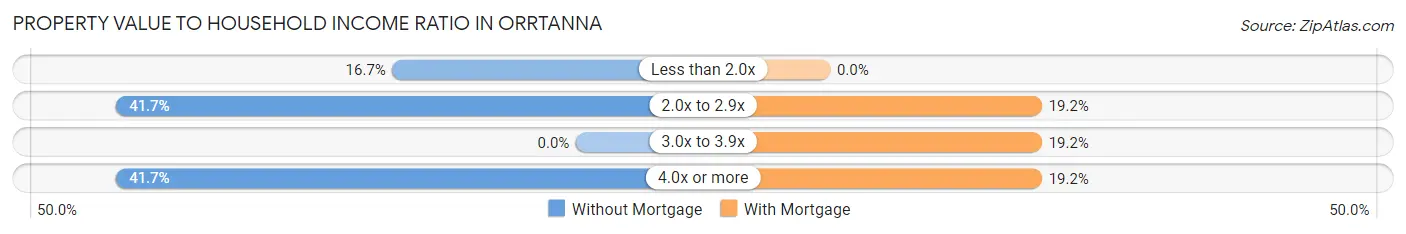
| Value-to-Income Ratio | Without Mortgage | With Mortgage |
| Less than 2.0x | 2 (16.7%) | 0 (0.0%) |
| 2.0x to 2.9x | 5 (41.7%) | 5 (19.2%) |
| 3.0x to 3.9x | 0 (0.0%) | 5 (19.2%) |
| 4.0x or more | 5 (41.7%) | 5 (19.2%) |
| Total | 12 (100.0%) | 26 (100.0%) |
Real Estate Taxes by Mortgage Status in Orrtanna
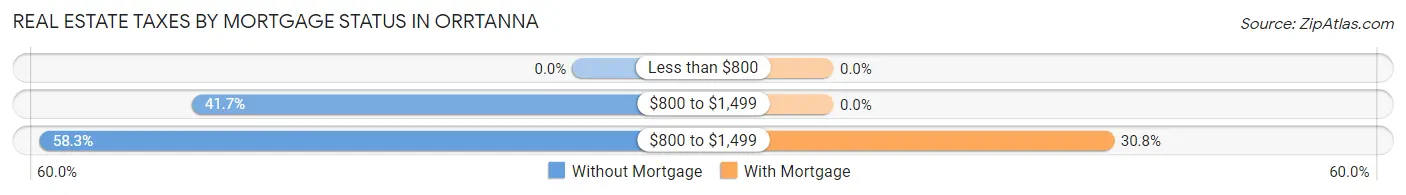
| Property Taxes | Without Mortgage | With Mortgage |
| Less than $800 | 0 (0.0%) | 0 (0.0%) |
| $800 to $1,499 | 5 (41.7%) | 0 (0.0%) |
| $800 to $1,499 | 7 (58.3%) | 8 (30.8%) |
| Total | 12 (100.0%) | 26 (100.0%) |
Health & Disability in Orrtanna
Health Insurance Coverage by Age in Orrtanna
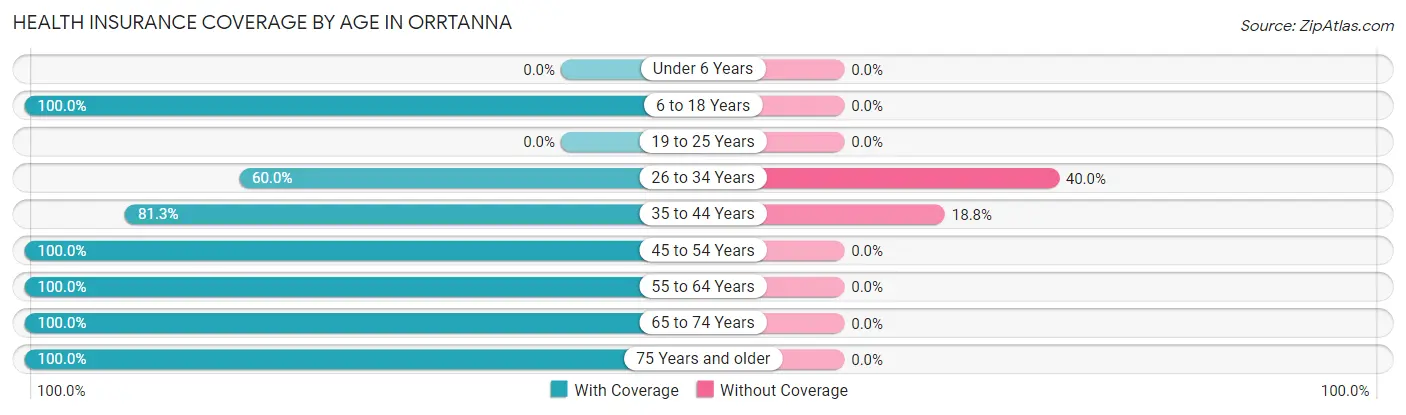
| Age Bracket | With Coverage | Without Coverage |
| Under 6 Years | 0 (0.0%) | 0 (0.0%) |
| 6 to 18 Years | 18 (100.0%) | 0 (0.0%) |
| 19 to 25 Years | 0 (0.0%) | 0 (0.0%) |
| 26 to 34 Years | 3 (60.0%) | 2 (40.0%) |
| 35 to 44 Years | 13 (81.2%) | 3 (18.8%) |
| 45 to 54 Years | 4 (100.0%) | 0 (0.0%) |
| 55 to 64 Years | 4 (100.0%) | 0 (0.0%) |
| 65 to 74 Years | 14 (100.0%) | 0 (0.0%) |
| 75 Years and older | 20 (100.0%) | 0 (0.0%) |
| Total | 76 (93.8%) | 5 (6.2%) |
Health Insurance Coverage by Citizenship Status in Orrtanna
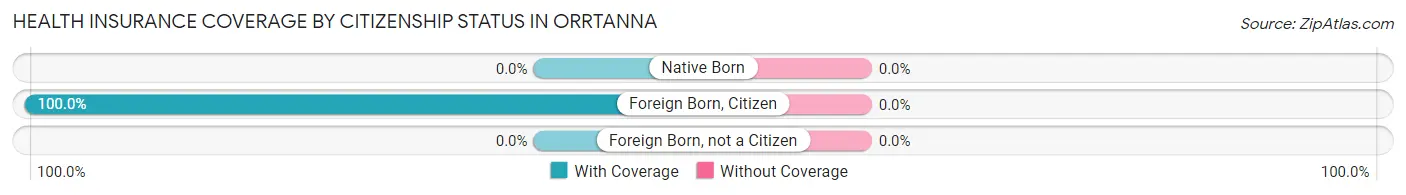
| Citizenship Status | With Coverage | Without Coverage |
| Native Born | 0 (0.0%) | 0 (0.0%) |
| Foreign Born, Citizen | 18 (100.0%) | 0 (0.0%) |
| Foreign Born, not a Citizen | 0 (0.0%) | 0 (0.0%) |
Health Insurance Coverage by Household Income in Orrtanna
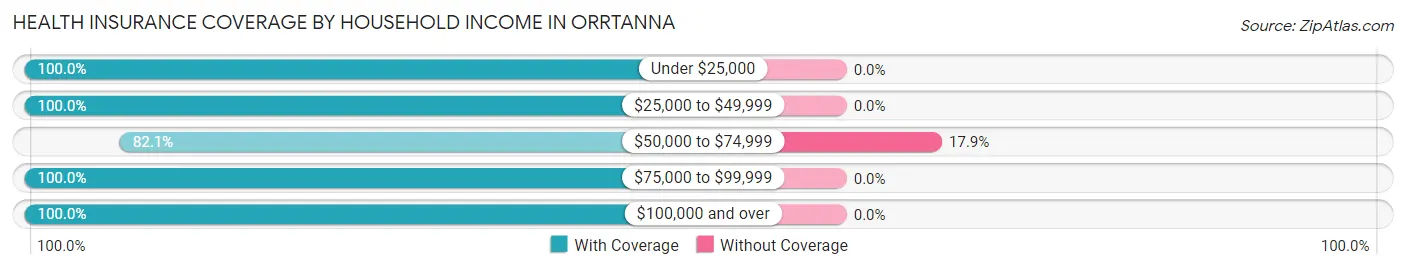
| Household Income | With Coverage | Without Coverage |
| Under $25,000 | 9 (100.0%) | 0 (0.0%) |
| $25,000 to $49,999 | 19 (100.0%) | 0 (0.0%) |
| $50,000 to $74,999 | 23 (82.1%) | 5 (17.9%) |
| $75,000 to $99,999 | 5 (100.0%) | 0 (0.0%) |
| $100,000 and over | 20 (100.0%) | 0 (0.0%) |
Public vs Private Health Insurance Coverage by Age in Orrtanna
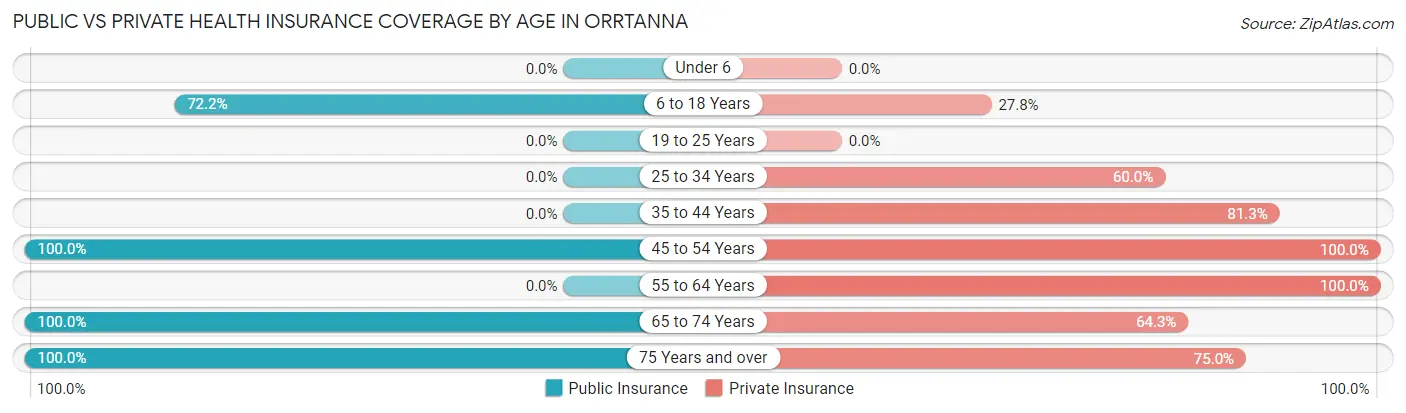
| Age Bracket | Public Insurance | Private Insurance |
| Under 6 | 0 (0.0%) | 0 (0.0%) |
| 6 to 18 Years | 13 (72.2%) | 5 (27.8%) |
| 19 to 25 Years | 0 (0.0%) | 0 (0.0%) |
| 25 to 34 Years | 0 (0.0%) | 3 (60.0%) |
| 35 to 44 Years | 0 (0.0%) | 13 (81.2%) |
| 45 to 54 Years | 4 (100.0%) | 4 (100.0%) |
| 55 to 64 Years | 0 (0.0%) | 4 (100.0%) |
| 65 to 74 Years | 14 (100.0%) | 9 (64.3%) |
| 75 Years and over | 20 (100.0%) | 15 (75.0%) |
| Total | 51 (63.0%) | 53 (65.4%) |
Disability Status by Sex by Age in Orrtanna
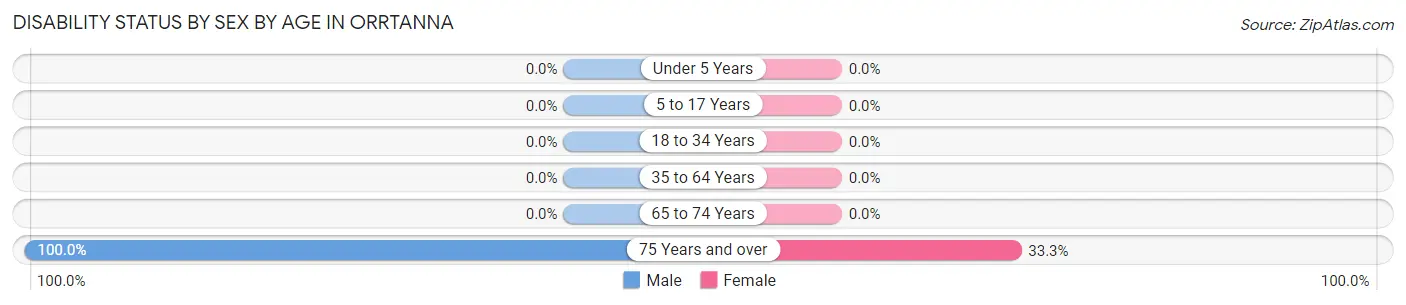
| Age Bracket | Male | Female |
| Under 5 Years | 0 (0.0%) | 0 (0.0%) |
| 5 to 17 Years | 0 (0.0%) | 0 (0.0%) |
| 18 to 34 Years | 0 (0.0%) | 0 (0.0%) |
| 35 to 64 Years | 0 (0.0%) | 0 (0.0%) |
| 65 to 74 Years | 0 (0.0%) | 0 (0.0%) |
| 75 Years and over | 5 (100.0%) | 5 (33.3%) |
Disability Class by Sex by Age in Orrtanna
Disability Class: Hearing Difficulty
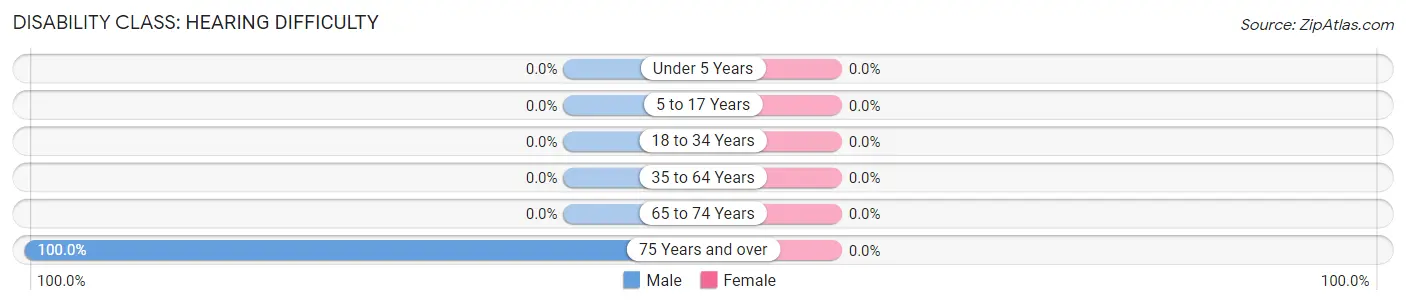
| Age Bracket | Male | Female |
| Under 5 Years | 0 (0.0%) | 0 (0.0%) |
| 5 to 17 Years | 0 (0.0%) | 0 (0.0%) |
| 18 to 34 Years | 0 (0.0%) | 0 (0.0%) |
| 35 to 64 Years | 0 (0.0%) | 0 (0.0%) |
| 65 to 74 Years | 0 (0.0%) | 0 (0.0%) |
| 75 Years and over | 5 (100.0%) | 0 (0.0%) |
Disability Class: Vision Difficulty
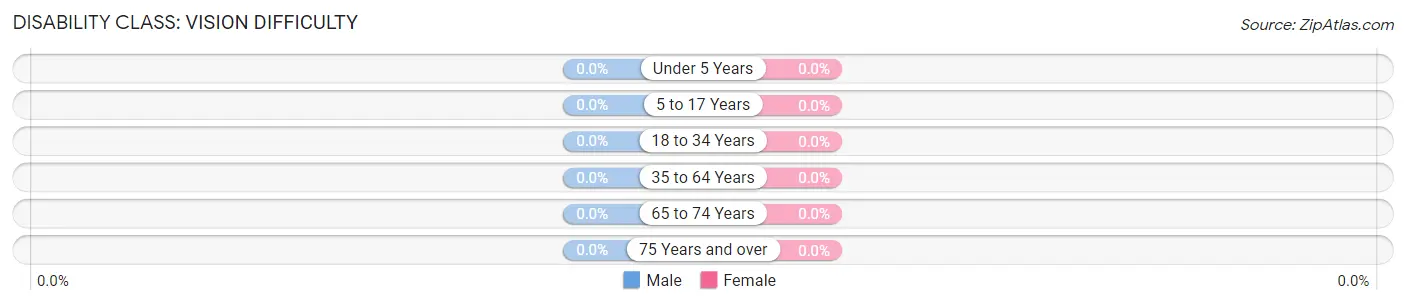
| Age Bracket | Male | Female |
| Under 5 Years | 0 (0.0%) | 0 (0.0%) |
| 5 to 17 Years | 0 (0.0%) | 0 (0.0%) |
| 18 to 34 Years | 0 (0.0%) | 0 (0.0%) |
| 35 to 64 Years | 0 (0.0%) | 0 (0.0%) |
| 65 to 74 Years | 0 (0.0%) | 0 (0.0%) |
| 75 Years and over | 0 (0.0%) | 0 (0.0%) |
Disability Class: Cognitive Difficulty
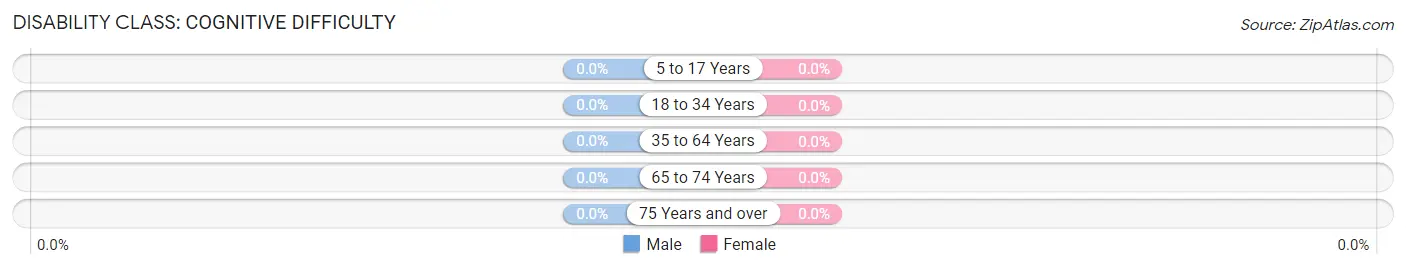
| Age Bracket | Male | Female |
| 5 to 17 Years | 0 (0.0%) | 0 (0.0%) |
| 18 to 34 Years | 0 (0.0%) | 0 (0.0%) |
| 35 to 64 Years | 0 (0.0%) | 0 (0.0%) |
| 65 to 74 Years | 0 (0.0%) | 0 (0.0%) |
| 75 Years and over | 0 (0.0%) | 0 (0.0%) |
Disability Class: Ambulatory Difficulty
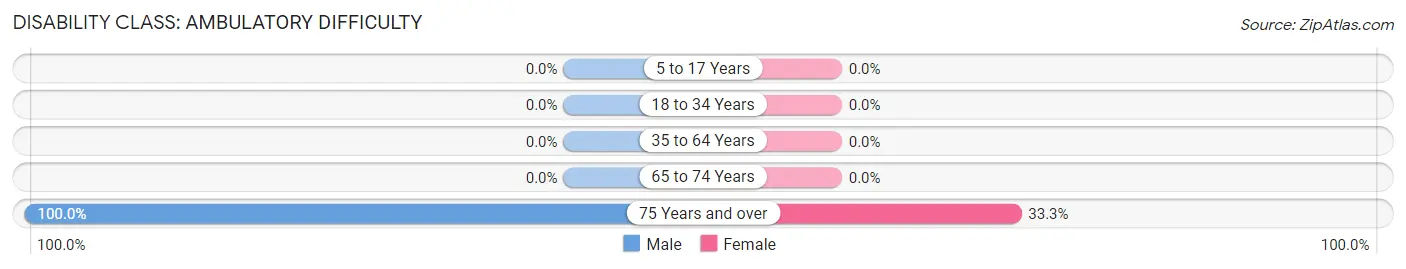
| Age Bracket | Male | Female |
| 5 to 17 Years | 0 (0.0%) | 0 (0.0%) |
| 18 to 34 Years | 0 (0.0%) | 0 (0.0%) |
| 35 to 64 Years | 0 (0.0%) | 0 (0.0%) |
| 65 to 74 Years | 0 (0.0%) | 0 (0.0%) |
| 75 Years and over | 5 (100.0%) | 5 (33.3%) |
Disability Class: Self-Care Difficulty
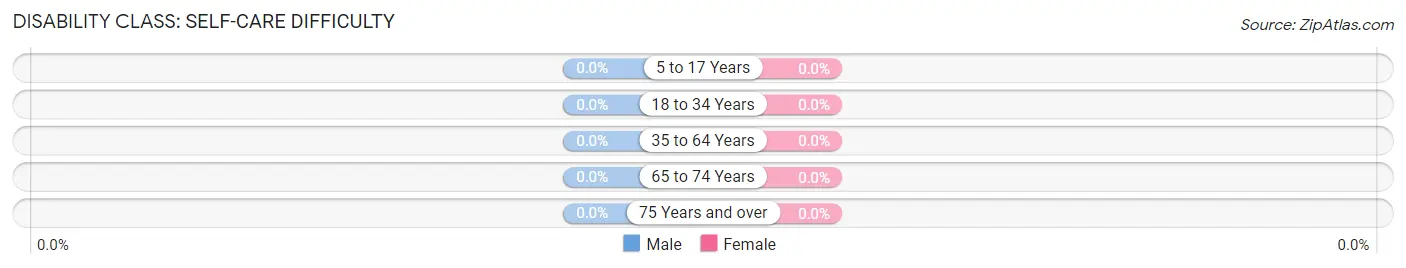
| Age Bracket | Male | Female |
| 5 to 17 Years | 0 (0.0%) | 0 (0.0%) |
| 18 to 34 Years | 0 (0.0%) | 0 (0.0%) |
| 35 to 64 Years | 0 (0.0%) | 0 (0.0%) |
| 65 to 74 Years | 0 (0.0%) | 0 (0.0%) |
| 75 Years and over | 0 (0.0%) | 0 (0.0%) |
Technology Access in Orrtanna
Computing Device Access in Orrtanna
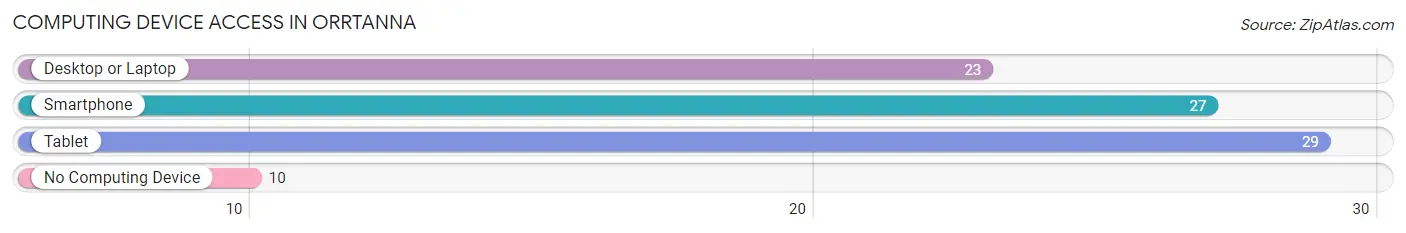
| Device Type | # Households | % Households |
| Desktop or Laptop | 23 | 54.8% |
| Smartphone | 27 | 64.3% |
| Tablet | 29 | 69.1% |
| No Computing Device | 10 | 23.8% |
| Total | 42 | 100.0% |
Internet Access in Orrtanna
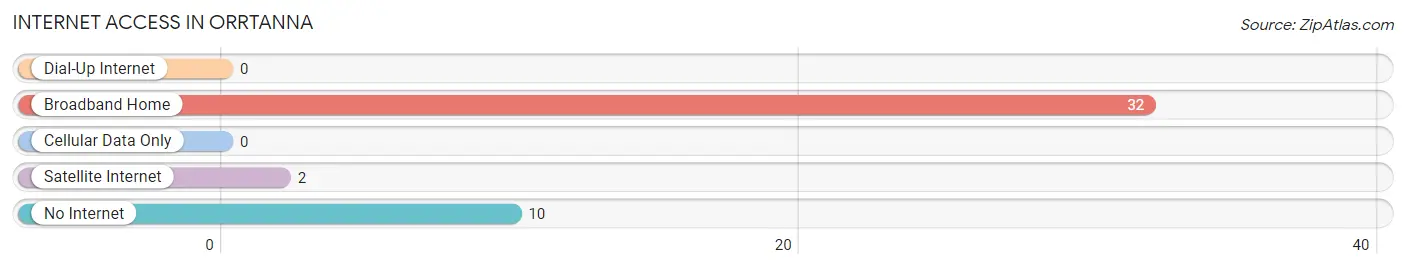
| Internet Type | # Households | % Households |
| Dial-Up Internet | 0 | 0.0% |
| Broadband Home | 32 | 76.2% |
| Cellular Data Only | 0 | 0.0% |
| Satellite Internet | 2 | 4.8% |
| No Internet | 10 | 23.8% |
| Total | 42 | 100.0% |
Orrtanna Summary
Orrtanna is a small unincorporated community located in Adams County, Pennsylvania. It is situated in the south-central part of the state, about 25 miles west of Gettysburg. The population of Orrtanna was estimated to be around 500 people in 2000.
History
The area that is now Orrtanna was first settled in the late 1700s by German immigrants. The town was originally known as “Orrtanna”, which is derived from the German word “ort”, meaning “place”. The town was officially established in 1845 and was named after the local Orrtanna Creek.
In the late 1800s, Orrtanna was a thriving agricultural community. The town was home to several farms, a general store, a post office, a blacksmith shop, and a school. The town also had a railroad station, which was used to transport goods and passengers to and from the nearby towns of Gettysburg and Hanover.
In the early 1900s, Orrtanna began to decline as the railroad station was closed and the town’s population began to dwindle. The town’s population continued to decline until the 1950s, when the population began to slowly increase again.
Geography
Orrtanna is located in south-central Pennsylvania, about 25 miles west of Gettysburg. The town is situated in the Appalachian Mountains and is surrounded by rolling hills and farmland. The town is located near the Orrtanna Creek, which flows through the town and is a popular spot for fishing and swimming.
The climate in Orrtanna is generally mild, with temperatures ranging from the low 30s in the winter to the mid-80s in the summer. The town receives an average of 40 inches of precipitation per year, with most of it falling in the form of snow in the winter months.
Economy
The economy of Orrtanna is largely based on agriculture. The town is home to several farms, which produce a variety of crops, including corn, soybeans, wheat, and hay. The town also has a few small businesses, including a general store, a post office, and a few restaurants.
The town is also home to a few small manufacturing companies, which produce a variety of products, including furniture, clothing, and automotive parts. The town is also home to a few small service businesses, such as auto repair shops and a few small construction companies.
Demographics
As of the 2000 census, the population of Orrtanna was estimated to be around 500 people. The town is predominantly white, with about 95% of the population being of European descent. The town also has a small Hispanic population, with about 4% of the population being of Hispanic or Latino origin.
The median household income in Orrtanna is around $45,000, which is slightly lower than the national average. The town has a relatively low unemployment rate, with only about 4% of the population being unemployed. The town also has a relatively low poverty rate, with only about 8% of the population living below the poverty line.
Common Questions
What is Per Capita Income in Orrtanna?
Per Capita income in Orrtanna is $29,383.
What is the Median Household income in Orrtanna?
Median Household Income in Orrtanna is $38,750.
What is Inequality or Gini Index in Orrtanna?
Inequality or Gini Index in Orrtanna is 0.32.
What is the Total Population of Orrtanna?
Total Population of Orrtanna is 81.
What is the Total Male Population of Orrtanna?
Total Male Population of Orrtanna is 30.
What is the Total Female Population of Orrtanna?
Total Female Population of Orrtanna is 51.
What is the Ratio of Males per 100 Females in Orrtanna?
There are 58.82 Males per 100 Females in Orrtanna.
What is the Ratio of Females per 100 Males in Orrtanna?
There are 170.00 Females per 100 Males in Orrtanna.
What is the Median Population Age in Orrtanna?
Median Population Age in Orrtanna is 52.4 Years.
What is the Average Family Size in Orrtanna
Average Family Size in Orrtanna is 3.2 People.
What is the Average Household Size in Orrtanna
Average Household Size in Orrtanna is 1.9 People.
How Large is the Labor Force in Orrtanna?
There are 27 People in the Labor Forcein in Orrtanna.
What is the Percentage of People in the Labor Force in Orrtanna?
42.9% of People are in the Labor Force in Orrtanna.
What is the Unemployment Rate in Orrtanna?
Unemployment Rate in Orrtanna is 18.5%.