Phoenixville borough, PA Map & Demographics
Phoenixville borough Overview
$50,290
PER CAPITA INCOME
$115,835
AVG FAMILY INCOME
$91,593
AVG HOUSEHOLD INCOME
22.2%
WAGE / INCOME GAP [ % ]
77.8¢/ $1
WAGE / INCOME GAP [ $ ]
0.39
INEQUALITY / GINI INDEX
18,723
TOTAL POPULATION
10,123
MALE POPULATION
8,600
FEMALE POPULATION
117.71
MALES / 100 FEMALES
84.96
FEMALES / 100 MALES
34.8
MEDIAN AGE
2.9
AVG FAMILY SIZE
2.2
AVG HOUSEHOLD SIZE
12,159
LABOR FORCE [ PEOPLE ]
77.9%
PERCENT IN LABOR FORCE
3.5%
UNEMPLOYMENT RATE
Income in Phoenixville borough
Income Overview in Phoenixville borough
Per Capita Income in Phoenixville borough is $50,290, while median incomes of families and households are $115,835 and $91,593 respectively.
| Characteristic | Number | Measure |
| Per Capita Income | 18,723 | $50,290 |
| Median Family Income | 4,243 | $115,835 |
| Mean Family Income | 4,243 | $125,731 |
| Median Household Income | 8,374 | $91,593 |
| Mean Household Income | 8,374 | $109,928 |
| Income Deficit | 4,243 | $0 |
| Wage / Income Gap (%) | 18,723 | 22.23% |
| Wage / Income Gap ($) | 18,723 | 77.77¢ per $1 |
| Gini / Inequality Index | 18,723 | 0.39 |
Earnings by Sex in Phoenixville borough
Average Earnings in Phoenixville borough are $58,937, $64,230 for men and $49,954 for women, a difference of 22.2%.
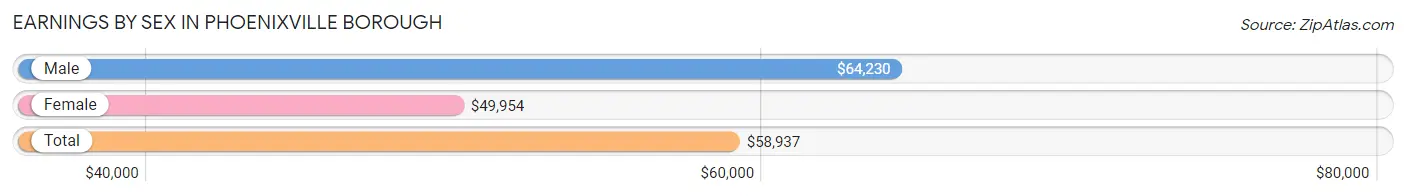
| Sex | Number | Average Earnings |
| Male | 6,801 (54.2%) | $64,230 |
| Female | 5,752 (45.8%) | $49,954 |
| Total | 12,553 (100.0%) | $58,937 |
Earnings by Sex by Income Bracket in Phoenixville borough
The most common earnings brackets in Phoenixville borough are $100,000+ for men (1,597 | 23.5%) and $75,000 to $99,999 for women (861 | 15.0%).
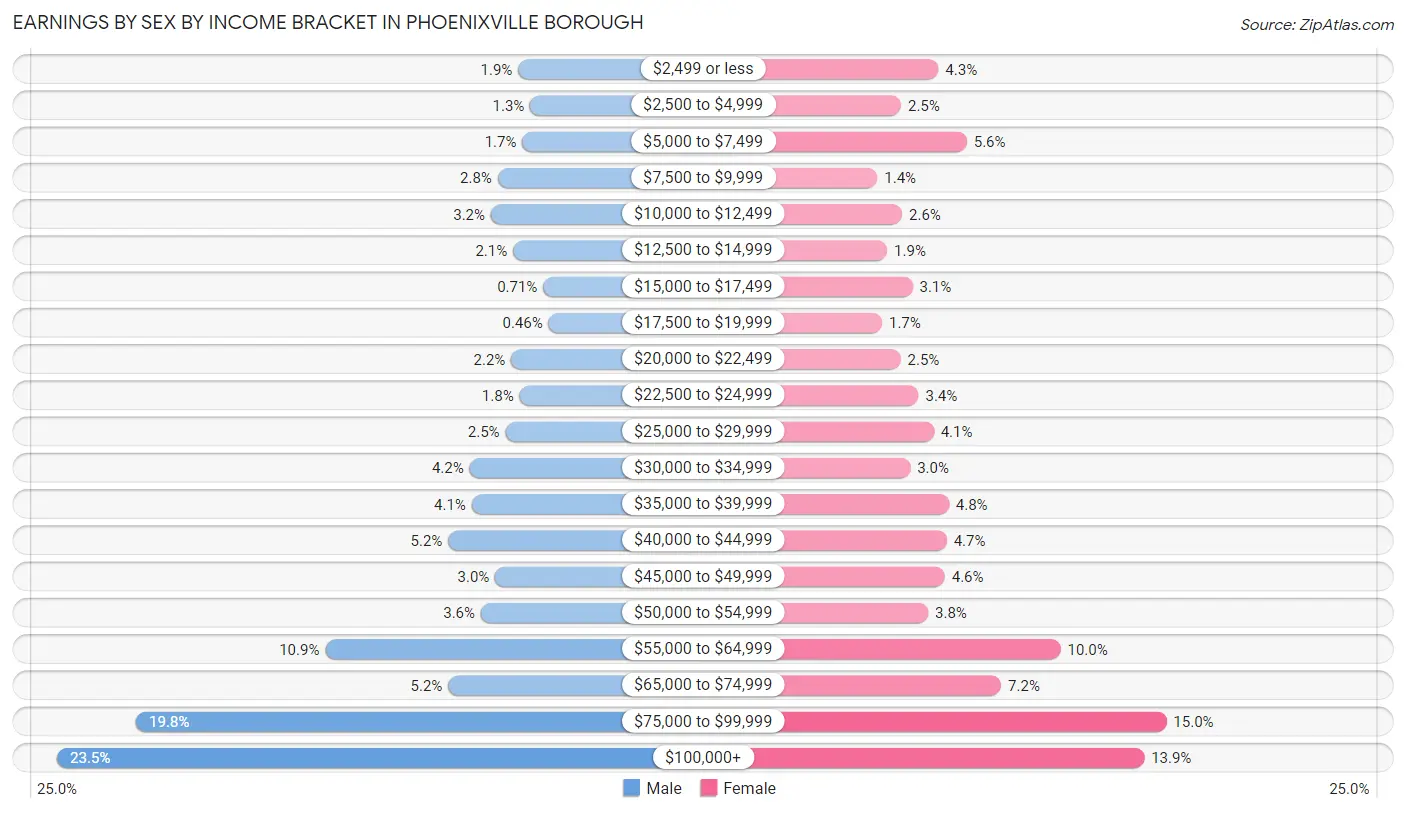
| Income | Male | Female |
| $2,499 or less | 128 (1.9%) | 247 (4.3%) |
| $2,500 to $4,999 | 90 (1.3%) | 146 (2.5%) |
| $5,000 to $7,499 | 115 (1.7%) | 323 (5.6%) |
| $7,500 to $9,999 | 193 (2.8%) | 82 (1.4%) |
| $10,000 to $12,499 | 215 (3.2%) | 149 (2.6%) |
| $12,500 to $14,999 | 144 (2.1%) | 109 (1.9%) |
| $15,000 to $17,499 | 48 (0.7%) | 177 (3.1%) |
| $17,500 to $19,999 | 31 (0.5%) | 95 (1.7%) |
| $20,000 to $22,499 | 150 (2.2%) | 145 (2.5%) |
| $22,500 to $24,999 | 124 (1.8%) | 193 (3.4%) |
| $25,000 to $29,999 | 169 (2.5%) | 234 (4.1%) |
| $30,000 to $34,999 | 283 (4.2%) | 171 (3.0%) |
| $35,000 to $39,999 | 276 (4.1%) | 275 (4.8%) |
| $40,000 to $44,999 | 351 (5.2%) | 269 (4.7%) |
| $45,000 to $49,999 | 201 (3.0%) | 264 (4.6%) |
| $50,000 to $54,999 | 247 (3.6%) | 219 (3.8%) |
| $55,000 to $64,999 | 743 (10.9%) | 576 (10.0%) |
| $65,000 to $74,999 | 351 (5.2%) | 416 (7.2%) |
| $75,000 to $99,999 | 1,345 (19.8%) | 861 (15.0%) |
| $100,000+ | 1,597 (23.5%) | 801 (13.9%) |
| Total | 6,801 (100.0%) | 5,752 (100.0%) |
Earnings by Sex by Educational Attainment in Phoenixville borough
Average earnings in Phoenixville borough are $64,881 for men and $54,537 for women, a difference of 15.9%. Men with an educational attainment of graduate degree enjoy the highest average annual earnings of $111,364, while those with high school diploma education earn the least with $41,058. Women with an educational attainment of graduate degree earn the most with the average annual earnings of $70,170, while those with less than high school education have the smallest earnings of $19,063.
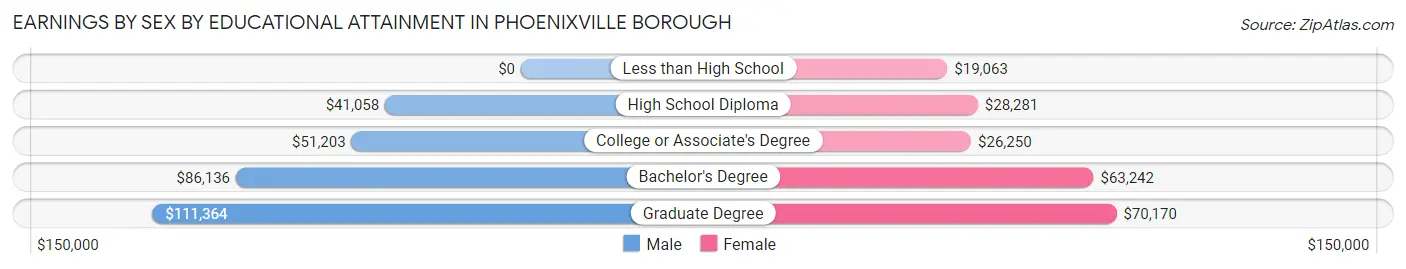
| Educational Attainment | Male Income | Female Income |
| Less than High School | - | - |
| High School Diploma | $41,058 | $28,281 |
| College or Associate's Degree | $51,203 | $26,250 |
| Bachelor's Degree | $86,136 | $63,242 |
| Graduate Degree | $111,364 | $70,170 |
| Total | $64,881 | $54,537 |
Family Income in Phoenixville borough
Family Income Brackets in Phoenixville borough
According to the Phoenixville borough family income data, there are 963 families falling into the $100,000 to $149,999 income range, which is the most common income bracket and makes up 22.7% of all families. Conversely, the $10,000 to $14,999 income bracket is the least frequent group with only 38 families (0.9%) belonging to this category.
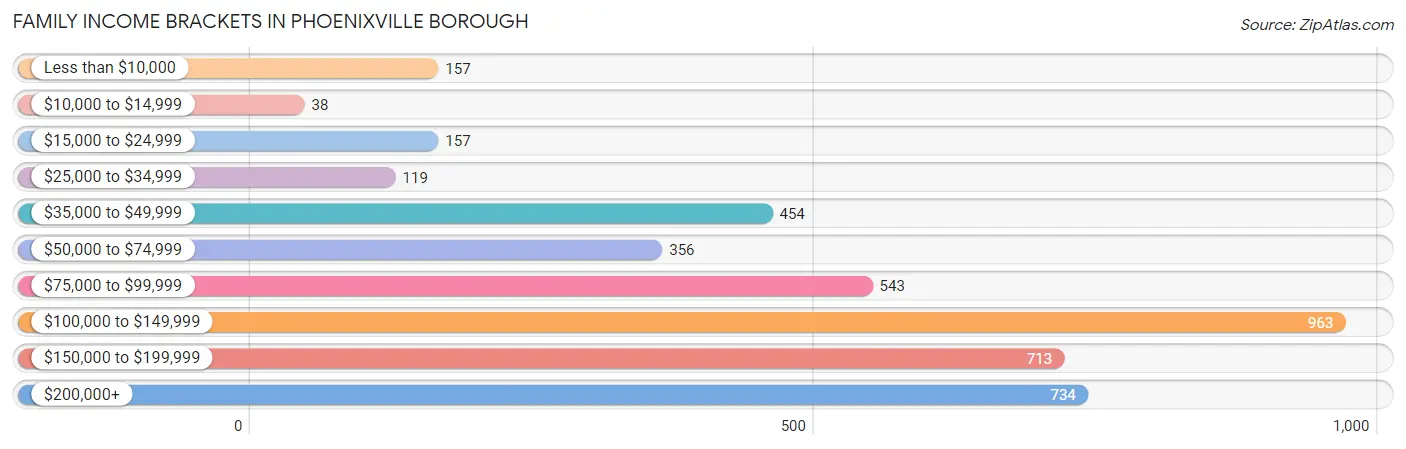
| Income Bracket | # Families | % Families |
| Less than $10,000 | 157 | 3.7% |
| $10,000 to $14,999 | 38 | 0.9% |
| $15,000 to $24,999 | 157 | 3.7% |
| $25,000 to $34,999 | 119 | 2.8% |
| $35,000 to $49,999 | 454 | 10.7% |
| $50,000 to $74,999 | 356 | 8.4% |
| $75,000 to $99,999 | 543 | 12.8% |
| $100,000 to $149,999 | 963 | 22.7% |
| $150,000 to $199,999 | 713 | 16.8% |
| $200,000+ | 734 | 17.3% |
Family Income by Famaliy Size in Phoenixville borough
6-person families (62 | 1.5%) account for the highest median family income in Phoenixville borough with $181,607 per family, while 3-person families (860 | 20.3%) have the highest median income of $51,944 per family member.
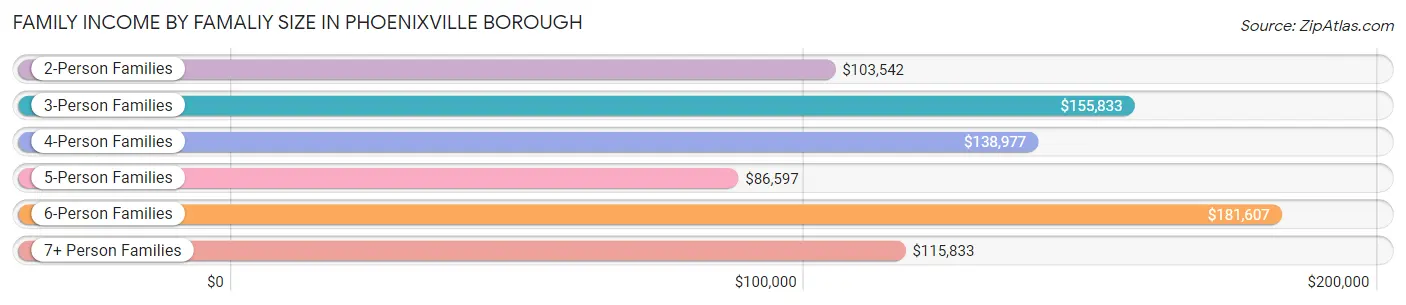
| Income Bracket | # Families | Median Income |
| 2-Person Families | 2,291 (54.0%) | $103,542 |
| 3-Person Families | 860 (20.3%) | $155,833 |
| 4-Person Families | 753 (17.7%) | $138,977 |
| 5-Person Families | 221 (5.2%) | $86,597 |
| 6-Person Families | 62 (1.5%) | $181,607 |
| 7+ Person Families | 56 (1.3%) | $115,833 |
| Total | 4,243 (100.0%) | $115,835 |
Family Income by Number of Earners in Phoenixville borough
The median family income in Phoenixville borough is $115,835, with families comprising 3+ earners (367) having the highest median family income of $158,090, while families with no earners (301) have the lowest median family income of $26,116, accounting for 8.6% and 7.1% of families, respectively.
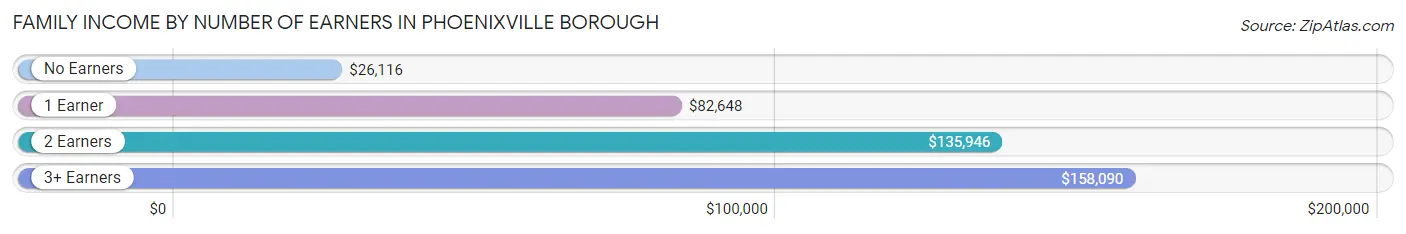
| Number of Earners | # Families | Median Income |
| No Earners | 301 (7.1%) | $26,116 |
| 1 Earner | 1,285 (30.3%) | $82,648 |
| 2 Earners | 2,290 (54.0%) | $135,946 |
| 3+ Earners | 367 (8.6%) | $158,090 |
| Total | 4,243 (100.0%) | $115,835 |
Household Income in Phoenixville borough
Household Income Brackets in Phoenixville borough
With 1,666 households falling in the category, the $100,000 to $149,999 income range is the most frequent in Phoenixville borough, accounting for 19.9% of all households. In contrast, only 201 households (2.4%) fall into the $10,000 to $14,999 income bracket, making it the least populous group.
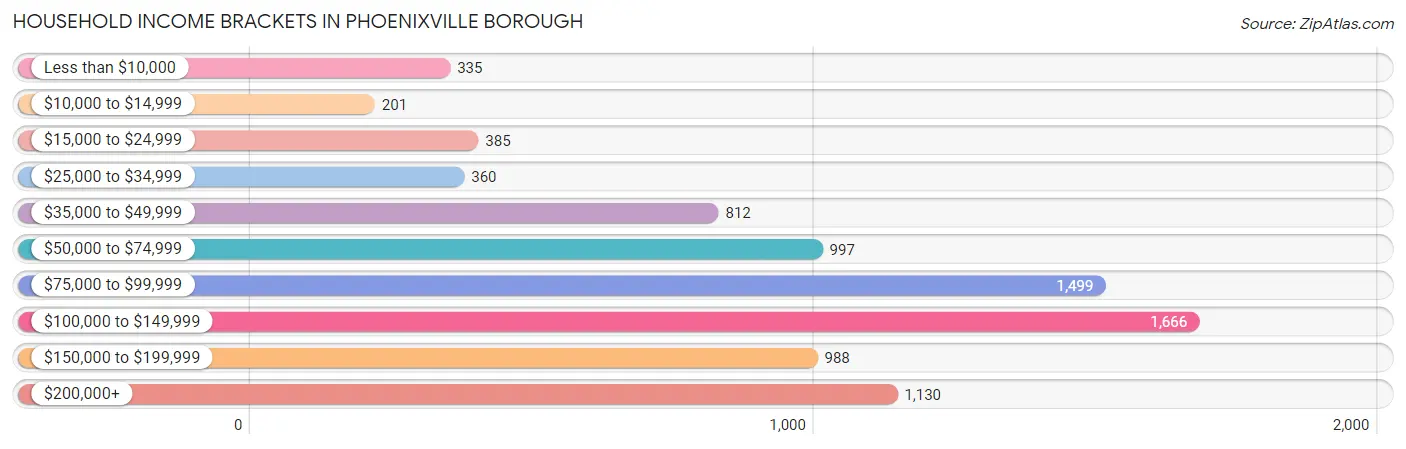
| Income Bracket | # Households | % Households |
| Less than $10,000 | 335 | 4.0% |
| $10,000 to $14,999 | 201 | 2.4% |
| $15,000 to $24,999 | 385 | 4.6% |
| $25,000 to $34,999 | 360 | 4.3% |
| $35,000 to $49,999 | 812 | 9.7% |
| $50,000 to $74,999 | 997 | 11.9% |
| $75,000 to $99,999 | 1,499 | 17.9% |
| $100,000 to $149,999 | 1,666 | 19.9% |
| $150,000 to $199,999 | 988 | 11.8% |
| $200,000+ | 1,130 | 13.5% |
Household Income by Householder Age in Phoenixville borough
The median household income in Phoenixville borough is $91,593, with the highest median household income of $105,653 found in the 25 to 44 years age bracket for the primary householder. A total of 3,879 households (46.3%) fall into this category. Meanwhile, the 65+ years age bracket for the primary householder has the lowest median household income of $49,125, with 1,663 households (19.9%) in this group.
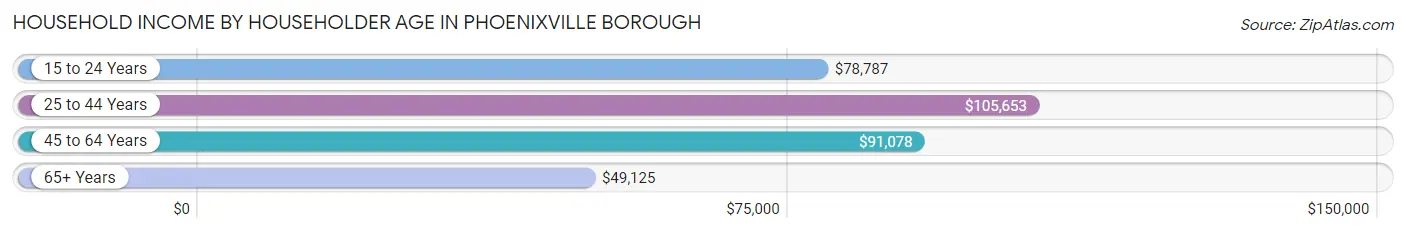
| Income Bracket | # Households | Median Income |
| 15 to 24 Years | 421 (5.0%) | $78,787 |
| 25 to 44 Years | 3,879 (46.3%) | $105,653 |
| 45 to 64 Years | 2,411 (28.8%) | $91,078 |
| 65+ Years | 1,663 (19.9%) | $49,125 |
| Total | 8,374 (100.0%) | $91,593 |
Poverty in Phoenixville borough
Income Below Poverty by Sex and Age in Phoenixville borough
With 9.8% poverty level for males and 10.5% for females among the residents of Phoenixville borough, 12 to 14 year old males and 5 year old females are the most vulnerable to poverty, with 106 males (49.1%) and 39 females (68.4%) in their respective age groups living below the poverty level.
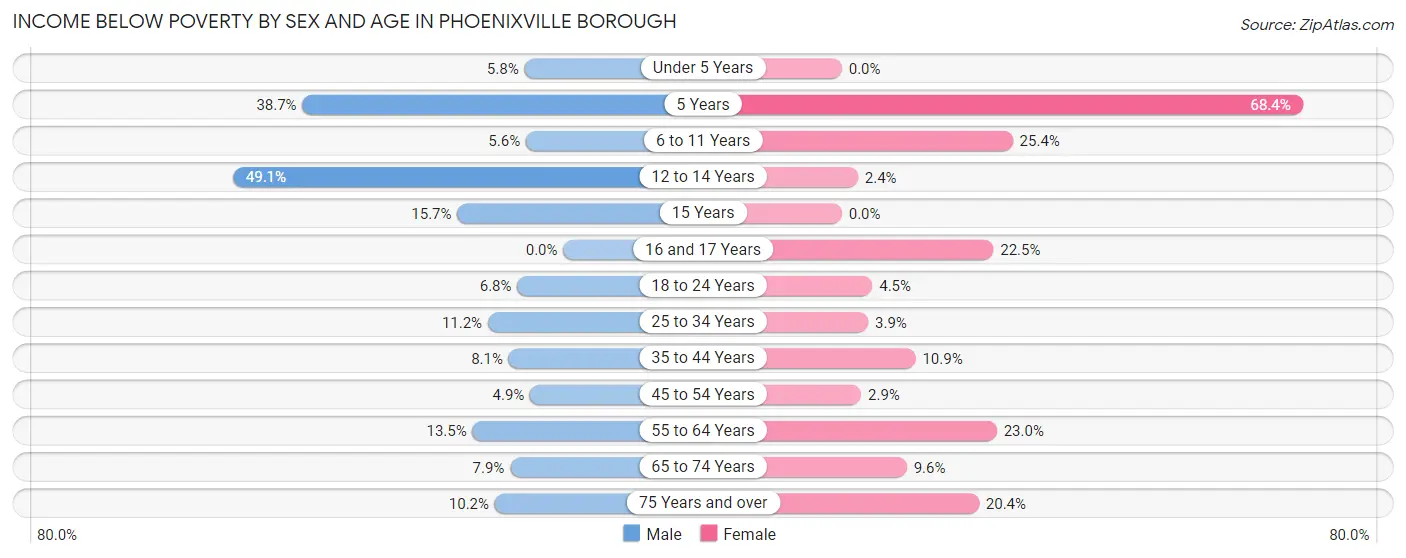
| Age Bracket | Male | Female |
| Under 5 Years | 40 (5.8%) | 0 (0.0%) |
| 5 Years | 43 (38.7%) | 39 (68.4%) |
| 6 to 11 Years | 38 (5.6%) | 138 (25.4%) |
| 12 to 14 Years | 106 (49.1%) | 6 (2.4%) |
| 15 Years | 17 (15.7%) | 0 (0.0%) |
| 16 and 17 Years | 0 (0.0%) | 27 (22.5%) |
| 18 to 24 Years | 55 (6.8%) | 29 (4.5%) |
| 25 to 34 Years | 286 (11.2%) | 82 (3.9%) |
| 35 to 44 Years | 124 (8.1%) | 146 (10.9%) |
| 45 to 54 Years | 67 (4.9%) | 23 (2.9%) |
| 55 to 64 Years | 115 (13.5%) | 249 (23.0%) |
| 65 to 74 Years | 45 (7.9%) | 70 (9.6%) |
| 75 Years and over | 49 (10.2%) | 94 (20.3%) |
| Total | 985 (9.8%) | 903 (10.5%) |
Income Above Poverty by Sex and Age in Phoenixville borough
According to the poverty statistics in Phoenixville borough, males aged 16 and 17 years and females aged under 5 years are the age groups that are most secure financially, with 100.0% of males and 100.0% of females in these age groups living above the poverty line.
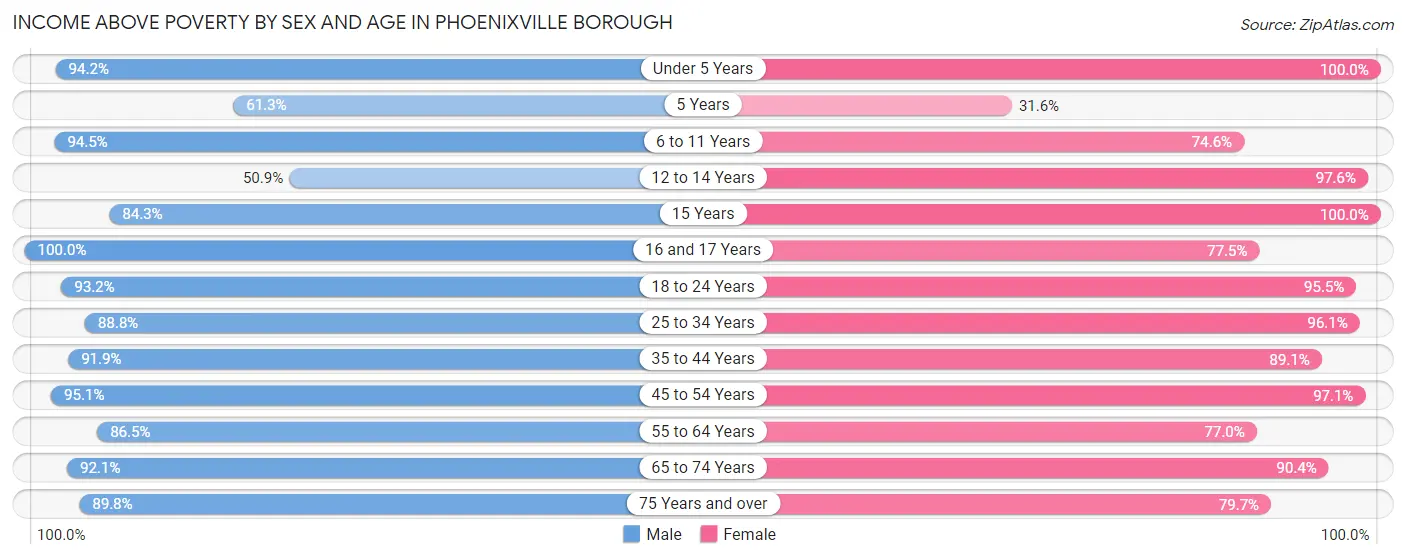
| Age Bracket | Male | Female |
| Under 5 Years | 653 (94.2%) | 409 (100.0%) |
| 5 Years | 68 (61.3%) | 18 (31.6%) |
| 6 to 11 Years | 647 (94.5%) | 406 (74.6%) |
| 12 to 14 Years | 110 (50.9%) | 246 (97.6%) |
| 15 Years | 91 (84.3%) | 40 (100.0%) |
| 16 and 17 Years | 130 (100.0%) | 93 (77.5%) |
| 18 to 24 Years | 750 (93.2%) | 611 (95.5%) |
| 25 to 34 Years | 2,267 (88.8%) | 2,016 (96.1%) |
| 35 to 44 Years | 1,407 (91.9%) | 1,188 (89.1%) |
| 45 to 54 Years | 1,293 (95.1%) | 781 (97.1%) |
| 55 to 64 Years | 738 (86.5%) | 833 (77.0%) |
| 65 to 74 Years | 525 (92.1%) | 656 (90.4%) |
| 75 Years and over | 433 (89.8%) | 368 (79.6%) |
| Total | 9,112 (90.2%) | 7,665 (89.5%) |
Income Below Poverty Among Married-Couple Families in Phoenixville borough
The poverty statistics for married-couple families in Phoenixville borough show that 3.5% or 103 of the total 2,969 families live below the poverty line. Families with no children have the highest poverty rate of 4.0%, comprising of 67 families. On the other hand, families with 3 or 4 children have the lowest poverty rate of 0.0%, which includes 0 families.

| Children | Above Poverty | Below Poverty |
| No Children | 1,626 (96.0%) | 67 (4.0%) |
| 1 or 2 Children | 1,056 (96.7%) | 36 (3.3%) |
| 3 or 4 Children | 184 (100.0%) | 0 (0.0%) |
| 5 or more Children | 0 (0.0%) | 0 (0.0%) |
| Total | 2,866 (96.5%) | 103 (3.5%) |
Income Below Poverty Among Single-Parent Households in Phoenixville borough
According to the poverty data in Phoenixville borough, 6.9% or 32 single-father households and 23.4% or 189 single-mother households are living below the poverty line. Among single-father households, those with 3 or 4 children have the highest poverty rate, with 32 households (78.0%) experiencing poverty. Likewise, among single-mother households, those with 5 or more children have the highest poverty rate, with 13 households (100.0%) falling below the poverty line.
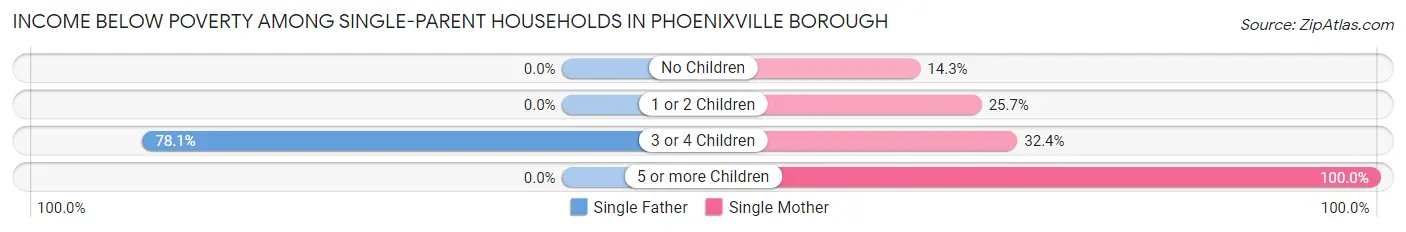
| Children | Single Father | Single Mother |
| No Children | 0 (0.0%) | 44 (14.3%) |
| 1 or 2 Children | 0 (0.0%) | 99 (25.7%) |
| 3 or 4 Children | 32 (78.0%) | 33 (32.4%) |
| 5 or more Children | 0 (0.0%) | 13 (100.0%) |
| Total | 32 (6.9%) | 189 (23.4%) |
Income Below Poverty Among Married-Couple vs Single-Parent Households in Phoenixville borough
The poverty data for Phoenixville borough shows that 103 of the married-couple family households (3.5%) and 221 of the single-parent households (17.3%) are living below the poverty level. Within the married-couple family households, those with no children have the highest poverty rate, with 67 households (4.0%) falling below the poverty line. Among the single-parent households, those with 5 or more children have the highest poverty rate, with 13 household (100.0%) living below poverty.
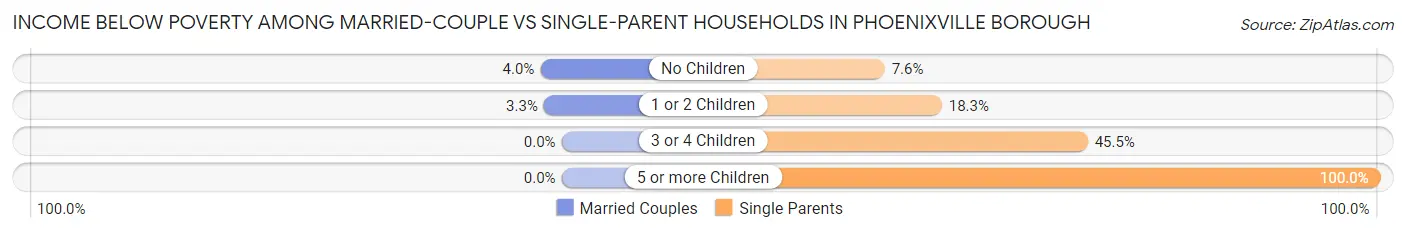
| Children | Married-Couple Families | Single-Parent Households |
| No Children | 67 (4.0%) | 44 (7.6%) |
| 1 or 2 Children | 36 (3.3%) | 99 (18.3%) |
| 3 or 4 Children | 0 (0.0%) | 65 (45.5%) |
| 5 or more Children | 0 (0.0%) | 13 (100.0%) |
| Total | 103 (3.5%) | 221 (17.3%) |
Race in Phoenixville borough
The most populous races in Phoenixville borough are White / Caucasian (15,513 | 82.9%), Two or more Races (1,237 | 6.6%), and Black / African American (968 | 5.2%).
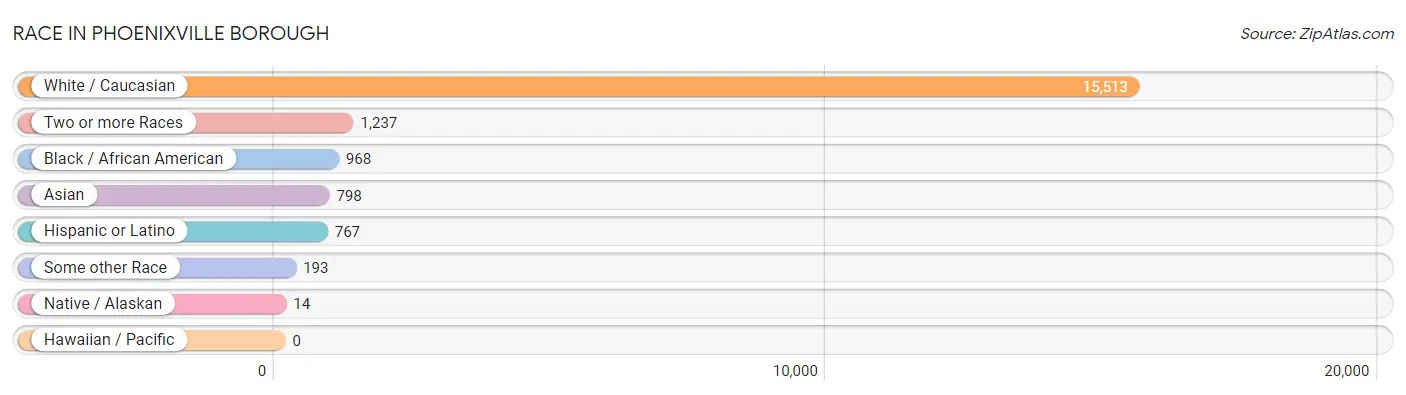
| Race | # Population | % Population |
| Asian | 798 | 4.3% |
| Black / African American | 968 | 5.2% |
| Hawaiian / Pacific | 0 | 0.0% |
| Hispanic or Latino | 767 | 4.1% |
| Native / Alaskan | 14 | 0.1% |
| White / Caucasian | 15,513 | 82.9% |
| Two or more Races | 1,237 | 6.6% |
| Some other Race | 193 | 1.0% |
| Total | 18,723 | 100.0% |
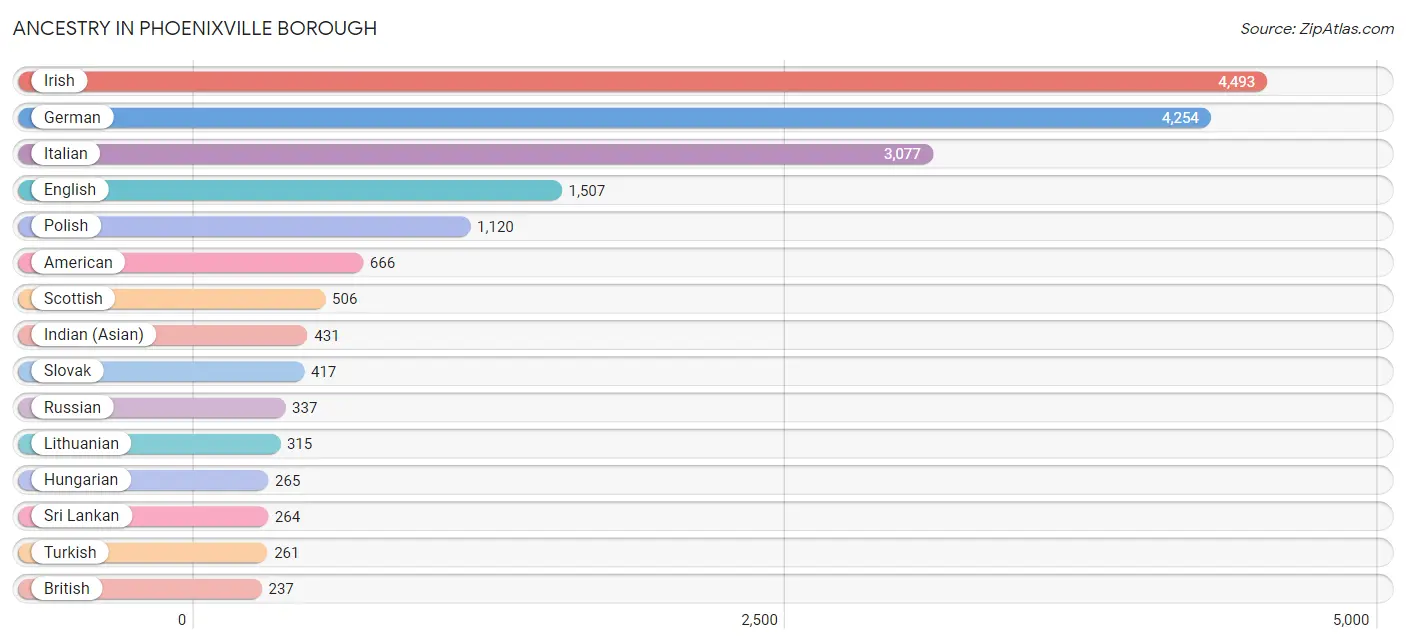
Ancestry in Phoenixville borough
The most populous ancestries reported in Phoenixville borough are Irish (4,493 | 24.0%), German (4,254 | 22.7%), Italian (3,077 | 16.4%), English (1,507 | 8.1%), and Polish (1,120 | 6.0%), together accounting for 77.2% of all Phoenixville borough residents.
| Ancestry | # Population | % Population |
| African | 69 | 0.4% |
| Alsatian | 26 | 0.1% |
| American | 666 | 3.6% |
| Arab | 43 | 0.2% |
| Armenian | 77 | 0.4% |
| Australian | 139 | 0.7% |
| Austrian | 73 | 0.4% |
| Bhutanese | 48 | 0.3% |
| Brazilian | 219 | 1.2% |
| British | 237 | 1.3% |
| Bulgarian | 13 | 0.1% |
| Burmese | 166 | 0.9% |
| Cape Verdean | 41 | 0.2% |
| Central American | 144 | 0.8% |
| Croatian | 27 | 0.1% |
| Cuban | 15 | 0.1% |
| Czech | 43 | 0.2% |
| Czechoslovakian | 7 | 0.0% |
| Danish | 26 | 0.1% |
| Dutch | 47 | 0.3% |
| Eastern European | 28 | 0.2% |
| Ecuadorian | 52 | 0.3% |
| English | 1,507 | 8.1% |
| European | 186 | 1.0% |
| French | 231 | 1.2% |
| French Canadian | 28 | 0.2% |
| German | 4,254 | 22.7% |
| Greek | 43 | 0.2% |
| Guatemalan | 81 | 0.4% |
| Hungarian | 265 | 1.4% |
| Indian (Asian) | 431 | 2.3% |
| Iranian | 20 | 0.1% |
| Irish | 4,493 | 24.0% |
| Israeli | 16 | 0.1% |
| Italian | 3,077 | 16.4% |
| Jamaican | 16 | 0.1% |
| Korean | 21 | 0.1% |
| Lebanese | 28 | 0.2% |
| Lithuanian | 315 | 1.7% |
| Malaysian | 28 | 0.2% |
| Maltese | 120 | 0.6% |
| Mexican | 216 | 1.1% |
| Mexican American Indian | 48 | 0.3% |
| Moroccan | 15 | 0.1% |
| Native Hawaiian | 19 | 0.1% |
| Navajo | 4 | 0.0% |
| Nigerian | 11 | 0.1% |
| Norwegian | 97 | 0.5% |
| Pennsylvania German | 133 | 0.7% |
| Peruvian | 87 | 0.5% |
| Polish | 1,120 | 6.0% |
| Puerto Rican | 137 | 0.7% |
| Russian | 337 | 1.8% |
| Salvadoran | 63 | 0.3% |
| Scandinavian | 9 | 0.1% |
| Scotch-Irish | 223 | 1.2% |
| Scottish | 506 | 2.7% |
| Serbian | 25 | 0.1% |
| Sioux | 19 | 0.1% |
| Slovak | 417 | 2.2% |
| Slovene | 20 | 0.1% |
| South American | 139 | 0.7% |
| Spaniard | 106 | 0.6% |
| Sri Lankan | 264 | 1.4% |
| Subsaharan African | 121 | 0.6% |
| Swedish | 99 | 0.5% |
| Thai | 109 | 0.6% |
| Turkish | 261 | 1.4% |
| Ukrainian | 101 | 0.5% |
| Welsh | 155 | 0.8% |
| West Indian | 16 | 0.1% |
| Yugoslavian | 21 | 0.1% | View All 72 Rows |
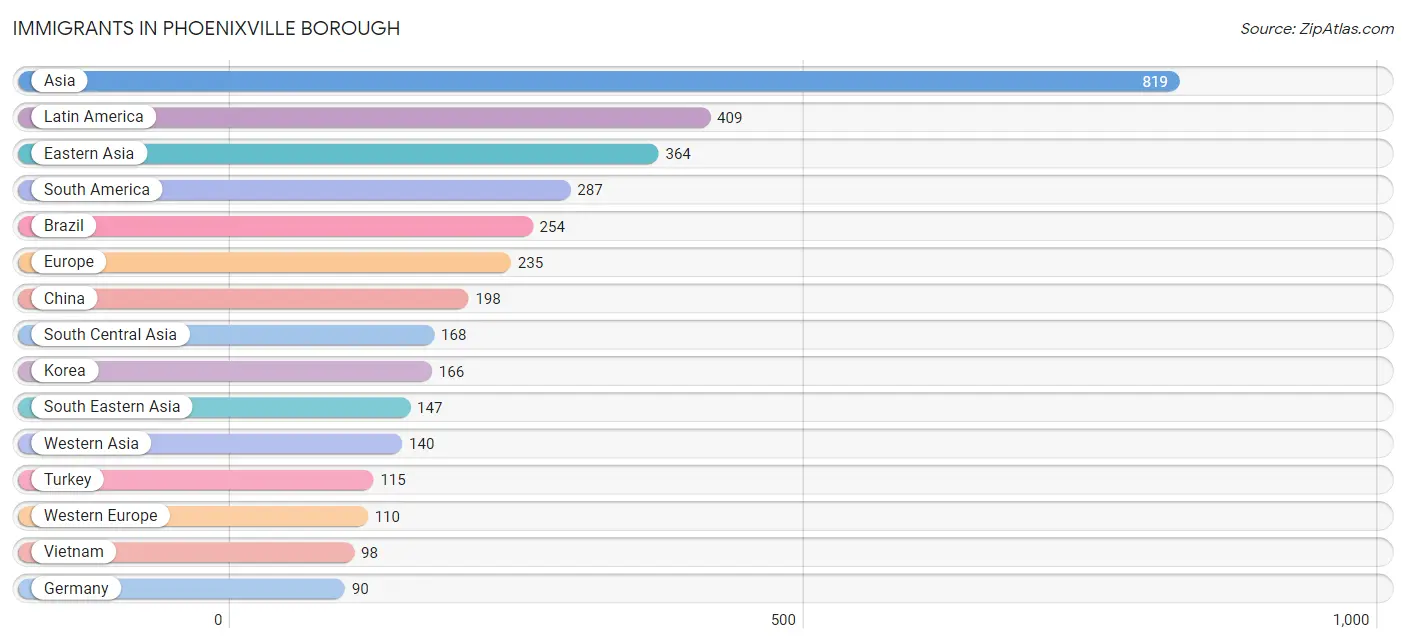
Immigrants in Phoenixville borough
The most numerous immigrant groups reported in Phoenixville borough came from Asia (819 | 4.4%), Latin America (409 | 2.2%), Eastern Asia (364 | 1.9%), South America (287 | 1.5%), and Brazil (254 | 1.4%), together accounting for 11.4% of all Phoenixville borough residents.
| Immigration Origin | # Population | % Population |
| Africa | 72 | 0.4% |
| Asia | 819 | 4.4% |
| Australia | 49 | 0.3% |
| Brazil | 254 | 1.4% |
| Bulgaria | 13 | 0.1% |
| Cabo Verde | 21 | 0.1% |
| Caribbean | 51 | 0.3% |
| Central America | 71 | 0.4% |
| China | 198 | 1.1% |
| Colombia | 21 | 0.1% |
| Cuba | 24 | 0.1% |
| Dominican Republic | 6 | 0.0% |
| Eastern Africa | 28 | 0.2% |
| Eastern Asia | 364 | 1.9% |
| Eastern Europe | 85 | 0.4% |
| Ecuador | 12 | 0.1% |
| England | 14 | 0.1% |
| Europe | 235 | 1.3% |
| France | 20 | 0.1% |
| Germany | 90 | 0.5% |
| Guatemala | 29 | 0.2% |
| Hungary | 4 | 0.0% |
| India | 82 | 0.4% |
| Indonesia | 49 | 0.3% |
| Iran | 20 | 0.1% |
| Ireland | 14 | 0.1% |
| Italy | 12 | 0.1% |
| Jamaica | 16 | 0.1% |
| Korea | 166 | 0.9% |
| Latin America | 409 | 2.2% |
| Lebanon | 25 | 0.1% |
| Mexico | 42 | 0.2% |
| Morocco | 23 | 0.1% |
| Nepal | 66 | 0.4% |
| Northern Africa | 23 | 0.1% |
| Northern Europe | 28 | 0.2% |
| Oceania | 58 | 0.3% |
| Russia | 56 | 0.3% |
| South America | 287 | 1.5% |
| South Central Asia | 168 | 0.9% |
| South Eastern Asia | 147 | 0.8% |
| Southern Europe | 12 | 0.1% |
| Taiwan | 7 | 0.0% |
| Turkey | 115 | 0.6% |
| Vietnam | 98 | 0.5% |
| West Indies | 5 | 0.0% |
| Western Africa | 21 | 0.1% |
| Western Asia | 140 | 0.7% |
| Western Europe | 110 | 0.6% |
| Zimbabwe | 28 | 0.2% | View All 50 Rows |
Sex and Age in Phoenixville borough
Sex and Age in Phoenixville borough
The most populous age groups in Phoenixville borough are 25 to 29 Years (1,450 | 14.3%) for men and 30 to 34 Years (1,291 | 15.0%) for women.
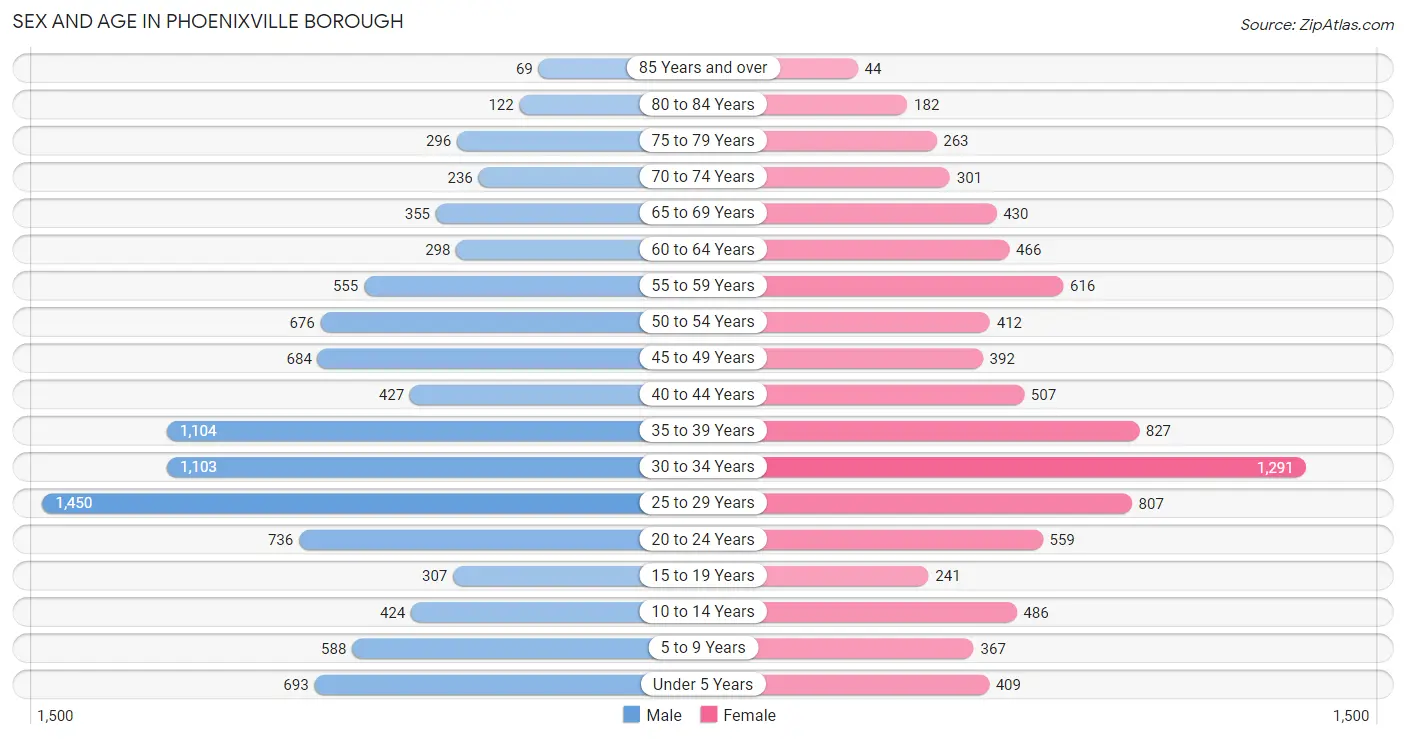
| Age Bracket | Male | Female |
| Under 5 Years | 693 (6.9%) | 409 (4.8%) |
| 5 to 9 Years | 588 (5.8%) | 367 (4.3%) |
| 10 to 14 Years | 424 (4.2%) | 486 (5.7%) |
| 15 to 19 Years | 307 (3.0%) | 241 (2.8%) |
| 20 to 24 Years | 736 (7.3%) | 559 (6.5%) |
| 25 to 29 Years | 1,450 (14.3%) | 807 (9.4%) |
| 30 to 34 Years | 1,103 (10.9%) | 1,291 (15.0%) |
| 35 to 39 Years | 1,104 (10.9%) | 827 (9.6%) |
| 40 to 44 Years | 427 (4.2%) | 507 (5.9%) |
| 45 to 49 Years | 684 (6.8%) | 392 (4.6%) |
| 50 to 54 Years | 676 (6.7%) | 412 (4.8%) |
| 55 to 59 Years | 555 (5.5%) | 616 (7.2%) |
| 60 to 64 Years | 298 (2.9%) | 466 (5.4%) |
| 65 to 69 Years | 355 (3.5%) | 430 (5.0%) |
| 70 to 74 Years | 236 (2.3%) | 301 (3.5%) |
| 75 to 79 Years | 296 (2.9%) | 263 (3.1%) |
| 80 to 84 Years | 122 (1.2%) | 182 (2.1%) |
| 85 Years and over | 69 (0.7%) | 44 (0.5%) |
| Total | 10,123 (100.0%) | 8,600 (100.0%) |
Families and Households in Phoenixville borough
Median Family Size in Phoenixville borough
The median family size in Phoenixville borough is 2.90 persons per family, with married-couple families (2,969 | 70.0%) accounting for the largest median family size of 3 persons per family. On the other hand, single male/father families (466 | 11.0%) represent the smallest median family size with 2.41 persons per family.
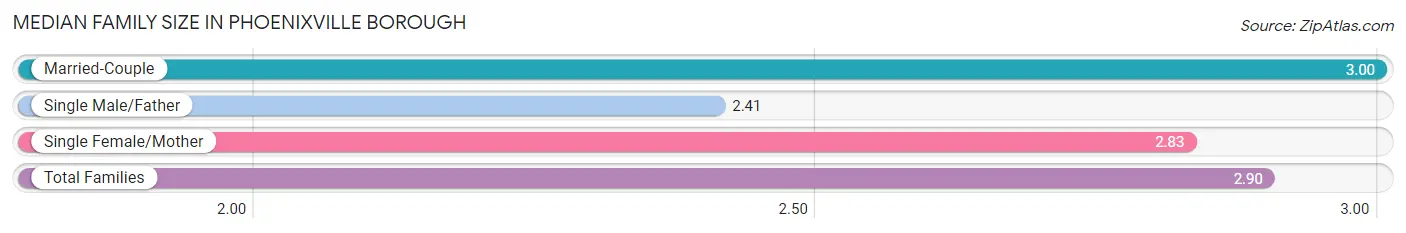
| Family Type | # Families | Family Size |
| Married-Couple | 2,969 (70.0%) | 3.00 |
| Single Male/Father | 466 (11.0%) | 2.41 |
| Single Female/Mother | 808 (19.0%) | 2.83 |
| Total Families | 4,243 (100.0%) | 2.90 |
Median Household Size in Phoenixville borough
The median household size in Phoenixville borough is 2.22 persons per household, with single female/mother households (808 | 9.7%) accounting for the largest median household size of 3.09 persons per household. non-family households (4,131 | 49.3%) represent the smallest median household size with 1.42 persons per household.
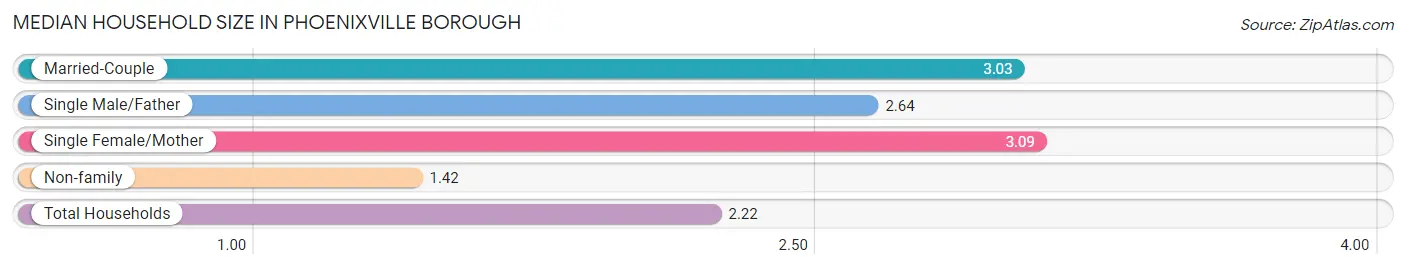
| Household Type | # Households | Household Size |
| Married-Couple | 2,969 (35.4%) | 3.03 |
| Single Male/Father | 466 (5.6%) | 2.64 |
| Single Female/Mother | 808 (9.7%) | 3.09 |
| Non-family | 4,131 (49.3%) | 1.42 |
| Total Households | 8,374 (100.0%) | 2.22 |
Household Size by Marriage Status in Phoenixville borough
Out of a total of 8,374 households in Phoenixville borough, 4,243 (50.7%) are family households, while 4,131 (49.3%) are nonfamily households. The most numerous type of family households are 2-person households, comprising 2,058, and the most common type of nonfamily households are 1-person households, comprising 2,824.
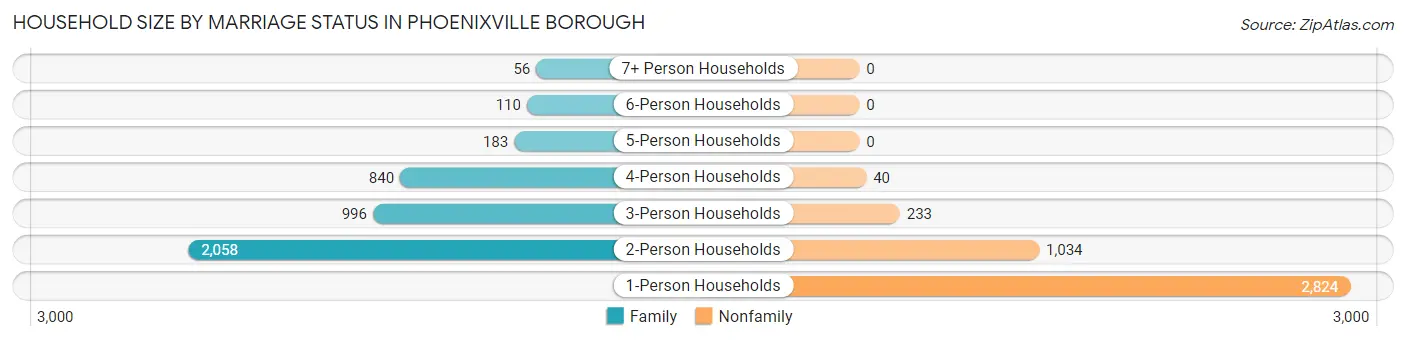
| Household Size | Family Households | Nonfamily Households |
| 1-Person Households | - | 2,824 (33.7%) |
| 2-Person Households | 2,058 (24.6%) | 1,034 (12.3%) |
| 3-Person Households | 996 (11.9%) | 233 (2.8%) |
| 4-Person Households | 840 (10.0%) | 40 (0.5%) |
| 5-Person Households | 183 (2.2%) | 0 (0.0%) |
| 6-Person Households | 110 (1.3%) | 0 (0.0%) |
| 7+ Person Households | 56 (0.7%) | 0 (0.0%) |
| Total | 4,243 (50.7%) | 4,131 (49.3%) |
Female Fertility in Phoenixville borough
Fertility by Age in Phoenixville borough
Average fertility rate in Phoenixville borough is 82.0 births per 1,000 women. Women in the age bracket of 35 to 50 years have the highest fertility rate with 92.0 births per 1,000 women. Women in the age bracket of 20 to 34 years acount for 57.2% of all women with births.
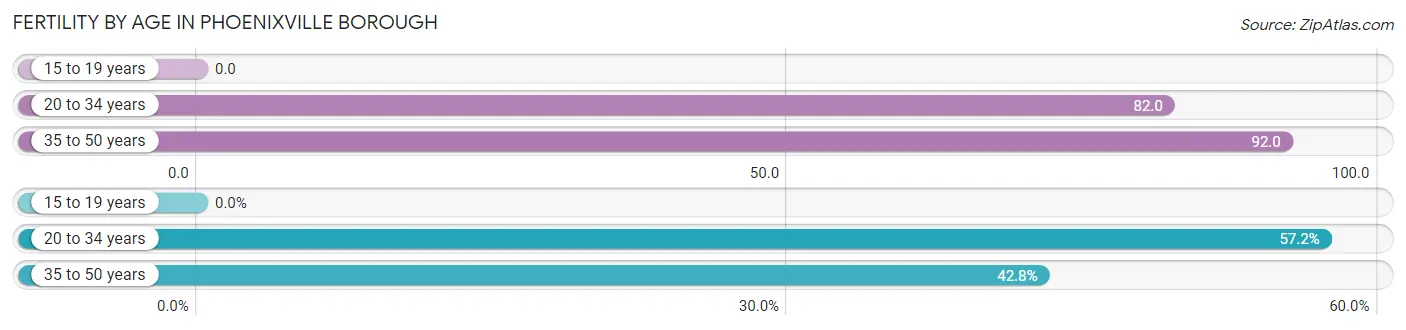
| Age Bracket | Women with Births | Births / 1,000 Women |
| 15 to 19 years | 0 (0.0%) | 0.0 |
| 20 to 34 years | 219 (57.2%) | 82.0 |
| 35 to 50 years | 164 (42.8%) | 92.0 |
| Total | 383 (100.0%) | 82.0 |
Fertility by Age by Marriage Status in Phoenixville borough
83.3% of women with births (383) in Phoenixville borough are married. The highest percentage of unmarried women with births falls into 35 to 50 years age bracket with 39.0% of them unmarried at the time of birth, while the lowest percentage of unmarried women with births belong to 20 to 34 years age bracket with 0.0% of them unmarried.
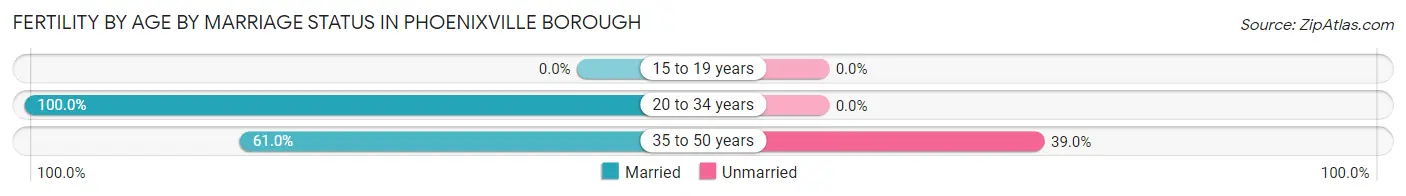
| Age Bracket | Married | Unmarried |
| 15 to 19 years | 0 (0.0%) | 0 (0.0%) |
| 20 to 34 years | 219 (100.0%) | 0 (0.0%) |
| 35 to 50 years | 100 (61.0%) | 64 (39.0%) |
| Total | 319 (83.3%) | 64 (16.7%) |
Fertility by Education in Phoenixville borough
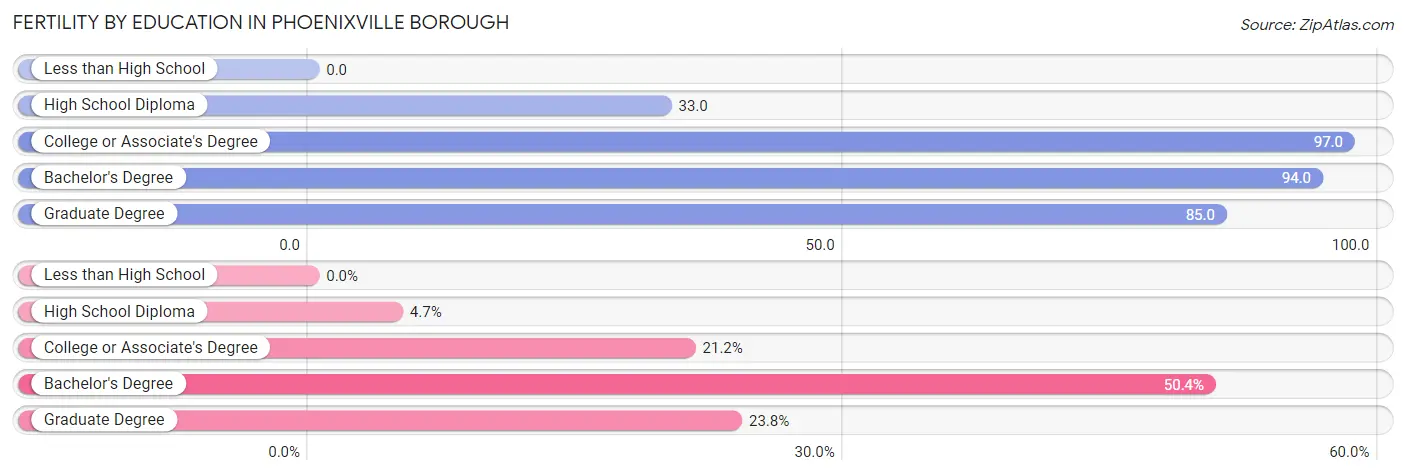
| Educational Attainment | Women with Births | Births / 1,000 Women |
| Less than High School | 0 (0.0%) | 0.0 |
| High School Diploma | 18 (4.7%) | 33.0 |
| College or Associate's Degree | 81 (21.1%) | 97.0 |
| Bachelor's Degree | 193 (50.4%) | 94.0 |
| Graduate Degree | 91 (23.8%) | 85.0 |
| Total | 383 (100.0%) | 82.0 |
Fertility by Education by Marriage Status in Phoenixville borough
16.7% of women with births in Phoenixville borough are unmarried. Women with the educational attainment of high school diploma are most likely to be married with 100.0% of them married at childbirth, while women with the educational attainment of college or associate's degree are least likely to be married with 79.0% of them unmarried at childbirth.
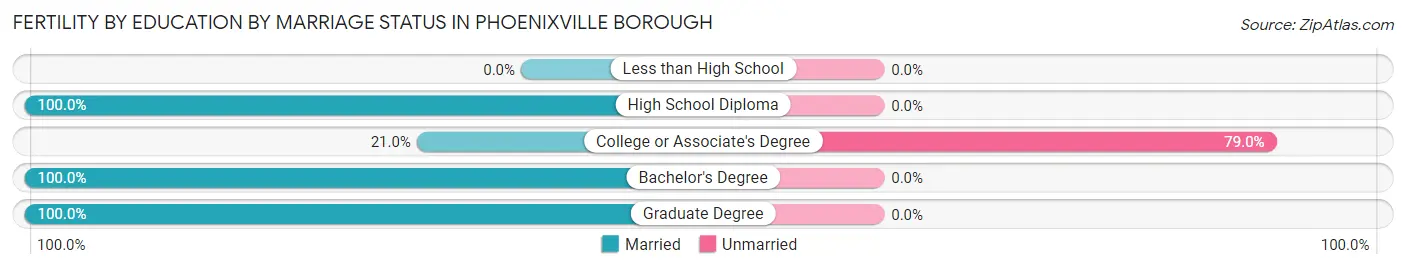
| Educational Attainment | Married | Unmarried |
| Less than High School | 0 (0.0%) | 0 (0.0%) |
| High School Diploma | 18 (100.0%) | 0 (0.0%) |
| College or Associate's Degree | 17 (21.0%) | 64 (79.0%) |
| Bachelor's Degree | 193 (100.0%) | 0 (0.0%) |
| Graduate Degree | 91 (100.0%) | 0 (0.0%) |
| Total | 319 (83.3%) | 64 (16.7%) |
Employment Characteristics in Phoenixville borough
Employment by Class of Employer in Phoenixville borough
Among the 11,414 employed individuals in Phoenixville borough, private company employees (8,625 | 75.6%), not-for-profit organizations (860 | 7.5%), and self-employed (not incorporated) (577 | 5.1%) make up the most common classes of employment.
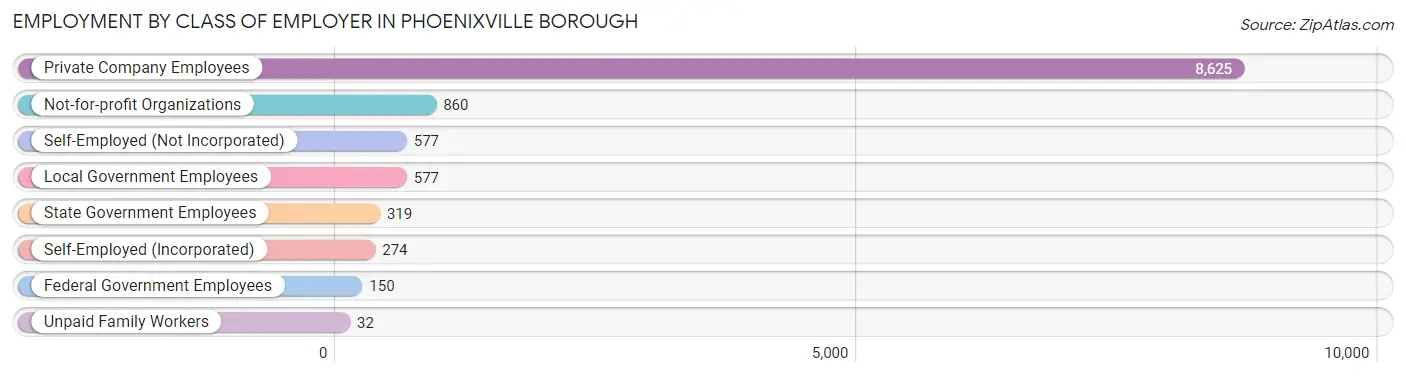
| Employer Class | # Employees | % Employees |
| Private Company Employees | 8,625 | 75.6% |
| Self-Employed (Incorporated) | 274 | 2.4% |
| Self-Employed (Not Incorporated) | 577 | 5.1% |
| Not-for-profit Organizations | 860 | 7.5% |
| Local Government Employees | 577 | 5.1% |
| State Government Employees | 319 | 2.8% |
| Federal Government Employees | 150 | 1.3% |
| Unpaid Family Workers | 32 | 0.3% |
| Total | 11,414 | 100.0% |
Employment Status by Age in Phoenixville borough
According to the labor force statistics for Phoenixville borough, out of the total population over 16 years of age (15,608), 77.9% or 12,159 individuals are in the labor force, with 3.5% or 426 of them unemployed. The age group with the highest labor force participation rate is 25 to 29 years, with 98.3% or 2,219 individuals in the labor force. Within the labor force, the 75 years and over age range has the highest percentage of unemployed individuals, with 15.4% or 19 of them being unemployed.
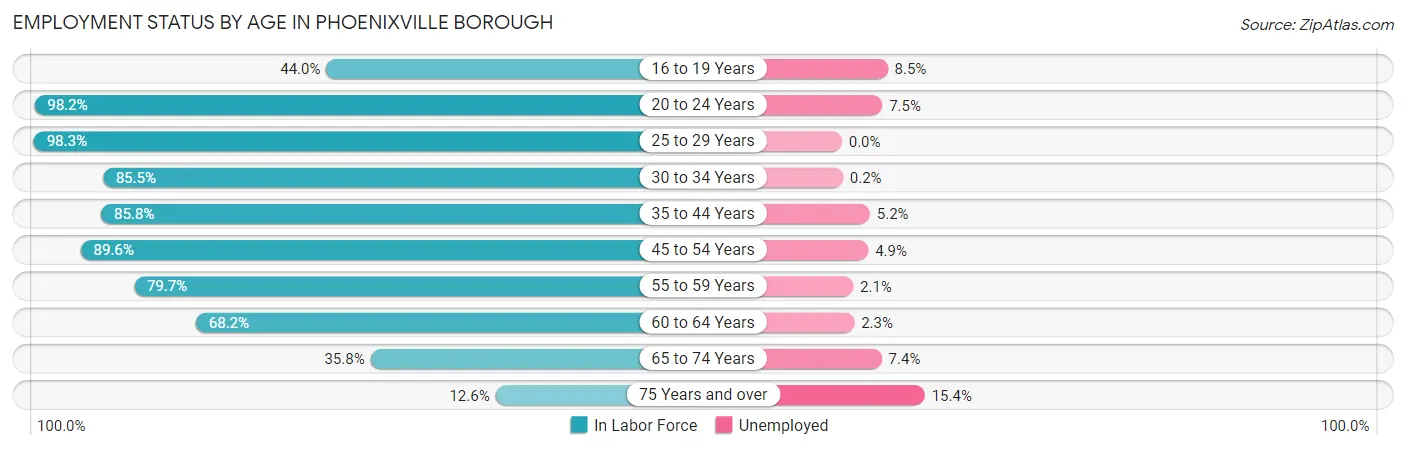
| Age Bracket | In Labor Force | Unemployed |
| 16 to 19 Years | 176 (44.0%) | 15 (8.5%) |
| 20 to 24 Years | 1,272 (98.2%) | 95 (7.5%) |
| 25 to 29 Years | 2,219 (98.3%) | 0 (0.0%) |
| 30 to 34 Years | 2,047 (85.5%) | 4 (0.2%) |
| 35 to 44 Years | 2,458 (85.8%) | 128 (5.2%) |
| 45 to 54 Years | 1,939 (89.6%) | 95 (4.9%) |
| 55 to 59 Years | 933 (79.7%) | 20 (2.1%) |
| 60 to 64 Years | 521 (68.2%) | 12 (2.3%) |
| 65 to 74 Years | 473 (35.8%) | 35 (7.4%) |
| 75 Years and over | 123 (12.6%) | 19 (15.4%) |
| Total | 12,159 (77.9%) | 426 (3.5%) |
Employment Status by Educational Attainment in Phoenixville borough
According to labor force statistics for Phoenixville borough, 87.1% of individuals (10,117) out of the total population between 25 and 64 years of age (11,615) are in the labor force, with 2.5% or 253 of them being unemployed. The group with the highest labor force participation rate are those with the educational attainment of bachelor's degree or higher, with 94.7% or 6,176 individuals in the labor force. Within the labor force, individuals with less than high school education have the highest percentage of unemployment, with 26.0% or 76 of them being unemployed.
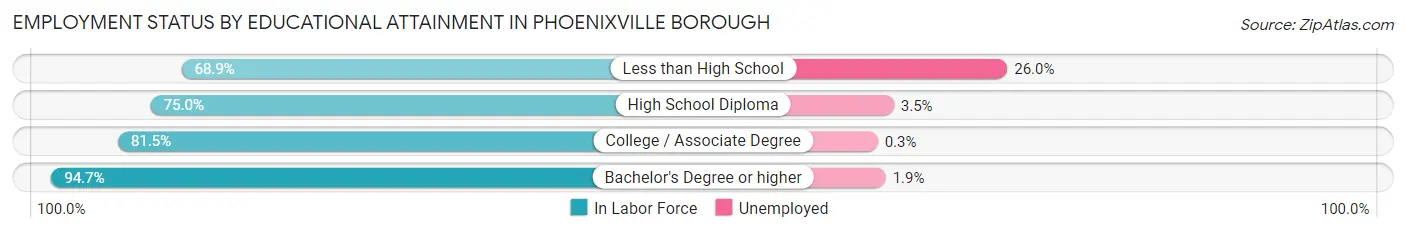
| Educational Attainment | In Labor Force | Unemployed |
| Less than High School | 292 (68.9%) | 110 (26.0%) |
| High School Diploma | 1,759 (75.0%) | 82 (3.5%) |
| College / Associate Degree | 1,894 (81.5%) | 7 (0.3%) |
| Bachelor's Degree or higher | 6,176 (94.7%) | 124 (1.9%) |
| Total | 10,117 (87.1%) | 290 (2.5%) |
Employment Occupations by Sex in Phoenixville borough
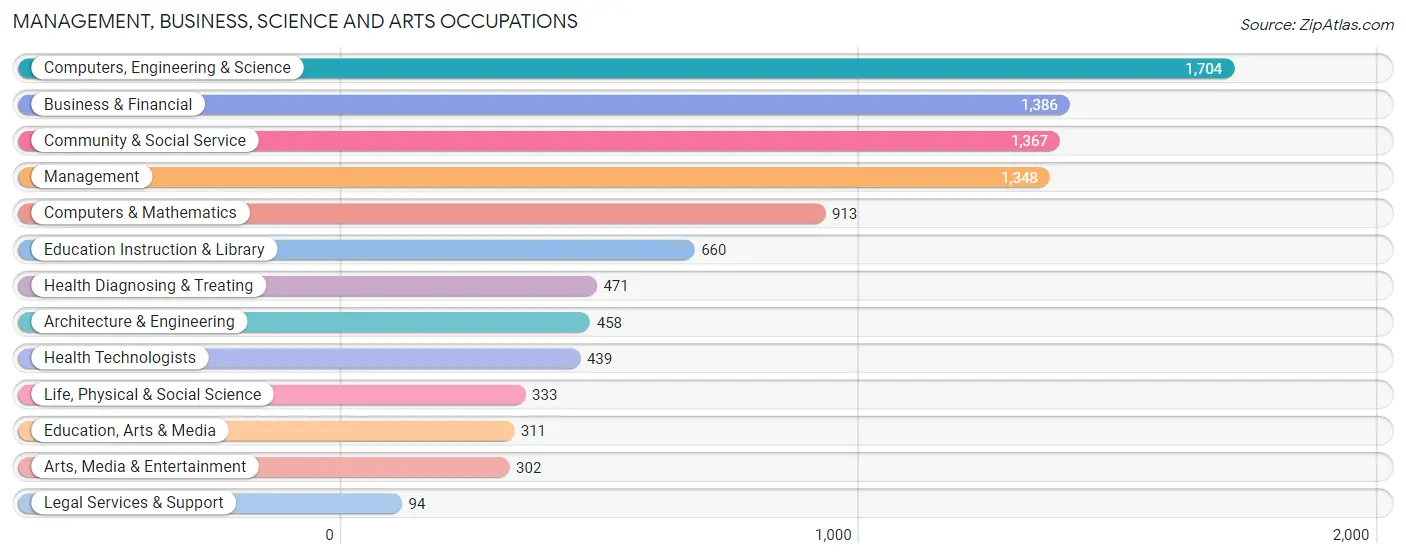
Management, Business, Science and Arts Occupations
The most common Management, Business, Science and Arts occupations in Phoenixville borough are Computers, Engineering & Science (1,704 | 14.5%), Business & Financial (1,386 | 11.8%), Community & Social Service (1,367 | 11.7%), Management (1,348 | 11.5%), and Computers & Mathematics (913 | 7.8%).
Management, Business, Science and Arts Occupations by Sex
Within the Management, Business, Science and Arts occupations in Phoenixville borough, the most male-oriented occupations are Computers & Mathematics (75.0%), Architecture & Engineering (72.1%), and Computers, Engineering & Science (71.1%), while the most female-oriented occupations are Legal Services & Support (100.0%), Health Diagnosing & Treating (95.1%), and Health Technologists (94.8%).
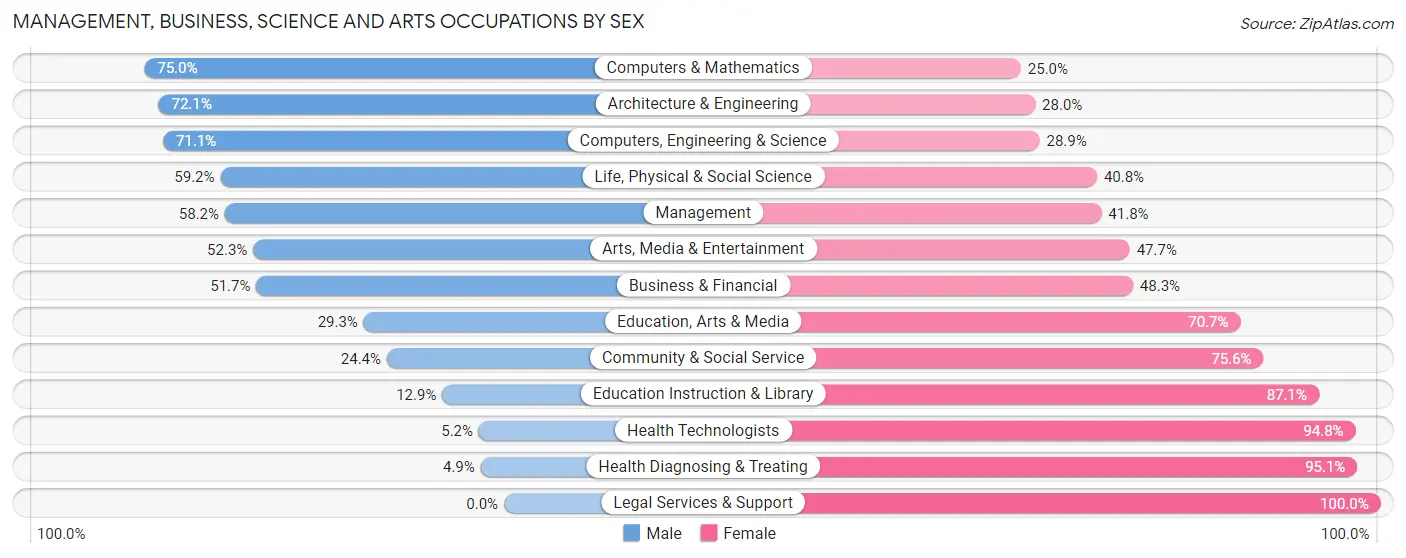
| Occupation | Male | Female |
| Management | 785 (58.2%) | 563 (41.8%) |
| Business & Financial | 716 (51.7%) | 670 (48.3%) |
| Computers, Engineering & Science | 1,212 (71.1%) | 492 (28.9%) |
| Computers & Mathematics | 685 (75.0%) | 228 (25.0%) |
| Architecture & Engineering | 330 (72.1%) | 128 (28.0%) |
| Life, Physical & Social Science | 197 (59.2%) | 136 (40.8%) |
| Community & Social Service | 334 (24.4%) | 1,033 (75.6%) |
| Education, Arts & Media | 91 (29.3%) | 220 (70.7%) |
| Legal Services & Support | 0 (0.0%) | 94 (100.0%) |
| Education Instruction & Library | 85 (12.9%) | 575 (87.1%) |
| Arts, Media & Entertainment | 158 (52.3%) | 144 (47.7%) |
| Health Diagnosing & Treating | 23 (4.9%) | 448 (95.1%) |
| Health Technologists | 23 (5.2%) | 416 (94.8%) |
| Total (Category) | 3,070 (48.9%) | 3,206 (51.1%) |
| Total (Overall) | 6,184 (52.8%) | 5,531 (47.2%) |
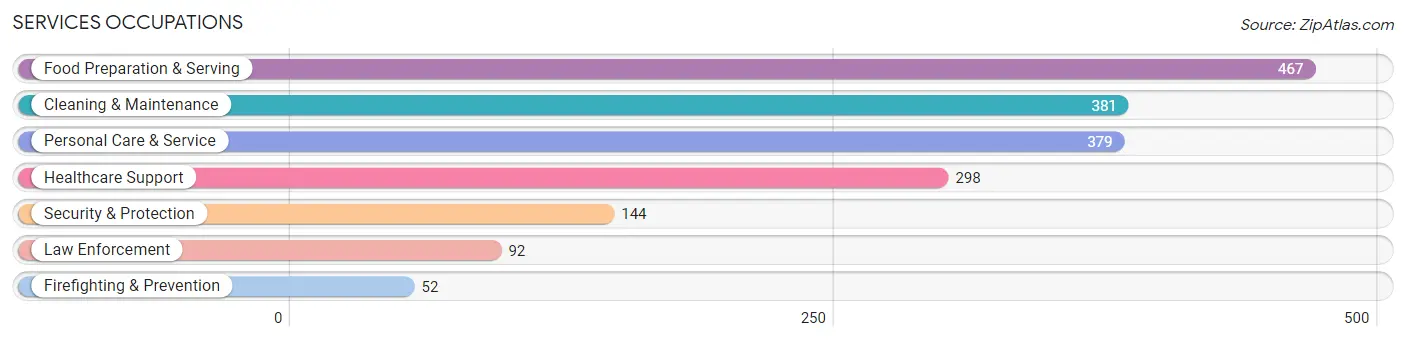
Services Occupations
The most common Services occupations in Phoenixville borough are Food Preparation & Serving (467 | 4.0%), Cleaning & Maintenance (381 | 3.3%), Personal Care & Service (379 | 3.2%), Healthcare Support (298 | 2.5%), and Security & Protection (144 | 1.2%).
Services Occupations by Sex
Within the Services occupations in Phoenixville borough, the most male-oriented occupations are Law Enforcement (88.0%), Security & Protection (65.3%), and Food Preparation & Serving (48.8%), while the most female-oriented occupations are Personal Care & Service (89.2%), Firefighting & Prevention (75.0%), and Healthcare Support (59.4%).
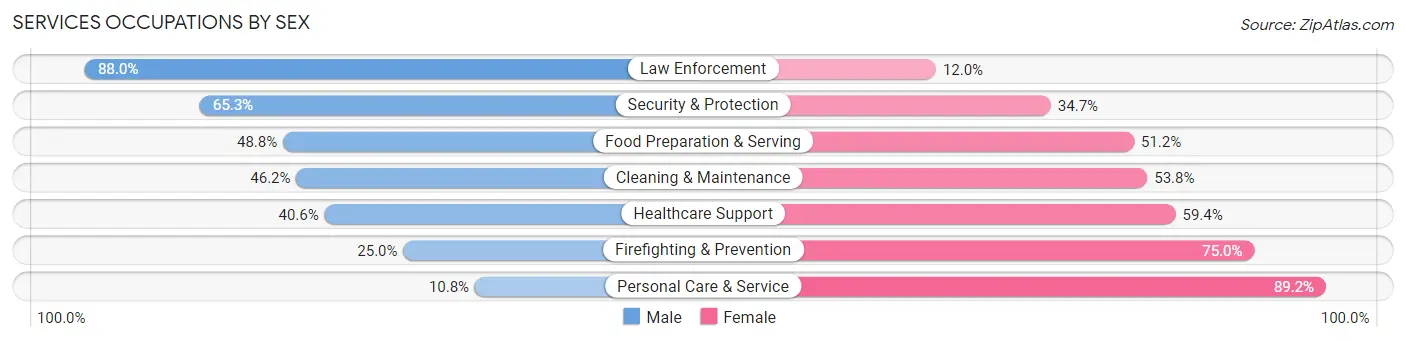
| Occupation | Male | Female |
| Healthcare Support | 121 (40.6%) | 177 (59.4%) |
| Security & Protection | 94 (65.3%) | 50 (34.7%) |
| Firefighting & Prevention | 13 (25.0%) | 39 (75.0%) |
| Law Enforcement | 81 (88.0%) | 11 (12.0%) |
| Food Preparation & Serving | 228 (48.8%) | 239 (51.2%) |
| Cleaning & Maintenance | 176 (46.2%) | 205 (53.8%) |
| Personal Care & Service | 41 (10.8%) | 338 (89.2%) |
| Total (Category) | 660 (39.5%) | 1,009 (60.5%) |
| Total (Overall) | 6,184 (52.8%) | 5,531 (47.2%) |
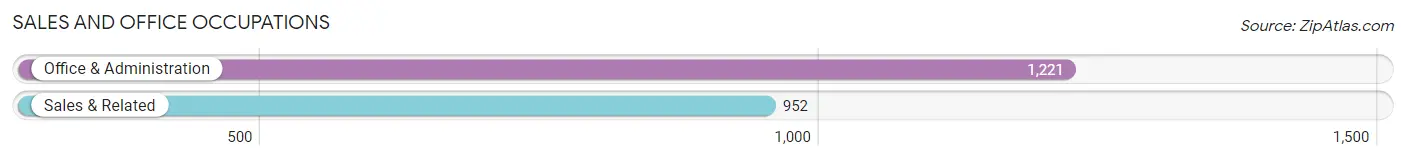
Sales and Office Occupations
The most common Sales and Office occupations in Phoenixville borough are Office & Administration (1,221 | 10.4%), and Sales & Related (952 | 8.1%).
Sales and Office Occupations by Sex
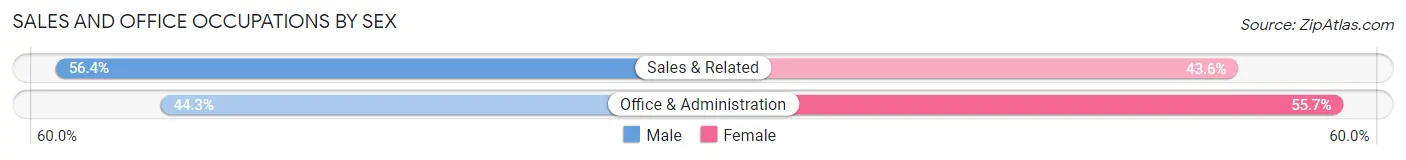
| Occupation | Male | Female |
| Sales & Related | 537 (56.4%) | 415 (43.6%) |
| Office & Administration | 541 (44.3%) | 680 (55.7%) |
| Total (Category) | 1,078 (49.6%) | 1,095 (50.4%) |
| Total (Overall) | 6,184 (52.8%) | 5,531 (47.2%) |
Natural Resources, Construction and Maintenance Occupations
The most common Natural Resources, Construction and Maintenance occupations in Phoenixville borough are Construction & Extraction (424 | 3.6%), Installation, Maintenance & Repair (198 | 1.7%), and Farming, Fishing & Forestry (42 | 0.4%).
Natural Resources, Construction and Maintenance Occupations by Sex
| Occupation | Male | Female |
| Farming, Fishing & Forestry | 42 (100.0%) | 0 (0.0%) |
| Construction & Extraction | 424 (100.0%) | 0 (0.0%) |
| Installation, Maintenance & Repair | 198 (100.0%) | 0 (0.0%) |
| Total (Category) | 664 (100.0%) | 0 (0.0%) |
| Total (Overall) | 6,184 (52.8%) | 5,531 (47.2%) |
Production, Transportation and Moving Occupations
The most common Production, Transportation and Moving occupations in Phoenixville borough are Production (540 | 4.6%), Material Moving (262 | 2.2%), and Transportation (131 | 1.1%).
Production, Transportation and Moving Occupations by Sex
| Occupation | Male | Female |
| Production | 402 (74.4%) | 138 (25.6%) |
| Transportation | 62 (47.3%) | 69 (52.7%) |
| Material Moving | 248 (94.7%) | 14 (5.3%) |
| Total (Category) | 712 (76.3%) | 221 (23.7%) |
| Total (Overall) | 6,184 (52.8%) | 5,531 (47.2%) |
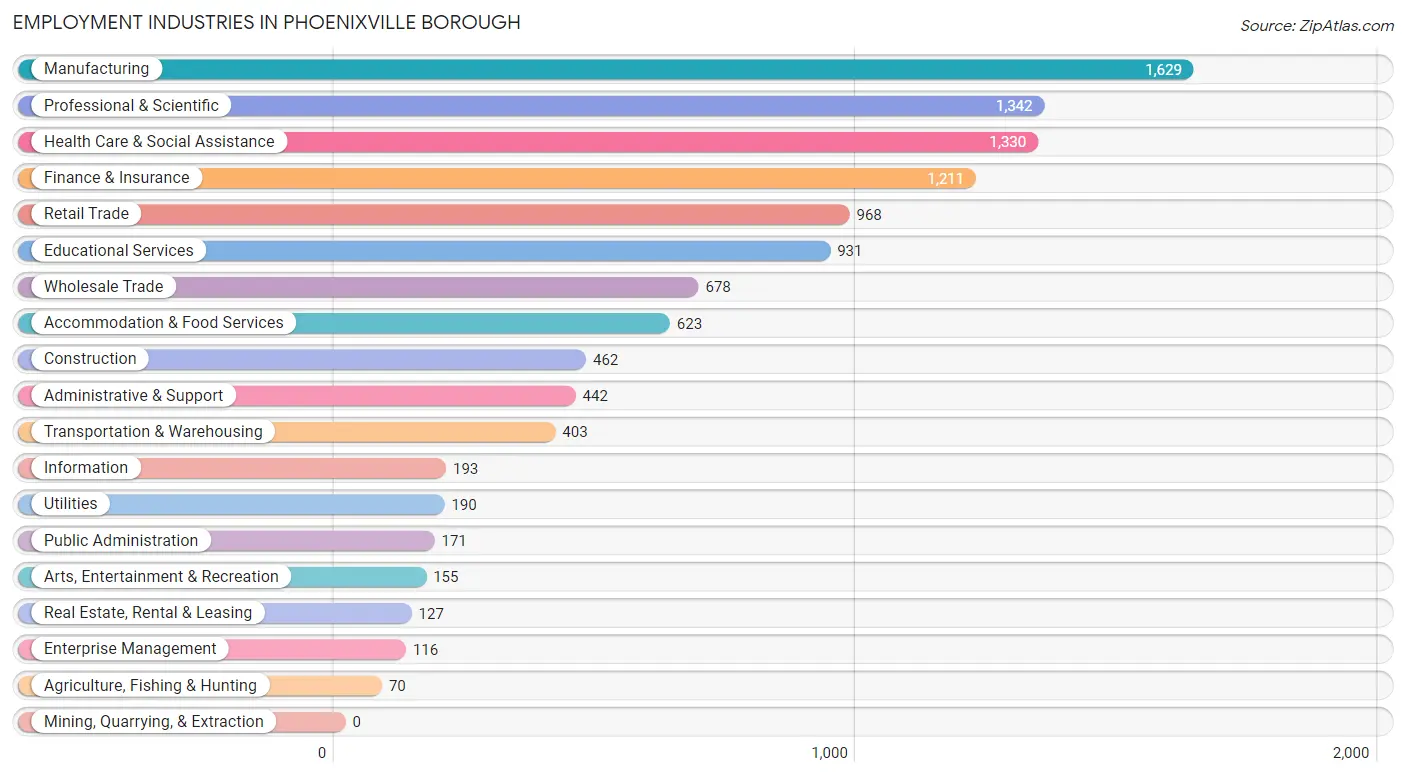
Employment Industries by Sex in Phoenixville borough
Employment Industries in Phoenixville borough
The major employment industries in Phoenixville borough include Manufacturing (1,629 | 13.9%), Professional & Scientific (1,342 | 11.5%), Health Care & Social Assistance (1,330 | 11.4%), Finance & Insurance (1,211 | 10.3%), and Retail Trade (968 | 8.3%).
Employment Industries by Sex in Phoenixville borough
The Phoenixville borough industries that see more men than women are Construction (95.5%), Utilities (94.7%), and Real Estate, Rental & Leasing (90.5%), whereas the industries that tend to have a higher number of women are Health Care & Social Assistance (81.9%), Educational Services (78.5%), and Arts, Entertainment & Recreation (73.6%).
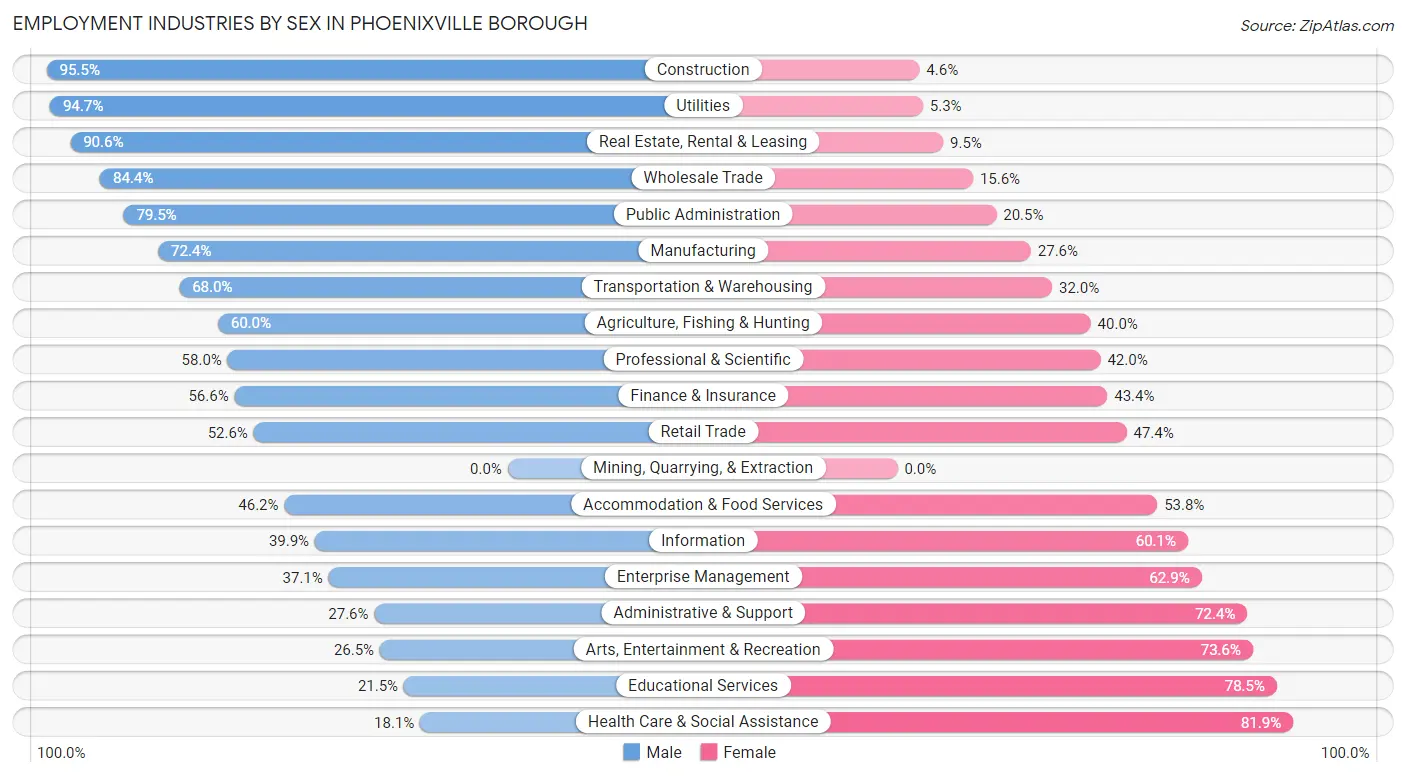
| Industry | Male | Female |
| Agriculture, Fishing & Hunting | 42 (60.0%) | 28 (40.0%) |
| Mining, Quarrying, & Extraction | 0 (0.0%) | 0 (0.0%) |
| Construction | 441 (95.5%) | 21 (4.5%) |
| Manufacturing | 1,179 (72.4%) | 450 (27.6%) |
| Wholesale Trade | 572 (84.4%) | 106 (15.6%) |
| Retail Trade | 509 (52.6%) | 459 (47.4%) |
| Transportation & Warehousing | 274 (68.0%) | 129 (32.0%) |
| Utilities | 180 (94.7%) | 10 (5.3%) |
| Information | 77 (39.9%) | 116 (60.1%) |
| Finance & Insurance | 685 (56.6%) | 526 (43.4%) |
| Real Estate, Rental & Leasing | 115 (90.5%) | 12 (9.5%) |
| Professional & Scientific | 778 (58.0%) | 564 (42.0%) |
| Enterprise Management | 43 (37.1%) | 73 (62.9%) |
| Administrative & Support | 122 (27.6%) | 320 (72.4%) |
| Educational Services | 200 (21.5%) | 731 (78.5%) |
| Health Care & Social Assistance | 241 (18.1%) | 1,089 (81.9%) |
| Arts, Entertainment & Recreation | 41 (26.5%) | 114 (73.6%) |
| Accommodation & Food Services | 288 (46.2%) | 335 (53.8%) |
| Public Administration | 136 (79.5%) | 35 (20.5%) |
| Total | 6,184 (52.8%) | 5,531 (47.2%) |
Education in Phoenixville borough
School Enrollment in Phoenixville borough
The most common levels of schooling among the 3,375 students in Phoenixville borough are elementary school (771 | 22.8%), middle school (652 | 19.3%), and high school (509 | 15.1%).
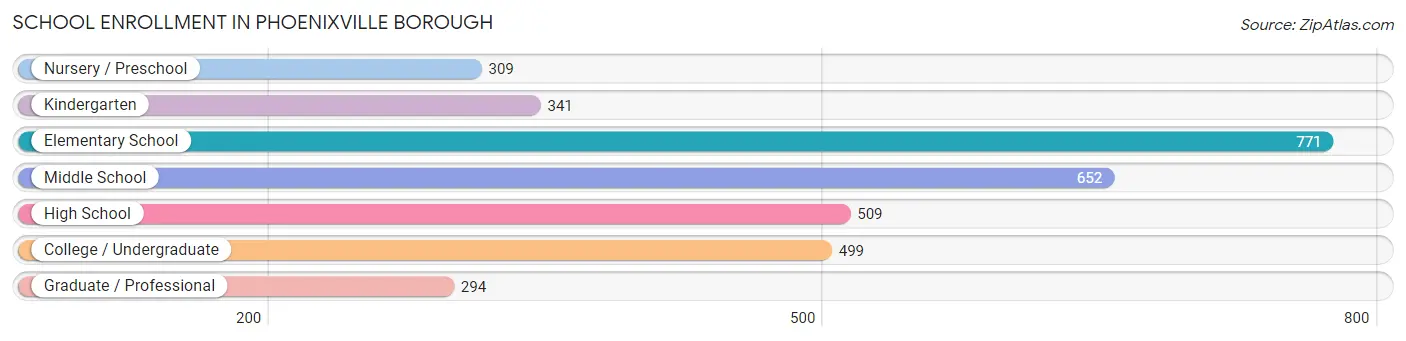
| School Level | # Students | % Students |
| Nursery / Preschool | 309 | 9.2% |
| Kindergarten | 341 | 10.1% |
| Elementary School | 771 | 22.8% |
| Middle School | 652 | 19.3% |
| High School | 509 | 15.1% |
| College / Undergraduate | 499 | 14.8% |
| Graduate / Professional | 294 | 8.7% |
| Total | 3,375 | 100.0% |
School Enrollment by Age by Funding Source in Phoenixville borough
Out of a total of 3,375 students who are enrolled in schools in Phoenixville borough, 638 (18.9%) attend a private institution, while the remaining 2,737 (81.1%) are enrolled in public schools. The age group of 18 to 19 year olds has the highest likelihood of being enrolled in private schools, with 41 (47.7% in the age bracket) enrolled. Conversely, the age group of 5 to 9 year old has the lowest likelihood of being enrolled in a private school, with 887 (94.1% in the age bracket) attending a public institution.
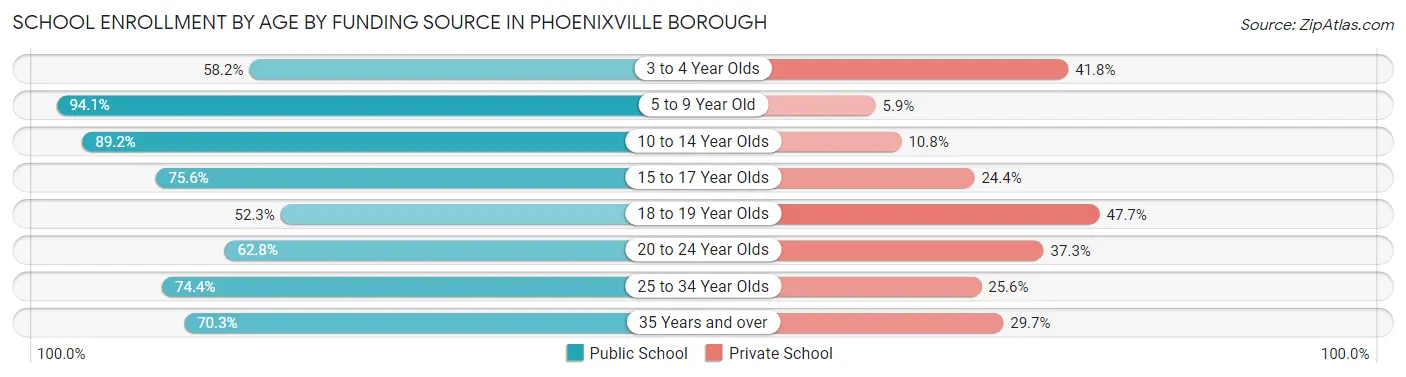
| Age Bracket | Public School | Private School |
| 3 to 4 Year Olds | 164 (58.2%) | 118 (41.8%) |
| 5 to 9 Year Old | 887 (94.1%) | 56 (5.9%) |
| 10 to 14 Year Olds | 812 (89.2%) | 98 (10.8%) |
| 15 to 17 Year Olds | 301 (75.6%) | 97 (24.4%) |
| 18 to 19 Year Olds | 45 (52.3%) | 41 (47.7%) |
| 20 to 24 Year Olds | 155 (62.7%) | 92 (37.2%) |
| 25 to 34 Year Olds | 296 (74.4%) | 102 (25.6%) |
| 35 Years and over | 78 (70.3%) | 33 (29.7%) |
| Total | 2,737 (81.1%) | 638 (18.9%) |
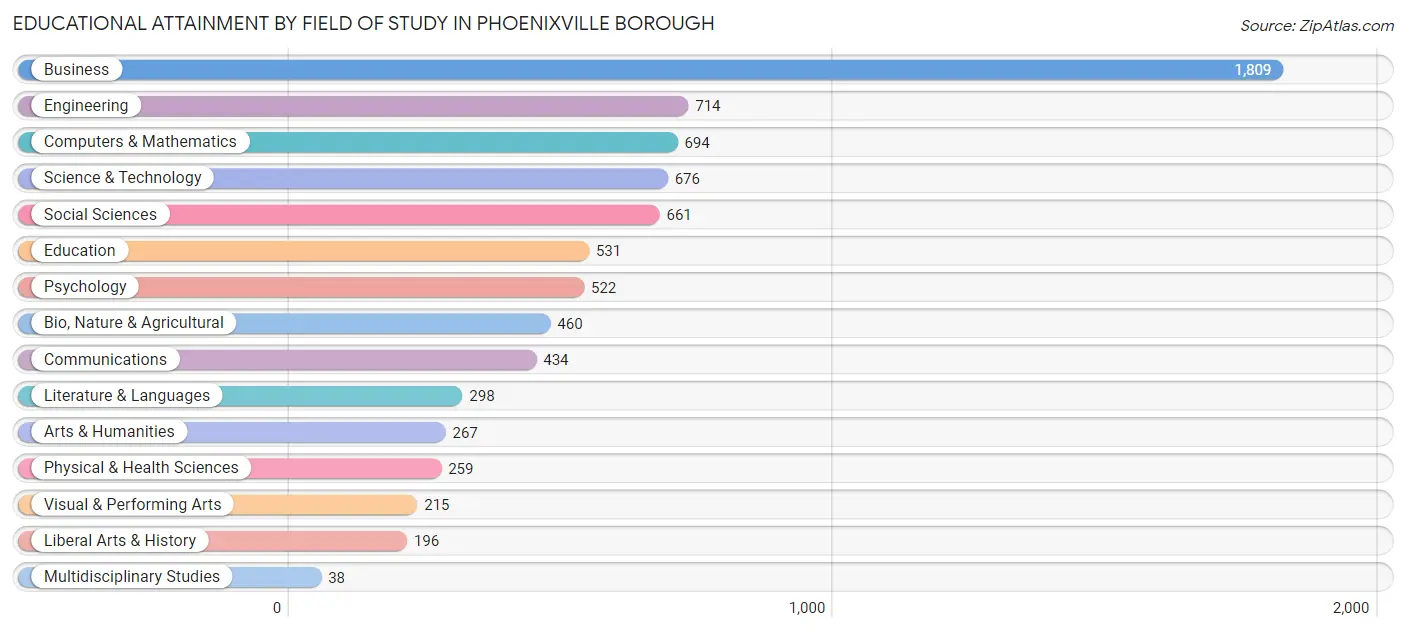
Educational Attainment by Field of Study in Phoenixville borough
Business (1,809 | 23.3%), engineering (714 | 9.2%), computers & mathematics (694 | 8.9%), science & technology (676 | 8.7%), and social sciences (661 | 8.5%) are the most common fields of study among 7,774 individuals in Phoenixville borough who have obtained a bachelor's degree or higher.
| Field of Study | # Graduates | % Graduates |
| Computers & Mathematics | 694 | 8.9% |
| Bio, Nature & Agricultural | 460 | 5.9% |
| Physical & Health Sciences | 259 | 3.3% |
| Psychology | 522 | 6.7% |
| Social Sciences | 661 | 8.5% |
| Engineering | 714 | 9.2% |
| Multidisciplinary Studies | 38 | 0.5% |
| Science & Technology | 676 | 8.7% |
| Business | 1,809 | 23.3% |
| Education | 531 | 6.8% |
| Literature & Languages | 298 | 3.8% |
| Liberal Arts & History | 196 | 2.5% |
| Visual & Performing Arts | 215 | 2.8% |
| Communications | 434 | 5.6% |
| Arts & Humanities | 267 | 3.4% |
| Total | 7,774 | 100.0% |
Transportation & Commute in Phoenixville borough
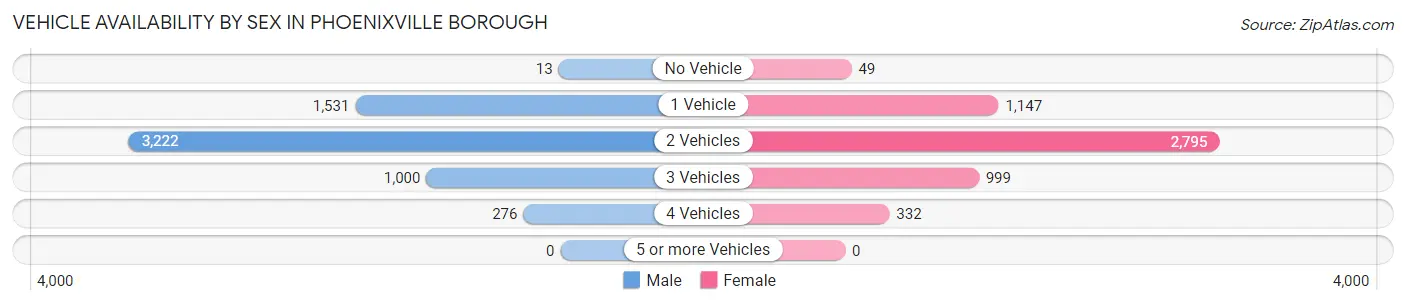
Vehicle Availability by Sex in Phoenixville borough
The most prevalent vehicle ownership categories in Phoenixville borough are males with 2 vehicles (3,222, accounting for 53.3%) and females with 2 vehicles (2,795, making up 60.5%).
| Vehicles Available | Male | Female |
| No Vehicle | 13 (0.2%) | 49 (0.9%) |
| 1 Vehicle | 1,531 (25.3%) | 1,147 (21.5%) |
| 2 Vehicles | 3,222 (53.3%) | 2,795 (52.5%) |
| 3 Vehicles | 1,000 (16.6%) | 999 (18.8%) |
| 4 Vehicles | 276 (4.6%) | 332 (6.2%) |
| 5 or more Vehicles | 0 (0.0%) | 0 (0.0%) |
| Total | 6,042 (100.0%) | 5,322 (100.0%) |
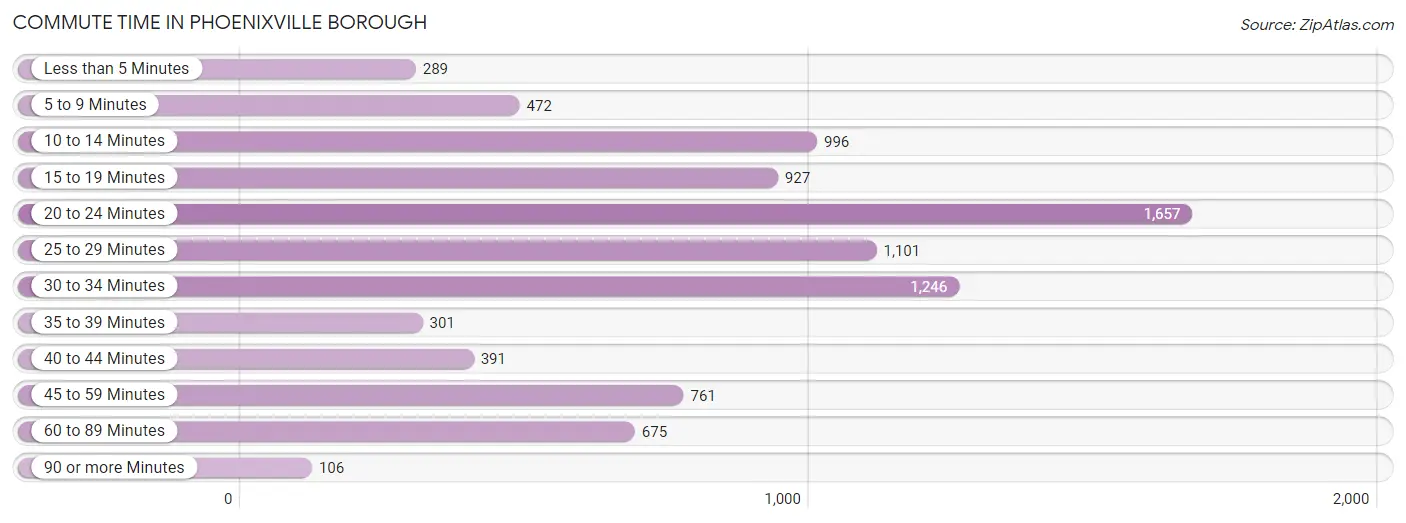
Commute Time in Phoenixville borough
The most frequently occuring commute durations in Phoenixville borough are 20 to 24 minutes (1,657 commuters, 18.6%), 30 to 34 minutes (1,246 commuters, 14.0%), and 25 to 29 minutes (1,101 commuters, 12.3%).
| Commute Time | # Commuters | % Commuters |
| Less than 5 Minutes | 289 | 3.2% |
| 5 to 9 Minutes | 472 | 5.3% |
| 10 to 14 Minutes | 996 | 11.2% |
| 15 to 19 Minutes | 927 | 10.4% |
| 20 to 24 Minutes | 1,657 | 18.6% |
| 25 to 29 Minutes | 1,101 | 12.3% |
| 30 to 34 Minutes | 1,246 | 14.0% |
| 35 to 39 Minutes | 301 | 3.4% |
| 40 to 44 Minutes | 391 | 4.4% |
| 45 to 59 Minutes | 761 | 8.5% |
| 60 to 89 Minutes | 675 | 7.6% |
| 90 or more Minutes | 106 | 1.2% |
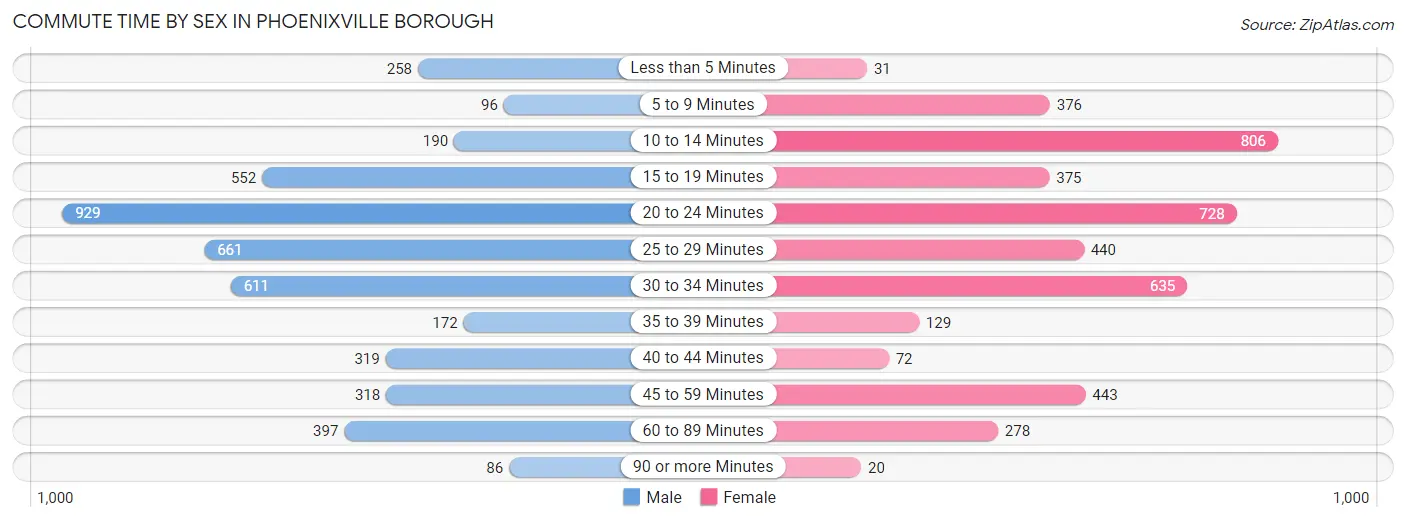
Commute Time by Sex in Phoenixville borough
The most common commute times in Phoenixville borough are 20 to 24 minutes (929 commuters, 20.2%) for males and 10 to 14 minutes (806 commuters, 18.6%) for females.
| Commute Time | Male | Female |
| Less than 5 Minutes | 258 (5.6%) | 31 (0.7%) |
| 5 to 9 Minutes | 96 (2.1%) | 376 (8.7%) |
| 10 to 14 Minutes | 190 (4.1%) | 806 (18.6%) |
| 15 to 19 Minutes | 552 (12.0%) | 375 (8.6%) |
| 20 to 24 Minutes | 929 (20.2%) | 728 (16.8%) |
| 25 to 29 Minutes | 661 (14.4%) | 440 (10.2%) |
| 30 to 34 Minutes | 611 (13.3%) | 635 (14.6%) |
| 35 to 39 Minutes | 172 (3.7%) | 129 (3.0%) |
| 40 to 44 Minutes | 319 (7.0%) | 72 (1.7%) |
| 45 to 59 Minutes | 318 (6.9%) | 443 (10.2%) |
| 60 to 89 Minutes | 397 (8.6%) | 278 (6.4%) |
| 90 or more Minutes | 86 (1.9%) | 20 (0.5%) |
Time of Departure to Work by Sex in Phoenixville borough
The most frequent times of departure to work in Phoenixville borough are 8:00 AM to 8:29 AM (826, 18.0%) for males and 7:30 AM to 7:59 AM (797, 18.4%) for females.
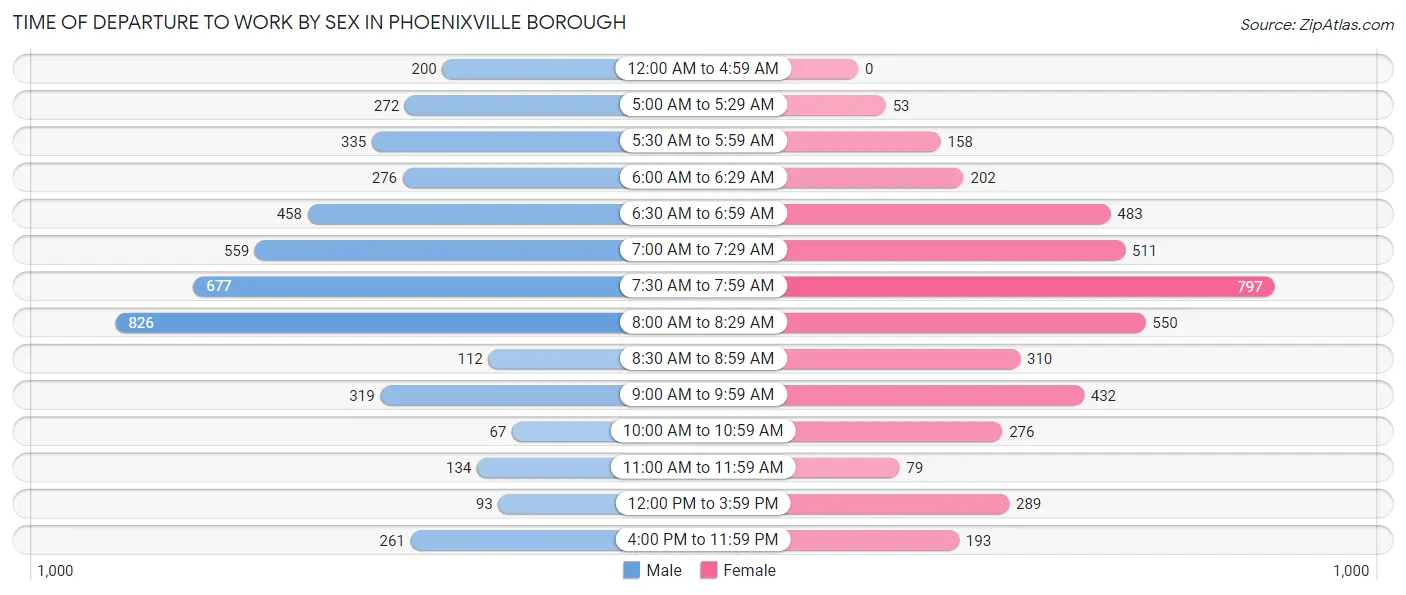
| Time of Departure | Male | Female |
| 12:00 AM to 4:59 AM | 200 (4.4%) | 0 (0.0%) |
| 5:00 AM to 5:29 AM | 272 (5.9%) | 53 (1.2%) |
| 5:30 AM to 5:59 AM | 335 (7.3%) | 158 (3.6%) |
| 6:00 AM to 6:29 AM | 276 (6.0%) | 202 (4.7%) |
| 6:30 AM to 6:59 AM | 458 (10.0%) | 483 (11.2%) |
| 7:00 AM to 7:29 AM | 559 (12.2%) | 511 (11.8%) |
| 7:30 AM to 7:59 AM | 677 (14.7%) | 797 (18.4%) |
| 8:00 AM to 8:29 AM | 826 (18.0%) | 550 (12.7%) |
| 8:30 AM to 8:59 AM | 112 (2.4%) | 310 (7.1%) |
| 9:00 AM to 9:59 AM | 319 (7.0%) | 432 (10.0%) |
| 10:00 AM to 10:59 AM | 67 (1.5%) | 276 (6.4%) |
| 11:00 AM to 11:59 AM | 134 (2.9%) | 79 (1.8%) |
| 12:00 PM to 3:59 PM | 93 (2.0%) | 289 (6.7%) |
| 4:00 PM to 11:59 PM | 261 (5.7%) | 193 (4.4%) |
| Total | 4,589 (100.0%) | 4,333 (100.0%) |
Housing Occupancy in Phoenixville borough
Occupancy by Ownership in Phoenixville borough
Of the total 8,374 dwellings in Phoenixville borough, owner-occupied units account for 4,203 (50.2%), while renter-occupied units make up 4,171 (49.8%).
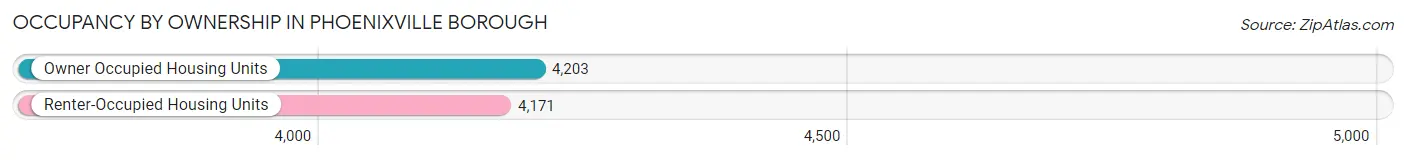
| Occupancy | # Housing Units | % Housing Units |
| Owner Occupied Housing Units | 4,203 | 50.2% |
| Renter-Occupied Housing Units | 4,171 | 49.8% |
| Total Occupied Housing Units | 8,374 | 100.0% |
Occupancy by Household Size in Phoenixville borough
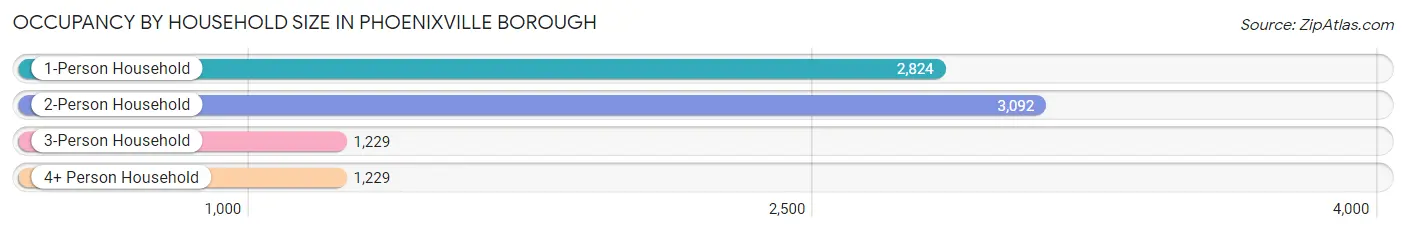
| Household Size | # Housing Units | % Housing Units |
| 1-Person Household | 2,824 | 33.7% |
| 2-Person Household | 3,092 | 36.9% |
| 3-Person Household | 1,229 | 14.7% |
| 4+ Person Household | 1,229 | 14.7% |
| Total Housing Units | 8,374 | 100.0% |
Occupancy by Ownership by Household Size in Phoenixville borough
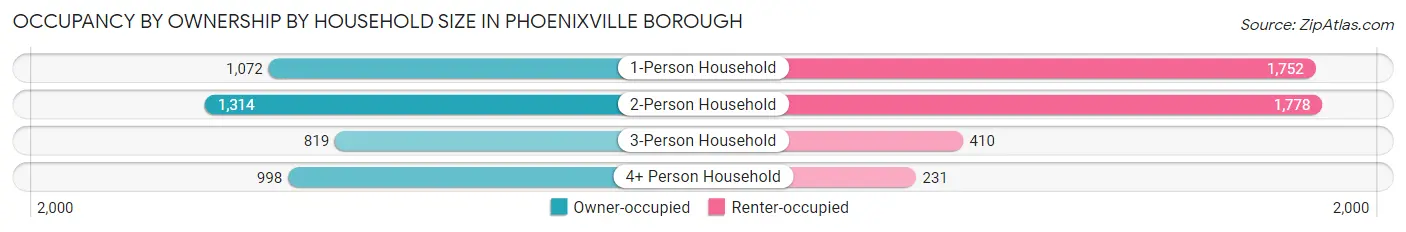
| Household Size | Owner-occupied | Renter-occupied |
| 1-Person Household | 1,072 (38.0%) | 1,752 (62.0%) |
| 2-Person Household | 1,314 (42.5%) | 1,778 (57.5%) |
| 3-Person Household | 819 (66.6%) | 410 (33.4%) |
| 4+ Person Household | 998 (81.2%) | 231 (18.8%) |
| Total Housing Units | 4,203 (50.2%) | 4,171 (49.8%) |
Occupancy by Educational Attainment in Phoenixville borough
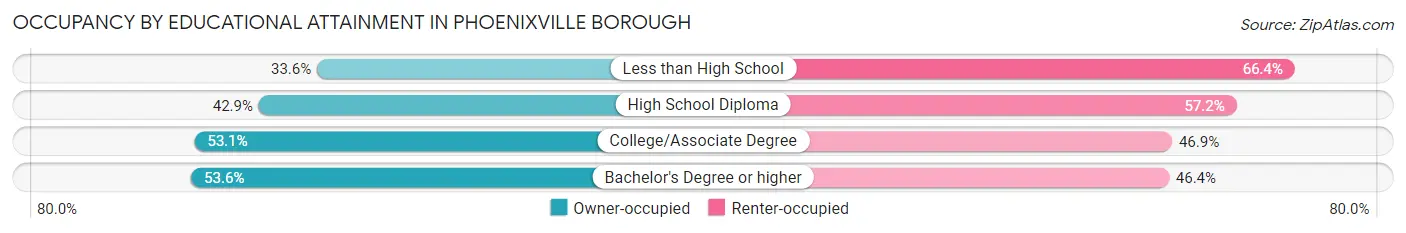
| Household Size | Owner-occupied | Renter-occupied |
| Less than High School | 160 (33.6%) | 316 (66.4%) |
| High School Diploma | 722 (42.8%) | 963 (57.2%) |
| College/Associate Degree | 844 (53.1%) | 746 (46.9%) |
| Bachelor's Degree or higher | 2,477 (53.6%) | 2,146 (46.4%) |
Occupancy by Age of Householder in Phoenixville borough
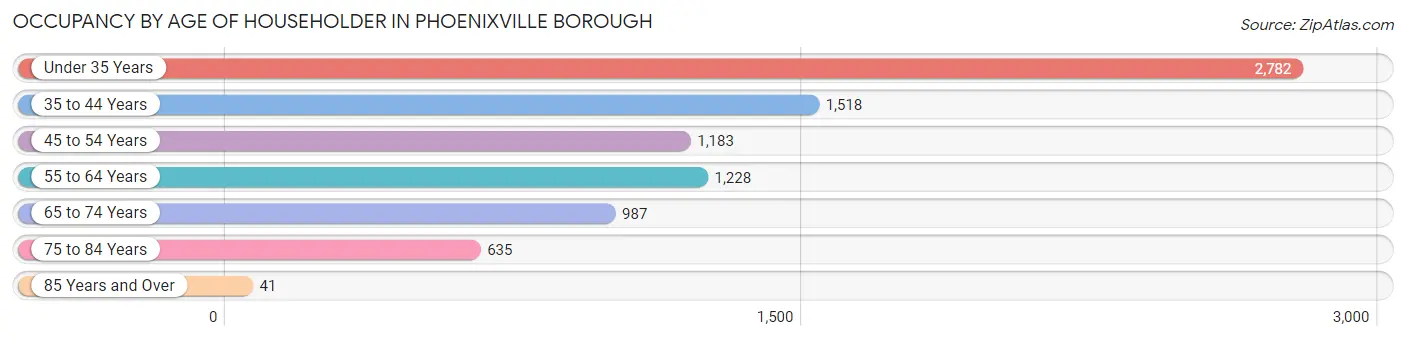
| Age Bracket | # Households | % Households |
| Under 35 Years | 2,782 | 33.2% |
| 35 to 44 Years | 1,518 | 18.1% |
| 45 to 54 Years | 1,183 | 14.1% |
| 55 to 64 Years | 1,228 | 14.7% |
| 65 to 74 Years | 987 | 11.8% |
| 75 to 84 Years | 635 | 7.6% |
| 85 Years and Over | 41 | 0.5% |
| Total | 8,374 | 100.0% |
Housing Finances in Phoenixville borough
Median Income by Occupancy in Phoenixville borough
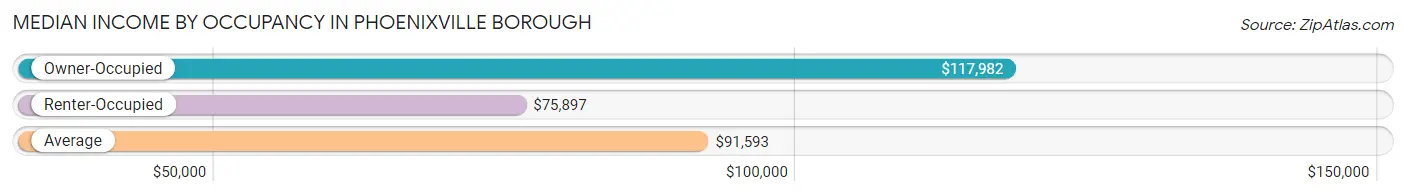
| Occupancy Type | # Households | Median Income |
| Owner-Occupied | 4,203 (50.2%) | $117,982 |
| Renter-Occupied | 4,171 (49.8%) | $75,897 |
| Average | 8,374 (100.0%) | $91,593 |
Occupancy by Householder Income Bracket in Phoenixville borough
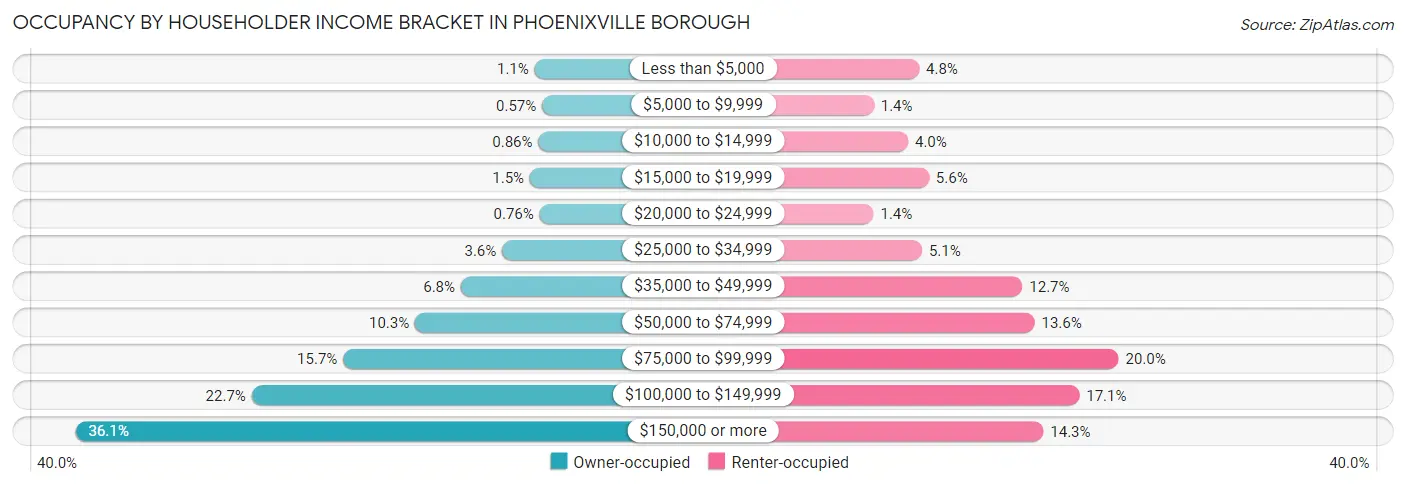
| Income Bracket | Owner-occupied | Renter-occupied |
| Less than $5,000 | 48 (1.1%) | 202 (4.8%) |
| $5,000 to $9,999 | 24 (0.6%) | 58 (1.4%) |
| $10,000 to $14,999 | 36 (0.9%) | 167 (4.0%) |
| $15,000 to $19,999 | 63 (1.5%) | 233 (5.6%) |
| $20,000 to $24,999 | 32 (0.8%) | 57 (1.4%) |
| $25,000 to $34,999 | 152 (3.6%) | 211 (5.1%) |
| $35,000 to $49,999 | 284 (6.8%) | 530 (12.7%) |
| $50,000 to $74,999 | 431 (10.2%) | 569 (13.6%) |
| $75,000 to $99,999 | 661 (15.7%) | 836 (20.0%) |
| $100,000 to $149,999 | 954 (22.7%) | 711 (17.1%) |
| $150,000 or more | 1,518 (36.1%) | 597 (14.3%) |
| Total | 4,203 (100.0%) | 4,171 (100.0%) |
Monthly Housing Cost Tiers in Phoenixville borough
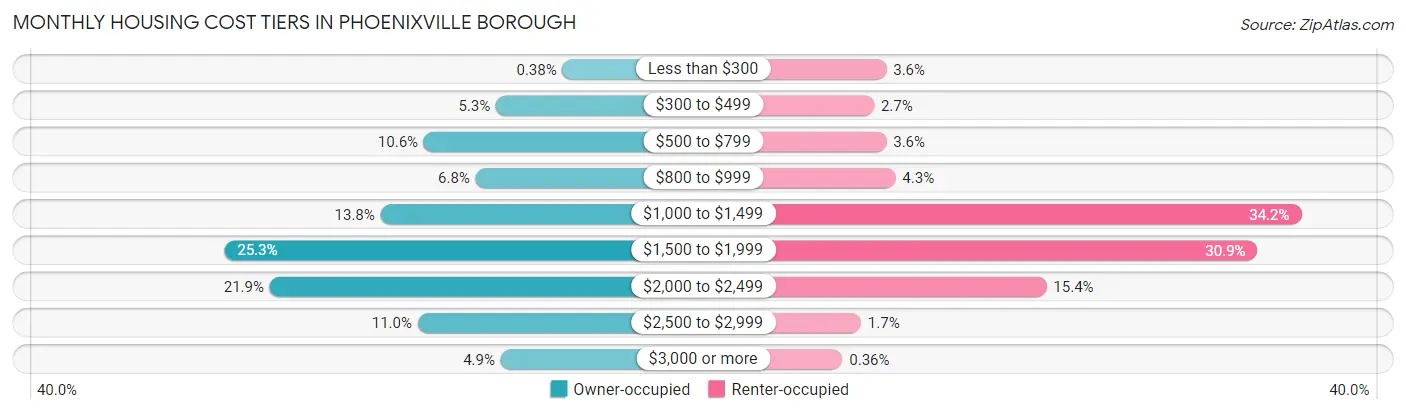
| Monthly Cost | Owner-occupied | Renter-occupied |
| Less than $300 | 16 (0.4%) | 150 (3.6%) |
| $300 to $499 | 222 (5.3%) | 112 (2.7%) |
| $500 to $799 | 445 (10.6%) | 150 (3.6%) |
| $800 to $999 | 285 (6.8%) | 178 (4.3%) |
| $1,000 to $1,499 | 579 (13.8%) | 1,425 (34.2%) |
| $1,500 to $1,999 | 1,063 (25.3%) | 1,290 (30.9%) |
| $2,000 to $2,499 | 922 (21.9%) | 642 (15.4%) |
| $2,500 to $2,999 | 464 (11.0%) | 72 (1.7%) |
| $3,000 or more | 207 (4.9%) | 15 (0.4%) |
| Total | 4,203 (100.0%) | 4,171 (100.0%) |
Physical Housing Characteristics in Phoenixville borough
Housing Structures in Phoenixville borough
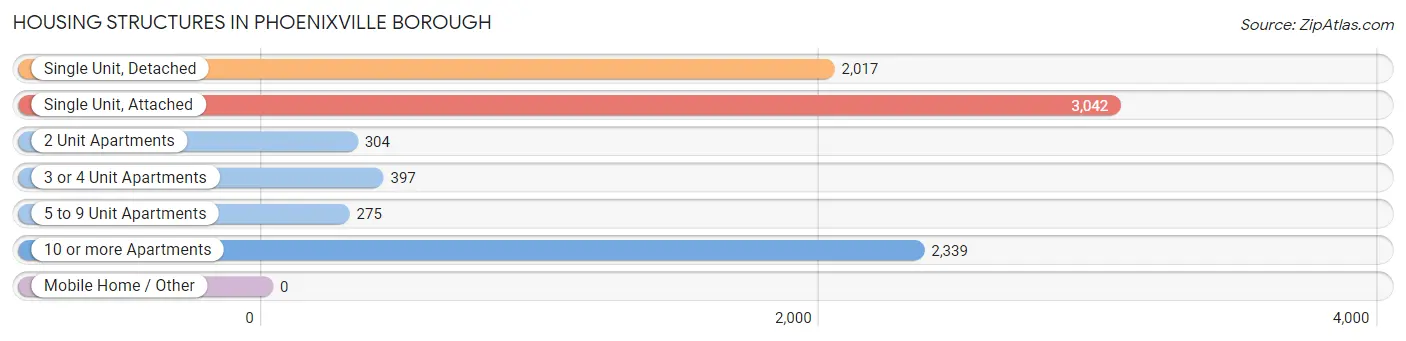
| Structure Type | # Housing Units | % Housing Units |
| Single Unit, Detached | 2,017 | 24.1% |
| Single Unit, Attached | 3,042 | 36.3% |
| 2 Unit Apartments | 304 | 3.6% |
| 3 or 4 Unit Apartments | 397 | 4.7% |
| 5 to 9 Unit Apartments | 275 | 3.3% |
| 10 or more Apartments | 2,339 | 27.9% |
| Mobile Home / Other | 0 | 0.0% |
| Total | 8,374 | 100.0% |
Housing Structures by Occupancy in Phoenixville borough
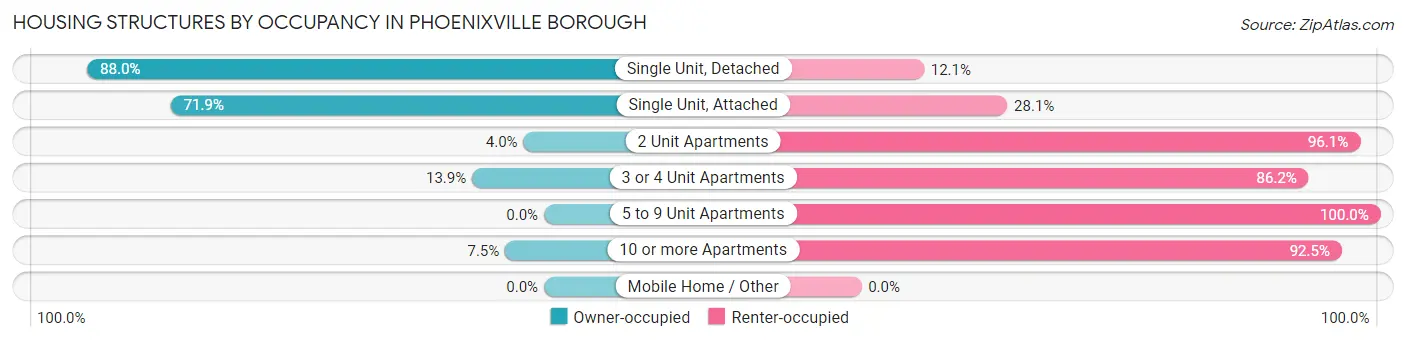
| Structure Type | Owner-occupied | Renter-occupied |
| Single Unit, Detached | 1,774 (87.9%) | 243 (12.0%) |
| Single Unit, Attached | 2,187 (71.9%) | 855 (28.1%) |
| 2 Unit Apartments | 12 (4.0%) | 292 (96.1%) |
| 3 or 4 Unit Apartments | 55 (13.9%) | 342 (86.2%) |
| 5 to 9 Unit Apartments | 0 (0.0%) | 275 (100.0%) |
| 10 or more Apartments | 175 (7.5%) | 2,164 (92.5%) |
| Mobile Home / Other | 0 (0.0%) | 0 (0.0%) |
| Total | 4,203 (50.2%) | 4,171 (49.8%) |
Housing Structures by Number of Rooms in Phoenixville borough
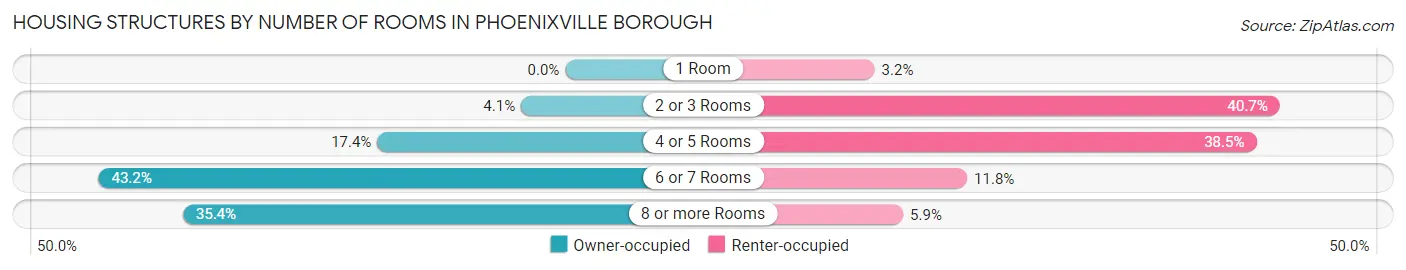
| Number of Rooms | Owner-occupied | Renter-occupied |
| 1 Room | 0 (0.0%) | 134 (3.2%) |
| 2 or 3 Rooms | 172 (4.1%) | 1,696 (40.7%) |
| 4 or 5 Rooms | 731 (17.4%) | 1,606 (38.5%) |
| 6 or 7 Rooms | 1,814 (43.2%) | 491 (11.8%) |
| 8 or more Rooms | 1,486 (35.4%) | 244 (5.9%) |
| Total | 4,203 (100.0%) | 4,171 (100.0%) |
Housing Structure by Heating Type in Phoenixville borough
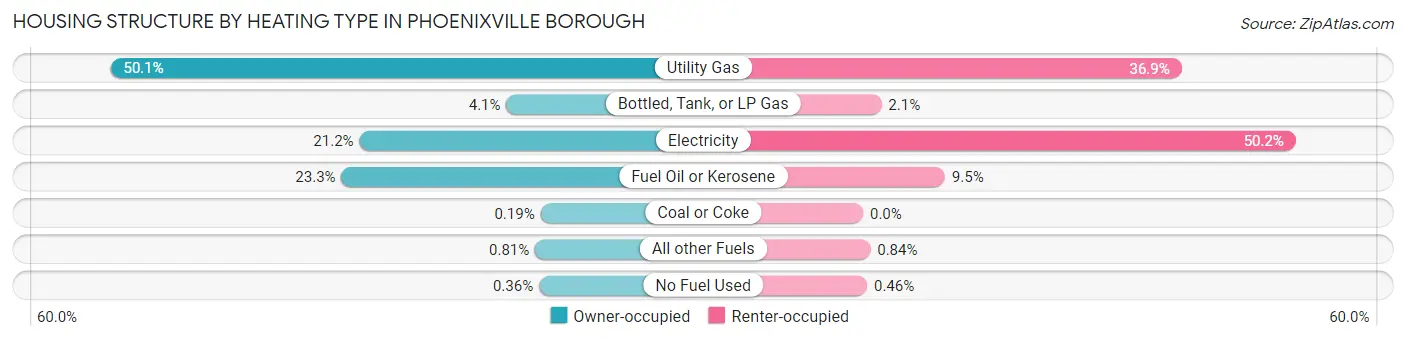
| Heating Type | Owner-occupied | Renter-occupied |
| Utility Gas | 2,104 (50.1%) | 1,540 (36.9%) |
| Bottled, Tank, or LP Gas | 174 (4.1%) | 89 (2.1%) |
| Electricity | 890 (21.2%) | 2,092 (50.2%) |
| Fuel Oil or Kerosene | 978 (23.3%) | 396 (9.5%) |
| Coal or Coke | 8 (0.2%) | 0 (0.0%) |
| All other Fuels | 34 (0.8%) | 35 (0.8%) |
| No Fuel Used | 15 (0.4%) | 19 (0.5%) |
| Total | 4,203 (100.0%) | 4,171 (100.0%) |
Household Vehicle Usage in Phoenixville borough
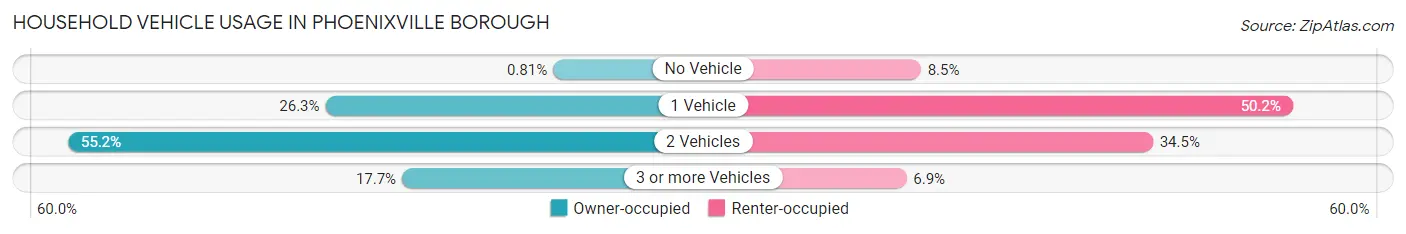
| Vehicles per Household | Owner-occupied | Renter-occupied |
| No Vehicle | 34 (0.8%) | 354 (8.5%) |
| 1 Vehicle | 1,106 (26.3%) | 2,092 (50.2%) |
| 2 Vehicles | 2,318 (55.1%) | 1,438 (34.5%) |
| 3 or more Vehicles | 745 (17.7%) | 287 (6.9%) |
| Total | 4,203 (100.0%) | 4,171 (100.0%) |
Real Estate & Mortgages in Phoenixville borough
Real Estate and Mortgage Overview in Phoenixville borough
| Characteristic | Without Mortgage | With Mortgage |
| Housing Units | 1,077 | 3,126 |
| Median Property Value | $320,000 | $327,200 |
| Median Household Income | $89,760 | $1,248 |
| Monthly Housing Costs | $731 | $207 |
| Real Estate Taxes | $3,965 | $0 |
Property Value by Mortgage Status in Phoenixville borough
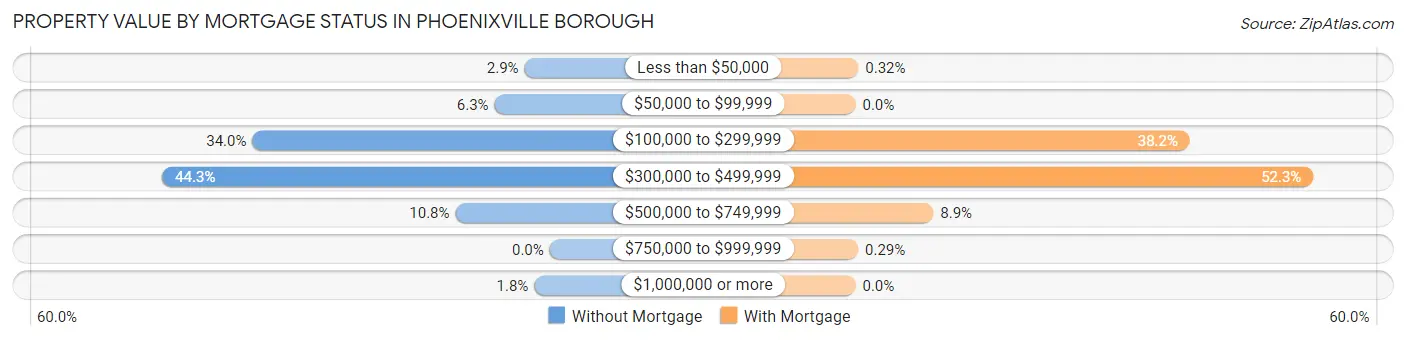
| Property Value | Without Mortgage | With Mortgage |
| Less than $50,000 | 31 (2.9%) | 10 (0.3%) |
| $50,000 to $99,999 | 68 (6.3%) | 0 (0.0%) |
| $100,000 to $299,999 | 366 (34.0%) | 1,194 (38.2%) |
| $300,000 to $499,999 | 477 (44.3%) | 1,635 (52.3%) |
| $500,000 to $749,999 | 116 (10.8%) | 278 (8.9%) |
| $750,000 to $999,999 | 0 (0.0%) | 9 (0.3%) |
| $1,000,000 or more | 19 (1.8%) | 0 (0.0%) |
| Total | 1,077 (100.0%) | 3,126 (100.0%) |
Household Income by Mortgage Status in Phoenixville borough
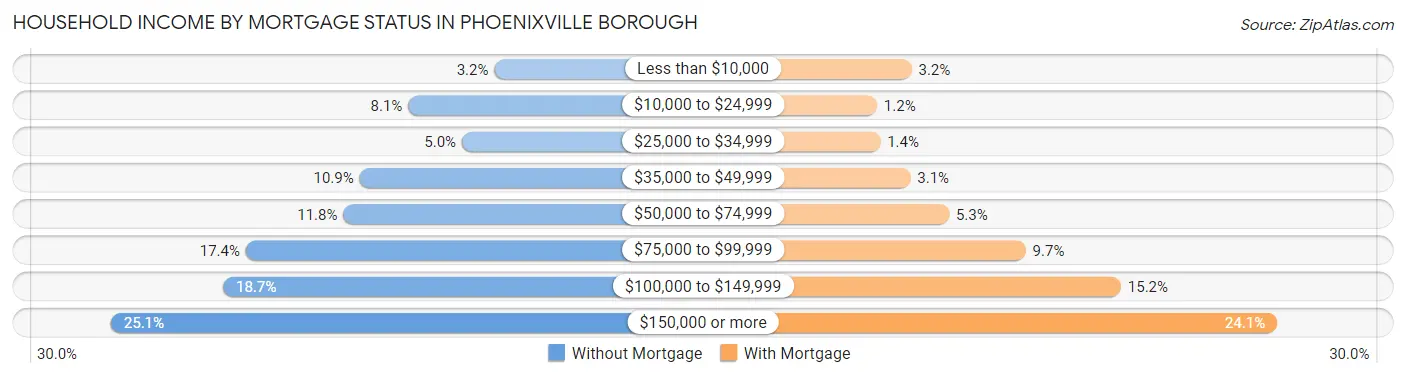
| Household Income | Without Mortgage | With Mortgage |
| Less than $10,000 | 34 (3.2%) | 100 (3.2%) |
| $10,000 to $24,999 | 87 (8.1%) | 38 (1.2%) |
| $25,000 to $34,999 | 54 (5.0%) | 44 (1.4%) |
| $35,000 to $49,999 | 117 (10.9%) | 98 (3.1%) |
| $50,000 to $74,999 | 127 (11.8%) | 167 (5.3%) |
| $75,000 to $99,999 | 187 (17.4%) | 304 (9.7%) |
| $100,000 to $149,999 | 201 (18.7%) | 474 (15.2%) |
| $150,000 or more | 270 (25.1%) | 753 (24.1%) |
| Total | 1,077 (100.0%) | 3,126 (100.0%) |
Property Value to Household Income Ratio in Phoenixville borough
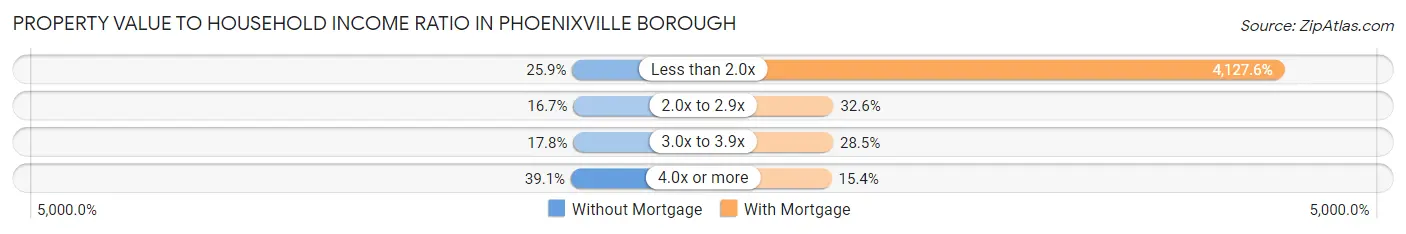
| Value-to-Income Ratio | Without Mortgage | With Mortgage |
| Less than 2.0x | 279 (25.9%) | 129,028 (4,127.6%) |
| 2.0x to 2.9x | 180 (16.7%) | 1,018 (32.6%) |
| 3.0x to 3.9x | 192 (17.8%) | 891 (28.5%) |
| 4.0x or more | 421 (39.1%) | 482 (15.4%) |
| Total | 1,077 (100.0%) | 3,126 (100.0%) |
Real Estate Taxes by Mortgage Status in Phoenixville borough
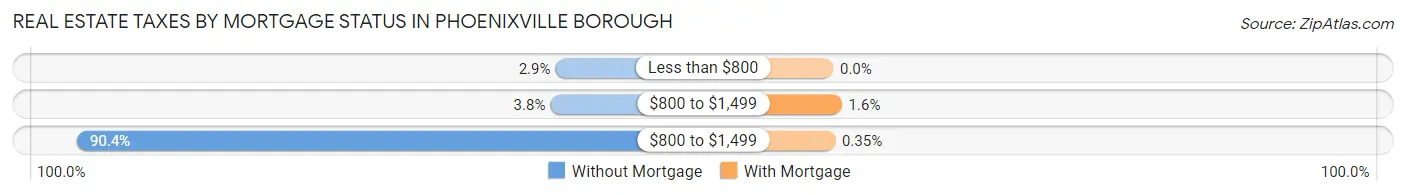
| Property Taxes | Without Mortgage | With Mortgage |
| Less than $800 | 31 (2.9%) | 0 (0.0%) |
| $800 to $1,499 | 41 (3.8%) | 49 (1.6%) |
| $800 to $1,499 | 974 (90.4%) | 11 (0.4%) |
| Total | 1,077 (100.0%) | 3,126 (100.0%) |
Health & Disability in Phoenixville borough
Health Insurance Coverage by Age in Phoenixville borough
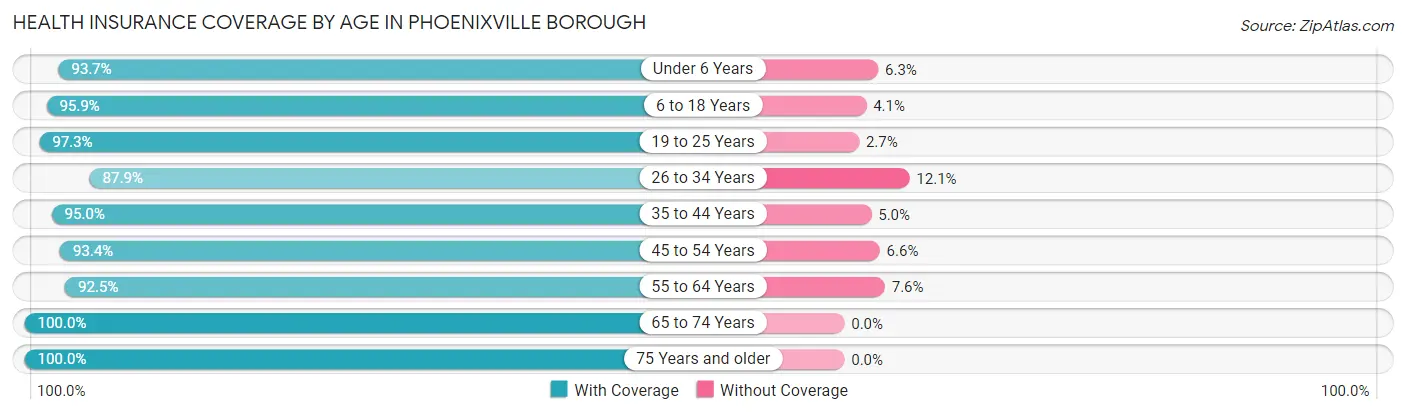
| Age Bracket | With Coverage | Without Coverage |
| Under 6 Years | 1,190 (93.7%) | 80 (6.3%) |
| 6 to 18 Years | 2,094 (95.9%) | 89 (4.1%) |
| 19 to 25 Years | 1,671 (97.3%) | 47 (2.7%) |
| 26 to 34 Years | 3,769 (87.9%) | 521 (12.1%) |
| 35 to 44 Years | 2,721 (95.0%) | 144 (5.0%) |
| 45 to 54 Years | 1,997 (93.4%) | 141 (6.6%) |
| 55 to 64 Years | 1,789 (92.4%) | 146 (7.5%) |
| 65 to 74 Years | 1,296 (100.0%) | 0 (0.0%) |
| 75 Years and older | 944 (100.0%) | 0 (0.0%) |
| Total | 17,471 (93.7%) | 1,168 (6.3%) |
Health Insurance Coverage by Citizenship Status in Phoenixville borough
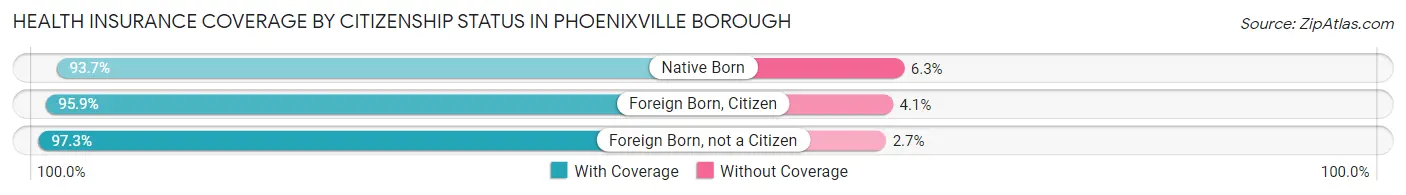
| Citizenship Status | With Coverage | Without Coverage |
| Native Born | 1,190 (93.7%) | 80 (6.3%) |
| Foreign Born, Citizen | 2,094 (95.9%) | 89 (4.1%) |
| Foreign Born, not a Citizen | 1,671 (97.3%) | 47 (2.7%) |
Health Insurance Coverage by Household Income in Phoenixville borough
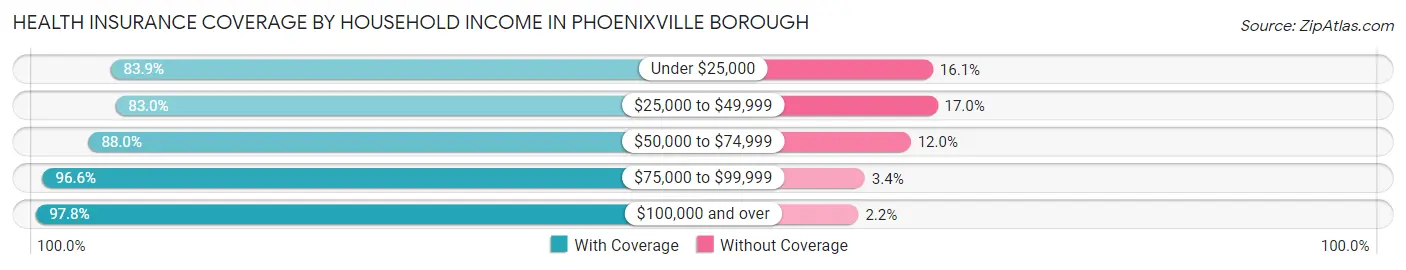
| Household Income | With Coverage | Without Coverage |
| Under $25,000 | 1,321 (83.9%) | 254 (16.1%) |
| $25,000 to $49,999 | 1,816 (83.0%) | 372 (17.0%) |
| $50,000 to $74,999 | 1,616 (88.0%) | 220 (12.0%) |
| $75,000 to $99,999 | 3,078 (96.6%) | 108 (3.4%) |
| $100,000 and over | 9,566 (97.8%) | 214 (2.2%) |
Public vs Private Health Insurance Coverage by Age in Phoenixville borough
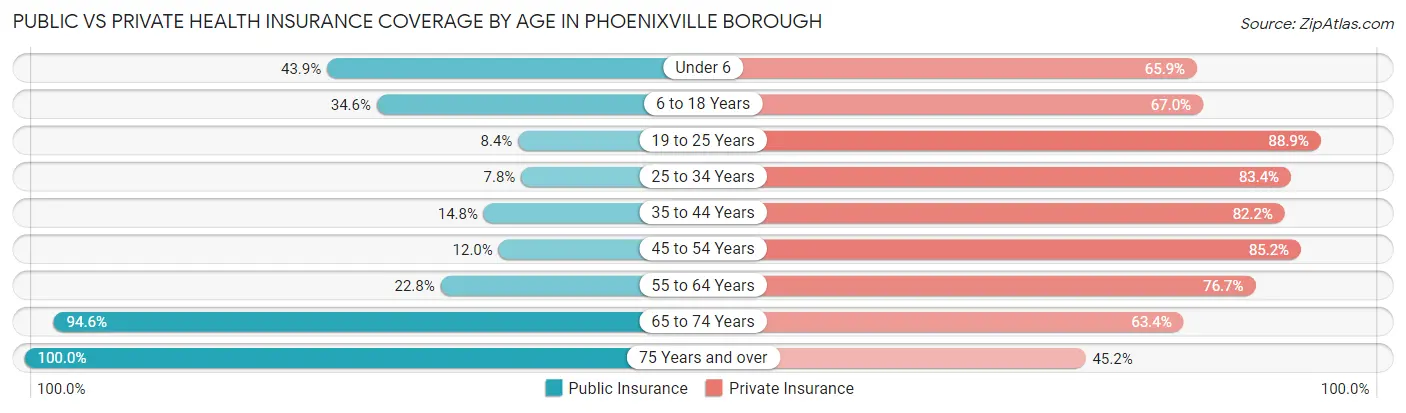
| Age Bracket | Public Insurance | Private Insurance |
| Under 6 | 557 (43.9%) | 837 (65.9%) |
| 6 to 18 Years | 756 (34.6%) | 1,463 (67.0%) |
| 19 to 25 Years | 144 (8.4%) | 1,527 (88.9%) |
| 25 to 34 Years | 336 (7.8%) | 3,576 (83.4%) |
| 35 to 44 Years | 423 (14.8%) | 2,355 (82.2%) |
| 45 to 54 Years | 257 (12.0%) | 1,822 (85.2%) |
| 55 to 64 Years | 441 (22.8%) | 1,485 (76.7%) |
| 65 to 74 Years | 1,226 (94.6%) | 822 (63.4%) |
| 75 Years and over | 944 (100.0%) | 427 (45.2%) |
| Total | 5,084 (27.3%) | 14,314 (76.8%) |
Disability Status by Sex by Age in Phoenixville borough
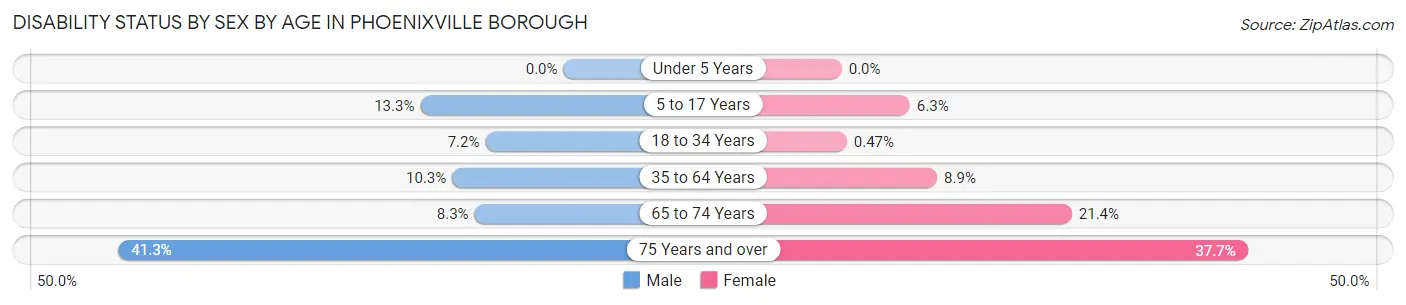
| Age Bracket | Male | Female |
| Under 5 Years | 0 (0.0%) | 0 (0.0%) |
| 5 to 17 Years | 166 (13.3%) | 64 (6.3%) |
| 18 to 34 Years | 243 (7.2%) | 13 (0.5%) |
| 35 to 64 Years | 384 (10.3%) | 285 (8.8%) |
| 65 to 74 Years | 47 (8.3%) | 155 (21.3%) |
| 75 Years and over | 199 (41.3%) | 174 (37.7%) |
Disability Class by Sex by Age in Phoenixville borough
Disability Class: Hearing Difficulty

| Age Bracket | Male | Female |
| Under 5 Years | 0 (0.0%) | 0 (0.0%) |
| 5 to 17 Years | 28 (2.2%) | 17 (1.7%) |
| 18 to 34 Years | 40 (1.2%) | 0 (0.0%) |
| 35 to 64 Years | 60 (1.6%) | 54 (1.7%) |
| 65 to 74 Years | 47 (8.3%) | 0 (0.0%) |
| 75 Years and over | 102 (21.2%) | 39 (8.4%) |
Disability Class: Vision Difficulty
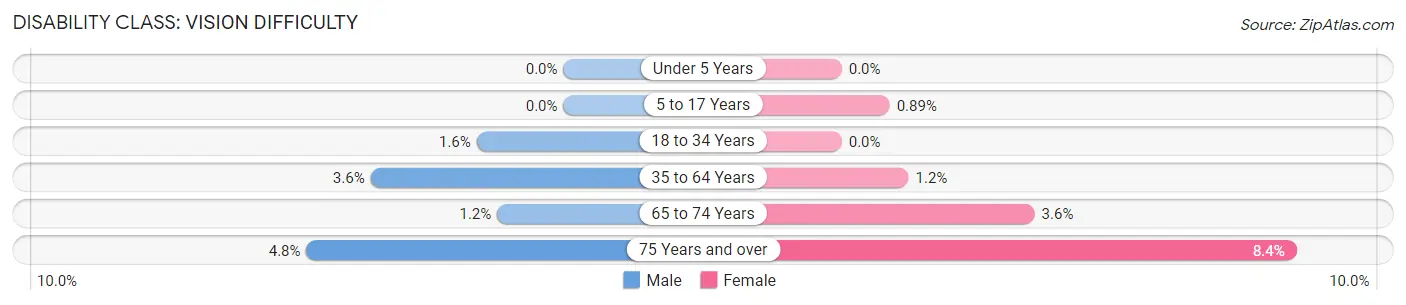
| Age Bracket | Male | Female |
| Under 5 Years | 0 (0.0%) | 0 (0.0%) |
| 5 to 17 Years | 0 (0.0%) | 9 (0.9%) |
| 18 to 34 Years | 54 (1.6%) | 0 (0.0%) |
| 35 to 64 Years | 133 (3.6%) | 40 (1.2%) |
| 65 to 74 Years | 7 (1.2%) | 26 (3.6%) |
| 75 Years and over | 23 (4.8%) | 39 (8.4%) |
Disability Class: Cognitive Difficulty
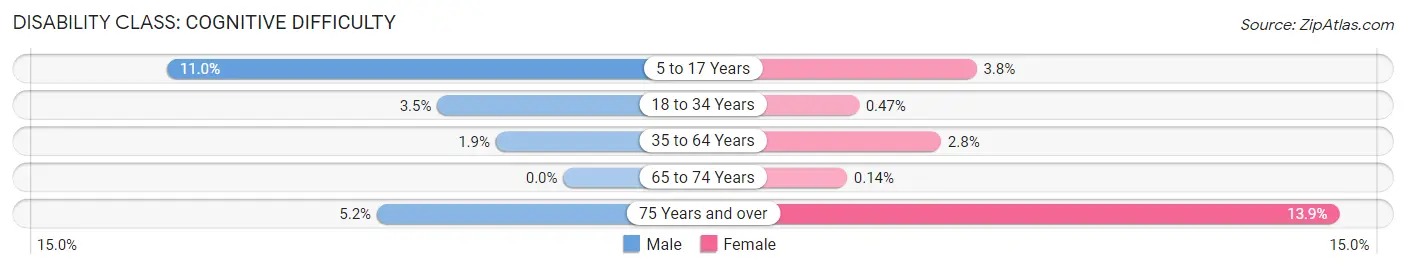
| Age Bracket | Male | Female |
| 5 to 17 Years | 138 (11.0%) | 38 (3.7%) |
| 18 to 34 Years | 118 (3.5%) | 13 (0.5%) |
| 35 to 64 Years | 70 (1.9%) | 89 (2.8%) |
| 65 to 74 Years | 0 (0.0%) | 1 (0.1%) |
| 75 Years and over | 25 (5.2%) | 64 (13.9%) |
Disability Class: Ambulatory Difficulty
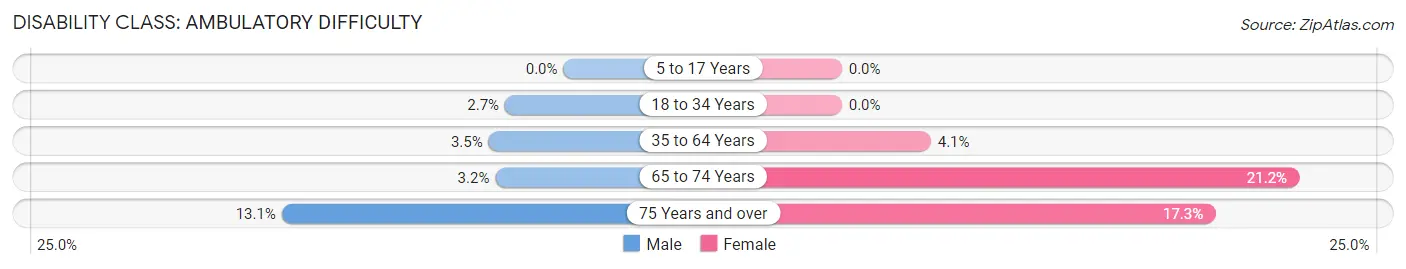
| Age Bracket | Male | Female |
| 5 to 17 Years | 0 (0.0%) | 0 (0.0%) |
| 18 to 34 Years | 91 (2.7%) | 0 (0.0%) |
| 35 to 64 Years | 129 (3.5%) | 133 (4.1%) |
| 65 to 74 Years | 18 (3.2%) | 154 (21.2%) |
| 75 Years and over | 63 (13.1%) | 80 (17.3%) |
Disability Class: Self-Care Difficulty
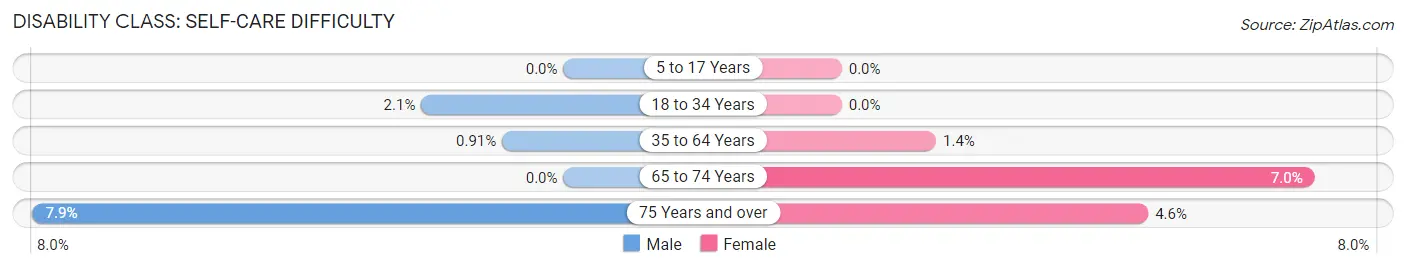
| Age Bracket | Male | Female |
| 5 to 17 Years | 0 (0.0%) | 0 (0.0%) |
| 18 to 34 Years | 71 (2.1%) | 0 (0.0%) |
| 35 to 64 Years | 34 (0.9%) | 45 (1.4%) |
| 65 to 74 Years | 0 (0.0%) | 51 (7.0%) |
| 75 Years and over | 38 (7.9%) | 21 (4.5%) |
Technology Access in Phoenixville borough
Computing Device Access in Phoenixville borough
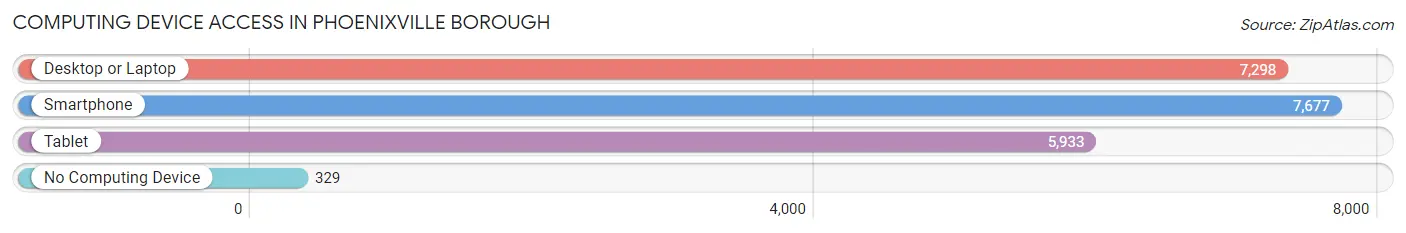
| Device Type | # Households | % Households |
| Desktop or Laptop | 7,298 | 87.2% |
| Smartphone | 7,677 | 91.7% |
| Tablet | 5,933 | 70.9% |
| No Computing Device | 329 | 3.9% |
| Total | 8,374 | 100.0% |
Internet Access in Phoenixville borough
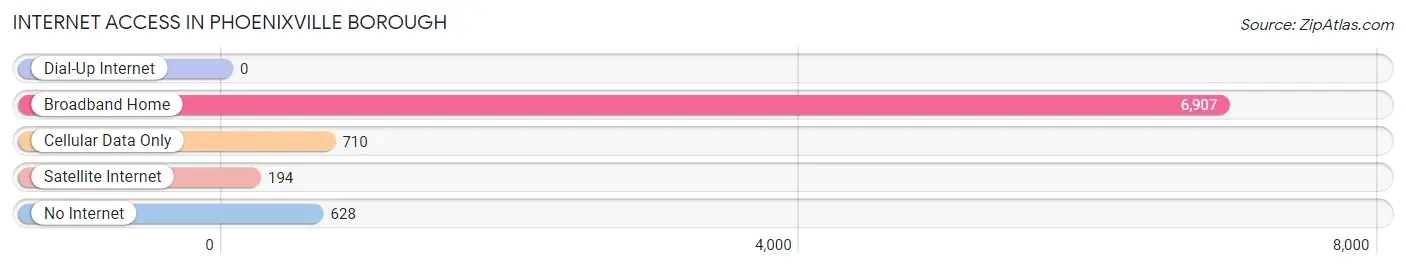
| Internet Type | # Households | % Households |
| Dial-Up Internet | 0 | 0.0% |
| Broadband Home | 6,907 | 82.5% |
| Cellular Data Only | 710 | 8.5% |
| Satellite Internet | 194 | 2.3% |
| No Internet | 628 | 7.5% |
| Total | 8,374 | 100.0% |
Phoenixville borough Summary
Introduction
Located in the heart of Chester County, Pennsylvania, the borough of Phoenixville is a small, vibrant community with a rich history and a bright future. With a population of 16,440 as of the 2010 census, Phoenixville is the largest borough in Chester County and the second largest in the state. The borough is situated along the Schuylkill River, and is home to a variety of businesses, restaurants, and attractions.
History
The area that is now Phoenixville was originally inhabited by the Lenni Lenape Native Americans. The first European settlers arrived in the area in the late 17th century, and the town was officially founded in 1732. The town was originally known as Manavon, and was later renamed Phoenixville in 1849.
The town was an important industrial center during the 19th century, and was home to several iron and steel mills. The Phoenix Iron Works, which was founded in 1810, was the largest and most successful of these mills. The Phoenix Iron Works was the first to produce the Bessemer process of steel production, and was the first to produce steel rails for the railroad industry.
The town was also home to several other industries, including a paper mill, a brickyard, and a brewery. The Phoenixville Foundry, which was founded in 1856, was the largest foundry in the United States at the time.
Geography
Phoenixville is located in southeastern Pennsylvania, in the heart of Chester County. The borough is situated along the Schuylkill River, and is bordered by the townships of East Pikeland, West Pikeland, Schuylkill, and East Vincent. The borough covers an area of 4.2 square miles, and has a population density of 3,919 people per square mile.
The borough is located in the Piedmont region of Pennsylvania, and is characterized by rolling hills and valleys. The borough is home to several parks and recreational areas, including Reeves Park, Reeves Woods, and the Schuylkill River Trail.
Economy
The economy of Phoenixville is largely based on the service industry, with a variety of restaurants, retail stores, and other businesses located in the borough. The borough is also home to several manufacturing companies, including the Phoenixville Foundry, which produces steel products.
The borough is also home to several educational institutions, including the University of Valley Forge, Valley Forge Military Academy and College, and the Valley Forge Christian College.
Demographics
As of the 2010 census, the population of Phoenixville was 16,440. The racial makeup of the borough was 87.3% White, 5.7% African American, 0.3% Native American, 2.2% Asian, 0.1% Pacific Islander, and 4.4% from other races. The median household income was $50,945, and the median family income was $62,917.
Conclusion
Phoenixville is a vibrant borough with a rich history and a bright future. The borough is home to a variety of businesses, restaurants, and attractions, and is an important industrial center in southeastern Pennsylvania. The borough is also home to several educational institutions, and has a diverse population with a median household income of $50,945.
Common Questions
What is Per Capita Income in Phoenixville borough?
Per Capita income in Phoenixville borough is $50,290.
What is the Median Family Income in Phoenixville borough?
Median Family Income in Phoenixville borough is $115,835.
What is the Median Household income in Phoenixville borough?
Median Household Income in Phoenixville borough is $91,593.
What is Income or Wage Gap in Phoenixville borough?
Income or Wage Gap in Phoenixville borough is 22.2%.
Women in Phoenixville borough earn 77.8 cents for every dollar earned by a man.
What is Inequality or Gini Index in Phoenixville borough?
Inequality or Gini Index in Phoenixville borough is 0.39.
What is the Total Population of Phoenixville borough?
Total Population of Phoenixville borough is 18,723.
What is the Total Male Population of Phoenixville borough?
Total Male Population of Phoenixville borough is 10,123.
What is the Total Female Population of Phoenixville borough?
Total Female Population of Phoenixville borough is 8,600.
What is the Ratio of Males per 100 Females in Phoenixville borough?
There are 117.71 Males per 100 Females in Phoenixville borough.
What is the Ratio of Females per 100 Males in Phoenixville borough?
There are 84.96 Females per 100 Males in Phoenixville borough.
What is the Median Population Age in Phoenixville borough?
Median Population Age in Phoenixville borough is 34.8 Years.
What is the Average Family Size in Phoenixville borough
Average Family Size in Phoenixville borough is 2.9 People.
What is the Average Household Size in Phoenixville borough
Average Household Size in Phoenixville borough is 2.2 People.
How Large is the Labor Force in Phoenixville borough?
There are 12,159 People in the Labor Forcein in Phoenixville borough.
What is the Percentage of People in the Labor Force in Phoenixville borough?
77.9% of People are in the Labor Force in Phoenixville borough.
What is the Unemployment Rate in Phoenixville borough?
Unemployment Rate in Phoenixville borough is 3.5%.