Bakerstown, PA Map & Demographics
Bakerstown Map
Bakerstown Overview
$71,536
PER CAPITA INCOME
$231,429
AVG FAMILY INCOME
$155,865
AVG HOUSEHOLD INCOME
52.1%
WAGE / INCOME GAP [ % ]
47.9¢/ $1
WAGE / INCOME GAP [ $ ]
0.47
INEQUALITY / GINI INDEX
2,859
TOTAL POPULATION
1,267
MALE POPULATION
1,592
FEMALE POPULATION
79.59
MALES / 100 FEMALES
125.65
FEMALES / 100 MALES
42.5
MEDIAN AGE
3.3
AVG FAMILY SIZE
3.0
AVG HOUSEHOLD SIZE
1,482
LABOR FORCE [ PEOPLE ]
66.1%
PERCENT IN LABOR FORCE
Bakerstown Zip Codes
Bakerstown Area Codes
Income in Bakerstown
Income Overview in Bakerstown
Per Capita Income in Bakerstown is $71,536, while median incomes of families and households are $231,429 and $155,865 respectively.
| Characteristic | Number | Measure |
| Per Capita Income | 2,859 | $71,536 |
| Median Family Income | 698 | $231,429 |
| Mean Family Income | 698 | $261,280 |
| Median Household Income | 955 | $155,865 |
| Mean Household Income | 955 | $211,019 |
| Income Deficit | 698 | $0 |
| Wage / Income Gap (%) | 2,859 | 52.08% |
| Wage / Income Gap ($) | 2,859 | 47.92¢ per $1 |
| Gini / Inequality Index | 2,859 | 0.47 |
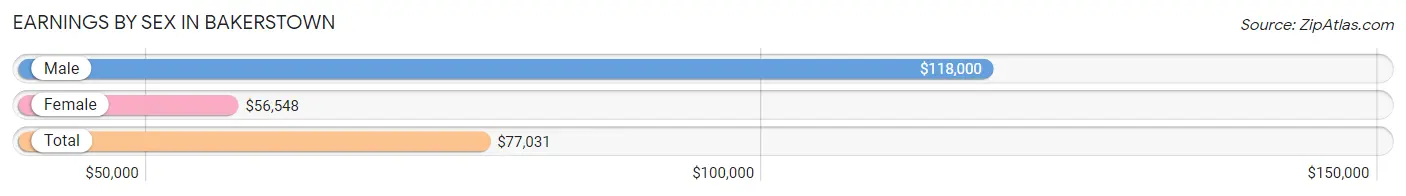
Earnings by Sex in Bakerstown
Average Earnings in Bakerstown are $77,031, $118,000 for men and $56,548 for women, a difference of 52.1%.
| Sex | Number | Average Earnings |
| Male | 820 (52.2%) | $118,000 |
| Female | 752 (47.8%) | $56,548 |
| Total | 1,572 (100.0%) | $77,031 |
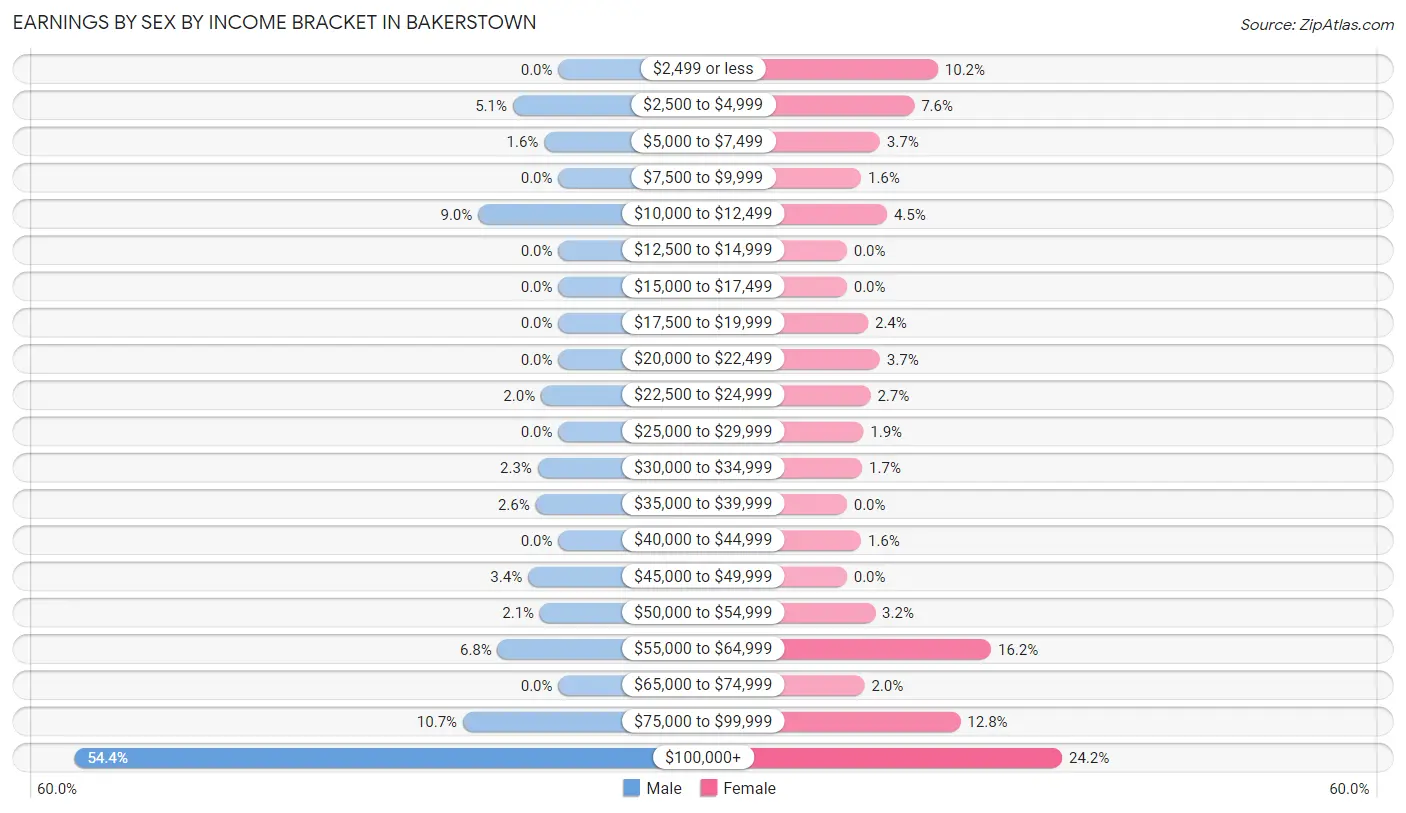
Earnings by Sex by Income Bracket in Bakerstown
The most common earnings brackets in Bakerstown are $100,000+ for men (446 | 54.4%) and $100,000+ for women (182 | 24.2%).
| Income | Male | Female |
| $2,499 or less | 0 (0.0%) | 77 (10.2%) |
| $2,500 to $4,999 | 42 (5.1%) | 57 (7.6%) |
| $5,000 to $7,499 | 13 (1.6%) | 28 (3.7%) |
| $7,500 to $9,999 | 0 (0.0%) | 12 (1.6%) |
| $10,000 to $12,499 | 74 (9.0%) | 34 (4.5%) |
| $12,500 to $14,999 | 0 (0.0%) | 0 (0.0%) |
| $15,000 to $17,499 | 0 (0.0%) | 0 (0.0%) |
| $17,500 to $19,999 | 0 (0.0%) | 18 (2.4%) |
| $20,000 to $22,499 | 0 (0.0%) | 28 (3.7%) |
| $22,500 to $24,999 | 16 (1.9%) | 20 (2.7%) |
| $25,000 to $29,999 | 0 (0.0%) | 14 (1.9%) |
| $30,000 to $34,999 | 19 (2.3%) | 13 (1.7%) |
| $35,000 to $39,999 | 21 (2.6%) | 0 (0.0%) |
| $40,000 to $44,999 | 0 (0.0%) | 12 (1.6%) |
| $45,000 to $49,999 | 28 (3.4%) | 0 (0.0%) |
| $50,000 to $54,999 | 17 (2.1%) | 24 (3.2%) |
| $55,000 to $64,999 | 56 (6.8%) | 122 (16.2%) |
| $65,000 to $74,999 | 0 (0.0%) | 15 (2.0%) |
| $75,000 to $99,999 | 88 (10.7%) | 96 (12.8%) |
| $100,000+ | 446 (54.4%) | 182 (24.2%) |
| Total | 820 (100.0%) | 752 (100.0%) |
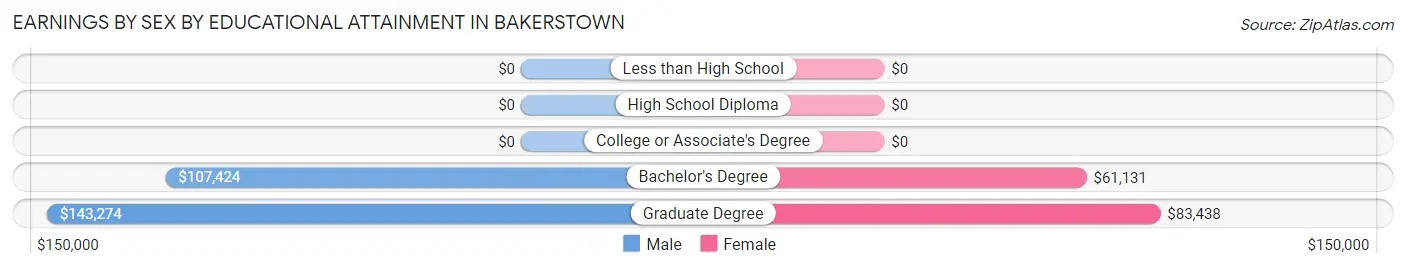
Earnings by Sex by Educational Attainment in Bakerstown
Average earnings in Bakerstown are $131,472 for men and $58,553 for women, a difference of 55.5%. Men with an educational attainment of graduate degree enjoy the highest average annual earnings of $143,274, while those with bachelor's degree education earn the least with $107,424. Women with an educational attainment of graduate degree earn the most with the average annual earnings of $83,438, while those with bachelor's degree education have the smallest earnings of $61,131.
| Educational Attainment | Male Income | Female Income |
| Less than High School | - | - |
| High School Diploma | - | - |
| College or Associate's Degree | - | - |
| Bachelor's Degree | $107,424 | $61,131 |
| Graduate Degree | $143,274 | $83,438 |
| Total | $131,472 | $58,553 |
Family Income in Bakerstown
Family Income Brackets in Bakerstown
According to the Bakerstown family income data, there are 408 families falling into the $200,000+ income range, which is the most common income bracket and makes up 58.5% of all families.
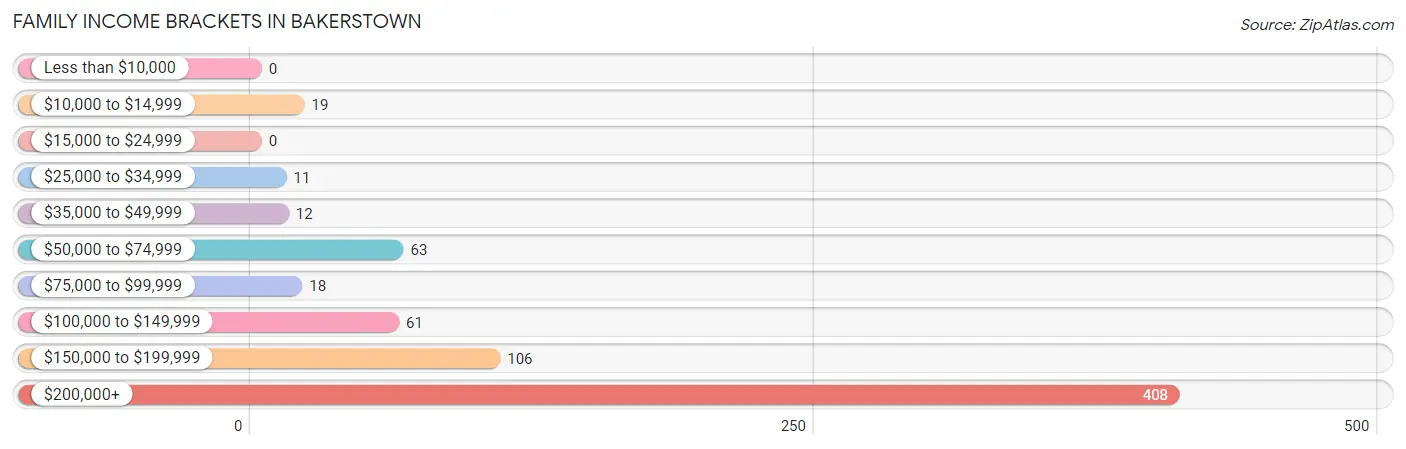
| Income Bracket | # Families | % Families |
| Less than $10,000 | 0 | 0.0% |
| $10,000 to $14,999 | 19 | 2.7% |
| $15,000 to $24,999 | 0 | 0.0% |
| $25,000 to $34,999 | 11 | 1.6% |
| $35,000 to $49,999 | 12 | 1.7% |
| $50,000 to $74,999 | 63 | 9.0% |
| $75,000 to $99,999 | 18 | 2.6% |
| $100,000 to $149,999 | 61 | 8.7% |
| $150,000 to $199,999 | 106 | 15.2% |
| $200,000+ | 408 | 58.5% |
Family Income by Famaliy Size in Bakerstown
3-person families (166 | 23.8%) account for the highest median family income in Bakerstown with $250,001 per family, while 2-person families (199 | 28.5%) have the highest median income of $117,542 per family member.
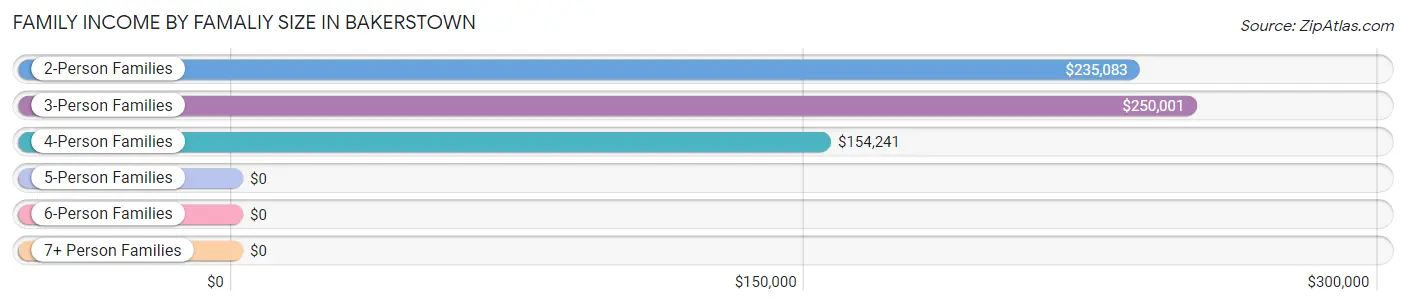
| Income Bracket | # Families | Median Income |
| 2-Person Families | 199 (28.5%) | $235,083 |
| 3-Person Families | 166 (23.8%) | $250,001 |
| 4-Person Families | 288 (41.3%) | $154,241 |
| 5-Person Families | 21 (3.0%) | $0 |
| 6-Person Families | 24 (3.4%) | $0 |
| 7+ Person Families | 0 (0.0%) | $0 |
| Total | 698 (100.0%) | $231,429 |
Family Income by Number of Earners in Bakerstown
The median family income in Bakerstown is $231,429, with families comprising 3+ earners (194) having the highest median family income of $250,001, while families with no earners (70) have the lowest median family income of $67,708, accounting for 27.8% and 10.0% of families, respectively.
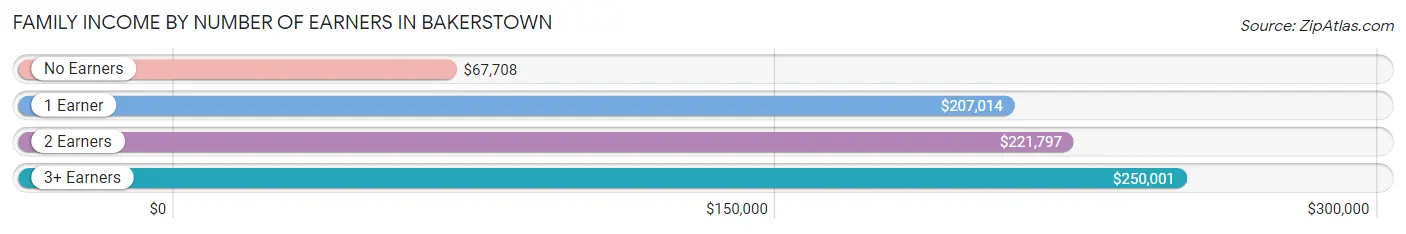
| Number of Earners | # Families | Median Income |
| No Earners | 70 (10.0%) | $67,708 |
| 1 Earner | 117 (16.8%) | $207,014 |
| 2 Earners | 317 (45.4%) | $221,797 |
| 3+ Earners | 194 (27.8%) | $250,001 |
| Total | 698 (100.0%) | $231,429 |
Household Income in Bakerstown
Household Income Brackets in Bakerstown
With 418 households falling in the category, the $200,000+ income range is the most frequent in Bakerstown, accounting for 43.8% of all households.
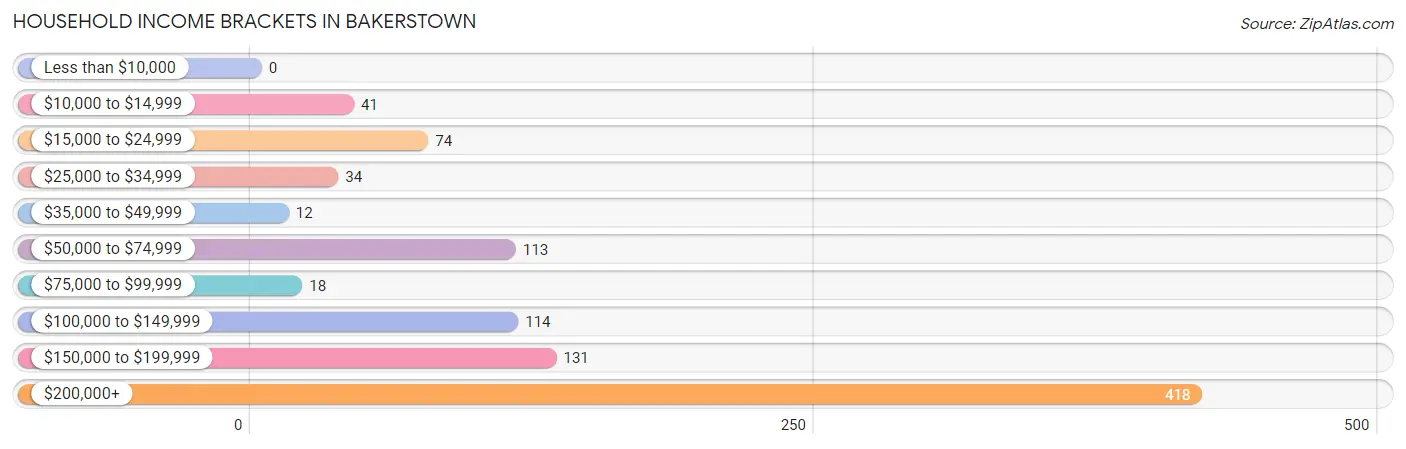
| Income Bracket | # Households | % Households |
| Less than $10,000 | 0 | 0.0% |
| $10,000 to $14,999 | 41 | 4.3% |
| $15,000 to $24,999 | 74 | 7.7% |
| $25,000 to $34,999 | 34 | 3.6% |
| $35,000 to $49,999 | 12 | 1.3% |
| $50,000 to $74,999 | 113 | 11.8% |
| $75,000 to $99,999 | 18 | 1.9% |
| $100,000 to $149,999 | 114 | 11.9% |
| $150,000 to $199,999 | 131 | 13.7% |
| $200,000+ | 418 | 43.8% |
Household Income by Householder Age in Bakerstown
The median household income in Bakerstown is $155,865, with the highest median household income of $250,001 found in the 45 to 64 years age bracket for the primary householder. A total of 374 households (39.2%) fall into this category.
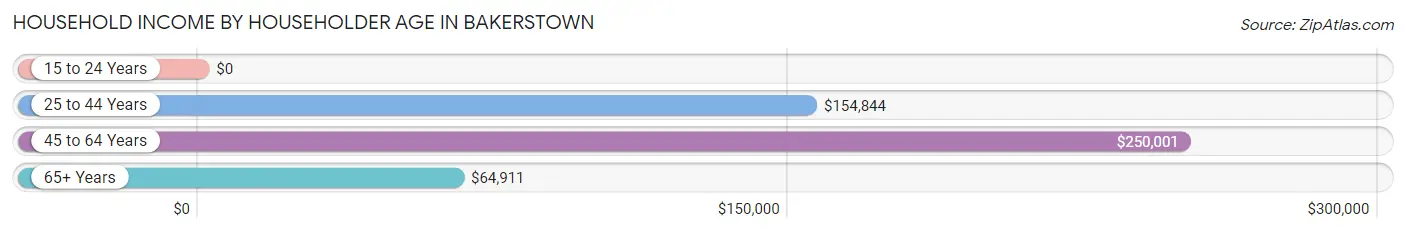
| Income Bracket | # Households | Median Income |
| 15 to 24 Years | 0 (0.0%) | $0 |
| 25 to 44 Years | 271 (28.4%) | $154,844 |
| 45 to 64 Years | 374 (39.2%) | $250,001 |
| 65+ Years | 310 (32.5%) | $64,911 |
| Total | 955 (100.0%) | $155,865 |
Poverty in Bakerstown
Income Below Poverty by Sex and Age in Bakerstown
With 2.4% poverty level for males and 16.7% for females among the residents of Bakerstown, 6 to 11 year old males and 75 year old and over females are the most vulnerable to poverty, with 17 males (40.5%) and 128 females (52.0%) in their respective age groups living below the poverty level.
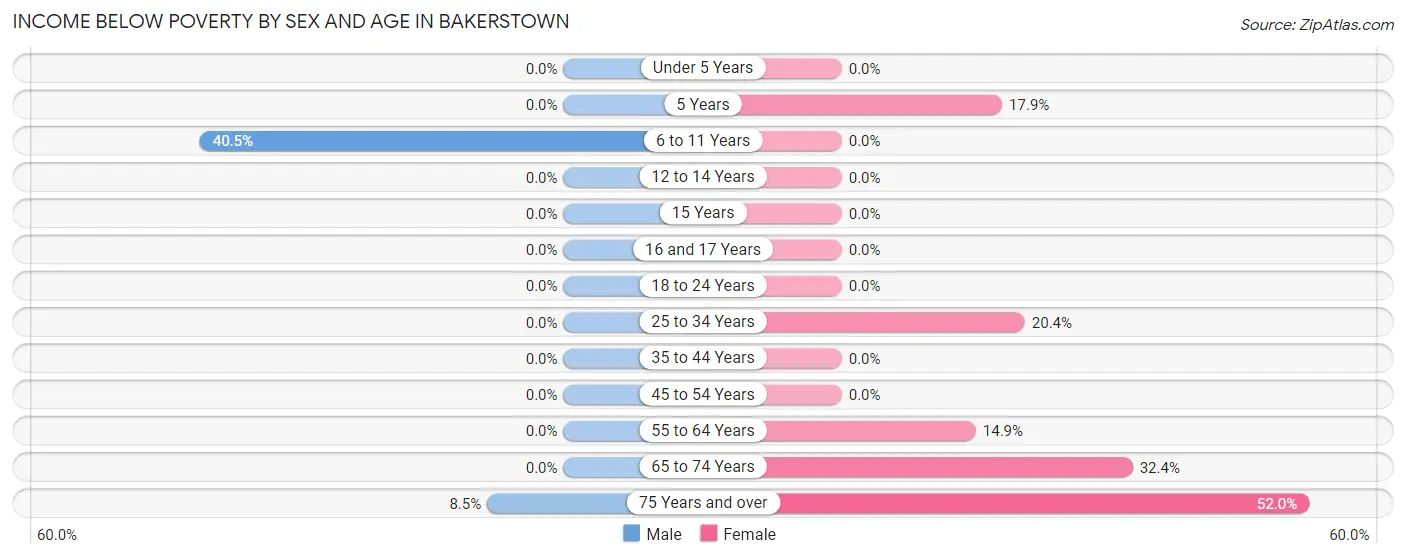
| Age Bracket | Male | Female |
| Under 5 Years | 0 (0.0%) | 0 (0.0%) |
| 5 Years | 0 (0.0%) | 15 (17.9%) |
| 6 to 11 Years | 17 (40.5%) | 0 (0.0%) |
| 12 to 14 Years | 0 (0.0%) | 0 (0.0%) |
| 15 Years | 0 (0.0%) | 0 (0.0%) |
| 16 and 17 Years | 0 (0.0%) | 0 (0.0%) |
| 18 to 24 Years | 0 (0.0%) | 0 (0.0%) |
| 25 to 34 Years | 0 (0.0%) | 21 (20.4%) |
| 35 to 44 Years | 0 (0.0%) | 0 (0.0%) |
| 45 to 54 Years | 0 (0.0%) | 0 (0.0%) |
| 55 to 64 Years | 0 (0.0%) | 43 (14.9%) |
| 65 to 74 Years | 0 (0.0%) | 58 (32.4%) |
| 75 Years and over | 13 (8.5%) | 128 (52.0%) |
| Total | 30 (2.4%) | 265 (16.7%) |
Income Above Poverty by Sex and Age in Bakerstown
According to the poverty statistics in Bakerstown, males aged under 5 years and females aged under 5 years are the age groups that are most secure financially, with 100.0% of males and 100.0% of females in these age groups living above the poverty line.
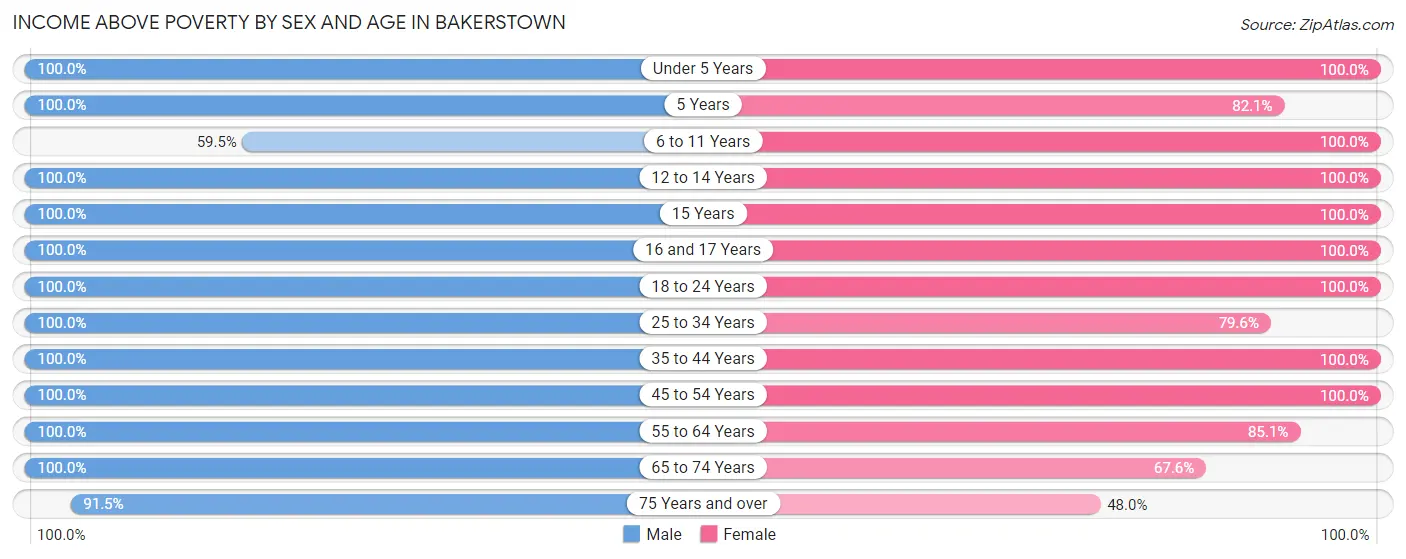
| Age Bracket | Male | Female |
| Under 5 Years | 124 (100.0%) | 98 (100.0%) |
| 5 Years | 16 (100.0%) | 69 (82.1%) |
| 6 to 11 Years | 25 (59.5%) | 143 (100.0%) |
| 12 to 14 Years | 45 (100.0%) | 22 (100.0%) |
| 15 Years | 23 (100.0%) | 20 (100.0%) |
| 16 and 17 Years | 66 (100.0%) | 40 (100.0%) |
| 18 to 24 Years | 99 (100.0%) | 40 (100.0%) |
| 25 to 34 Years | 104 (100.0%) | 82 (79.6%) |
| 35 to 44 Years | 198 (100.0%) | 209 (100.0%) |
| 45 to 54 Years | 175 (100.0%) | 120 (100.0%) |
| 55 to 64 Years | 172 (100.0%) | 245 (85.1%) |
| 65 to 74 Years | 50 (100.0%) | 121 (67.6%) |
| 75 Years and over | 140 (91.5%) | 118 (48.0%) |
| Total | 1,237 (97.6%) | 1,327 (83.4%) |
Income Below Poverty Among Married-Couple Families in Bakerstown
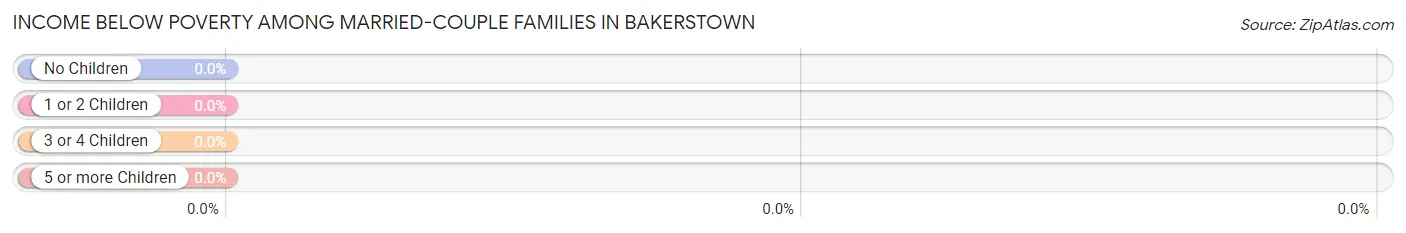
| Children | Above Poverty | Below Poverty |
| No Children | 271 (100.0%) | 0 (0.0%) |
| 1 or 2 Children | 298 (100.0%) | 0 (0.0%) |
| 3 or 4 Children | 45 (100.0%) | 0 (0.0%) |
| 5 or more Children | 0 (0.0%) | 0 (0.0%) |
| Total | 614 (100.0%) | 0 (0.0%) |
Income Below Poverty Among Single-Parent Households in Bakerstown
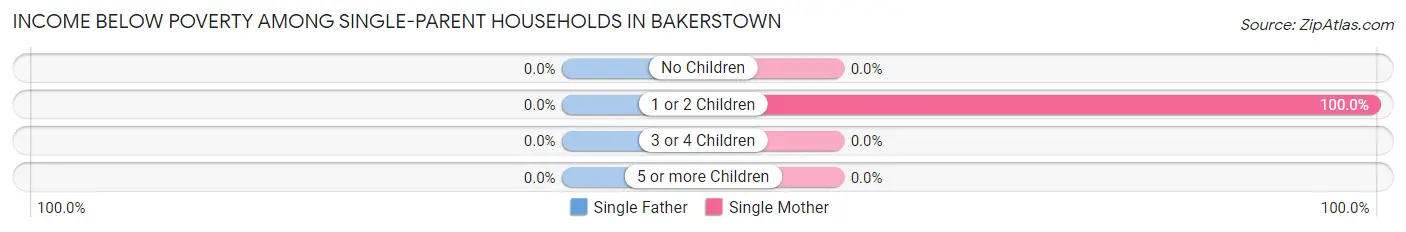
| Children | Single Father | Single Mother |
| No Children | 0 (0.0%) | 0 (0.0%) |
| 1 or 2 Children | 0 (0.0%) | 19 (100.0%) |
| 3 or 4 Children | 0 (0.0%) | 0 (0.0%) |
| 5 or more Children | 0 (0.0%) | 0 (0.0%) |
| Total | 0 (0.0%) | 19 (22.6%) |
Income Below Poverty Among Married-Couple vs Single-Parent Households in Bakerstown
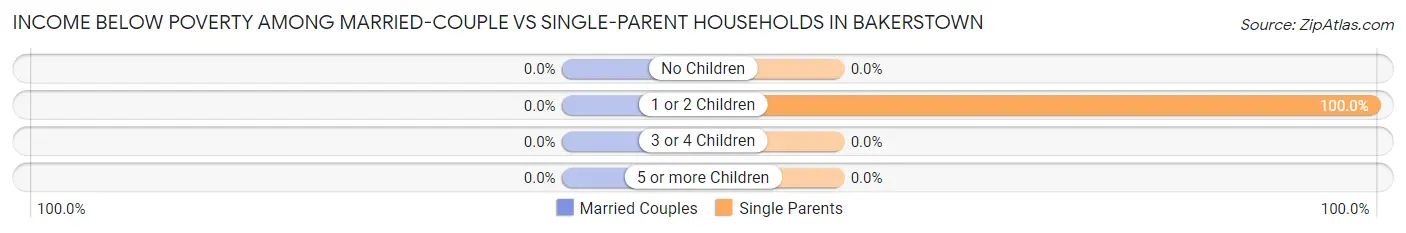
| Children | Married-Couple Families | Single-Parent Households |
| No Children | 0 (0.0%) | 0 (0.0%) |
| 1 or 2 Children | 0 (0.0%) | 19 (100.0%) |
| 3 or 4 Children | 0 (0.0%) | 0 (0.0%) |
| 5 or more Children | 0 (0.0%) | 0 (0.0%) |
| Total | 0 (0.0%) | 19 (22.6%) |
Race in Bakerstown
The most populous races in Bakerstown are White / Caucasian (2,466 | 86.3%), Asian (227 | 7.9%), and Two or more Races (144 | 5.0%).
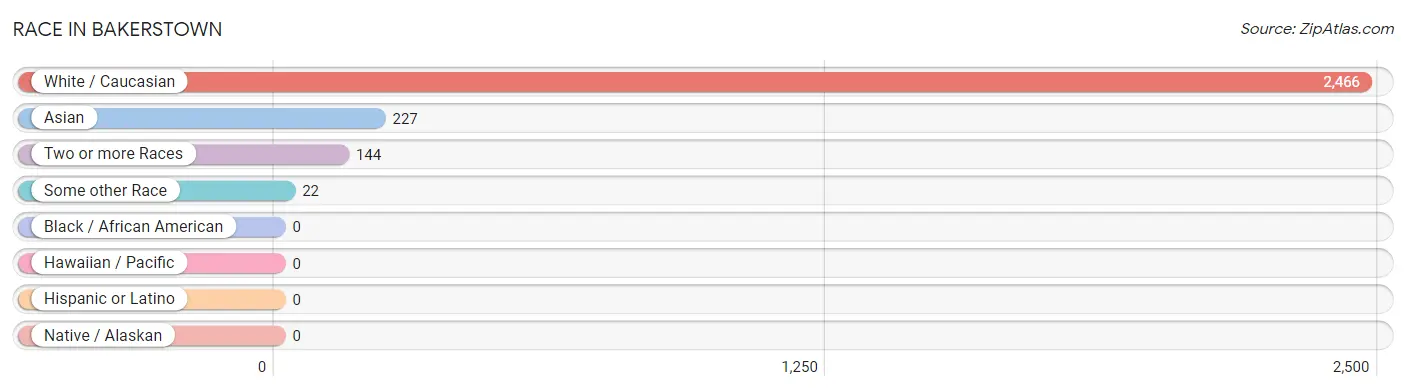
| Race | # Population | % Population |
| Asian | 227 | 7.9% |
| Black / African American | 0 | 0.0% |
| Hawaiian / Pacific | 0 | 0.0% |
| Hispanic or Latino | 0 | 0.0% |
| Native / Alaskan | 0 | 0.0% |
| White / Caucasian | 2,466 | 86.3% |
| Two or more Races | 144 | 5.0% |
| Some other Race | 22 | 0.8% |
| Total | 2,859 | 100.0% |
Ancestry in Bakerstown
The most populous ancestries reported in Bakerstown are German (757 | 26.5%), Irish (539 | 18.9%), Italian (468 | 16.4%), English (253 | 8.8%), and Polish (242 | 8.5%), together accounting for 79.0% of all Bakerstown residents.
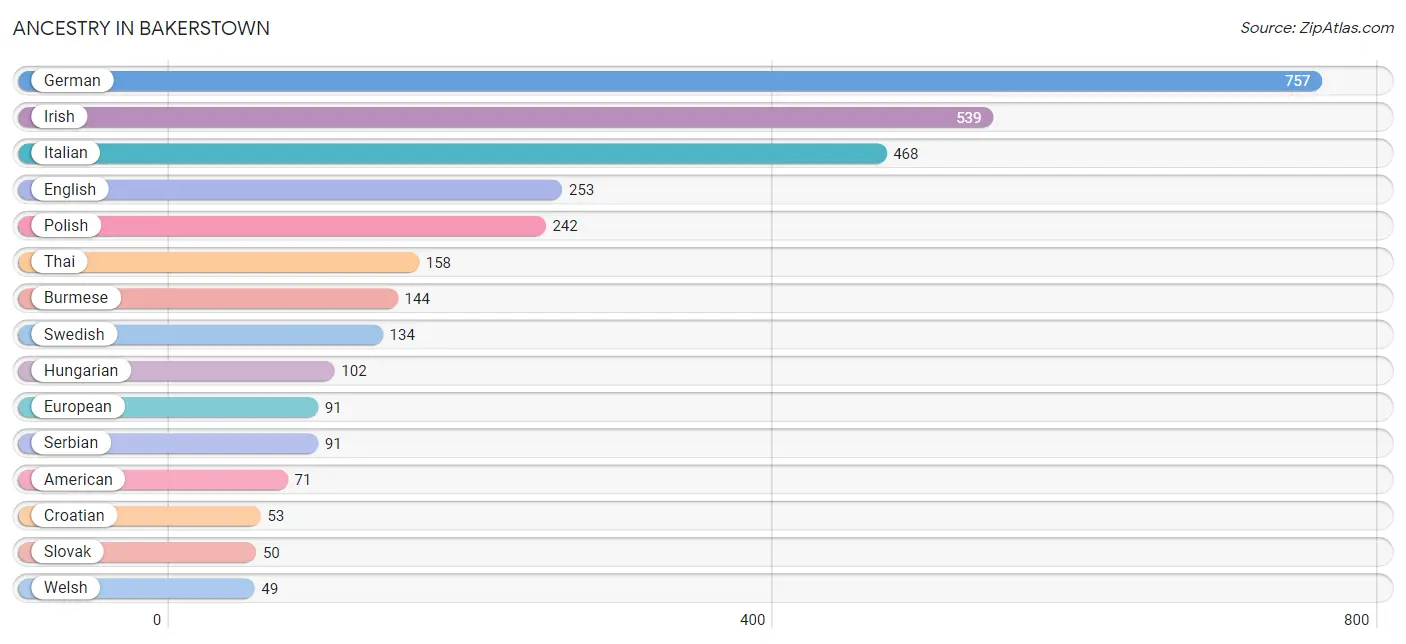
| Ancestry | # Population | % Population |
| American | 71 | 2.5% |
| British | 12 | 0.4% |
| Burmese | 144 | 5.0% |
| Croatian | 53 | 1.8% |
| Czech | 10 | 0.4% |
| Eastern European | 18 | 0.6% |
| English | 253 | 8.8% |
| European | 91 | 3.2% |
| Finnish | 22 | 0.8% |
| French | 39 | 1.4% |
| French Canadian | 22 | 0.8% |
| German | 757 | 26.5% |
| Greek | 24 | 0.8% |
| Hungarian | 102 | 3.6% |
| Indian (Asian) | 5 | 0.2% |
| Irish | 539 | 18.9% |
| Italian | 468 | 16.4% |
| Polish | 242 | 8.5% |
| Russian | 19 | 0.7% |
| Scotch-Irish | 29 | 1.0% |
| Scottish | 22 | 0.8% |
| Serbian | 91 | 3.2% |
| Slovak | 50 | 1.8% |
| Swedish | 134 | 4.7% |
| Swiss | 12 | 0.4% |
| Thai | 158 | 5.5% |
| Welsh | 49 | 1.7% | View All 27 Rows |
Immigrants in Bakerstown
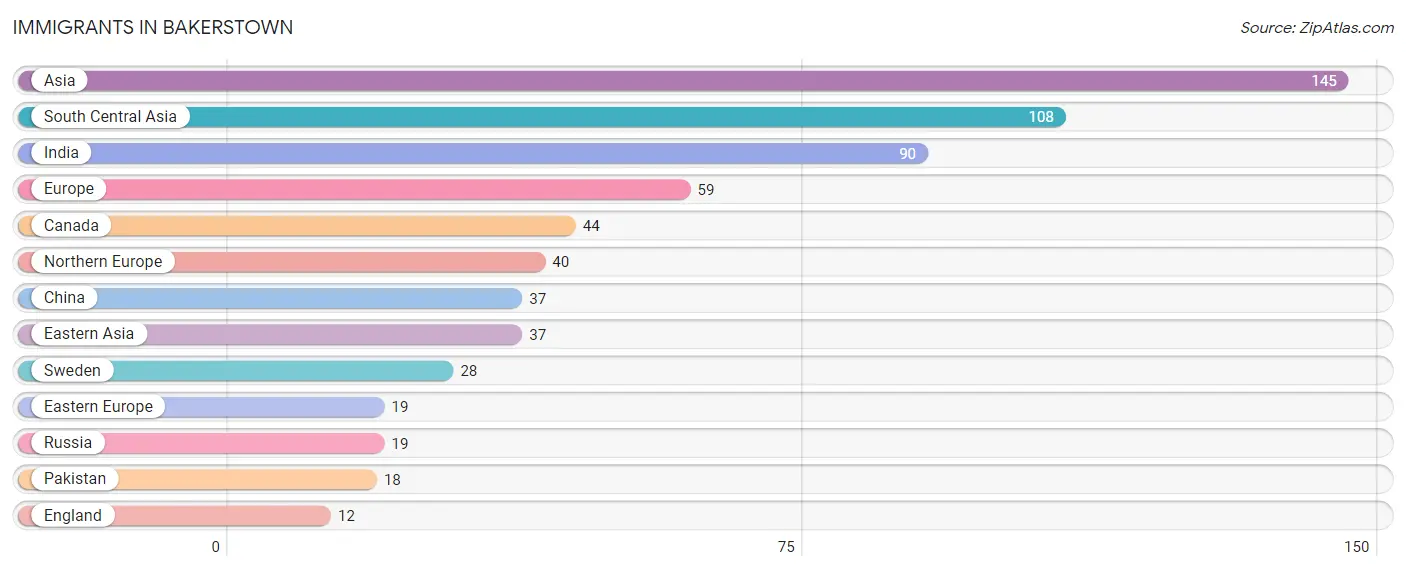
The most numerous immigrant groups reported in Bakerstown came from Asia (145 | 5.1%), South Central Asia (108 | 3.8%), India (90 | 3.2%), Europe (59 | 2.1%), and Canada (44 | 1.5%), together accounting for 15.6% of all Bakerstown residents.
| Immigration Origin | # Population | % Population |
| Asia | 145 | 5.1% |
| Canada | 44 | 1.5% |
| China | 37 | 1.3% |
| Eastern Asia | 37 | 1.3% |
| Eastern Europe | 19 | 0.7% |
| England | 12 | 0.4% |
| Europe | 59 | 2.1% |
| India | 90 | 3.2% |
| Northern Europe | 40 | 1.4% |
| Pakistan | 18 | 0.6% |
| Russia | 19 | 0.7% |
| South Central Asia | 108 | 3.8% |
| Sweden | 28 | 1.0% | View All 13 Rows |
Sex and Age in Bakerstown
Sex and Age in Bakerstown
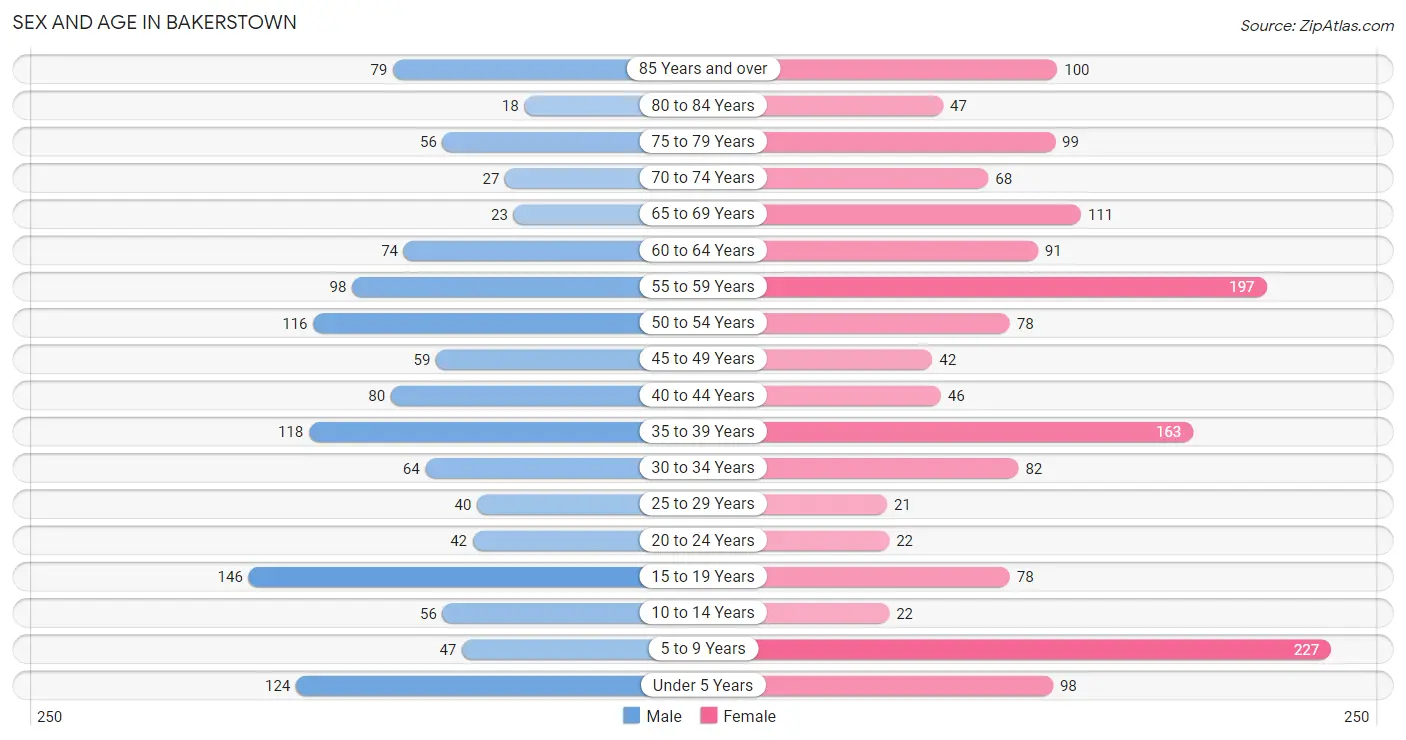
The most populous age groups in Bakerstown are 15 to 19 Years (146 | 11.5%) for men and 5 to 9 Years (227 | 14.3%) for women.
| Age Bracket | Male | Female |
| Under 5 Years | 124 (9.8%) | 98 (6.2%) |
| 5 to 9 Years | 47 (3.7%) | 227 (14.3%) |
| 10 to 14 Years | 56 (4.4%) | 22 (1.4%) |
| 15 to 19 Years | 146 (11.5%) | 78 (4.9%) |
| 20 to 24 Years | 42 (3.3%) | 22 (1.4%) |
| 25 to 29 Years | 40 (3.2%) | 21 (1.3%) |
| 30 to 34 Years | 64 (5.1%) | 82 (5.1%) |
| 35 to 39 Years | 118 (9.3%) | 163 (10.2%) |
| 40 to 44 Years | 80 (6.3%) | 46 (2.9%) |
| 45 to 49 Years | 59 (4.7%) | 42 (2.6%) |
| 50 to 54 Years | 116 (9.2%) | 78 (4.9%) |
| 55 to 59 Years | 98 (7.7%) | 197 (12.4%) |
| 60 to 64 Years | 74 (5.8%) | 91 (5.7%) |
| 65 to 69 Years | 23 (1.8%) | 111 (7.0%) |
| 70 to 74 Years | 27 (2.1%) | 68 (4.3%) |
| 75 to 79 Years | 56 (4.4%) | 99 (6.2%) |
| 80 to 84 Years | 18 (1.4%) | 47 (2.9%) |
| 85 Years and over | 79 (6.2%) | 100 (6.3%) |
| Total | 1,267 (100.0%) | 1,592 (100.0%) |
Families and Households in Bakerstown
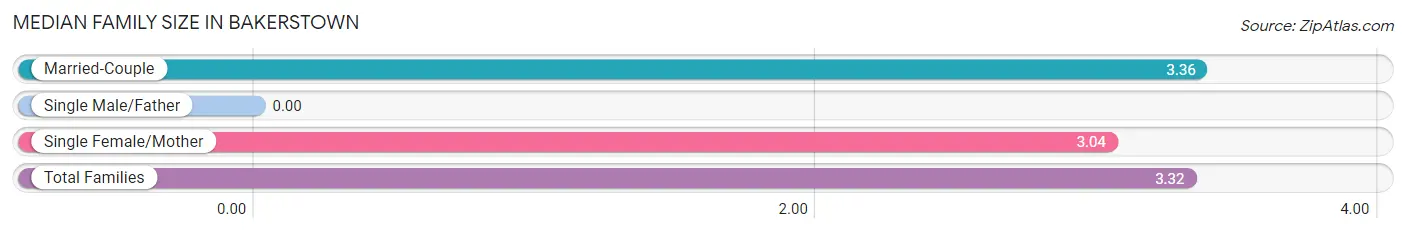
Median Family Size in Bakerstown
| Family Type | # Families | Family Size |
| Married-Couple | 614 (88.0%) | 3.36 |
| Single Male/Father | 0 (0.0%) | - |
| Single Female/Mother | 84 (12.0%) | 3.04 |
| Total Families | 698 (100.0%) | 3.32 |
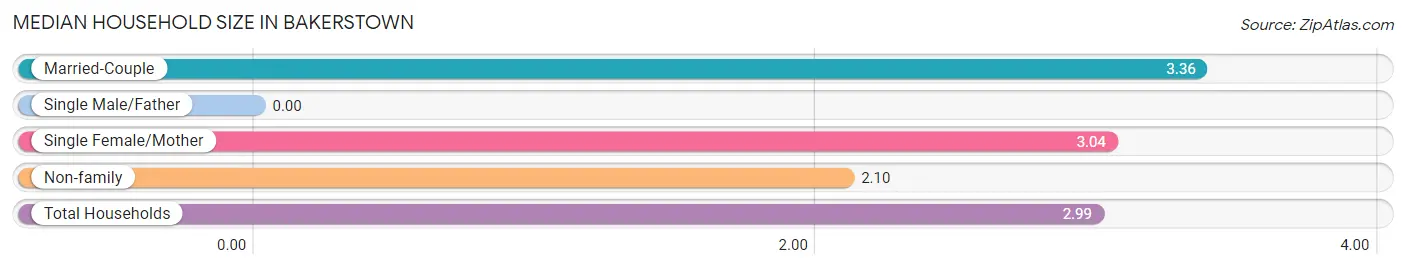
Median Household Size in Bakerstown
| Household Type | # Households | Household Size |
| Married-Couple | 614 (64.3%) | 3.36 |
| Single Male/Father | 0 (0.0%) | - |
| Single Female/Mother | 84 (8.8%) | 3.04 |
| Non-family | 257 (26.9%) | 2.10 |
| Total Households | 955 (100.0%) | 2.99 |
Household Size by Marriage Status in Bakerstown
Out of a total of 955 households in Bakerstown, 698 (73.1%) are family households, while 257 (26.9%) are nonfamily households. The most numerous type of family households are 4-person households, comprising 288, and the most common type of nonfamily households are 1-person households, comprising 189.
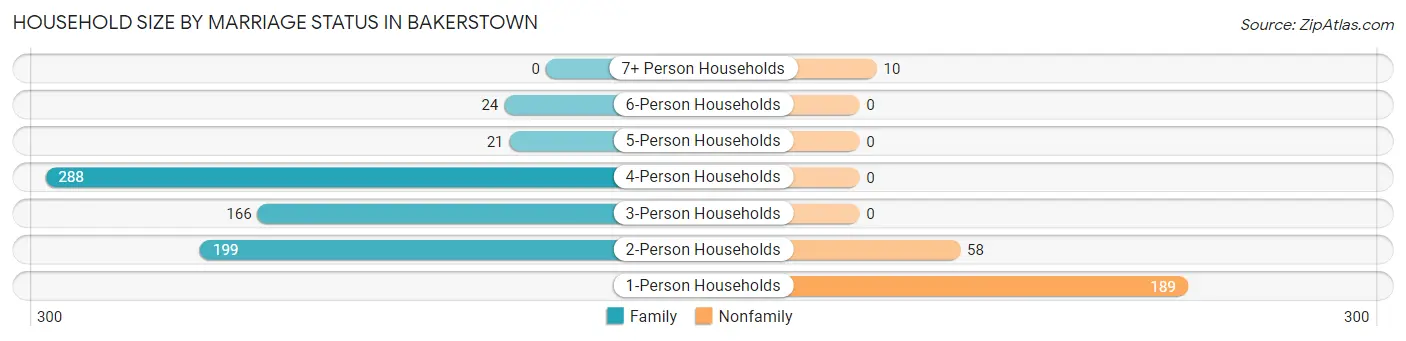
| Household Size | Family Households | Nonfamily Households |
| 1-Person Households | - | 189 (19.8%) |
| 2-Person Households | 199 (20.8%) | 58 (6.1%) |
| 3-Person Households | 166 (17.4%) | 0 (0.0%) |
| 4-Person Households | 288 (30.2%) | 0 (0.0%) |
| 5-Person Households | 21 (2.2%) | 0 (0.0%) |
| 6-Person Households | 24 (2.5%) | 0 (0.0%) |
| 7+ Person Households | 0 (0.0%) | 10 (1.1%) |
| Total | 698 (73.1%) | 257 (26.9%) |
Female Fertility in Bakerstown
Fertility by Age in Bakerstown
Average fertility rate in Bakerstown is 35.0 births per 1,000 women. Women in the age bracket of 35 to 50 years have the highest fertility rate with 60.0 births per 1,000 women. Women in the age bracket of 35 to 50 years acount for 100.0% of all women with births.
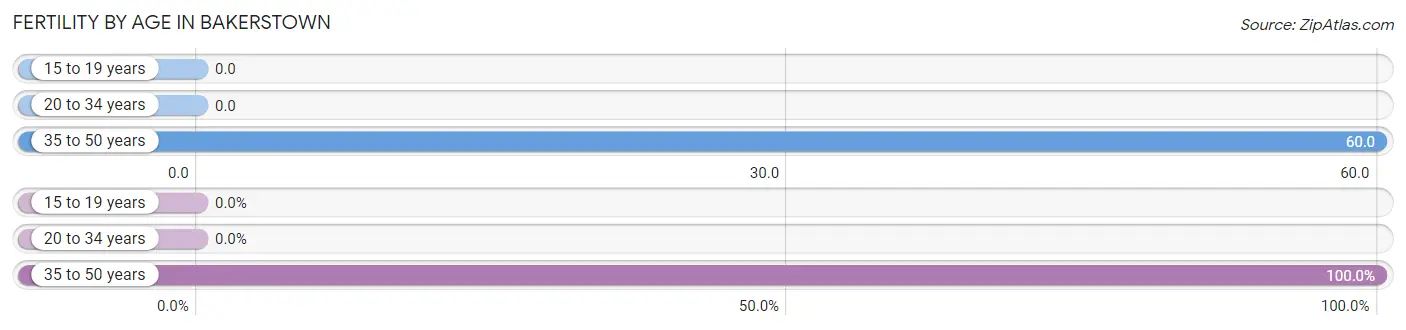
| Age Bracket | Women with Births | Births / 1,000 Women |
| 15 to 19 years | 0 (0.0%) | 0.0 |
| 20 to 34 years | 0 (0.0%) | 0.0 |
| 35 to 50 years | 17 (100.0%) | 60.0 |
| Total | 17 (100.0%) | 35.0 |
Fertility by Age by Marriage Status in Bakerstown
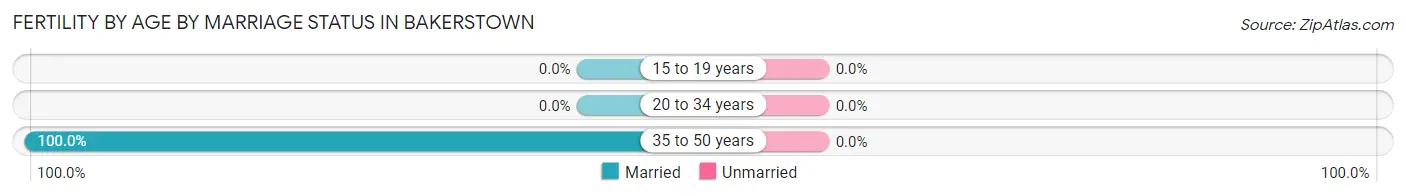
| Age Bracket | Married | Unmarried |
| 15 to 19 years | 0 (0.0%) | 0 (0.0%) |
| 20 to 34 years | 0 (0.0%) | 0 (0.0%) |
| 35 to 50 years | 17 (100.0%) | 0 (0.0%) |
| Total | 17 (100.0%) | 0 (0.0%) |
Fertility by Education in Bakerstown
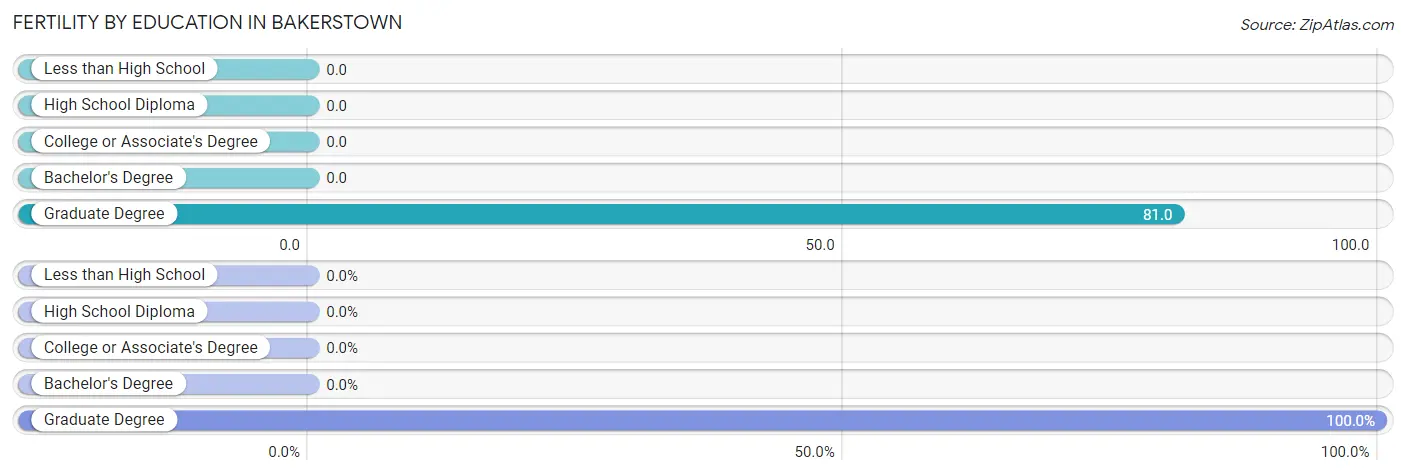
| Educational Attainment | Women with Births | Births / 1,000 Women |
| Less than High School | 0 (0.0%) | 0.0 |
| High School Diploma | 0 (0.0%) | 0.0 |
| College or Associate's Degree | 0 (0.0%) | 0.0 |
| Bachelor's Degree | 0 (0.0%) | 0.0 |
| Graduate Degree | 17 (100.0%) | 81.0 |
| Total | 17 (100.0%) | 35.0 |
Fertility by Education by Marriage Status in Bakerstown
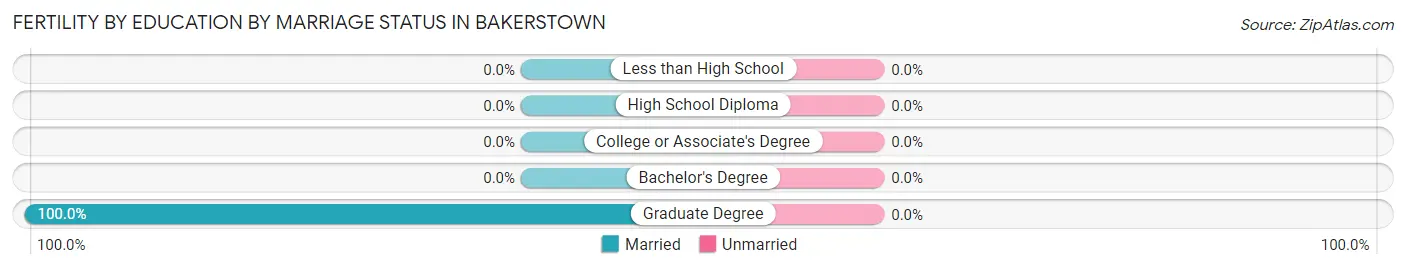
| Educational Attainment | Married | Unmarried |
| Less than High School | 0 (0.0%) | 0 (0.0%) |
| High School Diploma | 0 (0.0%) | 0 (0.0%) |
| College or Associate's Degree | 0 (0.0%) | 0 (0.0%) |
| Bachelor's Degree | 0 (0.0%) | 0 (0.0%) |
| Graduate Degree | 17 (100.0%) | 0 (0.0%) |
| Total | 17 (100.0%) | 0 (0.0%) |
Employment Characteristics in Bakerstown
Employment by Class of Employer in Bakerstown
Among the 1,483 employed individuals in Bakerstown, private company employees (1,117 | 75.3%), not-for-profit organizations (207 | 14.0%), and local government employees (63 | 4.3%) make up the most common classes of employment.
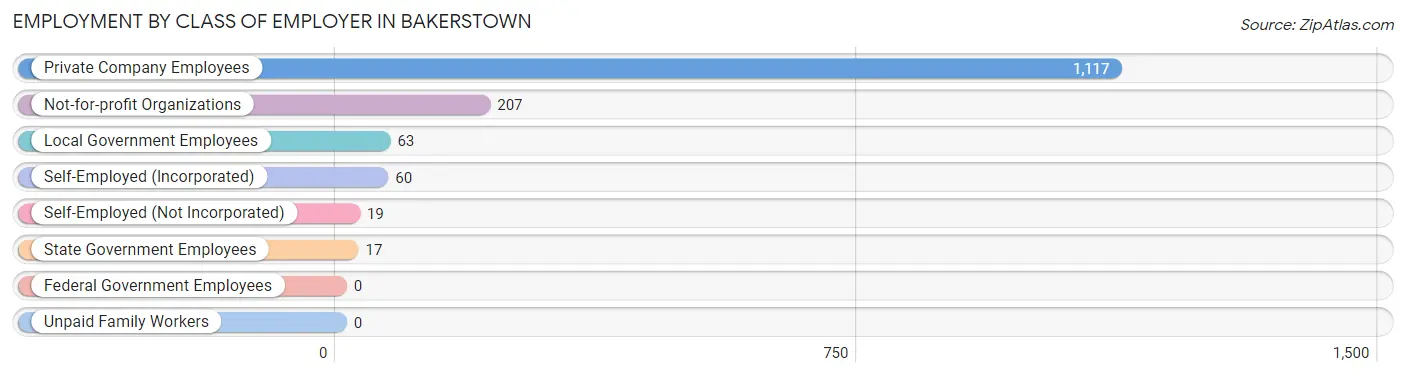
| Employer Class | # Employees | % Employees |
| Private Company Employees | 1,117 | 75.3% |
| Self-Employed (Incorporated) | 60 | 4.1% |
| Self-Employed (Not Incorporated) | 19 | 1.3% |
| Not-for-profit Organizations | 207 | 14.0% |
| Local Government Employees | 63 | 4.3% |
| State Government Employees | 17 | 1.1% |
| Federal Government Employees | 0 | 0.0% |
| Unpaid Family Workers | 0 | 0.0% |
| Total | 1,483 | 100.0% |
Employment Status by Age in Bakerstown
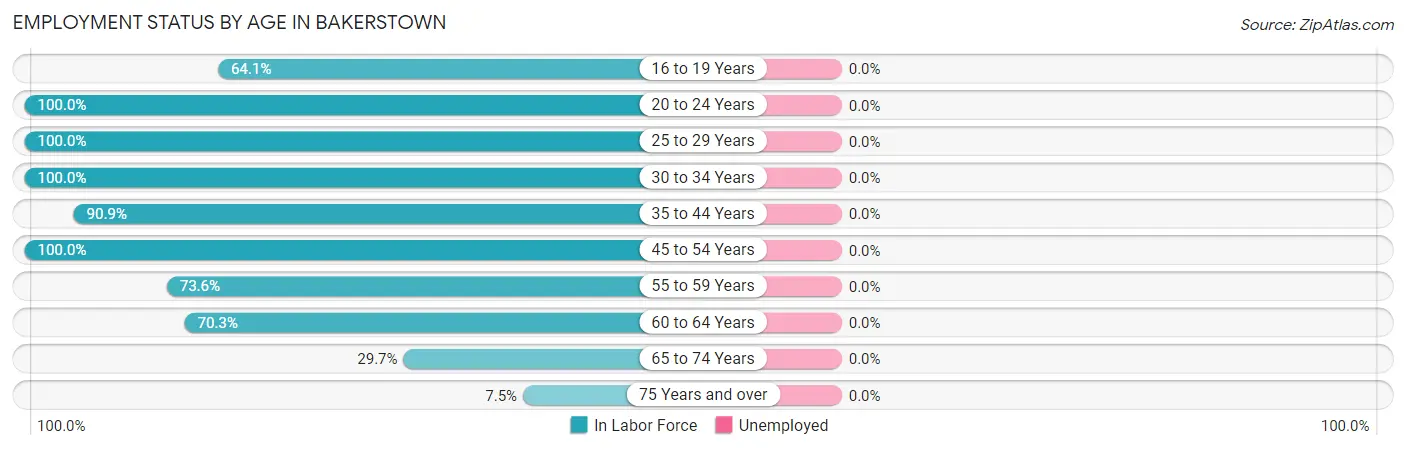
| Age Bracket | In Labor Force | Unemployed |
| 16 to 19 Years | 116 (64.1%) | 0 (0.0%) |
| 20 to 24 Years | 64 (100.0%) | 0 (0.0%) |
| 25 to 29 Years | 61 (100.0%) | 0 (0.0%) |
| 30 to 34 Years | 146 (100.0%) | 0 (0.0%) |
| 35 to 44 Years | 370 (90.9%) | 0 (0.0%) |
| 45 to 54 Years | 295 (100.0%) | 0 (0.0%) |
| 55 to 59 Years | 217 (73.6%) | 0 (0.0%) |
| 60 to 64 Years | 116 (70.3%) | 0 (0.0%) |
| 65 to 74 Years | 68 (29.7%) | 0 (0.0%) |
| 75 Years and over | 30 (7.5%) | 0 (0.0%) |
| Total | 1,482 (66.1%) | 0 (0.0%) |
Employment Status by Educational Attainment in Bakerstown
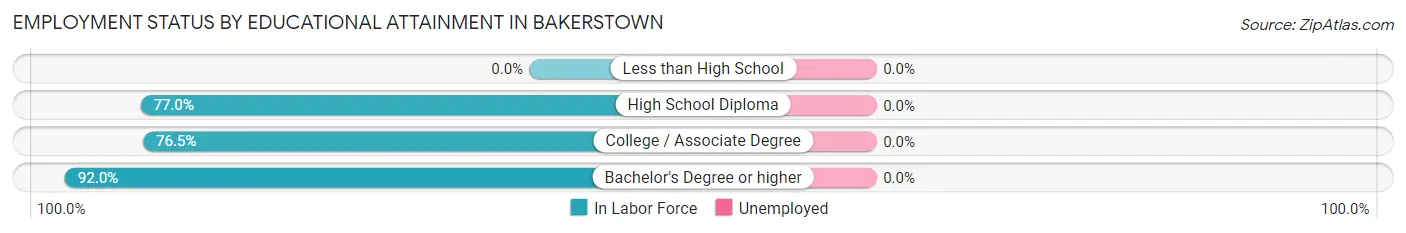
| Educational Attainment | In Labor Force | Unemployed |
| Less than High School | 0 (0.0%) | 0 (0.0%) |
| High School Diploma | 124 (77.0%) | 0 (0.0%) |
| College / Associate Degree | 150 (76.5%) | 0 (0.0%) |
| Bachelor's Degree or higher | 931 (92.0%) | 0 (0.0%) |
| Total | 1,205 (88.0%) | 0 (0.0%) |
Employment Occupations by Sex in Bakerstown
Management, Business, Science and Arts Occupations
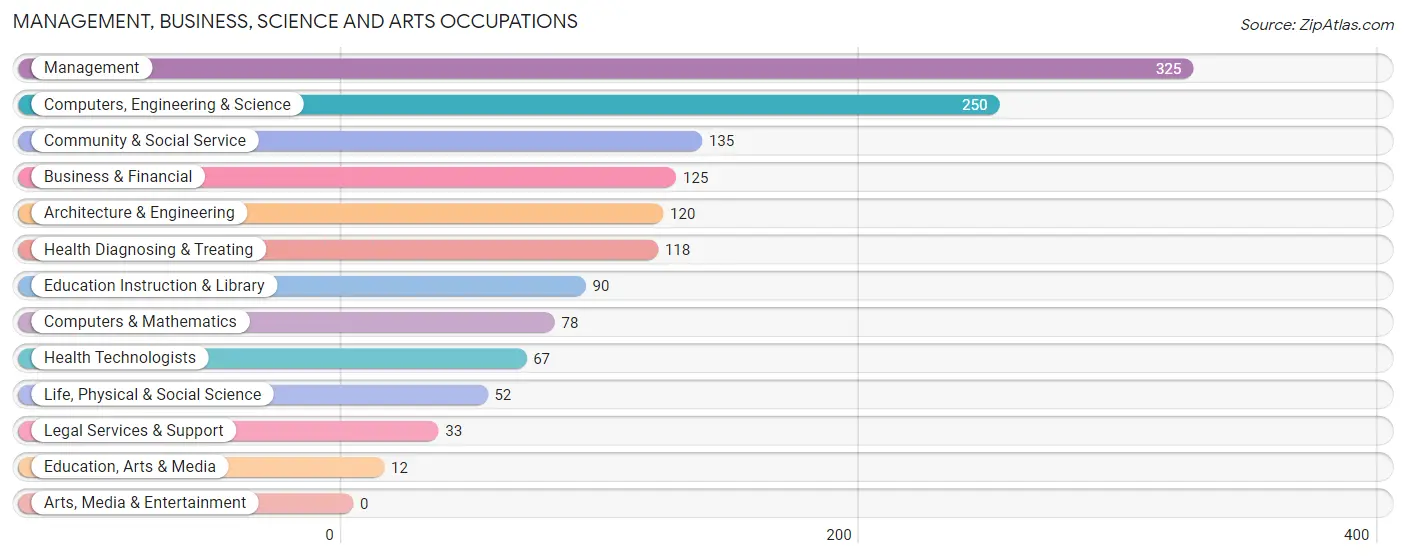
The most common Management, Business, Science and Arts occupations in Bakerstown are Management (325 | 21.9%), Computers, Engineering & Science (250 | 16.9%), Community & Social Service (135 | 9.1%), Business & Financial (125 | 8.4%), and Architecture & Engineering (120 | 8.1%).
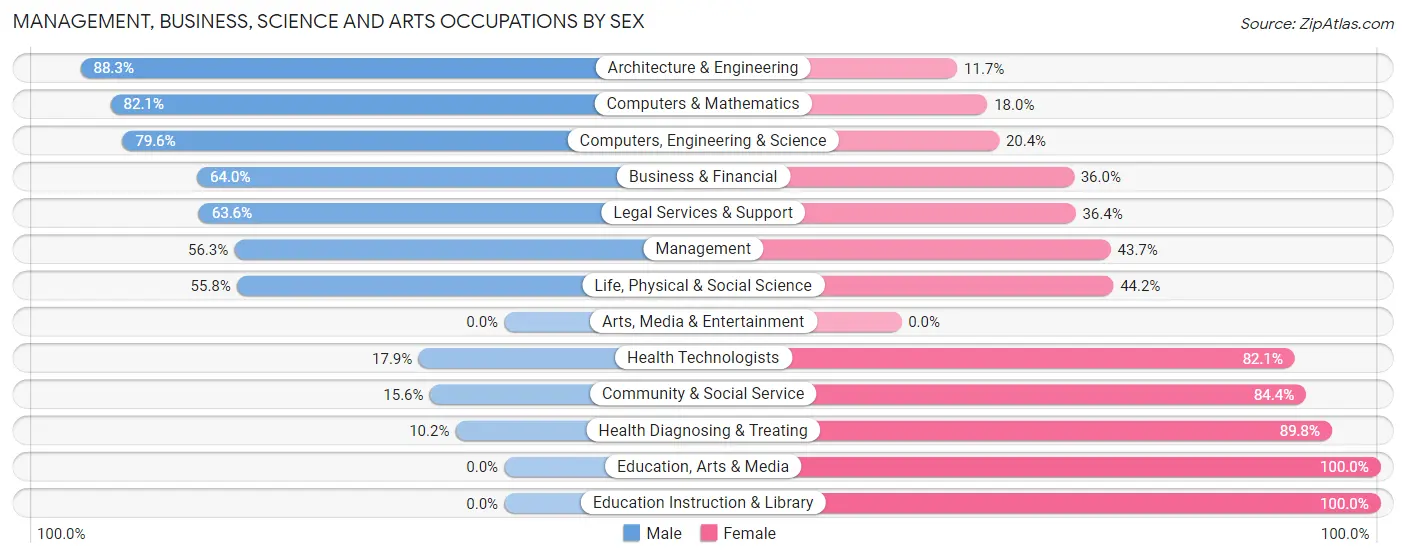
Management, Business, Science and Arts Occupations by Sex
Within the Management, Business, Science and Arts occupations in Bakerstown, the most male-oriented occupations are Architecture & Engineering (88.3%), Computers & Mathematics (82.1%), and Computers, Engineering & Science (79.6%), while the most female-oriented occupations are Education, Arts & Media (100.0%), Education Instruction & Library (100.0%), and Health Diagnosing & Treating (89.8%).
| Occupation | Male | Female |
| Management | 183 (56.3%) | 142 (43.7%) |
| Business & Financial | 80 (64.0%) | 45 (36.0%) |
| Computers, Engineering & Science | 199 (79.6%) | 51 (20.4%) |
| Computers & Mathematics | 64 (82.1%) | 14 (17.9%) |
| Architecture & Engineering | 106 (88.3%) | 14 (11.7%) |
| Life, Physical & Social Science | 29 (55.8%) | 23 (44.2%) |
| Community & Social Service | 21 (15.6%) | 114 (84.4%) |
| Education, Arts & Media | 0 (0.0%) | 12 (100.0%) |
| Legal Services & Support | 21 (63.6%) | 12 (36.4%) |
| Education Instruction & Library | 0 (0.0%) | 90 (100.0%) |
| Arts, Media & Entertainment | 0 (0.0%) | 0 (0.0%) |
| Health Diagnosing & Treating | 12 (10.2%) | 106 (89.8%) |
| Health Technologists | 12 (17.9%) | 55 (82.1%) |
| Total (Category) | 495 (51.9%) | 458 (48.1%) |
| Total (Overall) | 797 (53.7%) | 686 (46.3%) |
Services Occupations
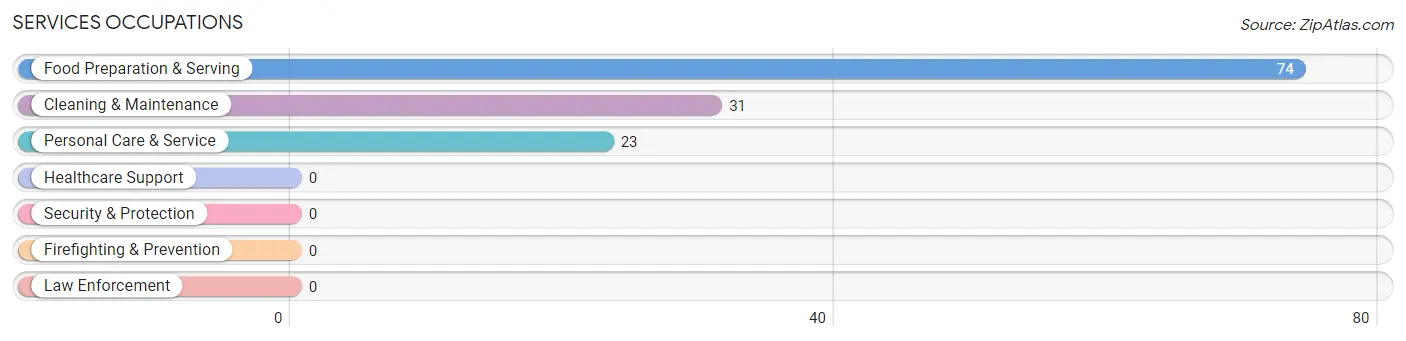
The most common Services occupations in Bakerstown are Food Preparation & Serving (74 | 5.0%), Cleaning & Maintenance (31 | 2.1%), and Personal Care & Service (23 | 1.5%).
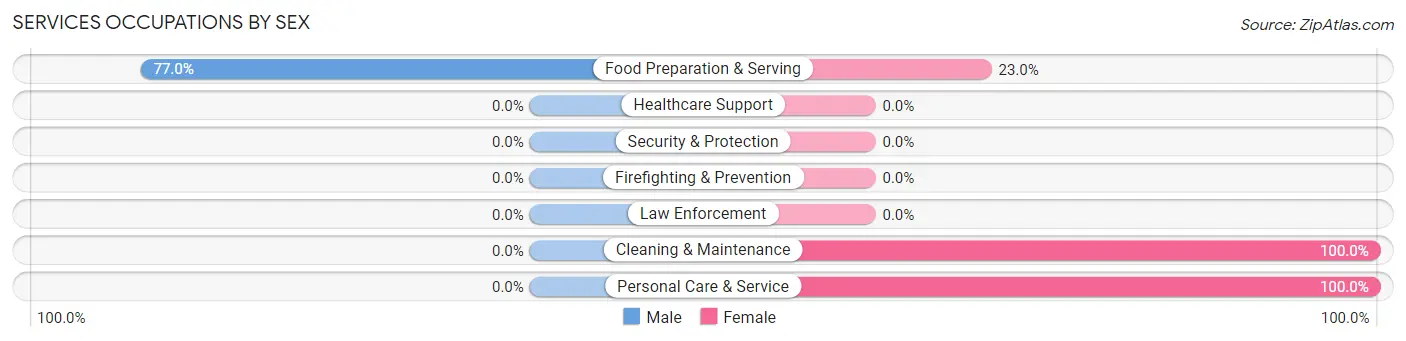
Services Occupations by Sex
| Occupation | Male | Female |
| Healthcare Support | 0 (0.0%) | 0 (0.0%) |
| Security & Protection | 0 (0.0%) | 0 (0.0%) |
| Firefighting & Prevention | 0 (0.0%) | 0 (0.0%) |
| Law Enforcement | 0 (0.0%) | 0 (0.0%) |
| Food Preparation & Serving | 57 (77.0%) | 17 (23.0%) |
| Cleaning & Maintenance | 0 (0.0%) | 31 (100.0%) |
| Personal Care & Service | 0 (0.0%) | 23 (100.0%) |
| Total (Category) | 57 (44.5%) | 71 (55.5%) |
| Total (Overall) | 797 (53.7%) | 686 (46.3%) |
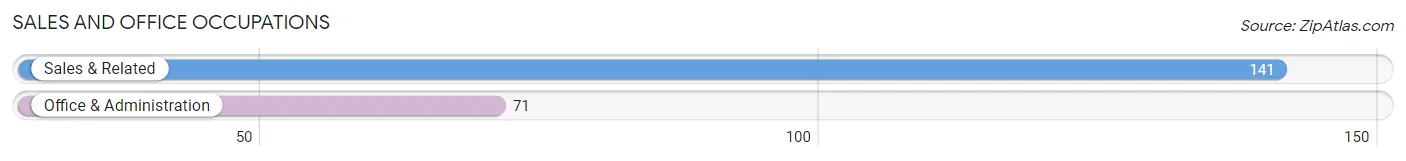
Sales and Office Occupations
The most common Sales and Office occupations in Bakerstown are Sales & Related (141 | 9.5%), and Office & Administration (71 | 4.8%).
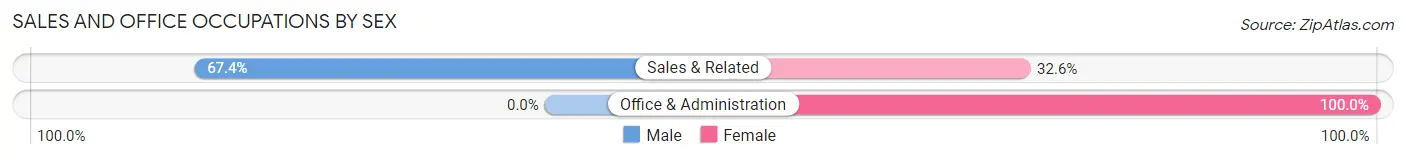
Sales and Office Occupations by Sex
| Occupation | Male | Female |
| Sales & Related | 95 (67.4%) | 46 (32.6%) |
| Office & Administration | 0 (0.0%) | 71 (100.0%) |
| Total (Category) | 95 (44.8%) | 117 (55.2%) |
| Total (Overall) | 797 (53.7%) | 686 (46.3%) |
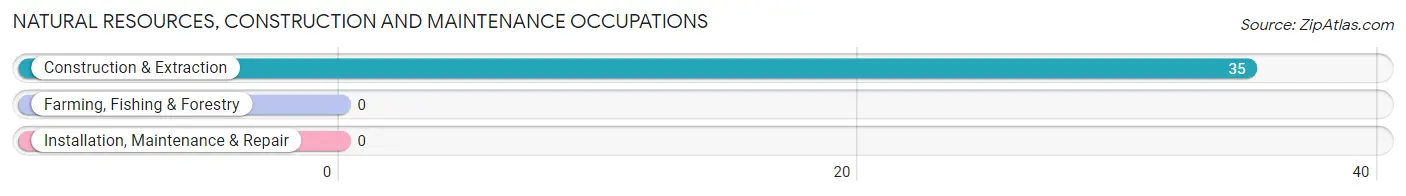
Natural Resources, Construction and Maintenance Occupations
The most common Natural Resources, Construction and Maintenance occupations in Bakerstown are , and Construction & Extraction (35 | 2.4%).
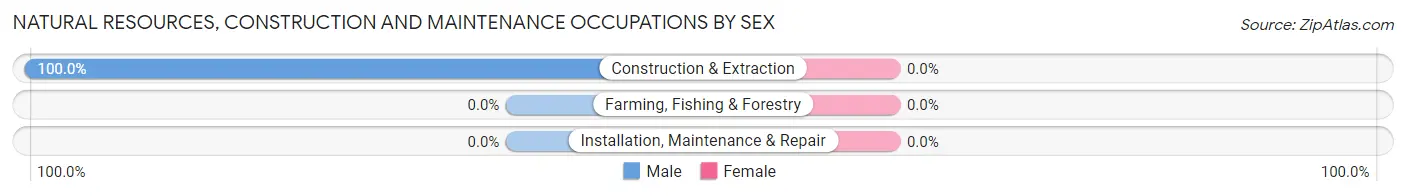
Natural Resources, Construction and Maintenance Occupations by Sex
| Occupation | Male | Female |
| Farming, Fishing & Forestry | 0 (0.0%) | 0 (0.0%) |
| Construction & Extraction | 35 (100.0%) | 0 (0.0%) |
| Installation, Maintenance & Repair | 0 (0.0%) | 0 (0.0%) |
| Total (Category) | 35 (100.0%) | 0 (0.0%) |
| Total (Overall) | 797 (53.7%) | 686 (46.3%) |
Production, Transportation and Moving Occupations
The most common Production, Transportation and Moving occupations in Bakerstown are Production (85 | 5.7%), Material Moving (57 | 3.8%), and Transportation (13 | 0.9%).
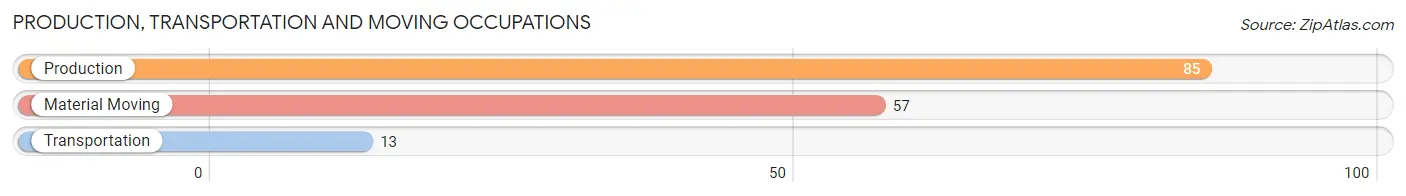
Production, Transportation and Moving Occupations by Sex
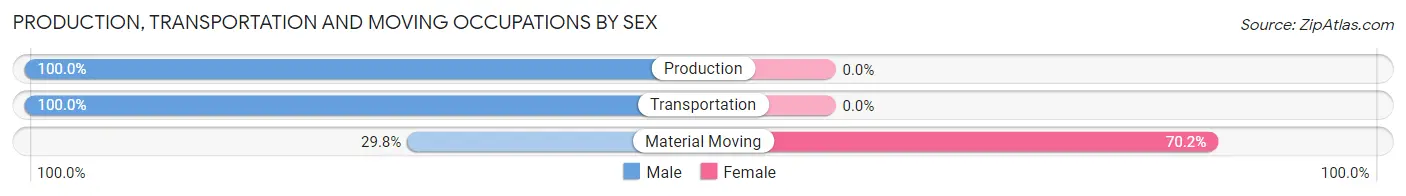
| Occupation | Male | Female |
| Production | 85 (100.0%) | 0 (0.0%) |
| Transportation | 13 (100.0%) | 0 (0.0%) |
| Material Moving | 17 (29.8%) | 40 (70.2%) |
| Total (Category) | 115 (74.2%) | 40 (25.8%) |
| Total (Overall) | 797 (53.7%) | 686 (46.3%) |
Employment Industries by Sex in Bakerstown
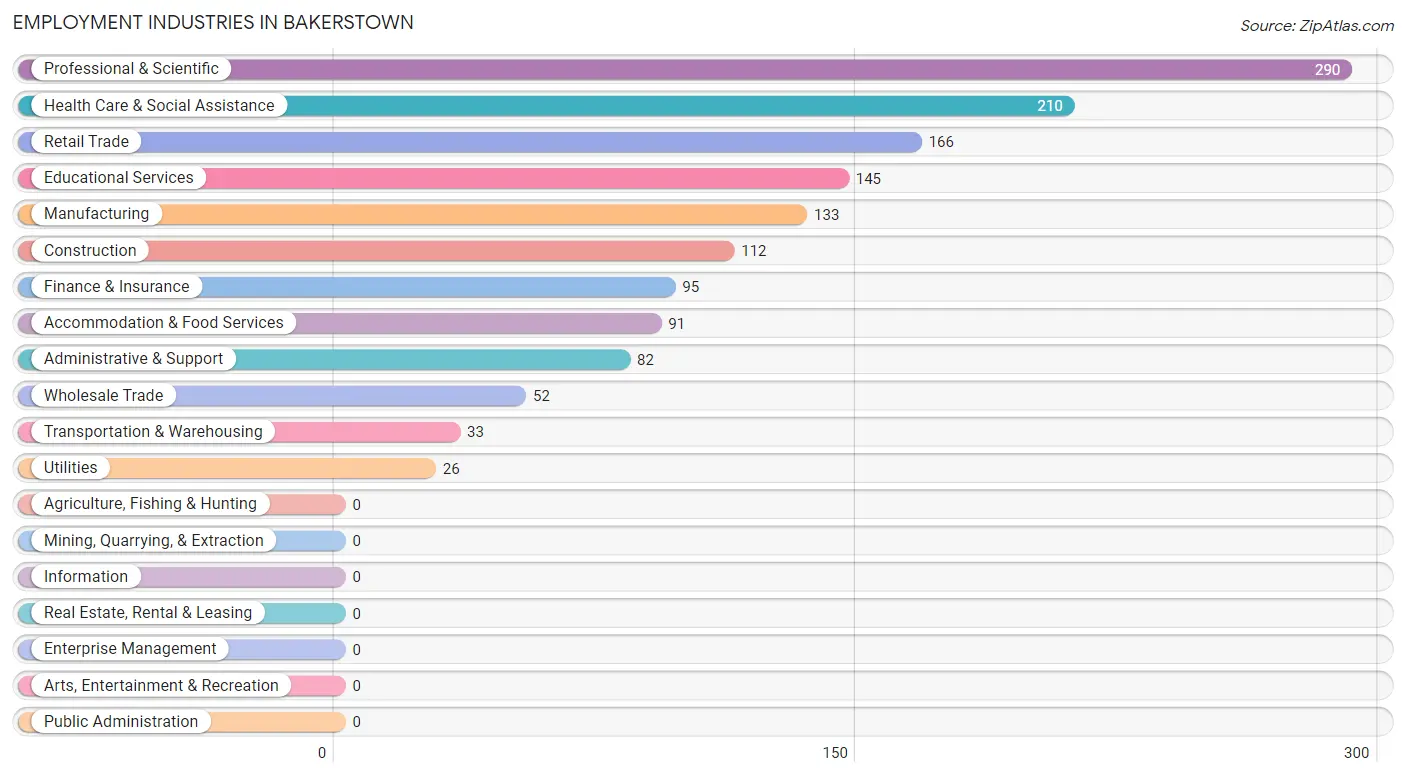
Employment Industries in Bakerstown
The major employment industries in Bakerstown include Professional & Scientific (290 | 19.6%), Health Care & Social Assistance (210 | 14.2%), Retail Trade (166 | 11.2%), Educational Services (145 | 9.8%), and Manufacturing (133 | 9.0%).
Employment Industries by Sex in Bakerstown
The Bakerstown industries that see more men than women are Professional & Scientific (87.2%), Construction (86.6%), and Manufacturing (84.2%), whereas the industries that tend to have a higher number of women are Health Care & Social Assistance (94.3%), Educational Services (86.9%), and Administrative & Support (69.5%).
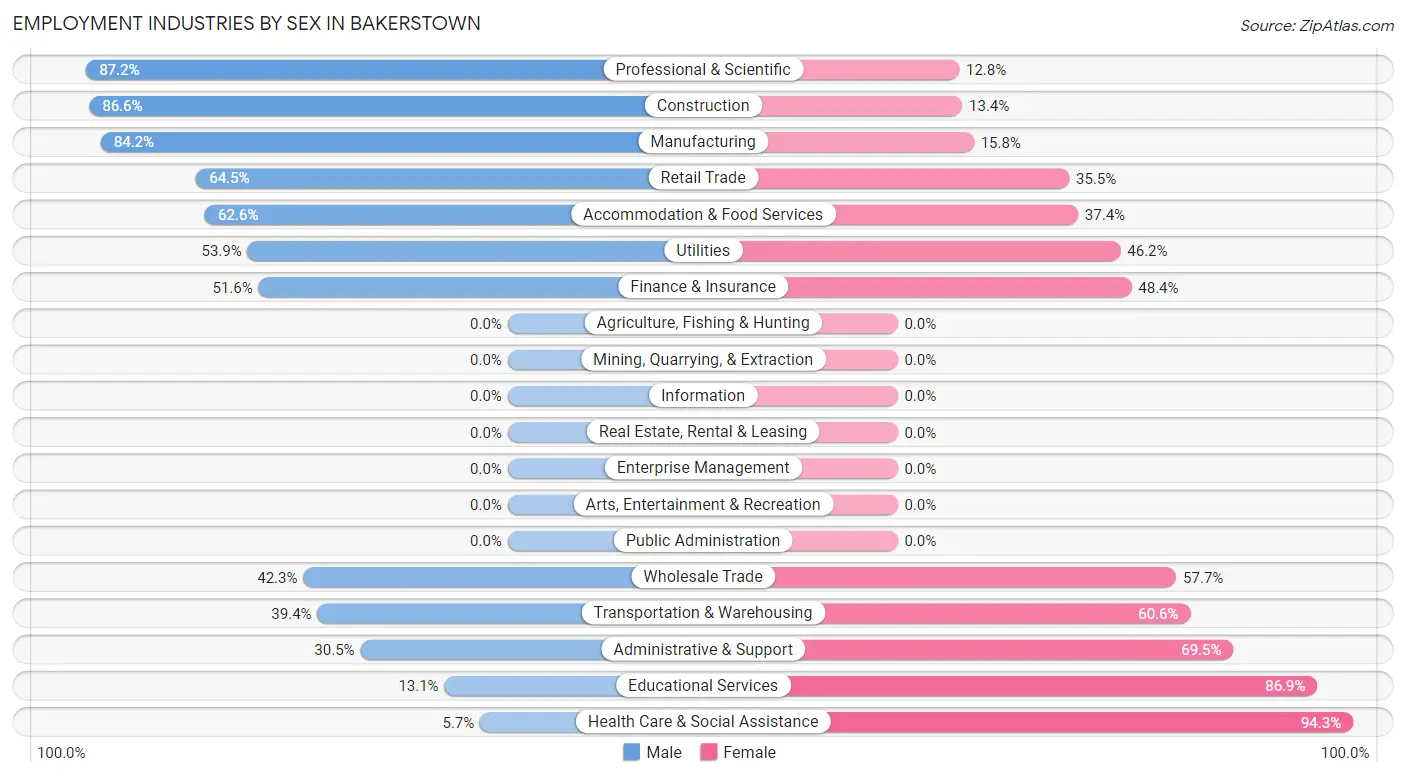
| Industry | Male | Female |
| Agriculture, Fishing & Hunting | 0 (0.0%) | 0 (0.0%) |
| Mining, Quarrying, & Extraction | 0 (0.0%) | 0 (0.0%) |
| Construction | 97 (86.6%) | 15 (13.4%) |
| Manufacturing | 112 (84.2%) | 21 (15.8%) |
| Wholesale Trade | 22 (42.3%) | 30 (57.7%) |
| Retail Trade | 107 (64.5%) | 59 (35.5%) |
| Transportation & Warehousing | 13 (39.4%) | 20 (60.6%) |
| Utilities | 14 (53.8%) | 12 (46.2%) |
| Information | 0 (0.0%) | 0 (0.0%) |
| Finance & Insurance | 49 (51.6%) | 46 (48.4%) |
| Real Estate, Rental & Leasing | 0 (0.0%) | 0 (0.0%) |
| Professional & Scientific | 253 (87.2%) | 37 (12.8%) |
| Enterprise Management | 0 (0.0%) | 0 (0.0%) |
| Administrative & Support | 25 (30.5%) | 57 (69.5%) |
| Educational Services | 19 (13.1%) | 126 (86.9%) |
| Health Care & Social Assistance | 12 (5.7%) | 198 (94.3%) |
| Arts, Entertainment & Recreation | 0 (0.0%) | 0 (0.0%) |
| Accommodation & Food Services | 57 (62.6%) | 34 (37.4%) |
| Public Administration | 0 (0.0%) | 0 (0.0%) |
| Total | 797 (53.7%) | 686 (46.3%) |
Education in Bakerstown
School Enrollment in Bakerstown
The most common levels of schooling among the 534 students in Bakerstown are high school (189 | 35.4%), elementary school (139 | 26.0%), and college / undergraduate (62 | 11.6%).
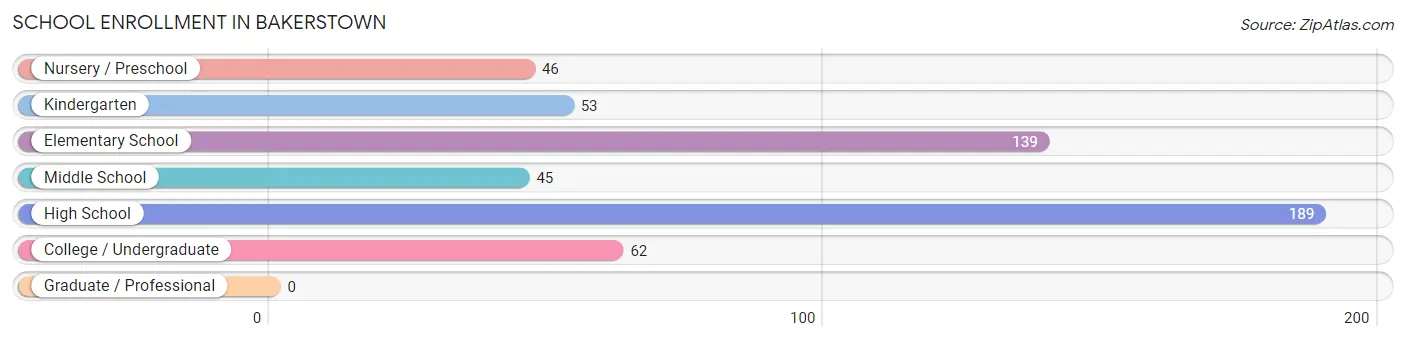
| School Level | # Students | % Students |
| Nursery / Preschool | 46 | 8.6% |
| Kindergarten | 53 | 9.9% |
| Elementary School | 139 | 26.0% |
| Middle School | 45 | 8.4% |
| High School | 189 | 35.4% |
| College / Undergraduate | 62 | 11.6% |
| Graduate / Professional | 0 | 0.0% |
| Total | 534 | 100.0% |
School Enrollment by Age by Funding Source in Bakerstown
Out of a total of 534 students who are enrolled in schools in Bakerstown, 134 (25.1%) attend a private institution, while the remaining 400 (74.9%) are enrolled in public schools. The age group of 18 to 19 year olds has the highest likelihood of being enrolled in private schools, with 57 (76.0% in the age bracket) enrolled. Conversely, the age group of 5 to 9 year old has the lowest likelihood of being enrolled in a private school, with 181 (100.0% in the age bracket) attending a public institution.
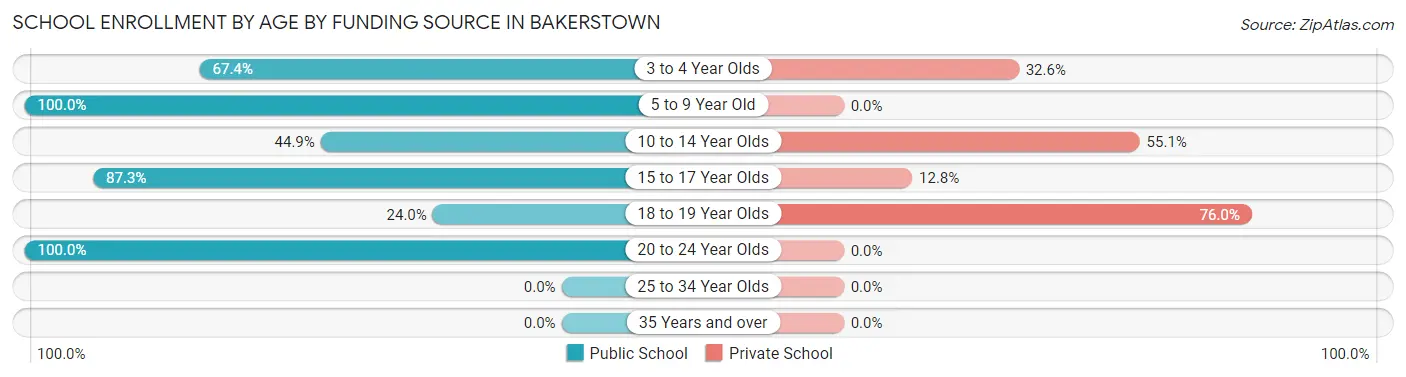
| Age Bracket | Public School | Private School |
| 3 to 4 Year Olds | 31 (67.4%) | 15 (32.6%) |
| 5 to 9 Year Old | 181 (100.0%) | 0 (0.0%) |
| 10 to 14 Year Olds | 35 (44.9%) | 43 (55.1%) |
| 15 to 17 Year Olds | 130 (87.3%) | 19 (12.8%) |
| 18 to 19 Year Olds | 18 (24.0%) | 57 (76.0%) |
| 20 to 24 Year Olds | 5 (100.0%) | 0 (0.0%) |
| 25 to 34 Year Olds | 0 (0.0%) | 0 (0.0%) |
| 35 Years and over | 0 (0.0%) | 0 (0.0%) |
| Total | 400 (74.9%) | 134 (25.1%) |
Educational Attainment by Field of Study in Bakerstown
Education (326 | 20.6%), science & technology (284 | 18.0%), engineering (186 | 11.8%), business (183 | 11.6%), and computers & mathematics (111 | 7.0%) are the most common fields of study among 1,580 individuals in Bakerstown who have obtained a bachelor's degree or higher.
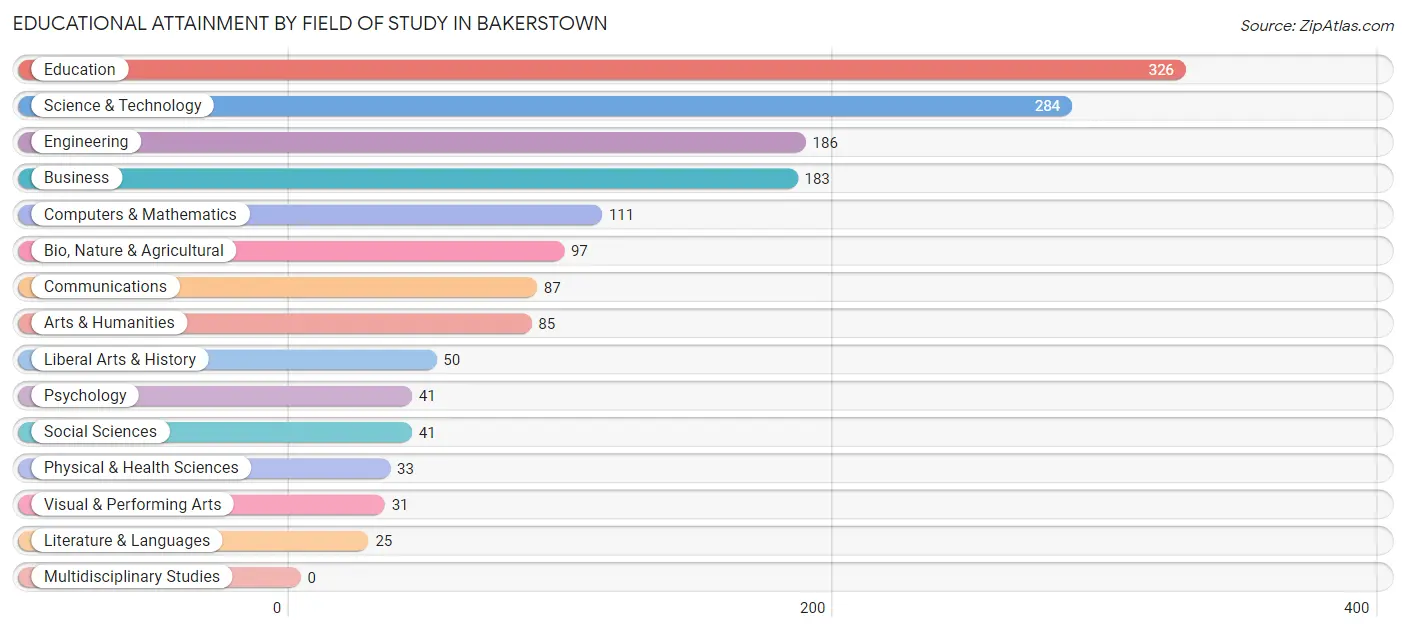
| Field of Study | # Graduates | % Graduates |
| Computers & Mathematics | 111 | 7.0% |
| Bio, Nature & Agricultural | 97 | 6.1% |
| Physical & Health Sciences | 33 | 2.1% |
| Psychology | 41 | 2.6% |
| Social Sciences | 41 | 2.6% |
| Engineering | 186 | 11.8% |
| Multidisciplinary Studies | 0 | 0.0% |
| Science & Technology | 284 | 18.0% |
| Business | 183 | 11.6% |
| Education | 326 | 20.6% |
| Literature & Languages | 25 | 1.6% |
| Liberal Arts & History | 50 | 3.2% |
| Visual & Performing Arts | 31 | 2.0% |
| Communications | 87 | 5.5% |
| Arts & Humanities | 85 | 5.4% |
| Total | 1,580 | 100.0% |
Transportation & Commute in Bakerstown
Vehicle Availability by Sex in Bakerstown
The most prevalent vehicle ownership categories in Bakerstown are males with 2 vehicles (351, accounting for 44.0%) and females with 2 vehicles (341, making up 51.2%).
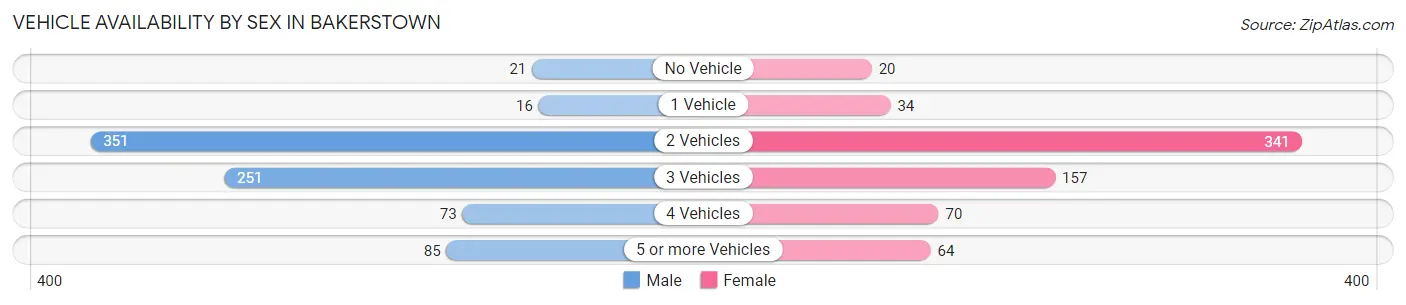
| Vehicles Available | Male | Female |
| No Vehicle | 21 (2.6%) | 20 (2.9%) |
| 1 Vehicle | 16 (2.0%) | 34 (5.0%) |
| 2 Vehicles | 351 (44.0%) | 341 (49.7%) |
| 3 Vehicles | 251 (31.5%) | 157 (22.9%) |
| 4 Vehicles | 73 (9.2%) | 70 (10.2%) |
| 5 or more Vehicles | 85 (10.7%) | 64 (9.3%) |
| Total | 797 (100.0%) | 686 (100.0%) |
Commute Time in Bakerstown
The most frequently occuring commute durations in Bakerstown are 45 to 59 minutes (272 commuters, 23.0%), 40 to 44 minutes (185 commuters, 15.7%), and 30 to 34 minutes (183 commuters, 15.5%).
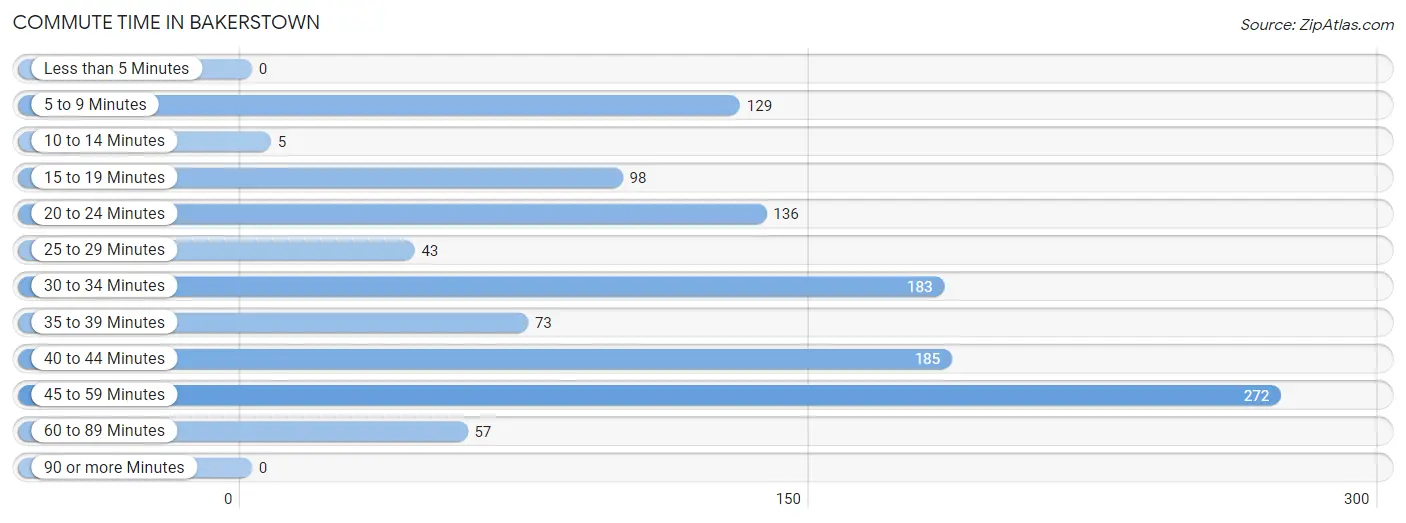
| Commute Time | # Commuters | % Commuters |
| Less than 5 Minutes | 0 | 0.0% |
| 5 to 9 Minutes | 129 | 10.9% |
| 10 to 14 Minutes | 5 | 0.4% |
| 15 to 19 Minutes | 98 | 8.3% |
| 20 to 24 Minutes | 136 | 11.5% |
| 25 to 29 Minutes | 43 | 3.6% |
| 30 to 34 Minutes | 183 | 15.5% |
| 35 to 39 Minutes | 73 | 6.2% |
| 40 to 44 Minutes | 185 | 15.7% |
| 45 to 59 Minutes | 272 | 23.0% |
| 60 to 89 Minutes | 57 | 4.8% |
| 90 or more Minutes | 0 | 0.0% |
Commute Time by Sex in Bakerstown
The most common commute times in Bakerstown are 45 to 59 minutes (165 commuters, 25.7%) for males and 45 to 59 minutes (107 commuters, 19.9%) for females.
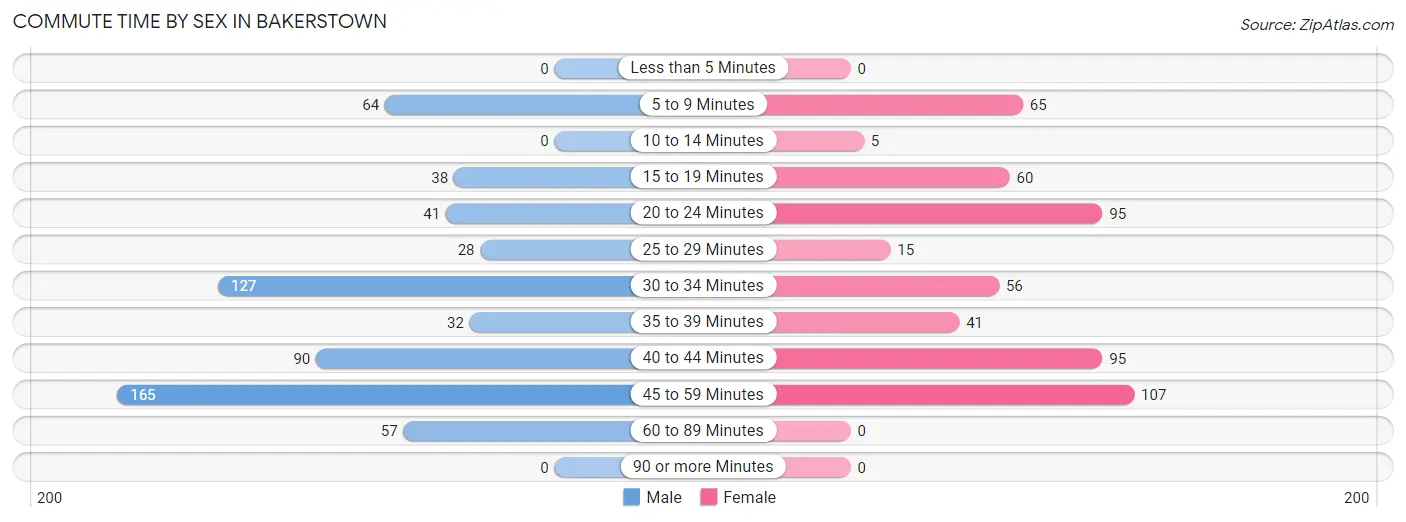
| Commute Time | Male | Female |
| Less than 5 Minutes | 0 (0.0%) | 0 (0.0%) |
| 5 to 9 Minutes | 64 (10.0%) | 65 (12.1%) |
| 10 to 14 Minutes | 0 (0.0%) | 5 (0.9%) |
| 15 to 19 Minutes | 38 (5.9%) | 60 (11.1%) |
| 20 to 24 Minutes | 41 (6.4%) | 95 (17.6%) |
| 25 to 29 Minutes | 28 (4.4%) | 15 (2.8%) |
| 30 to 34 Minutes | 127 (19.8%) | 56 (10.4%) |
| 35 to 39 Minutes | 32 (5.0%) | 41 (7.6%) |
| 40 to 44 Minutes | 90 (14.0%) | 95 (17.6%) |
| 45 to 59 Minutes | 165 (25.7%) | 107 (19.9%) |
| 60 to 89 Minutes | 57 (8.9%) | 0 (0.0%) |
| 90 or more Minutes | 0 (0.0%) | 0 (0.0%) |
Time of Departure to Work by Sex in Bakerstown
The most frequent times of departure to work in Bakerstown are 8:00 AM to 8:29 AM (141, 22.0%) for males and 7:00 AM to 7:29 AM (115, 21.3%) for females.
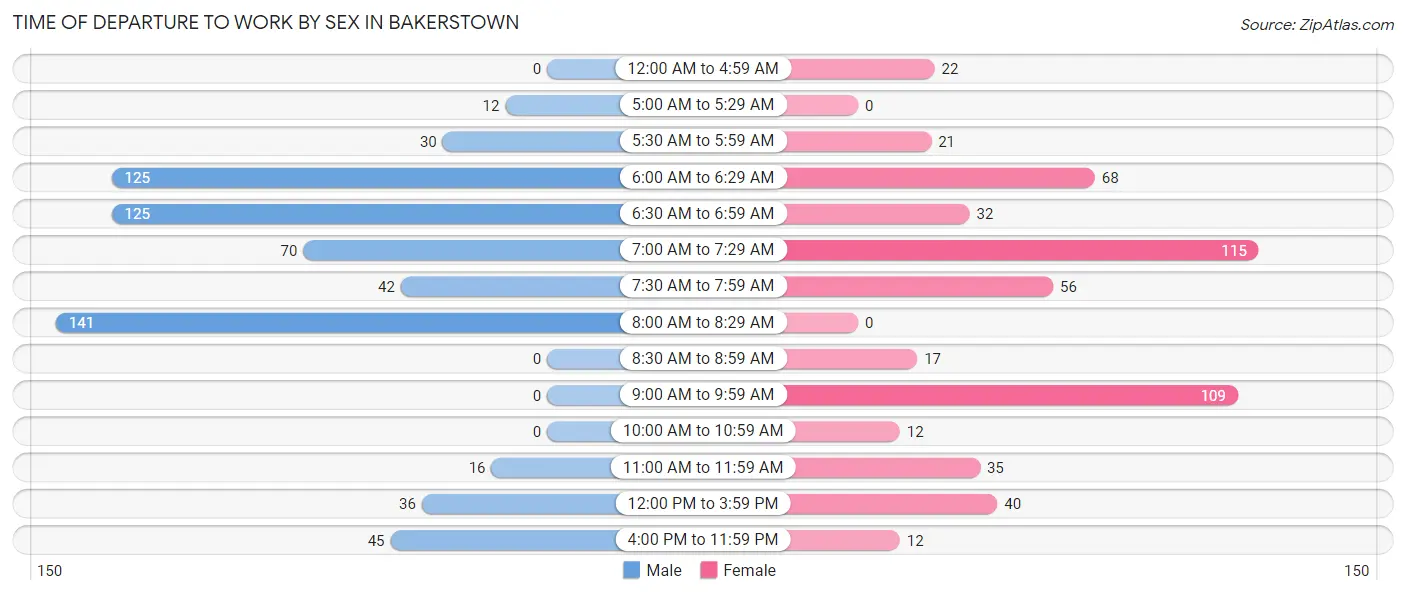
| Time of Departure | Male | Female |
| 12:00 AM to 4:59 AM | 0 (0.0%) | 22 (4.1%) |
| 5:00 AM to 5:29 AM | 12 (1.9%) | 0 (0.0%) |
| 5:30 AM to 5:59 AM | 30 (4.7%) | 21 (3.9%) |
| 6:00 AM to 6:29 AM | 125 (19.5%) | 68 (12.6%) |
| 6:30 AM to 6:59 AM | 125 (19.5%) | 32 (5.9%) |
| 7:00 AM to 7:29 AM | 70 (10.9%) | 115 (21.3%) |
| 7:30 AM to 7:59 AM | 42 (6.5%) | 56 (10.4%) |
| 8:00 AM to 8:29 AM | 141 (22.0%) | 0 (0.0%) |
| 8:30 AM to 8:59 AM | 0 (0.0%) | 17 (3.2%) |
| 9:00 AM to 9:59 AM | 0 (0.0%) | 109 (20.2%) |
| 10:00 AM to 10:59 AM | 0 (0.0%) | 12 (2.2%) |
| 11:00 AM to 11:59 AM | 16 (2.5%) | 35 (6.5%) |
| 12:00 PM to 3:59 PM | 36 (5.6%) | 40 (7.4%) |
| 4:00 PM to 11:59 PM | 45 (7.0%) | 12 (2.2%) |
| Total | 642 (100.0%) | 539 (100.0%) |
Housing Occupancy in Bakerstown
Occupancy by Ownership in Bakerstown
Of the total 955 dwellings in Bakerstown, owner-occupied units account for 749 (78.4%), while renter-occupied units make up 206 (21.6%).
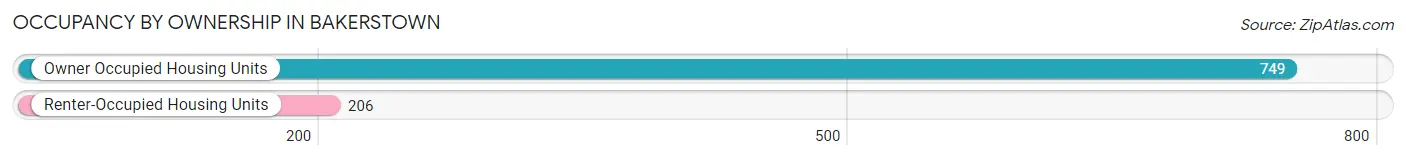
| Occupancy | # Housing Units | % Housing Units |
| Owner Occupied Housing Units | 749 | 78.4% |
| Renter-Occupied Housing Units | 206 | 21.6% |
| Total Occupied Housing Units | 955 | 100.0% |
Occupancy by Household Size in Bakerstown
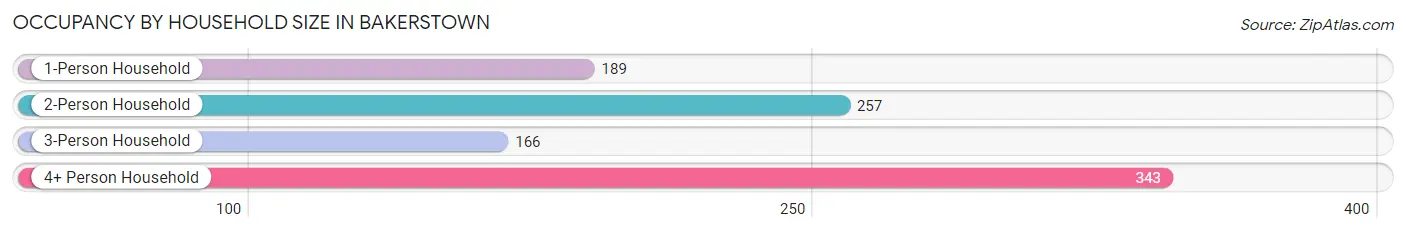
| Household Size | # Housing Units | % Housing Units |
| 1-Person Household | 189 | 19.8% |
| 2-Person Household | 257 | 26.9% |
| 3-Person Household | 166 | 17.4% |
| 4+ Person Household | 343 | 35.9% |
| Total Housing Units | 955 | 100.0% |
Occupancy by Ownership by Household Size in Bakerstown
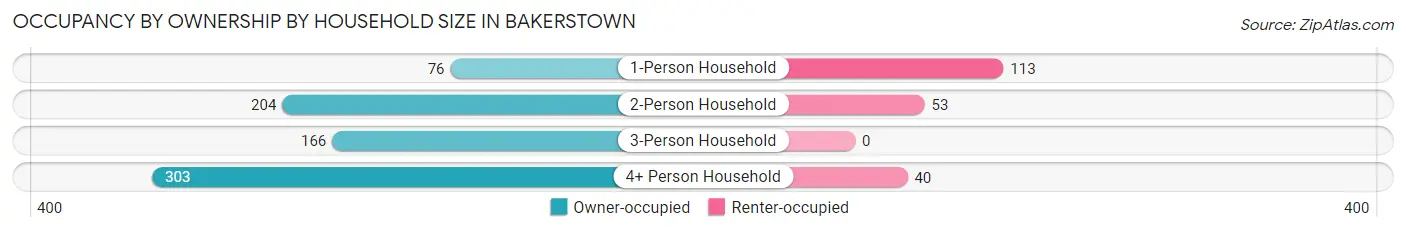
| Household Size | Owner-occupied | Renter-occupied |
| 1-Person Household | 76 (40.2%) | 113 (59.8%) |
| 2-Person Household | 204 (79.4%) | 53 (20.6%) |
| 3-Person Household | 166 (100.0%) | 0 (0.0%) |
| 4+ Person Household | 303 (88.3%) | 40 (11.7%) |
| Total Housing Units | 749 (78.4%) | 206 (21.6%) |
Occupancy by Educational Attainment in Bakerstown
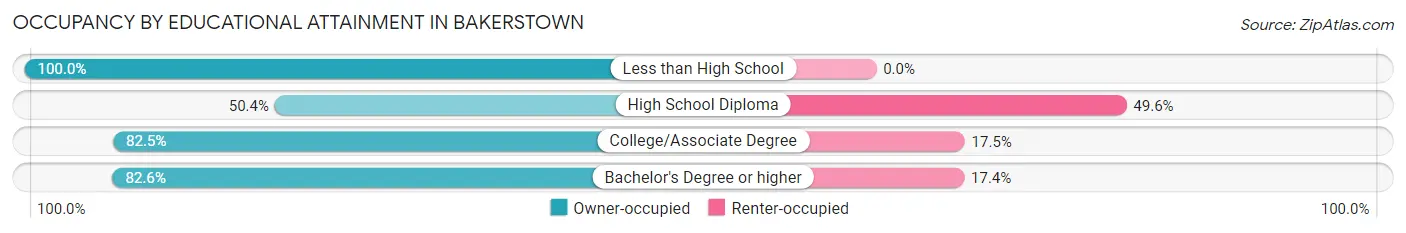
| Household Size | Owner-occupied | Renter-occupied |
| Less than High School | 12 (100.0%) | 0 (0.0%) |
| High School Diploma | 65 (50.4%) | 64 (49.6%) |
| College/Associate Degree | 94 (82.5%) | 20 (17.5%) |
| Bachelor's Degree or higher | 578 (82.6%) | 122 (17.4%) |
Occupancy by Age of Householder in Bakerstown
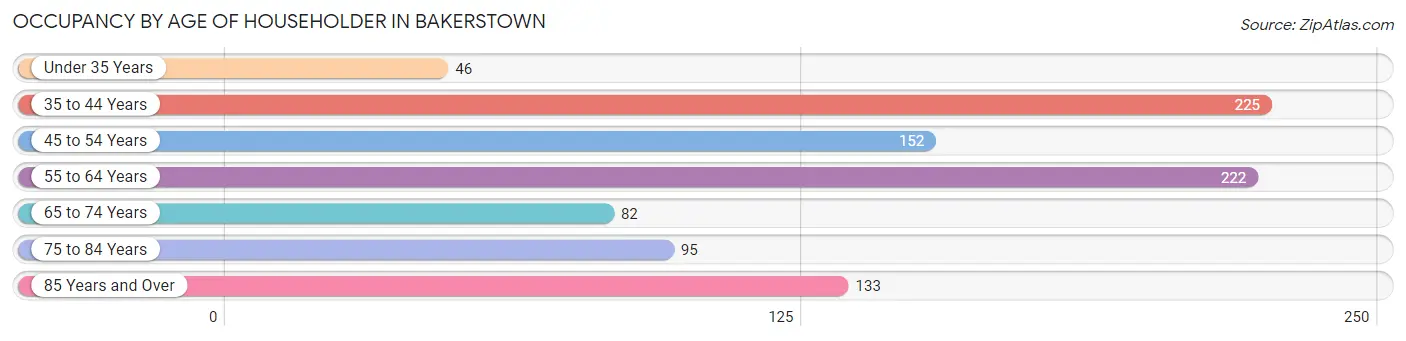
| Age Bracket | # Households | % Households |
| Under 35 Years | 46 | 4.8% |
| 35 to 44 Years | 225 | 23.6% |
| 45 to 54 Years | 152 | 15.9% |
| 55 to 64 Years | 222 | 23.3% |
| 65 to 74 Years | 82 | 8.6% |
| 75 to 84 Years | 95 | 10.0% |
| 85 Years and Over | 133 | 13.9% |
| Total | 955 | 100.0% |
Housing Finances in Bakerstown
Median Income by Occupancy in Bakerstown
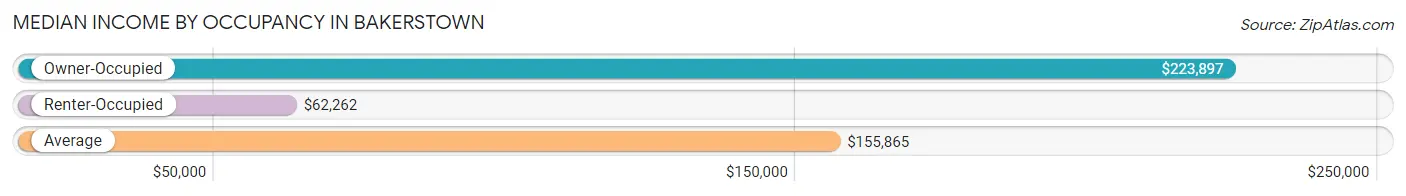
| Occupancy Type | # Households | Median Income |
| Owner-Occupied | 749 (78.4%) | $223,897 |
| Renter-Occupied | 206 (21.6%) | $62,262 |
| Average | 955 (100.0%) | $155,865 |
Occupancy by Householder Income Bracket in Bakerstown
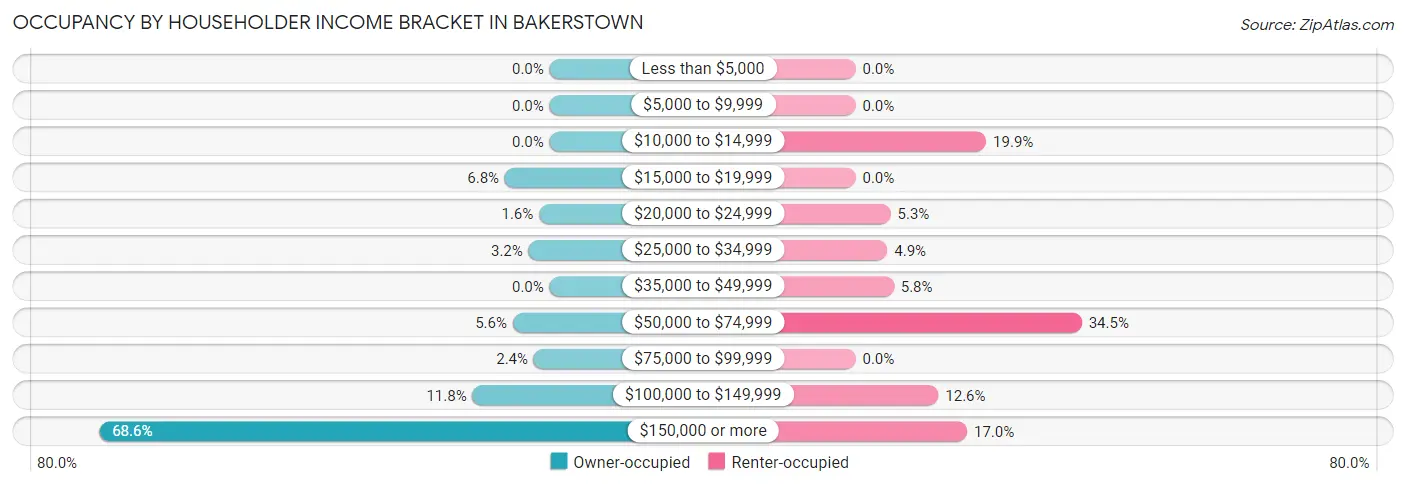
| Income Bracket | Owner-occupied | Renter-occupied |
| Less than $5,000 | 0 (0.0%) | 0 (0.0%) |
| $5,000 to $9,999 | 0 (0.0%) | 0 (0.0%) |
| $10,000 to $14,999 | 0 (0.0%) | 41 (19.9%) |
| $15,000 to $19,999 | 51 (6.8%) | 0 (0.0%) |
| $20,000 to $24,999 | 12 (1.6%) | 11 (5.3%) |
| $25,000 to $34,999 | 24 (3.2%) | 10 (4.9%) |
| $35,000 to $49,999 | 0 (0.0%) | 12 (5.8%) |
| $50,000 to $74,999 | 42 (5.6%) | 71 (34.5%) |
| $75,000 to $99,999 | 18 (2.4%) | 0 (0.0%) |
| $100,000 to $149,999 | 88 (11.7%) | 26 (12.6%) |
| $150,000 or more | 514 (68.6%) | 35 (17.0%) |
| Total | 749 (100.0%) | 206 (100.0%) |
Monthly Housing Cost Tiers in Bakerstown
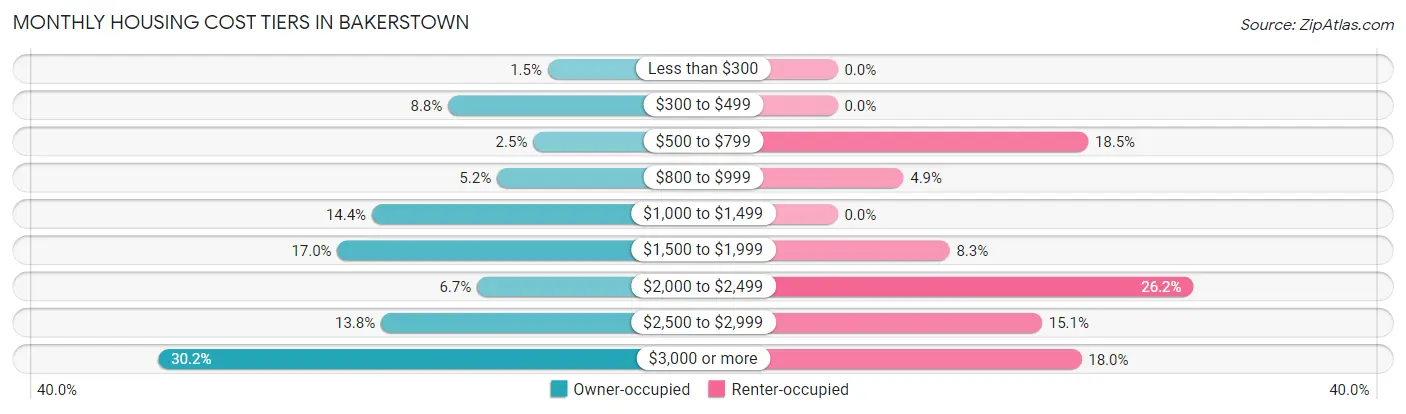
| Monthly Cost | Owner-occupied | Renter-occupied |
| Less than $300 | 11 (1.5%) | 0 (0.0%) |
| $300 to $499 | 66 (8.8%) | 0 (0.0%) |
| $500 to $799 | 19 (2.5%) | 38 (18.4%) |
| $800 to $999 | 39 (5.2%) | 10 (4.9%) |
| $1,000 to $1,499 | 108 (14.4%) | 0 (0.0%) |
| $1,500 to $1,999 | 127 (17.0%) | 17 (8.3%) |
| $2,000 to $2,499 | 50 (6.7%) | 54 (26.2%) |
| $2,500 to $2,999 | 103 (13.8%) | 31 (15.0%) |
| $3,000 or more | 226 (30.2%) | 37 (18.0%) |
| Total | 749 (100.0%) | 206 (100.0%) |
Physical Housing Characteristics in Bakerstown
Housing Structures in Bakerstown
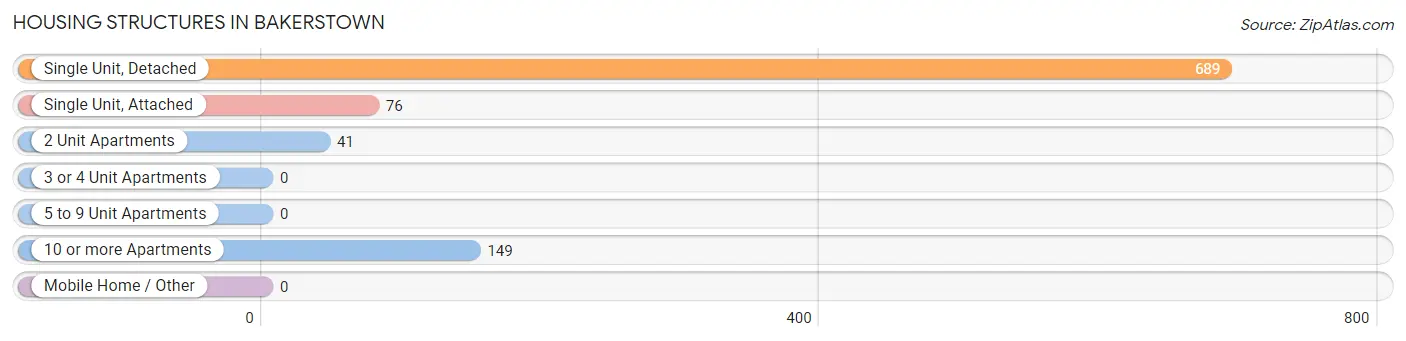
| Structure Type | # Housing Units | % Housing Units |
| Single Unit, Detached | 689 | 72.2% |
| Single Unit, Attached | 76 | 8.0% |
| 2 Unit Apartments | 41 | 4.3% |
| 3 or 4 Unit Apartments | 0 | 0.0% |
| 5 to 9 Unit Apartments | 0 | 0.0% |
| 10 or more Apartments | 149 | 15.6% |
| Mobile Home / Other | 0 | 0.0% |
| Total | 955 | 100.0% |
Housing Structures by Occupancy in Bakerstown
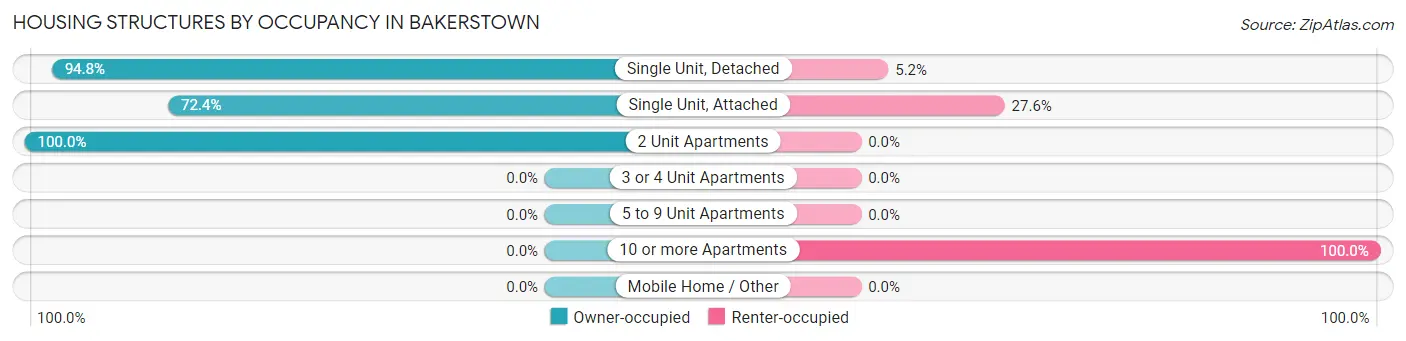
| Structure Type | Owner-occupied | Renter-occupied |
| Single Unit, Detached | 653 (94.8%) | 36 (5.2%) |
| Single Unit, Attached | 55 (72.4%) | 21 (27.6%) |
| 2 Unit Apartments | 41 (100.0%) | 0 (0.0%) |
| 3 or 4 Unit Apartments | 0 (0.0%) | 0 (0.0%) |
| 5 to 9 Unit Apartments | 0 (0.0%) | 0 (0.0%) |
| 10 or more Apartments | 0 (0.0%) | 149 (100.0%) |
| Mobile Home / Other | 0 (0.0%) | 0 (0.0%) |
| Total | 749 (78.4%) | 206 (21.6%) |
Housing Structures by Number of Rooms in Bakerstown
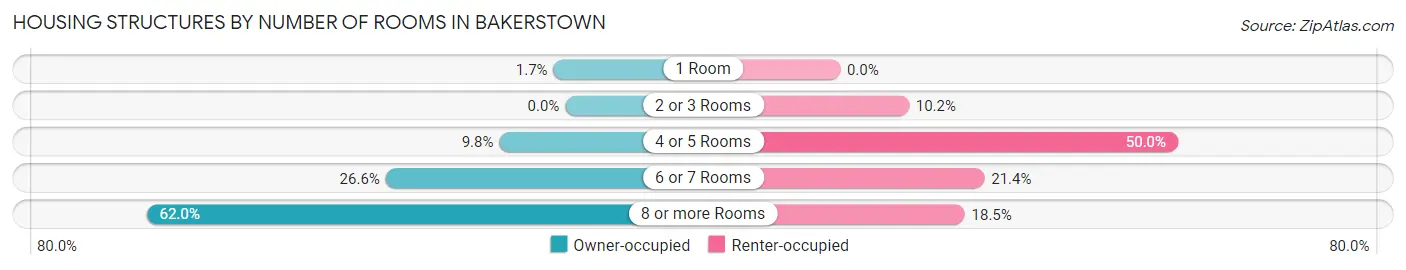
| Number of Rooms | Owner-occupied | Renter-occupied |
| 1 Room | 13 (1.7%) | 0 (0.0%) |
| 2 or 3 Rooms | 0 (0.0%) | 21 (10.2%) |
| 4 or 5 Rooms | 73 (9.8%) | 103 (50.0%) |
| 6 or 7 Rooms | 199 (26.6%) | 44 (21.4%) |
| 8 or more Rooms | 464 (62.0%) | 38 (18.4%) |
| Total | 749 (100.0%) | 206 (100.0%) |
Housing Structure by Heating Type in Bakerstown
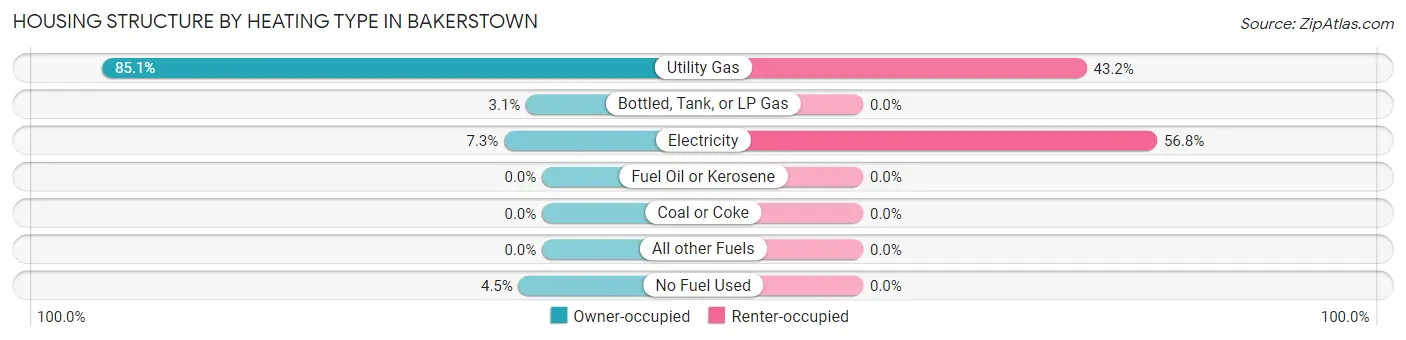
| Heating Type | Owner-occupied | Renter-occupied |
| Utility Gas | 637 (85.1%) | 89 (43.2%) |
| Bottled, Tank, or LP Gas | 23 (3.1%) | 0 (0.0%) |
| Electricity | 55 (7.3%) | 117 (56.8%) |
| Fuel Oil or Kerosene | 0 (0.0%) | 0 (0.0%) |
| Coal or Coke | 0 (0.0%) | 0 (0.0%) |
| All other Fuels | 0 (0.0%) | 0 (0.0%) |
| No Fuel Used | 34 (4.5%) | 0 (0.0%) |
| Total | 749 (100.0%) | 206 (100.0%) |
Household Vehicle Usage in Bakerstown
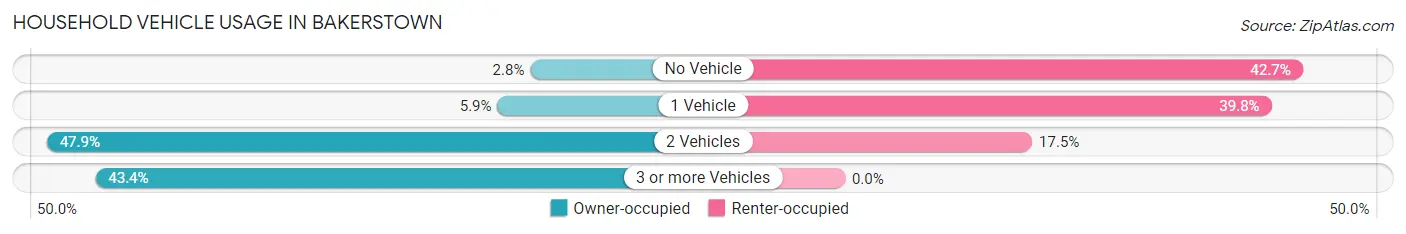
| Vehicles per Household | Owner-occupied | Renter-occupied |
| No Vehicle | 21 (2.8%) | 88 (42.7%) |
| 1 Vehicle | 44 (5.9%) | 82 (39.8%) |
| 2 Vehicles | 359 (47.9%) | 36 (17.5%) |
| 3 or more Vehicles | 325 (43.4%) | 0 (0.0%) |
| Total | 749 (100.0%) | 206 (100.0%) |
Real Estate & Mortgages in Bakerstown
Real Estate and Mortgage Overview in Bakerstown
| Characteristic | Without Mortgage | With Mortgage |
| Housing Units | 284 | 465 |
| Median Property Value | $422,700 | $503,100 |
| Median Household Income | - | - |
| Monthly Housing Costs | $1,016 | $226 |
| Real Estate Taxes | $6,424 | $0 |
Property Value by Mortgage Status in Bakerstown
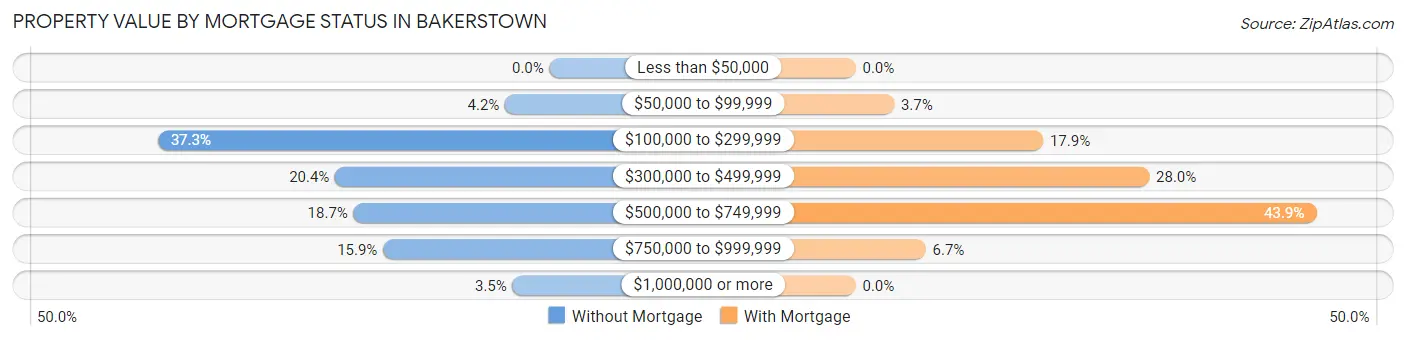
| Property Value | Without Mortgage | With Mortgage |
| Less than $50,000 | 0 (0.0%) | 0 (0.0%) |
| $50,000 to $99,999 | 12 (4.2%) | 17 (3.7%) |
| $100,000 to $299,999 | 106 (37.3%) | 83 (17.8%) |
| $300,000 to $499,999 | 58 (20.4%) | 130 (28.0%) |
| $500,000 to $749,999 | 53 (18.7%) | 204 (43.9%) |
| $750,000 to $999,999 | 45 (15.9%) | 31 (6.7%) |
| $1,000,000 or more | 10 (3.5%) | 0 (0.0%) |
| Total | 284 (100.0%) | 465 (100.0%) |
Household Income by Mortgage Status in Bakerstown
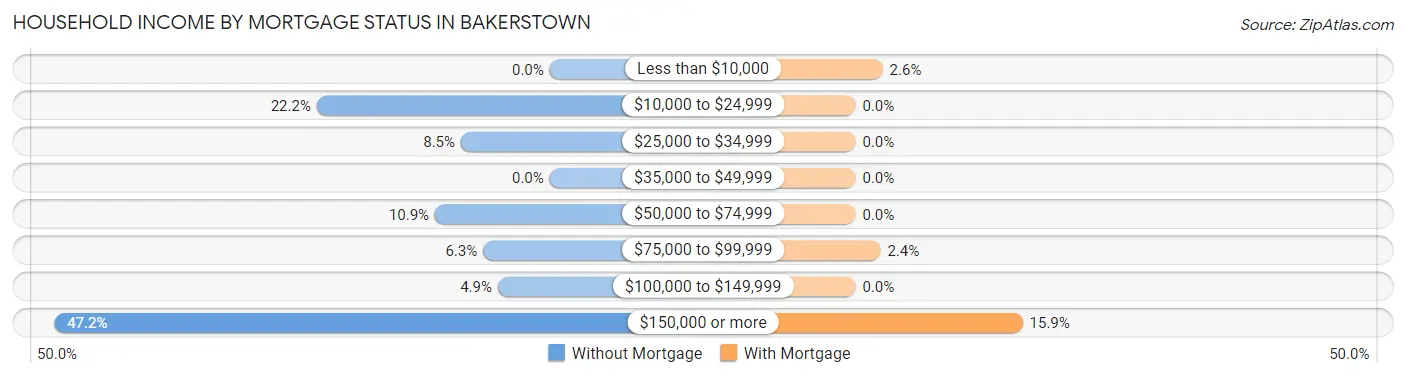
| Household Income | Without Mortgage | With Mortgage |
| Less than $10,000 | 0 (0.0%) | 12 (2.6%) |
| $10,000 to $24,999 | 63 (22.2%) | 0 (0.0%) |
| $25,000 to $34,999 | 24 (8.5%) | 0 (0.0%) |
| $35,000 to $49,999 | 0 (0.0%) | 0 (0.0%) |
| $50,000 to $74,999 | 31 (10.9%) | 0 (0.0%) |
| $75,000 to $99,999 | 18 (6.3%) | 11 (2.4%) |
| $100,000 to $149,999 | 14 (4.9%) | 0 (0.0%) |
| $150,000 or more | 134 (47.2%) | 74 (15.9%) |
| Total | 284 (100.0%) | 465 (100.0%) |
Property Value to Household Income Ratio in Bakerstown
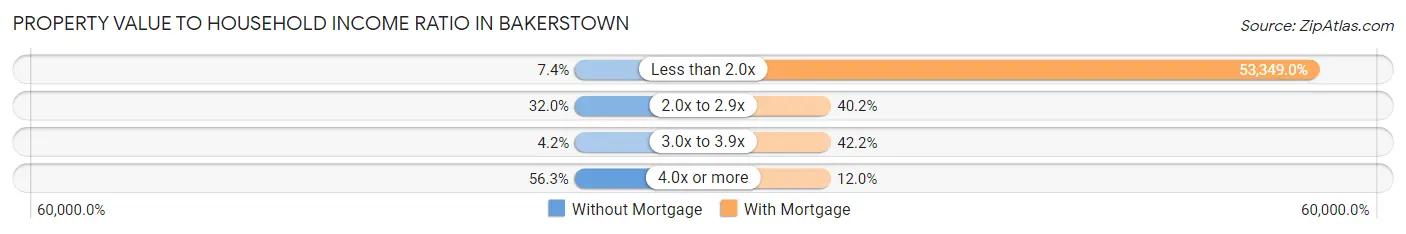
| Value-to-Income Ratio | Without Mortgage | With Mortgage |
| Less than 2.0x | 21 (7.4%) | 248,073 (53,349.0%) |
| 2.0x to 2.9x | 91 (32.0%) | 187 (40.2%) |
| 3.0x to 3.9x | 12 (4.2%) | 196 (42.1%) |
| 4.0x or more | 160 (56.3%) | 56 (12.0%) |
| Total | 284 (100.0%) | 465 (100.0%) |
Real Estate Taxes by Mortgage Status in Bakerstown
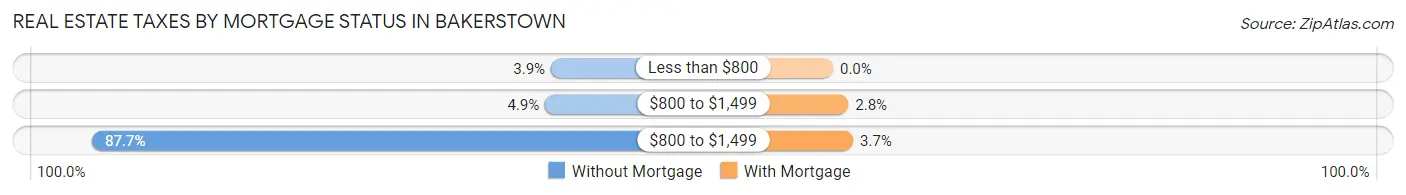
| Property Taxes | Without Mortgage | With Mortgage |
| Less than $800 | 11 (3.9%) | 0 (0.0%) |
| $800 to $1,499 | 14 (4.9%) | 13 (2.8%) |
| $800 to $1,499 | 249 (87.7%) | 17 (3.7%) |
| Total | 284 (100.0%) | 465 (100.0%) |
Health & Disability in Bakerstown
Health Insurance Coverage by Age in Bakerstown
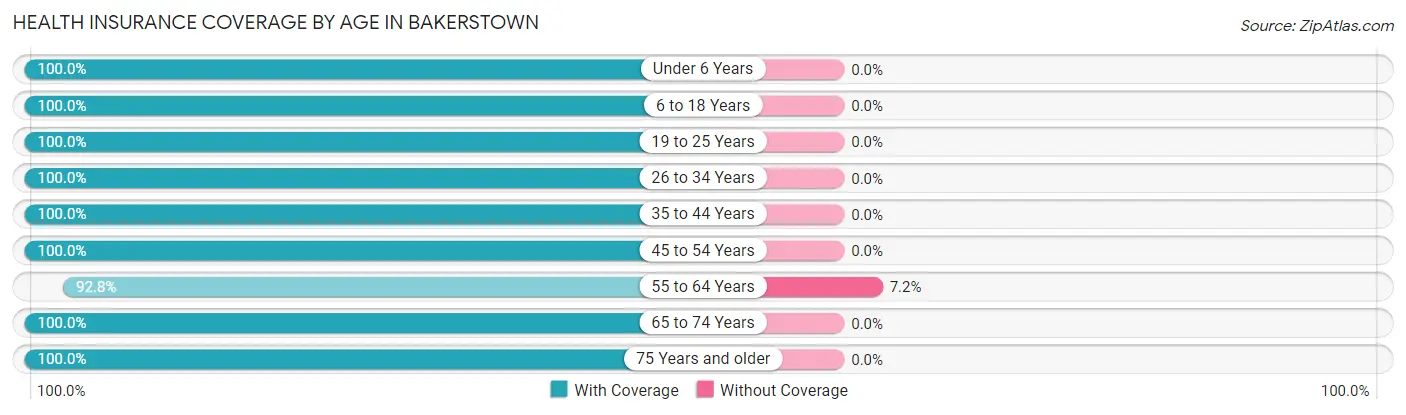
| Age Bracket | With Coverage | Without Coverage |
| Under 6 Years | 322 (100.0%) | 0 (0.0%) |
| 6 to 18 Years | 419 (100.0%) | 0 (0.0%) |
| 19 to 25 Years | 142 (100.0%) | 0 (0.0%) |
| 26 to 34 Years | 186 (100.0%) | 0 (0.0%) |
| 35 to 44 Years | 407 (100.0%) | 0 (0.0%) |
| 45 to 54 Years | 295 (100.0%) | 0 (0.0%) |
| 55 to 64 Years | 427 (92.8%) | 33 (7.2%) |
| 65 to 74 Years | 229 (100.0%) | 0 (0.0%) |
| 75 Years and older | 399 (100.0%) | 0 (0.0%) |
| Total | 2,826 (98.9%) | 33 (1.1%) |
Health Insurance Coverage by Citizenship Status in Bakerstown
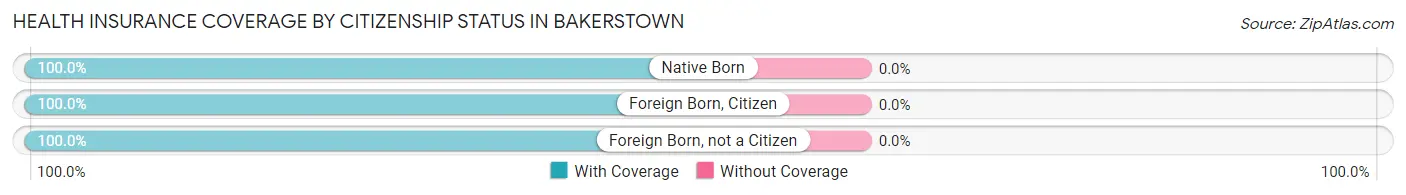
| Citizenship Status | With Coverage | Without Coverage |
| Native Born | 322 (100.0%) | 0 (0.0%) |
| Foreign Born, Citizen | 419 (100.0%) | 0 (0.0%) |
| Foreign Born, not a Citizen | 142 (100.0%) | 0 (0.0%) |
Health Insurance Coverage by Household Income in Bakerstown
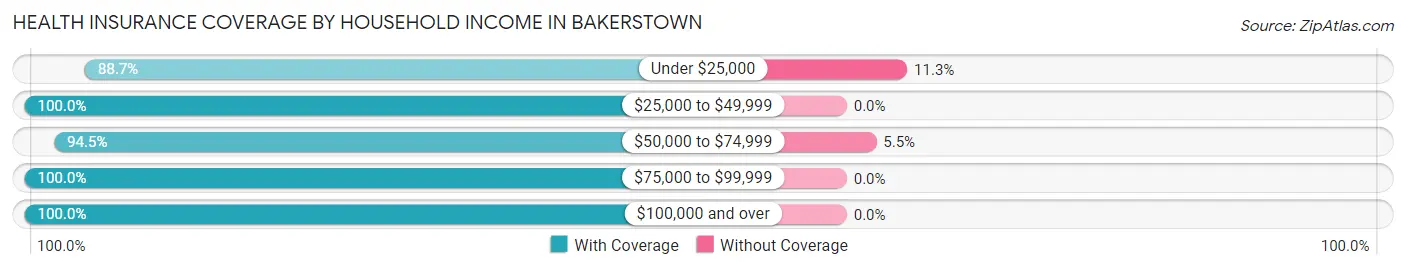
| Household Income | With Coverage | Without Coverage |
| Under $25,000 | 149 (88.7%) | 19 (11.3%) |
| $25,000 to $49,999 | 82 (100.0%) | 0 (0.0%) |
| $50,000 to $74,999 | 239 (94.5%) | 14 (5.5%) |
| $75,000 to $99,999 | 71 (100.0%) | 0 (0.0%) |
| $100,000 and over | 2,285 (100.0%) | 0 (0.0%) |
Public vs Private Health Insurance Coverage by Age in Bakerstown
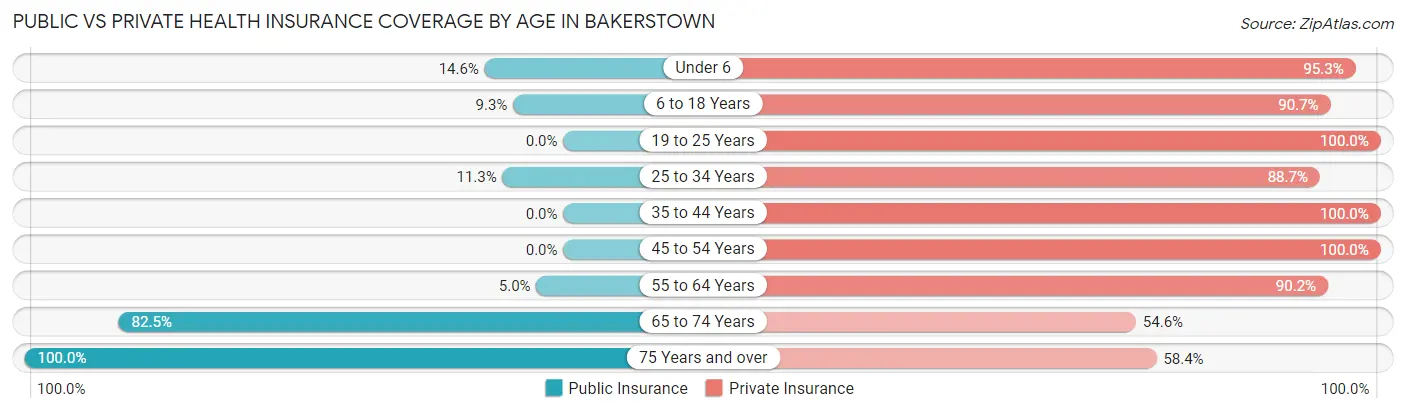
| Age Bracket | Public Insurance | Private Insurance |
| Under 6 | 47 (14.6%) | 307 (95.3%) |
| 6 to 18 Years | 39 (9.3%) | 380 (90.7%) |
| 19 to 25 Years | 0 (0.0%) | 142 (100.0%) |
| 25 to 34 Years | 21 (11.3%) | 165 (88.7%) |
| 35 to 44 Years | 0 (0.0%) | 407 (100.0%) |
| 45 to 54 Years | 0 (0.0%) | 295 (100.0%) |
| 55 to 64 Years | 23 (5.0%) | 415 (90.2%) |
| 65 to 74 Years | 189 (82.5%) | 125 (54.6%) |
| 75 Years and over | 399 (100.0%) | 233 (58.4%) |
| Total | 718 (25.1%) | 2,469 (86.4%) |
Disability Status by Sex by Age in Bakerstown
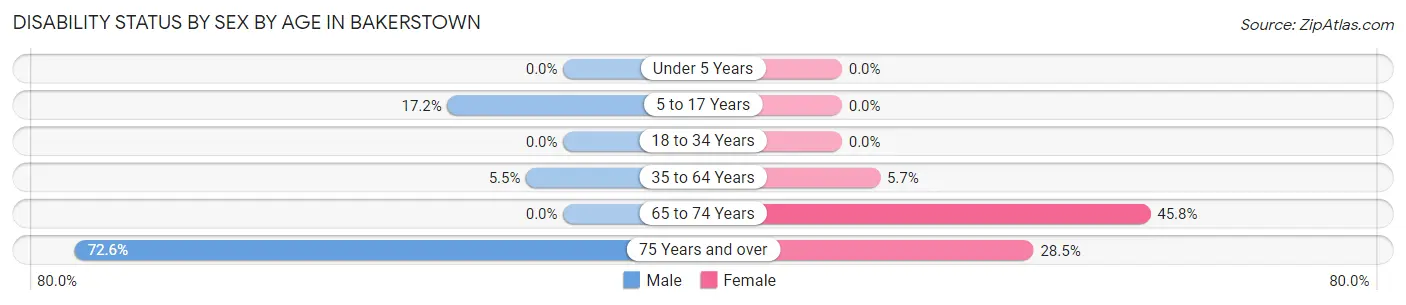
| Age Bracket | Male | Female |
| Under 5 Years | 0 (0.0%) | 0 (0.0%) |
| 5 to 17 Years | 33 (17.2%) | 0 (0.0%) |
| 18 to 34 Years | 0 (0.0%) | 0 (0.0%) |
| 35 to 64 Years | 30 (5.5%) | 35 (5.7%) |
| 65 to 74 Years | 0 (0.0%) | 82 (45.8%) |
| 75 Years and over | 111 (72.6%) | 70 (28.5%) |
Disability Class by Sex by Age in Bakerstown
Disability Class: Hearing Difficulty
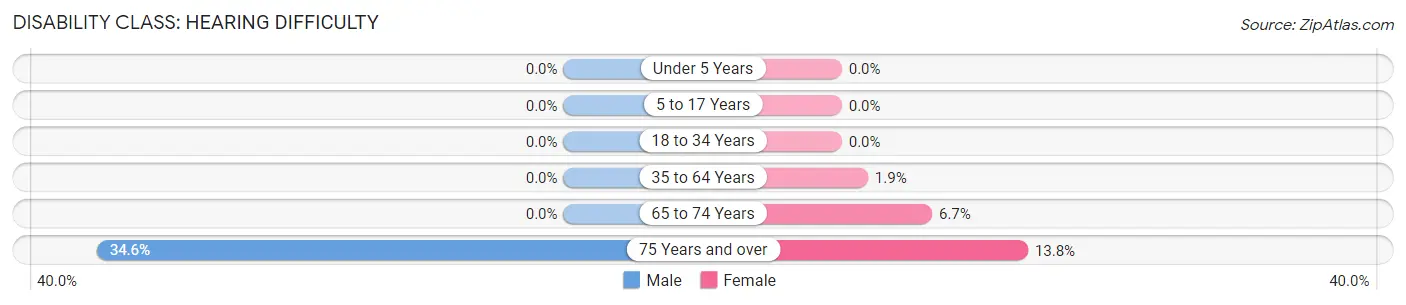
| Age Bracket | Male | Female |
| Under 5 Years | 0 (0.0%) | 0 (0.0%) |
| 5 to 17 Years | 0 (0.0%) | 0 (0.0%) |
| 18 to 34 Years | 0 (0.0%) | 0 (0.0%) |
| 35 to 64 Years | 0 (0.0%) | 12 (1.9%) |
| 65 to 74 Years | 0 (0.0%) | 12 (6.7%) |
| 75 Years and over | 53 (34.6%) | 34 (13.8%) |
Disability Class: Vision Difficulty
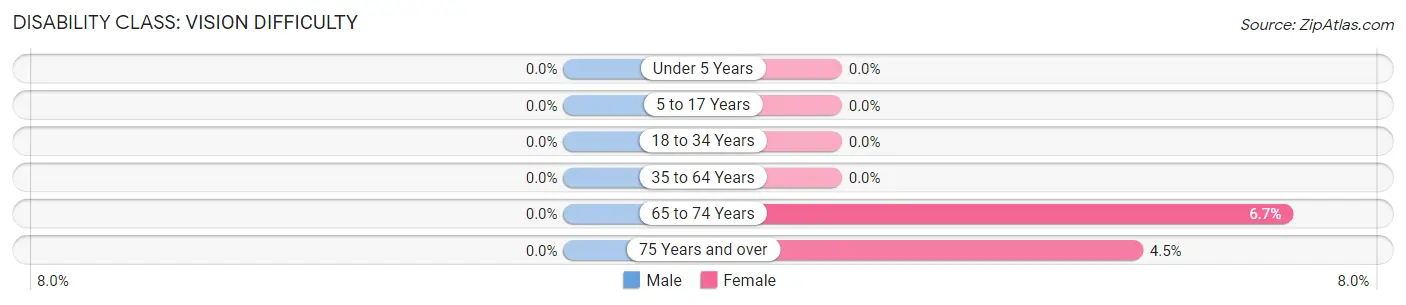
| Age Bracket | Male | Female |
| Under 5 Years | 0 (0.0%) | 0 (0.0%) |
| 5 to 17 Years | 0 (0.0%) | 0 (0.0%) |
| 18 to 34 Years | 0 (0.0%) | 0 (0.0%) |
| 35 to 64 Years | 0 (0.0%) | 0 (0.0%) |
| 65 to 74 Years | 0 (0.0%) | 12 (6.7%) |
| 75 Years and over | 0 (0.0%) | 11 (4.5%) |
Disability Class: Cognitive Difficulty
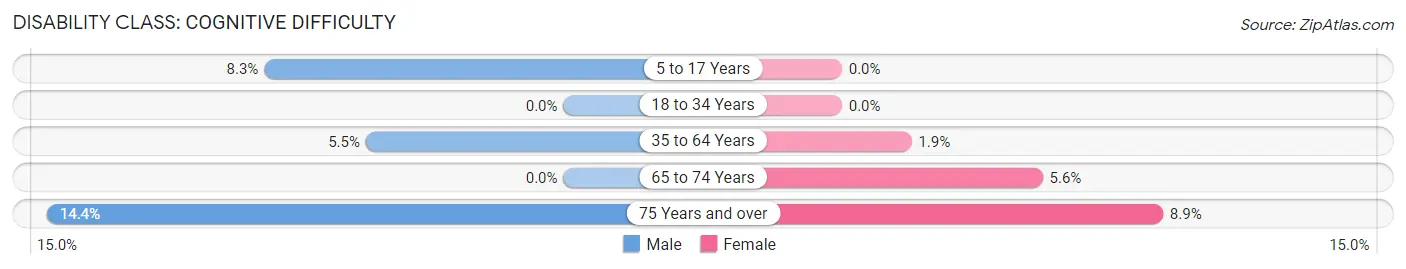
| Age Bracket | Male | Female |
| 5 to 17 Years | 16 (8.3%) | 0 (0.0%) |
| 18 to 34 Years | 0 (0.0%) | 0 (0.0%) |
| 35 to 64 Years | 30 (5.5%) | 12 (1.9%) |
| 65 to 74 Years | 0 (0.0%) | 10 (5.6%) |
| 75 Years and over | 22 (14.4%) | 22 (8.9%) |
Disability Class: Ambulatory Difficulty
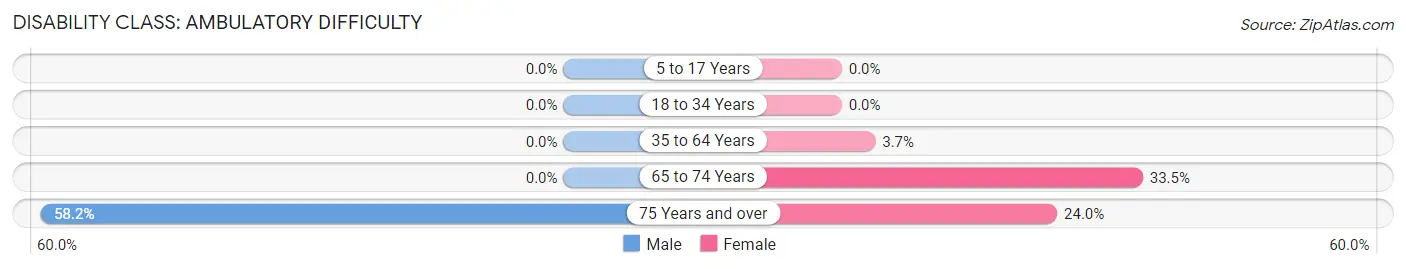
| Age Bracket | Male | Female |
| 5 to 17 Years | 0 (0.0%) | 0 (0.0%) |
| 18 to 34 Years | 0 (0.0%) | 0 (0.0%) |
| 35 to 64 Years | 0 (0.0%) | 23 (3.7%) |
| 65 to 74 Years | 0 (0.0%) | 60 (33.5%) |
| 75 Years and over | 89 (58.2%) | 59 (24.0%) |
Disability Class: Self-Care Difficulty
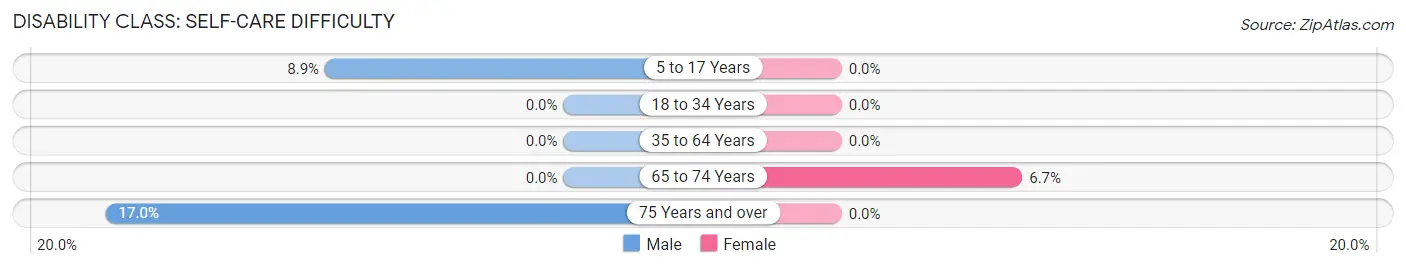
| Age Bracket | Male | Female |
| 5 to 17 Years | 17 (8.8%) | 0 (0.0%) |
| 18 to 34 Years | 0 (0.0%) | 0 (0.0%) |
| 35 to 64 Years | 0 (0.0%) | 0 (0.0%) |
| 65 to 74 Years | 0 (0.0%) | 12 (6.7%) |
| 75 Years and over | 26 (17.0%) | 0 (0.0%) |
Technology Access in Bakerstown
Computing Device Access in Bakerstown
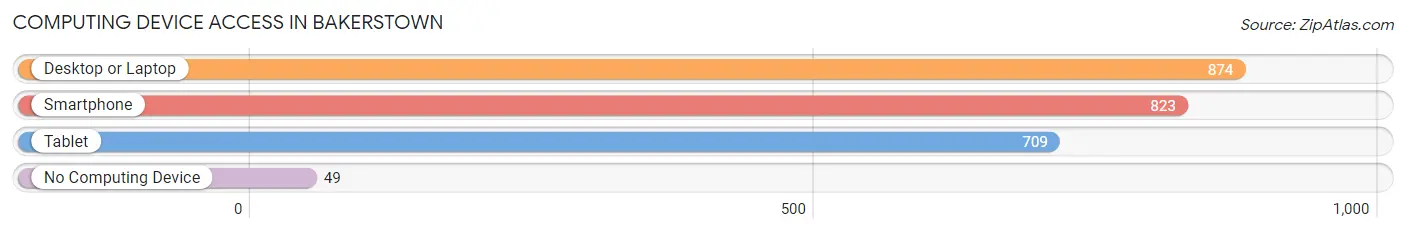
| Device Type | # Households | % Households |
| Desktop or Laptop | 874 | 91.5% |
| Smartphone | 823 | 86.2% |
| Tablet | 709 | 74.2% |
| No Computing Device | 49 | 5.1% |
| Total | 955 | 100.0% |
Internet Access in Bakerstown
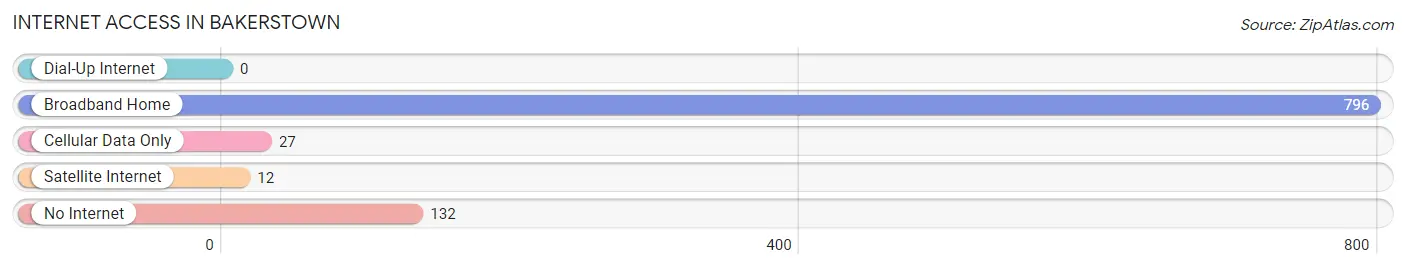
| Internet Type | # Households | % Households |
| Dial-Up Internet | 0 | 0.0% |
| Broadband Home | 796 | 83.4% |
| Cellular Data Only | 27 | 2.8% |
| Satellite Internet | 12 | 1.3% |
| No Internet | 132 | 13.8% |
| Total | 955 | 100.0% |
Bakerstown Summary
Bakerstown is a small unincorporated community located in Richland Township, Allegheny County, Pennsylvania. It is situated approximately 20 miles north of Pittsburgh and is part of the Greater Pittsburgh Metropolitan Area. The population of Bakerstown was 1,845 as of the 2010 census.
History
Bakerstown was founded in 1817 by John Baker, a Revolutionary War veteran. He purchased the land from the heirs of William Penn and named the area after himself. The area was originally a farming community, but it soon developed into a small industrial center. The first industry in the area was a sawmill, which was built in 1820. This was followed by a gristmill, a tannery, and a distillery.
In 1845, the Pittsburgh and Butler Plank Road was built through the area, connecting Bakerstown to Pittsburgh and Butler. This allowed for increased trade and commerce in the area, and the population began to grow. By the late 19th century, the area had become a popular summer resort destination for wealthy Pittsburghers.
Geography
Bakerstown is located in Richland Township, Allegheny County, Pennsylvania. It is situated approximately 20 miles north of Pittsburgh and is part of the Greater Pittsburgh Metropolitan Area. The community is located along the banks of the Allegheny River. The terrain is mostly flat, with some rolling hills.
The climate in Bakerstown is humid continental, with hot summers and cold winters. The average annual temperature is around 50°F (10°C). The average annual precipitation is around 40 inches (101 cm).
Economy
The economy of Bakerstown is largely based on agriculture and tourism. The area is home to several farms, which produce a variety of crops, including corn, soybeans, wheat, and hay. The area is also home to several wineries, which produce a variety of wines.
Tourism is also an important part of the local economy. The area is home to several historic sites, including the Bakerstown Historic District, which is listed on the National Register of Historic Places. The area is also home to several parks and recreational areas, including the Allegheny River Trail and the North Country Trail.
Demographics
As of the 2010 census, the population of Bakerstown was 1,845. The racial makeup of the community was 97.3% White, 0.9% African American, 0.2% Native American, 0.3% Asian, 0.1% Pacific Islander, 0.3% from other races, and 0.9% from two or more races. Hispanic or Latino of any race were 1.2% of the population.
The median household income in Bakerstown was $50,938, and the median family income was $60,938. The per capita income was $25,938. About 4.3% of families and 5.3% of the population were below the poverty line, including 6.3% of those under age 18 and 4.3% of those age 65 or over.
Common Questions
What is Per Capita Income in Bakerstown?
Per Capita income in Bakerstown is $71,536.
What is the Median Family Income in Bakerstown?
Median Family Income in Bakerstown is $231,429.
What is the Median Household income in Bakerstown?
Median Household Income in Bakerstown is $155,865.
What is Income or Wage Gap in Bakerstown?
Income or Wage Gap in Bakerstown is 52.1%.
Women in Bakerstown earn 47.9 cents for every dollar earned by a man.
What is Inequality or Gini Index in Bakerstown?
Inequality or Gini Index in Bakerstown is 0.47.
What is the Total Population of Bakerstown?
Total Population of Bakerstown is 2,859.
What is the Total Male Population of Bakerstown?
Total Male Population of Bakerstown is 1,267.
What is the Total Female Population of Bakerstown?
Total Female Population of Bakerstown is 1,592.
What is the Ratio of Males per 100 Females in Bakerstown?
There are 79.59 Males per 100 Females in Bakerstown.
What is the Ratio of Females per 100 Males in Bakerstown?
There are 125.65 Females per 100 Males in Bakerstown.
What is the Median Population Age in Bakerstown?
Median Population Age in Bakerstown is 42.5 Years.
What is the Average Family Size in Bakerstown
Average Family Size in Bakerstown is 3.3 People.
What is the Average Household Size in Bakerstown
Average Household Size in Bakerstown is 3.0 People.
How Large is the Labor Force in Bakerstown?
There are 1,482 People in the Labor Forcein in Bakerstown.
What is the Percentage of People in the Labor Force in Bakerstown?
66.1% of People are in the Labor Force in Bakerstown.