Thorndale, PA Map & Demographics
Thorndale Map
Thorndale Overview
$41,787
PER CAPITA INCOME
$130,177
AVG FAMILY INCOME
$96,667
AVG HOUSEHOLD INCOME
27.3%
WAGE / INCOME GAP [ % ]
72.7¢/ $1
WAGE / INCOME GAP [ $ ]
0.30
INEQUALITY / GINI INDEX
4,007
TOTAL POPULATION
1,856
MALE POPULATION
2,151
FEMALE POPULATION
86.29
MALES / 100 FEMALES
115.89
FEMALES / 100 MALES
38.1
MEDIAN AGE
3.3
AVG FAMILY SIZE
2.8
AVG HOUSEHOLD SIZE
2,085
LABOR FORCE [ PEOPLE ]
67.9%
PERCENT IN LABOR FORCE
1.1%
UNEMPLOYMENT RATE
Thorndale Zip Codes
Income in Thorndale
Income Overview in Thorndale
Per Capita Income in Thorndale is $41,787, while median incomes of families and households are $130,177 and $96,667 respectively.
| Characteristic | Number | Measure |
| Per Capita Income | 4,007 | $41,787 |
| Median Family Income | 1,045 | $130,177 |
| Mean Family Income | 1,045 | $127,523 |
| Median Household Income | 1,452 | $96,667 |
| Mean Household Income | 1,452 | $108,688 |
| Income Deficit | 1,045 | $0 |
| Wage / Income Gap (%) | 4,007 | 27.26% |
| Wage / Income Gap ($) | 4,007 | 72.74¢ per $1 |
| Gini / Inequality Index | 4,007 | 0.30 |
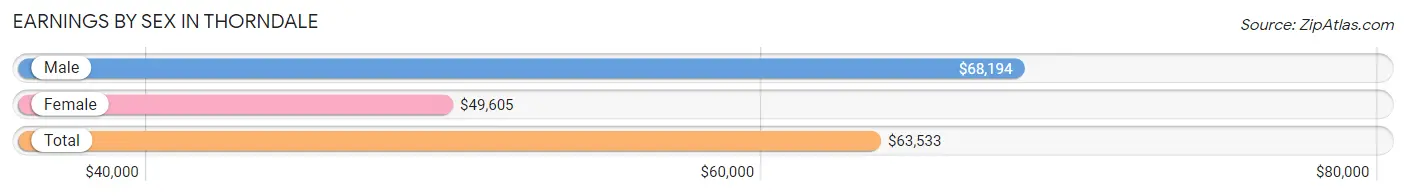
Earnings by Sex in Thorndale
Average Earnings in Thorndale are $63,533, $68,194 for men and $49,605 for women, a difference of 27.3%.
| Sex | Number | Average Earnings |
| Male | 1,242 (53.8%) | $68,194 |
| Female | 1,066 (46.2%) | $49,605 |
| Total | 2,308 (100.0%) | $63,533 |
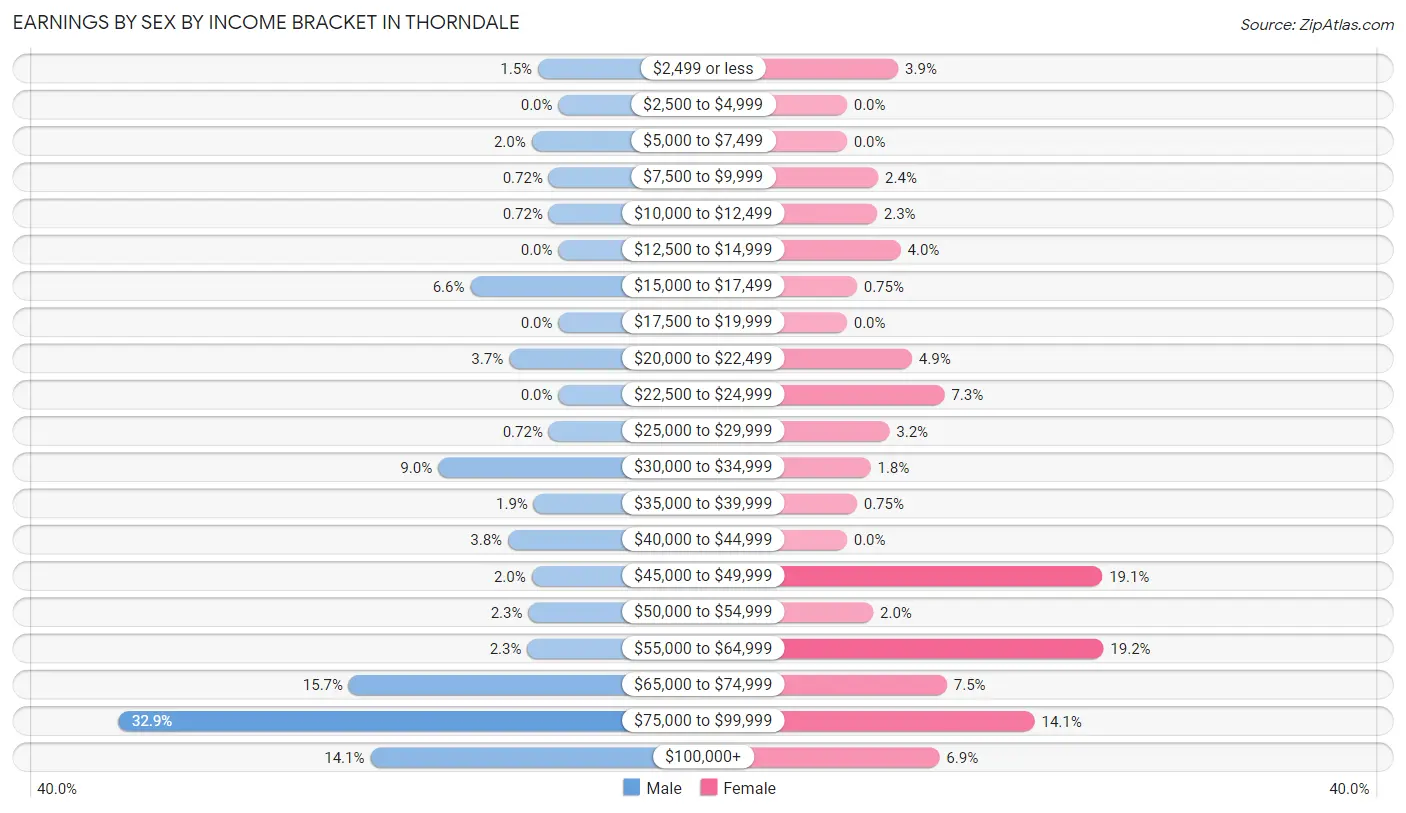
Earnings by Sex by Income Bracket in Thorndale
The most common earnings brackets in Thorndale are $75,000 to $99,999 for men (409 | 32.9%) and $55,000 to $64,999 for women (205 | 19.2%).
| Income | Male | Female |
| $2,499 or less | 19 (1.5%) | 41 (3.8%) |
| $2,500 to $4,999 | 0 (0.0%) | 0 (0.0%) |
| $5,000 to $7,499 | 25 (2.0%) | 0 (0.0%) |
| $7,500 to $9,999 | 9 (0.7%) | 25 (2.4%) |
| $10,000 to $12,499 | 9 (0.7%) | 24 (2.2%) |
| $12,500 to $14,999 | 0 (0.0%) | 43 (4.0%) |
| $15,000 to $17,499 | 82 (6.6%) | 8 (0.7%) |
| $17,500 to $19,999 | 0 (0.0%) | 0 (0.0%) |
| $20,000 to $22,499 | 46 (3.7%) | 52 (4.9%) |
| $22,500 to $24,999 | 0 (0.0%) | 78 (7.3%) |
| $25,000 to $29,999 | 9 (0.7%) | 34 (3.2%) |
| $30,000 to $34,999 | 112 (9.0%) | 19 (1.8%) |
| $35,000 to $39,999 | 23 (1.8%) | 8 (0.7%) |
| $40,000 to $44,999 | 47 (3.8%) | 0 (0.0%) |
| $45,000 to $49,999 | 25 (2.0%) | 204 (19.1%) |
| $50,000 to $54,999 | 28 (2.2%) | 21 (2.0%) |
| $55,000 to $64,999 | 29 (2.3%) | 205 (19.2%) |
| $65,000 to $74,999 | 195 (15.7%) | 80 (7.5%) |
| $75,000 to $99,999 | 409 (32.9%) | 150 (14.1%) |
| $100,000+ | 175 (14.1%) | 74 (6.9%) |
| Total | 1,242 (100.0%) | 1,066 (100.0%) |
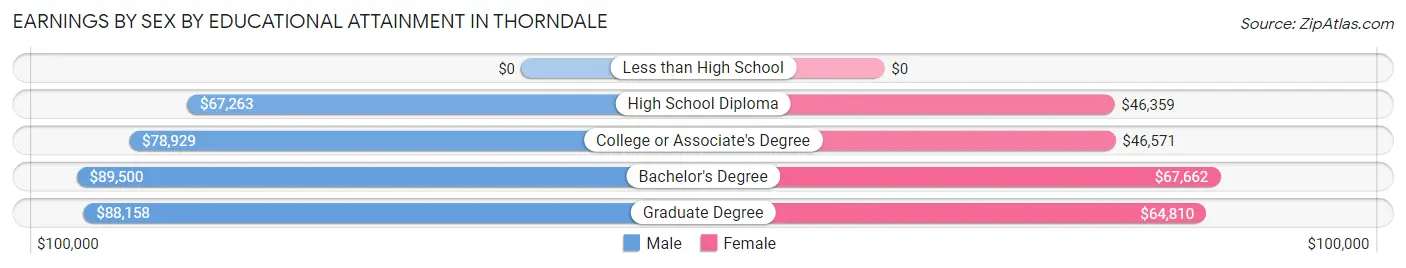
Earnings by Sex by Educational Attainment in Thorndale
Average earnings in Thorndale are $78,429 for men and $60,104 for women, a difference of 23.4%. Men with an educational attainment of bachelor's degree enjoy the highest average annual earnings of $89,500, while those with high school diploma education earn the least with $67,263. Women with an educational attainment of bachelor's degree earn the most with the average annual earnings of $67,662, while those with high school diploma education have the smallest earnings of $46,359.
| Educational Attainment | Male Income | Female Income |
| Less than High School | - | - |
| High School Diploma | $67,263 | $46,359 |
| College or Associate's Degree | $78,929 | $46,571 |
| Bachelor's Degree | $89,500 | $67,662 |
| Graduate Degree | $88,158 | $64,810 |
| Total | $78,429 | $60,104 |
Family Income in Thorndale
Family Income Brackets in Thorndale
According to the Thorndale family income data, there are 380 families falling into the $100,000 to $149,999 income range, which is the most common income bracket and makes up 36.4% of all families.
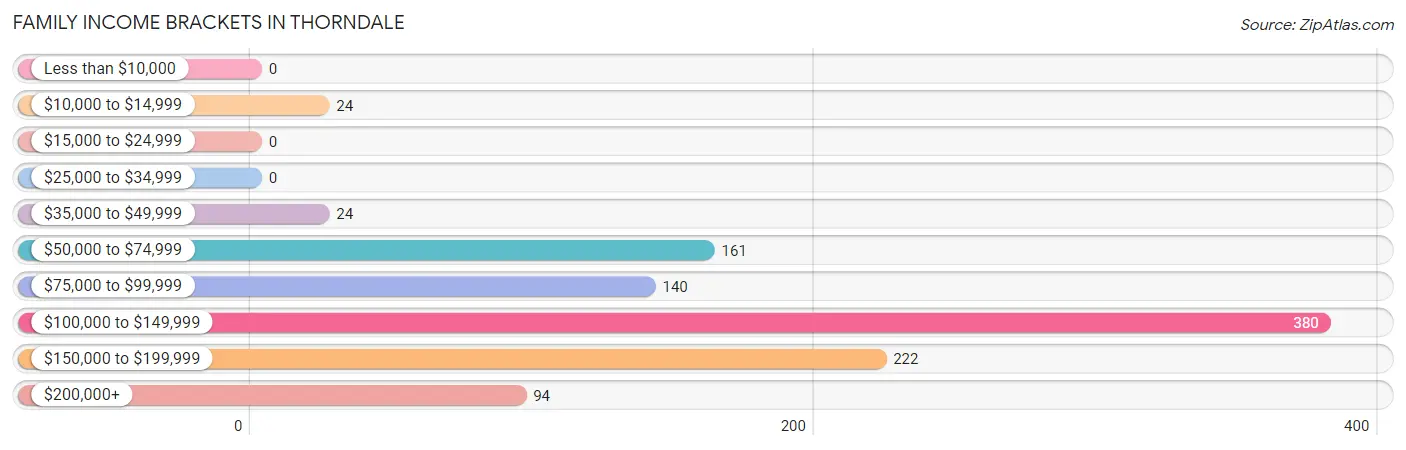
| Income Bracket | # Families | % Families |
| Less than $10,000 | 0 | 0.0% |
| $10,000 to $14,999 | 24 | 2.3% |
| $15,000 to $24,999 | 0 | 0.0% |
| $25,000 to $34,999 | 0 | 0.0% |
| $35,000 to $49,999 | 24 | 2.3% |
| $50,000 to $74,999 | 161 | 15.4% |
| $75,000 to $99,999 | 140 | 13.4% |
| $100,000 to $149,999 | 380 | 36.4% |
| $150,000 to $199,999 | 222 | 21.2% |
| $200,000+ | 94 | 9.0% |
Family Income by Famaliy Size in Thorndale
4-person families (196 | 18.8%) account for the highest median family income in Thorndale with $146,447 per family, while 2-person families (477 | 45.7%) have the highest median income of $51,644 per family member.
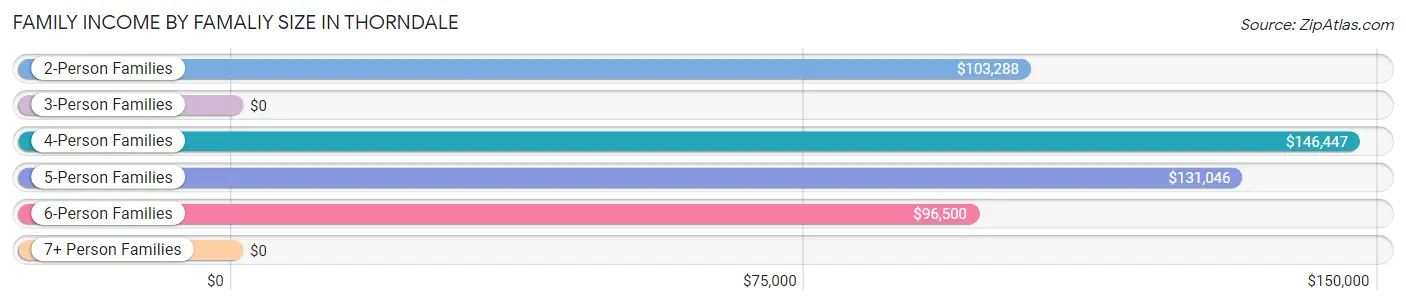
| Income Bracket | # Families | Median Income |
| 2-Person Families | 477 (45.7%) | $103,288 |
| 3-Person Families | 204 (19.5%) | $0 |
| 4-Person Families | 196 (18.8%) | $146,447 |
| 5-Person Families | 141 (13.5%) | $131,046 |
| 6-Person Families | 20 (1.9%) | $96,500 |
| 7+ Person Families | 7 (0.7%) | $0 |
| Total | 1,045 (100.0%) | $130,177 |
Family Income by Number of Earners in Thorndale
The median family income in Thorndale is $130,177, with families comprising 3+ earners (128) having the highest median family income of $181,118, while families with 1 earner (344) have the lowest median family income of $88,233, accounting for 12.2% and 32.9% of families, respectively.
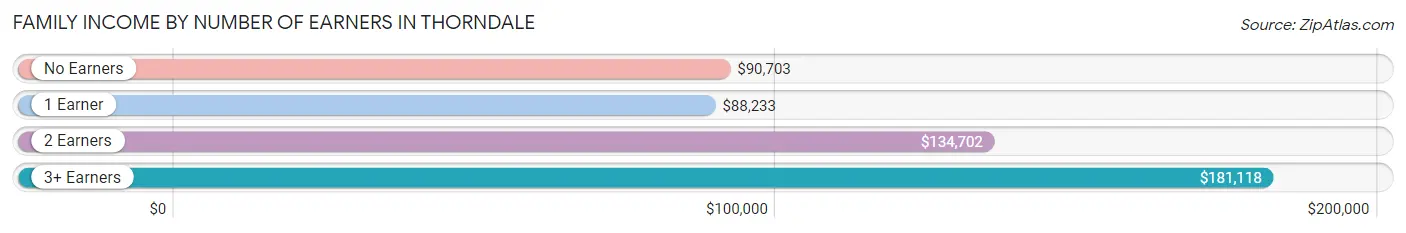
| Number of Earners | # Families | Median Income |
| No Earners | 93 (8.9%) | $90,703 |
| 1 Earner | 344 (32.9%) | $88,233 |
| 2 Earners | 480 (45.9%) | $134,702 |
| 3+ Earners | 128 (12.2%) | $181,118 |
| Total | 1,045 (100.0%) | $130,177 |
Household Income in Thorndale
Household Income Brackets in Thorndale
With 399 households falling in the category, the $100,000 to $149,999 income range is the most frequent in Thorndale, accounting for 27.5% of all households.
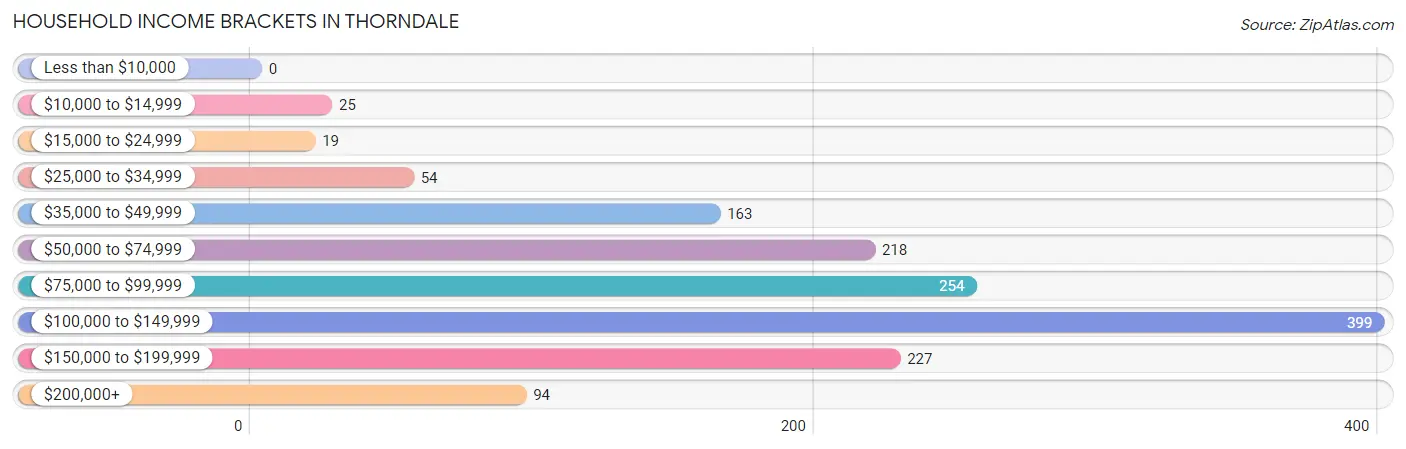
| Income Bracket | # Households | % Households |
| Less than $10,000 | 0 | 0.0% |
| $10,000 to $14,999 | 25 | 1.7% |
| $15,000 to $24,999 | 19 | 1.3% |
| $25,000 to $34,999 | 54 | 3.7% |
| $35,000 to $49,999 | 163 | 11.2% |
| $50,000 to $74,999 | 218 | 15.0% |
| $75,000 to $99,999 | 254 | 17.5% |
| $100,000 to $149,999 | 399 | 27.5% |
| $150,000 to $199,999 | 227 | 15.6% |
| $200,000+ | 94 | 6.5% |
Household Income by Householder Age in Thorndale
The median household income in Thorndale is $96,667, with the highest median household income of $137,868 found in the 45 to 64 years age bracket for the primary householder. A total of 421 households (29.0%) fall into this category. Meanwhile, the 15 to 24 years age bracket for the primary householder has the lowest median household income of $46,707, with 194 households (13.4%) in this group.
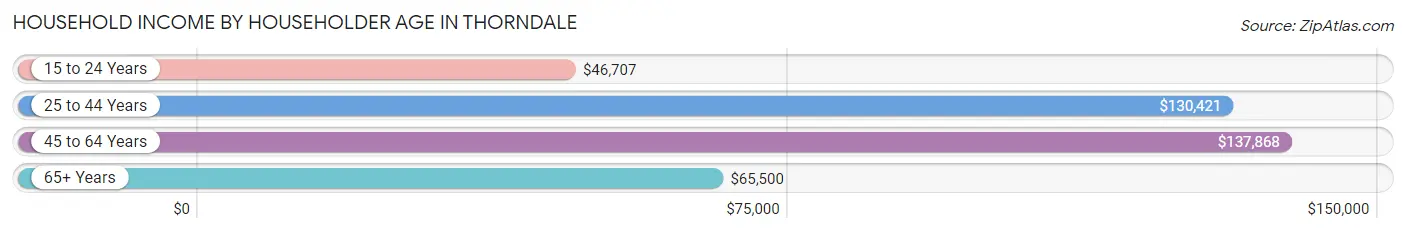
| Income Bracket | # Households | Median Income |
| 15 to 24 Years | 194 (13.4%) | $46,707 |
| 25 to 44 Years | 507 (34.9%) | $130,421 |
| 45 to 64 Years | 421 (29.0%) | $137,868 |
| 65+ Years | 330 (22.7%) | $65,500 |
| Total | 1,452 (100.0%) | $96,667 |
Poverty in Thorndale
Income Below Poverty by Sex and Age in Thorndale
With 2.2% poverty level for males and 2.5% for females among the residents of Thorndale, 75 year old and over males and 18 to 24 year old females are the most vulnerable to poverty, with 16 males (11.2%) and 27 females (15.1%) in their respective age groups living below the poverty level.
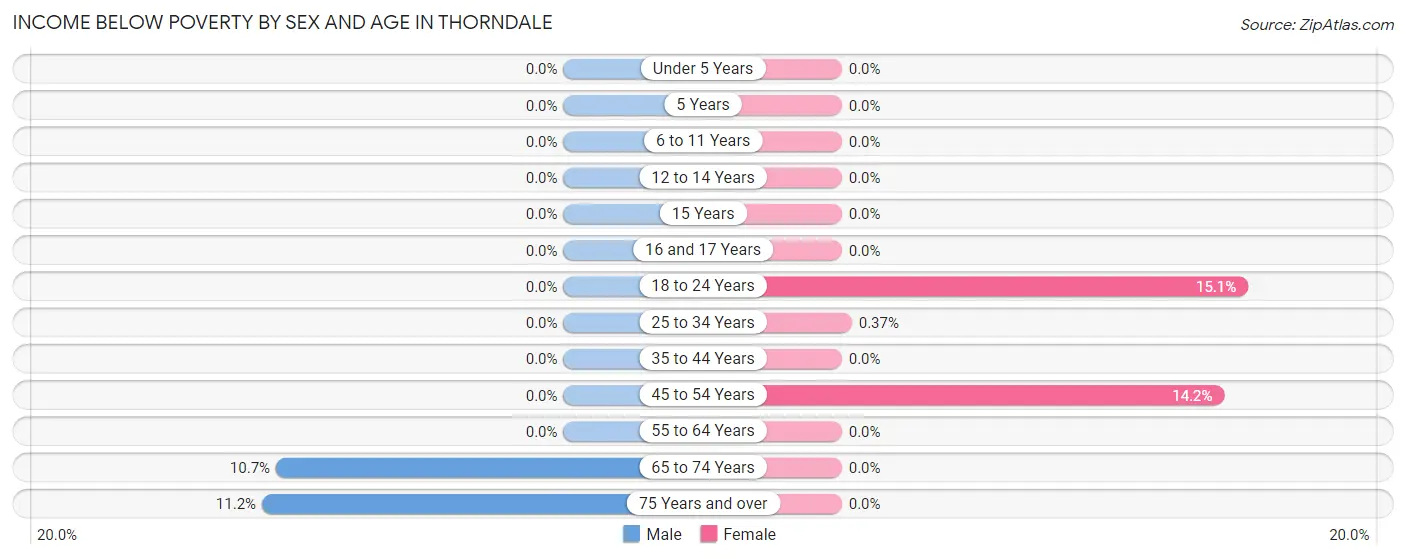
| Age Bracket | Male | Female |
| Under 5 Years | 0 (0.0%) | 0 (0.0%) |
| 5 Years | 0 (0.0%) | 0 (0.0%) |
| 6 to 11 Years | 0 (0.0%) | 0 (0.0%) |
| 12 to 14 Years | 0 (0.0%) | 0 (0.0%) |
| 15 Years | 0 (0.0%) | 0 (0.0%) |
| 16 and 17 Years | 0 (0.0%) | 0 (0.0%) |
| 18 to 24 Years | 0 (0.0%) | 27 (15.1%) |
| 25 to 34 Years | 0 (0.0%) | 1 (0.4%) |
| 35 to 44 Years | 0 (0.0%) | 0 (0.0%) |
| 45 to 54 Years | 0 (0.0%) | 25 (14.2%) |
| 55 to 64 Years | 0 (0.0%) | 0 (0.0%) |
| 65 to 74 Years | 24 (10.7%) | 0 (0.0%) |
| 75 Years and over | 16 (11.2%) | 0 (0.0%) |
| Total | 40 (2.2%) | 53 (2.5%) |
Income Above Poverty by Sex and Age in Thorndale
According to the poverty statistics in Thorndale, males aged under 5 years and females aged under 5 years are the age groups that are most secure financially, with 100.0% of males and 100.0% of females in these age groups living above the poverty line.
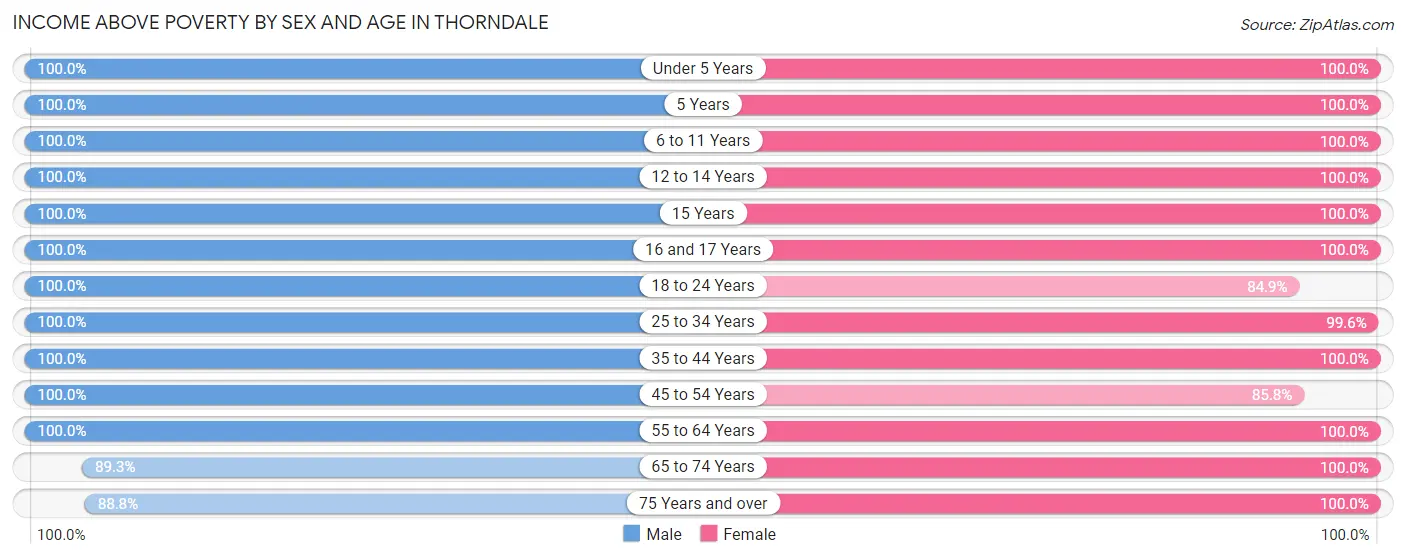
| Age Bracket | Male | Female |
| Under 5 Years | 81 (100.0%) | 173 (100.0%) |
| 5 Years | 8 (100.0%) | 5 (100.0%) |
| 6 to 11 Years | 176 (100.0%) | 279 (100.0%) |
| 12 to 14 Years | 37 (100.0%) | 162 (100.0%) |
| 15 Years | 7 (100.0%) | 9 (100.0%) |
| 16 and 17 Years | 19 (100.0%) | 27 (100.0%) |
| 18 to 24 Years | 136 (100.0%) | 152 (84.9%) |
| 25 to 34 Years | 230 (100.0%) | 267 (99.6%) |
| 35 to 44 Years | 430 (100.0%) | 287 (100.0%) |
| 45 to 54 Years | 157 (100.0%) | 151 (85.8%) |
| 55 to 64 Years | 207 (100.0%) | 267 (100.0%) |
| 65 to 74 Years | 201 (89.3%) | 241 (100.0%) |
| 75 Years and over | 127 (88.8%) | 78 (100.0%) |
| Total | 1,816 (97.8%) | 2,098 (97.5%) |
Income Below Poverty Among Married-Couple Families in Thorndale
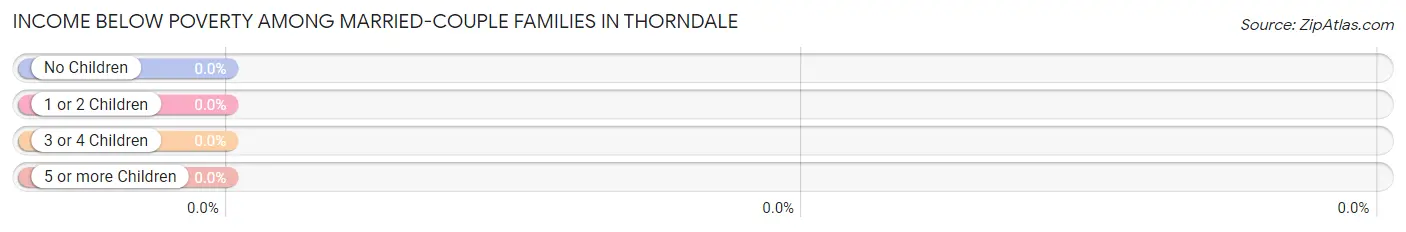
| Children | Above Poverty | Below Poverty |
| No Children | 536 (100.0%) | 0 (0.0%) |
| 1 or 2 Children | 207 (100.0%) | 0 (0.0%) |
| 3 or 4 Children | 138 (100.0%) | 0 (0.0%) |
| 5 or more Children | 7 (100.0%) | 0 (0.0%) |
| Total | 888 (100.0%) | 0 (0.0%) |
Income Below Poverty Among Single-Parent Households in Thorndale
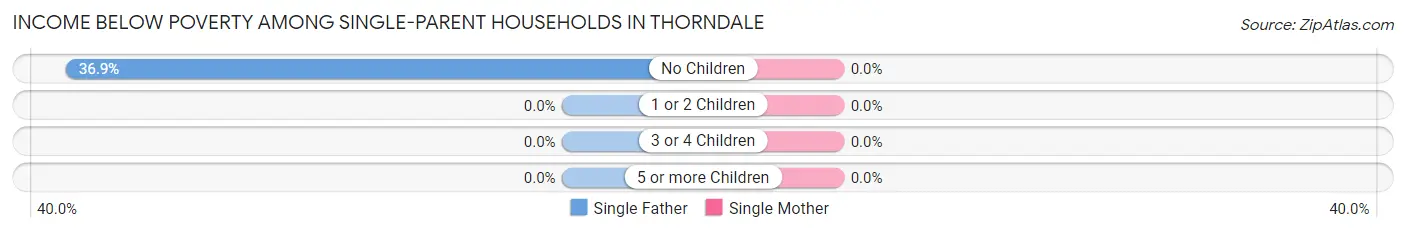
| Children | Single Father | Single Mother |
| No Children | 24 (36.9%) | 0 (0.0%) |
| 1 or 2 Children | 0 (0.0%) | 0 (0.0%) |
| 3 or 4 Children | 0 (0.0%) | 0 (0.0%) |
| 5 or more Children | 0 (0.0%) | 0 (0.0%) |
| Total | 24 (32.0%) | 0 (0.0%) |
Income Below Poverty Among Married-Couple vs Single-Parent Households in Thorndale
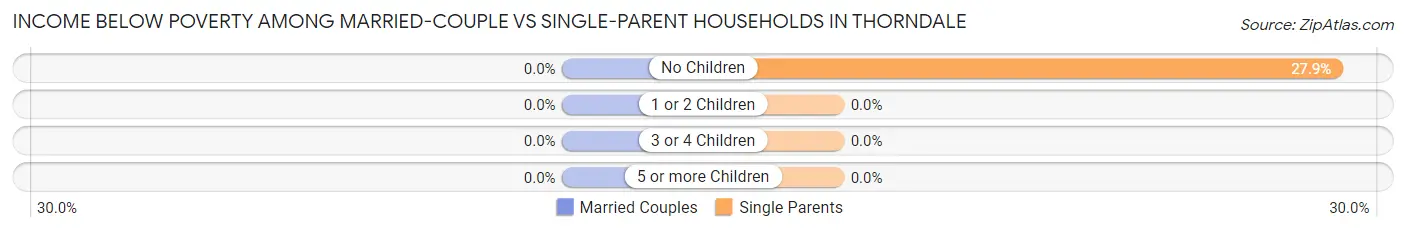
| Children | Married-Couple Families | Single-Parent Households |
| No Children | 0 (0.0%) | 24 (27.9%) |
| 1 or 2 Children | 0 (0.0%) | 0 (0.0%) |
| 3 or 4 Children | 0 (0.0%) | 0 (0.0%) |
| 5 or more Children | 0 (0.0%) | 0 (0.0%) |
| Total | 0 (0.0%) | 24 (15.3%) |
Race in Thorndale
The most populous races in Thorndale are White / Caucasian (3,285 | 82.0%), Hispanic or Latino (338 | 8.4%), and Black / African American (281 | 7.0%).
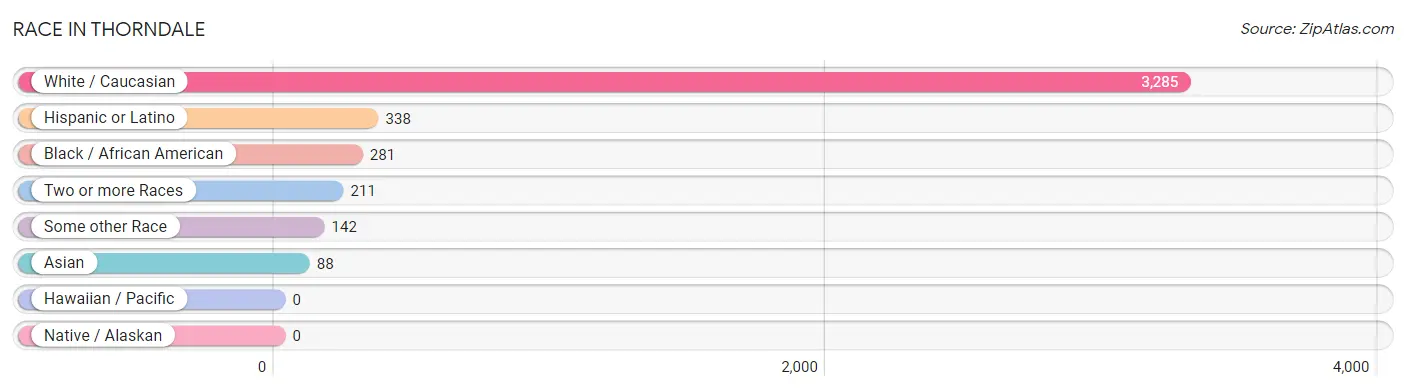
| Race | # Population | % Population |
| Asian | 88 | 2.2% |
| Black / African American | 281 | 7.0% |
| Hawaiian / Pacific | 0 | 0.0% |
| Hispanic or Latino | 338 | 8.4% |
| Native / Alaskan | 0 | 0.0% |
| White / Caucasian | 3,285 | 82.0% |
| Two or more Races | 211 | 5.3% |
| Some other Race | 142 | 3.5% |
| Total | 4,007 | 100.0% |
Ancestry in Thorndale
The most populous ancestries reported in Thorndale are Irish (1,231 | 30.7%), Italian (1,044 | 26.1%), German (536 | 13.4%), English (517 | 12.9%), and American (174 | 4.3%), together accounting for 87.4% of all Thorndale residents.
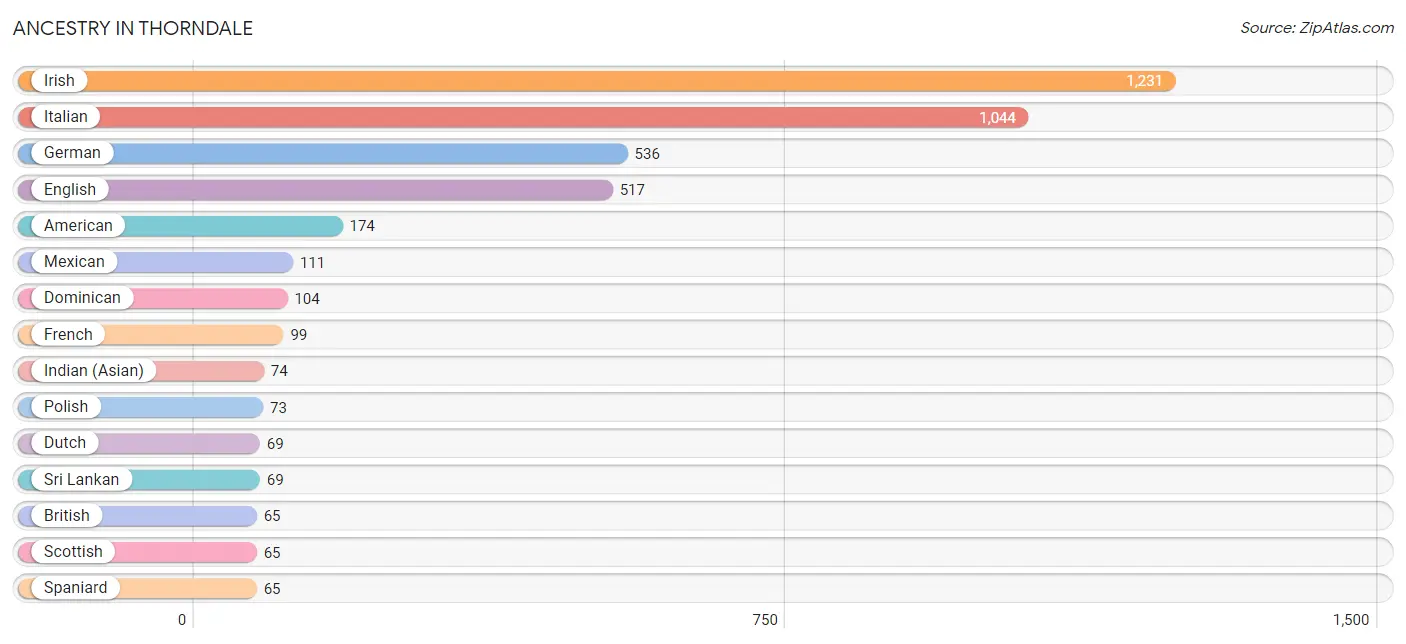
| Ancestry | # Population | % Population |
| American | 174 | 4.3% |
| Arab | 37 | 0.9% |
| British | 65 | 1.6% |
| Cherokee | 23 | 0.6% |
| Croatian | 19 | 0.5% |
| Dominican | 104 | 2.6% |
| Dutch | 69 | 1.7% |
| Ecuadorian | 48 | 1.2% |
| English | 517 | 12.9% |
| French | 99 | 2.5% |
| German | 536 | 13.4% |
| Greek | 21 | 0.5% |
| Hungarian | 17 | 0.4% |
| Indian (Asian) | 74 | 1.8% |
| Irish | 1,231 | 30.7% |
| Italian | 1,044 | 26.1% |
| Lebanese | 28 | 0.7% |
| Lithuanian | 35 | 0.9% |
| Mexican | 111 | 2.8% |
| Pennsylvania German | 56 | 1.4% |
| Polish | 73 | 1.8% |
| Portuguese | 17 | 0.4% |
| Russian | 48 | 1.2% |
| Scotch-Irish | 35 | 0.9% |
| Scottish | 65 | 1.6% |
| South American | 48 | 1.2% |
| Spaniard | 65 | 1.6% |
| Spanish | 10 | 0.3% |
| Sri Lankan | 69 | 1.7% |
| Subsaharan African | 35 | 0.9% |
| Swedish | 20 | 0.5% |
| Swiss | 15 | 0.4% |
| Syrian | 9 | 0.2% |
| Ukrainian | 1 | 0.0% |
| Welsh | 20 | 0.5% | View All 35 Rows |
Immigrants in Thorndale
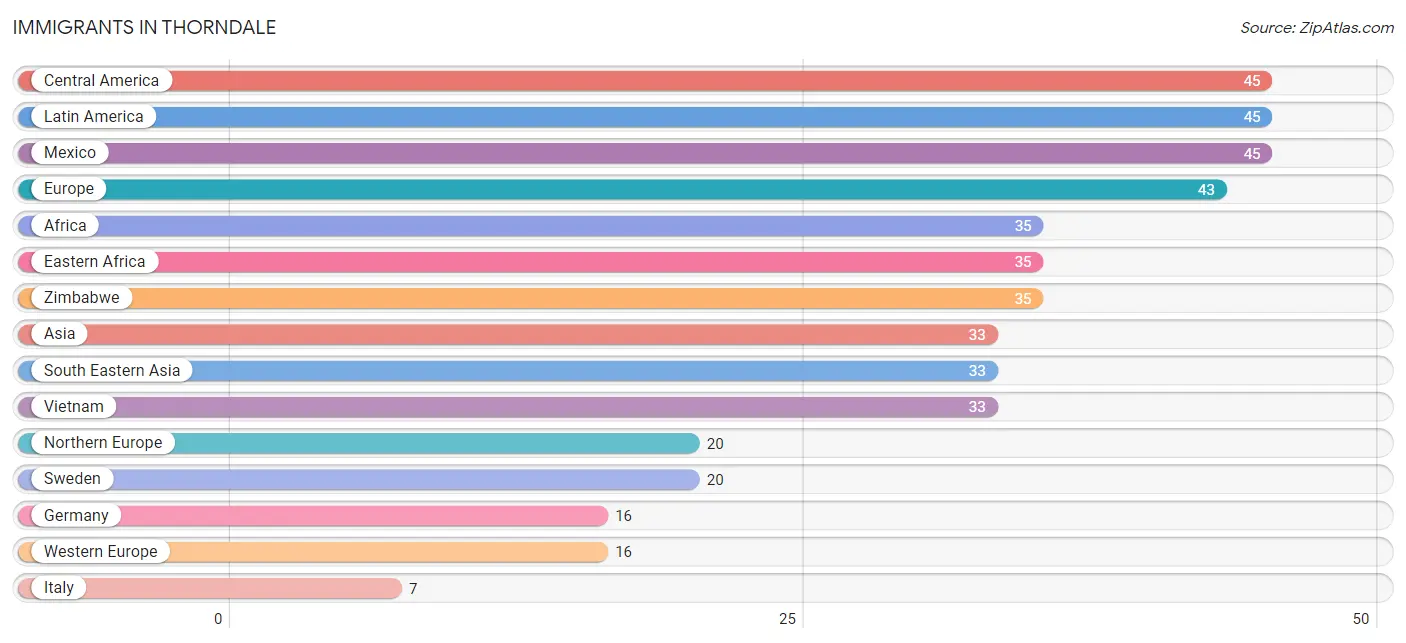
The most numerous immigrant groups reported in Thorndale came from Central America (45 | 1.1%), Latin America (45 | 1.1%), Mexico (45 | 1.1%), Europe (43 | 1.1%), and Africa (35 | 0.9%), together accounting for 5.3% of all Thorndale residents.
| Immigration Origin | # Population | % Population |
| Africa | 35 | 0.9% |
| Asia | 33 | 0.8% |
| Canada | 1 | 0.0% |
| Central America | 45 | 1.1% |
| Eastern Africa | 35 | 0.9% |
| Europe | 43 | 1.1% |
| Germany | 16 | 0.4% |
| Italy | 7 | 0.2% |
| Latin America | 45 | 1.1% |
| Mexico | 45 | 1.1% |
| Northern Europe | 20 | 0.5% |
| South Eastern Asia | 33 | 0.8% |
| Southern Europe | 7 | 0.2% |
| Sweden | 20 | 0.5% |
| Vietnam | 33 | 0.8% |
| Western Europe | 16 | 0.4% |
| Zimbabwe | 35 | 0.9% | View All 17 Rows |
Sex and Age in Thorndale
Sex and Age in Thorndale
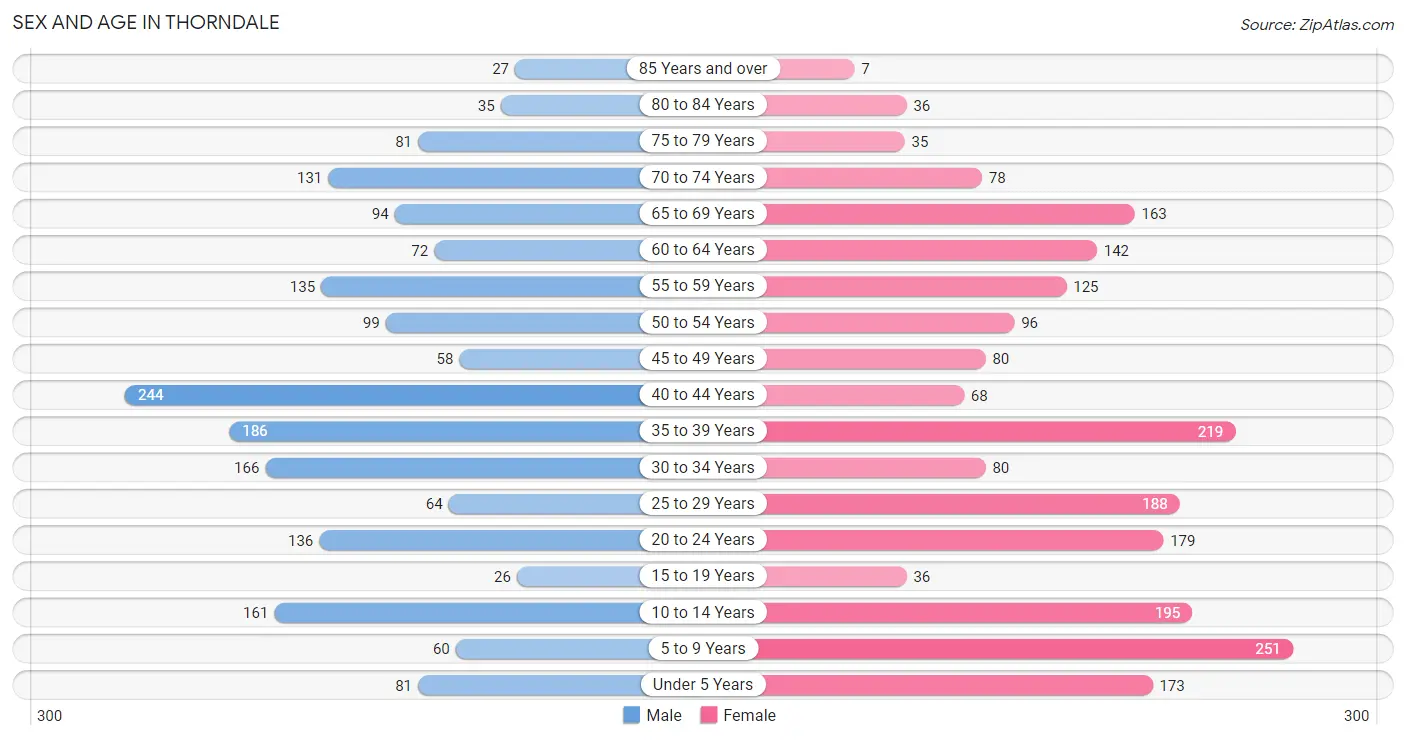
The most populous age groups in Thorndale are 40 to 44 Years (244 | 13.2%) for men and 5 to 9 Years (251 | 11.7%) for women.
| Age Bracket | Male | Female |
| Under 5 Years | 81 (4.4%) | 173 (8.0%) |
| 5 to 9 Years | 60 (3.2%) | 251 (11.7%) |
| 10 to 14 Years | 161 (8.7%) | 195 (9.1%) |
| 15 to 19 Years | 26 (1.4%) | 36 (1.7%) |
| 20 to 24 Years | 136 (7.3%) | 179 (8.3%) |
| 25 to 29 Years | 64 (3.5%) | 188 (8.7%) |
| 30 to 34 Years | 166 (8.9%) | 80 (3.7%) |
| 35 to 39 Years | 186 (10.0%) | 219 (10.2%) |
| 40 to 44 Years | 244 (13.2%) | 68 (3.2%) |
| 45 to 49 Years | 58 (3.1%) | 80 (3.7%) |
| 50 to 54 Years | 99 (5.3%) | 96 (4.5%) |
| 55 to 59 Years | 135 (7.3%) | 125 (5.8%) |
| 60 to 64 Years | 72 (3.9%) | 142 (6.6%) |
| 65 to 69 Years | 94 (5.1%) | 163 (7.6%) |
| 70 to 74 Years | 131 (7.1%) | 78 (3.6%) |
| 75 to 79 Years | 81 (4.4%) | 35 (1.6%) |
| 80 to 84 Years | 35 (1.9%) | 36 (1.7%) |
| 85 Years and over | 27 (1.5%) | 7 (0.3%) |
| Total | 1,856 (100.0%) | 2,151 (100.0%) |
Families and Households in Thorndale
Median Family Size in Thorndale
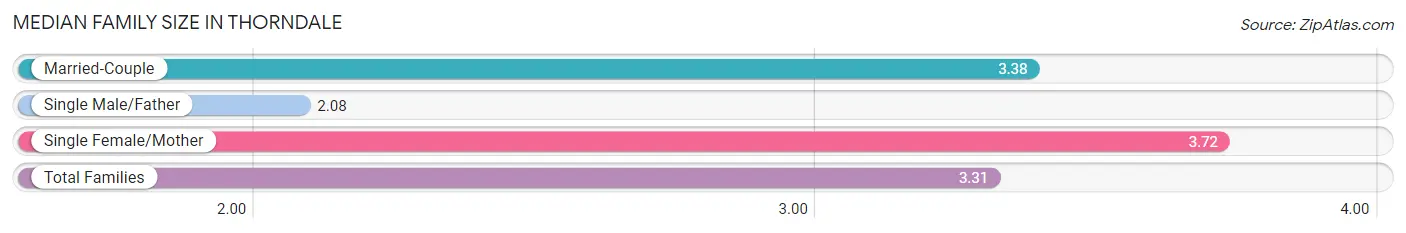
The median family size in Thorndale is 3.31 persons per family, with single female/mother families (82 | 7.9%) accounting for the largest median family size of 3.72 persons per family. On the other hand, single male/father families (75 | 7.2%) represent the smallest median family size with 2.08 persons per family.
| Family Type | # Families | Family Size |
| Married-Couple | 888 (85.0%) | 3.38 |
| Single Male/Father | 75 (7.2%) | 2.08 |
| Single Female/Mother | 82 (7.9%) | 3.72 |
| Total Families | 1,045 (100.0%) | 3.31 |
Median Household Size in Thorndale
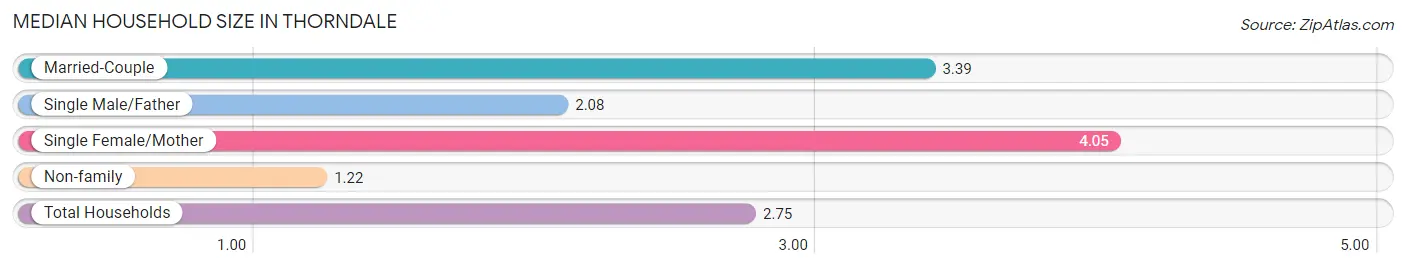
The median household size in Thorndale is 2.75 persons per household, with single female/mother households (82 | 5.7%) accounting for the largest median household size of 4.05 persons per household. non-family households (407 | 28.0%) represent the smallest median household size with 1.22 persons per household.
| Household Type | # Households | Household Size |
| Married-Couple | 888 (61.2%) | 3.39 |
| Single Male/Father | 75 (5.2%) | 2.08 |
| Single Female/Mother | 82 (5.7%) | 4.05 |
| Non-family | 407 (28.0%) | 1.22 |
| Total Households | 1,452 (100.0%) | 2.75 |
Household Size by Marriage Status in Thorndale
Out of a total of 1,452 households in Thorndale, 1,045 (72.0%) are family households, while 407 (28.0%) are nonfamily households. The most numerous type of family households are 2-person households, comprising 477, and the most common type of nonfamily households are 1-person households, comprising 301.
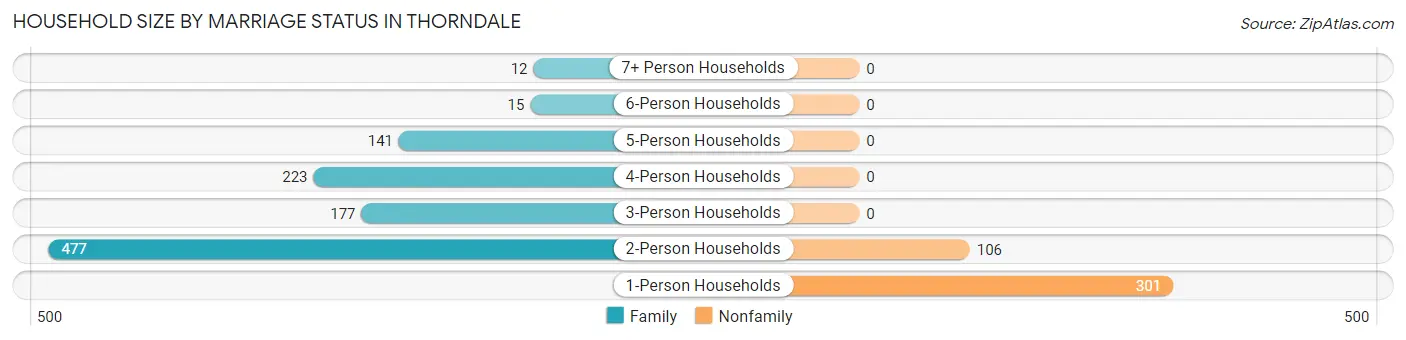
| Household Size | Family Households | Nonfamily Households |
| 1-Person Households | - | 301 (20.7%) |
| 2-Person Households | 477 (32.9%) | 106 (7.3%) |
| 3-Person Households | 177 (12.2%) | 0 (0.0%) |
| 4-Person Households | 223 (15.4%) | 0 (0.0%) |
| 5-Person Households | 141 (9.7%) | 0 (0.0%) |
| 6-Person Households | 15 (1.0%) | 0 (0.0%) |
| 7+ Person Households | 12 (0.8%) | 0 (0.0%) |
| Total | 1,045 (72.0%) | 407 (28.0%) |
Female Fertility in Thorndale
Fertility by Age in Thorndale
Average fertility rate in Thorndale is 79.0 births per 1,000 women. Women in the age bracket of 20 to 34 years have the highest fertility rate with 119.0 births per 1,000 women. Women in the age bracket of 20 to 34 years acount for 79.1% of all women with births.
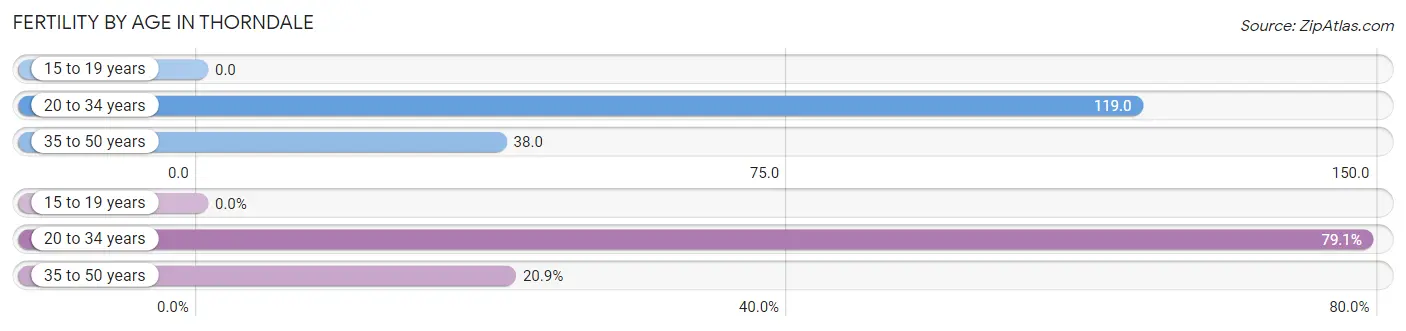
| Age Bracket | Women with Births | Births / 1,000 Women |
| 15 to 19 years | 0 (0.0%) | 0.0 |
| 20 to 34 years | 53 (79.1%) | 119.0 |
| 35 to 50 years | 14 (20.9%) | 38.0 |
| Total | 67 (100.0%) | 79.0 |
Fertility by Age by Marriage Status in Thorndale
59.7% of women with births (67) in Thorndale are married. The highest percentage of unmarried women with births falls into 20 to 34 years age bracket with 50.9% of them unmarried at the time of birth, while the lowest percentage of unmarried women with births belong to 35 to 50 years age bracket with 0.0% of them unmarried.
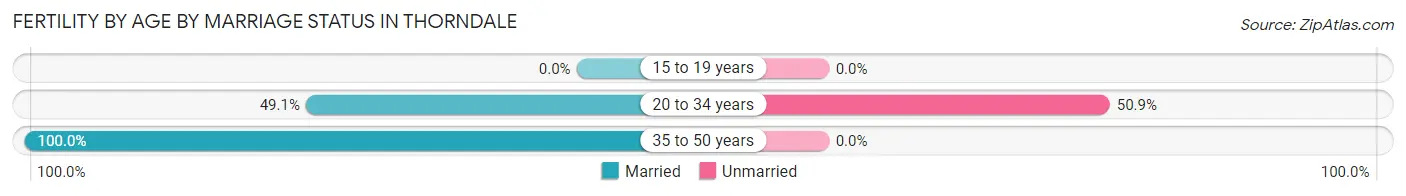
| Age Bracket | Married | Unmarried |
| 15 to 19 years | 0 (0.0%) | 0 (0.0%) |
| 20 to 34 years | 26 (49.1%) | 27 (50.9%) |
| 35 to 50 years | 14 (100.0%) | 0 (0.0%) |
| Total | 40 (59.7%) | 27 (40.3%) |
Fertility by Education in Thorndale
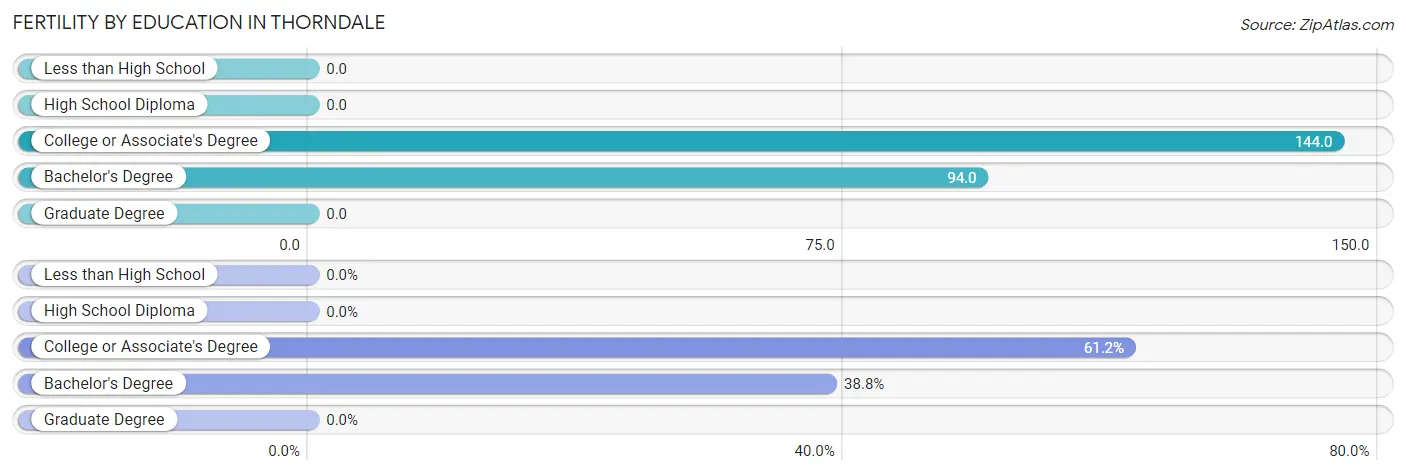
| Educational Attainment | Women with Births | Births / 1,000 Women |
| Less than High School | 0 (0.0%) | 0.0 |
| High School Diploma | 0 (0.0%) | 0.0 |
| College or Associate's Degree | 41 (61.2%) | 144.0 |
| Bachelor's Degree | 26 (38.8%) | 94.0 |
| Graduate Degree | 0 (0.0%) | 0.0 |
| Total | 67 (100.0%) | 79.0 |
Fertility by Education by Marriage Status in Thorndale
40.3% of women with births in Thorndale are unmarried. Women with the educational attainment of bachelor's degree are most likely to be married with 100.0% of them married at childbirth, while women with the educational attainment of college or associate's degree are least likely to be married with 65.8% of them unmarried at childbirth.
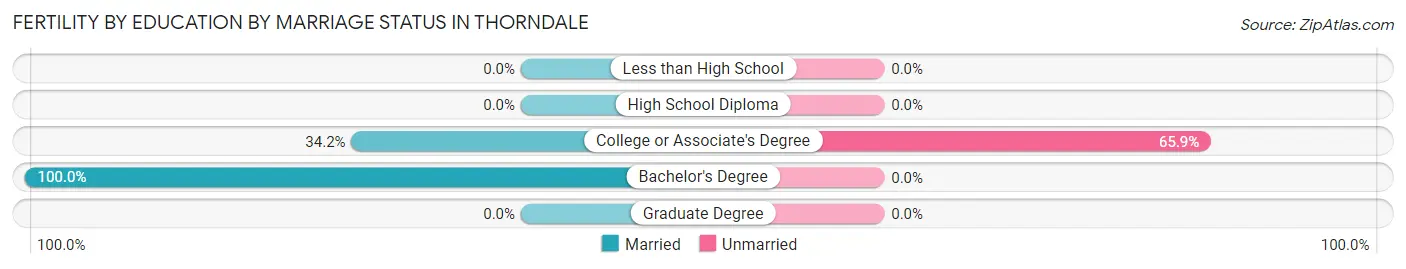
| Educational Attainment | Married | Unmarried |
| Less than High School | 0 (0.0%) | 0 (0.0%) |
| High School Diploma | 0 (0.0%) | 0 (0.0%) |
| College or Associate's Degree | 14 (34.2%) | 27 (65.8%) |
| Bachelor's Degree | 26 (100.0%) | 0 (0.0%) |
| Graduate Degree | 0 (0.0%) | 0 (0.0%) |
| Total | 40 (59.7%) | 27 (40.3%) |
Employment Characteristics in Thorndale
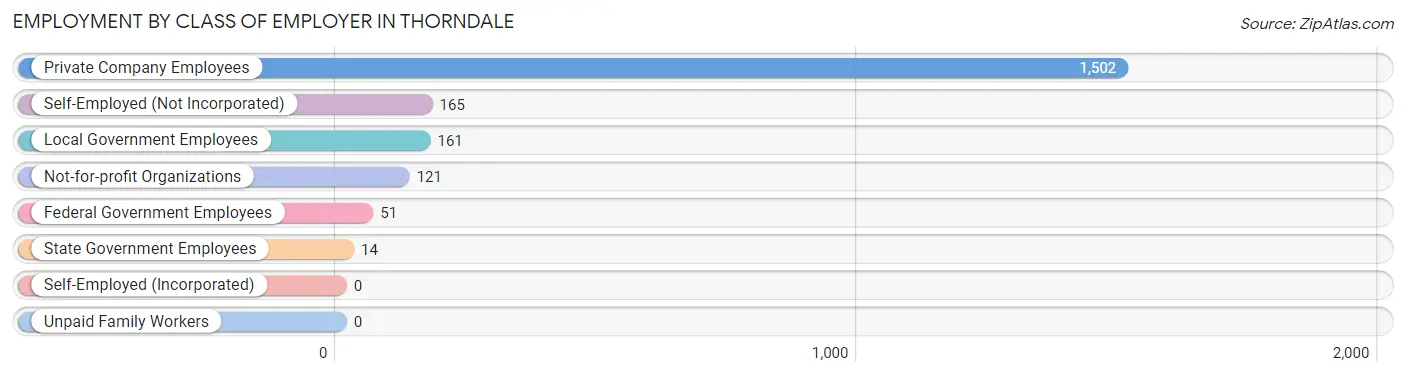
Employment by Class of Employer in Thorndale
Among the 2,014 employed individuals in Thorndale, private company employees (1,502 | 74.6%), self-employed (not incorporated) (165 | 8.2%), and local government employees (161 | 8.0%) make up the most common classes of employment.
| Employer Class | # Employees | % Employees |
| Private Company Employees | 1,502 | 74.6% |
| Self-Employed (Incorporated) | 0 | 0.0% |
| Self-Employed (Not Incorporated) | 165 | 8.2% |
| Not-for-profit Organizations | 121 | 6.0% |
| Local Government Employees | 161 | 8.0% |
| State Government Employees | 14 | 0.7% |
| Federal Government Employees | 51 | 2.5% |
| Unpaid Family Workers | 0 | 0.0% |
| Total | 2,014 | 100.0% |
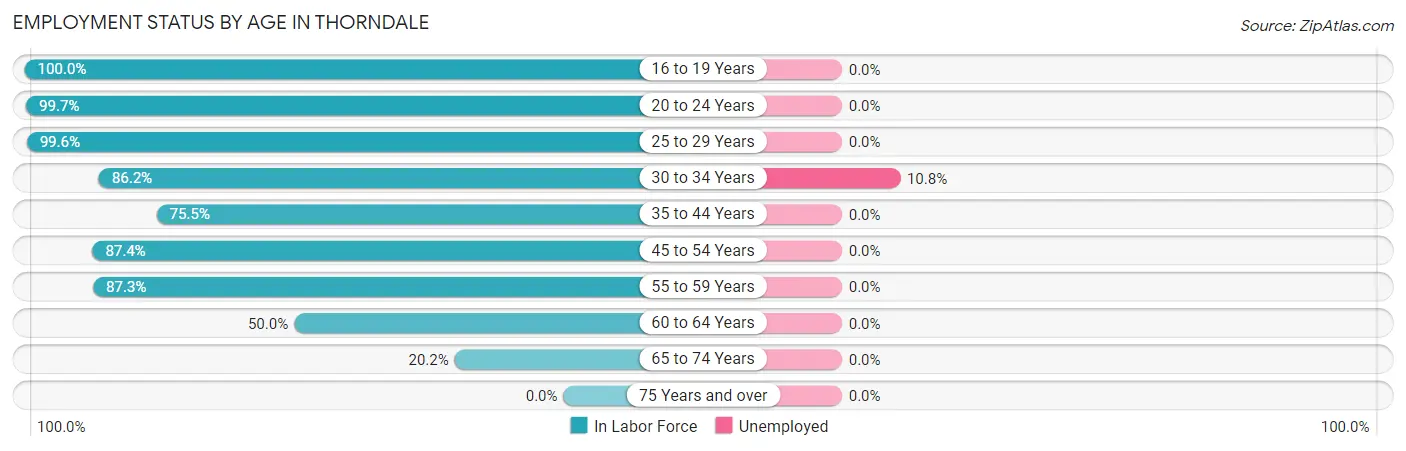
Employment Status by Age in Thorndale
According to the labor force statistics for Thorndale, out of the total population over 16 years of age (3,070), 67.9% or 2,085 individuals are in the labor force, with 1.1% or 23 of them unemployed. The age group with the highest labor force participation rate is 16 to 19 years, with 100.0% or 46 individuals in the labor force. Within the labor force, the 30 to 34 years age range has the highest percentage of unemployed individuals, with 10.8% or 23 of them being unemployed.
| Age Bracket | In Labor Force | Unemployed |
| 16 to 19 Years | 46 (100.0%) | 0 (0.0%) |
| 20 to 24 Years | 314 (99.7%) | 0 (0.0%) |
| 25 to 29 Years | 251 (99.6%) | 0 (0.0%) |
| 30 to 34 Years | 212 (86.2%) | 23 (10.8%) |
| 35 to 44 Years | 541 (75.5%) | 0 (0.0%) |
| 45 to 54 Years | 291 (87.4%) | 0 (0.0%) |
| 55 to 59 Years | 227 (87.3%) | 0 (0.0%) |
| 60 to 64 Years | 107 (50.0%) | 0 (0.0%) |
| 65 to 74 Years | 94 (20.2%) | 0 (0.0%) |
| 75 Years and over | 0 (0.0%) | 0 (0.0%) |
| Total | 2,085 (67.9%) | 23 (1.1%) |
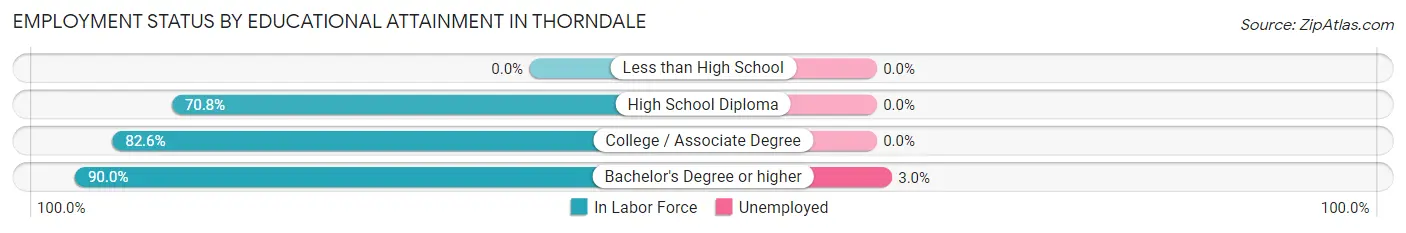
Employment Status by Educational Attainment in Thorndale
According to labor force statistics for Thorndale, 80.6% of individuals (1,630) out of the total population between 25 and 64 years of age (2,022) are in the labor force, with 1.4% or 23 of them being unemployed. The group with the highest labor force participation rate are those with the educational attainment of bachelor's degree or higher, with 90.0% or 776 individuals in the labor force. Within the labor force, individuals with bachelor's degree or higher education have the highest percentage of unemployment, with 3.0% or 23 of them being unemployed.
| Educational Attainment | In Labor Force | Unemployed |
| Less than High School | 0 (0.0%) | 0 (0.0%) |
| High School Diploma | 501 (70.8%) | 0 (0.0%) |
| College / Associate Degree | 352 (82.6%) | 0 (0.0%) |
| Bachelor's Degree or higher | 776 (90.0%) | 26 (3.0%) |
| Total | 1,630 (80.6%) | 28 (1.4%) |
Employment Occupations by Sex in Thorndale
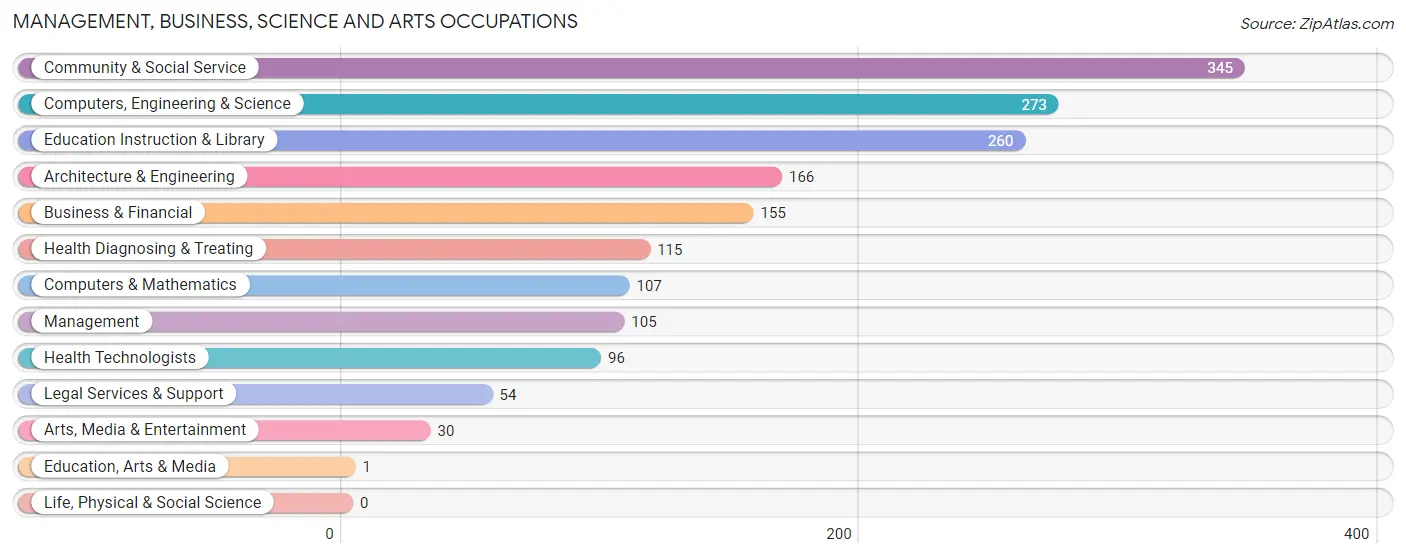
Management, Business, Science and Arts Occupations
The most common Management, Business, Science and Arts occupations in Thorndale are Community & Social Service (345 | 16.8%), Computers, Engineering & Science (273 | 13.3%), Education Instruction & Library (260 | 12.6%), Architecture & Engineering (166 | 8.1%), and Business & Financial (155 | 7.5%).
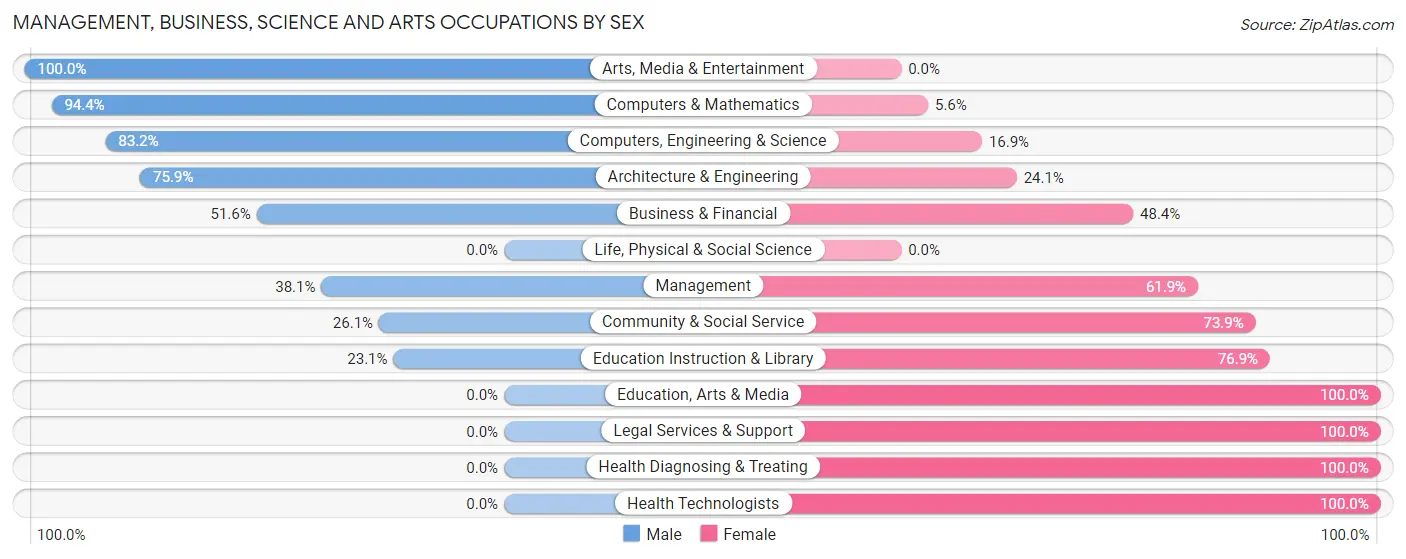
Management, Business, Science and Arts Occupations by Sex
Within the Management, Business, Science and Arts occupations in Thorndale, the most male-oriented occupations are Arts, Media & Entertainment (100.0%), Computers & Mathematics (94.4%), and Computers, Engineering & Science (83.2%), while the most female-oriented occupations are Education, Arts & Media (100.0%), Legal Services & Support (100.0%), and Health Diagnosing & Treating (100.0%).
| Occupation | Male | Female |
| Management | 40 (38.1%) | 65 (61.9%) |
| Business & Financial | 80 (51.6%) | 75 (48.4%) |
| Computers, Engineering & Science | 227 (83.2%) | 46 (16.9%) |
| Computers & Mathematics | 101 (94.4%) | 6 (5.6%) |
| Architecture & Engineering | 126 (75.9%) | 40 (24.1%) |
| Life, Physical & Social Science | 0 (0.0%) | 0 (0.0%) |
| Community & Social Service | 90 (26.1%) | 255 (73.9%) |
| Education, Arts & Media | 0 (0.0%) | 1 (100.0%) |
| Legal Services & Support | 0 (0.0%) | 54 (100.0%) |
| Education Instruction & Library | 60 (23.1%) | 200 (76.9%) |
| Arts, Media & Entertainment | 30 (100.0%) | 0 (0.0%) |
| Health Diagnosing & Treating | 0 (0.0%) | 115 (100.0%) |
| Health Technologists | 0 (0.0%) | 96 (100.0%) |
| Total (Category) | 437 (44.0%) | 556 (56.0%) |
| Total (Overall) | 1,033 (50.1%) | 1,027 (49.8%) |
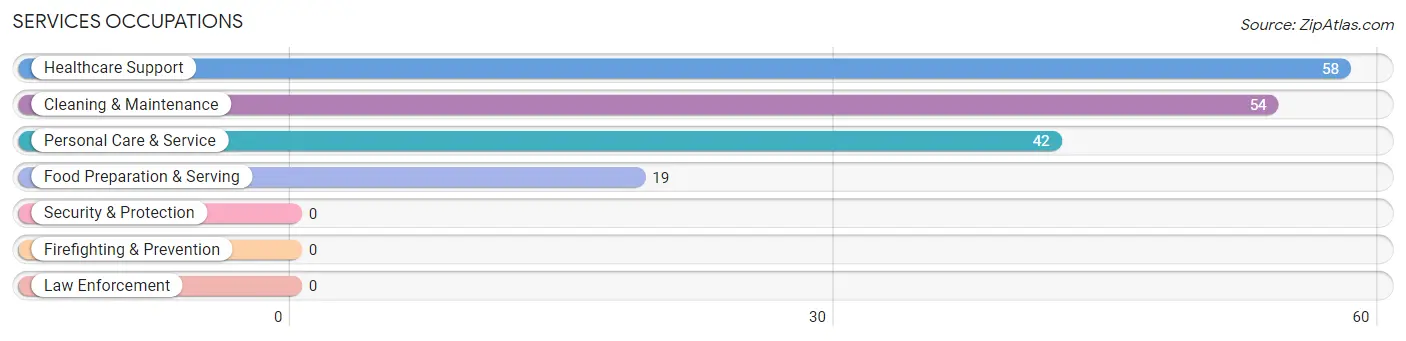
Services Occupations
The most common Services occupations in Thorndale are Healthcare Support (58 | 2.8%), Cleaning & Maintenance (54 | 2.6%), Personal Care & Service (42 | 2.0%), and Food Preparation & Serving (19 | 0.9%).
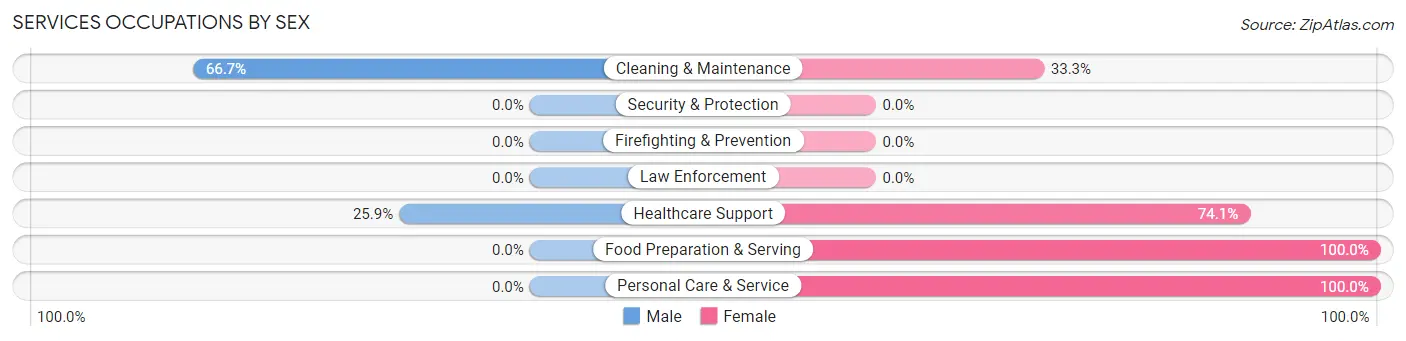
Services Occupations by Sex
Within the Services occupations in Thorndale, the most male-oriented occupations are Cleaning & Maintenance (66.7%), and Healthcare Support (25.9%), while the most female-oriented occupations are Food Preparation & Serving (100.0%), Personal Care & Service (100.0%), and Healthcare Support (74.1%).
| Occupation | Male | Female |
| Healthcare Support | 15 (25.9%) | 43 (74.1%) |
| Security & Protection | 0 (0.0%) | 0 (0.0%) |
| Firefighting & Prevention | 0 (0.0%) | 0 (0.0%) |
| Law Enforcement | 0 (0.0%) | 0 (0.0%) |
| Food Preparation & Serving | 0 (0.0%) | 19 (100.0%) |
| Cleaning & Maintenance | 36 (66.7%) | 18 (33.3%) |
| Personal Care & Service | 0 (0.0%) | 42 (100.0%) |
| Total (Category) | 51 (29.5%) | 122 (70.5%) |
| Total (Overall) | 1,033 (50.1%) | 1,027 (49.8%) |
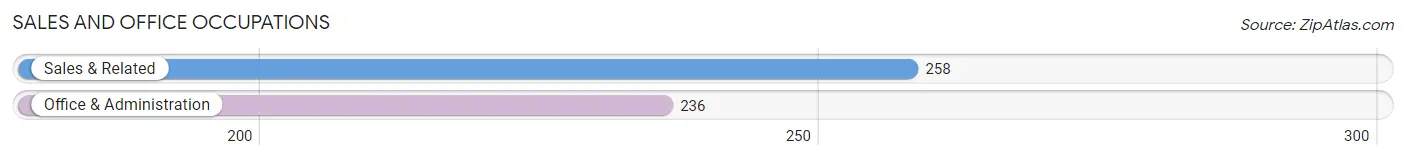
Sales and Office Occupations
The most common Sales and Office occupations in Thorndale are Sales & Related (258 | 12.5%), and Office & Administration (236 | 11.5%).
Sales and Office Occupations by Sex
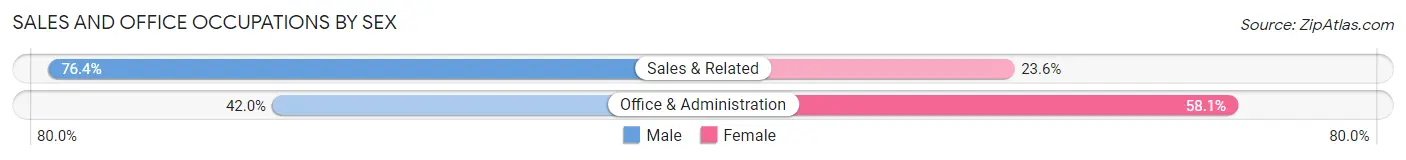
| Occupation | Male | Female |
| Sales & Related | 197 (76.4%) | 61 (23.6%) |
| Office & Administration | 99 (41.9%) | 137 (58.1%) |
| Total (Category) | 296 (59.9%) | 198 (40.1%) |
| Total (Overall) | 1,033 (50.1%) | 1,027 (49.8%) |
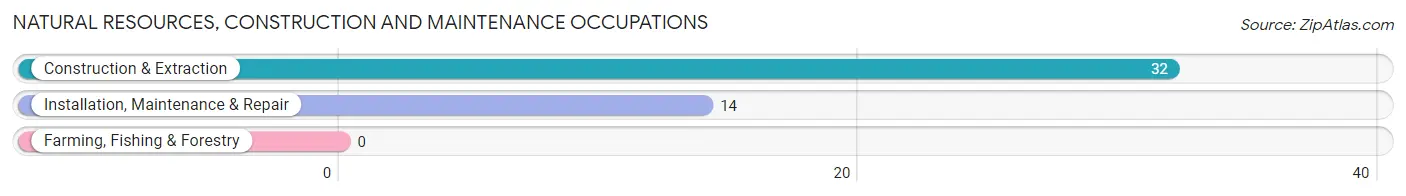
Natural Resources, Construction and Maintenance Occupations
The most common Natural Resources, Construction and Maintenance occupations in Thorndale are Construction & Extraction (32 | 1.5%), and Installation, Maintenance & Repair (14 | 0.7%).
Natural Resources, Construction and Maintenance Occupations by Sex
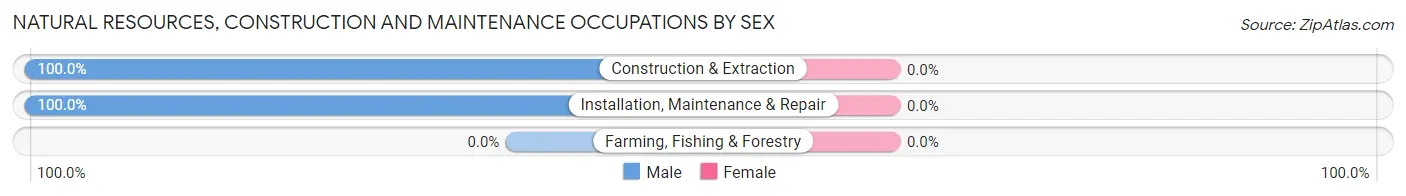
| Occupation | Male | Female |
| Farming, Fishing & Forestry | 0 (0.0%) | 0 (0.0%) |
| Construction & Extraction | 32 (100.0%) | 0 (0.0%) |
| Installation, Maintenance & Repair | 14 (100.0%) | 0 (0.0%) |
| Total (Category) | 46 (100.0%) | 0 (0.0%) |
| Total (Overall) | 1,033 (50.1%) | 1,027 (49.8%) |
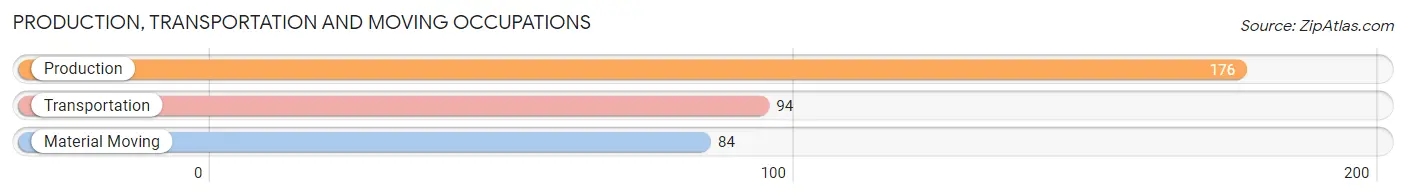
Production, Transportation and Moving Occupations
The most common Production, Transportation and Moving occupations in Thorndale are Production (176 | 8.5%), Transportation (94 | 4.6%), and Material Moving (84 | 4.1%).
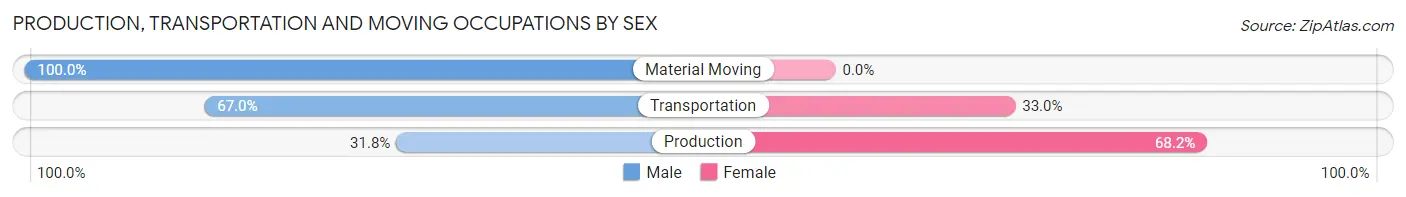
Production, Transportation and Moving Occupations by Sex
| Occupation | Male | Female |
| Production | 56 (31.8%) | 120 (68.2%) |
| Transportation | 63 (67.0%) | 31 (33.0%) |
| Material Moving | 84 (100.0%) | 0 (0.0%) |
| Total (Category) | 203 (57.3%) | 151 (42.7%) |
| Total (Overall) | 1,033 (50.1%) | 1,027 (49.8%) |
Employment Industries by Sex in Thorndale
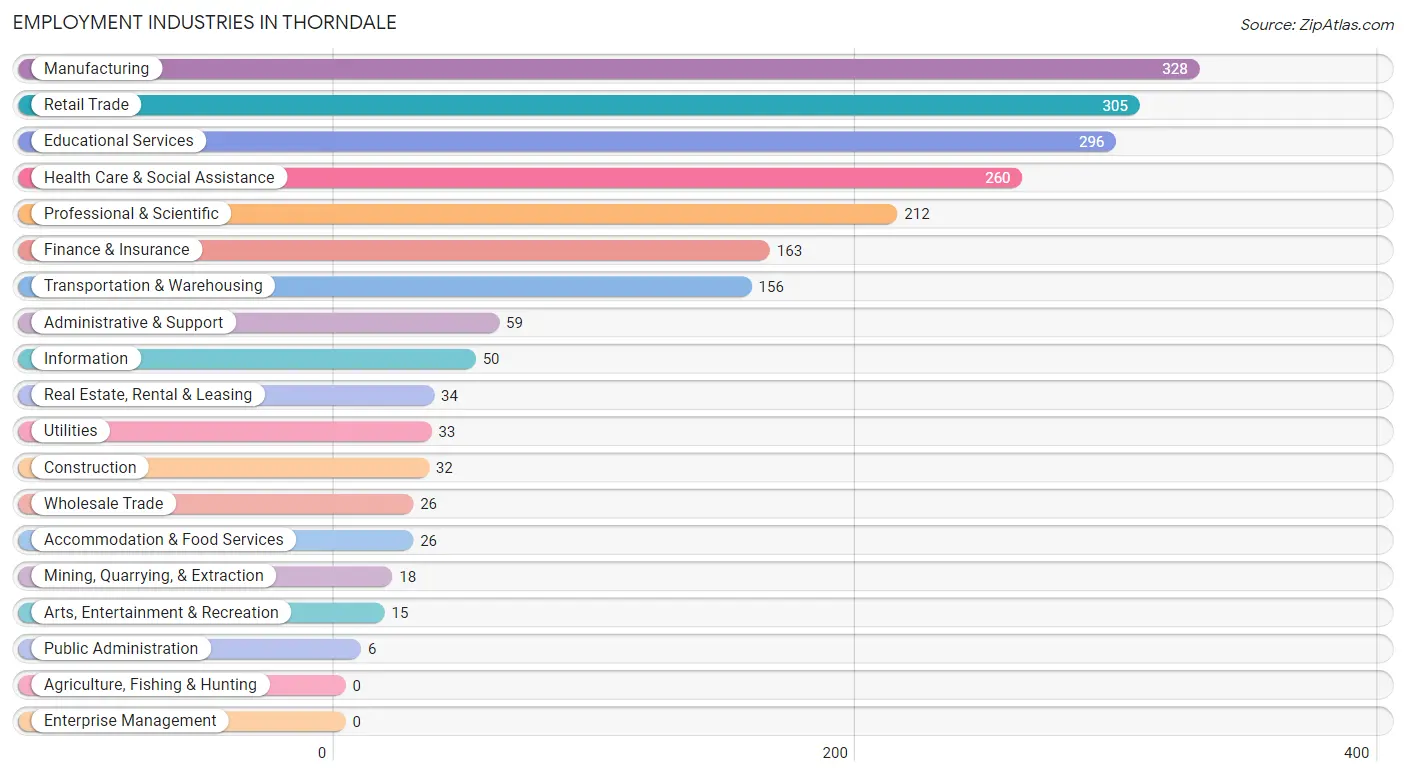
Employment Industries in Thorndale
The major employment industries in Thorndale include Manufacturing (328 | 15.9%), Retail Trade (305 | 14.8%), Educational Services (296 | 14.4%), Health Care & Social Assistance (260 | 12.6%), and Professional & Scientific (212 | 10.3%).
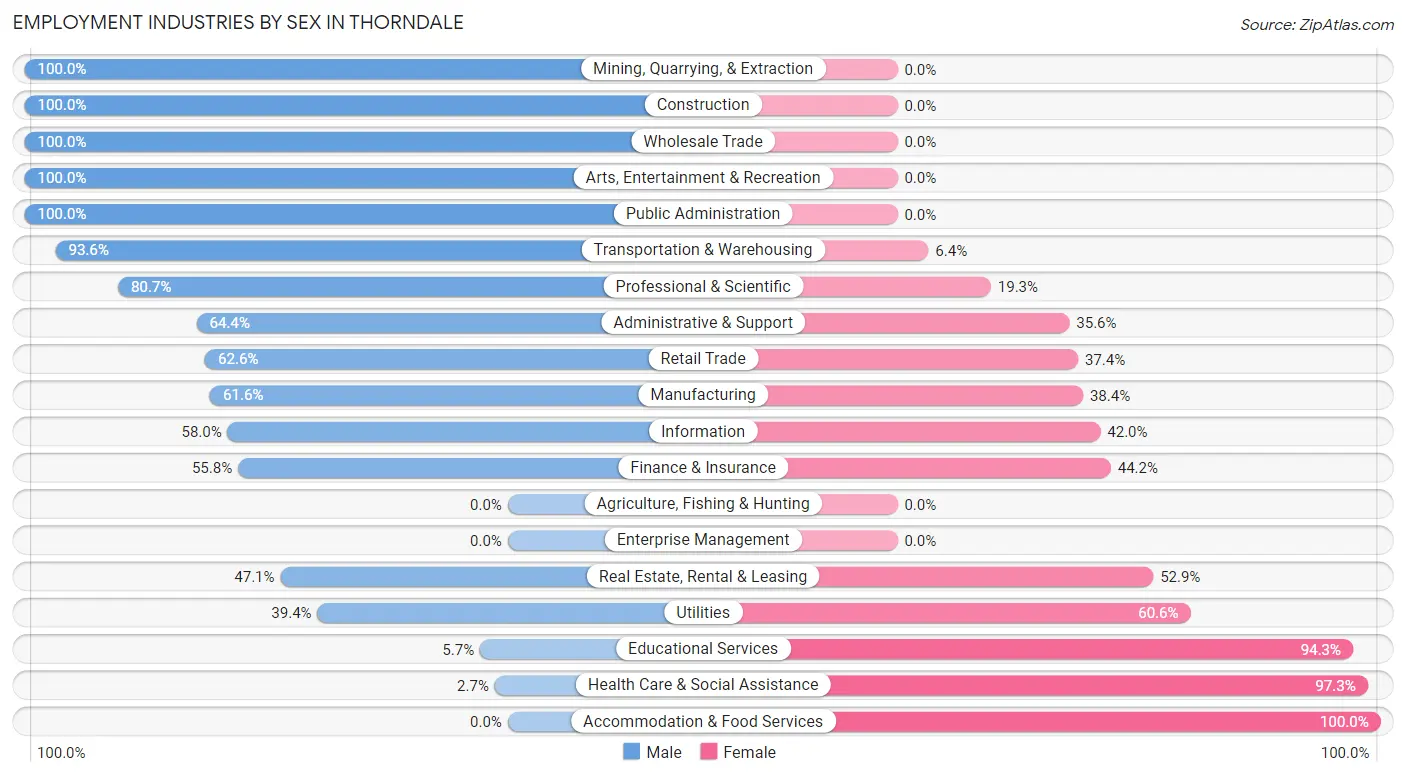
Employment Industries by Sex in Thorndale
The Thorndale industries that see more men than women are Mining, Quarrying, & Extraction (100.0%), Construction (100.0%), and Wholesale Trade (100.0%), whereas the industries that tend to have a higher number of women are Accommodation & Food Services (100.0%), Health Care & Social Assistance (97.3%), and Educational Services (94.3%).
| Industry | Male | Female |
| Agriculture, Fishing & Hunting | 0 (0.0%) | 0 (0.0%) |
| Mining, Quarrying, & Extraction | 18 (100.0%) | 0 (0.0%) |
| Construction | 32 (100.0%) | 0 (0.0%) |
| Manufacturing | 202 (61.6%) | 126 (38.4%) |
| Wholesale Trade | 26 (100.0%) | 0 (0.0%) |
| Retail Trade | 191 (62.6%) | 114 (37.4%) |
| Transportation & Warehousing | 146 (93.6%) | 10 (6.4%) |
| Utilities | 13 (39.4%) | 20 (60.6%) |
| Information | 29 (58.0%) | 21 (42.0%) |
| Finance & Insurance | 91 (55.8%) | 72 (44.2%) |
| Real Estate, Rental & Leasing | 16 (47.1%) | 18 (52.9%) |
| Professional & Scientific | 171 (80.7%) | 41 (19.3%) |
| Enterprise Management | 0 (0.0%) | 0 (0.0%) |
| Administrative & Support | 38 (64.4%) | 21 (35.6%) |
| Educational Services | 17 (5.7%) | 279 (94.3%) |
| Health Care & Social Assistance | 7 (2.7%) | 253 (97.3%) |
| Arts, Entertainment & Recreation | 15 (100.0%) | 0 (0.0%) |
| Accommodation & Food Services | 0 (0.0%) | 26 (100.0%) |
| Public Administration | 6 (100.0%) | 0 (0.0%) |
| Total | 1,033 (50.1%) | 1,027 (49.8%) |
Education in Thorndale
School Enrollment in Thorndale
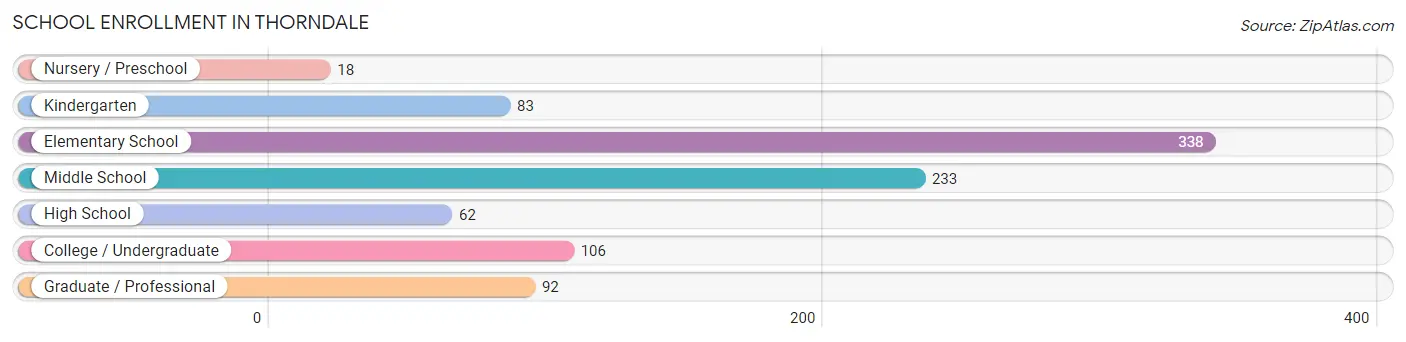
The most common levels of schooling among the 932 students in Thorndale are elementary school (338 | 36.3%), middle school (233 | 25.0%), and college / undergraduate (106 | 11.4%).
| School Level | # Students | % Students |
| Nursery / Preschool | 18 | 1.9% |
| Kindergarten | 83 | 8.9% |
| Elementary School | 338 | 36.3% |
| Middle School | 233 | 25.0% |
| High School | 62 | 6.7% |
| College / Undergraduate | 106 | 11.4% |
| Graduate / Professional | 92 | 9.9% |
| Total | 932 | 100.0% |
School Enrollment by Age by Funding Source in Thorndale
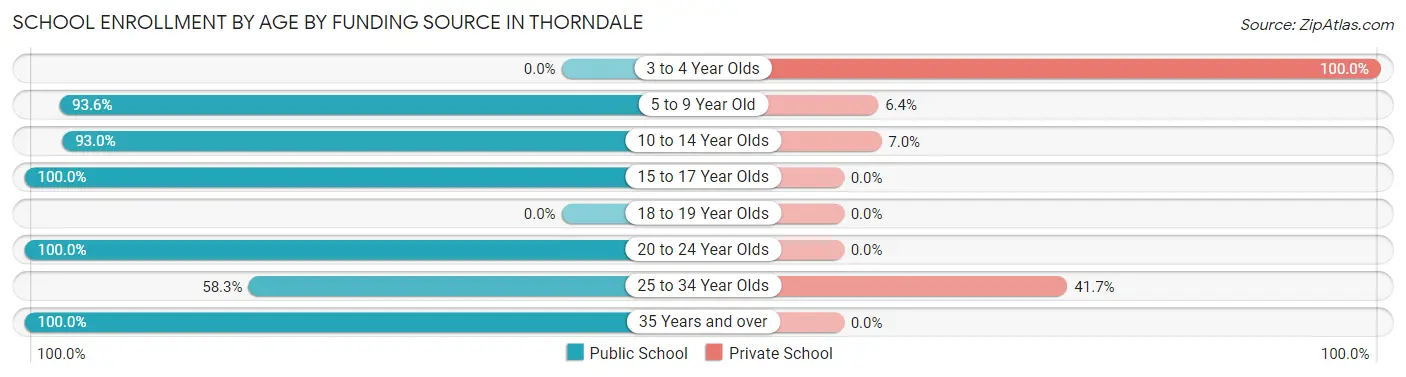
Out of a total of 932 students who are enrolled in schools in Thorndale, 75 (8.0%) attend a private institution, while the remaining 857 (92.0%) are enrolled in public schools. The age group of 3 to 4 year olds has the highest likelihood of being enrolled in private schools, with 5 (100.0% in the age bracket) enrolled. Conversely, the age group of 15 to 17 year olds has the lowest likelihood of being enrolled in a private school, with 62 (100.0% in the age bracket) attending a public institution.
| Age Bracket | Public School | Private School |
| 3 to 4 Year Olds | 0 (0.0%) | 5 (100.0%) |
| 5 to 9 Year Old | 291 (93.6%) | 20 (6.4%) |
| 10 to 14 Year Olds | 331 (93.0%) | 25 (7.0%) |
| 15 to 17 Year Olds | 62 (100.0%) | 0 (0.0%) |
| 18 to 19 Year Olds | 0 (0.0%) | 0 (0.0%) |
| 20 to 24 Year Olds | 46 (100.0%) | 0 (0.0%) |
| 25 to 34 Year Olds | 35 (58.3%) | 25 (41.7%) |
| 35 Years and over | 92 (100.0%) | 0 (0.0%) |
| Total | 857 (92.0%) | 75 (8.0%) |
Educational Attainment by Field of Study in Thorndale
Education (213 | 19.6%), business (194 | 17.8%), engineering (155 | 14.2%), visual & performing arts (111 | 10.2%), and psychology (94 | 8.6%) are the most common fields of study among 1,088 individuals in Thorndale who have obtained a bachelor's degree or higher.
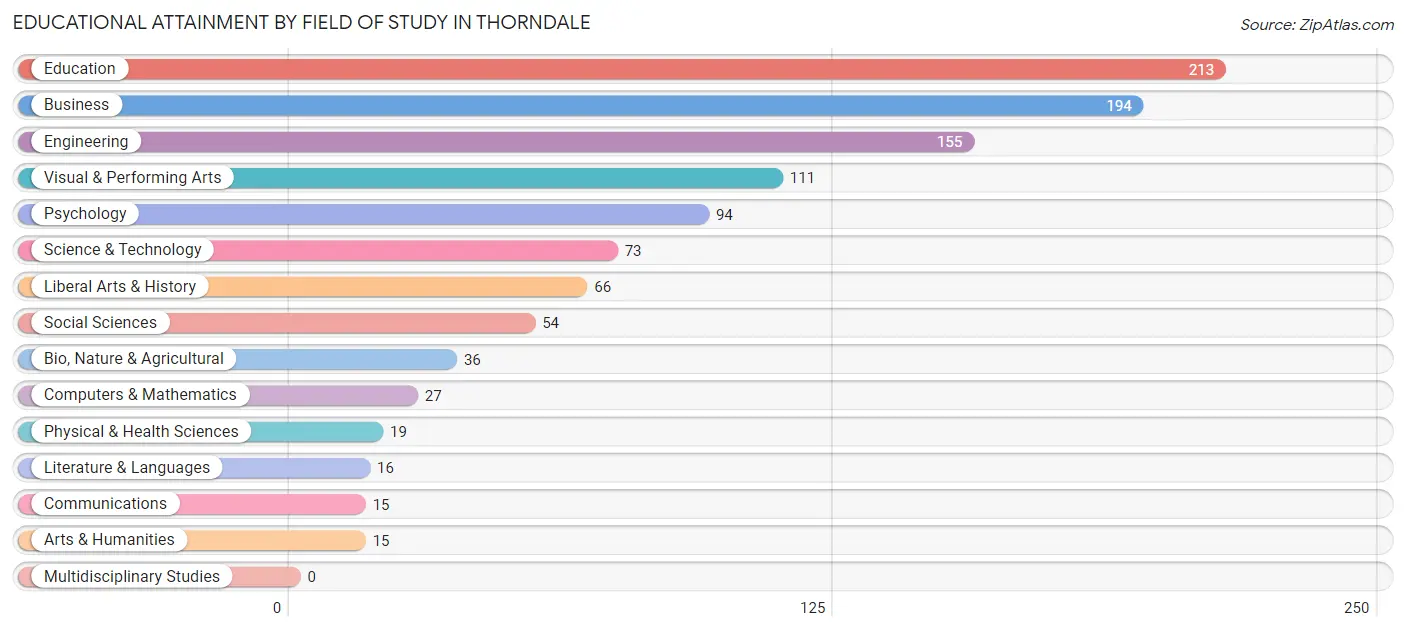
| Field of Study | # Graduates | % Graduates |
| Computers & Mathematics | 27 | 2.5% |
| Bio, Nature & Agricultural | 36 | 3.3% |
| Physical & Health Sciences | 19 | 1.8% |
| Psychology | 94 | 8.6% |
| Social Sciences | 54 | 5.0% |
| Engineering | 155 | 14.2% |
| Multidisciplinary Studies | 0 | 0.0% |
| Science & Technology | 73 | 6.7% |
| Business | 194 | 17.8% |
| Education | 213 | 19.6% |
| Literature & Languages | 16 | 1.5% |
| Liberal Arts & History | 66 | 6.1% |
| Visual & Performing Arts | 111 | 10.2% |
| Communications | 15 | 1.4% |
| Arts & Humanities | 15 | 1.4% |
| Total | 1,088 | 100.0% |
Transportation & Commute in Thorndale
Vehicle Availability by Sex in Thorndale
The most prevalent vehicle ownership categories in Thorndale are males with 2 vehicles (501, accounting for 48.5%) and females with 2 vehicles (441, making up 51.1%).
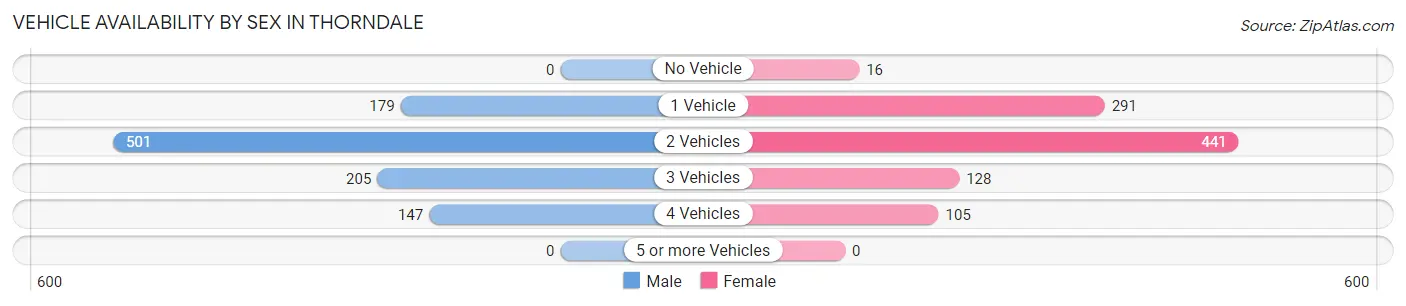
| Vehicles Available | Male | Female |
| No Vehicle | 0 (0.0%) | 16 (1.6%) |
| 1 Vehicle | 179 (17.3%) | 291 (29.7%) |
| 2 Vehicles | 501 (48.5%) | 441 (45.0%) |
| 3 Vehicles | 205 (19.9%) | 128 (13.1%) |
| 4 Vehicles | 147 (14.2%) | 105 (10.7%) |
| 5 or more Vehicles | 0 (0.0%) | 0 (0.0%) |
| Total | 1,032 (100.0%) | 981 (100.0%) |
Commute Time in Thorndale
The most frequently occuring commute durations in Thorndale are 10 to 14 minutes (264 commuters, 16.0%), 30 to 34 minutes (262 commuters, 15.8%), and 5 to 9 minutes (235 commuters, 14.2%).
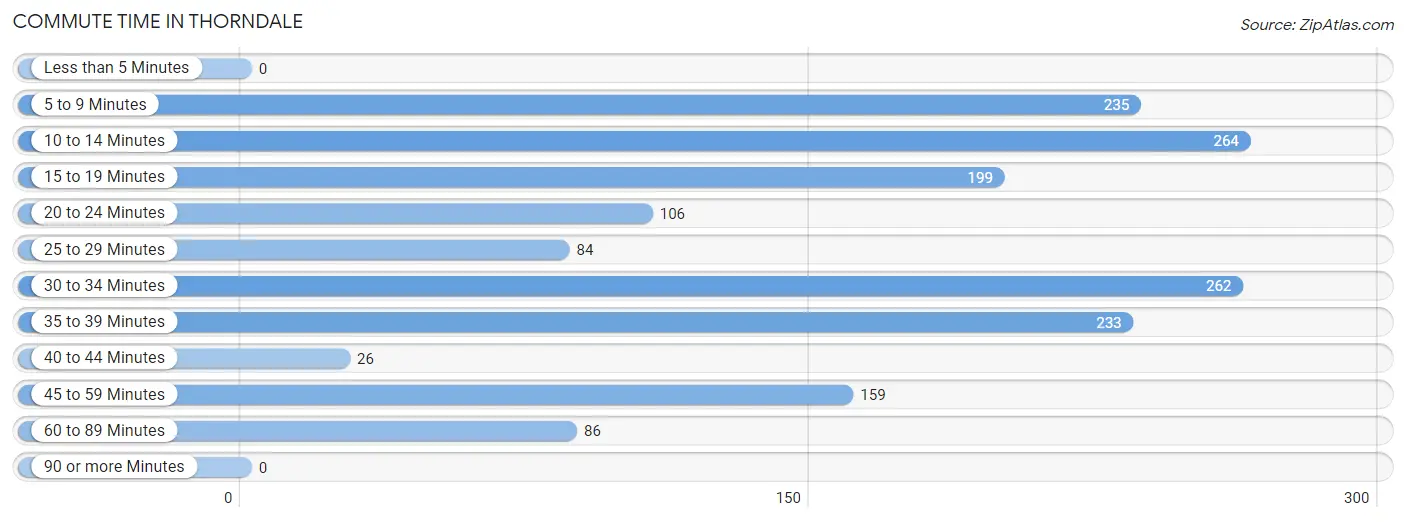
| Commute Time | # Commuters | % Commuters |
| Less than 5 Minutes | 0 | 0.0% |
| 5 to 9 Minutes | 235 | 14.2% |
| 10 to 14 Minutes | 264 | 16.0% |
| 15 to 19 Minutes | 199 | 12.0% |
| 20 to 24 Minutes | 106 | 6.4% |
| 25 to 29 Minutes | 84 | 5.1% |
| 30 to 34 Minutes | 262 | 15.8% |
| 35 to 39 Minutes | 233 | 14.1% |
| 40 to 44 Minutes | 26 | 1.6% |
| 45 to 59 Minutes | 159 | 9.6% |
| 60 to 89 Minutes | 86 | 5.2% |
| 90 or more Minutes | 0 | 0.0% |
Commute Time by Sex in Thorndale
The most common commute times in Thorndale are 10 to 14 minutes (208 commuters, 24.2%) for males and 35 to 39 minutes (204 commuters, 25.7%) for females.
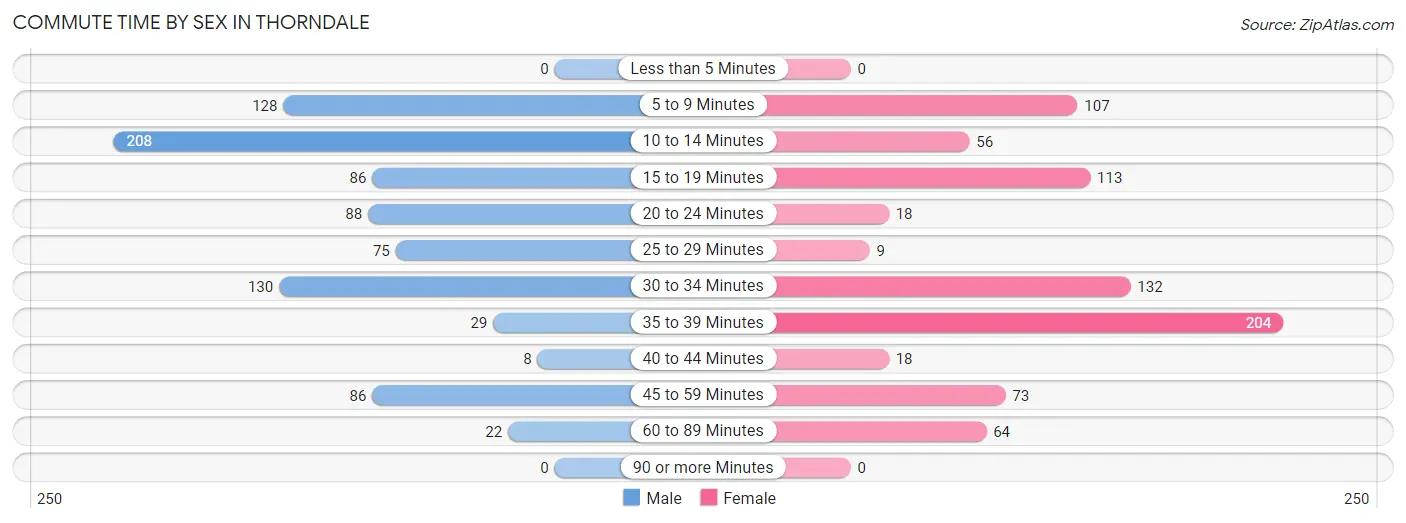
| Commute Time | Male | Female |
| Less than 5 Minutes | 0 (0.0%) | 0 (0.0%) |
| 5 to 9 Minutes | 128 (14.9%) | 107 (13.5%) |
| 10 to 14 Minutes | 208 (24.2%) | 56 (7.0%) |
| 15 to 19 Minutes | 86 (10.0%) | 113 (14.2%) |
| 20 to 24 Minutes | 88 (10.2%) | 18 (2.3%) |
| 25 to 29 Minutes | 75 (8.7%) | 9 (1.1%) |
| 30 to 34 Minutes | 130 (15.1%) | 132 (16.6%) |
| 35 to 39 Minutes | 29 (3.4%) | 204 (25.7%) |
| 40 to 44 Minutes | 8 (0.9%) | 18 (2.3%) |
| 45 to 59 Minutes | 86 (10.0%) | 73 (9.2%) |
| 60 to 89 Minutes | 22 (2.6%) | 64 (8.1%) |
| 90 or more Minutes | 0 (0.0%) | 0 (0.0%) |
Time of Departure to Work by Sex in Thorndale
The most frequent times of departure to work in Thorndale are 6:30 AM to 6:59 AM (231, 26.9%) for males and 7:30 AM to 7:59 AM (202, 25.4%) for females.
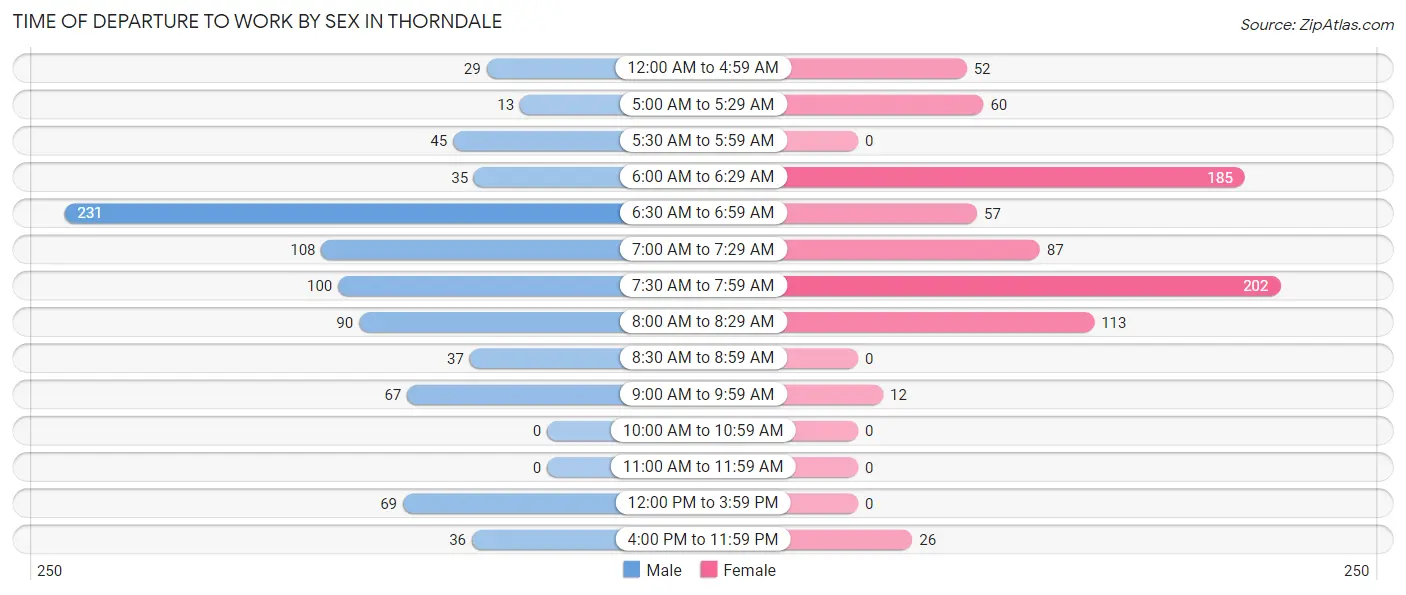
| Time of Departure | Male | Female |
| 12:00 AM to 4:59 AM | 29 (3.4%) | 52 (6.6%) |
| 5:00 AM to 5:29 AM | 13 (1.5%) | 60 (7.6%) |
| 5:30 AM to 5:59 AM | 45 (5.2%) | 0 (0.0%) |
| 6:00 AM to 6:29 AM | 35 (4.1%) | 185 (23.3%) |
| 6:30 AM to 6:59 AM | 231 (26.9%) | 57 (7.2%) |
| 7:00 AM to 7:29 AM | 108 (12.6%) | 87 (11.0%) |
| 7:30 AM to 7:59 AM | 100 (11.6%) | 202 (25.4%) |
| 8:00 AM to 8:29 AM | 90 (10.5%) | 113 (14.2%) |
| 8:30 AM to 8:59 AM | 37 (4.3%) | 0 (0.0%) |
| 9:00 AM to 9:59 AM | 67 (7.8%) | 12 (1.5%) |
| 10:00 AM to 10:59 AM | 0 (0.0%) | 0 (0.0%) |
| 11:00 AM to 11:59 AM | 0 (0.0%) | 0 (0.0%) |
| 12:00 PM to 3:59 PM | 69 (8.0%) | 0 (0.0%) |
| 4:00 PM to 11:59 PM | 36 (4.2%) | 26 (3.3%) |
| Total | 860 (100.0%) | 794 (100.0%) |
Housing Occupancy in Thorndale
Occupancy by Ownership in Thorndale
Of the total 1,452 dwellings in Thorndale, owner-occupied units account for 984 (67.8%), while renter-occupied units make up 468 (32.2%).
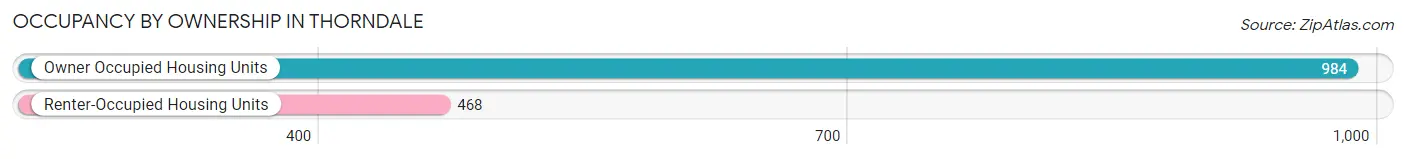
| Occupancy | # Housing Units | % Housing Units |
| Owner Occupied Housing Units | 984 | 67.8% |
| Renter-Occupied Housing Units | 468 | 32.2% |
| Total Occupied Housing Units | 1,452 | 100.0% |
Occupancy by Household Size in Thorndale
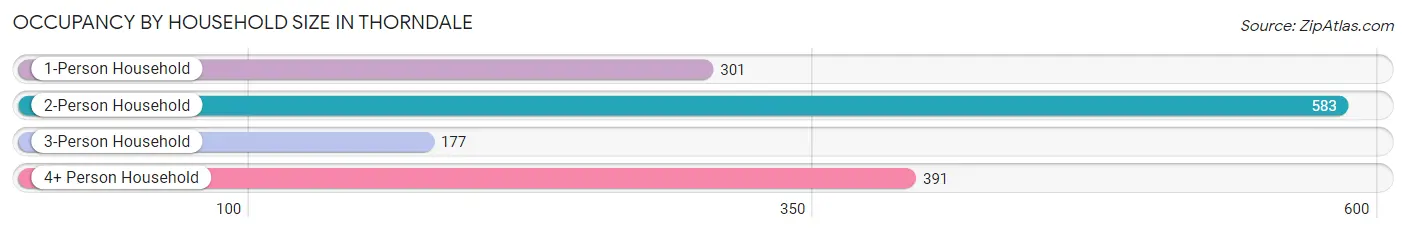
| Household Size | # Housing Units | % Housing Units |
| 1-Person Household | 301 | 20.7% |
| 2-Person Household | 583 | 40.2% |
| 3-Person Household | 177 | 12.2% |
| 4+ Person Household | 391 | 26.9% |
| Total Housing Units | 1,452 | 100.0% |
Occupancy by Ownership by Household Size in Thorndale
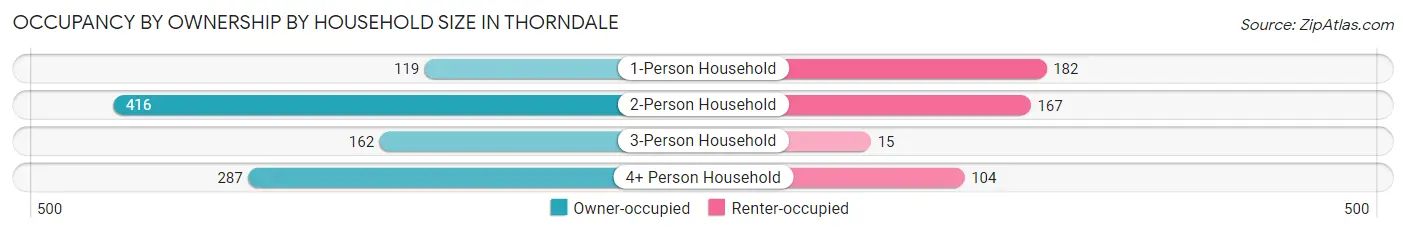
| Household Size | Owner-occupied | Renter-occupied |
| 1-Person Household | 119 (39.5%) | 182 (60.5%) |
| 2-Person Household | 416 (71.4%) | 167 (28.6%) |
| 3-Person Household | 162 (91.5%) | 15 (8.5%) |
| 4+ Person Household | 287 (73.4%) | 104 (26.6%) |
| Total Housing Units | 984 (67.8%) | 468 (32.2%) |
Occupancy by Educational Attainment in Thorndale
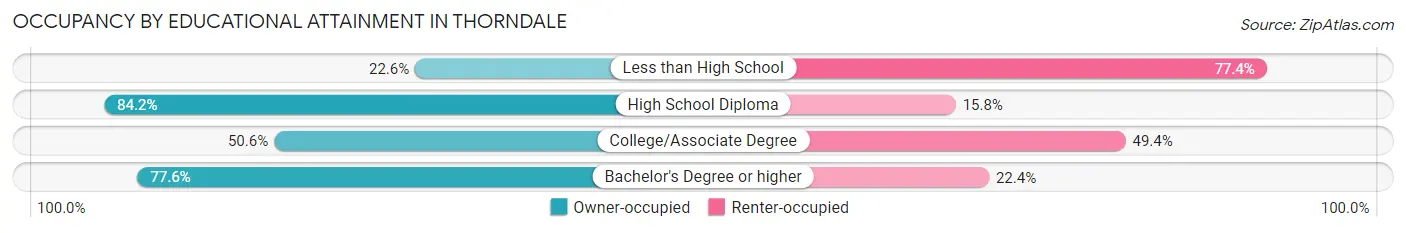
| Household Size | Owner-occupied | Renter-occupied |
| Less than High School | 7 (22.6%) | 24 (77.4%) |
| High School Diploma | 235 (84.2%) | 44 (15.8%) |
| College/Associate Degree | 270 (50.6%) | 264 (49.4%) |
| Bachelor's Degree or higher | 472 (77.6%) | 136 (22.4%) |
Occupancy by Age of Householder in Thorndale
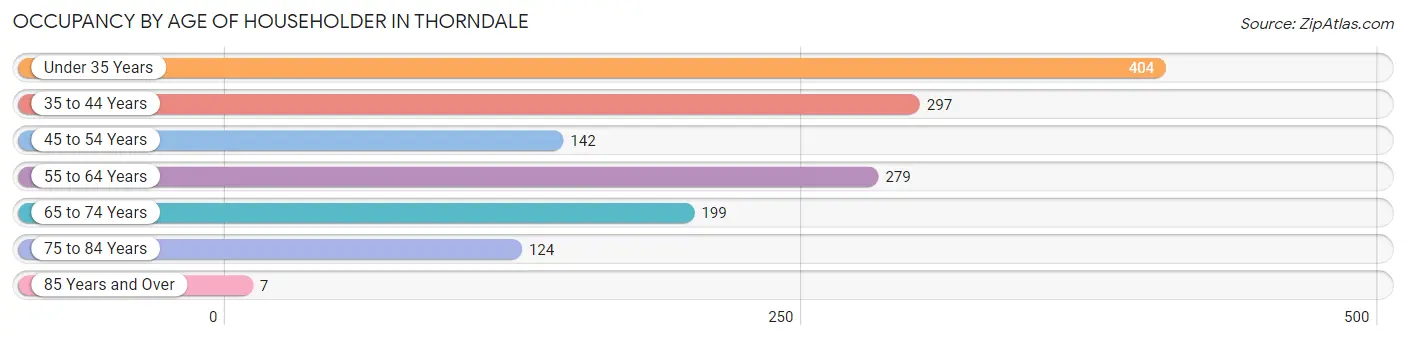
| Age Bracket | # Households | % Households |
| Under 35 Years | 404 | 27.8% |
| 35 to 44 Years | 297 | 20.4% |
| 45 to 54 Years | 142 | 9.8% |
| 55 to 64 Years | 279 | 19.2% |
| 65 to 74 Years | 199 | 13.7% |
| 75 to 84 Years | 124 | 8.5% |
| 85 Years and Over | 7 | 0.5% |
| Total | 1,452 | 100.0% |
Housing Finances in Thorndale
Median Income by Occupancy in Thorndale
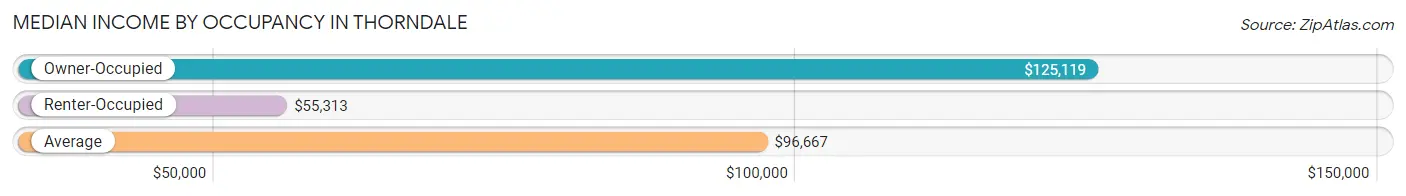
| Occupancy Type | # Households | Median Income |
| Owner-Occupied | 984 (67.8%) | $125,119 |
| Renter-Occupied | 468 (32.2%) | $55,313 |
| Average | 1,452 (100.0%) | $96,667 |
Occupancy by Householder Income Bracket in Thorndale
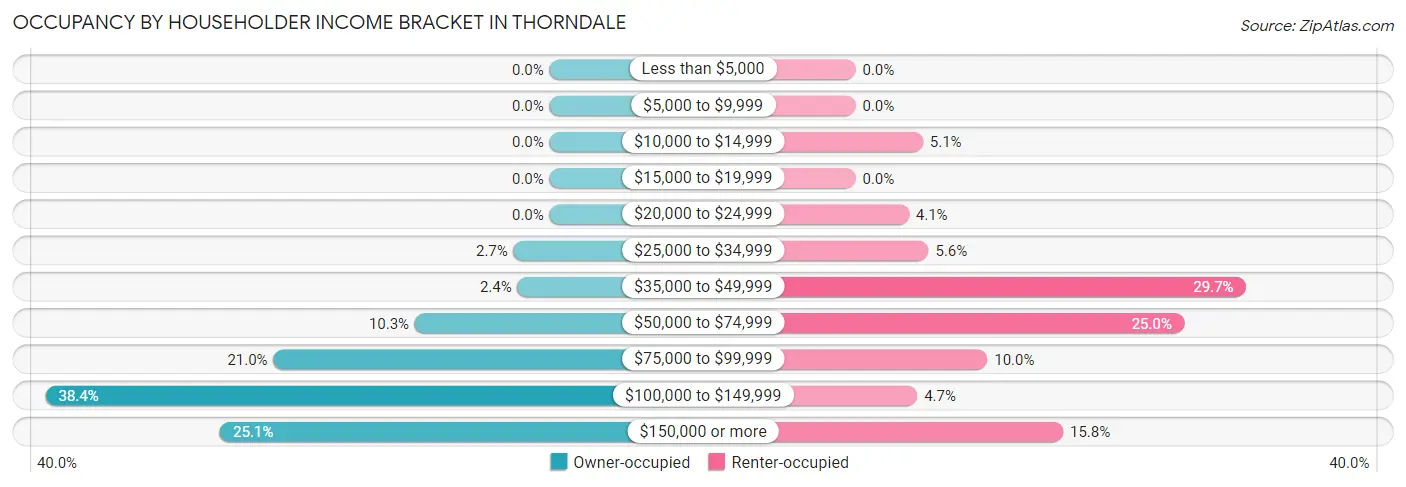
| Income Bracket | Owner-occupied | Renter-occupied |
| Less than $5,000 | 0 (0.0%) | 0 (0.0%) |
| $5,000 to $9,999 | 0 (0.0%) | 0 (0.0%) |
| $10,000 to $14,999 | 0 (0.0%) | 24 (5.1%) |
| $15,000 to $19,999 | 0 (0.0%) | 0 (0.0%) |
| $20,000 to $24,999 | 0 (0.0%) | 19 (4.1%) |
| $25,000 to $34,999 | 27 (2.7%) | 26 (5.6%) |
| $35,000 to $49,999 | 24 (2.4%) | 139 (29.7%) |
| $50,000 to $74,999 | 101 (10.3%) | 117 (25.0%) |
| $75,000 to $99,999 | 207 (21.0%) | 47 (10.0%) |
| $100,000 to $149,999 | 378 (38.4%) | 22 (4.7%) |
| $150,000 or more | 247 (25.1%) | 74 (15.8%) |
| Total | 984 (100.0%) | 468 (100.0%) |
Monthly Housing Cost Tiers in Thorndale
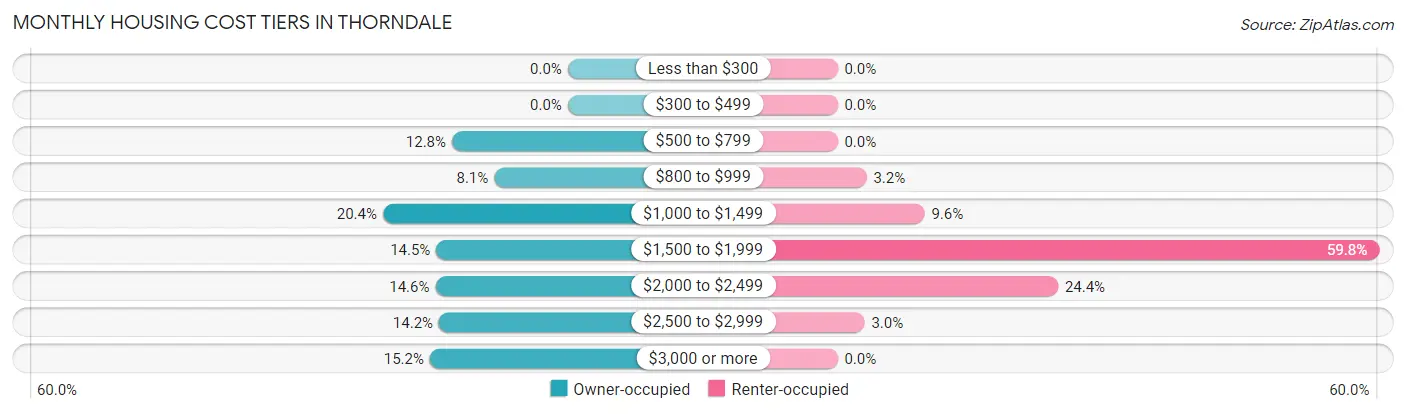
| Monthly Cost | Owner-occupied | Renter-occupied |
| Less than $300 | 0 (0.0%) | 0 (0.0%) |
| $300 to $499 | 0 (0.0%) | 0 (0.0%) |
| $500 to $799 | 126 (12.8%) | 0 (0.0%) |
| $800 to $999 | 80 (8.1%) | 15 (3.2%) |
| $1,000 to $1,499 | 201 (20.4%) | 45 (9.6%) |
| $1,500 to $1,999 | 143 (14.5%) | 280 (59.8%) |
| $2,000 to $2,499 | 144 (14.6%) | 114 (24.4%) |
| $2,500 to $2,999 | 140 (14.2%) | 14 (3.0%) |
| $3,000 or more | 150 (15.2%) | 0 (0.0%) |
| Total | 984 (100.0%) | 468 (100.0%) |
Physical Housing Characteristics in Thorndale
Housing Structures in Thorndale
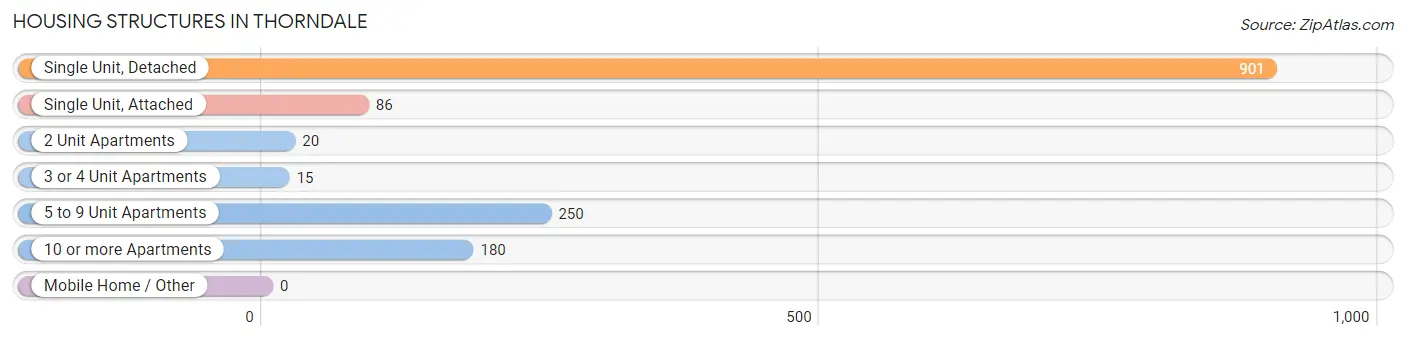
| Structure Type | # Housing Units | % Housing Units |
| Single Unit, Detached | 901 | 62.1% |
| Single Unit, Attached | 86 | 5.9% |
| 2 Unit Apartments | 20 | 1.4% |
| 3 or 4 Unit Apartments | 15 | 1.0% |
| 5 to 9 Unit Apartments | 250 | 17.2% |
| 10 or more Apartments | 180 | 12.4% |
| Mobile Home / Other | 0 | 0.0% |
| Total | 1,452 | 100.0% |
Housing Structures by Occupancy in Thorndale
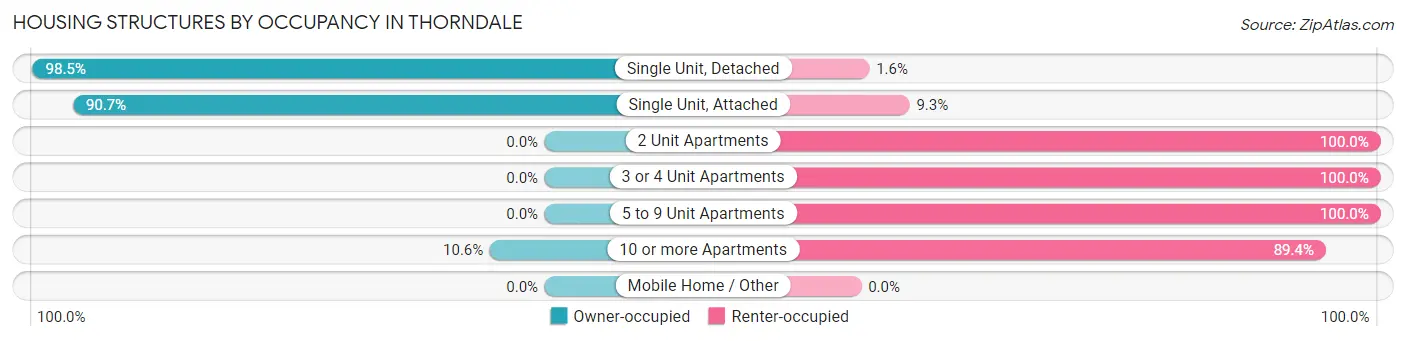
| Structure Type | Owner-occupied | Renter-occupied |
| Single Unit, Detached | 887 (98.5%) | 14 (1.5%) |
| Single Unit, Attached | 78 (90.7%) | 8 (9.3%) |
| 2 Unit Apartments | 0 (0.0%) | 20 (100.0%) |
| 3 or 4 Unit Apartments | 0 (0.0%) | 15 (100.0%) |
| 5 to 9 Unit Apartments | 0 (0.0%) | 250 (100.0%) |
| 10 or more Apartments | 19 (10.6%) | 161 (89.4%) |
| Mobile Home / Other | 0 (0.0%) | 0 (0.0%) |
| Total | 984 (67.8%) | 468 (32.2%) |
Housing Structures by Number of Rooms in Thorndale
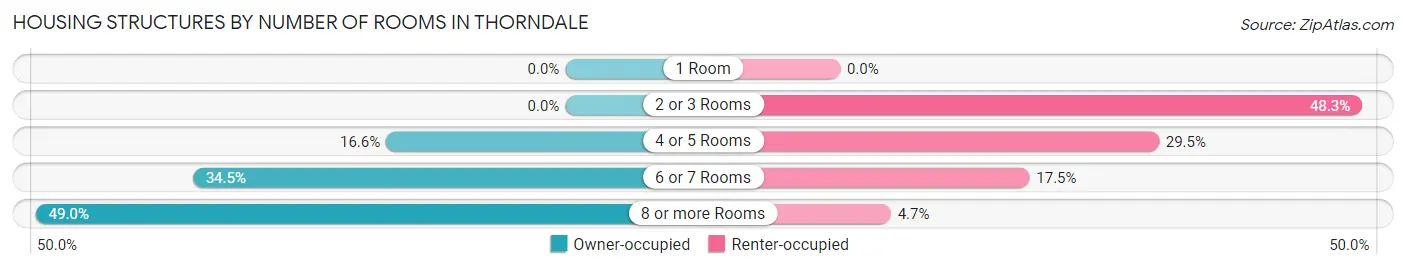
| Number of Rooms | Owner-occupied | Renter-occupied |
| 1 Room | 0 (0.0%) | 0 (0.0%) |
| 2 or 3 Rooms | 0 (0.0%) | 226 (48.3%) |
| 4 or 5 Rooms | 163 (16.6%) | 138 (29.5%) |
| 6 or 7 Rooms | 339 (34.4%) | 82 (17.5%) |
| 8 or more Rooms | 482 (49.0%) | 22 (4.7%) |
| Total | 984 (100.0%) | 468 (100.0%) |
Housing Structure by Heating Type in Thorndale
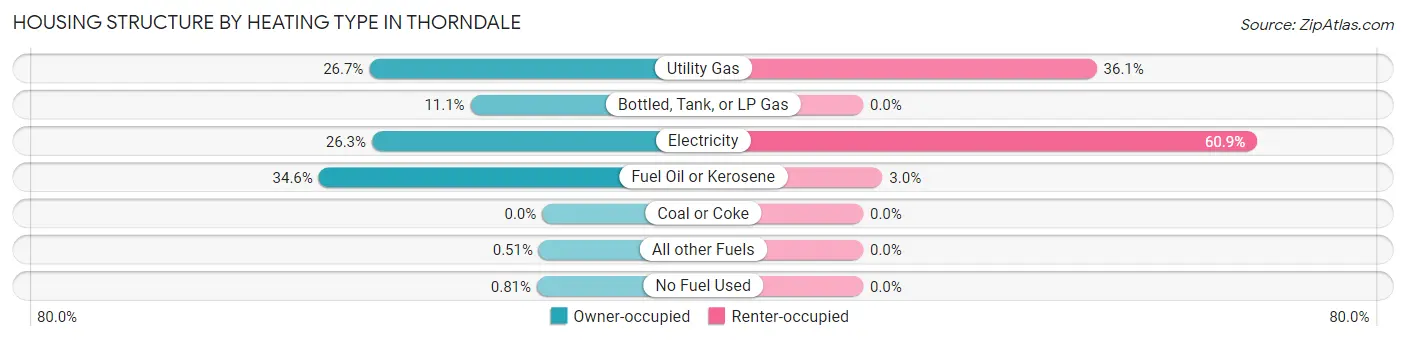
| Heating Type | Owner-occupied | Renter-occupied |
| Utility Gas | 263 (26.7%) | 169 (36.1%) |
| Bottled, Tank, or LP Gas | 109 (11.1%) | 0 (0.0%) |
| Electricity | 259 (26.3%) | 285 (60.9%) |
| Fuel Oil or Kerosene | 340 (34.5%) | 14 (3.0%) |
| Coal or Coke | 0 (0.0%) | 0 (0.0%) |
| All other Fuels | 5 (0.5%) | 0 (0.0%) |
| No Fuel Used | 8 (0.8%) | 0 (0.0%) |
| Total | 984 (100.0%) | 468 (100.0%) |
Household Vehicle Usage in Thorndale
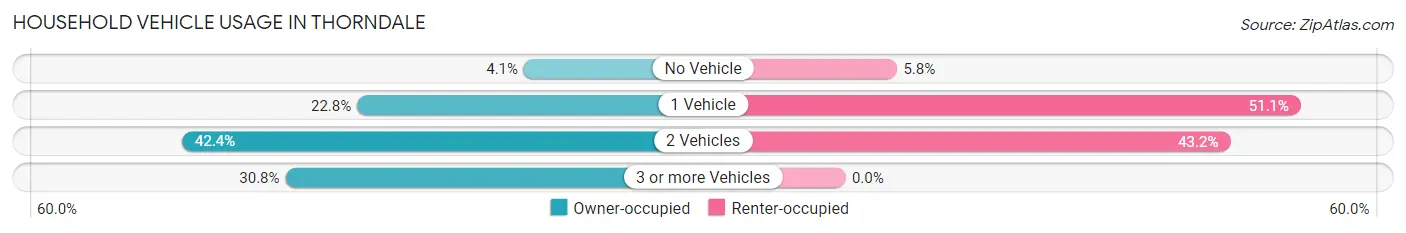
| Vehicles per Household | Owner-occupied | Renter-occupied |
| No Vehicle | 40 (4.1%) | 27 (5.8%) |
| 1 Vehicle | 224 (22.8%) | 239 (51.1%) |
| 2 Vehicles | 417 (42.4%) | 202 (43.2%) |
| 3 or more Vehicles | 303 (30.8%) | 0 (0.0%) |
| Total | 984 (100.0%) | 468 (100.0%) |
Real Estate & Mortgages in Thorndale
Real Estate and Mortgage Overview in Thorndale
| Characteristic | Without Mortgage | With Mortgage |
| Housing Units | 211 | 773 |
| Median Property Value | $252,000 | $318,500 |
| Median Household Income | $88,267 | $212 |
| Monthly Housing Costs | $766 | $150 |
| Real Estate Taxes | $3,896 | $0 |
Property Value by Mortgage Status in Thorndale
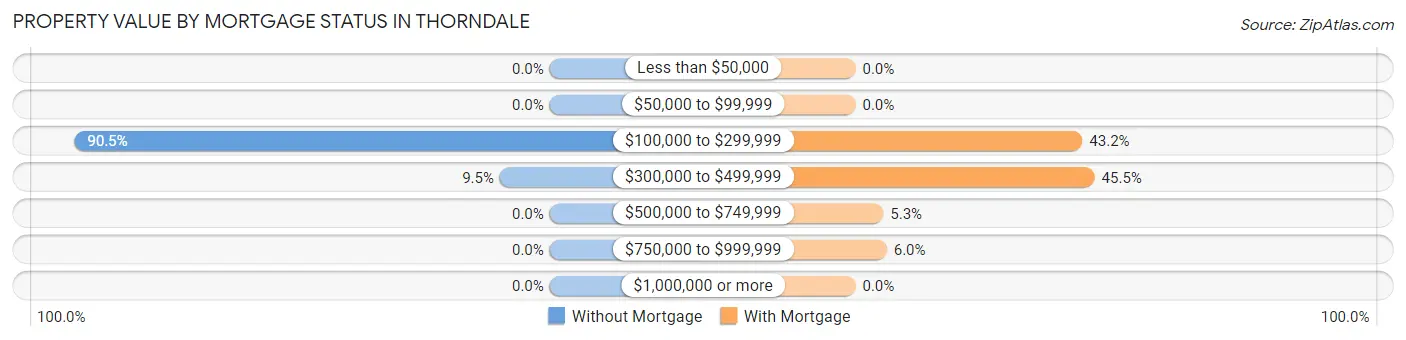
| Property Value | Without Mortgage | With Mortgage |
| Less than $50,000 | 0 (0.0%) | 0 (0.0%) |
| $50,000 to $99,999 | 0 (0.0%) | 0 (0.0%) |
| $100,000 to $299,999 | 191 (90.5%) | 334 (43.2%) |
| $300,000 to $499,999 | 20 (9.5%) | 352 (45.5%) |
| $500,000 to $749,999 | 0 (0.0%) | 41 (5.3%) |
| $750,000 to $999,999 | 0 (0.0%) | 46 (5.9%) |
| $1,000,000 or more | 0 (0.0%) | 0 (0.0%) |
| Total | 211 (100.0%) | 773 (100.0%) |
Household Income by Mortgage Status in Thorndale
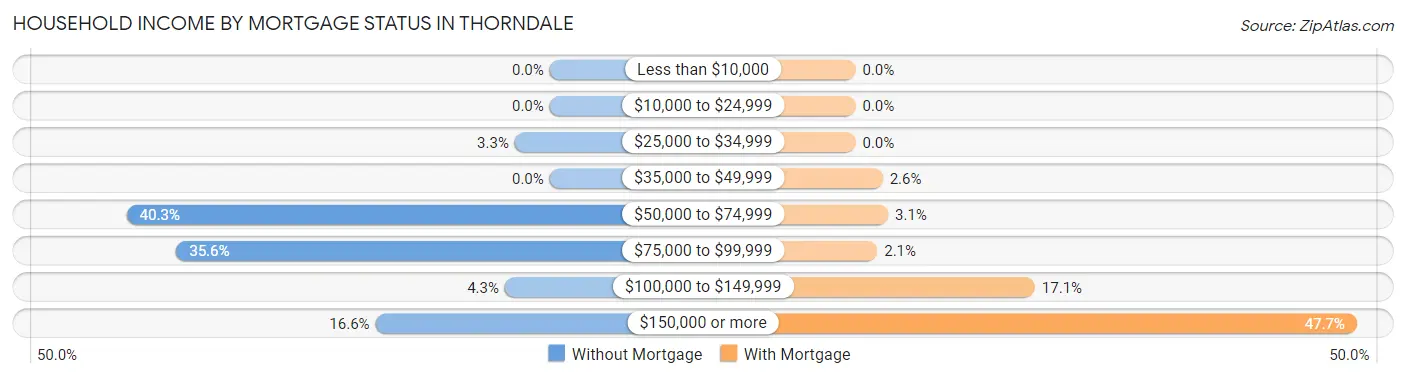
| Household Income | Without Mortgage | With Mortgage |
| Less than $10,000 | 0 (0.0%) | 0 (0.0%) |
| $10,000 to $24,999 | 0 (0.0%) | 0 (0.0%) |
| $25,000 to $34,999 | 7 (3.3%) | 0 (0.0%) |
| $35,000 to $49,999 | 0 (0.0%) | 20 (2.6%) |
| $50,000 to $74,999 | 85 (40.3%) | 24 (3.1%) |
| $75,000 to $99,999 | 75 (35.5%) | 16 (2.1%) |
| $100,000 to $149,999 | 9 (4.3%) | 132 (17.1%) |
| $150,000 or more | 35 (16.6%) | 369 (47.7%) |
| Total | 211 (100.0%) | 773 (100.0%) |
Property Value to Household Income Ratio in Thorndale
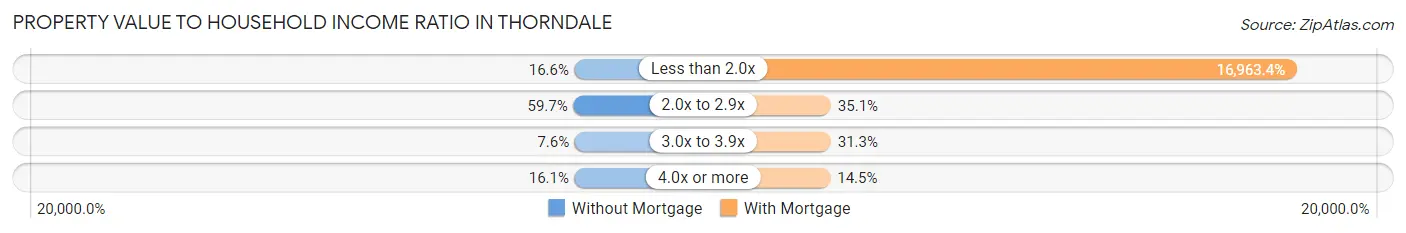
| Value-to-Income Ratio | Without Mortgage | With Mortgage |
| Less than 2.0x | 35 (16.6%) | 131,127 (16,963.4%) |
| 2.0x to 2.9x | 126 (59.7%) | 271 (35.1%) |
| 3.0x to 3.9x | 16 (7.6%) | 242 (31.3%) |
| 4.0x or more | 34 (16.1%) | 112 (14.5%) |
| Total | 211 (100.0%) | 773 (100.0%) |
Real Estate Taxes by Mortgage Status in Thorndale
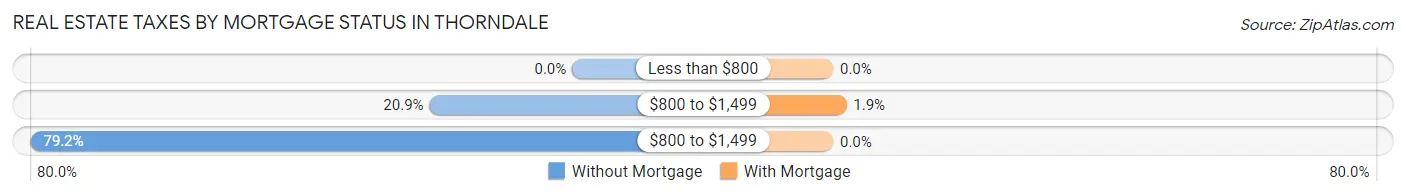
| Property Taxes | Without Mortgage | With Mortgage |
| Less than $800 | 0 (0.0%) | 0 (0.0%) |
| $800 to $1,499 | 44 (20.8%) | 15 (1.9%) |
| $800 to $1,499 | 167 (79.1%) | 0 (0.0%) |
| Total | 211 (100.0%) | 773 (100.0%) |
Health & Disability in Thorndale
Health Insurance Coverage by Age in Thorndale
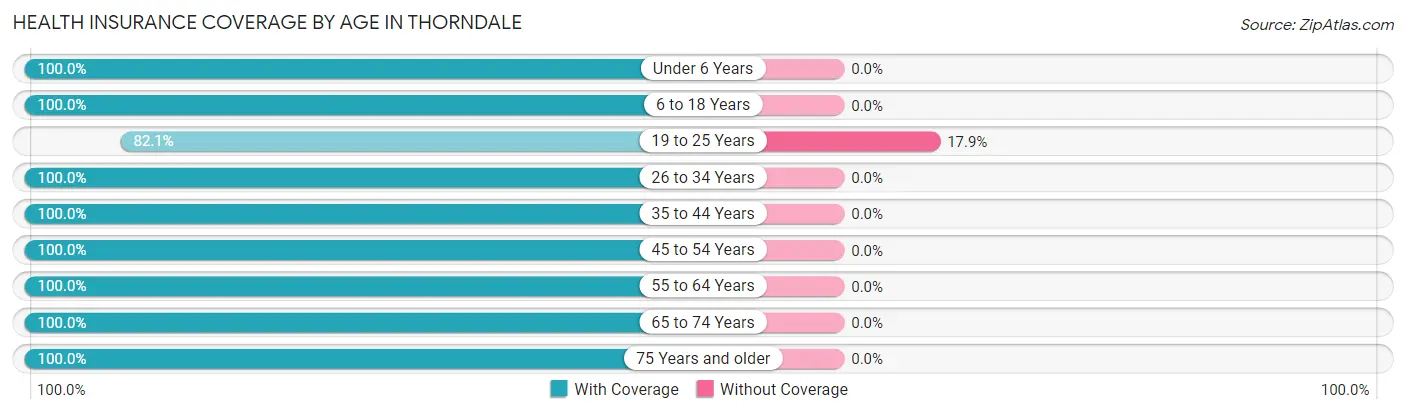
| Age Bracket | With Coverage | Without Coverage |
| Under 6 Years | 267 (100.0%) | 0 (0.0%) |
| 6 to 18 Years | 716 (100.0%) | 0 (0.0%) |
| 19 to 25 Years | 294 (82.1%) | 64 (17.9%) |
| 26 to 34 Years | 455 (100.0%) | 0 (0.0%) |
| 35 to 44 Years | 717 (100.0%) | 0 (0.0%) |
| 45 to 54 Years | 333 (100.0%) | 0 (0.0%) |
| 55 to 64 Years | 474 (100.0%) | 0 (0.0%) |
| 65 to 74 Years | 466 (100.0%) | 0 (0.0%) |
| 75 Years and older | 221 (100.0%) | 0 (0.0%) |
| Total | 3,943 (98.4%) | 64 (1.6%) |
Health Insurance Coverage by Citizenship Status in Thorndale
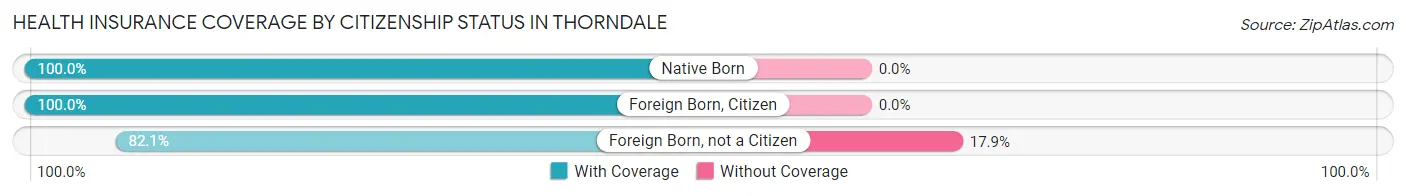
| Citizenship Status | With Coverage | Without Coverage |
| Native Born | 267 (100.0%) | 0 (0.0%) |
| Foreign Born, Citizen | 716 (100.0%) | 0 (0.0%) |
| Foreign Born, not a Citizen | 294 (82.1%) | 64 (17.9%) |
Health Insurance Coverage by Household Income in Thorndale
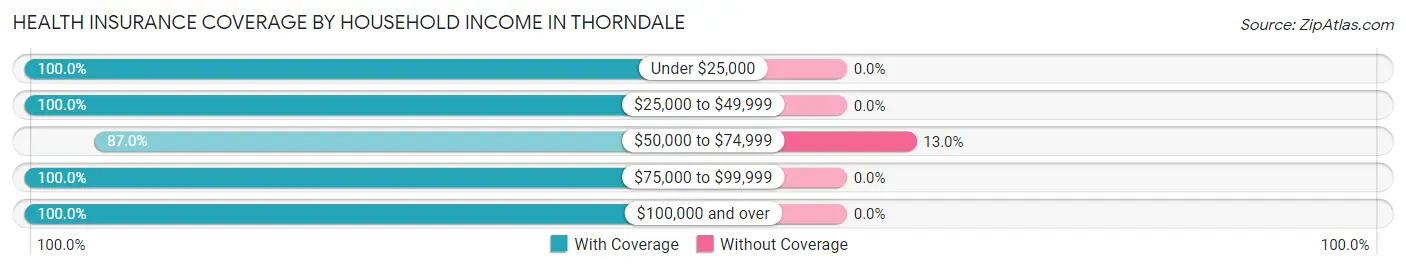
| Household Income | With Coverage | Without Coverage |
| Under $25,000 | 85 (100.0%) | 0 (0.0%) |
| $25,000 to $49,999 | 271 (100.0%) | 0 (0.0%) |
| $50,000 to $74,999 | 427 (87.0%) | 64 (13.0%) |
| $75,000 to $99,999 | 557 (100.0%) | 0 (0.0%) |
| $100,000 and over | 2,594 (100.0%) | 0 (0.0%) |
Public vs Private Health Insurance Coverage by Age in Thorndale
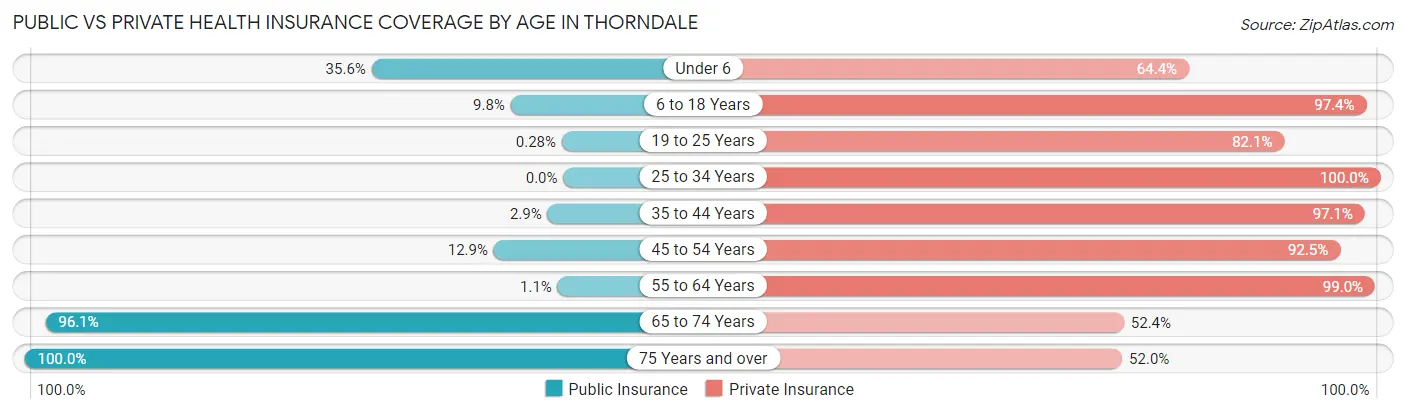
| Age Bracket | Public Insurance | Private Insurance |
| Under 6 | 95 (35.6%) | 172 (64.4%) |
| 6 to 18 Years | 70 (9.8%) | 697 (97.4%) |
| 19 to 25 Years | 1 (0.3%) | 294 (82.1%) |
| 25 to 34 Years | 0 (0.0%) | 455 (100.0%) |
| 35 to 44 Years | 21 (2.9%) | 696 (97.1%) |
| 45 to 54 Years | 43 (12.9%) | 308 (92.5%) |
| 55 to 64 Years | 5 (1.1%) | 469 (99.0%) |
| 65 to 74 Years | 448 (96.1%) | 244 (52.4%) |
| 75 Years and over | 221 (100.0%) | 115 (52.0%) |
| Total | 904 (22.6%) | 3,450 (86.1%) |
Disability Status by Sex by Age in Thorndale
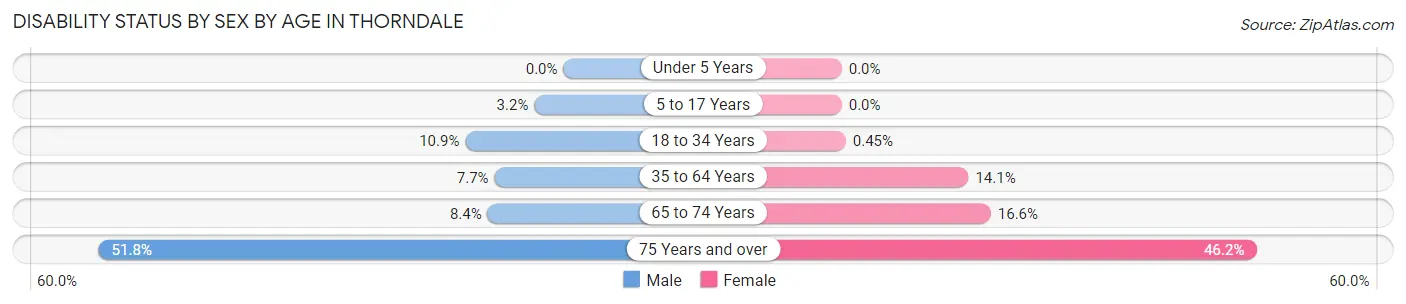
| Age Bracket | Male | Female |
| Under 5 Years | 0 (0.0%) | 0 (0.0%) |
| 5 to 17 Years | 8 (3.2%) | 0 (0.0%) |
| 18 to 34 Years | 40 (10.9%) | 2 (0.4%) |
| 35 to 64 Years | 61 (7.7%) | 103 (14.1%) |
| 65 to 74 Years | 19 (8.4%) | 40 (16.6%) |
| 75 Years and over | 74 (51.7%) | 36 (46.2%) |
Disability Class by Sex by Age in Thorndale
Disability Class: Hearing Difficulty
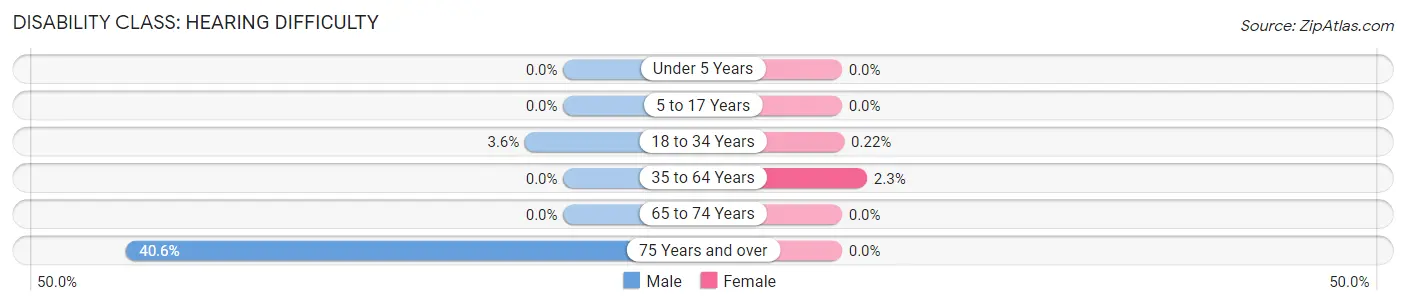
| Age Bracket | Male | Female |
| Under 5 Years | 0 (0.0%) | 0 (0.0%) |
| 5 to 17 Years | 0 (0.0%) | 0 (0.0%) |
| 18 to 34 Years | 13 (3.5%) | 1 (0.2%) |
| 35 to 64 Years | 0 (0.0%) | 17 (2.3%) |
| 65 to 74 Years | 0 (0.0%) | 0 (0.0%) |
| 75 Years and over | 58 (40.6%) | 0 (0.0%) |
Disability Class: Vision Difficulty
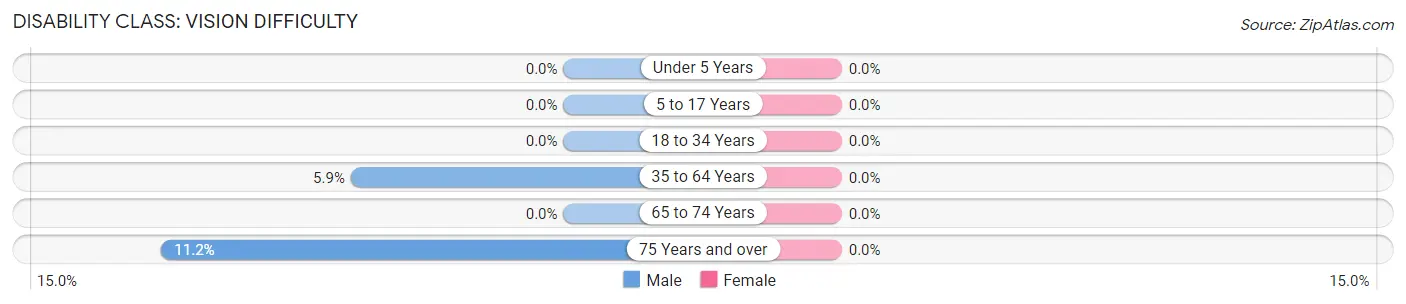
| Age Bracket | Male | Female |
| Under 5 Years | 0 (0.0%) | 0 (0.0%) |
| 5 to 17 Years | 0 (0.0%) | 0 (0.0%) |
| 18 to 34 Years | 0 (0.0%) | 0 (0.0%) |
| 35 to 64 Years | 47 (5.9%) | 0 (0.0%) |
| 65 to 74 Years | 0 (0.0%) | 0 (0.0%) |
| 75 Years and over | 16 (11.2%) | 0 (0.0%) |
Disability Class: Cognitive Difficulty
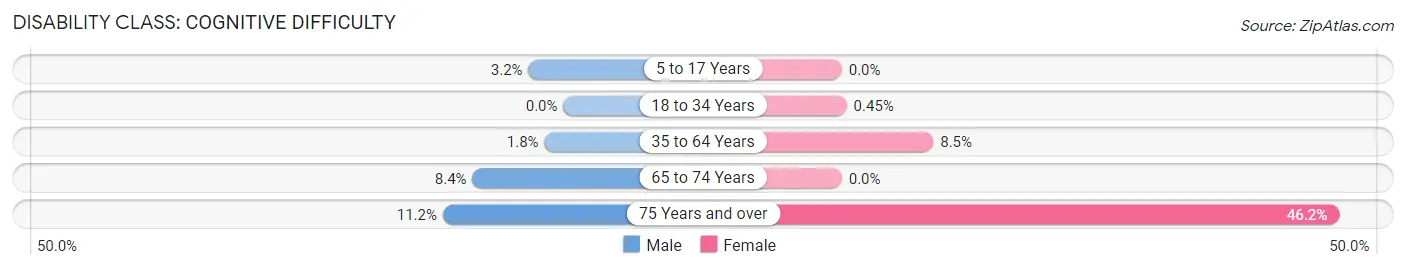
| Age Bracket | Male | Female |
| 5 to 17 Years | 8 (3.2%) | 0 (0.0%) |
| 18 to 34 Years | 0 (0.0%) | 2 (0.4%) |
| 35 to 64 Years | 14 (1.8%) | 62 (8.5%) |
| 65 to 74 Years | 19 (8.4%) | 0 (0.0%) |
| 75 Years and over | 16 (11.2%) | 36 (46.2%) |
Disability Class: Ambulatory Difficulty
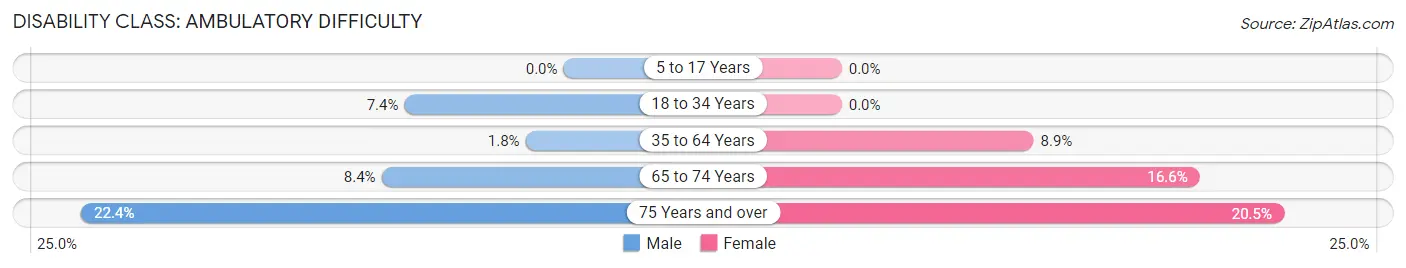
| Age Bracket | Male | Female |
| 5 to 17 Years | 0 (0.0%) | 0 (0.0%) |
| 18 to 34 Years | 27 (7.4%) | 0 (0.0%) |
| 35 to 64 Years | 14 (1.8%) | 65 (8.9%) |
| 65 to 74 Years | 19 (8.4%) | 40 (16.6%) |
| 75 Years and over | 32 (22.4%) | 16 (20.5%) |
Disability Class: Self-Care Difficulty
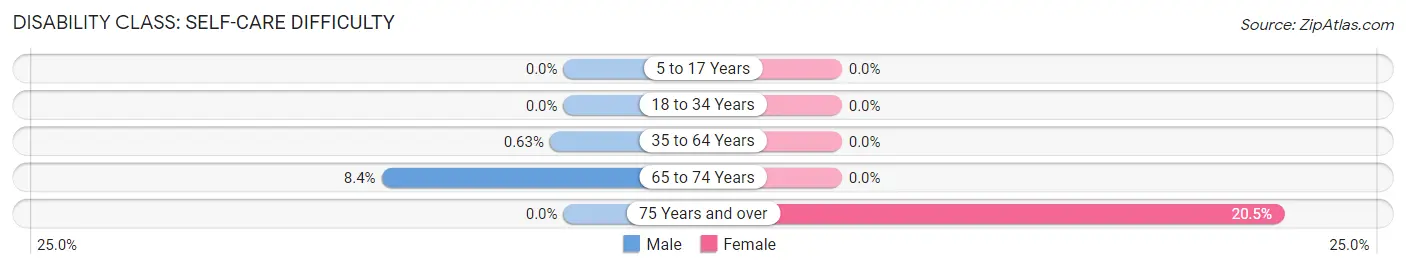
| Age Bracket | Male | Female |
| 5 to 17 Years | 0 (0.0%) | 0 (0.0%) |
| 18 to 34 Years | 0 (0.0%) | 0 (0.0%) |
| 35 to 64 Years | 5 (0.6%) | 0 (0.0%) |
| 65 to 74 Years | 19 (8.4%) | 0 (0.0%) |
| 75 Years and over | 0 (0.0%) | 16 (20.5%) |
Technology Access in Thorndale
Computing Device Access in Thorndale
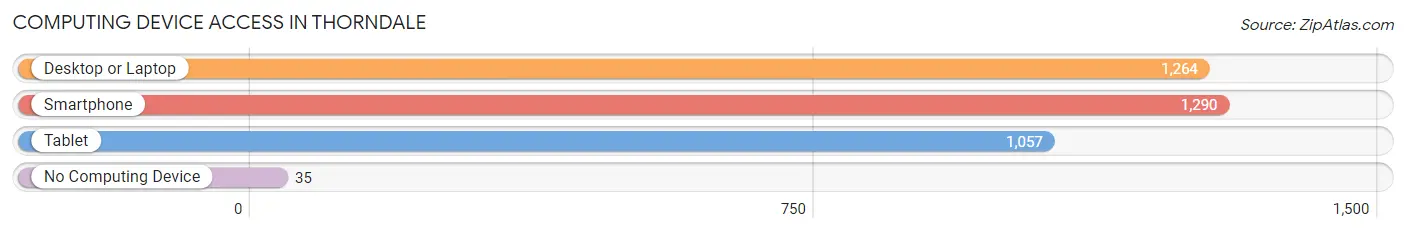
| Device Type | # Households | % Households |
| Desktop or Laptop | 1,264 | 87.1% |
| Smartphone | 1,290 | 88.8% |
| Tablet | 1,057 | 72.8% |
| No Computing Device | 35 | 2.4% |
| Total | 1,452 | 100.0% |
Internet Access in Thorndale
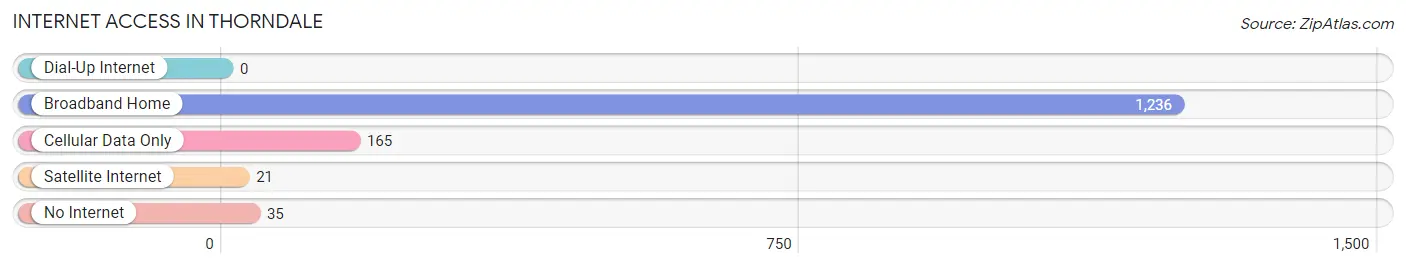
| Internet Type | # Households | % Households |
| Dial-Up Internet | 0 | 0.0% |
| Broadband Home | 1,236 | 85.1% |
| Cellular Data Only | 165 | 11.4% |
| Satellite Internet | 21 | 1.5% |
| No Internet | 35 | 2.4% |
| Total | 1,452 | 100.0% |
Thorndale Summary
History
The area now known as Thorndale, Pennsylvania was first settled in the late 1700s by a group of Welsh immigrants. The town was originally known as “Trefaldwyn”, which means “three fields” in Welsh. The town was officially incorporated in 1875 and was named after the nearby Thorndale Iron Works. The iron works was established in 1845 and was the first of its kind in the area. The iron works was a major employer in the area and helped to spur the growth of the town.
The town of Thorndale was a major hub for the Pennsylvania Railroad in the late 19th and early 20th centuries. The railroad was a major employer in the area and helped to bring in new businesses and people to the area. The town was also home to several other industries, including a brickyard, a sawmill, and a flour mill.
Geography
Thorndale is located in Chester County, Pennsylvania, approximately 30 miles west of Philadelphia. The town is situated in the Brandywine Valley, which is known for its rolling hills and lush farmland. The town is bordered by the towns of Downingtown, Coatesville, and West Chester. The town is also located near the intersection of two major highways, the Pennsylvania Turnpike and the US Route 30.
The town of Thorndale is located in a rural area and is surrounded by farmland. The town is home to several parks, including the Thorndale Community Park, which features a playground, picnic areas, and a walking trail. The town is also home to several historic sites, including the Thorndale Iron Works, which is listed on the National Register of Historic Places.
Economy
The economy of Thorndale is largely based on agriculture and light industry. The town is home to several farms, which produce a variety of crops, including corn, soybeans, and hay. The town is also home to several light industrial businesses, including a plastics manufacturer and a printing company.
The town is also home to several retail businesses, including a grocery store, a hardware store, and several restaurants. The town is also home to several professional services, including a law firm, an accounting firm, and a real estate agency.
Demographics
As of the 2010 census, the population of Thorndale was 4,082. The town has a median household income of $60,945 and a median family income of $71,945. The town is predominantly white, with 92.3% of the population identifying as white. The town is also home to a small Hispanic population, with 4.3% of the population identifying as Hispanic or Latino. The town is also home to a small African American population, with 1.3% of the population identifying as African American. The town is also home to a small Asian population, with 1.2% of the population identifying as Asian.
Common Questions
What is Per Capita Income in Thorndale?
Per Capita income in Thorndale is $41,787.
What is the Median Family Income in Thorndale?
Median Family Income in Thorndale is $130,177.
What is the Median Household income in Thorndale?
Median Household Income in Thorndale is $96,667.
What is Income or Wage Gap in Thorndale?
Income or Wage Gap in Thorndale is 27.3%.
Women in Thorndale earn 72.7 cents for every dollar earned by a man.
What is Inequality or Gini Index in Thorndale?
Inequality or Gini Index in Thorndale is 0.30.
What is the Total Population of Thorndale?
Total Population of Thorndale is 4,007.
What is the Total Male Population of Thorndale?
Total Male Population of Thorndale is 1,856.
What is the Total Female Population of Thorndale?
Total Female Population of Thorndale is 2,151.
What is the Ratio of Males per 100 Females in Thorndale?
There are 86.29 Males per 100 Females in Thorndale.
What is the Ratio of Females per 100 Males in Thorndale?
There are 115.89 Females per 100 Males in Thorndale.
What is the Median Population Age in Thorndale?
Median Population Age in Thorndale is 38.1 Years.
What is the Average Family Size in Thorndale
Average Family Size in Thorndale is 3.3 People.
What is the Average Household Size in Thorndale
Average Household Size in Thorndale is 2.8 People.
How Large is the Labor Force in Thorndale?
There are 2,085 People in the Labor Forcein in Thorndale.
What is the Percentage of People in the Labor Force in Thorndale?
67.9% of People are in the Labor Force in Thorndale.
What is the Unemployment Rate in Thorndale?
Unemployment Rate in Thorndale is 1.1%.