Northeast Ithaca, NY Map & Demographics
Northeast Ithaca Map
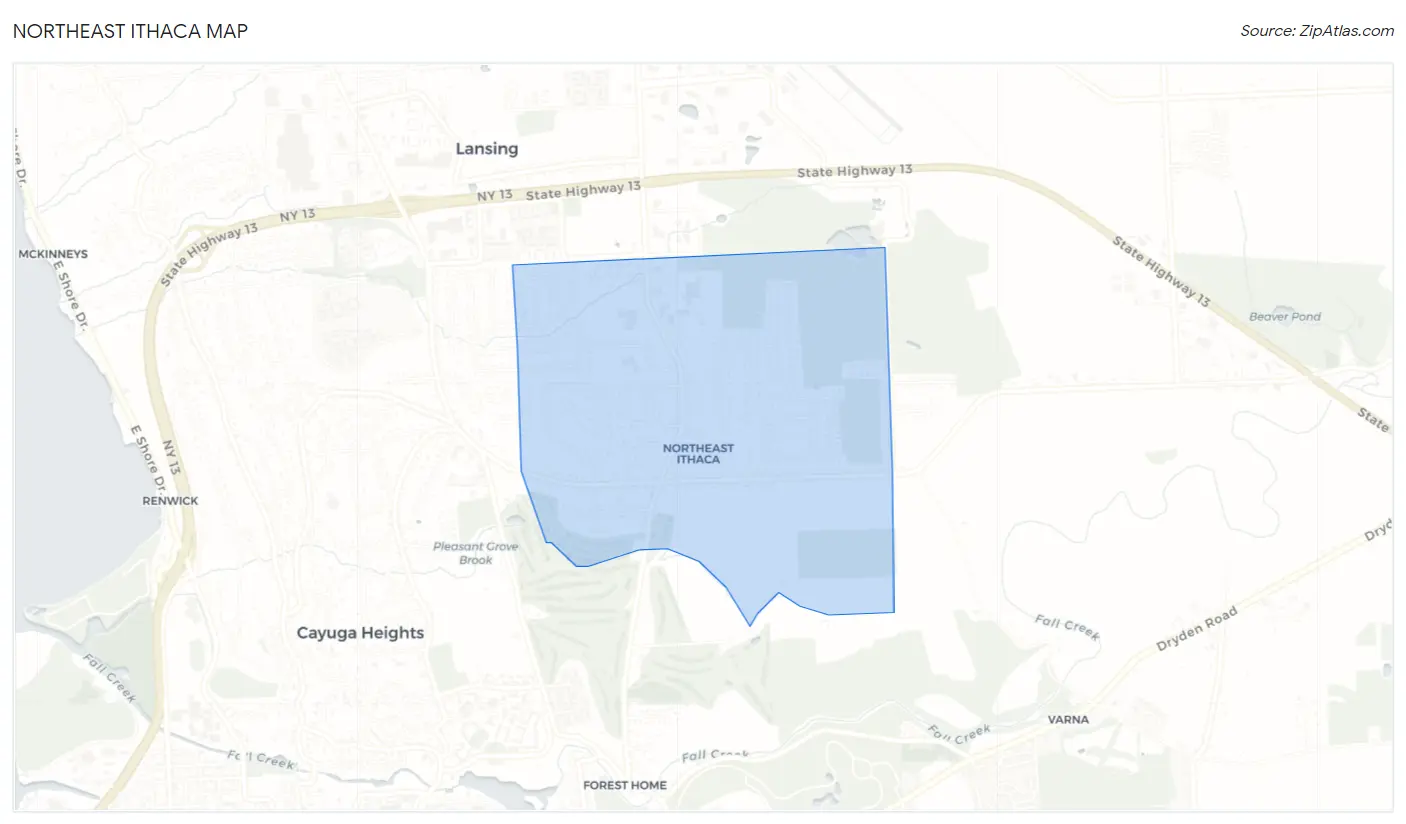
Northeast Ithaca Overview
$53,564
PER CAPITA INCOME
$138,594
AVG FAMILY INCOME
$94,306
AVG HOUSEHOLD INCOME
21.3%
WAGE / INCOME GAP [ % ]
78.7¢/ $1
WAGE / INCOME GAP [ $ ]
0.39
INEQUALITY / GINI INDEX
2,627
TOTAL POPULATION
1,243
MALE POPULATION
1,384
FEMALE POPULATION
89.81
MALES / 100 FEMALES
111.34
FEMALES / 100 MALES
40.5
MEDIAN AGE
2.7
AVG FAMILY SIZE
2.2
AVG HOUSEHOLD SIZE
1,454
LABOR FORCE [ PEOPLE ]
67.8%
PERCENT IN LABOR FORCE
3.0%
UNEMPLOYMENT RATE
Income in Northeast Ithaca
Income Overview in Northeast Ithaca
Per Capita Income in Northeast Ithaca is $53,564, while median incomes of families and households are $138,594 and $94,306 respectively.
| Characteristic | Number | Measure |
| Per Capita Income | 2,627 | $53,564 |
| Median Family Income | 760 | $138,594 |
| Mean Family Income | 760 | $151,552 |
| Median Household Income | 1,169 | $94,306 |
| Mean Household Income | 1,169 | $124,185 |
| Income Deficit | 760 | $0 |
| Wage / Income Gap (%) | 2,627 | 21.34% |
| Wage / Income Gap ($) | 2,627 | 78.66¢ per $1 |
| Gini / Inequality Index | 2,627 | 0.39 |
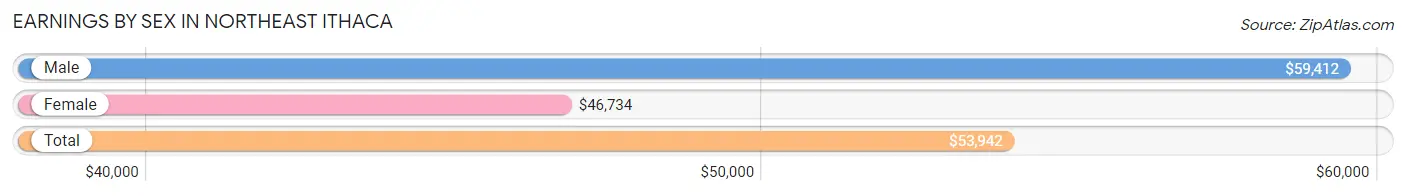
Earnings by Sex in Northeast Ithaca
Average Earnings in Northeast Ithaca are $53,942, $59,412 for men and $46,734 for women, a difference of 21.3%.
| Sex | Number | Average Earnings |
| Male | 762 (49.4%) | $59,412 |
| Female | 779 (50.5%) | $46,734 |
| Total | 1,541 (100.0%) | $53,942 |
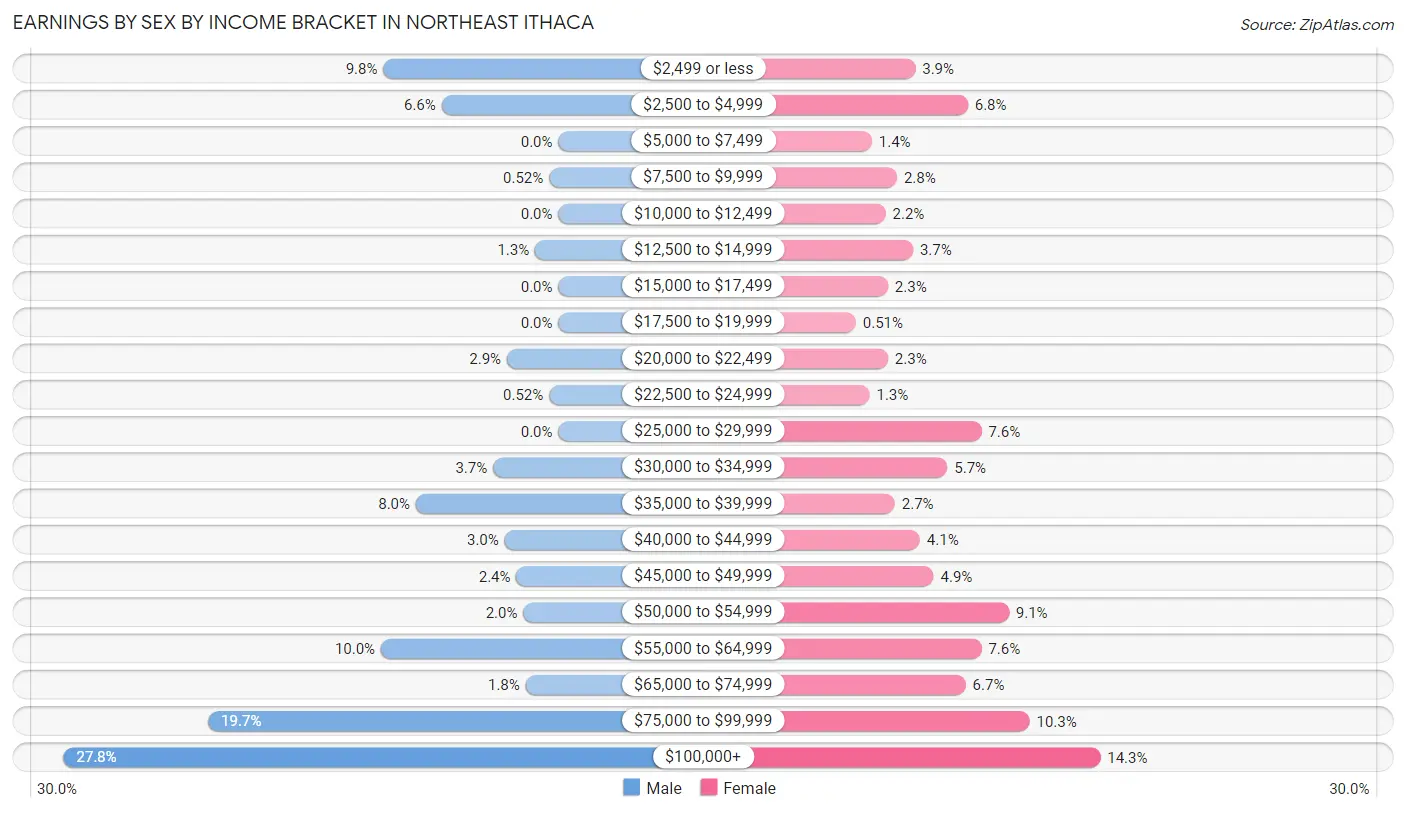
Earnings by Sex by Income Bracket in Northeast Ithaca
The most common earnings brackets in Northeast Ithaca are $100,000+ for men (212 | 27.8%) and $100,000+ for women (111 | 14.2%).
| Income | Male | Female |
| $2,499 or less | 75 (9.8%) | 30 (3.8%) |
| $2,500 to $4,999 | 50 (6.6%) | 53 (6.8%) |
| $5,000 to $7,499 | 0 (0.0%) | 11 (1.4%) |
| $7,500 to $9,999 | 4 (0.5%) | 22 (2.8%) |
| $10,000 to $12,499 | 0 (0.0%) | 17 (2.2%) |
| $12,500 to $14,999 | 10 (1.3%) | 29 (3.7%) |
| $15,000 to $17,499 | 0 (0.0%) | 18 (2.3%) |
| $17,500 to $19,999 | 0 (0.0%) | 4 (0.5%) |
| $20,000 to $22,499 | 22 (2.9%) | 18 (2.3%) |
| $22,500 to $24,999 | 4 (0.5%) | 10 (1.3%) |
| $25,000 to $29,999 | 0 (0.0%) | 59 (7.6%) |
| $30,000 to $34,999 | 28 (3.7%) | 44 (5.7%) |
| $35,000 to $39,999 | 61 (8.0%) | 21 (2.7%) |
| $40,000 to $44,999 | 23 (3.0%) | 32 (4.1%) |
| $45,000 to $49,999 | 18 (2.4%) | 38 (4.9%) |
| $50,000 to $54,999 | 15 (2.0%) | 71 (9.1%) |
| $55,000 to $64,999 | 76 (10.0%) | 59 (7.6%) |
| $65,000 to $74,999 | 14 (1.8%) | 52 (6.7%) |
| $75,000 to $99,999 | 150 (19.7%) | 80 (10.3%) |
| $100,000+ | 212 (27.8%) | 111 (14.2%) |
| Total | 762 (100.0%) | 779 (100.0%) |
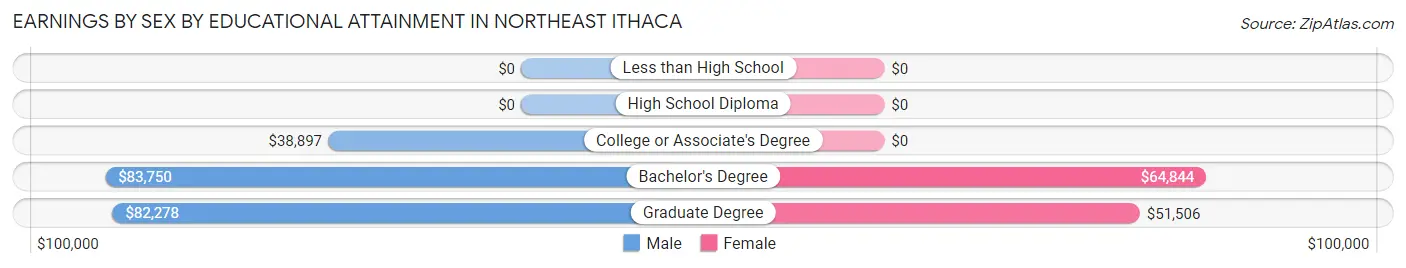
Earnings by Sex by Educational Attainment in Northeast Ithaca
Average earnings in Northeast Ithaca are $81,467 for men and $48,571 for women, a difference of 40.4%. Men with an educational attainment of bachelor's degree enjoy the highest average annual earnings of $83,750, while those with college or associate's degree education earn the least with $38,897. Women with an educational attainment of bachelor's degree earn the most with the average annual earnings of $64,844, while those with graduate degree education have the smallest earnings of $51,506.
| Educational Attainment | Male Income | Female Income |
| Less than High School | - | - |
| High School Diploma | - | - |
| College or Associate's Degree | $38,897 | $0 |
| Bachelor's Degree | $83,750 | $64,844 |
| Graduate Degree | $82,278 | $51,506 |
| Total | $81,467 | $48,571 |
Family Income in Northeast Ithaca
Family Income Brackets in Northeast Ithaca
According to the Northeast Ithaca family income data, there are 204 families falling into the $100,000 to $149,999 income range, which is the most common income bracket and makes up 26.8% of all families.
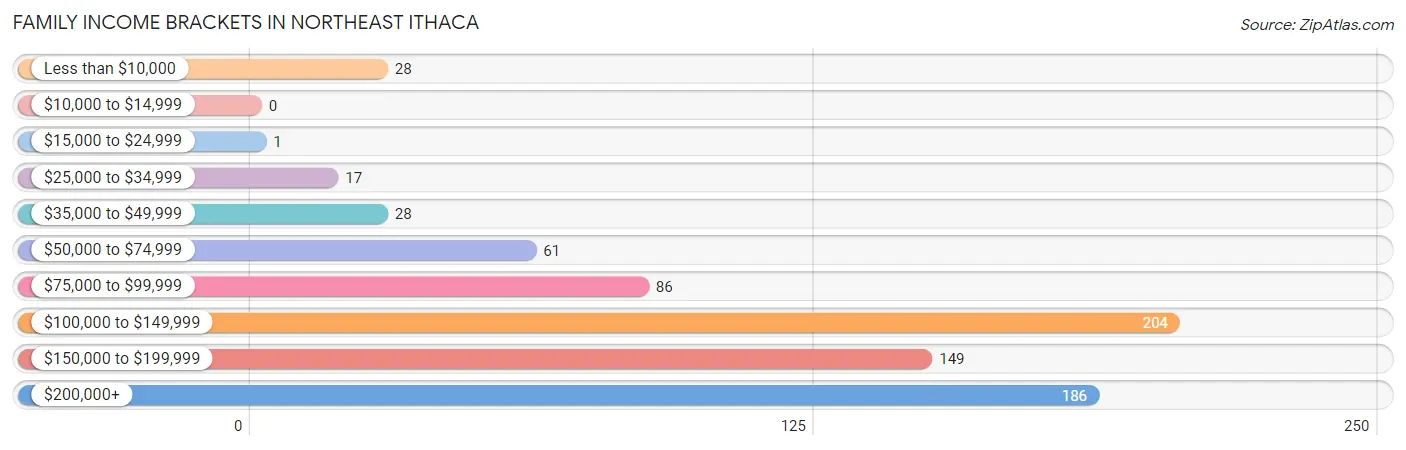
| Income Bracket | # Families | % Families |
| Less than $10,000 | 28 | 3.7% |
| $10,000 to $14,999 | 0 | 0.0% |
| $15,000 to $24,999 | 1 | 0.1% |
| $25,000 to $34,999 | 17 | 2.2% |
| $35,000 to $49,999 | 28 | 3.7% |
| $50,000 to $74,999 | 61 | 8.0% |
| $75,000 to $99,999 | 86 | 11.3% |
| $100,000 to $149,999 | 204 | 26.8% |
| $150,000 to $199,999 | 149 | 19.6% |
| $200,000+ | 186 | 24.5% |
Family Income by Famaliy Size in Northeast Ithaca
4-person families (239 | 31.5%) account for the highest median family income in Northeast Ithaca with $153,203 per family, while 4-person families (239 | 31.5%) have the highest median income of $38,301 per family member.
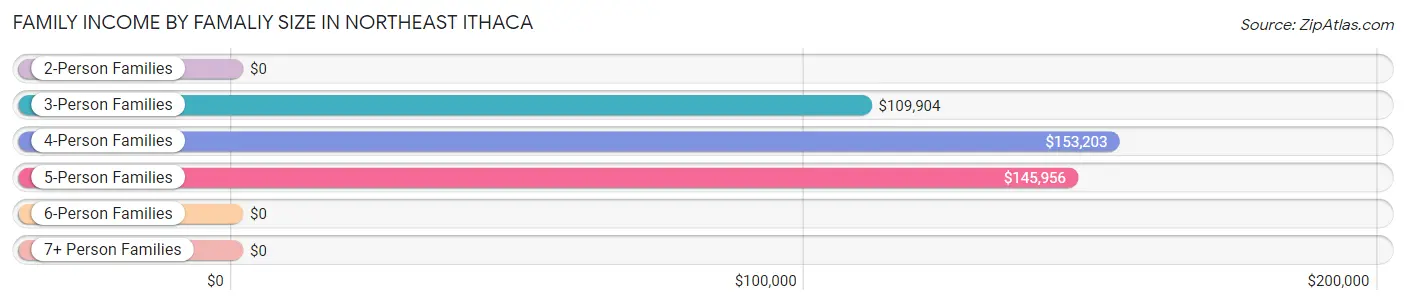
| Income Bracket | # Families | Median Income |
| 2-Person Families | 319 (42.0%) | $0 |
| 3-Person Families | 153 (20.1%) | $109,904 |
| 4-Person Families | 239 (31.5%) | $153,203 |
| 5-Person Families | 49 (6.5%) | $145,956 |
| 6-Person Families | 0 (0.0%) | $0 |
| 7+ Person Families | 0 (0.0%) | $0 |
| Total | 760 (100.0%) | $138,594 |
Family Income by Number of Earners in Northeast Ithaca
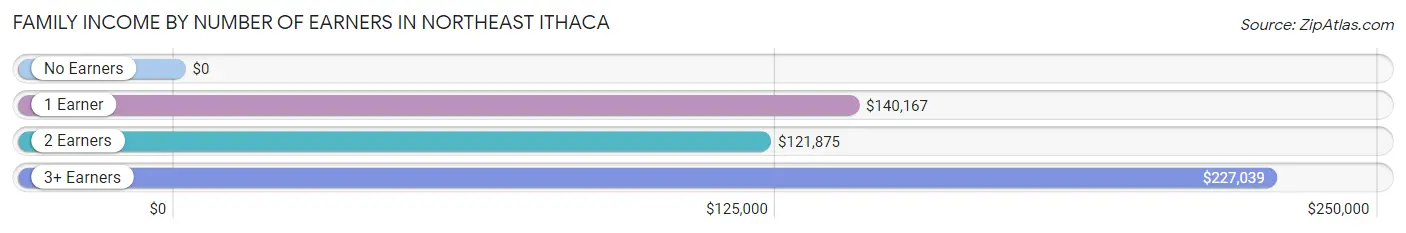
| Number of Earners | # Families | Median Income |
| No Earners | 65 (8.6%) | $0 |
| 1 Earner | 264 (34.7%) | $140,167 |
| 2 Earners | 344 (45.3%) | $121,875 |
| 3+ Earners | 87 (11.5%) | $227,039 |
| Total | 760 (100.0%) | $138,594 |
Household Income in Northeast Ithaca
Household Income Brackets in Northeast Ithaca
With 233 households falling in the category, the $50,000 to $74,999 income range is the most frequent in Northeast Ithaca, accounting for 19.9% of all households.
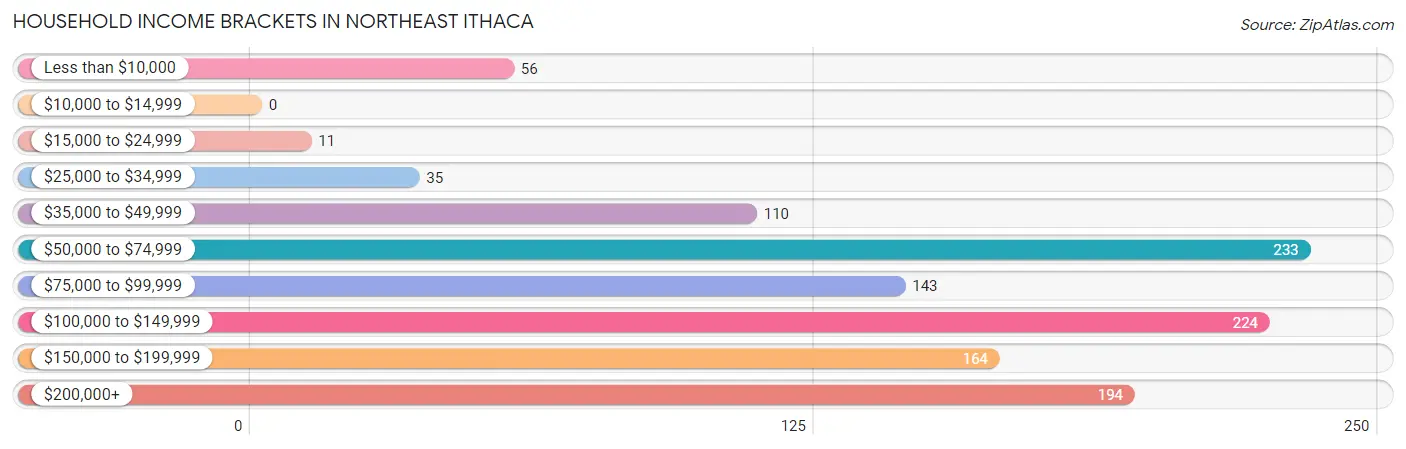
| Income Bracket | # Households | % Households |
| Less than $10,000 | 56 | 4.8% |
| $10,000 to $14,999 | 0 | 0.0% |
| $15,000 to $24,999 | 11 | 0.9% |
| $25,000 to $34,999 | 35 | 3.0% |
| $35,000 to $49,999 | 110 | 9.4% |
| $50,000 to $74,999 | 233 | 19.9% |
| $75,000 to $99,999 | 143 | 12.2% |
| $100,000 to $149,999 | 224 | 19.2% |
| $150,000 to $199,999 | 164 | 14.0% |
| $200,000+ | 194 | 16.6% |
Household Income by Householder Age in Northeast Ithaca
The median household income in Northeast Ithaca is $94,306, with the highest median household income of $121,250 found in the 45 to 64 years age bracket for the primary householder. A total of 338 households (28.9%) fall into this category. Meanwhile, the 15 to 24 years age bracket for the primary householder has the lowest median household income of $39,500, with 100 households (8.6%) in this group.
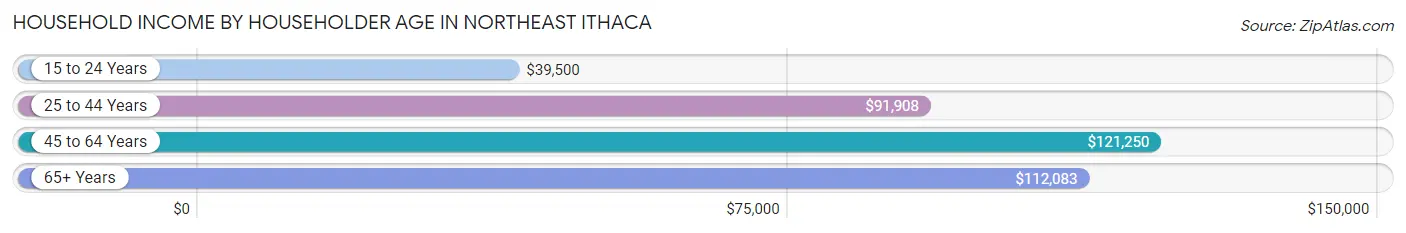
| Income Bracket | # Households | Median Income |
| 15 to 24 Years | 100 (8.6%) | $39,500 |
| 25 to 44 Years | 407 (34.8%) | $91,908 |
| 45 to 64 Years | 338 (28.9%) | $121,250 |
| 65+ Years | 324 (27.7%) | $112,083 |
| Total | 1,169 (100.0%) | $94,306 |
Poverty in Northeast Ithaca
Income Below Poverty by Sex and Age in Northeast Ithaca
With 4.7% poverty level for males and 7.7% for females among the residents of Northeast Ithaca, 5 year old males and 15 year old females are the most vulnerable to poverty, with 10 males (100.0%) and 11 females (78.6%) in their respective age groups living below the poverty level.
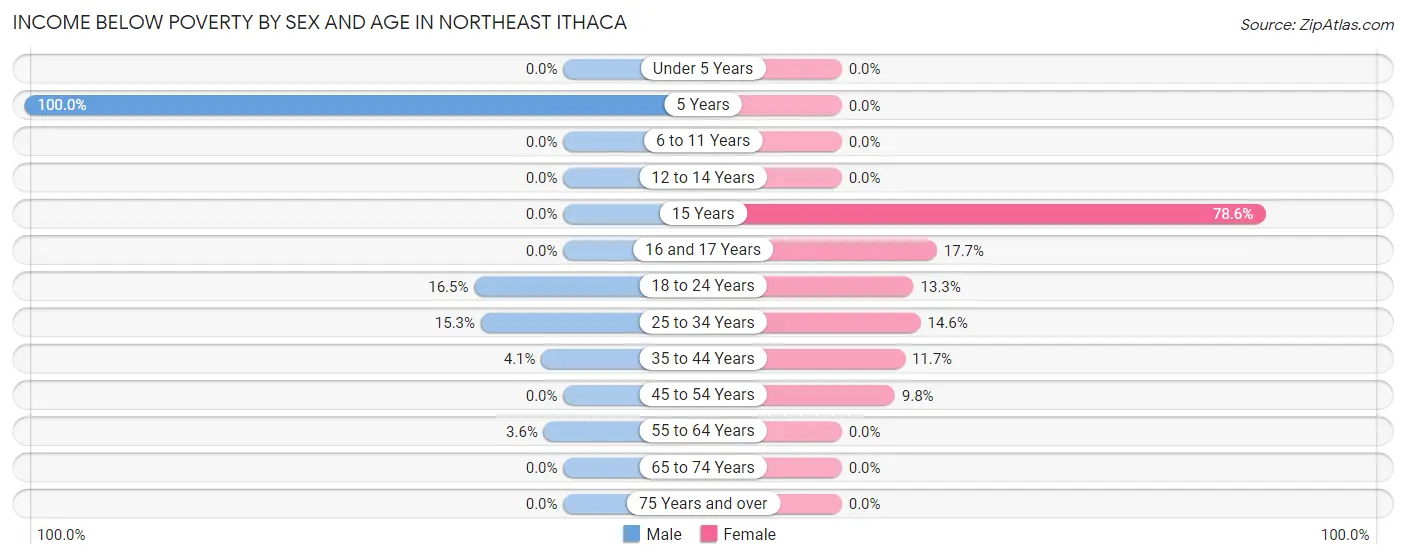
| Age Bracket | Male | Female |
| Under 5 Years | 0 (0.0%) | 0 (0.0%) |
| 5 Years | 10 (100.0%) | 0 (0.0%) |
| 6 to 11 Years | 0 (0.0%) | 0 (0.0%) |
| 12 to 14 Years | 0 (0.0%) | 0 (0.0%) |
| 15 Years | 0 (0.0%) | 11 (78.6%) |
| 16 and 17 Years | 0 (0.0%) | 3 (17.6%) |
| 18 to 24 Years | 20 (16.5%) | 8 (13.3%) |
| 25 to 34 Years | 15 (15.3%) | 36 (14.6%) |
| 35 to 44 Years | 8 (4.1%) | 30 (11.7%) |
| 45 to 54 Years | 0 (0.0%) | 18 (9.8%) |
| 55 to 64 Years | 4 (3.6%) | 0 (0.0%) |
| 65 to 74 Years | 0 (0.0%) | 0 (0.0%) |
| 75 Years and over | 0 (0.0%) | 0 (0.0%) |
| Total | 57 (4.7%) | 106 (7.7%) |
Income Above Poverty by Sex and Age in Northeast Ithaca
According to the poverty statistics in Northeast Ithaca, males aged under 5 years and females aged under 5 years are the age groups that are most secure financially, with 100.0% of males and 100.0% of females in these age groups living above the poverty line.
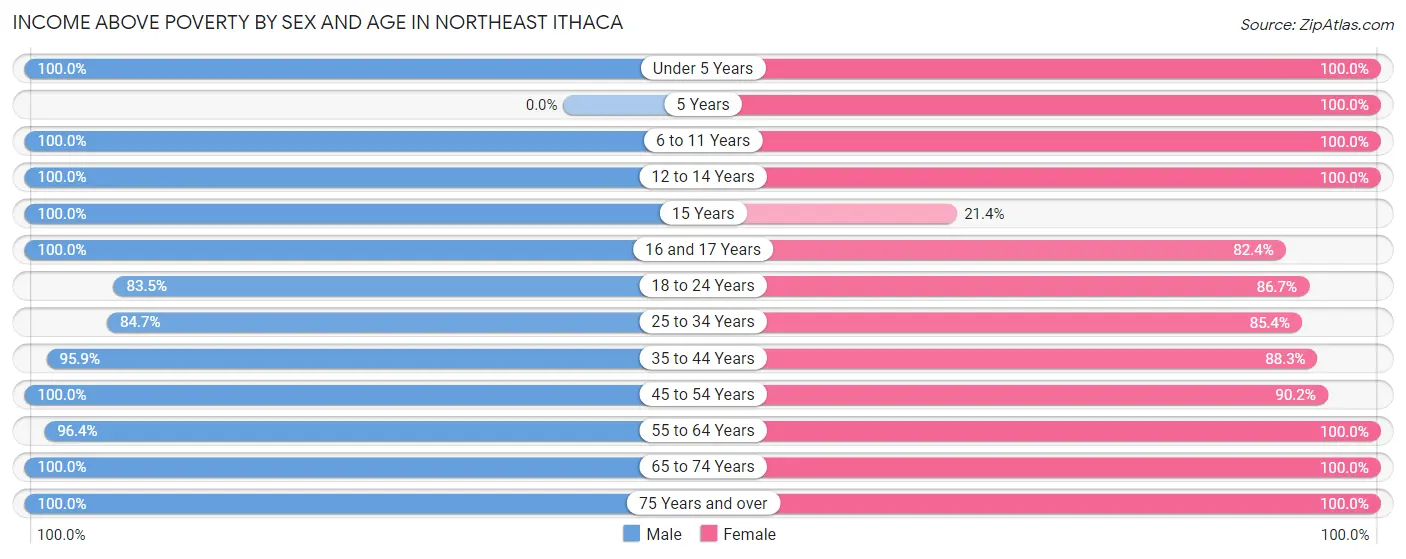
| Age Bracket | Male | Female |
| Under 5 Years | 68 (100.0%) | 5 (100.0%) |
| 5 Years | 0 (0.0%) | 22 (100.0%) |
| 6 to 11 Years | 56 (100.0%) | 105 (100.0%) |
| 12 to 14 Years | 64 (100.0%) | 82 (100.0%) |
| 15 Years | 28 (100.0%) | 3 (21.4%) |
| 16 and 17 Years | 49 (100.0%) | 14 (82.4%) |
| 18 to 24 Years | 101 (83.5%) | 52 (86.7%) |
| 25 to 34 Years | 83 (84.7%) | 210 (85.4%) |
| 35 to 44 Years | 188 (95.9%) | 226 (88.3%) |
| 45 to 54 Years | 214 (100.0%) | 165 (90.2%) |
| 55 to 64 Years | 106 (96.4%) | 92 (100.0%) |
| 65 to 74 Years | 106 (100.0%) | 147 (100.0%) |
| 75 Years and over | 89 (100.0%) | 154 (100.0%) |
| Total | 1,152 (95.3%) | 1,277 (92.3%) |
Income Below Poverty Among Married-Couple Families in Northeast Ithaca
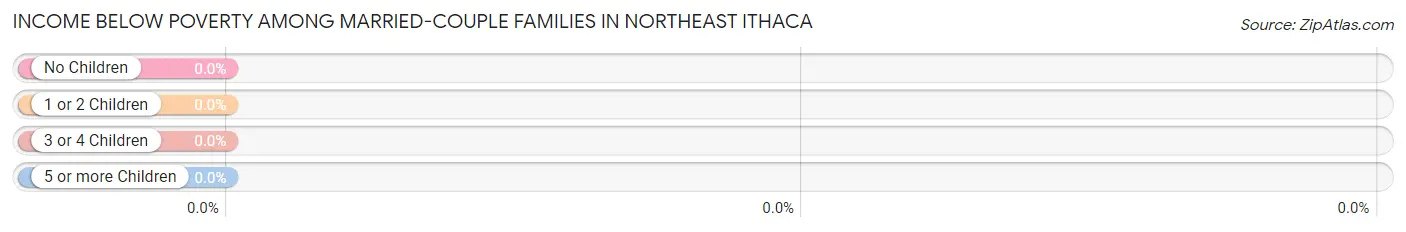
| Children | Above Poverty | Below Poverty |
| No Children | 330 (100.0%) | 0 (0.0%) |
| 1 or 2 Children | 301 (100.0%) | 0 (0.0%) |
| 3 or 4 Children | 31 (100.0%) | 0 (0.0%) |
| 5 or more Children | 0 (0.0%) | 0 (0.0%) |
| Total | 662 (100.0%) | 0 (0.0%) |
Income Below Poverty Among Single-Parent Households in Northeast Ithaca
According to the poverty data in Northeast Ithaca, 40.5% or 15 single-father households and 45.9% or 28 single-mother households are living below the poverty line. Among single-father households, those with 1 or 2 children have the highest poverty rate, with 15 households (68.2%) experiencing poverty. Likewise, among single-mother households, those with 1 or 2 children have the highest poverty rate, with 10 households (76.9%) falling below the poverty line.
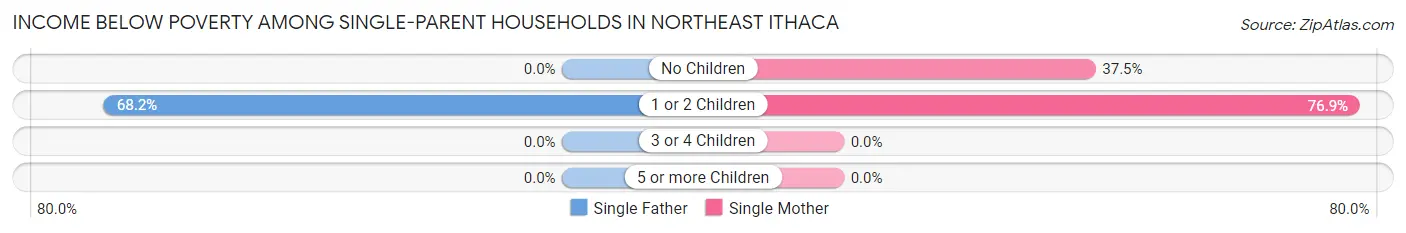
| Children | Single Father | Single Mother |
| No Children | 0 (0.0%) | 18 (37.5%) |
| 1 or 2 Children | 15 (68.2%) | 10 (76.9%) |
| 3 or 4 Children | 0 (0.0%) | 0 (0.0%) |
| 5 or more Children | 0 (0.0%) | 0 (0.0%) |
| Total | 15 (40.5%) | 28 (45.9%) |
Income Below Poverty Among Married-Couple vs Single-Parent Households in Northeast Ithaca
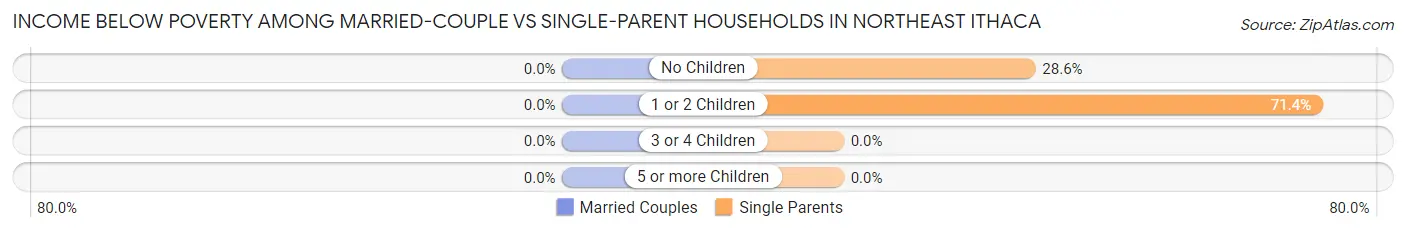
| Children | Married-Couple Families | Single-Parent Households |
| No Children | 0 (0.0%) | 18 (28.6%) |
| 1 or 2 Children | 0 (0.0%) | 25 (71.4%) |
| 3 or 4 Children | 0 (0.0%) | 0 (0.0%) |
| 5 or more Children | 0 (0.0%) | 0 (0.0%) |
| Total | 0 (0.0%) | 43 (43.9%) |
Race in Northeast Ithaca
The most populous races in Northeast Ithaca are White / Caucasian (2,072 | 78.9%), Asian (345 | 13.1%), and Hispanic or Latino (95 | 3.6%).
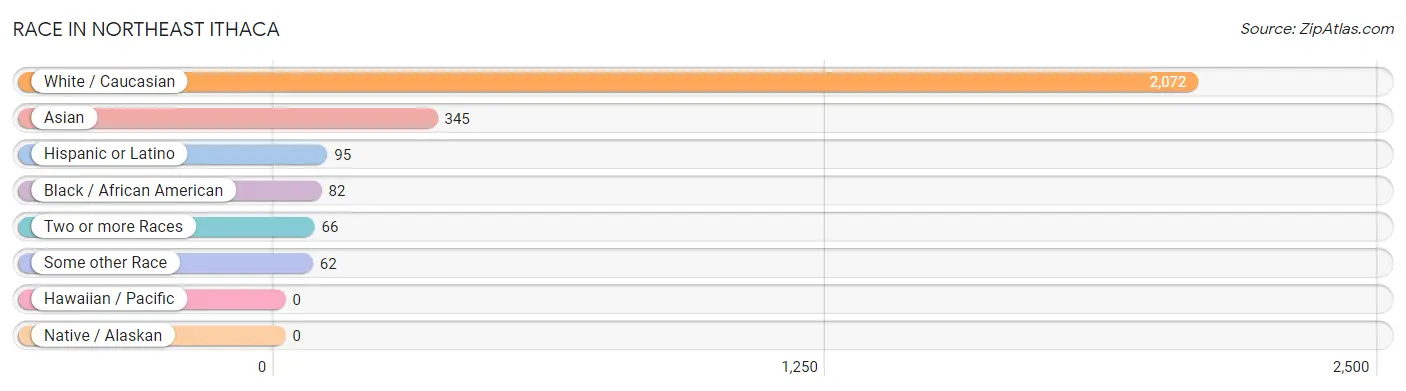
| Race | # Population | % Population |
| Asian | 345 | 13.1% |
| Black / African American | 82 | 3.1% |
| Hawaiian / Pacific | 0 | 0.0% |
| Hispanic or Latino | 95 | 3.6% |
| Native / Alaskan | 0 | 0.0% |
| White / Caucasian | 2,072 | 78.9% |
| Two or more Races | 66 | 2.5% |
| Some other Race | 62 | 2.4% |
| Total | 2,627 | 100.0% |
Ancestry in Northeast Ithaca
The most populous ancestries reported in Northeast Ithaca are German (358 | 13.6%), English (334 | 12.7%), Italian (243 | 9.2%), Irish (235 | 8.9%), and European (231 | 8.8%), together accounting for 53.3% of all Northeast Ithaca residents.
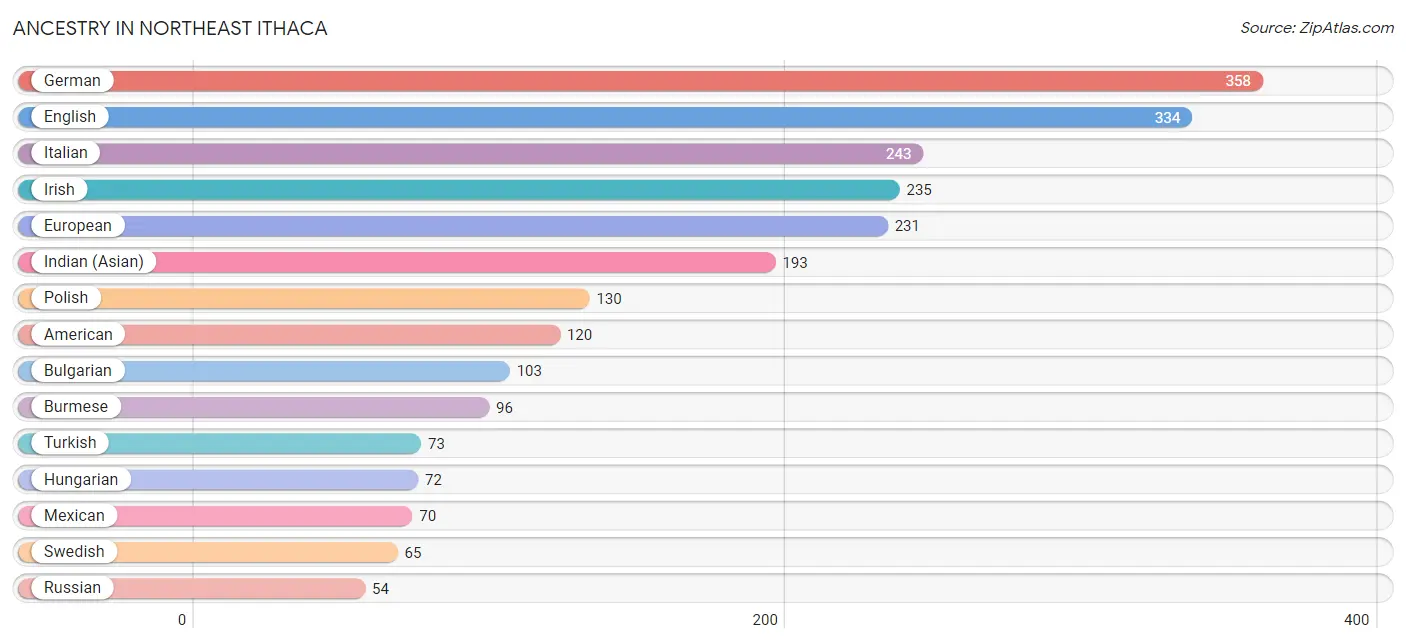
| Ancestry | # Population | % Population |
| American | 120 | 4.6% |
| Arab | 1 | 0.0% |
| Austrian | 16 | 0.6% |
| Bhutanese | 9 | 0.3% |
| Bulgarian | 103 | 3.9% |
| Burmese | 96 | 3.6% |
| Canadian | 33 | 1.3% |
| Cuban | 3 | 0.1% |
| Czech | 20 | 0.8% |
| Danish | 13 | 0.5% |
| Dutch | 15 | 0.6% |
| Eastern European | 29 | 1.1% |
| English | 334 | 12.7% |
| European | 231 | 8.8% |
| Finnish | 24 | 0.9% |
| French | 52 | 2.0% |
| French Canadian | 9 | 0.3% |
| German | 358 | 13.6% |
| Hungarian | 72 | 2.7% |
| Indian (Asian) | 193 | 7.3% |
| Irish | 235 | 8.9% |
| Italian | 243 | 9.2% |
| Kenyan | 19 | 0.7% |
| Korean | 2 | 0.1% |
| Lithuanian | 18 | 0.7% |
| Lumbee | 8 | 0.3% |
| Mexican | 70 | 2.7% |
| Nigerian | 23 | 0.9% |
| Northern European | 14 | 0.5% |
| Norwegian | 8 | 0.3% |
| Polish | 130 | 5.0% |
| Portuguese | 18 | 0.7% |
| Russian | 54 | 2.1% |
| Scandinavian | 15 | 0.6% |
| Scotch-Irish | 9 | 0.3% |
| Scottish | 40 | 1.5% |
| South American | 16 | 0.6% |
| Spaniard | 6 | 0.2% |
| Sri Lankan | 9 | 0.3% |
| Subsaharan African | 51 | 1.9% |
| Swedish | 65 | 2.5% |
| Swiss | 28 | 1.1% |
| Thai | 46 | 1.8% |
| Trinidadian and Tobagonian | 4 | 0.2% |
| Turkish | 73 | 2.8% |
| Ugandan | 9 | 0.3% |
| Ukrainian | 34 | 1.3% |
| Venezuelan | 16 | 0.6% |
| Welsh | 34 | 1.3% | View All 49 Rows |
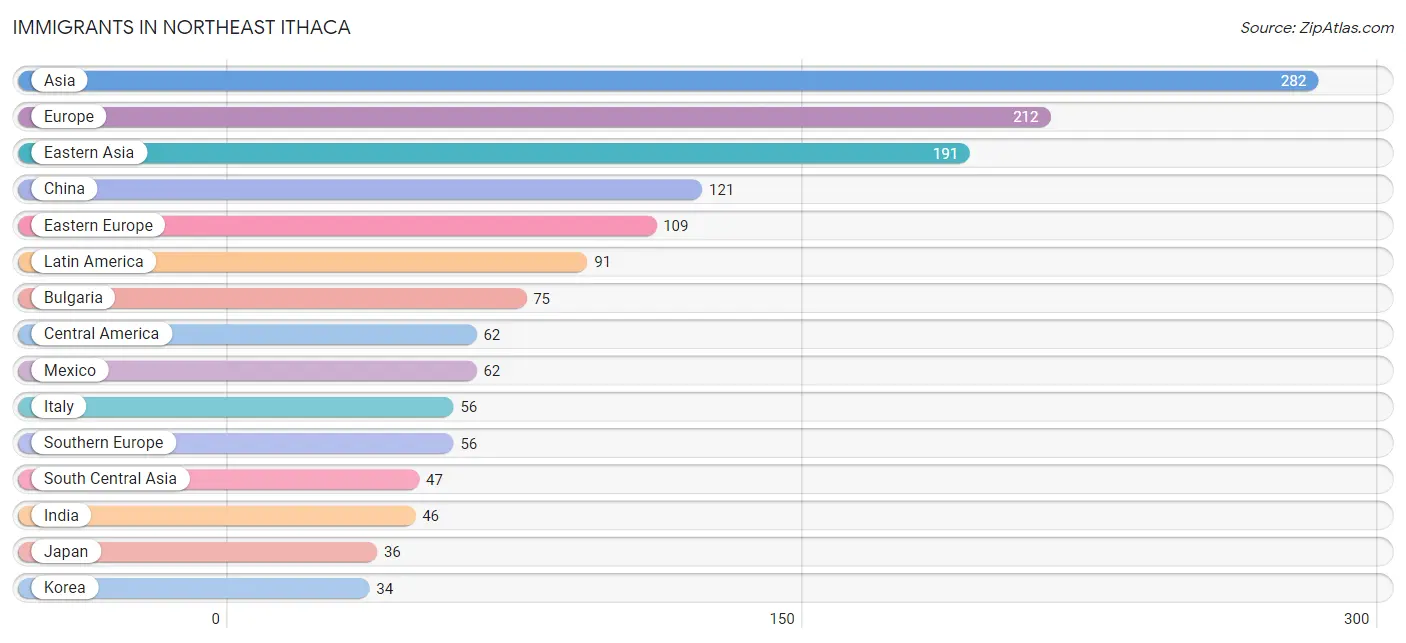
Immigrants in Northeast Ithaca
The most numerous immigrant groups reported in Northeast Ithaca came from Asia (282 | 10.7%), Europe (212 | 8.1%), Eastern Asia (191 | 7.3%), China (121 | 4.6%), and Eastern Europe (109 | 4.2%), together accounting for 34.8% of all Northeast Ithaca residents.
| Immigration Origin | # Population | % Population |
| Africa | 31 | 1.2% |
| Asia | 282 | 10.7% |
| Brazil | 18 | 0.7% |
| Bulgaria | 75 | 2.9% |
| Canada | 9 | 0.3% |
| Caribbean | 4 | 0.2% |
| Central America | 62 | 2.4% |
| China | 121 | 4.6% |
| Eastern Africa | 29 | 1.1% |
| Eastern Asia | 191 | 7.3% |
| Eastern Europe | 109 | 4.2% |
| England | 4 | 0.2% |
| Europe | 212 | 8.1% |
| France | 10 | 0.4% |
| Germany | 3 | 0.1% |
| India | 46 | 1.8% |
| Italy | 56 | 2.1% |
| Japan | 36 | 1.4% |
| Kenya | 20 | 0.8% |
| Korea | 34 | 1.3% |
| Latin America | 91 | 3.5% |
| Mexico | 62 | 2.4% |
| Moldova | 8 | 0.3% |
| Nepal | 1 | 0.0% |
| Netherlands | 14 | 0.5% |
| Nigeria | 2 | 0.1% |
| Northern Europe | 20 | 0.8% |
| Philippines | 2 | 0.1% |
| Poland | 26 | 1.0% |
| South America | 25 | 0.9% |
| South Central Asia | 47 | 1.8% |
| South Eastern Asia | 11 | 0.4% |
| Southern Europe | 56 | 2.1% |
| Trinidad and Tobago | 4 | 0.2% |
| Turkey | 21 | 0.8% |
| Uganda | 9 | 0.3% |
| Venezuela | 7 | 0.3% |
| Vietnam | 9 | 0.3% |
| Western Africa | 2 | 0.1% |
| Western Asia | 33 | 1.3% |
| Western Europe | 27 | 1.0% | View All 41 Rows |
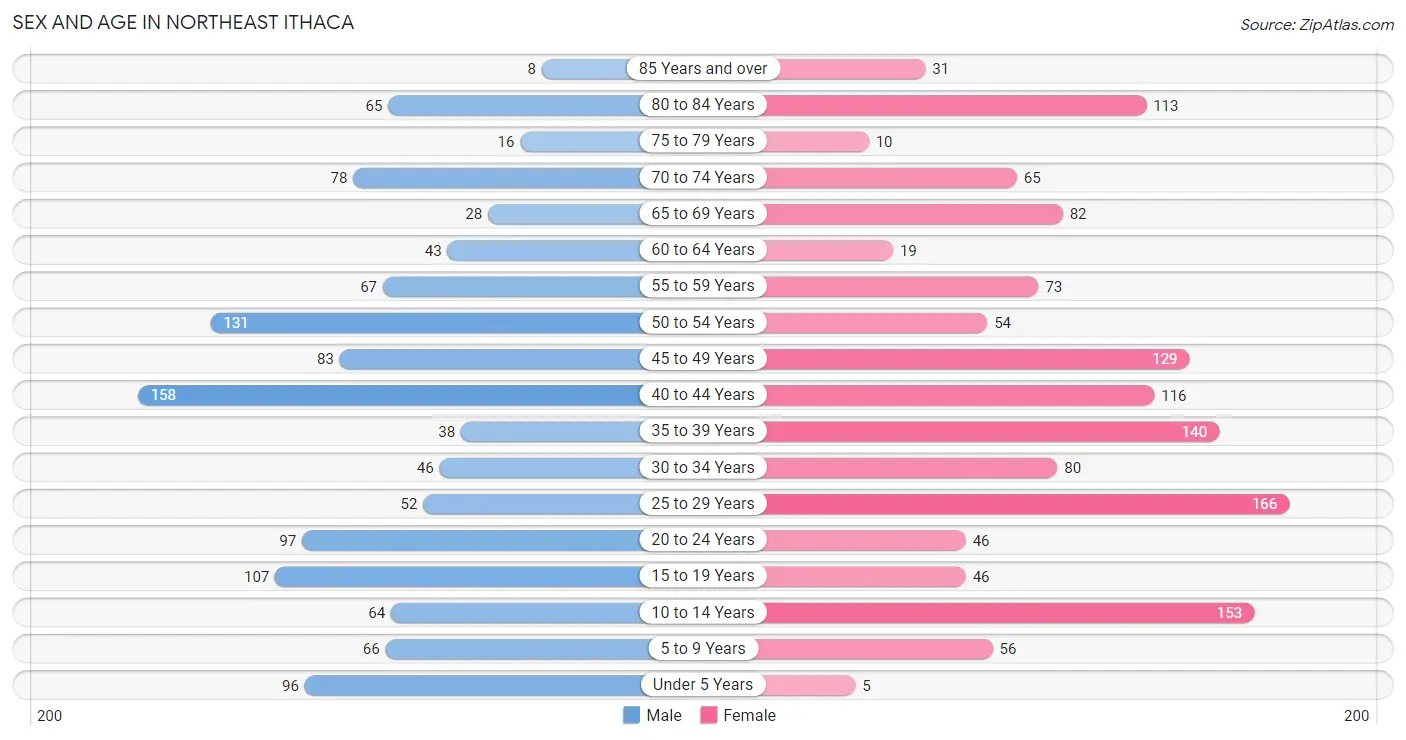
Sex and Age in Northeast Ithaca
Sex and Age in Northeast Ithaca
The most populous age groups in Northeast Ithaca are 40 to 44 Years (158 | 12.7%) for men and 25 to 29 Years (166 | 12.0%) for women.
| Age Bracket | Male | Female |
| Under 5 Years | 96 (7.7%) | 5 (0.4%) |
| 5 to 9 Years | 66 (5.3%) | 56 (4.1%) |
| 10 to 14 Years | 64 (5.1%) | 153 (11.1%) |
| 15 to 19 Years | 107 (8.6%) | 46 (3.3%) |
| 20 to 24 Years | 97 (7.8%) | 46 (3.3%) |
| 25 to 29 Years | 52 (4.2%) | 166 (12.0%) |
| 30 to 34 Years | 46 (3.7%) | 80 (5.8%) |
| 35 to 39 Years | 38 (3.1%) | 140 (10.1%) |
| 40 to 44 Years | 158 (12.7%) | 116 (8.4%) |
| 45 to 49 Years | 83 (6.7%) | 129 (9.3%) |
| 50 to 54 Years | 131 (10.5%) | 54 (3.9%) |
| 55 to 59 Years | 67 (5.4%) | 73 (5.3%) |
| 60 to 64 Years | 43 (3.5%) | 19 (1.4%) |
| 65 to 69 Years | 28 (2.2%) | 82 (5.9%) |
| 70 to 74 Years | 78 (6.3%) | 65 (4.7%) |
| 75 to 79 Years | 16 (1.3%) | 10 (0.7%) |
| 80 to 84 Years | 65 (5.2%) | 113 (8.2%) |
| 85 Years and over | 8 (0.6%) | 31 (2.2%) |
| Total | 1,243 (100.0%) | 1,384 (100.0%) |
Families and Households in Northeast Ithaca
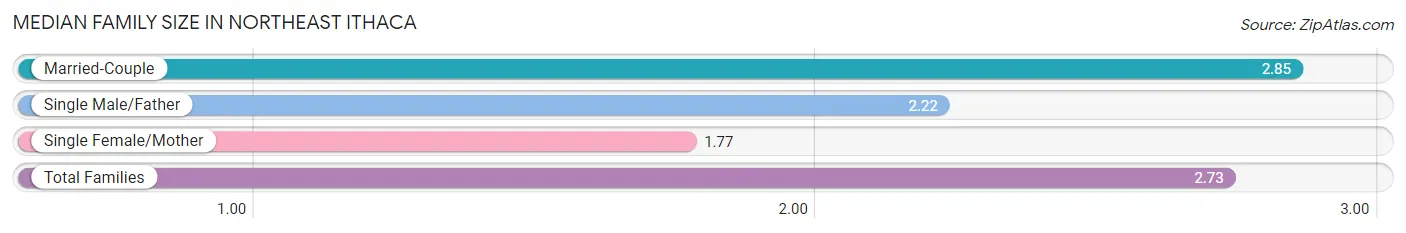
Median Family Size in Northeast Ithaca
The median family size in Northeast Ithaca is 2.73 persons per family, with married-couple families (662 | 87.1%) accounting for the largest median family size of 2.85 persons per family. On the other hand, single female/mother families (61 | 8.0%) represent the smallest median family size with 1.77 persons per family.
| Family Type | # Families | Family Size |
| Married-Couple | 662 (87.1%) | 2.85 |
| Single Male/Father | 37 (4.9%) | 2.22 |
| Single Female/Mother | 61 (8.0%) | 1.77 |
| Total Families | 760 (100.0%) | 2.73 |
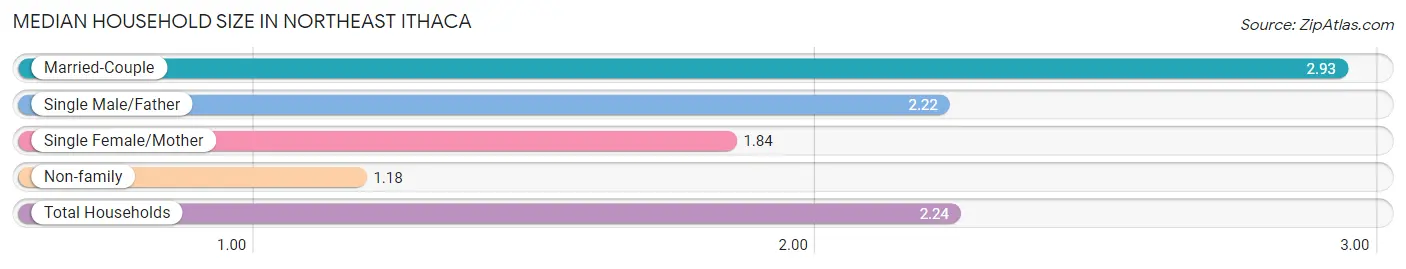
Median Household Size in Northeast Ithaca
The median household size in Northeast Ithaca is 2.24 persons per household, with married-couple households (662 | 56.6%) accounting for the largest median household size of 2.93 persons per household. non-family households (409 | 35.0%) represent the smallest median household size with 1.18 persons per household.
| Household Type | # Households | Household Size |
| Married-Couple | 662 (56.6%) | 2.93 |
| Single Male/Father | 37 (3.2%) | 2.22 |
| Single Female/Mother | 61 (5.2%) | 1.84 |
| Non-family | 409 (35.0%) | 1.18 |
| Total Households | 1,169 (100.0%) | 2.24 |
Household Size by Marriage Status in Northeast Ithaca
Out of a total of 1,169 households in Northeast Ithaca, 760 (65.0%) are family households, while 409 (35.0%) are nonfamily households. The most numerous type of family households are 2-person households, comprising 302, and the most common type of nonfamily households are 1-person households, comprising 347.
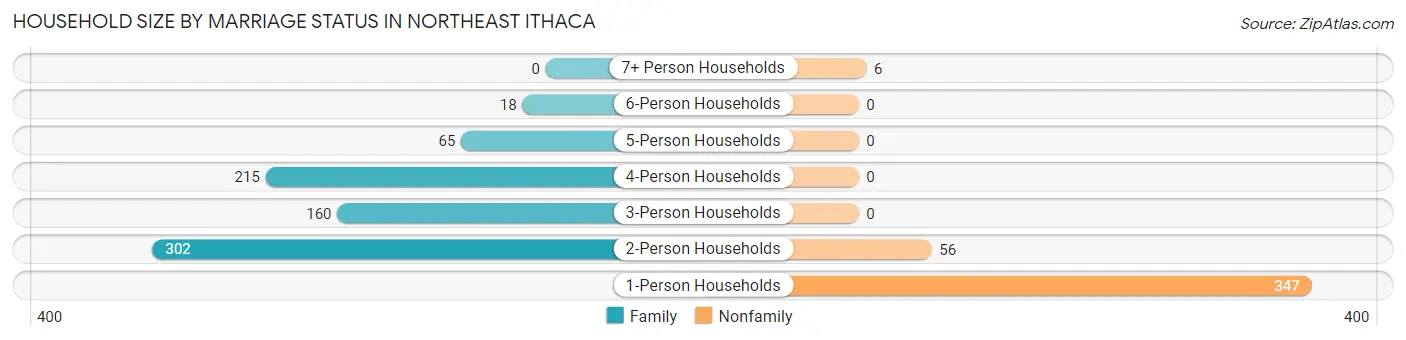
| Household Size | Family Households | Nonfamily Households |
| 1-Person Households | - | 347 (29.7%) |
| 2-Person Households | 302 (25.8%) | 56 (4.8%) |
| 3-Person Households | 160 (13.7%) | 0 (0.0%) |
| 4-Person Households | 215 (18.4%) | 0 (0.0%) |
| 5-Person Households | 65 (5.6%) | 0 (0.0%) |
| 6-Person Households | 18 (1.5%) | 0 (0.0%) |
| 7+ Person Households | 0 (0.0%) | 6 (0.5%) |
| Total | 760 (65.0%) | 409 (35.0%) |
Female Fertility in Northeast Ithaca
Fertility by Age in Northeast Ithaca
Average fertility rate in Northeast Ithaca is 28.0 births per 1,000 women. Women in the age bracket of 35 to 50 years have the highest fertility rate with 34.0 births per 1,000 women. Women in the age bracket of 35 to 50 years acount for 65.0% of all women with births.
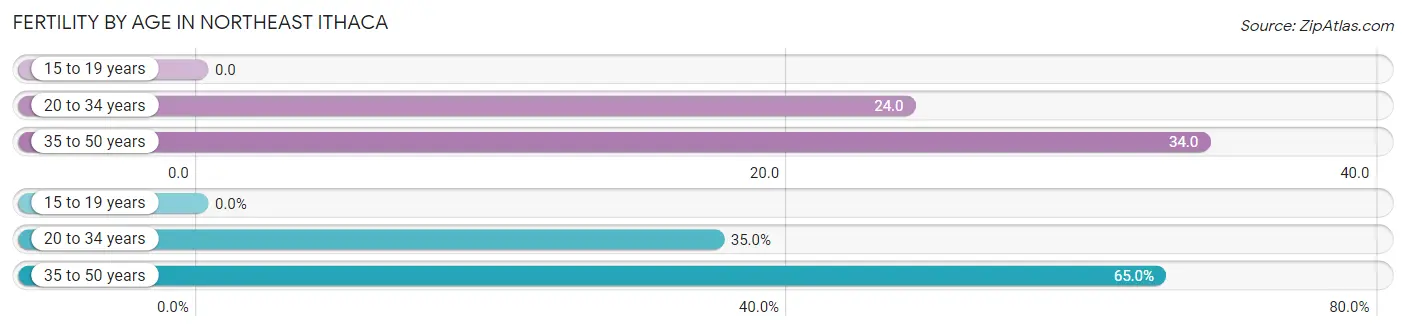
| Age Bracket | Women with Births | Births / 1,000 Women |
| 15 to 19 years | 0 (0.0%) | 0.0 |
| 20 to 34 years | 7 (35.0%) | 24.0 |
| 35 to 50 years | 13 (65.0%) | 34.0 |
| Total | 20 (100.0%) | 28.0 |
Fertility by Age by Marriage Status in Northeast Ithaca
60.0% of women with births (20) in Northeast Ithaca are married. The highest percentage of unmarried women with births falls into 35 to 50 years age bracket with 61.5% of them unmarried at the time of birth, while the lowest percentage of unmarried women with births belong to 20 to 34 years age bracket with 0.0% of them unmarried.
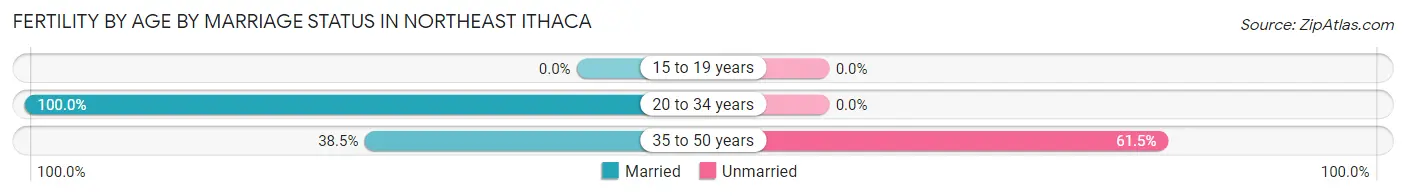
| Age Bracket | Married | Unmarried |
| 15 to 19 years | 0 (0.0%) | 0 (0.0%) |
| 20 to 34 years | 7 (100.0%) | 0 (0.0%) |
| 35 to 50 years | 5 (38.5%) | 8 (61.5%) |
| Total | 12 (60.0%) | 8 (40.0%) |
Fertility by Education in Northeast Ithaca
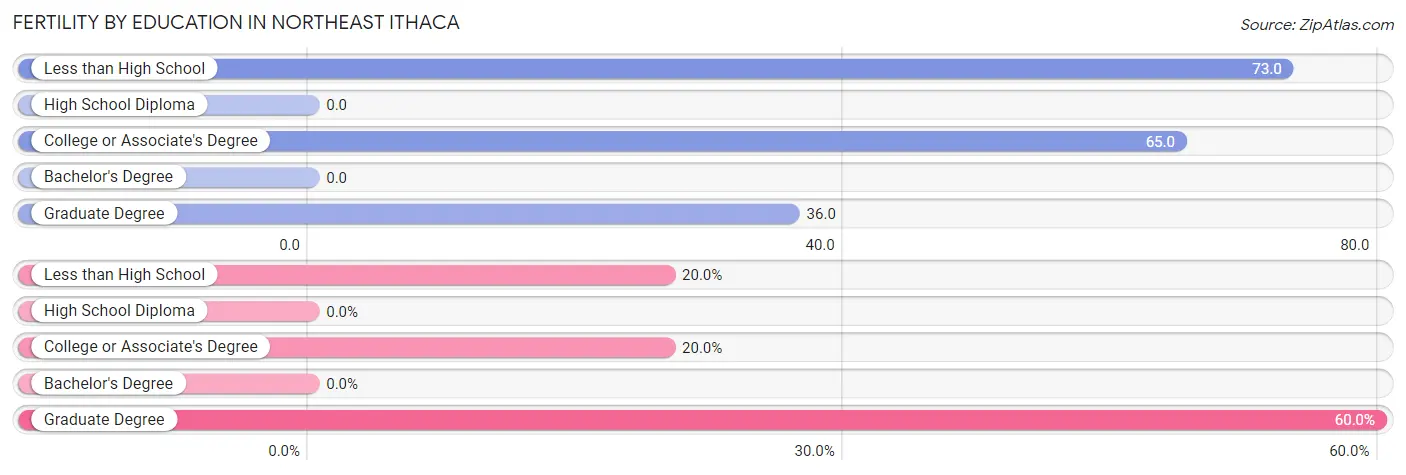
| Educational Attainment | Women with Births | Births / 1,000 Women |
| Less than High School | 4 (20.0%) | 73.0 |
| High School Diploma | 0 (0.0%) | 0.0 |
| College or Associate's Degree | 4 (20.0%) | 65.0 |
| Bachelor's Degree | 0 (0.0%) | 0.0 |
| Graduate Degree | 12 (60.0%) | 36.0 |
| Total | 20 (100.0%) | 28.0 |
Fertility by Education by Marriage Status in Northeast Ithaca
40.0% of women with births in Northeast Ithaca are unmarried. Women with the educational attainment of graduate degree are most likely to be married with 100.0% of them married at childbirth, while women with the educational attainment of less than high school are least likely to be married with 100.0% of them unmarried at childbirth.
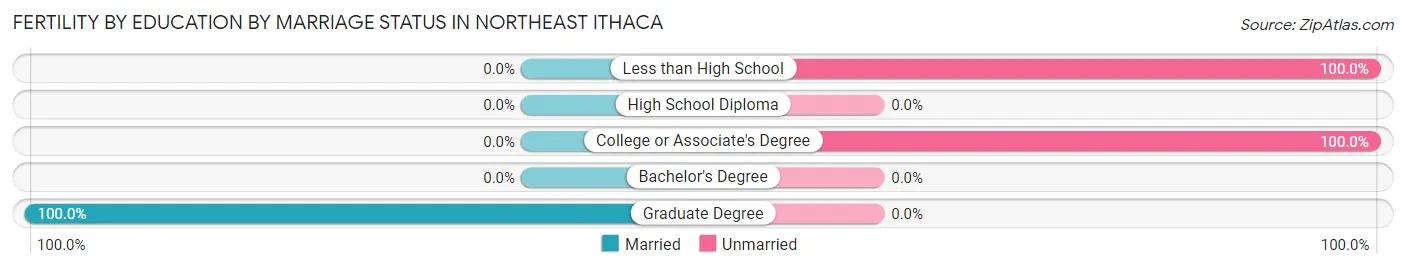
| Educational Attainment | Married | Unmarried |
| Less than High School | 0 (0.0%) | 4 (100.0%) |
| High School Diploma | 0 (0.0%) | 0 (0.0%) |
| College or Associate's Degree | 0 (0.0%) | 4 (100.0%) |
| Bachelor's Degree | 0 (0.0%) | 0 (0.0%) |
| Graduate Degree | 12 (100.0%) | 0 (0.0%) |
| Total | 12 (60.0%) | 8 (40.0%) |
Employment Characteristics in Northeast Ithaca
Employment by Class of Employer in Northeast Ithaca
Among the 1,387 employed individuals in Northeast Ithaca, not-for-profit organizations (628 | 45.3%), private company employees (493 | 35.5%), and state government employees (95 | 6.9%) make up the most common classes of employment.
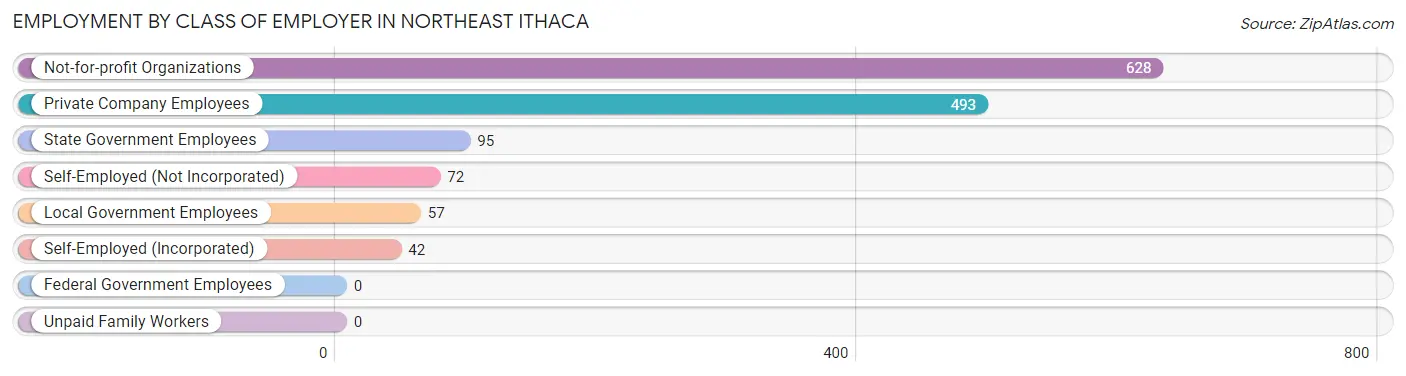
| Employer Class | # Employees | % Employees |
| Private Company Employees | 493 | 35.5% |
| Self-Employed (Incorporated) | 42 | 3.0% |
| Self-Employed (Not Incorporated) | 72 | 5.2% |
| Not-for-profit Organizations | 628 | 45.3% |
| Local Government Employees | 57 | 4.1% |
| State Government Employees | 95 | 6.9% |
| Federal Government Employees | 0 | 0.0% |
| Unpaid Family Workers | 0 | 0.0% |
| Total | 1,387 | 100.0% |
Employment Status by Age in Northeast Ithaca
According to the labor force statistics for Northeast Ithaca, out of the total population over 16 years of age (2,144), 67.8% or 1,454 individuals are in the labor force, with 3.0% or 44 of them unemployed. The age group with the highest labor force participation rate is 25 to 29 years, with 89.9% or 196 individuals in the labor force. Within the labor force, the 20 to 24 years age range has the highest percentage of unemployed individuals, with 16.9% or 20 of them being unemployed.
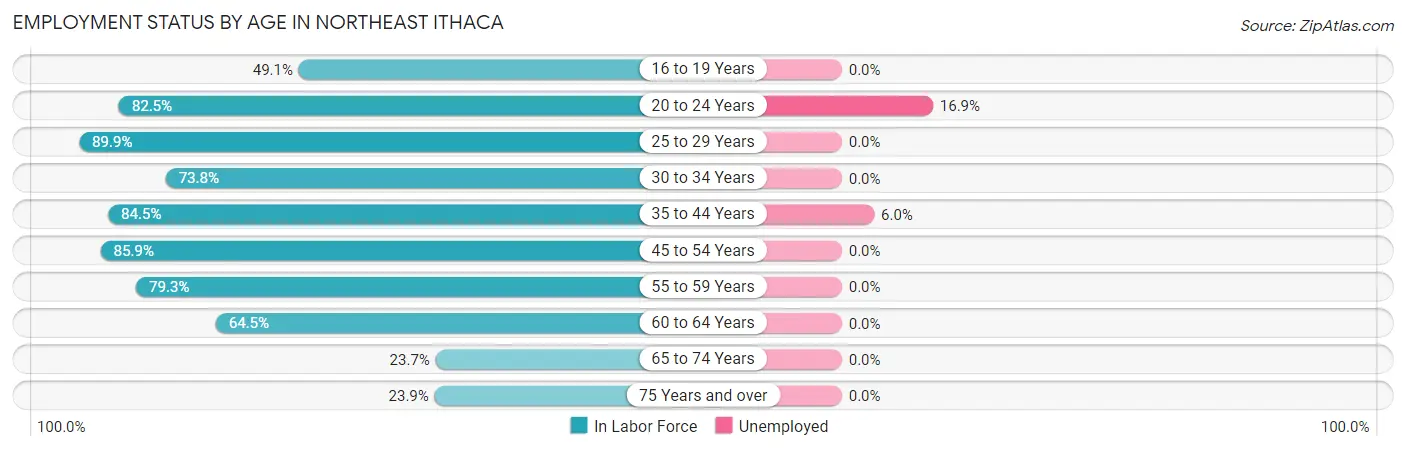
| Age Bracket | In Labor Force | Unemployed |
| 16 to 19 Years | 54 (49.1%) | 0 (0.0%) |
| 20 to 24 Years | 118 (82.5%) | 20 (16.9%) |
| 25 to 29 Years | 196 (89.9%) | 0 (0.0%) |
| 30 to 34 Years | 93 (73.8%) | 0 (0.0%) |
| 35 to 44 Years | 382 (84.5%) | 23 (6.0%) |
| 45 to 54 Years | 341 (85.9%) | 0 (0.0%) |
| 55 to 59 Years | 111 (79.3%) | 0 (0.0%) |
| 60 to 64 Years | 40 (64.5%) | 0 (0.0%) |
| 65 to 74 Years | 60 (23.7%) | 0 (0.0%) |
| 75 Years and over | 58 (23.9%) | 0 (0.0%) |
| Total | 1,454 (67.8%) | 44 (3.0%) |
Employment Status by Educational Attainment in Northeast Ithaca
According to labor force statistics for Northeast Ithaca, 83.4% of individuals (1,163) out of the total population between 25 and 64 years of age (1,395) are in the labor force, with 2.0% or 23 of them being unemployed. The group with the highest labor force participation rate are those with the educational attainment of bachelor's degree or higher, with 85.7% or 1,042 individuals in the labor force. Within the labor force, individuals with college / associate degree education have the highest percentage of unemployment, with 9.3% or 5 of them being unemployed.
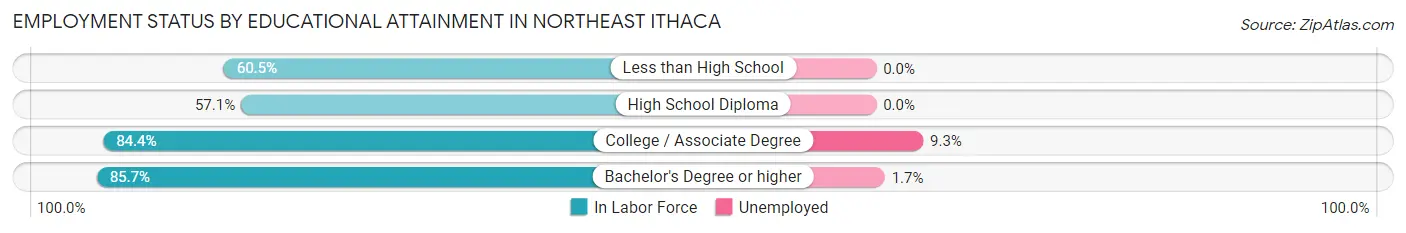
| Educational Attainment | In Labor Force | Unemployed |
| Less than High School | 23 (60.5%) | 0 (0.0%) |
| High School Diploma | 44 (57.1%) | 0 (0.0%) |
| College / Associate Degree | 54 (84.4%) | 6 (9.3%) |
| Bachelor's Degree or higher | 1,042 (85.7%) | 21 (1.7%) |
| Total | 1,163 (83.4%) | 28 (2.0%) |
Employment Occupations by Sex in Northeast Ithaca
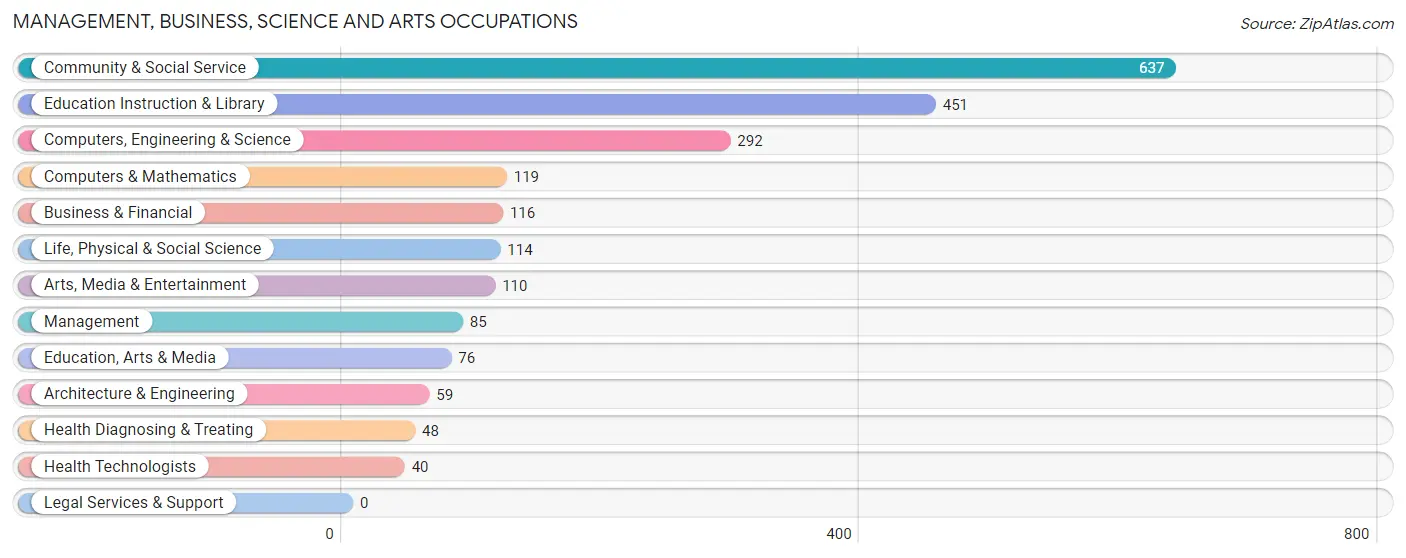
Management, Business, Science and Arts Occupations
The most common Management, Business, Science and Arts occupations in Northeast Ithaca are Community & Social Service (637 | 45.2%), Education Instruction & Library (451 | 32.0%), Computers, Engineering & Science (292 | 20.7%), Computers & Mathematics (119 | 8.4%), and Business & Financial (116 | 8.2%).
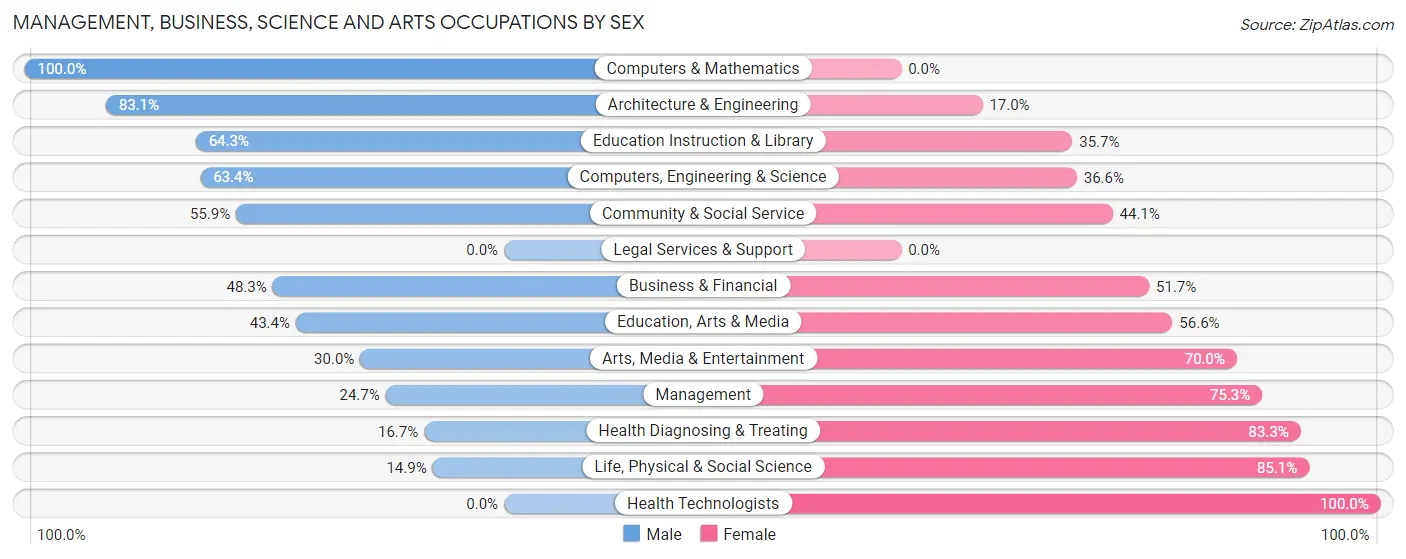
Management, Business, Science and Arts Occupations by Sex
Within the Management, Business, Science and Arts occupations in Northeast Ithaca, the most male-oriented occupations are Computers & Mathematics (100.0%), Architecture & Engineering (83.1%), and Education Instruction & Library (64.3%), while the most female-oriented occupations are Health Technologists (100.0%), Life, Physical & Social Science (85.1%), and Health Diagnosing & Treating (83.3%).
| Occupation | Male | Female |
| Management | 21 (24.7%) | 64 (75.3%) |
| Business & Financial | 56 (48.3%) | 60 (51.7%) |
| Computers, Engineering & Science | 185 (63.4%) | 107 (36.6%) |
| Computers & Mathematics | 119 (100.0%) | 0 (0.0%) |
| Architecture & Engineering | 49 (83.1%) | 10 (17.0%) |
| Life, Physical & Social Science | 17 (14.9%) | 97 (85.1%) |
| Community & Social Service | 356 (55.9%) | 281 (44.1%) |
| Education, Arts & Media | 33 (43.4%) | 43 (56.6%) |
| Legal Services & Support | 0 (0.0%) | 0 (0.0%) |
| Education Instruction & Library | 290 (64.3%) | 161 (35.7%) |
| Arts, Media & Entertainment | 33 (30.0%) | 77 (70.0%) |
| Health Diagnosing & Treating | 8 (16.7%) | 40 (83.3%) |
| Health Technologists | 0 (0.0%) | 40 (100.0%) |
| Total (Category) | 626 (53.1%) | 552 (46.9%) |
| Total (Overall) | 698 (49.5%) | 712 (50.5%) |
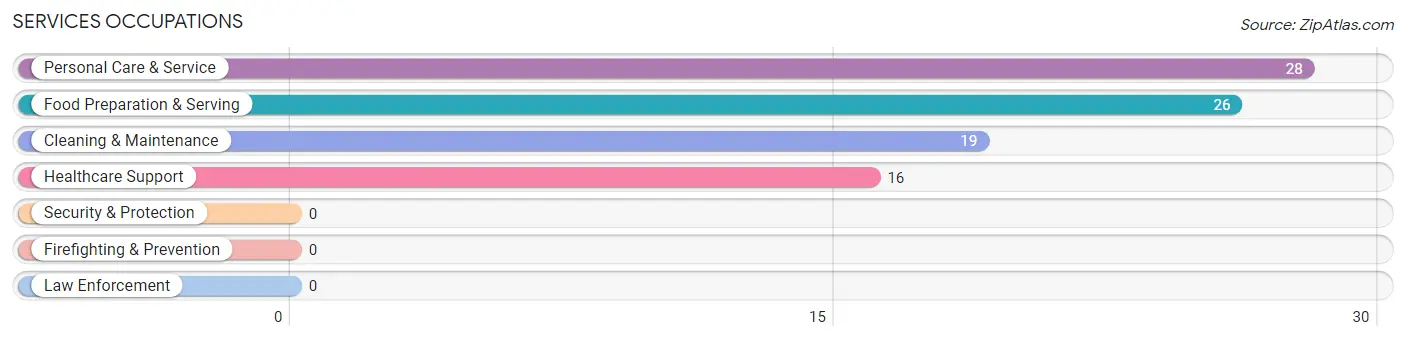
Services Occupations
The most common Services occupations in Northeast Ithaca are Personal Care & Service (28 | 2.0%), Food Preparation & Serving (26 | 1.8%), Cleaning & Maintenance (19 | 1.3%), and Healthcare Support (16 | 1.1%).
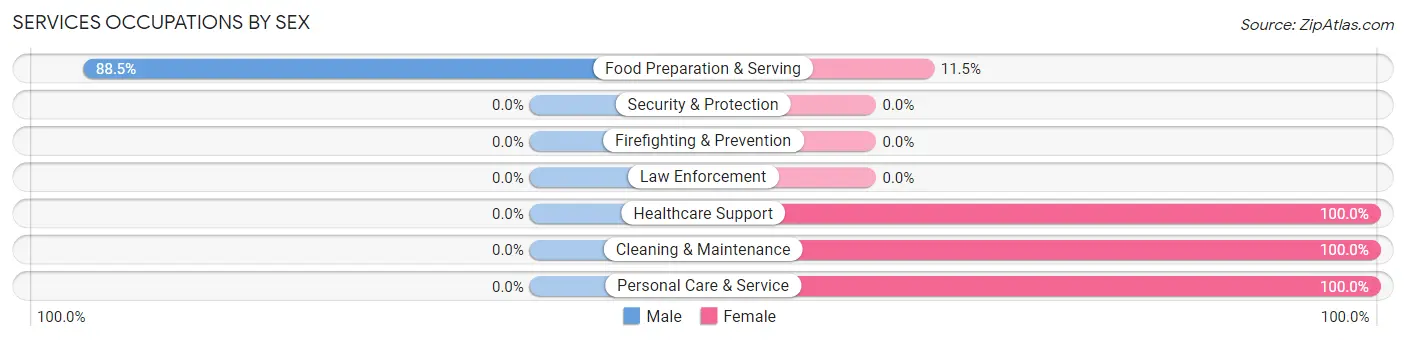
Services Occupations by Sex
| Occupation | Male | Female |
| Healthcare Support | 0 (0.0%) | 16 (100.0%) |
| Security & Protection | 0 (0.0%) | 0 (0.0%) |
| Firefighting & Prevention | 0 (0.0%) | 0 (0.0%) |
| Law Enforcement | 0 (0.0%) | 0 (0.0%) |
| Food Preparation & Serving | 23 (88.5%) | 3 (11.5%) |
| Cleaning & Maintenance | 0 (0.0%) | 19 (100.0%) |
| Personal Care & Service | 0 (0.0%) | 28 (100.0%) |
| Total (Category) | 23 (25.8%) | 66 (74.2%) |
| Total (Overall) | 698 (49.5%) | 712 (50.5%) |
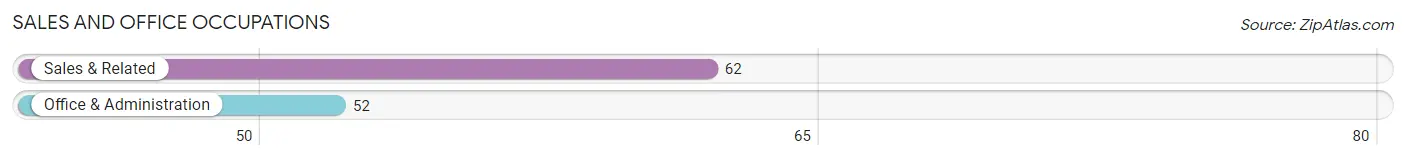
Sales and Office Occupations
The most common Sales and Office occupations in Northeast Ithaca are Sales & Related (62 | 4.4%), and Office & Administration (52 | 3.7%).
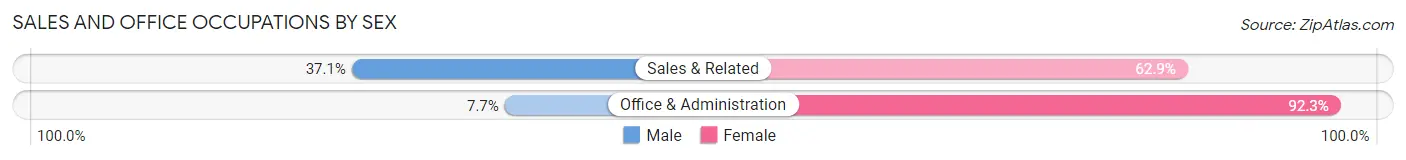
Sales and Office Occupations by Sex
| Occupation | Male | Female |
| Sales & Related | 23 (37.1%) | 39 (62.9%) |
| Office & Administration | 4 (7.7%) | 48 (92.3%) |
| Total (Category) | 27 (23.7%) | 87 (76.3%) |
| Total (Overall) | 698 (49.5%) | 712 (50.5%) |
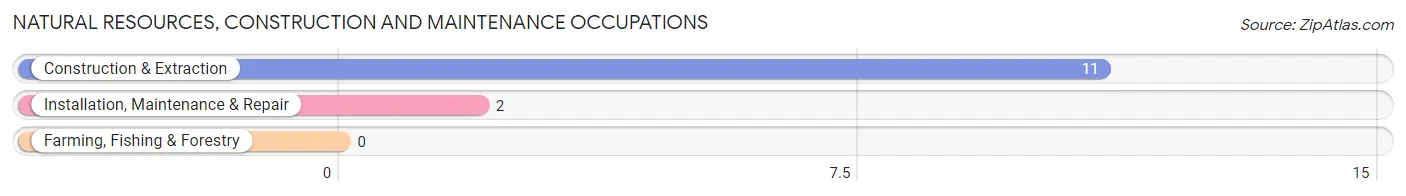
Natural Resources, Construction and Maintenance Occupations
The most common Natural Resources, Construction and Maintenance occupations in Northeast Ithaca are Construction & Extraction (11 | 0.8%), and Installation, Maintenance & Repair (2 | 0.1%).
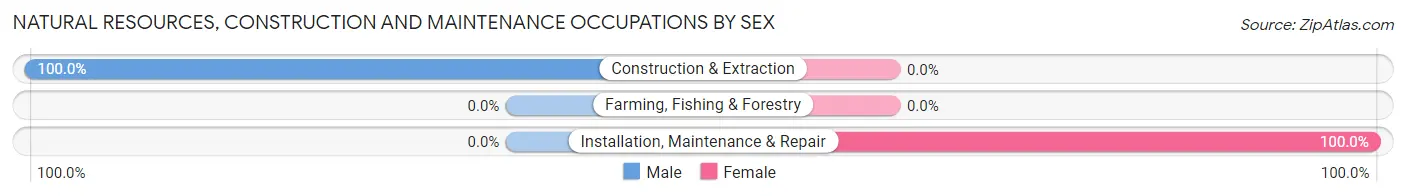
Natural Resources, Construction and Maintenance Occupations by Sex
| Occupation | Male | Female |
| Farming, Fishing & Forestry | 0 (0.0%) | 0 (0.0%) |
| Construction & Extraction | 11 (100.0%) | 0 (0.0%) |
| Installation, Maintenance & Repair | 0 (0.0%) | 2 (100.0%) |
| Total (Category) | 11 (84.6%) | 2 (15.4%) |
| Total (Overall) | 698 (49.5%) | 712 (50.5%) |
Production, Transportation and Moving Occupations
The most common Production, Transportation and Moving occupations in Northeast Ithaca are Material Moving (9 | 0.6%), and Transportation (7 | 0.5%).
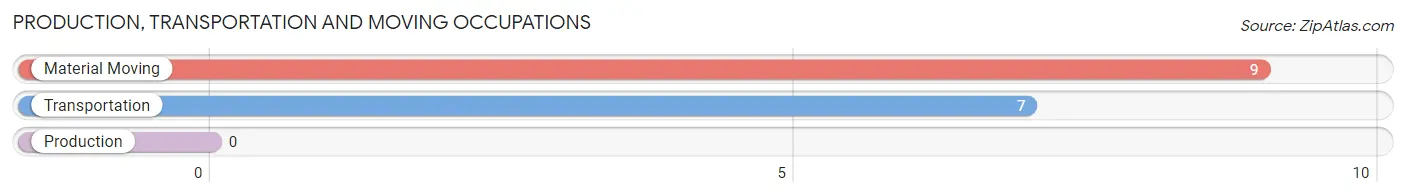
Production, Transportation and Moving Occupations by Sex
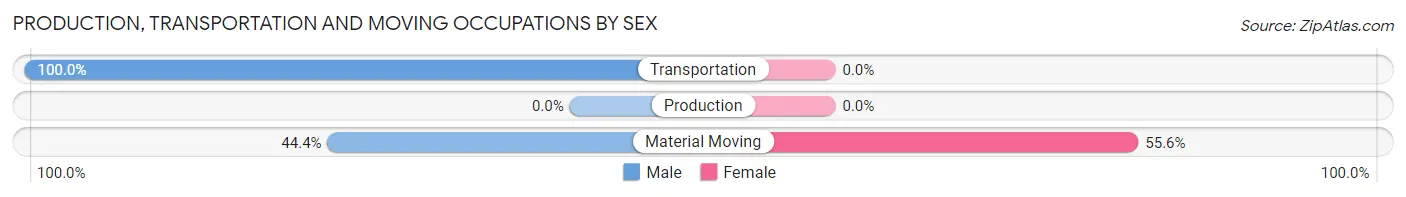
| Occupation | Male | Female |
| Production | 0 (0.0%) | 0 (0.0%) |
| Transportation | 7 (100.0%) | 0 (0.0%) |
| Material Moving | 4 (44.4%) | 5 (55.6%) |
| Total (Category) | 11 (68.8%) | 5 (31.2%) |
| Total (Overall) | 698 (49.5%) | 712 (50.5%) |
Employment Industries by Sex in Northeast Ithaca
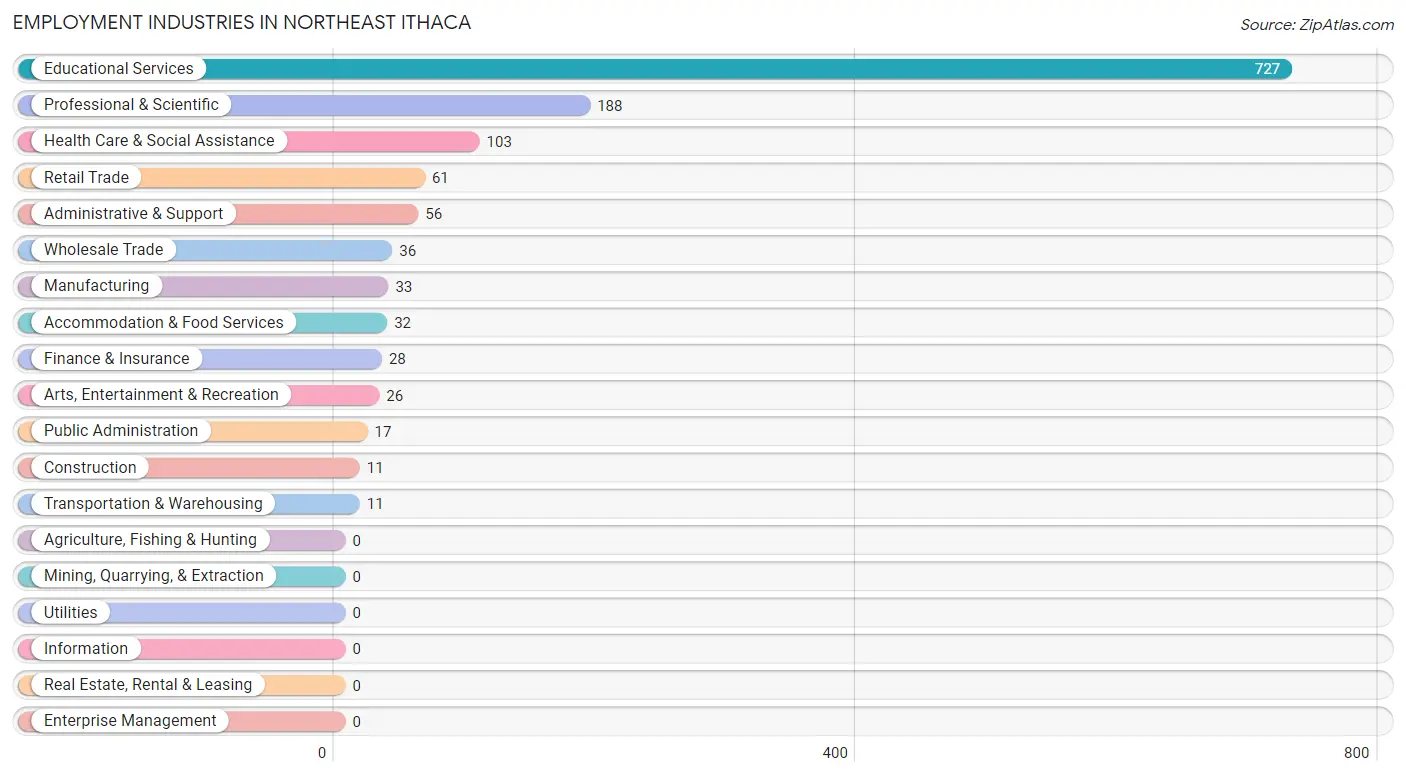
Employment Industries in Northeast Ithaca
The major employment industries in Northeast Ithaca include Educational Services (727 | 51.6%), Professional & Scientific (188 | 13.3%), Health Care & Social Assistance (103 | 7.3%), Retail Trade (61 | 4.3%), and Administrative & Support (56 | 4.0%).
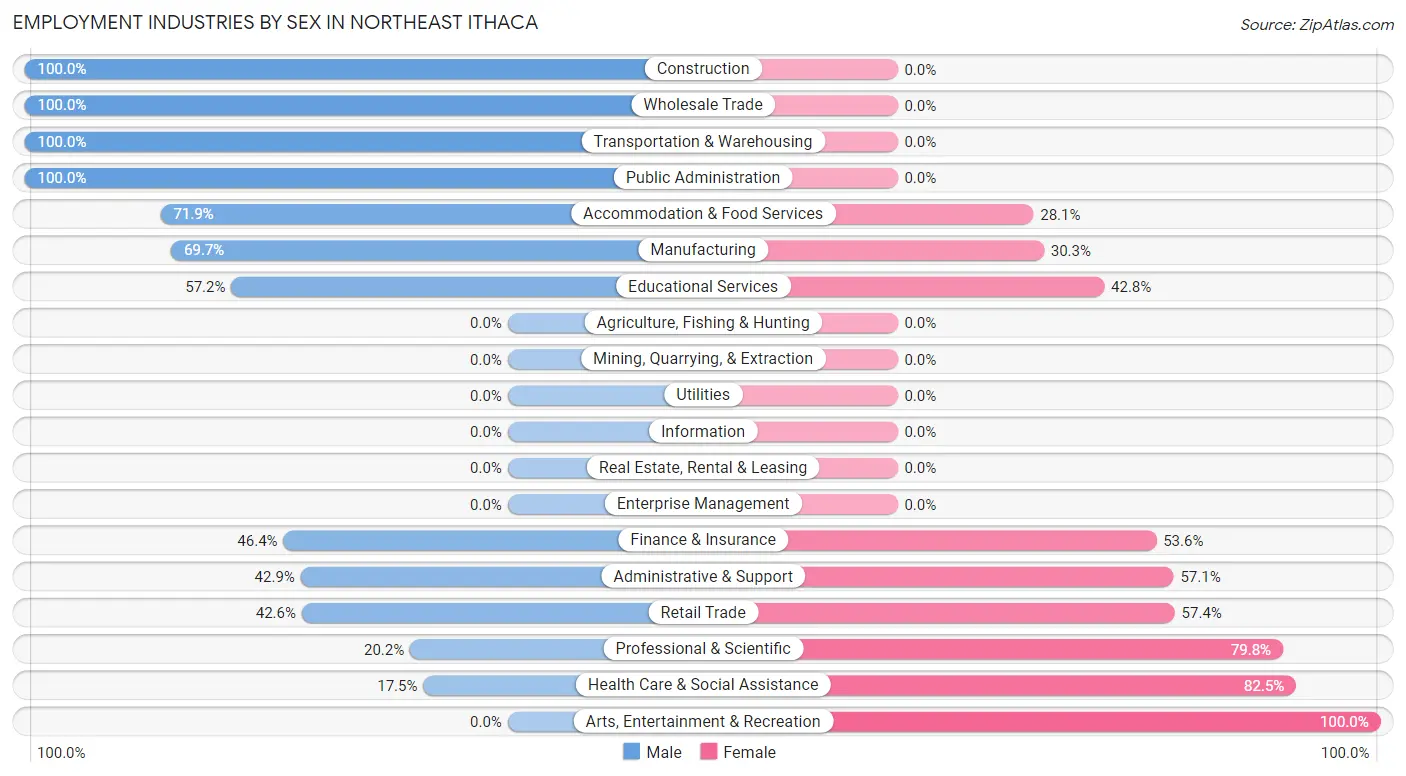
Employment Industries by Sex in Northeast Ithaca
The Northeast Ithaca industries that see more men than women are Construction (100.0%), Wholesale Trade (100.0%), and Transportation & Warehousing (100.0%), whereas the industries that tend to have a higher number of women are Arts, Entertainment & Recreation (100.0%), Health Care & Social Assistance (82.5%), and Professional & Scientific (79.8%).
| Industry | Male | Female |
| Agriculture, Fishing & Hunting | 0 (0.0%) | 0 (0.0%) |
| Mining, Quarrying, & Extraction | 0 (0.0%) | 0 (0.0%) |
| Construction | 11 (100.0%) | 0 (0.0%) |
| Manufacturing | 23 (69.7%) | 10 (30.3%) |
| Wholesale Trade | 36 (100.0%) | 0 (0.0%) |
| Retail Trade | 26 (42.6%) | 35 (57.4%) |
| Transportation & Warehousing | 11 (100.0%) | 0 (0.0%) |
| Utilities | 0 (0.0%) | 0 (0.0%) |
| Information | 0 (0.0%) | 0 (0.0%) |
| Finance & Insurance | 13 (46.4%) | 15 (53.6%) |
| Real Estate, Rental & Leasing | 0 (0.0%) | 0 (0.0%) |
| Professional & Scientific | 38 (20.2%) | 150 (79.8%) |
| Enterprise Management | 0 (0.0%) | 0 (0.0%) |
| Administrative & Support | 24 (42.9%) | 32 (57.1%) |
| Educational Services | 416 (57.2%) | 311 (42.8%) |
| Health Care & Social Assistance | 18 (17.5%) | 85 (82.5%) |
| Arts, Entertainment & Recreation | 0 (0.0%) | 26 (100.0%) |
| Accommodation & Food Services | 23 (71.9%) | 9 (28.1%) |
| Public Administration | 17 (100.0%) | 0 (0.0%) |
| Total | 698 (49.5%) | 712 (50.5%) |
Education in Northeast Ithaca
School Enrollment in Northeast Ithaca
The most common levels of schooling among the 767 students in Northeast Ithaca are middle school (173 | 22.6%), high school (170 | 22.2%), and graduate / professional (167 | 21.8%).
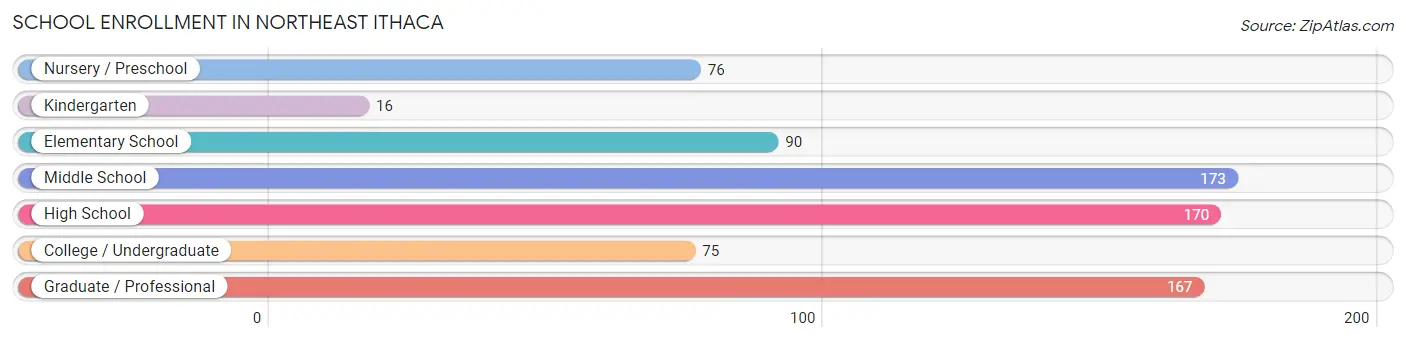
| School Level | # Students | % Students |
| Nursery / Preschool | 76 | 9.9% |
| Kindergarten | 16 | 2.1% |
| Elementary School | 90 | 11.7% |
| Middle School | 173 | 22.6% |
| High School | 170 | 22.2% |
| College / Undergraduate | 75 | 9.8% |
| Graduate / Professional | 167 | 21.8% |
| Total | 767 | 100.0% |
School Enrollment by Age by Funding Source in Northeast Ithaca
Out of a total of 767 students who are enrolled in schools in Northeast Ithaca, 273 (35.6%) attend a private institution, while the remaining 494 (64.4%) are enrolled in public schools. The age group of 20 to 24 year olds has the highest likelihood of being enrolled in private schools, with 93 (100.0% in the age bracket) enrolled. Conversely, the age group of 18 to 19 year olds has the lowest likelihood of being enrolled in a private school, with 15 (100.0% in the age bracket) attending a public institution.
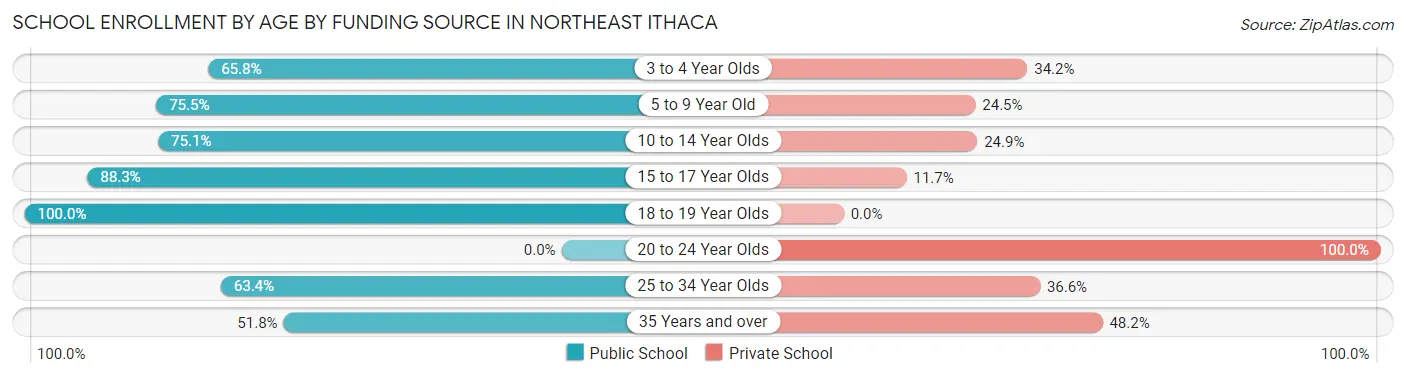
| Age Bracket | Public School | Private School |
| 3 to 4 Year Olds | 50 (65.8%) | 26 (34.2%) |
| 5 to 9 Year Old | 80 (75.5%) | 26 (24.5%) |
| 10 to 14 Year Olds | 163 (75.1%) | 54 (24.9%) |
| 15 to 17 Year Olds | 98 (88.3%) | 13 (11.7%) |
| 18 to 19 Year Olds | 15 (100.0%) | 0 (0.0%) |
| 20 to 24 Year Olds | 0 (0.0%) | 93 (100.0%) |
| 25 to 34 Year Olds | 59 (63.4%) | 34 (36.6%) |
| 35 Years and over | 29 (51.8%) | 27 (48.2%) |
| Total | 494 (64.4%) | 273 (35.6%) |
Educational Attainment by Field of Study in Northeast Ithaca
Education (235 | 13.2%), business (177 | 10.0%), visual & performing arts (176 | 9.9%), bio, nature & agricultural (171 | 9.6%), and social sciences (166 | 9.3%) are the most common fields of study among 1,775 individuals in Northeast Ithaca who have obtained a bachelor's degree or higher.
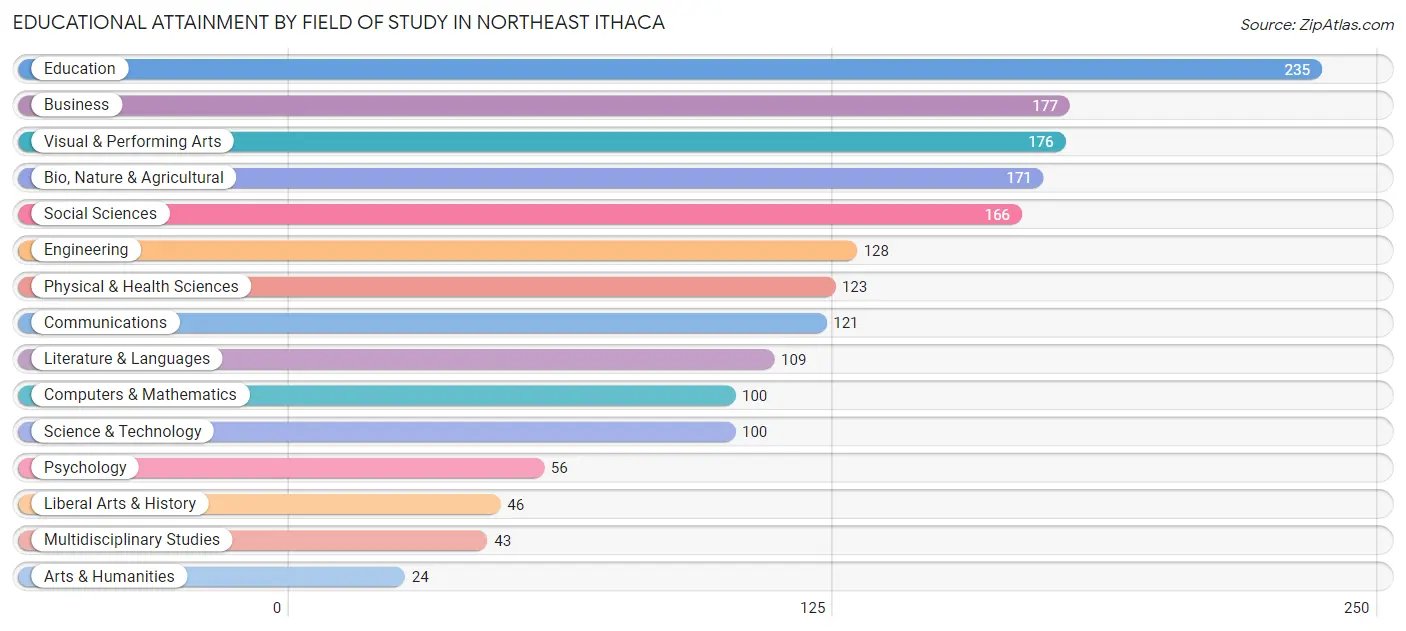
| Field of Study | # Graduates | % Graduates |
| Computers & Mathematics | 100 | 5.6% |
| Bio, Nature & Agricultural | 171 | 9.6% |
| Physical & Health Sciences | 123 | 6.9% |
| Psychology | 56 | 3.2% |
| Social Sciences | 166 | 9.3% |
| Engineering | 128 | 7.2% |
| Multidisciplinary Studies | 43 | 2.4% |
| Science & Technology | 100 | 5.6% |
| Business | 177 | 10.0% |
| Education | 235 | 13.2% |
| Literature & Languages | 109 | 6.1% |
| Liberal Arts & History | 46 | 2.6% |
| Visual & Performing Arts | 176 | 9.9% |
| Communications | 121 | 6.8% |
| Arts & Humanities | 24 | 1.3% |
| Total | 1,775 | 100.0% |
Transportation & Commute in Northeast Ithaca
Vehicle Availability by Sex in Northeast Ithaca
The most prevalent vehicle ownership categories in Northeast Ithaca are males with 2 vehicles (268, accounting for 39.4%) and females with 2 vehicles (235, making up 38.1%).
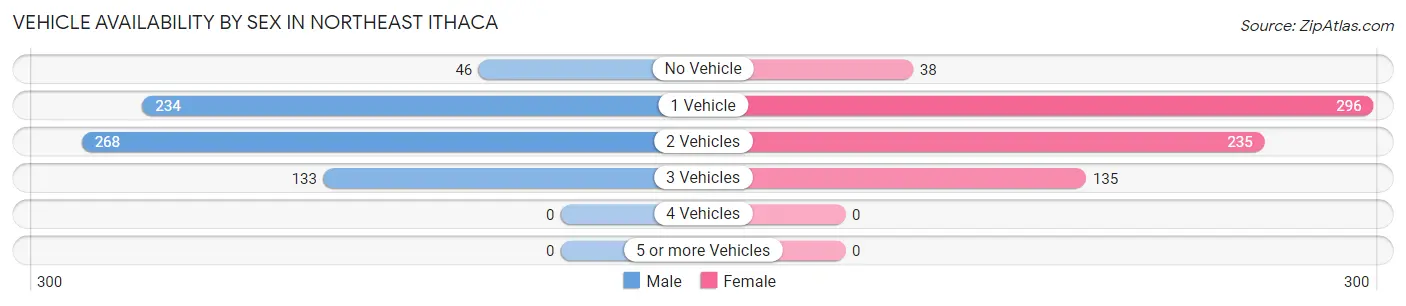
| Vehicles Available | Male | Female |
| No Vehicle | 46 (6.8%) | 38 (5.4%) |
| 1 Vehicle | 234 (34.4%) | 296 (42.0%) |
| 2 Vehicles | 268 (39.4%) | 235 (33.4%) |
| 3 Vehicles | 133 (19.5%) | 135 (19.2%) |
| 4 Vehicles | 0 (0.0%) | 0 (0.0%) |
| 5 or more Vehicles | 0 (0.0%) | 0 (0.0%) |
| Total | 681 (100.0%) | 704 (100.0%) |
Commute Time in Northeast Ithaca
The most frequently occuring commute durations in Northeast Ithaca are 15 to 19 minutes (273 commuters, 30.8%), 10 to 14 minutes (152 commuters, 17.2%), and 5 to 9 minutes (128 commuters, 14.4%).
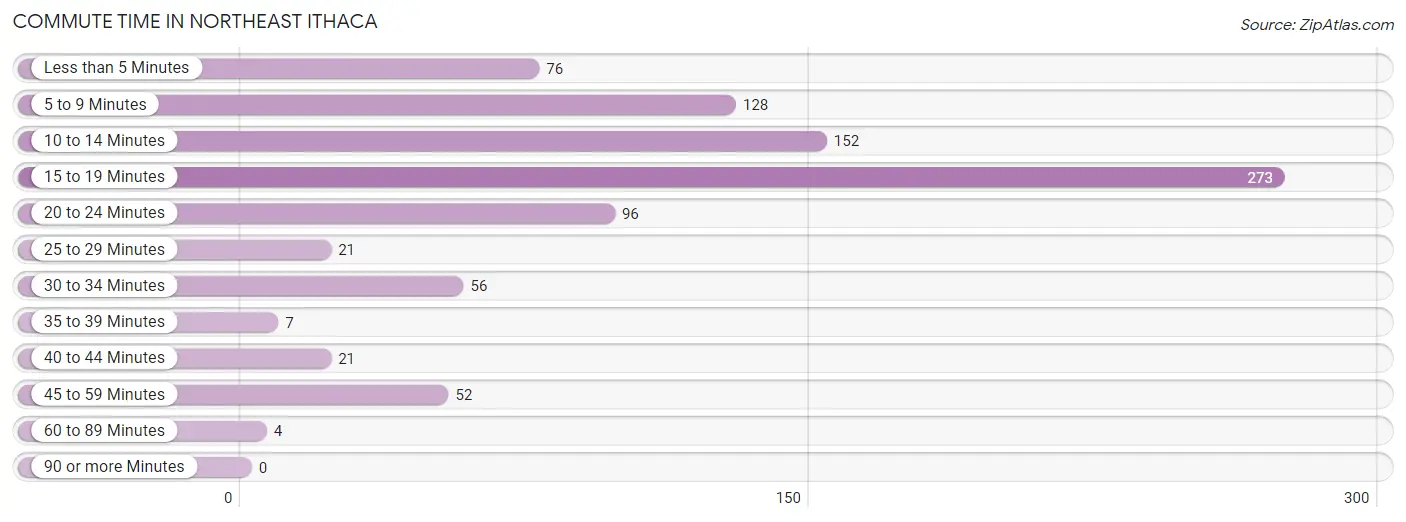
| Commute Time | # Commuters | % Commuters |
| Less than 5 Minutes | 76 | 8.6% |
| 5 to 9 Minutes | 128 | 14.4% |
| 10 to 14 Minutes | 152 | 17.2% |
| 15 to 19 Minutes | 273 | 30.8% |
| 20 to 24 Minutes | 96 | 10.8% |
| 25 to 29 Minutes | 21 | 2.4% |
| 30 to 34 Minutes | 56 | 6.3% |
| 35 to 39 Minutes | 7 | 0.8% |
| 40 to 44 Minutes | 21 | 2.4% |
| 45 to 59 Minutes | 52 | 5.9% |
| 60 to 89 Minutes | 4 | 0.4% |
| 90 or more Minutes | 0 | 0.0% |
Commute Time by Sex in Northeast Ithaca
The most common commute times in Northeast Ithaca are 15 to 19 minutes (151 commuters, 38.4%) for males and 15 to 19 minutes (122 commuters, 24.7%) for females.
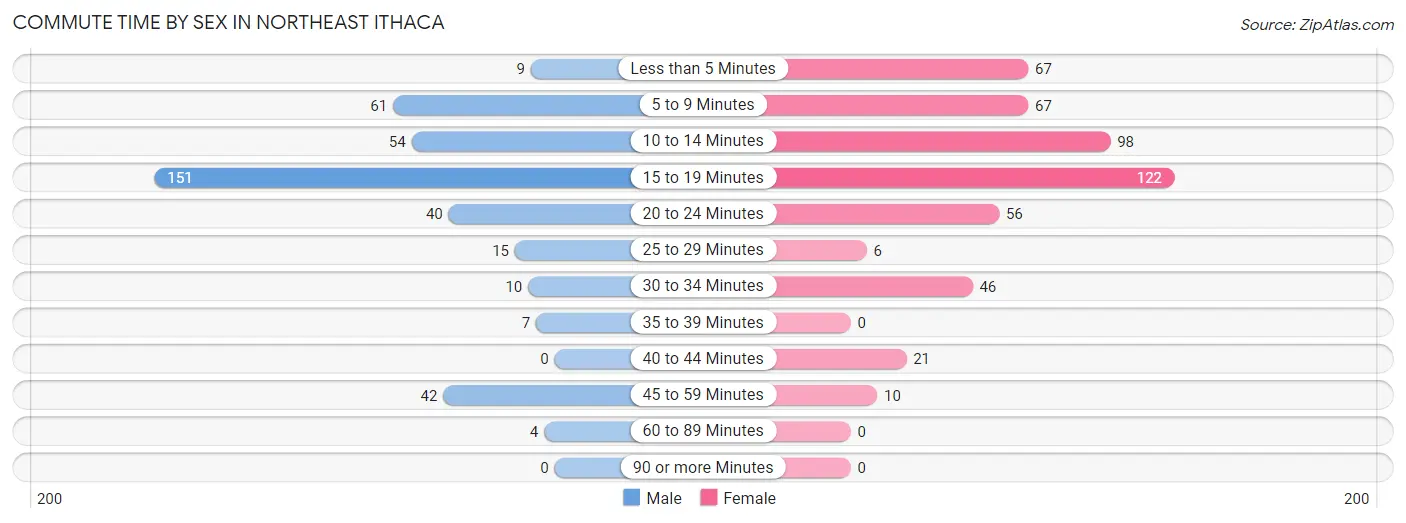
| Commute Time | Male | Female |
| Less than 5 Minutes | 9 (2.3%) | 67 (13.6%) |
| 5 to 9 Minutes | 61 (15.5%) | 67 (13.6%) |
| 10 to 14 Minutes | 54 (13.7%) | 98 (19.9%) |
| 15 to 19 Minutes | 151 (38.4%) | 122 (24.7%) |
| 20 to 24 Minutes | 40 (10.2%) | 56 (11.4%) |
| 25 to 29 Minutes | 15 (3.8%) | 6 (1.2%) |
| 30 to 34 Minutes | 10 (2.5%) | 46 (9.3%) |
| 35 to 39 Minutes | 7 (1.8%) | 0 (0.0%) |
| 40 to 44 Minutes | 0 (0.0%) | 21 (4.3%) |
| 45 to 59 Minutes | 42 (10.7%) | 10 (2.0%) |
| 60 to 89 Minutes | 4 (1.0%) | 0 (0.0%) |
| 90 or more Minutes | 0 (0.0%) | 0 (0.0%) |
Time of Departure to Work by Sex in Northeast Ithaca
The most frequent times of departure to work in Northeast Ithaca are 7:30 AM to 7:59 AM (120, 30.5%) for males and 7:30 AM to 7:59 AM (115, 23.3%) for females.
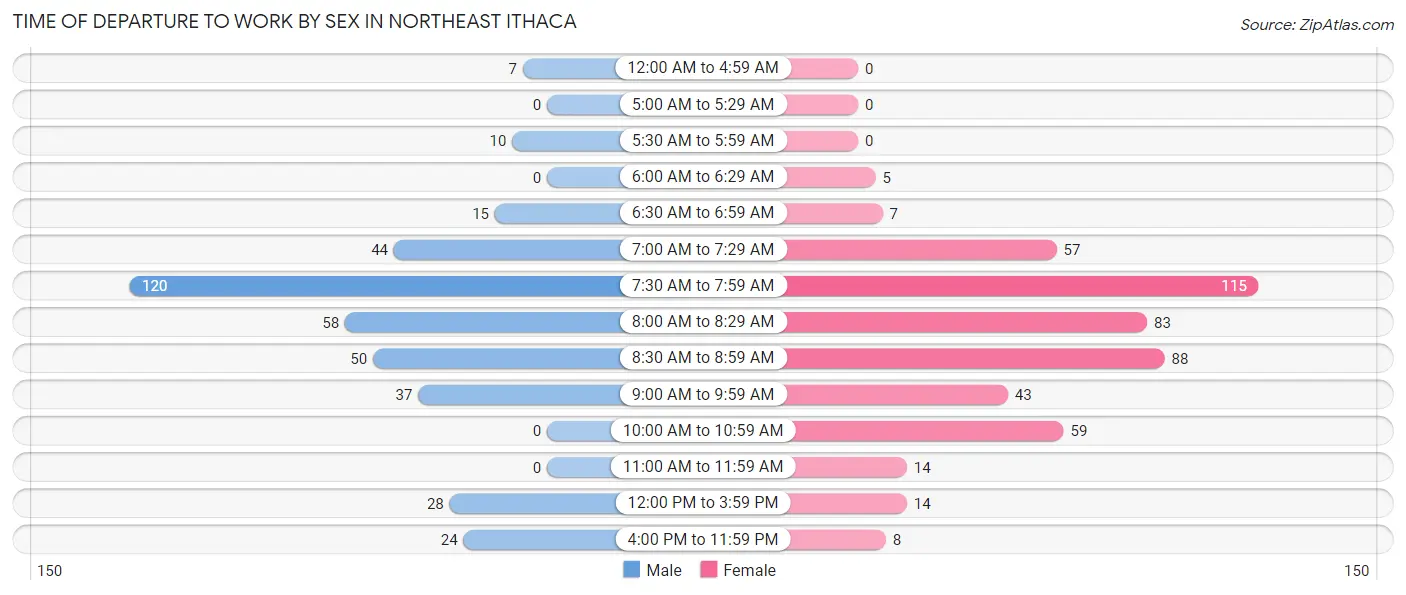
| Time of Departure | Male | Female |
| 12:00 AM to 4:59 AM | 7 (1.8%) | 0 (0.0%) |
| 5:00 AM to 5:29 AM | 0 (0.0%) | 0 (0.0%) |
| 5:30 AM to 5:59 AM | 10 (2.5%) | 0 (0.0%) |
| 6:00 AM to 6:29 AM | 0 (0.0%) | 5 (1.0%) |
| 6:30 AM to 6:59 AM | 15 (3.8%) | 7 (1.4%) |
| 7:00 AM to 7:29 AM | 44 (11.2%) | 57 (11.6%) |
| 7:30 AM to 7:59 AM | 120 (30.5%) | 115 (23.3%) |
| 8:00 AM to 8:29 AM | 58 (14.8%) | 83 (16.8%) |
| 8:30 AM to 8:59 AM | 50 (12.7%) | 88 (17.8%) |
| 9:00 AM to 9:59 AM | 37 (9.4%) | 43 (8.7%) |
| 10:00 AM to 10:59 AM | 0 (0.0%) | 59 (12.0%) |
| 11:00 AM to 11:59 AM | 0 (0.0%) | 14 (2.8%) |
| 12:00 PM to 3:59 PM | 28 (7.1%) | 14 (2.8%) |
| 4:00 PM to 11:59 PM | 24 (6.1%) | 8 (1.6%) |
| Total | 393 (100.0%) | 493 (100.0%) |
Housing Occupancy in Northeast Ithaca
Occupancy by Ownership in Northeast Ithaca
Of the total 1,169 dwellings in Northeast Ithaca, owner-occupied units account for 709 (60.7%), while renter-occupied units make up 460 (39.4%).
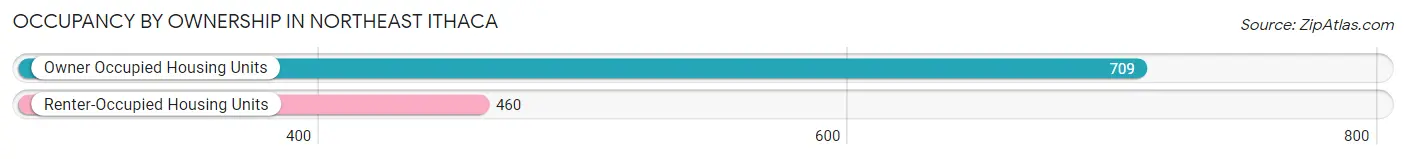
| Occupancy | # Housing Units | % Housing Units |
| Owner Occupied Housing Units | 709 | 60.7% |
| Renter-Occupied Housing Units | 460 | 39.4% |
| Total Occupied Housing Units | 1,169 | 100.0% |
Occupancy by Household Size in Northeast Ithaca
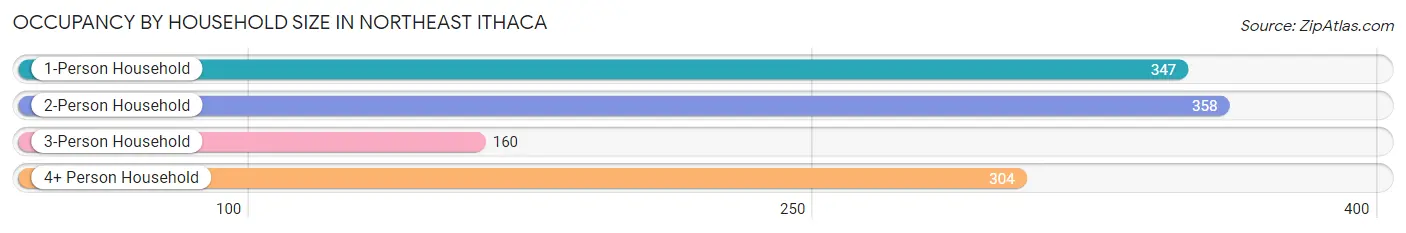
| Household Size | # Housing Units | % Housing Units |
| 1-Person Household | 347 | 29.7% |
| 2-Person Household | 358 | 30.6% |
| 3-Person Household | 160 | 13.7% |
| 4+ Person Household | 304 | 26.0% |
| Total Housing Units | 1,169 | 100.0% |
Occupancy by Ownership by Household Size in Northeast Ithaca
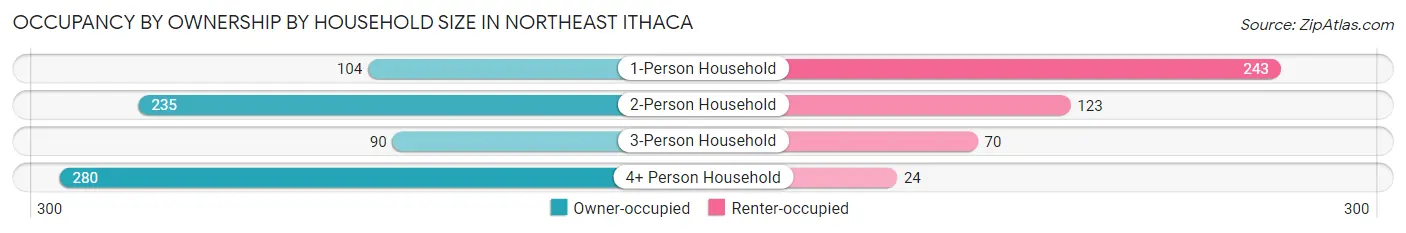
| Household Size | Owner-occupied | Renter-occupied |
| 1-Person Household | 104 (30.0%) | 243 (70.0%) |
| 2-Person Household | 235 (65.6%) | 123 (34.4%) |
| 3-Person Household | 90 (56.2%) | 70 (43.8%) |
| 4+ Person Household | 280 (92.1%) | 24 (7.9%) |
| Total Housing Units | 709 (60.7%) | 460 (39.4%) |
Occupancy by Educational Attainment in Northeast Ithaca
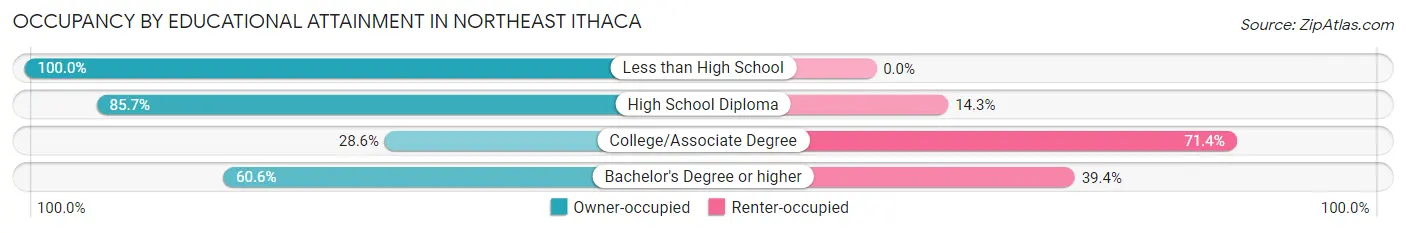
| Household Size | Owner-occupied | Renter-occupied |
| Less than High School | 8 (100.0%) | 0 (0.0%) |
| High School Diploma | 36 (85.7%) | 6 (14.3%) |
| College/Associate Degree | 12 (28.6%) | 30 (71.4%) |
| Bachelor's Degree or higher | 653 (60.6%) | 424 (39.4%) |
Occupancy by Age of Householder in Northeast Ithaca
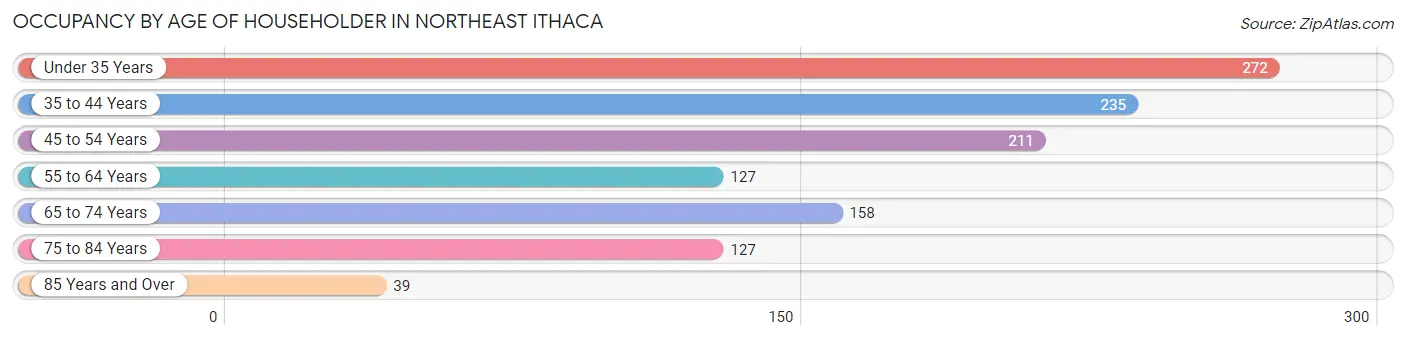
| Age Bracket | # Households | % Households |
| Under 35 Years | 272 | 23.3% |
| 35 to 44 Years | 235 | 20.1% |
| 45 to 54 Years | 211 | 18.0% |
| 55 to 64 Years | 127 | 10.9% |
| 65 to 74 Years | 158 | 13.5% |
| 75 to 84 Years | 127 | 10.9% |
| 85 Years and Over | 39 | 3.3% |
| Total | 1,169 | 100.0% |
Housing Finances in Northeast Ithaca
Median Income by Occupancy in Northeast Ithaca
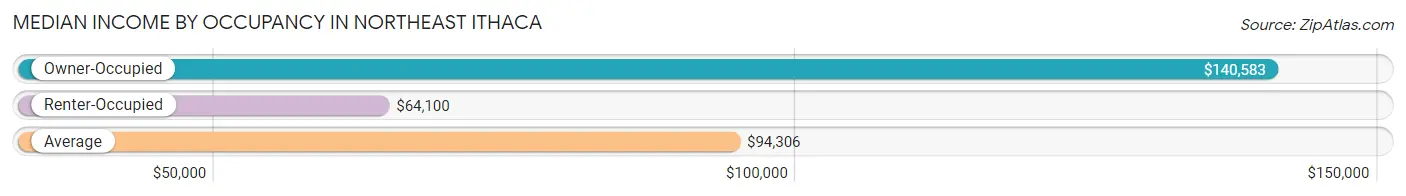
| Occupancy Type | # Households | Median Income |
| Owner-Occupied | 709 (60.7%) | $140,583 |
| Renter-Occupied | 460 (39.4%) | $64,100 |
| Average | 1,169 (100.0%) | $94,306 |
Occupancy by Householder Income Bracket in Northeast Ithaca
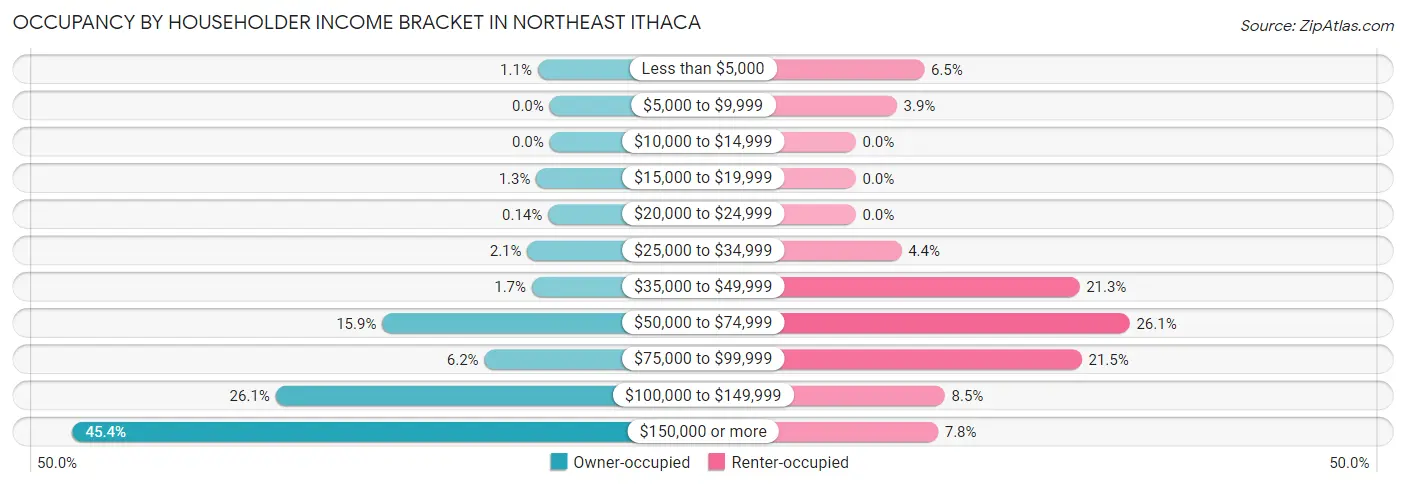
| Income Bracket | Owner-occupied | Renter-occupied |
| Less than $5,000 | 8 (1.1%) | 30 (6.5%) |
| $5,000 to $9,999 | 0 (0.0%) | 18 (3.9%) |
| $10,000 to $14,999 | 0 (0.0%) | 0 (0.0%) |
| $15,000 to $19,999 | 9 (1.3%) | 0 (0.0%) |
| $20,000 to $24,999 | 1 (0.1%) | 0 (0.0%) |
| $25,000 to $34,999 | 15 (2.1%) | 20 (4.3%) |
| $35,000 to $49,999 | 12 (1.7%) | 98 (21.3%) |
| $50,000 to $74,999 | 113 (15.9%) | 120 (26.1%) |
| $75,000 to $99,999 | 44 (6.2%) | 99 (21.5%) |
| $100,000 to $149,999 | 185 (26.1%) | 39 (8.5%) |
| $150,000 or more | 322 (45.4%) | 36 (7.8%) |
| Total | 709 (100.0%) | 460 (100.0%) |
Monthly Housing Cost Tiers in Northeast Ithaca
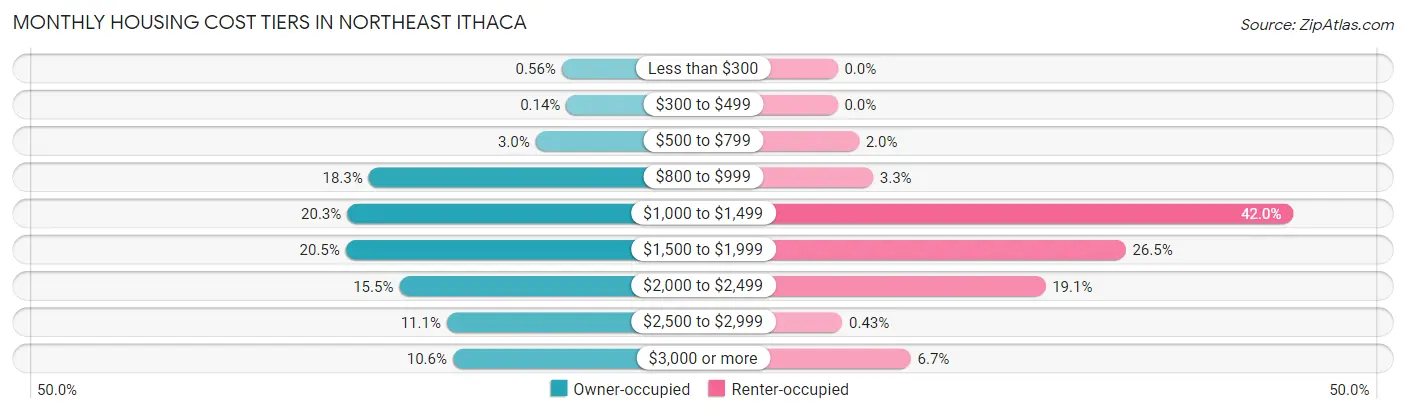
| Monthly Cost | Owner-occupied | Renter-occupied |
| Less than $300 | 4 (0.6%) | 0 (0.0%) |
| $300 to $499 | 1 (0.1%) | 0 (0.0%) |
| $500 to $799 | 21 (3.0%) | 9 (2.0%) |
| $800 to $999 | 130 (18.3%) | 15 (3.3%) |
| $1,000 to $1,499 | 144 (20.3%) | 193 (42.0%) |
| $1,500 to $1,999 | 145 (20.4%) | 122 (26.5%) |
| $2,000 to $2,499 | 110 (15.5%) | 88 (19.1%) |
| $2,500 to $2,999 | 79 (11.1%) | 2 (0.4%) |
| $3,000 or more | 75 (10.6%) | 31 (6.7%) |
| Total | 709 (100.0%) | 460 (100.0%) |
Physical Housing Characteristics in Northeast Ithaca
Housing Structures in Northeast Ithaca
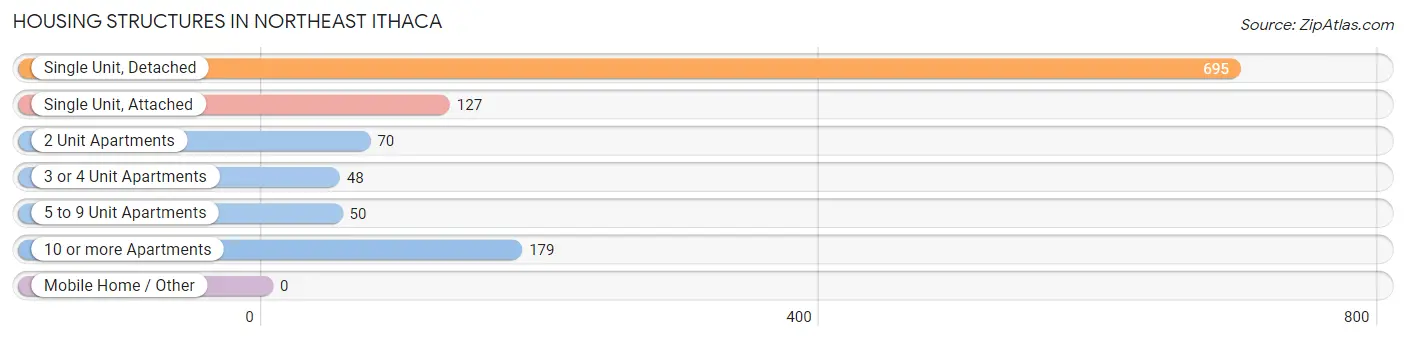
| Structure Type | # Housing Units | % Housing Units |
| Single Unit, Detached | 695 | 59.5% |
| Single Unit, Attached | 127 | 10.9% |
| 2 Unit Apartments | 70 | 6.0% |
| 3 or 4 Unit Apartments | 48 | 4.1% |
| 5 to 9 Unit Apartments | 50 | 4.3% |
| 10 or more Apartments | 179 | 15.3% |
| Mobile Home / Other | 0 | 0.0% |
| Total | 1,169 | 100.0% |
Housing Structures by Occupancy in Northeast Ithaca
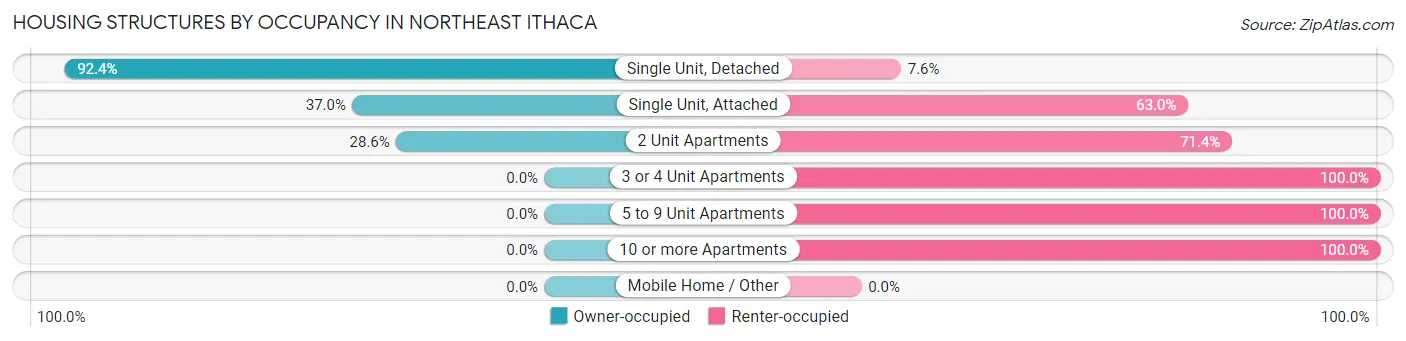
| Structure Type | Owner-occupied | Renter-occupied |
| Single Unit, Detached | 642 (92.4%) | 53 (7.6%) |
| Single Unit, Attached | 47 (37.0%) | 80 (63.0%) |
| 2 Unit Apartments | 20 (28.6%) | 50 (71.4%) |
| 3 or 4 Unit Apartments | 0 (0.0%) | 48 (100.0%) |
| 5 to 9 Unit Apartments | 0 (0.0%) | 50 (100.0%) |
| 10 or more Apartments | 0 (0.0%) | 179 (100.0%) |
| Mobile Home / Other | 0 (0.0%) | 0 (0.0%) |
| Total | 709 (60.7%) | 460 (39.4%) |
Housing Structures by Number of Rooms in Northeast Ithaca
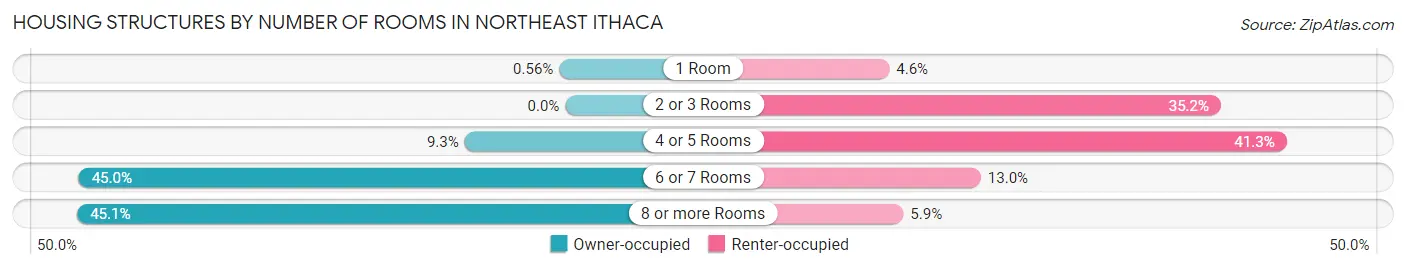
| Number of Rooms | Owner-occupied | Renter-occupied |
| 1 Room | 4 (0.6%) | 21 (4.6%) |
| 2 or 3 Rooms | 0 (0.0%) | 162 (35.2%) |
| 4 or 5 Rooms | 66 (9.3%) | 190 (41.3%) |
| 6 or 7 Rooms | 319 (45.0%) | 60 (13.0%) |
| 8 or more Rooms | 320 (45.1%) | 27 (5.9%) |
| Total | 709 (100.0%) | 460 (100.0%) |
Housing Structure by Heating Type in Northeast Ithaca
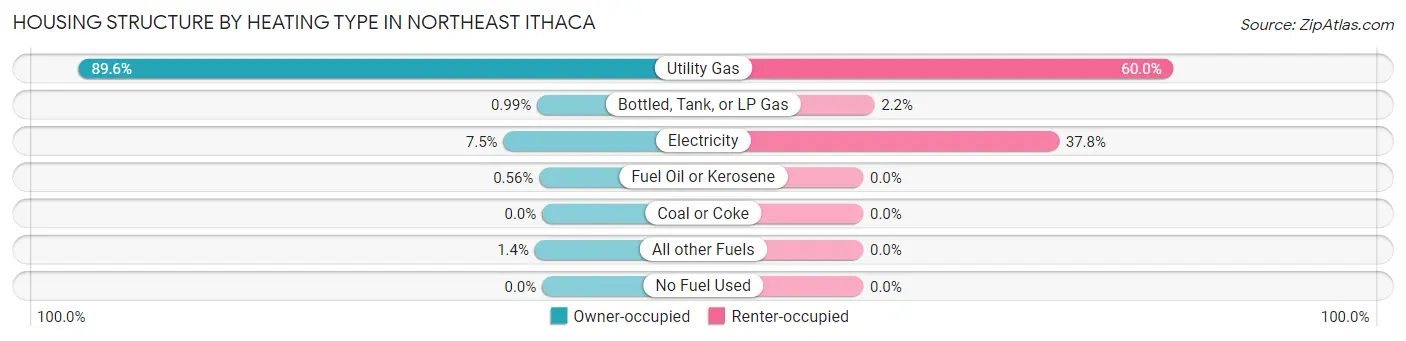
| Heating Type | Owner-occupied | Renter-occupied |
| Utility Gas | 635 (89.6%) | 276 (60.0%) |
| Bottled, Tank, or LP Gas | 7 (1.0%) | 10 (2.2%) |
| Electricity | 53 (7.5%) | 174 (37.8%) |
| Fuel Oil or Kerosene | 4 (0.6%) | 0 (0.0%) |
| Coal or Coke | 0 (0.0%) | 0 (0.0%) |
| All other Fuels | 10 (1.4%) | 0 (0.0%) |
| No Fuel Used | 0 (0.0%) | 0 (0.0%) |
| Total | 709 (100.0%) | 460 (100.0%) |
Household Vehicle Usage in Northeast Ithaca
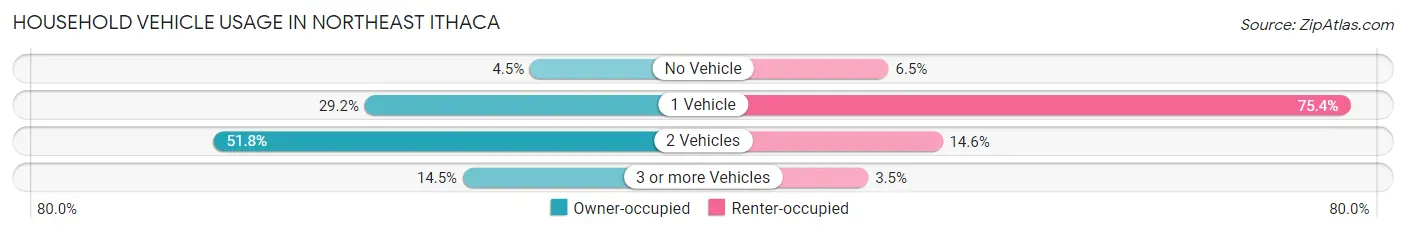
| Vehicles per Household | Owner-occupied | Renter-occupied |
| No Vehicle | 32 (4.5%) | 30 (6.5%) |
| 1 Vehicle | 207 (29.2%) | 347 (75.4%) |
| 2 Vehicles | 367 (51.8%) | 67 (14.6%) |
| 3 or more Vehicles | 103 (14.5%) | 16 (3.5%) |
| Total | 709 (100.0%) | 460 (100.0%) |
Real Estate & Mortgages in Northeast Ithaca
Real Estate and Mortgage Overview in Northeast Ithaca
| Characteristic | Without Mortgage | With Mortgage |
| Housing Units | 310 | 399 |
| Median Property Value | $349,200 | $309,200 |
| Median Household Income | $133,833 | $189 |
| Monthly Housing Costs | $1,007 | $75 |
| Real Estate Taxes | $8,149 | $0 |
Property Value by Mortgage Status in Northeast Ithaca
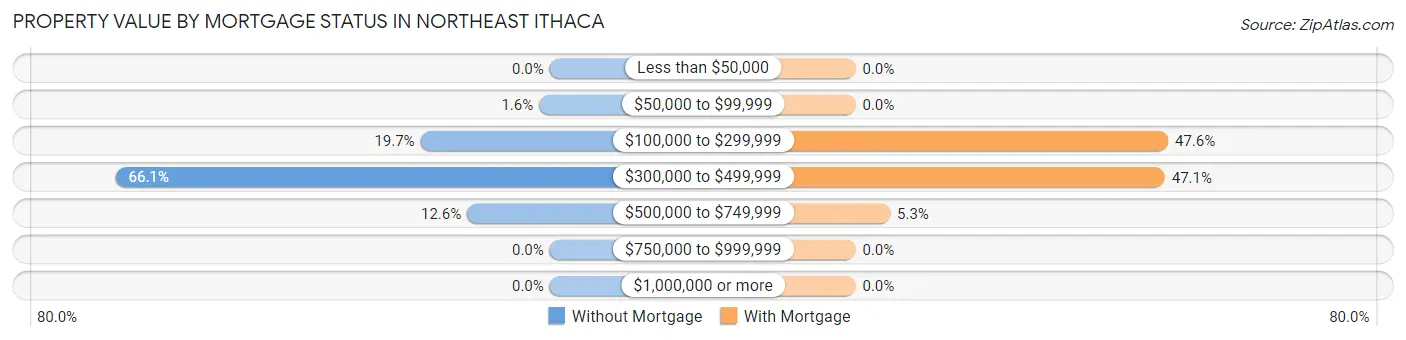
| Property Value | Without Mortgage | With Mortgage |
| Less than $50,000 | 0 (0.0%) | 0 (0.0%) |
| $50,000 to $99,999 | 5 (1.6%) | 0 (0.0%) |
| $100,000 to $299,999 | 61 (19.7%) | 190 (47.6%) |
| $300,000 to $499,999 | 205 (66.1%) | 188 (47.1%) |
| $500,000 to $749,999 | 39 (12.6%) | 21 (5.3%) |
| $750,000 to $999,999 | 0 (0.0%) | 0 (0.0%) |
| $1,000,000 or more | 0 (0.0%) | 0 (0.0%) |
| Total | 310 (100.0%) | 399 (100.0%) |
Household Income by Mortgage Status in Northeast Ithaca
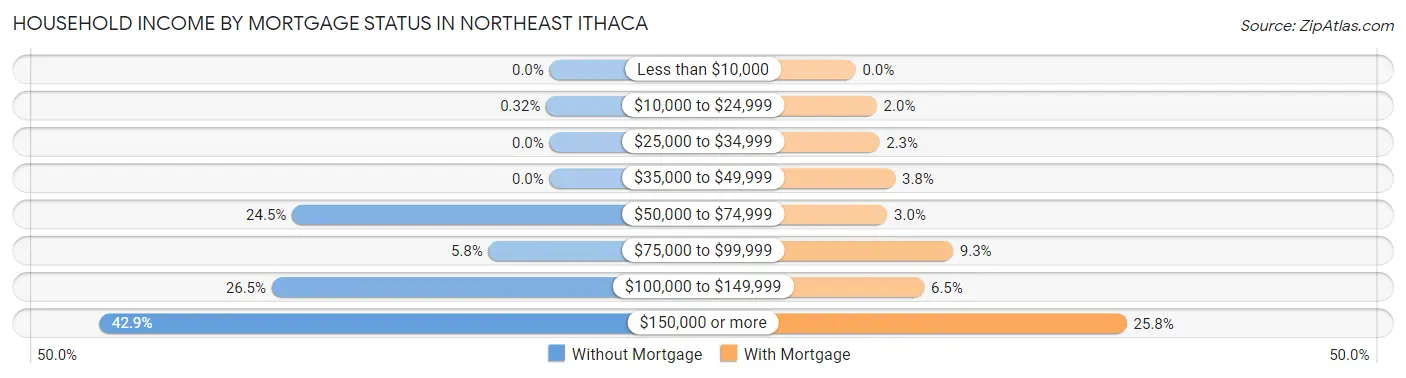
| Household Income | Without Mortgage | With Mortgage |
| Less than $10,000 | 0 (0.0%) | 0 (0.0%) |
| $10,000 to $24,999 | 1 (0.3%) | 8 (2.0%) |
| $25,000 to $34,999 | 0 (0.0%) | 9 (2.3%) |
| $35,000 to $49,999 | 0 (0.0%) | 15 (3.8%) |
| $50,000 to $74,999 | 76 (24.5%) | 12 (3.0%) |
| $75,000 to $99,999 | 18 (5.8%) | 37 (9.3%) |
| $100,000 to $149,999 | 82 (26.5%) | 26 (6.5%) |
| $150,000 or more | 133 (42.9%) | 103 (25.8%) |
| Total | 310 (100.0%) | 399 (100.0%) |
Property Value to Household Income Ratio in Northeast Ithaca
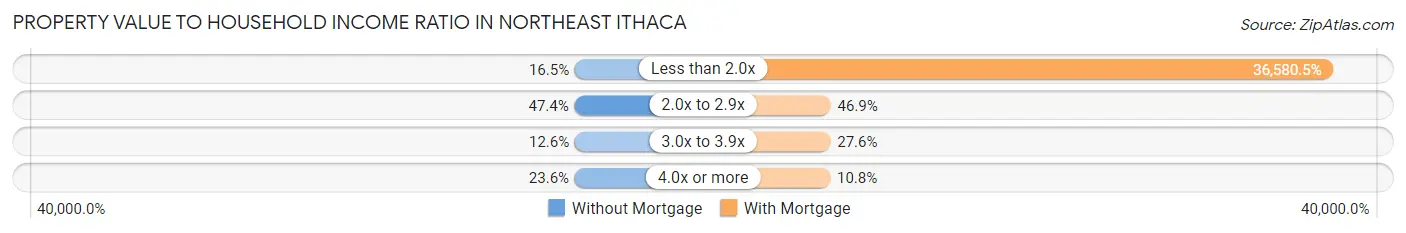
| Value-to-Income Ratio | Without Mortgage | With Mortgage |
| Less than 2.0x | 51 (16.5%) | 145,956 (36,580.5%) |
| 2.0x to 2.9x | 147 (47.4%) | 187 (46.9%) |
| 3.0x to 3.9x | 39 (12.6%) | 110 (27.6%) |
| 4.0x or more | 73 (23.5%) | 43 (10.8%) |
| Total | 310 (100.0%) | 399 (100.0%) |
Real Estate Taxes by Mortgage Status in Northeast Ithaca
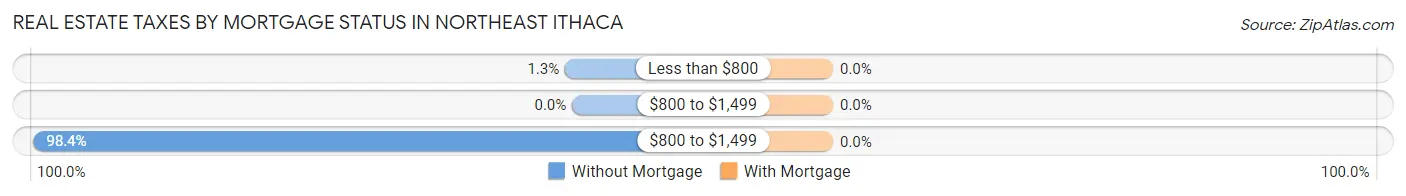
| Property Taxes | Without Mortgage | With Mortgage |
| Less than $800 | 4 (1.3%) | 0 (0.0%) |
| $800 to $1,499 | 0 (0.0%) | 0 (0.0%) |
| $800 to $1,499 | 305 (98.4%) | 0 (0.0%) |
| Total | 310 (100.0%) | 399 (100.0%) |
Health & Disability in Northeast Ithaca
Health Insurance Coverage by Age in Northeast Ithaca
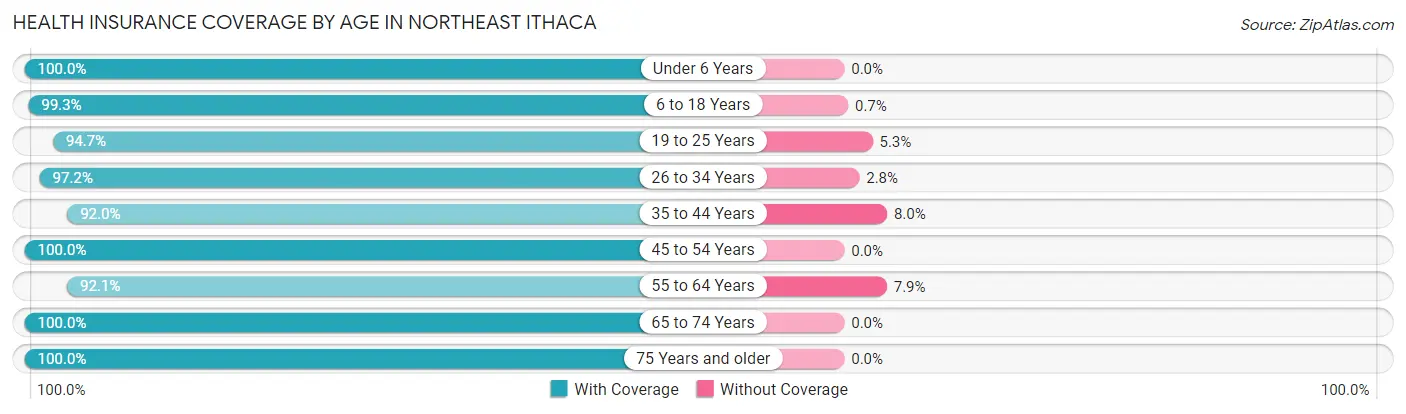
| Age Bracket | With Coverage | Without Coverage |
| Under 6 Years | 133 (100.0%) | 0 (0.0%) |
| 6 to 18 Years | 426 (99.3%) | 3 (0.7%) |
| 19 to 25 Years | 180 (94.7%) | 10 (5.3%) |
| 26 to 34 Years | 312 (97.2%) | 9 (2.8%) |
| 35 to 44 Years | 416 (92.0%) | 36 (8.0%) |
| 45 to 54 Years | 397 (100.0%) | 0 (0.0%) |
| 55 to 64 Years | 186 (92.1%) | 16 (7.9%) |
| 65 to 74 Years | 253 (100.0%) | 0 (0.0%) |
| 75 Years and older | 243 (100.0%) | 0 (0.0%) |
| Total | 2,546 (97.2%) | 74 (2.8%) |
Health Insurance Coverage by Citizenship Status in Northeast Ithaca
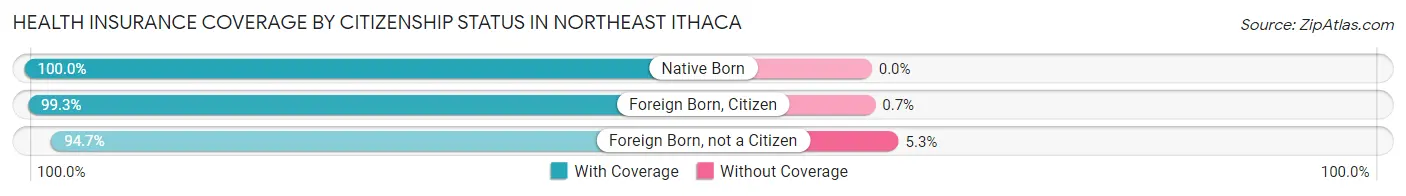
| Citizenship Status | With Coverage | Without Coverage |
| Native Born | 133 (100.0%) | 0 (0.0%) |
| Foreign Born, Citizen | 426 (99.3%) | 3 (0.7%) |
| Foreign Born, not a Citizen | 180 (94.7%) | 10 (5.3%) |
Health Insurance Coverage by Household Income in Northeast Ithaca
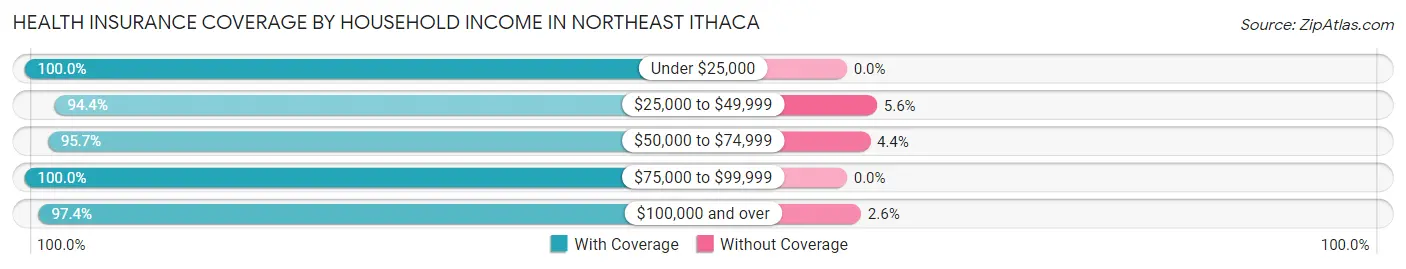
| Household Income | With Coverage | Without Coverage |
| Under $25,000 | 80 (100.0%) | 0 (0.0%) |
| $25,000 to $49,999 | 201 (94.4%) | 12 (5.6%) |
| $50,000 to $74,999 | 396 (95.7%) | 18 (4.3%) |
| $75,000 to $99,999 | 242 (100.0%) | 0 (0.0%) |
| $100,000 and over | 1,622 (97.4%) | 44 (2.6%) |
Public vs Private Health Insurance Coverage by Age in Northeast Ithaca
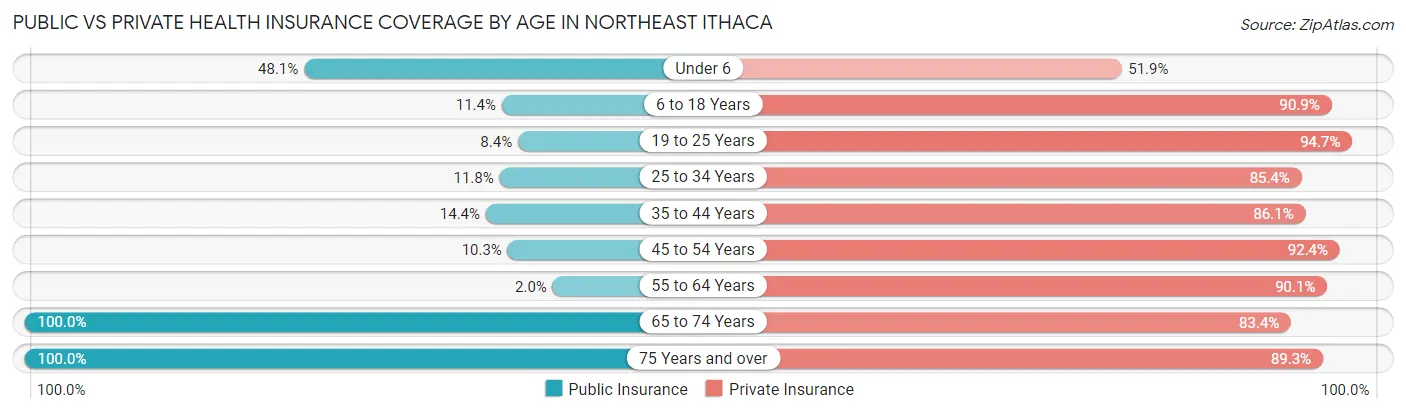
| Age Bracket | Public Insurance | Private Insurance |
| Under 6 | 64 (48.1%) | 69 (51.9%) |
| 6 to 18 Years | 49 (11.4%) | 390 (90.9%) |
| 19 to 25 Years | 16 (8.4%) | 180 (94.7%) |
| 25 to 34 Years | 38 (11.8%) | 274 (85.4%) |
| 35 to 44 Years | 65 (14.4%) | 389 (86.1%) |
| 45 to 54 Years | 41 (10.3%) | 367 (92.4%) |
| 55 to 64 Years | 4 (2.0%) | 182 (90.1%) |
| 65 to 74 Years | 253 (100.0%) | 211 (83.4%) |
| 75 Years and over | 243 (100.0%) | 217 (89.3%) |
| Total | 773 (29.5%) | 2,279 (87.0%) |
Disability Status by Sex by Age in Northeast Ithaca
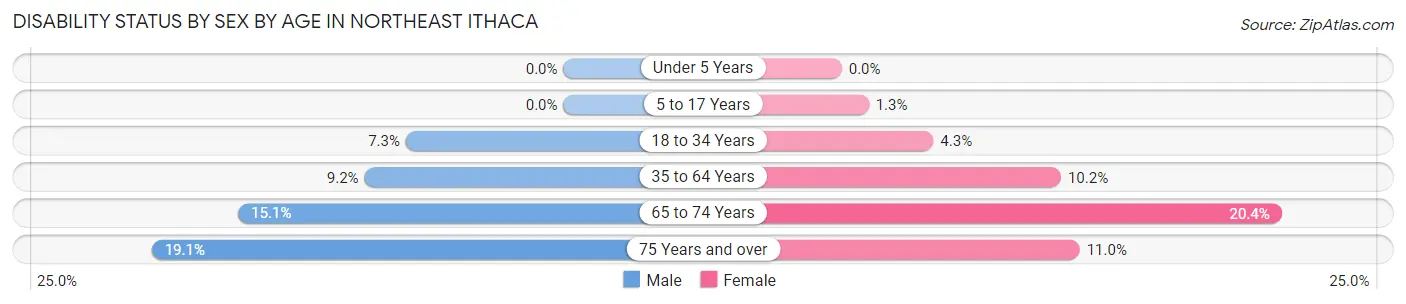
| Age Bracket | Male | Female |
| Under 5 Years | 0 (0.0%) | 0 (0.0%) |
| 5 to 17 Years | 0 (0.0%) | 3 (1.3%) |
| 18 to 34 Years | 16 (7.3%) | 13 (4.3%) |
| 35 to 64 Years | 48 (9.2%) | 54 (10.2%) |
| 65 to 74 Years | 16 (15.1%) | 30 (20.4%) |
| 75 Years and over | 17 (19.1%) | 17 (11.0%) |
Disability Class by Sex by Age in Northeast Ithaca
Disability Class: Hearing Difficulty
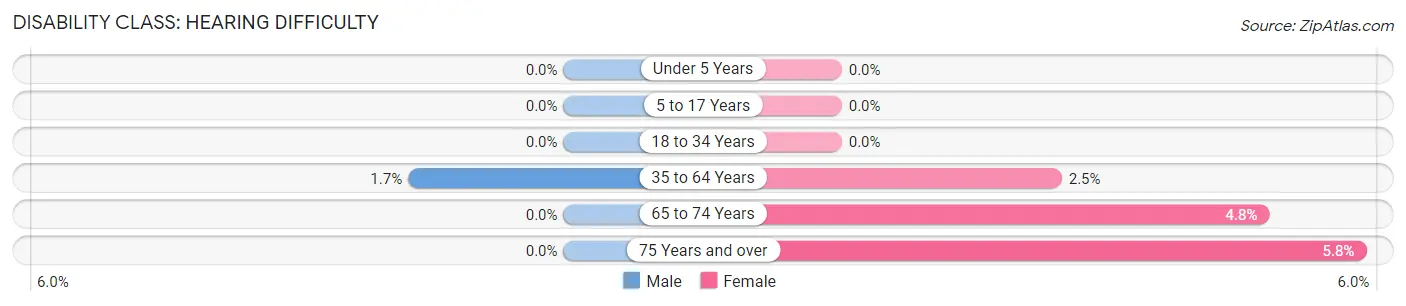
| Age Bracket | Male | Female |
| Under 5 Years | 0 (0.0%) | 0 (0.0%) |
| 5 to 17 Years | 0 (0.0%) | 0 (0.0%) |
| 18 to 34 Years | 0 (0.0%) | 0 (0.0%) |
| 35 to 64 Years | 9 (1.7%) | 13 (2.5%) |
| 65 to 74 Years | 0 (0.0%) | 7 (4.8%) |
| 75 Years and over | 0 (0.0%) | 9 (5.8%) |
Disability Class: Vision Difficulty
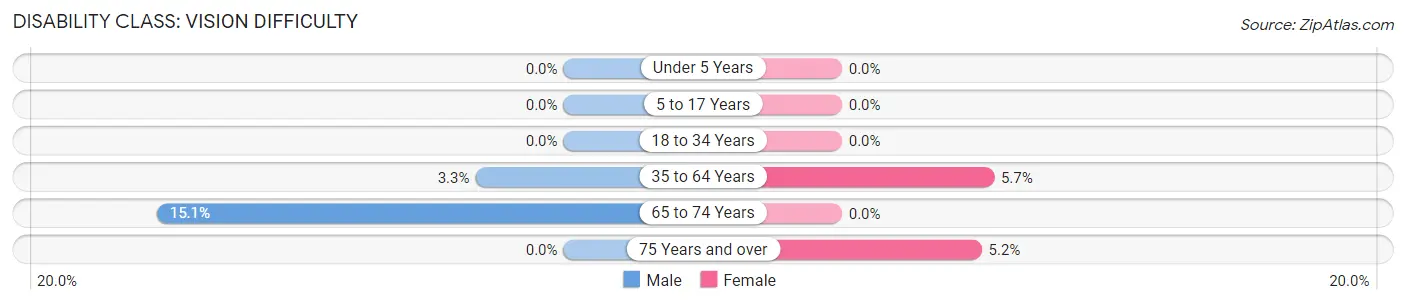
| Age Bracket | Male | Female |
| Under 5 Years | 0 (0.0%) | 0 (0.0%) |
| 5 to 17 Years | 0 (0.0%) | 0 (0.0%) |
| 18 to 34 Years | 0 (0.0%) | 0 (0.0%) |
| 35 to 64 Years | 17 (3.3%) | 30 (5.7%) |
| 65 to 74 Years | 16 (15.1%) | 0 (0.0%) |
| 75 Years and over | 0 (0.0%) | 8 (5.2%) |
Disability Class: Cognitive Difficulty
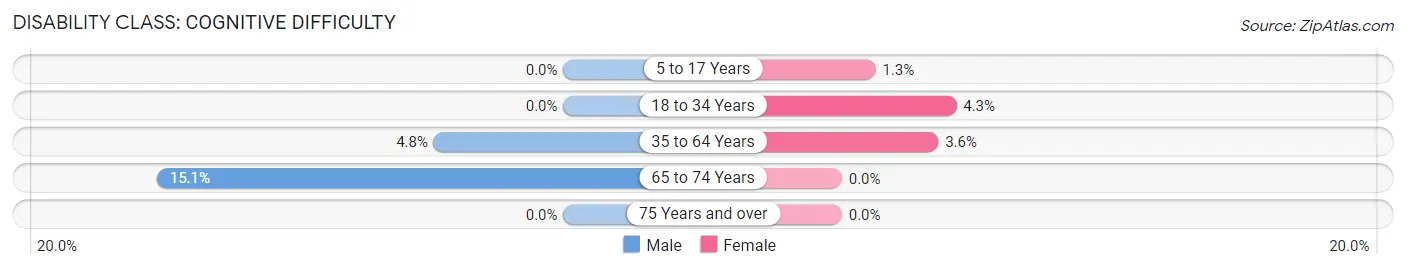
| Age Bracket | Male | Female |
| 5 to 17 Years | 0 (0.0%) | 3 (1.3%) |
| 18 to 34 Years | 0 (0.0%) | 13 (4.3%) |
| 35 to 64 Years | 25 (4.8%) | 19 (3.6%) |
| 65 to 74 Years | 16 (15.1%) | 0 (0.0%) |
| 75 Years and over | 0 (0.0%) | 0 (0.0%) |
Disability Class: Ambulatory Difficulty
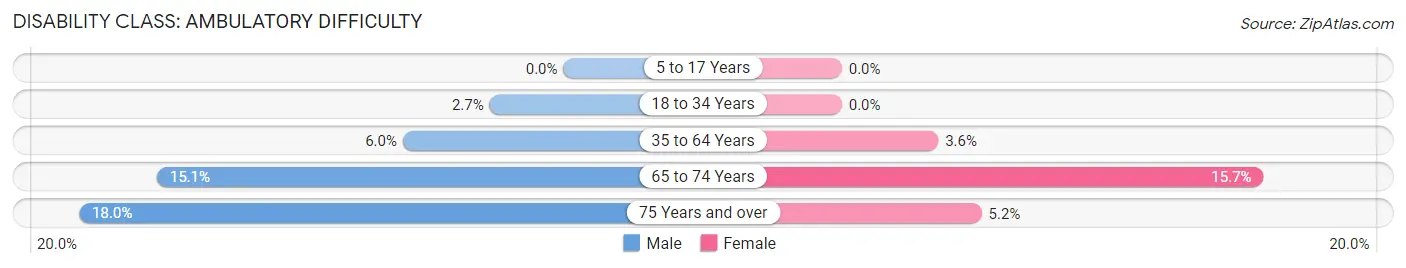
| Age Bracket | Male | Female |
| 5 to 17 Years | 0 (0.0%) | 0 (0.0%) |
| 18 to 34 Years | 6 (2.7%) | 0 (0.0%) |
| 35 to 64 Years | 31 (6.0%) | 19 (3.6%) |
| 65 to 74 Years | 16 (15.1%) | 23 (15.7%) |
| 75 Years and over | 16 (18.0%) | 8 (5.2%) |
Disability Class: Self-Care Difficulty
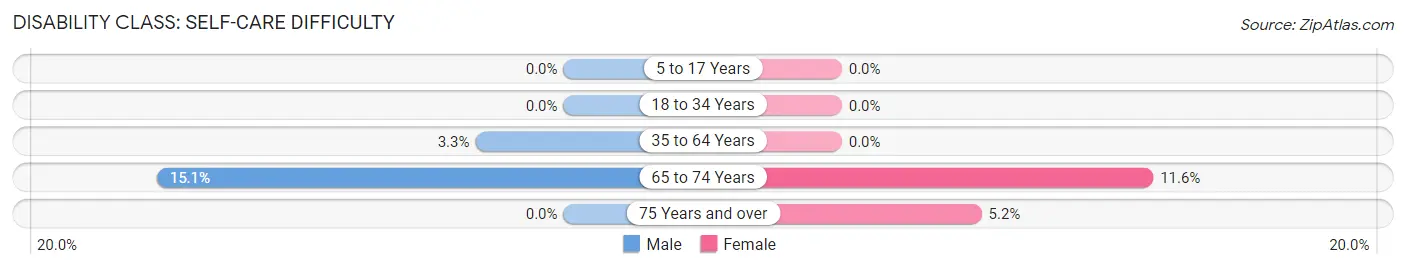
| Age Bracket | Male | Female |
| 5 to 17 Years | 0 (0.0%) | 0 (0.0%) |
| 18 to 34 Years | 0 (0.0%) | 0 (0.0%) |
| 35 to 64 Years | 17 (3.3%) | 0 (0.0%) |
| 65 to 74 Years | 16 (15.1%) | 17 (11.6%) |
| 75 Years and over | 0 (0.0%) | 8 (5.2%) |
Technology Access in Northeast Ithaca
Computing Device Access in Northeast Ithaca
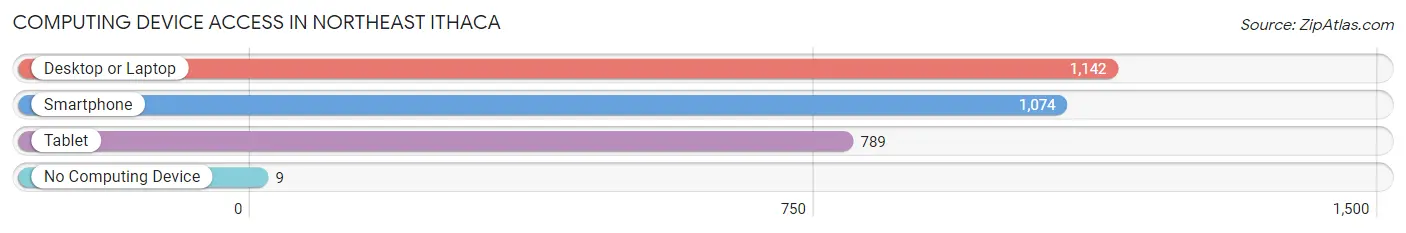
| Device Type | # Households | % Households |
| Desktop or Laptop | 1,142 | 97.7% |
| Smartphone | 1,074 | 91.9% |
| Tablet | 789 | 67.5% |
| No Computing Device | 9 | 0.8% |
| Total | 1,169 | 100.0% |
Internet Access in Northeast Ithaca
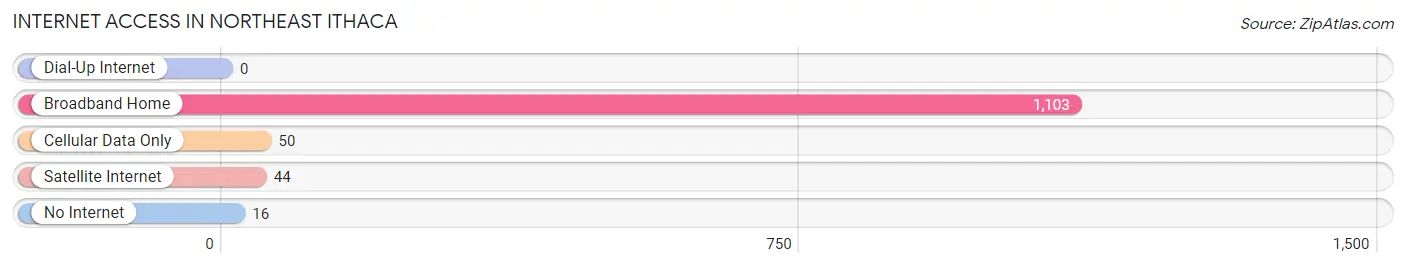
| Internet Type | # Households | % Households |
| Dial-Up Internet | 0 | 0.0% |
| Broadband Home | 1,103 | 94.4% |
| Cellular Data Only | 50 | 4.3% |
| Satellite Internet | 44 | 3.8% |
| No Internet | 16 | 1.4% |
| Total | 1,169 | 100.0% |
Northeast Ithaca Summary
Northeast Ithaca, NY is a small city located in the Finger Lakes region of New York State. It is situated on the northern edge of Cayuga Lake, the largest of the Finger Lakes. The city is home to Cornell University, Ithaca College, and Tompkins Cortland Community College. It is also home to a vibrant arts and culture scene, with numerous galleries, theaters, and music venues.
History
The area that is now Northeast Ithaca was originally inhabited by the Cayuga Nation, a member of the Iroquois Confederacy. The first European settlers arrived in the area in the late 1700s, and the city was officially incorporated in 1817. In the 19th century, the city became a center of industry, with several mills and factories located in the area. In 1865, Cornell University was founded in Ithaca, and the city quickly became a center of higher education.
Geography
Northeast Ithaca is located in the Finger Lakes region of New York State. It is situated on the northern edge of Cayuga Lake, the largest of the Finger Lakes. The city is bordered by the towns of Lansing, Dryden, and Ulysses. The city is located at the base of the Finger Lakes, and is surrounded by rolling hills and forests.
Economy
Northeast Ithaca is home to a diverse economy. The city is a major center of higher education, with Cornell University, Ithaca College, and Tompkins Cortland Community College all located in the city. The city is also home to a number of technology companies, including IBM, Microsoft, and Google. The city is also home to a vibrant arts and culture scene, with numerous galleries, theaters, and music venues.
Demographics
As of the 2010 census, the population of Northeast Ithaca was 30,014. The racial makeup of the city was 79.2% White, 8.3% African American, 0.3% Native American, 8.2% Asian, 0.1% Pacific Islander, and 3.9% from other races. The median household income was $41,945, and the median family income was $54,817. The per capita income was $25,945. The city has a large student population, with approximately 20,000 students enrolled at Cornell University, Ithaca College, and Tompkins Cortland Community College.
Common Questions
What is Per Capita Income in Northeast Ithaca?
Per Capita income in Northeast Ithaca is $53,564.
What is the Median Family Income in Northeast Ithaca?
Median Family Income in Northeast Ithaca is $138,594.
What is the Median Household income in Northeast Ithaca?
Median Household Income in Northeast Ithaca is $94,306.
What is Income or Wage Gap in Northeast Ithaca?
Income or Wage Gap in Northeast Ithaca is 21.3%.
Women in Northeast Ithaca earn 78.7 cents for every dollar earned by a man.
What is Inequality or Gini Index in Northeast Ithaca?
Inequality or Gini Index in Northeast Ithaca is 0.39.
What is the Total Population of Northeast Ithaca?
Total Population of Northeast Ithaca is 2,627.
What is the Total Male Population of Northeast Ithaca?
Total Male Population of Northeast Ithaca is 1,243.
What is the Total Female Population of Northeast Ithaca?
Total Female Population of Northeast Ithaca is 1,384.
What is the Ratio of Males per 100 Females in Northeast Ithaca?
There are 89.81 Males per 100 Females in Northeast Ithaca.
What is the Ratio of Females per 100 Males in Northeast Ithaca?
There are 111.34 Females per 100 Males in Northeast Ithaca.
What is the Median Population Age in Northeast Ithaca?
Median Population Age in Northeast Ithaca is 40.5 Years.
What is the Average Family Size in Northeast Ithaca
Average Family Size in Northeast Ithaca is 2.7 People.
What is the Average Household Size in Northeast Ithaca
Average Household Size in Northeast Ithaca is 2.2 People.
How Large is the Labor Force in Northeast Ithaca?
There are 1,454 People in the Labor Forcein in Northeast Ithaca.
What is the Percentage of People in the Labor Force in Northeast Ithaca?
67.8% of People are in the Labor Force in Northeast Ithaca.
What is the Unemployment Rate in Northeast Ithaca?
Unemployment Rate in Northeast Ithaca is 3.0%.