Wadsworth, NY Map & Demographics
Wadsworth Map
Wadsworth Overview
$25,736
PER CAPITA INCOME
$54,107
AVG HOUSEHOLD INCOME
0.43
INEQUALITY / GINI INDEX
148
TOTAL POPULATION
57
MALE POPULATION
91
FEMALE POPULATION
62.64
MALES / 100 FEMALES
159.65
FEMALES / 100 MALES
29.6
MEDIAN AGE
2.4
AVG FAMILY SIZE
2.9
AVG HOUSEHOLD SIZE
75
LABOR FORCE [ PEOPLE ]
78.1%
PERCENT IN LABOR FORCE
28.0%
UNEMPLOYMENT RATE
Wadsworth Area Codes
Income in Wadsworth
Income Overview in Wadsworth
| Characteristic | Number | Measure |
| Per Capita Income | 148 | $25,736 |
| Median Family Income | 51 | $0 |
| Mean Family Income | 51 | $54,416 |
| Median Household Income | 51 | $54,107 |
| Mean Household Income | 51 | $72,200 |
| Income Deficit | 51 | $0 |
| Wage / Income Gap (%) | 148 | 0.00% |
| Wage / Income Gap ($) | 148 | 100.00¢ per $1 |
| Gini / Inequality Index | 148 | 0.43 |
Earnings by Sex in Wadsworth
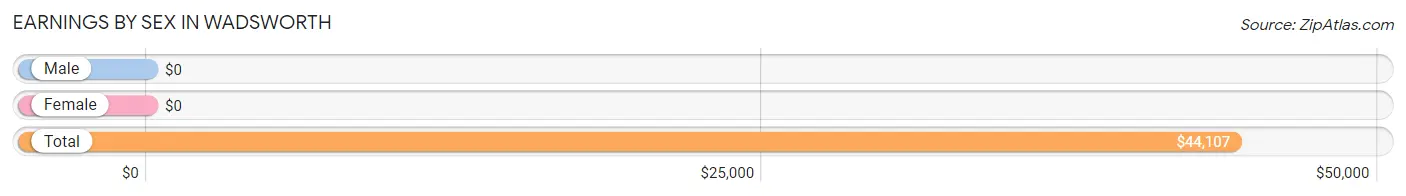
| Sex | Number | Average Earnings |
| Male | 17 (31.5%) | $0 |
| Female | 37 (68.5%) | $0 |
| Total | 54 (100.0%) | $44,107 |
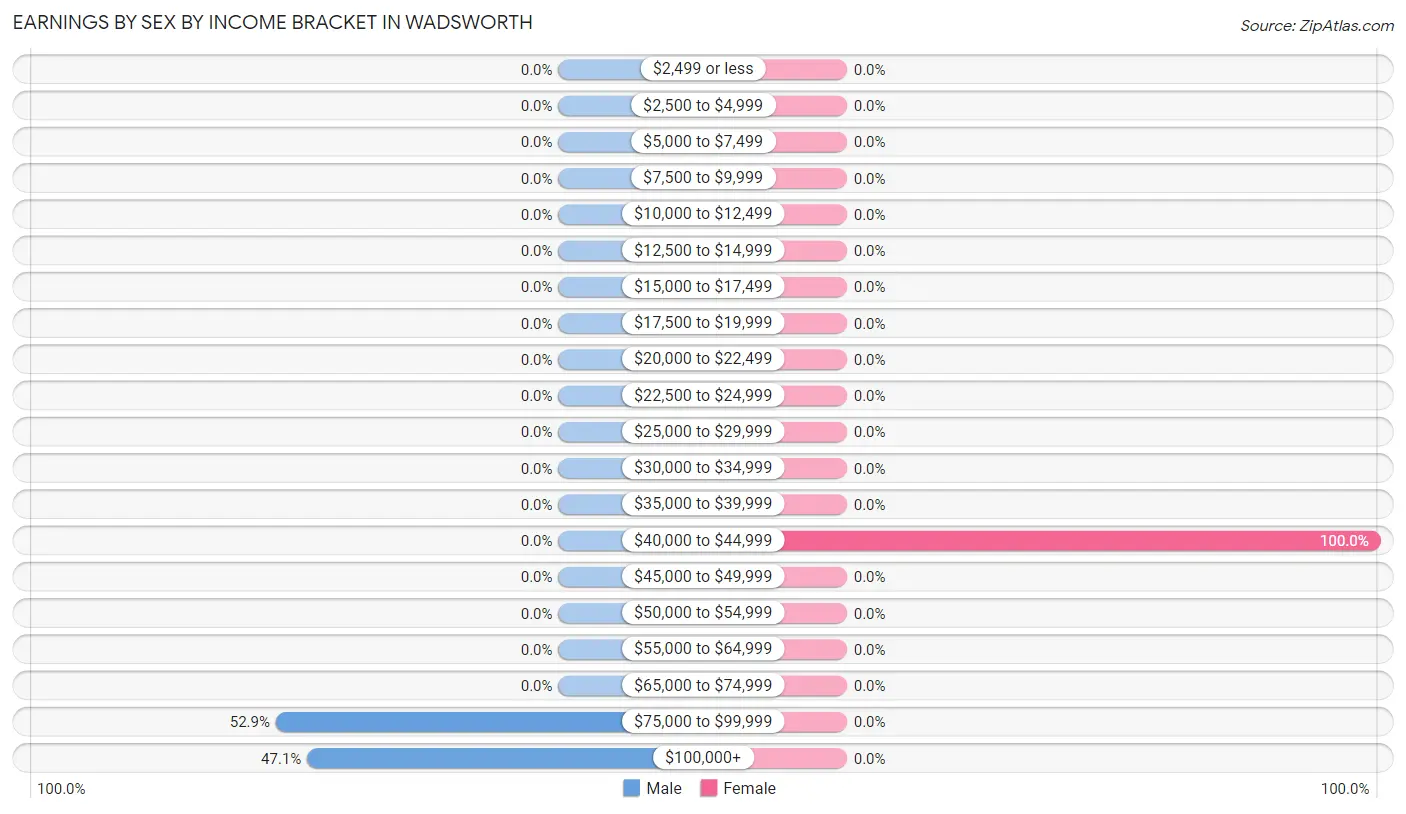
Earnings by Sex by Income Bracket in Wadsworth
The most common earnings brackets in Wadsworth are $75,000 to $99,999 for men (9 | 52.9%) and $40,000 to $44,999 for women (37 | 100.0%).
| Income | Male | Female |
| $2,499 or less | 0 (0.0%) | 0 (0.0%) |
| $2,500 to $4,999 | 0 (0.0%) | 0 (0.0%) |
| $5,000 to $7,499 | 0 (0.0%) | 0 (0.0%) |
| $7,500 to $9,999 | 0 (0.0%) | 0 (0.0%) |
| $10,000 to $12,499 | 0 (0.0%) | 0 (0.0%) |
| $12,500 to $14,999 | 0 (0.0%) | 0 (0.0%) |
| $15,000 to $17,499 | 0 (0.0%) | 0 (0.0%) |
| $17,500 to $19,999 | 0 (0.0%) | 0 (0.0%) |
| $20,000 to $22,499 | 0 (0.0%) | 0 (0.0%) |
| $22,500 to $24,999 | 0 (0.0%) | 0 (0.0%) |
| $25,000 to $29,999 | 0 (0.0%) | 0 (0.0%) |
| $30,000 to $34,999 | 0 (0.0%) | 0 (0.0%) |
| $35,000 to $39,999 | 0 (0.0%) | 0 (0.0%) |
| $40,000 to $44,999 | 0 (0.0%) | 37 (100.0%) |
| $45,000 to $49,999 | 0 (0.0%) | 0 (0.0%) |
| $50,000 to $54,999 | 0 (0.0%) | 0 (0.0%) |
| $55,000 to $64,999 | 0 (0.0%) | 0 (0.0%) |
| $65,000 to $74,999 | 0 (0.0%) | 0 (0.0%) |
| $75,000 to $99,999 | 9 (52.9%) | 0 (0.0%) |
| $100,000+ | 8 (47.1%) | 0 (0.0%) |
| Total | 17 (100.0%) | 37 (100.0%) |
Earnings by Sex by Educational Attainment in Wadsworth
| Educational Attainment | Male Income | Female Income |
| Less than High School | - | - |
| High School Diploma | - | - |
| College or Associate's Degree | - | - |
| Bachelor's Degree | - | - |
| Graduate Degree | - | - |
| Total | - | - |
Family Income in Wadsworth
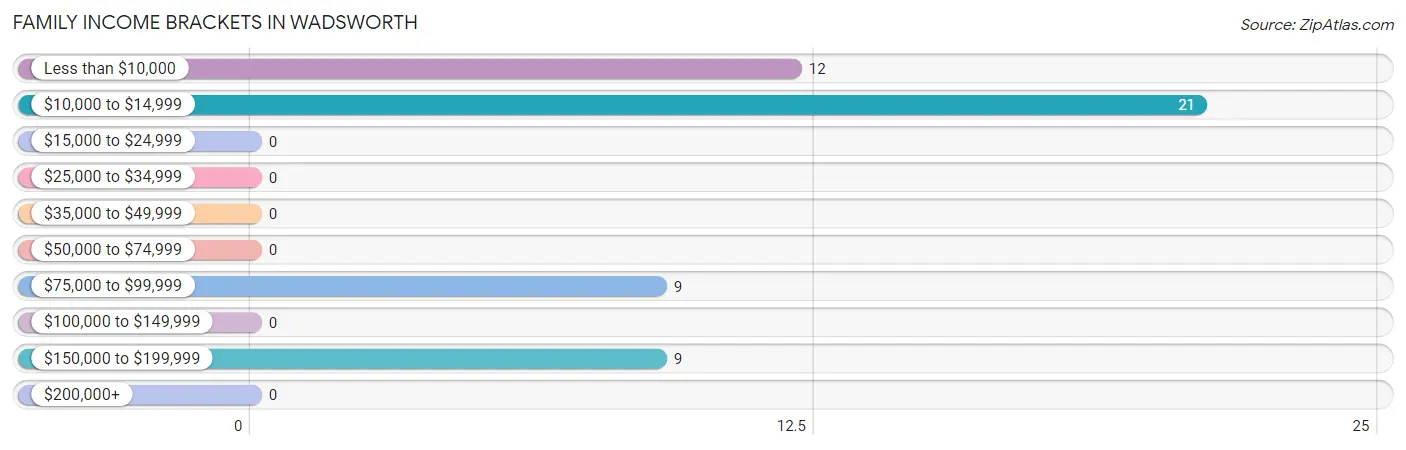
Family Income Brackets in Wadsworth
According to the Wadsworth family income data, there are 21 families falling into the $10,000 to $14,999 income range, which is the most common income bracket and makes up 41.2% of all families.
| Income Bracket | # Families | % Families |
| Less than $10,000 | 12 | 23.5% |
| $10,000 to $14,999 | 21 | 41.2% |
| $15,000 to $24,999 | 0 | 0.0% |
| $25,000 to $34,999 | 0 | 0.0% |
| $35,000 to $49,999 | 0 | 0.0% |
| $50,000 to $74,999 | 0 | 0.0% |
| $75,000 to $99,999 | 9 | 17.6% |
| $100,000 to $149,999 | 0 | 0.0% |
| $150,000 to $199,999 | 9 | 17.6% |
| $200,000+ | 0 | 0.0% |
Family Income by Famaliy Size in Wadsworth
| Income Bracket | # Families | Median Income |
| 2-Person Families | 30 (58.8%) | $0 |
| 3-Person Families | 9 (17.6%) | $0 |
| 4-Person Families | 12 (23.5%) | $0 |
| 5-Person Families | 0 (0.0%) | $0 |
| 6-Person Families | 0 (0.0%) | $0 |
| 7+ Person Families | 0 (0.0%) | $0 |
| Total | 51 (100.0%) | $0 |
Family Income by Number of Earners in Wadsworth
| Number of Earners | # Families | Median Income |
| No Earners | 33 (64.7%) | $0 |
| 1 Earner | 9 (17.6%) | $0 |
| 2 Earners | 9 (17.6%) | $0 |
| 3+ Earners | 0 (0.0%) | $0 |
| Total | 51 (100.0%) | $0 |
Household Income in Wadsworth
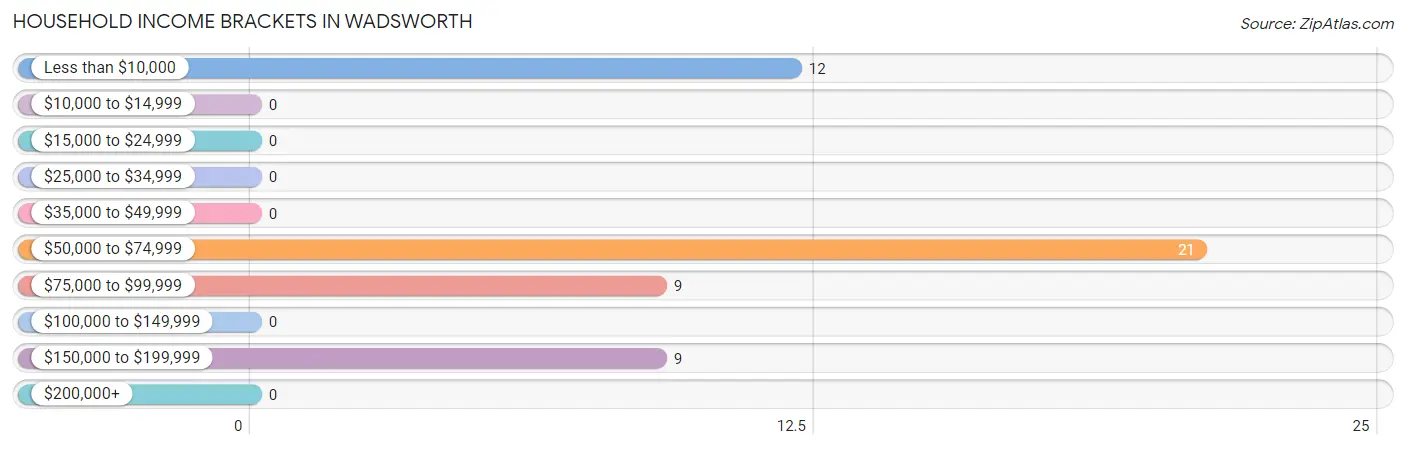
Household Income Brackets in Wadsworth
With 21 households falling in the category, the $50,000 to $74,999 income range is the most frequent in Wadsworth, accounting for 41.2% of all households.
| Income Bracket | # Households | % Households |
| Less than $10,000 | 12 | 23.5% |
| $10,000 to $14,999 | 0 | 0.0% |
| $15,000 to $24,999 | 0 | 0.0% |
| $25,000 to $34,999 | 0 | 0.0% |
| $35,000 to $49,999 | 0 | 0.0% |
| $50,000 to $74,999 | 21 | 41.2% |
| $75,000 to $99,999 | 9 | 17.6% |
| $100,000 to $149,999 | 0 | 0.0% |
| $150,000 to $199,999 | 9 | 17.6% |
| $200,000+ | 0 | 0.0% |
Household Income by Householder Age in Wadsworth
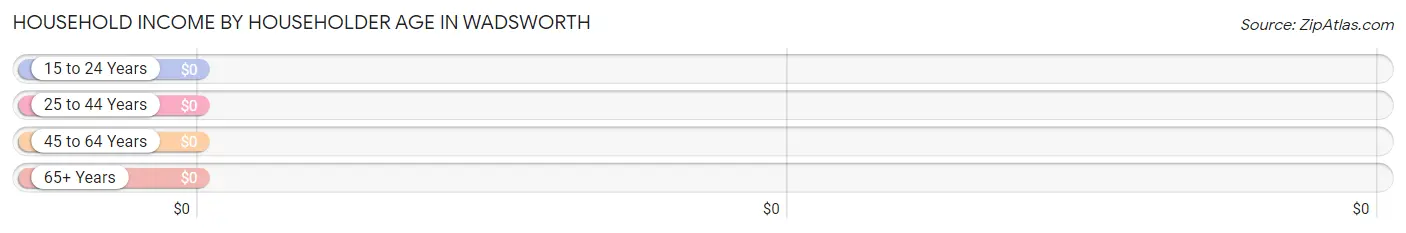
| Income Bracket | # Households | Median Income |
| 15 to 24 Years | 0 (0.0%) | $0 |
| 25 to 44 Years | 30 (58.8%) | $0 |
| 45 to 64 Years | 21 (41.2%) | $0 |
| 65+ Years | 0 (0.0%) | $0 |
| Total | 51 (100.0%) | $54,107 |
Poverty in Wadsworth
Income Below Poverty by Sex and Age in Wadsworth
With 54.4% poverty level for males and 50.5% for females among the residents of Wadsworth, 12 to 14 year old males and under 5 year old females are the most vulnerable to poverty, with 11 males (100.0%) and 13 females (100.0%) in their respective age groups living below the poverty level.
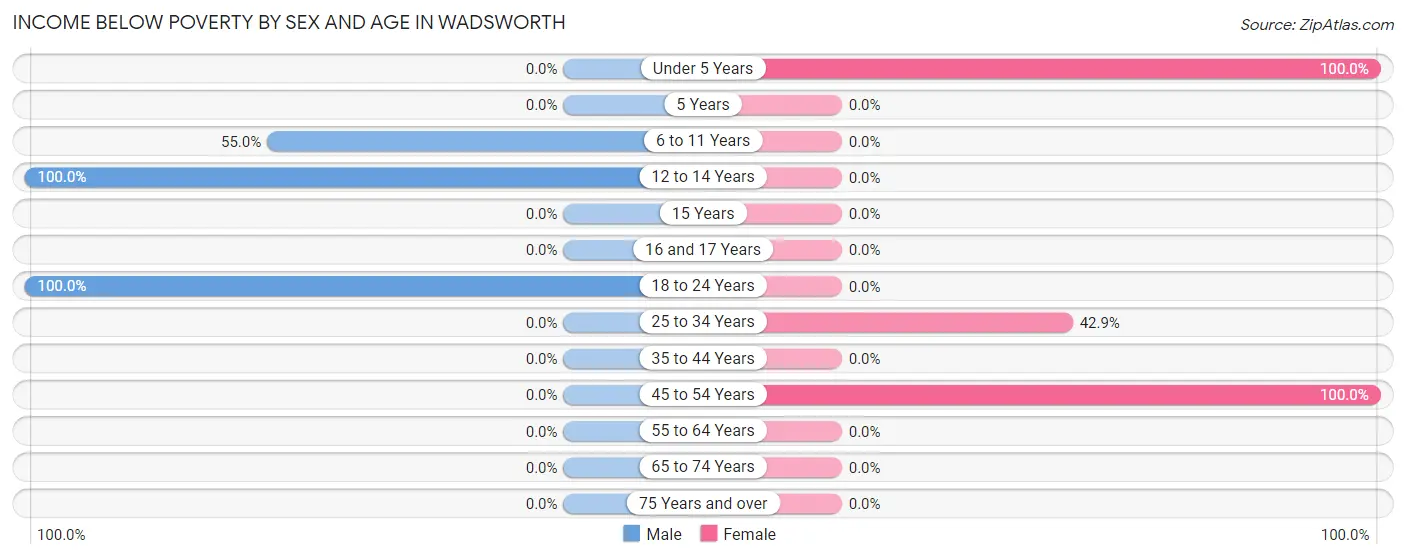
| Age Bracket | Male | Female |
| Under 5 Years | 0 (0.0%) | 13 (100.0%) |
| 5 Years | 0 (0.0%) | 0 (0.0%) |
| 6 to 11 Years | 11 (55.0%) | 0 (0.0%) |
| 12 to 14 Years | 11 (100.0%) | 0 (0.0%) |
| 15 Years | 0 (0.0%) | 0 (0.0%) |
| 16 and 17 Years | 0 (0.0%) | 0 (0.0%) |
| 18 to 24 Years | 9 (100.0%) | 0 (0.0%) |
| 25 to 34 Years | 0 (0.0%) | 21 (42.9%) |
| 35 to 44 Years | 0 (0.0%) | 0 (0.0%) |
| 45 to 54 Years | 0 (0.0%) | 12 (100.0%) |
| 55 to 64 Years | 0 (0.0%) | 0 (0.0%) |
| 65 to 74 Years | 0 (0.0%) | 0 (0.0%) |
| 75 Years and over | 0 (0.0%) | 0 (0.0%) |
| Total | 31 (54.4%) | 46 (50.5%) |
Income Above Poverty by Sex and Age in Wadsworth
According to the poverty statistics in Wadsworth, males aged 35 to 44 years and females aged 6 to 11 years are the age groups that are most secure financially, with 100.0% of males and 100.0% of females in these age groups living above the poverty line.
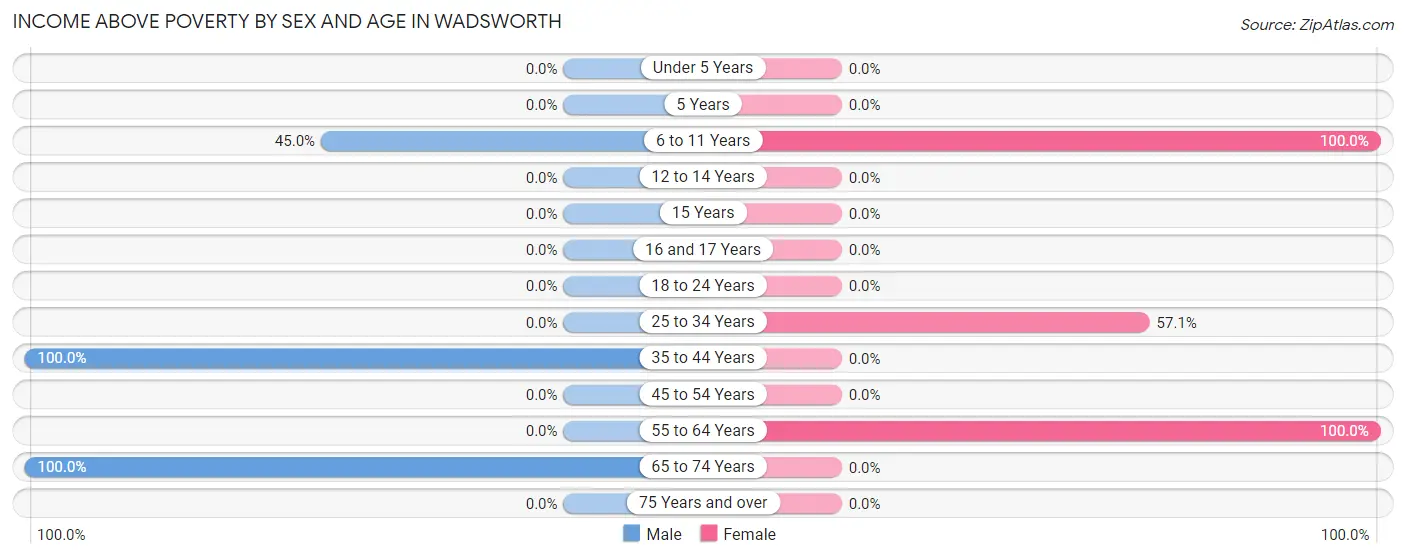
| Age Bracket | Male | Female |
| Under 5 Years | 0 (0.0%) | 0 (0.0%) |
| 5 Years | 0 (0.0%) | 0 (0.0%) |
| 6 to 11 Years | 9 (45.0%) | 8 (100.0%) |
| 12 to 14 Years | 0 (0.0%) | 0 (0.0%) |
| 15 Years | 0 (0.0%) | 0 (0.0%) |
| 16 and 17 Years | 0 (0.0%) | 0 (0.0%) |
| 18 to 24 Years | 0 (0.0%) | 0 (0.0%) |
| 25 to 34 Years | 0 (0.0%) | 28 (57.1%) |
| 35 to 44 Years | 9 (100.0%) | 0 (0.0%) |
| 45 to 54 Years | 0 (0.0%) | 0 (0.0%) |
| 55 to 64 Years | 0 (0.0%) | 9 (100.0%) |
| 65 to 74 Years | 8 (100.0%) | 0 (0.0%) |
| 75 Years and over | 0 (0.0%) | 0 (0.0%) |
| Total | 26 (45.6%) | 45 (49.4%) |
Income Below Poverty Among Married-Couple Families in Wadsworth
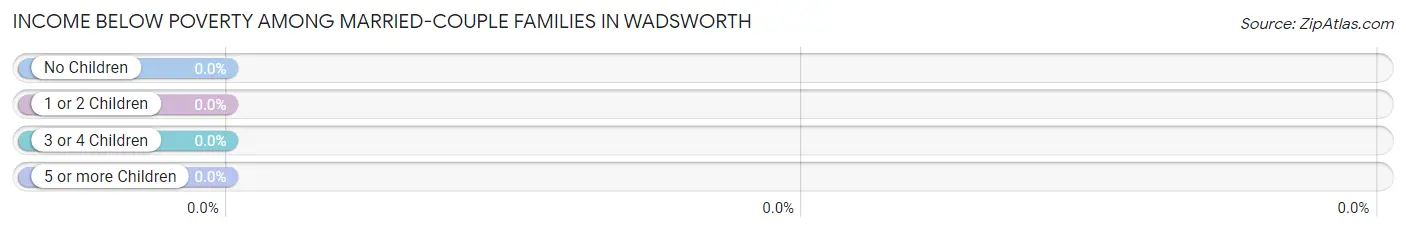
| Children | Above Poverty | Below Poverty |
| No Children | 9 (100.0%) | 0 (0.0%) |
| 1 or 2 Children | 0 (0.0%) | 0 (0.0%) |
| 3 or 4 Children | 0 (0.0%) | 0 (0.0%) |
| 5 or more Children | 0 (0.0%) | 0 (0.0%) |
| Total | 9 (100.0%) | 0 (0.0%) |
Income Below Poverty Among Single-Parent Households in Wadsworth
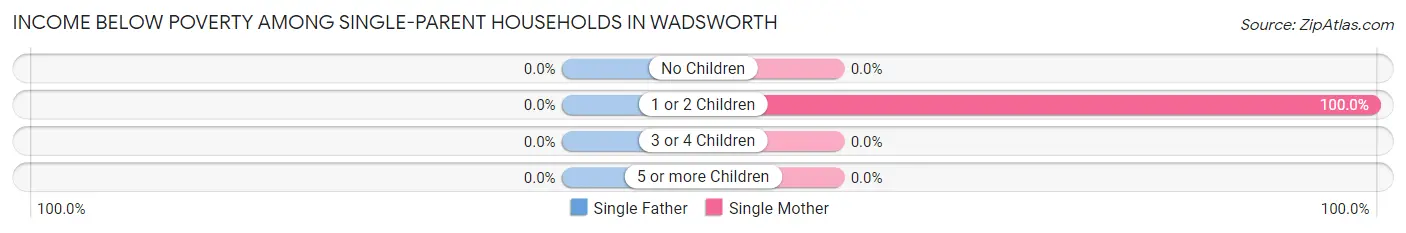
| Children | Single Father | Single Mother |
| No Children | 0 (0.0%) | 0 (0.0%) |
| 1 or 2 Children | 0 (0.0%) | 33 (100.0%) |
| 3 or 4 Children | 0 (0.0%) | 0 (0.0%) |
| 5 or more Children | 0 (0.0%) | 0 (0.0%) |
| Total | 0 (0.0%) | 33 (100.0%) |
Income Below Poverty Among Married-Couple vs Single-Parent Households in Wadsworth
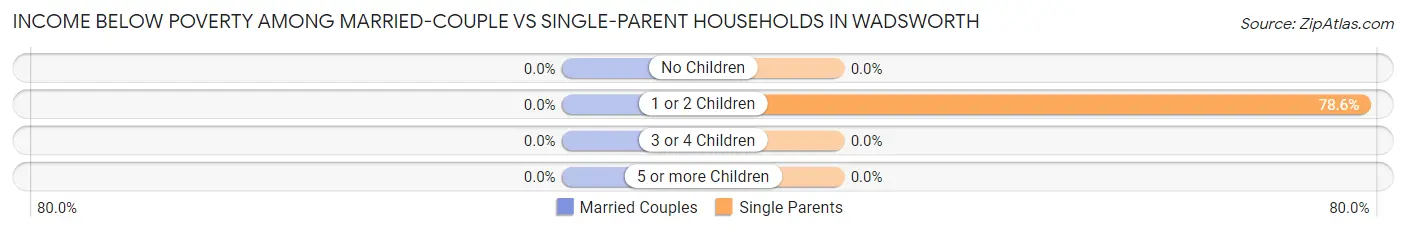
| Children | Married-Couple Families | Single-Parent Households |
| No Children | 0 (0.0%) | 0 (0.0%) |
| 1 or 2 Children | 0 (0.0%) | 33 (78.6%) |
| 3 or 4 Children | 0 (0.0%) | 0 (0.0%) |
| 5 or more Children | 0 (0.0%) | 0 (0.0%) |
| Total | 0 (0.0%) | 33 (78.6%) |
Race in Wadsworth
The most populous races in Wadsworth are White / Caucasian (148 | 100.0%), and Hispanic or Latino (22 | 14.9%).
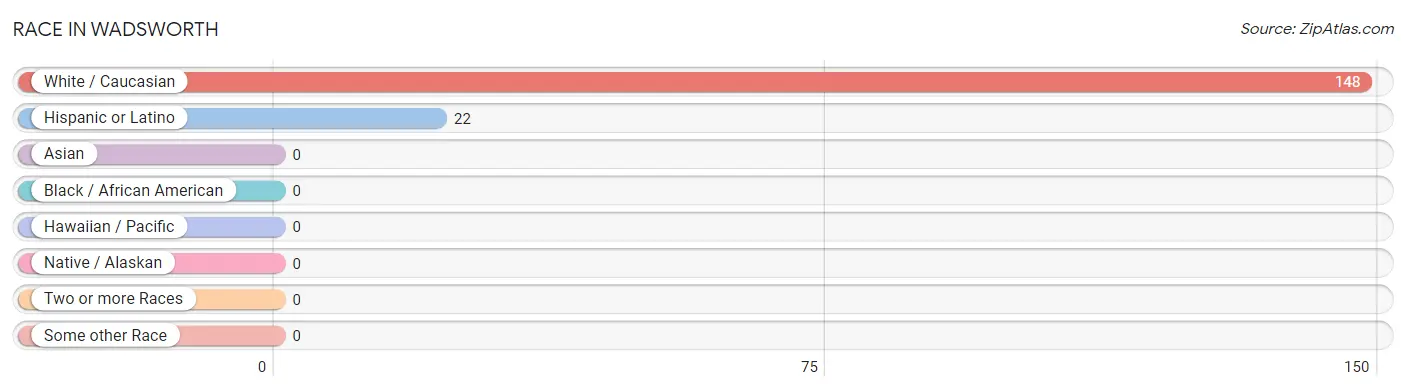
| Race | # Population | % Population |
| Asian | 0 | 0.0% |
| Black / African American | 0 | 0.0% |
| Hawaiian / Pacific | 0 | 0.0% |
| Hispanic or Latino | 22 | 14.9% |
| Native / Alaskan | 0 | 0.0% |
| White / Caucasian | 148 | 100.0% |
| Two or more Races | 0 | 0.0% |
| Some other Race | 0 | 0.0% |
| Total | 148 | 100.0% |
Ancestry in Wadsworth
The most populous ancestries reported in Wadsworth are Irish (49 | 33.1%), Puerto Rican (22 | 14.9%), German (21 | 14.2%), and Italian (9 | 6.1%), together accounting for 68.2% of all Wadsworth residents.
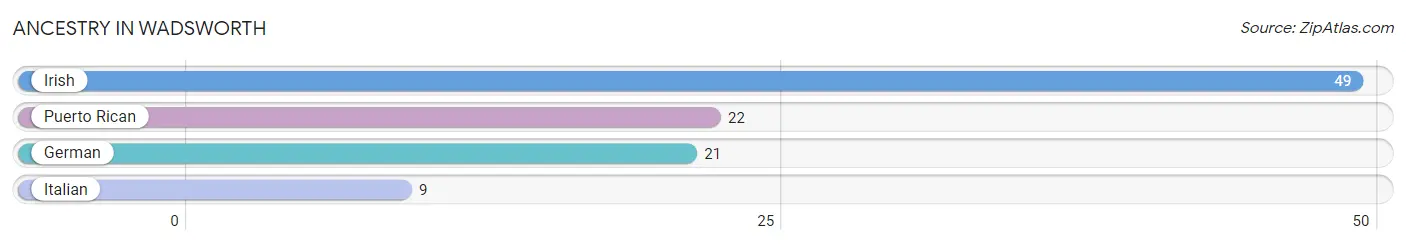
| Ancestry | # Population | % Population |
| German | 21 | 14.2% |
| Irish | 49 | 33.1% |
| Italian | 9 | 6.1% |
| Puerto Rican | 22 | 14.9% | View All 4 Rows |
Immigrants in Wadsworth

| Immigration Origin | # Population | % Population | View All 0 Rows |
Sex and Age in Wadsworth
Sex and Age in Wadsworth
The most populous age groups in Wadsworth are 10 to 14 Years (22 | 38.6%) for men and 30 to 34 Years (28 | 30.8%) for women.
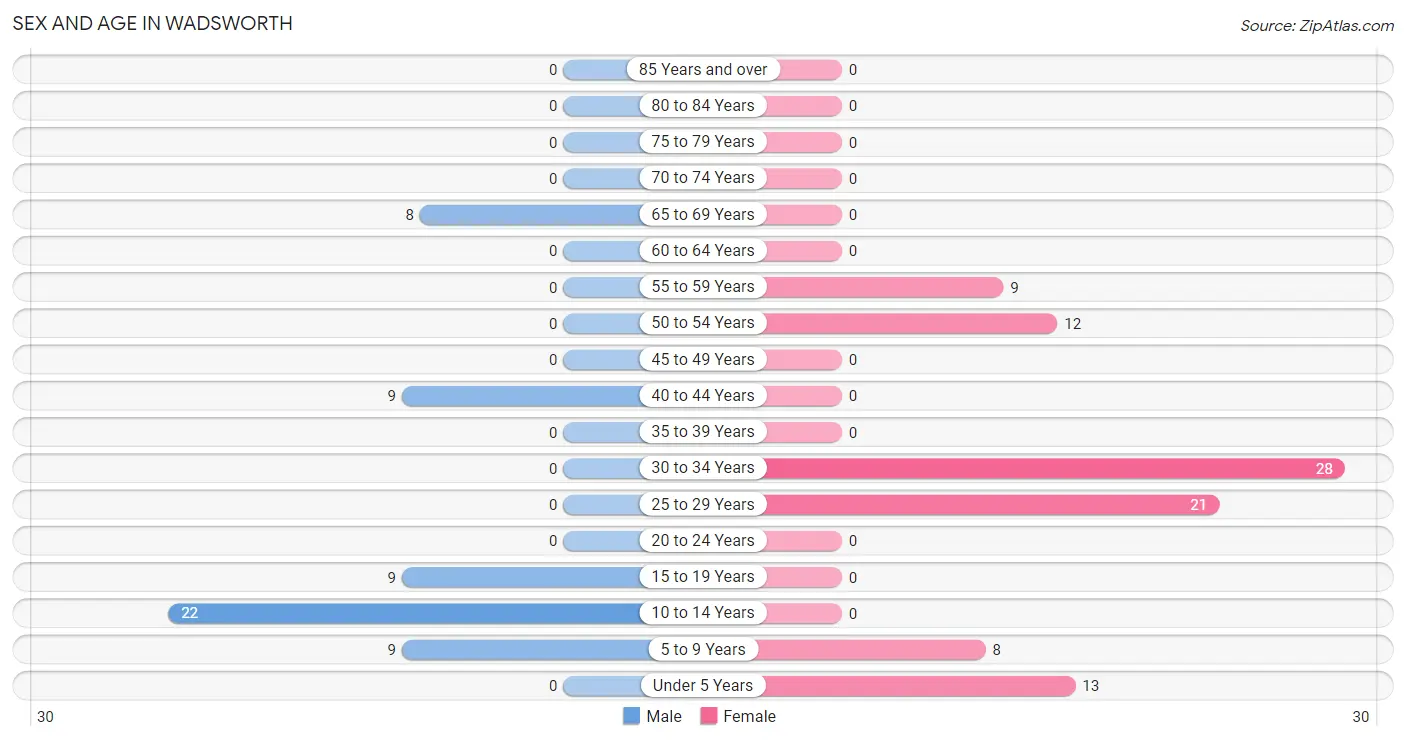
| Age Bracket | Male | Female |
| Under 5 Years | 0 (0.0%) | 13 (14.3%) |
| 5 to 9 Years | 9 (15.8%) | 8 (8.8%) |
| 10 to 14 Years | 22 (38.6%) | 0 (0.0%) |
| 15 to 19 Years | 9 (15.8%) | 0 (0.0%) |
| 20 to 24 Years | 0 (0.0%) | 0 (0.0%) |
| 25 to 29 Years | 0 (0.0%) | 21 (23.1%) |
| 30 to 34 Years | 0 (0.0%) | 28 (30.8%) |
| 35 to 39 Years | 0 (0.0%) | 0 (0.0%) |
| 40 to 44 Years | 9 (15.8%) | 0 (0.0%) |
| 45 to 49 Years | 0 (0.0%) | 0 (0.0%) |
| 50 to 54 Years | 0 (0.0%) | 12 (13.2%) |
| 55 to 59 Years | 0 (0.0%) | 9 (9.9%) |
| 60 to 64 Years | 0 (0.0%) | 0 (0.0%) |
| 65 to 69 Years | 8 (14.0%) | 0 (0.0%) |
| 70 to 74 Years | 0 (0.0%) | 0 (0.0%) |
| 75 to 79 Years | 0 (0.0%) | 0 (0.0%) |
| 80 to 84 Years | 0 (0.0%) | 0 (0.0%) |
| 85 Years and over | 0 (0.0%) | 0 (0.0%) |
| Total | 57 (100.0%) | 91 (100.0%) |
Families and Households in Wadsworth
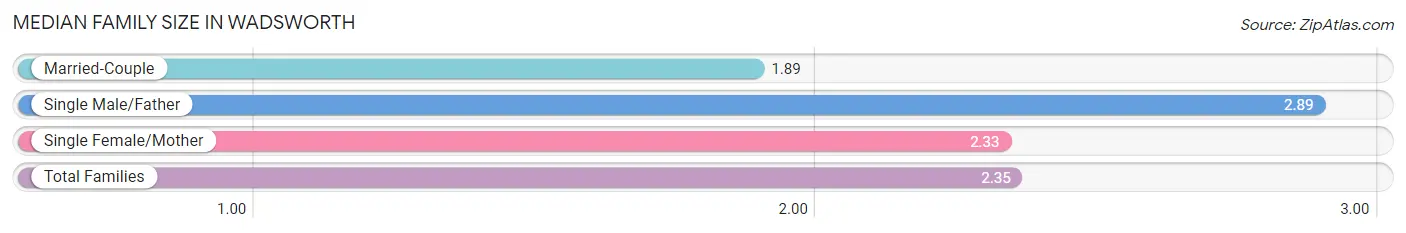
Median Family Size in Wadsworth
The median family size in Wadsworth is 2.35 persons per family, with single male/father families (9 | 17.6%) accounting for the largest median family size of 2.89 persons per family. On the other hand, married-couple families (9 | 17.6%) represent the smallest median family size with 1.89 persons per family.
| Family Type | # Families | Family Size |
| Married-Couple | 9 (17.6%) | 1.89 |
| Single Male/Father | 9 (17.6%) | 2.89 |
| Single Female/Mother | 33 (64.7%) | 2.33 |
| Total Families | 51 (100.0%) | 2.35 |
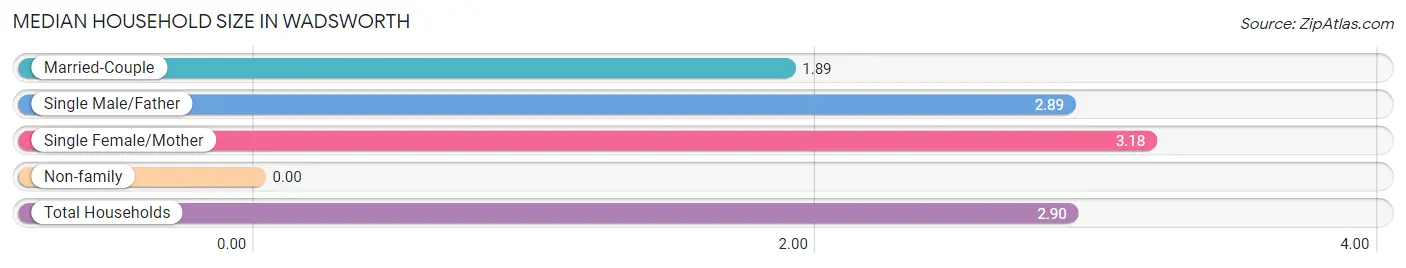
Median Household Size in Wadsworth
| Household Type | # Households | Household Size |
| Married-Couple | 9 (17.6%) | 1.89 |
| Single Male/Father | 9 (17.6%) | 2.89 |
| Single Female/Mother | 33 (64.7%) | 3.18 |
| Non-family | 0 (0.0%) | - |
| Total Households | 51 (100.0%) | 2.90 |
Household Size by Marriage Status in Wadsworth
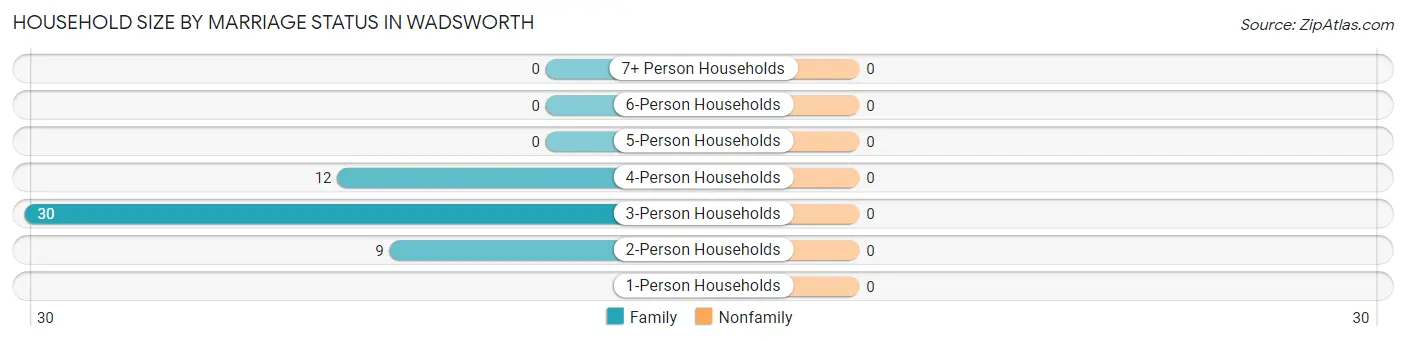
| Household Size | Family Households | Nonfamily Households |
| 1-Person Households | - | 0 (0.0%) |
| 2-Person Households | 9 (17.6%) | 0 (0.0%) |
| 3-Person Households | 30 (58.8%) | 0 (0.0%) |
| 4-Person Households | 12 (23.5%) | 0 (0.0%) |
| 5-Person Households | 0 (0.0%) | 0 (0.0%) |
| 6-Person Households | 0 (0.0%) | 0 (0.0%) |
| 7+ Person Households | 0 (0.0%) | 0 (0.0%) |
| Total | 51 (100.0%) | 0 (0.0%) |
Female Fertility in Wadsworth
Fertility by Age in Wadsworth
| Age Bracket | Women with Births | Births / 1,000 Women |
| 15 to 19 years | 0 (0.0%) | 0.0 |
| 20 to 34 years | 0 (0.0%) | 0.0 |
| 35 to 50 years | 0 (0.0%) | 0.0 |
| Total | 0 (0.0%) | 0.0 |
Fertility by Age by Marriage Status in Wadsworth
| Age Bracket | Married | Unmarried |
| 15 to 19 years | 0 (0.0%) | 0 (0.0%) |
| 20 to 34 years | 0 (0.0%) | 0 (0.0%) |
| 35 to 50 years | 0 (0.0%) | 0 (0.0%) |
| Total | 0 (0.0%) | 0 (0.0%) |
Fertility by Education in Wadsworth
| Educational Attainment | Women with Births | Births / 1,000 Women |
| Less than High School | 0 (0.0%) | 0.0 |
| High School Diploma | 0 (0.0%) | 0.0 |
| College or Associate's Degree | 0 (0.0%) | 0.0 |
| Bachelor's Degree | 0 (0.0%) | 0.0 |
| Graduate Degree | 0 (0.0%) | 0.0 |
| Total | 0 (0.0%) | 0.0 |
Fertility by Education by Marriage Status in Wadsworth
| Educational Attainment | Married | Unmarried |
| Less than High School | 0 (0.0%) | 0 (0.0%) |
| High School Diploma | 0 (0.0%) | 0 (0.0%) |
| College or Associate's Degree | 0 (0.0%) | 0 (0.0%) |
| Bachelor's Degree | 0 (0.0%) | 0 (0.0%) |
| Graduate Degree | 0 (0.0%) | 0 (0.0%) |
| Total | 0 (0.0%) | 0 (0.0%) |
Employment Characteristics in Wadsworth
Employment by Class of Employer in Wadsworth
Among the 54 employed individuals in Wadsworth, not-for-profit organizations (28 | 51.8%), federal government employees (17 | 31.5%), and private company employees (9 | 16.7%) make up the most common classes of employment.
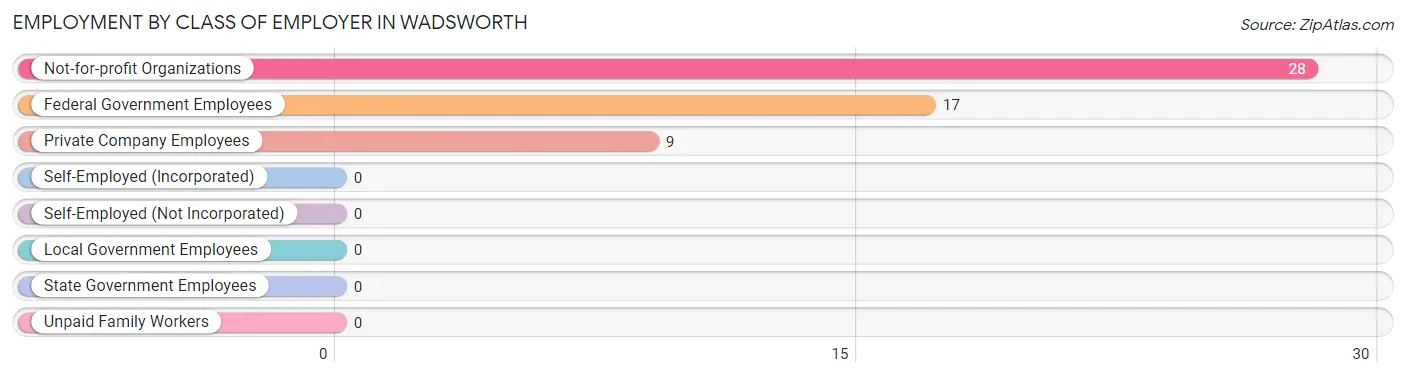
| Employer Class | # Employees | % Employees |
| Private Company Employees | 9 | 16.7% |
| Self-Employed (Incorporated) | 0 | 0.0% |
| Self-Employed (Not Incorporated) | 0 | 0.0% |
| Not-for-profit Organizations | 28 | 51.8% |
| Local Government Employees | 0 | 0.0% |
| State Government Employees | 0 | 0.0% |
| Federal Government Employees | 17 | 31.5% |
| Unpaid Family Workers | 0 | 0.0% |
| Total | 54 | 100.0% |
Employment Status by Age in Wadsworth
According to the labor force statistics for Wadsworth, out of the total population over 16 years of age (96), 78.1% or 75 individuals are in the labor force, with 28.0% or 21 of them unemployed. The age group with the highest labor force participation rate is 25 to 29 years, with 100.0% or 21 individuals in the labor force. Within the labor force, the 25 to 29 years age range has the highest percentage of unemployed individuals, with 100.0% or 21 of them being unemployed.
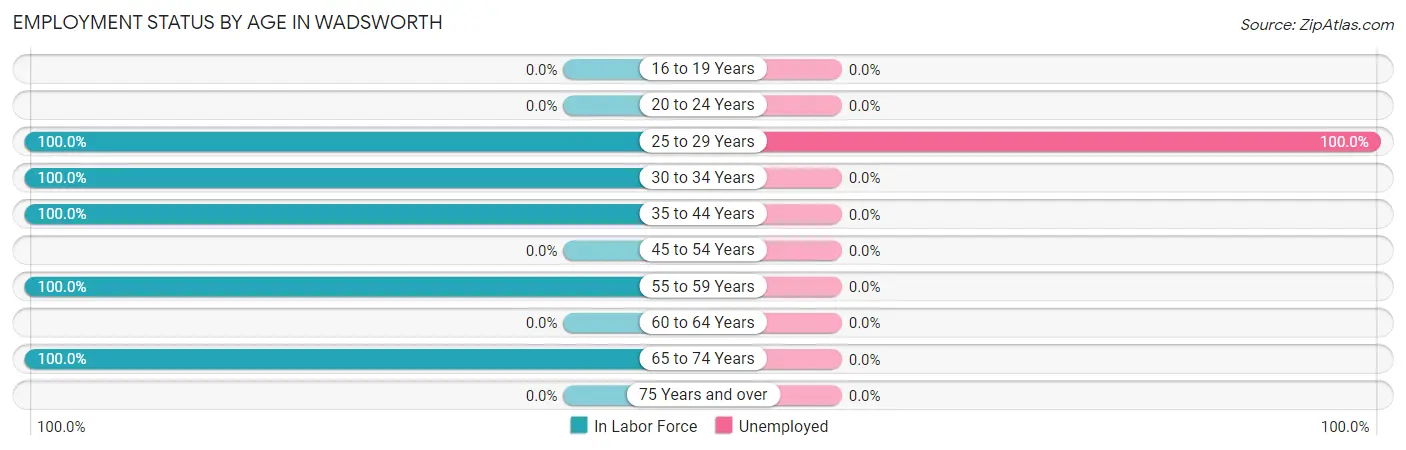
| Age Bracket | In Labor Force | Unemployed |
| 16 to 19 Years | 0 (0.0%) | 0 (0.0%) |
| 20 to 24 Years | 0 (0.0%) | 0 (0.0%) |
| 25 to 29 Years | 21 (100.0%) | 21 (100.0%) |
| 30 to 34 Years | 28 (100.0%) | 0 (0.0%) |
| 35 to 44 Years | 9 (100.0%) | 0 (0.0%) |
| 45 to 54 Years | 0 (0.0%) | 0 (0.0%) |
| 55 to 59 Years | 9 (100.0%) | 0 (0.0%) |
| 60 to 64 Years | 0 (0.0%) | 0 (0.0%) |
| 65 to 74 Years | 8 (100.0%) | 0 (0.0%) |
| 75 Years and over | 0 (0.0%) | 0 (0.0%) |
| Total | 75 (78.1%) | 21 (28.0%) |
Employment Status by Educational Attainment in Wadsworth
According to labor force statistics for Wadsworth, 84.8% of individuals (67) out of the total population between 25 and 64 years of age (79) are in the labor force, with 31.3% or 21 of them being unemployed. The group with the highest labor force participation rate are those with the educational attainment of high school diploma, with 100.0% or 30 individuals in the labor force. Within the labor force, individuals with high school diploma education have the highest percentage of unemployment, with 70.0% or 21 of them being unemployed.
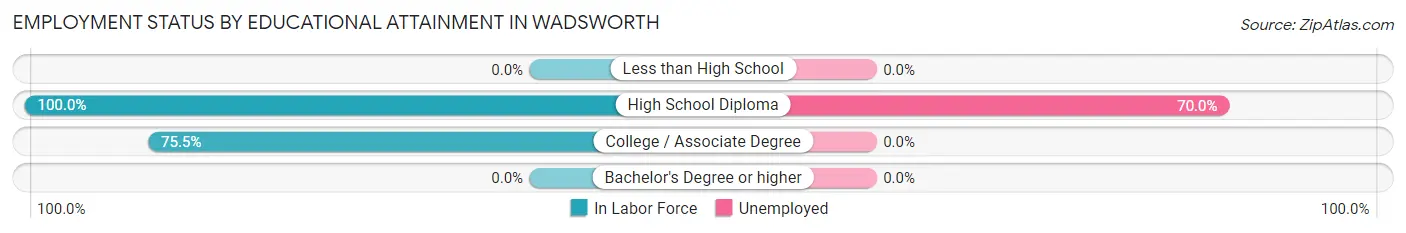
| Educational Attainment | In Labor Force | Unemployed |
| Less than High School | 0 (0.0%) | 0 (0.0%) |
| High School Diploma | 30 (100.0%) | 21 (70.0%) |
| College / Associate Degree | 37 (75.5%) | 0 (0.0%) |
| Bachelor's Degree or higher | 0 (0.0%) | 0 (0.0%) |
| Total | 67 (84.8%) | 25 (31.3%) |
Employment Occupations by Sex in Wadsworth
Management, Business, Science and Arts Occupations
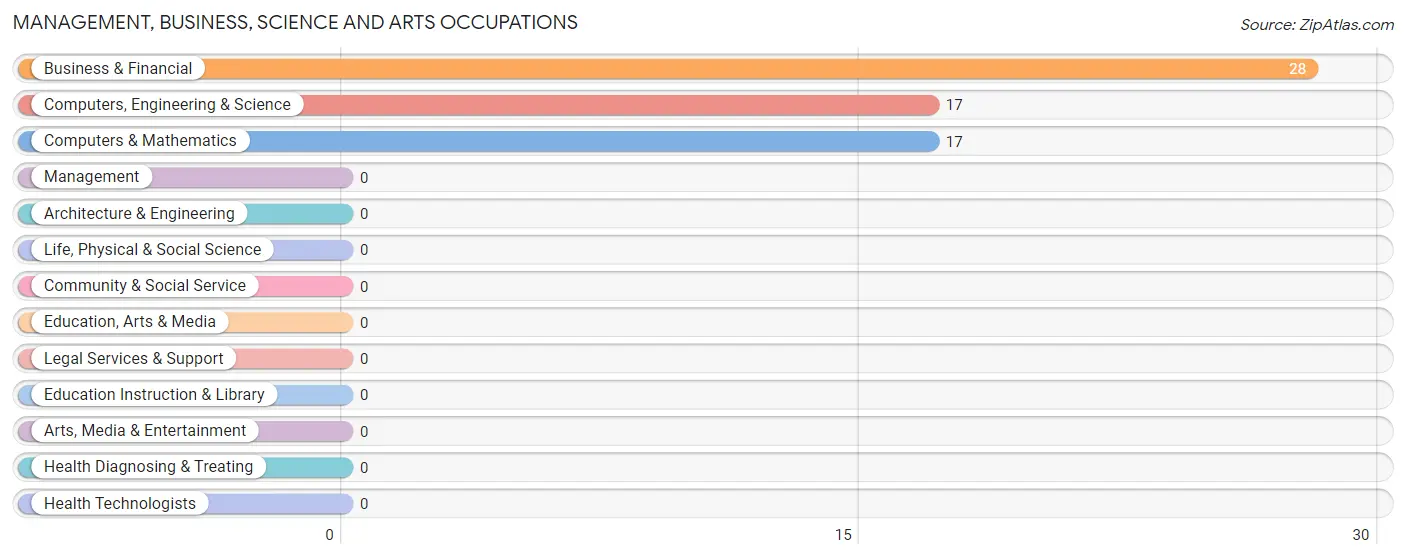
The most common Management, Business, Science and Arts occupations in Wadsworth are Business & Financial (28 | 51.8%), Computers, Engineering & Science (17 | 31.5%), and Computers & Mathematics (17 | 31.5%).
Management, Business, Science and Arts Occupations by Sex
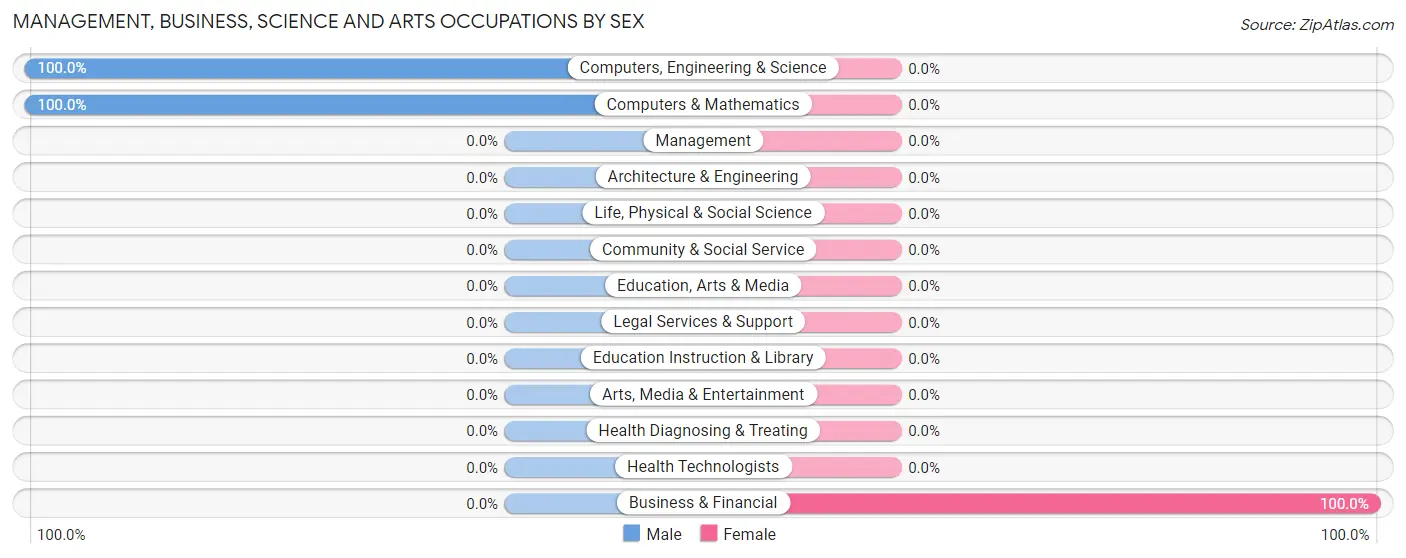
| Occupation | Male | Female |
| Management | 0 (0.0%) | 0 (0.0%) |
| Business & Financial | 0 (0.0%) | 28 (100.0%) |
| Computers, Engineering & Science | 17 (100.0%) | 0 (0.0%) |
| Computers & Mathematics | 17 (100.0%) | 0 (0.0%) |
| Architecture & Engineering | 0 (0.0%) | 0 (0.0%) |
| Life, Physical & Social Science | 0 (0.0%) | 0 (0.0%) |
| Community & Social Service | 0 (0.0%) | 0 (0.0%) |
| Education, Arts & Media | 0 (0.0%) | 0 (0.0%) |
| Legal Services & Support | 0 (0.0%) | 0 (0.0%) |
| Education Instruction & Library | 0 (0.0%) | 0 (0.0%) |
| Arts, Media & Entertainment | 0 (0.0%) | 0 (0.0%) |
| Health Diagnosing & Treating | 0 (0.0%) | 0 (0.0%) |
| Health Technologists | 0 (0.0%) | 0 (0.0%) |
| Total (Category) | 17 (37.8%) | 28 (62.2%) |
| Total (Overall) | 17 (31.5%) | 37 (68.5%) |
Services Occupations
Services Occupations by Sex
| Occupation | Male | Female |
| Healthcare Support | 0 (0.0%) | 0 (0.0%) |
| Security & Protection | 0 (0.0%) | 0 (0.0%) |
| Firefighting & Prevention | 0 (0.0%) | 0 (0.0%) |
| Law Enforcement | 0 (0.0%) | 0 (0.0%) |
| Food Preparation & Serving | 0 (0.0%) | 0 (0.0%) |
| Cleaning & Maintenance | 0 (0.0%) | 0 (0.0%) |
| Personal Care & Service | 0 (0.0%) | 0 (0.0%) |
| Total (Category) | 0 (0.0%) | 0 (0.0%) |
| Total (Overall) | 17 (31.5%) | 37 (68.5%) |
Sales and Office Occupations
The most common Sales and Office occupations in Wadsworth are , and Office & Administration (9 | 16.7%).
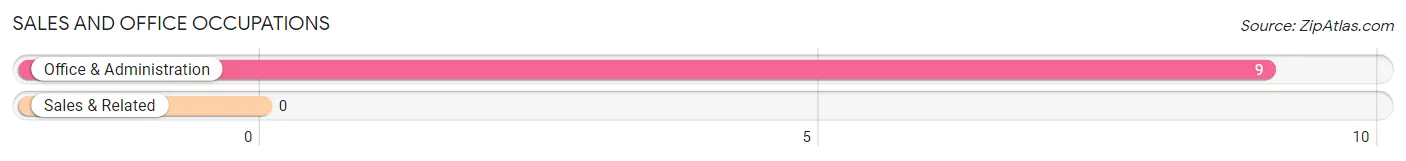
Sales and Office Occupations by Sex
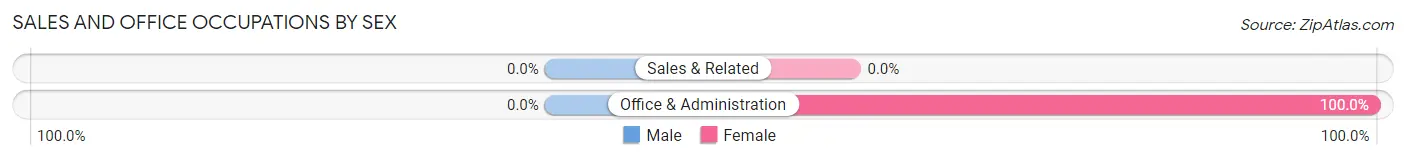
| Occupation | Male | Female |
| Sales & Related | 0 (0.0%) | 0 (0.0%) |
| Office & Administration | 0 (0.0%) | 9 (100.0%) |
| Total (Category) | 0 (0.0%) | 9 (100.0%) |
| Total (Overall) | 17 (31.5%) | 37 (68.5%) |
Natural Resources, Construction and Maintenance Occupations
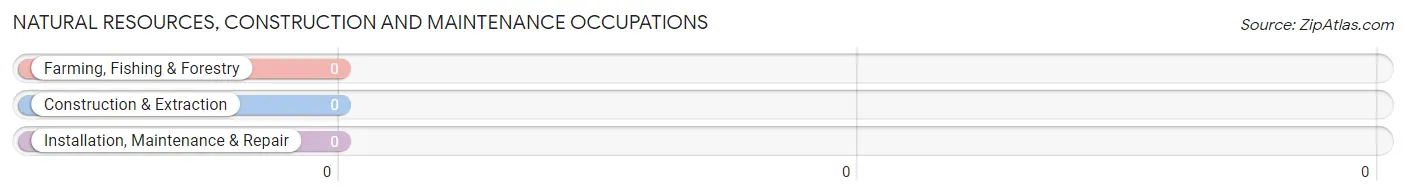
Natural Resources, Construction and Maintenance Occupations by Sex
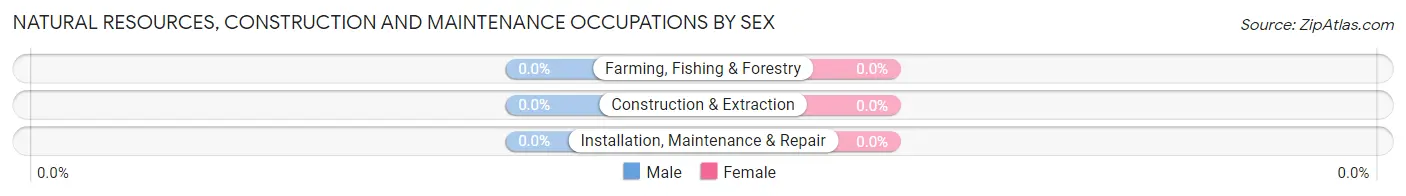
| Occupation | Male | Female |
| Farming, Fishing & Forestry | 0 (0.0%) | 0 (0.0%) |
| Construction & Extraction | 0 (0.0%) | 0 (0.0%) |
| Installation, Maintenance & Repair | 0 (0.0%) | 0 (0.0%) |
| Total (Category) | 0 (0.0%) | 0 (0.0%) |
| Total (Overall) | 17 (31.5%) | 37 (68.5%) |
Production, Transportation and Moving Occupations
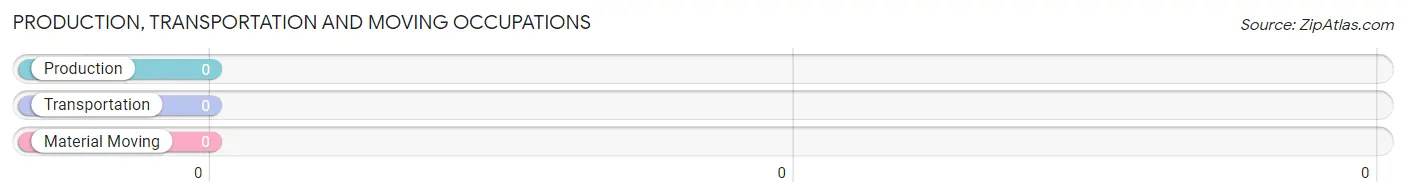
Production, Transportation and Moving Occupations by Sex
| Occupation | Male | Female |
| Production | 0 (0.0%) | 0 (0.0%) |
| Transportation | 0 (0.0%) | 0 (0.0%) |
| Material Moving | 0 (0.0%) | 0 (0.0%) |
| Total (Category) | 0 (0.0%) | 0 (0.0%) |
| Total (Overall) | 17 (31.5%) | 37 (68.5%) |
Employment Industries by Sex in Wadsworth
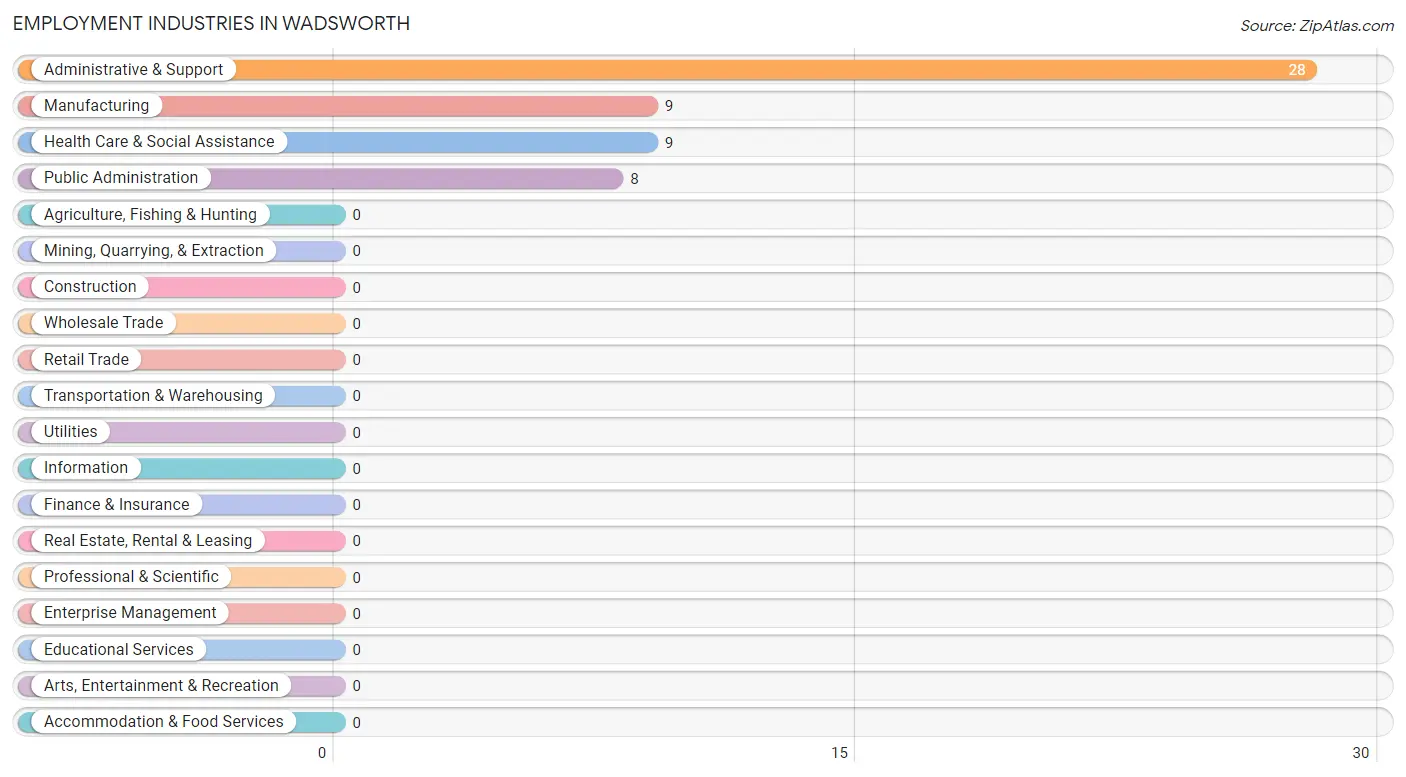
Employment Industries in Wadsworth
The major employment industries in Wadsworth include Administrative & Support (28 | 51.8%), Manufacturing (9 | 16.7%), Health Care & Social Assistance (9 | 16.7%), and Public Administration (8 | 14.8%).
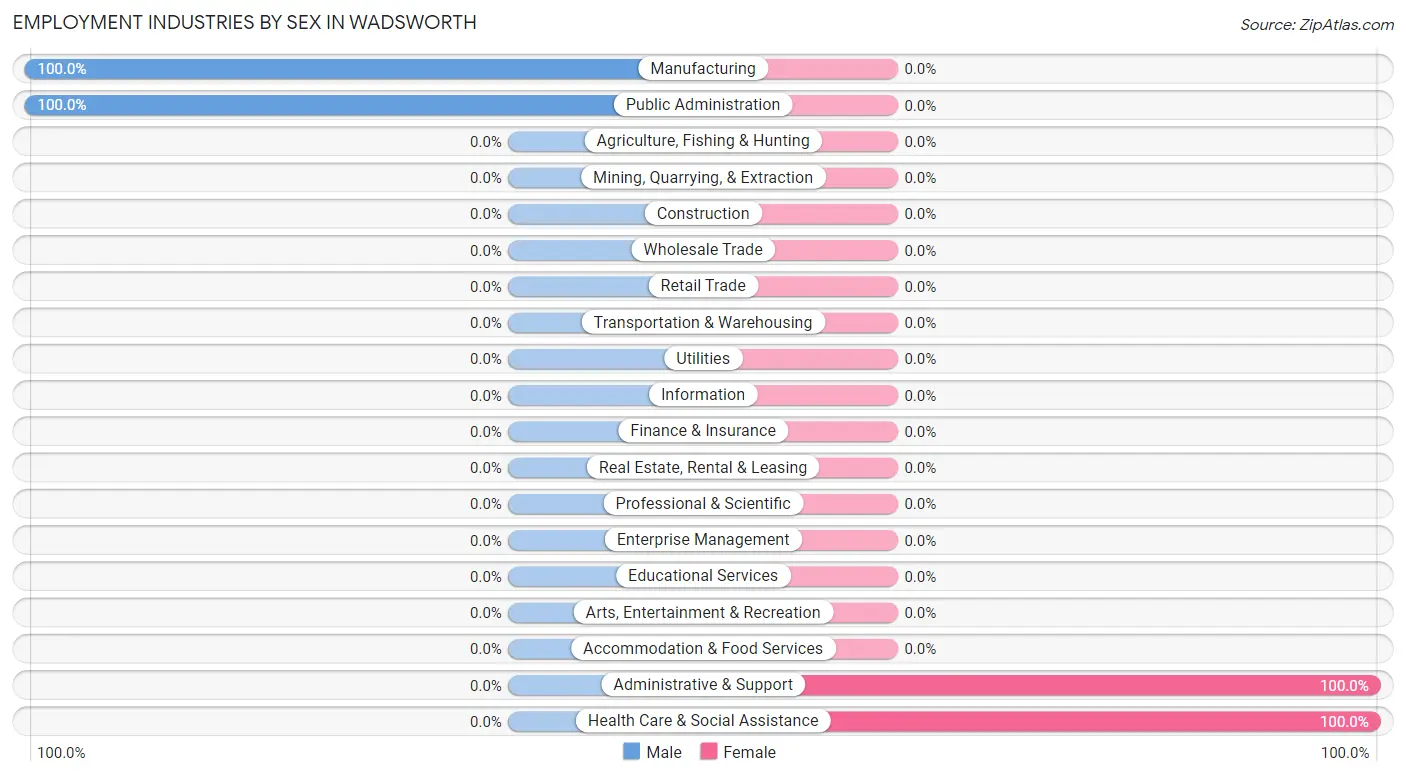
Employment Industries by Sex in Wadsworth
The Wadsworth industries that see more men than women are Manufacturing (100.0%), and Public Administration (100.0%), whereas the industries that tend to have a higher number of women are Administrative & Support (100.0%), and Health Care & Social Assistance (100.0%).
| Industry | Male | Female |
| Agriculture, Fishing & Hunting | 0 (0.0%) | 0 (0.0%) |
| Mining, Quarrying, & Extraction | 0 (0.0%) | 0 (0.0%) |
| Construction | 0 (0.0%) | 0 (0.0%) |
| Manufacturing | 9 (100.0%) | 0 (0.0%) |
| Wholesale Trade | 0 (0.0%) | 0 (0.0%) |
| Retail Trade | 0 (0.0%) | 0 (0.0%) |
| Transportation & Warehousing | 0 (0.0%) | 0 (0.0%) |
| Utilities | 0 (0.0%) | 0 (0.0%) |
| Information | 0 (0.0%) | 0 (0.0%) |
| Finance & Insurance | 0 (0.0%) | 0 (0.0%) |
| Real Estate, Rental & Leasing | 0 (0.0%) | 0 (0.0%) |
| Professional & Scientific | 0 (0.0%) | 0 (0.0%) |
| Enterprise Management | 0 (0.0%) | 0 (0.0%) |
| Administrative & Support | 0 (0.0%) | 28 (100.0%) |
| Educational Services | 0 (0.0%) | 0 (0.0%) |
| Health Care & Social Assistance | 0 (0.0%) | 9 (100.0%) |
| Arts, Entertainment & Recreation | 0 (0.0%) | 0 (0.0%) |
| Accommodation & Food Services | 0 (0.0%) | 0 (0.0%) |
| Public Administration | 8 (100.0%) | 0 (0.0%) |
| Total | 17 (31.5%) | 37 (68.5%) |
Education in Wadsworth
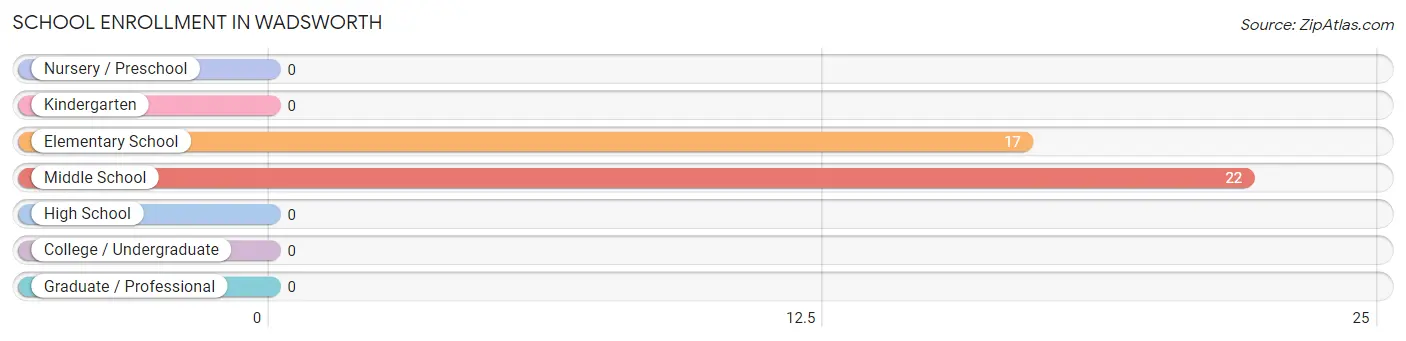
School Enrollment in Wadsworth
The most common levels of schooling among the 39 students in Wadsworth are middle school (22 | 56.4%), and elementary school (17 | 43.6%).
| School Level | # Students | % Students |
| Nursery / Preschool | 0 | 0.0% |
| Kindergarten | 0 | 0.0% |
| Elementary School | 17 | 43.6% |
| Middle School | 22 | 56.4% |
| High School | 0 | 0.0% |
| College / Undergraduate | 0 | 0.0% |
| Graduate / Professional | 0 | 0.0% |
| Total | 39 | 100.0% |
School Enrollment by Age by Funding Source in Wadsworth
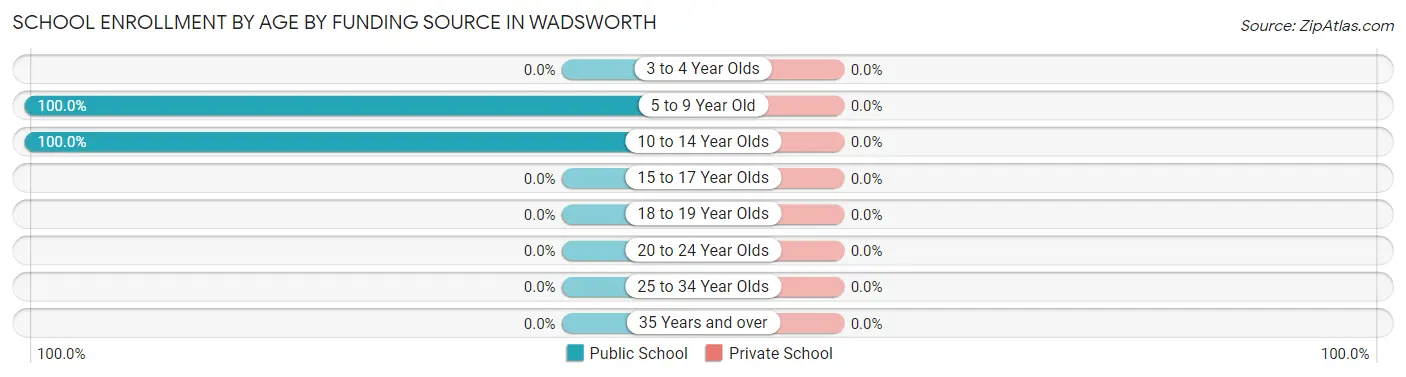
| Age Bracket | Public School | Private School |
| 3 to 4 Year Olds | 0 (0.0%) | 0 (0.0%) |
| 5 to 9 Year Old | 17 (100.0%) | 0 (0.0%) |
| 10 to 14 Year Olds | 22 (100.0%) | 0 (0.0%) |
| 15 to 17 Year Olds | 0 (0.0%) | 0 (0.0%) |
| 18 to 19 Year Olds | 0 (0.0%) | 0 (0.0%) |
| 20 to 24 Year Olds | 0 (0.0%) | 0 (0.0%) |
| 25 to 34 Year Olds | 0 (0.0%) | 0 (0.0%) |
| 35 Years and over | 0 (0.0%) | 0 (0.0%) |
| Total | 39 (100.0%) | 0 (0.0%) |
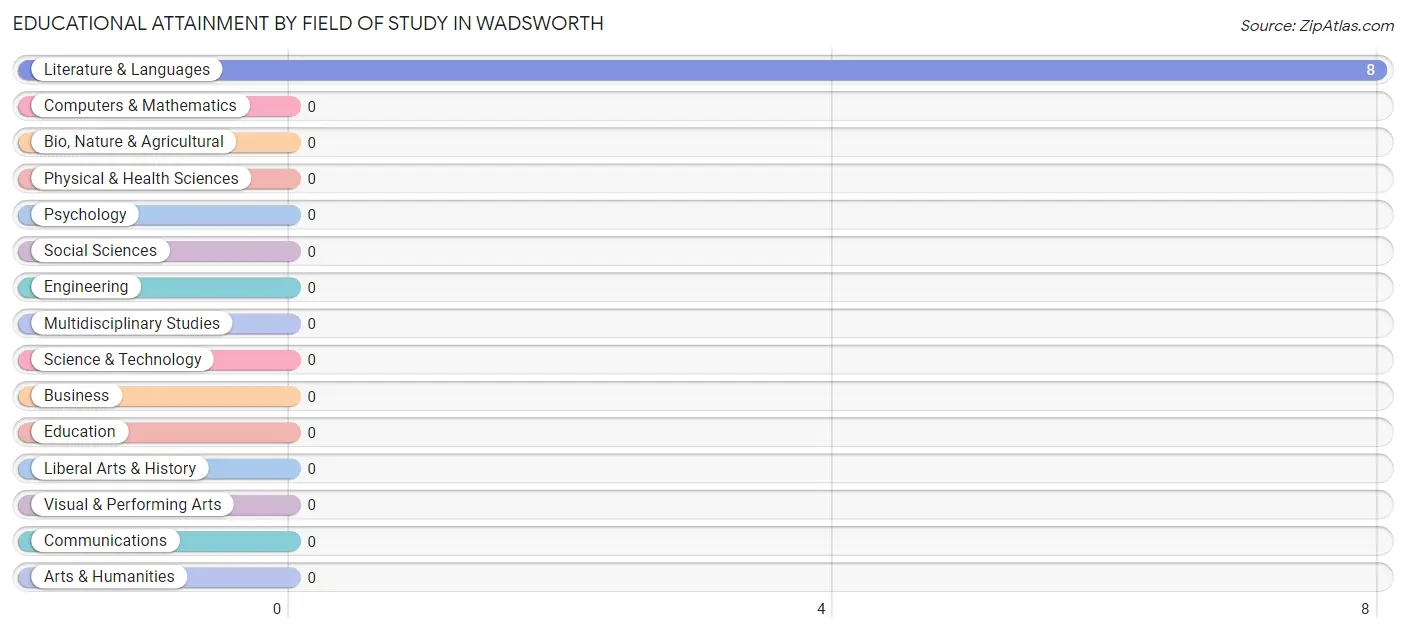
Educational Attainment by Field of Study in Wadsworth
, and literature & languages (8 | 100.0%) are the most common fields of study among 8 individuals in Wadsworth who have obtained a bachelor's degree or higher.
| Field of Study | # Graduates | % Graduates |
| Computers & Mathematics | 0 | 0.0% |
| Bio, Nature & Agricultural | 0 | 0.0% |
| Physical & Health Sciences | 0 | 0.0% |
| Psychology | 0 | 0.0% |
| Social Sciences | 0 | 0.0% |
| Engineering | 0 | 0.0% |
| Multidisciplinary Studies | 0 | 0.0% |
| Science & Technology | 0 | 0.0% |
| Business | 0 | 0.0% |
| Education | 0 | 0.0% |
| Literature & Languages | 8 | 100.0% |
| Liberal Arts & History | 0 | 0.0% |
| Visual & Performing Arts | 0 | 0.0% |
| Communications | 0 | 0.0% |
| Arts & Humanities | 0 | 0.0% |
| Total | 8 | 100.0% |
Transportation & Commute in Wadsworth
Vehicle Availability by Sex in Wadsworth
The most prevalent vehicle ownership categories in Wadsworth are males with 1 vehicle (9, accounting for 52.9%) and females with 1 vehicle (0, making up 24.3%).
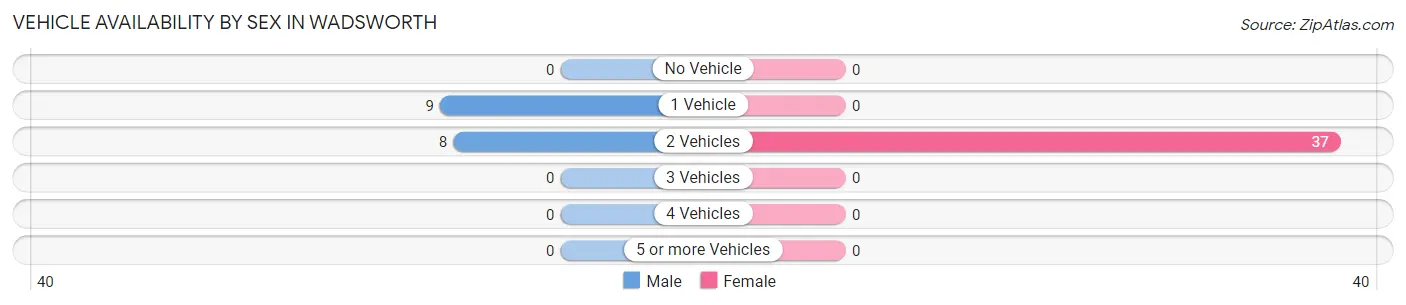
| Vehicles Available | Male | Female |
| No Vehicle | 0 (0.0%) | 0 (0.0%) |
| 1 Vehicle | 9 (52.9%) | 0 (0.0%) |
| 2 Vehicles | 8 (47.1%) | 37 (100.0%) |
| 3 Vehicles | 0 (0.0%) | 0 (0.0%) |
| 4 Vehicles | 0 (0.0%) | 0 (0.0%) |
| 5 or more Vehicles | 0 (0.0%) | 0 (0.0%) |
| Total | 17 (100.0%) | 37 (100.0%) |
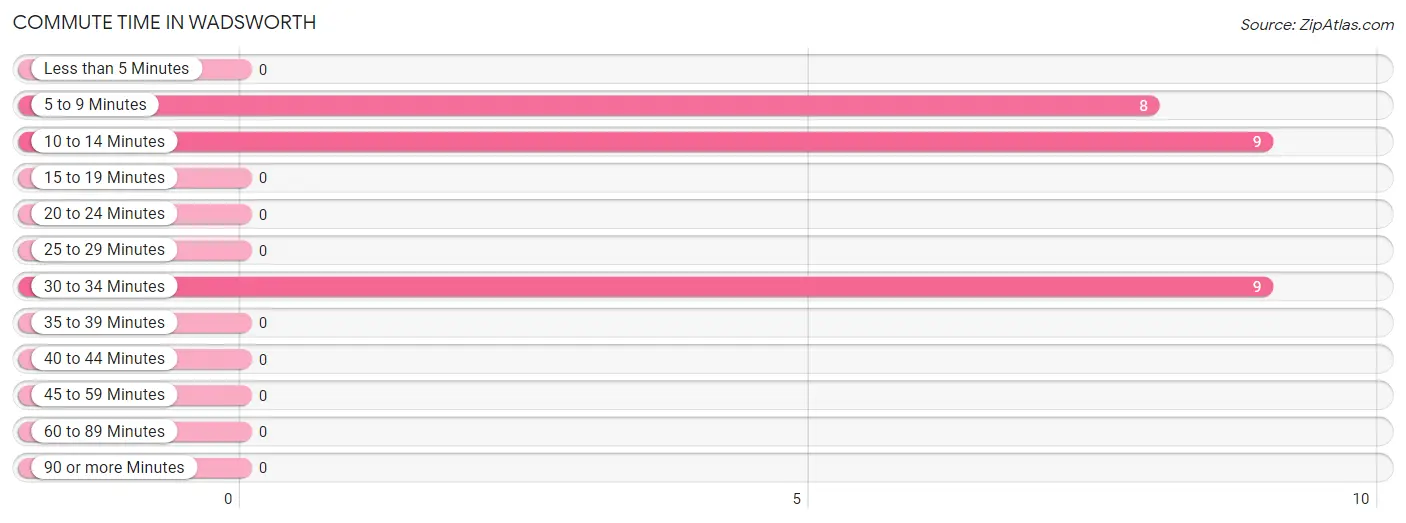
Commute Time in Wadsworth
The most frequently occuring commute durations in Wadsworth are 10 to 14 minutes (9 commuters, 34.6%), 30 to 34 minutes (9 commuters, 34.6%), and 5 to 9 minutes (8 commuters, 30.8%).
| Commute Time | # Commuters | % Commuters |
| Less than 5 Minutes | 0 | 0.0% |
| 5 to 9 Minutes | 8 | 30.8% |
| 10 to 14 Minutes | 9 | 34.6% |
| 15 to 19 Minutes | 0 | 0.0% |
| 20 to 24 Minutes | 0 | 0.0% |
| 25 to 29 Minutes | 0 | 0.0% |
| 30 to 34 Minutes | 9 | 34.6% |
| 35 to 39 Minutes | 0 | 0.0% |
| 40 to 44 Minutes | 0 | 0.0% |
| 45 to 59 Minutes | 0 | 0.0% |
| 60 to 89 Minutes | 0 | 0.0% |
| 90 or more Minutes | 0 | 0.0% |
Commute Time by Sex in Wadsworth
The most common commute times in Wadsworth are 30 to 34 minutes (9 commuters, 52.9%) for males and 10 to 14 minutes (9 commuters, 100.0%) for females.
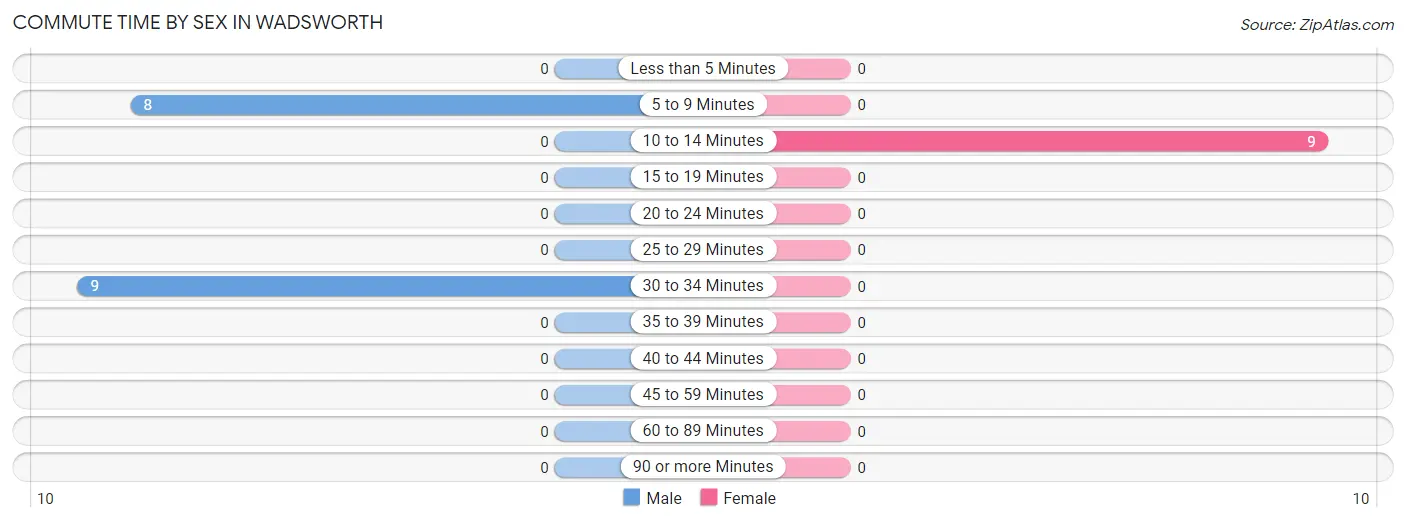
| Commute Time | Male | Female |
| Less than 5 Minutes | 0 (0.0%) | 0 (0.0%) |
| 5 to 9 Minutes | 8 (47.1%) | 0 (0.0%) |
| 10 to 14 Minutes | 0 (0.0%) | 9 (100.0%) |
| 15 to 19 Minutes | 0 (0.0%) | 0 (0.0%) |
| 20 to 24 Minutes | 0 (0.0%) | 0 (0.0%) |
| 25 to 29 Minutes | 0 (0.0%) | 0 (0.0%) |
| 30 to 34 Minutes | 9 (52.9%) | 0 (0.0%) |
| 35 to 39 Minutes | 0 (0.0%) | 0 (0.0%) |
| 40 to 44 Minutes | 0 (0.0%) | 0 (0.0%) |
| 45 to 59 Minutes | 0 (0.0%) | 0 (0.0%) |
| 60 to 89 Minutes | 0 (0.0%) | 0 (0.0%) |
| 90 or more Minutes | 0 (0.0%) | 0 (0.0%) |
Time of Departure to Work by Sex in Wadsworth
The most frequent times of departure to work in Wadsworth are 7:00 AM to 7:29 AM (9, 52.9%) for males and 11:00 AM to 11:59 AM (9, 100.0%) for females.
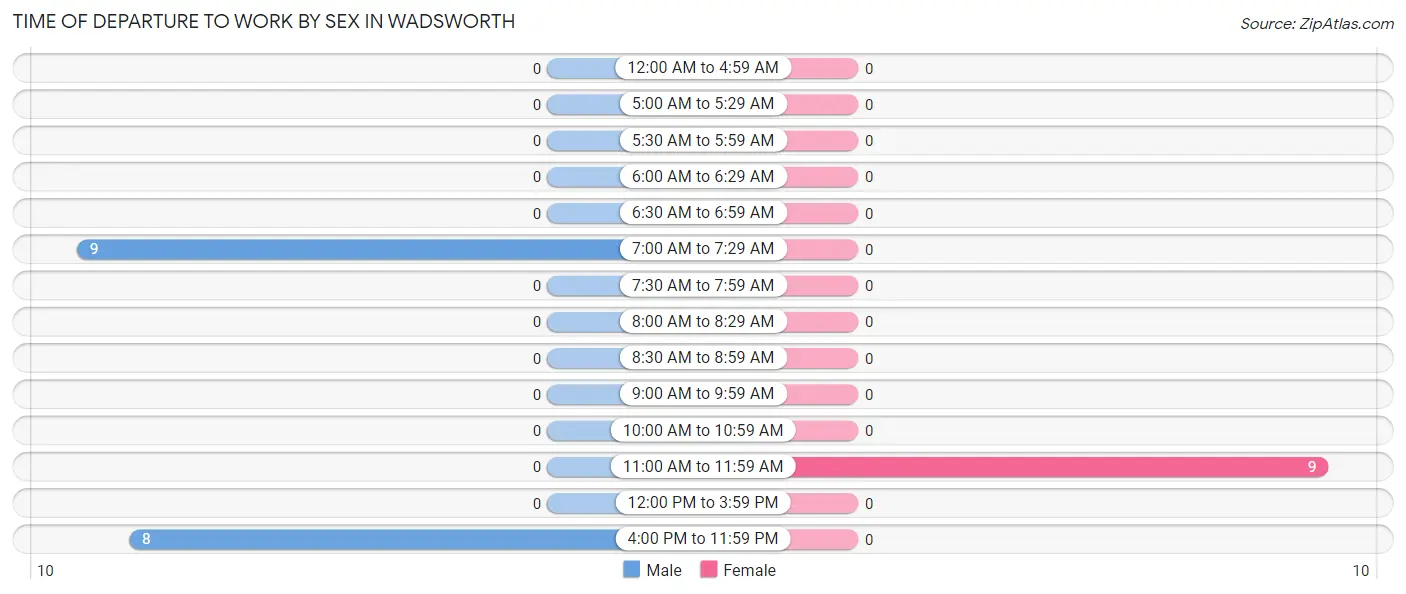
| Time of Departure | Male | Female |
| 12:00 AM to 4:59 AM | 0 (0.0%) | 0 (0.0%) |
| 5:00 AM to 5:29 AM | 0 (0.0%) | 0 (0.0%) |
| 5:30 AM to 5:59 AM | 0 (0.0%) | 0 (0.0%) |
| 6:00 AM to 6:29 AM | 0 (0.0%) | 0 (0.0%) |
| 6:30 AM to 6:59 AM | 0 (0.0%) | 0 (0.0%) |
| 7:00 AM to 7:29 AM | 9 (52.9%) | 0 (0.0%) |
| 7:30 AM to 7:59 AM | 0 (0.0%) | 0 (0.0%) |
| 8:00 AM to 8:29 AM | 0 (0.0%) | 0 (0.0%) |
| 8:30 AM to 8:59 AM | 0 (0.0%) | 0 (0.0%) |
| 9:00 AM to 9:59 AM | 0 (0.0%) | 0 (0.0%) |
| 10:00 AM to 10:59 AM | 0 (0.0%) | 0 (0.0%) |
| 11:00 AM to 11:59 AM | 0 (0.0%) | 9 (100.0%) |
| 12:00 PM to 3:59 PM | 0 (0.0%) | 0 (0.0%) |
| 4:00 PM to 11:59 PM | 8 (47.1%) | 0 (0.0%) |
| Total | 17 (100.0%) | 9 (100.0%) |
Housing Occupancy in Wadsworth
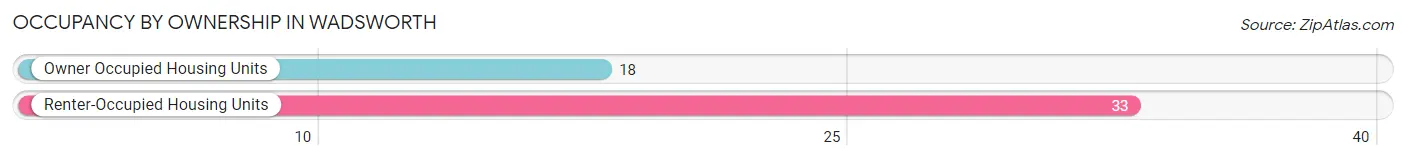
Occupancy by Ownership in Wadsworth
Of the total 51 dwellings in Wadsworth, owner-occupied units account for 18 (35.3%), while renter-occupied units make up 33 (64.7%).
| Occupancy | # Housing Units | % Housing Units |
| Owner Occupied Housing Units | 18 | 35.3% |
| Renter-Occupied Housing Units | 33 | 64.7% |
| Total Occupied Housing Units | 51 | 100.0% |
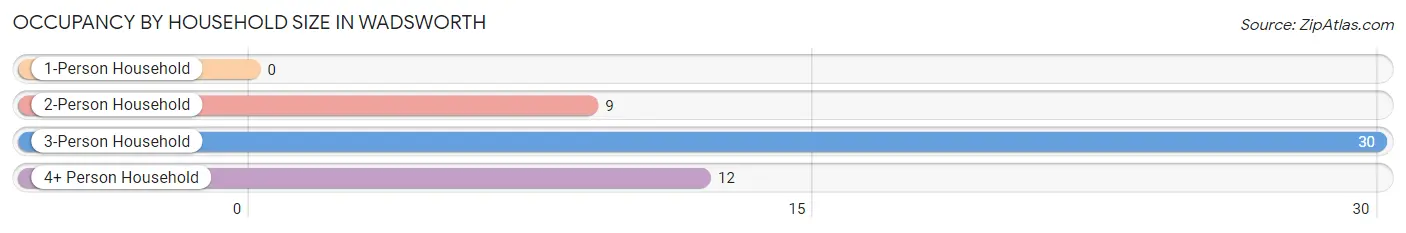
Occupancy by Household Size in Wadsworth
| Household Size | # Housing Units | % Housing Units |
| 1-Person Household | 0 | 0.0% |
| 2-Person Household | 9 | 17.6% |
| 3-Person Household | 30 | 58.8% |
| 4+ Person Household | 12 | 23.5% |
| Total Housing Units | 51 | 100.0% |
Occupancy by Ownership by Household Size in Wadsworth
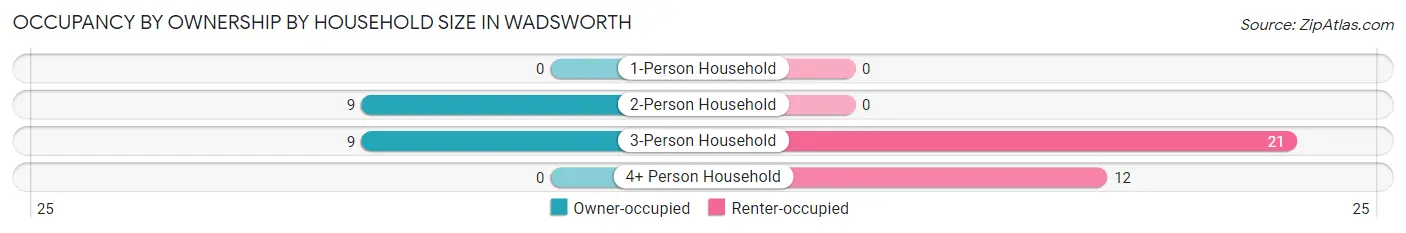
| Household Size | Owner-occupied | Renter-occupied |
| 1-Person Household | 0 (0.0%) | 0 (0.0%) |
| 2-Person Household | 9 (100.0%) | 0 (0.0%) |
| 3-Person Household | 9 (30.0%) | 21 (70.0%) |
| 4+ Person Household | 0 (0.0%) | 12 (100.0%) |
| Total Housing Units | 18 (35.3%) | 33 (64.7%) |
Occupancy by Educational Attainment in Wadsworth
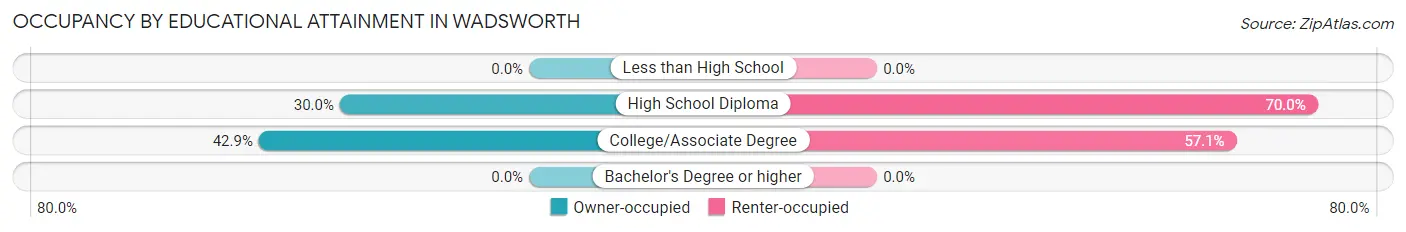
| Household Size | Owner-occupied | Renter-occupied |
| Less than High School | 0 (0.0%) | 0 (0.0%) |
| High School Diploma | 9 (30.0%) | 21 (70.0%) |
| College/Associate Degree | 9 (42.9%) | 12 (57.1%) |
| Bachelor's Degree or higher | 0 (0.0%) | 0 (0.0%) |
Occupancy by Age of Householder in Wadsworth
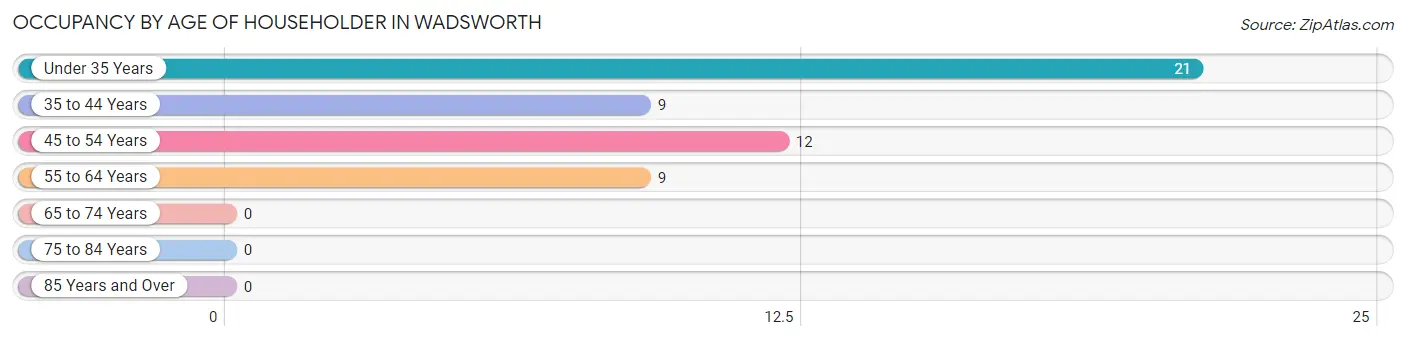
| Age Bracket | # Households | % Households |
| Under 35 Years | 21 | 41.2% |
| 35 to 44 Years | 9 | 17.6% |
| 45 to 54 Years | 12 | 23.5% |
| 55 to 64 Years | 9 | 17.6% |
| 65 to 74 Years | 0 | 0.0% |
| 75 to 84 Years | 0 | 0.0% |
| 85 Years and Over | 0 | 0.0% |
| Total | 51 | 100.0% |
Housing Finances in Wadsworth
Median Income by Occupancy in Wadsworth
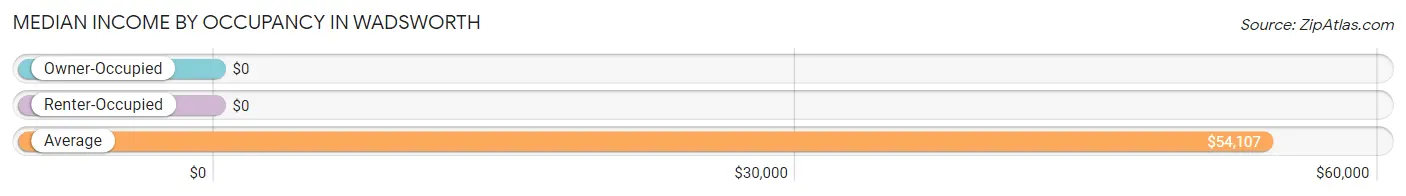
| Occupancy Type | # Households | Median Income |
| Owner-Occupied | 18 (35.3%) | $0 |
| Renter-Occupied | 33 (64.7%) | $0 |
| Average | 51 (100.0%) | $54,107 |
Occupancy by Householder Income Bracket in Wadsworth
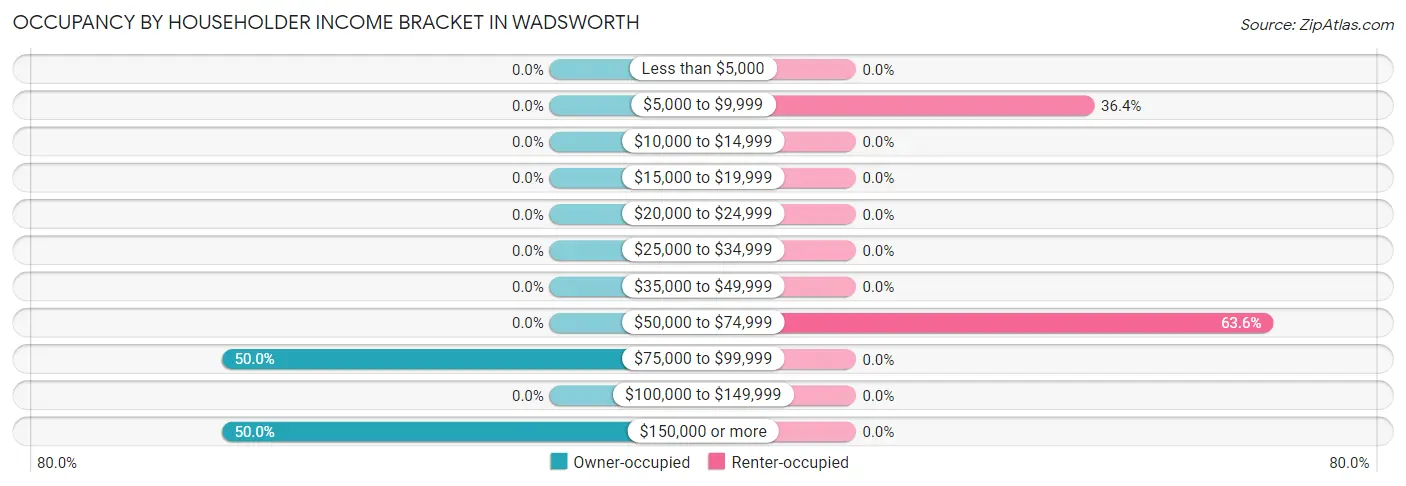
| Income Bracket | Owner-occupied | Renter-occupied |
| Less than $5,000 | 0 (0.0%) | 0 (0.0%) |
| $5,000 to $9,999 | 0 (0.0%) | 12 (36.4%) |
| $10,000 to $14,999 | 0 (0.0%) | 0 (0.0%) |
| $15,000 to $19,999 | 0 (0.0%) | 0 (0.0%) |
| $20,000 to $24,999 | 0 (0.0%) | 0 (0.0%) |
| $25,000 to $34,999 | 0 (0.0%) | 0 (0.0%) |
| $35,000 to $49,999 | 0 (0.0%) | 0 (0.0%) |
| $50,000 to $74,999 | 0 (0.0%) | 21 (63.6%) |
| $75,000 to $99,999 | 9 (50.0%) | 0 (0.0%) |
| $100,000 to $149,999 | 0 (0.0%) | 0 (0.0%) |
| $150,000 or more | 9 (50.0%) | 0 (0.0%) |
| Total | 18 (100.0%) | 33 (100.0%) |
Monthly Housing Cost Tiers in Wadsworth
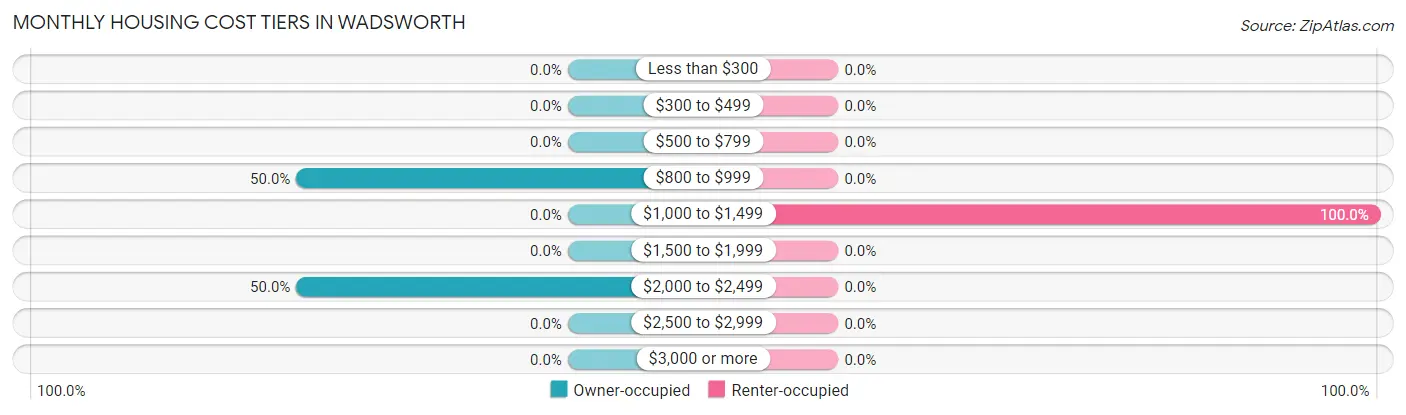
| Monthly Cost | Owner-occupied | Renter-occupied |
| Less than $300 | 0 (0.0%) | 0 (0.0%) |
| $300 to $499 | 0 (0.0%) | 0 (0.0%) |
| $500 to $799 | 0 (0.0%) | 0 (0.0%) |
| $800 to $999 | 9 (50.0%) | 0 (0.0%) |
| $1,000 to $1,499 | 0 (0.0%) | 33 (100.0%) |
| $1,500 to $1,999 | 0 (0.0%) | 0 (0.0%) |
| $2,000 to $2,499 | 9 (50.0%) | 0 (0.0%) |
| $2,500 to $2,999 | 0 (0.0%) | 0 (0.0%) |
| $3,000 or more | 0 (0.0%) | 0 (0.0%) |
| Total | 18 (100.0%) | 33 (100.0%) |
Physical Housing Characteristics in Wadsworth
Housing Structures in Wadsworth
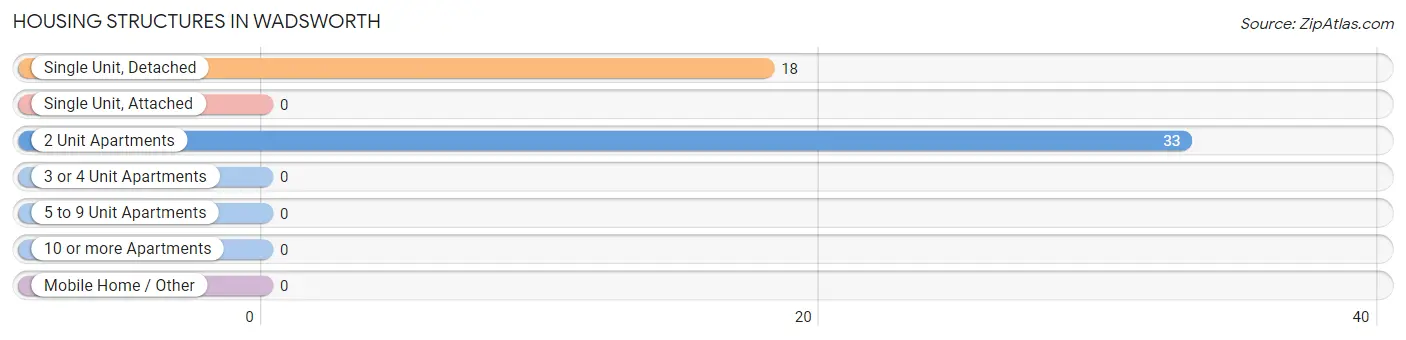
| Structure Type | # Housing Units | % Housing Units |
| Single Unit, Detached | 18 | 35.3% |
| Single Unit, Attached | 0 | 0.0% |
| 2 Unit Apartments | 33 | 64.7% |
| 3 or 4 Unit Apartments | 0 | 0.0% |
| 5 to 9 Unit Apartments | 0 | 0.0% |
| 10 or more Apartments | 0 | 0.0% |
| Mobile Home / Other | 0 | 0.0% |
| Total | 51 | 100.0% |
Housing Structures by Occupancy in Wadsworth
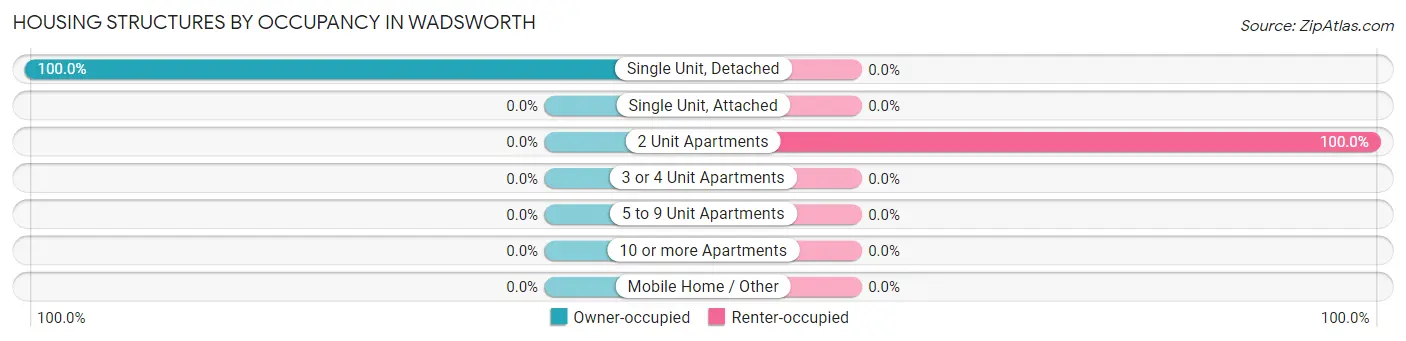
| Structure Type | Owner-occupied | Renter-occupied |
| Single Unit, Detached | 18 (100.0%) | 0 (0.0%) |
| Single Unit, Attached | 0 (0.0%) | 0 (0.0%) |
| 2 Unit Apartments | 0 (0.0%) | 33 (100.0%) |
| 3 or 4 Unit Apartments | 0 (0.0%) | 0 (0.0%) |
| 5 to 9 Unit Apartments | 0 (0.0%) | 0 (0.0%) |
| 10 or more Apartments | 0 (0.0%) | 0 (0.0%) |
| Mobile Home / Other | 0 (0.0%) | 0 (0.0%) |
| Total | 18 (35.3%) | 33 (64.7%) |
Housing Structures by Number of Rooms in Wadsworth
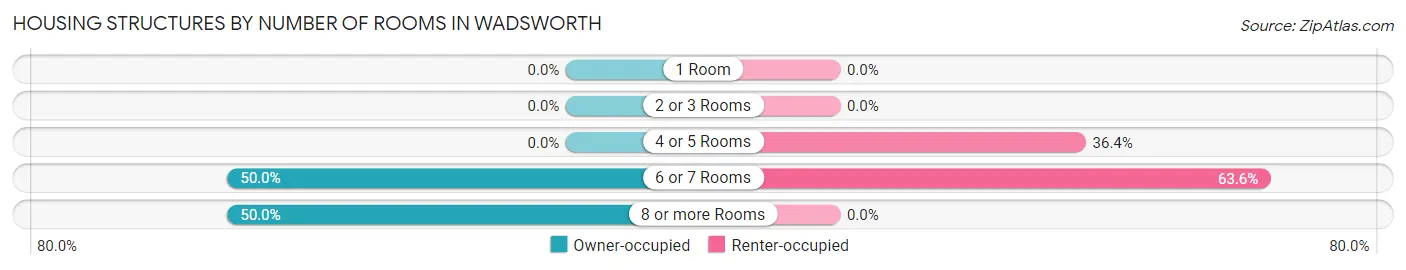
| Number of Rooms | Owner-occupied | Renter-occupied |
| 1 Room | 0 (0.0%) | 0 (0.0%) |
| 2 or 3 Rooms | 0 (0.0%) | 0 (0.0%) |
| 4 or 5 Rooms | 0 (0.0%) | 12 (36.4%) |
| 6 or 7 Rooms | 9 (50.0%) | 21 (63.6%) |
| 8 or more Rooms | 9 (50.0%) | 0 (0.0%) |
| Total | 18 (100.0%) | 33 (100.0%) |
Housing Structure by Heating Type in Wadsworth
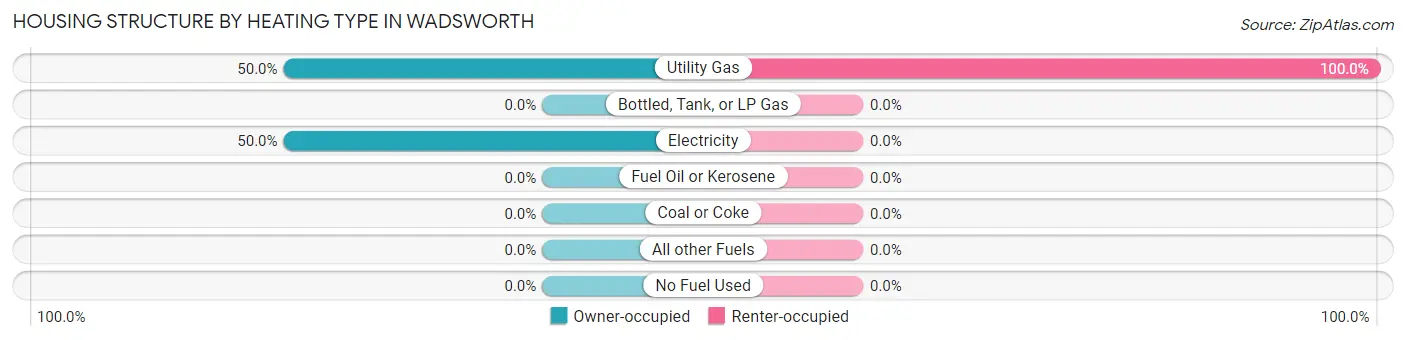
| Heating Type | Owner-occupied | Renter-occupied |
| Utility Gas | 9 (50.0%) | 33 (100.0%) |
| Bottled, Tank, or LP Gas | 0 (0.0%) | 0 (0.0%) |
| Electricity | 9 (50.0%) | 0 (0.0%) |
| Fuel Oil or Kerosene | 0 (0.0%) | 0 (0.0%) |
| Coal or Coke | 0 (0.0%) | 0 (0.0%) |
| All other Fuels | 0 (0.0%) | 0 (0.0%) |
| No Fuel Used | 0 (0.0%) | 0 (0.0%) |
| Total | 18 (100.0%) | 33 (100.0%) |
Household Vehicle Usage in Wadsworth
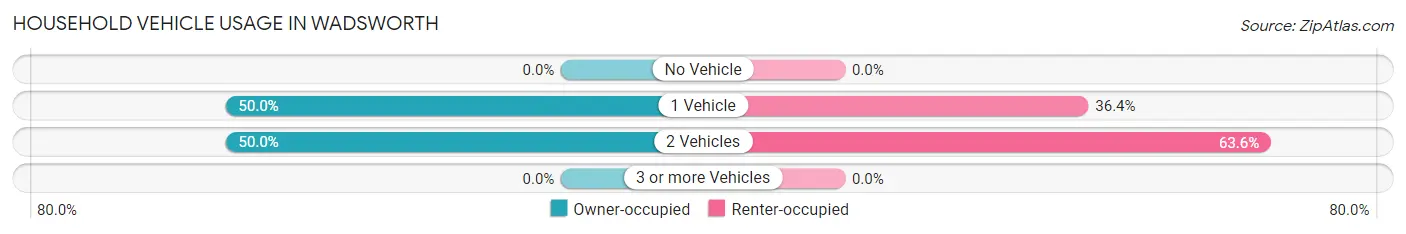
| Vehicles per Household | Owner-occupied | Renter-occupied |
| No Vehicle | 0 (0.0%) | 0 (0.0%) |
| 1 Vehicle | 9 (50.0%) | 12 (36.4%) |
| 2 Vehicles | 9 (50.0%) | 21 (63.6%) |
| 3 or more Vehicles | 0 (0.0%) | 0 (0.0%) |
| Total | 18 (100.0%) | 33 (100.0%) |
Real Estate & Mortgages in Wadsworth
Real Estate and Mortgage Overview in Wadsworth
| Characteristic | Without Mortgage | With Mortgage |
| Housing Units | 0 | 18 |
| Median Property Value | - | - |
| Median Household Income | - | - |
| Monthly Housing Costs | - | - |
| Real Estate Taxes | - | - |
Property Value by Mortgage Status in Wadsworth
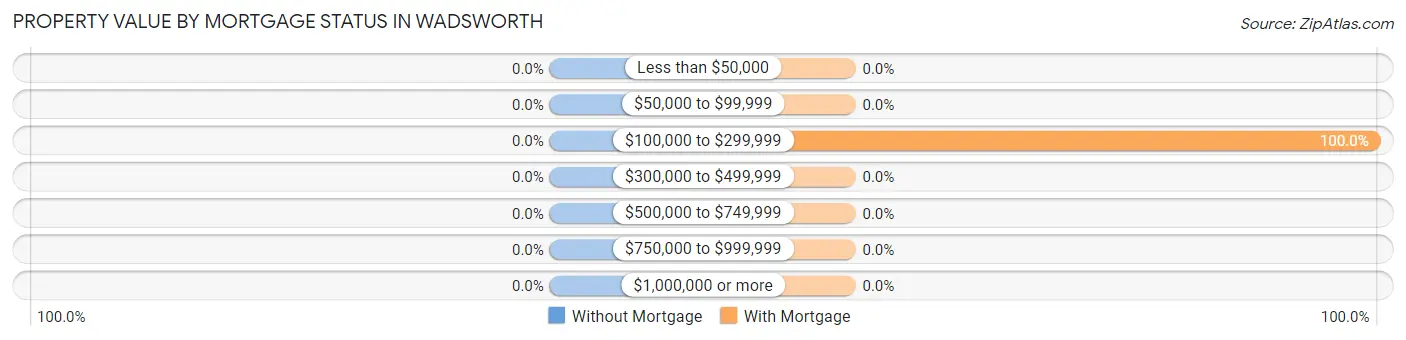
| Property Value | Without Mortgage | With Mortgage |
| Less than $50,000 | 0 (0.0%) | 0 (0.0%) |
| $50,000 to $99,999 | 0 (0.0%) | 0 (0.0%) |
| $100,000 to $299,999 | 0 (0.0%) | 18 (100.0%) |
| $300,000 to $499,999 | 0 (0.0%) | 0 (0.0%) |
| $500,000 to $749,999 | 0 (0.0%) | 0 (0.0%) |
| $750,000 to $999,999 | 0 (0.0%) | 0 (0.0%) |
| $1,000,000 or more | 0 (0.0%) | 0 (0.0%) |
| Total | 0 (0.0%) | 18 (100.0%) |
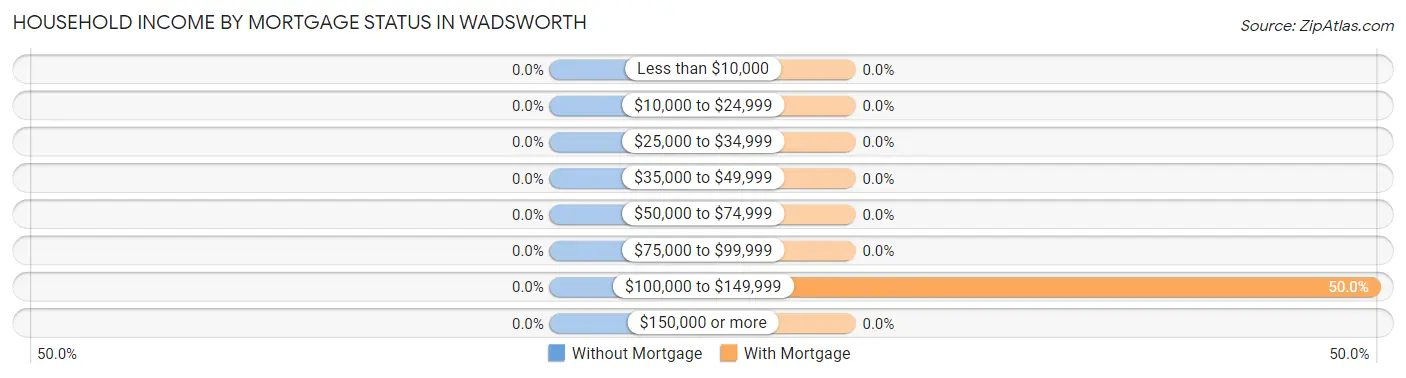
Household Income by Mortgage Status in Wadsworth
| Household Income | Without Mortgage | With Mortgage |
| Less than $10,000 | 0 (0.0%) | 0 (0.0%) |
| $10,000 to $24,999 | 0 (0.0%) | 0 (0.0%) |
| $25,000 to $34,999 | 0 (0.0%) | 0 (0.0%) |
| $35,000 to $49,999 | 0 (0.0%) | 0 (0.0%) |
| $50,000 to $74,999 | 0 (0.0%) | 0 (0.0%) |
| $75,000 to $99,999 | 0 (0.0%) | 0 (0.0%) |
| $100,000 to $149,999 | 0 (0.0%) | 9 (50.0%) |
| $150,000 or more | 0 (0.0%) | 0 (0.0%) |
| Total | 0 (0.0%) | 18 (100.0%) |
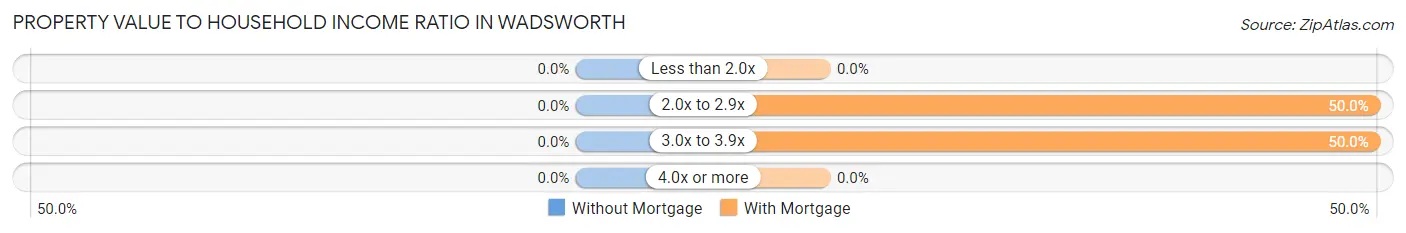
Property Value to Household Income Ratio in Wadsworth
| Value-to-Income Ratio | Without Mortgage | With Mortgage |
| Less than 2.0x | 0 (0.0%) | 0 (0.0%) |
| 2.0x to 2.9x | 0 (0.0%) | 9 (50.0%) |
| 3.0x to 3.9x | 0 (0.0%) | 9 (50.0%) |
| 4.0x or more | 0 (0.0%) | 0 (0.0%) |
| Total | 0 (0.0%) | 18 (100.0%) |
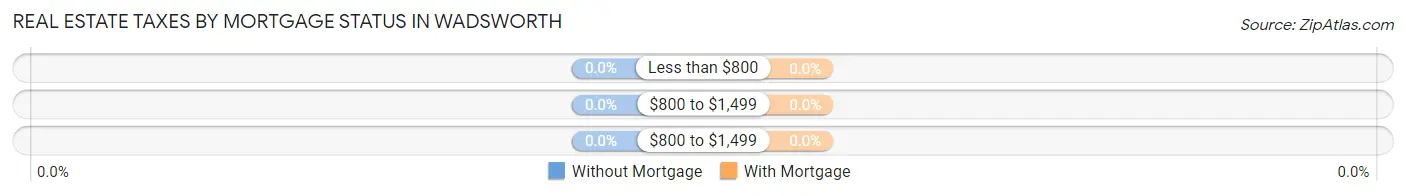
Real Estate Taxes by Mortgage Status in Wadsworth
| Property Taxes | Without Mortgage | With Mortgage |
| Less than $800 | 0 (0.0%) | 0 (0.0%) |
| $800 to $1,499 | 0 (0.0%) | 0 (0.0%) |
| $800 to $1,499 | 0 (0.0%) | 0 (0.0%) |
| Total | 0 (0.0%) | 18 (100.0%) |
Health & Disability in Wadsworth
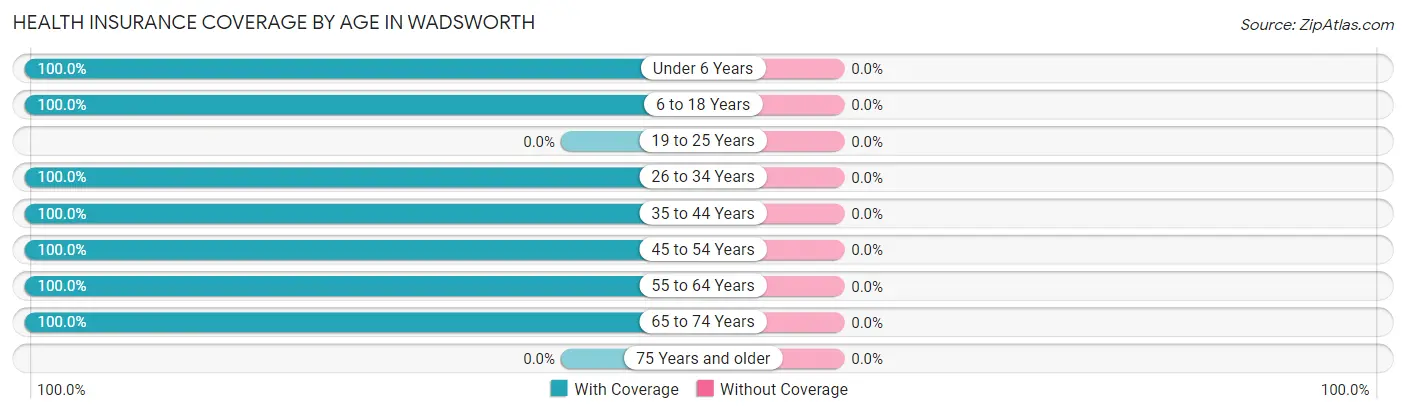
Health Insurance Coverage by Age in Wadsworth
| Age Bracket | With Coverage | Without Coverage |
| Under 6 Years | 13 (100.0%) | 0 (0.0%) |
| 6 to 18 Years | 48 (100.0%) | 0 (0.0%) |
| 19 to 25 Years | 0 (0.0%) | 0 (0.0%) |
| 26 to 34 Years | 49 (100.0%) | 0 (0.0%) |
| 35 to 44 Years | 9 (100.0%) | 0 (0.0%) |
| 45 to 54 Years | 12 (100.0%) | 0 (0.0%) |
| 55 to 64 Years | 9 (100.0%) | 0 (0.0%) |
| 65 to 74 Years | 8 (100.0%) | 0 (0.0%) |
| 75 Years and older | 0 (0.0%) | 0 (0.0%) |
| Total | 148 (100.0%) | 0 (0.0%) |
Health Insurance Coverage by Citizenship Status in Wadsworth
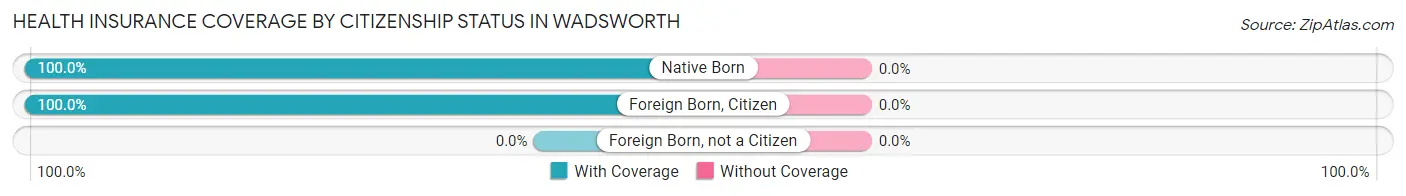
| Citizenship Status | With Coverage | Without Coverage |
| Native Born | 13 (100.0%) | 0 (0.0%) |
| Foreign Born, Citizen | 48 (100.0%) | 0 (0.0%) |
| Foreign Born, not a Citizen | 0 (0.0%) | 0 (0.0%) |
Health Insurance Coverage by Household Income in Wadsworth
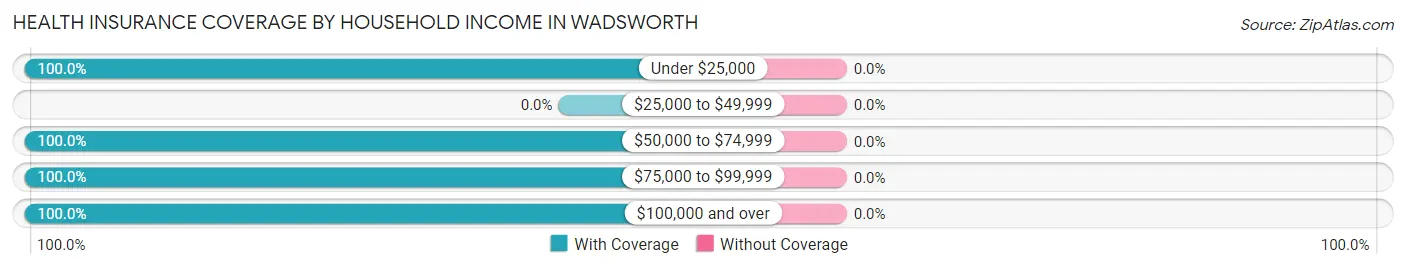
| Household Income | With Coverage | Without Coverage |
| Under $25,000 | 43 (100.0%) | 0 (0.0%) |
| $25,000 to $49,999 | 0 (0.0%) | 0 (0.0%) |
| $50,000 to $74,999 | 62 (100.0%) | 0 (0.0%) |
| $75,000 to $99,999 | 26 (100.0%) | 0 (0.0%) |
| $100,000 and over | 17 (100.0%) | 0 (0.0%) |
Public vs Private Health Insurance Coverage by Age in Wadsworth
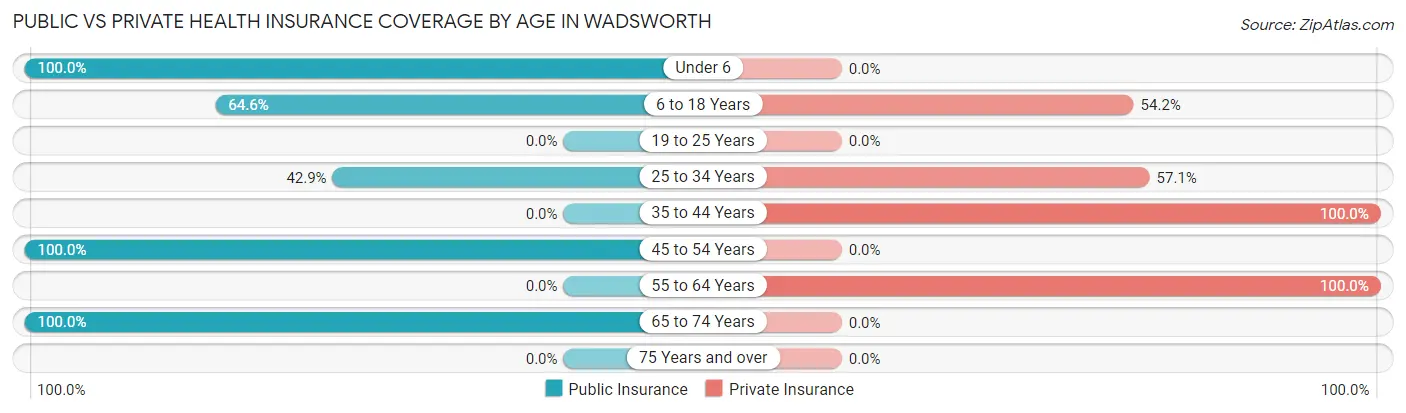
| Age Bracket | Public Insurance | Private Insurance |
| Under 6 | 13 (100.0%) | 0 (0.0%) |
| 6 to 18 Years | 31 (64.6%) | 26 (54.2%) |
| 19 to 25 Years | 0 (0.0%) | 0 (0.0%) |
| 25 to 34 Years | 21 (42.9%) | 28 (57.1%) |
| 35 to 44 Years | 0 (0.0%) | 9 (100.0%) |
| 45 to 54 Years | 12 (100.0%) | 0 (0.0%) |
| 55 to 64 Years | 0 (0.0%) | 9 (100.0%) |
| 65 to 74 Years | 8 (100.0%) | 0 (0.0%) |
| 75 Years and over | 0 (0.0%) | 0 (0.0%) |
| Total | 85 (57.4%) | 72 (48.6%) |
Disability Status by Sex by Age in Wadsworth
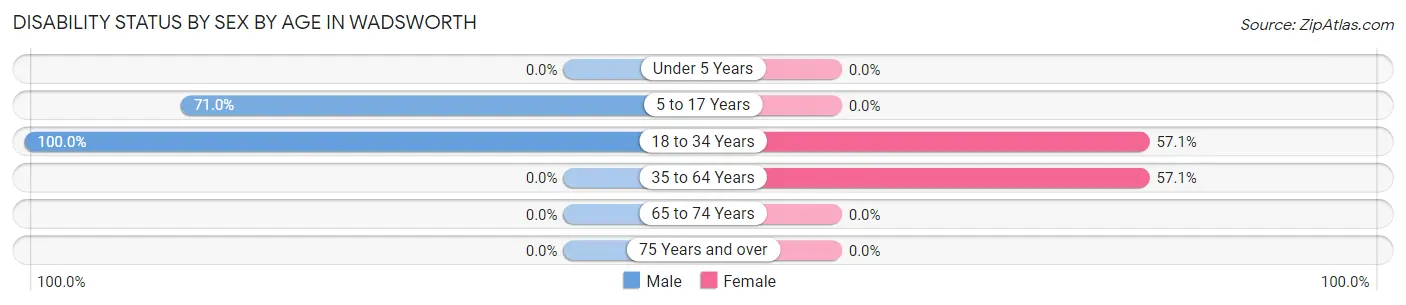
| Age Bracket | Male | Female |
| Under 5 Years | 0 (0.0%) | 0 (0.0%) |
| 5 to 17 Years | 22 (71.0%) | 0 (0.0%) |
| 18 to 34 Years | 9 (100.0%) | 28 (57.1%) |
| 35 to 64 Years | 0 (0.0%) | 12 (57.1%) |
| 65 to 74 Years | 0 (0.0%) | 0 (0.0%) |
| 75 Years and over | 0 (0.0%) | 0 (0.0%) |
Disability Class by Sex by Age in Wadsworth
Disability Class: Hearing Difficulty
| Age Bracket | Male | Female |
| Under 5 Years | 0 (0.0%) | 0 (0.0%) |
| 5 to 17 Years | 0 (0.0%) | 0 (0.0%) |
| 18 to 34 Years | 0 (0.0%) | 0 (0.0%) |
| 35 to 64 Years | 0 (0.0%) | 0 (0.0%) |
| 65 to 74 Years | 0 (0.0%) | 0 (0.0%) |
| 75 Years and over | 0 (0.0%) | 0 (0.0%) |
Disability Class: Vision Difficulty
| Age Bracket | Male | Female |
| Under 5 Years | 0 (0.0%) | 0 (0.0%) |
| 5 to 17 Years | 0 (0.0%) | 0 (0.0%) |
| 18 to 34 Years | 0 (0.0%) | 0 (0.0%) |
| 35 to 64 Years | 0 (0.0%) | 0 (0.0%) |
| 65 to 74 Years | 0 (0.0%) | 0 (0.0%) |
| 75 Years and over | 0 (0.0%) | 0 (0.0%) |
Disability Class: Cognitive Difficulty
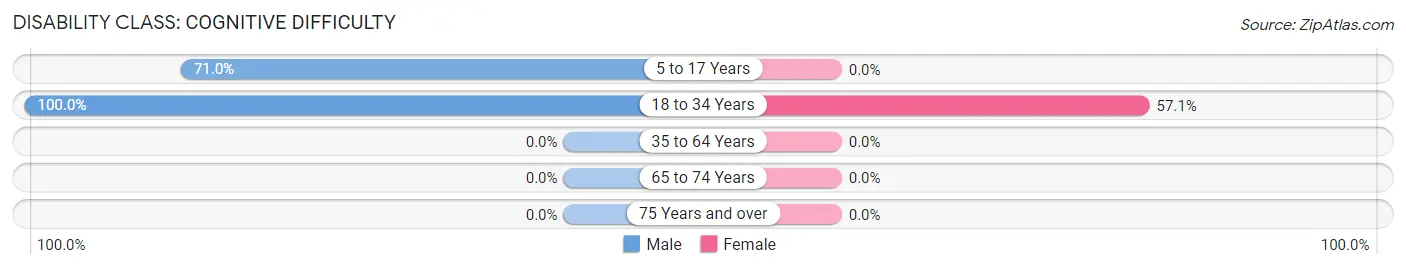
| Age Bracket | Male | Female |
| 5 to 17 Years | 22 (71.0%) | 0 (0.0%) |
| 18 to 34 Years | 9 (100.0%) | 28 (57.1%) |
| 35 to 64 Years | 0 (0.0%) | 0 (0.0%) |
| 65 to 74 Years | 0 (0.0%) | 0 (0.0%) |
| 75 Years and over | 0 (0.0%) | 0 (0.0%) |
Disability Class: Ambulatory Difficulty
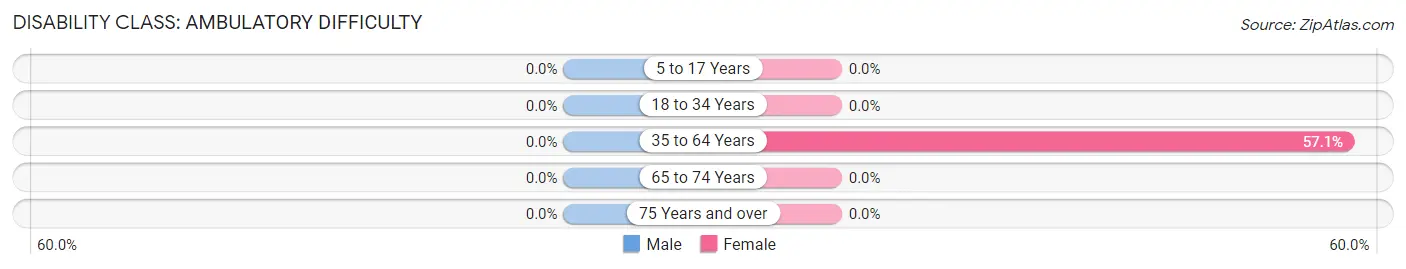
| Age Bracket | Male | Female |
| 5 to 17 Years | 0 (0.0%) | 0 (0.0%) |
| 18 to 34 Years | 0 (0.0%) | 0 (0.0%) |
| 35 to 64 Years | 0 (0.0%) | 12 (57.1%) |
| 65 to 74 Years | 0 (0.0%) | 0 (0.0%) |
| 75 Years and over | 0 (0.0%) | 0 (0.0%) |
Disability Class: Self-Care Difficulty
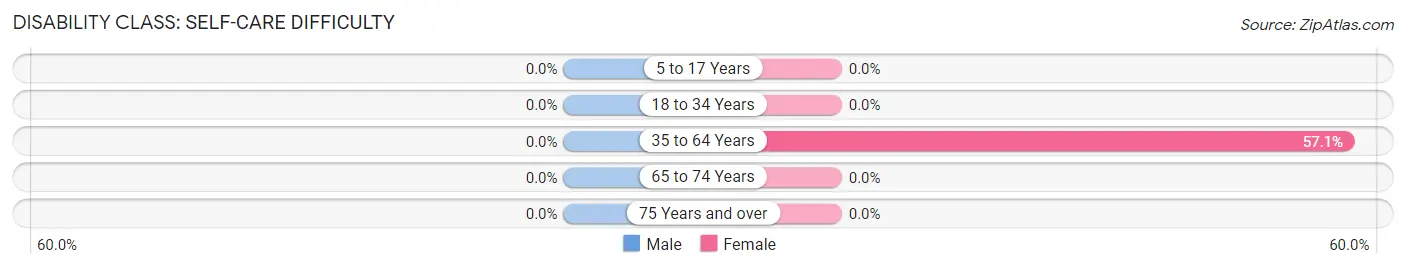
| Age Bracket | Male | Female |
| 5 to 17 Years | 0 (0.0%) | 0 (0.0%) |
| 18 to 34 Years | 0 (0.0%) | 0 (0.0%) |
| 35 to 64 Years | 0 (0.0%) | 12 (57.1%) |
| 65 to 74 Years | 0 (0.0%) | 0 (0.0%) |
| 75 Years and over | 0 (0.0%) | 0 (0.0%) |
Technology Access in Wadsworth
Computing Device Access in Wadsworth
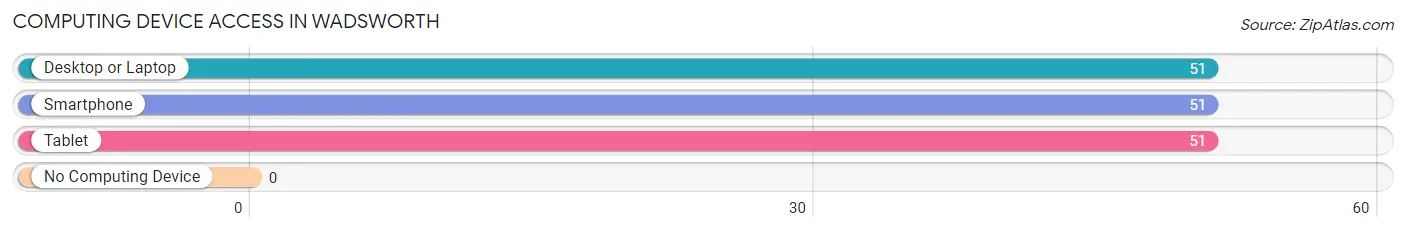
| Device Type | # Households | % Households |
| Desktop or Laptop | 51 | 100.0% |
| Smartphone | 51 | 100.0% |
| Tablet | 51 | 100.0% |
| No Computing Device | 0 | 0.0% |
| Total | 51 | 100.0% |
Internet Access in Wadsworth
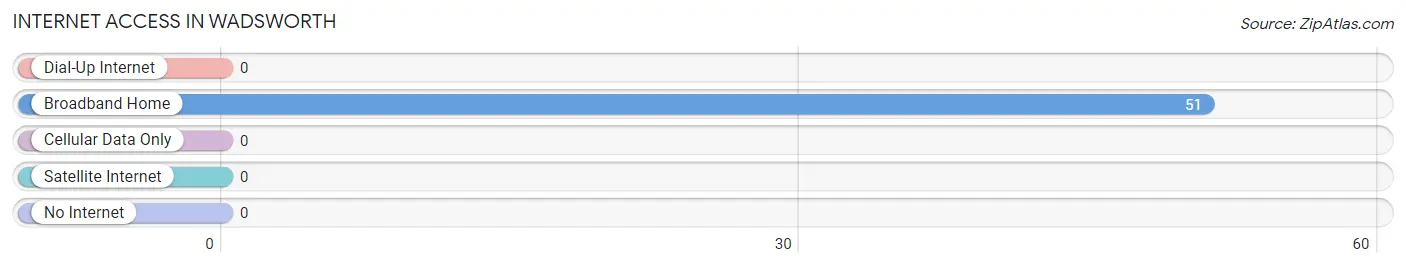
| Internet Type | # Households | % Households |
| Dial-Up Internet | 0 | 0.0% |
| Broadband Home | 51 | 100.0% |
| Cellular Data Only | 0 | 0.0% |
| Satellite Internet | 0 | 0.0% |
| No Internet | 0 | 0.0% |
| Total | 51 | 100.0% |
Wadsworth Summary
Wadsworth is a village located in the town of Genesee in Niagara County, New York. The village is situated on the banks of the Tonawanda Creek, and is part of the Buffalo-Niagara Falls metropolitan area. The population of Wadsworth was 1,845 at the 2010 census.
History
The area that is now Wadsworth was first settled in 1808 by a group of settlers from Connecticut. The village was originally known as "Wadsworthville" and was named after General James Wadsworth, a Revolutionary War hero. The village was incorporated in 1853.
In the late 19th century, Wadsworth was a popular summer resort destination for wealthy families from Buffalo and Rochester. The village was home to several large hotels, including the Wadsworth House, which was built in 1875 and was one of the largest hotels in the area.
Geography
Wadsworth is located at 42°51'25" North, 78°37'45" West (42.856944, -78.629167). According to the United States Census Bureau, the village has a total area of 0.9 square miles (2.3 km2), all of it land.
Economy
The economy of Wadsworth is largely based on agriculture and tourism. The village is home to several farms, including the Wadsworth Farms, which produces a variety of fruits and vegetables. The village is also home to several wineries, including the Niagara Wine Trail, which offers tours and tastings of local wines.
Tourism is also an important part of the local economy. The village is home to several historic sites, including the Wadsworth House, which is listed on the National Register of Historic Places. The village is also home to several parks, including the Wadsworth Falls State Park, which offers hiking, fishing, and camping.
Demographics
As of the census of 2010, there were 1,845 people, 745 households, and 486 families residing in the village. The population density was 2,039.2 people per square mile (788.3/km2). There were 809 housing units at an average density of 890.2 per square mile (344.3/km2). The racial makeup of the village was 97.2% White, 0.7% African American, 0.2% Native American, 0.3% Asian, 0.2% from other races, and 1.5% from two or more races. Hispanic or Latino of any race were 1.2% of the population.
There were 745 households, out of which 28.2% had children under the age of 18 living with them, 48.2% were married couples living together, 11.7% had a female householder with no husband present, and 35.2% were non-families. 29.7% of all households were made up of individuals, and 12.7% had someone living alone who was 65 years of age or older. The average household size was 2.45 and the average family size was 3.03.
In the village, the population was spread out, with 24.2% under the age of 18, 6.7% from 18 to 24, 28.2% from 25 to 44, 24.2% from 45 to 64, and 16.7% who were 65 years of age or older. The median age was 39 years. For every 100 females, there were 94.2 males. For every 100 females age 18 and over, there were 91.2 males.
The median income for a household in the village was $41,250, and the median income for a family was $50,000. Males had a median income of $36,250 versus $25,000 for females. The per capita income for the village was $20,845. About 5.2% of families and 8.2% of the population were below the poverty line, including 10.2% of those under age 18 and 5.2% of those age 65 or over.
Common Questions
What is Per Capita Income in Wadsworth?
Per Capita income in Wadsworth is $25,736.
What is the Median Household income in Wadsworth?
Median Household Income in Wadsworth is $54,107.
What is Inequality or Gini Index in Wadsworth?
Inequality or Gini Index in Wadsworth is 0.43.
What is the Total Population of Wadsworth?
Total Population of Wadsworth is 148.
What is the Total Male Population of Wadsworth?
Total Male Population of Wadsworth is 57.
What is the Total Female Population of Wadsworth?
Total Female Population of Wadsworth is 91.
What is the Ratio of Males per 100 Females in Wadsworth?
There are 62.64 Males per 100 Females in Wadsworth.
What is the Ratio of Females per 100 Males in Wadsworth?
There are 159.65 Females per 100 Males in Wadsworth.
What is the Median Population Age in Wadsworth?
Median Population Age in Wadsworth is 29.6 Years.
What is the Average Family Size in Wadsworth
Average Family Size in Wadsworth is 2.4 People.
What is the Average Household Size in Wadsworth
Average Household Size in Wadsworth is 2.9 People.
How Large is the Labor Force in Wadsworth?
There are 75 People in the Labor Forcein in Wadsworth.
What is the Percentage of People in the Labor Force in Wadsworth?
78.1% of People are in the Labor Force in Wadsworth.
What is the Unemployment Rate in Wadsworth?
Unemployment Rate in Wadsworth is 28.0%.