Zip Codes with the Highest Percentage of Population Employed in Computer, Engineering & Science in New York
RELATED REPORTS & OPTIONS
Computer, Engineering & Science
New York
Compare Zip Codes
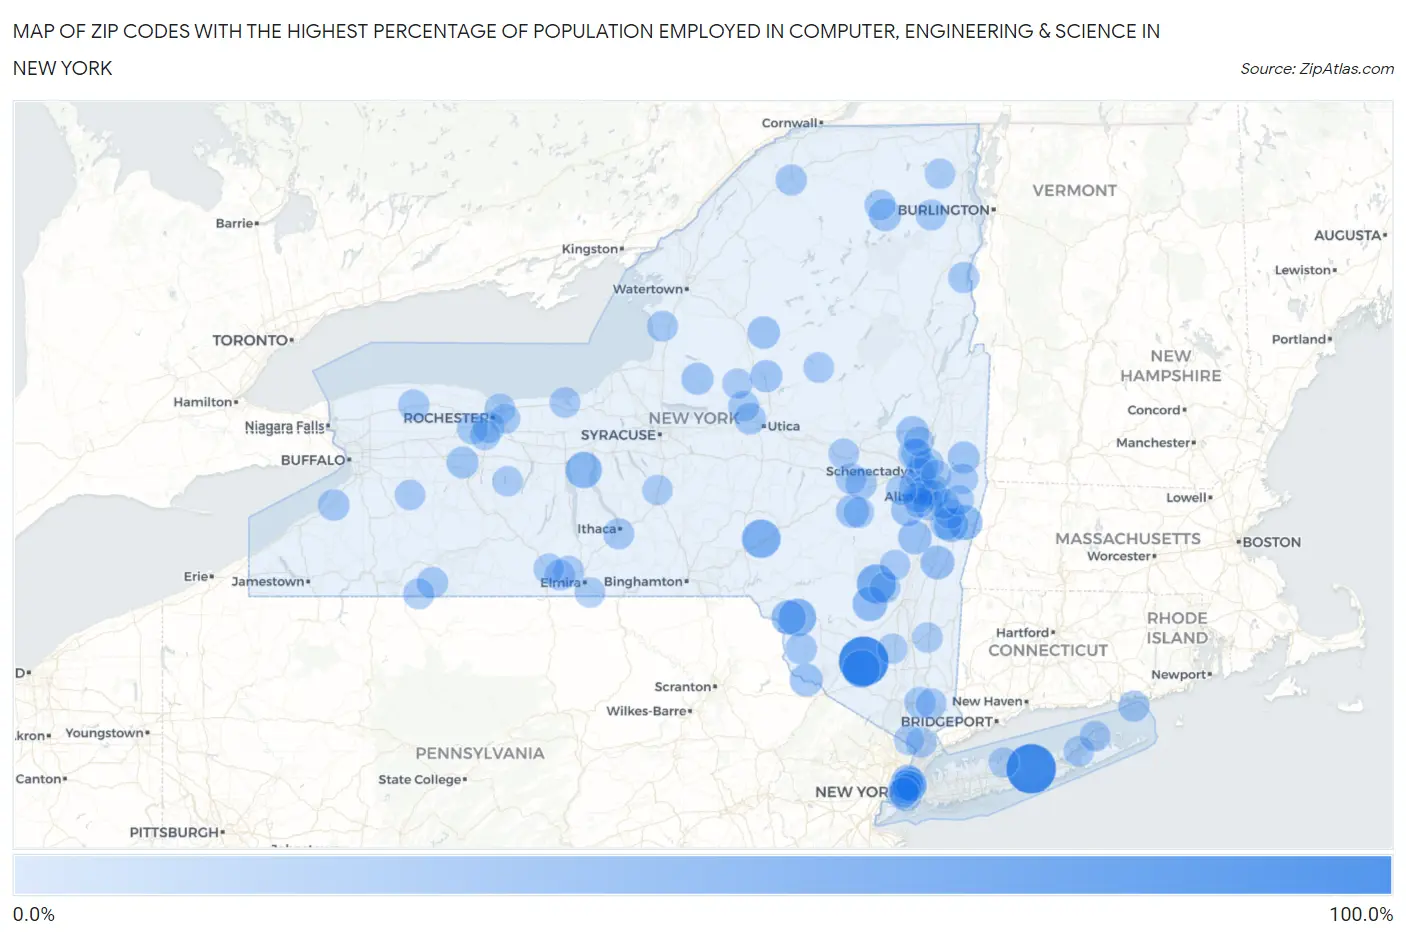
Map of Zip Codes with the Highest Percentage of Population Employed in Computer, Engineering & Science in New York
0.0%
100.0%
Zip Codes with the Highest Percentage of Population Employed in Computer, Engineering & Science in New York
| Zip Code | % Employed | vs State | vs National | |
| 1. | 10985 | 100.0% | 5.8%(+94.2)#1 | 6.8%(+93.2)#6 |
| 2. | 11973 | 100.0% | 5.8%(+94.2)#2 | 6.8%(+93.2)#7 |
| 3. | 12495 | 50.0% | 5.8%(+44.2)#3 | 6.8%(+43.2)#40 |
| 4. | 13859 | 49.1% | 5.8%(+43.2)#4 | 6.8%(+42.3)#47 |
| 5. | 10919 | 44.7% | 5.8%(+38.9)#5 | 6.8%(+37.9)#56 |
| 6. | 12724 | 44.2% | 5.8%(+38.4)#6 | 6.8%(+37.4)#57 |
| 7. | 13065 | 38.6% | 5.8%(+32.8)#7 | 6.8%(+31.9)#90 |
| 8. | 12195 | 32.4% | 5.8%(+26.6)#8 | 6.8%(+25.6)#153 |
| 9. | 12494 | 32.0% | 5.8%(+26.1)#9 | 6.8%(+25.2)#156 |
| 10. | 12736 | 30.6% | 5.8%(+24.7)#10 | 6.8%(+23.8)#172 |
| 11. | 12115 | 29.3% | 5.8%(+23.5)#11 | 6.8%(+22.5)#184 |
| 12. | 12513 | 27.8% | 5.8%(+22.0)#12 | 6.8%(+21.0)#216 |
| 13. | 12042 | 26.2% | 5.8%(+20.3)#13 | 6.8%(+19.4)#248 |
| 14. | 10044 | 25.9% | 5.8%(+20.1)#14 | 6.8%(+19.1)#255 |
| 15. | 12770 | 24.2% | 5.8%(+18.4)#15 | 6.8%(+17.4)#295 |
| 16. | 12194 | 23.8% | 5.8%(+18.0)#16 | 6.8%(+17.0)#308 |
| 17. | 12041 | 22.9% | 5.8%(+17.1)#17 | 6.8%(+16.1)#354 |
| 18. | 12863 | 22.5% | 5.8%(+16.7)#18 | 6.8%(+15.7)#370 |
| 19. | 13312 | 21.9% | 5.8%(+16.1)#19 | 6.8%(+15.1)#395 |
| 20. | 12939 | 21.3% | 5.8%(+15.5)#20 | 6.8%(+14.5)#423 |
| 21. | 13301 | 20.0% | 5.8%(+14.2)#21 | 6.8%(+13.2)#508 |
| 22. | 13483 | 19.6% | 5.8%(+13.8)#22 | 6.8%(+12.9)#539 |
| 23. | 12094 | 19.6% | 5.8%(+13.8)#23 | 6.8%(+12.8)#546 |
| 24. | 12132 | 18.8% | 5.8%(+12.9)#24 | 6.8%(+12.0)#615 |
| 25. | 14592 | 18.6% | 5.8%(+12.8)#25 | 6.8%(+11.9)#625 |
| 26. | 12084 | 17.8% | 5.8%(+12.0)#26 | 6.8%(+11.1)#698 |
| 27. | 14027 | 17.6% | 5.8%(+11.8)#27 | 6.8%(+10.9)#733 |
| 28. | 13424 | 17.4% | 5.8%(+11.6)#28 | 6.8%(+10.7)#761 |
| 29. | 12720 | 17.2% | 5.8%(+11.4)#29 | 6.8%(+10.4)#795 |
| 30. | 12148 | 17.2% | 5.8%(+11.4)#30 | 6.8%(+10.4)#796 |
| 31. | 10162 | 16.6% | 5.8%(+10.7)#31 | 6.8%(+9.80)#875 |
| 32. | 14623 | 16.5% | 5.8%(+10.6)#32 | 6.8%(+9.69)#896 |
| 33. | 13699 | 16.1% | 5.8%(+10.3)#33 | 6.8%(+9.35)#934 |
| 34. | 12035 | 16.1% | 5.8%(+10.3)#34 | 6.8%(+9.35)#937 |
| 35. | 14774 | 15.9% | 5.8%(+10.1)#35 | 6.8%(+9.16)#971 |
| 36. | 12027 | 15.9% | 5.8%(+10.0)#36 | 6.8%(+9.09)#981 |
| 37. | 12974 | 15.5% | 5.8%(+9.71)#37 | 6.8%(+8.76)#1,023 |
| 38. | 06390 | 15.4% | 5.8%(+9.57)#38 | 6.8%(+8.62)#1,053 |
| 39. | 14479 | 15.2% | 5.8%(+9.40)#39 | 6.8%(+8.45)#1,085 |
| 40. | 10517 | 15.1% | 5.8%(+9.31)#40 | 6.8%(+8.36)#1,103 |
| 41. | 10065 | 15.1% | 5.8%(+9.28)#41 | 6.8%(+8.33)#1,108 |
| 42. | 12409 | 15.0% | 5.8%(+9.17)#42 | 6.8%(+8.22)#1,124 |
| 43. | 12077 | 14.8% | 5.8%(+8.94)#43 | 6.8%(+7.99)#1,164 |
| 44. | 12912 | 14.6% | 5.8%(+8.74)#44 | 6.8%(+7.80)#1,208 |
| 45. | 14850 | 14.5% | 5.8%(+8.71)#45 | 6.8%(+7.77)#1,214 |
| 46. | 13441 | 14.5% | 5.8%(+8.71)#46 | 6.8%(+7.76)#1,216 |
| 47. | 14514 | 14.5% | 5.8%(+8.70)#47 | 6.8%(+7.75)#1,217 |
| 48. | 12204 | 14.5% | 5.8%(+8.69)#48 | 6.8%(+7.74)#1,220 |
| 49. | 13636 | 14.3% | 5.8%(+8.47)#49 | 6.8%(+7.52)#1,265 |
| 50. | 12976 | 14.3% | 5.8%(+8.47)#51 | 6.8%(+7.52)#1,267 |
| 51. | 14721 | 14.3% | 5.8%(+8.47)#52 | 6.8%(+7.52)#1,268 |
| 52. | 10501 | 14.2% | 5.8%(+8.41)#53 | 6.8%(+7.46)#1,288 |
| 53. | 11956 | 14.2% | 5.8%(+8.36)#54 | 6.8%(+7.41)#1,293 |
| 54. | 14814 | 14.0% | 5.8%(+8.18)#55 | 6.8%(+7.23)#1,338 |
| 55. | 12031 | 14.0% | 5.8%(+8.16)#56 | 6.8%(+7.21)#1,341 |
| 56. | 14555 | 14.0% | 5.8%(+8.15)#57 | 6.8%(+7.21)#1,346 |
| 57. | 14830 | 13.9% | 5.8%(+8.13)#58 | 6.8%(+7.18)#1,354 |
| 58. | 11109 | 13.9% | 5.8%(+8.12)#59 | 6.8%(+7.18)#1,358 |
| 59. | 12309 | 13.9% | 5.8%(+8.09)#60 | 6.8%(+7.14)#1,368 |
| 60. | 12052 | 13.9% | 5.8%(+8.09)#61 | 6.8%(+7.14)#1,370 |
| 61. | 12071 | 13.9% | 5.8%(+8.07)#62 | 6.8%(+7.12)#1,377 |
| 62. | 11965 | 13.8% | 5.8%(+8.00)#63 | 6.8%(+7.05)#1,394 |
| 63. | 10004 | 13.8% | 5.8%(+7.97)#64 | 6.8%(+7.02)#1,407 |
| 64. | 13353 | 13.6% | 5.8%(+7.82)#65 | 6.8%(+6.87)#1,448 |
| 65. | 10024 | 13.3% | 5.8%(+7.51)#66 | 6.8%(+6.57)#1,532 |
| 66. | 10018 | 13.2% | 5.8%(+7.42)#67 | 6.8%(+6.47)#1,559 |
| 67. | 12203 | 13.1% | 5.8%(+7.28)#68 | 6.8%(+6.33)#1,610 |
| 68. | 12207 | 12.9% | 5.8%(+7.13)#69 | 6.8%(+6.18)#1,660 |
| 69. | 13428 | 12.9% | 5.8%(+7.10)#70 | 6.8%(+6.15)#1,669 |
| 70. | 12123 | 12.9% | 5.8%(+7.06)#71 | 6.8%(+6.12)#1,684 |
| 71. | 10533 | 12.8% | 5.8%(+7.01)#72 | 6.8%(+6.07)#1,705 |
| 72. | 11217 | 12.8% | 5.8%(+6.99)#73 | 6.8%(+6.04)#1,712 |
| 73. | 10017 | 12.7% | 5.8%(+6.93)#74 | 6.8%(+5.98)#1,727 |
| 74. | 14870 | 12.7% | 5.8%(+6.91)#75 | 6.8%(+5.96)#1,736 |
| 75. | 12019 | 12.7% | 5.8%(+6.90)#76 | 6.8%(+5.95)#1,740 |
| 76. | 12061 | 12.7% | 5.8%(+6.85)#77 | 6.8%(+5.90)#1,762 |
| 77. | 12054 | 12.7% | 5.8%(+6.84)#78 | 6.8%(+5.89)#1,767 |
| 78. | 14113 | 12.5% | 5.8%(+6.72)#79 | 6.8%(+5.77)#1,803 |
| 79. | 12159 | 12.5% | 5.8%(+6.70)#80 | 6.8%(+5.75)#1,811 |
| 80. | 12436 | 12.5% | 5.8%(+6.68)#81 | 6.8%(+5.74)#1,818 |
| 81. | 11101 | 12.4% | 5.8%(+6.61)#82 | 6.8%(+5.66)#1,852 |
| 82. | 14622 | 12.4% | 5.8%(+6.57)#83 | 6.8%(+5.62)#1,869 |
| 83. | 12009 | 12.3% | 5.8%(+6.50)#84 | 6.8%(+5.55)#1,890 |
| 84. | 12569 | 12.3% | 5.8%(+6.49)#85 | 6.8%(+5.54)#1,898 |
| 85. | 13303 | 12.3% | 5.8%(+6.46)#86 | 6.8%(+5.52)#1,906 |
| 86. | 11790 | 12.3% | 5.8%(+6.45)#87 | 6.8%(+5.50)#1,915 |
| 87. | 12918 | 12.3% | 5.8%(+6.45)#88 | 6.8%(+5.50)#1,916 |
| 88. | 14471 | 12.2% | 5.8%(+6.41)#89 | 6.8%(+5.46)#1,933 |
| 89. | 10009 | 12.1% | 5.8%(+6.27)#90 | 6.8%(+5.32)#2,000 |
| 90. | 10962 | 12.1% | 5.8%(+6.25)#91 | 6.8%(+5.30)#2,005 |
| 91. | 10038 | 12.1% | 5.8%(+6.24)#92 | 6.8%(+5.29)#2,015 |
| 92. | 14894 | 12.0% | 5.8%(+6.21)#93 | 6.8%(+5.26)#2,027 |
| 93. | 14625 | 12.0% | 5.8%(+6.18)#94 | 6.8%(+5.23)#2,039 |
| 94. | 12018 | 12.0% | 5.8%(+6.15)#95 | 6.8%(+5.20)#2,050 |
| 95. | 12065 | 11.9% | 5.8%(+6.04)#96 | 6.8%(+5.09)#2,107 |
| 96. | 12047 | 11.8% | 5.8%(+6.02)#97 | 6.8%(+5.07)#2,116 |
| 97. | 13087 | 11.8% | 5.8%(+6.01)#98 | 6.8%(+5.06)#2,124 |
| 98. | 14586 | 11.7% | 5.8%(+5.85)#99 | 6.8%(+4.90)#2,198 |
| 99. | 12020 | 11.6% | 5.8%(+5.83)#100 | 6.8%(+4.88)#2,210 |
| 100. | 12548 | 11.6% | 5.8%(+5.78)#101 | 6.8%(+4.83)#2,237 |
Common Questions
What are the Top 10 Zip Codes with the Highest Percentage of Population Employed in Computer, Engineering & Science in New York?
Top 10 Zip Codes with the Highest Percentage of Population Employed in Computer, Engineering & Science in New York are:
What zip code has the Highest Percentage of Population Employed in Computer, Engineering & Science in New York?
10985 has the Highest Percentage of Population Employed in Computer, Engineering & Science in New York with 100.0%.
What is the Percentage of Population Employed in Computer, Engineering & Science in the State of New York?
Percentage of Population Employed in Computer, Engineering & Science in New York is 5.8%.
What is the Percentage of Population Employed in Computer, Engineering & Science in the United States?
Percentage of Population Employed in Computer, Engineering & Science in the United States is 6.8%.