Westmere, NY Map & Demographics
Westmere Map
Westmere Overview
$56,545
PER CAPITA INCOME
$112,253
AVG FAMILY INCOME
$80,133
AVG HOUSEHOLD INCOME
20.4%
WAGE / INCOME GAP [ % ]
79.6¢/ $1
WAGE / INCOME GAP [ $ ]
$2,809
FAMILY INCOME DEFICIT
0.48
INEQUALITY / GINI INDEX
7,798
TOTAL POPULATION
4,338
MALE POPULATION
3,460
FEMALE POPULATION
125.38
MALES / 100 FEMALES
79.76
FEMALES / 100 MALES
38.9
MEDIAN AGE
3.0
AVG FAMILY SIZE
2.2
AVG HOUSEHOLD SIZE
4,470
LABOR FORCE [ PEOPLE ]
69.2%
PERCENT IN LABOR FORCE
0.5%
UNEMPLOYMENT RATE
Income in Westmere
Income Overview in Westmere
Per Capita Income in Westmere is $56,545, while median incomes of families and households are $112,253 and $80,133 respectively.
| Characteristic | Number | Measure |
| Per Capita Income | 7,798 | $56,545 |
| Median Family Income | 1,956 | $112,253 |
| Mean Family Income | 1,956 | $163,306 |
| Median Household Income | 3,546 | $80,133 |
| Mean Household Income | 3,546 | $120,856 |
| Income Deficit | 1,956 | $2,809 |
| Wage / Income Gap (%) | 7,798 | 20.42% |
| Wage / Income Gap ($) | 7,798 | 79.58¢ per $1 |
| Gini / Inequality Index | 7,798 | 0.48 |
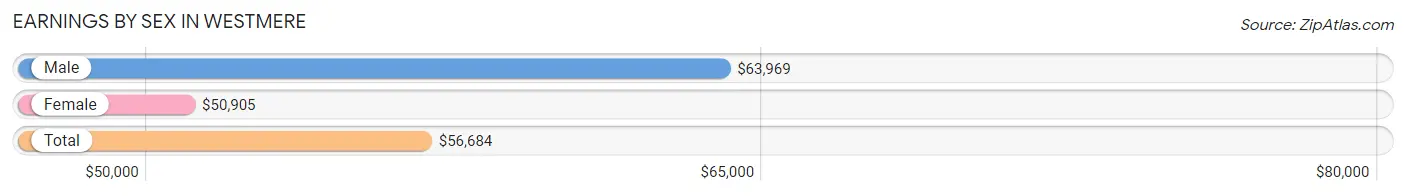
Earnings by Sex in Westmere
Average Earnings in Westmere are $56,684, $63,969 for men and $50,905 for women, a difference of 20.4%.
| Sex | Number | Average Earnings |
| Male | 2,633 (57.7%) | $63,969 |
| Female | 1,927 (42.3%) | $50,905 |
| Total | 4,560 (100.0%) | $56,684 |
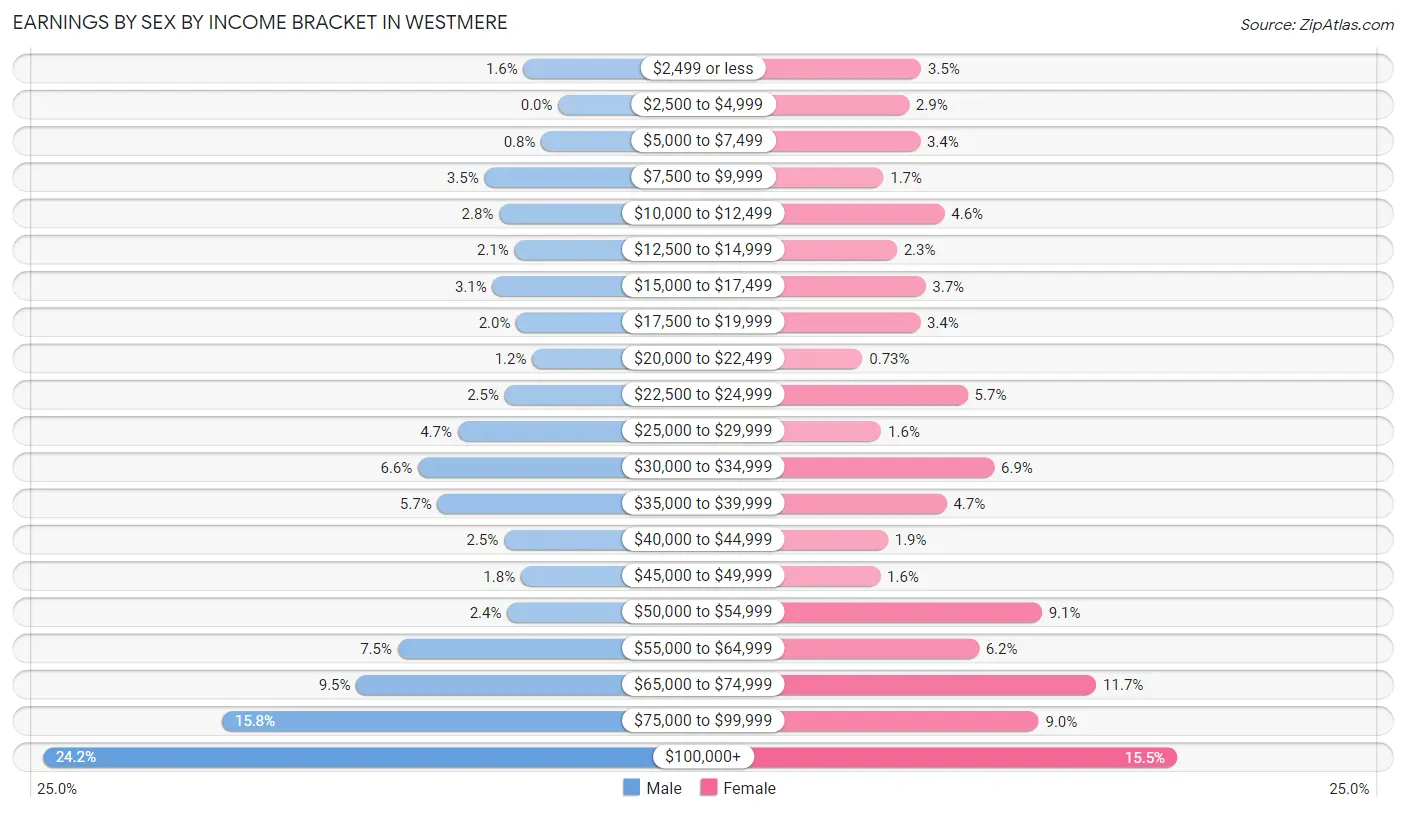
Earnings by Sex by Income Bracket in Westmere
The most common earnings brackets in Westmere are $100,000+ for men (636 | 24.1%) and $100,000+ for women (298 | 15.5%).
| Income | Male | Female |
| $2,499 or less | 43 (1.6%) | 67 (3.5%) |
| $2,500 to $4,999 | 0 (0.0%) | 56 (2.9%) |
| $5,000 to $7,499 | 21 (0.8%) | 66 (3.4%) |
| $7,500 to $9,999 | 91 (3.5%) | 33 (1.7%) |
| $10,000 to $12,499 | 73 (2.8%) | 88 (4.6%) |
| $12,500 to $14,999 | 54 (2.1%) | 45 (2.3%) |
| $15,000 to $17,499 | 81 (3.1%) | 71 (3.7%) |
| $17,500 to $19,999 | 52 (2.0%) | 66 (3.4%) |
| $20,000 to $22,499 | 32 (1.2%) | 14 (0.7%) |
| $22,500 to $24,999 | 66 (2.5%) | 109 (5.7%) |
| $25,000 to $29,999 | 124 (4.7%) | 31 (1.6%) |
| $30,000 to $34,999 | 173 (6.6%) | 133 (6.9%) |
| $35,000 to $39,999 | 149 (5.7%) | 90 (4.7%) |
| $40,000 to $44,999 | 67 (2.5%) | 37 (1.9%) |
| $45,000 to $49,999 | 46 (1.8%) | 30 (1.6%) |
| $50,000 to $54,999 | 63 (2.4%) | 176 (9.1%) |
| $55,000 to $64,999 | 198 (7.5%) | 119 (6.2%) |
| $65,000 to $74,999 | 249 (9.5%) | 225 (11.7%) |
| $75,000 to $99,999 | 415 (15.8%) | 173 (9.0%) |
| $100,000+ | 636 (24.1%) | 298 (15.5%) |
| Total | 2,633 (100.0%) | 1,927 (100.0%) |
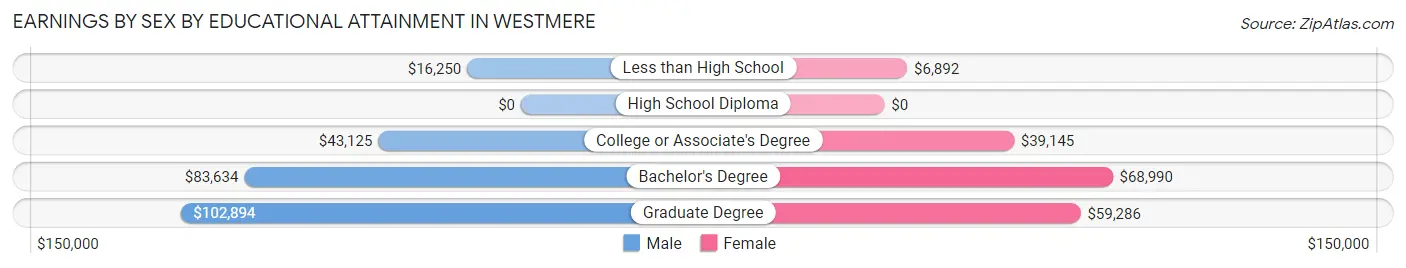
Earnings by Sex by Educational Attainment in Westmere
Average earnings in Westmere are $71,834 for men and $53,263 for women, a difference of 25.9%. Men with an educational attainment of graduate degree enjoy the highest average annual earnings of $102,894, while those with less than high school education earn the least with $16,250. Women with an educational attainment of bachelor's degree earn the most with the average annual earnings of $68,990, while those with less than high school education have the smallest earnings of $6,892.
| Educational Attainment | Male Income | Female Income |
| Less than High School | $16,250 | $6,892 |
| High School Diploma | - | - |
| College or Associate's Degree | $43,125 | $39,145 |
| Bachelor's Degree | $83,634 | $68,990 |
| Graduate Degree | $102,894 | $59,286 |
| Total | $71,834 | $53,263 |
Family Income in Westmere
Family Income Brackets in Westmere
According to the Westmere family income data, there are 460 families falling into the $100,000 to $149,999 income range, which is the most common income bracket and makes up 23.5% of all families.
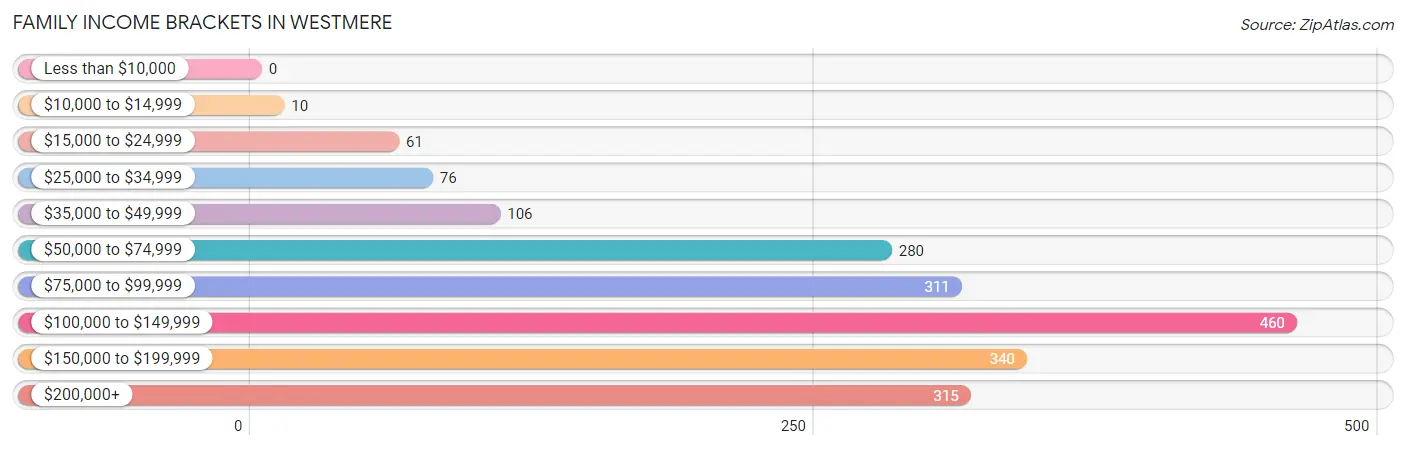
| Income Bracket | # Families | % Families |
| Less than $10,000 | 0 | 0.0% |
| $10,000 to $14,999 | 10 | 0.5% |
| $15,000 to $24,999 | 61 | 3.1% |
| $25,000 to $34,999 | 76 | 3.9% |
| $35,000 to $49,999 | 106 | 5.4% |
| $50,000 to $74,999 | 280 | 14.3% |
| $75,000 to $99,999 | 311 | 15.9% |
| $100,000 to $149,999 | 460 | 23.5% |
| $150,000 to $199,999 | 340 | 17.4% |
| $200,000+ | 315 | 16.1% |
Family Income by Famaliy Size in Westmere
4-person families (364 | 18.6%) account for the highest median family income in Westmere with $143,583 per family, while 2-person families (1,011 | 51.7%) have the highest median income of $49,752 per family member.
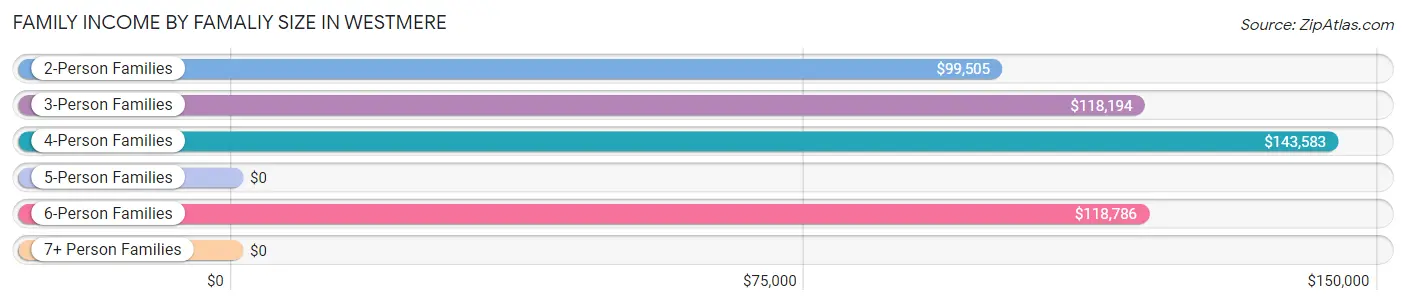
| Income Bracket | # Families | Median Income |
| 2-Person Families | 1,011 (51.7%) | $99,505 |
| 3-Person Families | 413 (21.1%) | $118,194 |
| 4-Person Families | 364 (18.6%) | $143,583 |
| 5-Person Families | 112 (5.7%) | $0 |
| 6-Person Families | 56 (2.9%) | $118,786 |
| 7+ Person Families | 0 (0.0%) | $0 |
| Total | 1,956 (100.0%) | $112,253 |
Family Income by Number of Earners in Westmere
The median family income in Westmere is $112,253, with families comprising 3+ earners (207) having the highest median family income of $193,024, while families with no earners (224) have the lowest median family income of $62,813, accounting for 10.6% and 11.5% of families, respectively.
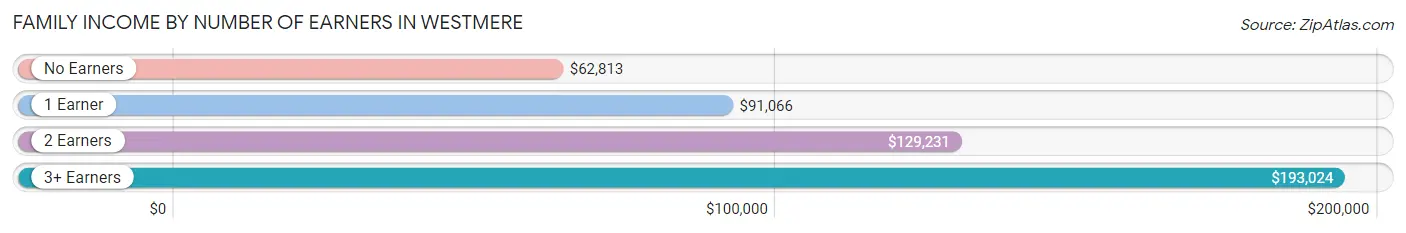
| Number of Earners | # Families | Median Income |
| No Earners | 224 (11.5%) | $62,813 |
| 1 Earner | 657 (33.6%) | $91,066 |
| 2 Earners | 868 (44.4%) | $129,231 |
| 3+ Earners | 207 (10.6%) | $193,024 |
| Total | 1,956 (100.0%) | $112,253 |
Household Income in Westmere
Household Income Brackets in Westmere
With 812 households falling in the category, the $50,000 to $74,999 income range is the most frequent in Westmere, accounting for 22.9% of all households. In contrast, only 53 households (1.5%) fall into the $10,000 to $14,999 income bracket, making it the least populous group.
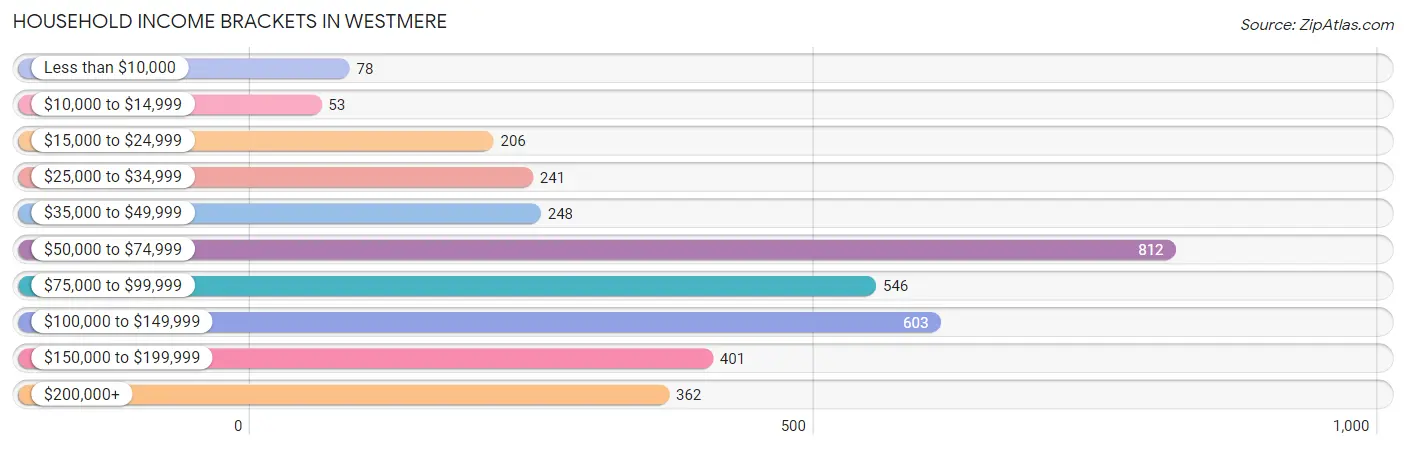
| Income Bracket | # Households | % Households |
| Less than $10,000 | 78 | 2.2% |
| $10,000 to $14,999 | 53 | 1.5% |
| $15,000 to $24,999 | 206 | 5.8% |
| $25,000 to $34,999 | 241 | 6.8% |
| $35,000 to $49,999 | 248 | 7.0% |
| $50,000 to $74,999 | 812 | 22.9% |
| $75,000 to $99,999 | 546 | 15.4% |
| $100,000 to $149,999 | 603 | 17.0% |
| $150,000 to $199,999 | 401 | 11.3% |
| $200,000+ | 362 | 10.2% |
Household Income by Householder Age in Westmere
The median household income in Westmere is $80,133, with the highest median household income of $111,554 found in the 45 to 64 years age bracket for the primary householder. A total of 1,413 households (39.9%) fall into this category. Meanwhile, the 65+ years age bracket for the primary householder has the lowest median household income of $53,616, with 797 households (22.5%) in this group.
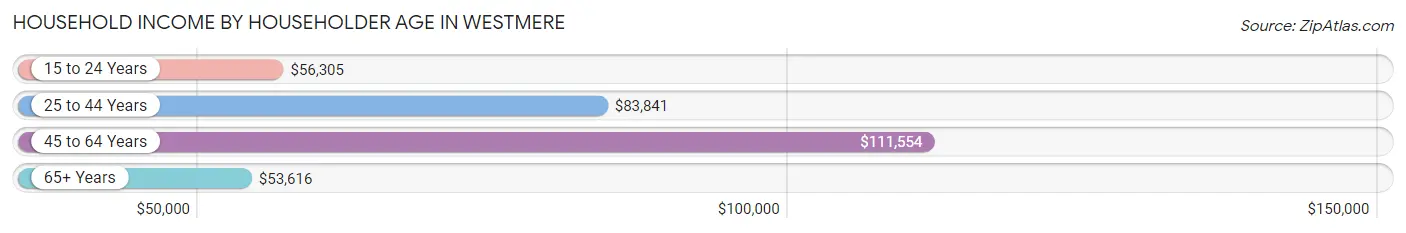
| Income Bracket | # Households | Median Income |
| 15 to 24 Years | 293 (8.3%) | $56,305 |
| 25 to 44 Years | 1,043 (29.4%) | $83,841 |
| 45 to 64 Years | 1,413 (39.9%) | $111,554 |
| 65+ Years | 797 (22.5%) | $53,616 |
| Total | 3,546 (100.0%) | $80,133 |
Poverty in Westmere
Income Below Poverty by Sex and Age in Westmere
With 4.8% poverty level for males and 5.7% for females among the residents of Westmere, 25 to 34 year old males and 16 and 17 year old females are the most vulnerable to poverty, with 54 males (10.0%) and 16 females (18.8%) in their respective age groups living below the poverty level.
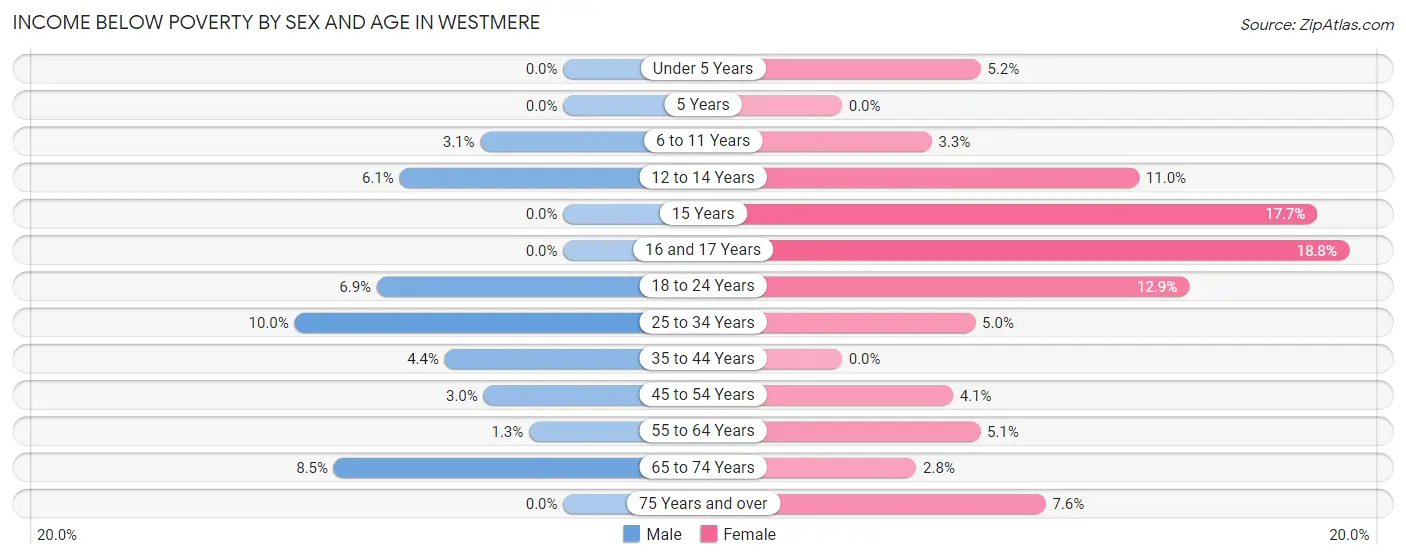
| Age Bracket | Male | Female |
| Under 5 Years | 0 (0.0%) | 7 (5.1%) |
| 5 Years | 0 (0.0%) | 0 (0.0%) |
| 6 to 11 Years | 8 (3.1%) | 8 (3.3%) |
| 12 to 14 Years | 16 (6.1%) | 16 (11.0%) |
| 15 Years | 0 (0.0%) | 15 (17.6%) |
| 16 and 17 Years | 0 (0.0%) | 16 (18.8%) |
| 18 to 24 Years | 50 (6.9%) | 41 (12.9%) |
| 25 to 34 Years | 54 (10.0%) | 26 (5.0%) |
| 35 to 44 Years | 21 (4.4%) | 0 (0.0%) |
| 45 to 54 Years | 18 (3.0%) | 11 (4.1%) |
| 55 to 64 Years | 8 (1.3%) | 28 (5.1%) |
| 65 to 74 Years | 31 (8.5%) | 12 (2.8%) |
| 75 Years and over | 0 (0.0%) | 17 (7.6%) |
| Total | 206 (4.8%) | 197 (5.7%) |
Income Above Poverty by Sex and Age in Westmere
According to the poverty statistics in Westmere, males aged under 5 years and females aged 5 years are the age groups that are most secure financially, with 100.0% of males and 100.0% of females in these age groups living above the poverty line.
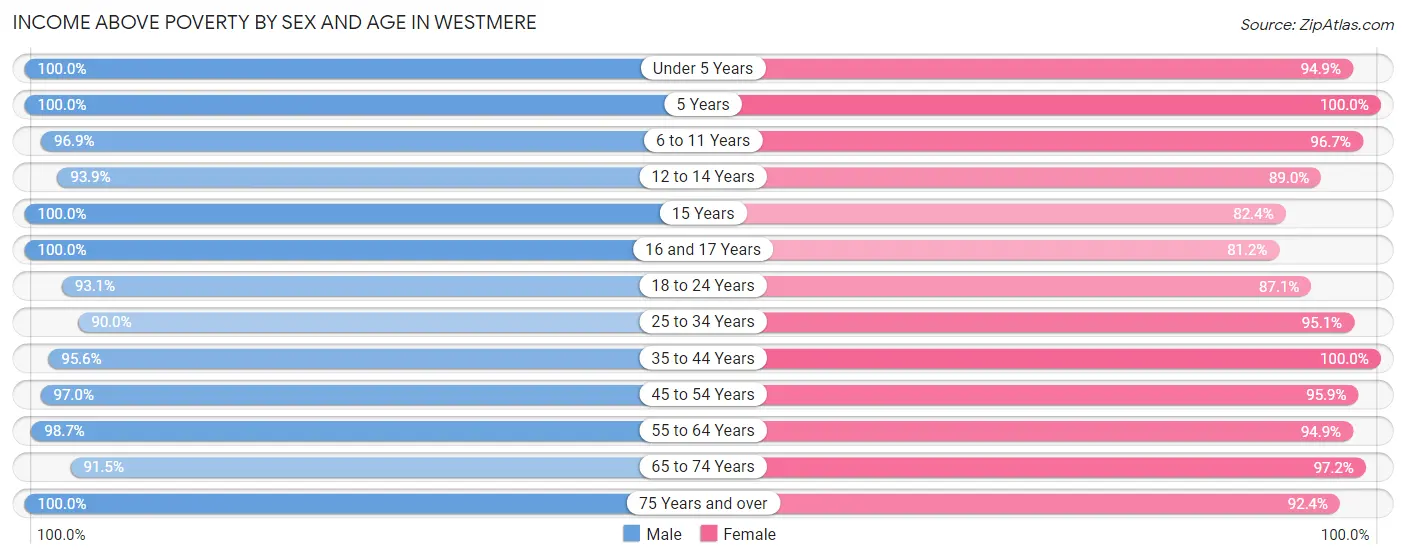
| Age Bracket | Male | Female |
| Under 5 Years | 170 (100.0%) | 129 (94.9%) |
| 5 Years | 15 (100.0%) | 13 (100.0%) |
| 6 to 11 Years | 252 (96.9%) | 232 (96.7%) |
| 12 to 14 Years | 247 (93.9%) | 129 (89.0%) |
| 15 Years | 12 (100.0%) | 70 (82.4%) |
| 16 and 17 Years | 37 (100.0%) | 69 (81.2%) |
| 18 to 24 Years | 673 (93.1%) | 277 (87.1%) |
| 25 to 34 Years | 487 (90.0%) | 499 (95.1%) |
| 35 to 44 Years | 456 (95.6%) | 424 (100.0%) |
| 45 to 54 Years | 590 (97.0%) | 256 (95.9%) |
| 55 to 64 Years | 624 (98.7%) | 518 (94.9%) |
| 65 to 74 Years | 333 (91.5%) | 423 (97.2%) |
| 75 Years and over | 232 (100.0%) | 208 (92.4%) |
| Total | 4,128 (95.3%) | 3,247 (94.3%) |
Income Below Poverty Among Married-Couple Families in Westmere
The poverty statistics for married-couple families in Westmere show that 3.5% or 48 of the total 1,392 families live below the poverty line. Families with 3 or 4 children have the highest poverty rate of 20.0%, comprising of 25 families. On the other hand, families with 1 or 2 children have the lowest poverty rate of 0.0%, which includes 0 families.
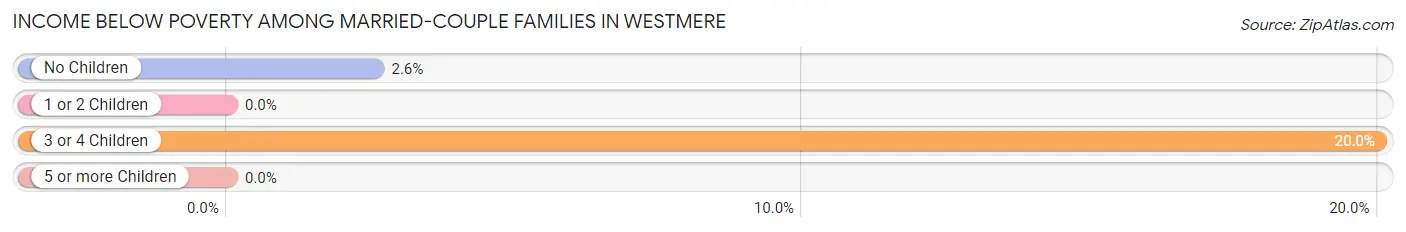
| Children | Above Poverty | Below Poverty |
| No Children | 878 (97.5%) | 23 (2.5%) |
| 1 or 2 Children | 366 (100.0%) | 0 (0.0%) |
| 3 or 4 Children | 100 (80.0%) | 25 (20.0%) |
| 5 or more Children | 0 (0.0%) | 0 (0.0%) |
| Total | 1,344 (96.6%) | 48 (3.5%) |
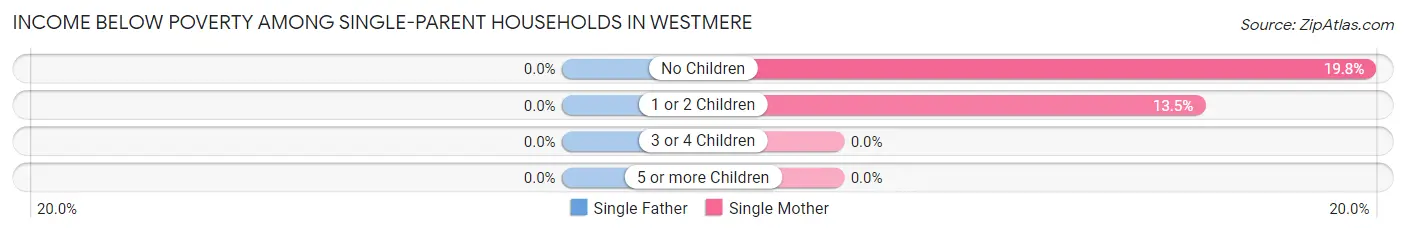
Income Below Poverty Among Single-Parent Households in Westmere
| Children | Single Father | Single Mother |
| No Children | 0 (0.0%) | 23 (19.8%) |
| 1 or 2 Children | 0 (0.0%) | 14 (13.5%) |
| 3 or 4 Children | 0 (0.0%) | 0 (0.0%) |
| 5 or more Children | 0 (0.0%) | 0 (0.0%) |
| Total | 0 (0.0%) | 37 (14.9%) |
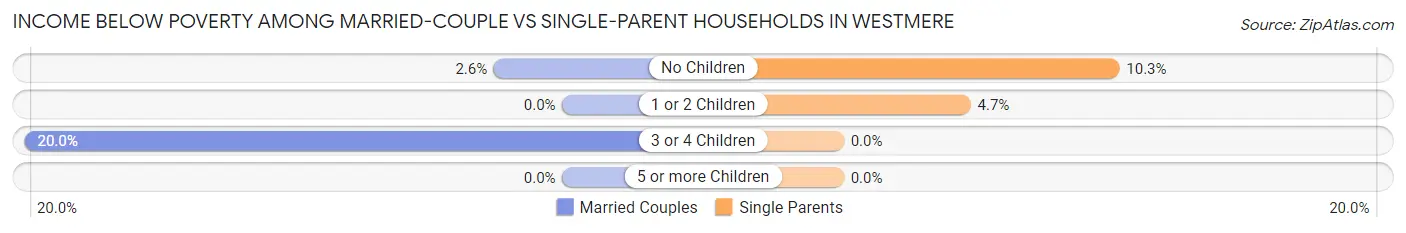
Income Below Poverty Among Married-Couple vs Single-Parent Households in Westmere
The poverty data for Westmere shows that 48 of the married-couple family households (3.5%) and 37 of the single-parent households (6.6%) are living below the poverty level. Within the married-couple family households, those with 3 or 4 children have the highest poverty rate, with 25 households (20.0%) falling below the poverty line. Among the single-parent households, those with no children have the highest poverty rate, with 23 household (10.3%) living below poverty.
| Children | Married-Couple Families | Single-Parent Households |
| No Children | 23 (2.5%) | 23 (10.3%) |
| 1 or 2 Children | 0 (0.0%) | 14 (4.7%) |
| 3 or 4 Children | 25 (20.0%) | 0 (0.0%) |
| 5 or more Children | 0 (0.0%) | 0 (0.0%) |
| Total | 48 (3.5%) | 37 (6.6%) |
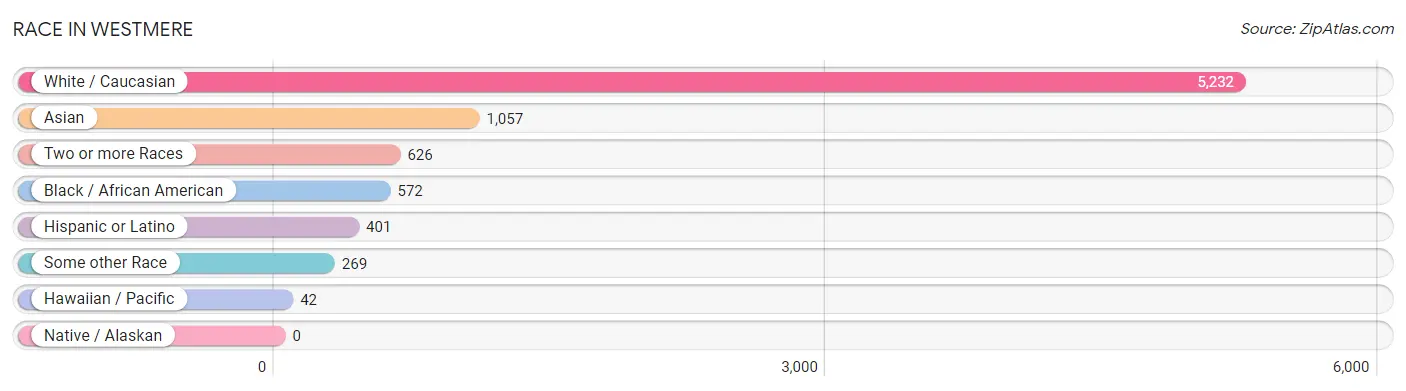
Race in Westmere
The most populous races in Westmere are White / Caucasian (5,232 | 67.1%), Asian (1,057 | 13.6%), and Two or more Races (626 | 8.0%).
| Race | # Population | % Population |
| Asian | 1,057 | 13.6% |
| Black / African American | 572 | 7.3% |
| Hawaiian / Pacific | 42 | 0.5% |
| Hispanic or Latino | 401 | 5.1% |
| Native / Alaskan | 0 | 0.0% |
| White / Caucasian | 5,232 | 67.1% |
| Two or more Races | 626 | 8.0% |
| Some other Race | 269 | 3.5% |
| Total | 7,798 | 100.0% |
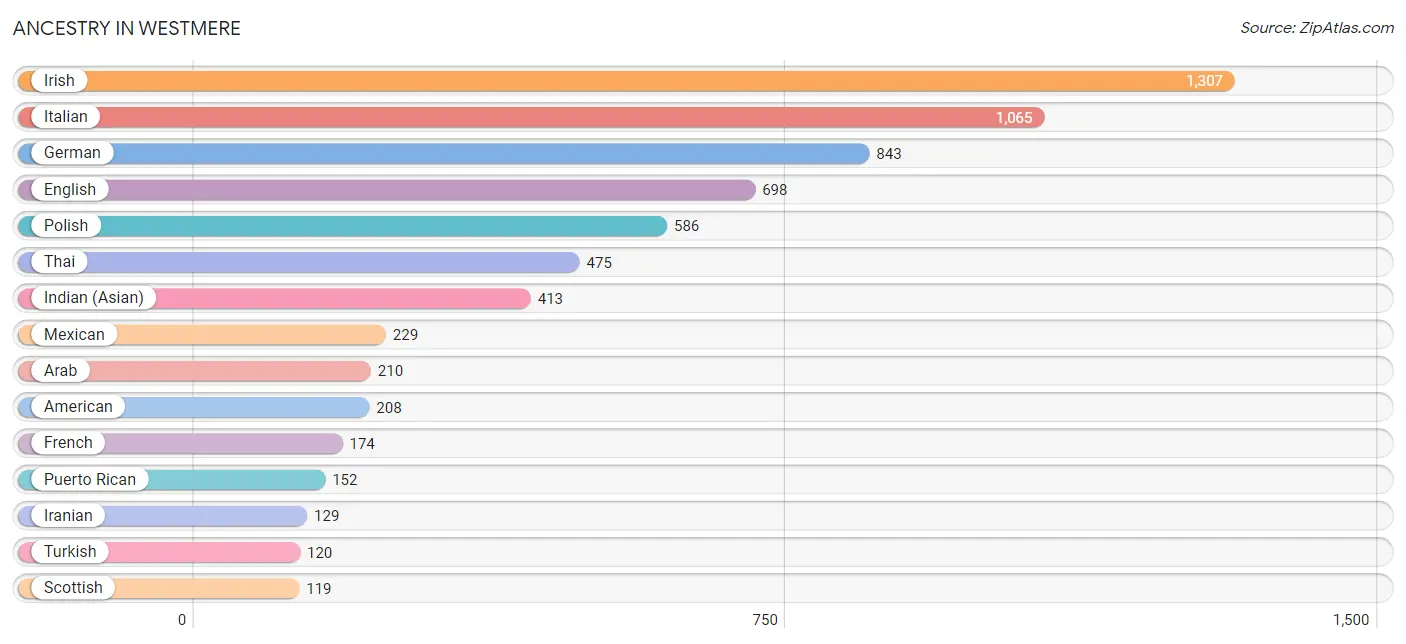
Ancestry in Westmere
The most populous ancestries reported in Westmere are Irish (1,307 | 16.8%), Italian (1,065 | 13.7%), German (843 | 10.8%), English (698 | 8.9%), and Polish (586 | 7.5%), together accounting for 57.7% of all Westmere residents.
| Ancestry | # Population | % Population |
| Afghan | 11 | 0.1% |
| Alsatian | 5 | 0.1% |
| American | 208 | 2.7% |
| Arab | 210 | 2.7% |
| Austrian | 7 | 0.1% |
| Barbadian | 34 | 0.4% |
| British | 21 | 0.3% |
| Burmese | 81 | 1.0% |
| Central American | 12 | 0.2% |
| Danish | 15 | 0.2% |
| Dutch | 107 | 1.4% |
| Eastern European | 22 | 0.3% |
| English | 698 | 8.9% |
| European | 64 | 0.8% |
| Filipino | 42 | 0.5% |
| French | 174 | 2.2% |
| French Canadian | 52 | 0.7% |
| German | 843 | 10.8% |
| Greek | 77 | 1.0% |
| Hungarian | 69 | 0.9% |
| Indian (Asian) | 413 | 5.3% |
| Iranian | 129 | 1.7% |
| Irish | 1,307 | 16.8% |
| Italian | 1,065 | 13.7% |
| Jamaican | 90 | 1.1% |
| Korean | 112 | 1.4% |
| Lebanese | 97 | 1.2% |
| Lithuanian | 25 | 0.3% |
| Luxembourger | 22 | 0.3% |
| Macedonian | 47 | 0.6% |
| Mexican | 229 | 2.9% |
| Norwegian | 9 | 0.1% |
| Polish | 586 | 7.5% |
| Puerto Rican | 152 | 1.9% |
| Romanian | 40 | 0.5% |
| Russian | 89 | 1.1% |
| Salvadoran | 12 | 0.2% |
| Scotch-Irish | 74 | 0.9% |
| Scottish | 119 | 1.5% |
| Spaniard | 8 | 0.1% |
| Swedish | 17 | 0.2% |
| Thai | 475 | 6.1% |
| Turkish | 120 | 1.5% |
| Ukrainian | 29 | 0.4% |
| Vietnamese | 10 | 0.1% |
| Welsh | 39 | 0.5% | View All 46 Rows |
Immigrants in Westmere
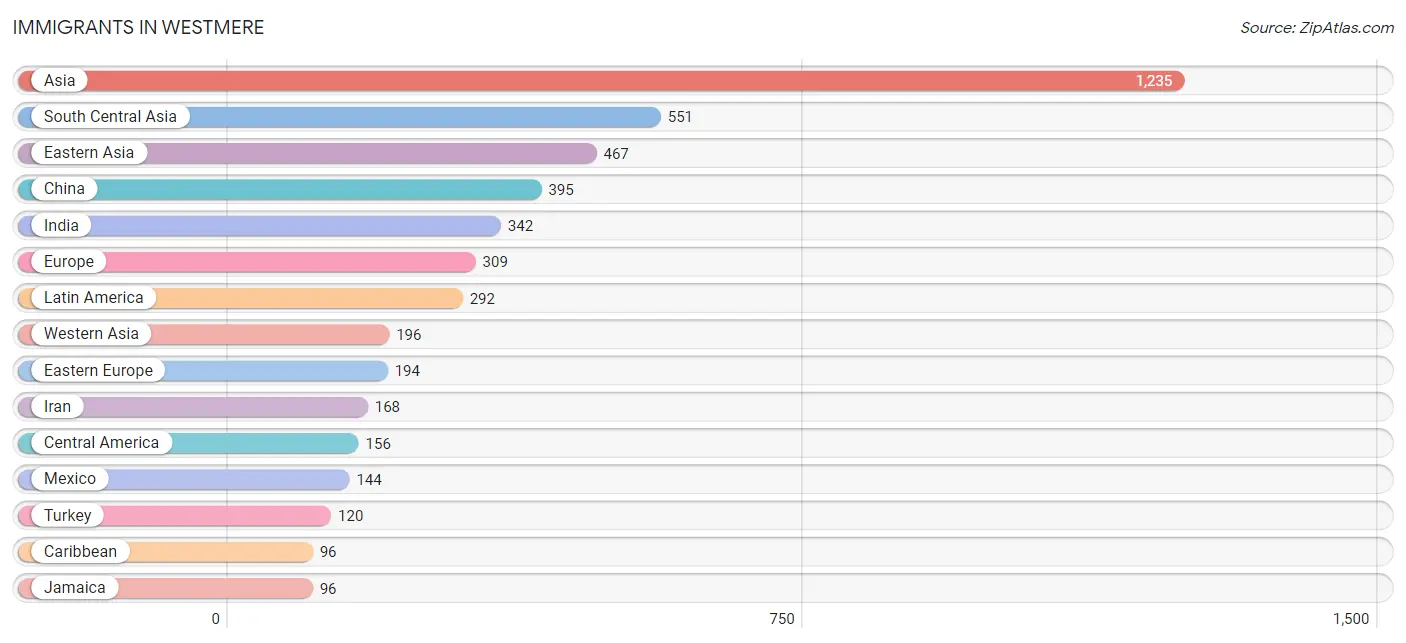
The most numerous immigrant groups reported in Westmere came from Asia (1,235 | 15.8%), South Central Asia (551 | 7.1%), Eastern Asia (467 | 6.0%), China (395 | 5.1%), and India (342 | 4.4%), together accounting for 38.4% of all Westmere residents.
| Immigration Origin | # Population | % Population |
| Afghanistan | 11 | 0.1% |
| Albania | 24 | 0.3% |
| Asia | 1,235 | 15.8% |
| Bangladesh | 23 | 0.3% |
| Belgium | 9 | 0.1% |
| Brazil | 37 | 0.5% |
| Canada | 15 | 0.2% |
| Caribbean | 96 | 1.2% |
| Central America | 156 | 2.0% |
| China | 395 | 5.1% |
| Eastern Asia | 467 | 6.0% |
| Eastern Europe | 194 | 2.5% |
| El Salvador | 12 | 0.2% |
| England | 8 | 0.1% |
| Europe | 309 | 4.0% |
| Fiji | 8 | 0.1% |
| Guyana | 3 | 0.0% |
| Hungary | 39 | 0.5% |
| India | 342 | 4.4% |
| Iran | 168 | 2.1% |
| Ireland | 26 | 0.3% |
| Italy | 72 | 0.9% |
| Jamaica | 96 | 1.2% |
| Jordan | 40 | 0.5% |
| Korea | 72 | 0.9% |
| Latin America | 292 | 3.7% |
| Mexico | 144 | 1.8% |
| Micronesia | 19 | 0.2% |
| Northern Europe | 34 | 0.4% |
| Oceania | 49 | 0.6% |
| Philippines | 16 | 0.2% |
| Romania | 26 | 0.3% |
| Russia | 58 | 0.7% |
| South America | 40 | 0.5% |
| South Central Asia | 551 | 7.1% |
| South Eastern Asia | 21 | 0.3% |
| Southern Europe | 72 | 0.9% |
| Taiwan | 68 | 0.9% |
| Turkey | 120 | 1.5% |
| Vietnam | 5 | 0.1% |
| Western Asia | 196 | 2.5% |
| Western Europe | 9 | 0.1% |
| Yemen | 36 | 0.5% | View All 43 Rows |
Sex and Age in Westmere
Sex and Age in Westmere
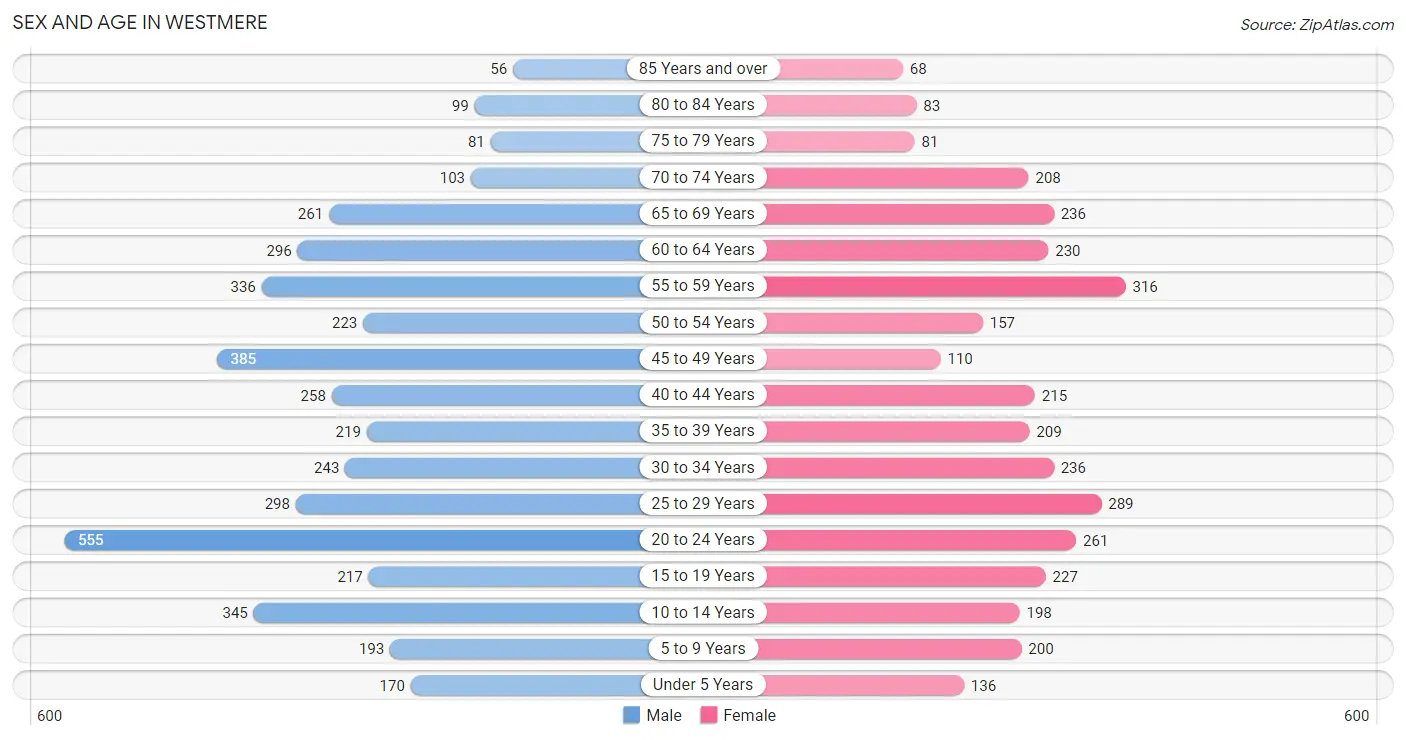
The most populous age groups in Westmere are 20 to 24 Years (555 | 12.8%) for men and 55 to 59 Years (316 | 9.1%) for women.
| Age Bracket | Male | Female |
| Under 5 Years | 170 (3.9%) | 136 (3.9%) |
| 5 to 9 Years | 193 (4.4%) | 200 (5.8%) |
| 10 to 14 Years | 345 (8.0%) | 198 (5.7%) |
| 15 to 19 Years | 217 (5.0%) | 227 (6.6%) |
| 20 to 24 Years | 555 (12.8%) | 261 (7.5%) |
| 25 to 29 Years | 298 (6.9%) | 289 (8.4%) |
| 30 to 34 Years | 243 (5.6%) | 236 (6.8%) |
| 35 to 39 Years | 219 (5.1%) | 209 (6.0%) |
| 40 to 44 Years | 258 (5.9%) | 215 (6.2%) |
| 45 to 49 Years | 385 (8.9%) | 110 (3.2%) |
| 50 to 54 Years | 223 (5.1%) | 157 (4.5%) |
| 55 to 59 Years | 336 (7.7%) | 316 (9.1%) |
| 60 to 64 Years | 296 (6.8%) | 230 (6.7%) |
| 65 to 69 Years | 261 (6.0%) | 236 (6.8%) |
| 70 to 74 Years | 103 (2.4%) | 208 (6.0%) |
| 75 to 79 Years | 81 (1.9%) | 81 (2.3%) |
| 80 to 84 Years | 99 (2.3%) | 83 (2.4%) |
| 85 Years and over | 56 (1.3%) | 68 (2.0%) |
| Total | 4,338 (100.0%) | 3,460 (100.0%) |
Families and Households in Westmere
Median Family Size in Westmere
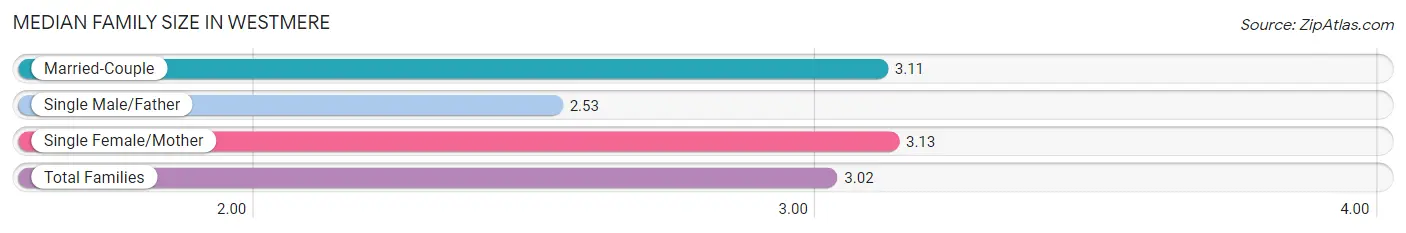
The median family size in Westmere is 3.02 persons per family, with single female/mother families (248 | 12.7%) accounting for the largest median family size of 3.13 persons per family. On the other hand, single male/father families (316 | 16.2%) represent the smallest median family size with 2.53 persons per family.
| Family Type | # Families | Family Size |
| Married-Couple | 1,392 (71.2%) | 3.11 |
| Single Male/Father | 316 (16.2%) | 2.53 |
| Single Female/Mother | 248 (12.7%) | 3.13 |
| Total Families | 1,956 (100.0%) | 3.02 |
Median Household Size in Westmere
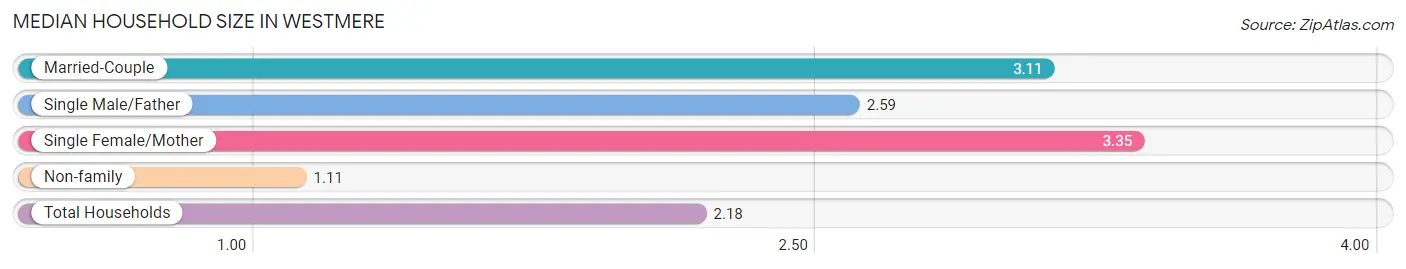
The median household size in Westmere is 2.18 persons per household, with single female/mother households (248 | 7.0%) accounting for the largest median household size of 3.35 persons per household. non-family households (1,590 | 44.8%) represent the smallest median household size with 1.11 persons per household.
| Household Type | # Households | Household Size |
| Married-Couple | 1,392 (39.3%) | 3.11 |
| Single Male/Father | 316 (8.9%) | 2.59 |
| Single Female/Mother | 248 (7.0%) | 3.35 |
| Non-family | 1,590 (44.8%) | 1.11 |
| Total Households | 3,546 (100.0%) | 2.18 |
Household Size by Marriage Status in Westmere
Out of a total of 3,546 households in Westmere, 1,956 (55.2%) are family households, while 1,590 (44.8%) are nonfamily households. The most numerous type of family households are 2-person households, comprising 988, and the most common type of nonfamily households are 1-person households, comprising 1,404.
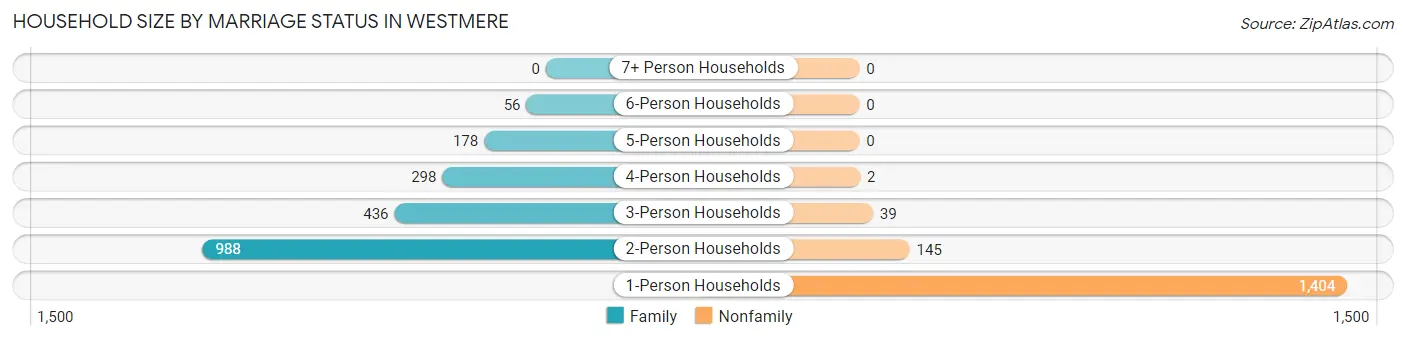
| Household Size | Family Households | Nonfamily Households |
| 1-Person Households | - | 1,404 (39.6%) |
| 2-Person Households | 988 (27.9%) | 145 (4.1%) |
| 3-Person Households | 436 (12.3%) | 39 (1.1%) |
| 4-Person Households | 298 (8.4%) | 2 (0.1%) |
| 5-Person Households | 178 (5.0%) | 0 (0.0%) |
| 6-Person Households | 56 (1.6%) | 0 (0.0%) |
| 7+ Person Households | 0 (0.0%) | 0 (0.0%) |
| Total | 1,956 (55.2%) | 1,590 (44.8%) |
Female Fertility in Westmere
Fertility by Age in Westmere
Average fertility rate in Westmere is 14.0 births per 1,000 women. Women in the age bracket of 20 to 34 years have the highest fertility rate with 28.0 births per 1,000 women. Women in the age bracket of 20 to 34 years acount for 100.0% of all women with births.
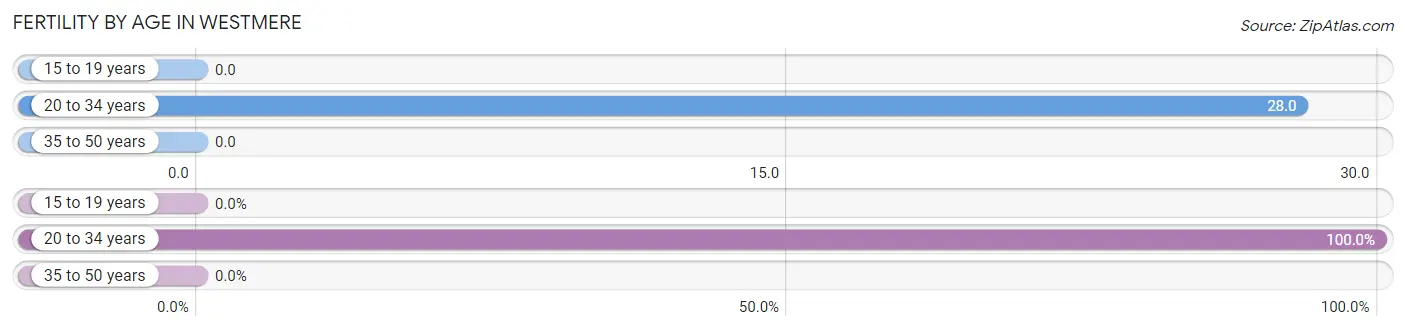
| Age Bracket | Women with Births | Births / 1,000 Women |
| 15 to 19 years | 0 (0.0%) | 0.0 |
| 20 to 34 years | 22 (100.0%) | 28.0 |
| 35 to 50 years | 0 (0.0%) | 0.0 |
| Total | 22 (100.0%) | 14.0 |
Fertility by Age by Marriage Status in Westmere
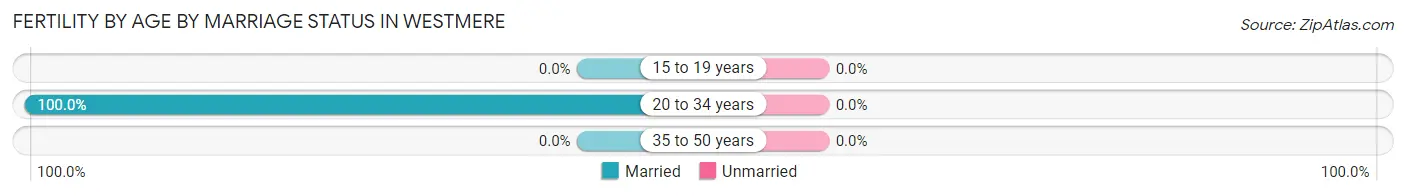
| Age Bracket | Married | Unmarried |
| 15 to 19 years | 0 (0.0%) | 0 (0.0%) |
| 20 to 34 years | 22 (100.0%) | 0 (0.0%) |
| 35 to 50 years | 0 (0.0%) | 0 (0.0%) |
| Total | 22 (100.0%) | 0 (0.0%) |
Fertility by Education in Westmere
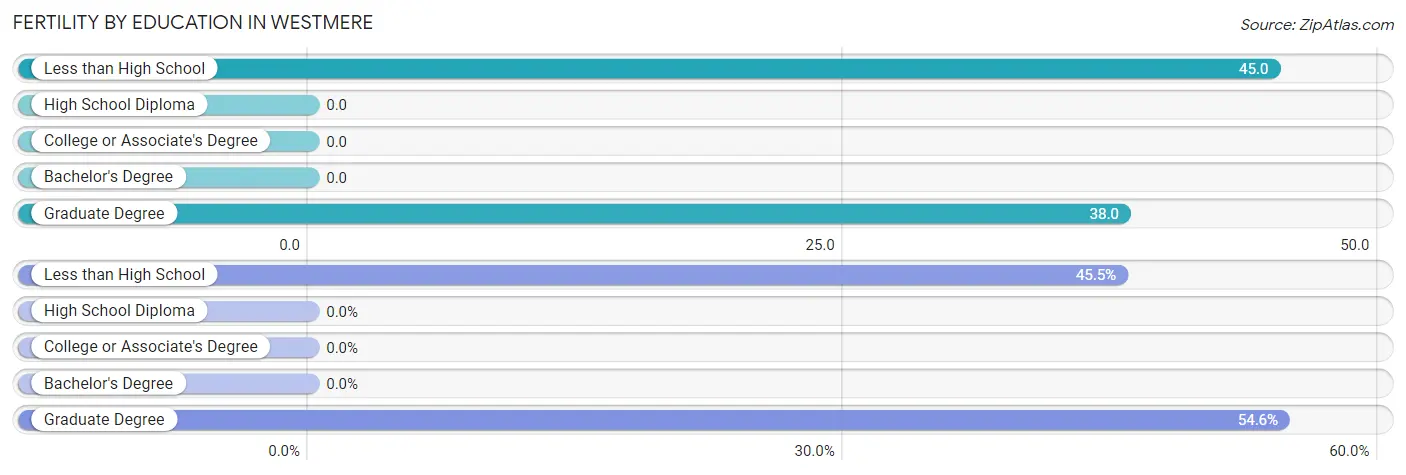
| Educational Attainment | Women with Births | Births / 1,000 Women |
| Less than High School | 10 (45.5%) | 45.0 |
| High School Diploma | 0 (0.0%) | 0.0 |
| College or Associate's Degree | 0 (0.0%) | 0.0 |
| Bachelor's Degree | 0 (0.0%) | 0.0 |
| Graduate Degree | 12 (54.5%) | 38.0 |
| Total | 22 (100.0%) | 14.0 |
Fertility by Education by Marriage Status in Westmere
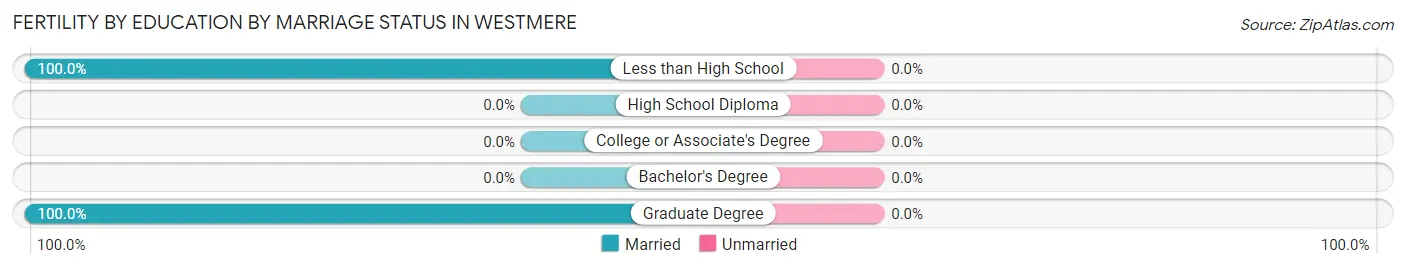
| Educational Attainment | Married | Unmarried |
| Less than High School | 10 (100.0%) | 0 (0.0%) |
| High School Diploma | 0 (0.0%) | 0 (0.0%) |
| College or Associate's Degree | 0 (0.0%) | 0 (0.0%) |
| Bachelor's Degree | 0 (0.0%) | 0 (0.0%) |
| Graduate Degree | 12 (100.0%) | 0 (0.0%) |
| Total | 22 (100.0%) | 0 (0.0%) |
Employment Characteristics in Westmere
Employment by Class of Employer in Westmere
Among the 4,350 employed individuals in Westmere, private company employees (2,446 | 56.2%), state government employees (637 | 14.6%), and not-for-profit organizations (443 | 10.2%) make up the most common classes of employment.
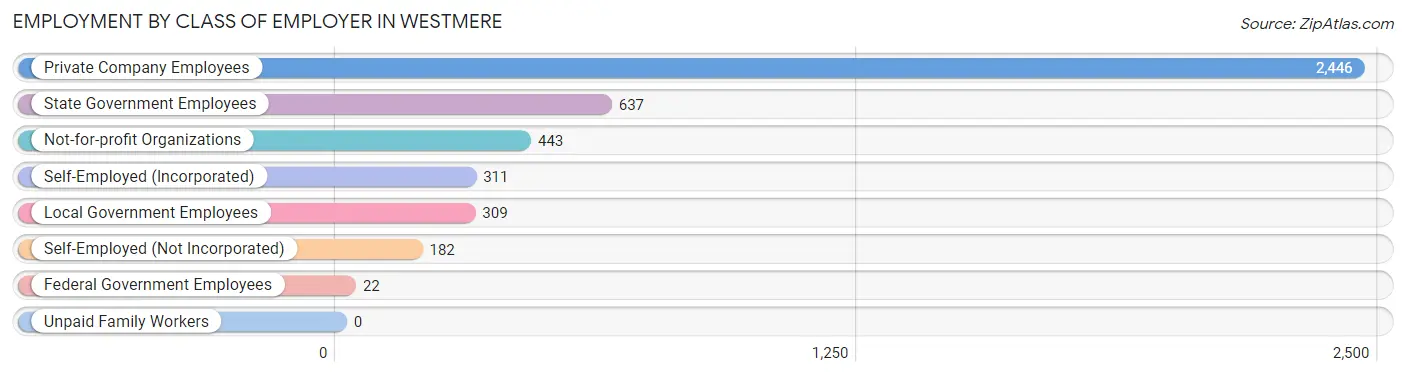
| Employer Class | # Employees | % Employees |
| Private Company Employees | 2,446 | 56.2% |
| Self-Employed (Incorporated) | 311 | 7.1% |
| Self-Employed (Not Incorporated) | 182 | 4.2% |
| Not-for-profit Organizations | 443 | 10.2% |
| Local Government Employees | 309 | 7.1% |
| State Government Employees | 637 | 14.6% |
| Federal Government Employees | 22 | 0.5% |
| Unpaid Family Workers | 0 | 0.0% |
| Total | 4,350 | 100.0% |
Employment Status by Age in Westmere
According to the labor force statistics for Westmere, out of the total population over 16 years of age (6,459), 69.2% or 4,470 individuals are in the labor force, with 0.5% or 22 of them unemployed. The age group with the highest labor force participation rate is 25 to 29 years, with 98.3% or 577 individuals in the labor force. Within the labor force, the 30 to 34 years age range has the highest percentage of unemployed individuals, with 2.6% or 10 of them being unemployed.
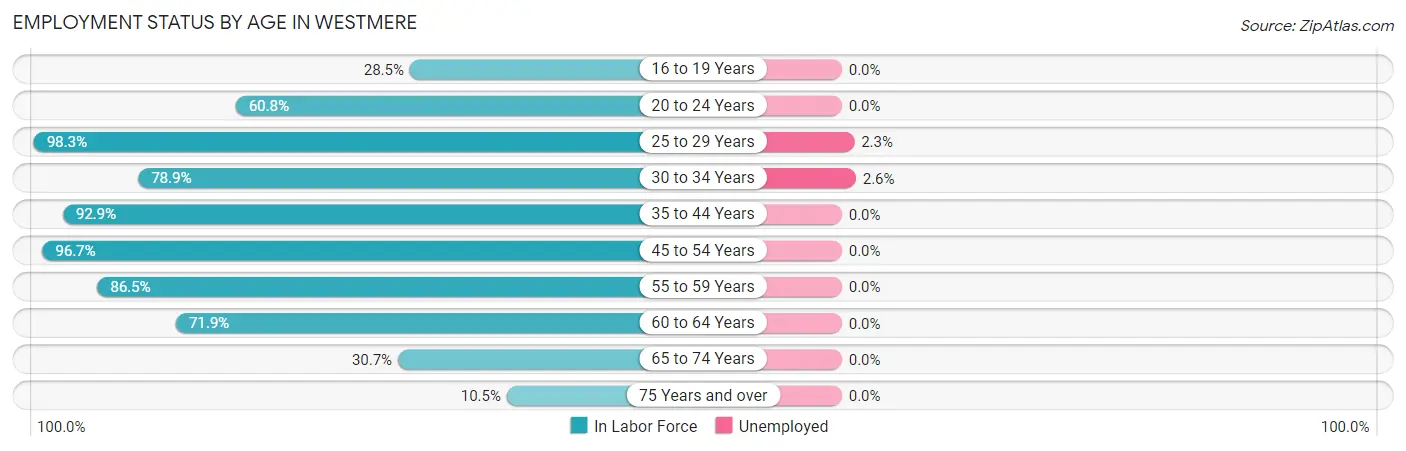
| Age Bracket | In Labor Force | Unemployed |
| 16 to 19 Years | 99 (28.5%) | 0 (0.0%) |
| 20 to 24 Years | 496 (60.8%) | 0 (0.0%) |
| 25 to 29 Years | 577 (98.3%) | 13 (2.3%) |
| 30 to 34 Years | 378 (78.9%) | 10 (2.6%) |
| 35 to 44 Years | 837 (92.9%) | 0 (0.0%) |
| 45 to 54 Years | 846 (96.7%) | 0 (0.0%) |
| 55 to 59 Years | 564 (86.5%) | 0 (0.0%) |
| 60 to 64 Years | 378 (71.9%) | 0 (0.0%) |
| 65 to 74 Years | 248 (30.7%) | 0 (0.0%) |
| 75 Years and over | 49 (10.5%) | 0 (0.0%) |
| Total | 4,470 (69.2%) | 22 (0.5%) |
Employment Status by Educational Attainment in Westmere
According to labor force statistics for Westmere, 89.1% of individuals (3,582) out of the total population between 25 and 64 years of age (4,020) are in the labor force, with 0.6% or 21 of them being unemployed. The group with the highest labor force participation rate are those with the educational attainment of bachelor's degree or higher, with 92.9% or 2,082 individuals in the labor force. Within the labor force, individuals with less than high school education have the highest percentage of unemployment, with 8.7% or 10 of them being unemployed.
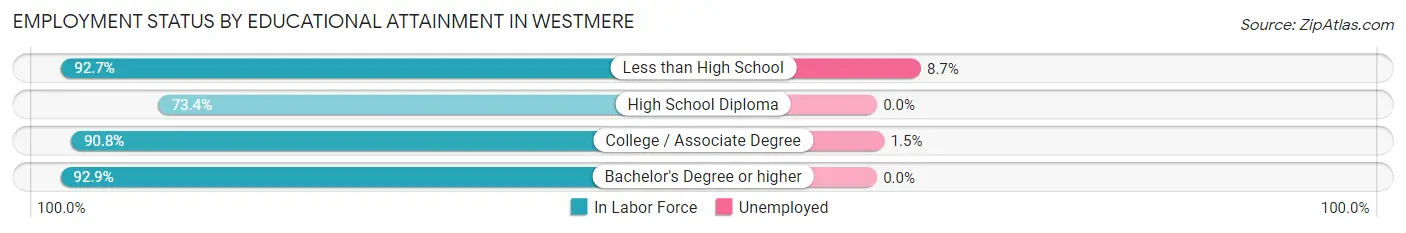
| Educational Attainment | In Labor Force | Unemployed |
| Less than High School | 115 (92.7%) | 11 (8.7%) |
| High School Diploma | 500 (73.4%) | 0 (0.0%) |
| College / Associate Degree | 884 (90.8%) | 15 (1.5%) |
| Bachelor's Degree or higher | 2,082 (92.9%) | 0 (0.0%) |
| Total | 3,582 (89.1%) | 24 (0.6%) |
Employment Occupations by Sex in Westmere
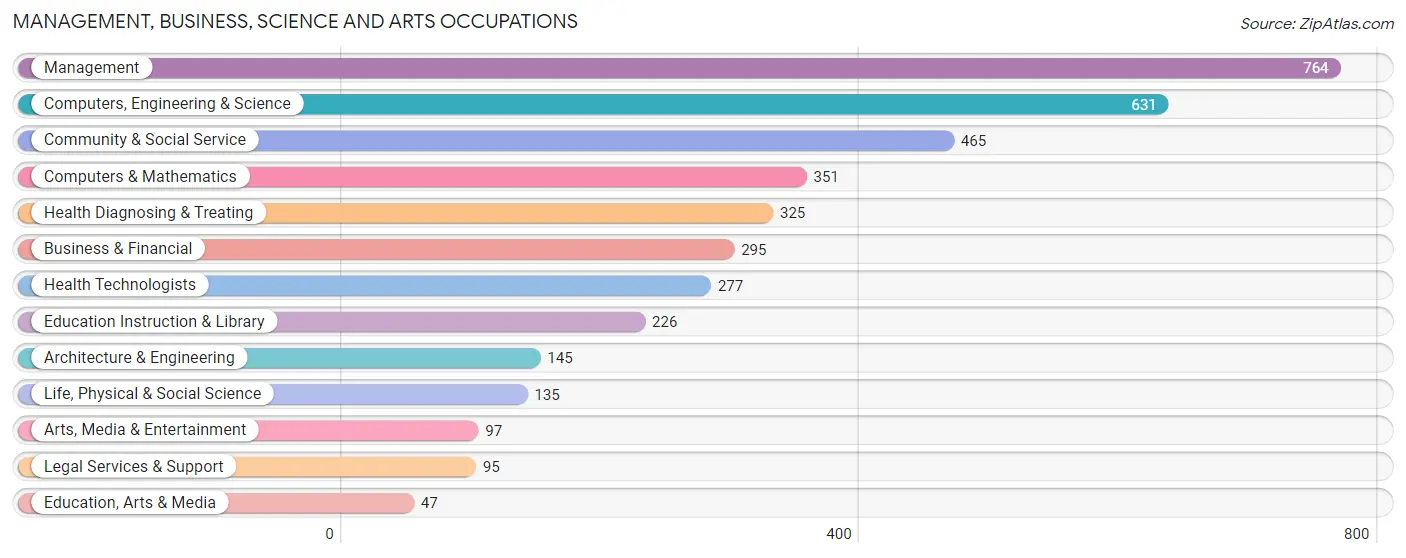
Management, Business, Science and Arts Occupations
The most common Management, Business, Science and Arts occupations in Westmere are Management (764 | 17.2%), Computers, Engineering & Science (631 | 14.2%), Community & Social Service (465 | 10.4%), Computers & Mathematics (351 | 7.9%), and Health Diagnosing & Treating (325 | 7.3%).
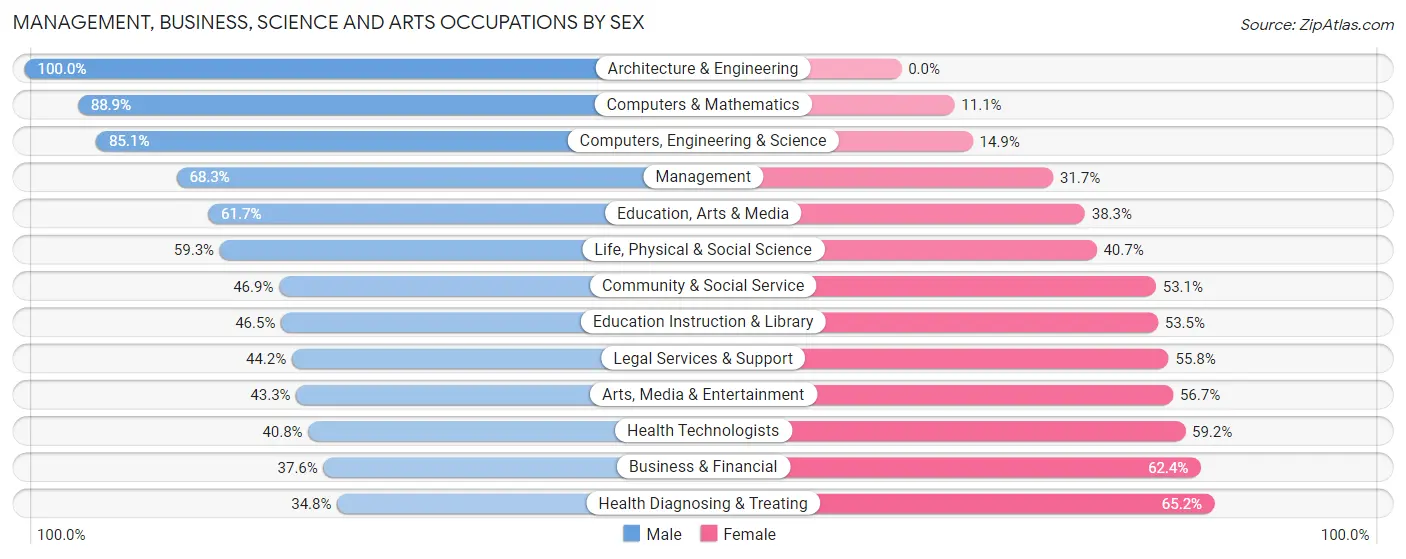
Management, Business, Science and Arts Occupations by Sex
Within the Management, Business, Science and Arts occupations in Westmere, the most male-oriented occupations are Architecture & Engineering (100.0%), Computers & Mathematics (88.9%), and Computers, Engineering & Science (85.1%), while the most female-oriented occupations are Health Diagnosing & Treating (65.2%), Business & Financial (62.4%), and Health Technologists (59.2%).
| Occupation | Male | Female |
| Management | 522 (68.3%) | 242 (31.7%) |
| Business & Financial | 111 (37.6%) | 184 (62.4%) |
| Computers, Engineering & Science | 537 (85.1%) | 94 (14.9%) |
| Computers & Mathematics | 312 (88.9%) | 39 (11.1%) |
| Architecture & Engineering | 145 (100.0%) | 0 (0.0%) |
| Life, Physical & Social Science | 80 (59.3%) | 55 (40.7%) |
| Community & Social Service | 218 (46.9%) | 247 (53.1%) |
| Education, Arts & Media | 29 (61.7%) | 18 (38.3%) |
| Legal Services & Support | 42 (44.2%) | 53 (55.8%) |
| Education Instruction & Library | 105 (46.5%) | 121 (53.5%) |
| Arts, Media & Entertainment | 42 (43.3%) | 55 (56.7%) |
| Health Diagnosing & Treating | 113 (34.8%) | 212 (65.2%) |
| Health Technologists | 113 (40.8%) | 164 (59.2%) |
| Total (Category) | 1,501 (60.5%) | 979 (39.5%) |
| Total (Overall) | 2,633 (59.2%) | 1,816 (40.8%) |
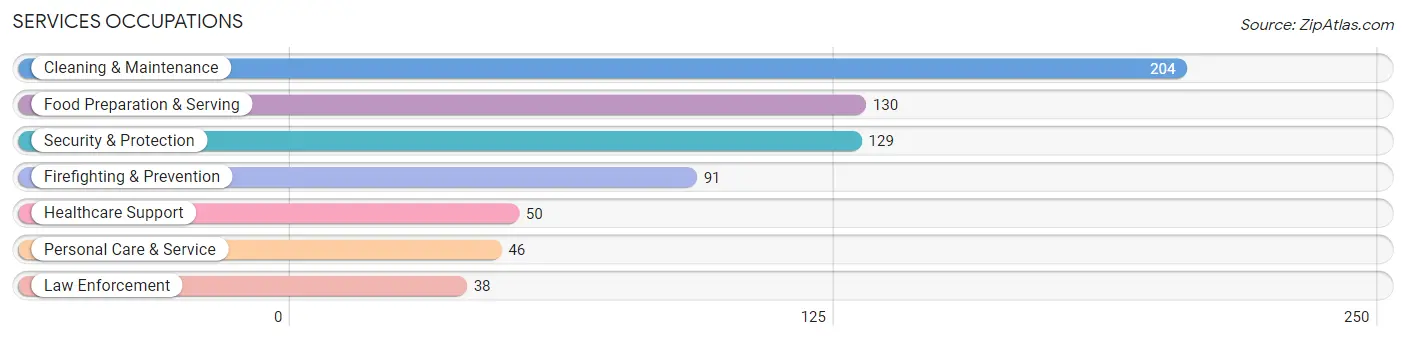
Services Occupations
The most common Services occupations in Westmere are Cleaning & Maintenance (204 | 4.6%), Food Preparation & Serving (130 | 2.9%), Security & Protection (129 | 2.9%), Firefighting & Prevention (91 | 2.1%), and Healthcare Support (50 | 1.1%).
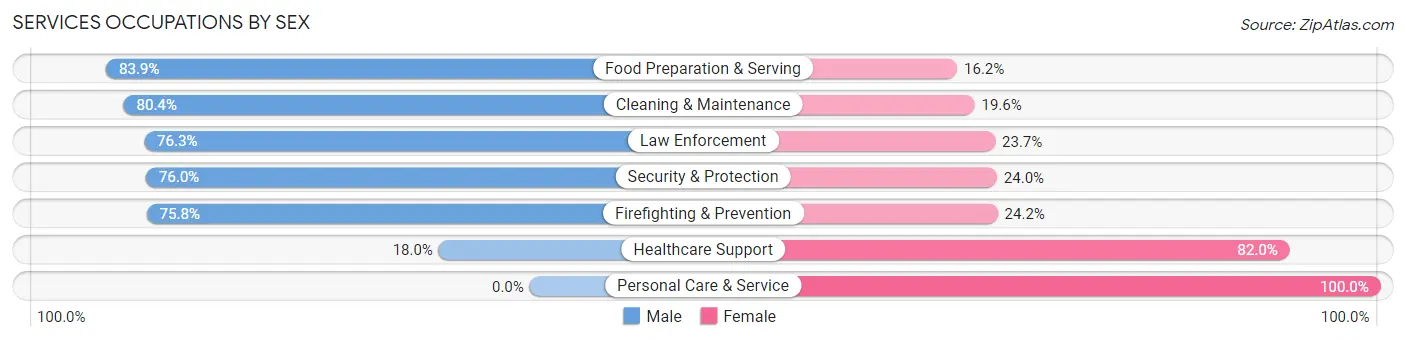
Services Occupations by Sex
Within the Services occupations in Westmere, the most male-oriented occupations are Food Preparation & Serving (83.9%), Cleaning & Maintenance (80.4%), and Law Enforcement (76.3%), while the most female-oriented occupations are Personal Care & Service (100.0%), Healthcare Support (82.0%), and Firefighting & Prevention (24.2%).
| Occupation | Male | Female |
| Healthcare Support | 9 (18.0%) | 41 (82.0%) |
| Security & Protection | 98 (76.0%) | 31 (24.0%) |
| Firefighting & Prevention | 69 (75.8%) | 22 (24.2%) |
| Law Enforcement | 29 (76.3%) | 9 (23.7%) |
| Food Preparation & Serving | 109 (83.9%) | 21 (16.2%) |
| Cleaning & Maintenance | 164 (80.4%) | 40 (19.6%) |
| Personal Care & Service | 0 (0.0%) | 46 (100.0%) |
| Total (Category) | 380 (68.0%) | 179 (32.0%) |
| Total (Overall) | 2,633 (59.2%) | 1,816 (40.8%) |
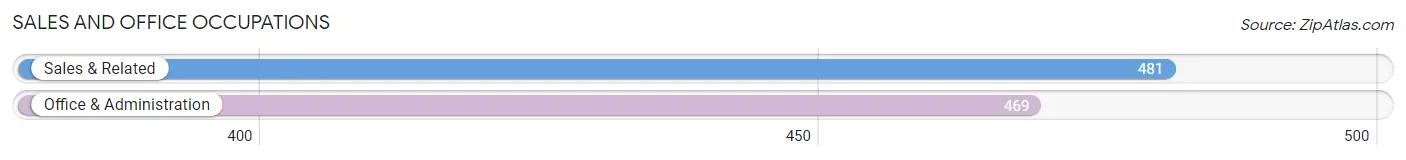
Sales and Office Occupations
The most common Sales and Office occupations in Westmere are Sales & Related (481 | 10.8%), and Office & Administration (469 | 10.5%).
Sales and Office Occupations by Sex
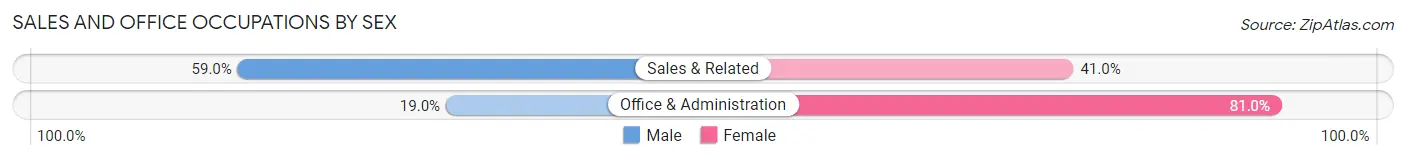
| Occupation | Male | Female |
| Sales & Related | 284 (59.0%) | 197 (41.0%) |
| Office & Administration | 89 (19.0%) | 380 (81.0%) |
| Total (Category) | 373 (39.3%) | 577 (60.7%) |
| Total (Overall) | 2,633 (59.2%) | 1,816 (40.8%) |
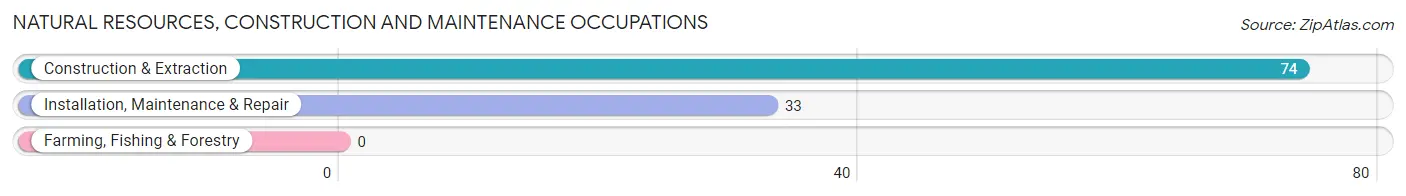
Natural Resources, Construction and Maintenance Occupations
The most common Natural Resources, Construction and Maintenance occupations in Westmere are Construction & Extraction (74 | 1.7%), and Installation, Maintenance & Repair (33 | 0.7%).
Natural Resources, Construction and Maintenance Occupations by Sex
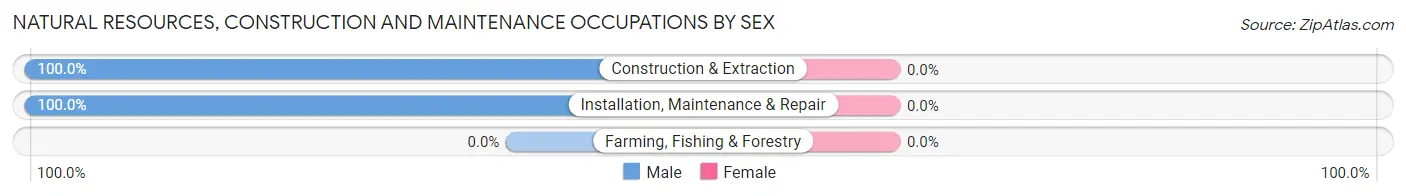
| Occupation | Male | Female |
| Farming, Fishing & Forestry | 0 (0.0%) | 0 (0.0%) |
| Construction & Extraction | 74 (100.0%) | 0 (0.0%) |
| Installation, Maintenance & Repair | 33 (100.0%) | 0 (0.0%) |
| Total (Category) | 107 (100.0%) | 0 (0.0%) |
| Total (Overall) | 2,633 (59.2%) | 1,816 (40.8%) |
Production, Transportation and Moving Occupations
The most common Production, Transportation and Moving occupations in Westmere are Transportation (138 | 3.1%), Production (115 | 2.6%), and Material Moving (100 | 2.2%).
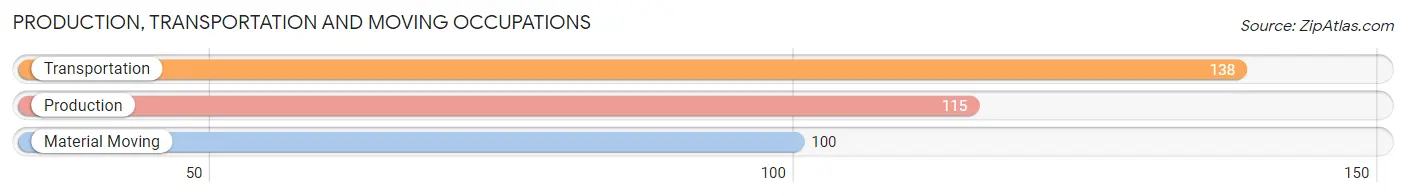
Production, Transportation and Moving Occupations by Sex
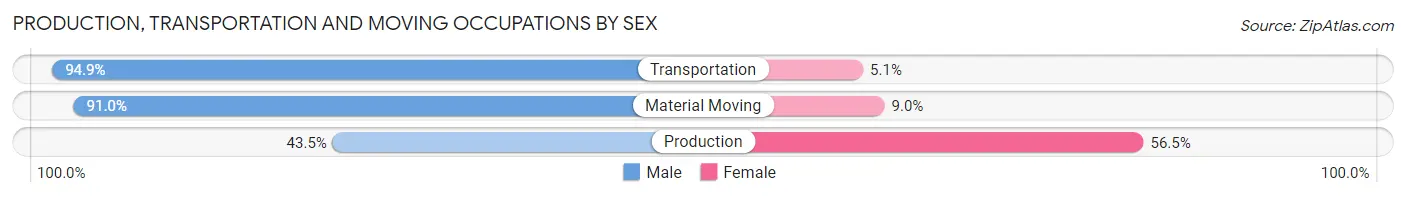
| Occupation | Male | Female |
| Production | 50 (43.5%) | 65 (56.5%) |
| Transportation | 131 (94.9%) | 7 (5.1%) |
| Material Moving | 91 (91.0%) | 9 (9.0%) |
| Total (Category) | 272 (77.0%) | 81 (23.0%) |
| Total (Overall) | 2,633 (59.2%) | 1,816 (40.8%) |
Employment Industries by Sex in Westmere
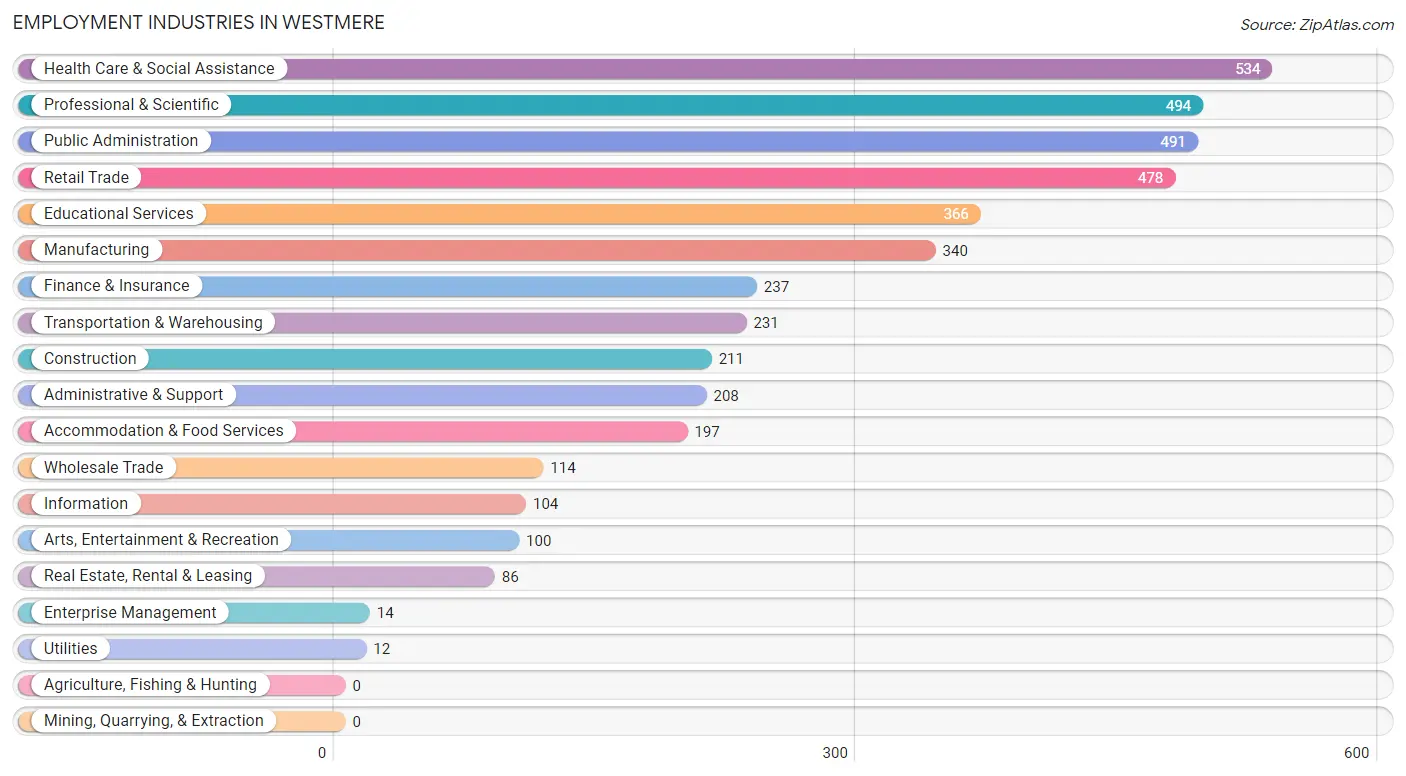
Employment Industries in Westmere
The major employment industries in Westmere include Health Care & Social Assistance (534 | 12.0%), Professional & Scientific (494 | 11.1%), Public Administration (491 | 11.0%), Retail Trade (478 | 10.7%), and Educational Services (366 | 8.2%).
Employment Industries by Sex in Westmere
The Westmere industries that see more men than women are Construction (100.0%), Transportation & Warehousing (100.0%), and Enterprise Management (100.0%), whereas the industries that tend to have a higher number of women are Utilities (100.0%), Public Administration (66.6%), and Health Care & Social Assistance (54.5%).
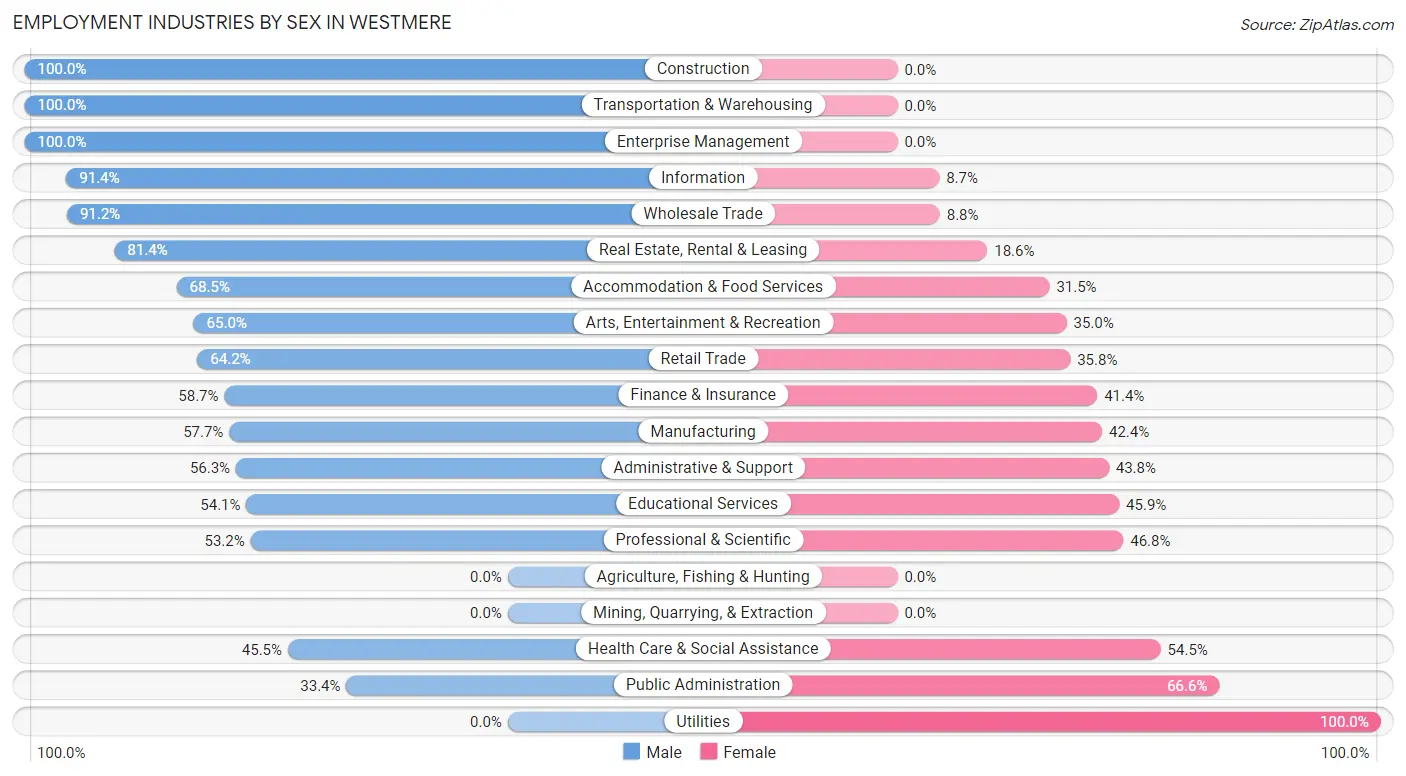
| Industry | Male | Female |
| Agriculture, Fishing & Hunting | 0 (0.0%) | 0 (0.0%) |
| Mining, Quarrying, & Extraction | 0 (0.0%) | 0 (0.0%) |
| Construction | 211 (100.0%) | 0 (0.0%) |
| Manufacturing | 196 (57.7%) | 144 (42.3%) |
| Wholesale Trade | 104 (91.2%) | 10 (8.8%) |
| Retail Trade | 307 (64.2%) | 171 (35.8%) |
| Transportation & Warehousing | 231 (100.0%) | 0 (0.0%) |
| Utilities | 0 (0.0%) | 12 (100.0%) |
| Information | 95 (91.3%) | 9 (8.6%) |
| Finance & Insurance | 139 (58.7%) | 98 (41.3%) |
| Real Estate, Rental & Leasing | 70 (81.4%) | 16 (18.6%) |
| Professional & Scientific | 263 (53.2%) | 231 (46.8%) |
| Enterprise Management | 14 (100.0%) | 0 (0.0%) |
| Administrative & Support | 117 (56.2%) | 91 (43.8%) |
| Educational Services | 198 (54.1%) | 168 (45.9%) |
| Health Care & Social Assistance | 243 (45.5%) | 291 (54.5%) |
| Arts, Entertainment & Recreation | 65 (65.0%) | 35 (35.0%) |
| Accommodation & Food Services | 135 (68.5%) | 62 (31.5%) |
| Public Administration | 164 (33.4%) | 327 (66.6%) |
| Total | 2,633 (59.2%) | 1,816 (40.8%) |
Education in Westmere
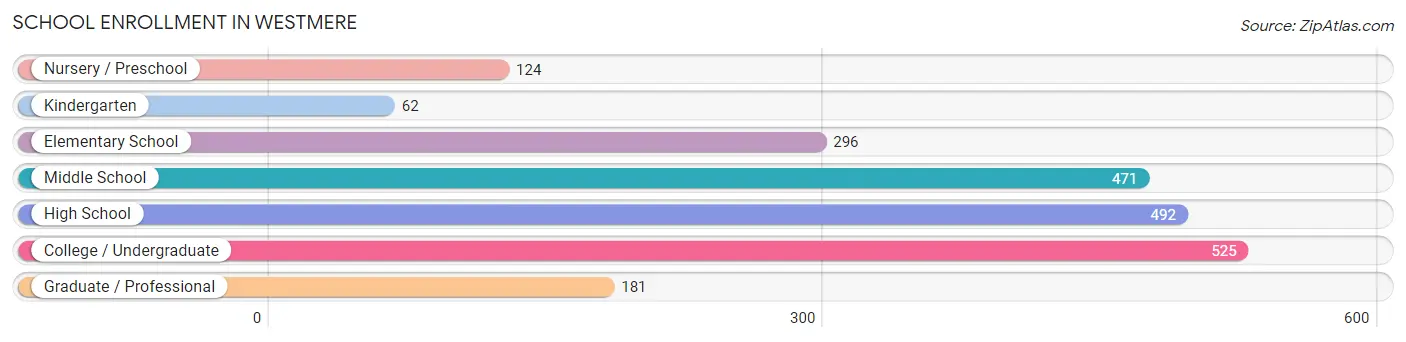
School Enrollment in Westmere
The most common levels of schooling among the 2,151 students in Westmere are college / undergraduate (525 | 24.4%), high school (492 | 22.9%), and middle school (471 | 21.9%).
| School Level | # Students | % Students |
| Nursery / Preschool | 124 | 5.8% |
| Kindergarten | 62 | 2.9% |
| Elementary School | 296 | 13.8% |
| Middle School | 471 | 21.9% |
| High School | 492 | 22.9% |
| College / Undergraduate | 525 | 24.4% |
| Graduate / Professional | 181 | 8.4% |
| Total | 2,151 | 100.0% |
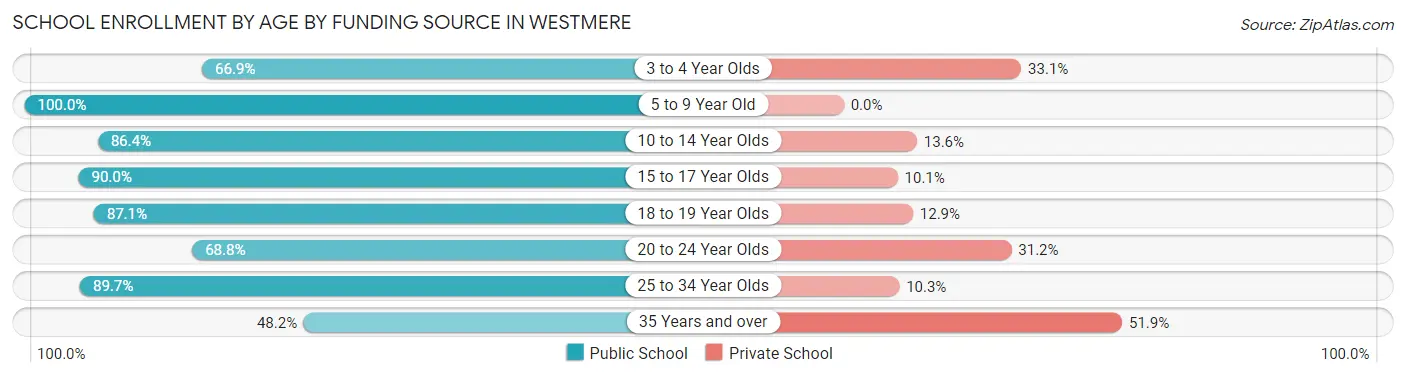
School Enrollment by Age by Funding Source in Westmere
Out of a total of 2,151 students who are enrolled in schools in Westmere, 361 (16.8%) attend a private institution, while the remaining 1,790 (83.2%) are enrolled in public schools. The age group of 35 years and over has the highest likelihood of being enrolled in private schools, with 28 (51.8% in the age bracket) enrolled. Conversely, the age group of 5 to 9 year old has the lowest likelihood of being enrolled in a private school, with 393 (100.0% in the age bracket) attending a public institution.
| Age Bracket | Public School | Private School |
| 3 to 4 Year Olds | 83 (66.9%) | 41 (33.1%) |
| 5 to 9 Year Old | 393 (100.0%) | 0 (0.0%) |
| 10 to 14 Year Olds | 469 (86.4%) | 74 (13.6%) |
| 15 to 17 Year Olds | 197 (89.9%) | 22 (10.1%) |
| 18 to 19 Year Olds | 196 (87.1%) | 29 (12.9%) |
| 20 to 24 Year Olds | 348 (68.8%) | 158 (31.2%) |
| 25 to 34 Year Olds | 78 (89.7%) | 9 (10.3%) |
| 35 Years and over | 26 (48.1%) | 28 (51.8%) |
| Total | 1,790 (83.2%) | 361 (16.8%) |
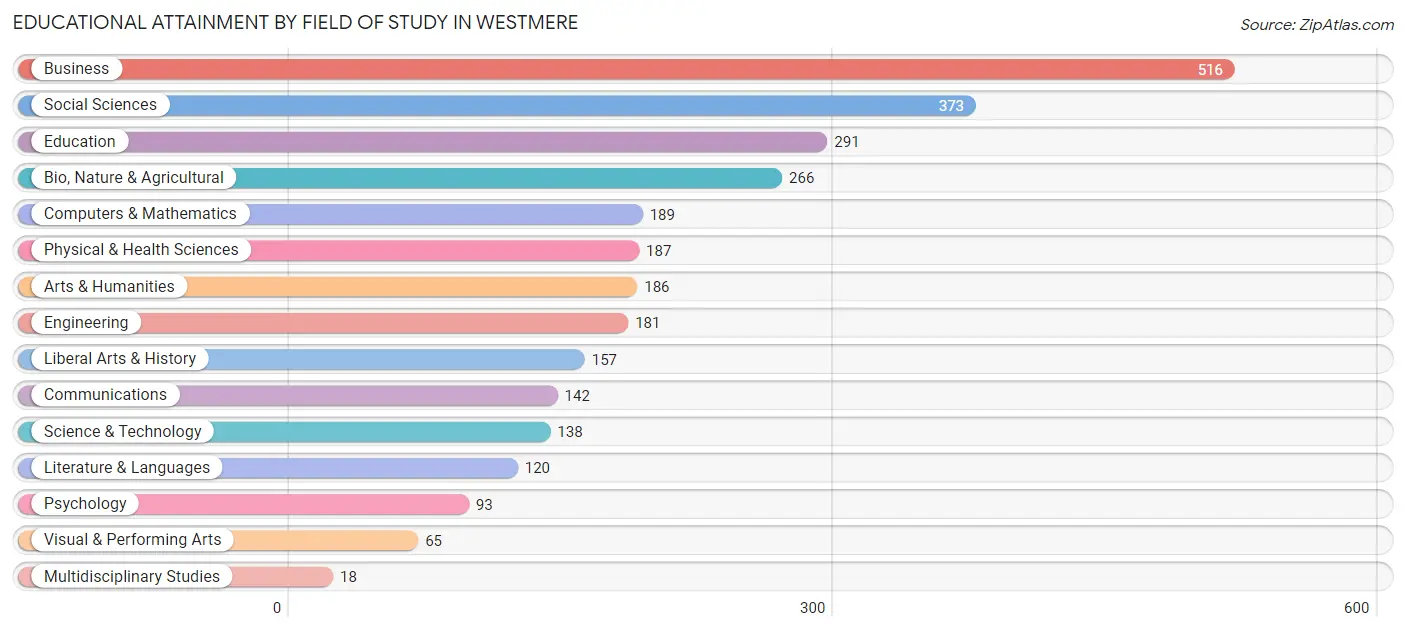
Educational Attainment by Field of Study in Westmere
Business (516 | 17.7%), social sciences (373 | 12.8%), education (291 | 10.0%), bio, nature & agricultural (266 | 9.1%), and computers & mathematics (189 | 6.5%) are the most common fields of study among 2,922 individuals in Westmere who have obtained a bachelor's degree or higher.
| Field of Study | # Graduates | % Graduates |
| Computers & Mathematics | 189 | 6.5% |
| Bio, Nature & Agricultural | 266 | 9.1% |
| Physical & Health Sciences | 187 | 6.4% |
| Psychology | 93 | 3.2% |
| Social Sciences | 373 | 12.8% |
| Engineering | 181 | 6.2% |
| Multidisciplinary Studies | 18 | 0.6% |
| Science & Technology | 138 | 4.7% |
| Business | 516 | 17.7% |
| Education | 291 | 10.0% |
| Literature & Languages | 120 | 4.1% |
| Liberal Arts & History | 157 | 5.4% |
| Visual & Performing Arts | 65 | 2.2% |
| Communications | 142 | 4.9% |
| Arts & Humanities | 186 | 6.4% |
| Total | 2,922 | 100.0% |
Transportation & Commute in Westmere
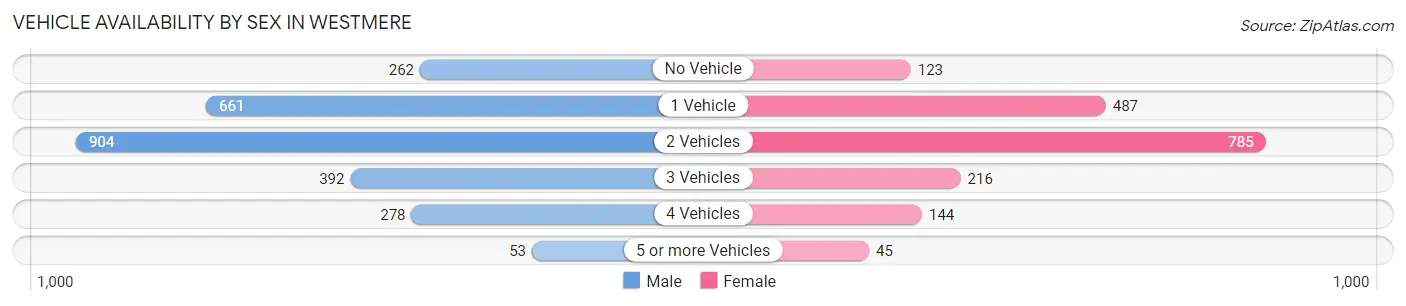
Vehicle Availability by Sex in Westmere
The most prevalent vehicle ownership categories in Westmere are males with 2 vehicles (904, accounting for 35.4%) and females with 2 vehicles (785, making up 50.2%).
| Vehicles Available | Male | Female |
| No Vehicle | 262 (10.3%) | 123 (6.8%) |
| 1 Vehicle | 661 (25.9%) | 487 (27.1%) |
| 2 Vehicles | 904 (35.4%) | 785 (43.6%) |
| 3 Vehicles | 392 (15.4%) | 216 (12.0%) |
| 4 Vehicles | 278 (10.9%) | 144 (8.0%) |
| 5 or more Vehicles | 53 (2.1%) | 45 (2.5%) |
| Total | 2,550 (100.0%) | 1,800 (100.0%) |
Commute Time in Westmere
The most frequently occuring commute durations in Westmere are 15 to 19 minutes (1,019 commuters, 26.3%), 20 to 24 minutes (874 commuters, 22.6%), and 10 to 14 minutes (608 commuters, 15.7%).
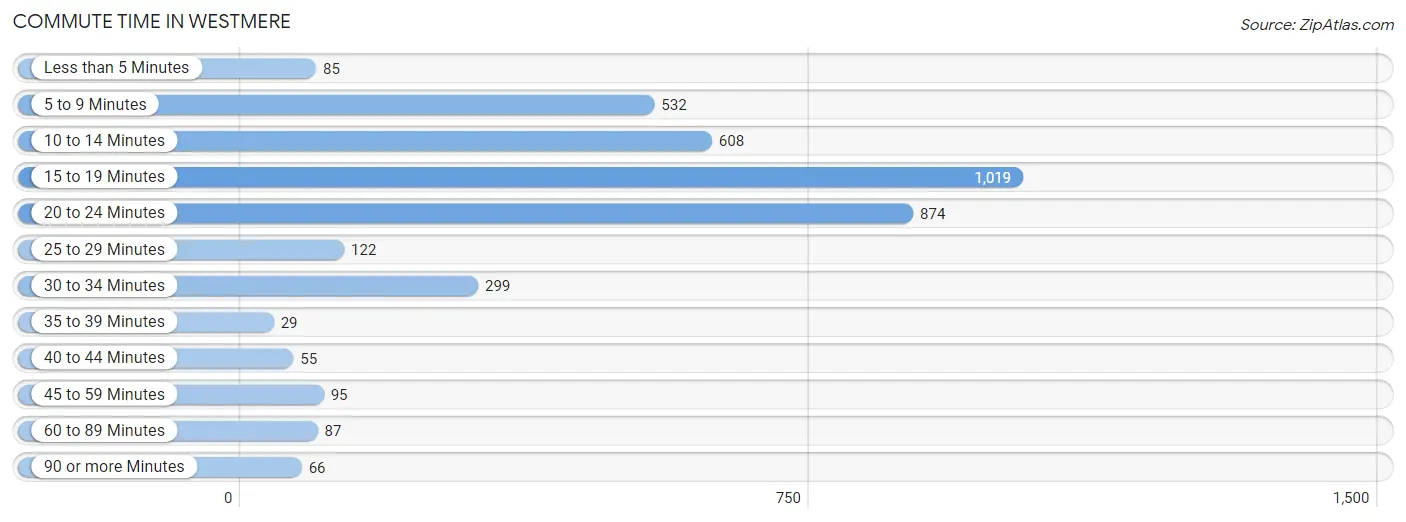
| Commute Time | # Commuters | % Commuters |
| Less than 5 Minutes | 85 | 2.2% |
| 5 to 9 Minutes | 532 | 13.7% |
| 10 to 14 Minutes | 608 | 15.7% |
| 15 to 19 Minutes | 1,019 | 26.3% |
| 20 to 24 Minutes | 874 | 22.6% |
| 25 to 29 Minutes | 122 | 3.2% |
| 30 to 34 Minutes | 299 | 7.7% |
| 35 to 39 Minutes | 29 | 0.7% |
| 40 to 44 Minutes | 55 | 1.4% |
| 45 to 59 Minutes | 95 | 2.5% |
| 60 to 89 Minutes | 87 | 2.2% |
| 90 or more Minutes | 66 | 1.7% |
Commute Time by Sex in Westmere
The most common commute times in Westmere are 15 to 19 minutes (609 commuters, 25.3%) for males and 15 to 19 minutes (410 commuters, 28.0%) for females.
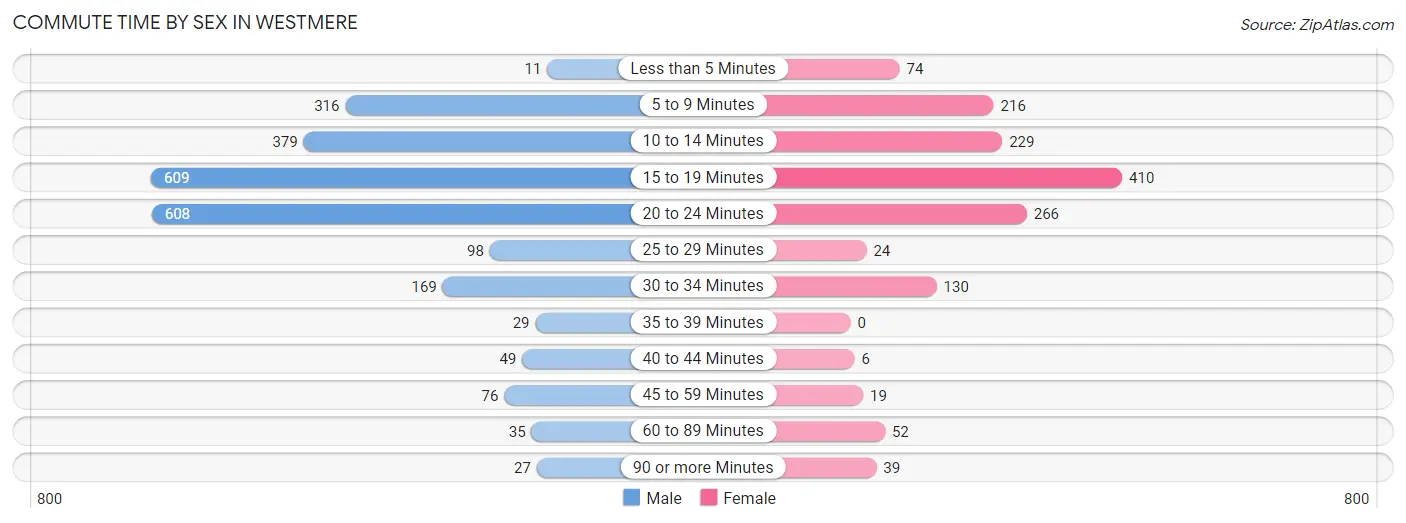
| Commute Time | Male | Female |
| Less than 5 Minutes | 11 (0.5%) | 74 (5.1%) |
| 5 to 9 Minutes | 316 (13.1%) | 216 (14.7%) |
| 10 to 14 Minutes | 379 (15.8%) | 229 (15.6%) |
| 15 to 19 Minutes | 609 (25.3%) | 410 (28.0%) |
| 20 to 24 Minutes | 608 (25.3%) | 266 (18.2%) |
| 25 to 29 Minutes | 98 (4.1%) | 24 (1.6%) |
| 30 to 34 Minutes | 169 (7.0%) | 130 (8.9%) |
| 35 to 39 Minutes | 29 (1.2%) | 0 (0.0%) |
| 40 to 44 Minutes | 49 (2.0%) | 6 (0.4%) |
| 45 to 59 Minutes | 76 (3.2%) | 19 (1.3%) |
| 60 to 89 Minutes | 35 (1.5%) | 52 (3.5%) |
| 90 or more Minutes | 27 (1.1%) | 39 (2.7%) |
Time of Departure to Work by Sex in Westmere
The most frequent times of departure to work in Westmere are 7:30 AM to 7:59 AM (453, 18.8%) for males and 7:00 AM to 7:29 AM (234, 16.0%) for females.
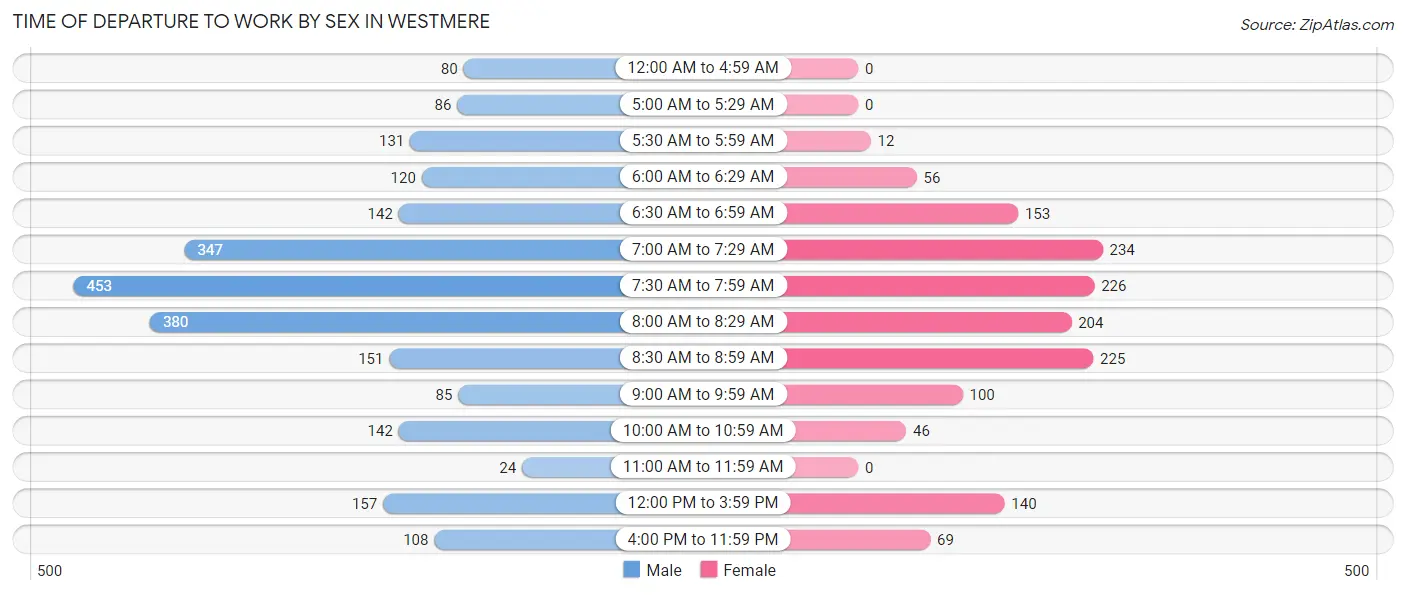
| Time of Departure | Male | Female |
| 12:00 AM to 4:59 AM | 80 (3.3%) | 0 (0.0%) |
| 5:00 AM to 5:29 AM | 86 (3.6%) | 0 (0.0%) |
| 5:30 AM to 5:59 AM | 131 (5.4%) | 12 (0.8%) |
| 6:00 AM to 6:29 AM | 120 (5.0%) | 56 (3.8%) |
| 6:30 AM to 6:59 AM | 142 (5.9%) | 153 (10.4%) |
| 7:00 AM to 7:29 AM | 347 (14.4%) | 234 (16.0%) |
| 7:30 AM to 7:59 AM | 453 (18.8%) | 226 (15.4%) |
| 8:00 AM to 8:29 AM | 380 (15.8%) | 204 (13.9%) |
| 8:30 AM to 8:59 AM | 151 (6.3%) | 225 (15.4%) |
| 9:00 AM to 9:59 AM | 85 (3.5%) | 100 (6.8%) |
| 10:00 AM to 10:59 AM | 142 (5.9%) | 46 (3.1%) |
| 11:00 AM to 11:59 AM | 24 (1.0%) | 0 (0.0%) |
| 12:00 PM to 3:59 PM | 157 (6.5%) | 140 (9.6%) |
| 4:00 PM to 11:59 PM | 108 (4.5%) | 69 (4.7%) |
| Total | 2,406 (100.0%) | 1,465 (100.0%) |
Housing Occupancy in Westmere
Occupancy by Ownership in Westmere
Of the total 3,546 dwellings in Westmere, owner-occupied units account for 1,826 (51.5%), while renter-occupied units make up 1,720 (48.5%).
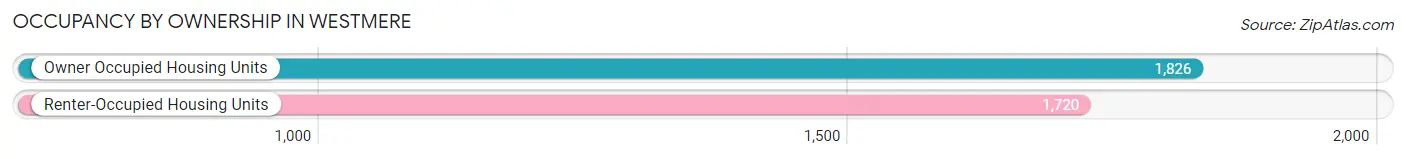
| Occupancy | # Housing Units | % Housing Units |
| Owner Occupied Housing Units | 1,826 | 51.5% |
| Renter-Occupied Housing Units | 1,720 | 48.5% |
| Total Occupied Housing Units | 3,546 | 100.0% |
Occupancy by Household Size in Westmere
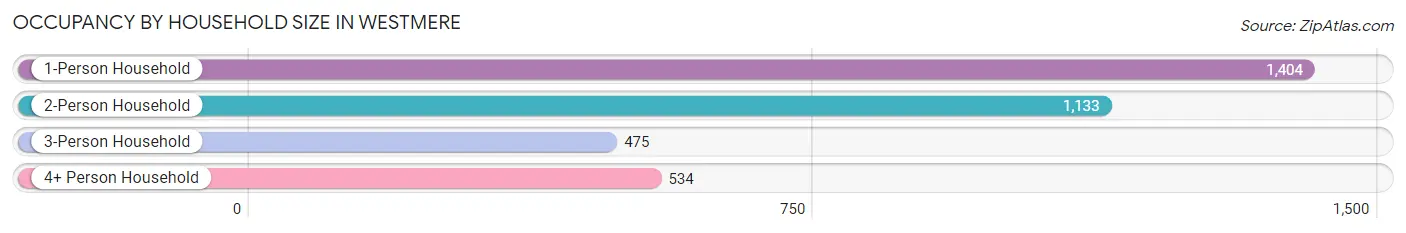
| Household Size | # Housing Units | % Housing Units |
| 1-Person Household | 1,404 | 39.6% |
| 2-Person Household | 1,133 | 32.0% |
| 3-Person Household | 475 | 13.4% |
| 4+ Person Household | 534 | 15.1% |
| Total Housing Units | 3,546 | 100.0% |
Occupancy by Ownership by Household Size in Westmere
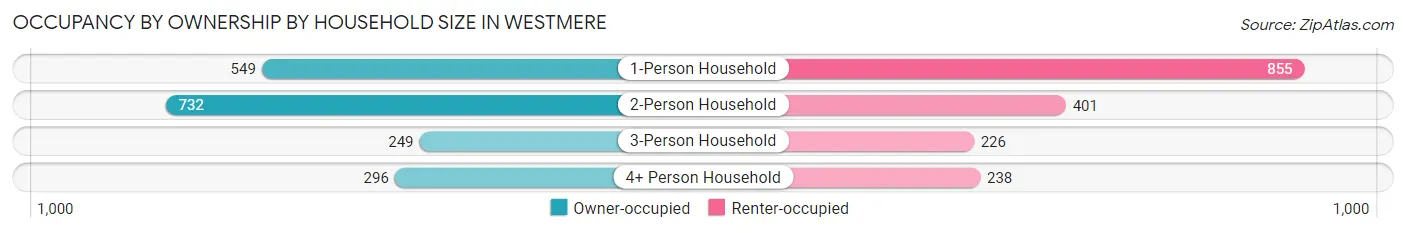
| Household Size | Owner-occupied | Renter-occupied |
| 1-Person Household | 549 (39.1%) | 855 (60.9%) |
| 2-Person Household | 732 (64.6%) | 401 (35.4%) |
| 3-Person Household | 249 (52.4%) | 226 (47.6%) |
| 4+ Person Household | 296 (55.4%) | 238 (44.6%) |
| Total Housing Units | 1,826 (51.5%) | 1,720 (48.5%) |
Occupancy by Educational Attainment in Westmere
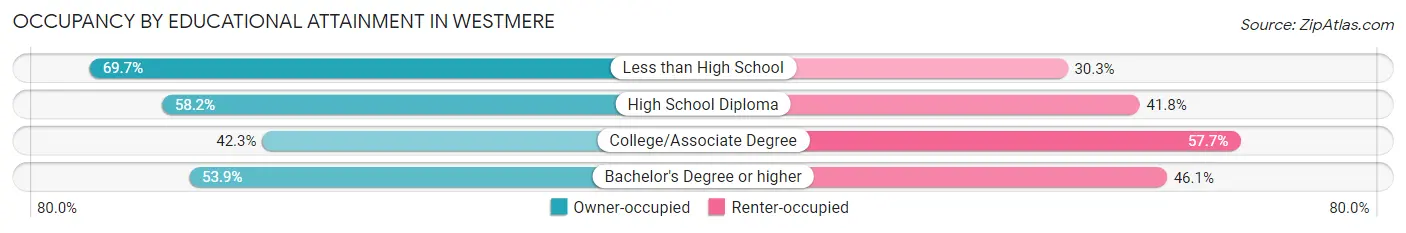
| Household Size | Owner-occupied | Renter-occupied |
| Less than High School | 62 (69.7%) | 27 (30.3%) |
| High School Diploma | 294 (58.2%) | 211 (41.8%) |
| College/Associate Degree | 442 (42.3%) | 603 (57.7%) |
| Bachelor's Degree or higher | 1,028 (53.9%) | 879 (46.1%) |
Occupancy by Age of Householder in Westmere
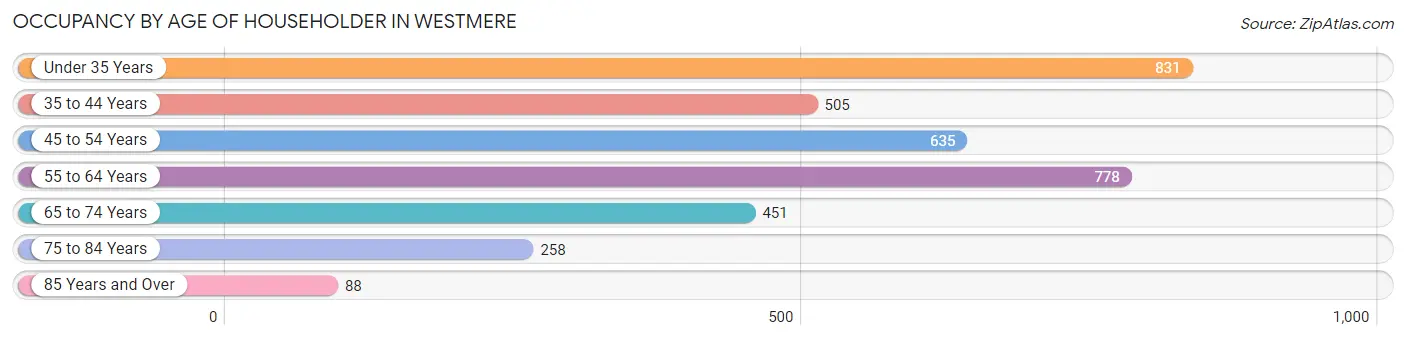
| Age Bracket | # Households | % Households |
| Under 35 Years | 831 | 23.4% |
| 35 to 44 Years | 505 | 14.2% |
| 45 to 54 Years | 635 | 17.9% |
| 55 to 64 Years | 778 | 21.9% |
| 65 to 74 Years | 451 | 12.7% |
| 75 to 84 Years | 258 | 7.3% |
| 85 Years and Over | 88 | 2.5% |
| Total | 3,546 | 100.0% |
Housing Finances in Westmere
Median Income by Occupancy in Westmere
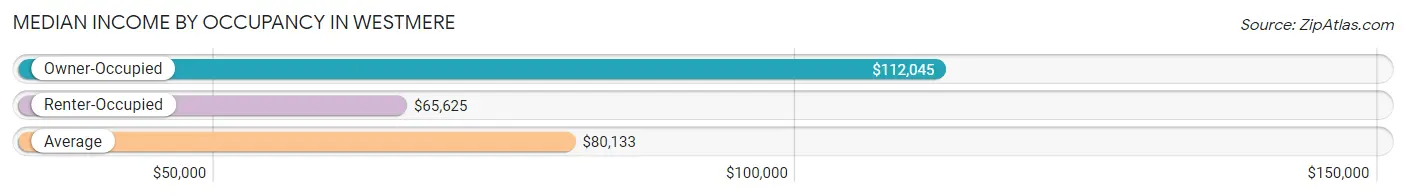
| Occupancy Type | # Households | Median Income |
| Owner-Occupied | 1,826 (51.5%) | $112,045 |
| Renter-Occupied | 1,720 (48.5%) | $65,625 |
| Average | 3,546 (100.0%) | $80,133 |
Occupancy by Householder Income Bracket in Westmere
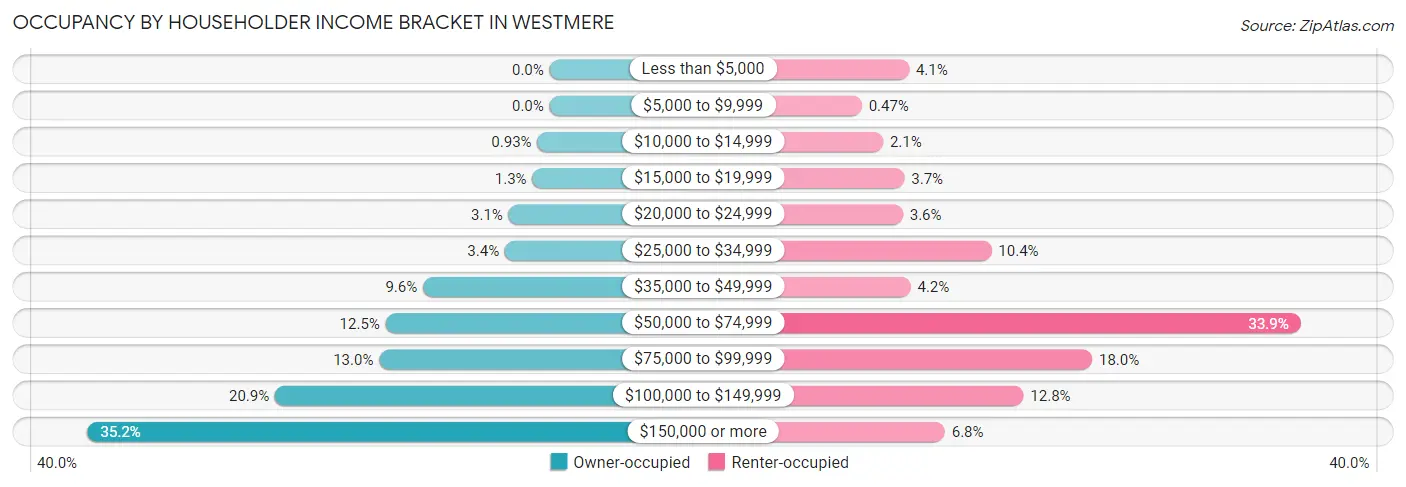
| Income Bracket | Owner-occupied | Renter-occupied |
| Less than $5,000 | 0 (0.0%) | 70 (4.1%) |
| $5,000 to $9,999 | 0 (0.0%) | 8 (0.5%) |
| $10,000 to $14,999 | 17 (0.9%) | 36 (2.1%) |
| $15,000 to $19,999 | 24 (1.3%) | 64 (3.7%) |
| $20,000 to $24,999 | 57 (3.1%) | 62 (3.6%) |
| $25,000 to $34,999 | 62 (3.4%) | 178 (10.3%) |
| $35,000 to $49,999 | 176 (9.6%) | 72 (4.2%) |
| $50,000 to $74,999 | 228 (12.5%) | 583 (33.9%) |
| $75,000 to $99,999 | 237 (13.0%) | 310 (18.0%) |
| $100,000 to $149,999 | 382 (20.9%) | 220 (12.8%) |
| $150,000 or more | 643 (35.2%) | 117 (6.8%) |
| Total | 1,826 (100.0%) | 1,720 (100.0%) |
Monthly Housing Cost Tiers in Westmere
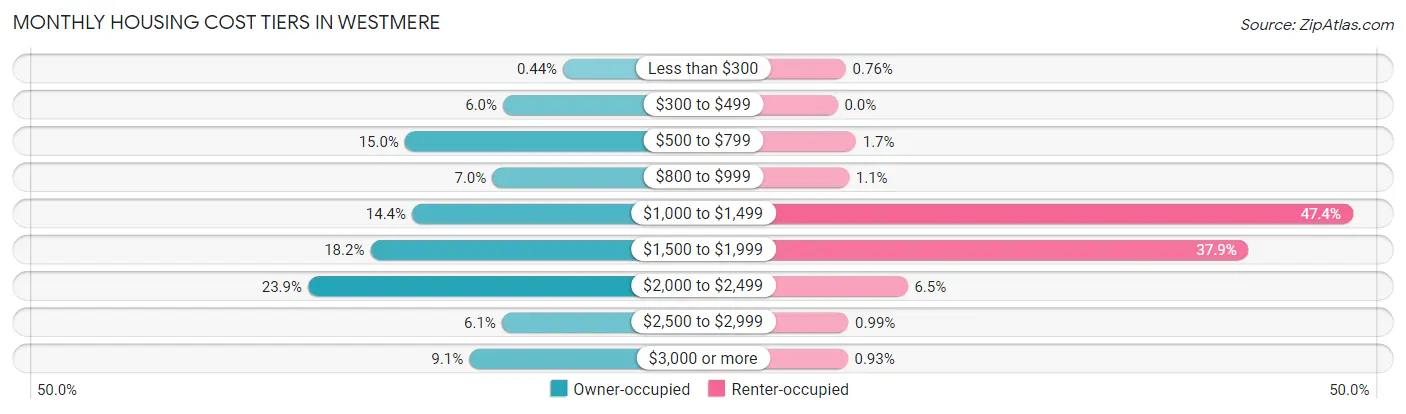
| Monthly Cost | Owner-occupied | Renter-occupied |
| Less than $300 | 8 (0.4%) | 13 (0.8%) |
| $300 to $499 | 109 (6.0%) | 0 (0.0%) |
| $500 to $799 | 274 (15.0%) | 29 (1.7%) |
| $800 to $999 | 127 (7.0%) | 18 (1.1%) |
| $1,000 to $1,499 | 262 (14.3%) | 816 (47.4%) |
| $1,500 to $1,999 | 332 (18.2%) | 651 (37.9%) |
| $2,000 to $2,499 | 437 (23.9%) | 111 (6.5%) |
| $2,500 to $2,999 | 111 (6.1%) | 17 (1.0%) |
| $3,000 or more | 166 (9.1%) | 16 (0.9%) |
| Total | 1,826 (100.0%) | 1,720 (100.0%) |
Physical Housing Characteristics in Westmere
Housing Structures in Westmere
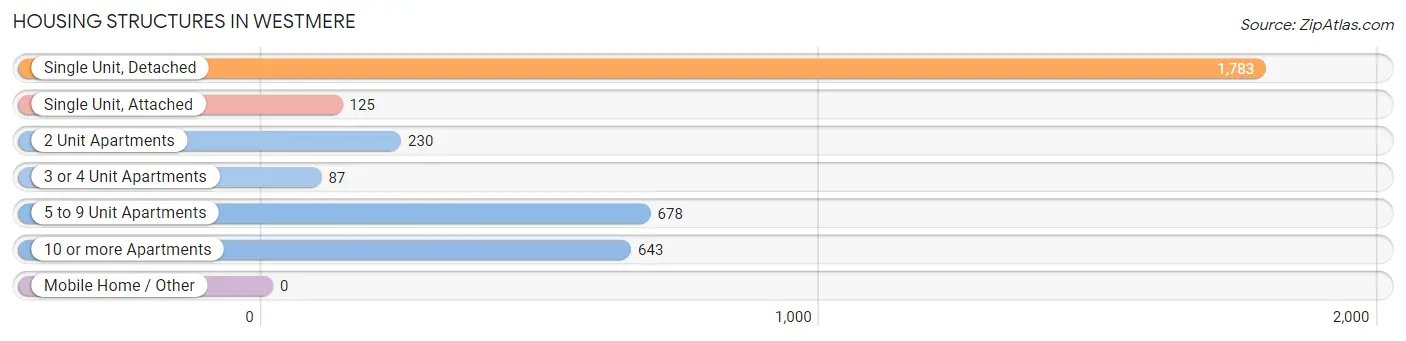
| Structure Type | # Housing Units | % Housing Units |
| Single Unit, Detached | 1,783 | 50.3% |
| Single Unit, Attached | 125 | 3.5% |
| 2 Unit Apartments | 230 | 6.5% |
| 3 or 4 Unit Apartments | 87 | 2.5% |
| 5 to 9 Unit Apartments | 678 | 19.1% |
| 10 or more Apartments | 643 | 18.1% |
| Mobile Home / Other | 0 | 0.0% |
| Total | 3,546 | 100.0% |
Housing Structures by Occupancy in Westmere
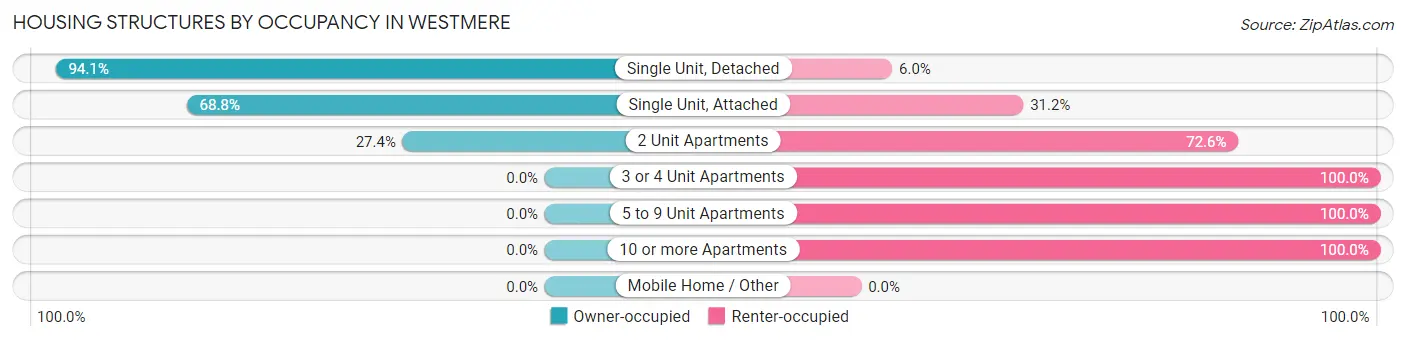
| Structure Type | Owner-occupied | Renter-occupied |
| Single Unit, Detached | 1,677 (94.1%) | 106 (5.9%) |
| Single Unit, Attached | 86 (68.8%) | 39 (31.2%) |
| 2 Unit Apartments | 63 (27.4%) | 167 (72.6%) |
| 3 or 4 Unit Apartments | 0 (0.0%) | 87 (100.0%) |
| 5 to 9 Unit Apartments | 0 (0.0%) | 678 (100.0%) |
| 10 or more Apartments | 0 (0.0%) | 643 (100.0%) |
| Mobile Home / Other | 0 (0.0%) | 0 (0.0%) |
| Total | 1,826 (51.5%) | 1,720 (48.5%) |
Housing Structures by Number of Rooms in Westmere
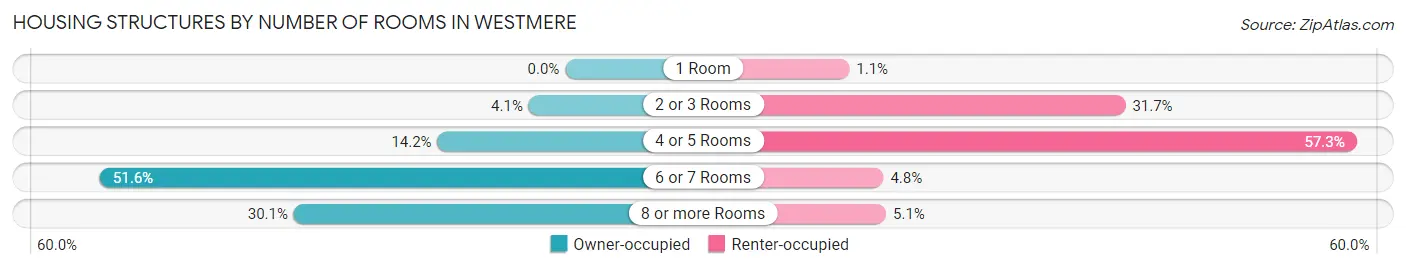
| Number of Rooms | Owner-occupied | Renter-occupied |
| 1 Room | 0 (0.0%) | 18 (1.1%) |
| 2 or 3 Rooms | 74 (4.1%) | 545 (31.7%) |
| 4 or 5 Rooms | 259 (14.2%) | 986 (57.3%) |
| 6 or 7 Rooms | 943 (51.6%) | 83 (4.8%) |
| 8 or more Rooms | 550 (30.1%) | 88 (5.1%) |
| Total | 1,826 (100.0%) | 1,720 (100.0%) |
Housing Structure by Heating Type in Westmere
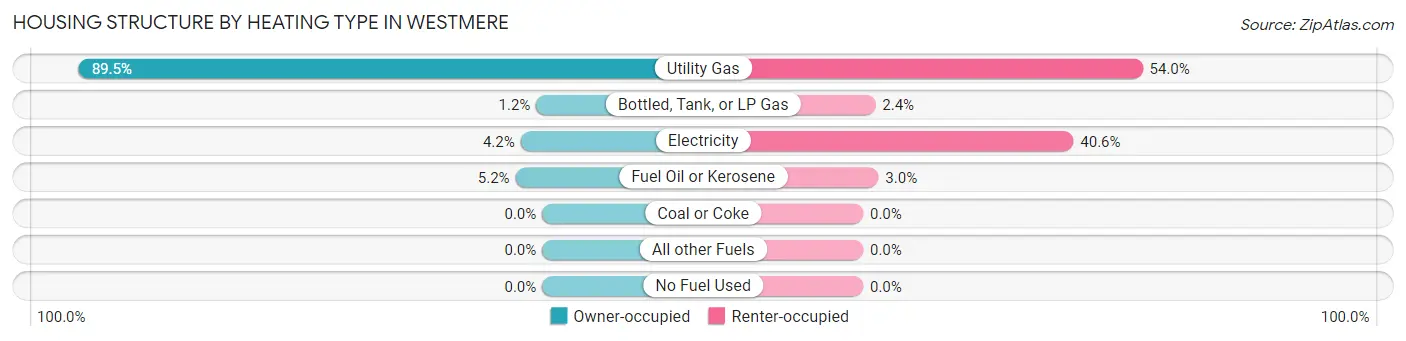
| Heating Type | Owner-occupied | Renter-occupied |
| Utility Gas | 1,635 (89.5%) | 929 (54.0%) |
| Bottled, Tank, or LP Gas | 21 (1.1%) | 41 (2.4%) |
| Electricity | 76 (4.2%) | 699 (40.6%) |
| Fuel Oil or Kerosene | 94 (5.1%) | 51 (3.0%) |
| Coal or Coke | 0 (0.0%) | 0 (0.0%) |
| All other Fuels | 0 (0.0%) | 0 (0.0%) |
| No Fuel Used | 0 (0.0%) | 0 (0.0%) |
| Total | 1,826 (100.0%) | 1,720 (100.0%) |
Household Vehicle Usage in Westmere
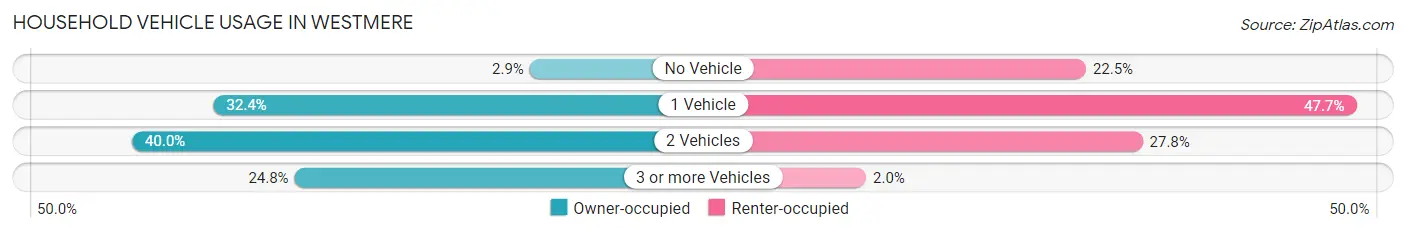
| Vehicles per Household | Owner-occupied | Renter-occupied |
| No Vehicle | 52 (2.9%) | 387 (22.5%) |
| 1 Vehicle | 591 (32.4%) | 821 (47.7%) |
| 2 Vehicles | 730 (40.0%) | 478 (27.8%) |
| 3 or more Vehicles | 453 (24.8%) | 34 (2.0%) |
| Total | 1,826 (100.0%) | 1,720 (100.0%) |
Real Estate & Mortgages in Westmere
Real Estate and Mortgage Overview in Westmere
| Characteristic | Without Mortgage | With Mortgage |
| Housing Units | 642 | 1,184 |
| Median Property Value | $270,600 | $287,600 |
| Median Household Income | $78,542 | $440 |
| Monthly Housing Costs | $755 | $155 |
| Real Estate Taxes | $5,257 | $34 |
Property Value by Mortgage Status in Westmere
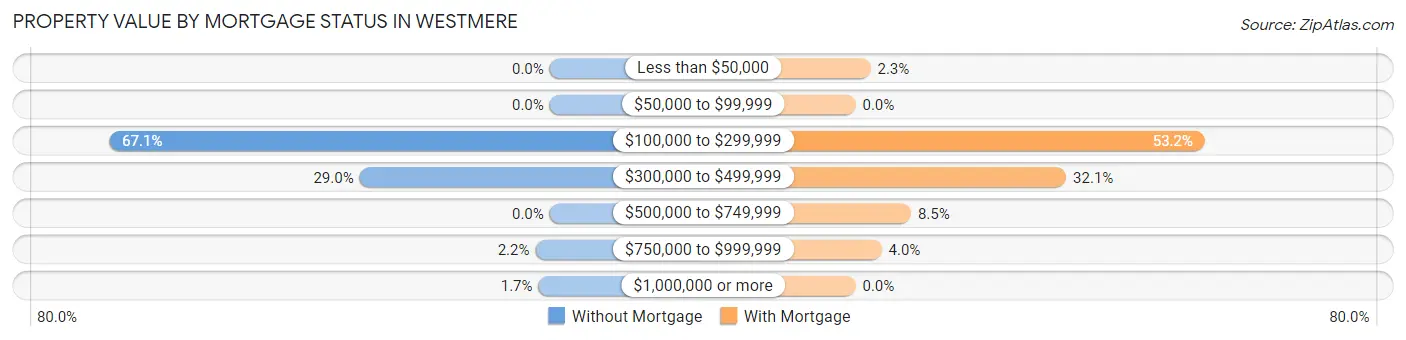
| Property Value | Without Mortgage | With Mortgage |
| Less than $50,000 | 0 (0.0%) | 27 (2.3%) |
| $50,000 to $99,999 | 0 (0.0%) | 0 (0.0%) |
| $100,000 to $299,999 | 431 (67.1%) | 630 (53.2%) |
| $300,000 to $499,999 | 186 (29.0%) | 380 (32.1%) |
| $500,000 to $749,999 | 0 (0.0%) | 100 (8.5%) |
| $750,000 to $999,999 | 14 (2.2%) | 47 (4.0%) |
| $1,000,000 or more | 11 (1.7%) | 0 (0.0%) |
| Total | 642 (100.0%) | 1,184 (100.0%) |
Household Income by Mortgage Status in Westmere
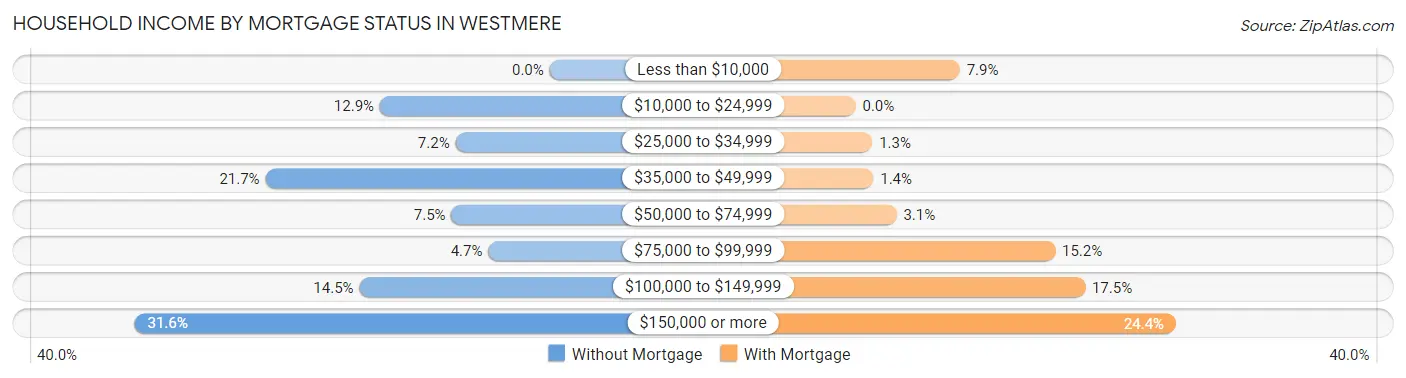
| Household Income | Without Mortgage | With Mortgage |
| Less than $10,000 | 0 (0.0%) | 94 (7.9%) |
| $10,000 to $24,999 | 83 (12.9%) | 0 (0.0%) |
| $25,000 to $34,999 | 46 (7.2%) | 15 (1.3%) |
| $35,000 to $49,999 | 139 (21.6%) | 16 (1.3%) |
| $50,000 to $74,999 | 48 (7.5%) | 37 (3.1%) |
| $75,000 to $99,999 | 30 (4.7%) | 180 (15.2%) |
| $100,000 to $149,999 | 93 (14.5%) | 207 (17.5%) |
| $150,000 or more | 203 (31.6%) | 289 (24.4%) |
| Total | 642 (100.0%) | 1,184 (100.0%) |
Property Value to Household Income Ratio in Westmere
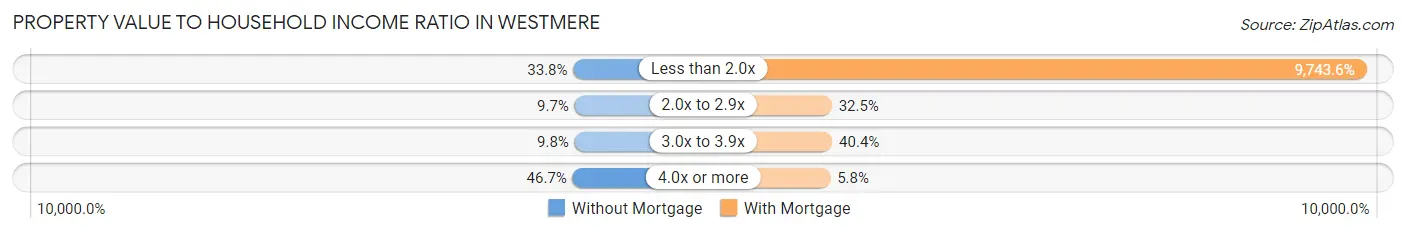
| Value-to-Income Ratio | Without Mortgage | With Mortgage |
| Less than 2.0x | 217 (33.8%) | 115,364 (9,743.6%) |
| 2.0x to 2.9x | 62 (9.7%) | 385 (32.5%) |
| 3.0x to 3.9x | 63 (9.8%) | 478 (40.4%) |
| 4.0x or more | 300 (46.7%) | 69 (5.8%) |
| Total | 642 (100.0%) | 1,184 (100.0%) |
Real Estate Taxes by Mortgage Status in Westmere
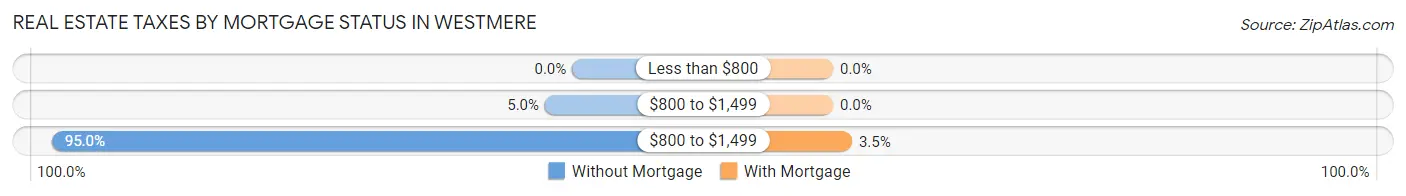
| Property Taxes | Without Mortgage | With Mortgage |
| Less than $800 | 0 (0.0%) | 0 (0.0%) |
| $800 to $1,499 | 32 (5.0%) | 0 (0.0%) |
| $800 to $1,499 | 610 (95.0%) | 41 (3.5%) |
| Total | 642 (100.0%) | 1,184 (100.0%) |
Health & Disability in Westmere
Health Insurance Coverage by Age in Westmere
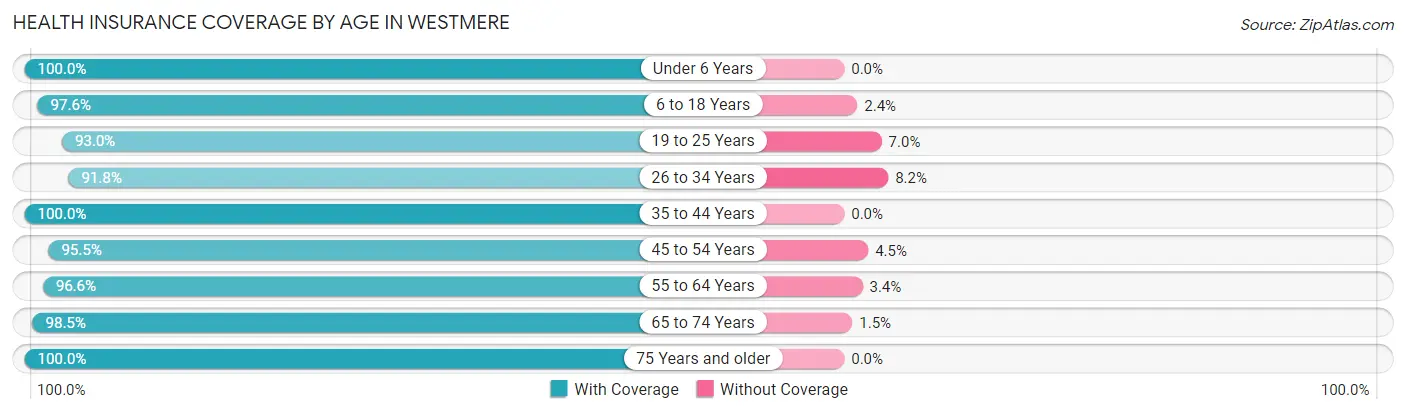
| Age Bracket | With Coverage | Without Coverage |
| Under 6 Years | 334 (100.0%) | 0 (0.0%) |
| 6 to 18 Years | 1,282 (97.6%) | 32 (2.4%) |
| 19 to 25 Years | 934 (93.0%) | 70 (7.0%) |
| 26 to 34 Years | 841 (91.8%) | 75 (8.2%) |
| 35 to 44 Years | 901 (100.0%) | 0 (0.0%) |
| 45 to 54 Years | 836 (95.5%) | 39 (4.5%) |
| 55 to 64 Years | 1,138 (96.6%) | 40 (3.4%) |
| 65 to 74 Years | 787 (98.5%) | 12 (1.5%) |
| 75 Years and older | 457 (100.0%) | 0 (0.0%) |
| Total | 7,510 (96.6%) | 268 (3.5%) |
Health Insurance Coverage by Citizenship Status in Westmere
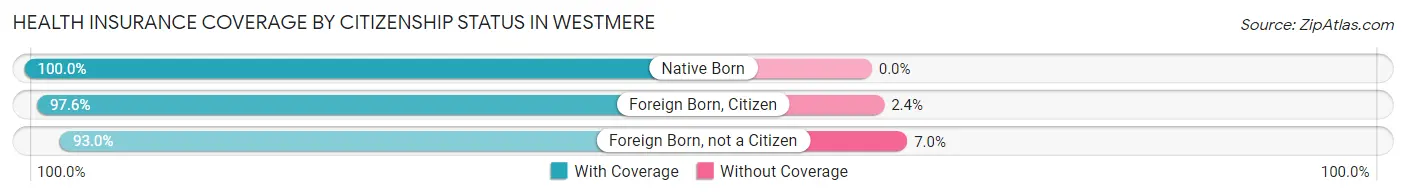
| Citizenship Status | With Coverage | Without Coverage |
| Native Born | 334 (100.0%) | 0 (0.0%) |
| Foreign Born, Citizen | 1,282 (97.6%) | 32 (2.4%) |
| Foreign Born, not a Citizen | 934 (93.0%) | 70 (7.0%) |
Health Insurance Coverage by Household Income in Westmere
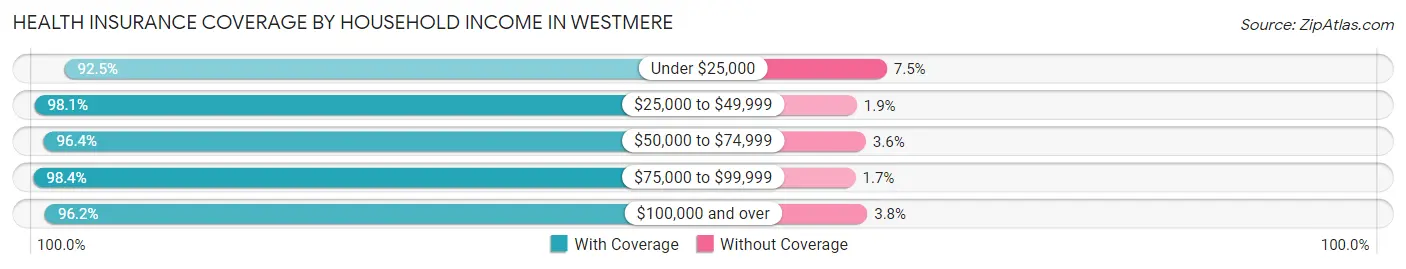
| Household Income | With Coverage | Without Coverage |
| Under $25,000 | 394 (92.5%) | 32 (7.5%) |
| $25,000 to $49,999 | 782 (98.1%) | 15 (1.9%) |
| $50,000 to $74,999 | 1,050 (96.4%) | 39 (3.6%) |
| $75,000 to $99,999 | 1,193 (98.4%) | 20 (1.7%) |
| $100,000 and over | 4,057 (96.2%) | 162 (3.8%) |
Public vs Private Health Insurance Coverage by Age in Westmere
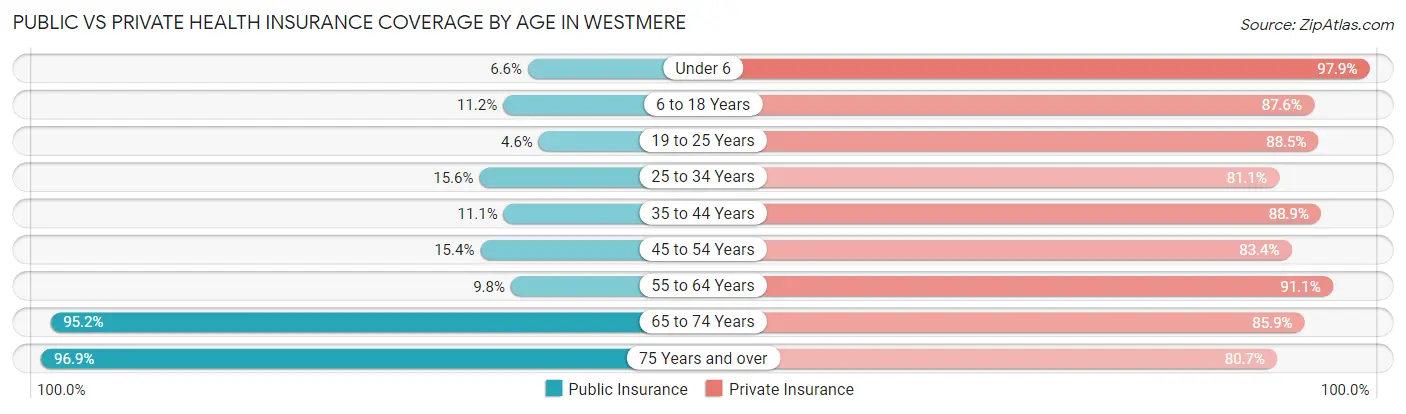
| Age Bracket | Public Insurance | Private Insurance |
| Under 6 | 22 (6.6%) | 327 (97.9%) |
| 6 to 18 Years | 147 (11.2%) | 1,151 (87.6%) |
| 19 to 25 Years | 46 (4.6%) | 888 (88.4%) |
| 25 to 34 Years | 143 (15.6%) | 743 (81.1%) |
| 35 to 44 Years | 100 (11.1%) | 801 (88.9%) |
| 45 to 54 Years | 135 (15.4%) | 730 (83.4%) |
| 55 to 64 Years | 115 (9.8%) | 1,073 (91.1%) |
| 65 to 74 Years | 761 (95.2%) | 686 (85.9%) |
| 75 Years and over | 443 (96.9%) | 369 (80.7%) |
| Total | 1,912 (24.6%) | 6,768 (87.0%) |
Disability Status by Sex by Age in Westmere
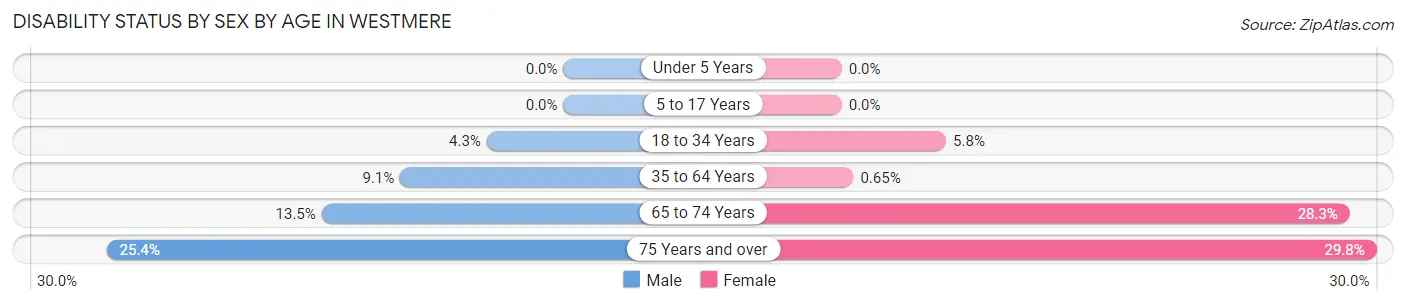
| Age Bracket | Male | Female |
| Under 5 Years | 0 (0.0%) | 0 (0.0%) |
| 5 to 17 Years | 0 (0.0%) | 0 (0.0%) |
| 18 to 34 Years | 54 (4.3%) | 49 (5.8%) |
| 35 to 64 Years | 156 (9.1%) | 8 (0.6%) |
| 65 to 74 Years | 49 (13.5%) | 123 (28.3%) |
| 75 Years and over | 59 (25.4%) | 67 (29.8%) |
Disability Class by Sex by Age in Westmere
Disability Class: Hearing Difficulty
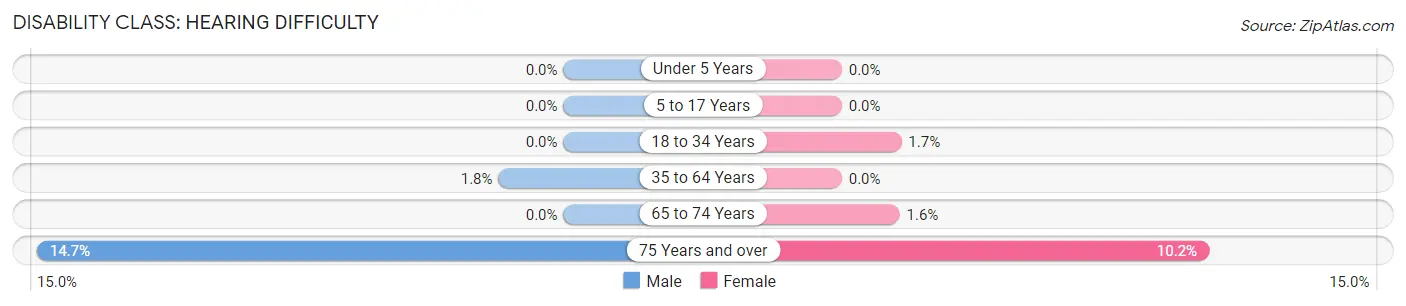
| Age Bracket | Male | Female |
| Under 5 Years | 0 (0.0%) | 0 (0.0%) |
| 5 to 17 Years | 0 (0.0%) | 0 (0.0%) |
| 18 to 34 Years | 0 (0.0%) | 14 (1.7%) |
| 35 to 64 Years | 31 (1.8%) | 0 (0.0%) |
| 65 to 74 Years | 0 (0.0%) | 7 (1.6%) |
| 75 Years and over | 34 (14.7%) | 23 (10.2%) |
Disability Class: Vision Difficulty
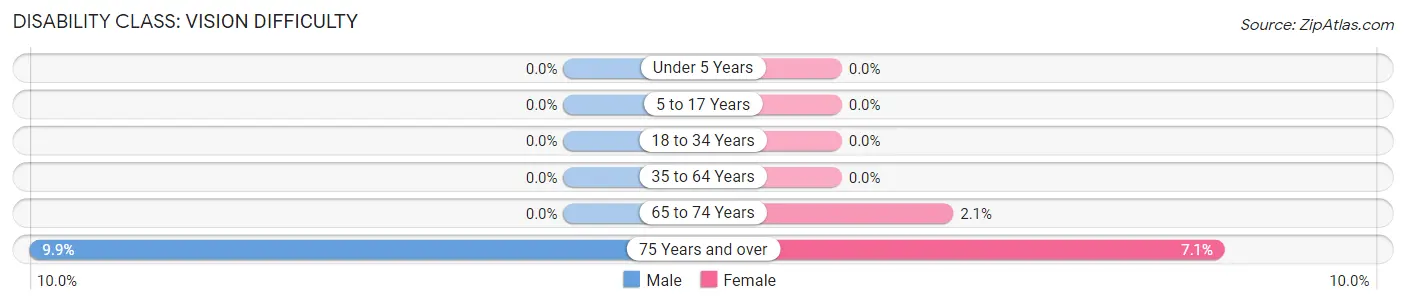
| Age Bracket | Male | Female |
| Under 5 Years | 0 (0.0%) | 0 (0.0%) |
| 5 to 17 Years | 0 (0.0%) | 0 (0.0%) |
| 18 to 34 Years | 0 (0.0%) | 0 (0.0%) |
| 35 to 64 Years | 0 (0.0%) | 0 (0.0%) |
| 65 to 74 Years | 0 (0.0%) | 9 (2.1%) |
| 75 Years and over | 23 (9.9%) | 16 (7.1%) |
Disability Class: Cognitive Difficulty
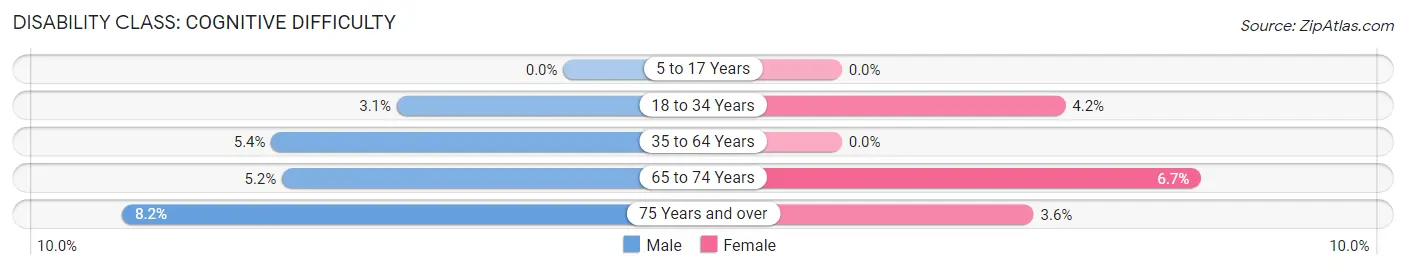
| Age Bracket | Male | Female |
| 5 to 17 Years | 0 (0.0%) | 0 (0.0%) |
| 18 to 34 Years | 39 (3.1%) | 35 (4.2%) |
| 35 to 64 Years | 93 (5.4%) | 0 (0.0%) |
| 65 to 74 Years | 19 (5.2%) | 29 (6.7%) |
| 75 Years and over | 19 (8.2%) | 8 (3.6%) |
Disability Class: Ambulatory Difficulty
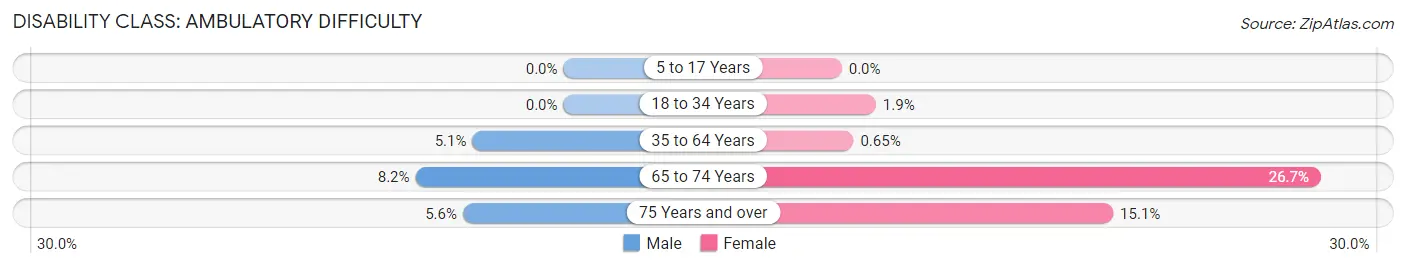
| Age Bracket | Male | Female |
| 5 to 17 Years | 0 (0.0%) | 0 (0.0%) |
| 18 to 34 Years | 0 (0.0%) | 16 (1.9%) |
| 35 to 64 Years | 87 (5.1%) | 8 (0.6%) |
| 65 to 74 Years | 30 (8.2%) | 116 (26.7%) |
| 75 Years and over | 13 (5.6%) | 34 (15.1%) |
Disability Class: Self-Care Difficulty
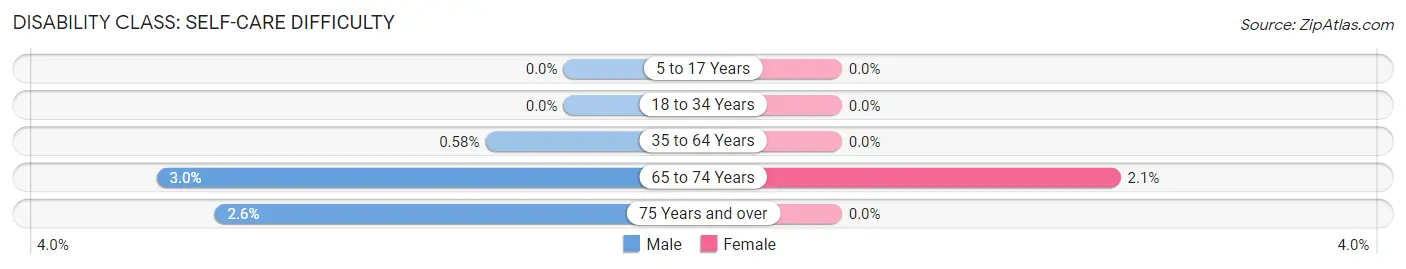
| Age Bracket | Male | Female |
| 5 to 17 Years | 0 (0.0%) | 0 (0.0%) |
| 18 to 34 Years | 0 (0.0%) | 0 (0.0%) |
| 35 to 64 Years | 10 (0.6%) | 0 (0.0%) |
| 65 to 74 Years | 11 (3.0%) | 9 (2.1%) |
| 75 Years and over | 6 (2.6%) | 0 (0.0%) |
Technology Access in Westmere
Computing Device Access in Westmere
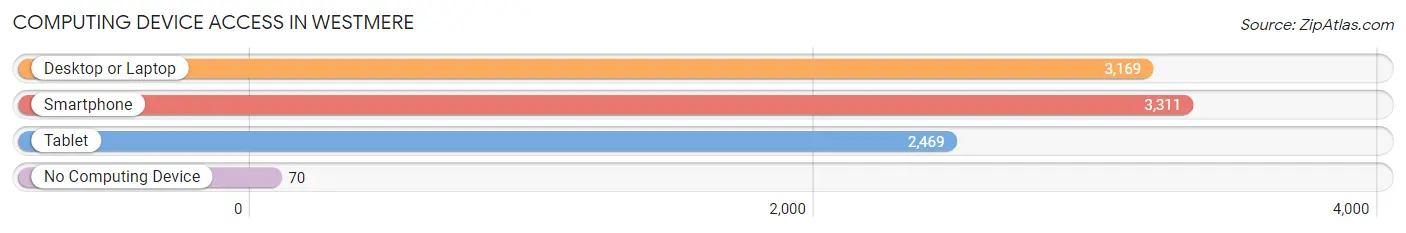
| Device Type | # Households | % Households |
| Desktop or Laptop | 3,169 | 89.4% |
| Smartphone | 3,311 | 93.4% |
| Tablet | 2,469 | 69.6% |
| No Computing Device | 70 | 2.0% |
| Total | 3,546 | 100.0% |
Internet Access in Westmere
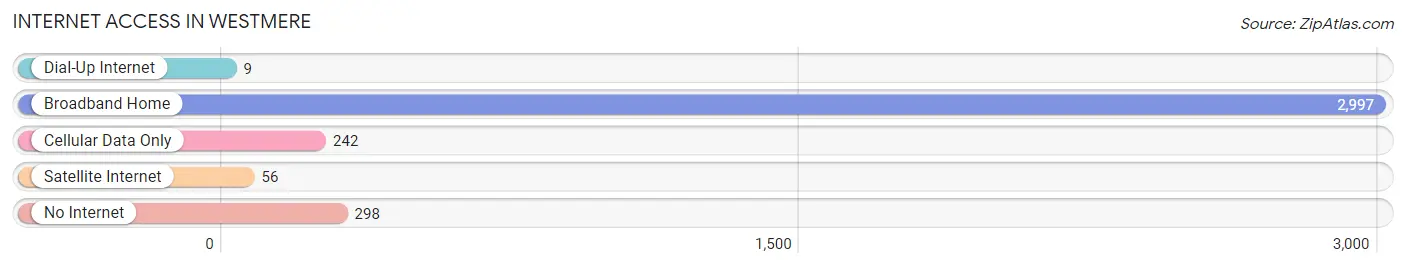
| Internet Type | # Households | % Households |
| Dial-Up Internet | 9 | 0.3% |
| Broadband Home | 2,997 | 84.5% |
| Cellular Data Only | 242 | 6.8% |
| Satellite Internet | 56 | 1.6% |
| No Internet | 298 | 8.4% |
| Total | 3,546 | 100.0% |
Westmere Summary
Westmere is a hamlet located in the town of Guilderland in Albany County, New York. It is located just west of the city of Albany and is part of the Albany-Schenectady-Troy Metropolitan Statistical Area. The hamlet is bordered by the towns of Bethlehem and New Scotland to the north, Guilderland to the east, and Colonie to the south and west.
History
Westmere was first settled in the late 1700s by Dutch and German immigrants. The hamlet was originally known as “Westmere Corners” and was part of the town of Bethlehem until it was annexed by the town of Guilderland in 1871. The hamlet was named after the nearby Westmere Lake, which was named after the English village of Westmere.
The hamlet was home to a number of small farms and businesses, including a grist mill, a saw mill, a blacksmith shop, and a general store. The hamlet also had a post office, which was established in 1871 and closed in 1904.
In the early 1900s, Westmere began to grow as a residential community. The hamlet was home to a number of summer resorts, including the Westmere Hotel, which was built in 1910 and closed in the 1950s.
Geography
Westmere is located in the town of Guilderland in Albany County, New York. It is located just west of the city of Albany and is part of the Albany-Schenectady-Troy Metropolitan Statistical Area. The hamlet is bordered by the towns of Bethlehem and New Scotland to the north, Guilderland to the east, and Colonie to the south and west.
Westmere is located on the western edge of the Helderberg Escarpment, a ridge of hills that runs from the Catskill Mountains to the Hudson River. The hamlet is located in the Mohawk Valley, which is part of the larger Hudson Valley region.
The hamlet is located in the Mohawk River watershed and is home to a number of small streams, including the Westmere Creek, which flows through the hamlet. The hamlet is also home to Westmere Lake, a small lake located in the center of the hamlet.
Economy
Westmere is primarily a residential community, with most of its residents commuting to nearby cities for work. The hamlet is home to a number of small businesses, including restaurants, convenience stores, and auto repair shops.
The hamlet is also home to a number of professional offices, including medical and dental offices, law offices, and accounting firms. The hamlet is also home to a number of small manufacturing companies, including a printing company and a metal fabrication company.
Demographics
As of the 2010 census, the population of Westmere was 4,845. The population is primarily white (90.2%), with small percentages of African American (3.2%), Asian (2.3%), and Hispanic (2.1%) residents. The median household income is $76,944, and the median home value is $269,400.
The hamlet is served by the Guilderland Central School District, which includes five elementary schools, two middle schools, and one high school. The hamlet is also home to a number of private schools, including a Catholic school and a Montessori school.
Common Questions
What is Per Capita Income in Westmere?
Per Capita income in Westmere is $56,545.
What is the Median Family Income in Westmere?
Median Family Income in Westmere is $112,253.
What is the Median Household income in Westmere?
Median Household Income in Westmere is $80,133.
What is Income or Wage Gap in Westmere?
Income or Wage Gap in Westmere is 20.4%.
Women in Westmere earn 79.6 cents for every dollar earned by a man.
What is Family Income Deficit in Westmere?
Family Income Deficit in Westmere is $2,809.
Families that are below poverty line in Westmere earn $2,809 less on average than the poverty threshold level.
What is Inequality or Gini Index in Westmere?
Inequality or Gini Index in Westmere is 0.48.
What is the Total Population of Westmere?
Total Population of Westmere is 7,798.
What is the Total Male Population of Westmere?
Total Male Population of Westmere is 4,338.
What is the Total Female Population of Westmere?
Total Female Population of Westmere is 3,460.
What is the Ratio of Males per 100 Females in Westmere?
There are 125.38 Males per 100 Females in Westmere.
What is the Ratio of Females per 100 Males in Westmere?
There are 79.76 Females per 100 Males in Westmere.
What is the Median Population Age in Westmere?
Median Population Age in Westmere is 38.9 Years.
What is the Average Family Size in Westmere
Average Family Size in Westmere is 3.0 People.
What is the Average Household Size in Westmere
Average Household Size in Westmere is 2.2 People.
How Large is the Labor Force in Westmere?
There are 4,470 People in the Labor Forcein in Westmere.
What is the Percentage of People in the Labor Force in Westmere?
69.2% of People are in the Labor Force in Westmere.
What is the Unemployment Rate in Westmere?
Unemployment Rate in Westmere is 0.5%.