Saugerties South, NY Map & Demographics
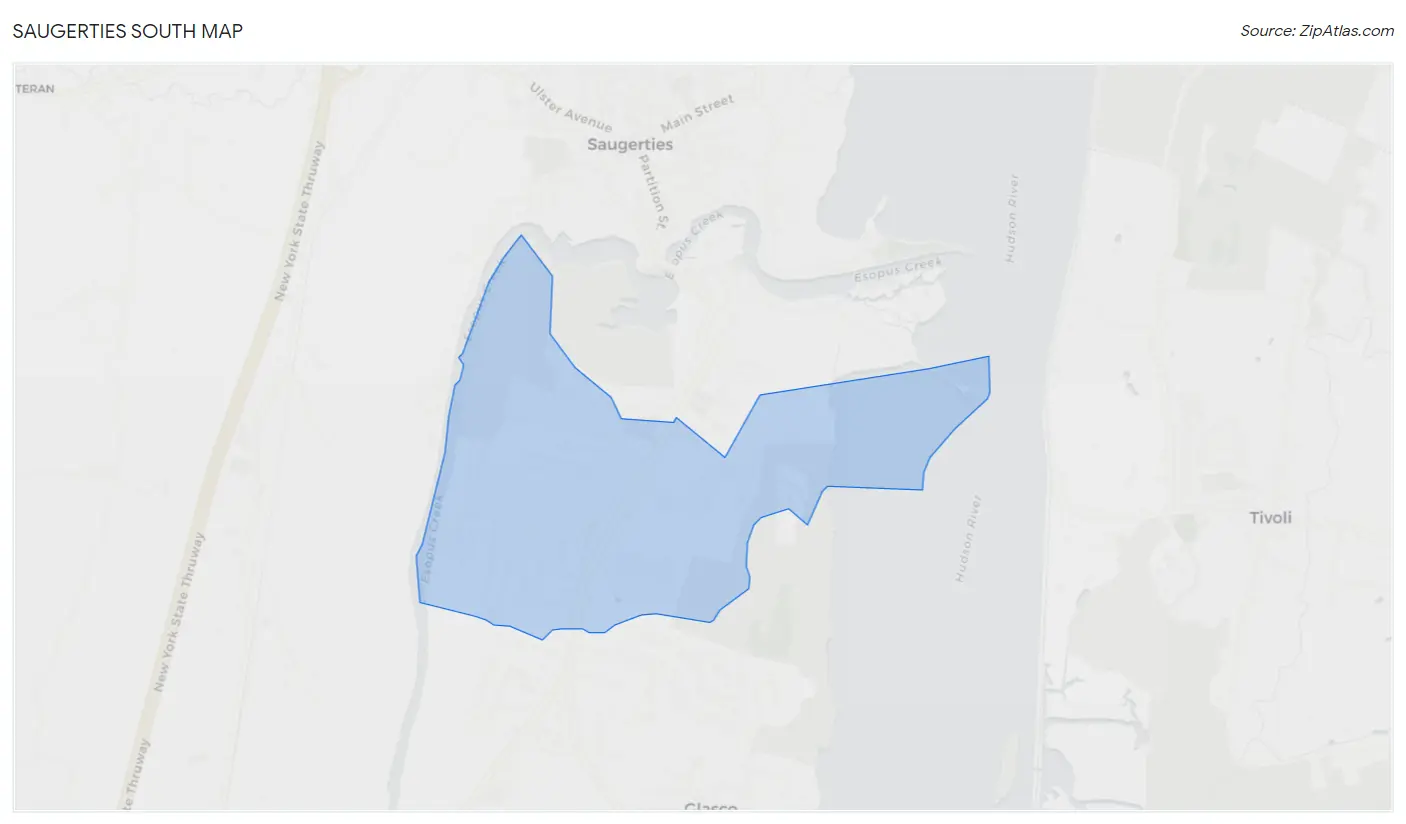
Saugerties South Map
Saugerties South Overview
$40,813
PER CAPITA INCOME
$112,500
AVG FAMILY INCOME
$75,568
AVG HOUSEHOLD INCOME
0.1%
WAGE / INCOME GAP [ % ]
99.9¢/ $1
WAGE / INCOME GAP [ $ ]
0.42
INEQUALITY / GINI INDEX
2,224
TOTAL POPULATION
1,068
MALE POPULATION
1,156
FEMALE POPULATION
92.39
MALES / 100 FEMALES
108.24
FEMALES / 100 MALES
44.1
MEDIAN AGE
3.0
AVG FAMILY SIZE
2.4
AVG HOUSEHOLD SIZE
1,200
LABOR FORCE [ PEOPLE ]
63.2%
PERCENT IN LABOR FORCE
7.2%
UNEMPLOYMENT RATE
Income in Saugerties South
Income Overview in Saugerties South
Per Capita Income in Saugerties South is $40,813, while median incomes of families and households are $112,500 and $75,568 respectively.
| Characteristic | Number | Measure |
| Per Capita Income | 2,224 | $40,813 |
| Median Family Income | 564 | $112,500 |
| Mean Family Income | 564 | $114,011 |
| Median Household Income | 933 | $75,568 |
| Mean Household Income | 933 | $92,115 |
| Income Deficit | 564 | $0 |
| Wage / Income Gap (%) | 2,224 | 0.09% |
| Wage / Income Gap ($) | 2,224 | 99.91¢ per $1 |
| Gini / Inequality Index | 2,224 | 0.42 |
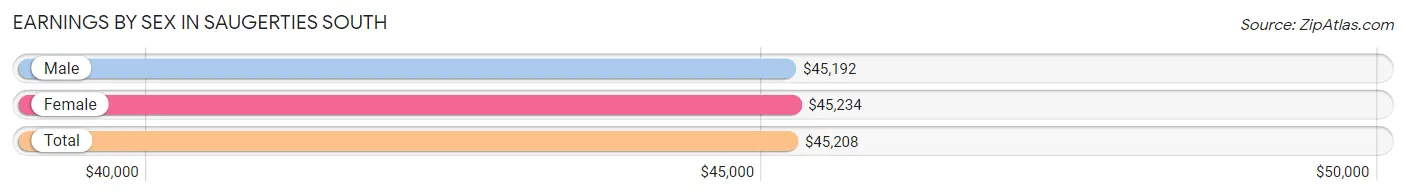
Earnings by Sex in Saugerties South
Average Earnings in Saugerties South are $45,208, $45,192 for men and $45,234 for women, a difference of 0.1%.
| Sex | Number | Average Earnings |
| Male | 614 (48.5%) | $45,192 |
| Female | 653 (51.5%) | $45,234 |
| Total | 1,267 (100.0%) | $45,208 |
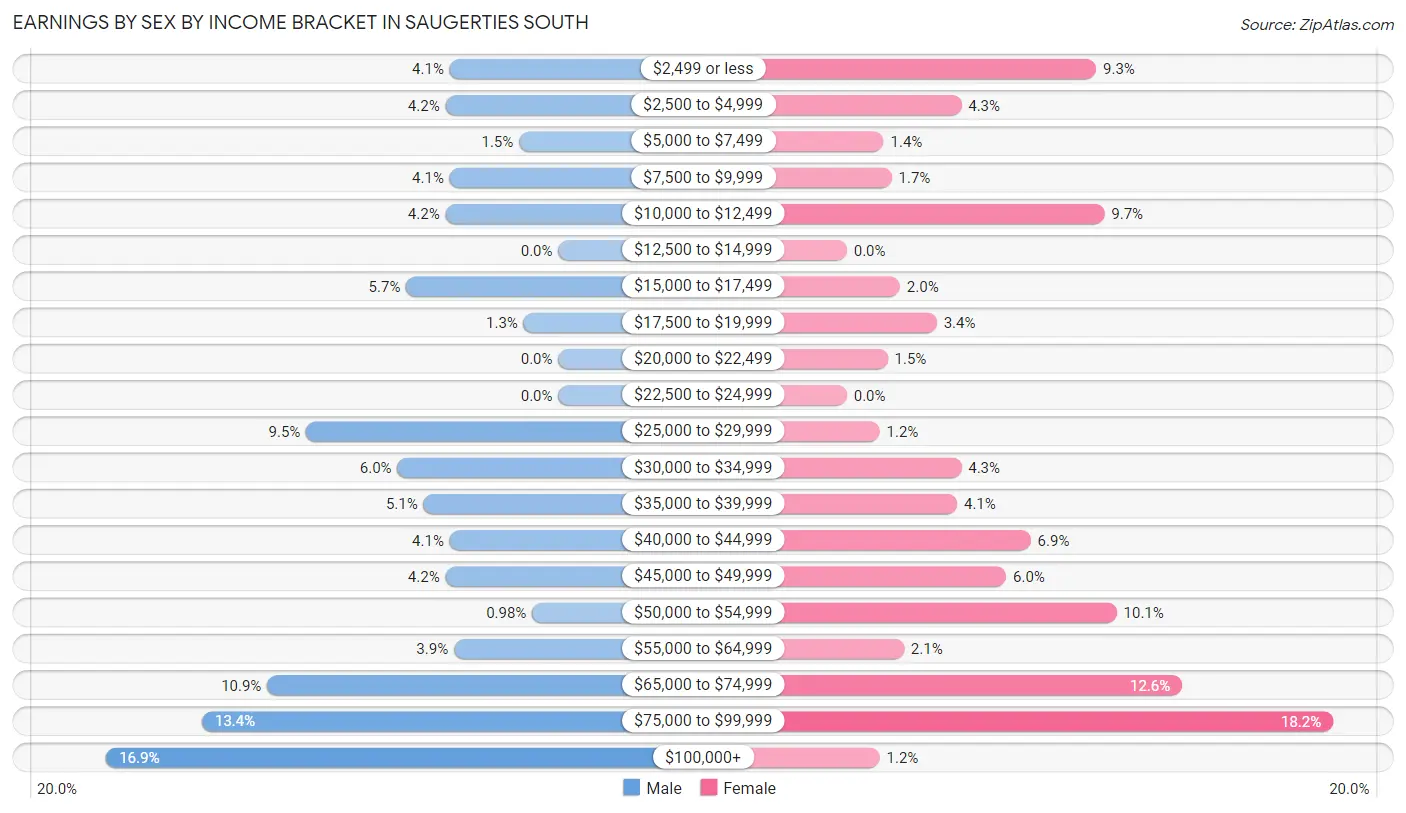
Earnings by Sex by Income Bracket in Saugerties South
The most common earnings brackets in Saugerties South are $100,000+ for men (104 | 16.9%) and $75,000 to $99,999 for women (119 | 18.2%).
| Income | Male | Female |
| $2,499 or less | 25 (4.1%) | 61 (9.3%) |
| $2,500 to $4,999 | 26 (4.2%) | 28 (4.3%) |
| $5,000 to $7,499 | 9 (1.5%) | 9 (1.4%) |
| $7,500 to $9,999 | 25 (4.1%) | 11 (1.7%) |
| $10,000 to $12,499 | 26 (4.2%) | 63 (9.7%) |
| $12,500 to $14,999 | 0 (0.0%) | 0 (0.0%) |
| $15,000 to $17,499 | 35 (5.7%) | 13 (2.0%) |
| $17,500 to $19,999 | 8 (1.3%) | 22 (3.4%) |
| $20,000 to $22,499 | 0 (0.0%) | 10 (1.5%) |
| $22,500 to $24,999 | 0 (0.0%) | 0 (0.0%) |
| $25,000 to $29,999 | 58 (9.5%) | 8 (1.2%) |
| $30,000 to $34,999 | 37 (6.0%) | 28 (4.3%) |
| $35,000 to $39,999 | 31 (5.1%) | 27 (4.1%) |
| $40,000 to $44,999 | 25 (4.1%) | 45 (6.9%) |
| $45,000 to $49,999 | 26 (4.2%) | 39 (6.0%) |
| $50,000 to $54,999 | 6 (1.0%) | 66 (10.1%) |
| $55,000 to $64,999 | 24 (3.9%) | 14 (2.1%) |
| $65,000 to $74,999 | 67 (10.9%) | 82 (12.6%) |
| $75,000 to $99,999 | 82 (13.4%) | 119 (18.2%) |
| $100,000+ | 104 (16.9%) | 8 (1.2%) |
| Total | 614 (100.0%) | 653 (100.0%) |
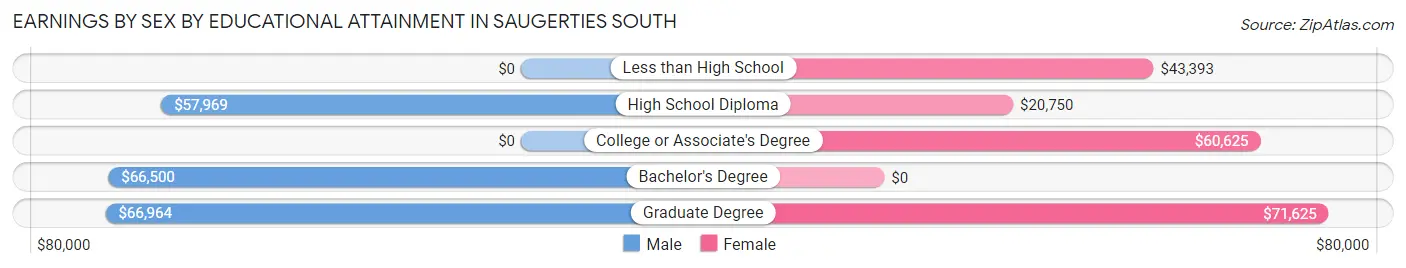
Earnings by Sex by Educational Attainment in Saugerties South
Average earnings in Saugerties South are $62,813 for men and $45,391 for women, a difference of 27.7%. Men with an educational attainment of graduate degree enjoy the highest average annual earnings of $66,964, while those with high school diploma education earn the least with $57,969. Women with an educational attainment of graduate degree earn the most with the average annual earnings of $71,625, while those with high school diploma education have the smallest earnings of $20,750.
| Educational Attainment | Male Income | Female Income |
| Less than High School | - | - |
| High School Diploma | $57,969 | $20,750 |
| College or Associate's Degree | - | - |
| Bachelor's Degree | $66,500 | $0 |
| Graduate Degree | $66,964 | $71,625 |
| Total | $62,813 | $45,391 |
Family Income in Saugerties South
Family Income Brackets in Saugerties South
According to the Saugerties South family income data, there are 205 families falling into the $100,000 to $149,999 income range, which is the most common income bracket and makes up 36.3% of all families. Conversely, the $10,000 to $14,999 income bracket is the least frequent group with only 7 families (1.2%) belonging to this category.
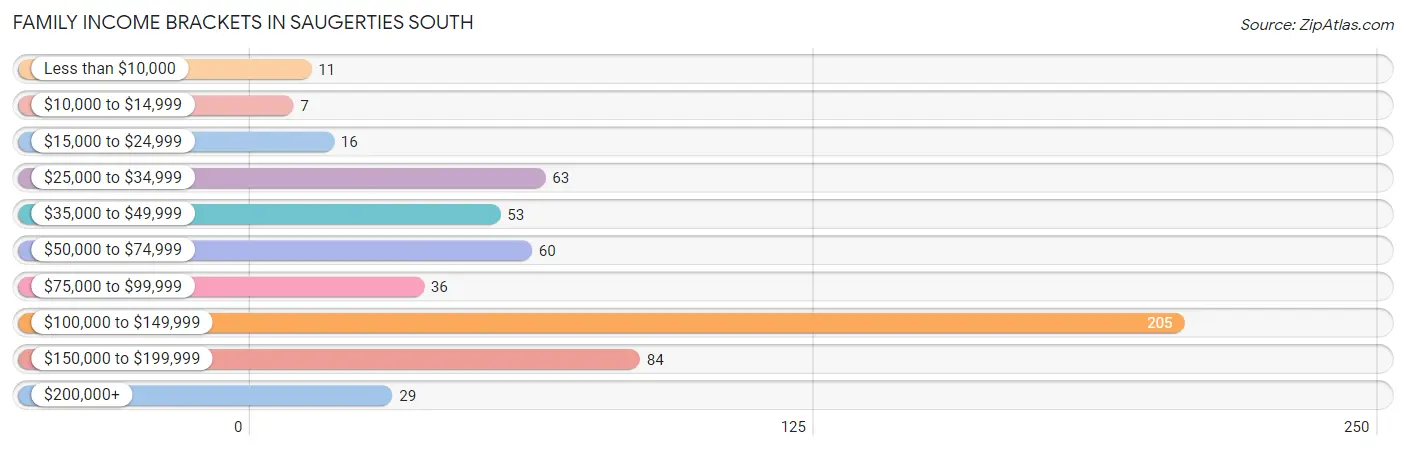
| Income Bracket | # Families | % Families |
| Less than $10,000 | 11 | 2.0% |
| $10,000 to $14,999 | 7 | 1.2% |
| $15,000 to $24,999 | 16 | 2.8% |
| $25,000 to $34,999 | 63 | 11.2% |
| $35,000 to $49,999 | 53 | 9.4% |
| $50,000 to $74,999 | 60 | 10.6% |
| $75,000 to $99,999 | 36 | 6.4% |
| $100,000 to $149,999 | 205 | 36.3% |
| $150,000 to $199,999 | 84 | 14.9% |
| $200,000+ | 29 | 5.1% |
Family Income by Famaliy Size in Saugerties South
4-person families (57 | 10.1%) account for the highest median family income in Saugerties South with $129,798 per family, while 3-person families (279 | 49.5%) have the highest median income of $36,442 per family member.
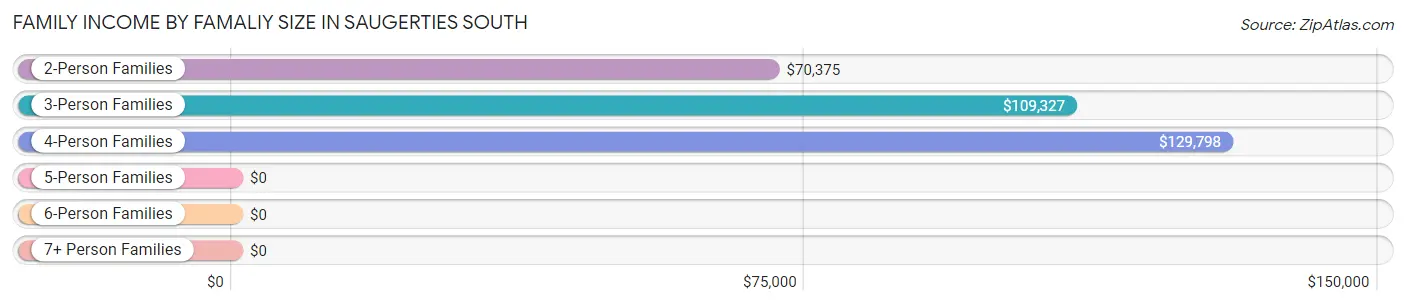
| Income Bracket | # Families | Median Income |
| 2-Person Families | 215 (38.1%) | $70,375 |
| 3-Person Families | 279 (49.5%) | $109,327 |
| 4-Person Families | 57 (10.1%) | $129,798 |
| 5-Person Families | 6 (1.1%) | $0 |
| 6-Person Families | 7 (1.2%) | $0 |
| 7+ Person Families | 0 (0.0%) | $0 |
| Total | 564 (100.0%) | $112,500 |
Family Income by Number of Earners in Saugerties South
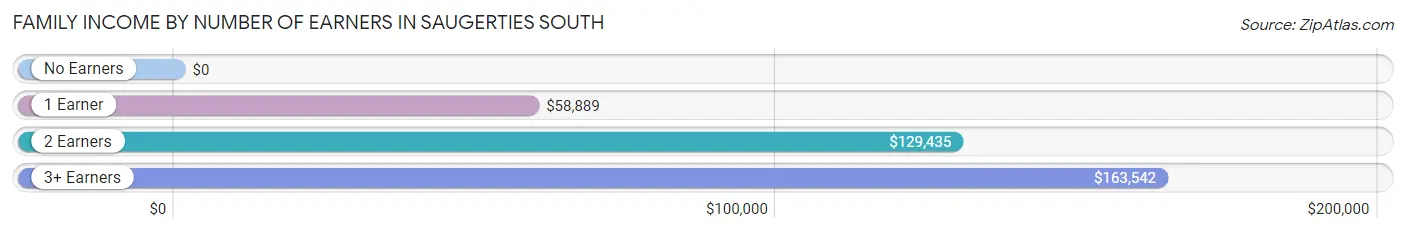
| Number of Earners | # Families | Median Income |
| No Earners | 55 (9.8%) | $0 |
| 1 Earner | 222 (39.4%) | $58,889 |
| 2 Earners | 246 (43.6%) | $129,435 |
| 3+ Earners | 41 (7.3%) | $163,542 |
| Total | 564 (100.0%) | $112,500 |
Household Income in Saugerties South
Household Income Brackets in Saugerties South
With 246 households falling in the category, the $100,000 to $149,999 income range is the most frequent in Saugerties South, accounting for 26.4% of all households. In contrast, only 27 households (2.9%) fall into the $10,000 to $14,999 income bracket, making it the least populous group.
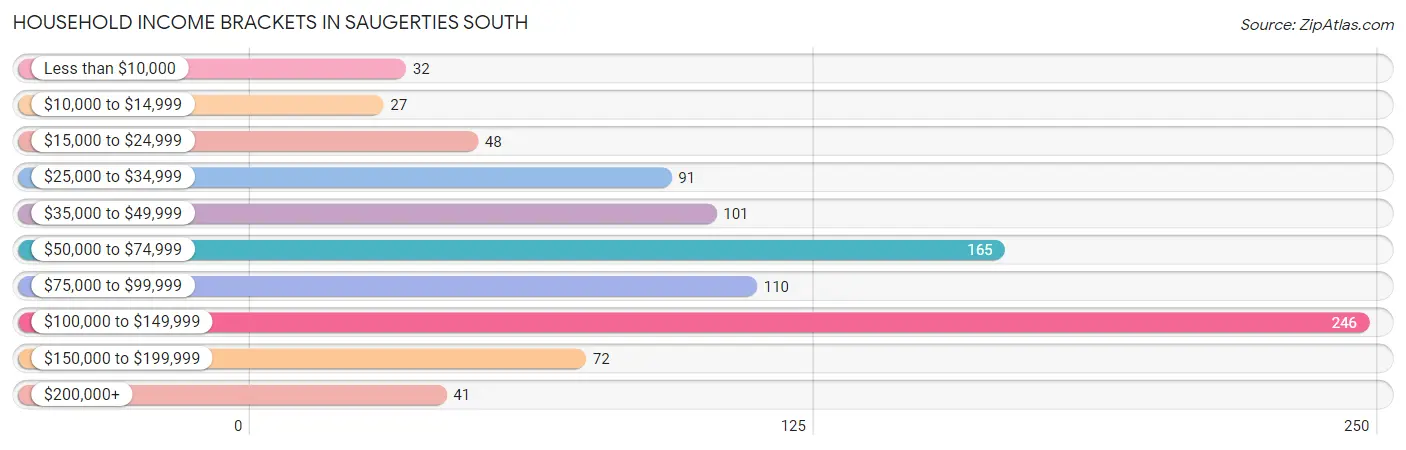
| Income Bracket | # Households | % Households |
| Less than $10,000 | 32 | 3.4% |
| $10,000 to $14,999 | 27 | 2.9% |
| $15,000 to $24,999 | 48 | 5.1% |
| $25,000 to $34,999 | 91 | 9.8% |
| $35,000 to $49,999 | 101 | 10.8% |
| $50,000 to $74,999 | 165 | 17.7% |
| $75,000 to $99,999 | 110 | 11.8% |
| $100,000 to $149,999 | 246 | 26.4% |
| $150,000 to $199,999 | 72 | 7.7% |
| $200,000+ | 41 | 4.4% |
Household Income by Householder Age in Saugerties South
The median household income in Saugerties South is $75,568, with the highest median household income of $117,153 found in the 25 to 44 years age bracket for the primary householder. A total of 269 households (28.8%) fall into this category. Meanwhile, the 15 to 24 years age bracket for the primary householder has the lowest median household income of $0, with 12 households (1.3%) in this group.
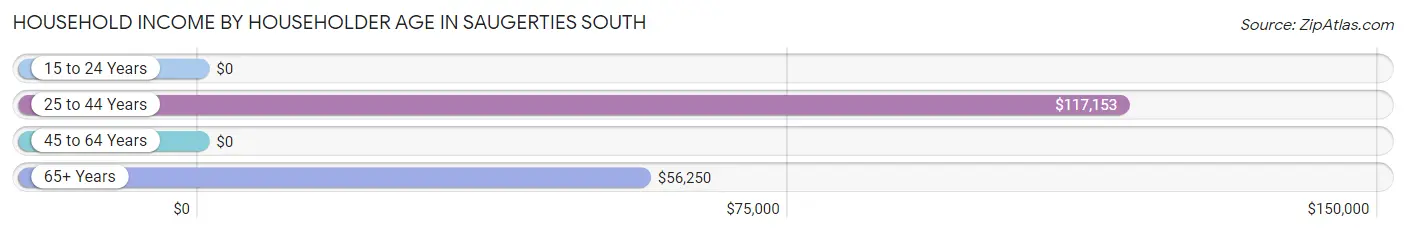
| Income Bracket | # Households | Median Income |
| 15 to 24 Years | 12 (1.3%) | $0 |
| 25 to 44 Years | 269 (28.8%) | $117,153 |
| 45 to 64 Years | 330 (35.4%) | $0 |
| 65+ Years | 322 (34.5%) | $56,250 |
| Total | 933 (100.0%) | $75,568 |
Poverty in Saugerties South
Income Below Poverty by Sex and Age in Saugerties South
With 6.4% poverty level for males and 11.7% for females among the residents of Saugerties South, under 5 year old males and 18 to 24 year old females are the most vulnerable to poverty, with 13 males (46.4%) and 12 females (34.3%) in their respective age groups living below the poverty level.
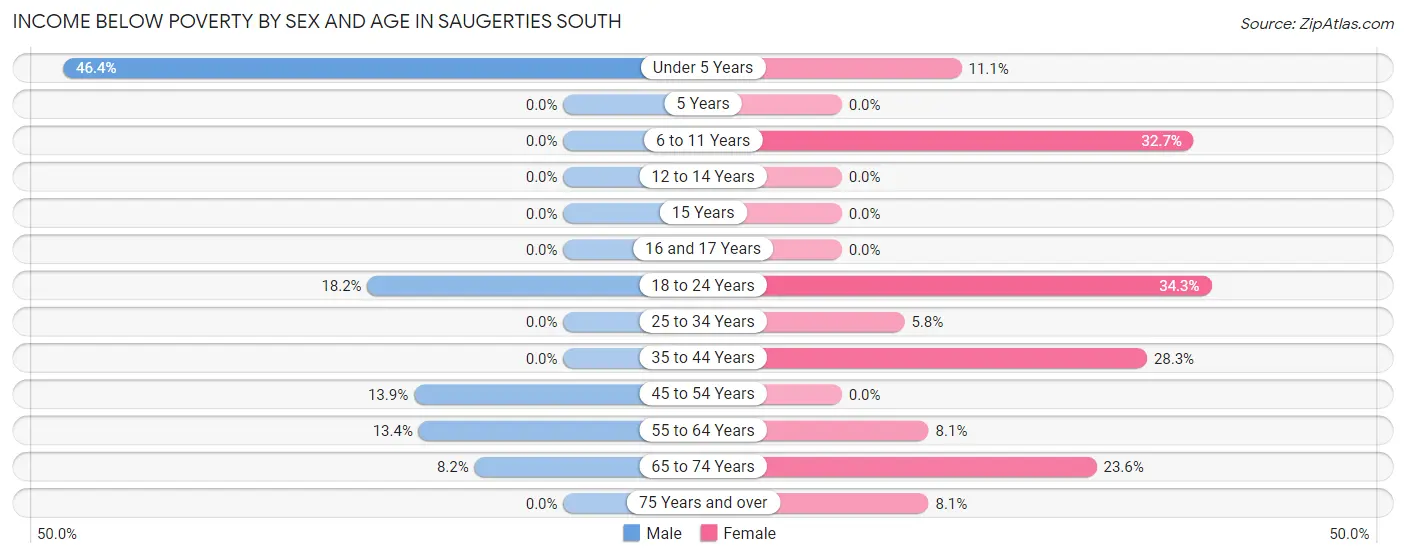
| Age Bracket | Male | Female |
| Under 5 Years | 13 (46.4%) | 9 (11.1%) |
| 5 Years | 0 (0.0%) | 0 (0.0%) |
| 6 to 11 Years | 0 (0.0%) | 16 (32.7%) |
| 12 to 14 Years | 0 (0.0%) | 0 (0.0%) |
| 15 Years | 0 (0.0%) | 0 (0.0%) |
| 16 and 17 Years | 0 (0.0%) | 0 (0.0%) |
| 18 to 24 Years | 14 (18.2%) | 12 (34.3%) |
| 25 to 34 Years | 0 (0.0%) | 11 (5.8%) |
| 35 to 44 Years | 0 (0.0%) | 32 (28.3%) |
| 45 to 54 Years | 14 (13.9%) | 0 (0.0%) |
| 55 to 64 Years | 20 (13.4%) | 15 (8.1%) |
| 65 to 74 Years | 7 (8.2%) | 26 (23.6%) |
| 75 Years and over | 0 (0.0%) | 14 (8.1%) |
| Total | 68 (6.4%) | 135 (11.7%) |
Income Above Poverty by Sex and Age in Saugerties South
According to the poverty statistics in Saugerties South, males aged 5 years and females aged 5 years are the age groups that are most secure financially, with 100.0% of males and 100.0% of females in these age groups living above the poverty line.
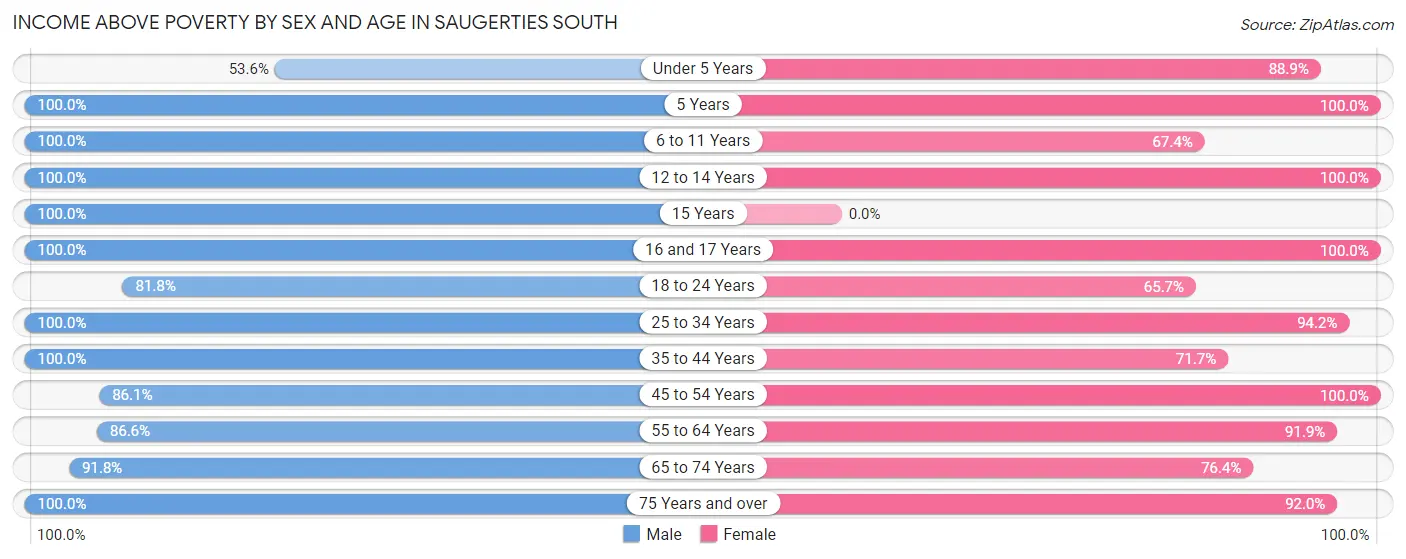
| Age Bracket | Male | Female |
| Under 5 Years | 15 (53.6%) | 72 (88.9%) |
| 5 Years | 12 (100.0%) | 24 (100.0%) |
| 6 to 11 Years | 58 (100.0%) | 33 (67.3%) |
| 12 to 14 Years | 51 (100.0%) | 9 (100.0%) |
| 15 Years | 13 (100.0%) | 0 (0.0%) |
| 16 and 17 Years | 50 (100.0%) | 13 (100.0%) |
| 18 to 24 Years | 63 (81.8%) | 23 (65.7%) |
| 25 to 34 Years | 242 (100.0%) | 178 (94.2%) |
| 35 to 44 Years | 93 (100.0%) | 81 (71.7%) |
| 45 to 54 Years | 87 (86.1%) | 173 (100.0%) |
| 55 to 64 Years | 129 (86.6%) | 171 (91.9%) |
| 65 to 74 Years | 78 (91.8%) | 84 (76.4%) |
| 75 Years and over | 109 (100.0%) | 160 (91.9%) |
| Total | 1,000 (93.6%) | 1,021 (88.3%) |
Income Below Poverty Among Married-Couple Families in Saugerties South
The poverty statistics for married-couple families in Saugerties South show that 1.7% or 7 of the total 402 families live below the poverty line. Families with no children have the highest poverty rate of 2.5%, comprising of 7 families. On the other hand, families with 1 or 2 children have the lowest poverty rate of 0.0%, which includes 0 families.
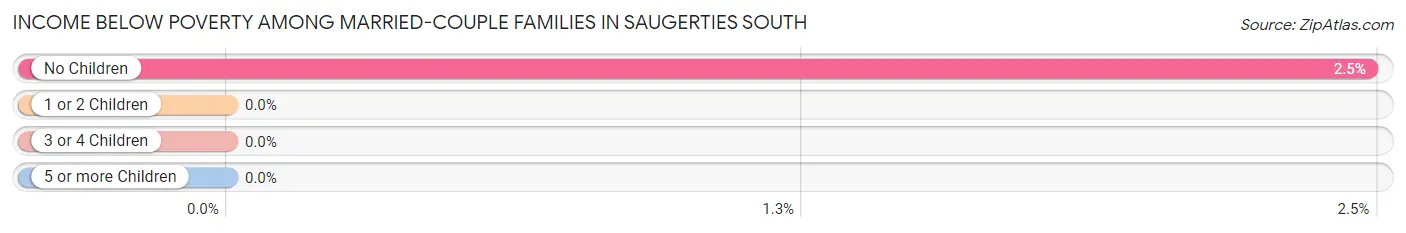
| Children | Above Poverty | Below Poverty |
| No Children | 275 (97.5%) | 7 (2.5%) |
| 1 or 2 Children | 113 (100.0%) | 0 (0.0%) |
| 3 or 4 Children | 7 (100.0%) | 0 (0.0%) |
| 5 or more Children | 0 (0.0%) | 0 (0.0%) |
| Total | 395 (98.3%) | 7 (1.7%) |
Income Below Poverty Among Single-Parent Households in Saugerties South
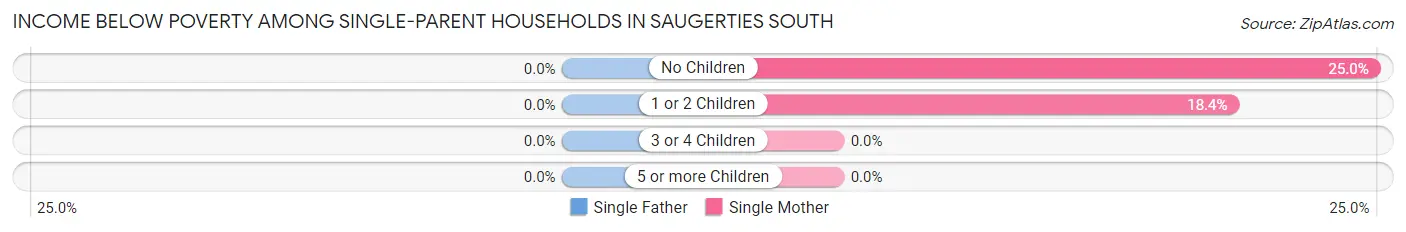
| Children | Single Father | Single Mother |
| No Children | 0 (0.0%) | 6 (25.0%) |
| 1 or 2 Children | 0 (0.0%) | 21 (18.4%) |
| 3 or 4 Children | 0 (0.0%) | 0 (0.0%) |
| 5 or more Children | 0 (0.0%) | 0 (0.0%) |
| Total | 0 (0.0%) | 27 (19.6%) |
Income Below Poverty Among Married-Couple vs Single-Parent Households in Saugerties South
The poverty data for Saugerties South shows that 7 of the married-couple family households (1.7%) and 27 of the single-parent households (16.7%) are living below the poverty level. Within the married-couple family households, those with no children have the highest poverty rate, with 7 households (2.5%) falling below the poverty line. Among the single-parent households, those with 1 or 2 children have the highest poverty rate, with 21 household (18.4%) living below poverty.
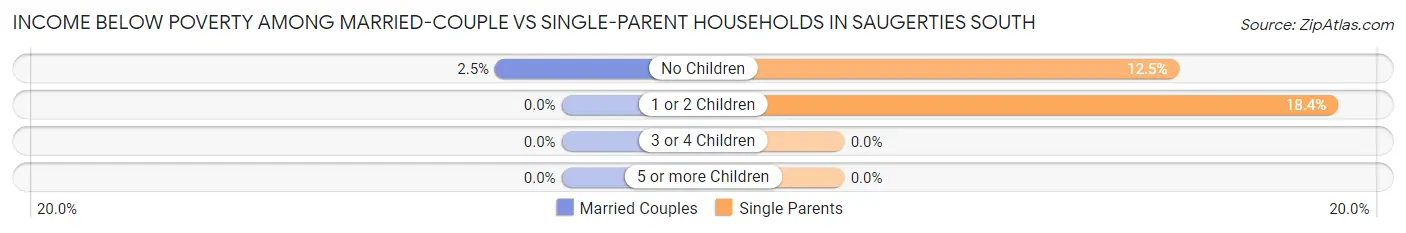
| Children | Married-Couple Families | Single-Parent Households |
| No Children | 7 (2.5%) | 6 (12.5%) |
| 1 or 2 Children | 0 (0.0%) | 21 (18.4%) |
| 3 or 4 Children | 0 (0.0%) | 0 (0.0%) |
| 5 or more Children | 0 (0.0%) | 0 (0.0%) |
| Total | 7 (1.7%) | 27 (16.7%) |
Race in Saugerties South
The most populous races in Saugerties South are White / Caucasian (1,866 | 83.9%), Two or more Races (275 | 12.4%), and Hispanic or Latino (103 | 4.6%).
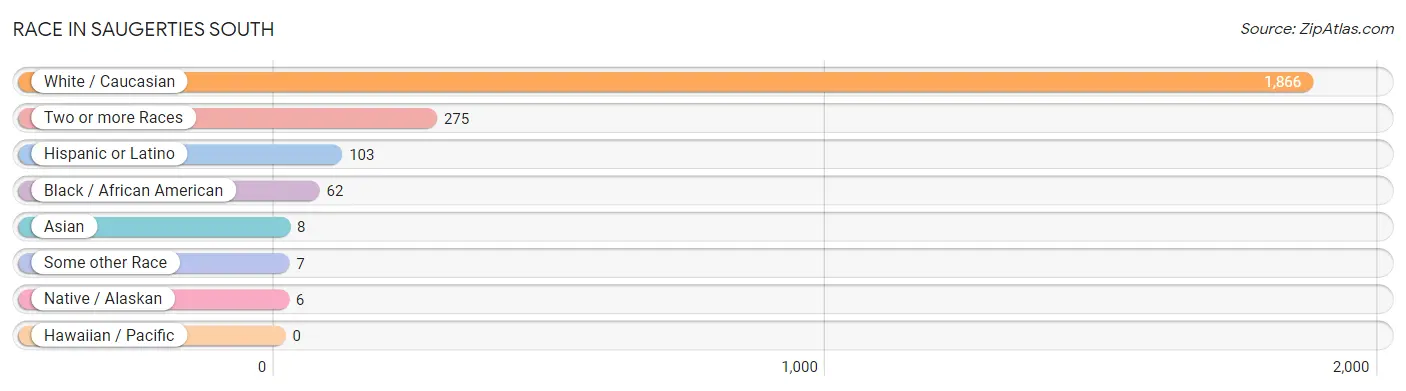
| Race | # Population | % Population |
| Asian | 8 | 0.4% |
| Black / African American | 62 | 2.8% |
| Hawaiian / Pacific | 0 | 0.0% |
| Hispanic or Latino | 103 | 4.6% |
| Native / Alaskan | 6 | 0.3% |
| White / Caucasian | 1,866 | 83.9% |
| Two or more Races | 275 | 12.4% |
| Some other Race | 7 | 0.3% |
| Total | 2,224 | 100.0% |
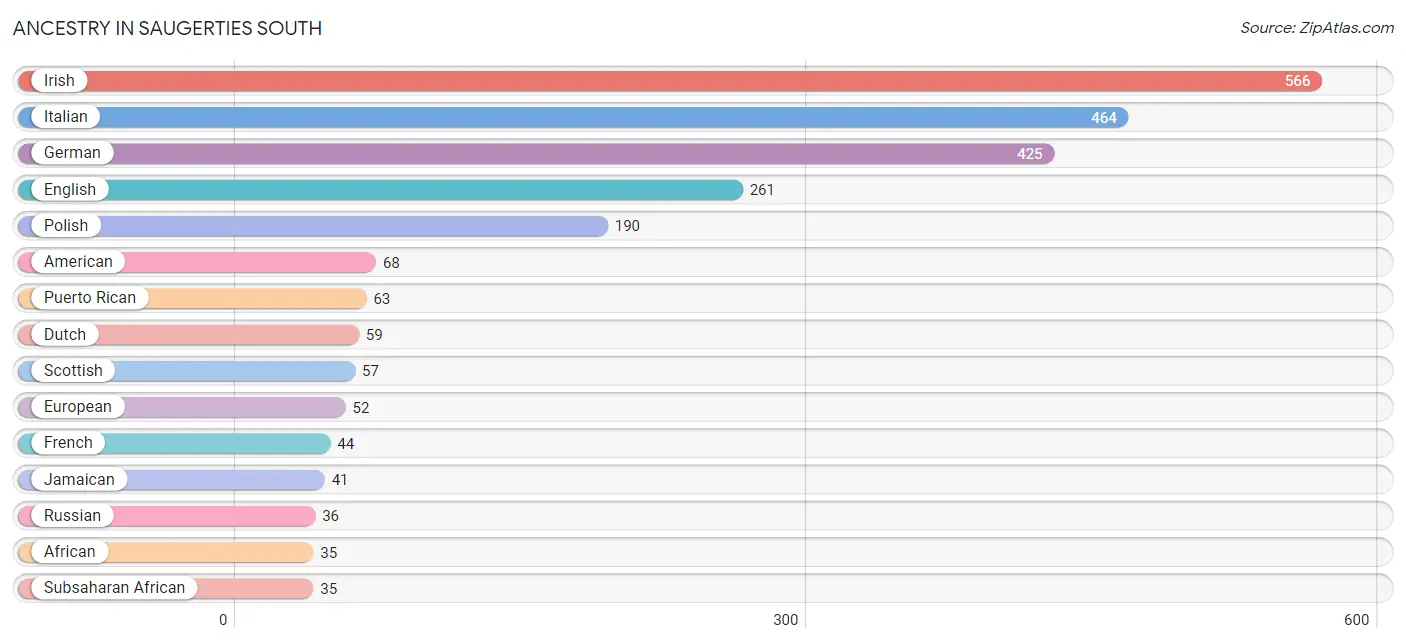
Ancestry in Saugerties South
The most populous ancestries reported in Saugerties South are Irish (566 | 25.5%), Italian (464 | 20.9%), German (425 | 19.1%), English (261 | 11.7%), and Polish (190 | 8.5%), together accounting for 85.7% of all Saugerties South residents.
| Ancestry | # Population | % Population |
| African | 35 | 1.6% |
| Albanian | 12 | 0.5% |
| American | 68 | 3.1% |
| British | 8 | 0.4% |
| Canadian | 12 | 0.5% |
| Celtic | 10 | 0.4% |
| Central American | 33 | 1.5% |
| Cherokee | 27 | 1.2% |
| Colombian | 7 | 0.3% |
| Cypriot | 8 | 0.4% |
| Czech | 14 | 0.6% |
| Dutch | 59 | 2.6% |
| Eastern European | 7 | 0.3% |
| English | 261 | 11.7% |
| European | 52 | 2.3% |
| French | 44 | 2.0% |
| French Canadian | 11 | 0.5% |
| German | 425 | 19.1% |
| Greek | 16 | 0.7% |
| Hungarian | 11 | 0.5% |
| Indian (Asian) | 14 | 0.6% |
| Irish | 566 | 25.5% |
| Iroquois | 6 | 0.3% |
| Italian | 464 | 20.9% |
| Jamaican | 41 | 1.8% |
| Lithuanian | 20 | 0.9% |
| Northern European | 8 | 0.4% |
| Norwegian | 23 | 1.0% |
| Pennsylvania German | 8 | 0.4% |
| Polish | 190 | 8.5% |
| Puerto Rican | 63 | 2.8% |
| Russian | 36 | 1.6% |
| Salvadoran | 33 | 1.5% |
| Scandinavian | 20 | 0.9% |
| Scotch-Irish | 28 | 1.3% |
| Scottish | 57 | 2.6% |
| Slovak | 11 | 0.5% |
| South American | 7 | 0.3% |
| Subsaharan African | 35 | 1.6% |
| Swedish | 17 | 0.8% |
| Ukrainian | 7 | 0.3% | View All 41 Rows |
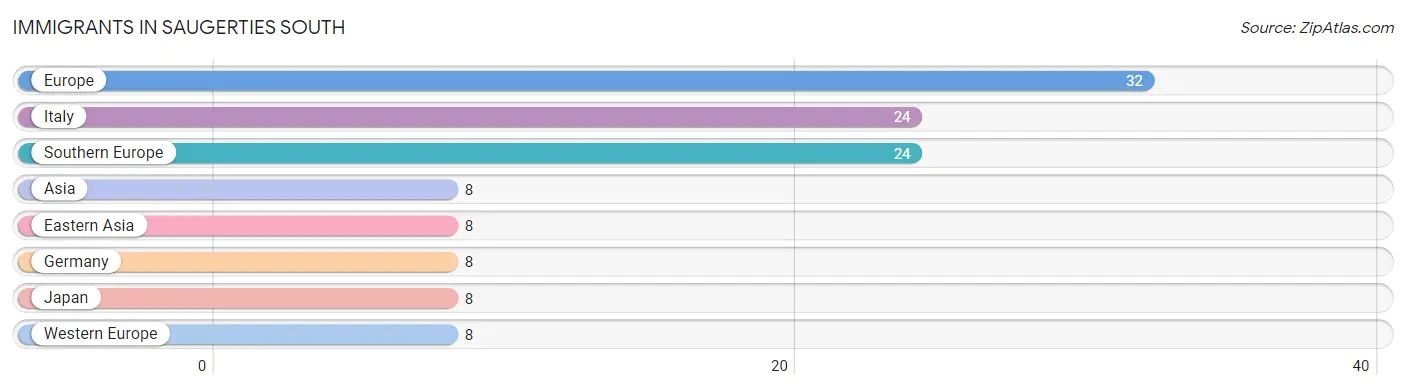
Immigrants in Saugerties South
The most numerous immigrant groups reported in Saugerties South came from Europe (32 | 1.4%), Italy (24 | 1.1%), Southern Europe (24 | 1.1%), Asia (8 | 0.4%), and Eastern Asia (8 | 0.4%), together accounting for 4.3% of all Saugerties South residents.
| Immigration Origin | # Population | % Population |
| Asia | 8 | 0.4% |
| Eastern Asia | 8 | 0.4% |
| Europe | 32 | 1.4% |
| Germany | 8 | 0.4% |
| Italy | 24 | 1.1% |
| Japan | 8 | 0.4% |
| Southern Europe | 24 | 1.1% |
| Western Europe | 8 | 0.4% | View All 8 Rows |
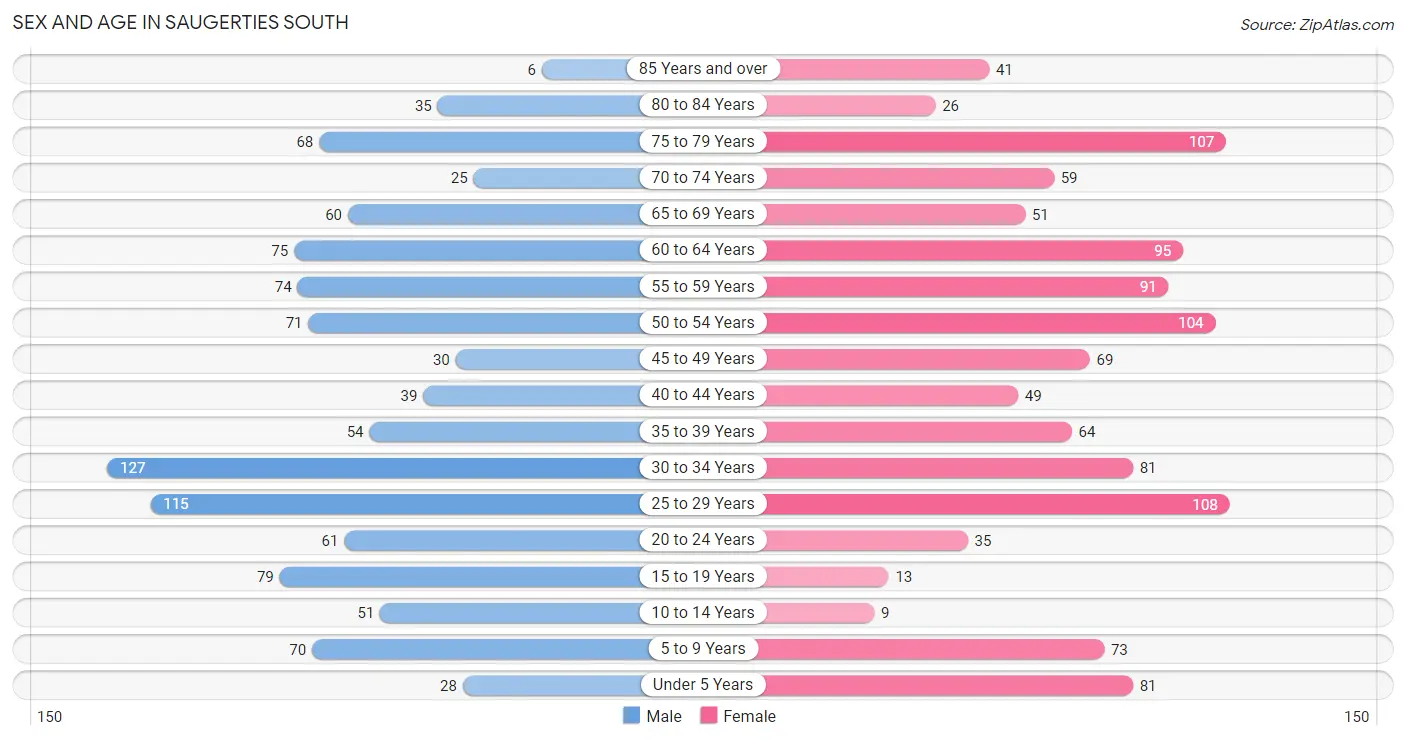
Sex and Age in Saugerties South
Sex and Age in Saugerties South
The most populous age groups in Saugerties South are 30 to 34 Years (127 | 11.9%) for men and 25 to 29 Years (108 | 9.3%) for women.
| Age Bracket | Male | Female |
| Under 5 Years | 28 (2.6%) | 81 (7.0%) |
| 5 to 9 Years | 70 (6.6%) | 73 (6.3%) |
| 10 to 14 Years | 51 (4.8%) | 9 (0.8%) |
| 15 to 19 Years | 79 (7.4%) | 13 (1.1%) |
| 20 to 24 Years | 61 (5.7%) | 35 (3.0%) |
| 25 to 29 Years | 115 (10.8%) | 108 (9.3%) |
| 30 to 34 Years | 127 (11.9%) | 81 (7.0%) |
| 35 to 39 Years | 54 (5.1%) | 64 (5.5%) |
| 40 to 44 Years | 39 (3.6%) | 49 (4.2%) |
| 45 to 49 Years | 30 (2.8%) | 69 (6.0%) |
| 50 to 54 Years | 71 (6.7%) | 104 (9.0%) |
| 55 to 59 Years | 74 (6.9%) | 91 (7.9%) |
| 60 to 64 Years | 75 (7.0%) | 95 (8.2%) |
| 65 to 69 Years | 60 (5.6%) | 51 (4.4%) |
| 70 to 74 Years | 25 (2.3%) | 59 (5.1%) |
| 75 to 79 Years | 68 (6.4%) | 107 (9.3%) |
| 80 to 84 Years | 35 (3.3%) | 26 (2.2%) |
| 85 Years and over | 6 (0.6%) | 41 (3.5%) |
| Total | 1,068 (100.0%) | 1,156 (100.0%) |
Families and Households in Saugerties South
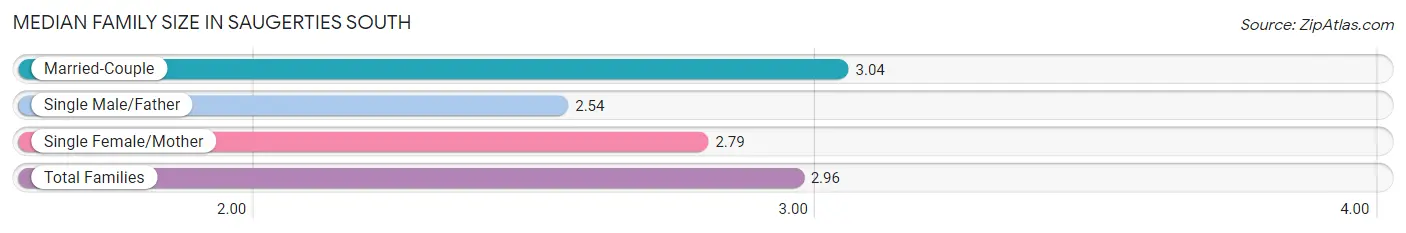
Median Family Size in Saugerties South
The median family size in Saugerties South is 2.96 persons per family, with married-couple families (402 | 71.3%) accounting for the largest median family size of 3.04 persons per family. On the other hand, single male/father families (24 | 4.3%) represent the smallest median family size with 2.54 persons per family.
| Family Type | # Families | Family Size |
| Married-Couple | 402 (71.3%) | 3.04 |
| Single Male/Father | 24 (4.3%) | 2.54 |
| Single Female/Mother | 138 (24.5%) | 2.79 |
| Total Families | 564 (100.0%) | 2.96 |
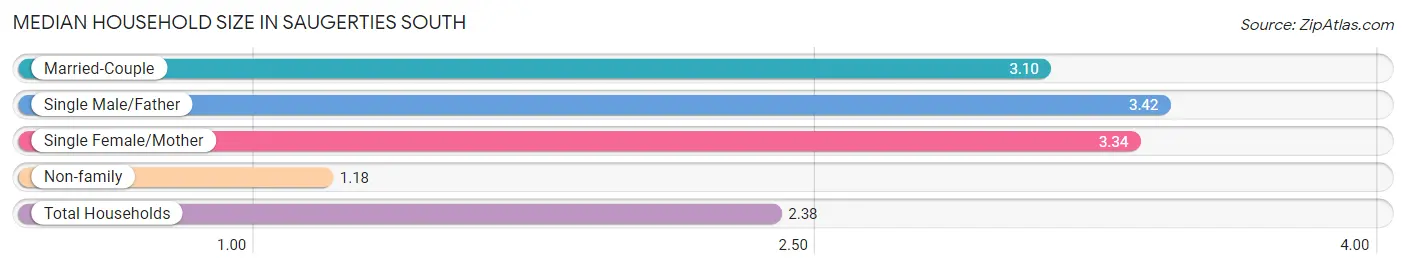
Median Household Size in Saugerties South
The median household size in Saugerties South is 2.38 persons per household, with single male/father households (24 | 2.6%) accounting for the largest median household size of 3.42 persons per household. non-family households (369 | 39.6%) represent the smallest median household size with 1.18 persons per household.
| Household Type | # Households | Household Size |
| Married-Couple | 402 (43.1%) | 3.10 |
| Single Male/Father | 24 (2.6%) | 3.42 |
| Single Female/Mother | 138 (14.8%) | 3.34 |
| Non-family | 369 (39.6%) | 1.18 |
| Total Households | 933 (100.0%) | 2.38 |
Household Size by Marriage Status in Saugerties South
Out of a total of 933 households in Saugerties South, 564 (60.5%) are family households, while 369 (39.6%) are nonfamily households. The most numerous type of family households are 3-person households, comprising 250, and the most common type of nonfamily households are 1-person households, comprising 301.
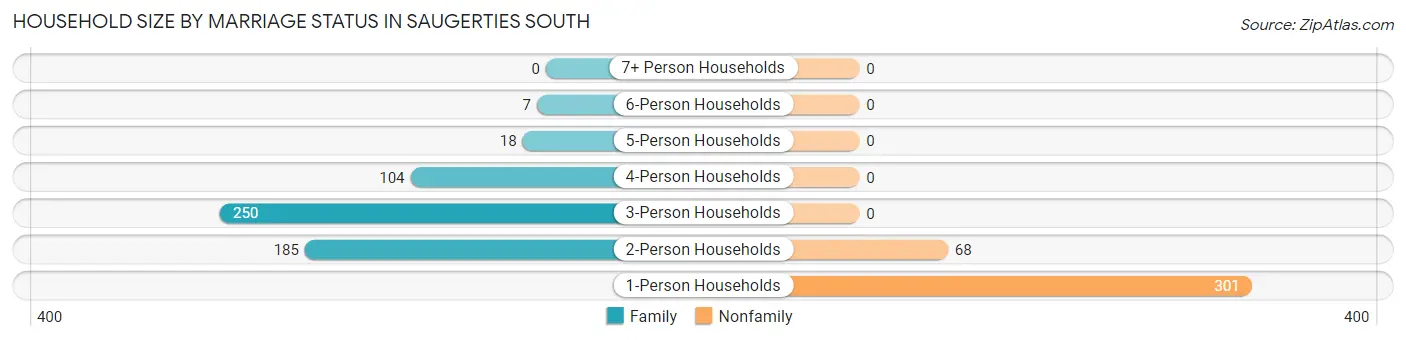
| Household Size | Family Households | Nonfamily Households |
| 1-Person Households | - | 301 (32.3%) |
| 2-Person Households | 185 (19.8%) | 68 (7.3%) |
| 3-Person Households | 250 (26.8%) | 0 (0.0%) |
| 4-Person Households | 104 (11.2%) | 0 (0.0%) |
| 5-Person Households | 18 (1.9%) | 0 (0.0%) |
| 6-Person Households | 7 (0.7%) | 0 (0.0%) |
| 7+ Person Households | 0 (0.0%) | 0 (0.0%) |
| Total | 564 (60.5%) | 369 (39.6%) |
Female Fertility in Saugerties South
Fertility by Age in Saugerties South
Average fertility rate in Saugerties South is 64.0 births per 1,000 women. Women in the age bracket of 20 to 34 years have the highest fertility rate with 121.0 births per 1,000 women. Women in the age bracket of 20 to 34 years acount for 100.0% of all women with births.
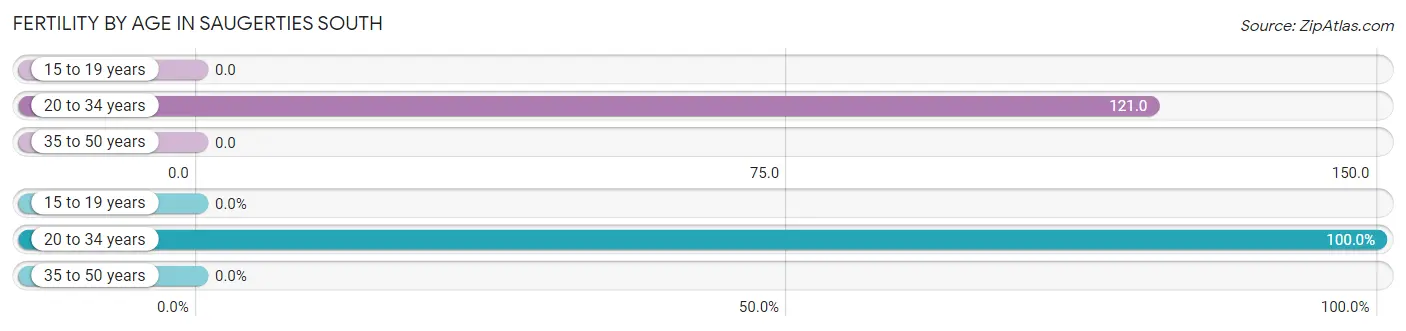
| Age Bracket | Women with Births | Births / 1,000 Women |
| 15 to 19 years | 0 (0.0%) | 0.0 |
| 20 to 34 years | 27 (100.0%) | 121.0 |
| 35 to 50 years | 0 (0.0%) | 0.0 |
| Total | 27 (100.0%) | 64.0 |
Fertility by Age by Marriage Status in Saugerties South
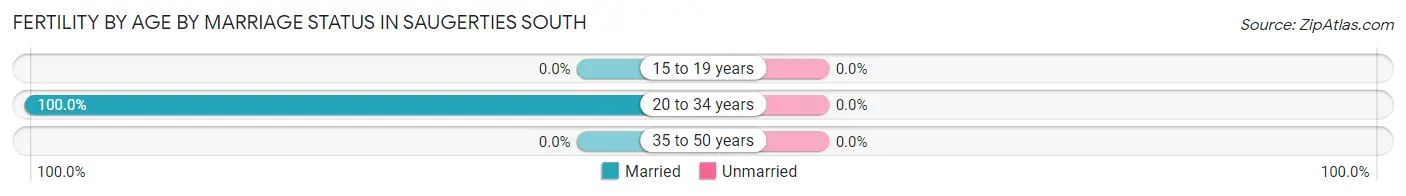
| Age Bracket | Married | Unmarried |
| 15 to 19 years | 0 (0.0%) | 0 (0.0%) |
| 20 to 34 years | 27 (100.0%) | 0 (0.0%) |
| 35 to 50 years | 0 (0.0%) | 0 (0.0%) |
| Total | 27 (100.0%) | 0 (0.0%) |
Fertility by Education in Saugerties South
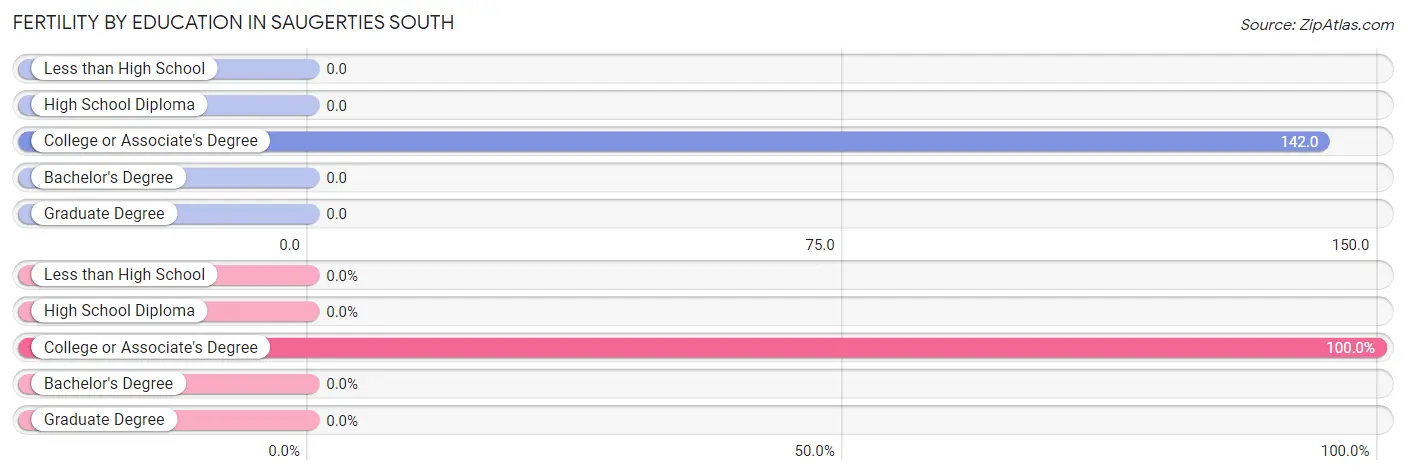
| Educational Attainment | Women with Births | Births / 1,000 Women |
| Less than High School | 0 (0.0%) | 0.0 |
| High School Diploma | 0 (0.0%) | 0.0 |
| College or Associate's Degree | 27 (100.0%) | 142.0 |
| Bachelor's Degree | 0 (0.0%) | 0.0 |
| Graduate Degree | 0 (0.0%) | 0.0 |
| Total | 27 (100.0%) | 64.0 |
Fertility by Education by Marriage Status in Saugerties South
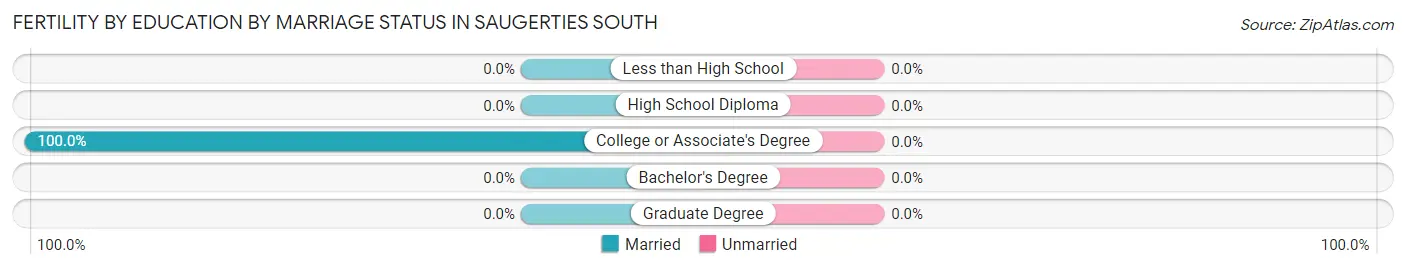
| Educational Attainment | Married | Unmarried |
| Less than High School | 0 (0.0%) | 0 (0.0%) |
| High School Diploma | 0 (0.0%) | 0 (0.0%) |
| College or Associate's Degree | 27 (100.0%) | 0 (0.0%) |
| Bachelor's Degree | 0 (0.0%) | 0 (0.0%) |
| Graduate Degree | 0 (0.0%) | 0 (0.0%) |
| Total | 27 (100.0%) | 0 (0.0%) |
Employment Characteristics in Saugerties South
Employment by Class of Employer in Saugerties South
Among the 1,114 employed individuals in Saugerties South, private company employees (824 | 74.0%), not-for-profit organizations (140 | 12.6%), and local government employees (111 | 10.0%) make up the most common classes of employment.
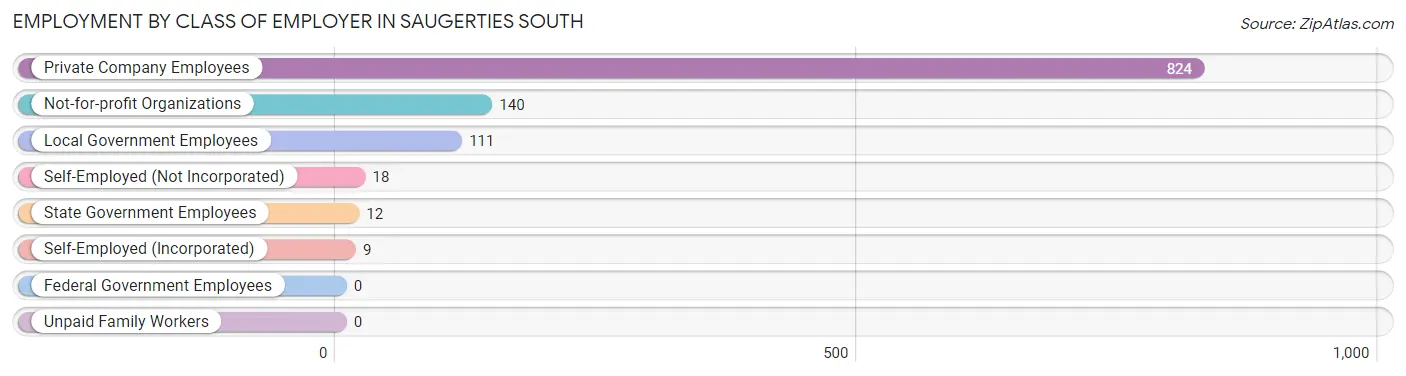
| Employer Class | # Employees | % Employees |
| Private Company Employees | 824 | 74.0% |
| Self-Employed (Incorporated) | 9 | 0.8% |
| Self-Employed (Not Incorporated) | 18 | 1.6% |
| Not-for-profit Organizations | 140 | 12.6% |
| Local Government Employees | 111 | 10.0% |
| State Government Employees | 12 | 1.1% |
| Federal Government Employees | 0 | 0.0% |
| Unpaid Family Workers | 0 | 0.0% |
| Total | 1,114 | 100.0% |
Employment Status by Age in Saugerties South
According to the labor force statistics for Saugerties South, out of the total population over 16 years of age (1,899), 63.2% or 1,200 individuals are in the labor force, with 7.2% or 86 of them unemployed. The age group with the highest labor force participation rate is 25 to 29 years, with 100.0% or 223 individuals in the labor force. Within the labor force, the 55 to 59 years age range has the highest percentage of unemployed individuals, with 15.6% or 21 of them being unemployed.
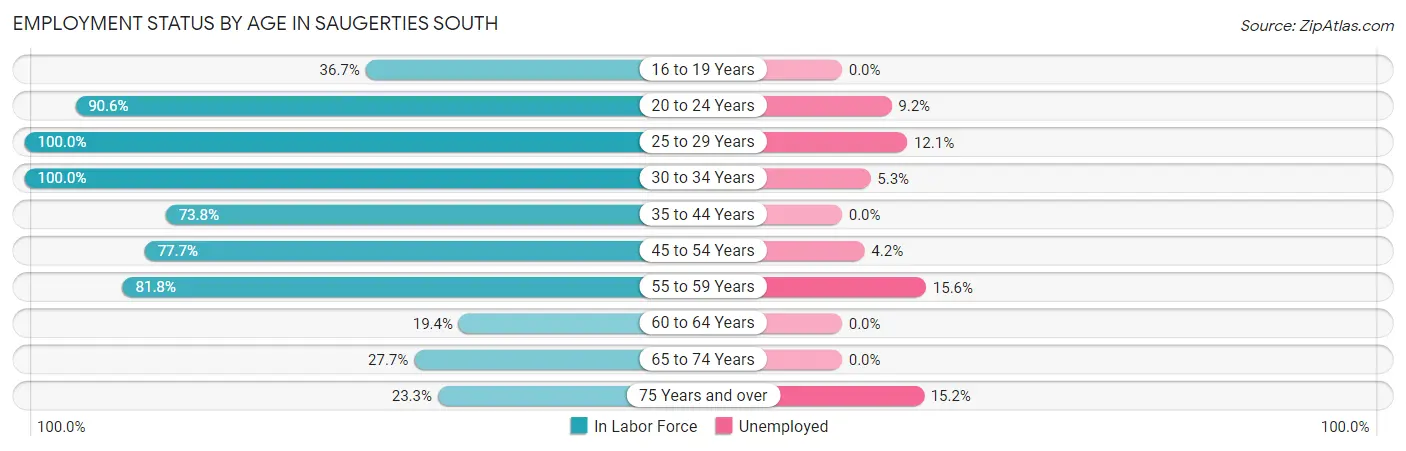
| Age Bracket | In Labor Force | Unemployed |
| 16 to 19 Years | 29 (36.7%) | 0 (0.0%) |
| 20 to 24 Years | 87 (90.6%) | 8 (9.2%) |
| 25 to 29 Years | 223 (100.0%) | 27 (12.1%) |
| 30 to 34 Years | 208 (100.0%) | 11 (5.3%) |
| 35 to 44 Years | 152 (73.8%) | 0 (0.0%) |
| 45 to 54 Years | 213 (77.7%) | 9 (4.2%) |
| 55 to 59 Years | 135 (81.8%) | 21 (15.6%) |
| 60 to 64 Years | 33 (19.4%) | 0 (0.0%) |
| 65 to 74 Years | 54 (27.7%) | 0 (0.0%) |
| 75 Years and over | 66 (23.3%) | 10 (15.2%) |
| Total | 1,200 (63.2%) | 86 (7.2%) |
Employment Status by Educational Attainment in Saugerties South
According to labor force statistics for Saugerties South, 77.4% of individuals (964) out of the total population between 25 and 64 years of age (1,246) are in the labor force, with 7.1% or 68 of them being unemployed. The group with the highest labor force participation rate are those with the educational attainment of bachelor's degree or higher, with 85.6% or 308 individuals in the labor force. Within the labor force, individuals with high school diploma education have the highest percentage of unemployment, with 13.2% or 30 of them being unemployed.
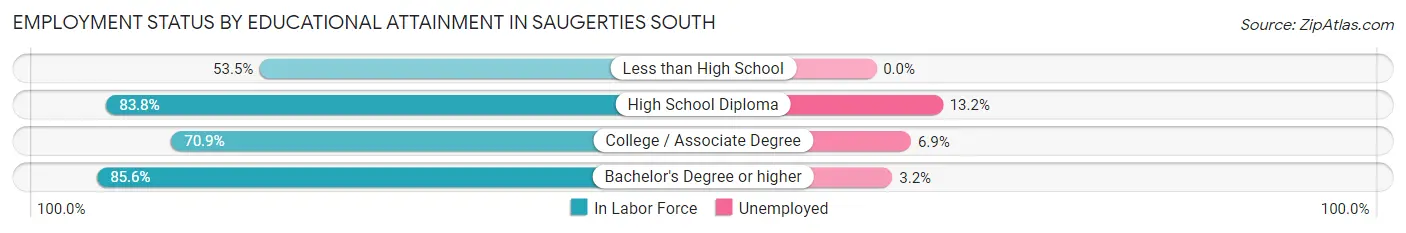
| Educational Attainment | In Labor Force | Unemployed |
| Less than High School | 23 (53.5%) | 0 (0.0%) |
| High School Diploma | 228 (83.8%) | 36 (13.2%) |
| College / Associate Degree | 405 (70.9%) | 39 (6.9%) |
| Bachelor's Degree or higher | 308 (85.6%) | 12 (3.2%) |
| Total | 964 (77.4%) | 88 (7.1%) |
Employment Occupations by Sex in Saugerties South
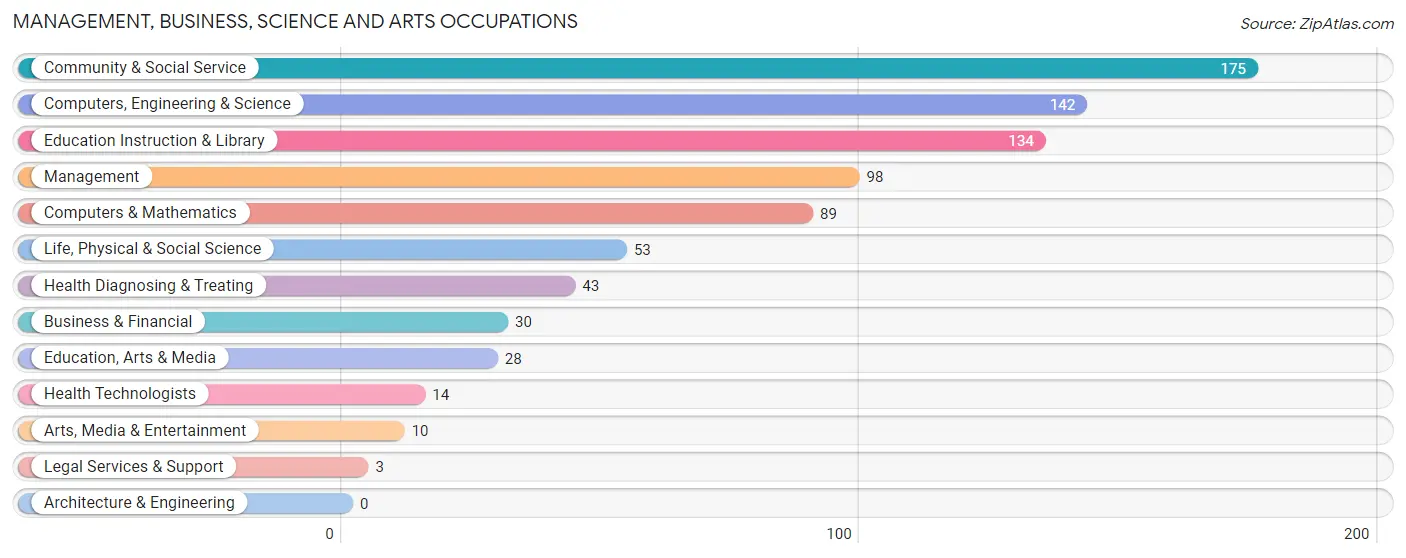
Management, Business, Science and Arts Occupations
The most common Management, Business, Science and Arts occupations in Saugerties South are Community & Social Service (175 | 15.7%), Computers, Engineering & Science (142 | 12.8%), Education Instruction & Library (134 | 12.0%), Management (98 | 8.8%), and Computers & Mathematics (89 | 8.0%).
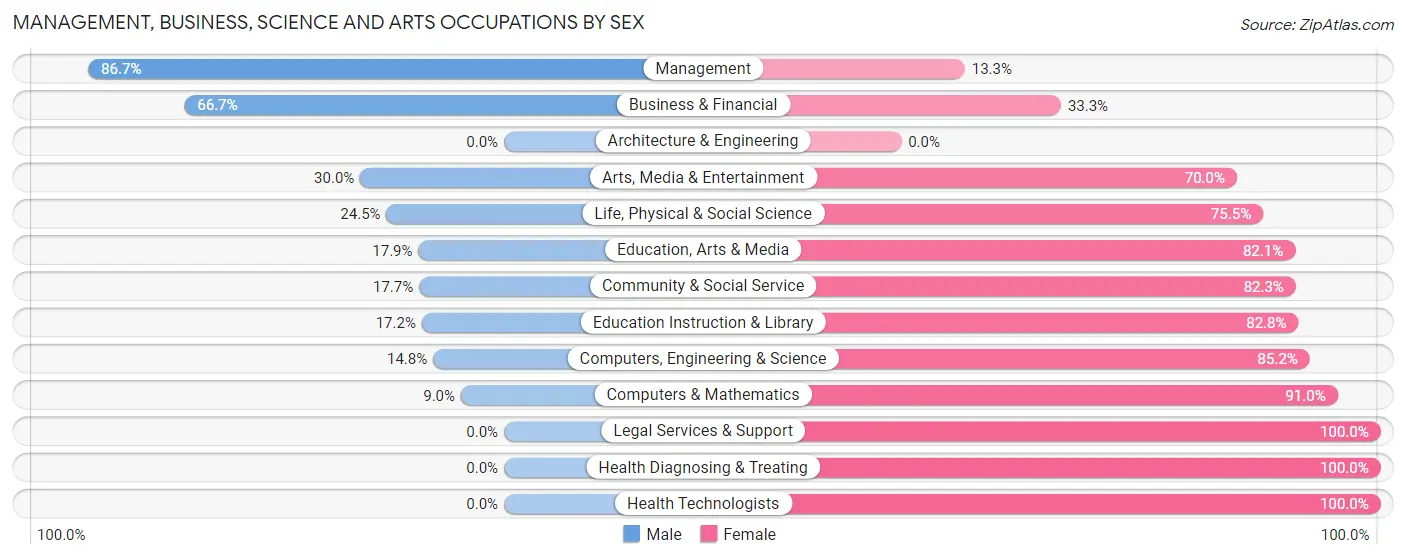
Management, Business, Science and Arts Occupations by Sex
Within the Management, Business, Science and Arts occupations in Saugerties South, the most male-oriented occupations are Management (86.7%), Business & Financial (66.7%), and Arts, Media & Entertainment (30.0%), while the most female-oriented occupations are Legal Services & Support (100.0%), Health Diagnosing & Treating (100.0%), and Health Technologists (100.0%).
| Occupation | Male | Female |
| Management | 85 (86.7%) | 13 (13.3%) |
| Business & Financial | 20 (66.7%) | 10 (33.3%) |
| Computers, Engineering & Science | 21 (14.8%) | 121 (85.2%) |
| Computers & Mathematics | 8 (9.0%) | 81 (91.0%) |
| Architecture & Engineering | 0 (0.0%) | 0 (0.0%) |
| Life, Physical & Social Science | 13 (24.5%) | 40 (75.5%) |
| Community & Social Service | 31 (17.7%) | 144 (82.3%) |
| Education, Arts & Media | 5 (17.9%) | 23 (82.1%) |
| Legal Services & Support | 0 (0.0%) | 3 (100.0%) |
| Education Instruction & Library | 23 (17.2%) | 111 (82.8%) |
| Arts, Media & Entertainment | 3 (30.0%) | 7 (70.0%) |
| Health Diagnosing & Treating | 0 (0.0%) | 43 (100.0%) |
| Health Technologists | 0 (0.0%) | 14 (100.0%) |
| Total (Category) | 157 (32.2%) | 331 (67.8%) |
| Total (Overall) | 511 (45.9%) | 603 (54.1%) |
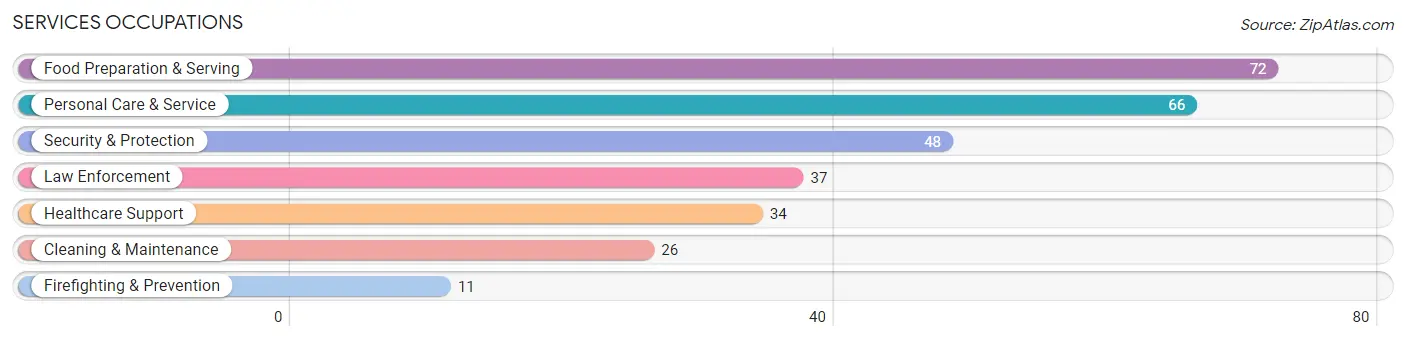
Services Occupations
The most common Services occupations in Saugerties South are Food Preparation & Serving (72 | 6.5%), Personal Care & Service (66 | 5.9%), Security & Protection (48 | 4.3%), Law Enforcement (37 | 3.3%), and Healthcare Support (34 | 3.0%).
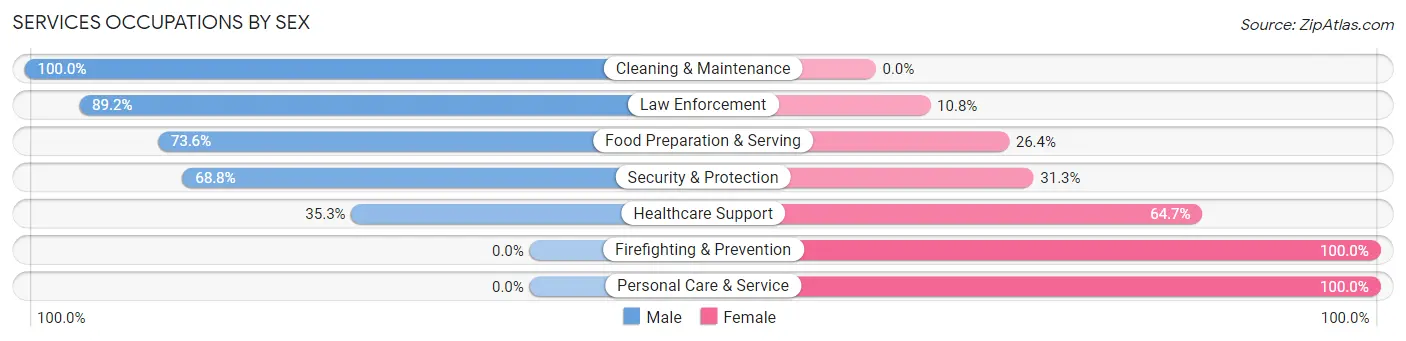
Services Occupations by Sex
Within the Services occupations in Saugerties South, the most male-oriented occupations are Cleaning & Maintenance (100.0%), Law Enforcement (89.2%), and Food Preparation & Serving (73.6%), while the most female-oriented occupations are Firefighting & Prevention (100.0%), Personal Care & Service (100.0%), and Healthcare Support (64.7%).
| Occupation | Male | Female |
| Healthcare Support | 12 (35.3%) | 22 (64.7%) |
| Security & Protection | 33 (68.8%) | 15 (31.2%) |
| Firefighting & Prevention | 0 (0.0%) | 11 (100.0%) |
| Law Enforcement | 33 (89.2%) | 4 (10.8%) |
| Food Preparation & Serving | 53 (73.6%) | 19 (26.4%) |
| Cleaning & Maintenance | 26 (100.0%) | 0 (0.0%) |
| Personal Care & Service | 0 (0.0%) | 66 (100.0%) |
| Total (Category) | 124 (50.4%) | 122 (49.6%) |
| Total (Overall) | 511 (45.9%) | 603 (54.1%) |
Sales and Office Occupations
The most common Sales and Office occupations in Saugerties South are Office & Administration (121 | 10.9%), and Sales & Related (117 | 10.5%).
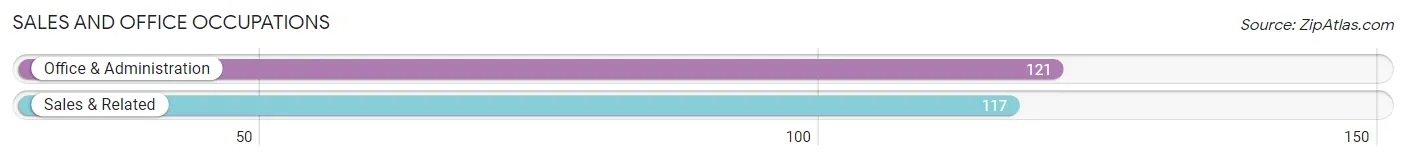
Sales and Office Occupations by Sex
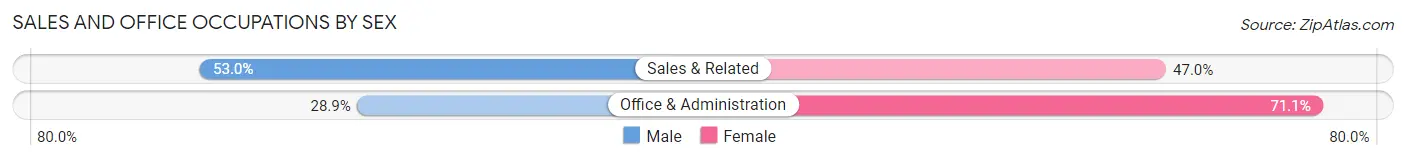
| Occupation | Male | Female |
| Sales & Related | 62 (53.0%) | 55 (47.0%) |
| Office & Administration | 35 (28.9%) | 86 (71.1%) |
| Total (Category) | 97 (40.8%) | 141 (59.2%) |
| Total (Overall) | 511 (45.9%) | 603 (54.1%) |
Natural Resources, Construction and Maintenance Occupations
The most common Natural Resources, Construction and Maintenance occupations in Saugerties South are Installation, Maintenance & Repair (58 | 5.2%), and Construction & Extraction (12 | 1.1%).
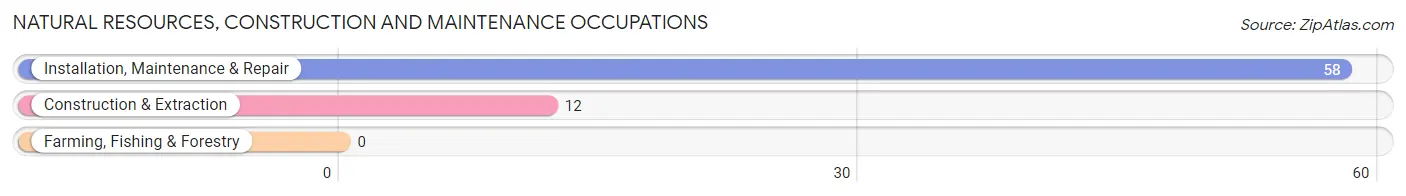
Natural Resources, Construction and Maintenance Occupations by Sex
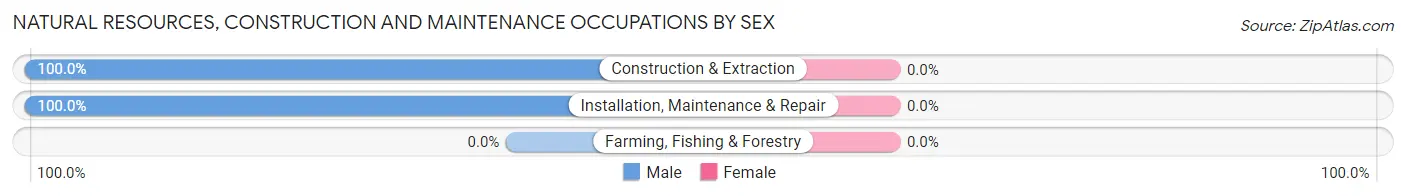
| Occupation | Male | Female |
| Farming, Fishing & Forestry | 0 (0.0%) | 0 (0.0%) |
| Construction & Extraction | 12 (100.0%) | 0 (0.0%) |
| Installation, Maintenance & Repair | 58 (100.0%) | 0 (0.0%) |
| Total (Category) | 70 (100.0%) | 0 (0.0%) |
| Total (Overall) | 511 (45.9%) | 603 (54.1%) |
Production, Transportation and Moving Occupations
The most common Production, Transportation and Moving occupations in Saugerties South are Transportation (50 | 4.5%), Production (14 | 1.3%), and Material Moving (8 | 0.7%).
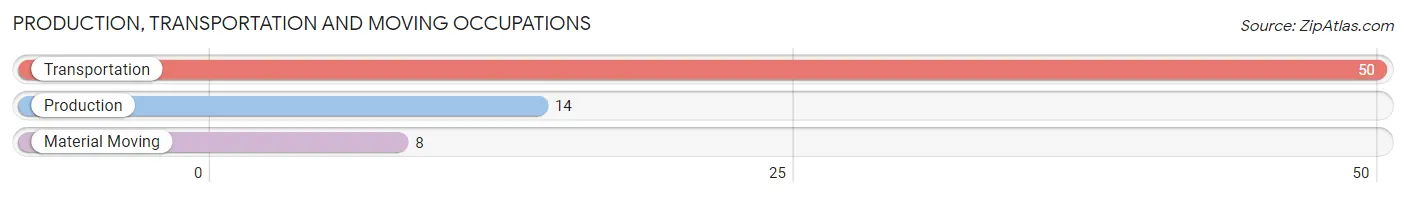
Production, Transportation and Moving Occupations by Sex
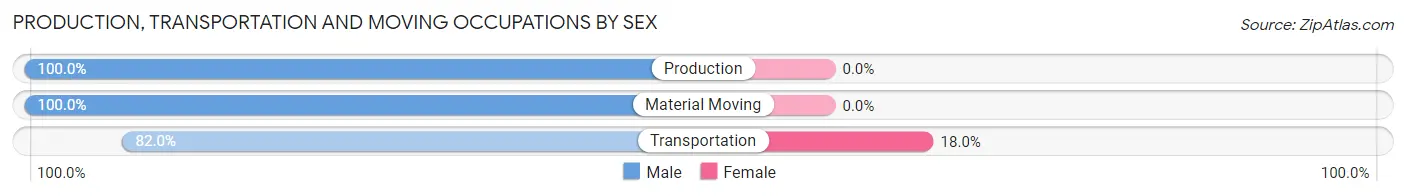
| Occupation | Male | Female |
| Production | 14 (100.0%) | 0 (0.0%) |
| Transportation | 41 (82.0%) | 9 (18.0%) |
| Material Moving | 8 (100.0%) | 0 (0.0%) |
| Total (Category) | 63 (87.5%) | 9 (12.5%) |
| Total (Overall) | 511 (45.9%) | 603 (54.1%) |
Employment Industries by Sex in Saugerties South
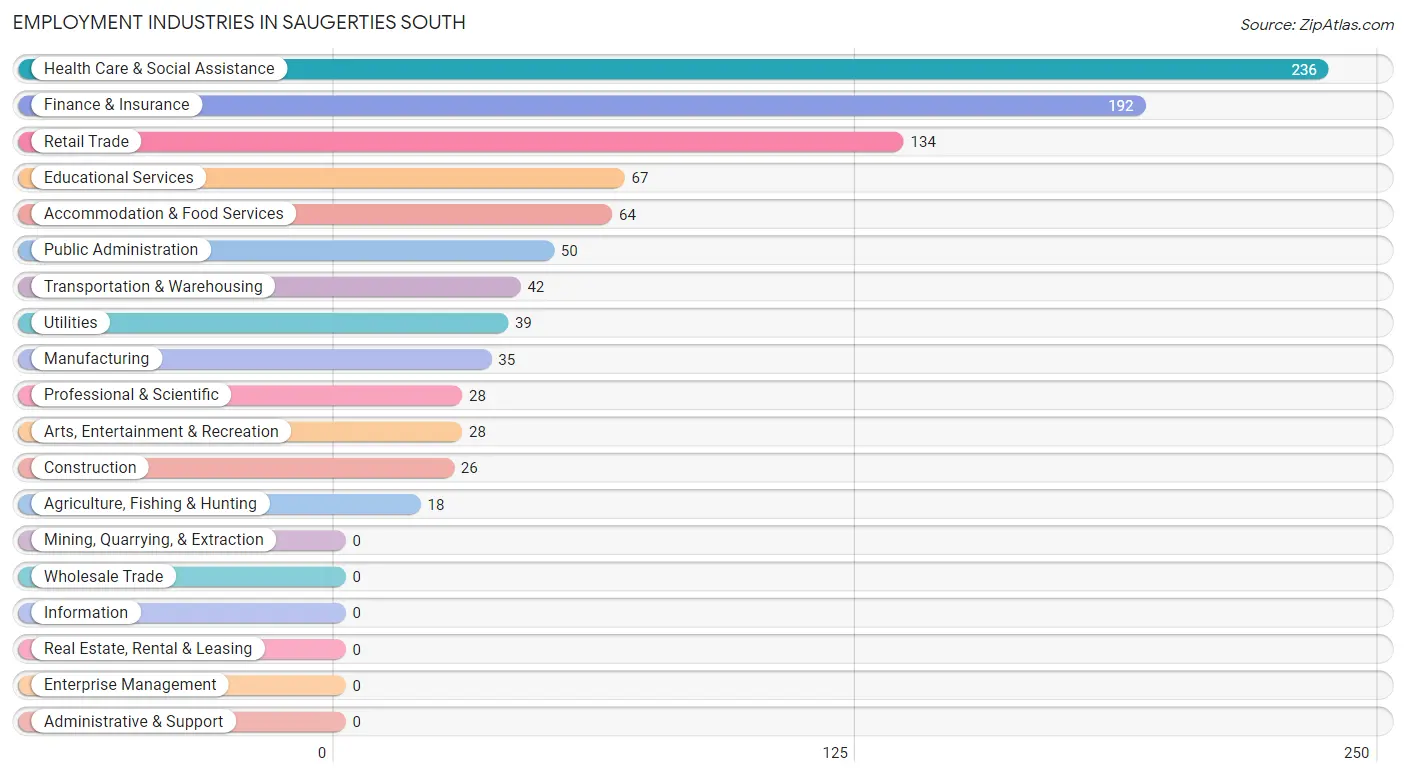
Employment Industries in Saugerties South
The major employment industries in Saugerties South include Health Care & Social Assistance (236 | 21.2%), Finance & Insurance (192 | 17.2%), Retail Trade (134 | 12.0%), Educational Services (67 | 6.0%), and Accommodation & Food Services (64 | 5.8%).
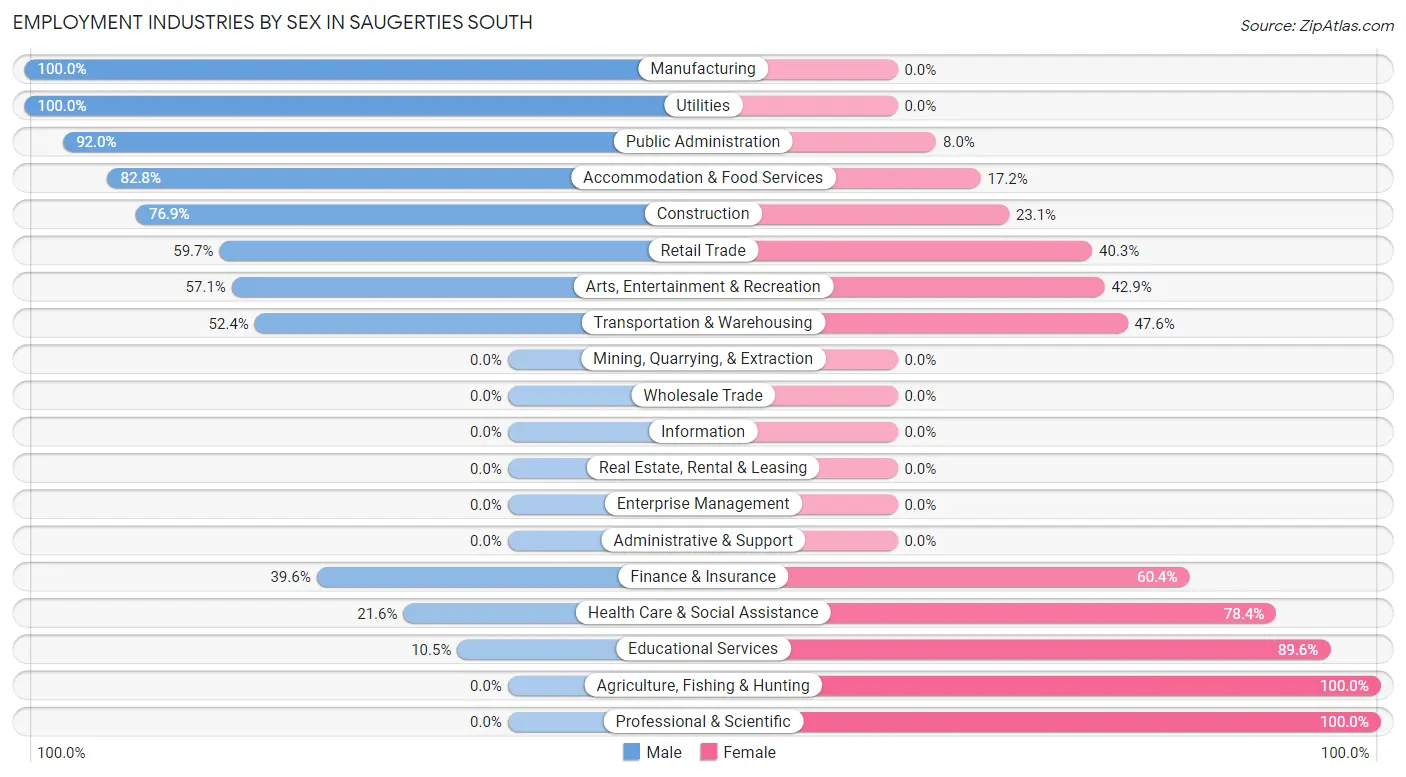
Employment Industries by Sex in Saugerties South
The Saugerties South industries that see more men than women are Manufacturing (100.0%), Utilities (100.0%), and Public Administration (92.0%), whereas the industries that tend to have a higher number of women are Agriculture, Fishing & Hunting (100.0%), Professional & Scientific (100.0%), and Educational Services (89.5%).
| Industry | Male | Female |
| Agriculture, Fishing & Hunting | 0 (0.0%) | 18 (100.0%) |
| Mining, Quarrying, & Extraction | 0 (0.0%) | 0 (0.0%) |
| Construction | 20 (76.9%) | 6 (23.1%) |
| Manufacturing | 35 (100.0%) | 0 (0.0%) |
| Wholesale Trade | 0 (0.0%) | 0 (0.0%) |
| Retail Trade | 80 (59.7%) | 54 (40.3%) |
| Transportation & Warehousing | 22 (52.4%) | 20 (47.6%) |
| Utilities | 39 (100.0%) | 0 (0.0%) |
| Information | 0 (0.0%) | 0 (0.0%) |
| Finance & Insurance | 76 (39.6%) | 116 (60.4%) |
| Real Estate, Rental & Leasing | 0 (0.0%) | 0 (0.0%) |
| Professional & Scientific | 0 (0.0%) | 28 (100.0%) |
| Enterprise Management | 0 (0.0%) | 0 (0.0%) |
| Administrative & Support | 0 (0.0%) | 0 (0.0%) |
| Educational Services | 7 (10.4%) | 60 (89.5%) |
| Health Care & Social Assistance | 51 (21.6%) | 185 (78.4%) |
| Arts, Entertainment & Recreation | 16 (57.1%) | 12 (42.9%) |
| Accommodation & Food Services | 53 (82.8%) | 11 (17.2%) |
| Public Administration | 46 (92.0%) | 4 (8.0%) |
| Total | 511 (45.9%) | 603 (54.1%) |
Education in Saugerties South
School Enrollment in Saugerties South
The most common levels of schooling among the 447 students in Saugerties South are high school (122 | 27.3%), elementary school (107 | 23.9%), and college / undergraduate (106 | 23.7%).
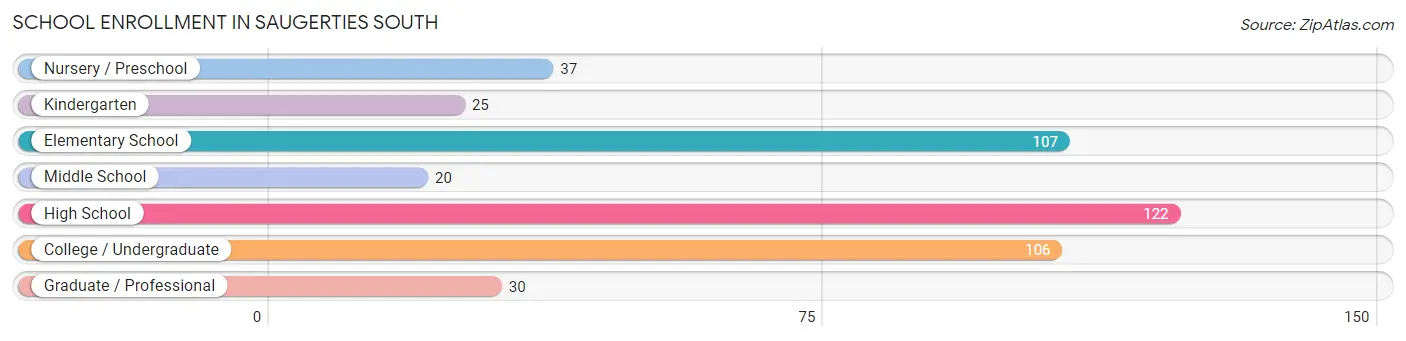
| School Level | # Students | % Students |
| Nursery / Preschool | 37 | 8.3% |
| Kindergarten | 25 | 5.6% |
| Elementary School | 107 | 23.9% |
| Middle School | 20 | 4.5% |
| High School | 122 | 27.3% |
| College / Undergraduate | 106 | 23.7% |
| Graduate / Professional | 30 | 6.7% |
| Total | 447 | 100.0% |
School Enrollment by Age by Funding Source in Saugerties South
Out of a total of 447 students who are enrolled in schools in Saugerties South, 16 (3.6%) attend a private institution, while the remaining 431 (96.4%) are enrolled in public schools. The age group of 18 to 19 year olds has the highest likelihood of being enrolled in private schools, with 16 (100.0% in the age bracket) enrolled. Conversely, the age group of 3 to 4 year olds has the lowest likelihood of being enrolled in a private school, with 37 (100.0% in the age bracket) attending a public institution.
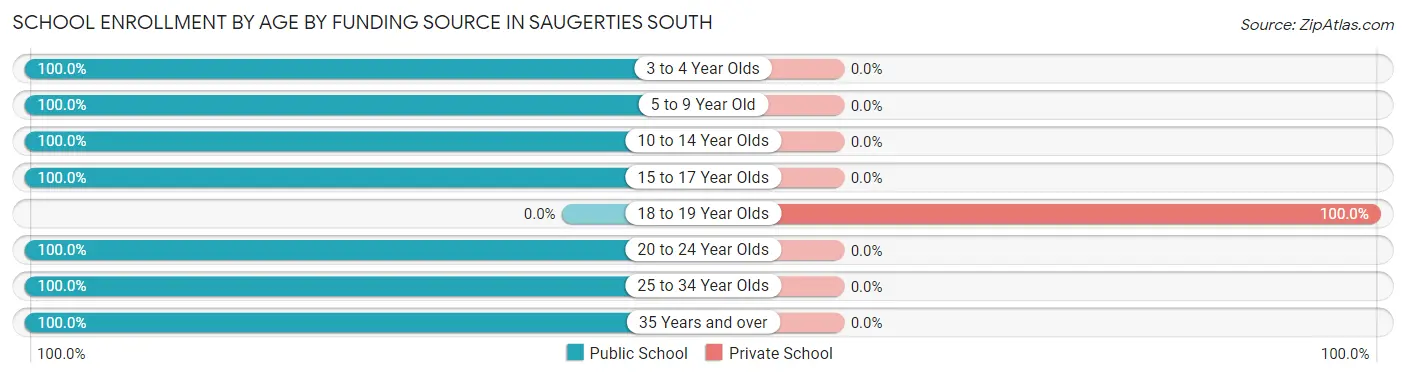
| Age Bracket | Public School | Private School |
| 3 to 4 Year Olds | 37 (100.0%) | 0 (0.0%) |
| 5 to 9 Year Old | 132 (100.0%) | 0 (0.0%) |
| 10 to 14 Year Olds | 60 (100.0%) | 0 (0.0%) |
| 15 to 17 Year Olds | 76 (100.0%) | 0 (0.0%) |
| 18 to 19 Year Olds | 0 (0.0%) | 16 (100.0%) |
| 20 to 24 Year Olds | 7 (100.0%) | 0 (0.0%) |
| 25 to 34 Year Olds | 55 (100.0%) | 0 (0.0%) |
| 35 Years and over | 64 (100.0%) | 0 (0.0%) |
| Total | 431 (96.4%) | 16 (3.6%) |
Educational Attainment by Field of Study in Saugerties South
Education (199 | 39.5%), science & technology (77 | 15.3%), business (73 | 14.5%), bio, nature & agricultural (39 | 7.7%), and arts & humanities (21 | 4.2%) are the most common fields of study among 504 individuals in Saugerties South who have obtained a bachelor's degree or higher.
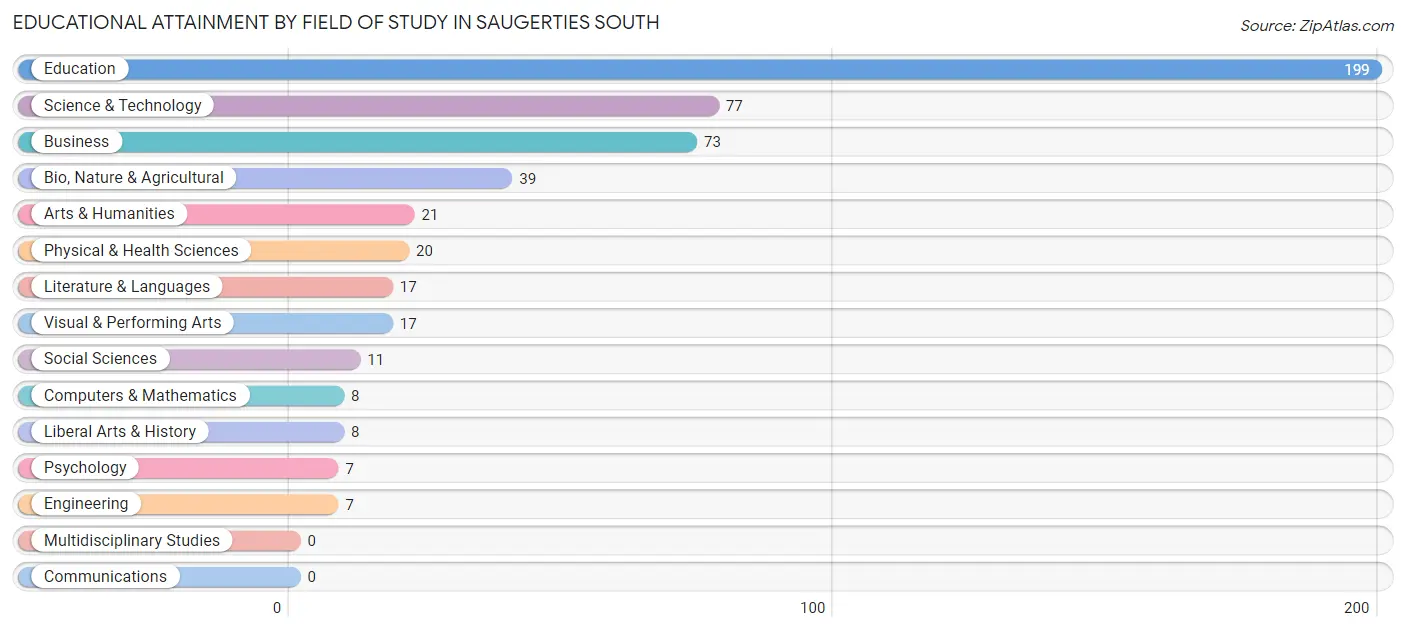
| Field of Study | # Graduates | % Graduates |
| Computers & Mathematics | 8 | 1.6% |
| Bio, Nature & Agricultural | 39 | 7.7% |
| Physical & Health Sciences | 20 | 4.0% |
| Psychology | 7 | 1.4% |
| Social Sciences | 11 | 2.2% |
| Engineering | 7 | 1.4% |
| Multidisciplinary Studies | 0 | 0.0% |
| Science & Technology | 77 | 15.3% |
| Business | 73 | 14.5% |
| Education | 199 | 39.5% |
| Literature & Languages | 17 | 3.4% |
| Liberal Arts & History | 8 | 1.6% |
| Visual & Performing Arts | 17 | 3.4% |
| Communications | 0 | 0.0% |
| Arts & Humanities | 21 | 4.2% |
| Total | 504 | 100.0% |
Transportation & Commute in Saugerties South
Vehicle Availability by Sex in Saugerties South
The most prevalent vehicle ownership categories in Saugerties South are males with 2 vehicles (229, accounting for 44.8%) and females with 2 vehicles (219, making up 38.0%).
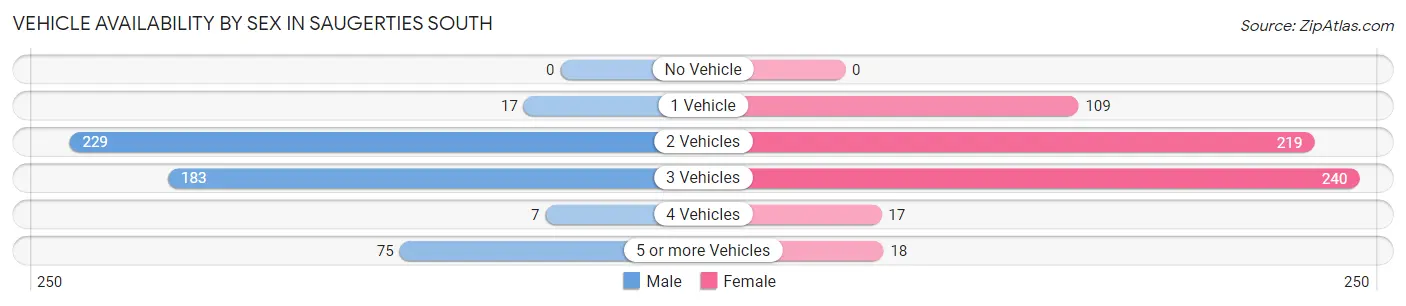
| Vehicles Available | Male | Female |
| No Vehicle | 0 (0.0%) | 0 (0.0%) |
| 1 Vehicle | 17 (3.3%) | 109 (18.1%) |
| 2 Vehicles | 229 (44.8%) | 219 (36.3%) |
| 3 Vehicles | 183 (35.8%) | 240 (39.8%) |
| 4 Vehicles | 7 (1.4%) | 17 (2.8%) |
| 5 or more Vehicles | 75 (14.7%) | 18 (3.0%) |
| Total | 511 (100.0%) | 603 (100.0%) |
Commute Time in Saugerties South
The most frequently occuring commute durations in Saugerties South are 15 to 19 minutes (155 commuters, 16.9%), 20 to 24 minutes (149 commuters, 16.3%), and 30 to 34 minutes (133 commuters, 14.5%).
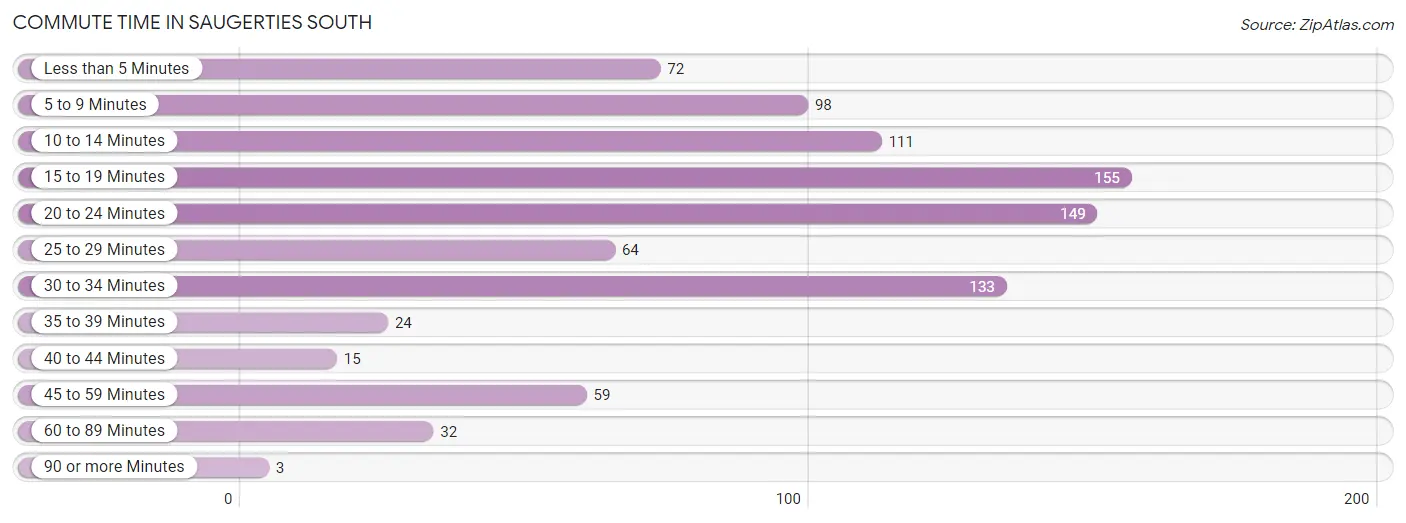
| Commute Time | # Commuters | % Commuters |
| Less than 5 Minutes | 72 | 7.9% |
| 5 to 9 Minutes | 98 | 10.7% |
| 10 to 14 Minutes | 111 | 12.1% |
| 15 to 19 Minutes | 155 | 16.9% |
| 20 to 24 Minutes | 149 | 16.3% |
| 25 to 29 Minutes | 64 | 7.0% |
| 30 to 34 Minutes | 133 | 14.5% |
| 35 to 39 Minutes | 24 | 2.6% |
| 40 to 44 Minutes | 15 | 1.6% |
| 45 to 59 Minutes | 59 | 6.5% |
| 60 to 89 Minutes | 32 | 3.5% |
| 90 or more Minutes | 3 | 0.3% |
Commute Time by Sex in Saugerties South
The most common commute times in Saugerties South are 20 to 24 minutes (110 commuters, 25.2%) for males and 15 to 19 minutes (105 commuters, 22.0%) for females.
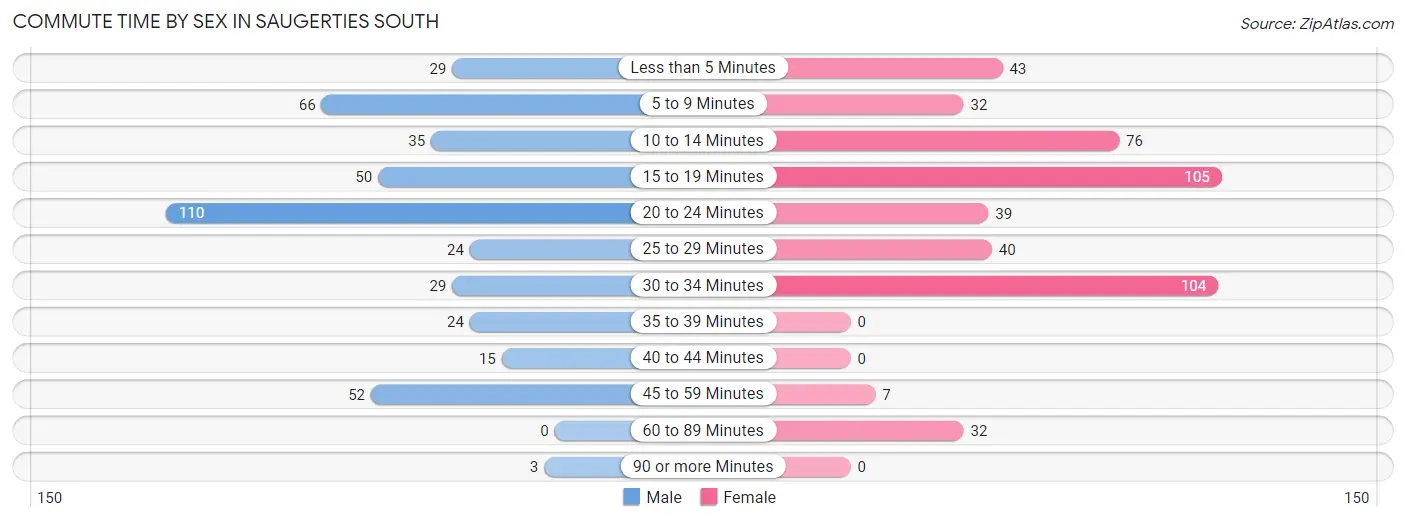
| Commute Time | Male | Female |
| Less than 5 Minutes | 29 (6.6%) | 43 (9.0%) |
| 5 to 9 Minutes | 66 (15.1%) | 32 (6.7%) |
| 10 to 14 Minutes | 35 (8.0%) | 76 (15.9%) |
| 15 to 19 Minutes | 50 (11.4%) | 105 (22.0%) |
| 20 to 24 Minutes | 110 (25.2%) | 39 (8.2%) |
| 25 to 29 Minutes | 24 (5.5%) | 40 (8.4%) |
| 30 to 34 Minutes | 29 (6.6%) | 104 (21.8%) |
| 35 to 39 Minutes | 24 (5.5%) | 0 (0.0%) |
| 40 to 44 Minutes | 15 (3.4%) | 0 (0.0%) |
| 45 to 59 Minutes | 52 (11.9%) | 7 (1.5%) |
| 60 to 89 Minutes | 0 (0.0%) | 32 (6.7%) |
| 90 or more Minutes | 3 (0.7%) | 0 (0.0%) |
Time of Departure to Work by Sex in Saugerties South
The most frequent times of departure to work in Saugerties South are 7:00 AM to 7:29 AM (100, 22.9%) for males and 7:00 AM to 7:29 AM (114, 23.8%) for females.
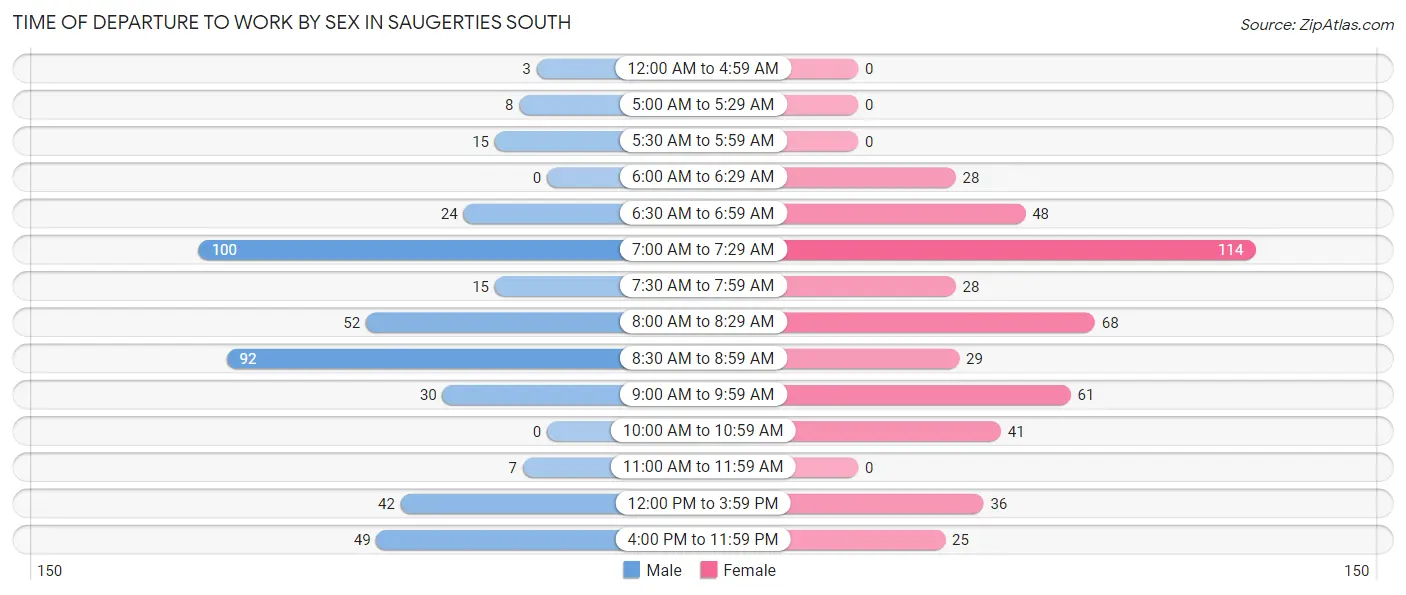
| Time of Departure | Male | Female |
| 12:00 AM to 4:59 AM | 3 (0.7%) | 0 (0.0%) |
| 5:00 AM to 5:29 AM | 8 (1.8%) | 0 (0.0%) |
| 5:30 AM to 5:59 AM | 15 (3.4%) | 0 (0.0%) |
| 6:00 AM to 6:29 AM | 0 (0.0%) | 28 (5.9%) |
| 6:30 AM to 6:59 AM | 24 (5.5%) | 48 (10.0%) |
| 7:00 AM to 7:29 AM | 100 (22.9%) | 114 (23.8%) |
| 7:30 AM to 7:59 AM | 15 (3.4%) | 28 (5.9%) |
| 8:00 AM to 8:29 AM | 52 (11.9%) | 68 (14.2%) |
| 8:30 AM to 8:59 AM | 92 (21.0%) | 29 (6.1%) |
| 9:00 AM to 9:59 AM | 30 (6.9%) | 61 (12.8%) |
| 10:00 AM to 10:59 AM | 0 (0.0%) | 41 (8.6%) |
| 11:00 AM to 11:59 AM | 7 (1.6%) | 0 (0.0%) |
| 12:00 PM to 3:59 PM | 42 (9.6%) | 36 (7.5%) |
| 4:00 PM to 11:59 PM | 49 (11.2%) | 25 (5.2%) |
| Total | 437 (100.0%) | 478 (100.0%) |
Housing Occupancy in Saugerties South
Occupancy by Ownership in Saugerties South
Of the total 933 dwellings in Saugerties South, owner-occupied units account for 603 (64.6%), while renter-occupied units make up 330 (35.4%).
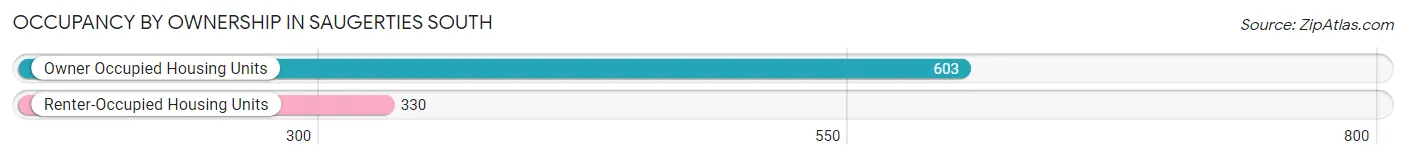
| Occupancy | # Housing Units | % Housing Units |
| Owner Occupied Housing Units | 603 | 64.6% |
| Renter-Occupied Housing Units | 330 | 35.4% |
| Total Occupied Housing Units | 933 | 100.0% |
Occupancy by Household Size in Saugerties South
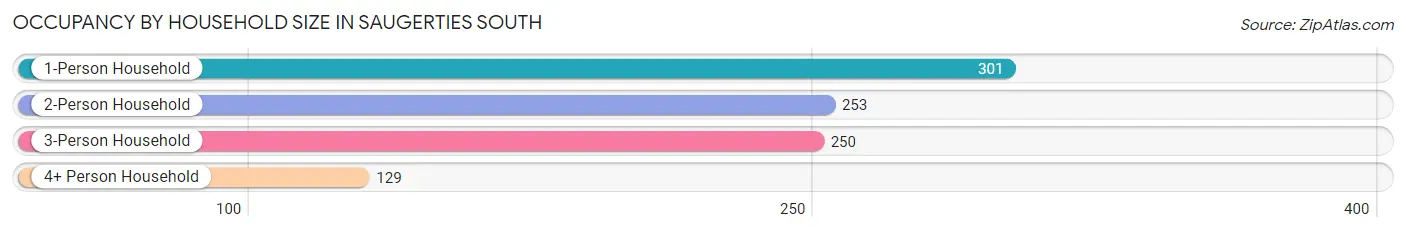
| Household Size | # Housing Units | % Housing Units |
| 1-Person Household | 301 | 32.3% |
| 2-Person Household | 253 | 27.1% |
| 3-Person Household | 250 | 26.8% |
| 4+ Person Household | 129 | 13.8% |
| Total Housing Units | 933 | 100.0% |
Occupancy by Ownership by Household Size in Saugerties South
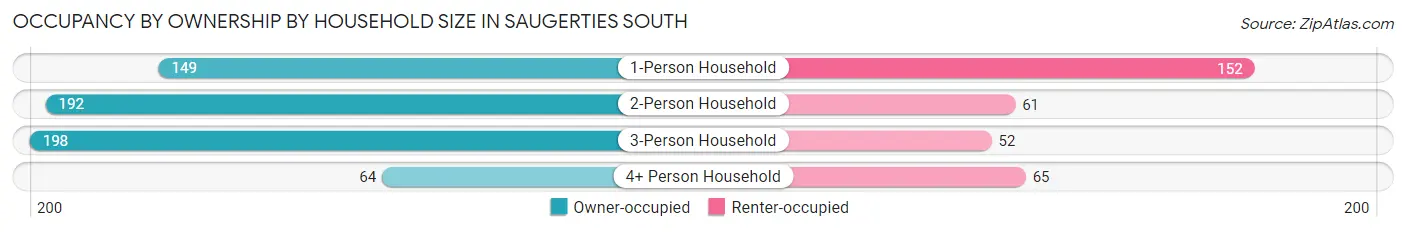
| Household Size | Owner-occupied | Renter-occupied |
| 1-Person Household | 149 (49.5%) | 152 (50.5%) |
| 2-Person Household | 192 (75.9%) | 61 (24.1%) |
| 3-Person Household | 198 (79.2%) | 52 (20.8%) |
| 4+ Person Household | 64 (49.6%) | 65 (50.4%) |
| Total Housing Units | 603 (64.6%) | 330 (35.4%) |
Occupancy by Educational Attainment in Saugerties South
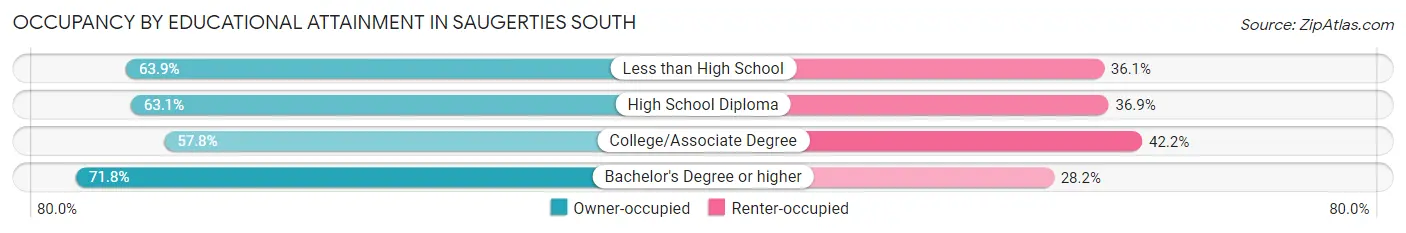
| Household Size | Owner-occupied | Renter-occupied |
| Less than High School | 23 (63.9%) | 13 (36.1%) |
| High School Diploma | 149 (63.1%) | 87 (36.9%) |
| College/Associate Degree | 181 (57.8%) | 132 (42.2%) |
| Bachelor's Degree or higher | 250 (71.8%) | 98 (28.2%) |
Occupancy by Age of Householder in Saugerties South
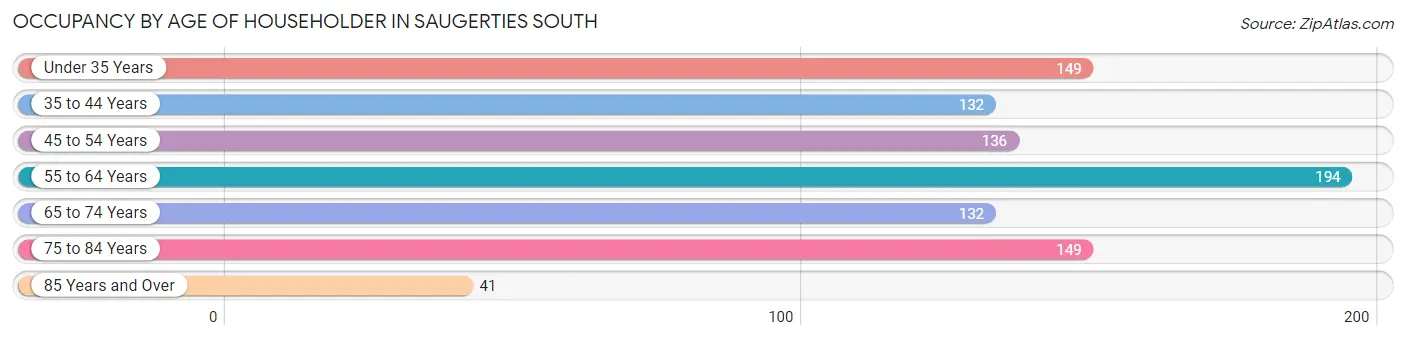
| Age Bracket | # Households | % Households |
| Under 35 Years | 149 | 16.0% |
| 35 to 44 Years | 132 | 14.1% |
| 45 to 54 Years | 136 | 14.6% |
| 55 to 64 Years | 194 | 20.8% |
| 65 to 74 Years | 132 | 14.1% |
| 75 to 84 Years | 149 | 16.0% |
| 85 Years and Over | 41 | 4.4% |
| Total | 933 | 100.0% |
Housing Finances in Saugerties South
Median Income by Occupancy in Saugerties South
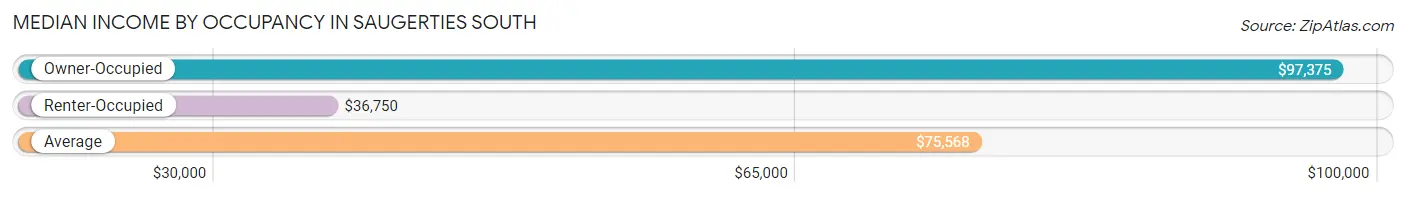
| Occupancy Type | # Households | Median Income |
| Owner-Occupied | 603 (64.6%) | $97,375 |
| Renter-Occupied | 330 (35.4%) | $36,750 |
| Average | 933 (100.0%) | $75,568 |
Occupancy by Householder Income Bracket in Saugerties South
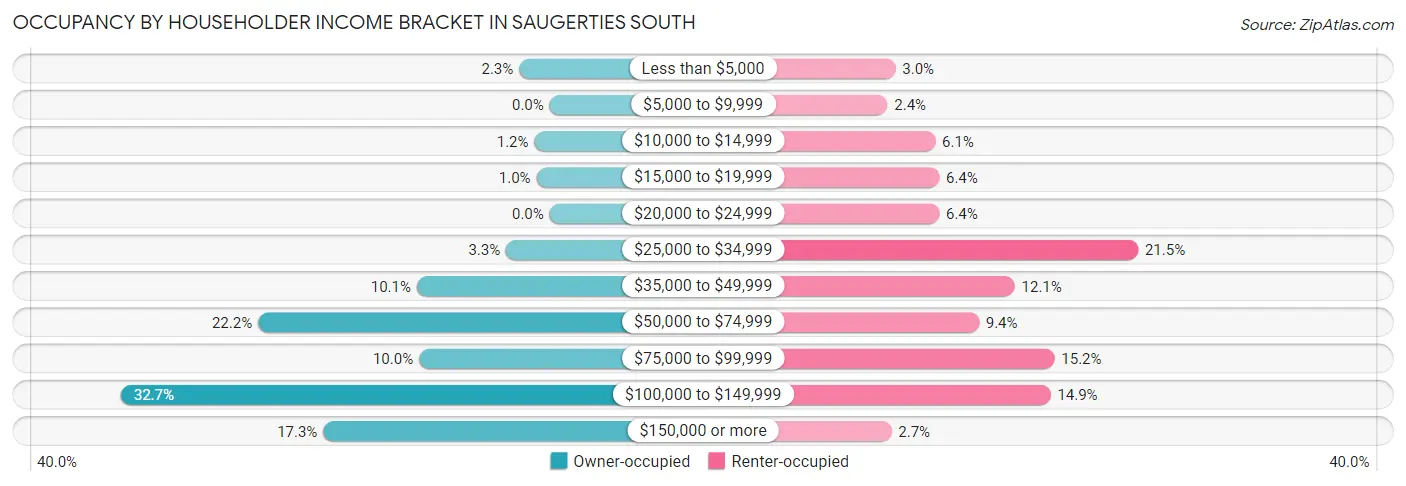
| Income Bracket | Owner-occupied | Renter-occupied |
| Less than $5,000 | 14 (2.3%) | 10 (3.0%) |
| $5,000 to $9,999 | 0 (0.0%) | 8 (2.4%) |
| $10,000 to $14,999 | 7 (1.2%) | 20 (6.1%) |
| $15,000 to $19,999 | 6 (1.0%) | 21 (6.4%) |
| $20,000 to $24,999 | 0 (0.0%) | 21 (6.4%) |
| $25,000 to $34,999 | 20 (3.3%) | 71 (21.5%) |
| $35,000 to $49,999 | 61 (10.1%) | 40 (12.1%) |
| $50,000 to $74,999 | 134 (22.2%) | 31 (9.4%) |
| $75,000 to $99,999 | 60 (10.0%) | 50 (15.1%) |
| $100,000 to $149,999 | 197 (32.7%) | 49 (14.8%) |
| $150,000 or more | 104 (17.2%) | 9 (2.7%) |
| Total | 603 (100.0%) | 330 (100.0%) |
Monthly Housing Cost Tiers in Saugerties South
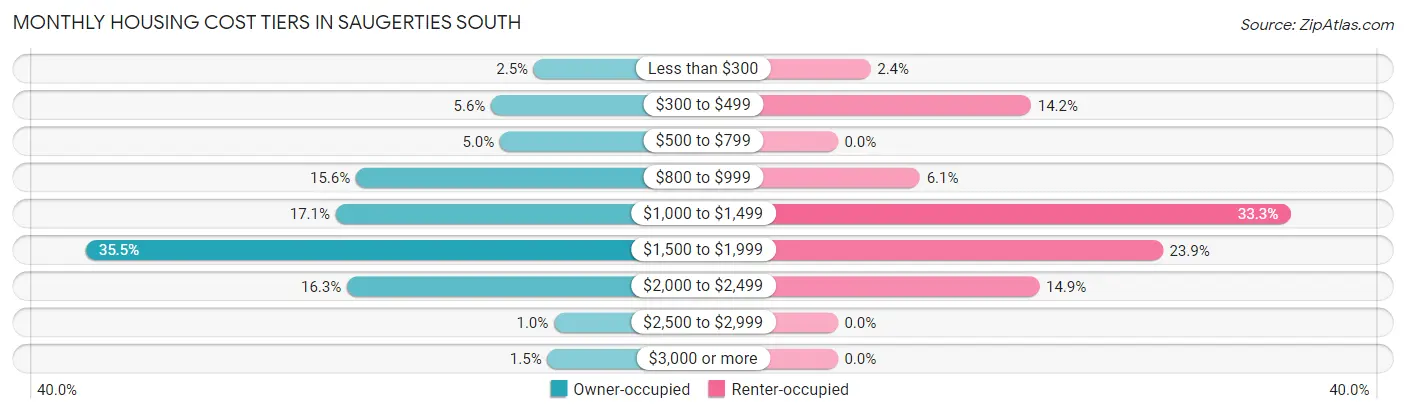
| Monthly Cost | Owner-occupied | Renter-occupied |
| Less than $300 | 15 (2.5%) | 8 (2.4%) |
| $300 to $499 | 34 (5.6%) | 47 (14.2%) |
| $500 to $799 | 30 (5.0%) | 0 (0.0%) |
| $800 to $999 | 94 (15.6%) | 20 (6.1%) |
| $1,000 to $1,499 | 103 (17.1%) | 110 (33.3%) |
| $1,500 to $1,999 | 214 (35.5%) | 79 (23.9%) |
| $2,000 to $2,499 | 98 (16.3%) | 49 (14.8%) |
| $2,500 to $2,999 | 6 (1.0%) | 0 (0.0%) |
| $3,000 or more | 9 (1.5%) | 0 (0.0%) |
| Total | 603 (100.0%) | 330 (100.0%) |
Physical Housing Characteristics in Saugerties South
Housing Structures in Saugerties South
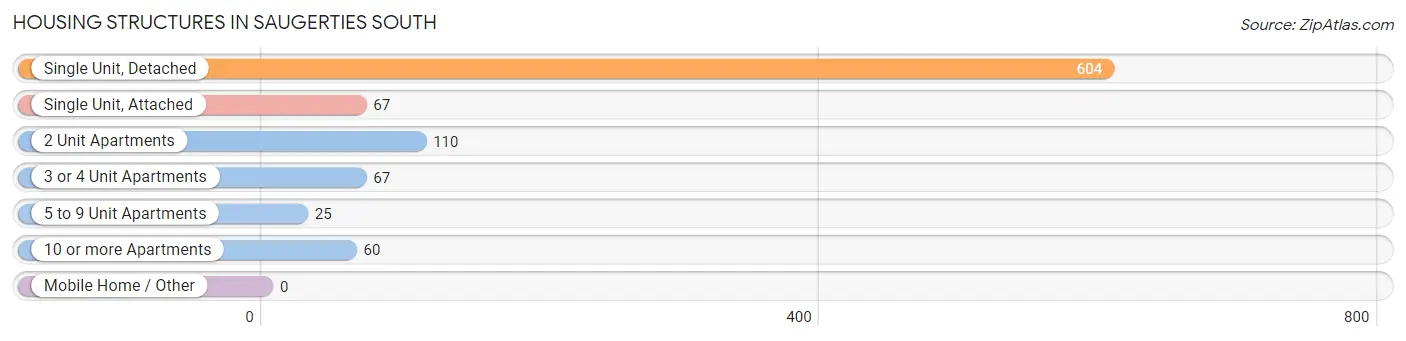
| Structure Type | # Housing Units | % Housing Units |
| Single Unit, Detached | 604 | 64.7% |
| Single Unit, Attached | 67 | 7.2% |
| 2 Unit Apartments | 110 | 11.8% |
| 3 or 4 Unit Apartments | 67 | 7.2% |
| 5 to 9 Unit Apartments | 25 | 2.7% |
| 10 or more Apartments | 60 | 6.4% |
| Mobile Home / Other | 0 | 0.0% |
| Total | 933 | 100.0% |
Housing Structures by Occupancy in Saugerties South
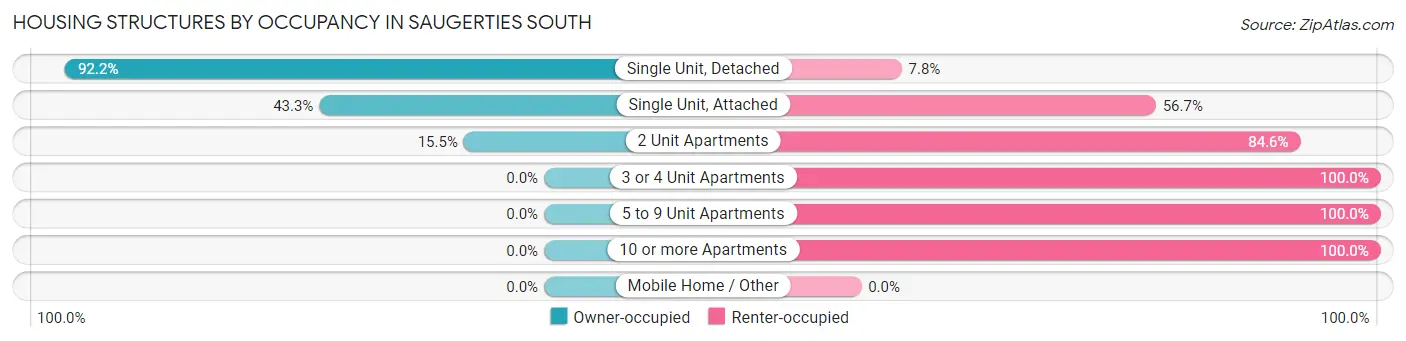
| Structure Type | Owner-occupied | Renter-occupied |
| Single Unit, Detached | 557 (92.2%) | 47 (7.8%) |
| Single Unit, Attached | 29 (43.3%) | 38 (56.7%) |
| 2 Unit Apartments | 17 (15.4%) | 93 (84.6%) |
| 3 or 4 Unit Apartments | 0 (0.0%) | 67 (100.0%) |
| 5 to 9 Unit Apartments | 0 (0.0%) | 25 (100.0%) |
| 10 or more Apartments | 0 (0.0%) | 60 (100.0%) |
| Mobile Home / Other | 0 (0.0%) | 0 (0.0%) |
| Total | 603 (64.6%) | 330 (35.4%) |
Housing Structures by Number of Rooms in Saugerties South
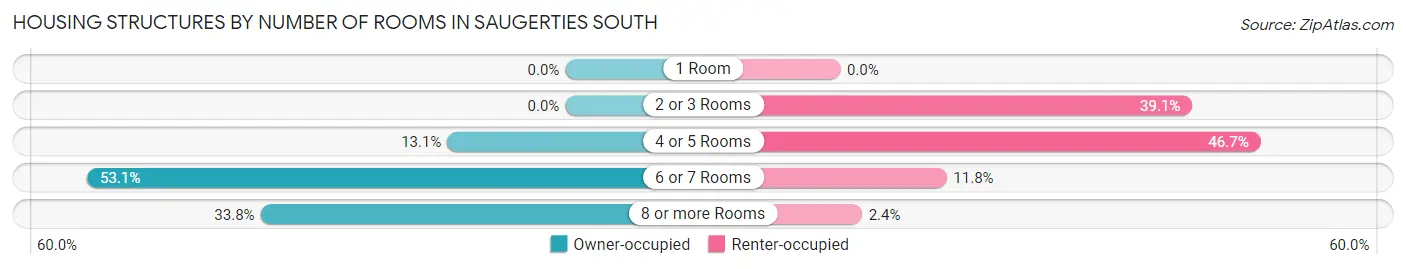
| Number of Rooms | Owner-occupied | Renter-occupied |
| 1 Room | 0 (0.0%) | 0 (0.0%) |
| 2 or 3 Rooms | 0 (0.0%) | 129 (39.1%) |
| 4 or 5 Rooms | 79 (13.1%) | 154 (46.7%) |
| 6 or 7 Rooms | 320 (53.1%) | 39 (11.8%) |
| 8 or more Rooms | 204 (33.8%) | 8 (2.4%) |
| Total | 603 (100.0%) | 330 (100.0%) |
Housing Structure by Heating Type in Saugerties South
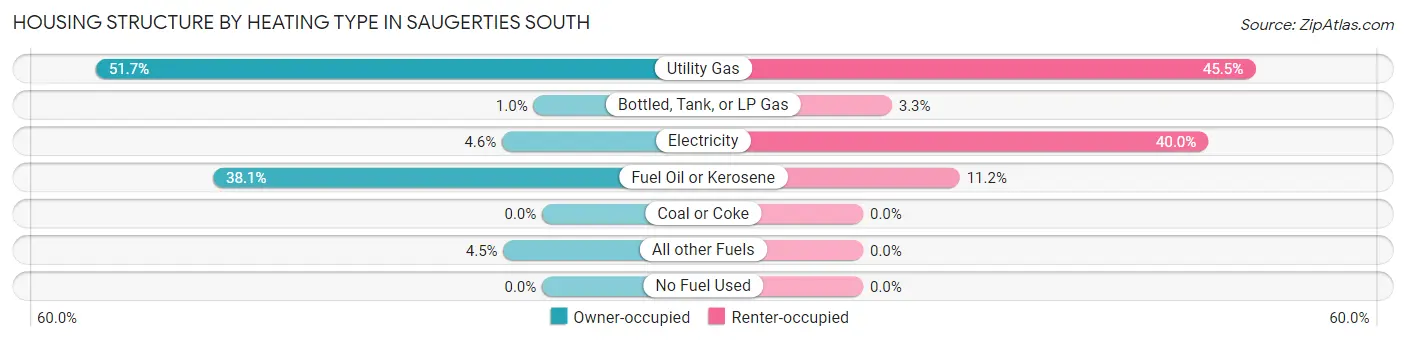
| Heating Type | Owner-occupied | Renter-occupied |
| Utility Gas | 312 (51.7%) | 150 (45.5%) |
| Bottled, Tank, or LP Gas | 6 (1.0%) | 11 (3.3%) |
| Electricity | 28 (4.6%) | 132 (40.0%) |
| Fuel Oil or Kerosene | 230 (38.1%) | 37 (11.2%) |
| Coal or Coke | 0 (0.0%) | 0 (0.0%) |
| All other Fuels | 27 (4.5%) | 0 (0.0%) |
| No Fuel Used | 0 (0.0%) | 0 (0.0%) |
| Total | 603 (100.0%) | 330 (100.0%) |
Household Vehicle Usage in Saugerties South
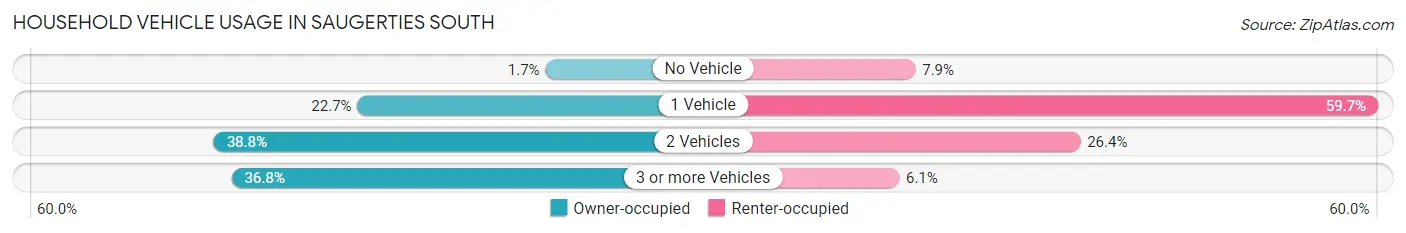
| Vehicles per Household | Owner-occupied | Renter-occupied |
| No Vehicle | 10 (1.7%) | 26 (7.9%) |
| 1 Vehicle | 137 (22.7%) | 197 (59.7%) |
| 2 Vehicles | 234 (38.8%) | 87 (26.4%) |
| 3 or more Vehicles | 222 (36.8%) | 20 (6.1%) |
| Total | 603 (100.0%) | 330 (100.0%) |
Real Estate & Mortgages in Saugerties South
Real Estate and Mortgage Overview in Saugerties South
| Characteristic | Without Mortgage | With Mortgage |
| Housing Units | 214 | 389 |
| Median Property Value | $266,700 | $240,000 |
| Median Household Income | $60,227 | $104 |
| Monthly Housing Costs | $917 | $9 |
| Real Estate Taxes | $5,614 | $0 |
Property Value by Mortgage Status in Saugerties South
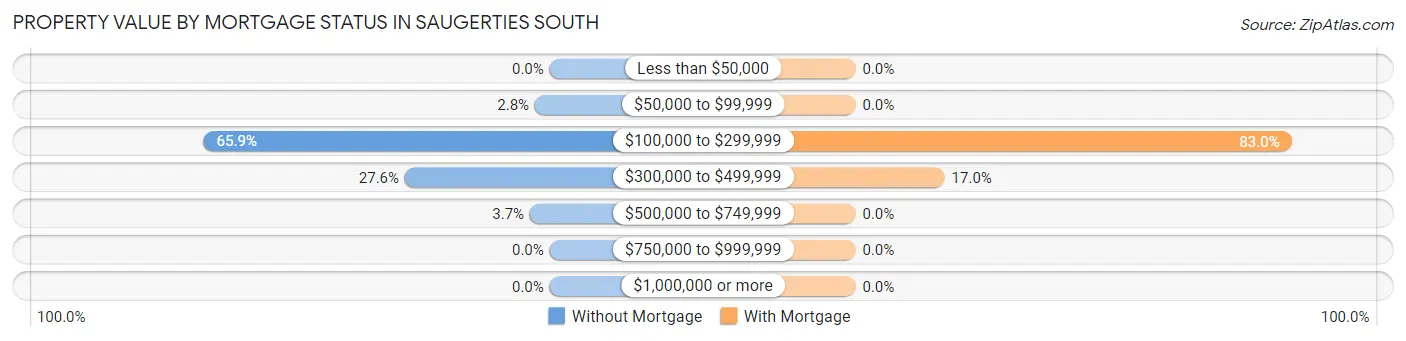
| Property Value | Without Mortgage | With Mortgage |
| Less than $50,000 | 0 (0.0%) | 0 (0.0%) |
| $50,000 to $99,999 | 6 (2.8%) | 0 (0.0%) |
| $100,000 to $299,999 | 141 (65.9%) | 323 (83.0%) |
| $300,000 to $499,999 | 59 (27.6%) | 66 (17.0%) |
| $500,000 to $749,999 | 8 (3.7%) | 0 (0.0%) |
| $750,000 to $999,999 | 0 (0.0%) | 0 (0.0%) |
| $1,000,000 or more | 0 (0.0%) | 0 (0.0%) |
| Total | 214 (100.0%) | 389 (100.0%) |
Household Income by Mortgage Status in Saugerties South
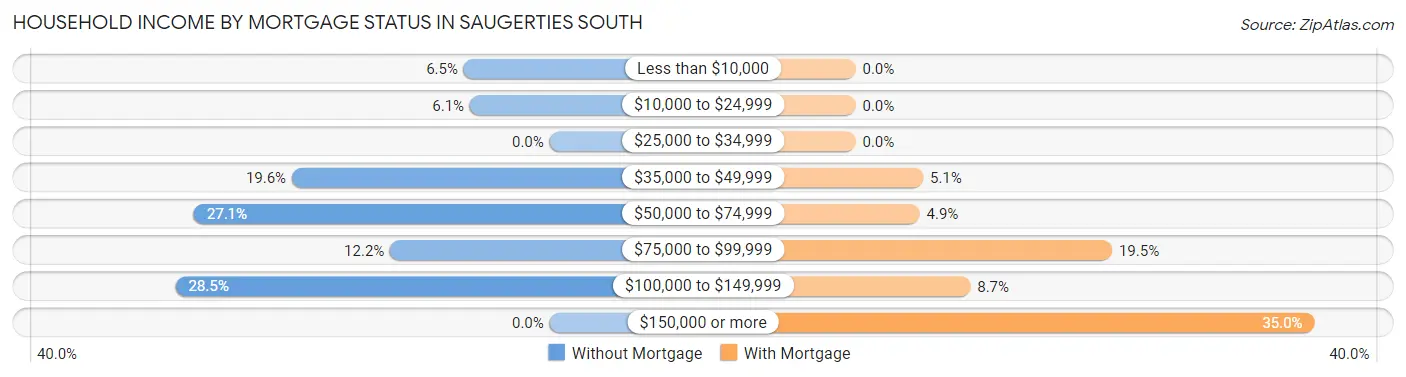
| Household Income | Without Mortgage | With Mortgage |
| Less than $10,000 | 14 (6.5%) | 0 (0.0%) |
| $10,000 to $24,999 | 13 (6.1%) | 0 (0.0%) |
| $25,000 to $34,999 | 0 (0.0%) | 0 (0.0%) |
| $35,000 to $49,999 | 42 (19.6%) | 20 (5.1%) |
| $50,000 to $74,999 | 58 (27.1%) | 19 (4.9%) |
| $75,000 to $99,999 | 26 (12.1%) | 76 (19.5%) |
| $100,000 to $149,999 | 61 (28.5%) | 34 (8.7%) |
| $150,000 or more | 0 (0.0%) | 136 (35.0%) |
| Total | 214 (100.0%) | 389 (100.0%) |
Property Value to Household Income Ratio in Saugerties South

| Value-to-Income Ratio | Without Mortgage | With Mortgage |
| Less than 2.0x | 22 (10.3%) | 133,125 (34,222.4%) |
| 2.0x to 2.9x | 35 (16.4%) | 137 (35.2%) |
| 3.0x to 3.9x | 44 (20.6%) | 129 (33.2%) |
| 4.0x or more | 113 (52.8%) | 24 (6.2%) |
| Total | 214 (100.0%) | 389 (100.0%) |
Real Estate Taxes by Mortgage Status in Saugerties South
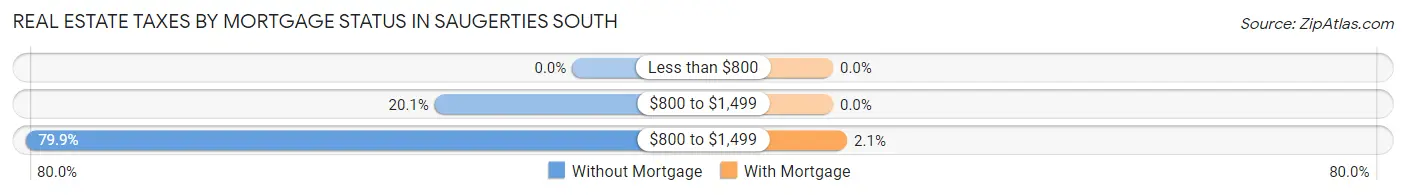
| Property Taxes | Without Mortgage | With Mortgage |
| Less than $800 | 0 (0.0%) | 0 (0.0%) |
| $800 to $1,499 | 43 (20.1%) | 0 (0.0%) |
| $800 to $1,499 | 171 (79.9%) | 8 (2.1%) |
| Total | 214 (100.0%) | 389 (100.0%) |
Health & Disability in Saugerties South
Health Insurance Coverage by Age in Saugerties South
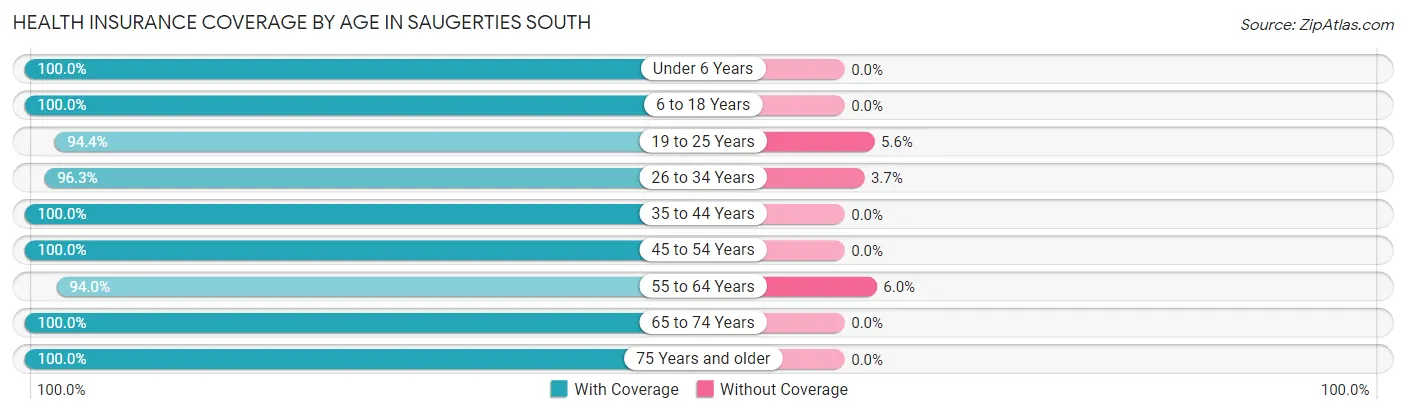
| Age Bracket | With Coverage | Without Coverage |
| Under 6 Years | 145 (100.0%) | 0 (0.0%) |
| 6 to 18 Years | 243 (100.0%) | 0 (0.0%) |
| 19 to 25 Years | 153 (94.4%) | 9 (5.6%) |
| 26 to 34 Years | 367 (96.3%) | 14 (3.7%) |
| 35 to 44 Years | 206 (100.0%) | 0 (0.0%) |
| 45 to 54 Years | 274 (100.0%) | 0 (0.0%) |
| 55 to 64 Years | 315 (94.0%) | 20 (6.0%) |
| 65 to 74 Years | 195 (100.0%) | 0 (0.0%) |
| 75 Years and older | 283 (100.0%) | 0 (0.0%) |
| Total | 2,181 (98.1%) | 43 (1.9%) |
Health Insurance Coverage by Citizenship Status in Saugerties South
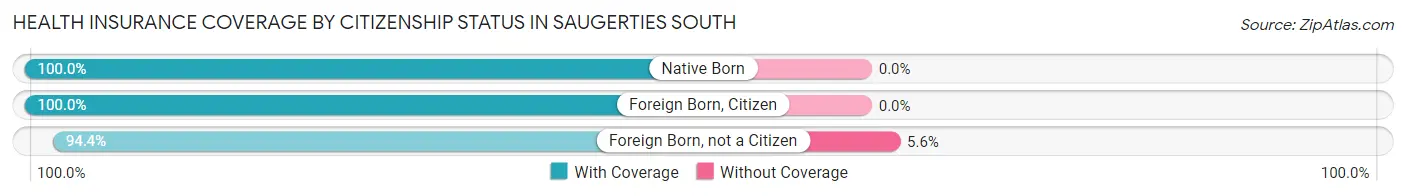
| Citizenship Status | With Coverage | Without Coverage |
| Native Born | 145 (100.0%) | 0 (0.0%) |
| Foreign Born, Citizen | 243 (100.0%) | 0 (0.0%) |
| Foreign Born, not a Citizen | 153 (94.4%) | 9 (5.6%) |
Health Insurance Coverage by Household Income in Saugerties South
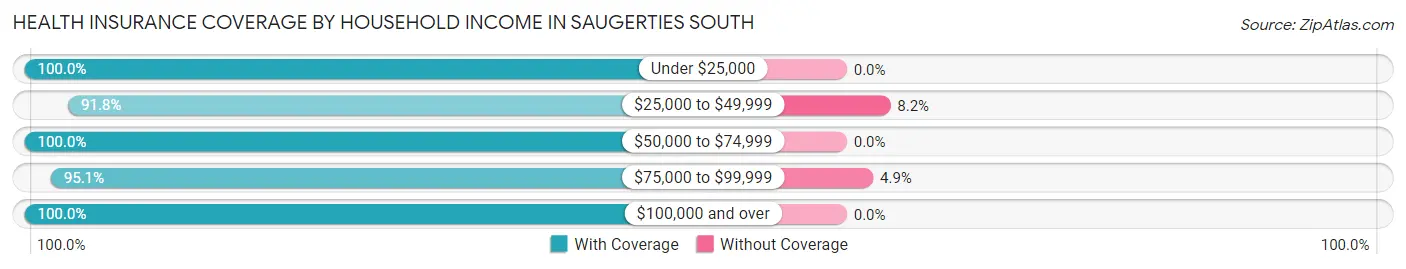
| Household Income | With Coverage | Without Coverage |
| Under $25,000 | 140 (100.0%) | 0 (0.0%) |
| $25,000 to $49,999 | 360 (91.8%) | 32 (8.2%) |
| $50,000 to $74,999 | 313 (100.0%) | 0 (0.0%) |
| $75,000 to $99,999 | 212 (95.1%) | 11 (4.9%) |
| $100,000 and over | 1,156 (100.0%) | 0 (0.0%) |
Public vs Private Health Insurance Coverage by Age in Saugerties South
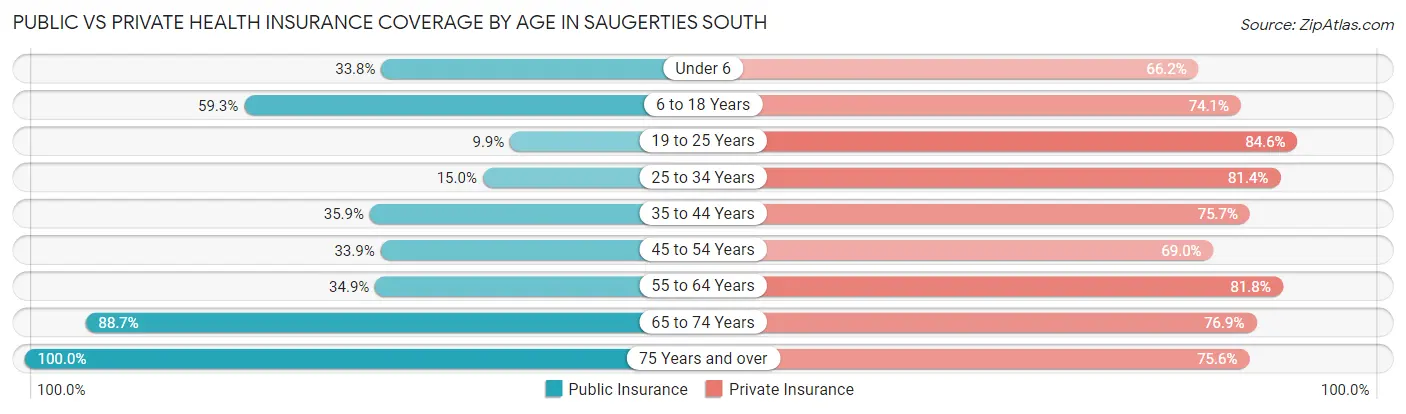
| Age Bracket | Public Insurance | Private Insurance |
| Under 6 | 49 (33.8%) | 96 (66.2%) |
| 6 to 18 Years | 144 (59.3%) | 180 (74.1%) |
| 19 to 25 Years | 16 (9.9%) | 137 (84.6%) |
| 25 to 34 Years | 57 (15.0%) | 310 (81.4%) |
| 35 to 44 Years | 74 (35.9%) | 156 (75.7%) |
| 45 to 54 Years | 93 (33.9%) | 189 (69.0%) |
| 55 to 64 Years | 117 (34.9%) | 274 (81.8%) |
| 65 to 74 Years | 173 (88.7%) | 150 (76.9%) |
| 75 Years and over | 283 (100.0%) | 214 (75.6%) |
| Total | 1,006 (45.2%) | 1,706 (76.7%) |
Disability Status by Sex by Age in Saugerties South
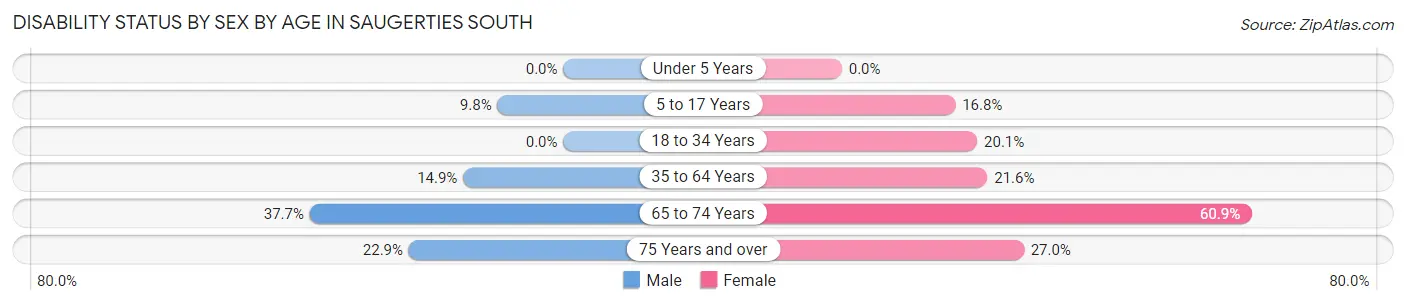
| Age Bracket | Male | Female |
| Under 5 Years | 0 (0.0%) | 0 (0.0%) |
| 5 to 17 Years | 18 (9.8%) | 16 (16.8%) |
| 18 to 34 Years | 0 (0.0%) | 45 (20.1%) |
| 35 to 64 Years | 51 (14.9%) | 102 (21.6%) |
| 65 to 74 Years | 32 (37.7%) | 67 (60.9%) |
| 75 Years and over | 25 (22.9%) | 47 (27.0%) |
Disability Class by Sex by Age in Saugerties South
Disability Class: Hearing Difficulty
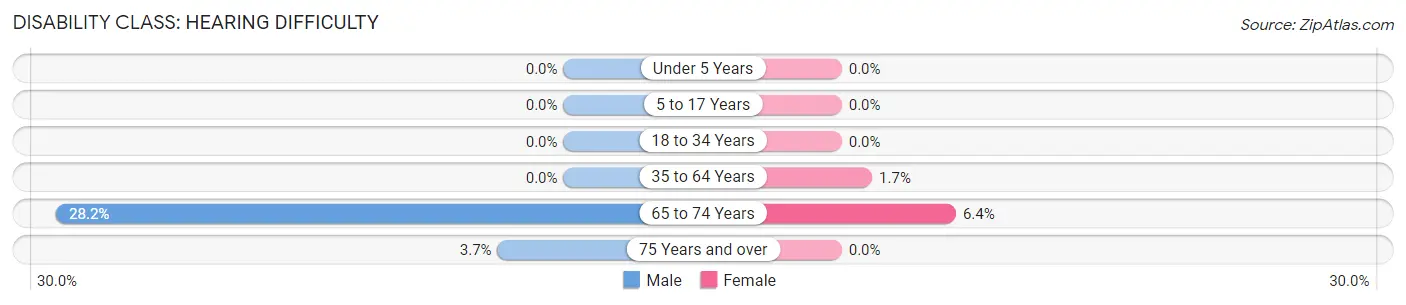
| Age Bracket | Male | Female |
| Under 5 Years | 0 (0.0%) | 0 (0.0%) |
| 5 to 17 Years | 0 (0.0%) | 0 (0.0%) |
| 18 to 34 Years | 0 (0.0%) | 0 (0.0%) |
| 35 to 64 Years | 0 (0.0%) | 8 (1.7%) |
| 65 to 74 Years | 24 (28.2%) | 7 (6.4%) |
| 75 Years and over | 4 (3.7%) | 0 (0.0%) |
Disability Class: Vision Difficulty
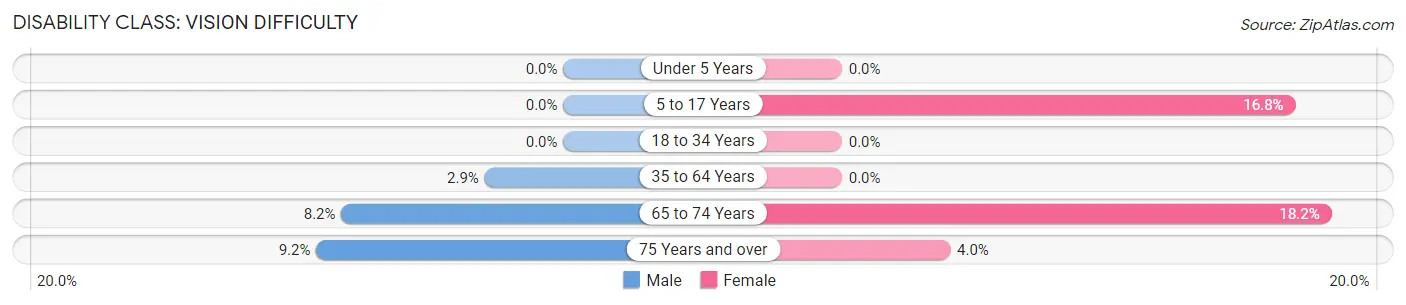
| Age Bracket | Male | Female |
| Under 5 Years | 0 (0.0%) | 0 (0.0%) |
| 5 to 17 Years | 0 (0.0%) | 16 (16.8%) |
| 18 to 34 Years | 0 (0.0%) | 0 (0.0%) |
| 35 to 64 Years | 10 (2.9%) | 0 (0.0%) |
| 65 to 74 Years | 7 (8.2%) | 20 (18.2%) |
| 75 Years and over | 10 (9.2%) | 7 (4.0%) |
Disability Class: Cognitive Difficulty
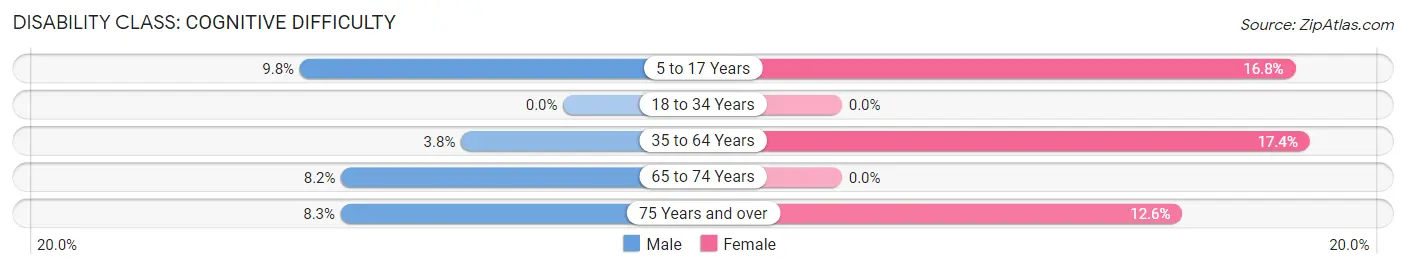
| Age Bracket | Male | Female |
| 5 to 17 Years | 18 (9.8%) | 16 (16.8%) |
| 18 to 34 Years | 0 (0.0%) | 0 (0.0%) |
| 35 to 64 Years | 13 (3.8%) | 82 (17.4%) |
| 65 to 74 Years | 7 (8.2%) | 0 (0.0%) |
| 75 Years and over | 9 (8.3%) | 22 (12.6%) |
Disability Class: Ambulatory Difficulty
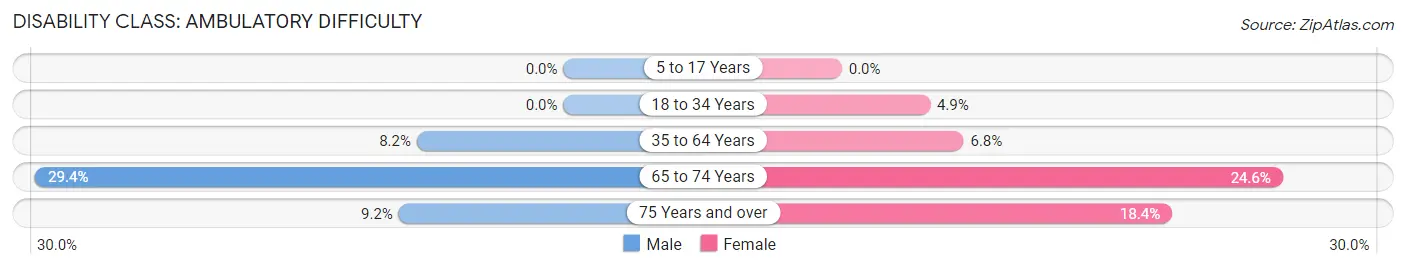
| Age Bracket | Male | Female |
| 5 to 17 Years | 0 (0.0%) | 0 (0.0%) |
| 18 to 34 Years | 0 (0.0%) | 11 (4.9%) |
| 35 to 64 Years | 28 (8.2%) | 32 (6.8%) |
| 65 to 74 Years | 25 (29.4%) | 27 (24.5%) |
| 75 Years and over | 10 (9.2%) | 32 (18.4%) |
Disability Class: Self-Care Difficulty
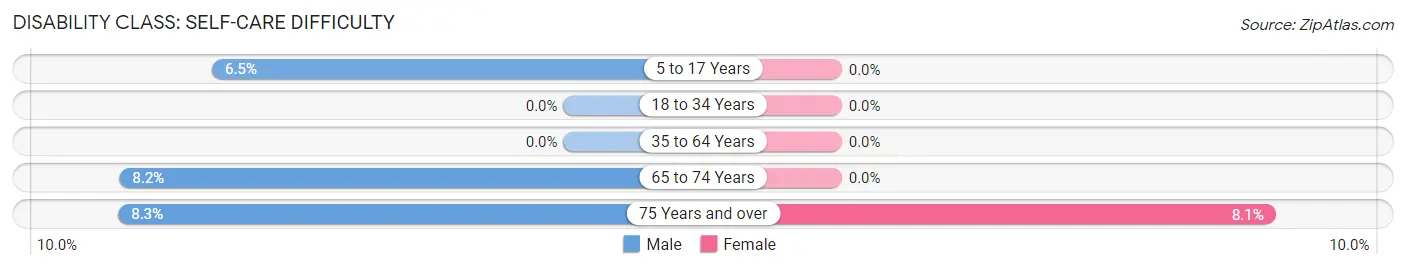
| Age Bracket | Male | Female |
| 5 to 17 Years | 12 (6.5%) | 0 (0.0%) |
| 18 to 34 Years | 0 (0.0%) | 0 (0.0%) |
| 35 to 64 Years | 0 (0.0%) | 0 (0.0%) |
| 65 to 74 Years | 7 (8.2%) | 0 (0.0%) |
| 75 Years and over | 9 (8.3%) | 14 (8.1%) |
Technology Access in Saugerties South
Computing Device Access in Saugerties South
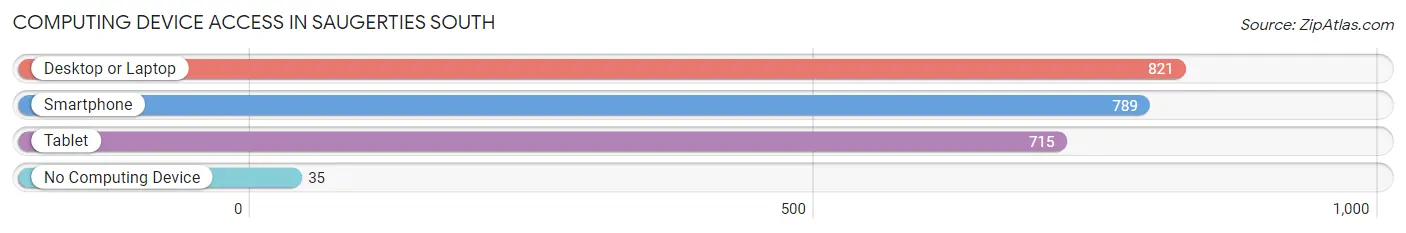
| Device Type | # Households | % Households |
| Desktop or Laptop | 821 | 88.0% |
| Smartphone | 789 | 84.6% |
| Tablet | 715 | 76.6% |
| No Computing Device | 35 | 3.7% |
| Total | 933 | 100.0% |
Internet Access in Saugerties South
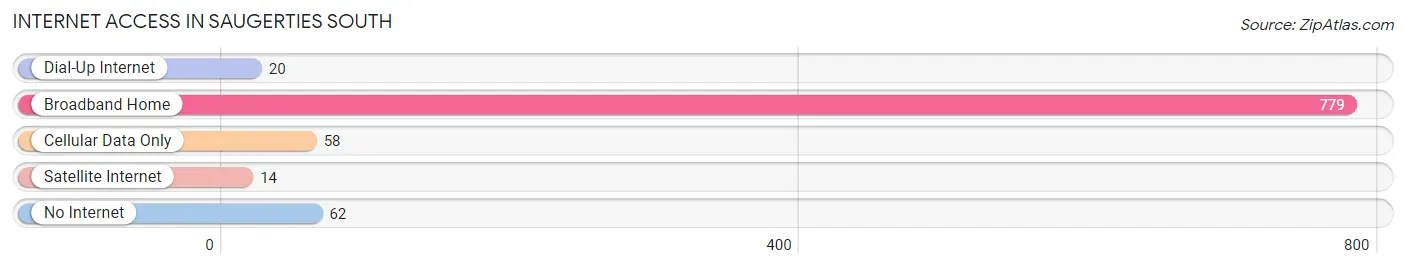
| Internet Type | # Households | % Households |
| Dial-Up Internet | 20 | 2.1% |
| Broadband Home | 779 | 83.5% |
| Cellular Data Only | 58 | 6.2% |
| Satellite Internet | 14 | 1.5% |
| No Internet | 62 | 6.7% |
| Total | 933 | 100.0% |
Saugerties South Summary
Saugerties South, NY is a small hamlet located in Ulster County, New York. It is situated on the west bank of the Hudson River, just south of the village of Saugerties. The hamlet is part of the Town of Saugerties and is bordered by the hamlets of Glasco and Malden-on-Hudson.
History
Saugerties South was first settled in the late 1700s by Dutch and German immigrants. The hamlet was originally known as “Saugerties Landing” and was a major port for the Hudson River steamboats. In the early 1800s, the hamlet was renamed “Saugerties South” and became a popular summer resort destination. The hamlet was home to several large hotels, including the Saugerties Hotel, which was built in 1845 and was one of the largest hotels in the area.
In the late 1800s, the hamlet began to decline as a resort destination and the hotels closed. The hamlet was then used as a summer camp for children and was home to several summer camps, including Camp Saugerties and Camp Saugerties South.
In the early 1900s, the hamlet began to experience a resurgence as a summer resort destination. The hamlet was home to several large resorts, including the Saugerties Beach Club, which was built in 1910 and was one of the largest resorts in the area.
The hamlet continued to be a popular summer resort destination until the 1950s, when the resorts began to close. The hamlet then began to decline and many of the buildings were abandoned. In the late 1970s, the hamlet began to experience a resurgence as a residential community.
Geography
Saugerties South is located in Ulster County, New York. It is situated on the west bank of the Hudson River, just south of the village of Saugerties. The hamlet is part of the Town of Saugerties and is bordered by the hamlets of Glasco and Malden-on-Hudson.
The hamlet is located in a rural area and is surrounded by forests and rolling hills. The hamlet is home to several small lakes, including Lake Saugerties and Lake Glasco.
Economy
The economy of Saugerties South is largely based on tourism. The hamlet is home to several small businesses, including restaurants, shops, and bed and breakfasts. The hamlet is also home to several small farms, which produce a variety of fruits and vegetables.
The hamlet is also home to several small manufacturing companies, which produce a variety of products, including furniture, clothing, and electronics.
Demographics
As of the 2010 census, the population of Saugerties South was 1,845. The population is largely white (94.3%) and the median household income is $50,000. The hamlet is home to a large number of retirees, with nearly one-third of the population over the age of 65.
Conclusion
Saugerties South is a small hamlet located in Ulster County, New York. It is situated on the west bank of the Hudson River, just south of the village of Saugerties. The hamlet is part of the Town of Saugerties and is bordered by the hamlets of Glasco and Malden-on-Hudson. The hamlet has a long history as a summer resort destination and is now home to several small businesses and farms. The population of Saugerties South is largely white and the median household income is $50,000. The hamlet is home to a large number of retirees, with nearly one-third of the population over the age of 65.
Common Questions
What is Per Capita Income in Saugerties South?
Per Capita income in Saugerties South is $40,813.
What is the Median Family Income in Saugerties South?
Median Family Income in Saugerties South is $112,500.
What is the Median Household income in Saugerties South?
Median Household Income in Saugerties South is $75,568.
What is Income or Wage Gap in Saugerties South?
Income or Wage Gap in Saugerties South is 0.1%.
Women in Saugerties South earn 99.9 cents for every dollar earned by a man.
What is Inequality or Gini Index in Saugerties South?
Inequality or Gini Index in Saugerties South is 0.42.
What is the Total Population of Saugerties South?
Total Population of Saugerties South is 2,224.
What is the Total Male Population of Saugerties South?
Total Male Population of Saugerties South is 1,068.
What is the Total Female Population of Saugerties South?
Total Female Population of Saugerties South is 1,156.
What is the Ratio of Males per 100 Females in Saugerties South?
There are 92.39 Males per 100 Females in Saugerties South.
What is the Ratio of Females per 100 Males in Saugerties South?
There are 108.24 Females per 100 Males in Saugerties South.
What is the Median Population Age in Saugerties South?
Median Population Age in Saugerties South is 44.1 Years.
What is the Average Family Size in Saugerties South
Average Family Size in Saugerties South is 3.0 People.
What is the Average Household Size in Saugerties South
Average Household Size in Saugerties South is 2.4 People.
How Large is the Labor Force in Saugerties South?
There are 1,200 People in the Labor Forcein in Saugerties South.
What is the Percentage of People in the Labor Force in Saugerties South?
63.2% of People are in the Labor Force in Saugerties South.
What is the Unemployment Rate in Saugerties South?
Unemployment Rate in Saugerties South is 7.2%.