Firthcliffe, NY Map & Demographics
Firthcliffe Map
Firthcliffe Overview
$45,289
PER CAPITA INCOME
$130,245
AVG FAMILY INCOME
$96,315
AVG HOUSEHOLD INCOME
35.6%
WAGE / INCOME GAP [ % ]
64.4¢/ $1
WAGE / INCOME GAP [ $ ]
0.37
INEQUALITY / GINI INDEX
5,264
TOTAL POPULATION
2,492
MALE POPULATION
2,772
FEMALE POPULATION
89.90
MALES / 100 FEMALES
111.24
FEMALES / 100 MALES
41.7
MEDIAN AGE
3.2
AVG FAMILY SIZE
2.5
AVG HOUSEHOLD SIZE
2,834
LABOR FORCE [ PEOPLE ]
66.5%
PERCENT IN LABOR FORCE
3.6%
UNEMPLOYMENT RATE
Income in Firthcliffe
Income Overview in Firthcliffe
Per Capita Income in Firthcliffe is $45,289, while median incomes of families and households are $130,245 and $96,315 respectively.
| Characteristic | Number | Measure |
| Per Capita Income | 5,264 | $45,289 |
| Median Family Income | 1,310 | $130,245 |
| Mean Family Income | 1,310 | $136,370 |
| Median Household Income | 2,075 | $96,315 |
| Mean Household Income | 2,075 | $113,003 |
| Income Deficit | 1,310 | $0 |
| Wage / Income Gap (%) | 5,264 | 35.62% |
| Wage / Income Gap ($) | 5,264 | 64.38¢ per $1 |
| Gini / Inequality Index | 5,264 | 0.37 |
Earnings by Sex in Firthcliffe
Average Earnings in Firthcliffe are $55,000, $66,410 for men and $42,757 for women, a difference of 35.6%.
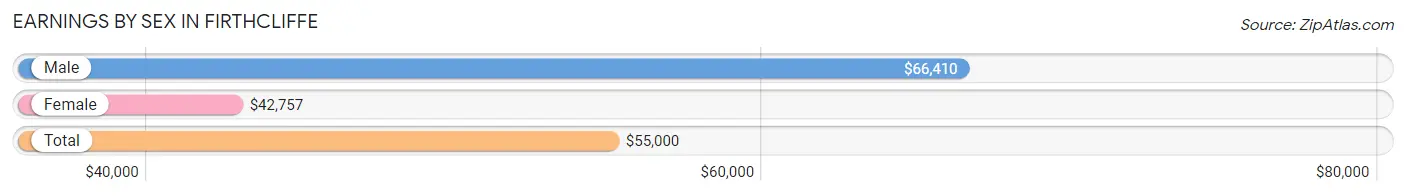
| Sex | Number | Average Earnings |
| Male | 1,573 (53.7%) | $66,410 |
| Female | 1,357 (46.3%) | $42,757 |
| Total | 2,930 (100.0%) | $55,000 |
Earnings by Sex by Income Bracket in Firthcliffe
The most common earnings brackets in Firthcliffe are $100,000+ for men (479 | 30.4%) and $75,000 to $99,999 for women (208 | 15.3%).
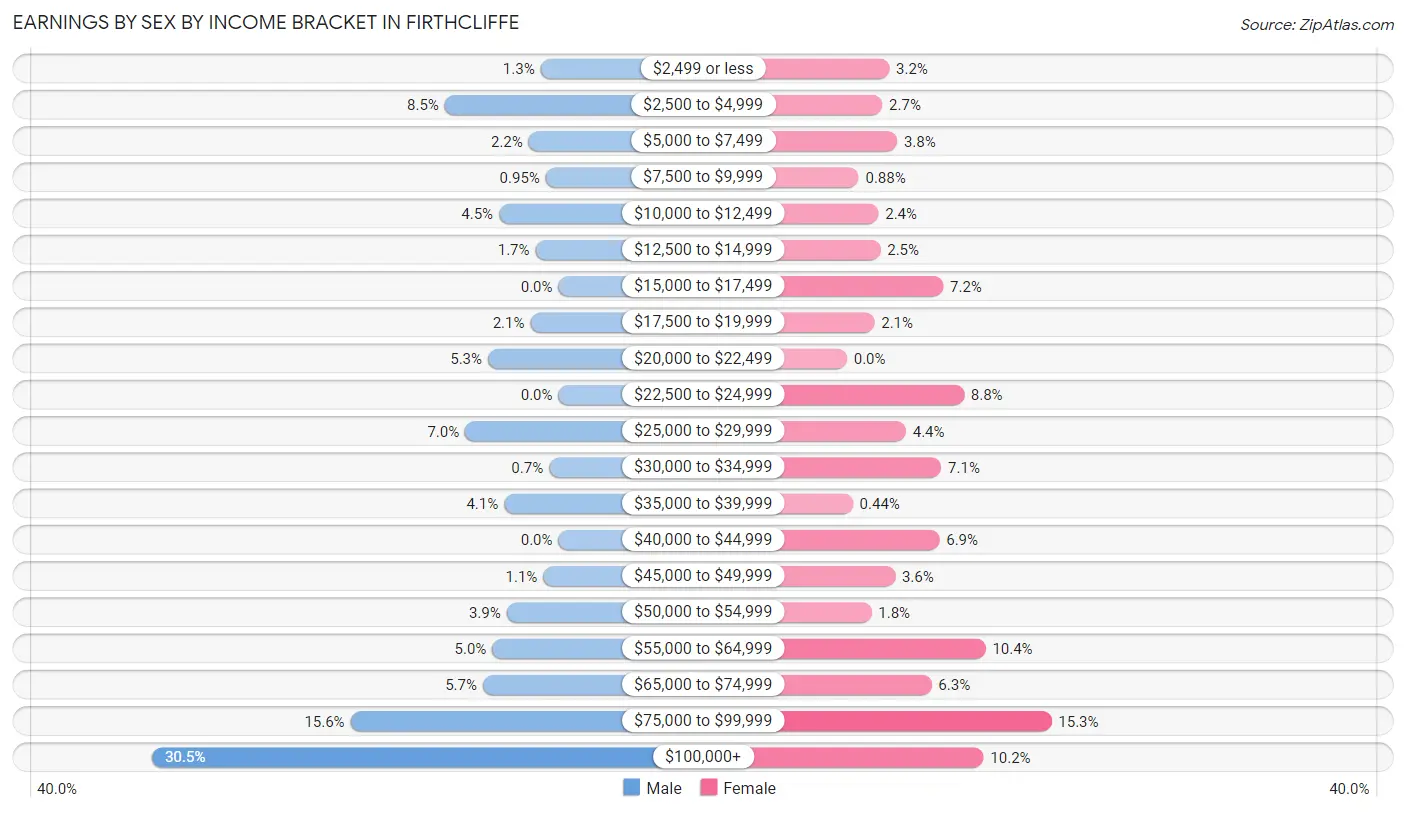
| Income | Male | Female |
| $2,499 or less | 21 (1.3%) | 43 (3.2%) |
| $2,500 to $4,999 | 134 (8.5%) | 36 (2.6%) |
| $5,000 to $7,499 | 35 (2.2%) | 51 (3.8%) |
| $7,500 to $9,999 | 15 (0.9%) | 12 (0.9%) |
| $10,000 to $12,499 | 70 (4.4%) | 32 (2.4%) |
| $12,500 to $14,999 | 27 (1.7%) | 34 (2.5%) |
| $15,000 to $17,499 | 0 (0.0%) | 98 (7.2%) |
| $17,500 to $19,999 | 33 (2.1%) | 28 (2.1%) |
| $20,000 to $22,499 | 83 (5.3%) | 0 (0.0%) |
| $22,500 to $24,999 | 0 (0.0%) | 119 (8.8%) |
| $25,000 to $29,999 | 110 (7.0%) | 60 (4.4%) |
| $30,000 to $34,999 | 11 (0.7%) | 96 (7.1%) |
| $35,000 to $39,999 | 64 (4.1%) | 6 (0.4%) |
| $40,000 to $44,999 | 0 (0.0%) | 94 (6.9%) |
| $45,000 to $49,999 | 18 (1.1%) | 49 (3.6%) |
| $50,000 to $54,999 | 61 (3.9%) | 25 (1.8%) |
| $55,000 to $64,999 | 78 (5.0%) | 141 (10.4%) |
| $65,000 to $74,999 | 89 (5.7%) | 86 (6.3%) |
| $75,000 to $99,999 | 245 (15.6%) | 208 (15.3%) |
| $100,000+ | 479 (30.4%) | 139 (10.2%) |
| Total | 1,573 (100.0%) | 1,357 (100.0%) |
Earnings by Sex by Educational Attainment in Firthcliffe
Average earnings in Firthcliffe are $83,958 for men and $47,404 for women, a difference of 43.5%. Men with an educational attainment of graduate degree enjoy the highest average annual earnings of $106,050, while those with high school diploma education earn the least with $35,404. Women with an educational attainment of bachelor's degree earn the most with the average annual earnings of $88,304, while those with high school diploma education have the smallest earnings of $24,908.
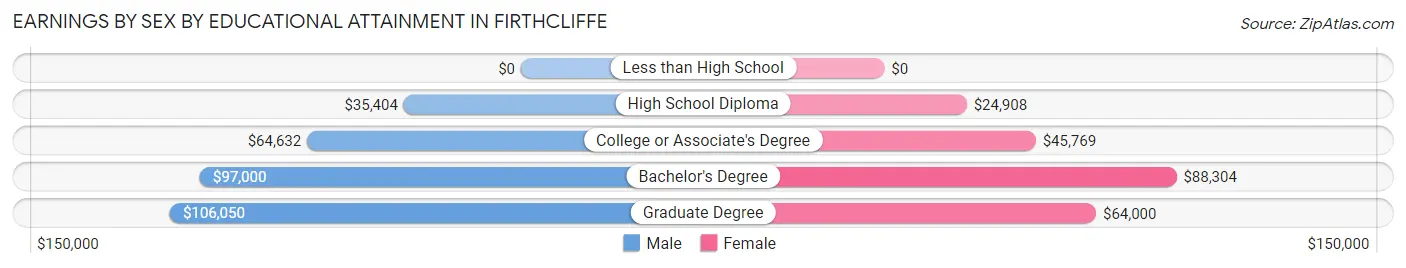
| Educational Attainment | Male Income | Female Income |
| Less than High School | - | - |
| High School Diploma | $35,404 | $24,908 |
| College or Associate's Degree | $64,632 | $45,769 |
| Bachelor's Degree | $97,000 | $88,304 |
| Graduate Degree | $106,050 | $64,000 |
| Total | $83,958 | $47,404 |
Family Income in Firthcliffe
Family Income Brackets in Firthcliffe
According to the Firthcliffe family income data, there are 333 families falling into the $100,000 to $149,999 income range, which is the most common income bracket and makes up 25.4% of all families.
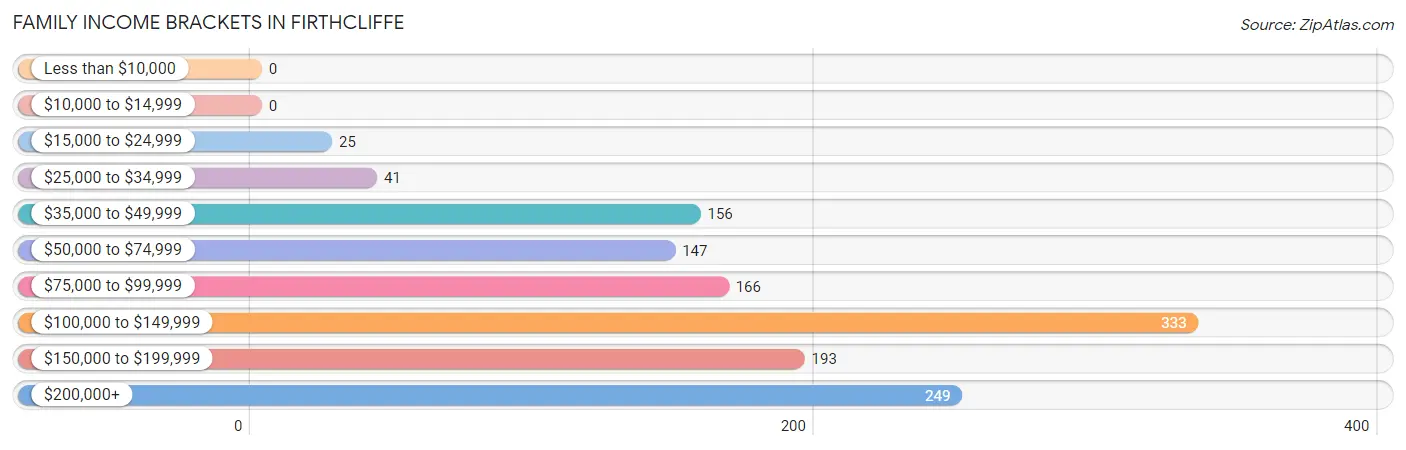
| Income Bracket | # Families | % Families |
| Less than $10,000 | 0 | 0.0% |
| $10,000 to $14,999 | 0 | 0.0% |
| $15,000 to $24,999 | 25 | 1.9% |
| $25,000 to $34,999 | 41 | 3.1% |
| $35,000 to $49,999 | 156 | 11.9% |
| $50,000 to $74,999 | 147 | 11.2% |
| $75,000 to $99,999 | 166 | 12.7% |
| $100,000 to $149,999 | 333 | 25.4% |
| $150,000 to $199,999 | 193 | 14.7% |
| $200,000+ | 249 | 19.0% |
Family Income by Famaliy Size in Firthcliffe
5-person families (67 | 5.1%) account for the highest median family income in Firthcliffe with $250,001 per family, while 2-person families (607 | 46.3%) have the highest median income of $51,384 per family member.
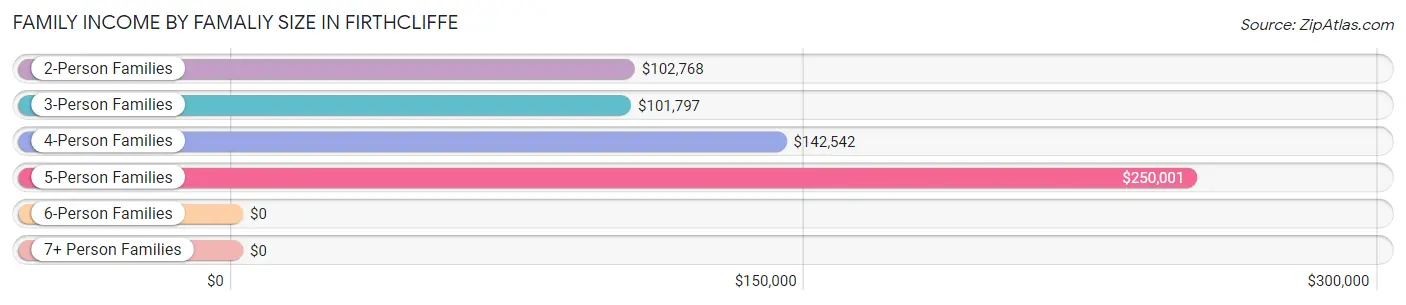
| Income Bracket | # Families | Median Income |
| 2-Person Families | 607 (46.3%) | $102,768 |
| 3-Person Families | 269 (20.5%) | $101,797 |
| 4-Person Families | 297 (22.7%) | $142,542 |
| 5-Person Families | 67 (5.1%) | $250,001 |
| 6-Person Families | 60 (4.6%) | $0 |
| 7+ Person Families | 10 (0.8%) | $0 |
| Total | 1,310 (100.0%) | $130,245 |
Family Income by Number of Earners in Firthcliffe
The median family income in Firthcliffe is $130,245, with families comprising 3+ earners (173) having the highest median family income of $199,063, while families with no earners (117) have the lowest median family income of $64,479, accounting for 13.2% and 8.9% of families, respectively.
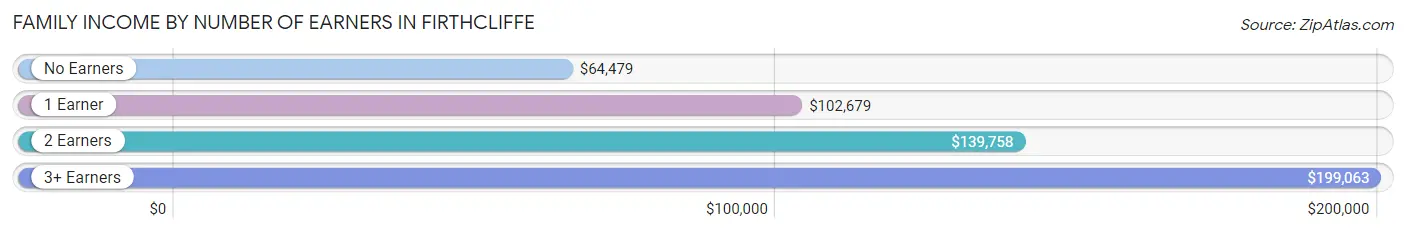
| Number of Earners | # Families | Median Income |
| No Earners | 117 (8.9%) | $64,479 |
| 1 Earner | 412 (31.5%) | $102,679 |
| 2 Earners | 608 (46.4%) | $139,758 |
| 3+ Earners | 173 (13.2%) | $199,063 |
| Total | 1,310 (100.0%) | $130,245 |
Household Income in Firthcliffe
Household Income Brackets in Firthcliffe
With 554 households falling in the category, the $100,000 to $149,999 income range is the most frequent in Firthcliffe, accounting for 26.7% of all households. In contrast, only 31 households (1.5%) fall into the less than $10,000 income bracket, making it the least populous group.
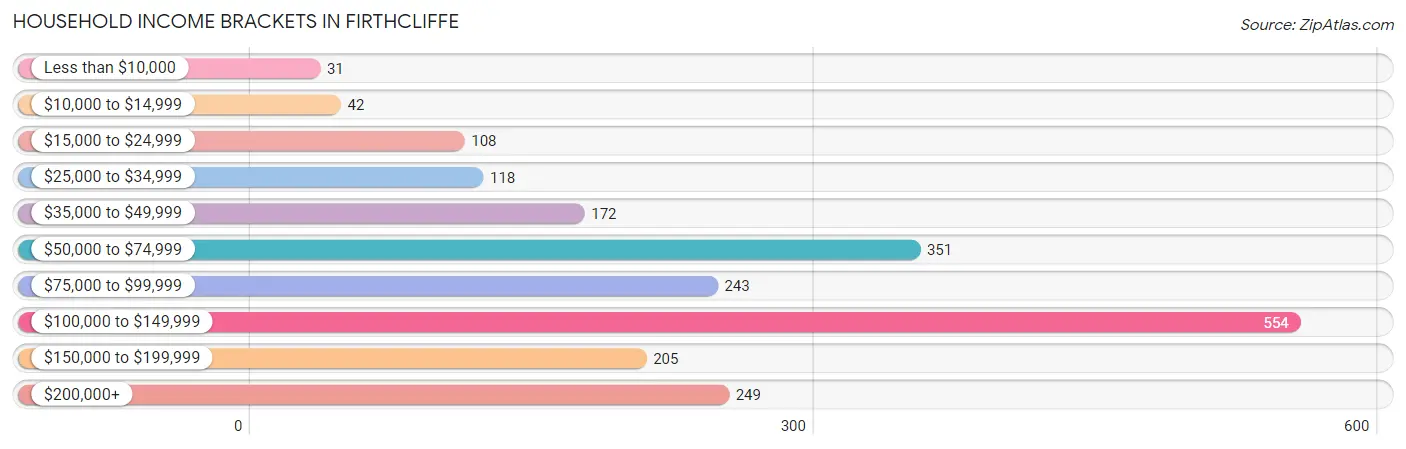
| Income Bracket | # Households | % Households |
| Less than $10,000 | 31 | 1.5% |
| $10,000 to $14,999 | 42 | 2.0% |
| $15,000 to $24,999 | 108 | 5.2% |
| $25,000 to $34,999 | 118 | 5.7% |
| $35,000 to $49,999 | 172 | 8.3% |
| $50,000 to $74,999 | 351 | 16.9% |
| $75,000 to $99,999 | 243 | 11.7% |
| $100,000 to $149,999 | 554 | 26.7% |
| $150,000 to $199,999 | 205 | 9.9% |
| $200,000+ | 249 | 12.0% |
Household Income by Householder Age in Firthcliffe
The median household income in Firthcliffe is $96,315, with the highest median household income of $124,167 found in the 45 to 64 years age bracket for the primary householder. A total of 724 households (34.9%) fall into this category. Meanwhile, the 15 to 24 years age bracket for the primary householder has the lowest median household income of $0, with 18 households (0.9%) in this group.
| Income Bracket | # Households | Median Income |
| 15 to 24 Years | 18 (0.9%) | $0 |
| 25 to 44 Years | 647 (31.2%) | $110,219 |
| 45 to 64 Years | 724 (34.9%) | $124,167 |
| 65+ Years | 686 (33.1%) | $59,516 |
| Total | 2,075 (100.0%) | $96,315 |
Poverty in Firthcliffe
Income Below Poverty by Sex and Age in Firthcliffe
With 5.0% poverty level for males and 4.3% for females among the residents of Firthcliffe, 15 year old males and 16 and 17 year old females are the most vulnerable to poverty, with 20 males (30.3%) and 18 females (28.1%) in their respective age groups living below the poverty level.
| Age Bracket | Male | Female |
| Under 5 Years | 0 (0.0%) | 0 (0.0%) |
| 5 Years | 0 (0.0%) | 0 (0.0%) |
| 6 to 11 Years | 16 (10.3%) | 0 (0.0%) |
| 12 to 14 Years | 0 (0.0%) | 14 (9.9%) |
| 15 Years | 20 (30.3%) | 0 (0.0%) |
| 16 and 17 Years | 0 (0.0%) | 18 (28.1%) |
| 18 to 24 Years | 0 (0.0%) | 0 (0.0%) |
| 25 to 34 Years | 3 (0.8%) | 0 (0.0%) |
| 35 to 44 Years | 30 (9.0%) | 54 (19.3%) |
| 45 to 54 Years | 0 (0.0%) | 12 (3.4%) |
| 55 to 64 Years | 32 (7.6%) | 12 (2.9%) |
| 65 to 74 Years | 16 (4.4%) | 0 (0.0%) |
| 75 Years and over | 8 (7.4%) | 10 (3.3%) |
| Total | 125 (5.0%) | 120 (4.3%) |
Income Above Poverty by Sex and Age in Firthcliffe
According to the poverty statistics in Firthcliffe, males aged under 5 years and females aged under 5 years are the age groups that are most secure financially, with 100.0% of males and 100.0% of females in these age groups living above the poverty line.
| Age Bracket | Male | Female |
| Under 5 Years | 117 (100.0%) | 223 (100.0%) |
| 5 Years | 36 (100.0%) | 34 (100.0%) |
| 6 to 11 Years | 140 (89.7%) | 130 (100.0%) |
| 12 to 14 Years | 65 (100.0%) | 128 (90.1%) |
| 15 Years | 46 (69.7%) | 28 (100.0%) |
| 16 and 17 Years | 72 (100.0%) | 46 (71.9%) |
| 18 to 24 Years | 167 (100.0%) | 195 (100.0%) |
| 25 to 34 Years | 361 (99.2%) | 305 (100.0%) |
| 35 to 44 Years | 302 (91.0%) | 226 (80.7%) |
| 45 to 54 Years | 225 (100.0%) | 341 (96.6%) |
| 55 to 64 Years | 388 (92.4%) | 405 (97.1%) |
| 65 to 74 Years | 348 (95.6%) | 286 (100.0%) |
| 75 Years and over | 100 (92.6%) | 297 (96.7%) |
| Total | 2,367 (95.0%) | 2,644 (95.7%) |
Income Below Poverty Among Married-Couple Families in Firthcliffe
| Children | Above Poverty | Below Poverty |
| No Children | 590 (100.0%) | 0 (0.0%) |
| 1 or 2 Children | 400 (100.0%) | 0 (0.0%) |
| 3 or 4 Children | 43 (100.0%) | 0 (0.0%) |
| 5 or more Children | 0 (0.0%) | 0 (0.0%) |
| Total | 1,033 (100.0%) | 0 (0.0%) |
Income Below Poverty Among Single-Parent Households in Firthcliffe
According to the poverty data in Firthcliffe, 13.4% or 9 single-father households and 11.9% or 25 single-mother households are living below the poverty line. Among single-father households, those with 3 or 4 children have the highest poverty rate, with 9 households (100.0%) experiencing poverty. Likewise, among single-mother households, those with 1 or 2 children have the highest poverty rate, with 25 households (22.3%) falling below the poverty line.
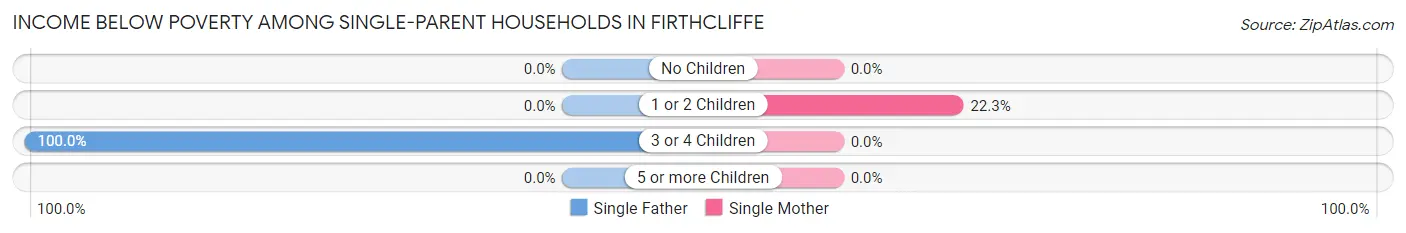
| Children | Single Father | Single Mother |
| No Children | 0 (0.0%) | 0 (0.0%) |
| 1 or 2 Children | 0 (0.0%) | 25 (22.3%) |
| 3 or 4 Children | 9 (100.0%) | 0 (0.0%) |
| 5 or more Children | 0 (0.0%) | 0 (0.0%) |
| Total | 9 (13.4%) | 25 (11.9%) |
Income Below Poverty Among Married-Couple vs Single-Parent Households in Firthcliffe
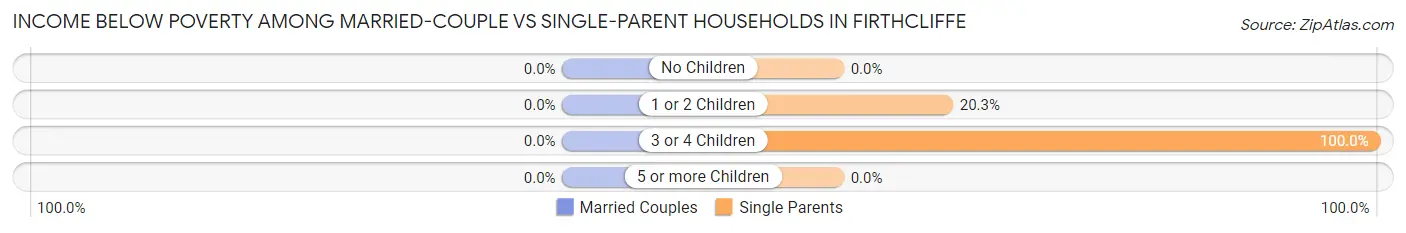
| Children | Married-Couple Families | Single-Parent Households |
| No Children | 0 (0.0%) | 0 (0.0%) |
| 1 or 2 Children | 0 (0.0%) | 25 (20.3%) |
| 3 or 4 Children | 0 (0.0%) | 9 (100.0%) |
| 5 or more Children | 0 (0.0%) | 0 (0.0%) |
| Total | 0 (0.0%) | 34 (12.3%) |
Race in Firthcliffe
The most populous races in Firthcliffe are White / Caucasian (4,192 | 79.6%), Hispanic or Latino (682 | 13.0%), and Two or more Races (350 | 6.7%).
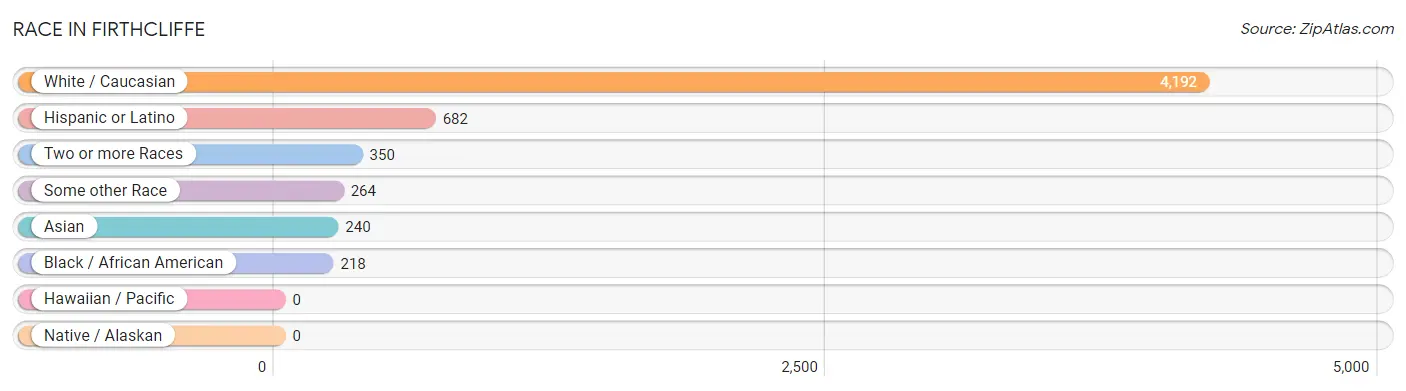
| Race | # Population | % Population |
| Asian | 240 | 4.6% |
| Black / African American | 218 | 4.1% |
| Hawaiian / Pacific | 0 | 0.0% |
| Hispanic or Latino | 682 | 13.0% |
| Native / Alaskan | 0 | 0.0% |
| White / Caucasian | 4,192 | 79.6% |
| Two or more Races | 350 | 6.7% |
| Some other Race | 264 | 5.0% |
| Total | 5,264 | 100.0% |
Ancestry in Firthcliffe
The most populous ancestries reported in Firthcliffe are Irish (1,202 | 22.8%), Italian (960 | 18.2%), German (748 | 14.2%), English (553 | 10.5%), and American (304 | 5.8%), together accounting for 71.6% of all Firthcliffe residents.
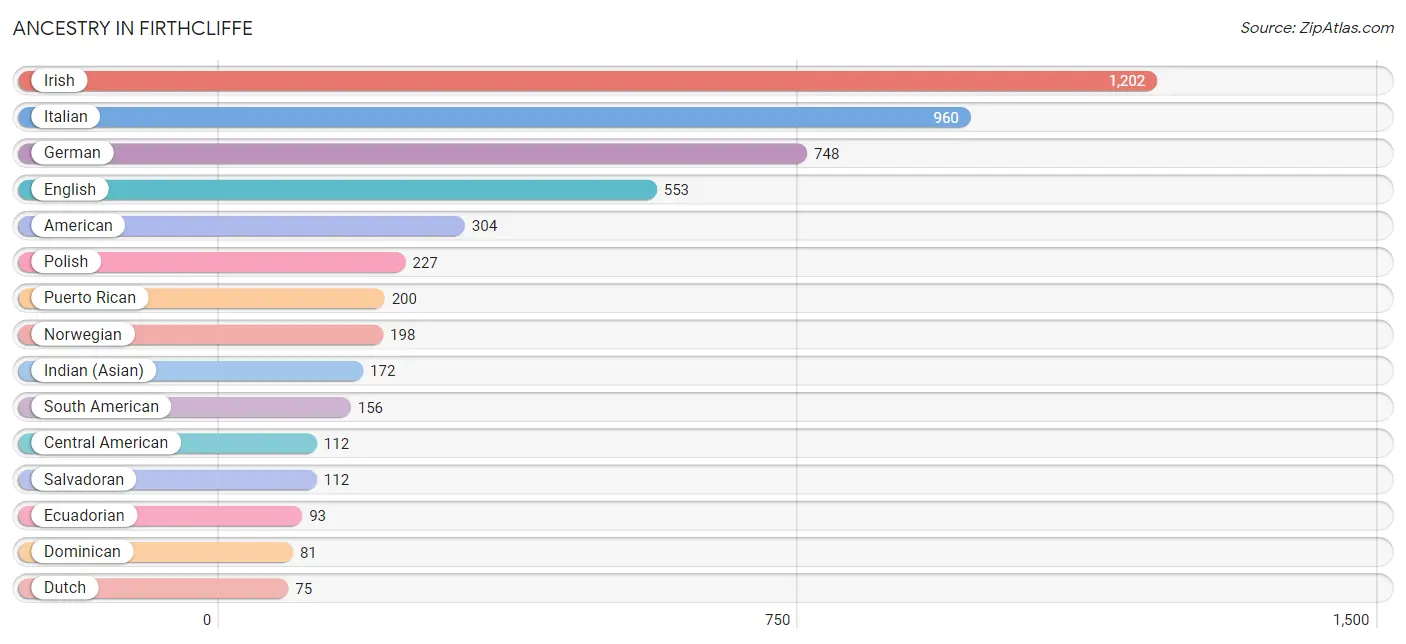
| Ancestry | # Population | % Population |
| American | 304 | 5.8% |
| Arab | 1 | 0.0% |
| Austrian | 49 | 0.9% |
| Bhutanese | 1 | 0.0% |
| British | 58 | 1.1% |
| Central American | 112 | 2.1% |
| Colombian | 14 | 0.3% |
| Croatian | 6 | 0.1% |
| Czechoslovakian | 8 | 0.2% |
| Delaware | 28 | 0.5% |
| Dominican | 81 | 1.5% |
| Dutch | 75 | 1.4% |
| Ecuadorian | 93 | 1.8% |
| English | 553 | 10.5% |
| European | 37 | 0.7% |
| French | 44 | 0.8% |
| French Canadian | 58 | 1.1% |
| German | 748 | 14.2% |
| Greek | 13 | 0.3% |
| Hungarian | 12 | 0.2% |
| Indian (Asian) | 172 | 3.3% |
| Irish | 1,202 | 22.8% |
| Israeli | 17 | 0.3% |
| Italian | 960 | 18.2% |
| Korean | 57 | 1.1% |
| Malaysian | 25 | 0.5% |
| Mexican | 65 | 1.2% |
| Norwegian | 198 | 3.8% |
| Peruvian | 13 | 0.3% |
| Polish | 227 | 4.3% |
| Portuguese | 9 | 0.2% |
| Puerto Rican | 200 | 3.8% |
| Russian | 55 | 1.0% |
| Salvadoran | 112 | 2.1% |
| Scandinavian | 15 | 0.3% |
| Scotch-Irish | 68 | 1.3% |
| Scottish | 60 | 1.1% |
| Sioux | 49 | 0.9% |
| Slovak | 12 | 0.2% |
| South American | 156 | 3.0% |
| Spaniard | 36 | 0.7% |
| Spanish | 23 | 0.4% |
| Swedish | 37 | 0.7% |
| Trinidadian and Tobagonian | 36 | 0.7% |
| Ukrainian | 11 | 0.2% |
| Venezuelan | 36 | 0.7% |
| Welsh | 21 | 0.4% | View All 47 Rows |
Immigrants in Firthcliffe
The most numerous immigrant groups reported in Firthcliffe came from Latin America (100 | 1.9%), Europe (87 | 1.7%), Asia (72 | 1.4%), South America (55 | 1.0%), and Central America (45 | 0.9%), together accounting for 6.8% of all Firthcliffe residents.
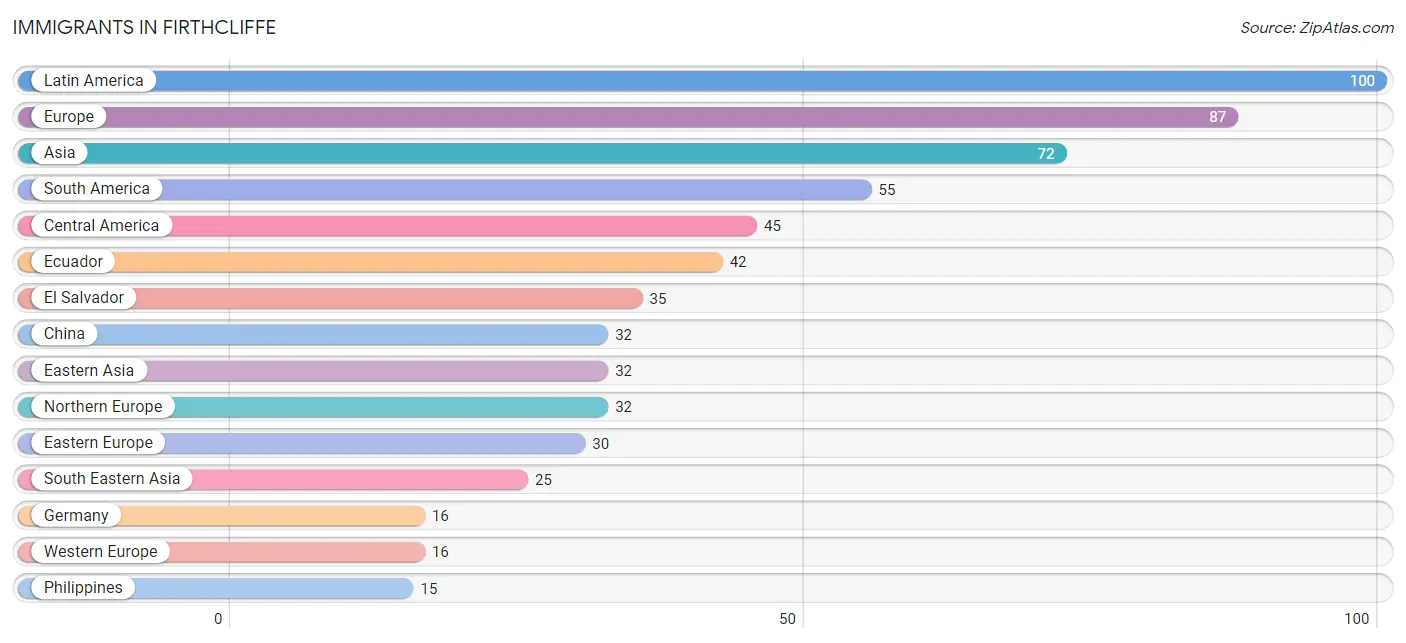
| Immigration Origin | # Population | % Population |
| Asia | 72 | 1.4% |
| Central America | 45 | 0.9% |
| China | 32 | 0.6% |
| Croatia | 6 | 0.1% |
| Eastern Asia | 32 | 0.6% |
| Eastern Europe | 30 | 0.6% |
| Ecuador | 42 | 0.8% |
| El Salvador | 35 | 0.7% |
| England | 13 | 0.3% |
| Europe | 87 | 1.7% |
| Germany | 16 | 0.3% |
| Hong Kong | 14 | 0.3% |
| Ireland | 11 | 0.2% |
| Kuwait | 1 | 0.0% |
| Laos | 10 | 0.2% |
| Latin America | 100 | 1.9% |
| Mexico | 10 | 0.2% |
| Northern Europe | 32 | 0.6% |
| Norway | 8 | 0.2% |
| Peru | 13 | 0.3% |
| Philippines | 15 | 0.3% |
| Poland | 12 | 0.2% |
| Portugal | 9 | 0.2% |
| South America | 55 | 1.0% |
| South Central Asia | 14 | 0.3% |
| South Eastern Asia | 25 | 0.5% |
| Southern Europe | 9 | 0.2% |
| Ukraine | 12 | 0.2% |
| Uzbekistan | 14 | 0.3% |
| Western Asia | 1 | 0.0% |
| Western Europe | 16 | 0.3% | View All 31 Rows |
Sex and Age in Firthcliffe
Sex and Age in Firthcliffe
The most populous age groups in Firthcliffe are 30 to 34 Years (292 | 11.7%) for men and 60 to 64 Years (299 | 10.8%) for women.
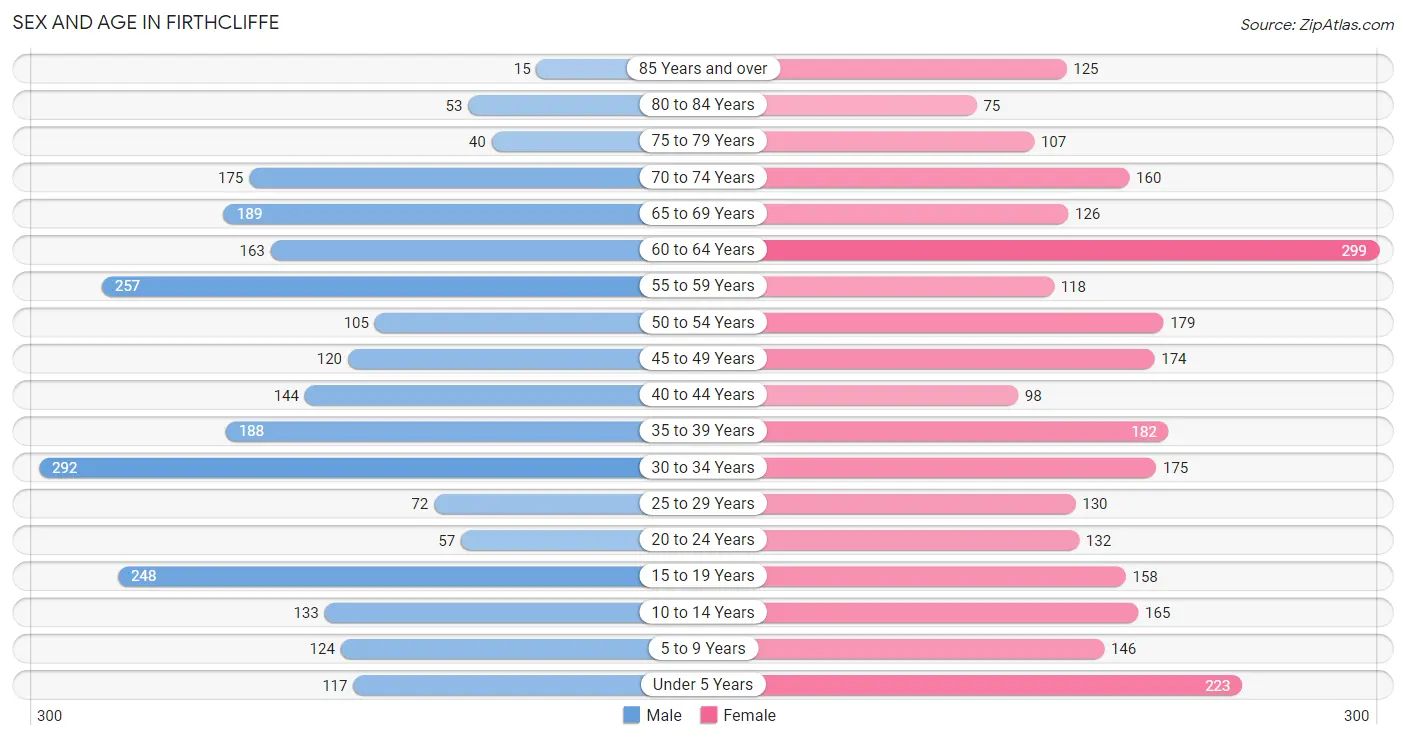
| Age Bracket | Male | Female |
| Under 5 Years | 117 (4.7%) | 223 (8.0%) |
| 5 to 9 Years | 124 (5.0%) | 146 (5.3%) |
| 10 to 14 Years | 133 (5.3%) | 165 (5.9%) |
| 15 to 19 Years | 248 (10.0%) | 158 (5.7%) |
| 20 to 24 Years | 57 (2.3%) | 132 (4.8%) |
| 25 to 29 Years | 72 (2.9%) | 130 (4.7%) |
| 30 to 34 Years | 292 (11.7%) | 175 (6.3%) |
| 35 to 39 Years | 188 (7.5%) | 182 (6.6%) |
| 40 to 44 Years | 144 (5.8%) | 98 (3.5%) |
| 45 to 49 Years | 120 (4.8%) | 174 (6.3%) |
| 50 to 54 Years | 105 (4.2%) | 179 (6.5%) |
| 55 to 59 Years | 257 (10.3%) | 118 (4.3%) |
| 60 to 64 Years | 163 (6.5%) | 299 (10.8%) |
| 65 to 69 Years | 189 (7.6%) | 126 (4.5%) |
| 70 to 74 Years | 175 (7.0%) | 160 (5.8%) |
| 75 to 79 Years | 40 (1.6%) | 107 (3.9%) |
| 80 to 84 Years | 53 (2.1%) | 75 (2.7%) |
| 85 Years and over | 15 (0.6%) | 125 (4.5%) |
| Total | 2,492 (100.0%) | 2,772 (100.0%) |
Families and Households in Firthcliffe
Median Family Size in Firthcliffe
The median family size in Firthcliffe is 3.22 persons per family, with married-couple families (1,033 | 78.8%) accounting for the largest median family size of 3.39 persons per family. On the other hand, single female/mother families (210 | 16.0%) represent the smallest median family size with 2.49 persons per family.
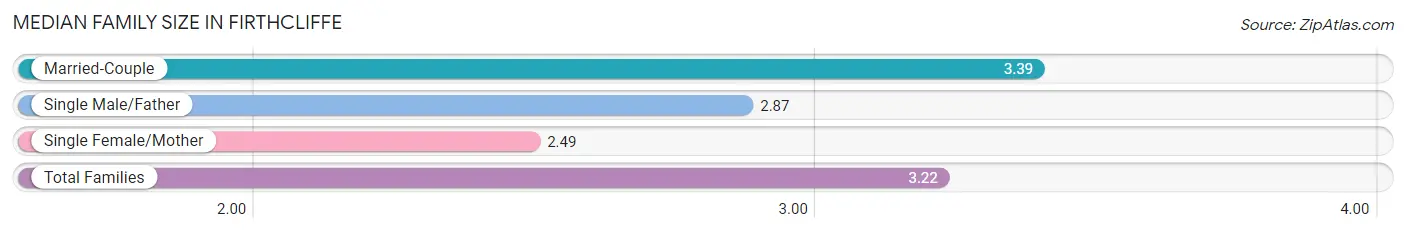
| Family Type | # Families | Family Size |
| Married-Couple | 1,033 (78.8%) | 3.39 |
| Single Male/Father | 67 (5.1%) | 2.87 |
| Single Female/Mother | 210 (16.0%) | 2.49 |
| Total Families | 1,310 (100.0%) | 3.22 |
Median Household Size in Firthcliffe
The median household size in Firthcliffe is 2.52 persons per household, with married-couple households (1,033 | 49.8%) accounting for the largest median household size of 3.39 persons per household. non-family households (765 | 36.9%) represent the smallest median household size with 1.25 persons per household.
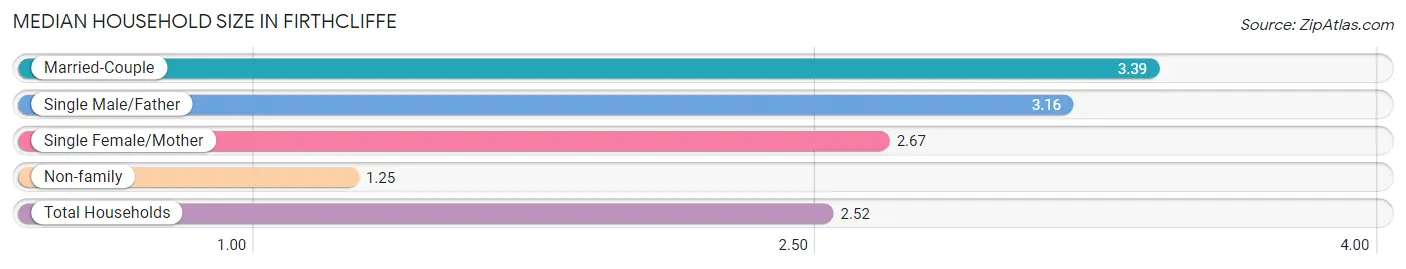
| Household Type | # Households | Household Size |
| Married-Couple | 1,033 (49.8%) | 3.39 |
| Single Male/Father | 67 (3.2%) | 3.16 |
| Single Female/Mother | 210 (10.1%) | 2.67 |
| Non-family | 765 (36.9%) | 1.25 |
| Total Households | 2,075 (100.0%) | 2.52 |
Household Size by Marriage Status in Firthcliffe
Out of a total of 2,075 households in Firthcliffe, 1,310 (63.1%) are family households, while 765 (36.9%) are nonfamily households. The most numerous type of family households are 2-person households, comprising 556, and the most common type of nonfamily households are 1-person households, comprising 572.
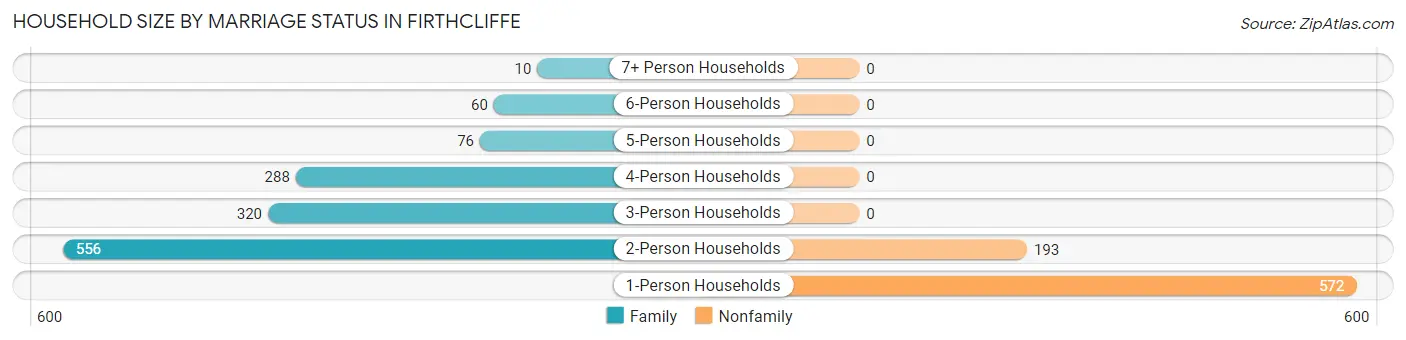
| Household Size | Family Households | Nonfamily Households |
| 1-Person Households | - | 572 (27.6%) |
| 2-Person Households | 556 (26.8%) | 193 (9.3%) |
| 3-Person Households | 320 (15.4%) | 0 (0.0%) |
| 4-Person Households | 288 (13.9%) | 0 (0.0%) |
| 5-Person Households | 76 (3.7%) | 0 (0.0%) |
| 6-Person Households | 60 (2.9%) | 0 (0.0%) |
| 7+ Person Households | 10 (0.5%) | 0 (0.0%) |
| Total | 1,310 (63.1%) | 765 (36.9%) |
Female Fertility in Firthcliffe
Fertility by Age in Firthcliffe
Average fertility rate in Firthcliffe is 55.0 births per 1,000 women. Women in the age bracket of 20 to 34 years have the highest fertility rate with 110.0 births per 1,000 women. Women in the age bracket of 20 to 34 years acount for 80.0% of all women with births.
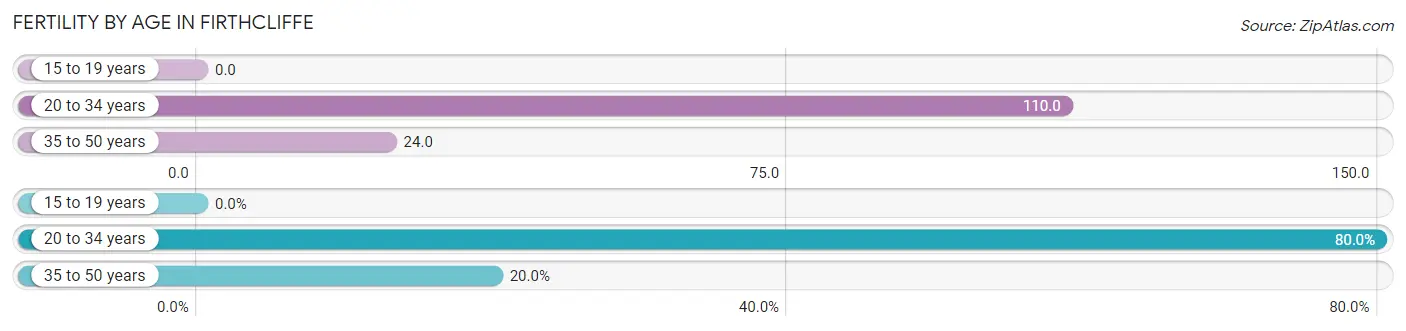
| Age Bracket | Women with Births | Births / 1,000 Women |
| 15 to 19 years | 0 (0.0%) | 0.0 |
| 20 to 34 years | 48 (80.0%) | 110.0 |
| 35 to 50 years | 12 (20.0%) | 24.0 |
| Total | 60 (100.0%) | 55.0 |
Fertility by Age by Marriage Status in Firthcliffe

| Age Bracket | Married | Unmarried |
| 15 to 19 years | 0 (0.0%) | 0 (0.0%) |
| 20 to 34 years | 48 (100.0%) | 0 (0.0%) |
| 35 to 50 years | 12 (100.0%) | 0 (0.0%) |
| Total | 60 (100.0%) | 0 (0.0%) |
Fertility by Education in Firthcliffe
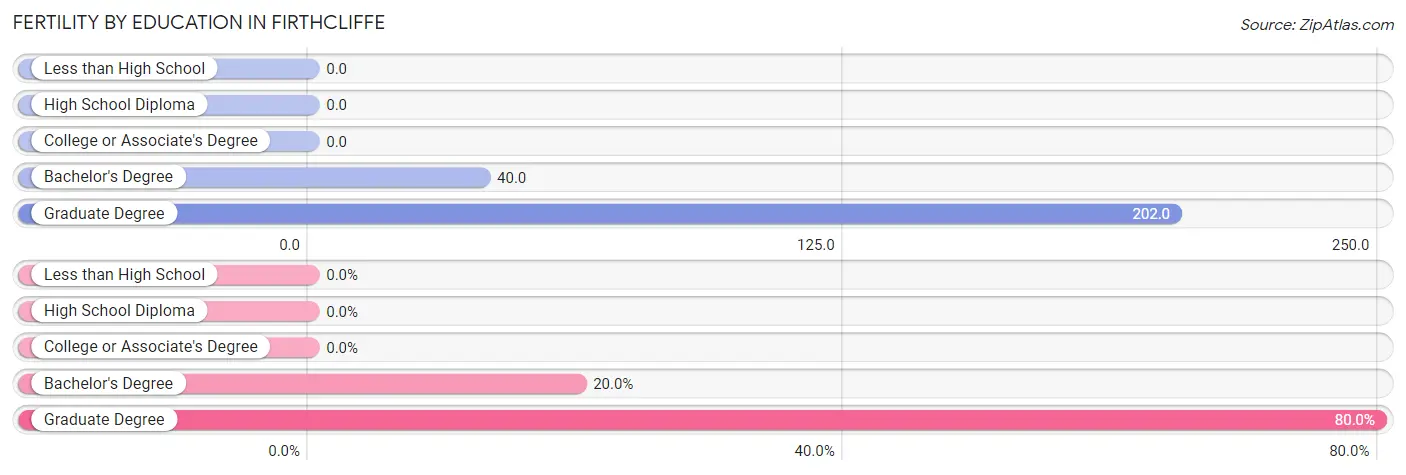
| Educational Attainment | Women with Births | Births / 1,000 Women |
| Less than High School | 0 (0.0%) | 0.0 |
| High School Diploma | 0 (0.0%) | 0.0 |
| College or Associate's Degree | 0 (0.0%) | 0.0 |
| Bachelor's Degree | 12 (20.0%) | 40.0 |
| Graduate Degree | 48 (80.0%) | 202.0 |
| Total | 60 (100.0%) | 55.0 |
Fertility by Education by Marriage Status in Firthcliffe
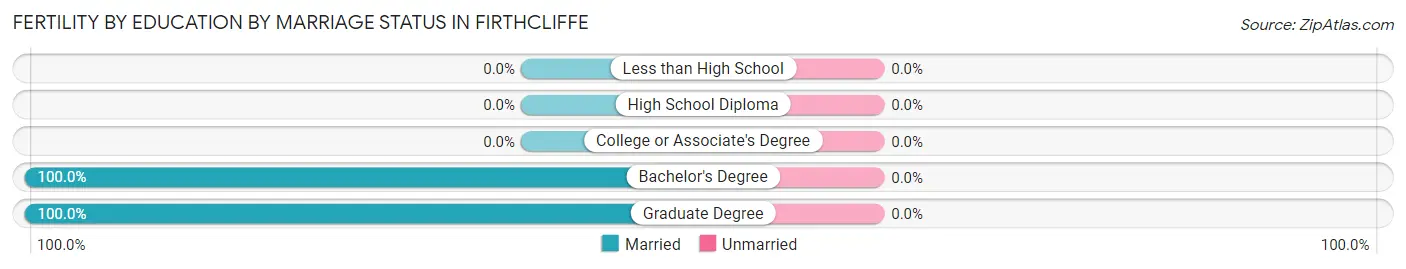
| Educational Attainment | Married | Unmarried |
| Less than High School | 0 (0.0%) | 0 (0.0%) |
| High School Diploma | 0 (0.0%) | 0 (0.0%) |
| College or Associate's Degree | 0 (0.0%) | 0 (0.0%) |
| Bachelor's Degree | 12 (100.0%) | 0 (0.0%) |
| Graduate Degree | 48 (100.0%) | 0 (0.0%) |
| Total | 60 (100.0%) | 0 (0.0%) |
Employment Characteristics in Firthcliffe
Employment by Class of Employer in Firthcliffe
Among the 2,706 employed individuals in Firthcliffe, private company employees (1,557 | 57.5%), local government employees (331 | 12.2%), and federal government employees (276 | 10.2%) make up the most common classes of employment.
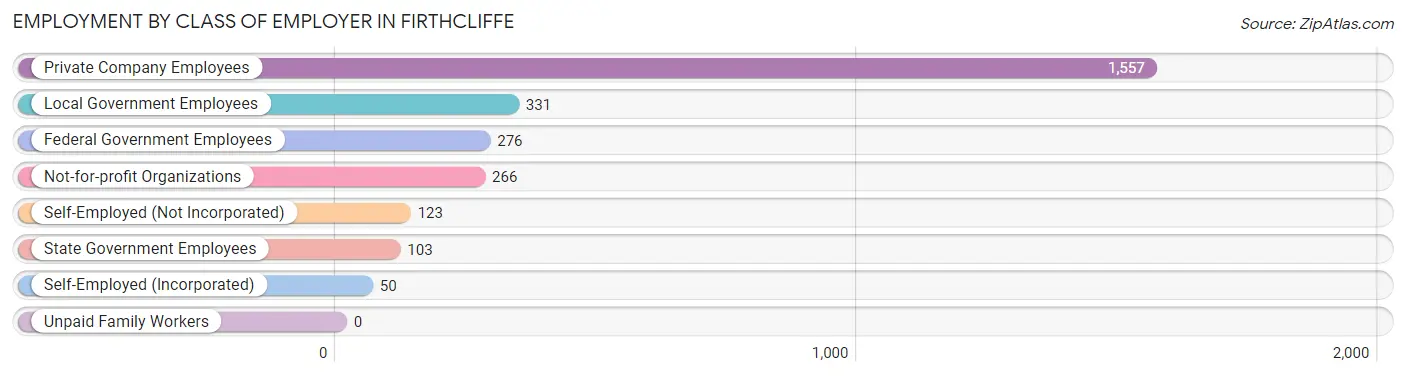
| Employer Class | # Employees | % Employees |
| Private Company Employees | 1,557 | 57.5% |
| Self-Employed (Incorporated) | 50 | 1.8% |
| Self-Employed (Not Incorporated) | 123 | 4.5% |
| Not-for-profit Organizations | 266 | 9.8% |
| Local Government Employees | 331 | 12.2% |
| State Government Employees | 103 | 3.8% |
| Federal Government Employees | 276 | 10.2% |
| Unpaid Family Workers | 0 | 0.0% |
| Total | 2,706 | 100.0% |
Employment Status by Age in Firthcliffe
According to the labor force statistics for Firthcliffe, out of the total population over 16 years of age (4,262), 66.5% or 2,834 individuals are in the labor force, with 3.6% or 102 of them unemployed. The age group with the highest labor force participation rate is 20 to 24 years, with 100.0% or 189 individuals in the labor force. Within the labor force, the 65 to 74 years age range has the highest percentage of unemployed individuals, with 6.5% or 13 of them being unemployed.
| Age Bracket | In Labor Force | Unemployed |
| 16 to 19 Years | 120 (38.5%) | 5 (4.2%) |
| 20 to 24 Years | 189 (100.0%) | 12 (6.3%) |
| 25 to 29 Years | 202 (100.0%) | 0 (0.0%) |
| 30 to 34 Years | 454 (97.2%) | 20 (4.5%) |
| 35 to 44 Years | 533 (87.1%) | 20 (3.8%) |
| 45 to 54 Years | 535 (92.6%) | 33 (6.2%) |
| 55 to 59 Years | 252 (67.2%) | 0 (0.0%) |
| 60 to 64 Years | 300 (64.9%) | 0 (0.0%) |
| 65 to 74 Years | 201 (30.9%) | 13 (6.5%) |
| 75 Years and over | 50 (12.0%) | 0 (0.0%) |
| Total | 2,834 (66.5%) | 102 (3.6%) |
Employment Status by Educational Attainment in Firthcliffe
According to labor force statistics for Firthcliffe, 84.4% of individuals (2,275) out of the total population between 25 and 64 years of age (2,696) are in the labor force, with 3.2% or 73 of them being unemployed. The group with the highest labor force participation rate are those with the educational attainment of bachelor's degree or higher, with 88.6% or 1,162 individuals in the labor force. Within the labor force, individuals with bachelor's degree or higher education have the highest percentage of unemployment, with 4.4% or 51 of them being unemployed.
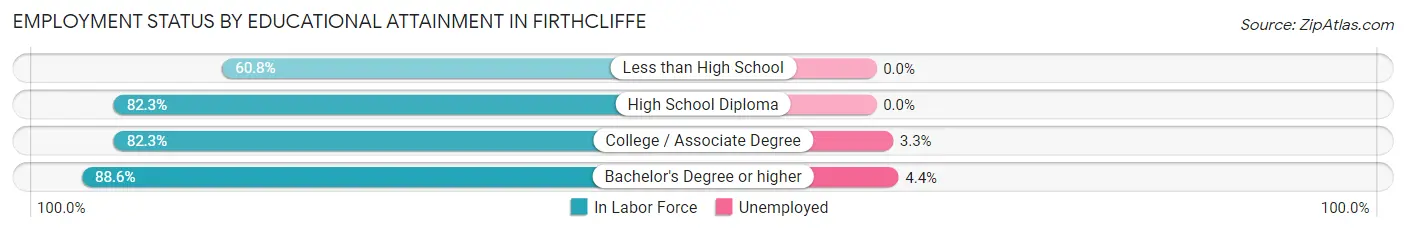
| Educational Attainment | In Labor Force | Unemployed |
| Less than High School | 73 (60.8%) | 0 (0.0%) |
| High School Diploma | 367 (82.3%) | 0 (0.0%) |
| College / Associate Degree | 673 (82.3%) | 27 (3.3%) |
| Bachelor's Degree or higher | 1,162 (88.6%) | 58 (4.4%) |
| Total | 2,275 (84.4%) | 86 (3.2%) |
Employment Occupations by Sex in Firthcliffe
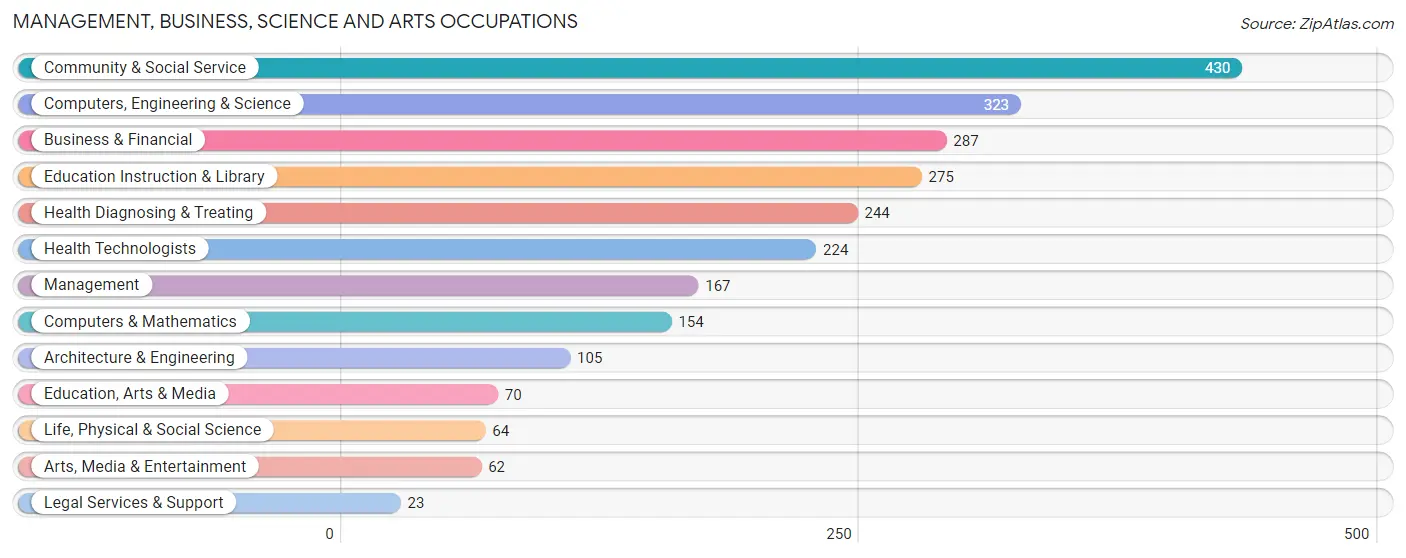
Management, Business, Science and Arts Occupations
The most common Management, Business, Science and Arts occupations in Firthcliffe are Community & Social Service (430 | 15.9%), Computers, Engineering & Science (323 | 11.9%), Business & Financial (287 | 10.6%), Education Instruction & Library (275 | 10.2%), and Health Diagnosing & Treating (244 | 9.0%).
Management, Business, Science and Arts Occupations by Sex
Within the Management, Business, Science and Arts occupations in Firthcliffe, the most male-oriented occupations are Architecture & Engineering (100.0%), Legal Services & Support (100.0%), and Computers & Mathematics (89.6%), while the most female-oriented occupations are Health Diagnosing & Treating (89.7%), Health Technologists (88.8%), and Education, Arts & Media (88.6%).
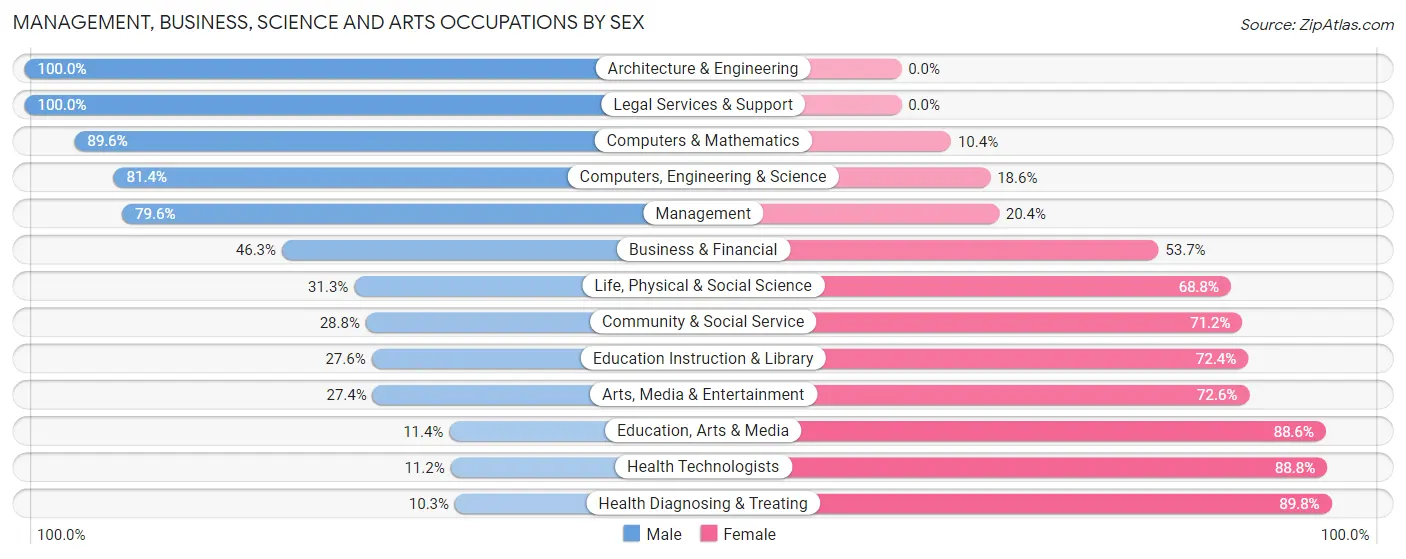
| Occupation | Male | Female |
| Management | 133 (79.6%) | 34 (20.4%) |
| Business & Financial | 133 (46.3%) | 154 (53.7%) |
| Computers, Engineering & Science | 263 (81.4%) | 60 (18.6%) |
| Computers & Mathematics | 138 (89.6%) | 16 (10.4%) |
| Architecture & Engineering | 105 (100.0%) | 0 (0.0%) |
| Life, Physical & Social Science | 20 (31.2%) | 44 (68.8%) |
| Community & Social Service | 124 (28.8%) | 306 (71.2%) |
| Education, Arts & Media | 8 (11.4%) | 62 (88.6%) |
| Legal Services & Support | 23 (100.0%) | 0 (0.0%) |
| Education Instruction & Library | 76 (27.6%) | 199 (72.4%) |
| Arts, Media & Entertainment | 17 (27.4%) | 45 (72.6%) |
| Health Diagnosing & Treating | 25 (10.2%) | 219 (89.7%) |
| Health Technologists | 25 (11.2%) | 199 (88.8%) |
| Total (Category) | 678 (46.7%) | 773 (53.3%) |
| Total (Overall) | 1,418 (52.4%) | 1,288 (47.6%) |
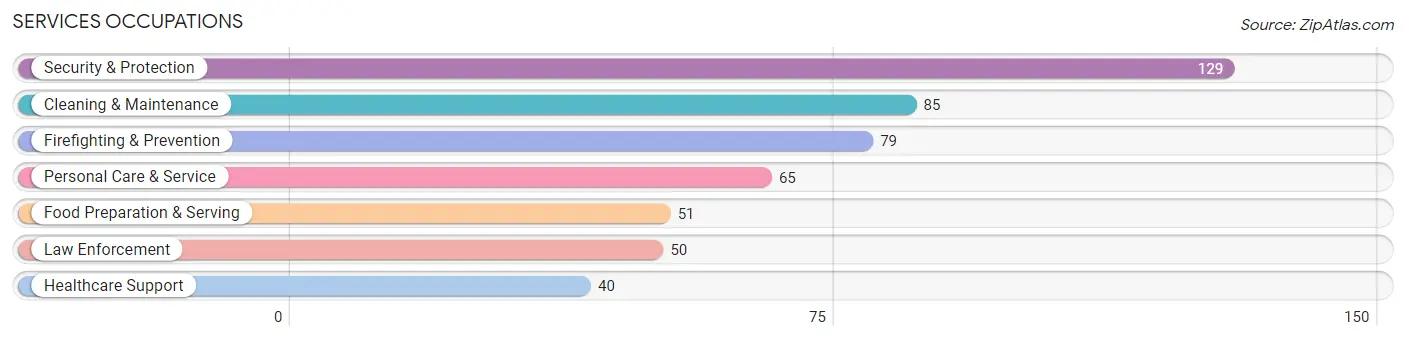
Services Occupations
The most common Services occupations in Firthcliffe are Security & Protection (129 | 4.8%), Cleaning & Maintenance (85 | 3.1%), Firefighting & Prevention (79 | 2.9%), Personal Care & Service (65 | 2.4%), and Food Preparation & Serving (51 | 1.9%).
Services Occupations by Sex
Within the Services occupations in Firthcliffe, the most male-oriented occupations are Firefighting & Prevention (84.8%), Cleaning & Maintenance (84.7%), and Security & Protection (79.1%), while the most female-oriented occupations are Personal Care & Service (100.0%), Food Preparation & Serving (64.7%), and Healthcare Support (35.0%).
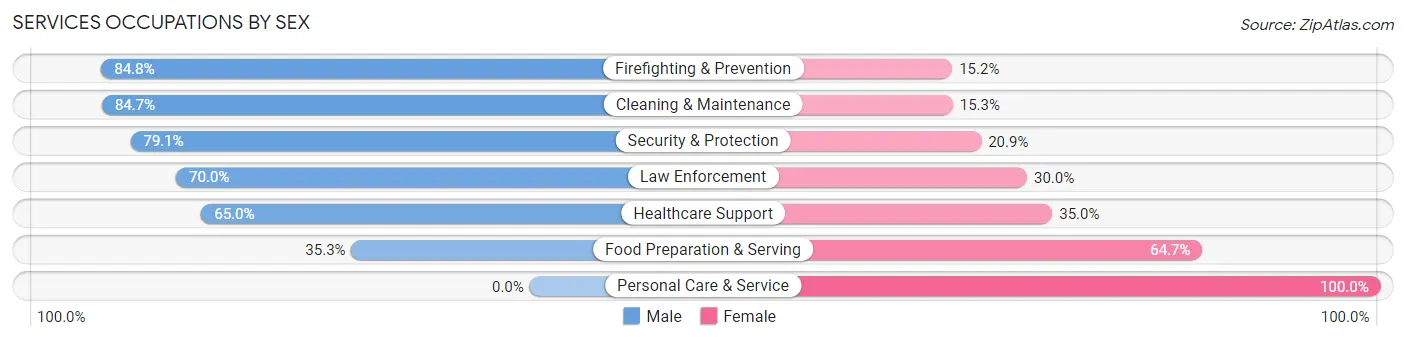
| Occupation | Male | Female |
| Healthcare Support | 26 (65.0%) | 14 (35.0%) |
| Security & Protection | 102 (79.1%) | 27 (20.9%) |
| Firefighting & Prevention | 67 (84.8%) | 12 (15.2%) |
| Law Enforcement | 35 (70.0%) | 15 (30.0%) |
| Food Preparation & Serving | 18 (35.3%) | 33 (64.7%) |
| Cleaning & Maintenance | 72 (84.7%) | 13 (15.3%) |
| Personal Care & Service | 0 (0.0%) | 65 (100.0%) |
| Total (Category) | 218 (58.9%) | 152 (41.1%) |
| Total (Overall) | 1,418 (52.4%) | 1,288 (47.6%) |
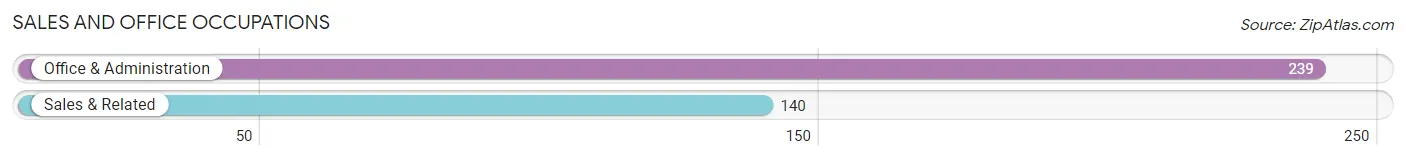
Sales and Office Occupations
The most common Sales and Office occupations in Firthcliffe are Office & Administration (239 | 8.8%), and Sales & Related (140 | 5.2%).
Sales and Office Occupations by Sex
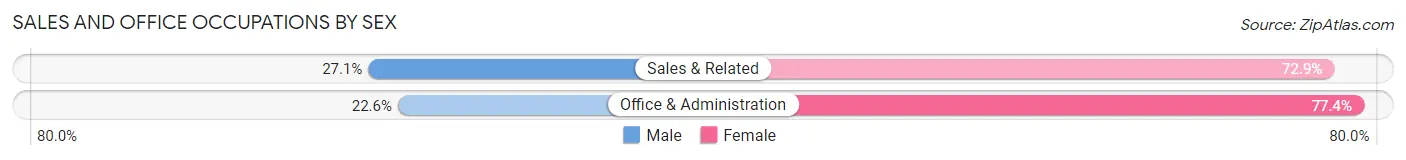
| Occupation | Male | Female |
| Sales & Related | 38 (27.1%) | 102 (72.9%) |
| Office & Administration | 54 (22.6%) | 185 (77.4%) |
| Total (Category) | 92 (24.3%) | 287 (75.7%) |
| Total (Overall) | 1,418 (52.4%) | 1,288 (47.6%) |
Natural Resources, Construction and Maintenance Occupations
The most common Natural Resources, Construction and Maintenance occupations in Firthcliffe are Construction & Extraction (227 | 8.4%), and Installation, Maintenance & Repair (51 | 1.9%).
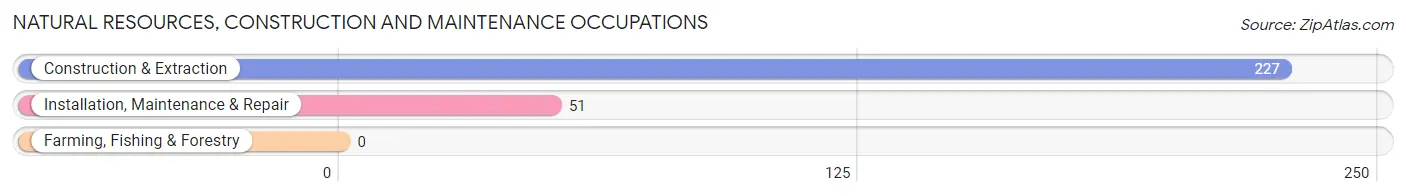
Natural Resources, Construction and Maintenance Occupations by Sex
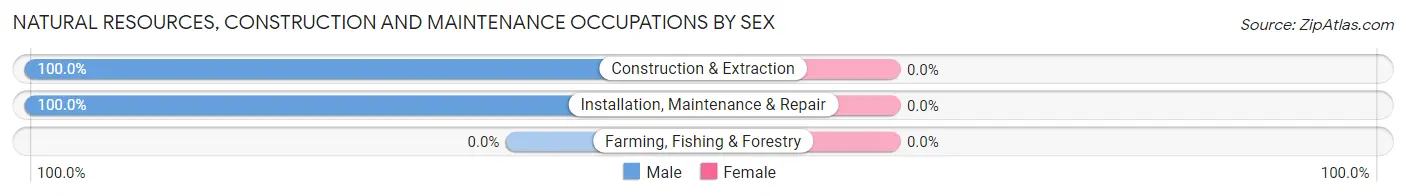
| Occupation | Male | Female |
| Farming, Fishing & Forestry | 0 (0.0%) | 0 (0.0%) |
| Construction & Extraction | 227 (100.0%) | 0 (0.0%) |
| Installation, Maintenance & Repair | 51 (100.0%) | 0 (0.0%) |
| Total (Category) | 278 (100.0%) | 0 (0.0%) |
| Total (Overall) | 1,418 (52.4%) | 1,288 (47.6%) |
Production, Transportation and Moving Occupations
The most common Production, Transportation and Moving occupations in Firthcliffe are Material Moving (94 | 3.5%), Transportation (83 | 3.1%), and Production (51 | 1.9%).
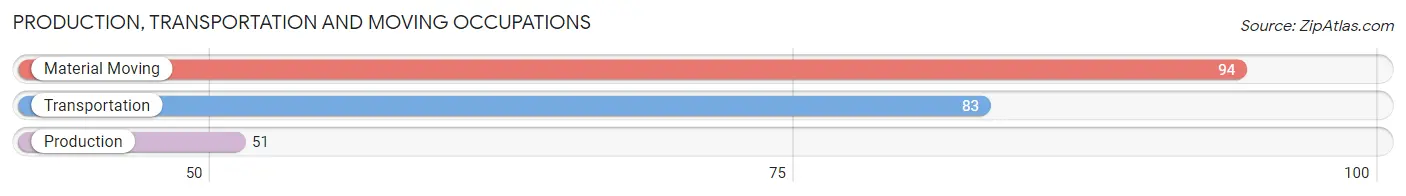
Production, Transportation and Moving Occupations by Sex
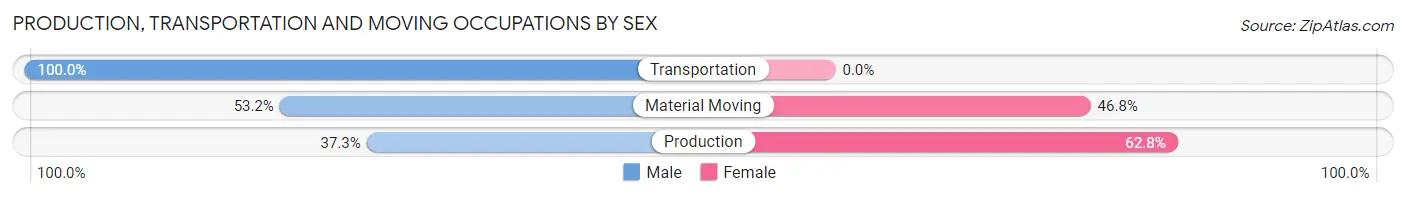
| Occupation | Male | Female |
| Production | 19 (37.2%) | 32 (62.7%) |
| Transportation | 83 (100.0%) | 0 (0.0%) |
| Material Moving | 50 (53.2%) | 44 (46.8%) |
| Total (Category) | 152 (66.7%) | 76 (33.3%) |
| Total (Overall) | 1,418 (52.4%) | 1,288 (47.6%) |
Employment Industries by Sex in Firthcliffe
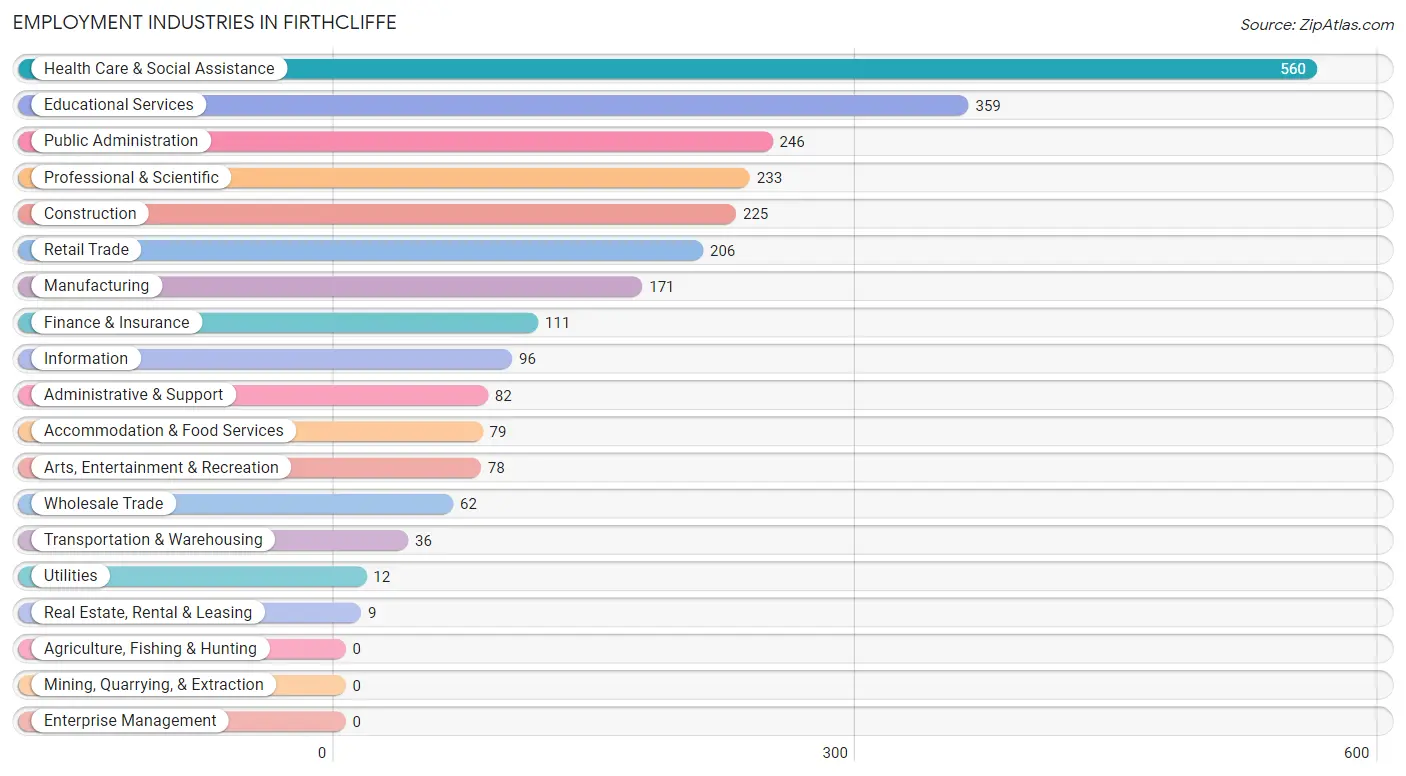
Employment Industries in Firthcliffe
The major employment industries in Firthcliffe include Health Care & Social Assistance (560 | 20.7%), Educational Services (359 | 13.3%), Public Administration (246 | 9.1%), Professional & Scientific (233 | 8.6%), and Construction (225 | 8.3%).
Employment Industries by Sex in Firthcliffe
The Firthcliffe industries that see more men than women are Wholesale Trade (100.0%), Transportation & Warehousing (100.0%), and Construction (94.2%), whereas the industries that tend to have a higher number of women are Utilities (100.0%), Real Estate, Rental & Leasing (100.0%), and Retail Trade (81.1%).
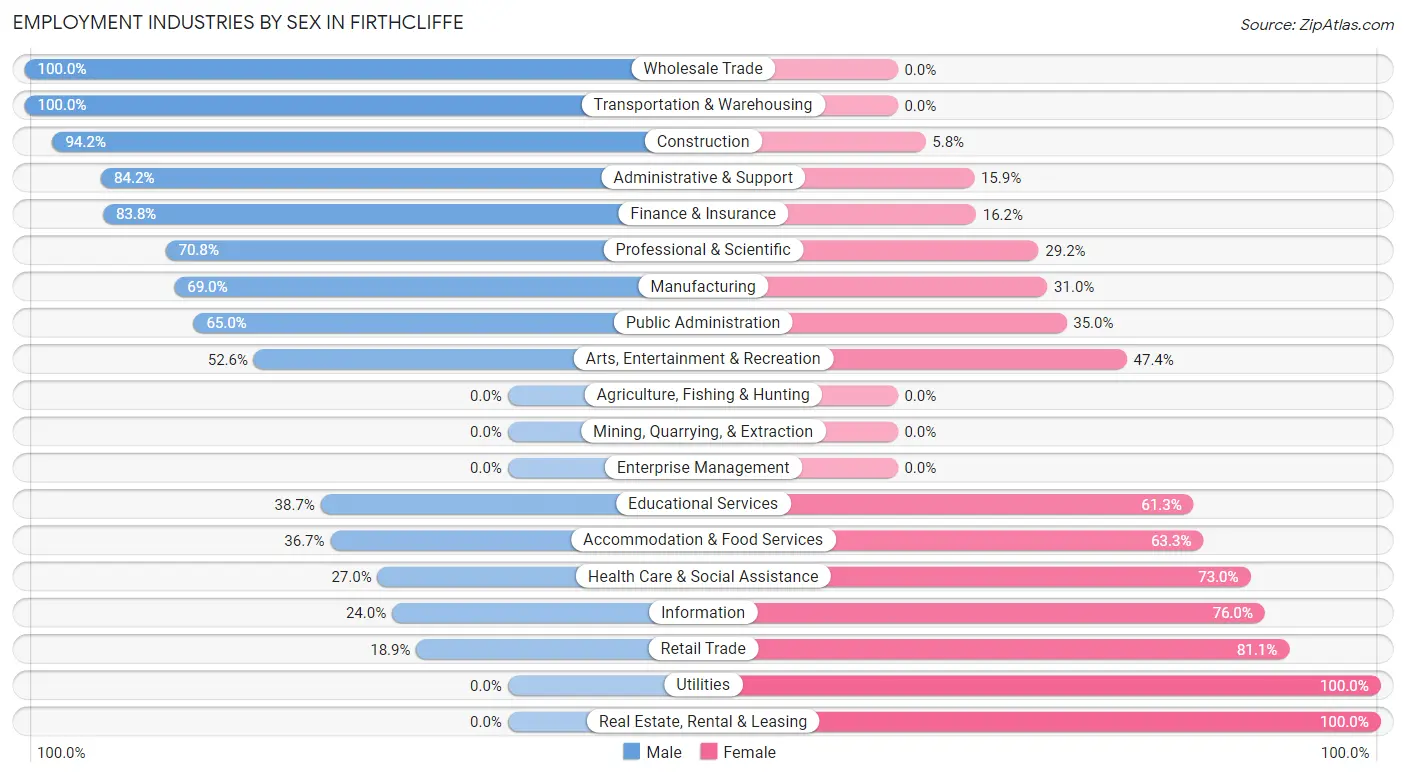
| Industry | Male | Female |
| Agriculture, Fishing & Hunting | 0 (0.0%) | 0 (0.0%) |
| Mining, Quarrying, & Extraction | 0 (0.0%) | 0 (0.0%) |
| Construction | 212 (94.2%) | 13 (5.8%) |
| Manufacturing | 118 (69.0%) | 53 (31.0%) |
| Wholesale Trade | 62 (100.0%) | 0 (0.0%) |
| Retail Trade | 39 (18.9%) | 167 (81.1%) |
| Transportation & Warehousing | 36 (100.0%) | 0 (0.0%) |
| Utilities | 0 (0.0%) | 12 (100.0%) |
| Information | 23 (24.0%) | 73 (76.0%) |
| Finance & Insurance | 93 (83.8%) | 18 (16.2%) |
| Real Estate, Rental & Leasing | 0 (0.0%) | 9 (100.0%) |
| Professional & Scientific | 165 (70.8%) | 68 (29.2%) |
| Enterprise Management | 0 (0.0%) | 0 (0.0%) |
| Administrative & Support | 69 (84.2%) | 13 (15.9%) |
| Educational Services | 139 (38.7%) | 220 (61.3%) |
| Health Care & Social Assistance | 151 (27.0%) | 409 (73.0%) |
| Arts, Entertainment & Recreation | 41 (52.6%) | 37 (47.4%) |
| Accommodation & Food Services | 29 (36.7%) | 50 (63.3%) |
| Public Administration | 160 (65.0%) | 86 (35.0%) |
| Total | 1,418 (52.4%) | 1,288 (47.6%) |
Education in Firthcliffe
School Enrollment in Firthcliffe
The most common levels of schooling among the 1,107 students in Firthcliffe are high school (379 | 34.2%), middle school (186 | 16.8%), and college / undergraduate (183 | 16.5%).
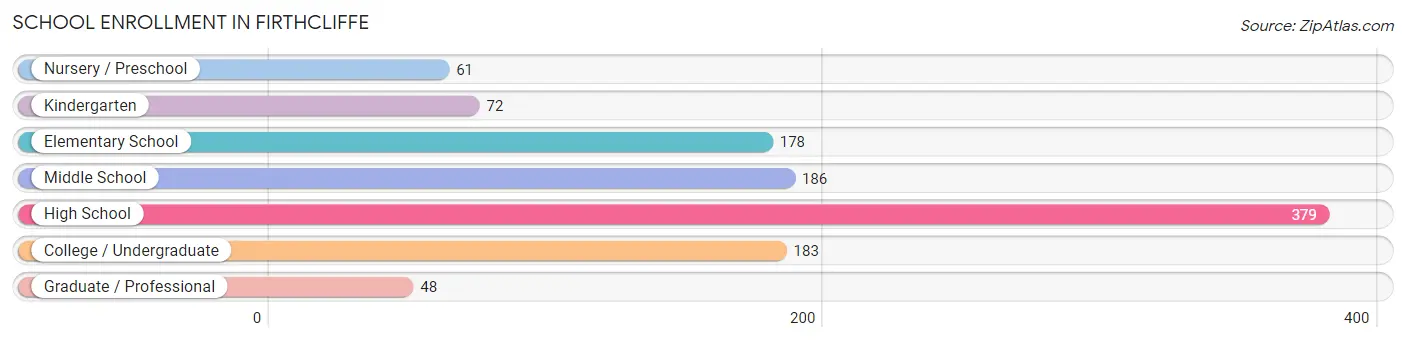
| School Level | # Students | % Students |
| Nursery / Preschool | 61 | 5.5% |
| Kindergarten | 72 | 6.5% |
| Elementary School | 178 | 16.1% |
| Middle School | 186 | 16.8% |
| High School | 379 | 34.2% |
| College / Undergraduate | 183 | 16.5% |
| Graduate / Professional | 48 | 4.3% |
| Total | 1,107 | 100.0% |
School Enrollment by Age by Funding Source in Firthcliffe
Out of a total of 1,107 students who are enrolled in schools in Firthcliffe, 200 (18.1%) attend a private institution, while the remaining 907 (81.9%) are enrolled in public schools. The age group of 3 to 4 year olds has the highest likelihood of being enrolled in private schools, with 50 (100.0% in the age bracket) enrolled. Conversely, the age group of 10 to 14 year olds has the lowest likelihood of being enrolled in a private school, with 297 (99.7% in the age bracket) attending a public institution.
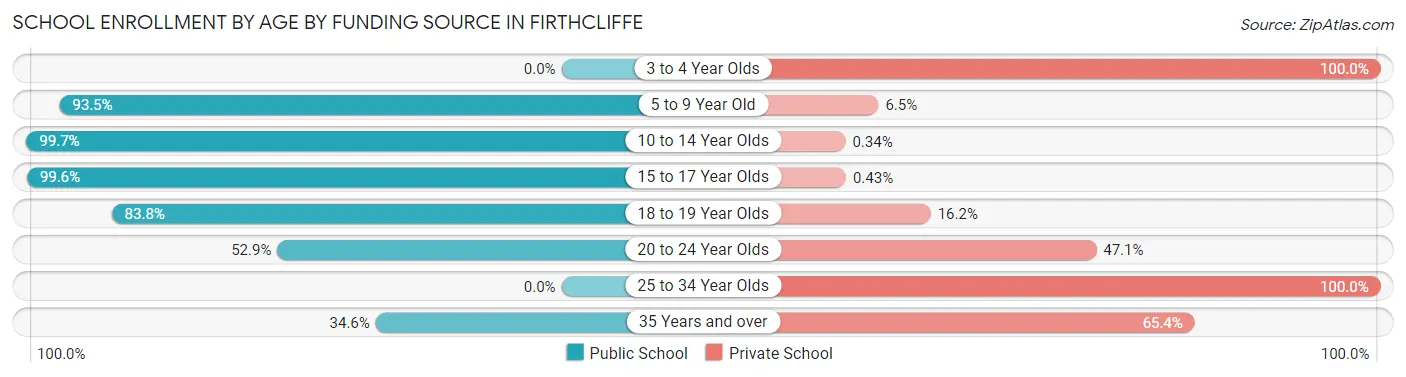
| Age Bracket | Public School | Private School |
| 3 to 4 Year Olds | 0 (0.0%) | 50 (100.0%) |
| 5 to 9 Year Old | 231 (93.5%) | 16 (6.5%) |
| 10 to 14 Year Olds | 297 (99.7%) | 1 (0.3%) |
| 15 to 17 Year Olds | 232 (99.6%) | 1 (0.4%) |
| 18 to 19 Year Olds | 93 (83.8%) | 18 (16.2%) |
| 20 to 24 Year Olds | 36 (52.9%) | 32 (47.1%) |
| 25 to 34 Year Olds | 0 (0.0%) | 48 (100.0%) |
| 35 Years and over | 18 (34.6%) | 34 (65.4%) |
| Total | 907 (81.9%) | 200 (18.1%) |
Educational Attainment by Field of Study in Firthcliffe
Education (356 | 18.3%), business (325 | 16.7%), literature & languages (174 | 8.9%), visual & performing arts (171 | 8.8%), and social sciences (143 | 7.4%) are the most common fields of study among 1,944 individuals in Firthcliffe who have obtained a bachelor's degree or higher.
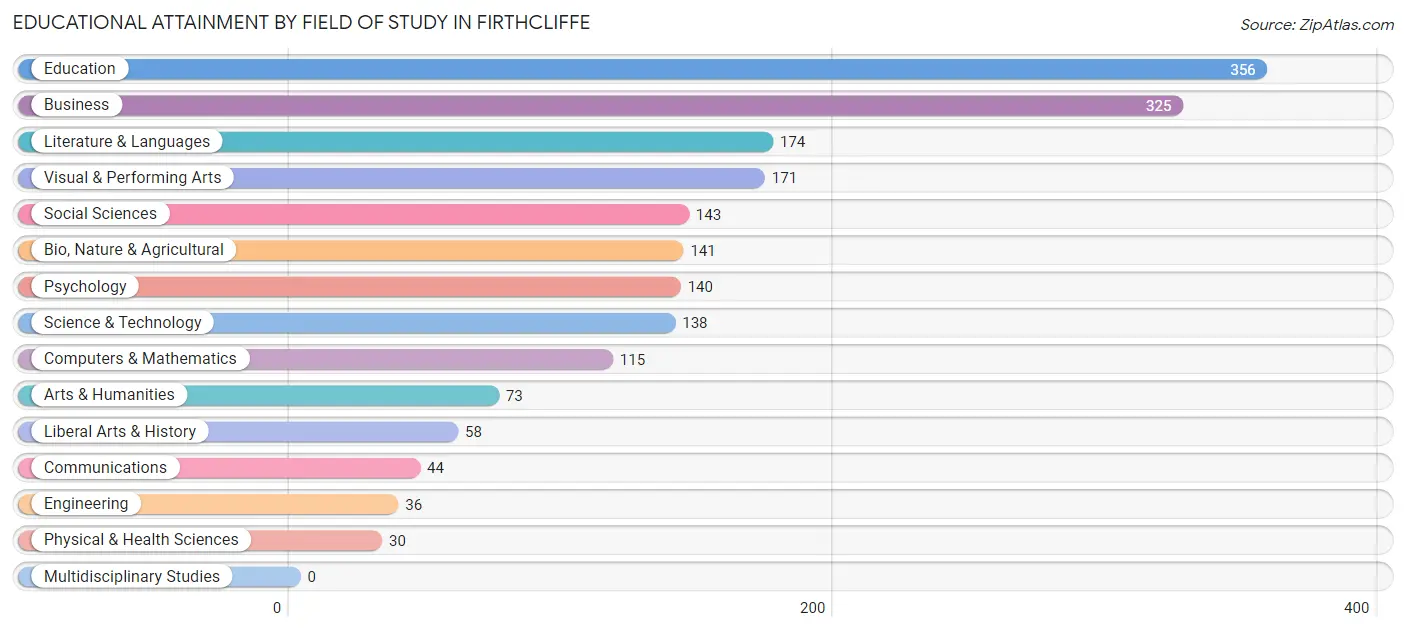
| Field of Study | # Graduates | % Graduates |
| Computers & Mathematics | 115 | 5.9% |
| Bio, Nature & Agricultural | 141 | 7.2% |
| Physical & Health Sciences | 30 | 1.5% |
| Psychology | 140 | 7.2% |
| Social Sciences | 143 | 7.4% |
| Engineering | 36 | 1.8% |
| Multidisciplinary Studies | 0 | 0.0% |
| Science & Technology | 138 | 7.1% |
| Business | 325 | 16.7% |
| Education | 356 | 18.3% |
| Literature & Languages | 174 | 8.9% |
| Liberal Arts & History | 58 | 3.0% |
| Visual & Performing Arts | 171 | 8.8% |
| Communications | 44 | 2.3% |
| Arts & Humanities | 73 | 3.8% |
| Total | 1,944 | 100.0% |
Transportation & Commute in Firthcliffe
Vehicle Availability by Sex in Firthcliffe
The most prevalent vehicle ownership categories in Firthcliffe are males with 2 vehicles (579, accounting for 41.6%) and females with 2 vehicles (540, making up 44.0%).
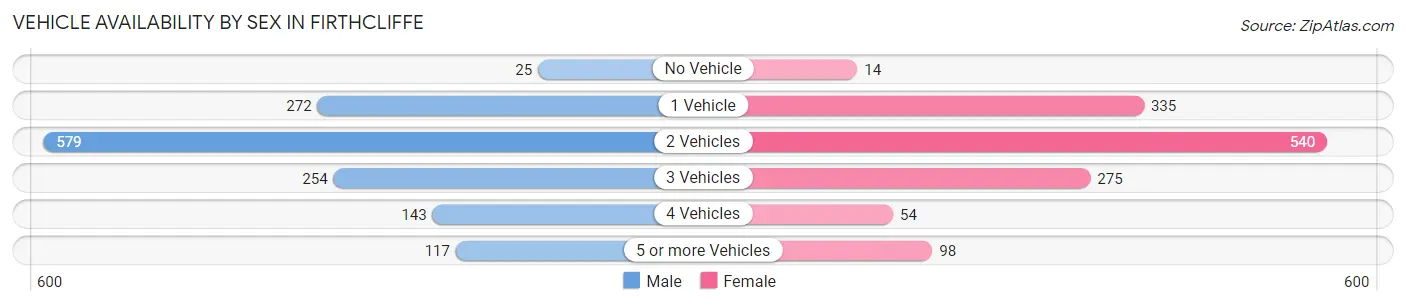
| Vehicles Available | Male | Female |
| No Vehicle | 25 (1.8%) | 14 (1.1%) |
| 1 Vehicle | 272 (19.6%) | 335 (25.5%) |
| 2 Vehicles | 579 (41.6%) | 540 (41.0%) |
| 3 Vehicles | 254 (18.3%) | 275 (20.9%) |
| 4 Vehicles | 143 (10.3%) | 54 (4.1%) |
| 5 or more Vehicles | 117 (8.4%) | 98 (7.4%) |
| Total | 1,390 (100.0%) | 1,316 (100.0%) |
Commute Time in Firthcliffe
The most frequently occuring commute durations in Firthcliffe are 15 to 19 minutes (517 commuters, 20.5%), 5 to 9 minutes (283 commuters, 11.2%), and 10 to 14 minutes (274 commuters, 10.9%).
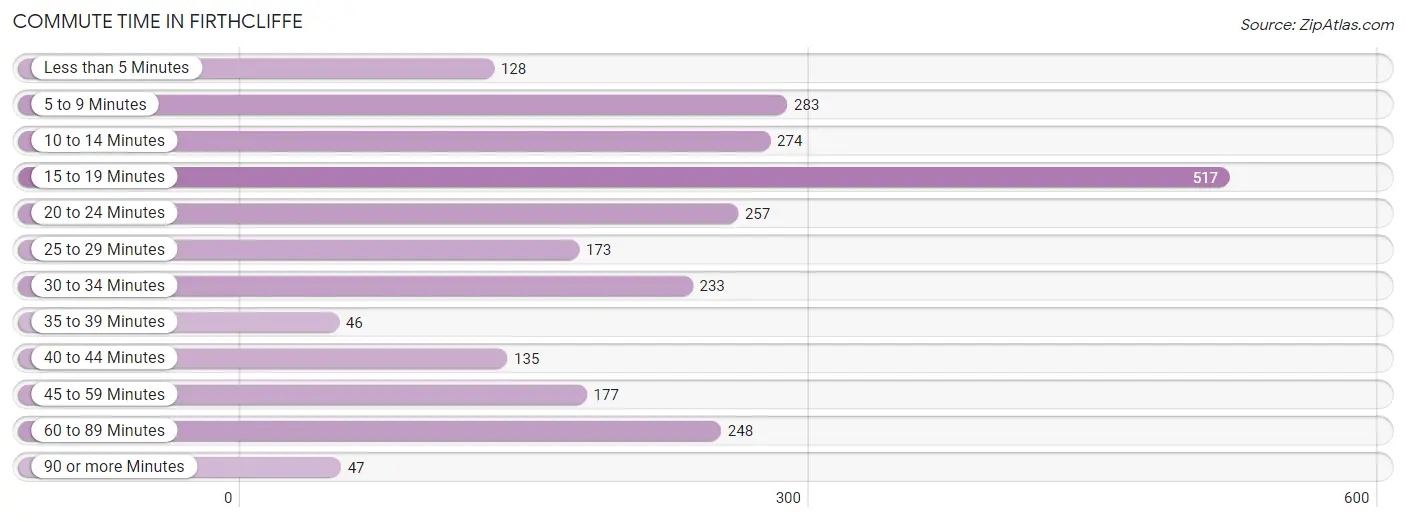
| Commute Time | # Commuters | % Commuters |
| Less than 5 Minutes | 128 | 5.1% |
| 5 to 9 Minutes | 283 | 11.2% |
| 10 to 14 Minutes | 274 | 10.9% |
| 15 to 19 Minutes | 517 | 20.5% |
| 20 to 24 Minutes | 257 | 10.2% |
| 25 to 29 Minutes | 173 | 6.9% |
| 30 to 34 Minutes | 233 | 9.2% |
| 35 to 39 Minutes | 46 | 1.8% |
| 40 to 44 Minutes | 135 | 5.4% |
| 45 to 59 Minutes | 177 | 7.0% |
| 60 to 89 Minutes | 248 | 9.9% |
| 90 or more Minutes | 47 | 1.9% |
Commute Time by Sex in Firthcliffe
The most common commute times in Firthcliffe are 15 to 19 minutes (320 commuters, 25.4%) for males and 15 to 19 minutes (197 commuters, 15.6%) for females.
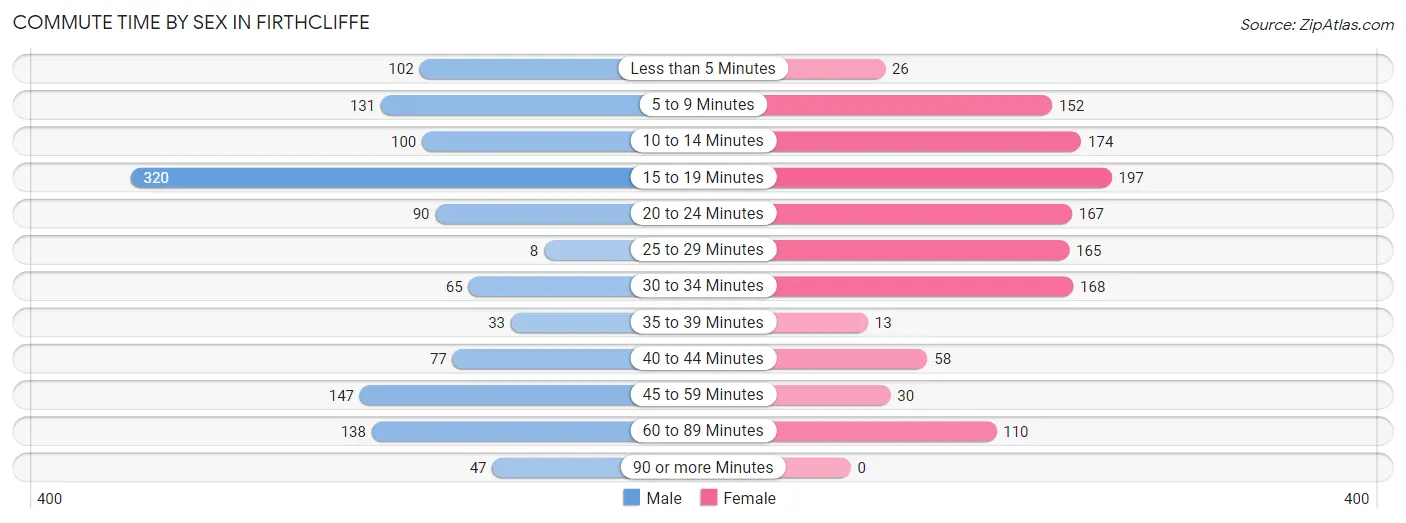
| Commute Time | Male | Female |
| Less than 5 Minutes | 102 (8.1%) | 26 (2.1%) |
| 5 to 9 Minutes | 131 (10.4%) | 152 (12.1%) |
| 10 to 14 Minutes | 100 (8.0%) | 174 (13.8%) |
| 15 to 19 Minutes | 320 (25.4%) | 197 (15.6%) |
| 20 to 24 Minutes | 90 (7.1%) | 167 (13.3%) |
| 25 to 29 Minutes | 8 (0.6%) | 165 (13.1%) |
| 30 to 34 Minutes | 65 (5.2%) | 168 (13.3%) |
| 35 to 39 Minutes | 33 (2.6%) | 13 (1.0%) |
| 40 to 44 Minutes | 77 (6.1%) | 58 (4.6%) |
| 45 to 59 Minutes | 147 (11.7%) | 30 (2.4%) |
| 60 to 89 Minutes | 138 (11.0%) | 110 (8.7%) |
| 90 or more Minutes | 47 (3.7%) | 0 (0.0%) |
Time of Departure to Work by Sex in Firthcliffe
The most frequent times of departure to work in Firthcliffe are 7:30 AM to 7:59 AM (219, 17.4%) for males and 7:30 AM to 7:59 AM (174, 13.8%) for females.
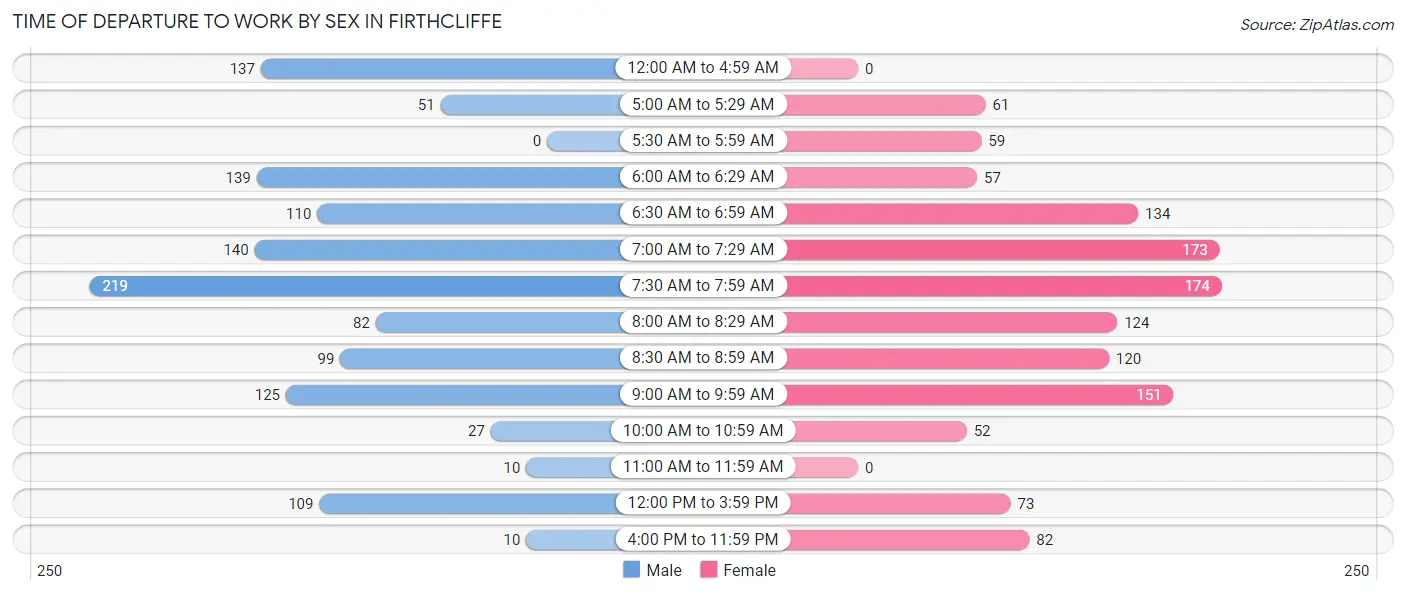
| Time of Departure | Male | Female |
| 12:00 AM to 4:59 AM | 137 (10.9%) | 0 (0.0%) |
| 5:00 AM to 5:29 AM | 51 (4.1%) | 61 (4.8%) |
| 5:30 AM to 5:59 AM | 0 (0.0%) | 59 (4.7%) |
| 6:00 AM to 6:29 AM | 139 (11.1%) | 57 (4.5%) |
| 6:30 AM to 6:59 AM | 110 (8.7%) | 134 (10.6%) |
| 7:00 AM to 7:29 AM | 140 (11.1%) | 173 (13.7%) |
| 7:30 AM to 7:59 AM | 219 (17.4%) | 174 (13.8%) |
| 8:00 AM to 8:29 AM | 82 (6.5%) | 124 (9.8%) |
| 8:30 AM to 8:59 AM | 99 (7.9%) | 120 (9.5%) |
| 9:00 AM to 9:59 AM | 125 (9.9%) | 151 (12.0%) |
| 10:00 AM to 10:59 AM | 27 (2.1%) | 52 (4.1%) |
| 11:00 AM to 11:59 AM | 10 (0.8%) | 0 (0.0%) |
| 12:00 PM to 3:59 PM | 109 (8.7%) | 73 (5.8%) |
| 4:00 PM to 11:59 PM | 10 (0.8%) | 82 (6.5%) |
| Total | 1,258 (100.0%) | 1,260 (100.0%) |
Housing Occupancy in Firthcliffe
Occupancy by Ownership in Firthcliffe
Of the total 2,075 dwellings in Firthcliffe, owner-occupied units account for 1,263 (60.9%), while renter-occupied units make up 812 (39.1%).
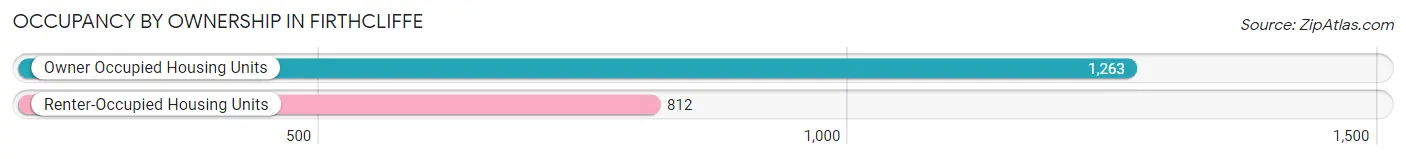
| Occupancy | # Housing Units | % Housing Units |
| Owner Occupied Housing Units | 1,263 | 60.9% |
| Renter-Occupied Housing Units | 812 | 39.1% |
| Total Occupied Housing Units | 2,075 | 100.0% |
Occupancy by Household Size in Firthcliffe
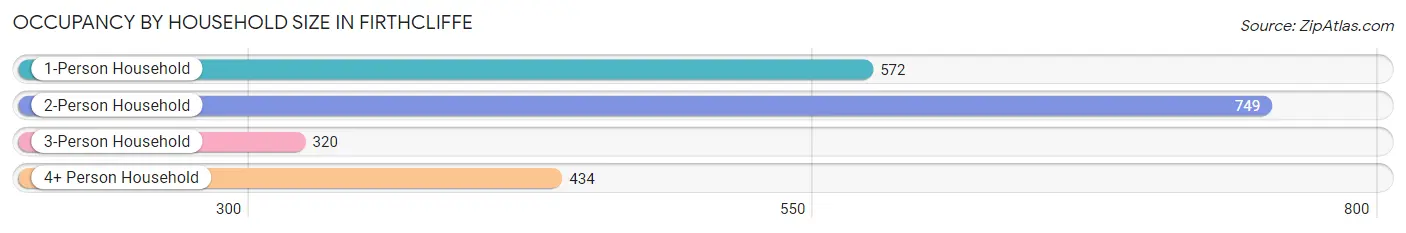
| Household Size | # Housing Units | % Housing Units |
| 1-Person Household | 572 | 27.6% |
| 2-Person Household | 749 | 36.1% |
| 3-Person Household | 320 | 15.4% |
| 4+ Person Household | 434 | 20.9% |
| Total Housing Units | 2,075 | 100.0% |
Occupancy by Ownership by Household Size in Firthcliffe
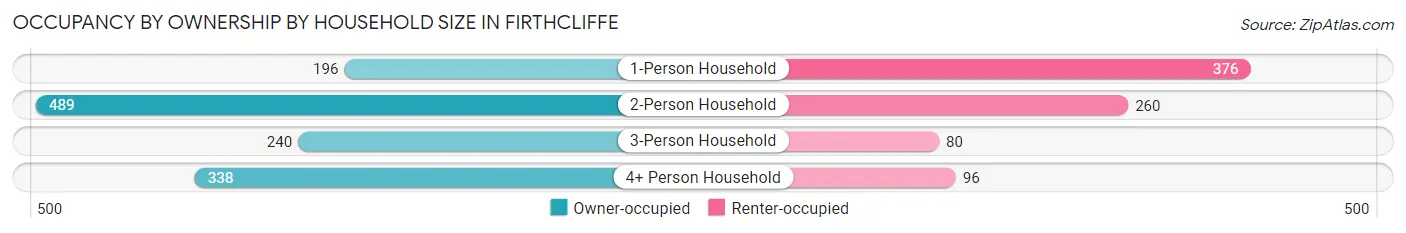
| Household Size | Owner-occupied | Renter-occupied |
| 1-Person Household | 196 (34.3%) | 376 (65.7%) |
| 2-Person Household | 489 (65.3%) | 260 (34.7%) |
| 3-Person Household | 240 (75.0%) | 80 (25.0%) |
| 4+ Person Household | 338 (77.9%) | 96 (22.1%) |
| Total Housing Units | 1,263 (60.9%) | 812 (39.1%) |
Occupancy by Educational Attainment in Firthcliffe
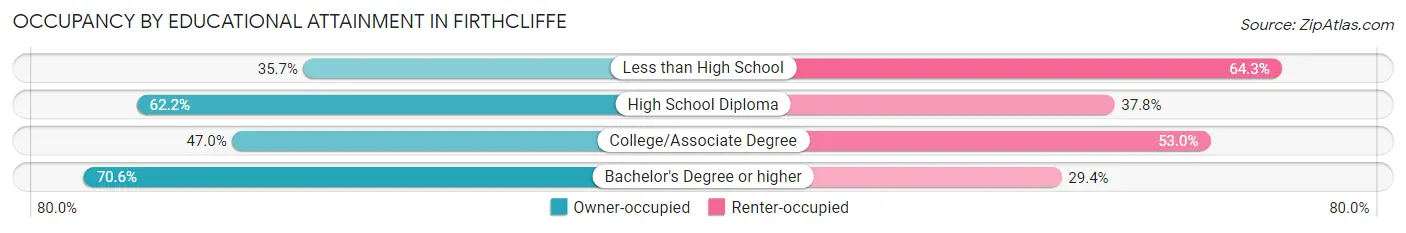
| Household Size | Owner-occupied | Renter-occupied |
| Less than High School | 30 (35.7%) | 54 (64.3%) |
| High School Diploma | 196 (62.2%) | 119 (37.8%) |
| College/Associate Degree | 292 (47.0%) | 329 (53.0%) |
| Bachelor's Degree or higher | 745 (70.6%) | 310 (29.4%) |
Occupancy by Age of Householder in Firthcliffe
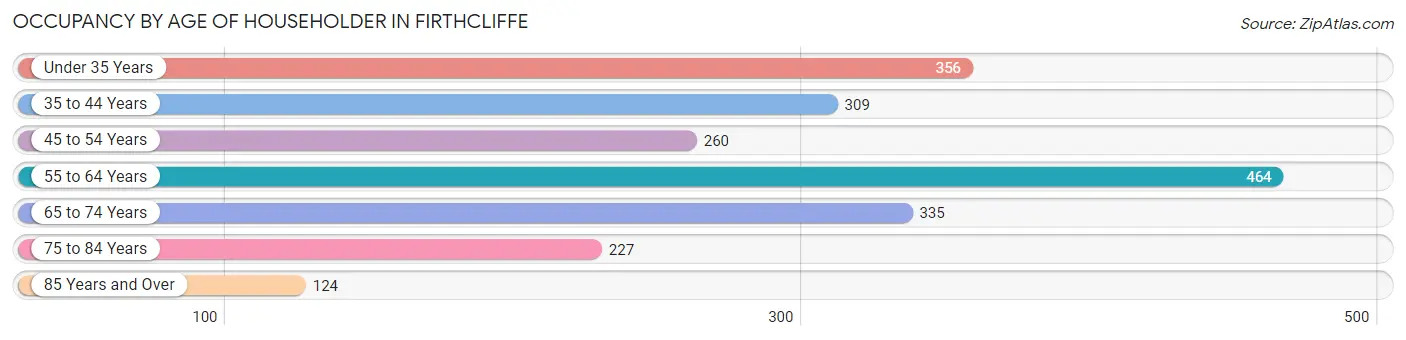
| Age Bracket | # Households | % Households |
| Under 35 Years | 356 | 17.2% |
| 35 to 44 Years | 309 | 14.9% |
| 45 to 54 Years | 260 | 12.5% |
| 55 to 64 Years | 464 | 22.4% |
| 65 to 74 Years | 335 | 16.1% |
| 75 to 84 Years | 227 | 10.9% |
| 85 Years and Over | 124 | 6.0% |
| Total | 2,075 | 100.0% |
Housing Finances in Firthcliffe
Median Income by Occupancy in Firthcliffe
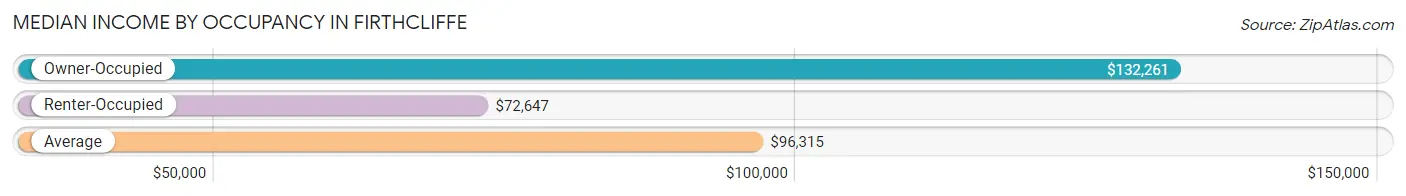
| Occupancy Type | # Households | Median Income |
| Owner-Occupied | 1,263 (60.9%) | $132,261 |
| Renter-Occupied | 812 (39.1%) | $72,647 |
| Average | 2,075 (100.0%) | $96,315 |
Occupancy by Householder Income Bracket in Firthcliffe
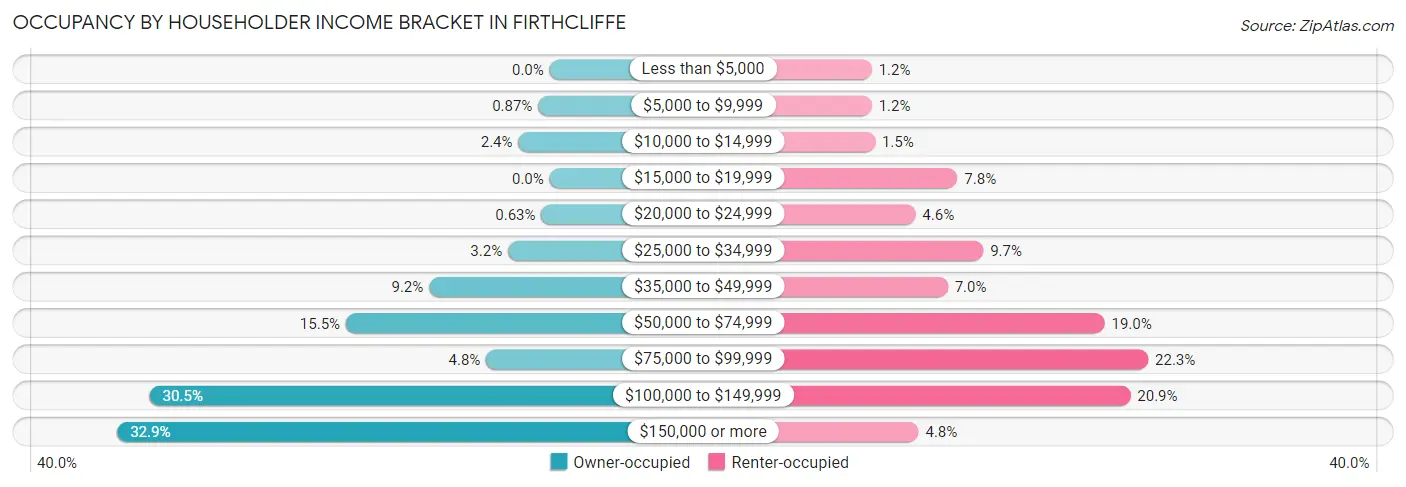
| Income Bracket | Owner-occupied | Renter-occupied |
| Less than $5,000 | 0 (0.0%) | 10 (1.2%) |
| $5,000 to $9,999 | 11 (0.9%) | 10 (1.2%) |
| $10,000 to $14,999 | 30 (2.4%) | 12 (1.5%) |
| $15,000 to $19,999 | 0 (0.0%) | 63 (7.8%) |
| $20,000 to $24,999 | 8 (0.6%) | 37 (4.6%) |
| $25,000 to $34,999 | 40 (3.2%) | 79 (9.7%) |
| $35,000 to $49,999 | 116 (9.2%) | 57 (7.0%) |
| $50,000 to $74,999 | 196 (15.5%) | 154 (19.0%) |
| $75,000 to $99,999 | 61 (4.8%) | 181 (22.3%) |
| $100,000 to $149,999 | 385 (30.5%) | 170 (20.9%) |
| $150,000 or more | 416 (32.9%) | 39 (4.8%) |
| Total | 1,263 (100.0%) | 812 (100.0%) |
Monthly Housing Cost Tiers in Firthcliffe
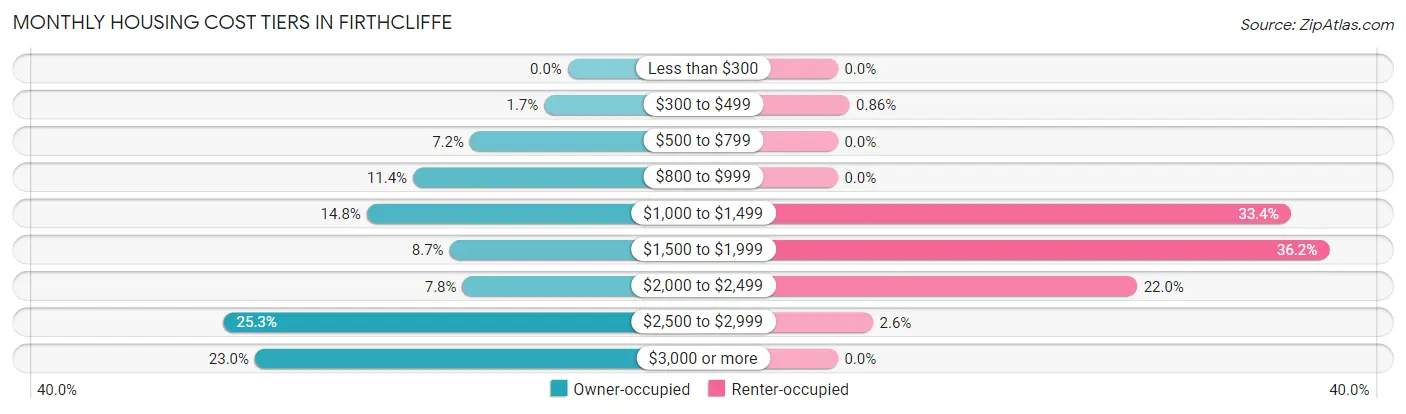
| Monthly Cost | Owner-occupied | Renter-occupied |
| Less than $300 | 0 (0.0%) | 0 (0.0%) |
| $300 to $499 | 22 (1.7%) | 7 (0.9%) |
| $500 to $799 | 91 (7.2%) | 0 (0.0%) |
| $800 to $999 | 144 (11.4%) | 0 (0.0%) |
| $1,000 to $1,499 | 187 (14.8%) | 271 (33.4%) |
| $1,500 to $1,999 | 110 (8.7%) | 294 (36.2%) |
| $2,000 to $2,499 | 98 (7.8%) | 179 (22.0%) |
| $2,500 to $2,999 | 320 (25.3%) | 21 (2.6%) |
| $3,000 or more | 291 (23.0%) | 0 (0.0%) |
| Total | 1,263 (100.0%) | 812 (100.0%) |
Physical Housing Characteristics in Firthcliffe
Housing Structures in Firthcliffe
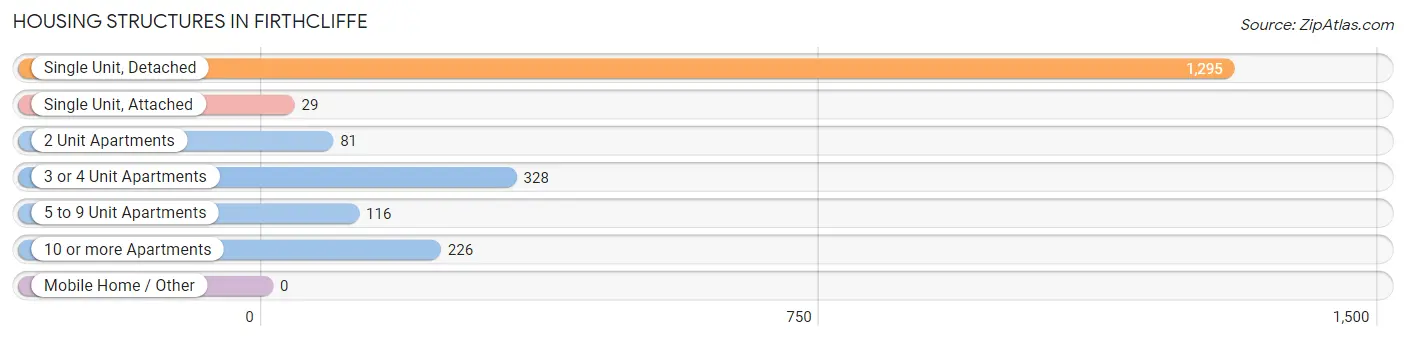
| Structure Type | # Housing Units | % Housing Units |
| Single Unit, Detached | 1,295 | 62.4% |
| Single Unit, Attached | 29 | 1.4% |
| 2 Unit Apartments | 81 | 3.9% |
| 3 or 4 Unit Apartments | 328 | 15.8% |
| 5 to 9 Unit Apartments | 116 | 5.6% |
| 10 or more Apartments | 226 | 10.9% |
| Mobile Home / Other | 0 | 0.0% |
| Total | 2,075 | 100.0% |
Housing Structures by Occupancy in Firthcliffe
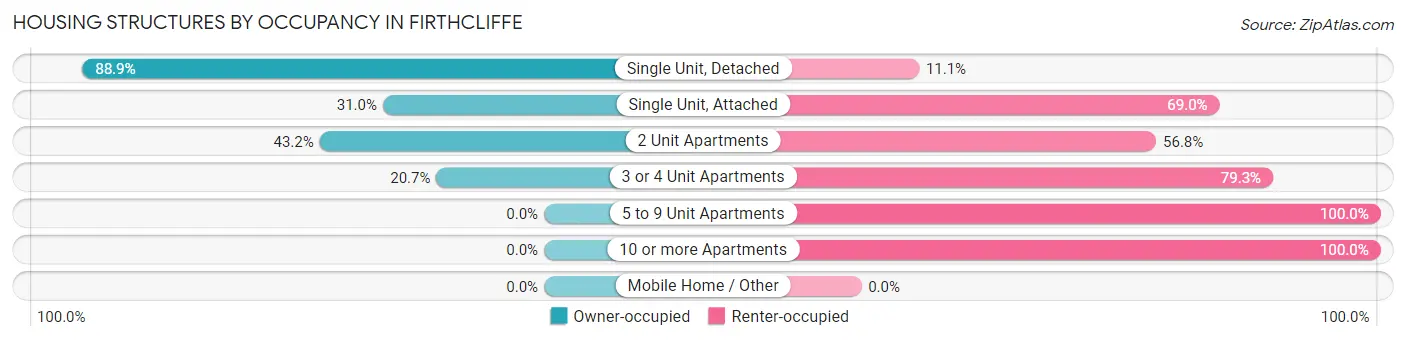
| Structure Type | Owner-occupied | Renter-occupied |
| Single Unit, Detached | 1,151 (88.9%) | 144 (11.1%) |
| Single Unit, Attached | 9 (31.0%) | 20 (69.0%) |
| 2 Unit Apartments | 35 (43.2%) | 46 (56.8%) |
| 3 or 4 Unit Apartments | 68 (20.7%) | 260 (79.3%) |
| 5 to 9 Unit Apartments | 0 (0.0%) | 116 (100.0%) |
| 10 or more Apartments | 0 (0.0%) | 226 (100.0%) |
| Mobile Home / Other | 0 (0.0%) | 0 (0.0%) |
| Total | 1,263 (60.9%) | 812 (39.1%) |
Housing Structures by Number of Rooms in Firthcliffe
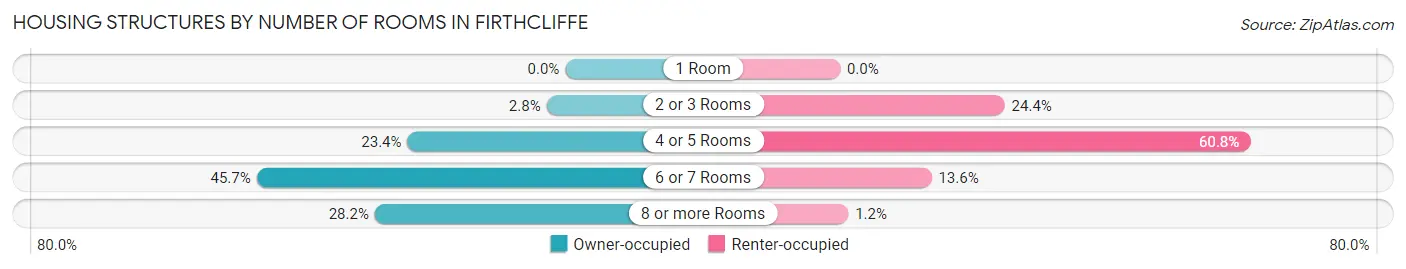
| Number of Rooms | Owner-occupied | Renter-occupied |
| 1 Room | 0 (0.0%) | 0 (0.0%) |
| 2 or 3 Rooms | 35 (2.8%) | 198 (24.4%) |
| 4 or 5 Rooms | 295 (23.4%) | 494 (60.8%) |
| 6 or 7 Rooms | 577 (45.7%) | 110 (13.6%) |
| 8 or more Rooms | 356 (28.2%) | 10 (1.2%) |
| Total | 1,263 (100.0%) | 812 (100.0%) |
Housing Structure by Heating Type in Firthcliffe
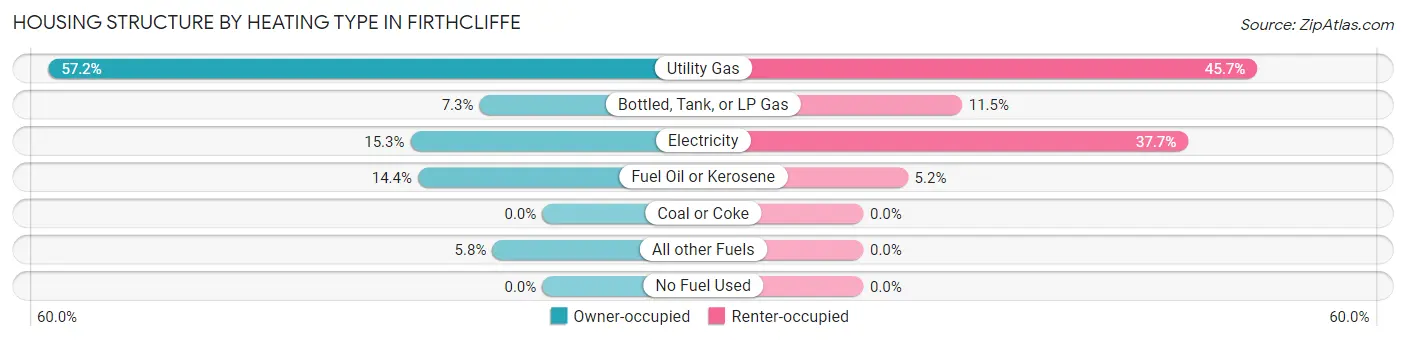
| Heating Type | Owner-occupied | Renter-occupied |
| Utility Gas | 723 (57.2%) | 371 (45.7%) |
| Bottled, Tank, or LP Gas | 92 (7.3%) | 93 (11.5%) |
| Electricity | 193 (15.3%) | 306 (37.7%) |
| Fuel Oil or Kerosene | 182 (14.4%) | 42 (5.2%) |
| Coal or Coke | 0 (0.0%) | 0 (0.0%) |
| All other Fuels | 73 (5.8%) | 0 (0.0%) |
| No Fuel Used | 0 (0.0%) | 0 (0.0%) |
| Total | 1,263 (100.0%) | 812 (100.0%) |
Household Vehicle Usage in Firthcliffe
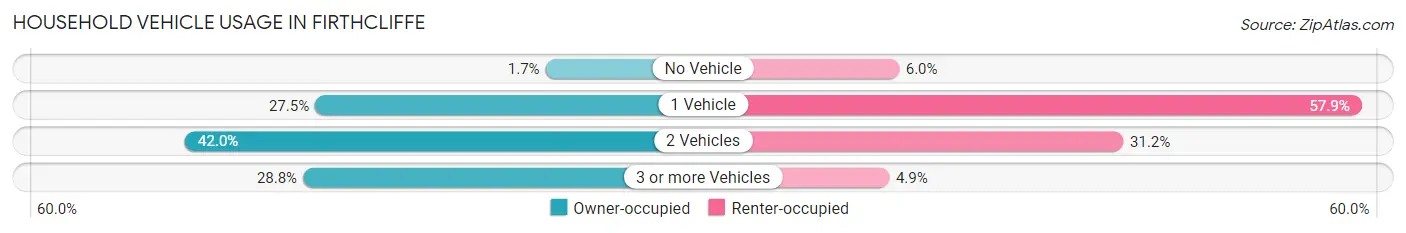
| Vehicles per Household | Owner-occupied | Renter-occupied |
| No Vehicle | 21 (1.7%) | 49 (6.0%) |
| 1 Vehicle | 347 (27.5%) | 470 (57.9%) |
| 2 Vehicles | 531 (42.0%) | 253 (31.2%) |
| 3 or more Vehicles | 364 (28.8%) | 40 (4.9%) |
| Total | 1,263 (100.0%) | 812 (100.0%) |
Real Estate & Mortgages in Firthcliffe
Real Estate and Mortgage Overview in Firthcliffe
| Characteristic | Without Mortgage | With Mortgage |
| Housing Units | 394 | 869 |
| Median Property Value | $282,500 | $367,200 |
| Median Household Income | $70,781 | $377 |
| Monthly Housing Costs | $1,028 | $291 |
| Real Estate Taxes | $7,371 | $0 |
Property Value by Mortgage Status in Firthcliffe
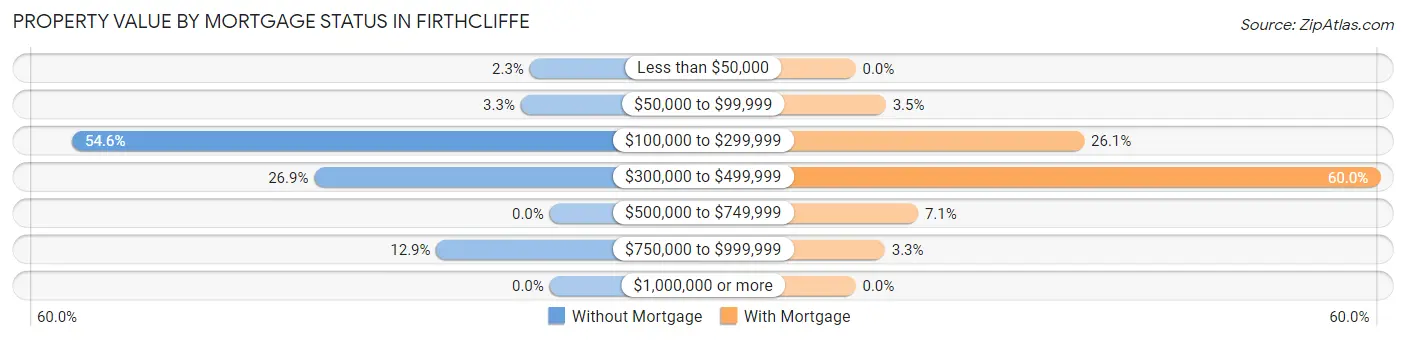
| Property Value | Without Mortgage | With Mortgage |
| Less than $50,000 | 9 (2.3%) | 0 (0.0%) |
| $50,000 to $99,999 | 13 (3.3%) | 30 (3.5%) |
| $100,000 to $299,999 | 215 (54.6%) | 227 (26.1%) |
| $300,000 to $499,999 | 106 (26.9%) | 521 (60.0%) |
| $500,000 to $749,999 | 0 (0.0%) | 62 (7.1%) |
| $750,000 to $999,999 | 51 (12.9%) | 29 (3.3%) |
| $1,000,000 or more | 0 (0.0%) | 0 (0.0%) |
| Total | 394 (100.0%) | 869 (100.0%) |
Household Income by Mortgage Status in Firthcliffe
| Household Income | Without Mortgage | With Mortgage |
| Less than $10,000 | 11 (2.8%) | 27 (3.1%) |
| $10,000 to $24,999 | 8 (2.0%) | 0 (0.0%) |
| $25,000 to $34,999 | 29 (7.4%) | 30 (3.5%) |
| $35,000 to $49,999 | 41 (10.4%) | 11 (1.3%) |
| $50,000 to $74,999 | 130 (33.0%) | 75 (8.6%) |
| $75,000 to $99,999 | 18 (4.6%) | 66 (7.6%) |
| $100,000 to $149,999 | 118 (29.9%) | 43 (5.0%) |
| $150,000 or more | 39 (9.9%) | 267 (30.7%) |
| Total | 394 (100.0%) | 869 (100.0%) |
Property Value to Household Income Ratio in Firthcliffe
| Value-to-Income Ratio | Without Mortgage | With Mortgage |
| Less than 2.0x | 84 (21.3%) | 143,071 (16,463.9%) |
| 2.0x to 2.9x | 51 (12.9%) | 184 (21.2%) |
| 3.0x to 3.9x | 48 (12.2%) | 389 (44.8%) |
| 4.0x or more | 211 (53.5%) | 132 (15.2%) |
| Total | 394 (100.0%) | 869 (100.0%) |
Real Estate Taxes by Mortgage Status in Firthcliffe
| Property Taxes | Without Mortgage | With Mortgage |
| Less than $800 | 9 (2.3%) | 0 (0.0%) |
| $800 to $1,499 | 8 (2.0%) | 0 (0.0%) |
| $800 to $1,499 | 364 (92.4%) | 0 (0.0%) |
| Total | 394 (100.0%) | 869 (100.0%) |
Health & Disability in Firthcliffe
Health Insurance Coverage by Age in Firthcliffe
| Age Bracket | With Coverage | Without Coverage |
| Under 6 Years | 413 (100.0%) | 0 (0.0%) |
| 6 to 18 Years | 783 (100.0%) | 0 (0.0%) |
| 19 to 25 Years | 318 (100.0%) | 0 (0.0%) |
| 26 to 34 Years | 548 (87.7%) | 77 (12.3%) |
| 35 to 44 Years | 601 (98.2%) | 11 (1.8%) |
| 45 to 54 Years | 547 (94.6%) | 31 (5.4%) |
| 55 to 64 Years | 793 (94.7%) | 44 (5.3%) |
| 65 to 74 Years | 650 (100.0%) | 0 (0.0%) |
| 75 Years and older | 415 (100.0%) | 0 (0.0%) |
| Total | 5,068 (96.9%) | 163 (3.1%) |
Health Insurance Coverage by Citizenship Status in Firthcliffe
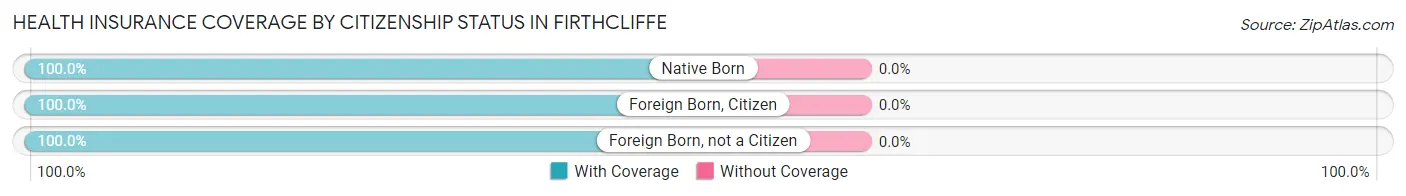
| Citizenship Status | With Coverage | Without Coverage |
| Native Born | 413 (100.0%) | 0 (0.0%) |
| Foreign Born, Citizen | 783 (100.0%) | 0 (0.0%) |
| Foreign Born, not a Citizen | 318 (100.0%) | 0 (0.0%) |
Health Insurance Coverage by Household Income in Firthcliffe
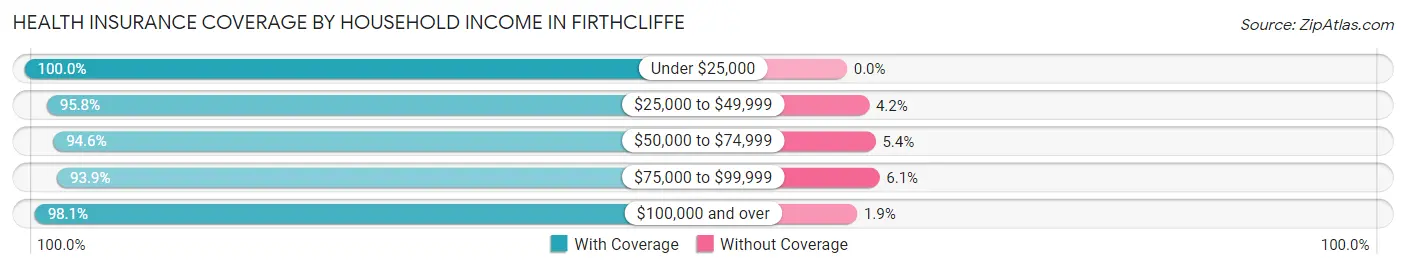
| Household Income | With Coverage | Without Coverage |
| Under $25,000 | 199 (100.0%) | 0 (0.0%) |
| $25,000 to $49,999 | 576 (95.8%) | 25 (4.2%) |
| $50,000 to $74,999 | 617 (94.6%) | 35 (5.4%) |
| $75,000 to $99,999 | 708 (93.9%) | 46 (6.1%) |
| $100,000 and over | 2,940 (98.1%) | 57 (1.9%) |
Public vs Private Health Insurance Coverage by Age in Firthcliffe
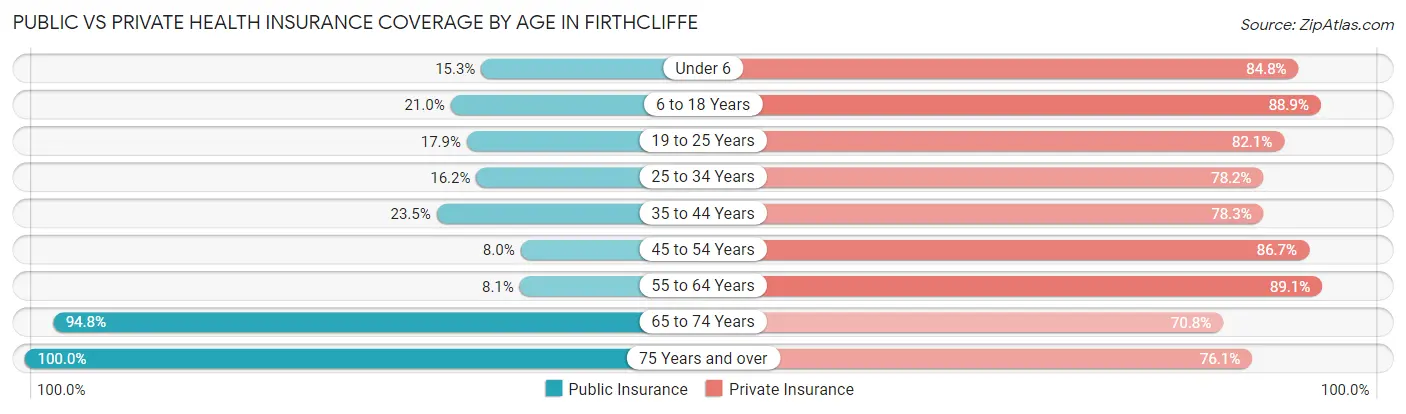
| Age Bracket | Public Insurance | Private Insurance |
| Under 6 | 63 (15.2%) | 350 (84.8%) |
| 6 to 18 Years | 164 (20.9%) | 696 (88.9%) |
| 19 to 25 Years | 57 (17.9%) | 261 (82.1%) |
| 25 to 34 Years | 101 (16.2%) | 489 (78.2%) |
| 35 to 44 Years | 144 (23.5%) | 479 (78.3%) |
| 45 to 54 Years | 46 (8.0%) | 501 (86.7%) |
| 55 to 64 Years | 68 (8.1%) | 746 (89.1%) |
| 65 to 74 Years | 616 (94.8%) | 460 (70.8%) |
| 75 Years and over | 415 (100.0%) | 316 (76.1%) |
| Total | 1,674 (32.0%) | 4,298 (82.2%) |
Disability Status by Sex by Age in Firthcliffe
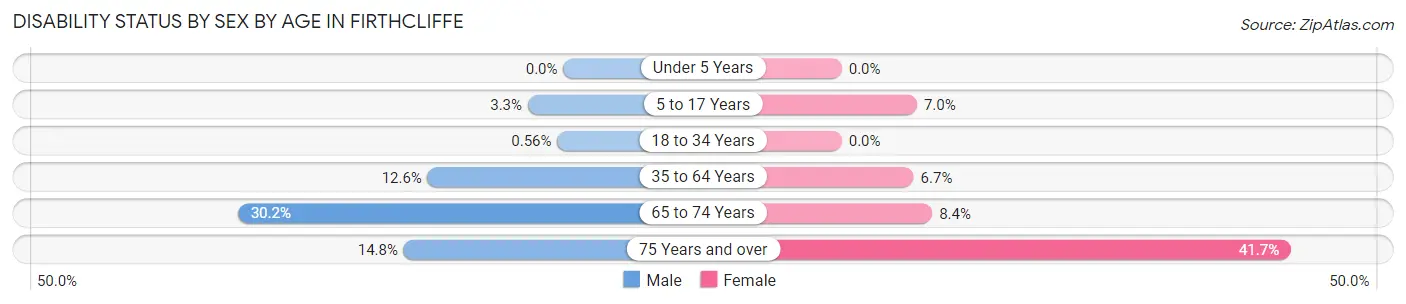
| Age Bracket | Male | Female |
| Under 5 Years | 0 (0.0%) | 0 (0.0%) |
| 5 to 17 Years | 13 (3.3%) | 28 (7.0%) |
| 18 to 34 Years | 3 (0.6%) | 0 (0.0%) |
| 35 to 64 Years | 123 (12.6%) | 70 (6.7%) |
| 65 to 74 Years | 110 (30.2%) | 24 (8.4%) |
| 75 Years and over | 16 (14.8%) | 128 (41.7%) |
Disability Class by Sex by Age in Firthcliffe
Disability Class: Hearing Difficulty
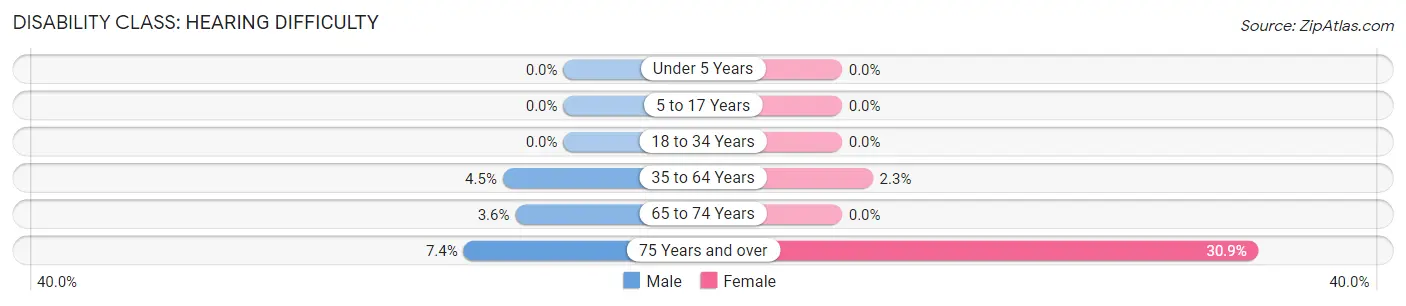
| Age Bracket | Male | Female |
| Under 5 Years | 0 (0.0%) | 0 (0.0%) |
| 5 to 17 Years | 0 (0.0%) | 0 (0.0%) |
| 18 to 34 Years | 0 (0.0%) | 0 (0.0%) |
| 35 to 64 Years | 44 (4.5%) | 24 (2.3%) |
| 65 to 74 Years | 13 (3.6%) | 0 (0.0%) |
| 75 Years and over | 8 (7.4%) | 95 (30.9%) |
Disability Class: Vision Difficulty
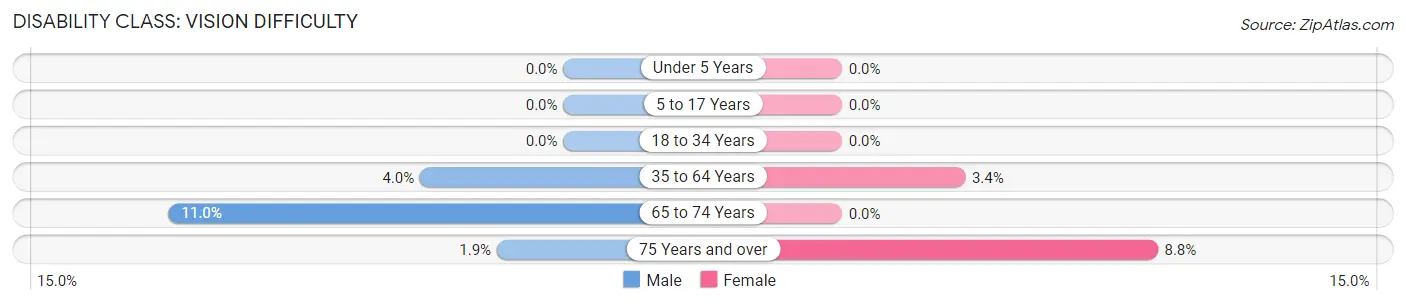
| Age Bracket | Male | Female |
| Under 5 Years | 0 (0.0%) | 0 (0.0%) |
| 5 to 17 Years | 0 (0.0%) | 0 (0.0%) |
| 18 to 34 Years | 0 (0.0%) | 0 (0.0%) |
| 35 to 64 Years | 39 (4.0%) | 36 (3.4%) |
| 65 to 74 Years | 40 (11.0%) | 0 (0.0%) |
| 75 Years and over | 2 (1.8%) | 27 (8.8%) |
Disability Class: Cognitive Difficulty
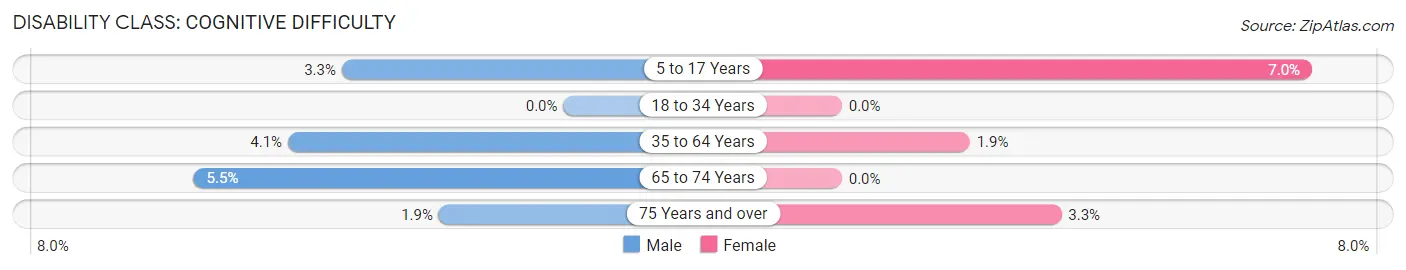
| Age Bracket | Male | Female |
| 5 to 17 Years | 13 (3.3%) | 28 (7.0%) |
| 18 to 34 Years | 0 (0.0%) | 0 (0.0%) |
| 35 to 64 Years | 40 (4.1%) | 20 (1.9%) |
| 65 to 74 Years | 20 (5.5%) | 0 (0.0%) |
| 75 Years and over | 2 (1.8%) | 10 (3.3%) |
Disability Class: Ambulatory Difficulty
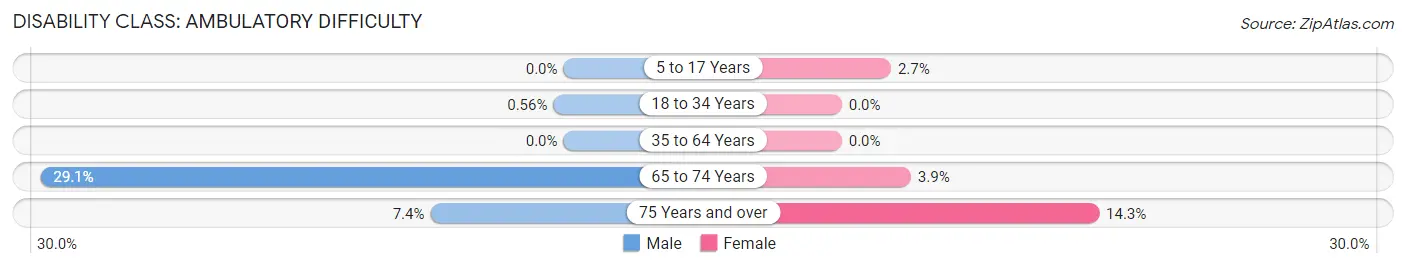
| Age Bracket | Male | Female |
| 5 to 17 Years | 0 (0.0%) | 11 (2.7%) |
| 18 to 34 Years | 3 (0.6%) | 0 (0.0%) |
| 35 to 64 Years | 0 (0.0%) | 0 (0.0%) |
| 65 to 74 Years | 106 (29.1%) | 11 (3.8%) |
| 75 Years and over | 8 (7.4%) | 44 (14.3%) |
Disability Class: Self-Care Difficulty
| Age Bracket | Male | Female |
| 5 to 17 Years | 0 (0.0%) | 11 (2.7%) |
| 18 to 34 Years | 3 (0.6%) | 0 (0.0%) |
| 35 to 64 Years | 4 (0.4%) | 0 (0.0%) |
| 65 to 74 Years | 8 (2.2%) | 0 (0.0%) |
| 75 Years and over | 2 (1.8%) | 27 (8.8%) |
Technology Access in Firthcliffe
Computing Device Access in Firthcliffe
| Device Type | # Households | % Households |
| Desktop or Laptop | 1,698 | 81.8% |
| Smartphone | 1,759 | 84.8% |
| Tablet | 1,437 | 69.3% |
| No Computing Device | 131 | 6.3% |
| Total | 2,075 | 100.0% |
Internet Access in Firthcliffe
| Internet Type | # Households | % Households |
| Dial-Up Internet | 0 | 0.0% |
| Broadband Home | 1,637 | 78.9% |
| Cellular Data Only | 224 | 10.8% |
| Satellite Internet | 0 | 0.0% |
| No Internet | 179 | 8.6% |
| Total | 2,075 | 100.0% |
Firthcliffe Summary
Firthcliffe is a hamlet located in the Town of Newburgh in Orange County, New York. It is situated on the west bank of the Hudson River, just north of the City of Newburgh. The hamlet is bordered by the Town of Newburgh to the north, the City of Newburgh to the south, and the Town of New Windsor to the east.
History
Firthcliffe was originally part of the Town of Newburgh, and was known as the “Firthcliffe District”. The name is derived from the Firth family, who were among the earliest settlers in the area. The Firth family owned a large tract of land in the area, and the district was named after them.
The Firthcliffe District was established in 1809, and the first post office was established in 1820. The hamlet was officially incorporated in 1845.
In the late 19th century, Firthcliffe was a popular summer resort destination for wealthy New Yorkers. The hamlet was home to several large estates, including the Firthcliffe Estate, which was owned by the Firth family. The estate was later purchased by the City of Newburgh and is now part of the Firthcliffe Park.
Geography
Firthcliffe is located in the Hudson Valley region of New York State. The hamlet is situated on the west bank of the Hudson River, just north of the City of Newburgh. The hamlet is bordered by the Town of Newburgh to the north, the City of Newburgh to the south, and the Town of New Windsor to the east.
The terrain of Firthcliffe is mostly flat, with some rolling hills. The hamlet is located in a temperate climate, with hot summers and cold winters.
Economy
The economy of Firthcliffe is largely based on tourism and retail. The hamlet is home to several small businesses, including restaurants, shops, and galleries. The hamlet is also home to several large estates, which are popular tourist attractions.
The hamlet is also home to several industrial and manufacturing businesses. The largest employer in the hamlet is the Firthcliffe Industrial Park, which is home to several large companies.
Demographics
As of the 2010 census, the population of Firthcliffe was 2,845. The racial makeup of the hamlet was 87.3% White, 8.2% African American, 0.7% Native American, 0.7% Asian, and 2.1% from other races. Hispanic or Latino of any race were 5.2% of the population.
The median household income in Firthcliffe was $50,945, and the median family income was $60,945. The per capita income was $25,945. About 8.2% of families and 10.2% of the population were below the poverty line.
Common Questions
What is Per Capita Income in Firthcliffe?
Per Capita income in Firthcliffe is $45,289.
What is the Median Family Income in Firthcliffe?
Median Family Income in Firthcliffe is $130,245.
What is the Median Household income in Firthcliffe?
Median Household Income in Firthcliffe is $96,315.
What is Income or Wage Gap in Firthcliffe?
Income or Wage Gap in Firthcliffe is 35.6%.
Women in Firthcliffe earn 64.4 cents for every dollar earned by a man.
What is Inequality or Gini Index in Firthcliffe?
Inequality or Gini Index in Firthcliffe is 0.37.
What is the Total Population of Firthcliffe?
Total Population of Firthcliffe is 5,264.
What is the Total Male Population of Firthcliffe?
Total Male Population of Firthcliffe is 2,492.
What is the Total Female Population of Firthcliffe?
Total Female Population of Firthcliffe is 2,772.
What is the Ratio of Males per 100 Females in Firthcliffe?
There are 89.90 Males per 100 Females in Firthcliffe.
What is the Ratio of Females per 100 Males in Firthcliffe?
There are 111.24 Females per 100 Males in Firthcliffe.
What is the Median Population Age in Firthcliffe?
Median Population Age in Firthcliffe is 41.7 Years.
What is the Average Family Size in Firthcliffe
Average Family Size in Firthcliffe is 3.2 People.
What is the Average Household Size in Firthcliffe
Average Household Size in Firthcliffe is 2.5 People.
How Large is the Labor Force in Firthcliffe?
There are 2,834 People in the Labor Forcein in Firthcliffe.
What is the Percentage of People in the Labor Force in Firthcliffe?
66.5% of People are in the Labor Force in Firthcliffe.
What is the Unemployment Rate in Firthcliffe?
Unemployment Rate in Firthcliffe is 3.6%.