Callicoon, NY Map & Demographics
Callicoon Map
Callicoon Overview
$52,453
PER CAPITA INCOME
$86,458
AVG FAMILY INCOME
$70,500
AVG HOUSEHOLD INCOME
0.37
INEQUALITY / GINI INDEX
225
TOTAL POPULATION
135
MALE POPULATION
90
FEMALE POPULATION
150.00
MALES / 100 FEMALES
66.67
FEMALES / 100 MALES
59.2
MEDIAN AGE
2.5
AVG FAMILY SIZE
1.8
AVG HOUSEHOLD SIZE
122
LABOR FORCE [ PEOPLE ]
60.1%
PERCENT IN LABOR FORCE
18.0%
UNEMPLOYMENT RATE
Callicoon Zip Codes
Callicoon Area Codes
Income in Callicoon
Income Overview in Callicoon
Per Capita Income in Callicoon is $52,453, while median incomes of families and households are $86,458 and $70,500 respectively.
| Characteristic | Number | Measure |
| Per Capita Income | 225 | $52,453 |
| Median Family Income | 67 | $86,458 |
| Mean Family Income | 67 | $114,309 |
| Median Household Income | 126 | $70,500 |
| Mean Household Income | 126 | $95,331 |
| Income Deficit | 67 | $0 |
| Wage / Income Gap (%) | 225 | 0.00% |
| Wage / Income Gap ($) | 225 | 100.00¢ per $1 |
| Gini / Inequality Index | 225 | 0.37 |
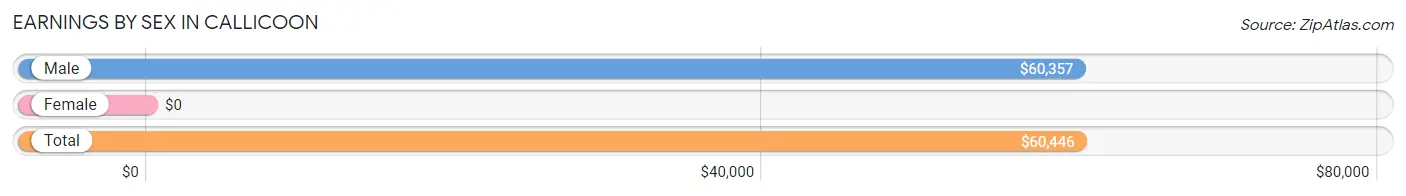
Earnings by Sex in Callicoon
| Sex | Number | Average Earnings |
| Male | 84 (66.1%) | $60,357 |
| Female | 43 (33.9%) | $0 |
| Total | 127 (100.0%) | $60,446 |
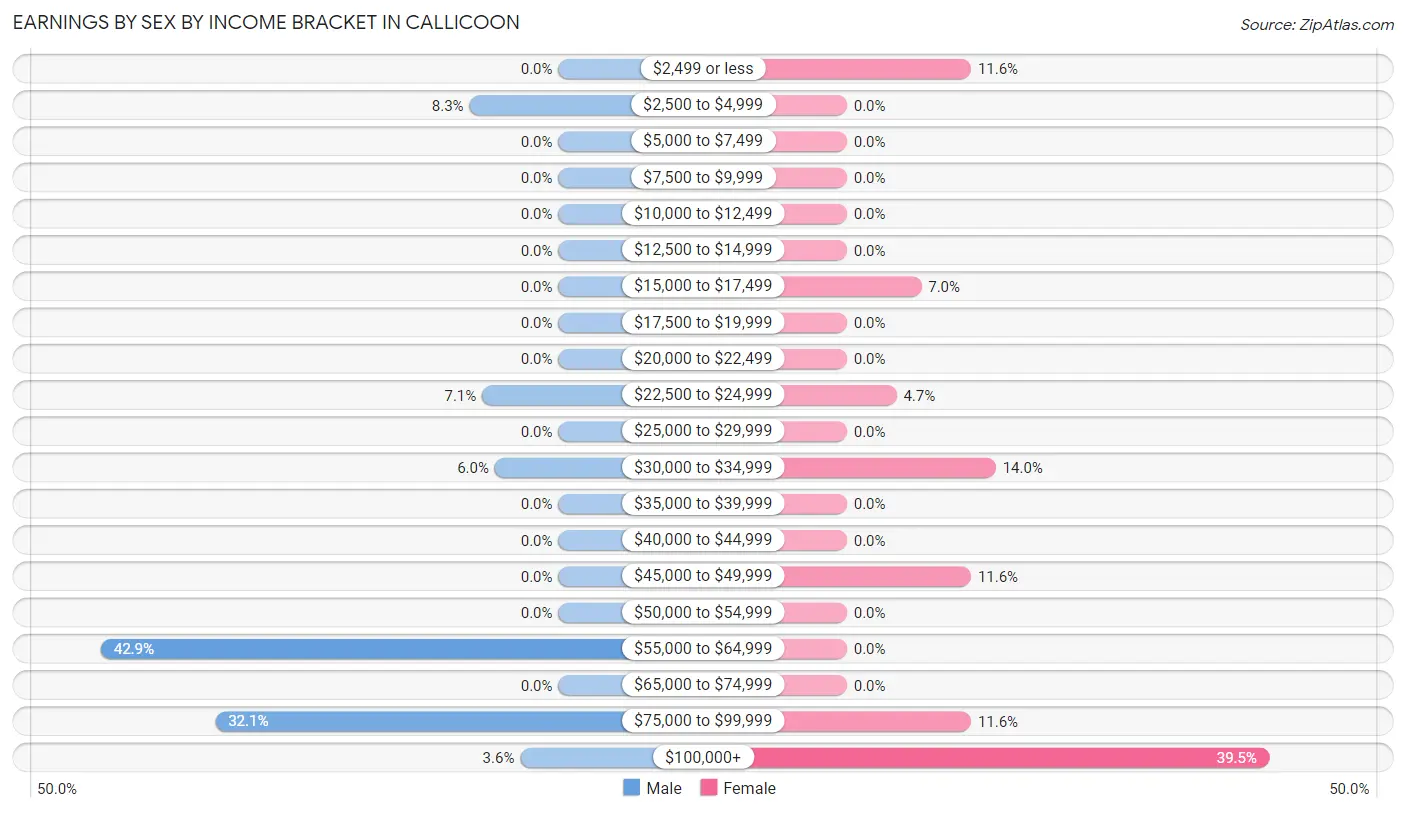
Earnings by Sex by Income Bracket in Callicoon
The most common earnings brackets in Callicoon are $55,000 to $64,999 for men (36 | 42.9%) and $100,000+ for women (17 | 39.5%).
| Income | Male | Female |
| $2,499 or less | 0 (0.0%) | 5 (11.6%) |
| $2,500 to $4,999 | 7 (8.3%) | 0 (0.0%) |
| $5,000 to $7,499 | 0 (0.0%) | 0 (0.0%) |
| $7,500 to $9,999 | 0 (0.0%) | 0 (0.0%) |
| $10,000 to $12,499 | 0 (0.0%) | 0 (0.0%) |
| $12,500 to $14,999 | 0 (0.0%) | 0 (0.0%) |
| $15,000 to $17,499 | 0 (0.0%) | 3 (7.0%) |
| $17,500 to $19,999 | 0 (0.0%) | 0 (0.0%) |
| $20,000 to $22,499 | 0 (0.0%) | 0 (0.0%) |
| $22,500 to $24,999 | 6 (7.1%) | 2 (4.6%) |
| $25,000 to $29,999 | 0 (0.0%) | 0 (0.0%) |
| $30,000 to $34,999 | 5 (5.9%) | 6 (14.0%) |
| $35,000 to $39,999 | 0 (0.0%) | 0 (0.0%) |
| $40,000 to $44,999 | 0 (0.0%) | 0 (0.0%) |
| $45,000 to $49,999 | 0 (0.0%) | 5 (11.6%) |
| $50,000 to $54,999 | 0 (0.0%) | 0 (0.0%) |
| $55,000 to $64,999 | 36 (42.9%) | 0 (0.0%) |
| $65,000 to $74,999 | 0 (0.0%) | 0 (0.0%) |
| $75,000 to $99,999 | 27 (32.1%) | 5 (11.6%) |
| $100,000+ | 3 (3.6%) | 17 (39.5%) |
| Total | 84 (100.0%) | 43 (100.0%) |
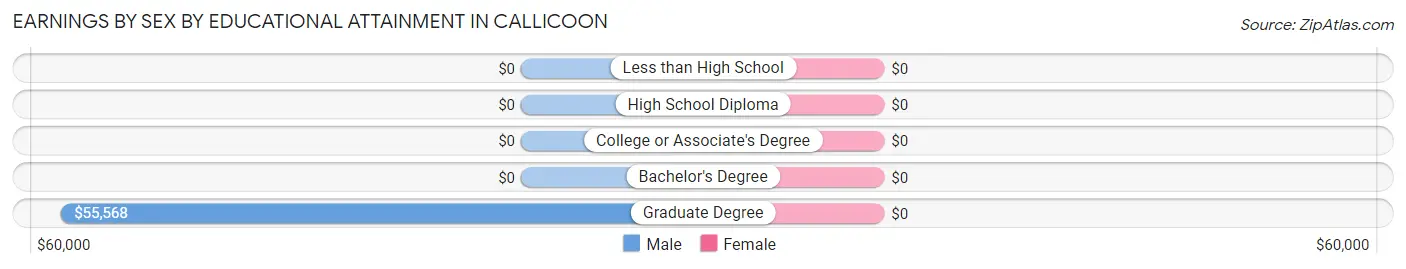
Earnings by Sex by Educational Attainment in Callicoon
| Educational Attainment | Male Income | Female Income |
| Less than High School | - | - |
| High School Diploma | - | - |
| College or Associate's Degree | - | - |
| Bachelor's Degree | - | - |
| Graduate Degree | $55,568 | $0 |
| Total | $60,357 | $99,000 |
Family Income in Callicoon
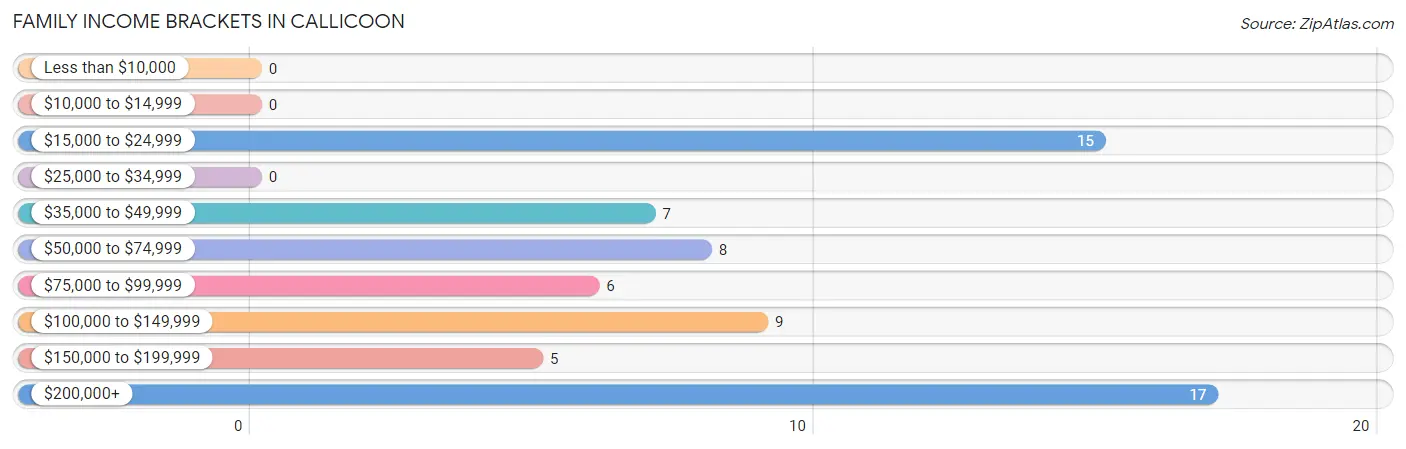
Family Income Brackets in Callicoon
According to the Callicoon family income data, there are 17 families falling into the $200,000+ income range, which is the most common income bracket and makes up 25.4% of all families.
| Income Bracket | # Families | % Families |
| Less than $10,000 | 0 | 0.0% |
| $10,000 to $14,999 | 0 | 0.0% |
| $15,000 to $24,999 | 15 | 22.4% |
| $25,000 to $34,999 | 0 | 0.0% |
| $35,000 to $49,999 | 7 | 10.4% |
| $50,000 to $74,999 | 8 | 11.9% |
| $75,000 to $99,999 | 6 | 9.0% |
| $100,000 to $149,999 | 9 | 13.4% |
| $150,000 to $199,999 | 5 | 7.5% |
| $200,000+ | 17 | 25.4% |
Family Income by Famaliy Size in Callicoon
| Income Bracket | # Families | Median Income |
| 2-Person Families | 45 (67.2%) | $0 |
| 3-Person Families | 11 (16.4%) | $0 |
| 4-Person Families | 11 (16.4%) | $0 |
| 5-Person Families | 0 (0.0%) | $0 |
| 6-Person Families | 0 (0.0%) | $0 |
| 7+ Person Families | 0 (0.0%) | $0 |
| Total | 67 (100.0%) | $86,458 |
Family Income by Number of Earners in Callicoon
| Number of Earners | # Families | Median Income |
| No Earners | 23 (34.3%) | $0 |
| 1 Earner | 0 (0.0%) | $0 |
| 2 Earners | 39 (58.2%) | $0 |
| 3+ Earners | 5 (7.5%) | $0 |
| Total | 67 (100.0%) | $86,458 |
Household Income in Callicoon
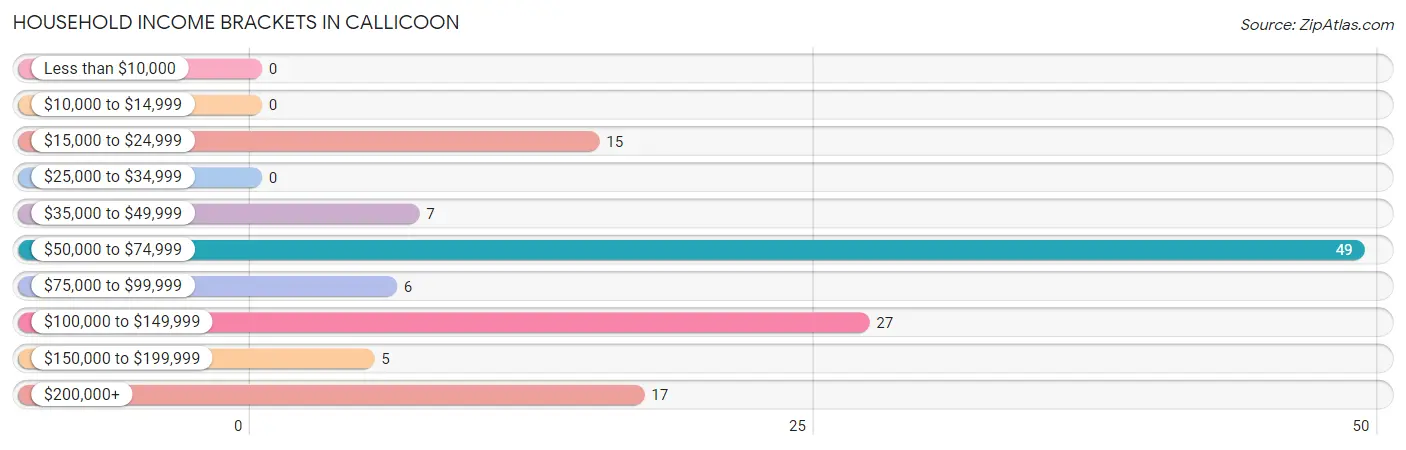
Household Income Brackets in Callicoon
With 49 households falling in the category, the $50,000 to $74,999 income range is the most frequent in Callicoon, accounting for 38.9% of all households.
| Income Bracket | # Households | % Households |
| Less than $10,000 | 0 | 0.0% |
| $10,000 to $14,999 | 0 | 0.0% |
| $15,000 to $24,999 | 15 | 11.9% |
| $25,000 to $34,999 | 0 | 0.0% |
| $35,000 to $49,999 | 7 | 5.6% |
| $50,000 to $74,999 | 49 | 38.9% |
| $75,000 to $99,999 | 6 | 4.8% |
| $100,000 to $149,999 | 27 | 21.4% |
| $150,000 to $199,999 | 5 | 4.0% |
| $200,000+ | 17 | 13.5% |
Household Income by Householder Age in Callicoon
The median household income in Callicoon is $70,500, with the highest median household income of $71,875 found in the 45 to 64 years age bracket for the primary householder. A total of 69 households (54.8%) fall into this category.
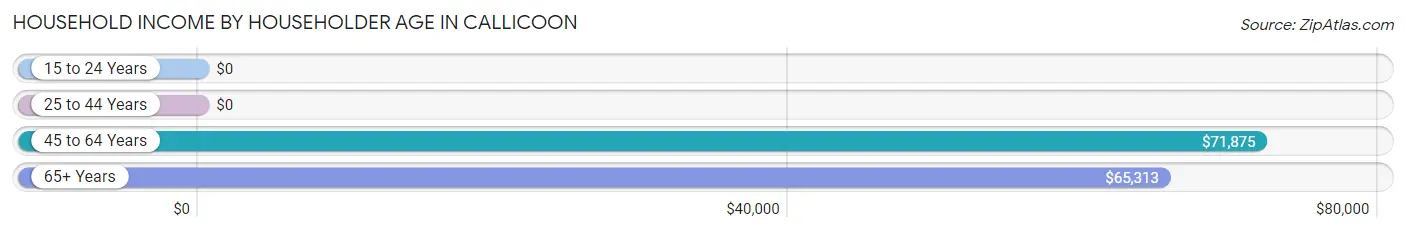
| Income Bracket | # Households | Median Income |
| 15 to 24 Years | 0 (0.0%) | $0 |
| 25 to 44 Years | 7 (5.6%) | $0 |
| 45 to 64 Years | 69 (54.8%) | $71,875 |
| 65+ Years | 50 (39.7%) | $65,313 |
| Total | 126 (100.0%) | $70,500 |
Poverty in Callicoon
Income Below Poverty by Sex and Age in Callicoon
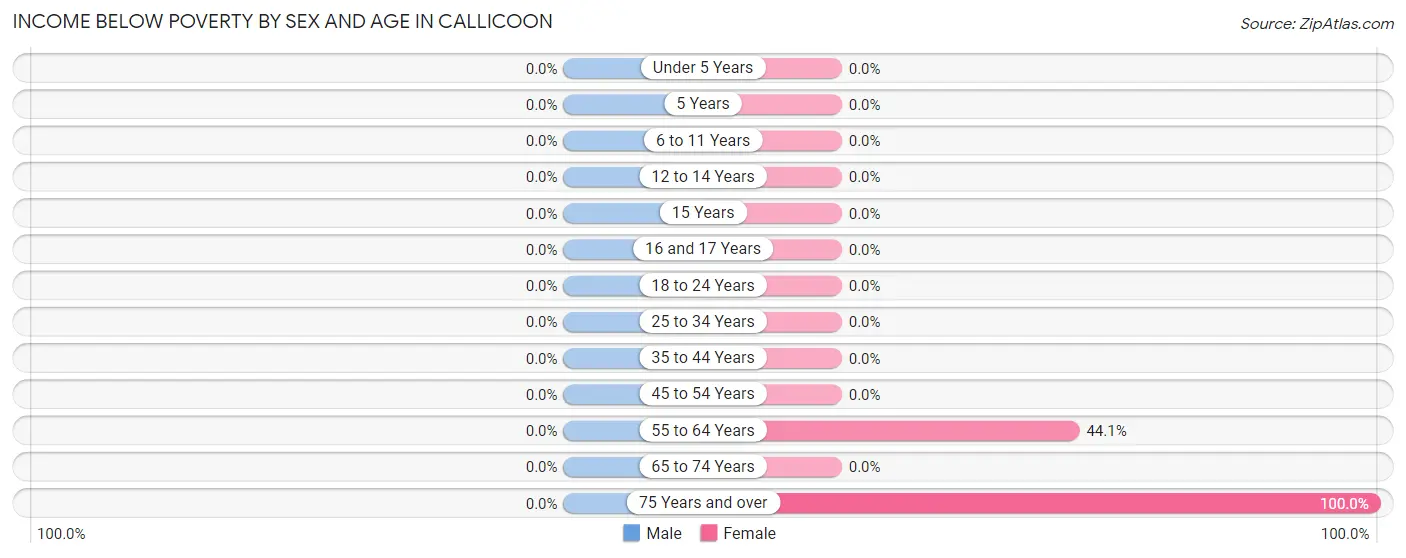
| Age Bracket | Male | Female |
| Under 5 Years | 0 (0.0%) | 0 (0.0%) |
| 5 Years | 0 (0.0%) | 0 (0.0%) |
| 6 to 11 Years | 0 (0.0%) | 0 (0.0%) |
| 12 to 14 Years | 0 (0.0%) | 0 (0.0%) |
| 15 Years | 0 (0.0%) | 0 (0.0%) |
| 16 and 17 Years | 0 (0.0%) | 0 (0.0%) |
| 18 to 24 Years | 0 (0.0%) | 0 (0.0%) |
| 25 to 34 Years | 0 (0.0%) | 0 (0.0%) |
| 35 to 44 Years | 0 (0.0%) | 0 (0.0%) |
| 45 to 54 Years | 0 (0.0%) | 0 (0.0%) |
| 55 to 64 Years | 0 (0.0%) | 15 (44.1%) |
| 65 to 74 Years | 0 (0.0%) | 0 (0.0%) |
| 75 Years and over | 0 (0.0%) | 15 (100.0%) |
| Total | 0 (0.0%) | 30 (33.3%) |
Income Above Poverty by Sex and Age in Callicoon
According to the poverty statistics in Callicoon, males aged 12 to 14 years and females aged 16 and 17 years are the age groups that are most secure financially, with 100.0% of males and 100.0% of females in these age groups living above the poverty line.
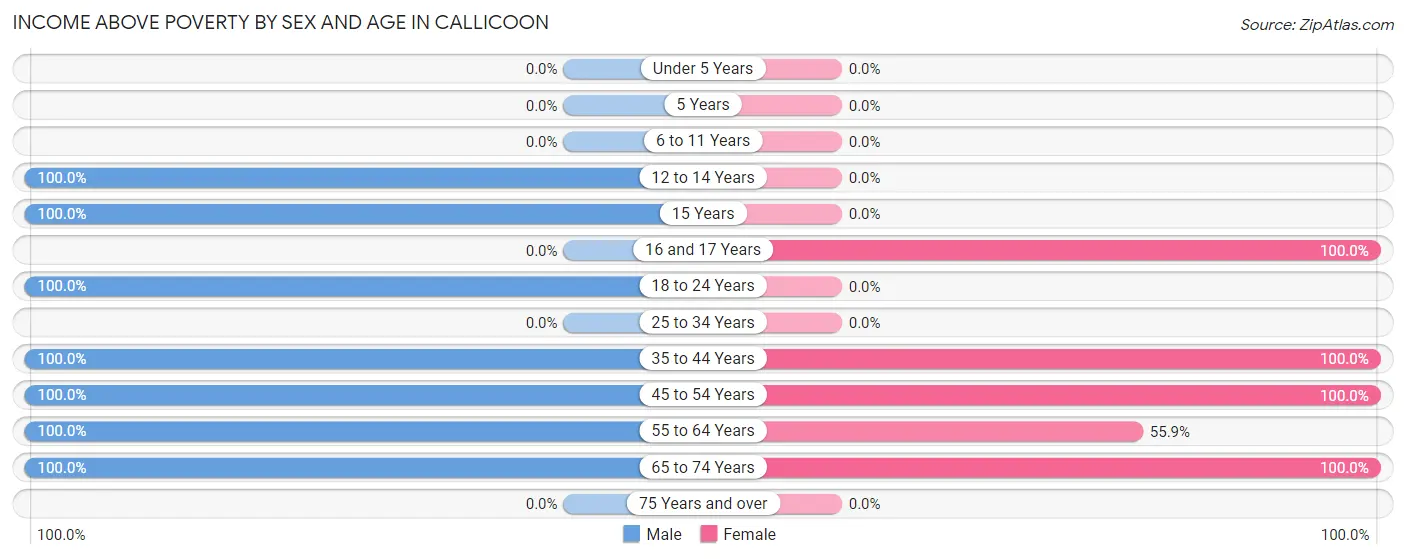
| Age Bracket | Male | Female |
| Under 5 Years | 0 (0.0%) | 0 (0.0%) |
| 5 Years | 0 (0.0%) | 0 (0.0%) |
| 6 to 11 Years | 0 (0.0%) | 0 (0.0%) |
| 12 to 14 Years | 11 (100.0%) | 0 (0.0%) |
| 15 Years | 11 (100.0%) | 0 (0.0%) |
| 16 and 17 Years | 0 (0.0%) | 5 (100.0%) |
| 18 to 24 Years | 7 (100.0%) | 0 (0.0%) |
| 25 to 34 Years | 0 (0.0%) | 0 (0.0%) |
| 35 to 44 Years | 7 (100.0%) | 13 (100.0%) |
| 45 to 54 Years | 25 (100.0%) | 6 (100.0%) |
| 55 to 64 Years | 48 (100.0%) | 19 (55.9%) |
| 65 to 74 Years | 26 (100.0%) | 17 (100.0%) |
| 75 Years and over | 0 (0.0%) | 0 (0.0%) |
| Total | 135 (100.0%) | 60 (66.7%) |
Income Below Poverty Among Married-Couple Families in Callicoon
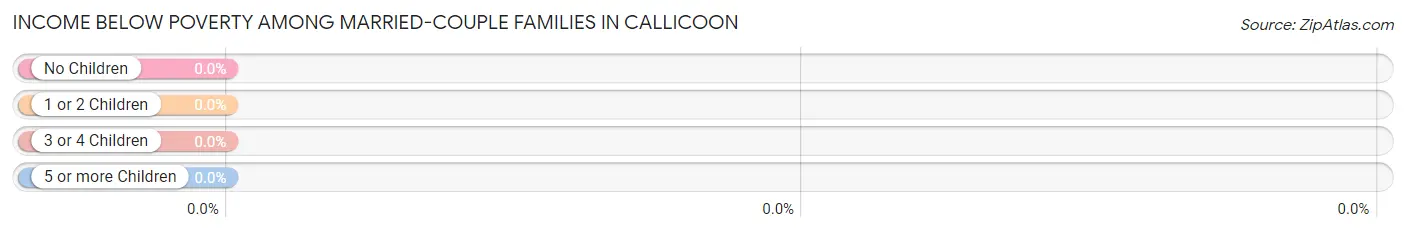
| Children | Above Poverty | Below Poverty |
| No Children | 30 (100.0%) | 0 (0.0%) |
| 1 or 2 Children | 22 (100.0%) | 0 (0.0%) |
| 3 or 4 Children | 0 (0.0%) | 0 (0.0%) |
| 5 or more Children | 0 (0.0%) | 0 (0.0%) |
| Total | 52 (100.0%) | 0 (0.0%) |
Income Below Poverty Among Single-Parent Households in Callicoon
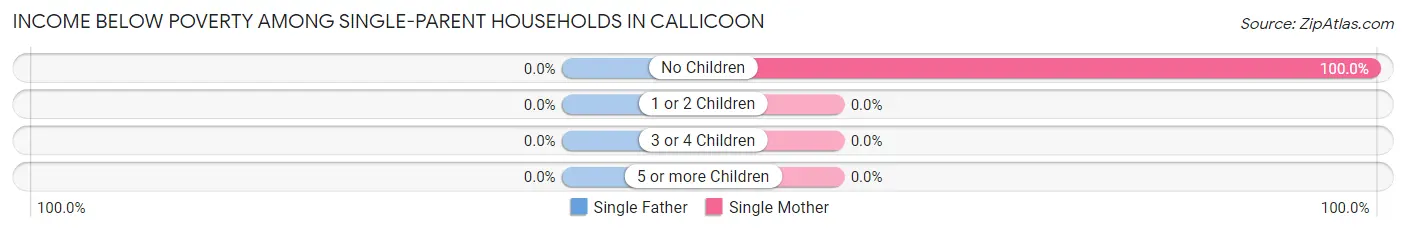
| Children | Single Father | Single Mother |
| No Children | 0 (0.0%) | 15 (100.0%) |
| 1 or 2 Children | 0 (0.0%) | 0 (0.0%) |
| 3 or 4 Children | 0 (0.0%) | 0 (0.0%) |
| 5 or more Children | 0 (0.0%) | 0 (0.0%) |
| Total | 0 (0.0%) | 15 (100.0%) |
Income Below Poverty Among Married-Couple vs Single-Parent Households in Callicoon
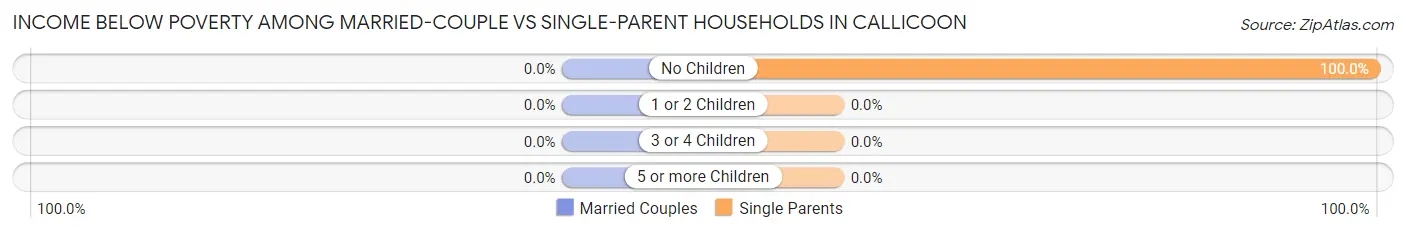
| Children | Married-Couple Families | Single-Parent Households |
| No Children | 0 (0.0%) | 15 (100.0%) |
| 1 or 2 Children | 0 (0.0%) | 0 (0.0%) |
| 3 or 4 Children | 0 (0.0%) | 0 (0.0%) |
| 5 or more Children | 0 (0.0%) | 0 (0.0%) |
| Total | 0 (0.0%) | 15 (100.0%) |
Race in Callicoon
The most populous races in Callicoon are White / Caucasian (196 | 87.1%), Hispanic or Latino (39 | 17.3%), and Black / African American (14 | 6.2%).
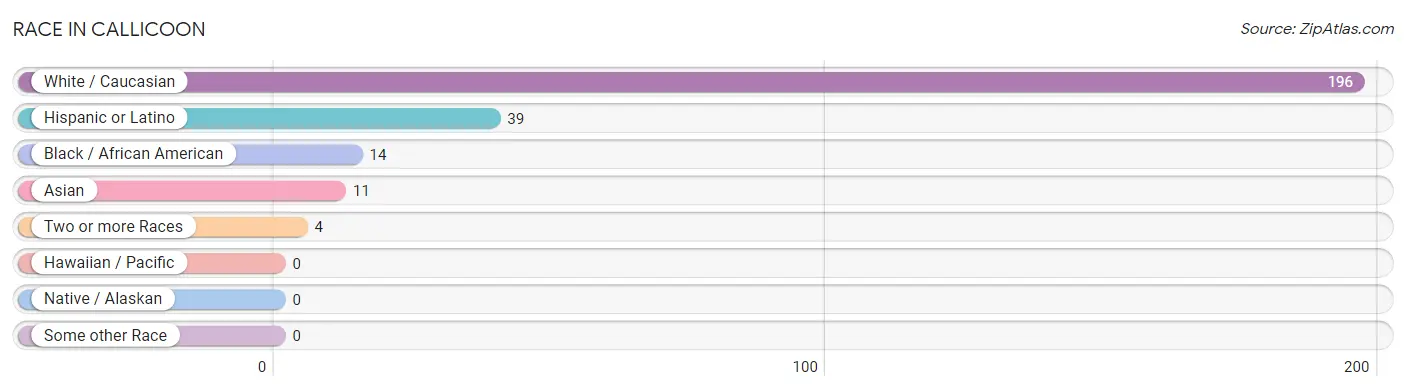
| Race | # Population | % Population |
| Asian | 11 | 4.9% |
| Black / African American | 14 | 6.2% |
| Hawaiian / Pacific | 0 | 0.0% |
| Hispanic or Latino | 39 | 17.3% |
| Native / Alaskan | 0 | 0.0% |
| White / Caucasian | 196 | 87.1% |
| Two or more Races | 4 | 1.8% |
| Some other Race | 0 | 0.0% |
| Total | 225 | 100.0% |
Ancestry in Callicoon
The most populous ancestries reported in Callicoon are Italian (56 | 24.9%), American (40 | 17.8%), Puerto Rican (39 | 17.3%), Irish (35 | 15.6%), and Czech (30 | 13.3%), together accounting for 88.9% of all Callicoon residents.
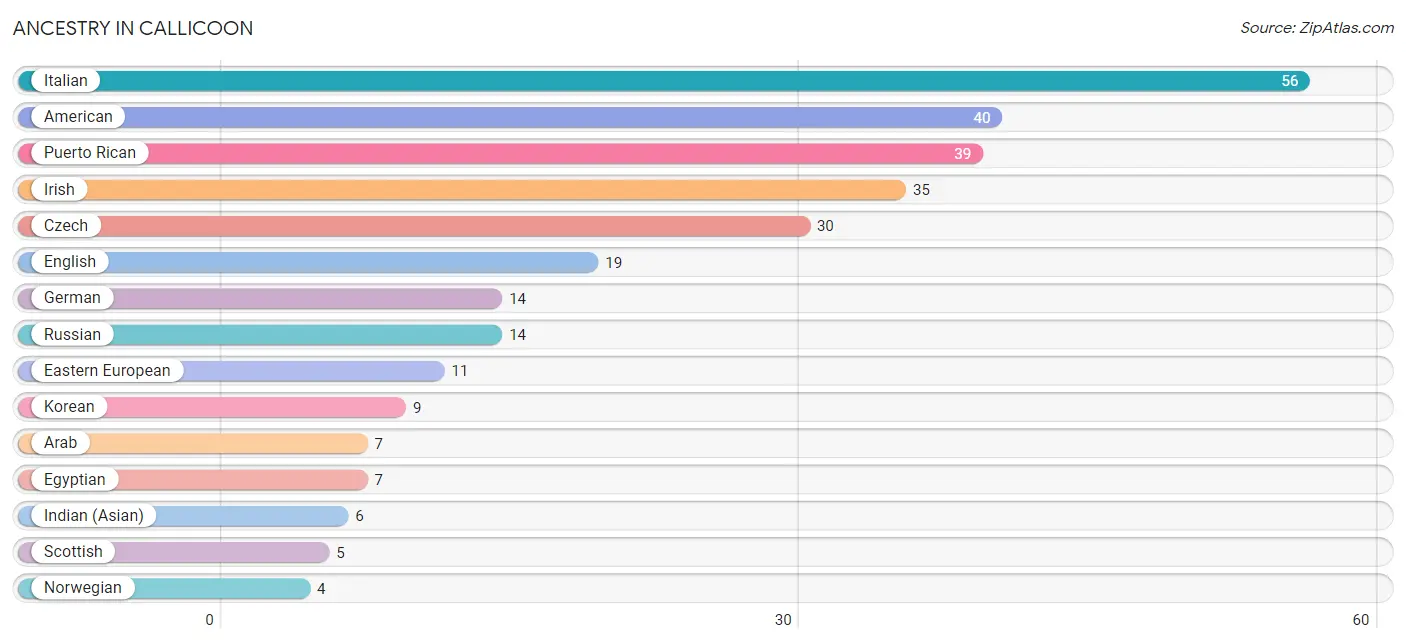
| Ancestry | # Population | % Population |
| American | 40 | 17.8% |
| Arab | 7 | 3.1% |
| Czech | 30 | 13.3% |
| Eastern European | 11 | 4.9% |
| Egyptian | 7 | 3.1% |
| English | 19 | 8.4% |
| German | 14 | 6.2% |
| Indian (Asian) | 6 | 2.7% |
| Irish | 35 | 15.6% |
| Italian | 56 | 24.9% |
| Korean | 9 | 4.0% |
| Norwegian | 4 | 1.8% |
| Puerto Rican | 39 | 17.3% |
| Russian | 14 | 6.2% |
| Scottish | 5 | 2.2% | View All 15 Rows |
Immigrants in Callicoon
The most numerous immigrant groups reported in Callicoon came from Asia (11 | 4.9%), Africa (7 | 3.1%), Egypt (7 | 3.1%), Northern Africa (7 | 3.1%), and China (6 | 2.7%), together accounting for 16.9% of all Callicoon residents.
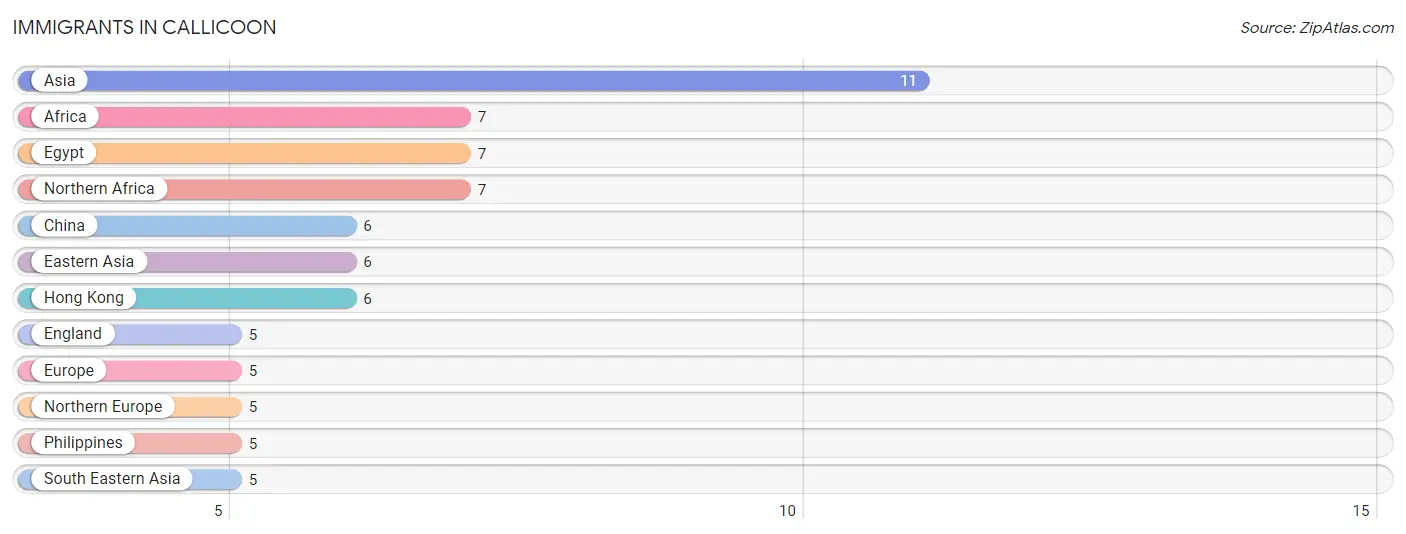
| Immigration Origin | # Population | % Population |
| Africa | 7 | 3.1% |
| Asia | 11 | 4.9% |
| China | 6 | 2.7% |
| Eastern Asia | 6 | 2.7% |
| Egypt | 7 | 3.1% |
| England | 5 | 2.2% |
| Europe | 5 | 2.2% |
| Hong Kong | 6 | 2.7% |
| Northern Africa | 7 | 3.1% |
| Northern Europe | 5 | 2.2% |
| Philippines | 5 | 2.2% |
| South Eastern Asia | 5 | 2.2% | View All 12 Rows |
Sex and Age in Callicoon
Sex and Age in Callicoon
The most populous age groups in Callicoon are 55 to 59 Years (37 | 27.4%) for men and 60 to 64 Years (19 | 21.1%) for women.
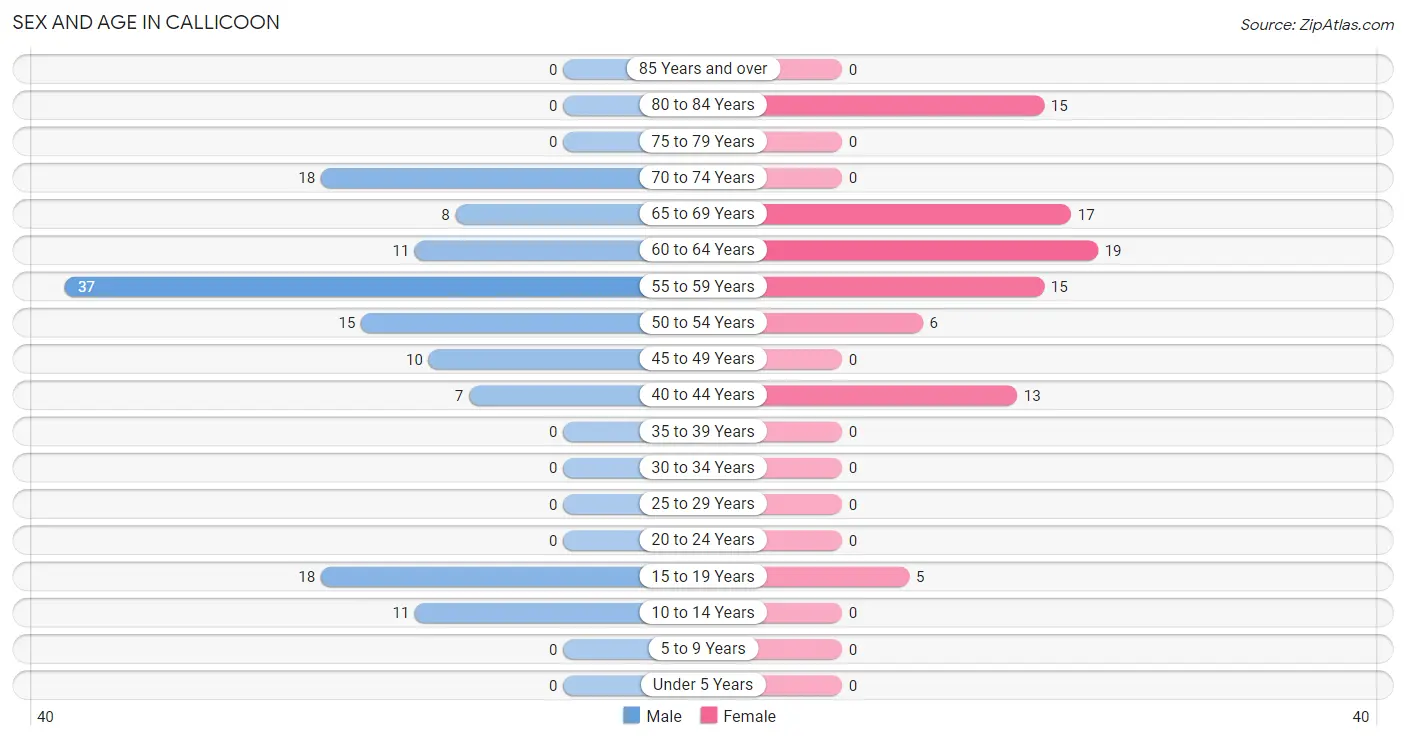
| Age Bracket | Male | Female |
| Under 5 Years | 0 (0.0%) | 0 (0.0%) |
| 5 to 9 Years | 0 (0.0%) | 0 (0.0%) |
| 10 to 14 Years | 11 (8.2%) | 0 (0.0%) |
| 15 to 19 Years | 18 (13.3%) | 5 (5.6%) |
| 20 to 24 Years | 0 (0.0%) | 0 (0.0%) |
| 25 to 29 Years | 0 (0.0%) | 0 (0.0%) |
| 30 to 34 Years | 0 (0.0%) | 0 (0.0%) |
| 35 to 39 Years | 0 (0.0%) | 0 (0.0%) |
| 40 to 44 Years | 7 (5.2%) | 13 (14.4%) |
| 45 to 49 Years | 10 (7.4%) | 0 (0.0%) |
| 50 to 54 Years | 15 (11.1%) | 6 (6.7%) |
| 55 to 59 Years | 37 (27.4%) | 15 (16.7%) |
| 60 to 64 Years | 11 (8.2%) | 19 (21.1%) |
| 65 to 69 Years | 8 (5.9%) | 17 (18.9%) |
| 70 to 74 Years | 18 (13.3%) | 0 (0.0%) |
| 75 to 79 Years | 0 (0.0%) | 0 (0.0%) |
| 80 to 84 Years | 0 (0.0%) | 15 (16.7%) |
| 85 Years and over | 0 (0.0%) | 0 (0.0%) |
| Total | 135 (100.0%) | 90 (100.0%) |
Families and Households in Callicoon
Median Family Size in Callicoon
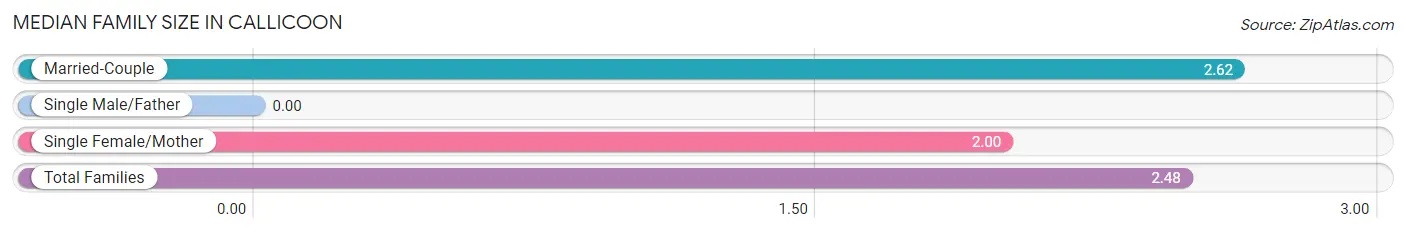
| Family Type | # Families | Family Size |
| Married-Couple | 52 (77.6%) | 2.62 |
| Single Male/Father | 0 (0.0%) | - |
| Single Female/Mother | 15 (22.4%) | 2.00 |
| Total Families | 67 (100.0%) | 2.48 |
Median Household Size in Callicoon
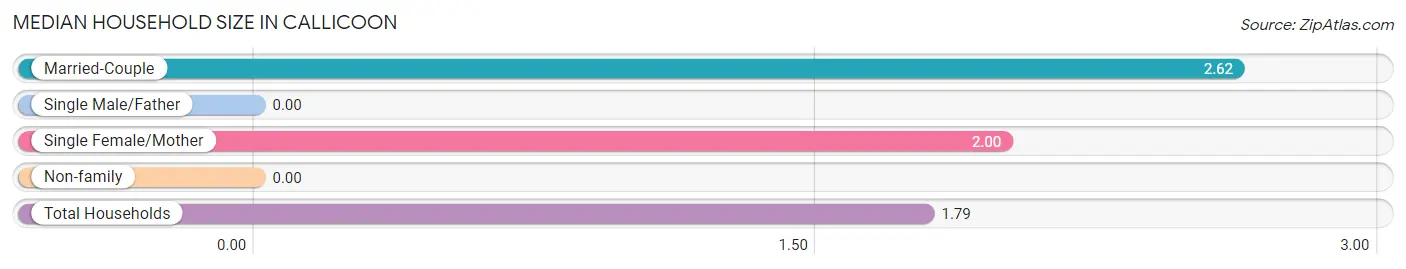
| Household Type | # Households | Household Size |
| Married-Couple | 52 (41.3%) | 2.62 |
| Single Male/Father | 0 (0.0%) | - |
| Single Female/Mother | 15 (11.9%) | 2.00 |
| Non-family | 59 (46.8%) | - |
| Total Households | 126 (100.0%) | 1.79 |
Household Size by Marriage Status in Callicoon
Out of a total of 126 households in Callicoon, 67 (53.2%) are family households, while 59 (46.8%) are nonfamily households. The most numerous type of family households are 2-person households, comprising 45, and the most common type of nonfamily households are 1-person households, comprising 59.
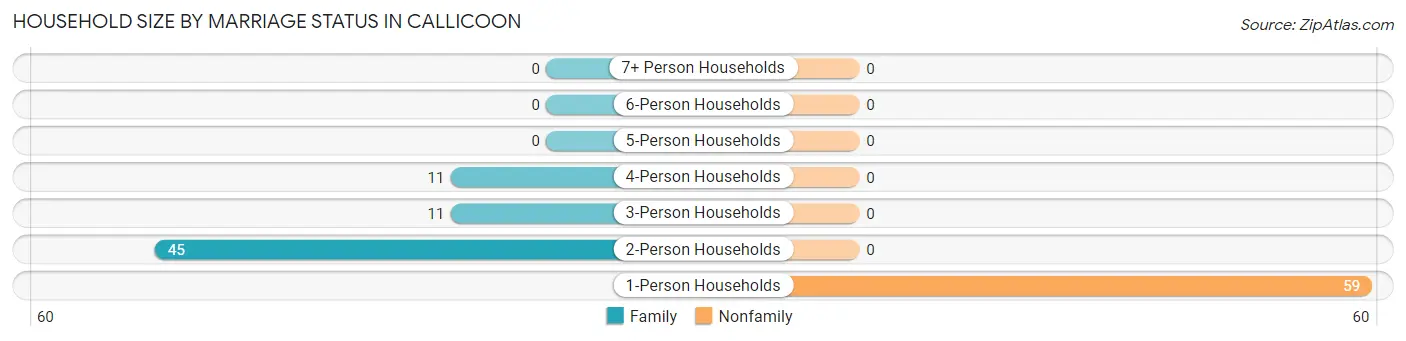
| Household Size | Family Households | Nonfamily Households |
| 1-Person Households | - | 59 (46.8%) |
| 2-Person Households | 45 (35.7%) | 0 (0.0%) |
| 3-Person Households | 11 (8.7%) | 0 (0.0%) |
| 4-Person Households | 11 (8.7%) | 0 (0.0%) |
| 5-Person Households | 0 (0.0%) | 0 (0.0%) |
| 6-Person Households | 0 (0.0%) | 0 (0.0%) |
| 7+ Person Households | 0 (0.0%) | 0 (0.0%) |
| Total | 67 (53.2%) | 59 (46.8%) |
Female Fertility in Callicoon
Fertility by Age in Callicoon
| Age Bracket | Women with Births | Births / 1,000 Women |
| 15 to 19 years | 0 (0.0%) | 0.0 |
| 20 to 34 years | 0 (0.0%) | 0.0 |
| 35 to 50 years | 0 (0.0%) | 0.0 |
| Total | 0 (0.0%) | 0.0 |
Fertility by Age by Marriage Status in Callicoon
| Age Bracket | Married | Unmarried |
| 15 to 19 years | 0 (0.0%) | 0 (0.0%) |
| 20 to 34 years | 0 (0.0%) | 0 (0.0%) |
| 35 to 50 years | 0 (0.0%) | 0 (0.0%) |
| Total | 0 (0.0%) | 0 (0.0%) |
Fertility by Education in Callicoon
| Educational Attainment | Women with Births | Births / 1,000 Women |
| Less than High School | 0 (0.0%) | 0.0 |
| High School Diploma | 0 (0.0%) | 0.0 |
| College or Associate's Degree | 0 (0.0%) | 0.0 |
| Bachelor's Degree | 0 (0.0%) | 0.0 |
| Graduate Degree | 0 (0.0%) | 0.0 |
| Total | 0 (0.0%) | 0.0 |
Fertility by Education by Marriage Status in Callicoon
| Educational Attainment | Married | Unmarried |
| Less than High School | 0 (0.0%) | 0 (0.0%) |
| High School Diploma | 0 (0.0%) | 0 (0.0%) |
| College or Associate's Degree | 0 (0.0%) | 0 (0.0%) |
| Bachelor's Degree | 0 (0.0%) | 0 (0.0%) |
| Graduate Degree | 0 (0.0%) | 0 (0.0%) |
| Total | 0 (0.0%) | 0 (0.0%) |
Employment Characteristics in Callicoon
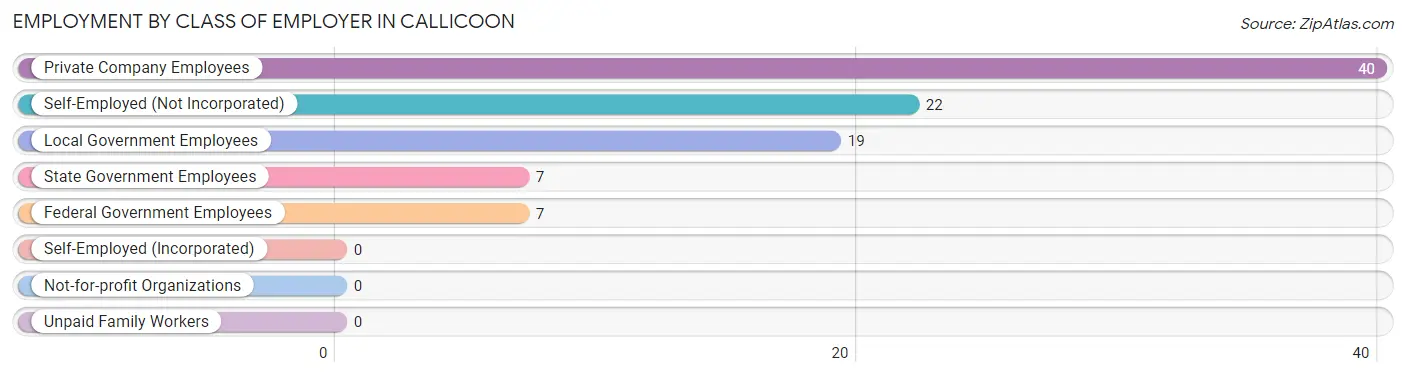
Employment by Class of Employer in Callicoon
Among the 95 employed individuals in Callicoon, private company employees (40 | 42.1%), self-employed (not incorporated) (22 | 23.2%), and local government employees (19 | 20.0%) make up the most common classes of employment.
| Employer Class | # Employees | % Employees |
| Private Company Employees | 40 | 42.1% |
| Self-Employed (Incorporated) | 0 | 0.0% |
| Self-Employed (Not Incorporated) | 22 | 23.2% |
| Not-for-profit Organizations | 0 | 0.0% |
| Local Government Employees | 19 | 20.0% |
| State Government Employees | 7 | 7.4% |
| Federal Government Employees | 7 | 7.4% |
| Unpaid Family Workers | 0 | 0.0% |
| Total | 95 | 100.0% |
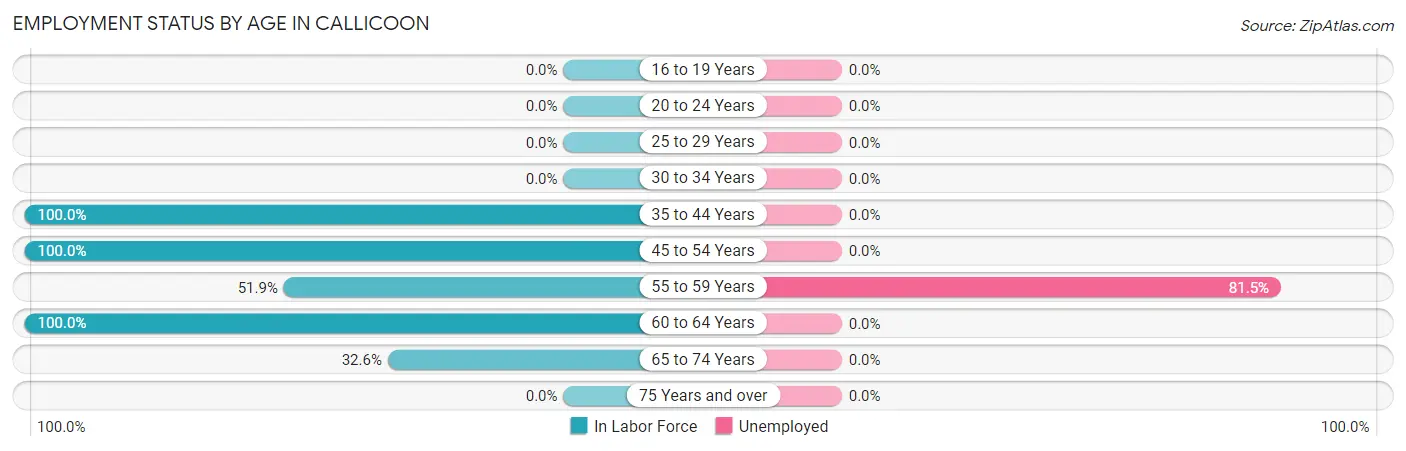
Employment Status by Age in Callicoon
According to the labor force statistics for Callicoon, out of the total population over 16 years of age (203), 60.1% or 122 individuals are in the labor force, with 18.0% or 22 of them unemployed. The age group with the highest labor force participation rate is 35 to 44 years, with 100.0% or 20 individuals in the labor force. Within the labor force, the 55 to 59 years age range has the highest percentage of unemployed individuals, with 81.5% or 22 of them being unemployed.
| Age Bracket | In Labor Force | Unemployed |
| 16 to 19 Years | 0 (0.0%) | 0 (0.0%) |
| 20 to 24 Years | 0 (0.0%) | 0 (0.0%) |
| 25 to 29 Years | 0 (0.0%) | 0 (0.0%) |
| 30 to 34 Years | 0 (0.0%) | 0 (0.0%) |
| 35 to 44 Years | 20 (100.0%) | 0 (0.0%) |
| 45 to 54 Years | 31 (100.0%) | 0 (0.0%) |
| 55 to 59 Years | 27 (51.9%) | 22 (81.5%) |
| 60 to 64 Years | 30 (100.0%) | 0 (0.0%) |
| 65 to 74 Years | 14 (32.6%) | 0 (0.0%) |
| 75 Years and over | 0 (0.0%) | 0 (0.0%) |
| Total | 122 (60.1%) | 22 (18.0%) |
Employment Status by Educational Attainment in Callicoon
According to labor force statistics for Callicoon, 81.2% of individuals (108) out of the total population between 25 and 64 years of age (133) are in the labor force, with 20.4% or 22 of them being unemployed. The group with the highest labor force participation rate are those with the educational attainment of college / associate degree, with 100.0% or 13 individuals in the labor force. Within the labor force, individuals with bachelor's degree or higher education have the highest percentage of unemployment, with 29.3% or 22 of them being unemployed.
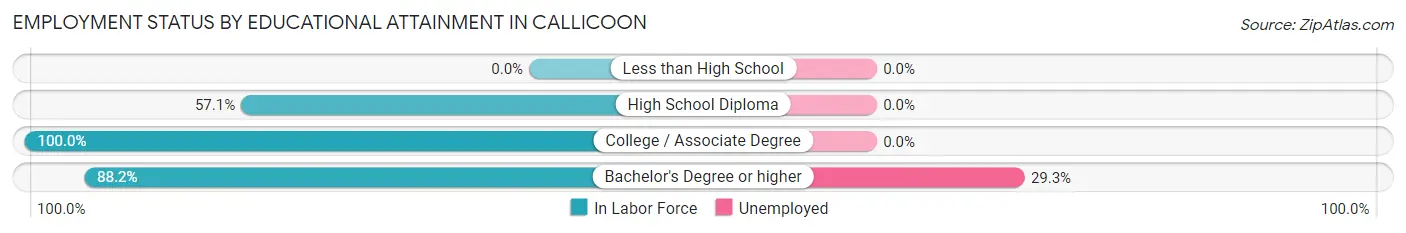
| Educational Attainment | In Labor Force | Unemployed |
| Less than High School | 0 (0.0%) | 0 (0.0%) |
| High School Diploma | 20 (57.1%) | 0 (0.0%) |
| College / Associate Degree | 13 (100.0%) | 0 (0.0%) |
| Bachelor's Degree or higher | 75 (88.2%) | 25 (29.3%) |
| Total | 108 (81.2%) | 27 (20.4%) |
Employment Occupations by Sex in Callicoon
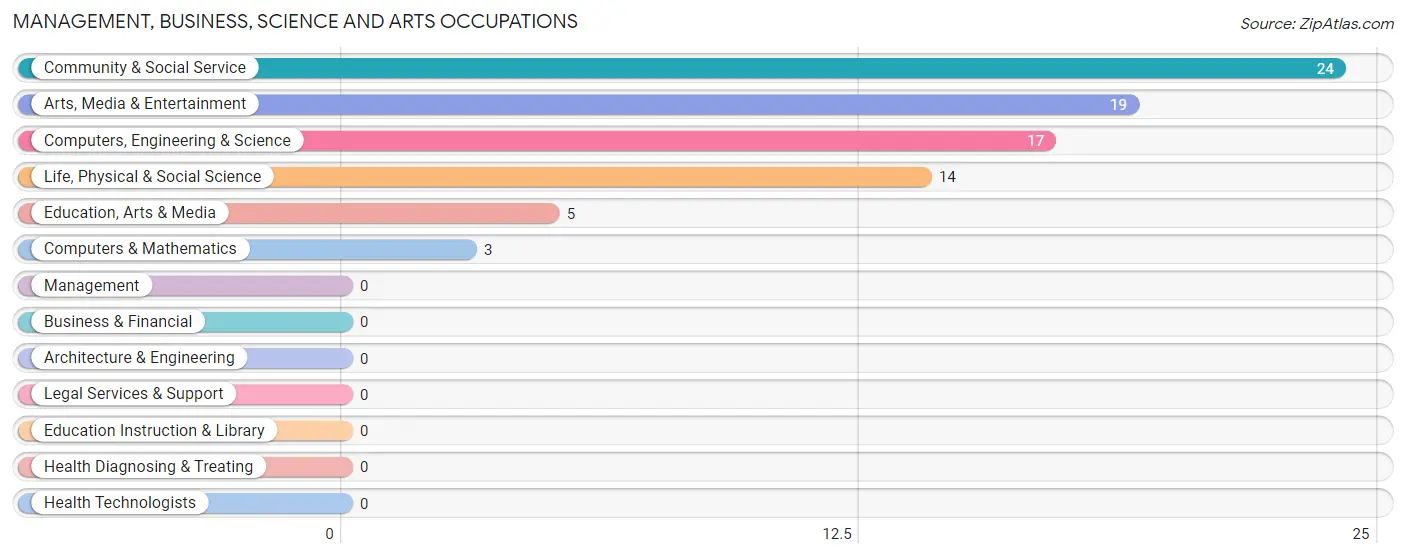
Management, Business, Science and Arts Occupations
The most common Management, Business, Science and Arts occupations in Callicoon are Community & Social Service (24 | 24.0%), Arts, Media & Entertainment (19 | 19.0%), Computers, Engineering & Science (17 | 17.0%), Life, Physical & Social Science (14 | 14.0%), and Education, Arts & Media (5 | 5.0%).
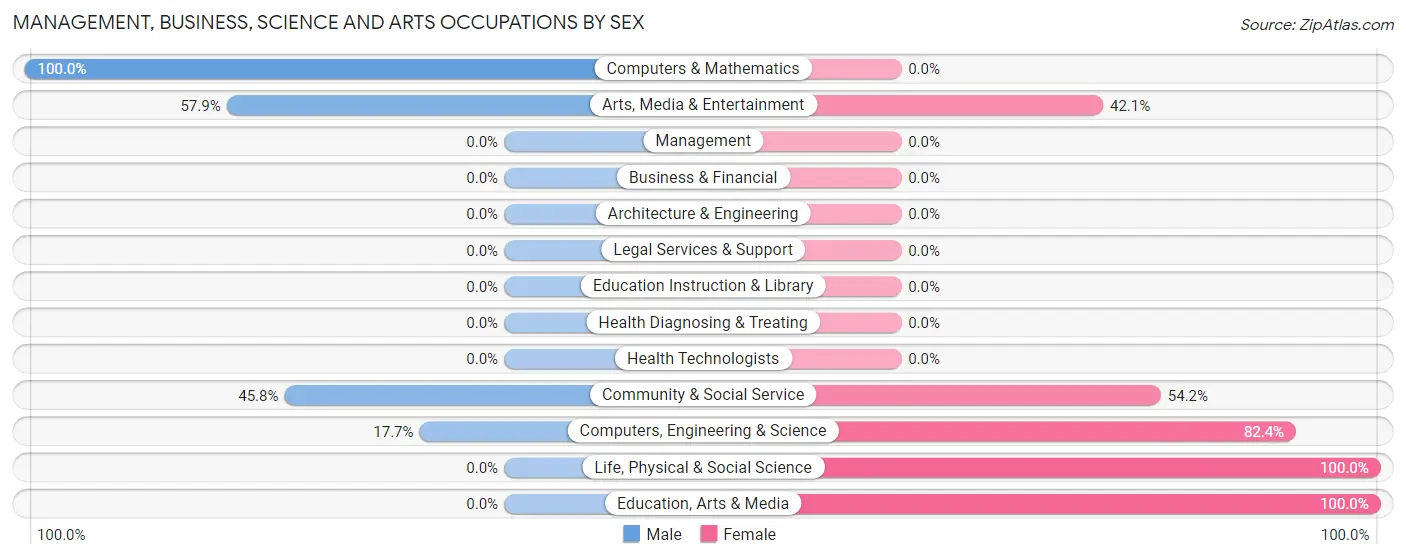
Management, Business, Science and Arts Occupations by Sex
Within the Management, Business, Science and Arts occupations in Callicoon, the most male-oriented occupations are Computers & Mathematics (100.0%), Arts, Media & Entertainment (57.9%), and Community & Social Service (45.8%), while the most female-oriented occupations are Life, Physical & Social Science (100.0%), Education, Arts & Media (100.0%), and Computers, Engineering & Science (82.4%).
| Occupation | Male | Female |
| Management | 0 (0.0%) | 0 (0.0%) |
| Business & Financial | 0 (0.0%) | 0 (0.0%) |
| Computers, Engineering & Science | 3 (17.6%) | 14 (82.4%) |
| Computers & Mathematics | 3 (100.0%) | 0 (0.0%) |
| Architecture & Engineering | 0 (0.0%) | 0 (0.0%) |
| Life, Physical & Social Science | 0 (0.0%) | 14 (100.0%) |
| Community & Social Service | 11 (45.8%) | 13 (54.2%) |
| Education, Arts & Media | 0 (0.0%) | 5 (100.0%) |
| Legal Services & Support | 0 (0.0%) | 0 (0.0%) |
| Education Instruction & Library | 0 (0.0%) | 0 (0.0%) |
| Arts, Media & Entertainment | 11 (57.9%) | 8 (42.1%) |
| Health Diagnosing & Treating | 0 (0.0%) | 0 (0.0%) |
| Health Technologists | 0 (0.0%) | 0 (0.0%) |
| Total (Category) | 14 (34.2%) | 27 (65.8%) |
| Total (Overall) | 62 (62.0%) | 38 (38.0%) |
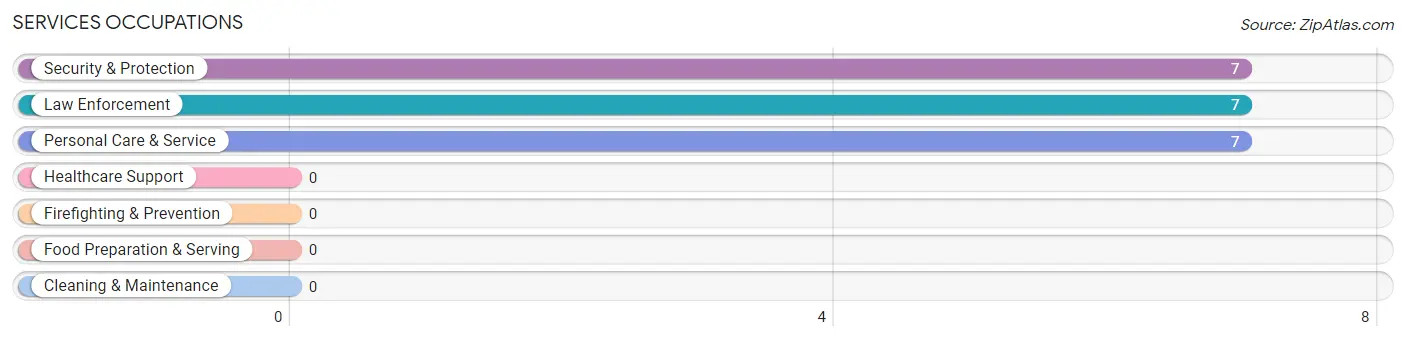
Services Occupations
The most common Services occupations in Callicoon are Security & Protection (7 | 7.0%), Law Enforcement (7 | 7.0%), and Personal Care & Service (7 | 7.0%).
Services Occupations by Sex
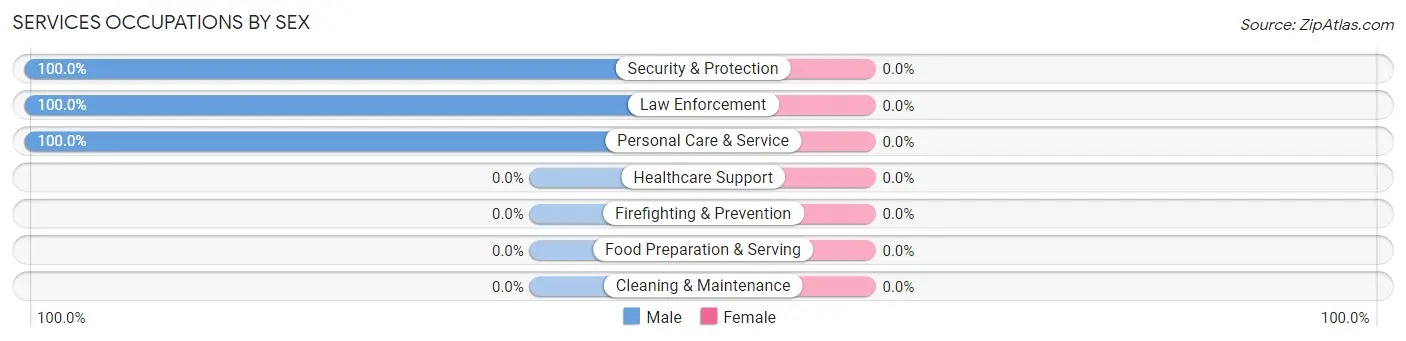
| Occupation | Male | Female |
| Healthcare Support | 0 (0.0%) | 0 (0.0%) |
| Security & Protection | 7 (100.0%) | 0 (0.0%) |
| Firefighting & Prevention | 0 (0.0%) | 0 (0.0%) |
| Law Enforcement | 7 (100.0%) | 0 (0.0%) |
| Food Preparation & Serving | 0 (0.0%) | 0 (0.0%) |
| Cleaning & Maintenance | 0 (0.0%) | 0 (0.0%) |
| Personal Care & Service | 7 (100.0%) | 0 (0.0%) |
| Total (Category) | 14 (100.0%) | 0 (0.0%) |
| Total (Overall) | 62 (62.0%) | 38 (38.0%) |
Sales and Office Occupations
The most common Sales and Office occupations in Callicoon are Sales & Related (11 | 11.0%), and Office & Administration (5 | 5.0%).
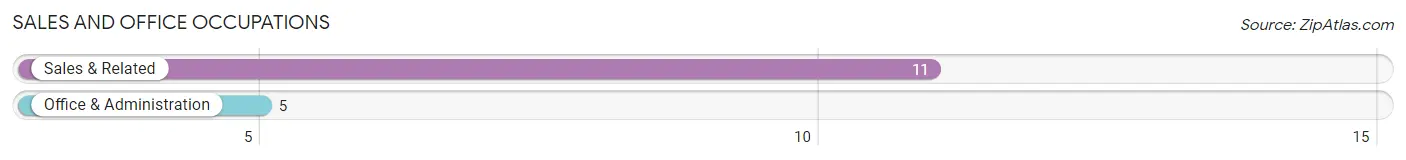
Sales and Office Occupations by Sex
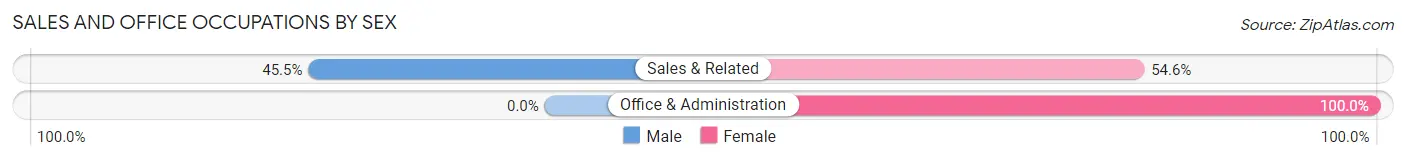
| Occupation | Male | Female |
| Sales & Related | 5 (45.5%) | 6 (54.5%) |
| Office & Administration | 0 (0.0%) | 5 (100.0%) |
| Total (Category) | 5 (31.2%) | 11 (68.8%) |
| Total (Overall) | 62 (62.0%) | 38 (38.0%) |
Natural Resources, Construction and Maintenance Occupations
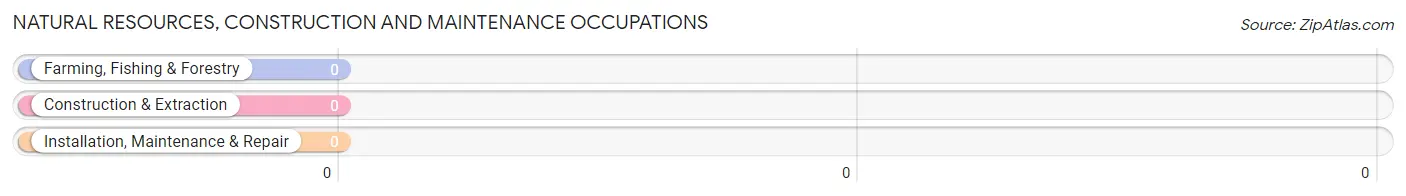
Natural Resources, Construction and Maintenance Occupations by Sex
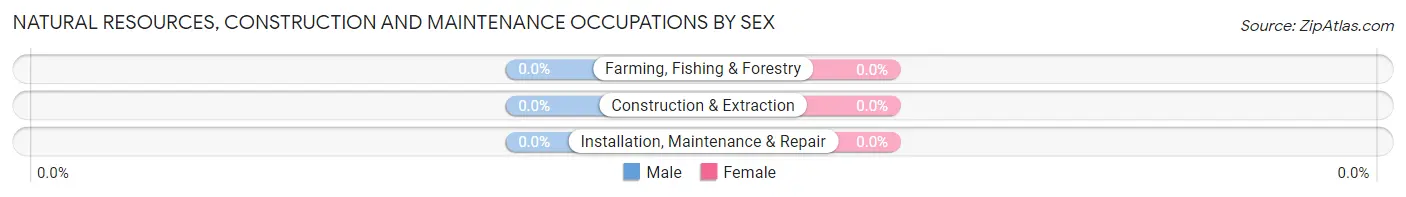
| Occupation | Male | Female |
| Farming, Fishing & Forestry | 0 (0.0%) | 0 (0.0%) |
| Construction & Extraction | 0 (0.0%) | 0 (0.0%) |
| Installation, Maintenance & Repair | 0 (0.0%) | 0 (0.0%) |
| Total (Category) | 0 (0.0%) | 0 (0.0%) |
| Total (Overall) | 62 (62.0%) | 38 (38.0%) |
Production, Transportation and Moving Occupations
The most common Production, Transportation and Moving occupations in Callicoon are , and Transportation (29 | 29.0%).
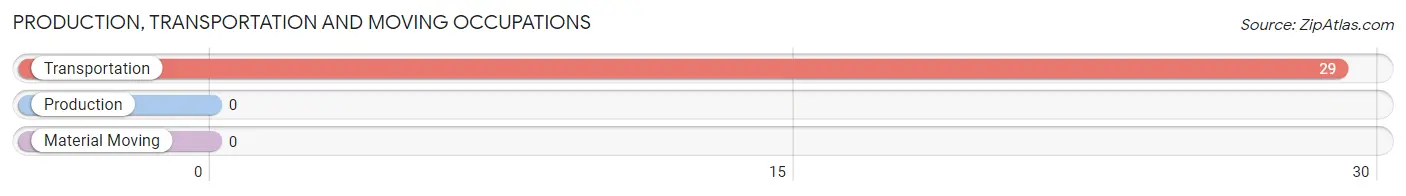
Production, Transportation and Moving Occupations by Sex
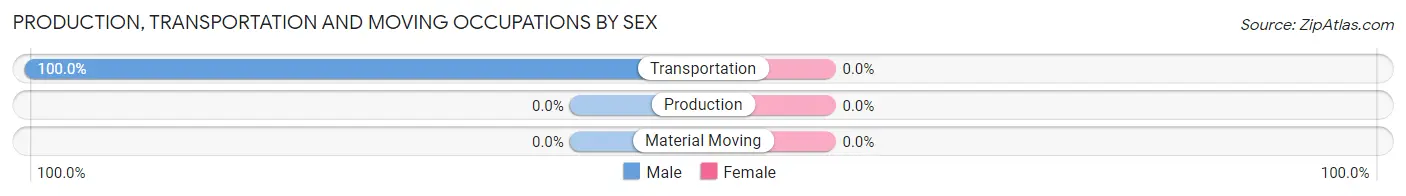
| Occupation | Male | Female |
| Production | 0 (0.0%) | 0 (0.0%) |
| Transportation | 29 (100.0%) | 0 (0.0%) |
| Material Moving | 0 (0.0%) | 0 (0.0%) |
| Total (Category) | 29 (100.0%) | 0 (0.0%) |
| Total (Overall) | 62 (62.0%) | 38 (38.0%) |
Employment Industries by Sex in Callicoon
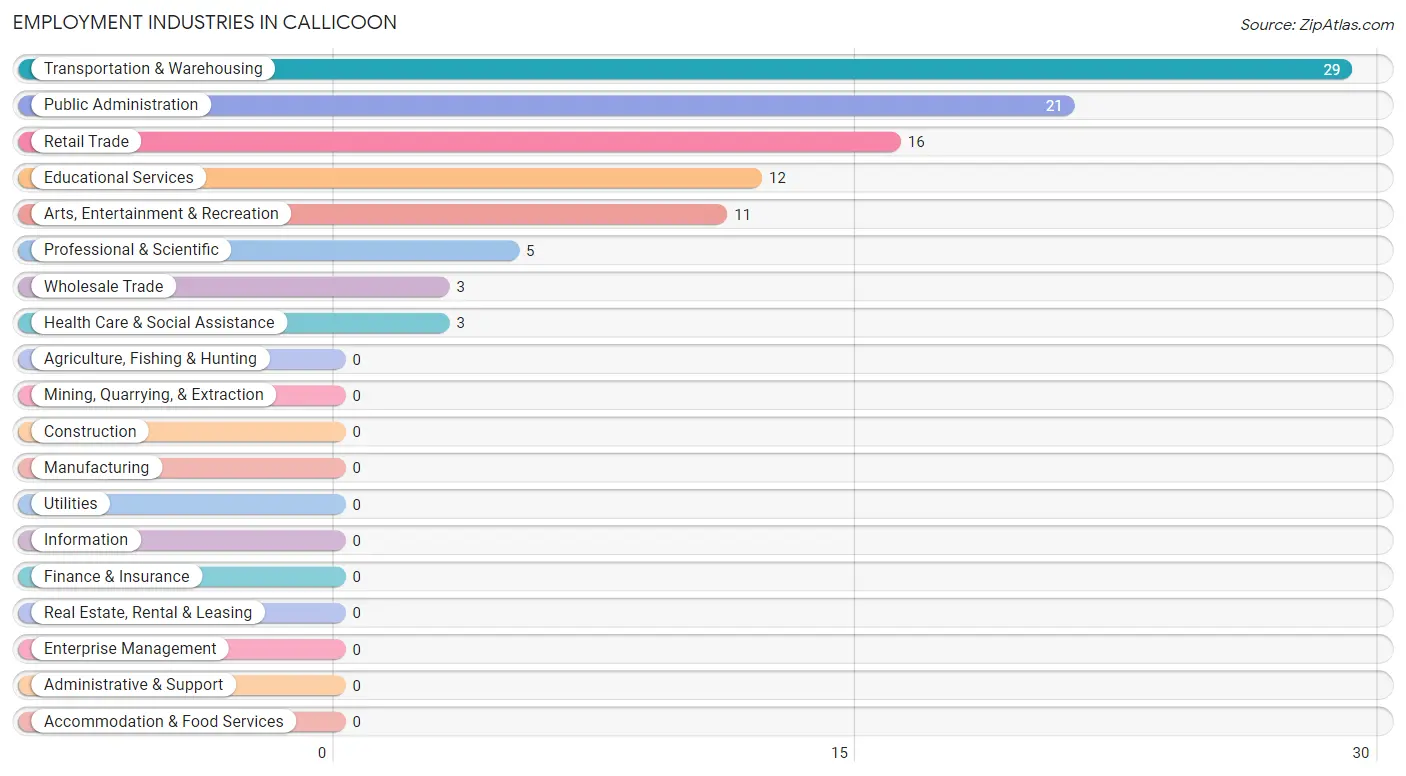
Employment Industries in Callicoon
The major employment industries in Callicoon include Transportation & Warehousing (29 | 29.0%), Public Administration (21 | 21.0%), Retail Trade (16 | 16.0%), Educational Services (12 | 12.0%), and Arts, Entertainment & Recreation (11 | 11.0%).
Employment Industries by Sex in Callicoon
The Callicoon industries that see more men than women are Transportation & Warehousing (100.0%), Health Care & Social Assistance (100.0%), and Arts, Entertainment & Recreation (100.0%), whereas the industries that tend to have a higher number of women are Wholesale Trade (100.0%), Professional & Scientific (100.0%), and Retail Trade (68.8%).
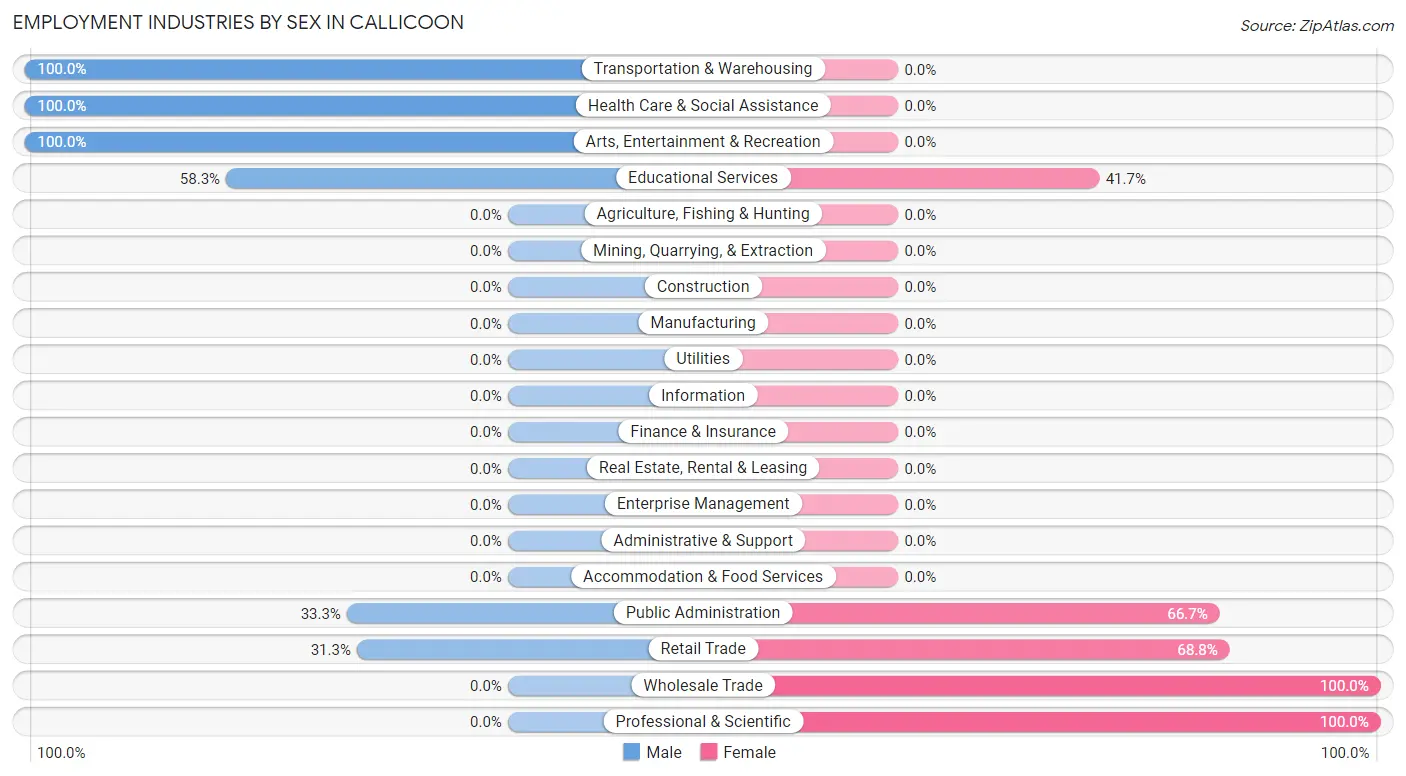
| Industry | Male | Female |
| Agriculture, Fishing & Hunting | 0 (0.0%) | 0 (0.0%) |
| Mining, Quarrying, & Extraction | 0 (0.0%) | 0 (0.0%) |
| Construction | 0 (0.0%) | 0 (0.0%) |
| Manufacturing | 0 (0.0%) | 0 (0.0%) |
| Wholesale Trade | 0 (0.0%) | 3 (100.0%) |
| Retail Trade | 5 (31.2%) | 11 (68.8%) |
| Transportation & Warehousing | 29 (100.0%) | 0 (0.0%) |
| Utilities | 0 (0.0%) | 0 (0.0%) |
| Information | 0 (0.0%) | 0 (0.0%) |
| Finance & Insurance | 0 (0.0%) | 0 (0.0%) |
| Real Estate, Rental & Leasing | 0 (0.0%) | 0 (0.0%) |
| Professional & Scientific | 0 (0.0%) | 5 (100.0%) |
| Enterprise Management | 0 (0.0%) | 0 (0.0%) |
| Administrative & Support | 0 (0.0%) | 0 (0.0%) |
| Educational Services | 7 (58.3%) | 5 (41.7%) |
| Health Care & Social Assistance | 3 (100.0%) | 0 (0.0%) |
| Arts, Entertainment & Recreation | 11 (100.0%) | 0 (0.0%) |
| Accommodation & Food Services | 0 (0.0%) | 0 (0.0%) |
| Public Administration | 7 (33.3%) | 14 (66.7%) |
| Total | 62 (62.0%) | 38 (38.0%) |
Education in Callicoon
School Enrollment in Callicoon
The most common levels of schooling among the 34 students in Callicoon are high school (16 | 47.1%), middle school (11 | 32.4%), and college / undergraduate (7 | 20.6%).
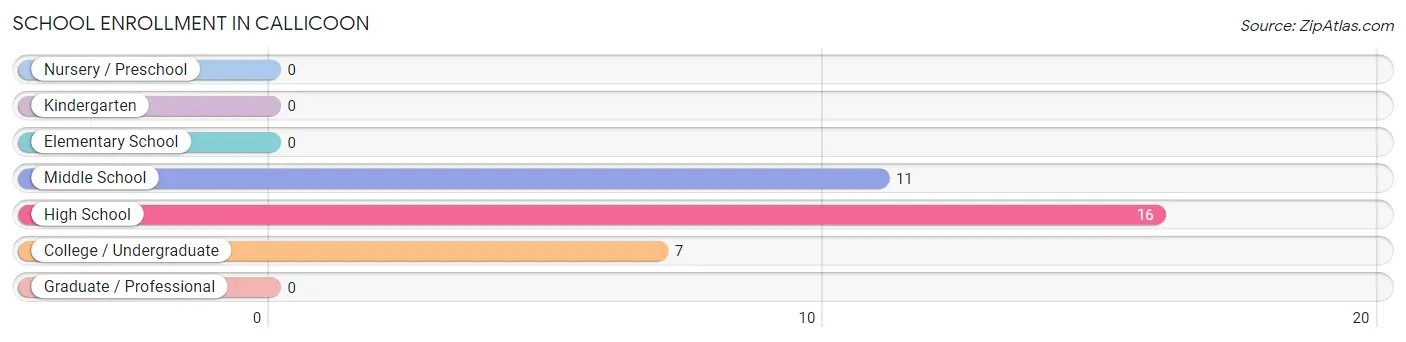
| School Level | # Students | % Students |
| Nursery / Preschool | 0 | 0.0% |
| Kindergarten | 0 | 0.0% |
| Elementary School | 0 | 0.0% |
| Middle School | 11 | 32.4% |
| High School | 16 | 47.1% |
| College / Undergraduate | 7 | 20.6% |
| Graduate / Professional | 0 | 0.0% |
| Total | 34 | 100.0% |
School Enrollment by Age by Funding Source in Callicoon
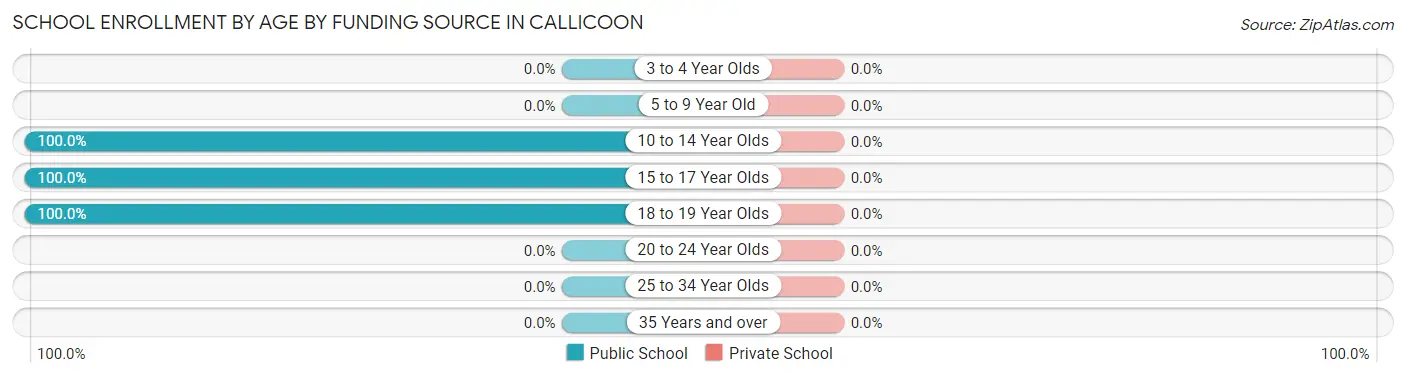
| Age Bracket | Public School | Private School |
| 3 to 4 Year Olds | 0 (0.0%) | 0 (0.0%) |
| 5 to 9 Year Old | 0 (0.0%) | 0 (0.0%) |
| 10 to 14 Year Olds | 11 (100.0%) | 0 (0.0%) |
| 15 to 17 Year Olds | 16 (100.0%) | 0 (0.0%) |
| 18 to 19 Year Olds | 7 (100.0%) | 0 (0.0%) |
| 20 to 24 Year Olds | 0 (0.0%) | 0 (0.0%) |
| 25 to 34 Year Olds | 0 (0.0%) | 0 (0.0%) |
| 35 Years and over | 0 (0.0%) | 0 (0.0%) |
| Total | 34 (100.0%) | 0 (0.0%) |
Educational Attainment by Field of Study in Callicoon
Visual & performing arts (25 | 21.4%), communications (22 | 18.8%), education (14 | 12.0%), literature & languages (14 | 12.0%), and business (12 | 10.3%) are the most common fields of study among 117 individuals in Callicoon who have obtained a bachelor's degree or higher.
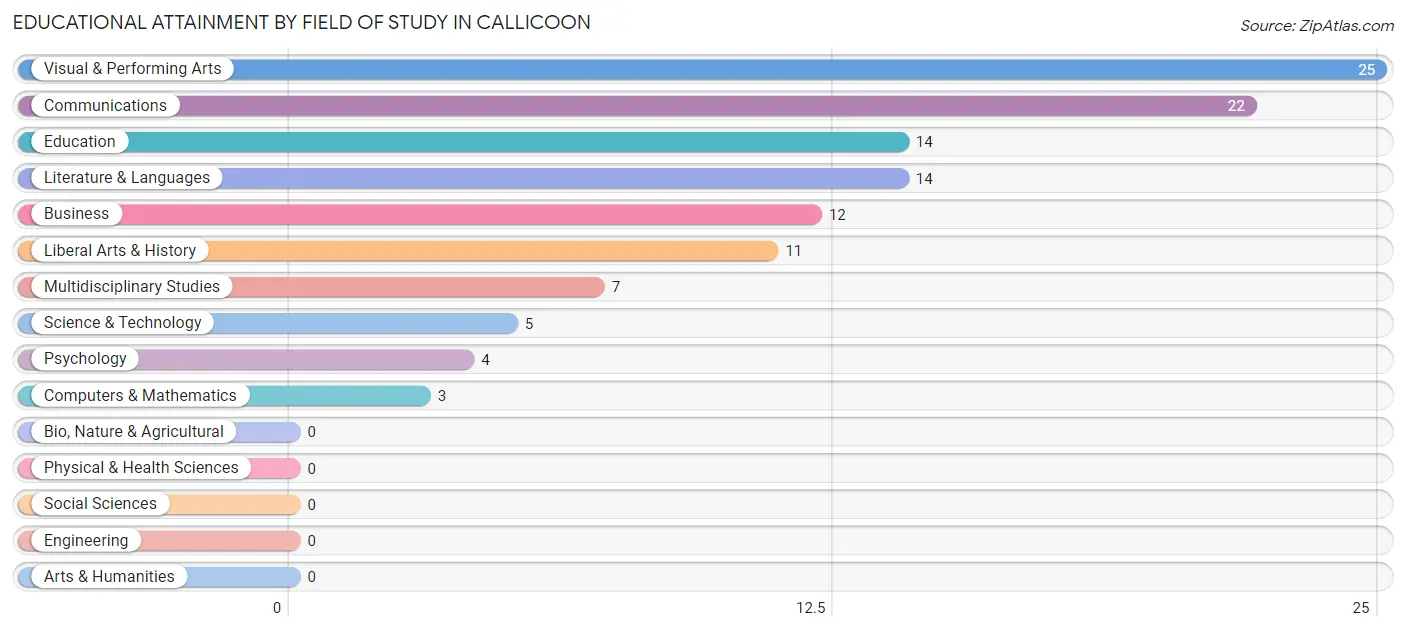
| Field of Study | # Graduates | % Graduates |
| Computers & Mathematics | 3 | 2.6% |
| Bio, Nature & Agricultural | 0 | 0.0% |
| Physical & Health Sciences | 0 | 0.0% |
| Psychology | 4 | 3.4% |
| Social Sciences | 0 | 0.0% |
| Engineering | 0 | 0.0% |
| Multidisciplinary Studies | 7 | 6.0% |
| Science & Technology | 5 | 4.3% |
| Business | 12 | 10.3% |
| Education | 14 | 12.0% |
| Literature & Languages | 14 | 12.0% |
| Liberal Arts & History | 11 | 9.4% |
| Visual & Performing Arts | 25 | 21.4% |
| Communications | 22 | 18.8% |
| Arts & Humanities | 0 | 0.0% |
| Total | 117 | 100.0% |
Transportation & Commute in Callicoon
Vehicle Availability by Sex in Callicoon
The most prevalent vehicle ownership categories in Callicoon are males with 1 vehicle (21, accounting for 36.8%) and females with 1 vehicle (22, making up 55.3%).
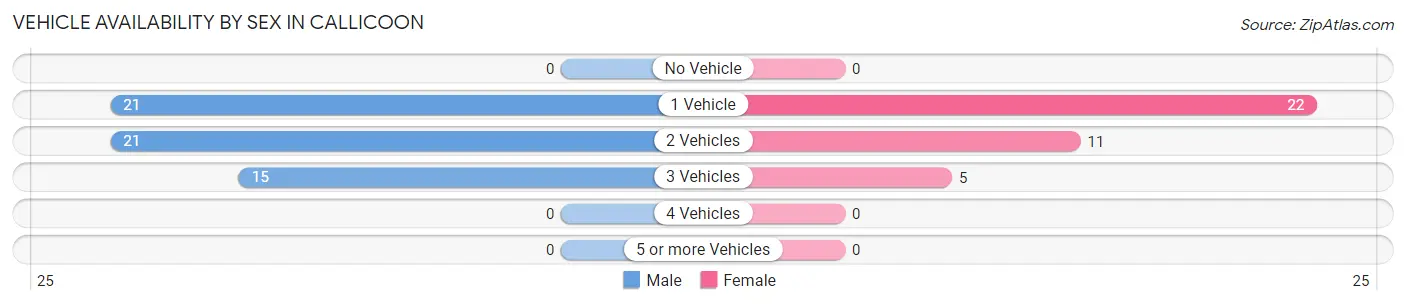
| Vehicles Available | Male | Female |
| No Vehicle | 0 (0.0%) | 0 (0.0%) |
| 1 Vehicle | 21 (36.8%) | 22 (57.9%) |
| 2 Vehicles | 21 (36.8%) | 11 (28.9%) |
| 3 Vehicles | 15 (26.3%) | 5 (13.2%) |
| 4 Vehicles | 0 (0.0%) | 0 (0.0%) |
| 5 or more Vehicles | 0 (0.0%) | 0 (0.0%) |
| Total | 57 (100.0%) | 38 (100.0%) |
Commute Time in Callicoon
The most frequently occuring commute durations in Callicoon are 45 to 59 minutes (27 commuters, 34.2%), 30 to 34 minutes (14 commuters, 17.7%), and 15 to 19 minutes (9 commuters, 11.4%).
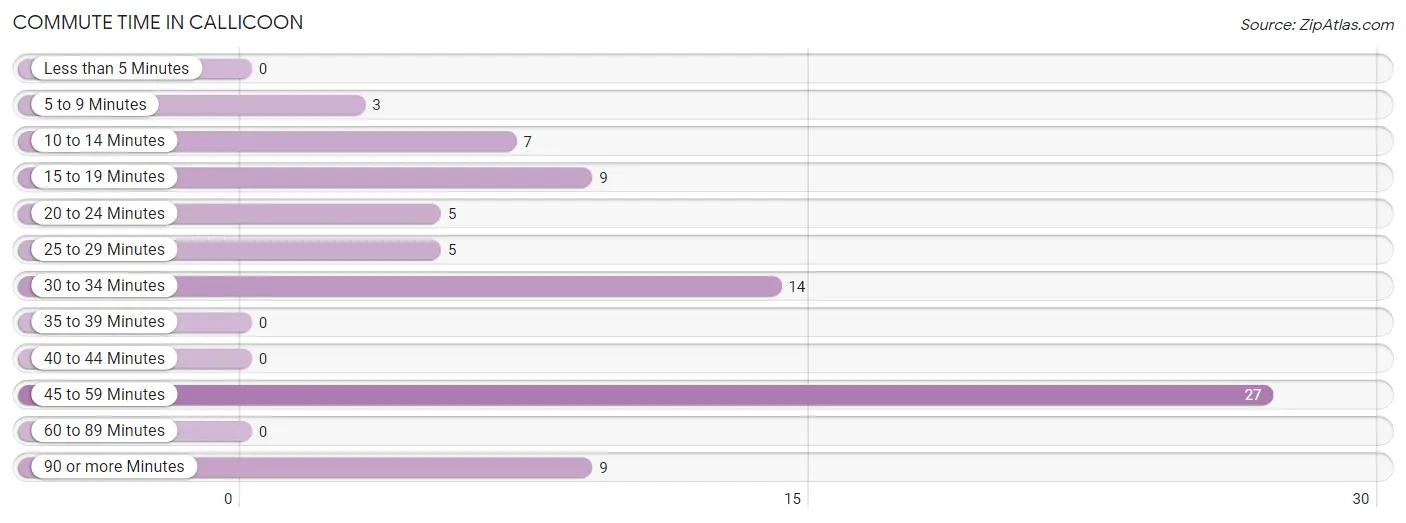
| Commute Time | # Commuters | % Commuters |
| Less than 5 Minutes | 0 | 0.0% |
| 5 to 9 Minutes | 3 | 3.8% |
| 10 to 14 Minutes | 7 | 8.9% |
| 15 to 19 Minutes | 9 | 11.4% |
| 20 to 24 Minutes | 5 | 6.3% |
| 25 to 29 Minutes | 5 | 6.3% |
| 30 to 34 Minutes | 14 | 17.7% |
| 35 to 39 Minutes | 0 | 0.0% |
| 40 to 44 Minutes | 0 | 0.0% |
| 45 to 59 Minutes | 27 | 34.2% |
| 60 to 89 Minutes | 0 | 0.0% |
| 90 or more Minutes | 9 | 11.4% |
Commute Time by Sex in Callicoon
The most common commute times in Callicoon are 45 to 59 minutes (27 commuters, 58.7%) for males and 30 to 34 minutes (14 commuters, 42.4%) for females.
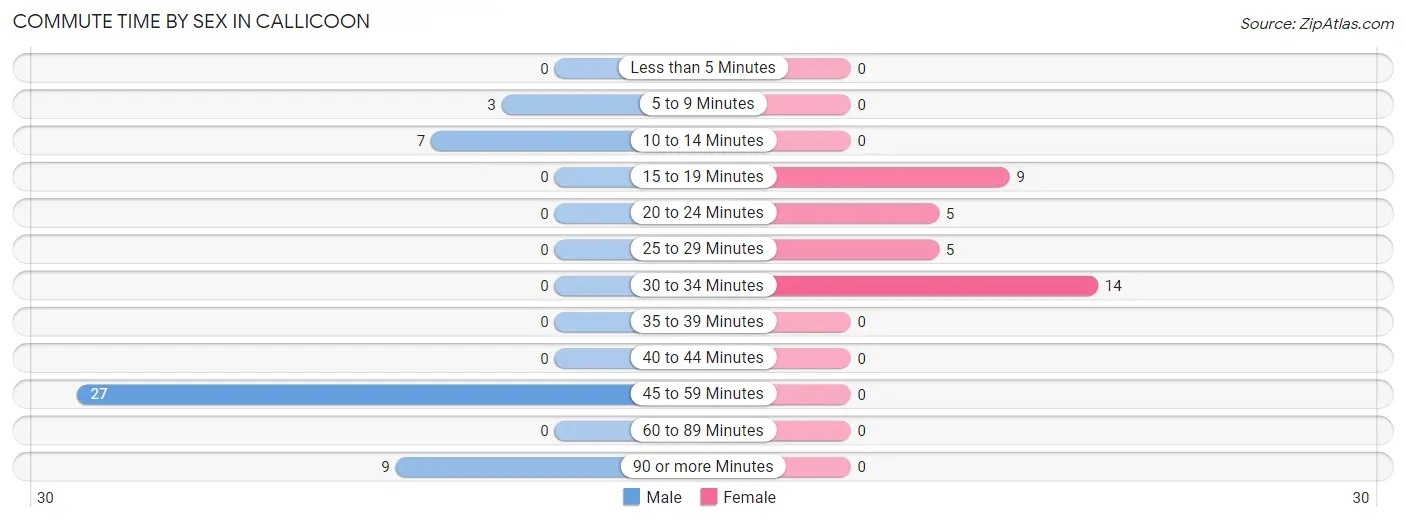
| Commute Time | Male | Female |
| Less than 5 Minutes | 0 (0.0%) | 0 (0.0%) |
| 5 to 9 Minutes | 3 (6.5%) | 0 (0.0%) |
| 10 to 14 Minutes | 7 (15.2%) | 0 (0.0%) |
| 15 to 19 Minutes | 0 (0.0%) | 9 (27.3%) |
| 20 to 24 Minutes | 0 (0.0%) | 5 (15.1%) |
| 25 to 29 Minutes | 0 (0.0%) | 5 (15.1%) |
| 30 to 34 Minutes | 0 (0.0%) | 14 (42.4%) |
| 35 to 39 Minutes | 0 (0.0%) | 0 (0.0%) |
| 40 to 44 Minutes | 0 (0.0%) | 0 (0.0%) |
| 45 to 59 Minutes | 27 (58.7%) | 0 (0.0%) |
| 60 to 89 Minutes | 0 (0.0%) | 0 (0.0%) |
| 90 or more Minutes | 9 (19.6%) | 0 (0.0%) |
Time of Departure to Work by Sex in Callicoon
The most frequent times of departure to work in Callicoon are 11:00 AM to 11:59 AM (14, 30.4%) for males and 8:00 AM to 8:29 AM (14, 42.4%) for females.
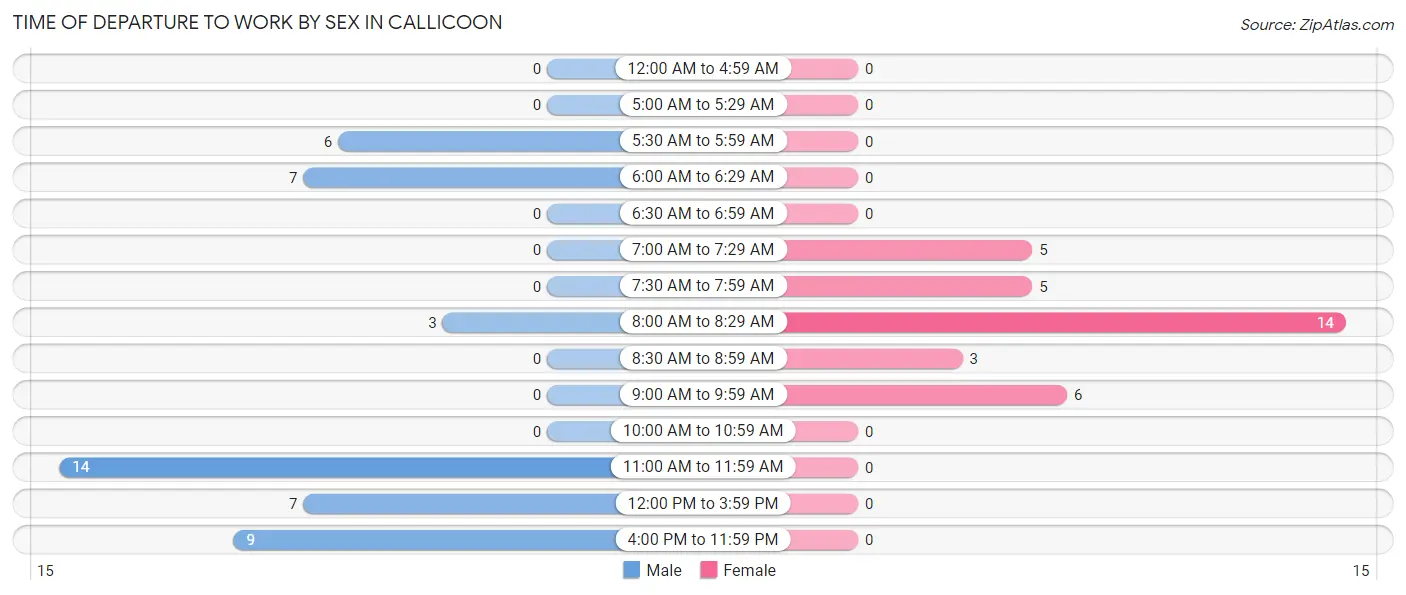
| Time of Departure | Male | Female |
| 12:00 AM to 4:59 AM | 0 (0.0%) | 0 (0.0%) |
| 5:00 AM to 5:29 AM | 0 (0.0%) | 0 (0.0%) |
| 5:30 AM to 5:59 AM | 6 (13.0%) | 0 (0.0%) |
| 6:00 AM to 6:29 AM | 7 (15.2%) | 0 (0.0%) |
| 6:30 AM to 6:59 AM | 0 (0.0%) | 0 (0.0%) |
| 7:00 AM to 7:29 AM | 0 (0.0%) | 5 (15.1%) |
| 7:30 AM to 7:59 AM | 0 (0.0%) | 5 (15.1%) |
| 8:00 AM to 8:29 AM | 3 (6.5%) | 14 (42.4%) |
| 8:30 AM to 8:59 AM | 0 (0.0%) | 3 (9.1%) |
| 9:00 AM to 9:59 AM | 0 (0.0%) | 6 (18.2%) |
| 10:00 AM to 10:59 AM | 0 (0.0%) | 0 (0.0%) |
| 11:00 AM to 11:59 AM | 14 (30.4%) | 0 (0.0%) |
| 12:00 PM to 3:59 PM | 7 (15.2%) | 0 (0.0%) |
| 4:00 PM to 11:59 PM | 9 (19.6%) | 0 (0.0%) |
| Total | 46 (100.0%) | 33 (100.0%) |
Housing Occupancy in Callicoon
Occupancy by Ownership in Callicoon
Of the total 126 dwellings in Callicoon, owner-occupied units account for 104 (82.5%), while renter-occupied units make up 22 (17.5%).
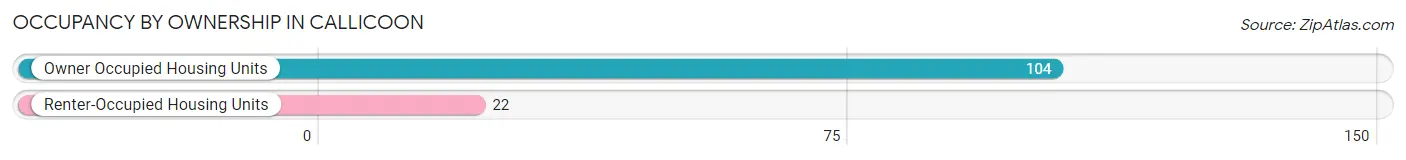
| Occupancy | # Housing Units | % Housing Units |
| Owner Occupied Housing Units | 104 | 82.5% |
| Renter-Occupied Housing Units | 22 | 17.5% |
| Total Occupied Housing Units | 126 | 100.0% |
Occupancy by Household Size in Callicoon
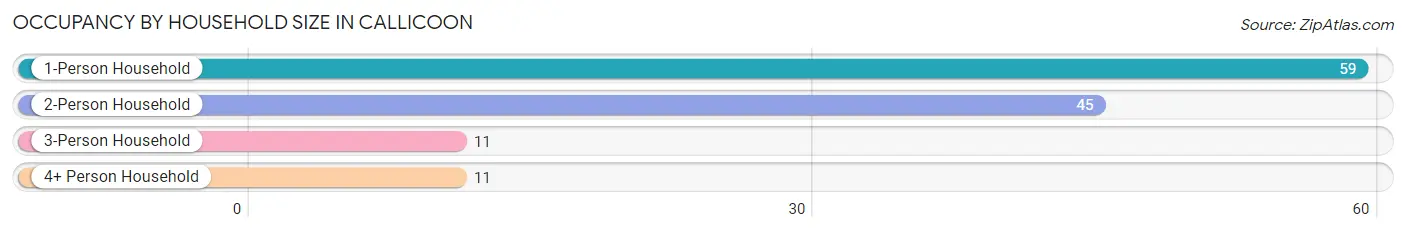
| Household Size | # Housing Units | % Housing Units |
| 1-Person Household | 59 | 46.8% |
| 2-Person Household | 45 | 35.7% |
| 3-Person Household | 11 | 8.7% |
| 4+ Person Household | 11 | 8.7% |
| Total Housing Units | 126 | 100.0% |
Occupancy by Ownership by Household Size in Callicoon
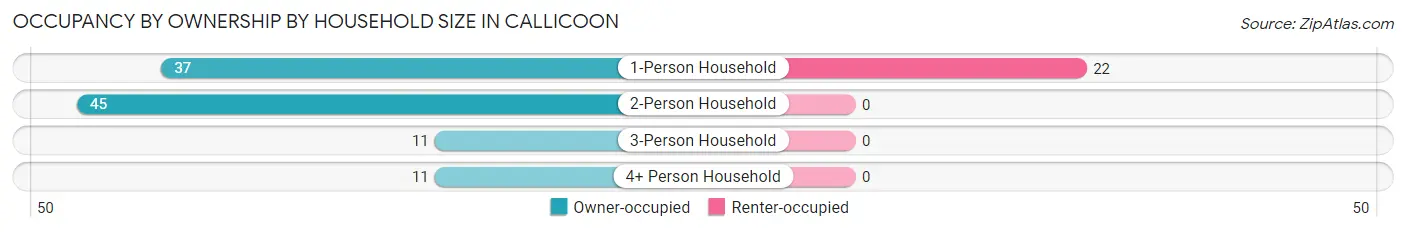
| Household Size | Owner-occupied | Renter-occupied |
| 1-Person Household | 37 (62.7%) | 22 (37.3%) |
| 2-Person Household | 45 (100.0%) | 0 (0.0%) |
| 3-Person Household | 11 (100.0%) | 0 (0.0%) |
| 4+ Person Household | 11 (100.0%) | 0 (0.0%) |
| Total Housing Units | 104 (82.5%) | 22 (17.5%) |
Occupancy by Educational Attainment in Callicoon
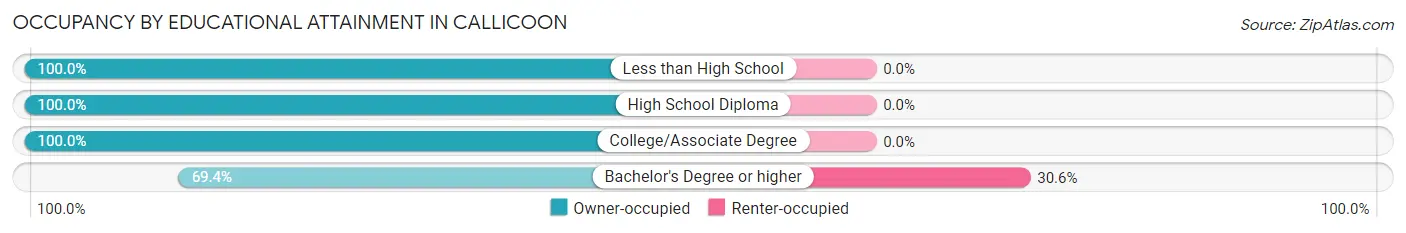
| Household Size | Owner-occupied | Renter-occupied |
| Less than High School | 15 (100.0%) | 0 (0.0%) |
| High School Diploma | 19 (100.0%) | 0 (0.0%) |
| College/Associate Degree | 20 (100.0%) | 0 (0.0%) |
| Bachelor's Degree or higher | 50 (69.4%) | 22 (30.6%) |
Occupancy by Age of Householder in Callicoon
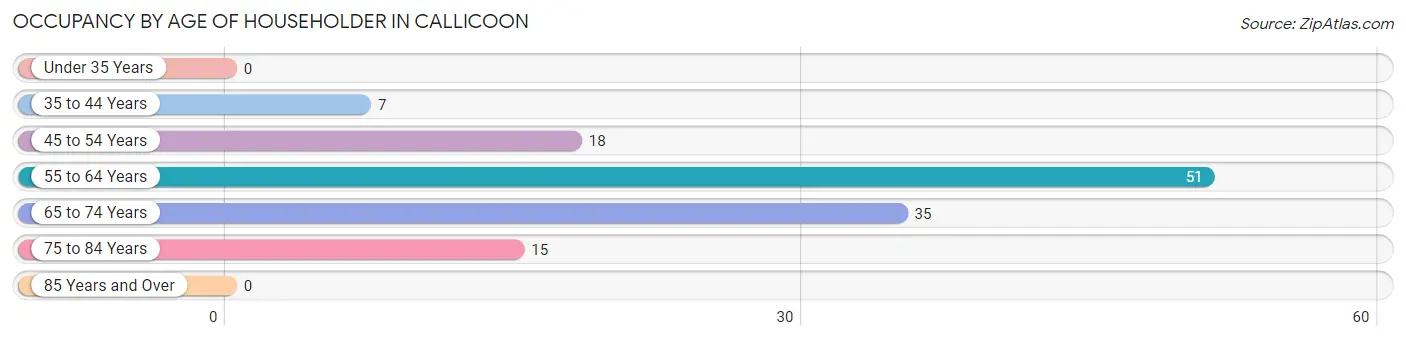
| Age Bracket | # Households | % Households |
| Under 35 Years | 0 | 0.0% |
| 35 to 44 Years | 7 | 5.6% |
| 45 to 54 Years | 18 | 14.3% |
| 55 to 64 Years | 51 | 40.5% |
| 65 to 74 Years | 35 | 27.8% |
| 75 to 84 Years | 15 | 11.9% |
| 85 Years and Over | 0 | 0.0% |
| Total | 126 | 100.0% |
Housing Finances in Callicoon
Median Income by Occupancy in Callicoon
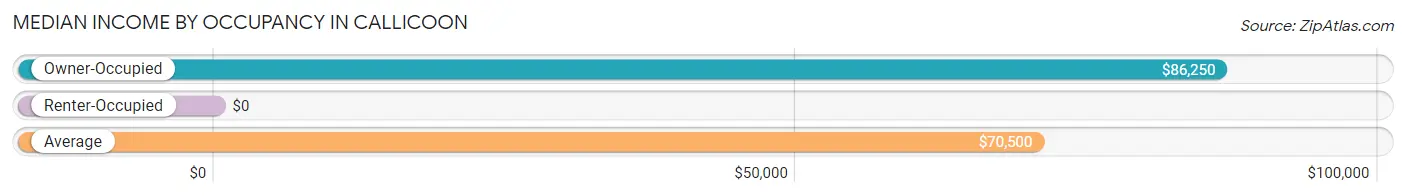
| Occupancy Type | # Households | Median Income |
| Owner-Occupied | 104 (82.5%) | $86,250 |
| Renter-Occupied | 22 (17.5%) | $0 |
| Average | 126 (100.0%) | $70,500 |
Occupancy by Householder Income Bracket in Callicoon
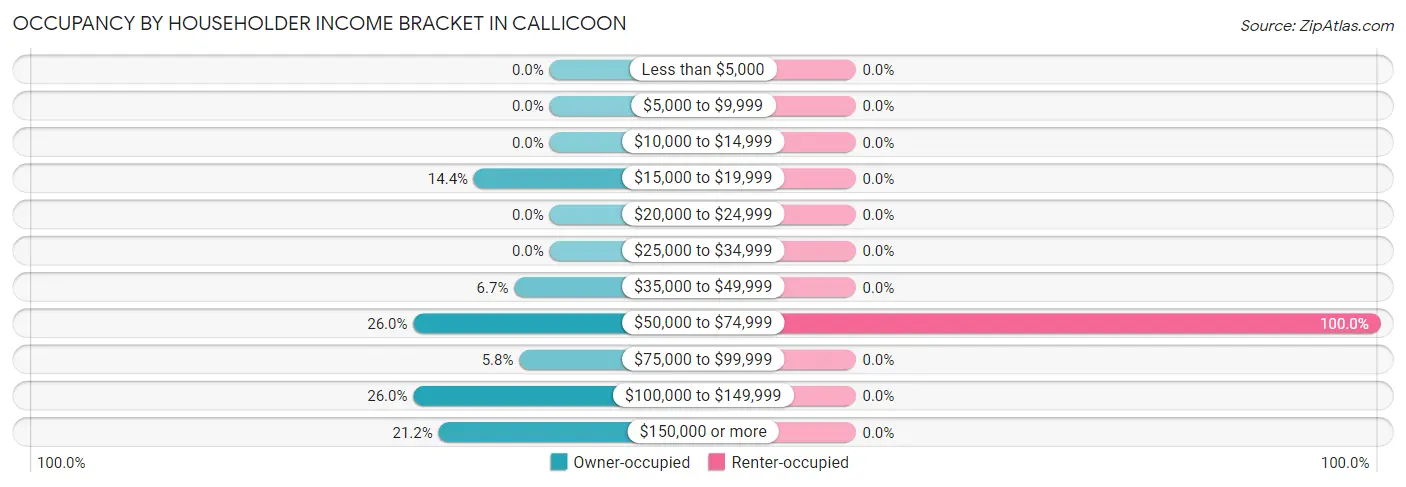
| Income Bracket | Owner-occupied | Renter-occupied |
| Less than $5,000 | 0 (0.0%) | 0 (0.0%) |
| $5,000 to $9,999 | 0 (0.0%) | 0 (0.0%) |
| $10,000 to $14,999 | 0 (0.0%) | 0 (0.0%) |
| $15,000 to $19,999 | 15 (14.4%) | 0 (0.0%) |
| $20,000 to $24,999 | 0 (0.0%) | 0 (0.0%) |
| $25,000 to $34,999 | 0 (0.0%) | 0 (0.0%) |
| $35,000 to $49,999 | 7 (6.7%) | 0 (0.0%) |
| $50,000 to $74,999 | 27 (26.0%) | 22 (100.0%) |
| $75,000 to $99,999 | 6 (5.8%) | 0 (0.0%) |
| $100,000 to $149,999 | 27 (26.0%) | 0 (0.0%) |
| $150,000 or more | 22 (21.1%) | 0 (0.0%) |
| Total | 104 (100.0%) | 22 (100.0%) |
Monthly Housing Cost Tiers in Callicoon
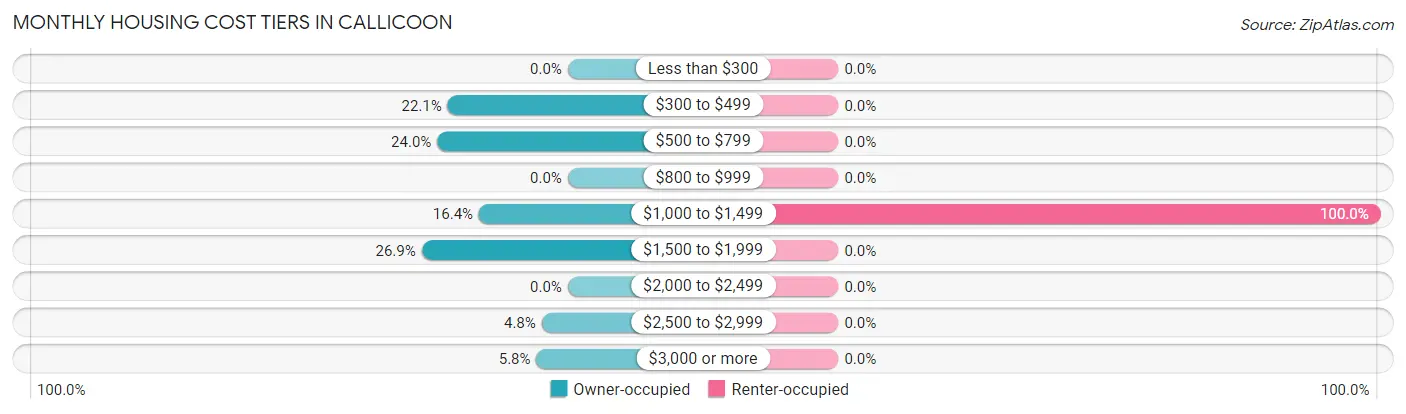
| Monthly Cost | Owner-occupied | Renter-occupied |
| Less than $300 | 0 (0.0%) | 0 (0.0%) |
| $300 to $499 | 23 (22.1%) | 0 (0.0%) |
| $500 to $799 | 25 (24.0%) | 0 (0.0%) |
| $800 to $999 | 0 (0.0%) | 0 (0.0%) |
| $1,000 to $1,499 | 17 (16.4%) | 22 (100.0%) |
| $1,500 to $1,999 | 28 (26.9%) | 0 (0.0%) |
| $2,000 to $2,499 | 0 (0.0%) | 0 (0.0%) |
| $2,500 to $2,999 | 5 (4.8%) | 0 (0.0%) |
| $3,000 or more | 6 (5.8%) | 0 (0.0%) |
| Total | 104 (100.0%) | 22 (100.0%) |
Physical Housing Characteristics in Callicoon
Housing Structures in Callicoon
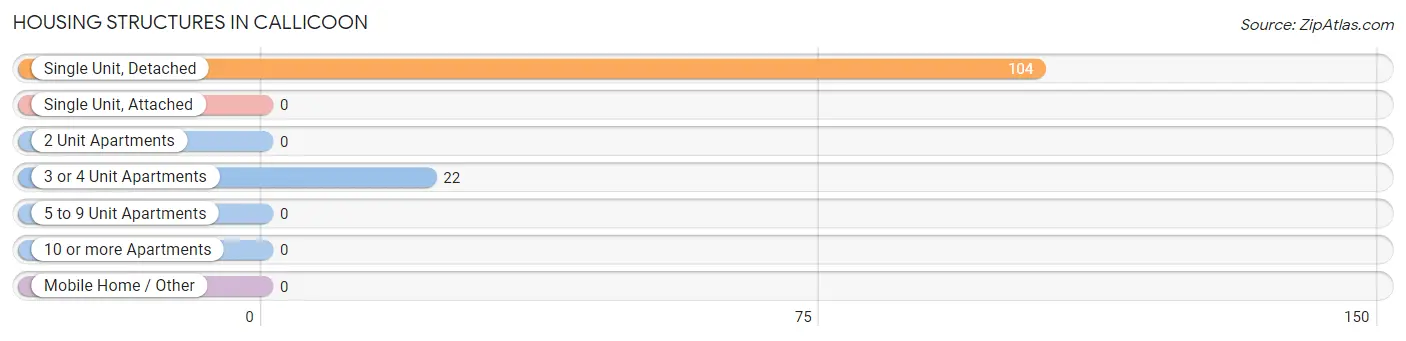
| Structure Type | # Housing Units | % Housing Units |
| Single Unit, Detached | 104 | 82.5% |
| Single Unit, Attached | 0 | 0.0% |
| 2 Unit Apartments | 0 | 0.0% |
| 3 or 4 Unit Apartments | 22 | 17.5% |
| 5 to 9 Unit Apartments | 0 | 0.0% |
| 10 or more Apartments | 0 | 0.0% |
| Mobile Home / Other | 0 | 0.0% |
| Total | 126 | 100.0% |
Housing Structures by Occupancy in Callicoon
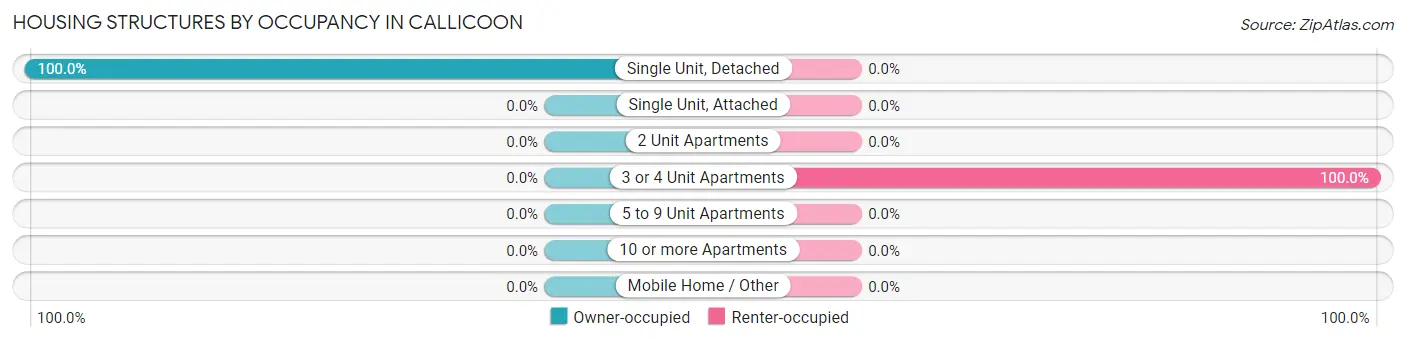
| Structure Type | Owner-occupied | Renter-occupied |
| Single Unit, Detached | 104 (100.0%) | 0 (0.0%) |
| Single Unit, Attached | 0 (0.0%) | 0 (0.0%) |
| 2 Unit Apartments | 0 (0.0%) | 0 (0.0%) |
| 3 or 4 Unit Apartments | 0 (0.0%) | 22 (100.0%) |
| 5 to 9 Unit Apartments | 0 (0.0%) | 0 (0.0%) |
| 10 or more Apartments | 0 (0.0%) | 0 (0.0%) |
| Mobile Home / Other | 0 (0.0%) | 0 (0.0%) |
| Total | 104 (82.5%) | 22 (17.5%) |
Housing Structures by Number of Rooms in Callicoon
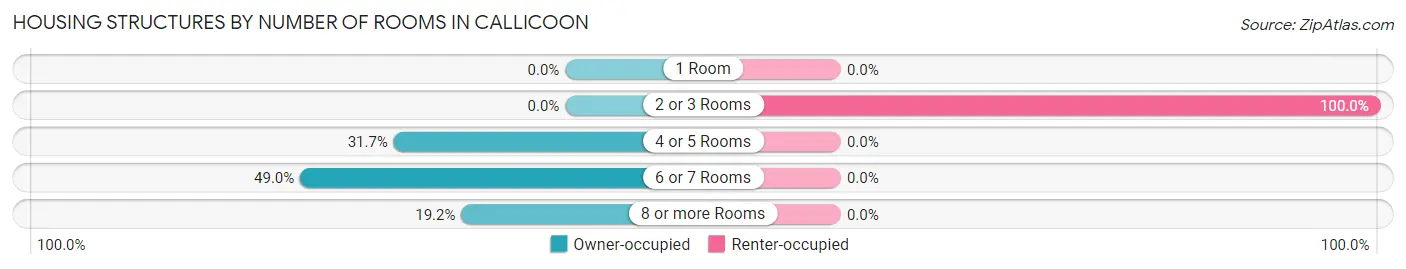
| Number of Rooms | Owner-occupied | Renter-occupied |
| 1 Room | 0 (0.0%) | 0 (0.0%) |
| 2 or 3 Rooms | 0 (0.0%) | 22 (100.0%) |
| 4 or 5 Rooms | 33 (31.7%) | 0 (0.0%) |
| 6 or 7 Rooms | 51 (49.0%) | 0 (0.0%) |
| 8 or more Rooms | 20 (19.2%) | 0 (0.0%) |
| Total | 104 (100.0%) | 22 (100.0%) |
Housing Structure by Heating Type in Callicoon
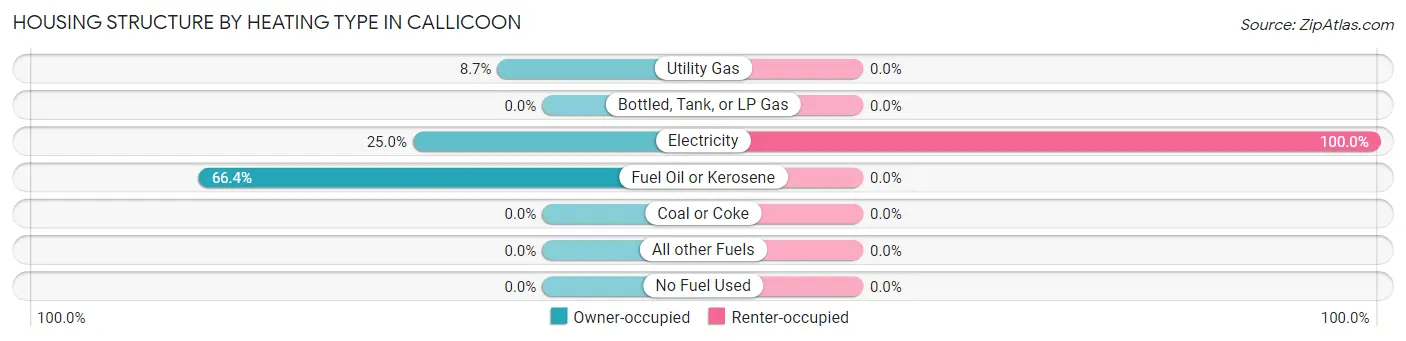
| Heating Type | Owner-occupied | Renter-occupied |
| Utility Gas | 9 (8.6%) | 0 (0.0%) |
| Bottled, Tank, or LP Gas | 0 (0.0%) | 0 (0.0%) |
| Electricity | 26 (25.0%) | 22 (100.0%) |
| Fuel Oil or Kerosene | 69 (66.3%) | 0 (0.0%) |
| Coal or Coke | 0 (0.0%) | 0 (0.0%) |
| All other Fuels | 0 (0.0%) | 0 (0.0%) |
| No Fuel Used | 0 (0.0%) | 0 (0.0%) |
| Total | 104 (100.0%) | 22 (100.0%) |
Household Vehicle Usage in Callicoon
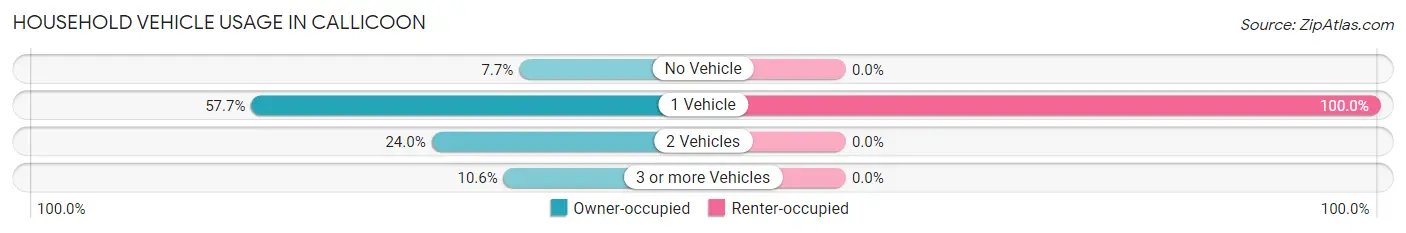
| Vehicles per Household | Owner-occupied | Renter-occupied |
| No Vehicle | 8 (7.7%) | 0 (0.0%) |
| 1 Vehicle | 60 (57.7%) | 22 (100.0%) |
| 2 Vehicles | 25 (24.0%) | 0 (0.0%) |
| 3 or more Vehicles | 11 (10.6%) | 0 (0.0%) |
| Total | 104 (100.0%) | 22 (100.0%) |
Real Estate & Mortgages in Callicoon
Real Estate and Mortgage Overview in Callicoon
| Characteristic | Without Mortgage | With Mortgage |
| Housing Units | 60 | 44 |
| Median Property Value | $122,100 | $315,800 |
| Median Household Income | $66,250 | $19 |
| Monthly Housing Costs | $537 | $6 |
| Real Estate Taxes | $2,882 | $0 |
Property Value by Mortgage Status in Callicoon
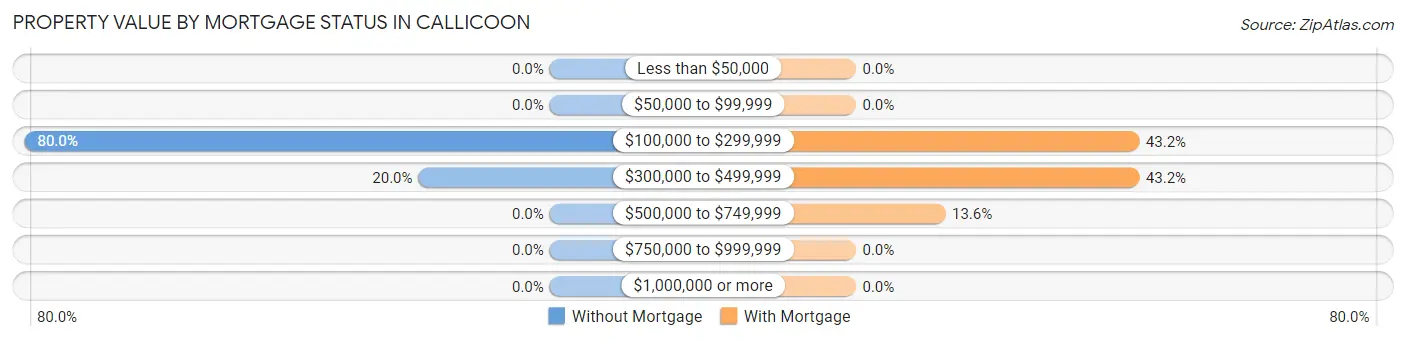
| Property Value | Without Mortgage | With Mortgage |
| Less than $50,000 | 0 (0.0%) | 0 (0.0%) |
| $50,000 to $99,999 | 0 (0.0%) | 0 (0.0%) |
| $100,000 to $299,999 | 48 (80.0%) | 19 (43.2%) |
| $300,000 to $499,999 | 12 (20.0%) | 19 (43.2%) |
| $500,000 to $749,999 | 0 (0.0%) | 6 (13.6%) |
| $750,000 to $999,999 | 0 (0.0%) | 0 (0.0%) |
| $1,000,000 or more | 0 (0.0%) | 0 (0.0%) |
| Total | 60 (100.0%) | 44 (100.0%) |
Household Income by Mortgage Status in Callicoon
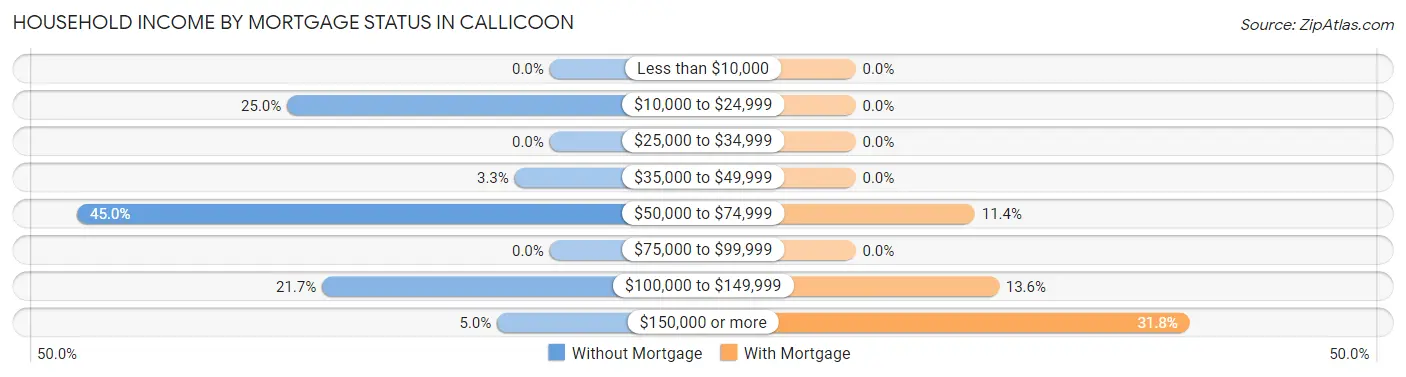
| Household Income | Without Mortgage | With Mortgage |
| Less than $10,000 | 0 (0.0%) | 0 (0.0%) |
| $10,000 to $24,999 | 15 (25.0%) | 0 (0.0%) |
| $25,000 to $34,999 | 0 (0.0%) | 0 (0.0%) |
| $35,000 to $49,999 | 2 (3.3%) | 0 (0.0%) |
| $50,000 to $74,999 | 27 (45.0%) | 5 (11.4%) |
| $75,000 to $99,999 | 0 (0.0%) | 0 (0.0%) |
| $100,000 to $149,999 | 13 (21.7%) | 6 (13.6%) |
| $150,000 or more | 3 (5.0%) | 14 (31.8%) |
| Total | 60 (100.0%) | 44 (100.0%) |
Property Value to Household Income Ratio in Callicoon
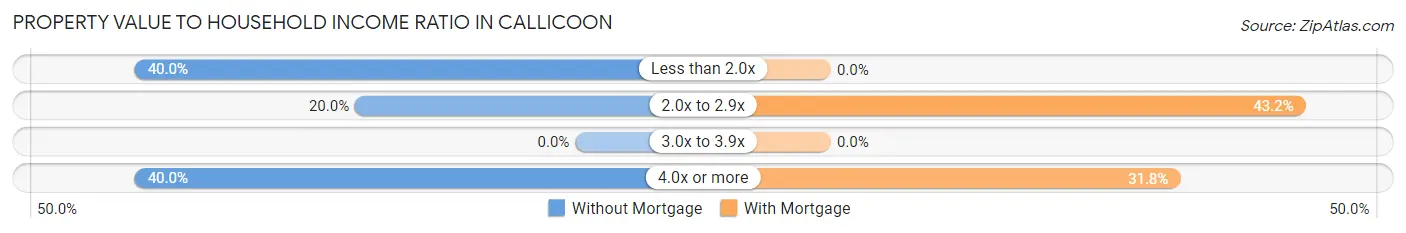
| Value-to-Income Ratio | Without Mortgage | With Mortgage |
| Less than 2.0x | 24 (40.0%) | 0 (0.0%) |
| 2.0x to 2.9x | 12 (20.0%) | 19 (43.2%) |
| 3.0x to 3.9x | 0 (0.0%) | 0 (0.0%) |
| 4.0x or more | 24 (40.0%) | 14 (31.8%) |
| Total | 60 (100.0%) | 44 (100.0%) |
Real Estate Taxes by Mortgage Status in Callicoon
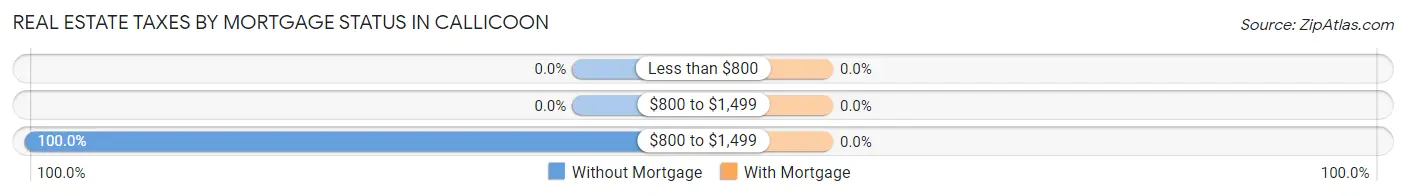
| Property Taxes | Without Mortgage | With Mortgage |
| Less than $800 | 0 (0.0%) | 0 (0.0%) |
| $800 to $1,499 | 0 (0.0%) | 0 (0.0%) |
| $800 to $1,499 | 60 (100.0%) | 0 (0.0%) |
| Total | 60 (100.0%) | 44 (100.0%) |
Health & Disability in Callicoon
Health Insurance Coverage by Age in Callicoon
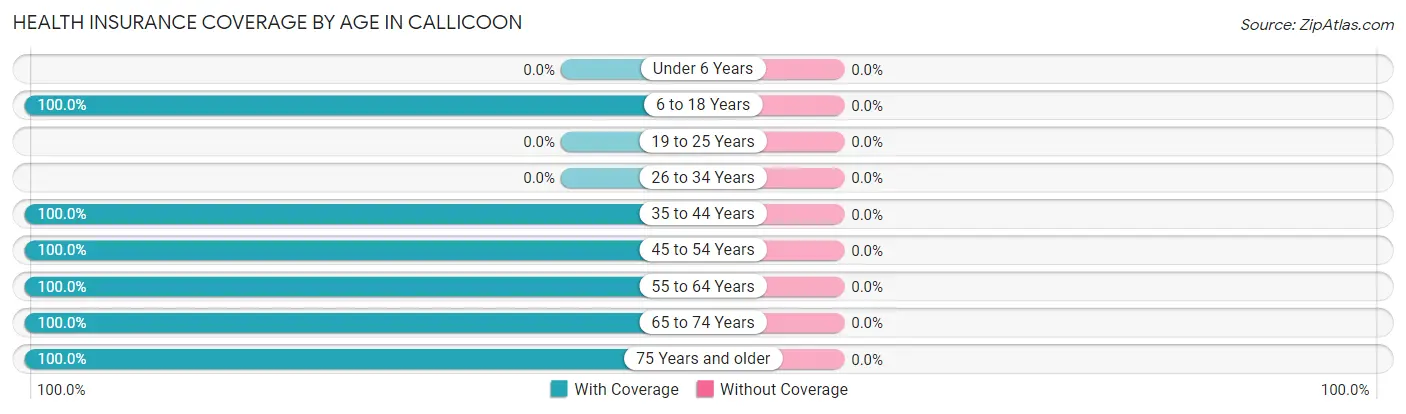
| Age Bracket | With Coverage | Without Coverage |
| Under 6 Years | 0 (0.0%) | 0 (0.0%) |
| 6 to 18 Years | 34 (100.0%) | 0 (0.0%) |
| 19 to 25 Years | 0 (0.0%) | 0 (0.0%) |
| 26 to 34 Years | 0 (0.0%) | 0 (0.0%) |
| 35 to 44 Years | 20 (100.0%) | 0 (0.0%) |
| 45 to 54 Years | 31 (100.0%) | 0 (0.0%) |
| 55 to 64 Years | 82 (100.0%) | 0 (0.0%) |
| 65 to 74 Years | 43 (100.0%) | 0 (0.0%) |
| 75 Years and older | 15 (100.0%) | 0 (0.0%) |
| Total | 225 (100.0%) | 0 (0.0%) |
Health Insurance Coverage by Citizenship Status in Callicoon
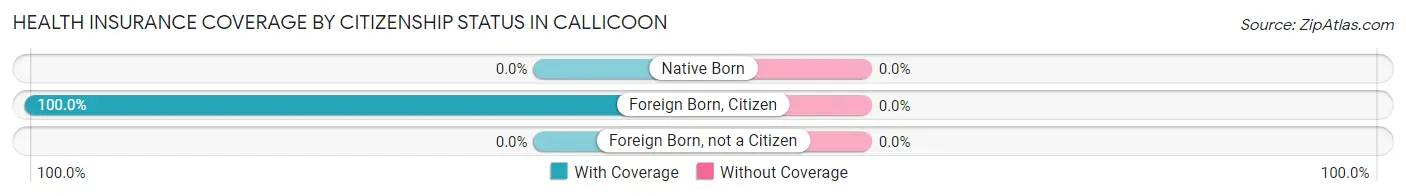
| Citizenship Status | With Coverage | Without Coverage |
| Native Born | 0 (0.0%) | 0 (0.0%) |
| Foreign Born, Citizen | 34 (100.0%) | 0 (0.0%) |
| Foreign Born, not a Citizen | 0 (0.0%) | 0 (0.0%) |
Health Insurance Coverage by Household Income in Callicoon
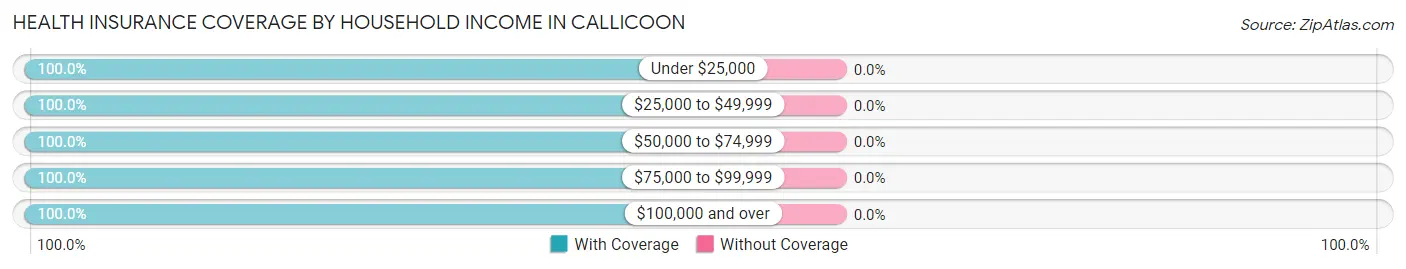
| Household Income | With Coverage | Without Coverage |
| Under $25,000 | 30 (100.0%) | 0 (0.0%) |
| $25,000 to $49,999 | 24 (100.0%) | 0 (0.0%) |
| $50,000 to $74,999 | 57 (100.0%) | 0 (0.0%) |
| $75,000 to $99,999 | 25 (100.0%) | 0 (0.0%) |
| $100,000 and over | 89 (100.0%) | 0 (0.0%) |
Public vs Private Health Insurance Coverage by Age in Callicoon
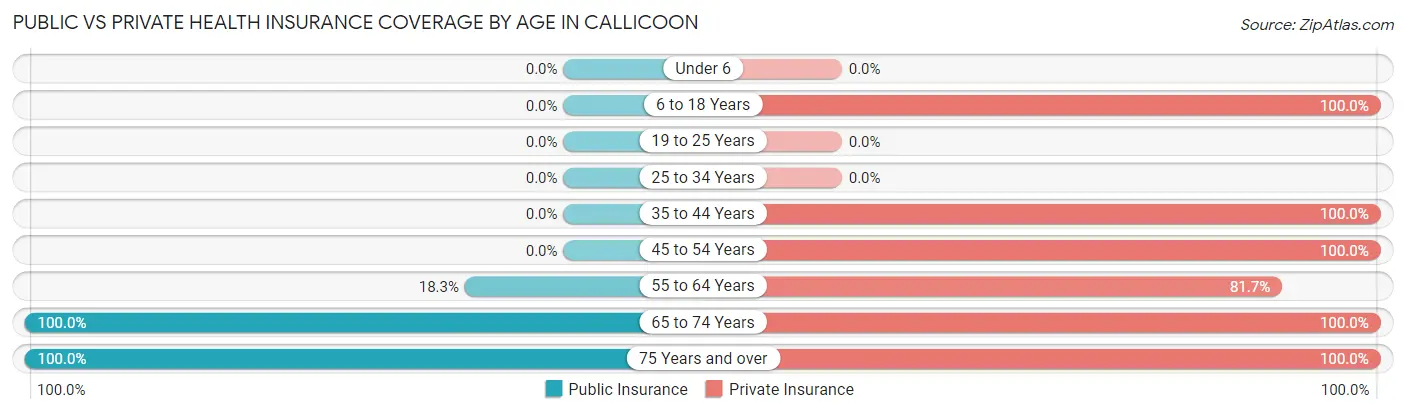
| Age Bracket | Public Insurance | Private Insurance |
| Under 6 | 0 (0.0%) | 0 (0.0%) |
| 6 to 18 Years | 0 (0.0%) | 34 (100.0%) |
| 19 to 25 Years | 0 (0.0%) | 0 (0.0%) |
| 25 to 34 Years | 0 (0.0%) | 0 (0.0%) |
| 35 to 44 Years | 0 (0.0%) | 20 (100.0%) |
| 45 to 54 Years | 0 (0.0%) | 31 (100.0%) |
| 55 to 64 Years | 15 (18.3%) | 67 (81.7%) |
| 65 to 74 Years | 43 (100.0%) | 43 (100.0%) |
| 75 Years and over | 15 (100.0%) | 15 (100.0%) |
| Total | 73 (32.4%) | 210 (93.3%) |
Disability Status by Sex by Age in Callicoon
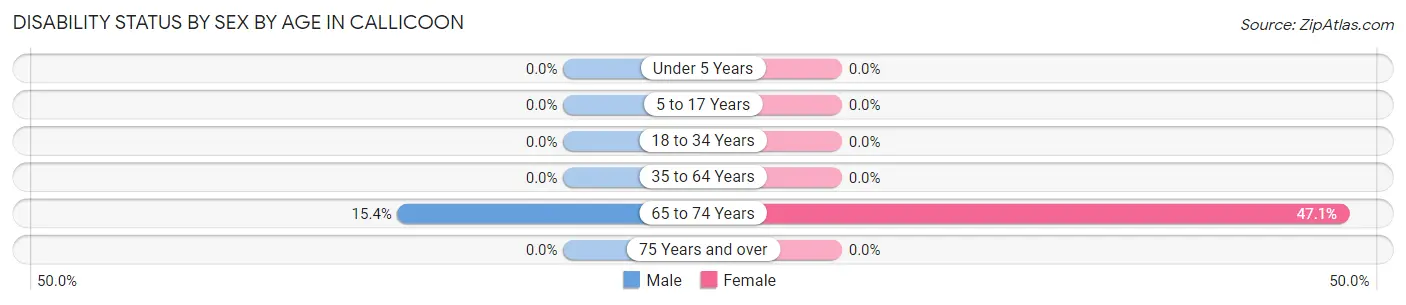
| Age Bracket | Male | Female |
| Under 5 Years | 0 (0.0%) | 0 (0.0%) |
| 5 to 17 Years | 0 (0.0%) | 0 (0.0%) |
| 18 to 34 Years | 0 (0.0%) | 0 (0.0%) |
| 35 to 64 Years | 0 (0.0%) | 0 (0.0%) |
| 65 to 74 Years | 4 (15.4%) | 8 (47.1%) |
| 75 Years and over | 0 (0.0%) | 0 (0.0%) |
Disability Class by Sex by Age in Callicoon
Disability Class: Hearing Difficulty
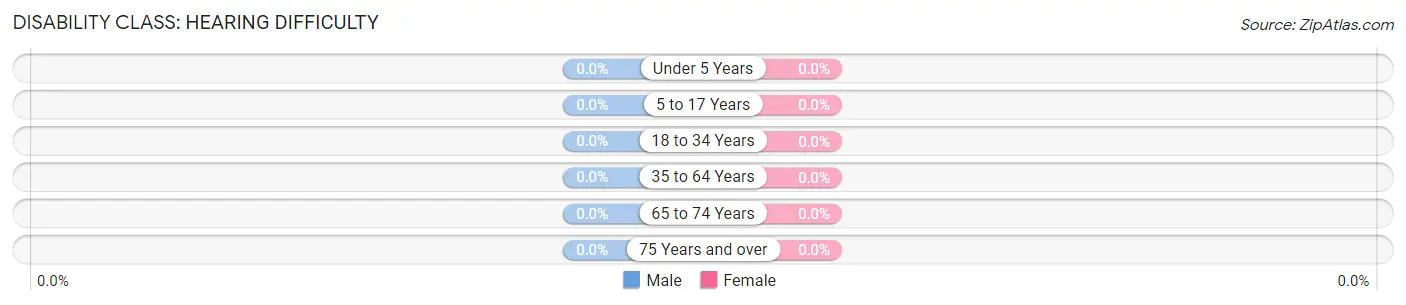
| Age Bracket | Male | Female |
| Under 5 Years | 0 (0.0%) | 0 (0.0%) |
| 5 to 17 Years | 0 (0.0%) | 0 (0.0%) |
| 18 to 34 Years | 0 (0.0%) | 0 (0.0%) |
| 35 to 64 Years | 0 (0.0%) | 0 (0.0%) |
| 65 to 74 Years | 0 (0.0%) | 0 (0.0%) |
| 75 Years and over | 0 (0.0%) | 0 (0.0%) |
Disability Class: Vision Difficulty
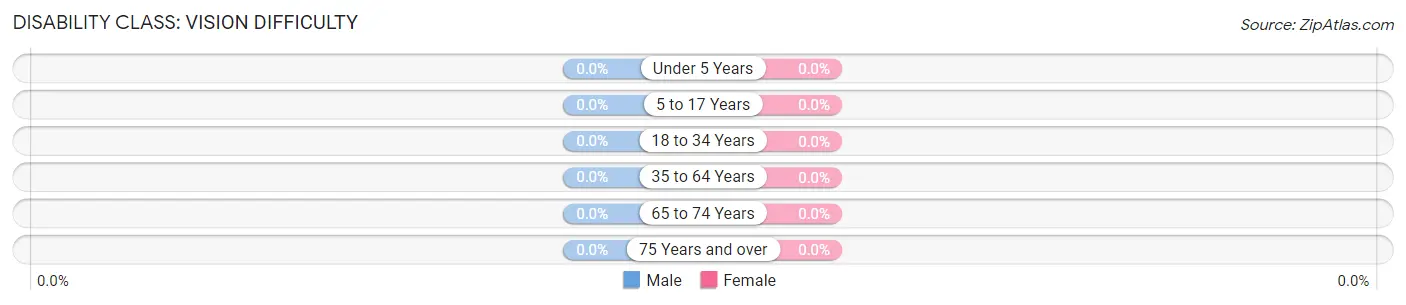
| Age Bracket | Male | Female |
| Under 5 Years | 0 (0.0%) | 0 (0.0%) |
| 5 to 17 Years | 0 (0.0%) | 0 (0.0%) |
| 18 to 34 Years | 0 (0.0%) | 0 (0.0%) |
| 35 to 64 Years | 0 (0.0%) | 0 (0.0%) |
| 65 to 74 Years | 0 (0.0%) | 0 (0.0%) |
| 75 Years and over | 0 (0.0%) | 0 (0.0%) |
Disability Class: Cognitive Difficulty
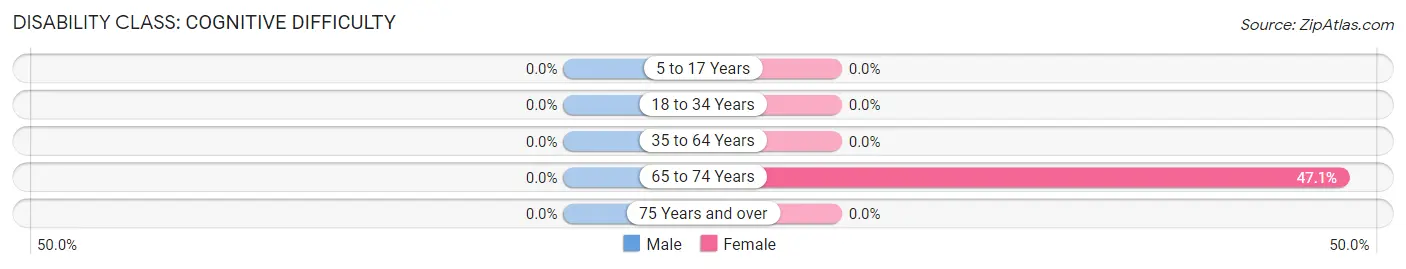
| Age Bracket | Male | Female |
| 5 to 17 Years | 0 (0.0%) | 0 (0.0%) |
| 18 to 34 Years | 0 (0.0%) | 0 (0.0%) |
| 35 to 64 Years | 0 (0.0%) | 0 (0.0%) |
| 65 to 74 Years | 0 (0.0%) | 8 (47.1%) |
| 75 Years and over | 0 (0.0%) | 0 (0.0%) |
Disability Class: Ambulatory Difficulty
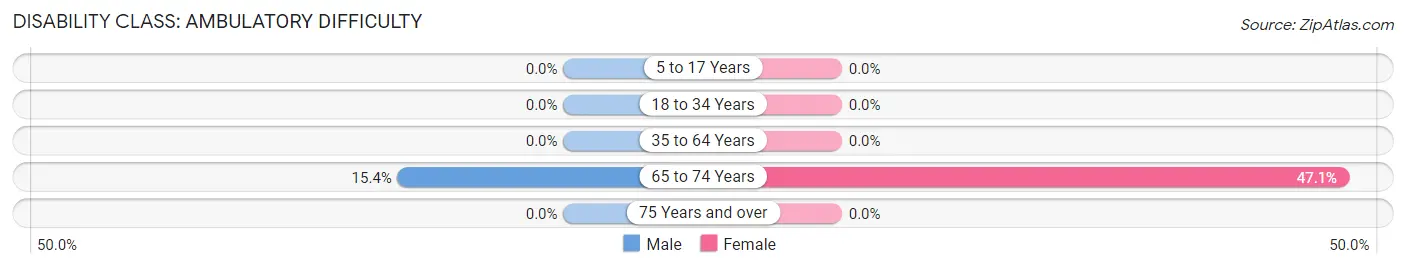
| Age Bracket | Male | Female |
| 5 to 17 Years | 0 (0.0%) | 0 (0.0%) |
| 18 to 34 Years | 0 (0.0%) | 0 (0.0%) |
| 35 to 64 Years | 0 (0.0%) | 0 (0.0%) |
| 65 to 74 Years | 4 (15.4%) | 8 (47.1%) |
| 75 Years and over | 0 (0.0%) | 0 (0.0%) |
Disability Class: Self-Care Difficulty
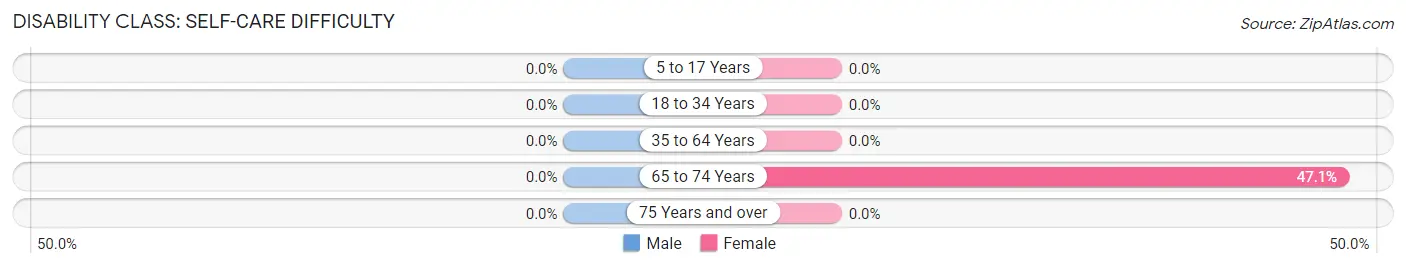
| Age Bracket | Male | Female |
| 5 to 17 Years | 0 (0.0%) | 0 (0.0%) |
| 18 to 34 Years | 0 (0.0%) | 0 (0.0%) |
| 35 to 64 Years | 0 (0.0%) | 0 (0.0%) |
| 65 to 74 Years | 0 (0.0%) | 8 (47.1%) |
| 75 Years and over | 0 (0.0%) | 0 (0.0%) |
Technology Access in Callicoon
Computing Device Access in Callicoon
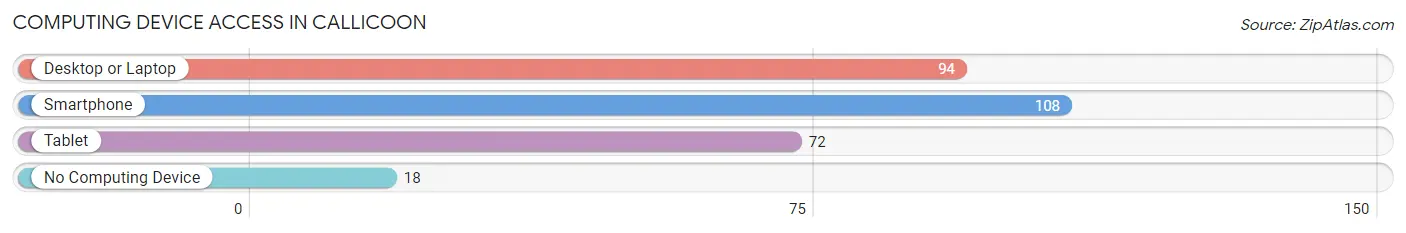
| Device Type | # Households | % Households |
| Desktop or Laptop | 94 | 74.6% |
| Smartphone | 108 | 85.7% |
| Tablet | 72 | 57.1% |
| No Computing Device | 18 | 14.3% |
| Total | 126 | 100.0% |
Internet Access in Callicoon
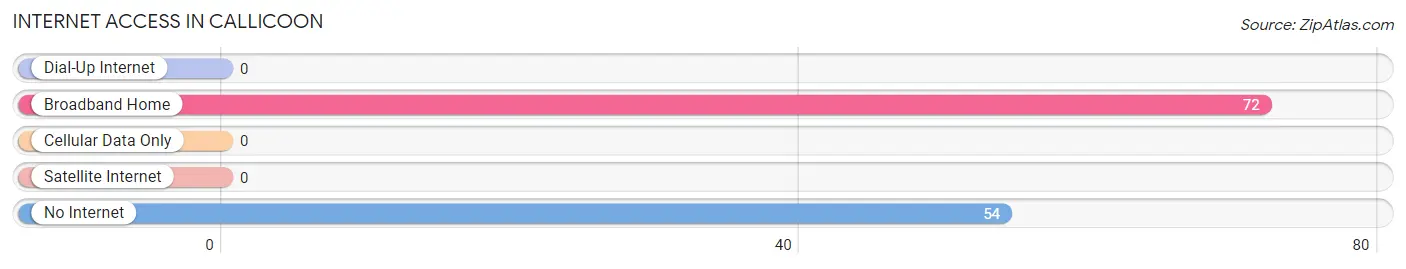
| Internet Type | # Households | % Households |
| Dial-Up Internet | 0 | 0.0% |
| Broadband Home | 72 | 57.1% |
| Cellular Data Only | 0 | 0.0% |
| Satellite Internet | 0 | 0.0% |
| No Internet | 54 | 42.9% |
| Total | 126 | 100.0% |
Callicoon Summary
Callicoon is a small town located in Sullivan County, New York, United States. It is situated on the western bank of the Delaware River, near the border of Pennsylvania. The town is part of the Catskill Mountains region and is home to a population of approximately 1,400 people.
History
The area that is now Callicoon was originally inhabited by the Lenape Native Americans. The first European settlers arrived in the area in the late 1700s, and the town was officially established in 1809. The town was named after the Callicoon Creek, which was named after a Native American chief.
In the early 1800s, the town was a major center for the lumber industry. The town was also home to several gristmills, sawmills, and tanneries. The Delaware and Hudson Canal was built in the area in 1828, and it provided a major transportation route for the lumber industry.
In the late 1800s, the town began to experience a decline in the lumber industry. This led to a shift in the economy towards agriculture and tourism. The town was also home to several resorts, which attracted visitors from New York City and other parts of the country.
Geography
Callicoon is located in the western part of Sullivan County, New York. It is situated on the western bank of the Delaware River, near the border of Pennsylvania. The town is part of the Catskill Mountains region and is home to a population of approximately 1,400 people.
The town covers an area of approximately 11.5 square miles and is located at an elevation of 1,000 feet. The terrain is mostly hilly and forested, with some areas of flat land. The town is home to several small lakes and streams, including the Callicoon Creek.
Economy
The economy of Callicoon is largely based on agriculture and tourism. The town is home to several farms, which produce a variety of crops, including corn, soybeans, and hay. The town is also home to several wineries, which produce a variety of wines.
The town is also home to several small businesses, including restaurants, shops, and galleries. The town is also home to several resorts, which attract visitors from New York City and other parts of the country.
Demographics
As of the 2010 census, the population of Callicoon was 1,399. The racial makeup of the town was 97.2% White, 0.6% African American, 0.2% Native American, 0.2% Asian, 0.1% Pacific Islander, 0.7% from other races, and 1.2% from two or more races. Hispanic or Latino of any race were 2.3% of the population.
The median household income in Callicoon was $45,000, and the median family income was $50,000. The per capita income was $20,000. About 10.3% of the population was below the poverty line.
Common Questions
What is Per Capita Income in Callicoon?
Per Capita income in Callicoon is $52,453.
What is the Median Family Income in Callicoon?
Median Family Income in Callicoon is $86,458.
What is the Median Household income in Callicoon?
Median Household Income in Callicoon is $70,500.
What is Inequality or Gini Index in Callicoon?
Inequality or Gini Index in Callicoon is 0.37.
What is the Total Population of Callicoon?
Total Population of Callicoon is 225.
What is the Total Male Population of Callicoon?
Total Male Population of Callicoon is 135.
What is the Total Female Population of Callicoon?
Total Female Population of Callicoon is 90.
What is the Ratio of Males per 100 Females in Callicoon?
There are 150.00 Males per 100 Females in Callicoon.
What is the Ratio of Females per 100 Males in Callicoon?
There are 66.67 Females per 100 Males in Callicoon.
What is the Median Population Age in Callicoon?
Median Population Age in Callicoon is 59.2 Years.
What is the Average Family Size in Callicoon
Average Family Size in Callicoon is 2.5 People.
What is the Average Household Size in Callicoon
Average Household Size in Callicoon is 1.8 People.
How Large is the Labor Force in Callicoon?
There are 122 People in the Labor Forcein in Callicoon.
What is the Percentage of People in the Labor Force in Callicoon?
60.1% of People are in the Labor Force in Callicoon.
What is the Unemployment Rate in Callicoon?
Unemployment Rate in Callicoon is 18.0%.