Menands, NY Map & Demographics
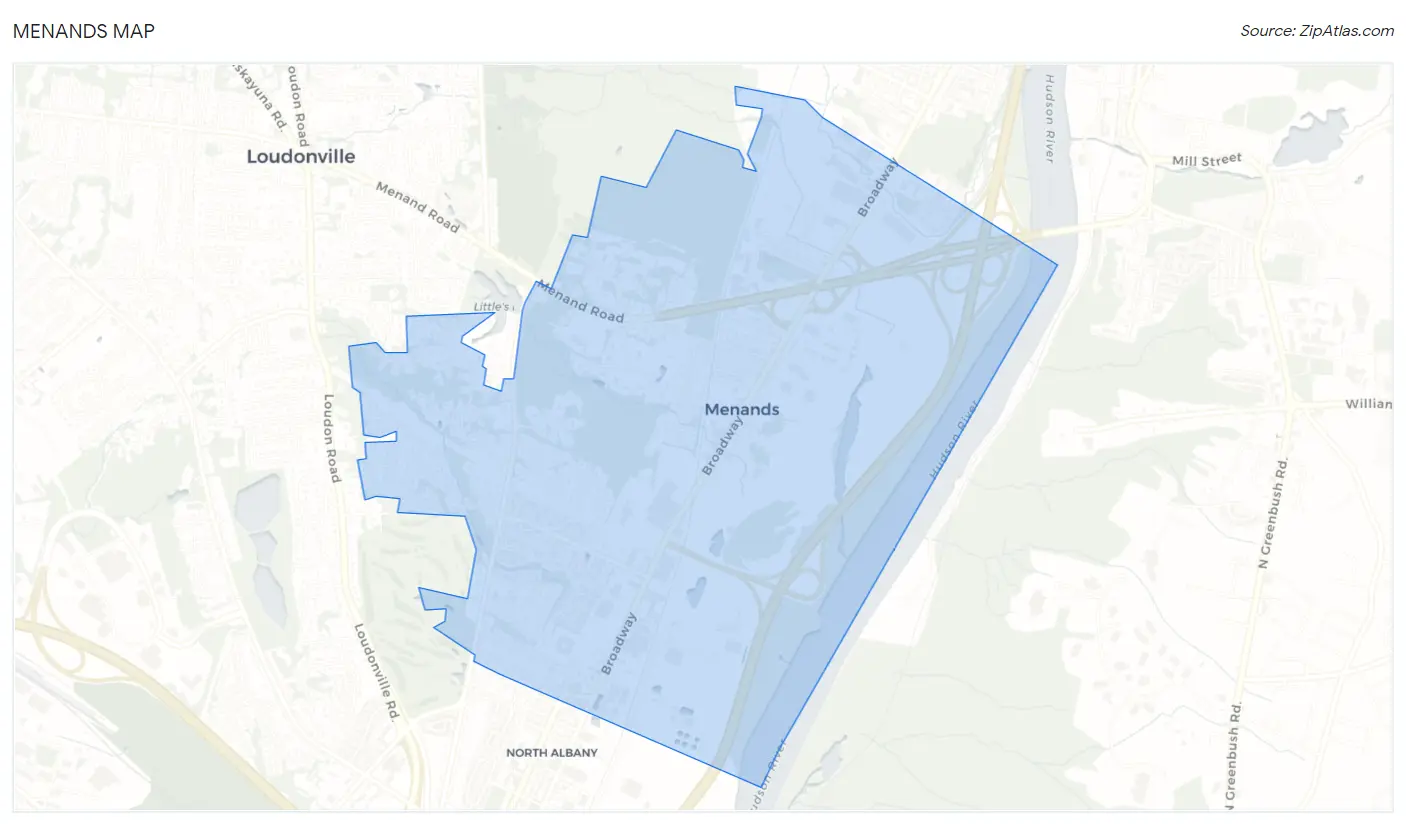
Menands Map
Menands Overview
$39,801
PER CAPITA INCOME
$82,563
AVG FAMILY INCOME
$73,000
AVG HOUSEHOLD INCOME
17.8%
WAGE / INCOME GAP [ % ]
82.2¢/ $1
WAGE / INCOME GAP [ $ ]
0.31
INEQUALITY / GINI INDEX
4,512
TOTAL POPULATION
2,344
MALE POPULATION
2,168
FEMALE POPULATION
108.12
MALES / 100 FEMALES
92.49
FEMALES / 100 MALES
36.1
MEDIAN AGE
2.9
AVG FAMILY SIZE
2.0
AVG HOUSEHOLD SIZE
2,541
LABOR FORCE [ PEOPLE ]
72.3%
PERCENT IN LABOR FORCE
3.1%
UNEMPLOYMENT RATE
Menands Area Codes
Income in Menands
Income Overview in Menands
Per Capita Income in Menands is $39,801, while median incomes of families and households are $82,563 and $73,000 respectively.
| Characteristic | Number | Measure |
| Per Capita Income | 4,512 | $39,801 |
| Median Family Income | 1,047 | $82,563 |
| Mean Family Income | 1,047 | $90,830 |
| Median Household Income | 2,214 | $73,000 |
| Mean Household Income | 2,214 | $81,438 |
| Income Deficit | 1,047 | $0 |
| Wage / Income Gap (%) | 4,512 | 17.85% |
| Wage / Income Gap ($) | 4,512 | 82.15¢ per $1 |
| Gini / Inequality Index | 4,512 | 0.31 |
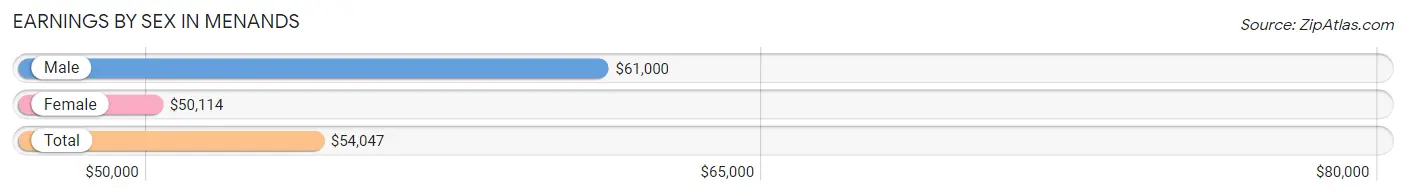
Earnings by Sex in Menands
Average Earnings in Menands are $54,047, $61,000 for men and $50,114 for women, a difference of 17.8%.
| Sex | Number | Average Earnings |
| Male | 1,424 (54.3%) | $61,000 |
| Female | 1,197 (45.7%) | $50,114 |
| Total | 2,621 (100.0%) | $54,047 |
Earnings by Sex by Income Bracket in Menands
The most common earnings brackets in Menands are $75,000 to $99,999 for men (334 | 23.5%) and $75,000 to $99,999 for women (241 | 20.1%).
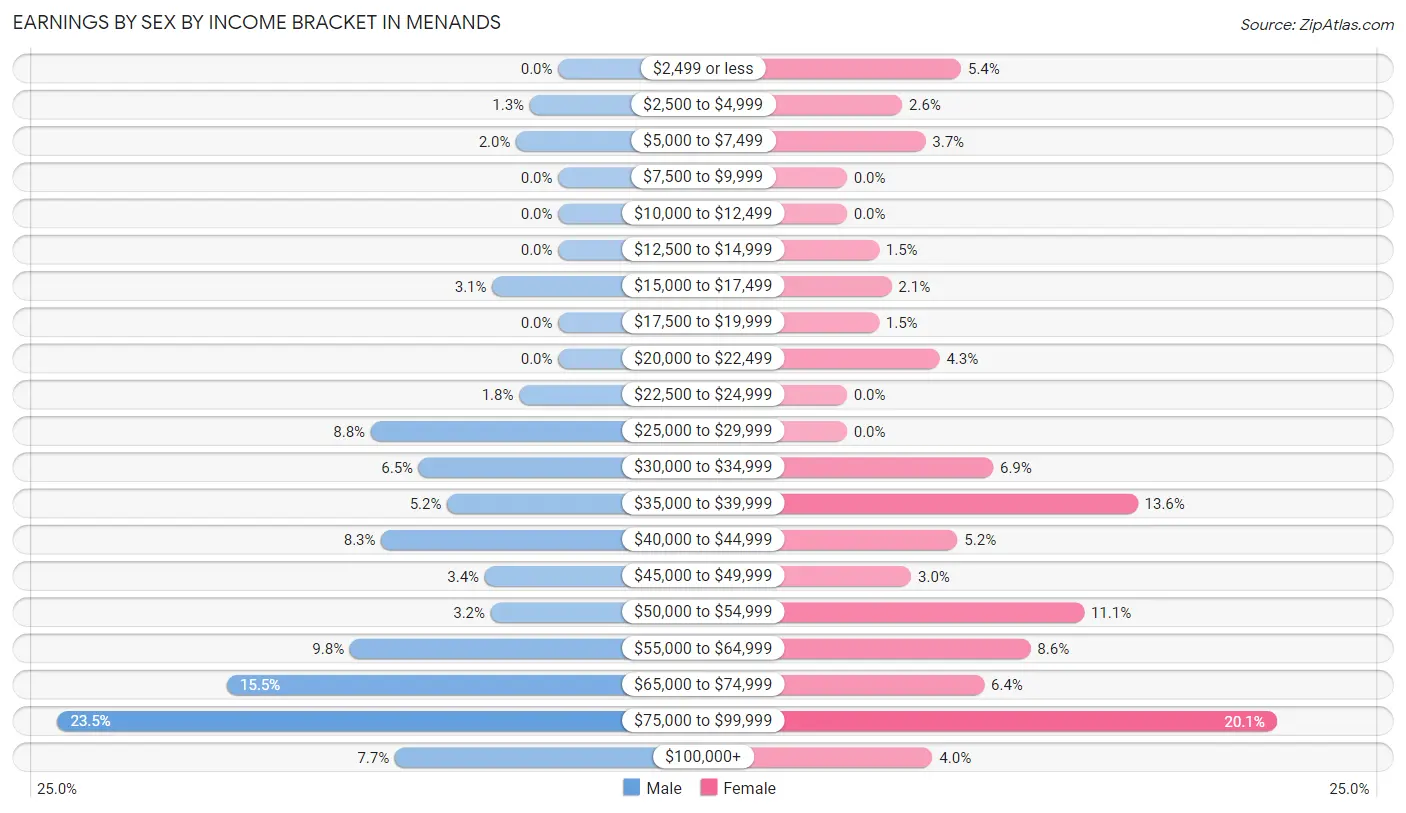
| Income | Male | Female |
| $2,499 or less | 0 (0.0%) | 64 (5.3%) |
| $2,500 to $4,999 | 19 (1.3%) | 31 (2.6%) |
| $5,000 to $7,499 | 28 (2.0%) | 44 (3.7%) |
| $7,500 to $9,999 | 0 (0.0%) | 0 (0.0%) |
| $10,000 to $12,499 | 0 (0.0%) | 0 (0.0%) |
| $12,500 to $14,999 | 0 (0.0%) | 18 (1.5%) |
| $15,000 to $17,499 | 44 (3.1%) | 25 (2.1%) |
| $17,500 to $19,999 | 0 (0.0%) | 18 (1.5%) |
| $20,000 to $22,499 | 0 (0.0%) | 52 (4.3%) |
| $22,500 to $24,999 | 26 (1.8%) | 0 (0.0%) |
| $25,000 to $29,999 | 125 (8.8%) | 0 (0.0%) |
| $30,000 to $34,999 | 93 (6.5%) | 82 (6.9%) |
| $35,000 to $39,999 | 74 (5.2%) | 163 (13.6%) |
| $40,000 to $44,999 | 118 (8.3%) | 62 (5.2%) |
| $45,000 to $49,999 | 49 (3.4%) | 36 (3.0%) |
| $50,000 to $54,999 | 45 (3.2%) | 133 (11.1%) |
| $55,000 to $64,999 | 139 (9.8%) | 103 (8.6%) |
| $65,000 to $74,999 | 221 (15.5%) | 77 (6.4%) |
| $75,000 to $99,999 | 334 (23.5%) | 241 (20.1%) |
| $100,000+ | 109 (7.6%) | 48 (4.0%) |
| Total | 1,424 (100.0%) | 1,197 (100.0%) |
Earnings by Sex by Educational Attainment in Menands
Average earnings in Menands are $61,266 for men and $51,607 for women, a difference of 15.8%. Men with an educational attainment of bachelor's degree enjoy the highest average annual earnings of $76,027, while those with college or associate's degree education earn the least with $49,052. Women with an educational attainment of graduate degree earn the most with the average annual earnings of $71,635, while those with college or associate's degree education have the smallest earnings of $39,859.
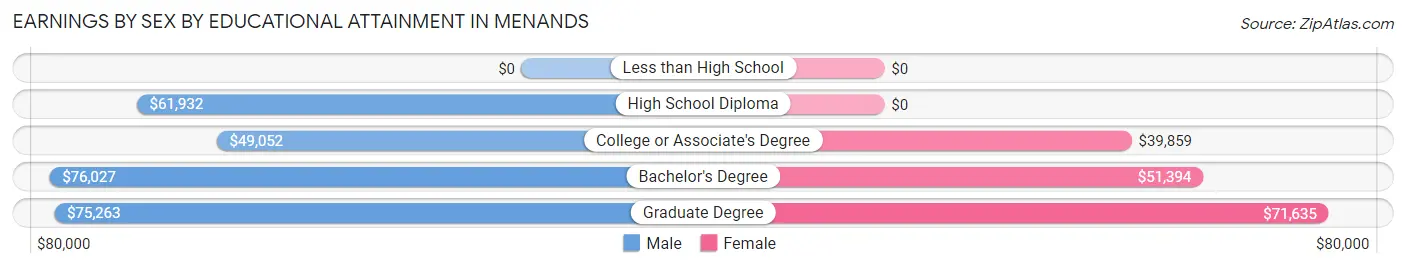
| Educational Attainment | Male Income | Female Income |
| Less than High School | - | - |
| High School Diploma | $61,932 | $0 |
| College or Associate's Degree | $49,052 | $39,859 |
| Bachelor's Degree | $76,027 | $51,394 |
| Graduate Degree | $75,263 | $71,635 |
| Total | $61,266 | $51,607 |
Family Income in Menands
Family Income Brackets in Menands
According to the Menands family income data, there are 260 families falling into the $75,000 to $99,999 income range, which is the most common income bracket and makes up 24.8% of all families.
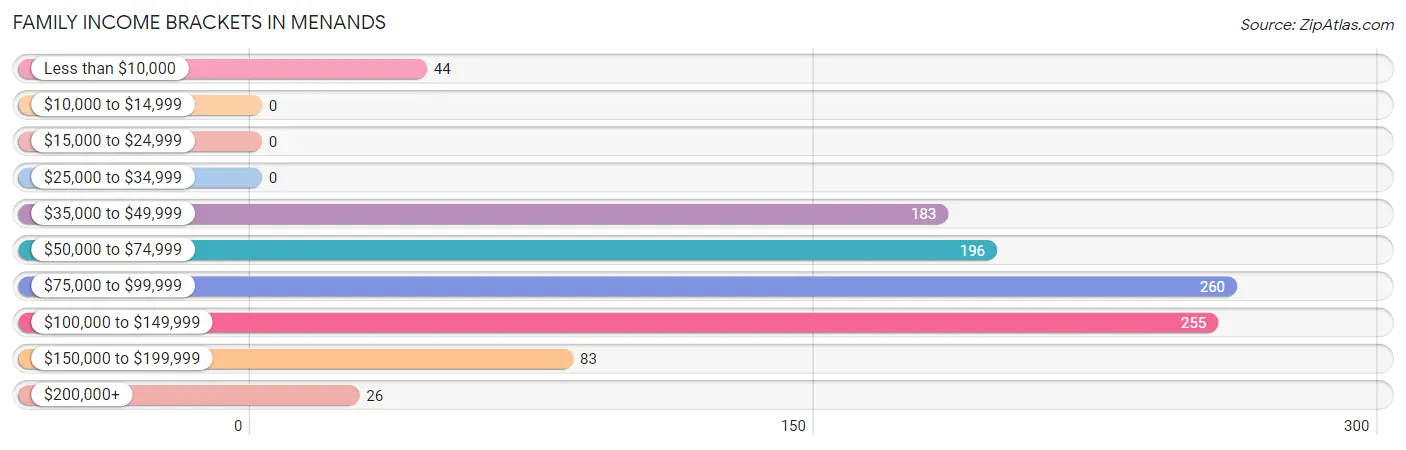
| Income Bracket | # Families | % Families |
| Less than $10,000 | 44 | 4.2% |
| $10,000 to $14,999 | 0 | 0.0% |
| $15,000 to $24,999 | 0 | 0.0% |
| $25,000 to $34,999 | 0 | 0.0% |
| $35,000 to $49,999 | 183 | 17.5% |
| $50,000 to $74,999 | 196 | 18.7% |
| $75,000 to $99,999 | 260 | 24.8% |
| $100,000 to $149,999 | 255 | 24.4% |
| $150,000 to $199,999 | 83 | 7.9% |
| $200,000+ | 26 | 2.5% |
Family Income by Famaliy Size in Menands
3-person families (191 | 18.2%) account for the highest median family income in Menands with $101,094 per family, while 2-person families (644 | 61.5%) have the highest median income of $41,412 per family member.
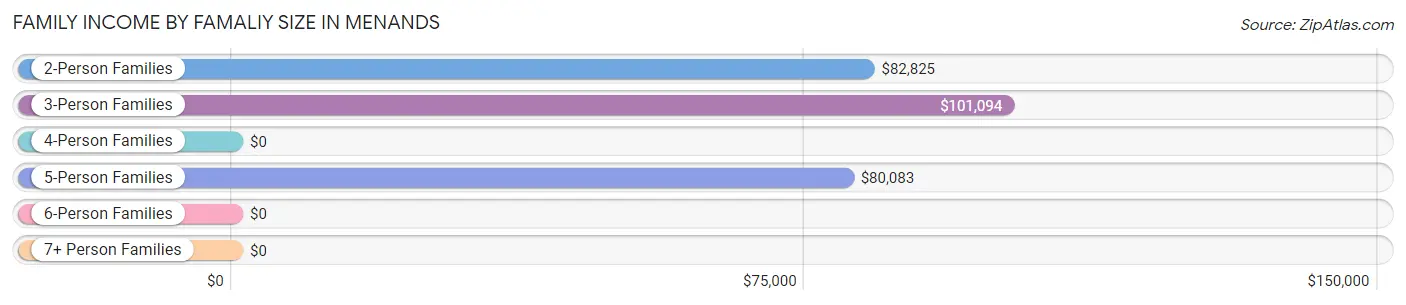
| Income Bracket | # Families | Median Income |
| 2-Person Families | 644 (61.5%) | $82,825 |
| 3-Person Families | 191 (18.2%) | $101,094 |
| 4-Person Families | 74 (7.1%) | $0 |
| 5-Person Families | 138 (13.2%) | $80,083 |
| 6-Person Families | 0 (0.0%) | $0 |
| 7+ Person Families | 0 (0.0%) | $0 |
| Total | 1,047 (100.0%) | $82,563 |
Family Income by Number of Earners in Menands
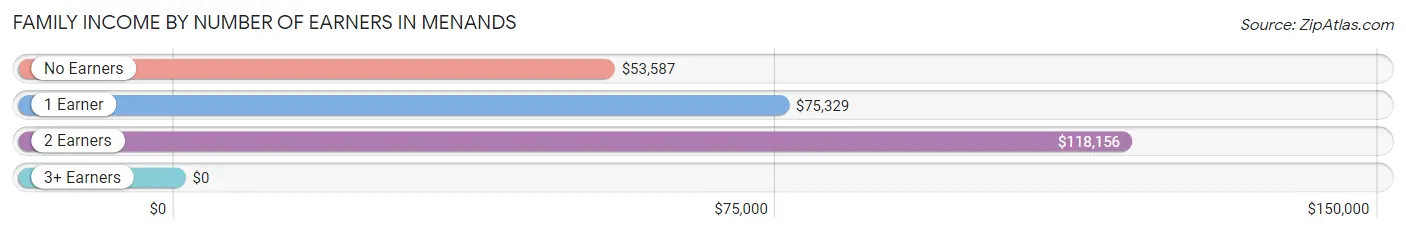
| Number of Earners | # Families | Median Income |
| No Earners | 132 (12.6%) | $53,587 |
| 1 Earner | 372 (35.5%) | $75,329 |
| 2 Earners | 543 (51.9%) | $118,156 |
| 3+ Earners | 0 (0.0%) | $0 |
| Total | 1,047 (100.0%) | $82,563 |
Household Income in Menands
Household Income Brackets in Menands
With 571 households falling in the category, the $50,000 to $74,999 income range is the most frequent in Menands, accounting for 25.8% of all households. In contrast, only 11 households (0.5%) fall into the $15,000 to $24,999 income bracket, making it the least populous group.
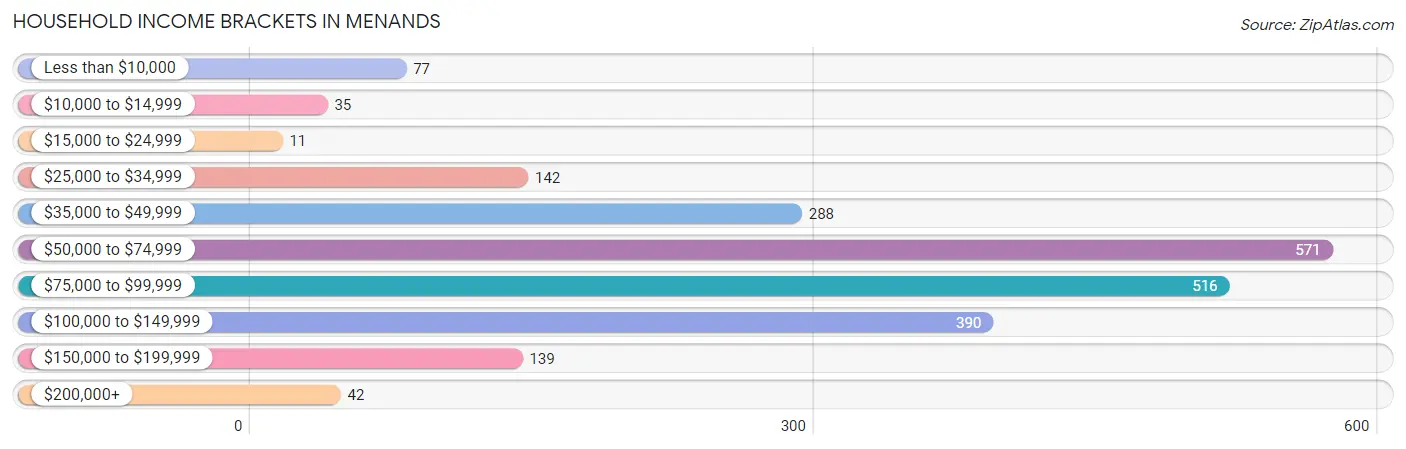
| Income Bracket | # Households | % Households |
| Less than $10,000 | 77 | 3.5% |
| $10,000 to $14,999 | 35 | 1.6% |
| $15,000 to $24,999 | 11 | 0.5% |
| $25,000 to $34,999 | 142 | 6.4% |
| $35,000 to $49,999 | 288 | 13.0% |
| $50,000 to $74,999 | 571 | 25.8% |
| $75,000 to $99,999 | 516 | 23.3% |
| $100,000 to $149,999 | 390 | 17.6% |
| $150,000 to $199,999 | 139 | 6.3% |
| $200,000+ | 42 | 1.9% |
Household Income by Householder Age in Menands
The median household income in Menands is $73,000, with the highest median household income of $75,057 found in the 65+ years age bracket for the primary householder. A total of 377 households (17.0%) fall into this category. Meanwhile, the 15 to 24 years age bracket for the primary householder has the lowest median household income of $0, with 91 households (4.1%) in this group.
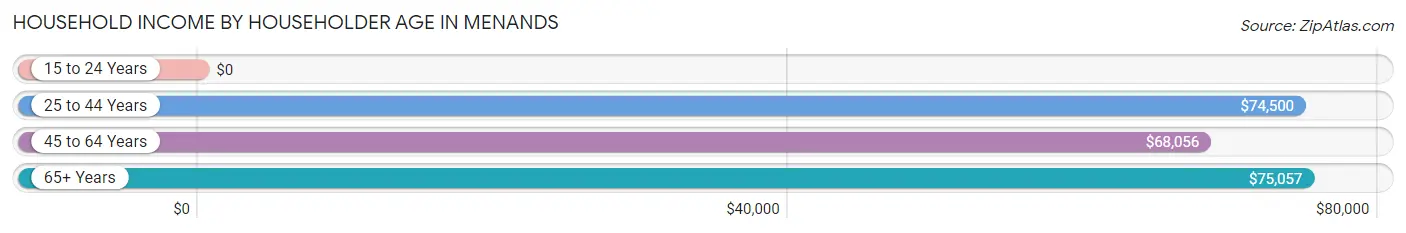
| Income Bracket | # Households | Median Income |
| 15 to 24 Years | 91 (4.1%) | $0 |
| 25 to 44 Years | 1,008 (45.5%) | $74,500 |
| 45 to 64 Years | 738 (33.3%) | $68,056 |
| 65+ Years | 377 (17.0%) | $75,057 |
| Total | 2,214 (100.0%) | $73,000 |
Poverty in Menands
Income Below Poverty by Sex and Age in Menands
With 3.7% poverty level for males and 8.4% for females among the residents of Menands, under 5 year old males and 75 year old and over females are the most vulnerable to poverty, with 68 males (26.5%) and 63 females (31.0%) in their respective age groups living below the poverty level.
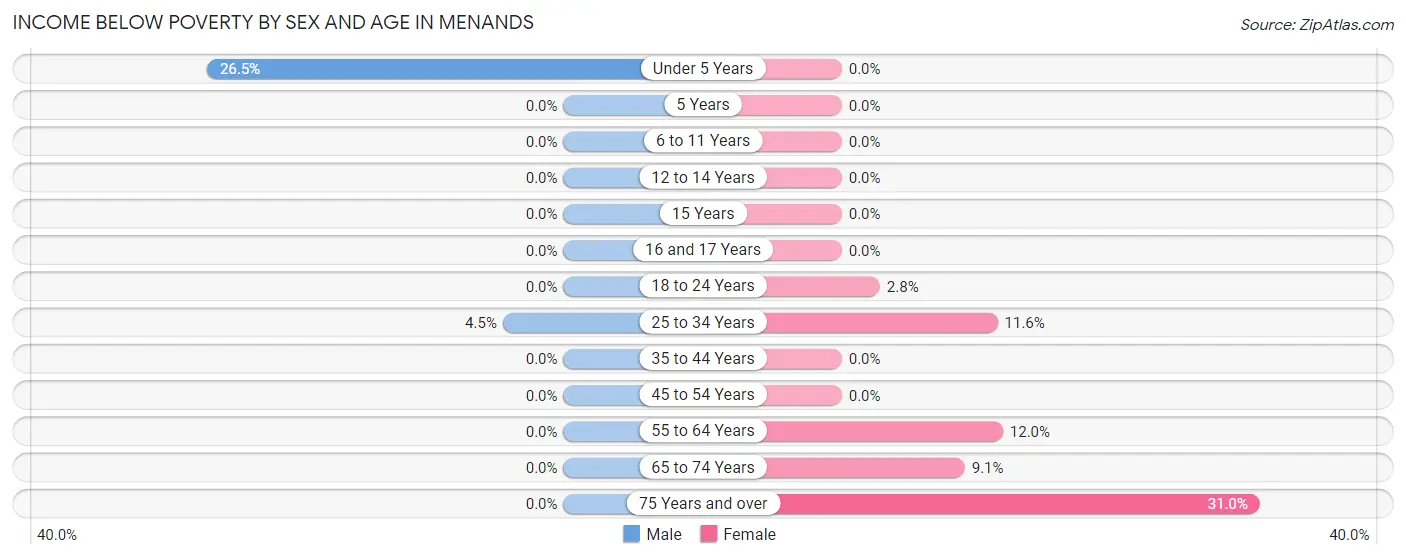
| Age Bracket | Male | Female |
| Under 5 Years | 68 (26.5%) | 0 (0.0%) |
| 5 Years | 0 (0.0%) | 0 (0.0%) |
| 6 to 11 Years | 0 (0.0%) | 0 (0.0%) |
| 12 to 14 Years | 0 (0.0%) | 0 (0.0%) |
| 15 Years | 0 (0.0%) | 0 (0.0%) |
| 16 and 17 Years | 0 (0.0%) | 0 (0.0%) |
| 18 to 24 Years | 0 (0.0%) | 3 (2.8%) |
| 25 to 34 Years | 19 (4.5%) | 59 (11.6%) |
| 35 to 44 Years | 0 (0.0%) | 0 (0.0%) |
| 45 to 54 Years | 0 (0.0%) | 0 (0.0%) |
| 55 to 64 Years | 0 (0.0%) | 36 (12.0%) |
| 65 to 74 Years | 0 (0.0%) | 22 (9.1%) |
| 75 Years and over | 0 (0.0%) | 63 (31.0%) |
| Total | 87 (3.7%) | 183 (8.4%) |
Income Above Poverty by Sex and Age in Menands
According to the poverty statistics in Menands, males aged 5 years and females aged under 5 years are the age groups that are most secure financially, with 100.0% of males and 100.0% of females in these age groups living above the poverty line.
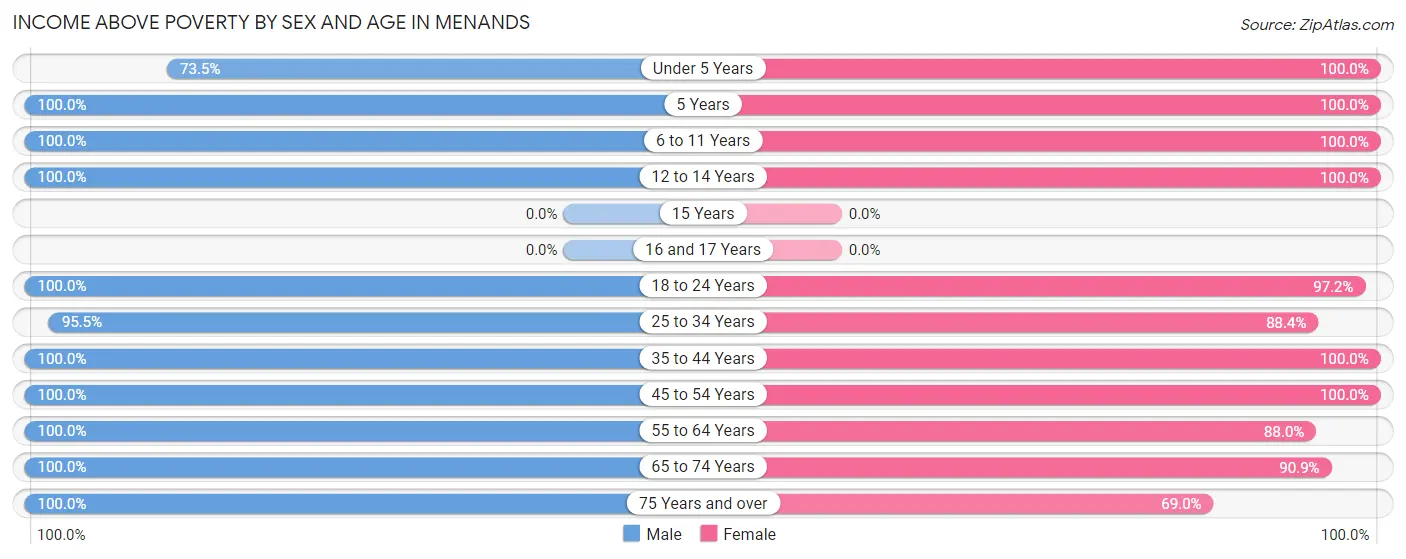
| Age Bracket | Male | Female |
| Under 5 Years | 189 (73.5%) | 55 (100.0%) |
| 5 Years | 192 (100.0%) | 38 (100.0%) |
| 6 to 11 Years | 241 (100.0%) | 134 (100.0%) |
| 12 to 14 Years | 57 (100.0%) | 23 (100.0%) |
| 15 Years | 0 (0.0%) | 0 (0.0%) |
| 16 and 17 Years | 0 (0.0%) | 0 (0.0%) |
| 18 to 24 Years | 108 (100.0%) | 103 (97.2%) |
| 25 to 34 Years | 403 (95.5%) | 451 (88.4%) |
| 35 to 44 Years | 375 (100.0%) | 371 (100.0%) |
| 45 to 54 Years | 83 (100.0%) | 186 (100.0%) |
| 55 to 64 Years | 423 (100.0%) | 265 (88.0%) |
| 65 to 74 Years | 62 (100.0%) | 219 (90.9%) |
| 75 Years and over | 124 (100.0%) | 140 (69.0%) |
| Total | 2,257 (96.3%) | 1,985 (91.6%) |
Income Below Poverty Among Married-Couple Families in Menands
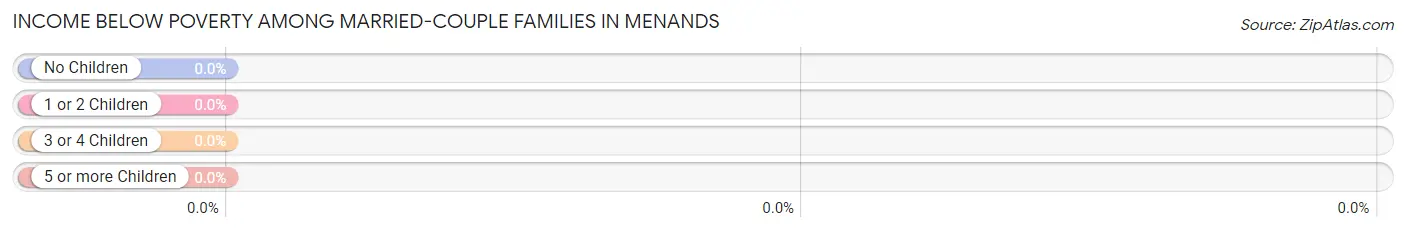
| Children | Above Poverty | Below Poverty |
| No Children | 418 (100.0%) | 0 (0.0%) |
| 1 or 2 Children | 208 (100.0%) | 0 (0.0%) |
| 3 or 4 Children | 102 (100.0%) | 0 (0.0%) |
| 5 or more Children | 0 (0.0%) | 0 (0.0%) |
| Total | 728 (100.0%) | 0 (0.0%) |
Income Below Poverty Among Single-Parent Households in Menands
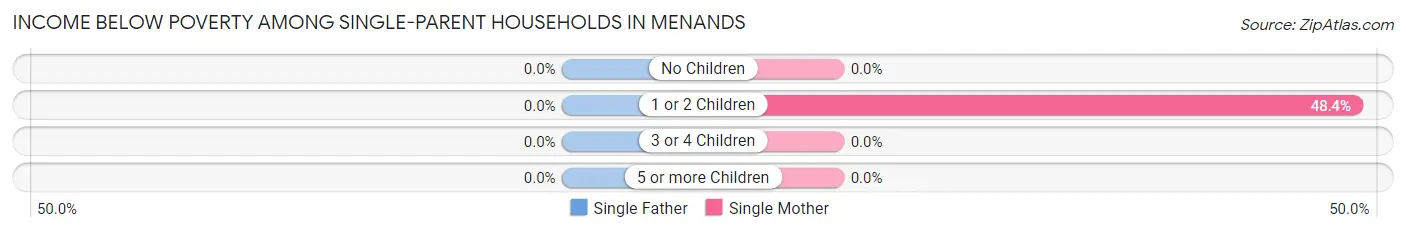
| Children | Single Father | Single Mother |
| No Children | 0 (0.0%) | 0 (0.0%) |
| 1 or 2 Children | 0 (0.0%) | 44 (48.3%) |
| 3 or 4 Children | 0 (0.0%) | 0 (0.0%) |
| 5 or more Children | 0 (0.0%) | 0 (0.0%) |
| Total | 0 (0.0%) | 44 (17.1%) |
Income Below Poverty Among Married-Couple vs Single-Parent Households in Menands
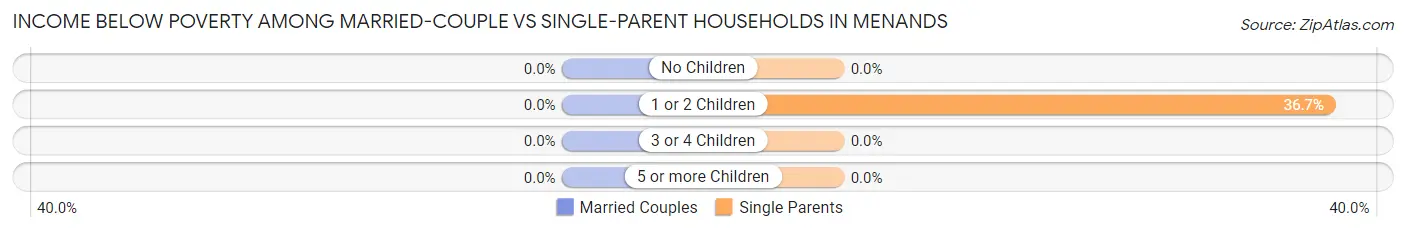
| Children | Married-Couple Families | Single-Parent Households |
| No Children | 0 (0.0%) | 0 (0.0%) |
| 1 or 2 Children | 0 (0.0%) | 44 (36.7%) |
| 3 or 4 Children | 0 (0.0%) | 0 (0.0%) |
| 5 or more Children | 0 (0.0%) | 0 (0.0%) |
| Total | 0 (0.0%) | 44 (13.8%) |
Race in Menands
The most populous races in Menands are White / Caucasian (2,588 | 57.4%), Black / African American (972 | 21.5%), and Asian (559 | 12.4%).
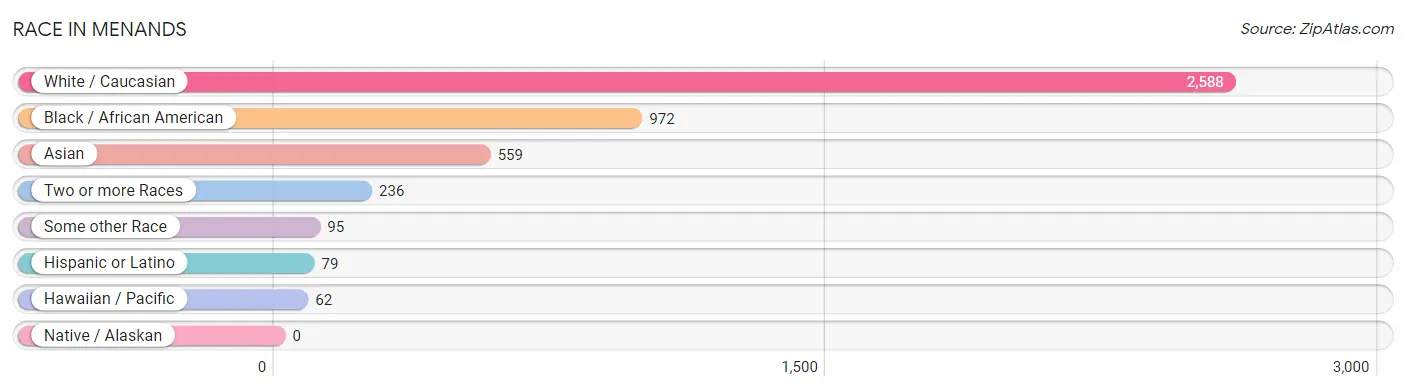
| Race | # Population | % Population |
| Asian | 559 | 12.4% |
| Black / African American | 972 | 21.5% |
| Hawaiian / Pacific | 62 | 1.4% |
| Hispanic or Latino | 79 | 1.8% |
| Native / Alaskan | 0 | 0.0% |
| White / Caucasian | 2,588 | 57.4% |
| Two or more Races | 236 | 5.2% |
| Some other Race | 95 | 2.1% |
| Total | 4,512 | 100.0% |
Ancestry in Menands
The most populous ancestries reported in Menands are Irish (881 | 19.5%), English (514 | 11.4%), German (428 | 9.5%), Thai (418 | 9.3%), and French (371 | 8.2%), together accounting for 57.9% of all Menands residents.
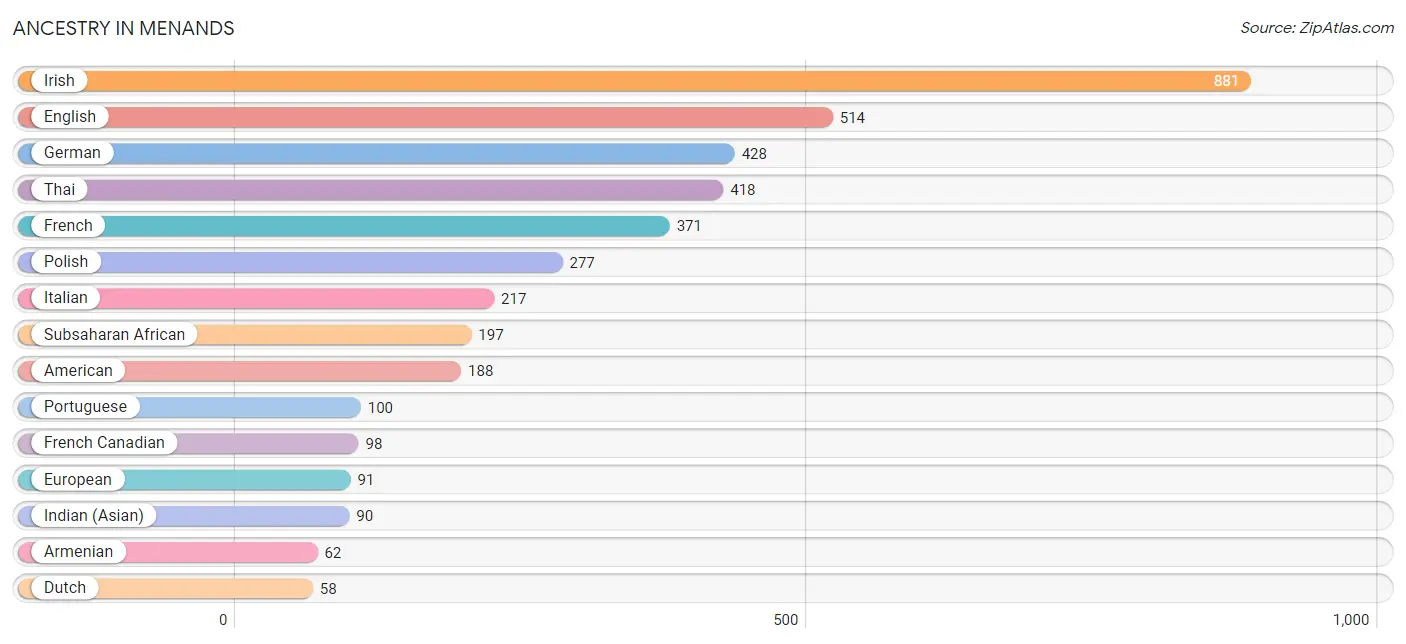
| Ancestry | # Population | % Population |
| Albanian | 32 | 0.7% |
| American | 188 | 4.2% |
| Armenian | 62 | 1.4% |
| British | 52 | 1.1% |
| Burmese | 18 | 0.4% |
| Canadian | 4 | 0.1% |
| Danish | 36 | 0.8% |
| Dutch | 58 | 1.3% |
| English | 514 | 11.4% |
| European | 91 | 2.0% |
| French | 371 | 8.2% |
| French Canadian | 98 | 2.2% |
| German | 428 | 9.5% |
| Ghanaian | 44 | 1.0% |
| Guyanese | 47 | 1.0% |
| Hungarian | 12 | 0.3% |
| Indian (Asian) | 90 | 2.0% |
| Irish | 881 | 19.5% |
| Italian | 217 | 4.8% |
| Korean | 26 | 0.6% |
| Lithuanian | 6 | 0.1% |
| Nigerian | 33 | 0.7% |
| Norwegian | 34 | 0.7% |
| Polish | 277 | 6.1% |
| Portuguese | 100 | 2.2% |
| Puerto Rican | 50 | 1.1% |
| Russian | 23 | 0.5% |
| Scandinavian | 29 | 0.6% |
| Scotch-Irish | 40 | 0.9% |
| Scottish | 22 | 0.5% |
| Serbian | 18 | 0.4% |
| Slovak | 3 | 0.1% |
| South American | 26 | 0.6% |
| Subsaharan African | 197 | 4.4% |
| Swedish | 12 | 0.3% |
| Thai | 418 | 9.3% |
| Ukrainian | 48 | 1.1% |
| Uruguayan | 26 | 0.6% |
| Welsh | 56 | 1.2% | View All 39 Rows |
Immigrants in Menands
The most numerous immigrant groups reported in Menands came from Asia (320 | 7.1%), South Central Asia (268 | 5.9%), India (250 | 5.5%), Africa (77 | 1.7%), and Eastern Asia (52 | 1.1%), together accounting for 21.4% of all Menands residents.
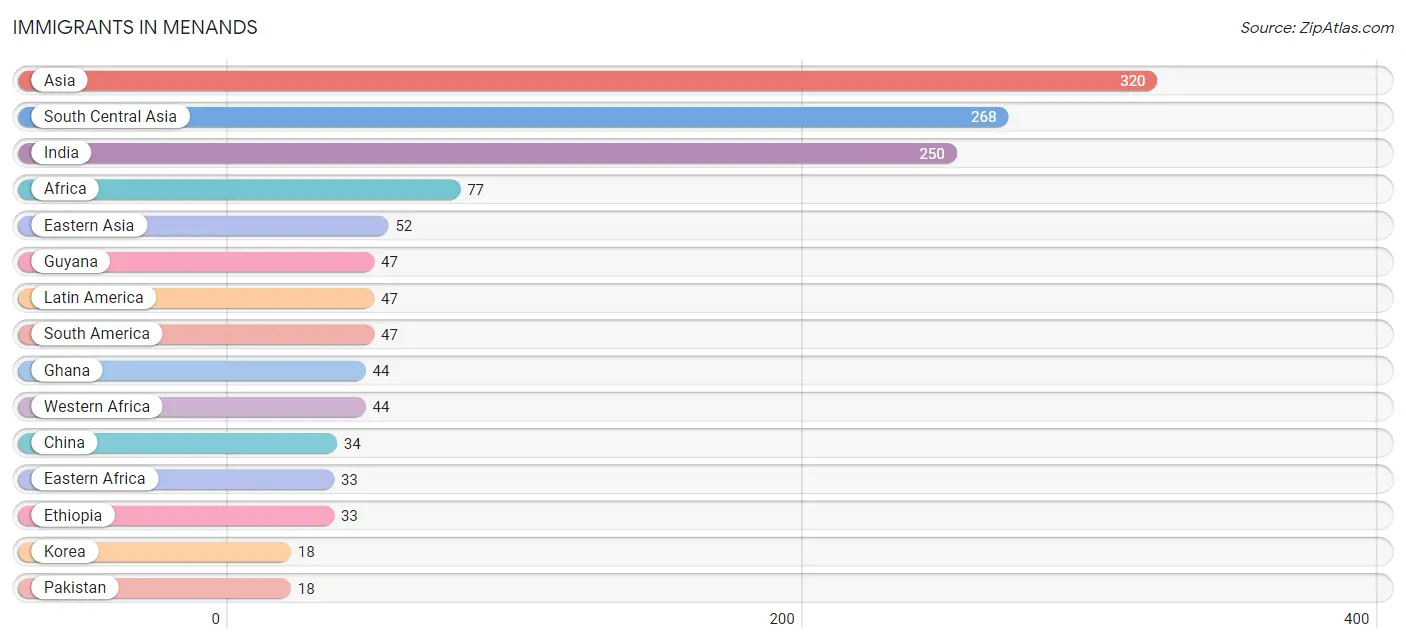
| Immigration Origin | # Population | % Population |
| Africa | 77 | 1.7% |
| Asia | 320 | 7.1% |
| China | 34 | 0.7% |
| Eastern Africa | 33 | 0.7% |
| Eastern Asia | 52 | 1.1% |
| Ethiopia | 33 | 0.7% |
| Ghana | 44 | 1.0% |
| Guyana | 47 | 1.0% |
| India | 250 | 5.5% |
| Korea | 18 | 0.4% |
| Latin America | 47 | 1.0% |
| Pakistan | 18 | 0.4% |
| South America | 47 | 1.0% |
| South Central Asia | 268 | 5.9% |
| Western Africa | 44 | 1.0% | View All 15 Rows |
Sex and Age in Menands
Sex and Age in Menands
The most populous age groups in Menands are 5 to 9 Years (376 | 16.0%) for men and 25 to 29 Years (400 | 18.4%) for women.
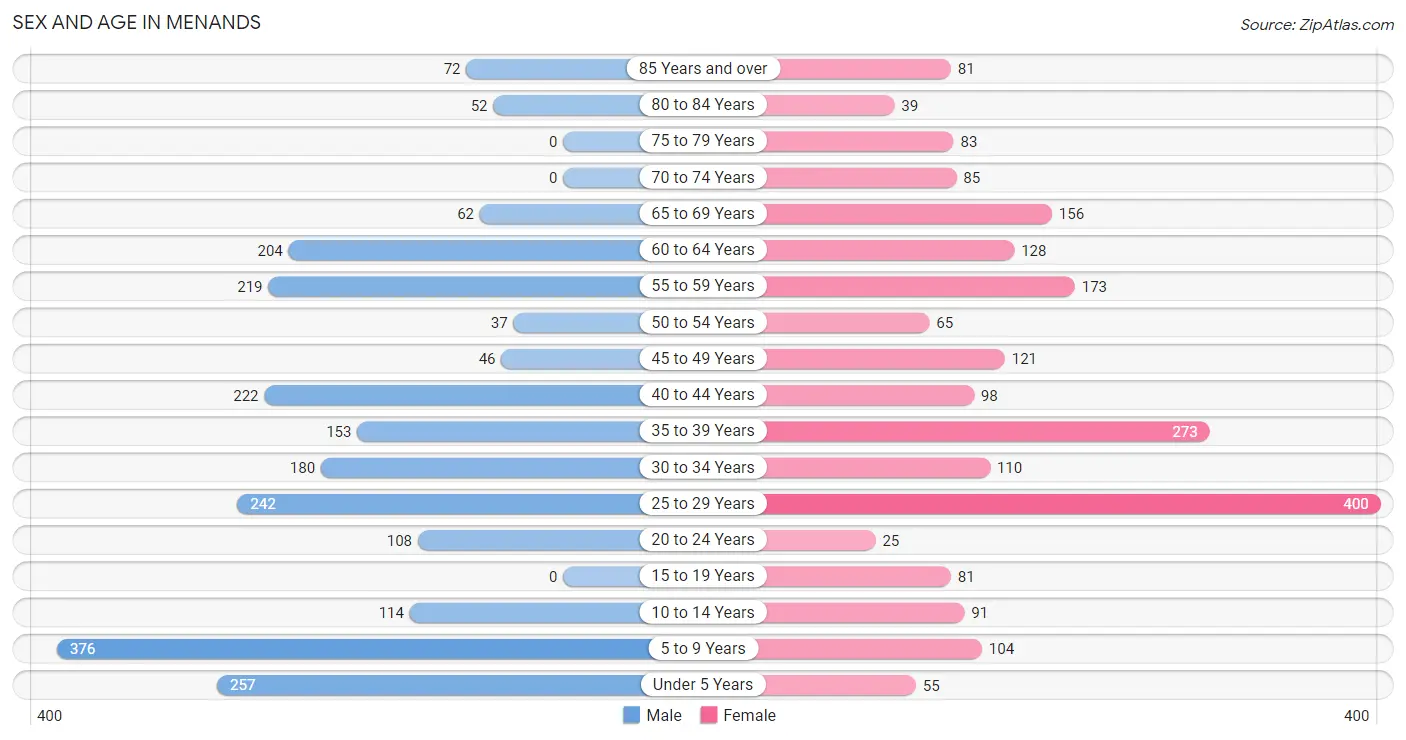
| Age Bracket | Male | Female |
| Under 5 Years | 257 (11.0%) | 55 (2.5%) |
| 5 to 9 Years | 376 (16.0%) | 104 (4.8%) |
| 10 to 14 Years | 114 (4.9%) | 91 (4.2%) |
| 15 to 19 Years | 0 (0.0%) | 81 (3.7%) |
| 20 to 24 Years | 108 (4.6%) | 25 (1.1%) |
| 25 to 29 Years | 242 (10.3%) | 400 (18.4%) |
| 30 to 34 Years | 180 (7.7%) | 110 (5.1%) |
| 35 to 39 Years | 153 (6.5%) | 273 (12.6%) |
| 40 to 44 Years | 222 (9.5%) | 98 (4.5%) |
| 45 to 49 Years | 46 (2.0%) | 121 (5.6%) |
| 50 to 54 Years | 37 (1.6%) | 65 (3.0%) |
| 55 to 59 Years | 219 (9.3%) | 173 (8.0%) |
| 60 to 64 Years | 204 (8.7%) | 128 (5.9%) |
| 65 to 69 Years | 62 (2.6%) | 156 (7.2%) |
| 70 to 74 Years | 0 (0.0%) | 85 (3.9%) |
| 75 to 79 Years | 0 (0.0%) | 83 (3.8%) |
| 80 to 84 Years | 52 (2.2%) | 39 (1.8%) |
| 85 Years and over | 72 (3.1%) | 81 (3.7%) |
| Total | 2,344 (100.0%) | 2,168 (100.0%) |
Families and Households in Menands
Median Family Size in Menands
The median family size in Menands is 2.86 persons per family, with married-couple families (728 | 69.5%) accounting for the largest median family size of 3.09 persons per family. On the other hand, single male/father families (62 | 5.9%) represent the smallest median family size with 1.76 persons per family.
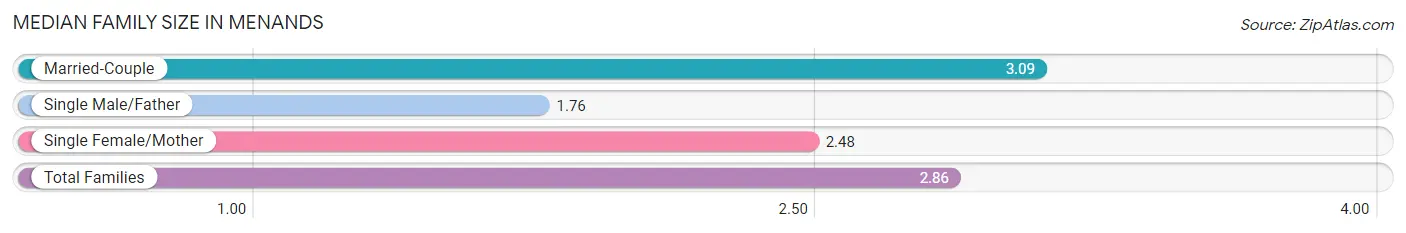
| Family Type | # Families | Family Size |
| Married-Couple | 728 (69.5%) | 3.09 |
| Single Male/Father | 62 (5.9%) | 1.76 |
| Single Female/Mother | 257 (24.5%) | 2.48 |
| Total Families | 1,047 (100.0%) | 2.86 |
Median Household Size in Menands
The median household size in Menands is 2.01 persons per household, with married-couple households (728 | 32.9%) accounting for the largest median household size of 3.09 persons per household. non-family households (1,167 | 52.7%) represent the smallest median household size with 1.21 persons per household.
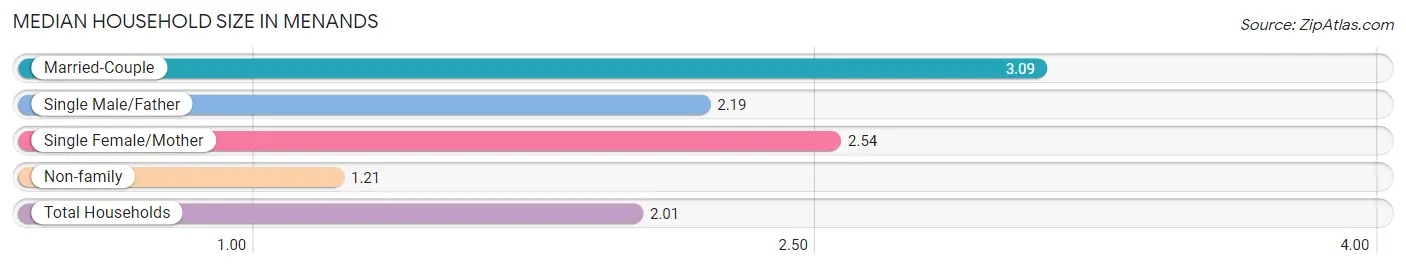
| Household Type | # Households | Household Size |
| Married-Couple | 728 (32.9%) | 3.09 |
| Single Male/Father | 62 (2.8%) | 2.19 |
| Single Female/Mother | 257 (11.6%) | 2.54 |
| Non-family | 1,167 (52.7%) | 1.21 |
| Total Households | 2,214 (100.0%) | 2.01 |
Household Size by Marriage Status in Menands
Out of a total of 2,214 households in Menands, 1,047 (47.3%) are family households, while 1,167 (52.7%) are nonfamily households. The most numerous type of family households are 2-person households, comprising 599, and the most common type of nonfamily households are 1-person households, comprising 919.
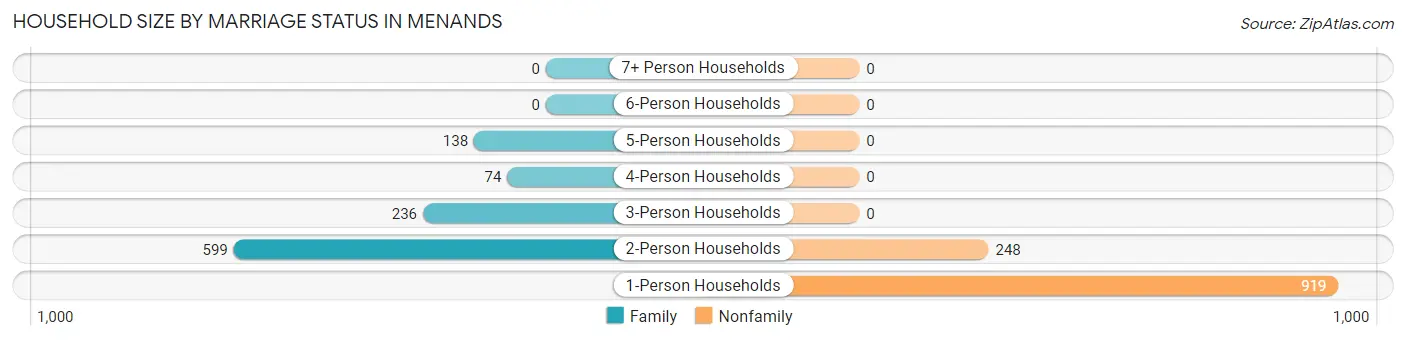
| Household Size | Family Households | Nonfamily Households |
| 1-Person Households | - | 919 (41.5%) |
| 2-Person Households | 599 (27.1%) | 248 (11.2%) |
| 3-Person Households | 236 (10.7%) | 0 (0.0%) |
| 4-Person Households | 74 (3.3%) | 0 (0.0%) |
| 5-Person Households | 138 (6.2%) | 0 (0.0%) |
| 6-Person Households | 0 (0.0%) | 0 (0.0%) |
| 7+ Person Households | 0 (0.0%) | 0 (0.0%) |
| Total | 1,047 (47.3%) | 1,167 (52.7%) |
Female Fertility in Menands
Fertility by Age in Menands
Average fertility rate in Menands is 22.0 births per 1,000 women. Women in the age bracket of 35 to 50 years have the highest fertility rate with 49.0 births per 1,000 women. Women in the age bracket of 35 to 50 years acount for 100.0% of all women with births.
| Age Bracket | Women with Births | Births / 1,000 Women |
| 15 to 19 years | 0 (0.0%) | 0.0 |
| 20 to 34 years | 0 (0.0%) | 0.0 |
| 35 to 50 years | 24 (100.0%) | 49.0 |
| Total | 24 (100.0%) | 22.0 |
Fertility by Age by Marriage Status in Menands
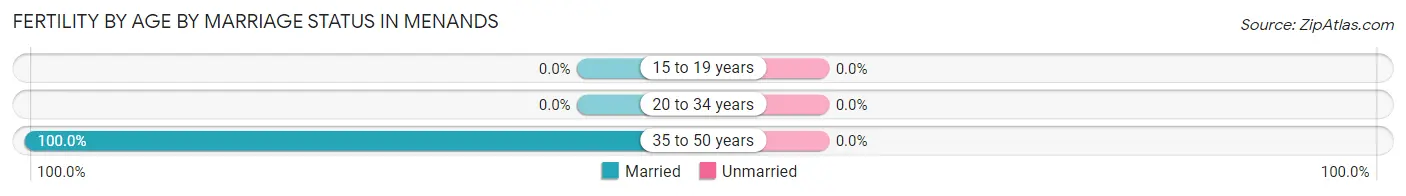
| Age Bracket | Married | Unmarried |
| 15 to 19 years | 0 (0.0%) | 0 (0.0%) |
| 20 to 34 years | 0 (0.0%) | 0 (0.0%) |
| 35 to 50 years | 24 (100.0%) | 0 (0.0%) |
| Total | 24 (100.0%) | 0 (0.0%) |
Fertility by Education in Menands
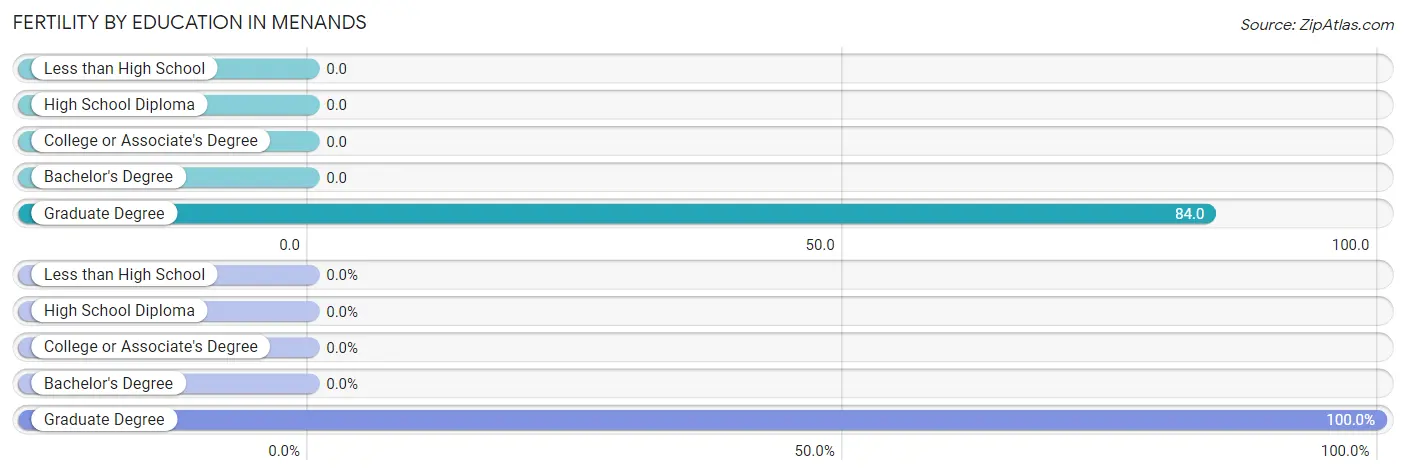
| Educational Attainment | Women with Births | Births / 1,000 Women |
| Less than High School | 0 (0.0%) | 0.0 |
| High School Diploma | 0 (0.0%) | 0.0 |
| College or Associate's Degree | 0 (0.0%) | 0.0 |
| Bachelor's Degree | 0 (0.0%) | 0.0 |
| Graduate Degree | 24 (100.0%) | 84.0 |
| Total | 24 (100.0%) | 22.0 |
Fertility by Education by Marriage Status in Menands
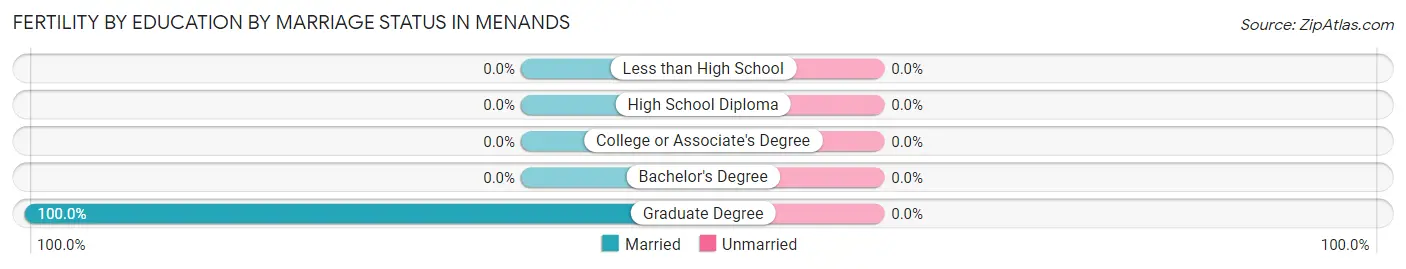
| Educational Attainment | Married | Unmarried |
| Less than High School | 0 (0.0%) | 0 (0.0%) |
| High School Diploma | 0 (0.0%) | 0 (0.0%) |
| College or Associate's Degree | 0 (0.0%) | 0 (0.0%) |
| Bachelor's Degree | 0 (0.0%) | 0 (0.0%) |
| Graduate Degree | 24 (100.0%) | 0 (0.0%) |
| Total | 24 (100.0%) | 0 (0.0%) |
Employment Characteristics in Menands
Employment by Class of Employer in Menands
Among the 2,460 employed individuals in Menands, private company employees (1,287 | 52.3%), state government employees (449 | 18.2%), and not-for-profit organizations (330 | 13.4%) make up the most common classes of employment.
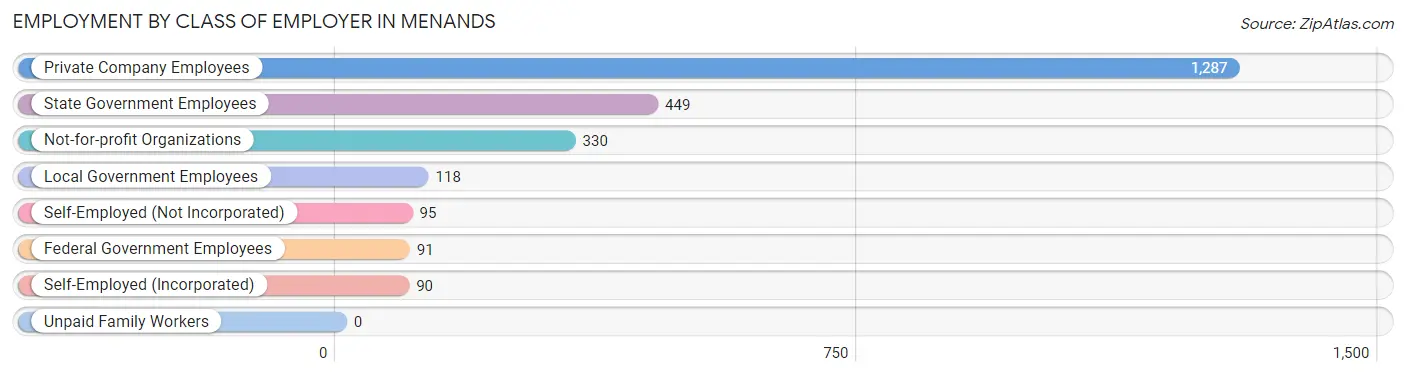
| Employer Class | # Employees | % Employees |
| Private Company Employees | 1,287 | 52.3% |
| Self-Employed (Incorporated) | 90 | 3.7% |
| Self-Employed (Not Incorporated) | 95 | 3.9% |
| Not-for-profit Organizations | 330 | 13.4% |
| Local Government Employees | 118 | 4.8% |
| State Government Employees | 449 | 18.2% |
| Federal Government Employees | 91 | 3.7% |
| Unpaid Family Workers | 0 | 0.0% |
| Total | 2,460 | 100.0% |
Employment Status by Age in Menands
According to the labor force statistics for Menands, out of the total population over 16 years of age (3,515), 72.3% or 2,541 individuals are in the labor force, with 3.1% or 79 of them unemployed. The age group with the highest labor force participation rate is 20 to 24 years, with 100.0% or 133 individuals in the labor force. Within the labor force, the 75 years and over age range has the highest percentage of unemployed individuals, with 48.6% or 18 of them being unemployed.
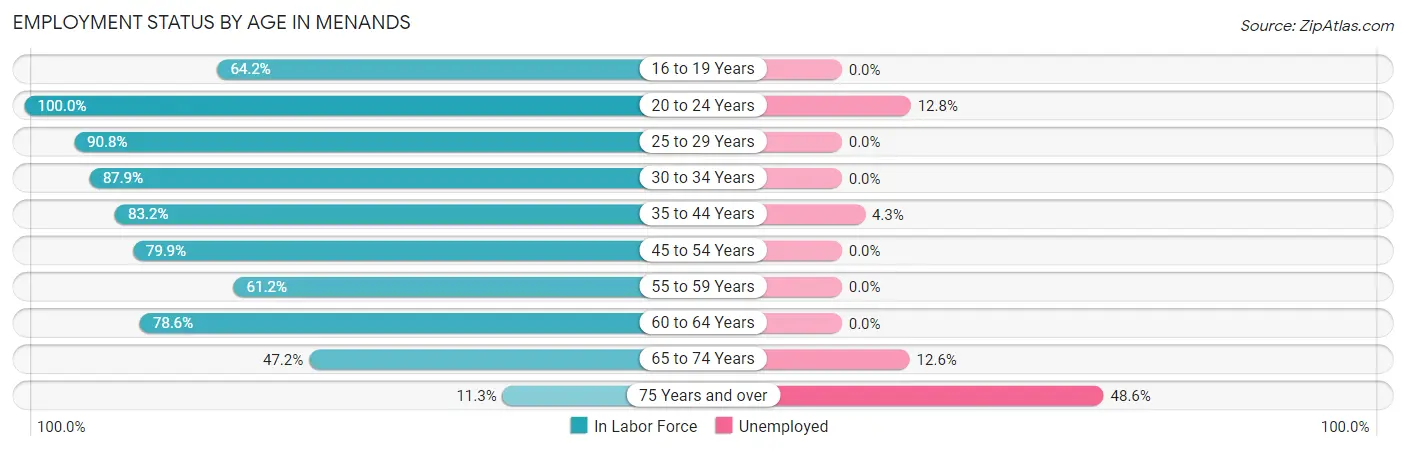
| Age Bracket | In Labor Force | Unemployed |
| 16 to 19 Years | 52 (64.2%) | 0 (0.0%) |
| 20 to 24 Years | 133 (100.0%) | 17 (12.8%) |
| 25 to 29 Years | 583 (90.8%) | 0 (0.0%) |
| 30 to 34 Years | 255 (87.9%) | 0 (0.0%) |
| 35 to 44 Years | 621 (83.2%) | 27 (4.3%) |
| 45 to 54 Years | 215 (79.9%) | 0 (0.0%) |
| 55 to 59 Years | 240 (61.2%) | 0 (0.0%) |
| 60 to 64 Years | 261 (78.6%) | 0 (0.0%) |
| 65 to 74 Years | 143 (47.2%) | 18 (12.6%) |
| 75 Years and over | 37 (11.3%) | 18 (48.6%) |
| Total | 2,541 (72.3%) | 79 (3.1%) |
Employment Status by Educational Attainment in Menands
According to labor force statistics for Menands, 81.4% of individuals (2,174) out of the total population between 25 and 64 years of age (2,671) are in the labor force, with 1.2% or 26 of them being unemployed. The group with the highest labor force participation rate are those with the educational attainment of bachelor's degree or higher, with 90.7% or 1,224 individuals in the labor force. Within the labor force, individuals with bachelor's degree or higher education have the highest percentage of unemployment, with 2.2% or 27 of them being unemployed.
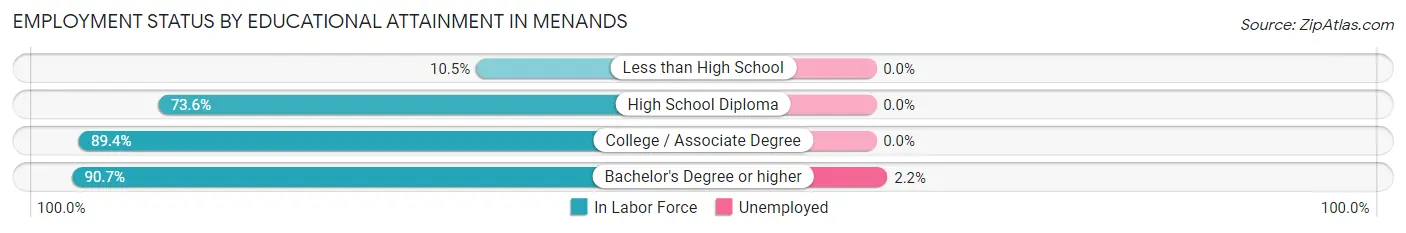
| Educational Attainment | In Labor Force | Unemployed |
| Less than High School | 21 (10.5%) | 0 (0.0%) |
| High School Diploma | 340 (73.6%) | 0 (0.0%) |
| College / Associate Degree | 589 (89.4%) | 0 (0.0%) |
| Bachelor's Degree or higher | 1,224 (90.7%) | 30 (2.2%) |
| Total | 2,174 (81.4%) | 32 (1.2%) |
Employment Occupations by Sex in Menands
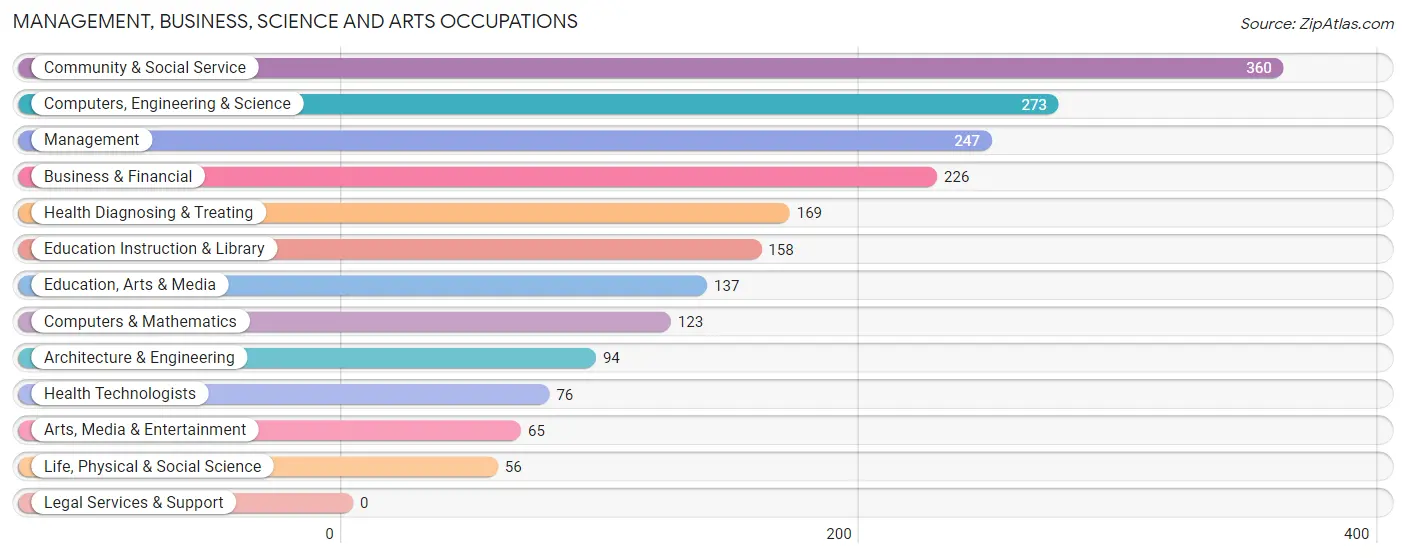
Management, Business, Science and Arts Occupations
The most common Management, Business, Science and Arts occupations in Menands are Community & Social Service (360 | 14.6%), Computers, Engineering & Science (273 | 11.1%), Management (247 | 10.0%), Business & Financial (226 | 9.2%), and Health Diagnosing & Treating (169 | 6.9%).
Management, Business, Science and Arts Occupations by Sex
Within the Management, Business, Science and Arts occupations in Menands, the most male-oriented occupations are Computers & Mathematics (100.0%), Life, Physical & Social Science (100.0%), and Computers, Engineering & Science (90.5%), while the most female-oriented occupations are Education, Arts & Media (100.0%), Health Technologists (100.0%), and Community & Social Service (80.8%).
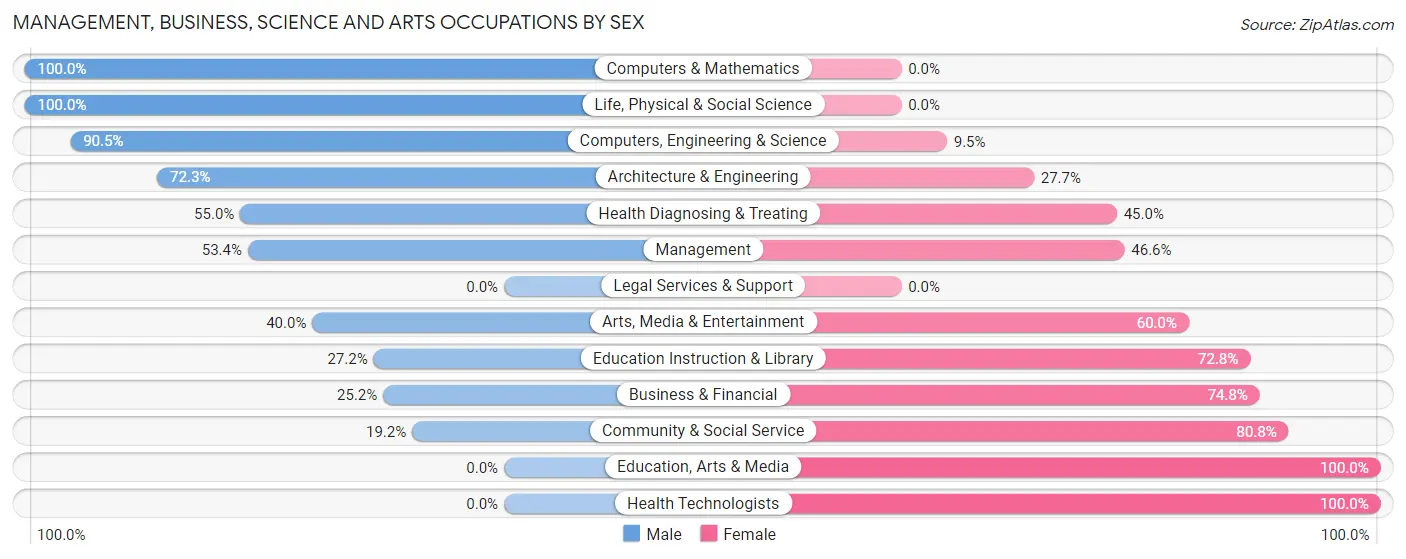
| Occupation | Male | Female |
| Management | 132 (53.4%) | 115 (46.6%) |
| Business & Financial | 57 (25.2%) | 169 (74.8%) |
| Computers, Engineering & Science | 247 (90.5%) | 26 (9.5%) |
| Computers & Mathematics | 123 (100.0%) | 0 (0.0%) |
| Architecture & Engineering | 68 (72.3%) | 26 (27.7%) |
| Life, Physical & Social Science | 56 (100.0%) | 0 (0.0%) |
| Community & Social Service | 69 (19.2%) | 291 (80.8%) |
| Education, Arts & Media | 0 (0.0%) | 137 (100.0%) |
| Legal Services & Support | 0 (0.0%) | 0 (0.0%) |
| Education Instruction & Library | 43 (27.2%) | 115 (72.8%) |
| Arts, Media & Entertainment | 26 (40.0%) | 39 (60.0%) |
| Health Diagnosing & Treating | 93 (55.0%) | 76 (45.0%) |
| Health Technologists | 0 (0.0%) | 76 (100.0%) |
| Total (Category) | 598 (46.9%) | 677 (53.1%) |
| Total (Overall) | 1,370 (55.7%) | 1,090 (44.3%) |
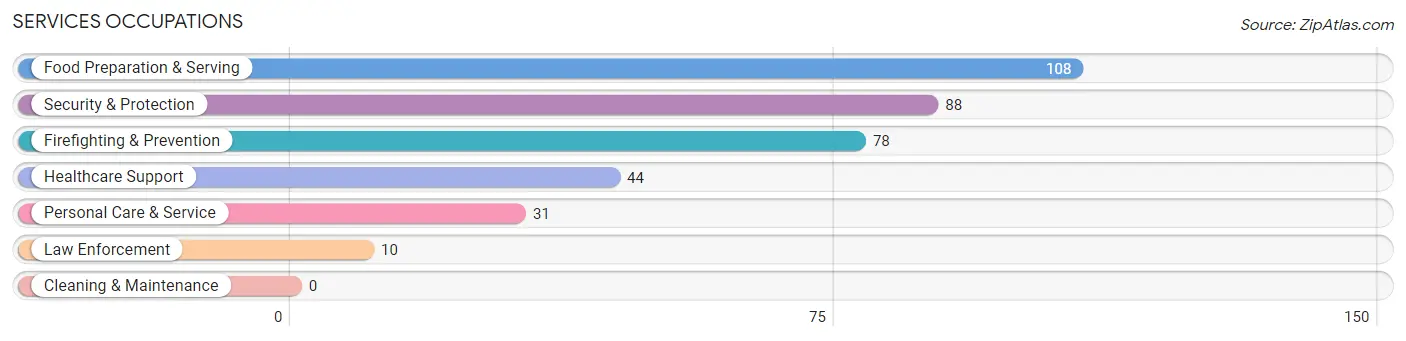
Services Occupations
The most common Services occupations in Menands are Food Preparation & Serving (108 | 4.4%), Security & Protection (88 | 3.6%), Firefighting & Prevention (78 | 3.2%), Healthcare Support (44 | 1.8%), and Personal Care & Service (31 | 1.3%).
Services Occupations by Sex
Within the Services occupations in Menands, the most male-oriented occupations are Firefighting & Prevention (100.0%), and Security & Protection (88.6%), while the most female-oriented occupations are Healthcare Support (100.0%), Law Enforcement (100.0%), and Food Preparation & Serving (100.0%).
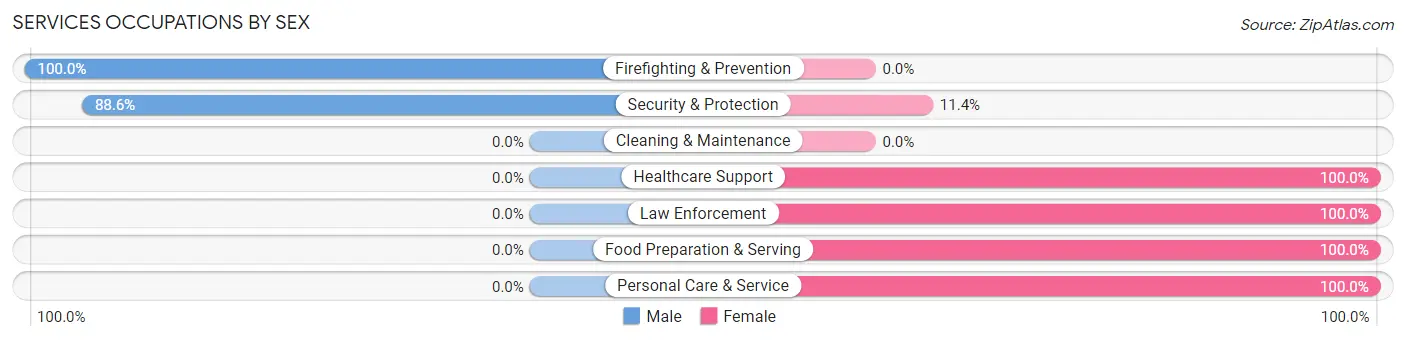
| Occupation | Male | Female |
| Healthcare Support | 0 (0.0%) | 44 (100.0%) |
| Security & Protection | 78 (88.6%) | 10 (11.4%) |
| Firefighting & Prevention | 78 (100.0%) | 0 (0.0%) |
| Law Enforcement | 0 (0.0%) | 10 (100.0%) |
| Food Preparation & Serving | 0 (0.0%) | 108 (100.0%) |
| Cleaning & Maintenance | 0 (0.0%) | 0 (0.0%) |
| Personal Care & Service | 0 (0.0%) | 31 (100.0%) |
| Total (Category) | 78 (28.8%) | 193 (71.2%) |
| Total (Overall) | 1,370 (55.7%) | 1,090 (44.3%) |
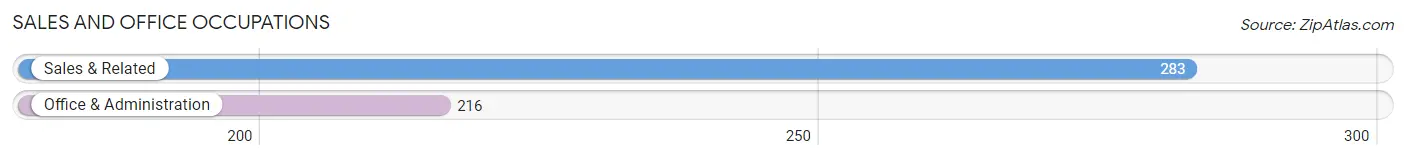
Sales and Office Occupations
The most common Sales and Office occupations in Menands are Sales & Related (283 | 11.5%), and Office & Administration (216 | 8.8%).
Sales and Office Occupations by Sex
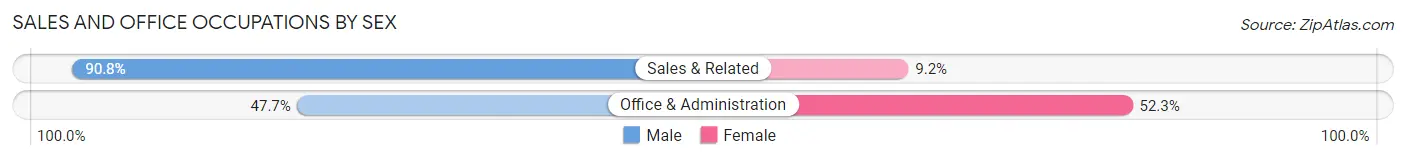
| Occupation | Male | Female |
| Sales & Related | 257 (90.8%) | 26 (9.2%) |
| Office & Administration | 103 (47.7%) | 113 (52.3%) |
| Total (Category) | 360 (72.1%) | 139 (27.9%) |
| Total (Overall) | 1,370 (55.7%) | 1,090 (44.3%) |
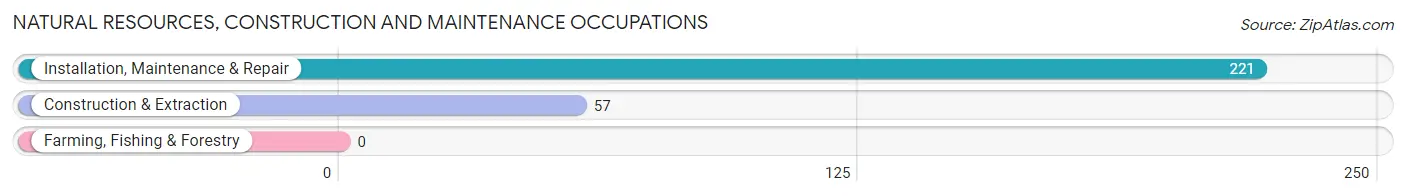
Natural Resources, Construction and Maintenance Occupations
The most common Natural Resources, Construction and Maintenance occupations in Menands are Installation, Maintenance & Repair (221 | 9.0%), and Construction & Extraction (57 | 2.3%).
Natural Resources, Construction and Maintenance Occupations by Sex
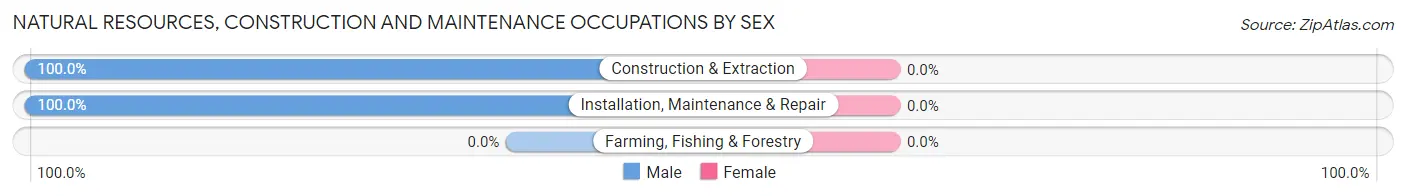
| Occupation | Male | Female |
| Farming, Fishing & Forestry | 0 (0.0%) | 0 (0.0%) |
| Construction & Extraction | 57 (100.0%) | 0 (0.0%) |
| Installation, Maintenance & Repair | 221 (100.0%) | 0 (0.0%) |
| Total (Category) | 278 (100.0%) | 0 (0.0%) |
| Total (Overall) | 1,370 (55.7%) | 1,090 (44.3%) |
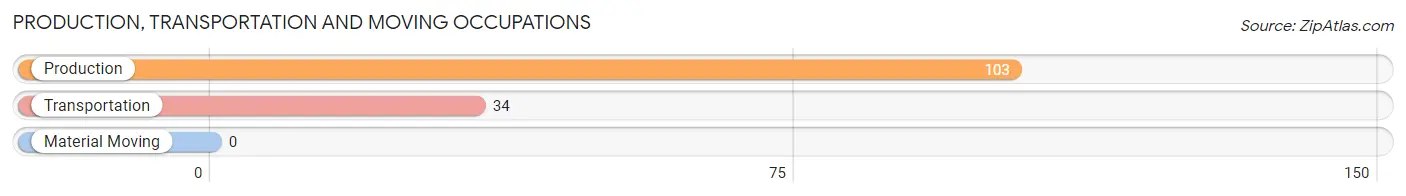
Production, Transportation and Moving Occupations
The most common Production, Transportation and Moving occupations in Menands are Production (103 | 4.2%), and Transportation (34 | 1.4%).
Production, Transportation and Moving Occupations by Sex
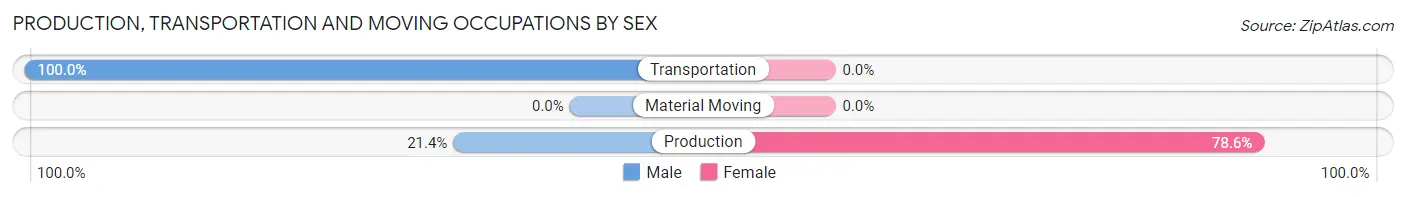
| Occupation | Male | Female |
| Production | 22 (21.4%) | 81 (78.6%) |
| Transportation | 34 (100.0%) | 0 (0.0%) |
| Material Moving | 0 (0.0%) | 0 (0.0%) |
| Total (Category) | 56 (40.9%) | 81 (59.1%) |
| Total (Overall) | 1,370 (55.7%) | 1,090 (44.3%) |
Employment Industries by Sex in Menands
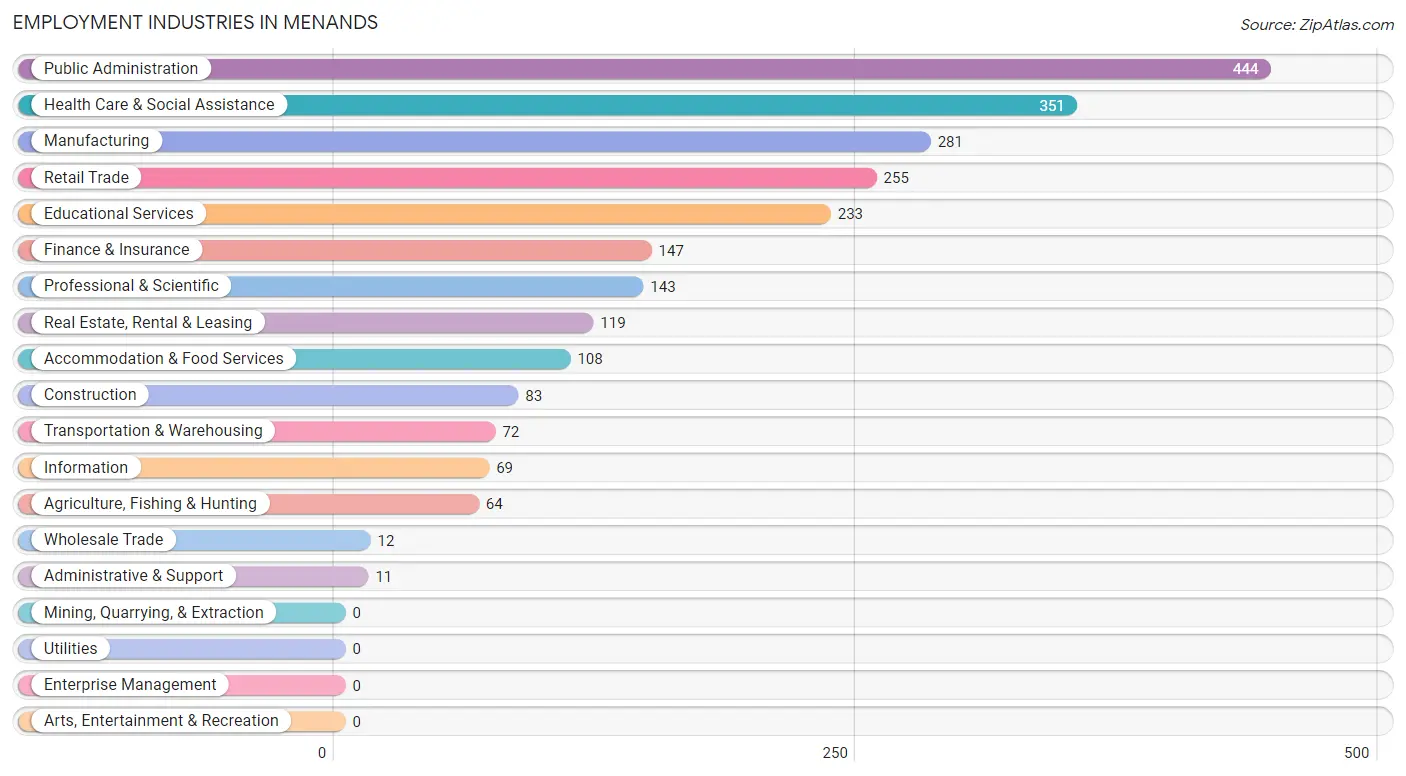
Employment Industries in Menands
The major employment industries in Menands include Public Administration (444 | 18.0%), Health Care & Social Assistance (351 | 14.3%), Manufacturing (281 | 11.4%), Retail Trade (255 | 10.4%), and Educational Services (233 | 9.5%).
Employment Industries by Sex in Menands
The Menands industries that see more men than women are Wholesale Trade (100.0%), Transportation & Warehousing (100.0%), and Manufacturing (89.7%), whereas the industries that tend to have a higher number of women are Administrative & Support (100.0%), Accommodation & Food Services (100.0%), and Health Care & Social Assistance (80.6%).
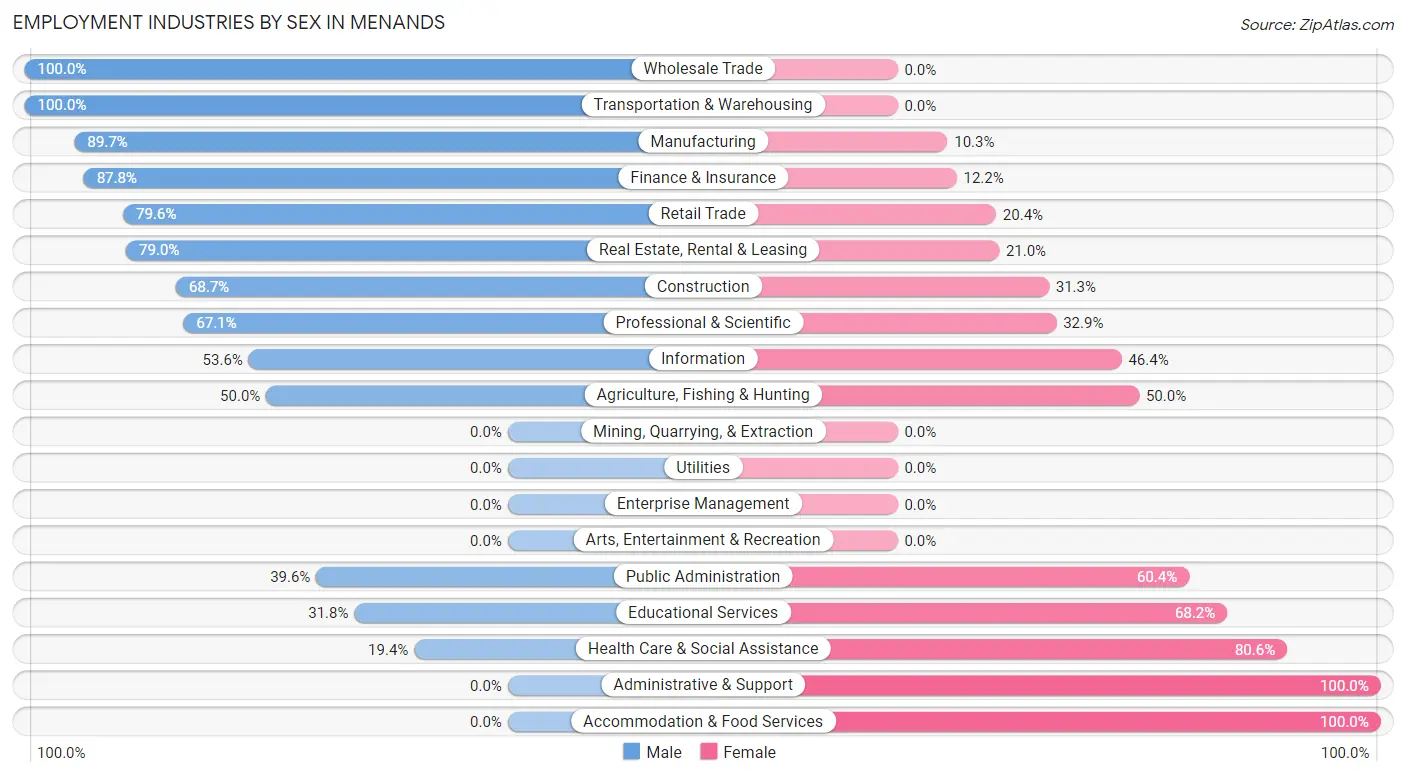
| Industry | Male | Female |
| Agriculture, Fishing & Hunting | 32 (50.0%) | 32 (50.0%) |
| Mining, Quarrying, & Extraction | 0 (0.0%) | 0 (0.0%) |
| Construction | 57 (68.7%) | 26 (31.3%) |
| Manufacturing | 252 (89.7%) | 29 (10.3%) |
| Wholesale Trade | 12 (100.0%) | 0 (0.0%) |
| Retail Trade | 203 (79.6%) | 52 (20.4%) |
| Transportation & Warehousing | 72 (100.0%) | 0 (0.0%) |
| Utilities | 0 (0.0%) | 0 (0.0%) |
| Information | 37 (53.6%) | 32 (46.4%) |
| Finance & Insurance | 129 (87.8%) | 18 (12.2%) |
| Real Estate, Rental & Leasing | 94 (79.0%) | 25 (21.0%) |
| Professional & Scientific | 96 (67.1%) | 47 (32.9%) |
| Enterprise Management | 0 (0.0%) | 0 (0.0%) |
| Administrative & Support | 0 (0.0%) | 11 (100.0%) |
| Educational Services | 74 (31.8%) | 159 (68.2%) |
| Health Care & Social Assistance | 68 (19.4%) | 283 (80.6%) |
| Arts, Entertainment & Recreation | 0 (0.0%) | 0 (0.0%) |
| Accommodation & Food Services | 0 (0.0%) | 108 (100.0%) |
| Public Administration | 176 (39.6%) | 268 (60.4%) |
| Total | 1,370 (55.7%) | 1,090 (44.3%) |
Education in Menands
School Enrollment in Menands
The most common levels of schooling among the 934 students in Menands are elementary school (250 | 26.8%), kindergarten (230 | 24.6%), and middle school (205 | 22.0%).
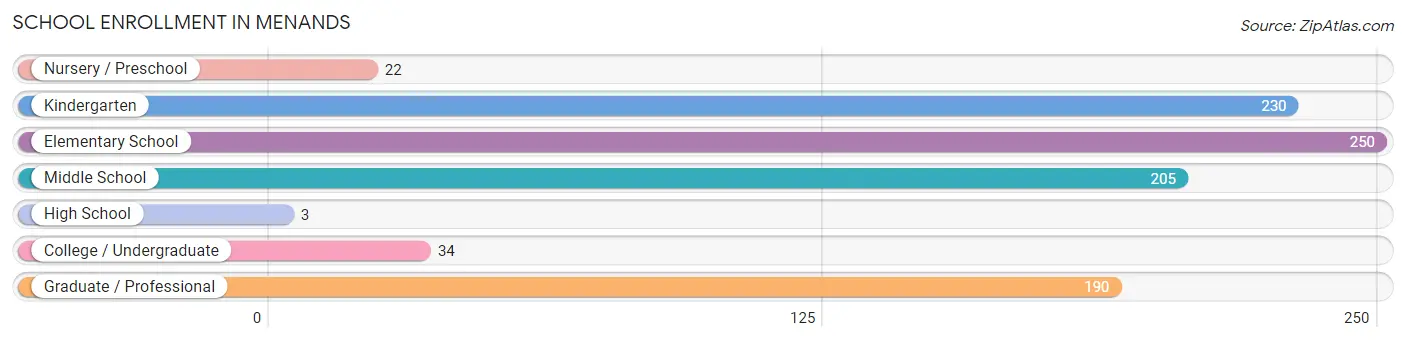
| School Level | # Students | % Students |
| Nursery / Preschool | 22 | 2.4% |
| Kindergarten | 230 | 24.6% |
| Elementary School | 250 | 26.8% |
| Middle School | 205 | 22.0% |
| High School | 3 | 0.3% |
| College / Undergraduate | 34 | 3.6% |
| Graduate / Professional | 190 | 20.3% |
| Total | 934 | 100.0% |
School Enrollment by Age by Funding Source in Menands
Out of a total of 934 students who are enrolled in schools in Menands, 206 (22.1%) attend a private institution, while the remaining 728 (77.9%) are enrolled in public schools. The age group of 35 years and over has the highest likelihood of being enrolled in private schools, with 70 (89.7% in the age bracket) enrolled. Conversely, the age group of 3 to 4 year olds has the lowest likelihood of being enrolled in a private school, with 22 (100.0% in the age bracket) attending a public institution.
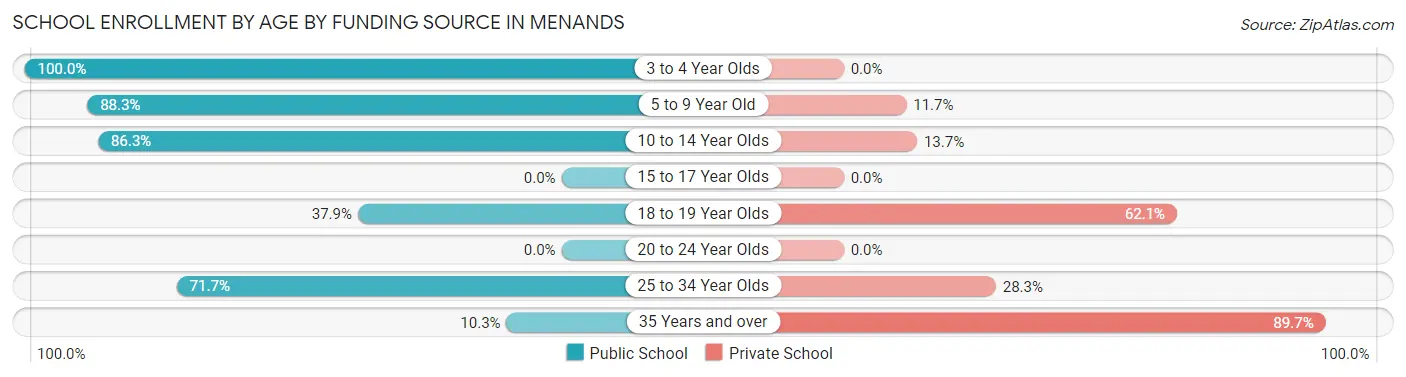
| Age Bracket | Public School | Private School |
| 3 to 4 Year Olds | 22 (100.0%) | 0 (0.0%) |
| 5 to 9 Year Old | 424 (88.3%) | 56 (11.7%) |
| 10 to 14 Year Olds | 177 (86.3%) | 28 (13.7%) |
| 15 to 17 Year Olds | 0 (0.0%) | 0 (0.0%) |
| 18 to 19 Year Olds | 11 (37.9%) | 18 (62.1%) |
| 20 to 24 Year Olds | 0 (0.0%) | 0 (0.0%) |
| 25 to 34 Year Olds | 86 (71.7%) | 34 (28.3%) |
| 35 Years and over | 8 (10.3%) | 70 (89.7%) |
| Total | 728 (77.9%) | 206 (22.1%) |
Educational Attainment by Field of Study in Menands
Engineering (212 | 11.1%), business (210 | 11.0%), psychology (202 | 10.6%), science & technology (191 | 10.0%), and education (185 | 9.7%) are the most common fields of study among 1,904 individuals in Menands who have obtained a bachelor's degree or higher.
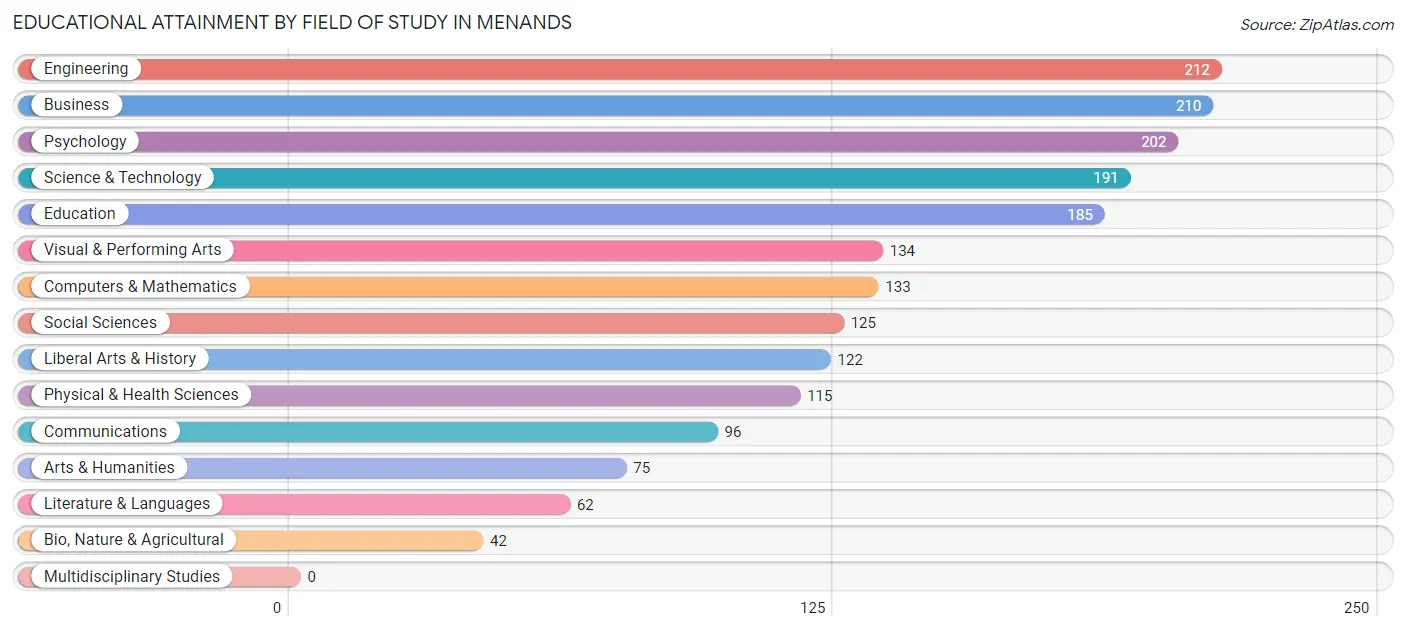
| Field of Study | # Graduates | % Graduates |
| Computers & Mathematics | 133 | 7.0% |
| Bio, Nature & Agricultural | 42 | 2.2% |
| Physical & Health Sciences | 115 | 6.0% |
| Psychology | 202 | 10.6% |
| Social Sciences | 125 | 6.6% |
| Engineering | 212 | 11.1% |
| Multidisciplinary Studies | 0 | 0.0% |
| Science & Technology | 191 | 10.0% |
| Business | 210 | 11.0% |
| Education | 185 | 9.7% |
| Literature & Languages | 62 | 3.3% |
| Liberal Arts & History | 122 | 6.4% |
| Visual & Performing Arts | 134 | 7.0% |
| Communications | 96 | 5.0% |
| Arts & Humanities | 75 | 3.9% |
| Total | 1,904 | 100.0% |
Transportation & Commute in Menands
Vehicle Availability by Sex in Menands
The most prevalent vehicle ownership categories in Menands are males with 2 vehicles (677, accounting for 49.4%) and females with 2 vehicles (771, making up 62.1%).
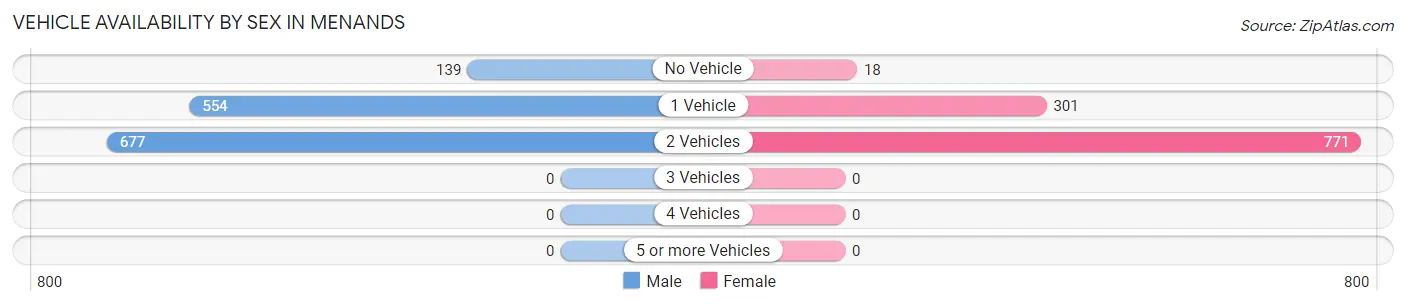
| Vehicles Available | Male | Female |
| No Vehicle | 139 (10.2%) | 18 (1.7%) |
| 1 Vehicle | 554 (40.4%) | 301 (27.6%) |
| 2 Vehicles | 677 (49.4%) | 771 (70.7%) |
| 3 Vehicles | 0 (0.0%) | 0 (0.0%) |
| 4 Vehicles | 0 (0.0%) | 0 (0.0%) |
| 5 or more Vehicles | 0 (0.0%) | 0 (0.0%) |
| Total | 1,370 (100.0%) | 1,090 (100.0%) |
Commute Time in Menands
The most frequently occuring commute durations in Menands are 15 to 19 minutes (767 commuters, 34.4%), 10 to 14 minutes (504 commuters, 22.6%), and 25 to 29 minutes (260 commuters, 11.7%).
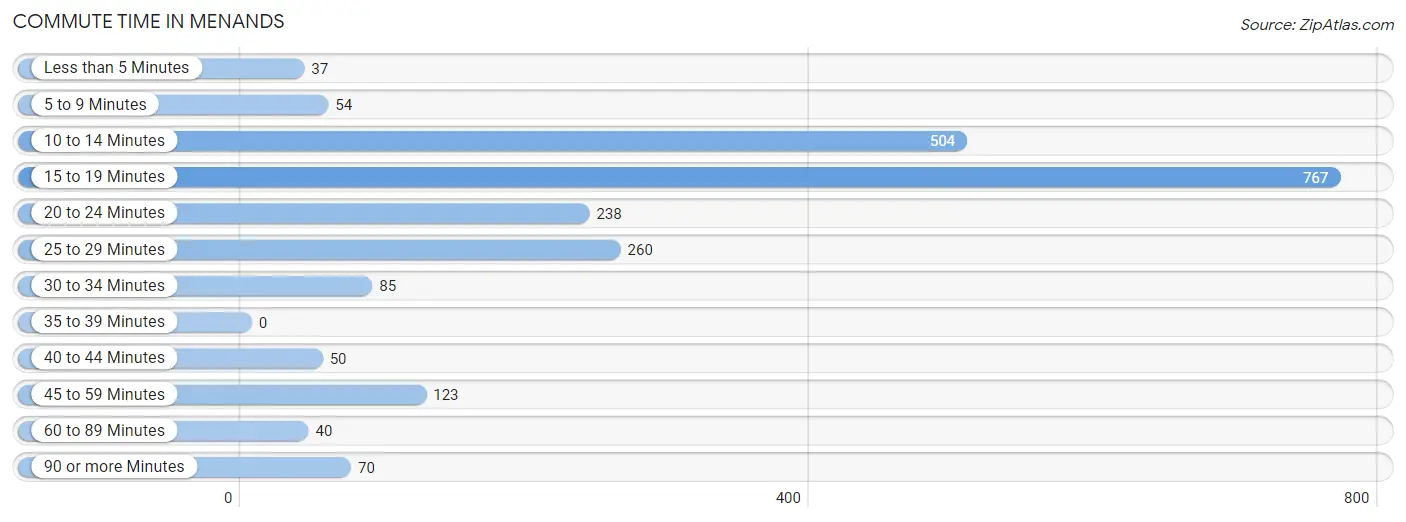
| Commute Time | # Commuters | % Commuters |
| Less than 5 Minutes | 37 | 1.7% |
| 5 to 9 Minutes | 54 | 2.4% |
| 10 to 14 Minutes | 504 | 22.6% |
| 15 to 19 Minutes | 767 | 34.4% |
| 20 to 24 Minutes | 238 | 10.7% |
| 25 to 29 Minutes | 260 | 11.7% |
| 30 to 34 Minutes | 85 | 3.8% |
| 35 to 39 Minutes | 0 | 0.0% |
| 40 to 44 Minutes | 50 | 2.2% |
| 45 to 59 Minutes | 123 | 5.5% |
| 60 to 89 Minutes | 40 | 1.8% |
| 90 or more Minutes | 70 | 3.1% |
Commute Time by Sex in Menands
The most common commute times in Menands are 15 to 19 minutes (466 commuters, 37.0%) for males and 15 to 19 minutes (301 commuters, 31.0%) for females.
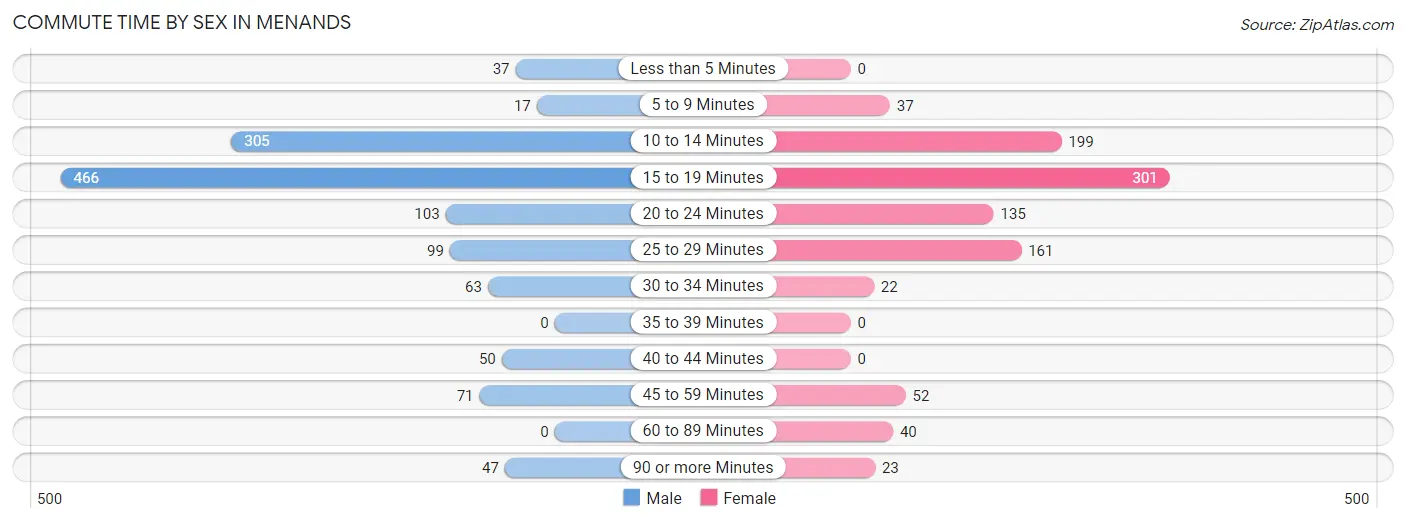
| Commute Time | Male | Female |
| Less than 5 Minutes | 37 (2.9%) | 0 (0.0%) |
| 5 to 9 Minutes | 17 (1.3%) | 37 (3.8%) |
| 10 to 14 Minutes | 305 (24.2%) | 199 (20.5%) |
| 15 to 19 Minutes | 466 (37.0%) | 301 (31.0%) |
| 20 to 24 Minutes | 103 (8.2%) | 135 (13.9%) |
| 25 to 29 Minutes | 99 (7.9%) | 161 (16.6%) |
| 30 to 34 Minutes | 63 (5.0%) | 22 (2.3%) |
| 35 to 39 Minutes | 0 (0.0%) | 0 (0.0%) |
| 40 to 44 Minutes | 50 (4.0%) | 0 (0.0%) |
| 45 to 59 Minutes | 71 (5.6%) | 52 (5.4%) |
| 60 to 89 Minutes | 0 (0.0%) | 40 (4.1%) |
| 90 or more Minutes | 47 (3.7%) | 23 (2.4%) |
Time of Departure to Work by Sex in Menands
The most frequent times of departure to work in Menands are 9:00 AM to 9:59 AM (265, 21.1%) for males and 8:00 AM to 8:29 AM (196, 20.2%) for females.
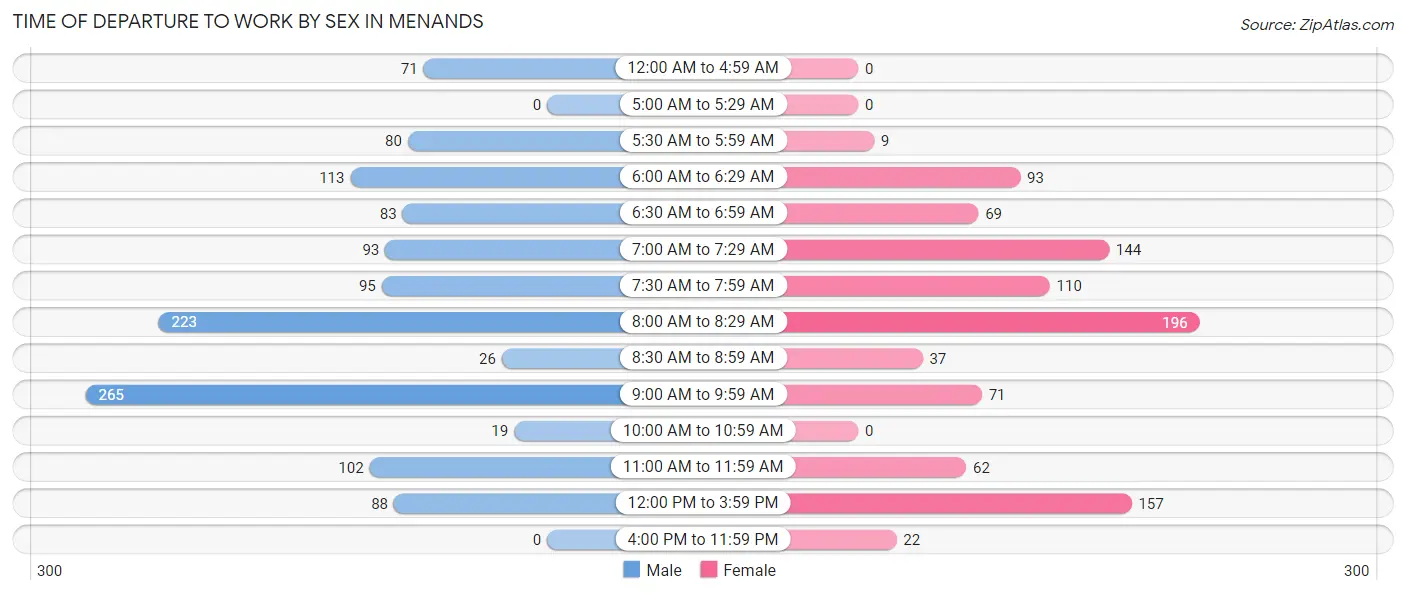
| Time of Departure | Male | Female |
| 12:00 AM to 4:59 AM | 71 (5.6%) | 0 (0.0%) |
| 5:00 AM to 5:29 AM | 0 (0.0%) | 0 (0.0%) |
| 5:30 AM to 5:59 AM | 80 (6.4%) | 9 (0.9%) |
| 6:00 AM to 6:29 AM | 113 (9.0%) | 93 (9.6%) |
| 6:30 AM to 6:59 AM | 83 (6.6%) | 69 (7.1%) |
| 7:00 AM to 7:29 AM | 93 (7.4%) | 144 (14.8%) |
| 7:30 AM to 7:59 AM | 95 (7.5%) | 110 (11.3%) |
| 8:00 AM to 8:29 AM | 223 (17.7%) | 196 (20.2%) |
| 8:30 AM to 8:59 AM | 26 (2.1%) | 37 (3.8%) |
| 9:00 AM to 9:59 AM | 265 (21.1%) | 71 (7.3%) |
| 10:00 AM to 10:59 AM | 19 (1.5%) | 0 (0.0%) |
| 11:00 AM to 11:59 AM | 102 (8.1%) | 62 (6.4%) |
| 12:00 PM to 3:59 PM | 88 (7.0%) | 157 (16.2%) |
| 4:00 PM to 11:59 PM | 0 (0.0%) | 22 (2.3%) |
| Total | 1,258 (100.0%) | 970 (100.0%) |
Housing Occupancy in Menands
Occupancy by Ownership in Menands
Of the total 2,214 dwellings in Menands, owner-occupied units account for 681 (30.8%), while renter-occupied units make up 1,533 (69.2%).
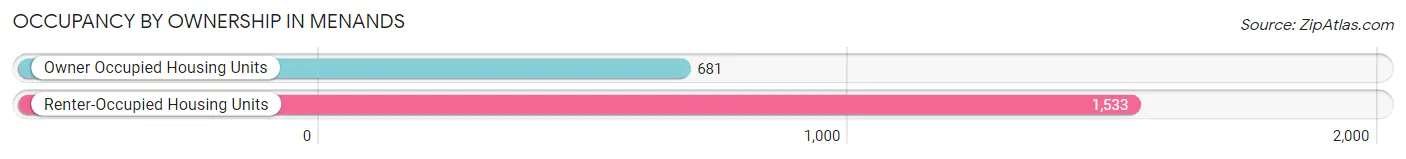
| Occupancy | # Housing Units | % Housing Units |
| Owner Occupied Housing Units | 681 | 30.8% |
| Renter-Occupied Housing Units | 1,533 | 69.2% |
| Total Occupied Housing Units | 2,214 | 100.0% |
Occupancy by Household Size in Menands
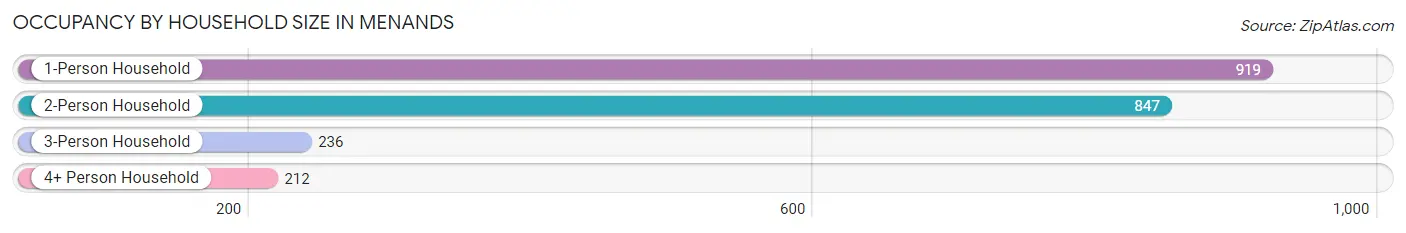
| Household Size | # Housing Units | % Housing Units |
| 1-Person Household | 919 | 41.5% |
| 2-Person Household | 847 | 38.3% |
| 3-Person Household | 236 | 10.7% |
| 4+ Person Household | 212 | 9.6% |
| Total Housing Units | 2,214 | 100.0% |
Occupancy by Ownership by Household Size in Menands
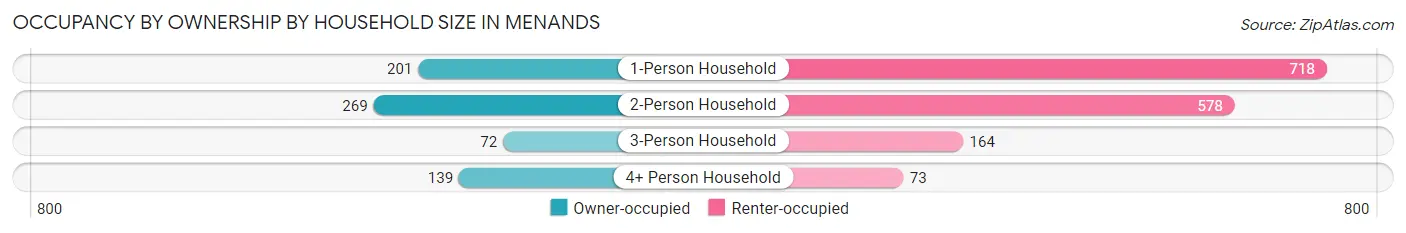
| Household Size | Owner-occupied | Renter-occupied |
| 1-Person Household | 201 (21.9%) | 718 (78.1%) |
| 2-Person Household | 269 (31.8%) | 578 (68.2%) |
| 3-Person Household | 72 (30.5%) | 164 (69.5%) |
| 4+ Person Household | 139 (65.6%) | 73 (34.4%) |
| Total Housing Units | 681 (30.8%) | 1,533 (69.2%) |
Occupancy by Educational Attainment in Menands
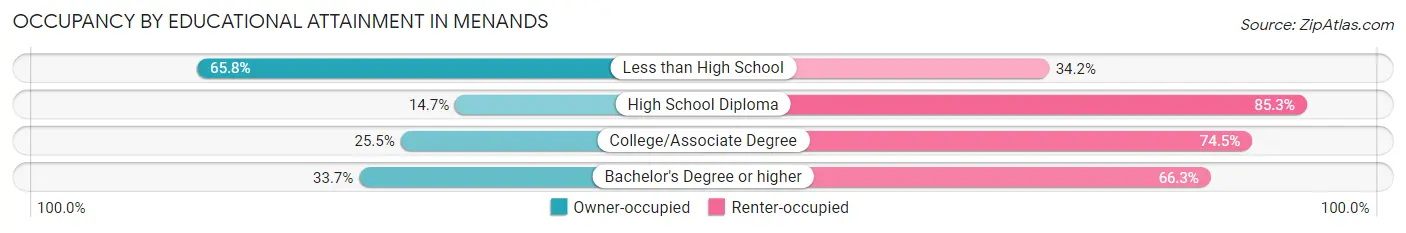
| Household Size | Owner-occupied | Renter-occupied |
| Less than High School | 100 (65.8%) | 52 (34.2%) |
| High School Diploma | 54 (14.7%) | 314 (85.3%) |
| College/Associate Degree | 135 (25.5%) | 395 (74.5%) |
| Bachelor's Degree or higher | 392 (33.7%) | 772 (66.3%) |
Occupancy by Age of Householder in Menands
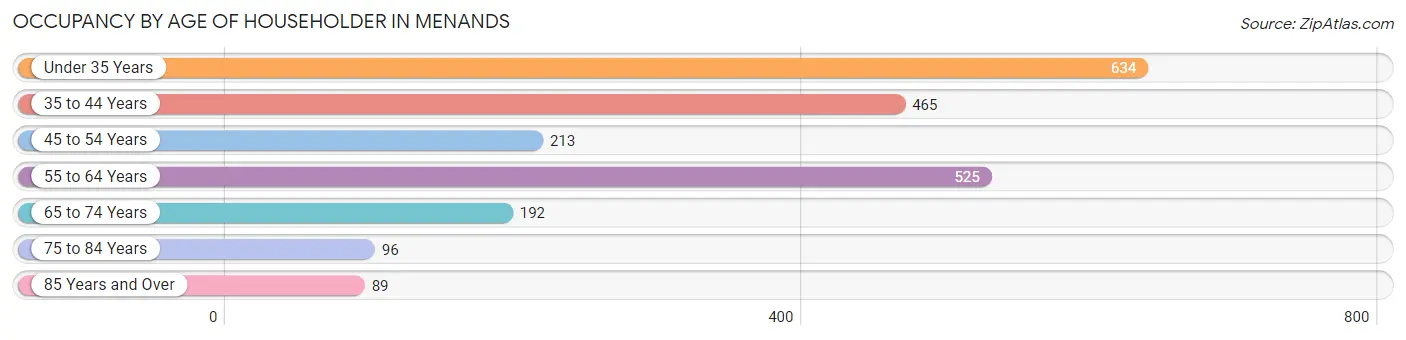
| Age Bracket | # Households | % Households |
| Under 35 Years | 634 | 28.6% |
| 35 to 44 Years | 465 | 21.0% |
| 45 to 54 Years | 213 | 9.6% |
| 55 to 64 Years | 525 | 23.7% |
| 65 to 74 Years | 192 | 8.7% |
| 75 to 84 Years | 96 | 4.3% |
| 85 Years and Over | 89 | 4.0% |
| Total | 2,214 | 100.0% |
Housing Finances in Menands
Median Income by Occupancy in Menands
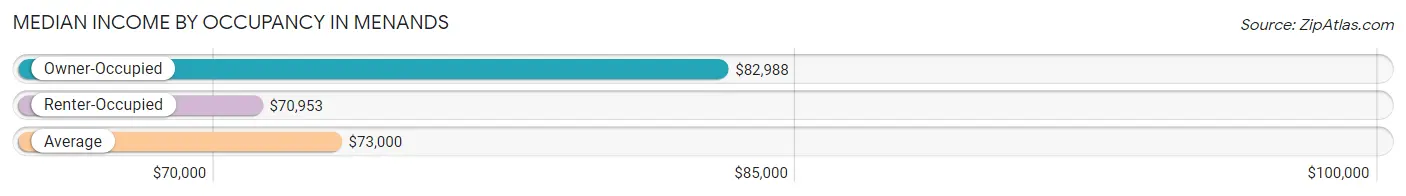
| Occupancy Type | # Households | Median Income |
| Owner-Occupied | 681 (30.8%) | $82,988 |
| Renter-Occupied | 1,533 (69.2%) | $70,953 |
| Average | 2,214 (100.0%) | $73,000 |
Occupancy by Householder Income Bracket in Menands
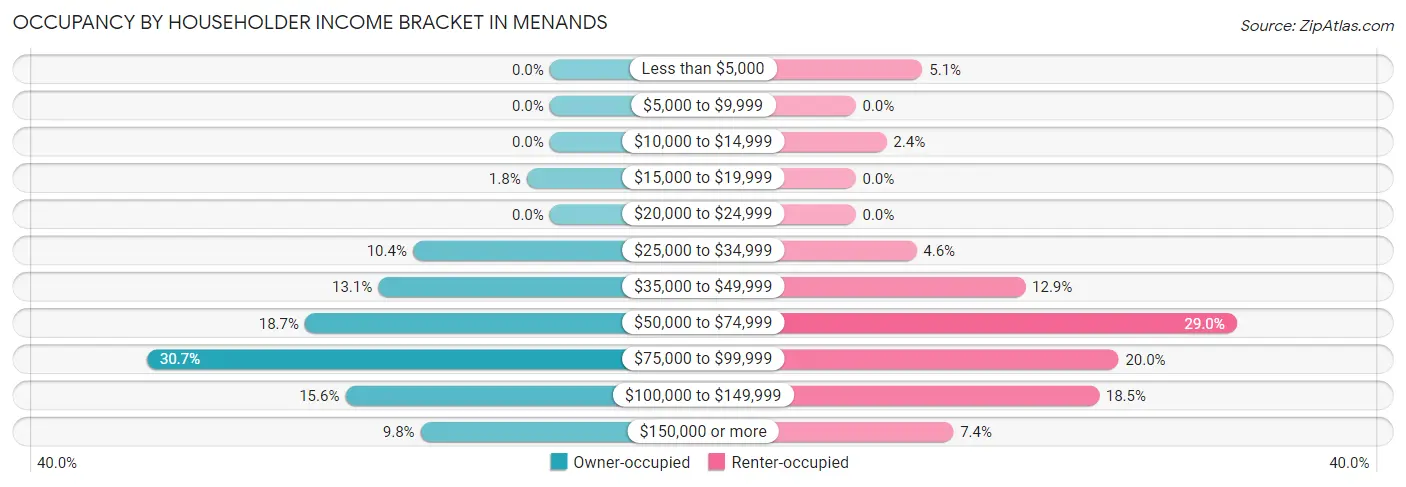
| Income Bracket | Owner-occupied | Renter-occupied |
| Less than $5,000 | 0 (0.0%) | 78 (5.1%) |
| $5,000 to $9,999 | 0 (0.0%) | 0 (0.0%) |
| $10,000 to $14,999 | 0 (0.0%) | 36 (2.4%) |
| $15,000 to $19,999 | 12 (1.8%) | 0 (0.0%) |
| $20,000 to $24,999 | 0 (0.0%) | 0 (0.0%) |
| $25,000 to $34,999 | 71 (10.4%) | 71 (4.6%) |
| $35,000 to $49,999 | 89 (13.1%) | 198 (12.9%) |
| $50,000 to $74,999 | 127 (18.6%) | 445 (29.0%) |
| $75,000 to $99,999 | 209 (30.7%) | 307 (20.0%) |
| $100,000 to $149,999 | 106 (15.6%) | 284 (18.5%) |
| $150,000 or more | 67 (9.8%) | 114 (7.4%) |
| Total | 681 (100.0%) | 1,533 (100.0%) |
Monthly Housing Cost Tiers in Menands
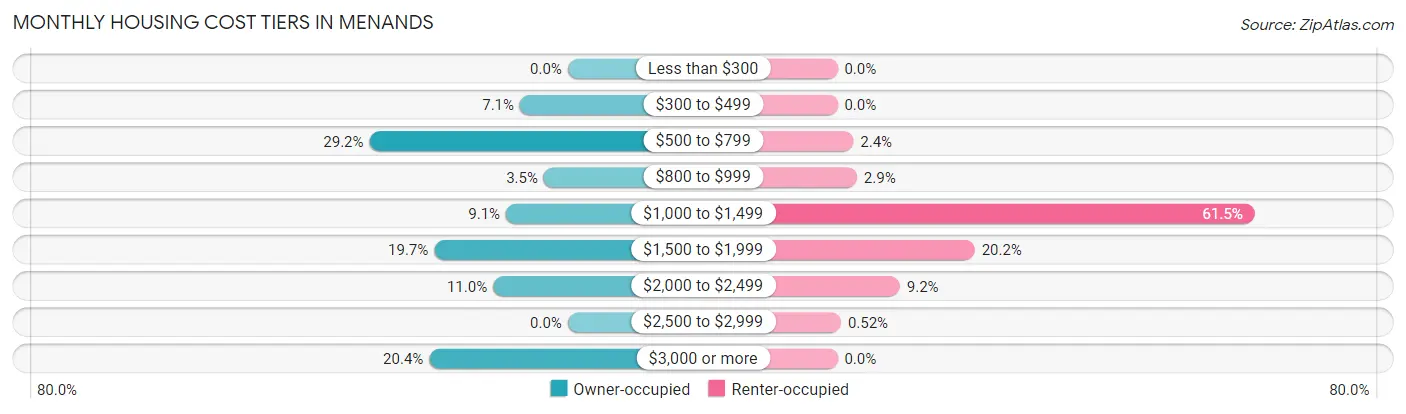
| Monthly Cost | Owner-occupied | Renter-occupied |
| Less than $300 | 0 (0.0%) | 0 (0.0%) |
| $300 to $499 | 48 (7.0%) | 0 (0.0%) |
| $500 to $799 | 199 (29.2%) | 36 (2.4%) |
| $800 to $999 | 24 (3.5%) | 44 (2.9%) |
| $1,000 to $1,499 | 62 (9.1%) | 942 (61.5%) |
| $1,500 to $1,999 | 134 (19.7%) | 310 (20.2%) |
| $2,000 to $2,499 | 75 (11.0%) | 141 (9.2%) |
| $2,500 to $2,999 | 0 (0.0%) | 8 (0.5%) |
| $3,000 or more | 139 (20.4%) | 0 (0.0%) |
| Total | 681 (100.0%) | 1,533 (100.0%) |
Physical Housing Characteristics in Menands
Housing Structures in Menands
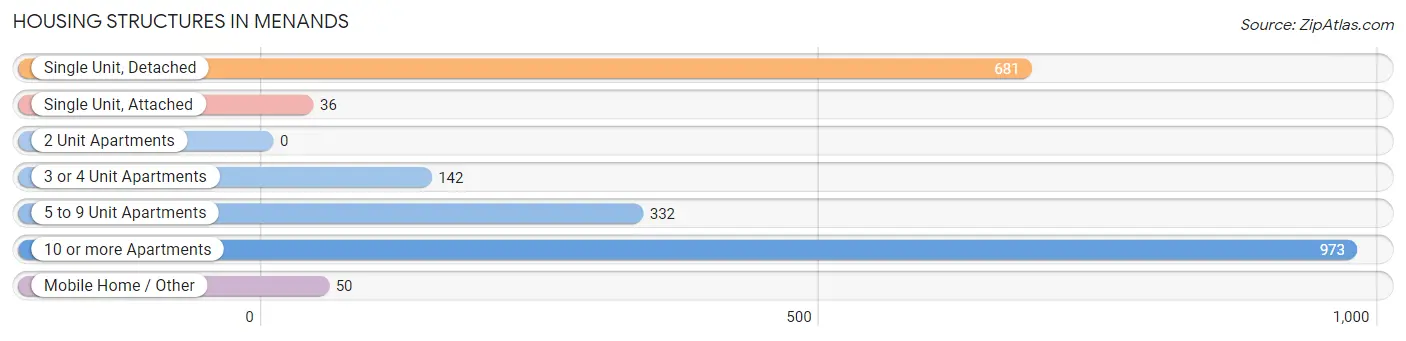
| Structure Type | # Housing Units | % Housing Units |
| Single Unit, Detached | 681 | 30.8% |
| Single Unit, Attached | 36 | 1.6% |
| 2 Unit Apartments | 0 | 0.0% |
| 3 or 4 Unit Apartments | 142 | 6.4% |
| 5 to 9 Unit Apartments | 332 | 15.0% |
| 10 or more Apartments | 973 | 44.0% |
| Mobile Home / Other | 50 | 2.3% |
| Total | 2,214 | 100.0% |
Housing Structures by Occupancy in Menands
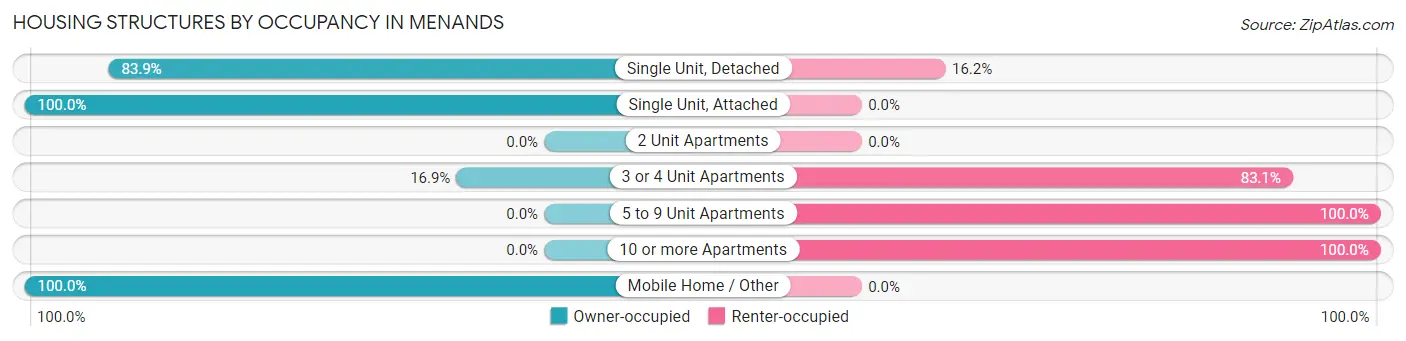
| Structure Type | Owner-occupied | Renter-occupied |
| Single Unit, Detached | 571 (83.9%) | 110 (16.2%) |
| Single Unit, Attached | 36 (100.0%) | 0 (0.0%) |
| 2 Unit Apartments | 0 (0.0%) | 0 (0.0%) |
| 3 or 4 Unit Apartments | 24 (16.9%) | 118 (83.1%) |
| 5 to 9 Unit Apartments | 0 (0.0%) | 332 (100.0%) |
| 10 or more Apartments | 0 (0.0%) | 973 (100.0%) |
| Mobile Home / Other | 50 (100.0%) | 0 (0.0%) |
| Total | 681 (30.8%) | 1,533 (69.2%) |
Housing Structures by Number of Rooms in Menands
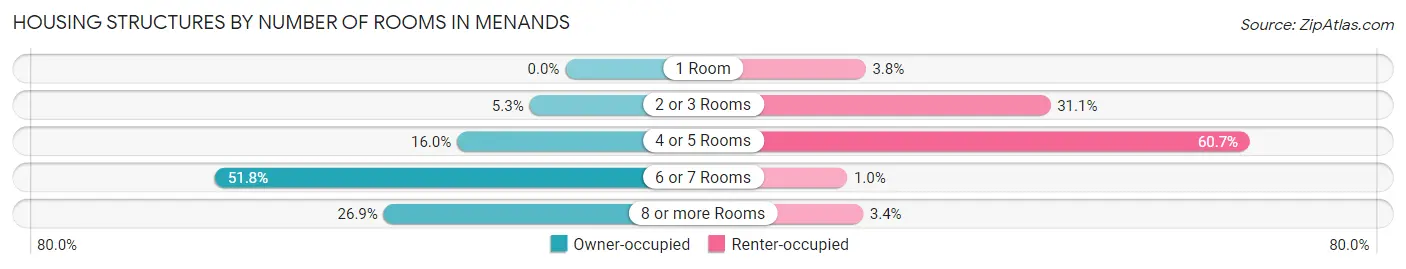
| Number of Rooms | Owner-occupied | Renter-occupied |
| 1 Room | 0 (0.0%) | 58 (3.8%) |
| 2 or 3 Rooms | 36 (5.3%) | 477 (31.1%) |
| 4 or 5 Rooms | 109 (16.0%) | 930 (60.7%) |
| 6 or 7 Rooms | 353 (51.8%) | 16 (1.0%) |
| 8 or more Rooms | 183 (26.9%) | 52 (3.4%) |
| Total | 681 (100.0%) | 1,533 (100.0%) |
Housing Structure by Heating Type in Menands
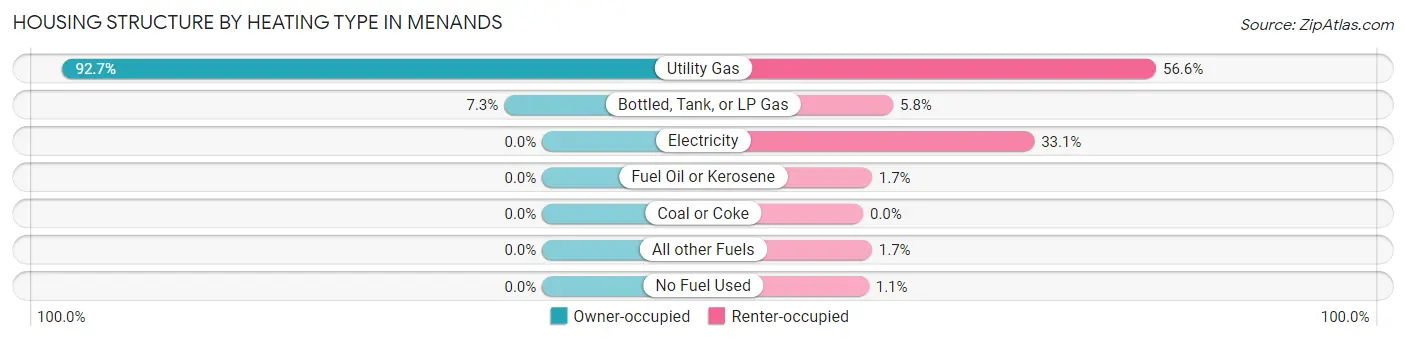
| Heating Type | Owner-occupied | Renter-occupied |
| Utility Gas | 631 (92.7%) | 868 (56.6%) |
| Bottled, Tank, or LP Gas | 50 (7.3%) | 89 (5.8%) |
| Electricity | 0 (0.0%) | 507 (33.1%) |
| Fuel Oil or Kerosene | 0 (0.0%) | 26 (1.7%) |
| Coal or Coke | 0 (0.0%) | 0 (0.0%) |
| All other Fuels | 0 (0.0%) | 26 (1.7%) |
| No Fuel Used | 0 (0.0%) | 17 (1.1%) |
| Total | 681 (100.0%) | 1,533 (100.0%) |
Household Vehicle Usage in Menands
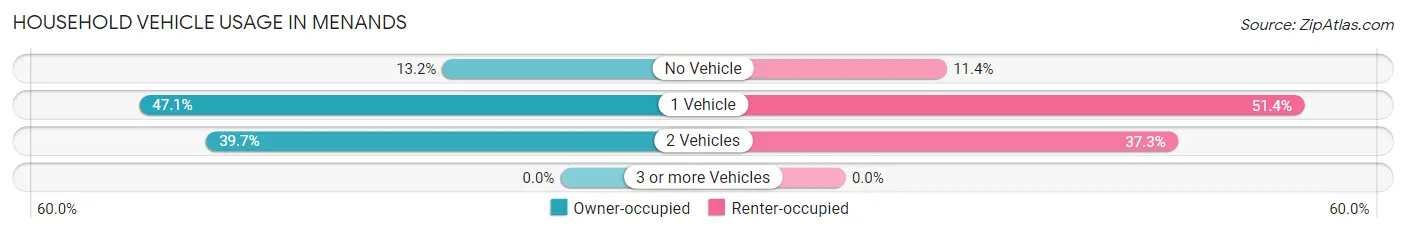
| Vehicles per Household | Owner-occupied | Renter-occupied |
| No Vehicle | 90 (13.2%) | 174 (11.4%) |
| 1 Vehicle | 321 (47.1%) | 788 (51.4%) |
| 2 Vehicles | 270 (39.7%) | 571 (37.2%) |
| 3 or more Vehicles | 0 (0.0%) | 0 (0.0%) |
| Total | 681 (100.0%) | 1,533 (100.0%) |
Real Estate & Mortgages in Menands
Real Estate and Mortgage Overview in Menands
| Characteristic | Without Mortgage | With Mortgage |
| Housing Units | 233 | 448 |
| Median Property Value | $294,800 | $247,700 |
| Median Household Income | $75,398 | $51 |
| Monthly Housing Costs | $677 | $139 |
| Real Estate Taxes | $5,995 | $100 |
Property Value by Mortgage Status in Menands
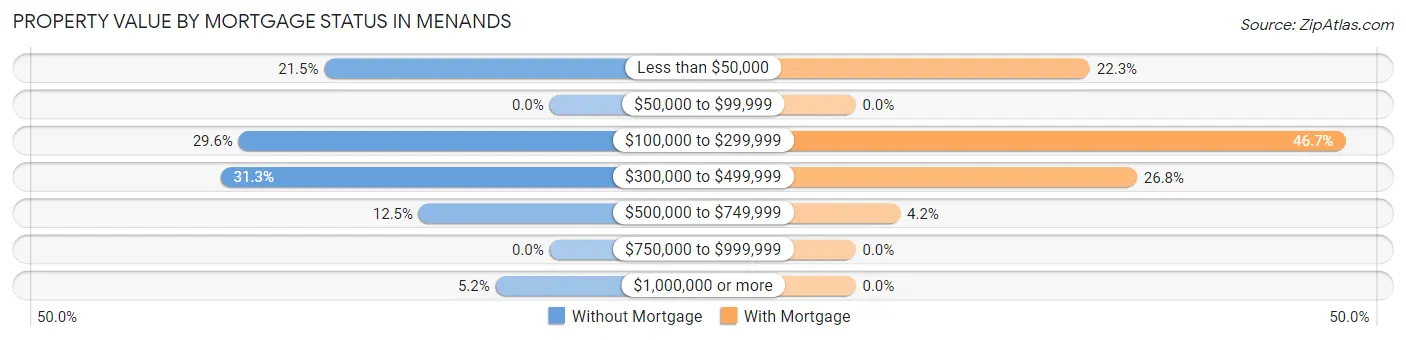
| Property Value | Without Mortgage | With Mortgage |
| Less than $50,000 | 50 (21.5%) | 100 (22.3%) |
| $50,000 to $99,999 | 0 (0.0%) | 0 (0.0%) |
| $100,000 to $299,999 | 69 (29.6%) | 209 (46.7%) |
| $300,000 to $499,999 | 73 (31.3%) | 120 (26.8%) |
| $500,000 to $749,999 | 29 (12.4%) | 19 (4.2%) |
| $750,000 to $999,999 | 0 (0.0%) | 0 (0.0%) |
| $1,000,000 or more | 12 (5.1%) | 0 (0.0%) |
| Total | 233 (100.0%) | 448 (100.0%) |
Household Income by Mortgage Status in Menands
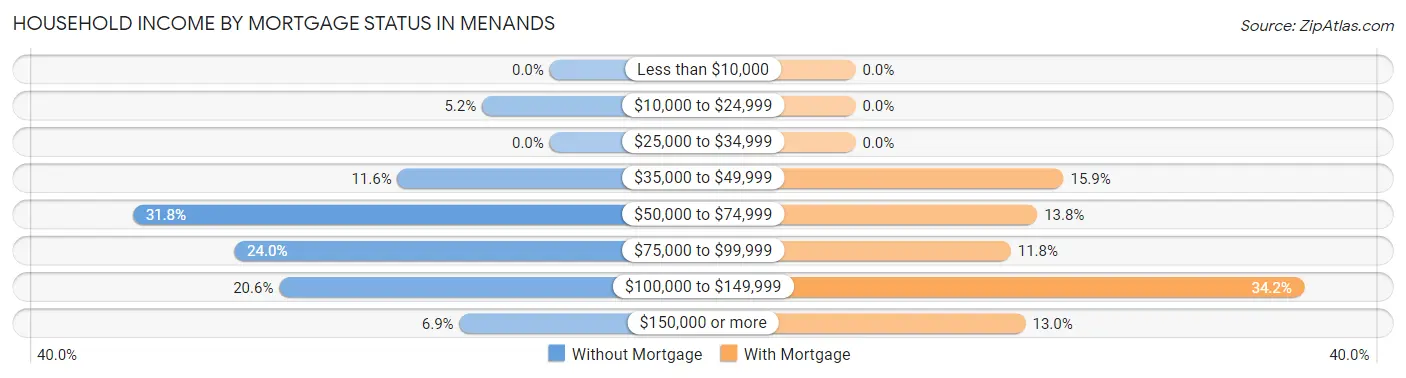
| Household Income | Without Mortgage | With Mortgage |
| Less than $10,000 | 0 (0.0%) | 0 (0.0%) |
| $10,000 to $24,999 | 12 (5.1%) | 0 (0.0%) |
| $25,000 to $34,999 | 0 (0.0%) | 0 (0.0%) |
| $35,000 to $49,999 | 27 (11.6%) | 71 (15.9%) |
| $50,000 to $74,999 | 74 (31.8%) | 62 (13.8%) |
| $75,000 to $99,999 | 56 (24.0%) | 53 (11.8%) |
| $100,000 to $149,999 | 48 (20.6%) | 153 (34.2%) |
| $150,000 or more | 16 (6.9%) | 58 (13.0%) |
| Total | 233 (100.0%) | 448 (100.0%) |
Property Value to Household Income Ratio in Menands
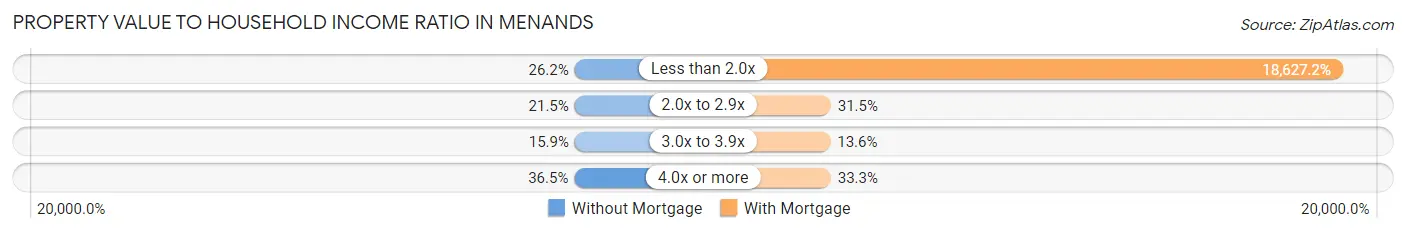
| Value-to-Income Ratio | Without Mortgage | With Mortgage |
| Less than 2.0x | 61 (26.2%) | 83,450 (18,627.2%) |
| 2.0x to 2.9x | 50 (21.5%) | 141 (31.5%) |
| 3.0x to 3.9x | 37 (15.9%) | 61 (13.6%) |
| 4.0x or more | 85 (36.5%) | 149 (33.3%) |
| Total | 233 (100.0%) | 448 (100.0%) |
Real Estate Taxes by Mortgage Status in Menands
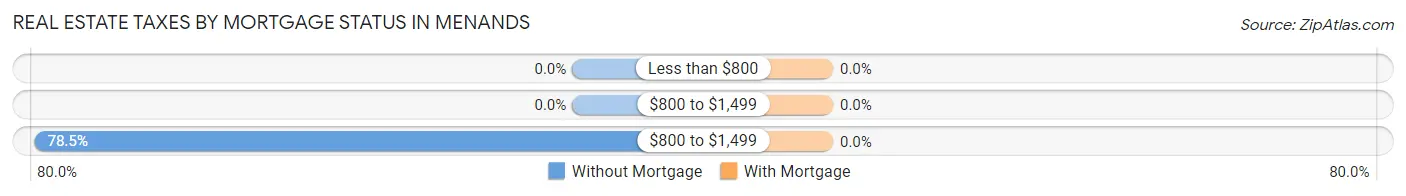
| Property Taxes | Without Mortgage | With Mortgage |
| Less than $800 | 0 (0.0%) | 0 (0.0%) |
| $800 to $1,499 | 0 (0.0%) | 0 (0.0%) |
| $800 to $1,499 | 183 (78.5%) | 0 (0.0%) |
| Total | 233 (100.0%) | 448 (100.0%) |
Health & Disability in Menands
Health Insurance Coverage by Age in Menands
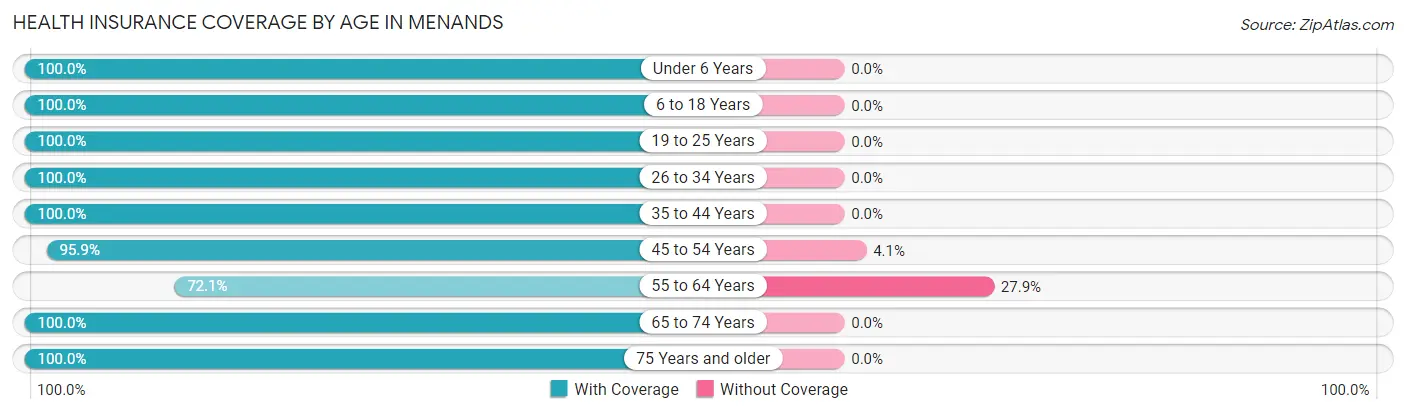
| Age Bracket | With Coverage | Without Coverage |
| Under 6 Years | 542 (100.0%) | 0 (0.0%) |
| 6 to 18 Years | 458 (100.0%) | 0 (0.0%) |
| 19 to 25 Years | 270 (100.0%) | 0 (0.0%) |
| 26 to 34 Years | 873 (100.0%) | 0 (0.0%) |
| 35 to 44 Years | 746 (100.0%) | 0 (0.0%) |
| 45 to 54 Years | 258 (95.9%) | 11 (4.1%) |
| 55 to 64 Years | 522 (72.1%) | 202 (27.9%) |
| 65 to 74 Years | 303 (100.0%) | 0 (0.0%) |
| 75 Years and older | 327 (100.0%) | 0 (0.0%) |
| Total | 4,299 (95.3%) | 213 (4.7%) |
Health Insurance Coverage by Citizenship Status in Menands
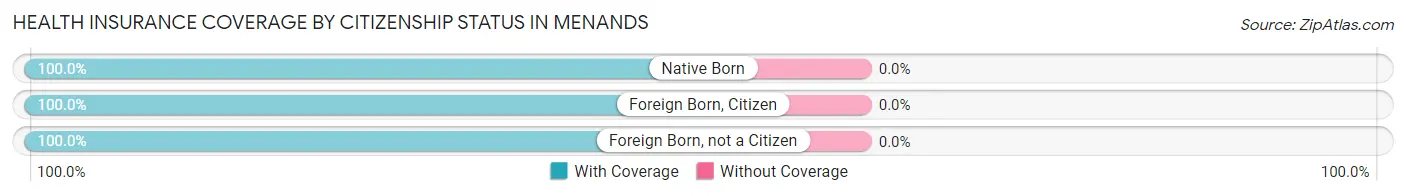
| Citizenship Status | With Coverage | Without Coverage |
| Native Born | 542 (100.0%) | 0 (0.0%) |
| Foreign Born, Citizen | 458 (100.0%) | 0 (0.0%) |
| Foreign Born, not a Citizen | 270 (100.0%) | 0 (0.0%) |
Health Insurance Coverage by Household Income in Menands
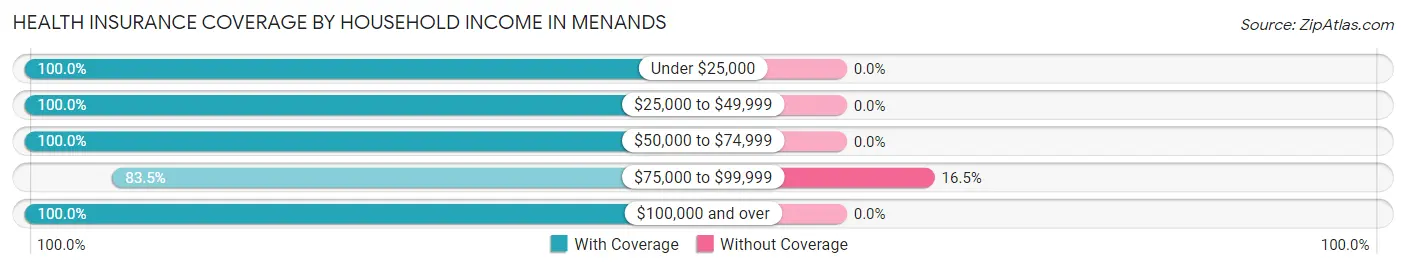
| Household Income | With Coverage | Without Coverage |
| Under $25,000 | 194 (100.0%) | 0 (0.0%) |
| $25,000 to $49,999 | 704 (100.0%) | 0 (0.0%) |
| $50,000 to $74,999 | 913 (100.0%) | 0 (0.0%) |
| $75,000 to $99,999 | 1,081 (83.5%) | 213 (16.5%) |
| $100,000 and over | 1,341 (100.0%) | 0 (0.0%) |
Public vs Private Health Insurance Coverage by Age in Menands
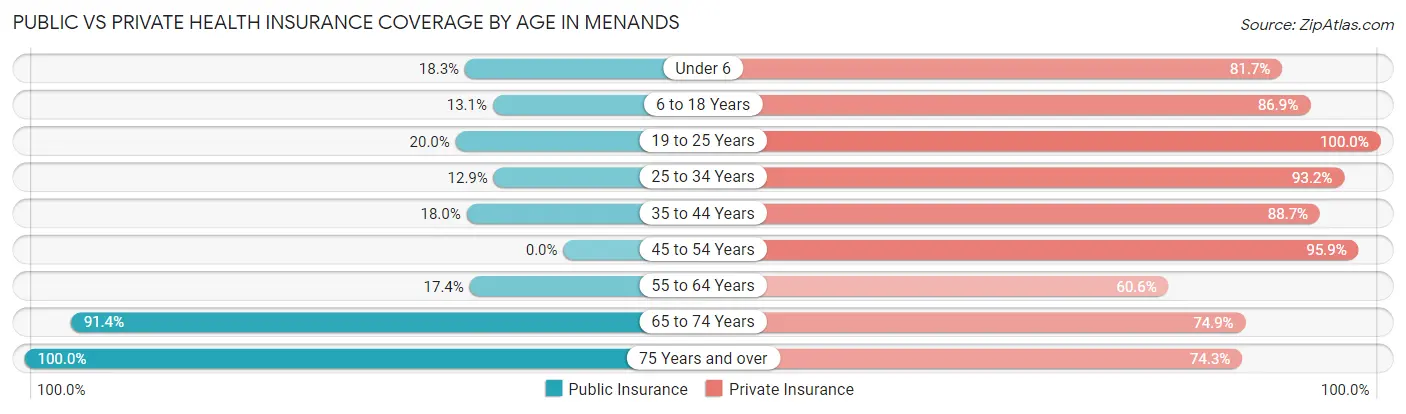
| Age Bracket | Public Insurance | Private Insurance |
| Under 6 | 99 (18.3%) | 443 (81.7%) |
| 6 to 18 Years | 60 (13.1%) | 398 (86.9%) |
| 19 to 25 Years | 54 (20.0%) | 270 (100.0%) |
| 25 to 34 Years | 113 (12.9%) | 814 (93.2%) |
| 35 to 44 Years | 134 (18.0%) | 662 (88.7%) |
| 45 to 54 Years | 0 (0.0%) | 258 (95.9%) |
| 55 to 64 Years | 126 (17.4%) | 439 (60.6%) |
| 65 to 74 Years | 277 (91.4%) | 227 (74.9%) |
| 75 Years and over | 327 (100.0%) | 243 (74.3%) |
| Total | 1,190 (26.4%) | 3,754 (83.2%) |
Disability Status by Sex by Age in Menands
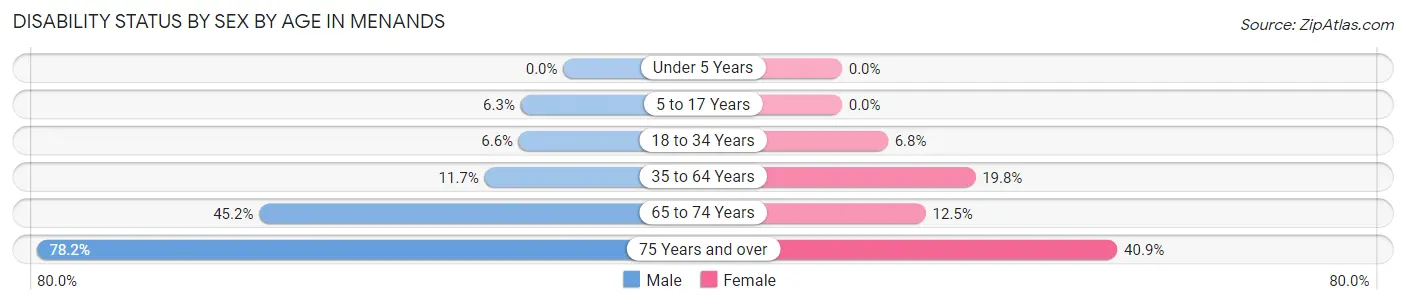
| Age Bracket | Male | Female |
| Under 5 Years | 0 (0.0%) | 0 (0.0%) |
| 5 to 17 Years | 31 (6.3%) | 0 (0.0%) |
| 18 to 34 Years | 35 (6.6%) | 42 (6.8%) |
| 35 to 64 Years | 103 (11.7%) | 170 (19.8%) |
| 65 to 74 Years | 28 (45.2%) | 30 (12.4%) |
| 75 Years and over | 97 (78.2%) | 83 (40.9%) |
Disability Class by Sex by Age in Menands
Disability Class: Hearing Difficulty
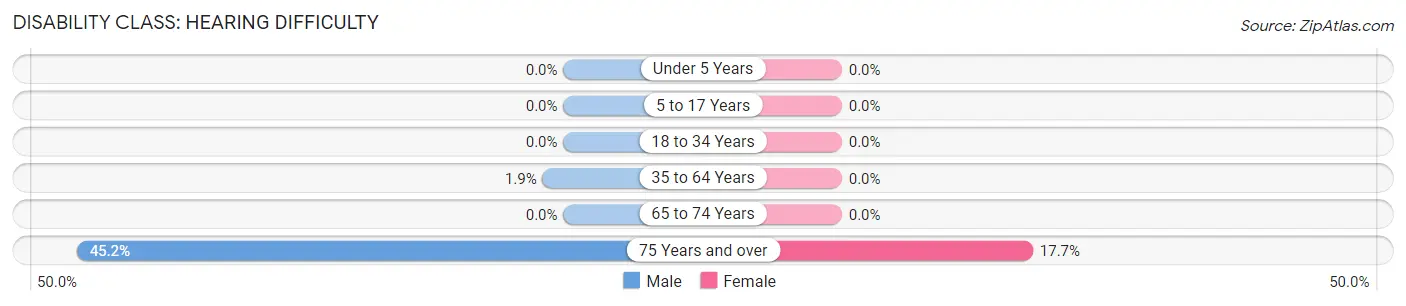
| Age Bracket | Male | Female |
| Under 5 Years | 0 (0.0%) | 0 (0.0%) |
| 5 to 17 Years | 0 (0.0%) | 0 (0.0%) |
| 18 to 34 Years | 0 (0.0%) | 0 (0.0%) |
| 35 to 64 Years | 17 (1.9%) | 0 (0.0%) |
| 65 to 74 Years | 0 (0.0%) | 0 (0.0%) |
| 75 Years and over | 56 (45.2%) | 36 (17.7%) |
Disability Class: Vision Difficulty
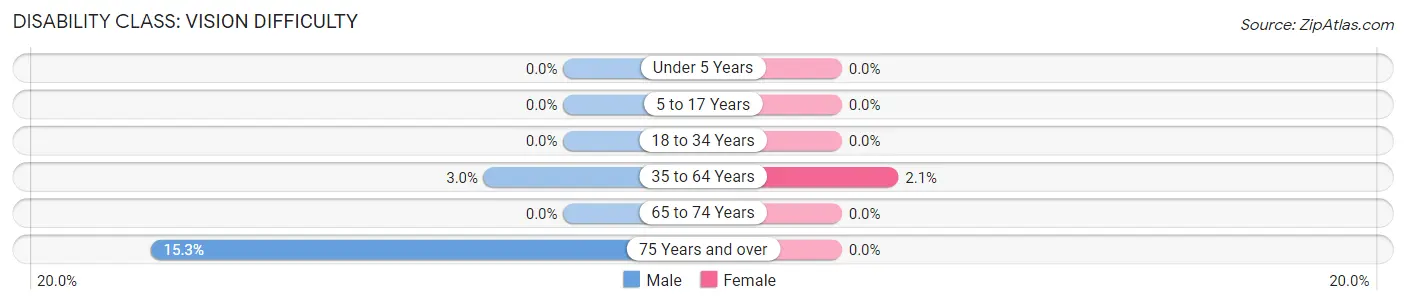
| Age Bracket | Male | Female |
| Under 5 Years | 0 (0.0%) | 0 (0.0%) |
| 5 to 17 Years | 0 (0.0%) | 0 (0.0%) |
| 18 to 34 Years | 0 (0.0%) | 0 (0.0%) |
| 35 to 64 Years | 26 (2.9%) | 18 (2.1%) |
| 65 to 74 Years | 0 (0.0%) | 0 (0.0%) |
| 75 Years and over | 19 (15.3%) | 0 (0.0%) |
Disability Class: Cognitive Difficulty
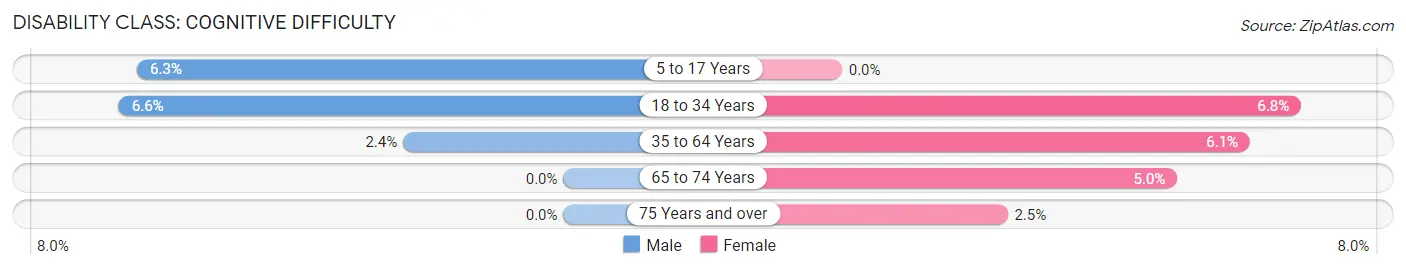
| Age Bracket | Male | Female |
| 5 to 17 Years | 31 (6.3%) | 0 (0.0%) |
| 18 to 34 Years | 35 (6.6%) | 42 (6.8%) |
| 35 to 64 Years | 21 (2.4%) | 52 (6.1%) |
| 65 to 74 Years | 0 (0.0%) | 12 (5.0%) |
| 75 Years and over | 0 (0.0%) | 5 (2.5%) |
Disability Class: Ambulatory Difficulty
| Age Bracket | Male | Female |
| 5 to 17 Years | 0 (0.0%) | 0 (0.0%) |
| 18 to 34 Years | 35 (6.6%) | 0 (0.0%) |
| 35 to 64 Years | 39 (4.4%) | 152 (17.7%) |
| 65 to 74 Years | 0 (0.0%) | 18 (7.5%) |
| 75 Years and over | 22 (17.7%) | 58 (28.6%) |
Disability Class: Self-Care Difficulty
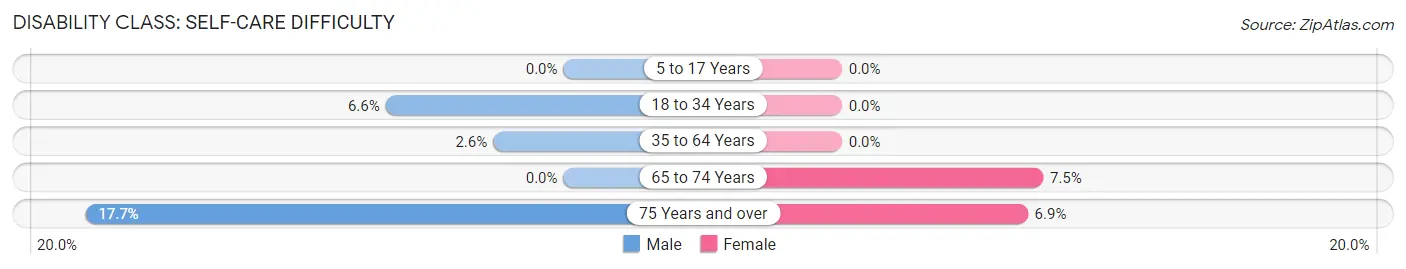
| Age Bracket | Male | Female |
| 5 to 17 Years | 0 (0.0%) | 0 (0.0%) |
| 18 to 34 Years | 35 (6.6%) | 0 (0.0%) |
| 35 to 64 Years | 23 (2.6%) | 0 (0.0%) |
| 65 to 74 Years | 0 (0.0%) | 18 (7.5%) |
| 75 Years and over | 22 (17.7%) | 14 (6.9%) |
Technology Access in Menands
Computing Device Access in Menands
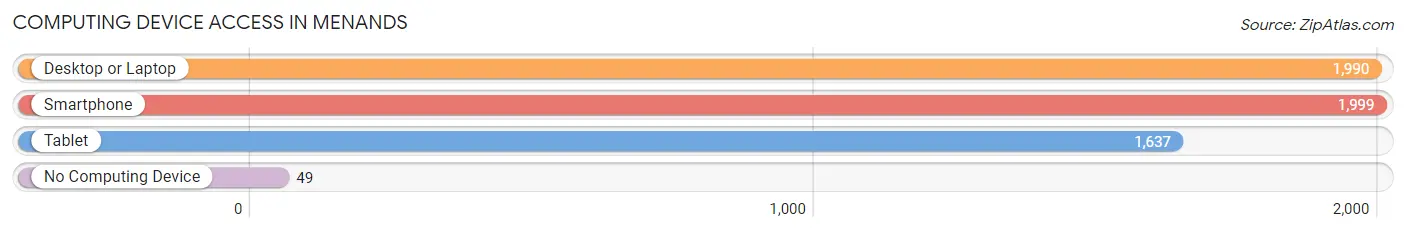
| Device Type | # Households | % Households |
| Desktop or Laptop | 1,990 | 89.9% |
| Smartphone | 1,999 | 90.3% |
| Tablet | 1,637 | 73.9% |
| No Computing Device | 49 | 2.2% |
| Total | 2,214 | 100.0% |
Internet Access in Menands
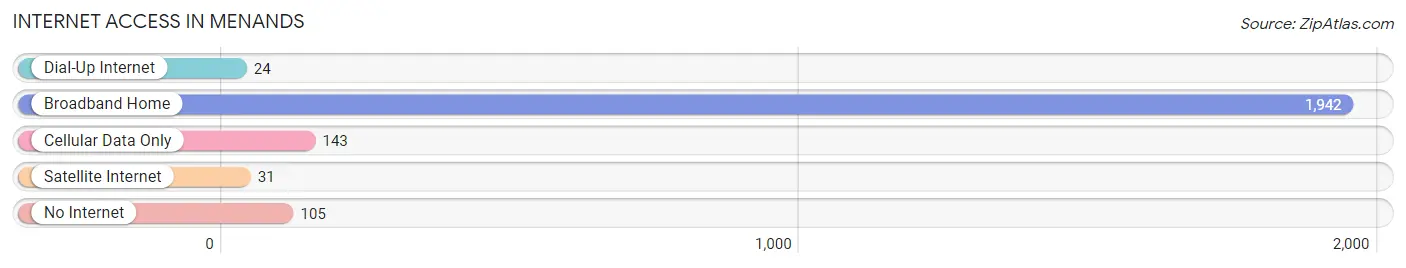
| Internet Type | # Households | % Households |
| Dial-Up Internet | 24 | 1.1% |
| Broadband Home | 1,942 | 87.7% |
| Cellular Data Only | 143 | 6.5% |
| Satellite Internet | 31 | 1.4% |
| No Internet | 105 | 4.7% |
| Total | 2,214 | 100.0% |
Menands Summary
Menands is a village located in Albany County, New York, United States. It is a suburb of the city of Albany, located on the west bank of the Hudson River. The population was 3,990 at the 2010 census.
History
The area that is now Menands was originally inhabited by the Mahican Native American tribe. The first European settlers arrived in the area in the late 17th century. The village was originally known as “The Flats” and was part of the Manor of Rensselaerswyck. The village was incorporated in 1836 and was named after Louis Menand, a French-Canadian fur trader who had settled in the area in the late 1700s.
In the 19th century, Menands was a popular summer resort destination for wealthy Albany residents. The village was home to several large estates, including the estate of the prominent Van Rensselaer family. The village also had several hotels, including the Menands Hotel, which was built in 1845 and was a popular destination for visitors from New York City.
In the early 20th century, Menands became a popular residential area for middle-class families. The village was home to several factories, including the Albany Felt Company, which was founded in 1891 and was the largest felt manufacturer in the world at the time. The village also had several stores, including a grocery store, a hardware store, and a pharmacy.
Geography
Menands is located in the northern part of Albany County, on the west bank of the Hudson River. The village is bordered by the city of Albany to the south, the town of Colonie to the east, and the town of North Greenbush to the north. The village is located approximately 5 miles north of downtown Albany.
The village has a total area of 1.2 square miles, all of which is land. The village is located in a flat, low-lying area, with an elevation of approximately 50 feet above sea level. The village is located in the Mohawk River watershed.
Economy
The economy of Menands is largely based on the service industry. The village is home to several businesses, including restaurants, retail stores, and professional services. The village is also home to several government offices, including the Albany County Department of Social Services and the Albany County Department of Mental Health.
The village is also home to several manufacturing companies, including the Albany Felt Company, which is still in operation today. The village is also home to several warehouses and distribution centers, including the Albany Distribution Center, which is operated by the United Parcel Service.
Demographics
As of the 2010 census, the population of Menands was 3,990. The racial makeup of the village was 87.3% White, 5.7% African American, 0.3% Native American, 2.2% Asian, 0.1% Pacific Islander, 1.7% from other races, and 2.9% from two or more races. Hispanic or Latino of any race were 5.2% of the population.
The median household income in Menands was $50,972, and the median family income was $60,972. The per capita income for the village was $25,972. About 8.3% of families and 10.2% of the population were below the poverty line, including 14.2% of those under age 18 and 5.2% of those age 65 or over.
Common Questions
What is Per Capita Income in Menands?
Per Capita income in Menands is $39,801.
What is the Median Family Income in Menands?
Median Family Income in Menands is $82,563.
What is the Median Household income in Menands?
Median Household Income in Menands is $73,000.
What is Income or Wage Gap in Menands?
Income or Wage Gap in Menands is 17.8%.
Women in Menands earn 82.2 cents for every dollar earned by a man.
What is Inequality or Gini Index in Menands?
Inequality or Gini Index in Menands is 0.31.
What is the Total Population of Menands?
Total Population of Menands is 4,512.
What is the Total Male Population of Menands?
Total Male Population of Menands is 2,344.
What is the Total Female Population of Menands?
Total Female Population of Menands is 2,168.
What is the Ratio of Males per 100 Females in Menands?
There are 108.12 Males per 100 Females in Menands.
What is the Ratio of Females per 100 Males in Menands?
There are 92.49 Females per 100 Males in Menands.
What is the Median Population Age in Menands?
Median Population Age in Menands is 36.1 Years.
What is the Average Family Size in Menands
Average Family Size in Menands is 2.9 People.
What is the Average Household Size in Menands
Average Household Size in Menands is 2.0 People.
How Large is the Labor Force in Menands?
There are 2,541 People in the Labor Forcein in Menands.
What is the Percentage of People in the Labor Force in Menands?
72.3% of People are in the Labor Force in Menands.
What is the Unemployment Rate in Menands?
Unemployment Rate in Menands is 3.1%.