West End, NY Map & Demographics
West End Map
West End Overview
$31,702
PER CAPITA INCOME
$70,625
AVG FAMILY INCOME
$67,017
AVG HOUSEHOLD INCOME
20.5%
WAGE / INCOME GAP [ % ]
79.5¢/ $1
WAGE / INCOME GAP [ $ ]
0.35
INEQUALITY / GINI INDEX
2,142
TOTAL POPULATION
1,339
MALE POPULATION
803
FEMALE POPULATION
166.75
MALES / 100 FEMALES
59.97
FEMALES / 100 MALES
40.6
MEDIAN AGE
3.1
AVG FAMILY SIZE
2.4
AVG HOUSEHOLD SIZE
1,064
LABOR FORCE [ PEOPLE ]
61.1%
PERCENT IN LABOR FORCE
3.5%
UNEMPLOYMENT RATE
Income in West End
Income Overview in West End
Per Capita Income in West End is $31,702, while median incomes of families and households are $70,625 and $67,017 respectively.
| Characteristic | Number | Measure |
| Per Capita Income | 2,142 | $31,702 |
| Median Family Income | 477 | $70,625 |
| Mean Family Income | 477 | $92,892 |
| Median Household Income | 845 | $67,017 |
| Mean Household Income | 845 | $77,515 |
| Income Deficit | 477 | $0 |
| Wage / Income Gap (%) | 2,142 | 20.50% |
| Wage / Income Gap ($) | 2,142 | 79.50¢ per $1 |
| Gini / Inequality Index | 2,142 | 0.35 |
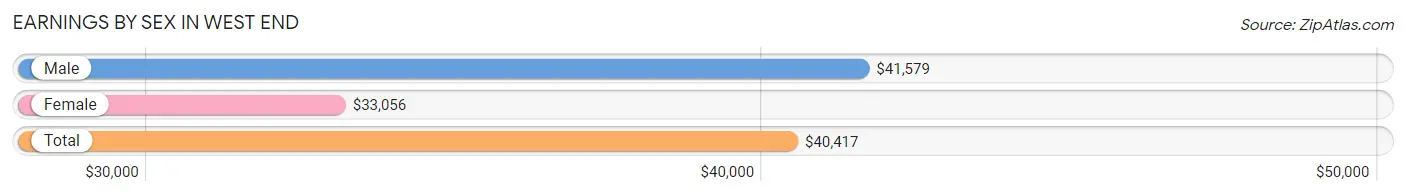
Earnings by Sex in West End
Average Earnings in West End are $40,417, $41,579 for men and $33,056 for women, a difference of 20.5%.
| Sex | Number | Average Earnings |
| Male | 662 (59.4%) | $41,579 |
| Female | 452 (40.6%) | $33,056 |
| Total | 1,114 (100.0%) | $40,417 |
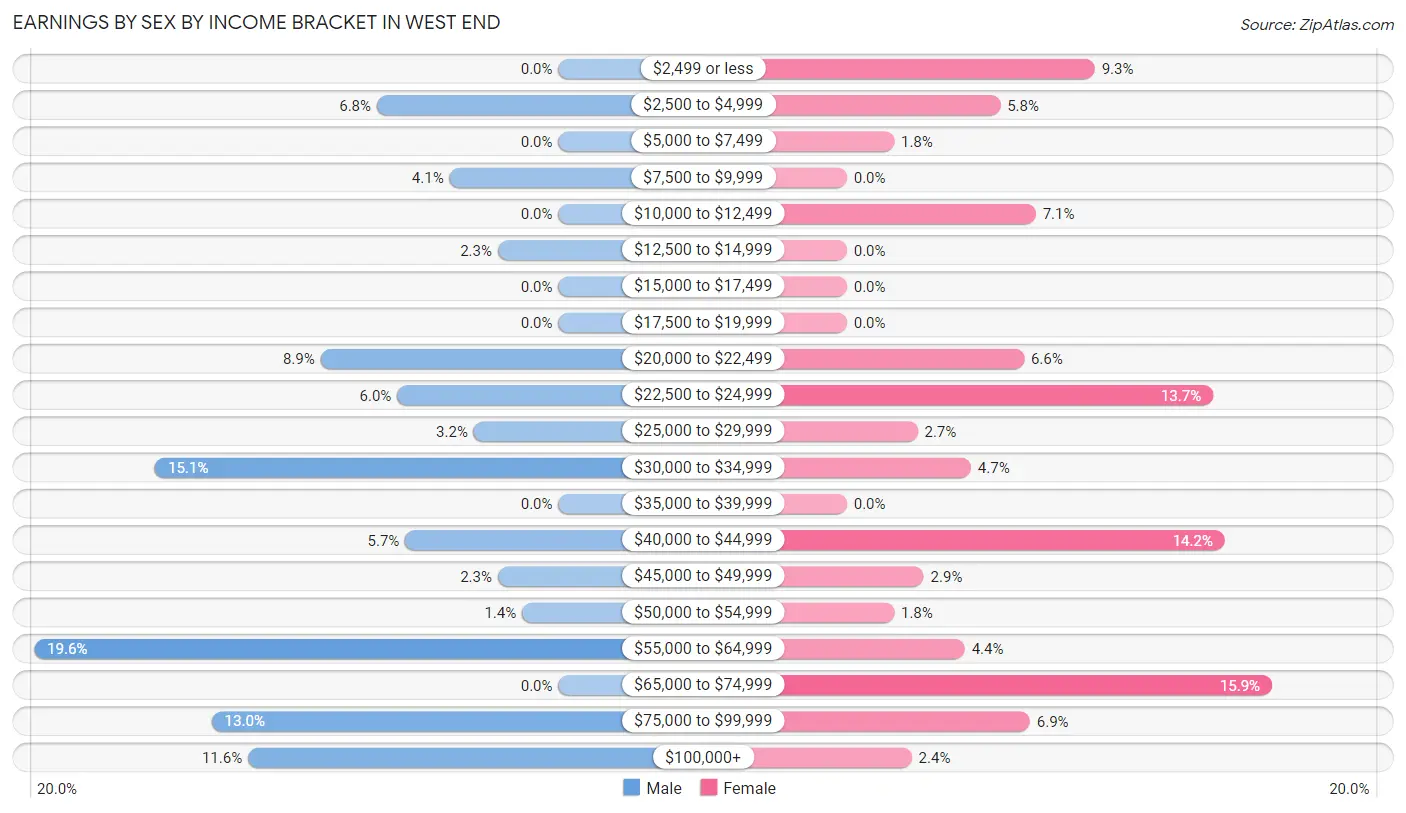
Earnings by Sex by Income Bracket in West End
The most common earnings brackets in West End are $55,000 to $64,999 for men (130 | 19.6%) and $65,000 to $74,999 for women (72 | 15.9%).
| Income | Male | Female |
| $2,499 or less | 0 (0.0%) | 42 (9.3%) |
| $2,500 to $4,999 | 45 (6.8%) | 26 (5.8%) |
| $5,000 to $7,499 | 0 (0.0%) | 8 (1.8%) |
| $7,500 to $9,999 | 27 (4.1%) | 0 (0.0%) |
| $10,000 to $12,499 | 0 (0.0%) | 32 (7.1%) |
| $12,500 to $14,999 | 15 (2.3%) | 0 (0.0%) |
| $15,000 to $17,499 | 0 (0.0%) | 0 (0.0%) |
| $17,500 to $19,999 | 0 (0.0%) | 0 (0.0%) |
| $20,000 to $22,499 | 59 (8.9%) | 30 (6.6%) |
| $22,500 to $24,999 | 40 (6.0%) | 62 (13.7%) |
| $25,000 to $29,999 | 21 (3.2%) | 12 (2.6%) |
| $30,000 to $34,999 | 100 (15.1%) | 21 (4.6%) |
| $35,000 to $39,999 | 0 (0.0%) | 0 (0.0%) |
| $40,000 to $44,999 | 38 (5.7%) | 64 (14.2%) |
| $45,000 to $49,999 | 15 (2.3%) | 13 (2.9%) |
| $50,000 to $54,999 | 9 (1.4%) | 8 (1.8%) |
| $55,000 to $64,999 | 130 (19.6%) | 20 (4.4%) |
| $65,000 to $74,999 | 0 (0.0%) | 72 (15.9%) |
| $75,000 to $99,999 | 86 (13.0%) | 31 (6.9%) |
| $100,000+ | 77 (11.6%) | 11 (2.4%) |
| Total | 662 (100.0%) | 452 (100.0%) |
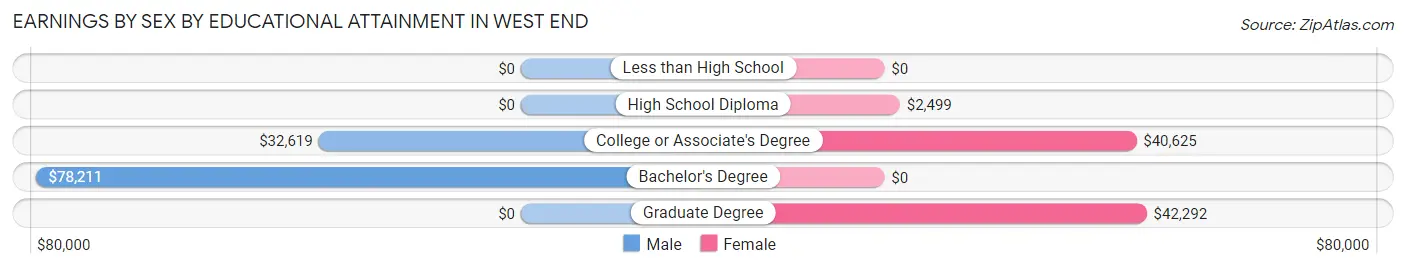
Earnings by Sex by Educational Attainment in West End
Average earnings in West End are $55,481 for men and $40,723 for women, a difference of 26.6%. Men with an educational attainment of bachelor's degree enjoy the highest average annual earnings of $78,211, while those with college or associate's degree education earn the least with $32,619. Women with an educational attainment of graduate degree earn the most with the average annual earnings of $42,292, while those with high school diploma education have the smallest earnings of $2,499.
| Educational Attainment | Male Income | Female Income |
| Less than High School | - | - |
| High School Diploma | - | - |
| College or Associate's Degree | $32,619 | $40,625 |
| Bachelor's Degree | $78,211 | $0 |
| Graduate Degree | - | - |
| Total | $55,481 | $40,723 |
Family Income in West End
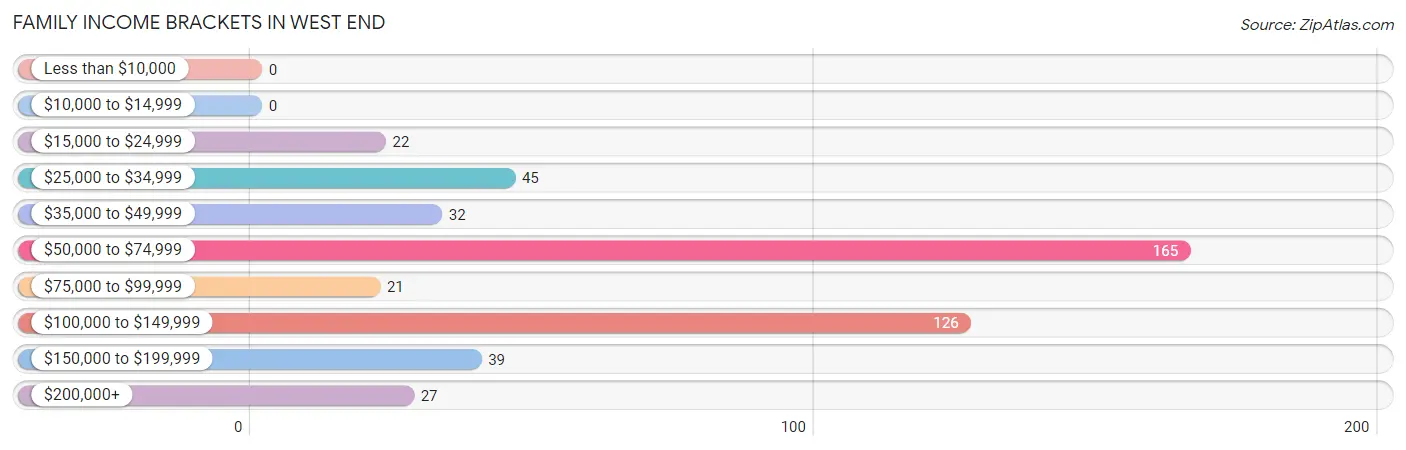
Family Income Brackets in West End
According to the West End family income data, there are 165 families falling into the $50,000 to $74,999 income range, which is the most common income bracket and makes up 34.6% of all families.
| Income Bracket | # Families | % Families |
| Less than $10,000 | 0 | 0.0% |
| $10,000 to $14,999 | 0 | 0.0% |
| $15,000 to $24,999 | 22 | 4.6% |
| $25,000 to $34,999 | 45 | 9.4% |
| $35,000 to $49,999 | 32 | 6.7% |
| $50,000 to $74,999 | 165 | 34.6% |
| $75,000 to $99,999 | 21 | 4.4% |
| $100,000 to $149,999 | 126 | 26.4% |
| $150,000 to $199,999 | 39 | 8.2% |
| $200,000+ | 27 | 5.7% |
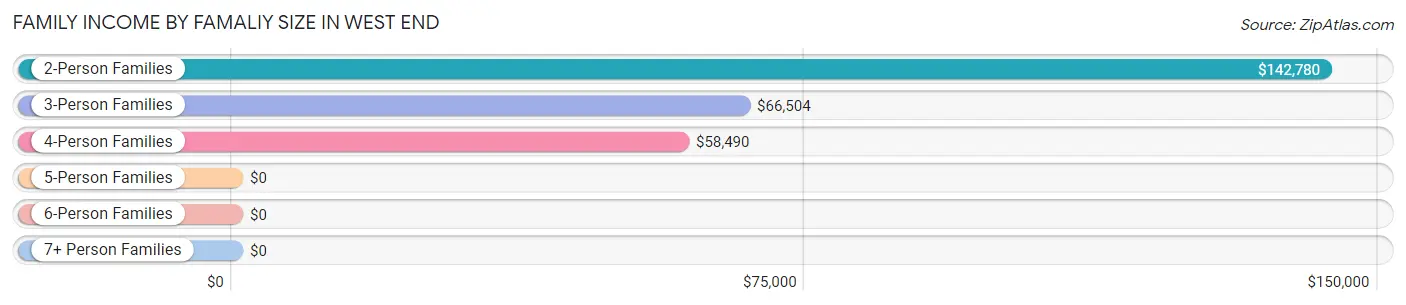
Family Income by Famaliy Size in West End
2-person families (191 | 40.0%) account for the highest median family income in West End with $142,780 per family, while 2-person families (191 | 40.0%) have the highest median income of $71,390 per family member.
| Income Bracket | # Families | Median Income |
| 2-Person Families | 191 (40.0%) | $142,780 |
| 3-Person Families | 181 (38.0%) | $66,504 |
| 4-Person Families | 74 (15.5%) | $58,490 |
| 5-Person Families | 22 (4.6%) | $0 |
| 6-Person Families | 9 (1.9%) | $0 |
| 7+ Person Families | 0 (0.0%) | $0 |
| Total | 477 (100.0%) | $70,625 |
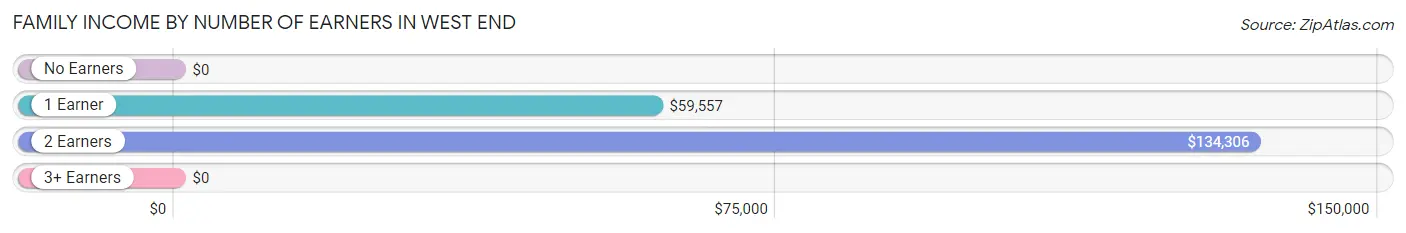
Family Income by Number of Earners in West End
| Number of Earners | # Families | Median Income |
| No Earners | 25 (5.2%) | $0 |
| 1 Earner | 221 (46.3%) | $59,557 |
| 2 Earners | 209 (43.8%) | $134,306 |
| 3+ Earners | 22 (4.6%) | $0 |
| Total | 477 (100.0%) | $70,625 |
Household Income in West End
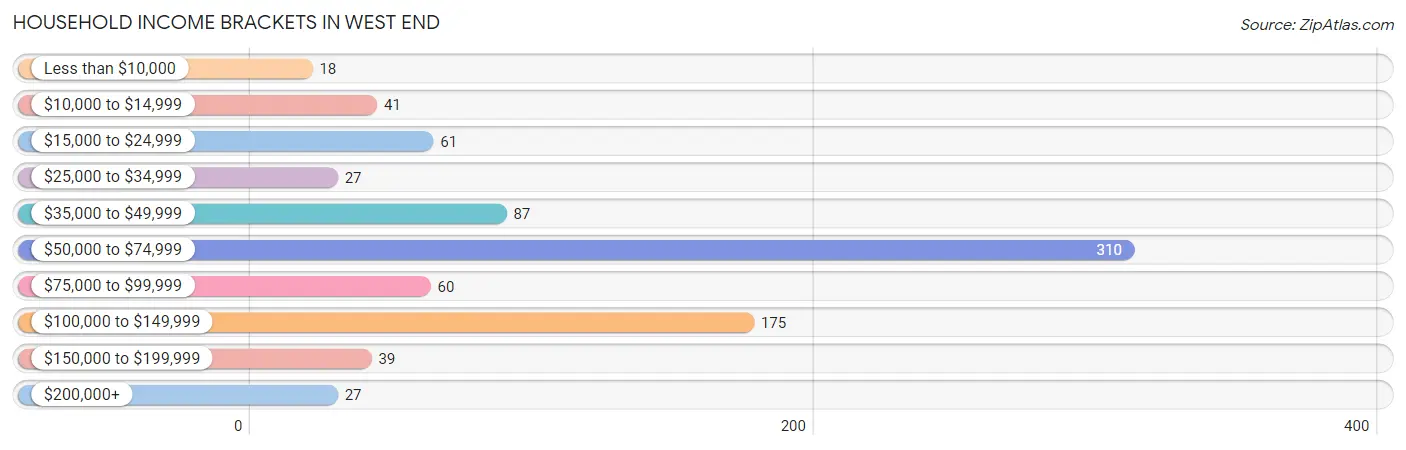
Household Income Brackets in West End
With 310 households falling in the category, the $50,000 to $74,999 income range is the most frequent in West End, accounting for 36.7% of all households. In contrast, only 18 households (2.1%) fall into the less than $10,000 income bracket, making it the least populous group.
| Income Bracket | # Households | % Households |
| Less than $10,000 | 18 | 2.1% |
| $10,000 to $14,999 | 41 | 4.9% |
| $15,000 to $24,999 | 61 | 7.2% |
| $25,000 to $34,999 | 27 | 3.2% |
| $35,000 to $49,999 | 87 | 10.3% |
| $50,000 to $74,999 | 310 | 36.7% |
| $75,000 to $99,999 | 60 | 7.1% |
| $100,000 to $149,999 | 175 | 20.7% |
| $150,000 to $199,999 | 39 | 4.6% |
| $200,000+ | 27 | 3.2% |
Household Income by Householder Age in West End
The median household income in West End is $67,017, with the highest median household income of $66,183 found in the 65+ years age bracket for the primary householder. A total of 291 households (34.4%) fall into this category. Meanwhile, the 15 to 24 years age bracket for the primary householder has the lowest median household income of $0, with 38 households (4.5%) in this group.
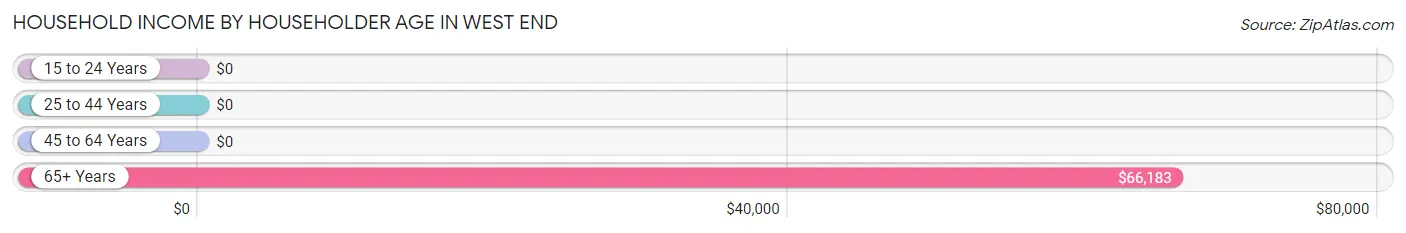
| Income Bracket | # Households | Median Income |
| 15 to 24 Years | 38 (4.5%) | $0 |
| 25 to 44 Years | 206 (24.4%) | $0 |
| 45 to 64 Years | 310 (36.7%) | $0 |
| 65+ Years | 291 (34.4%) | $66,183 |
| Total | 845 (100.0%) | $67,017 |
Poverty in West End
Income Below Poverty by Sex and Age in West End
With 6.8% poverty level for males and 16.2% for females among the residents of West End, 35 to 44 year old males and 18 to 24 year old females are the most vulnerable to poverty, with 41 males (27.9%) and 43 females (100.0%) in their respective age groups living below the poverty level.
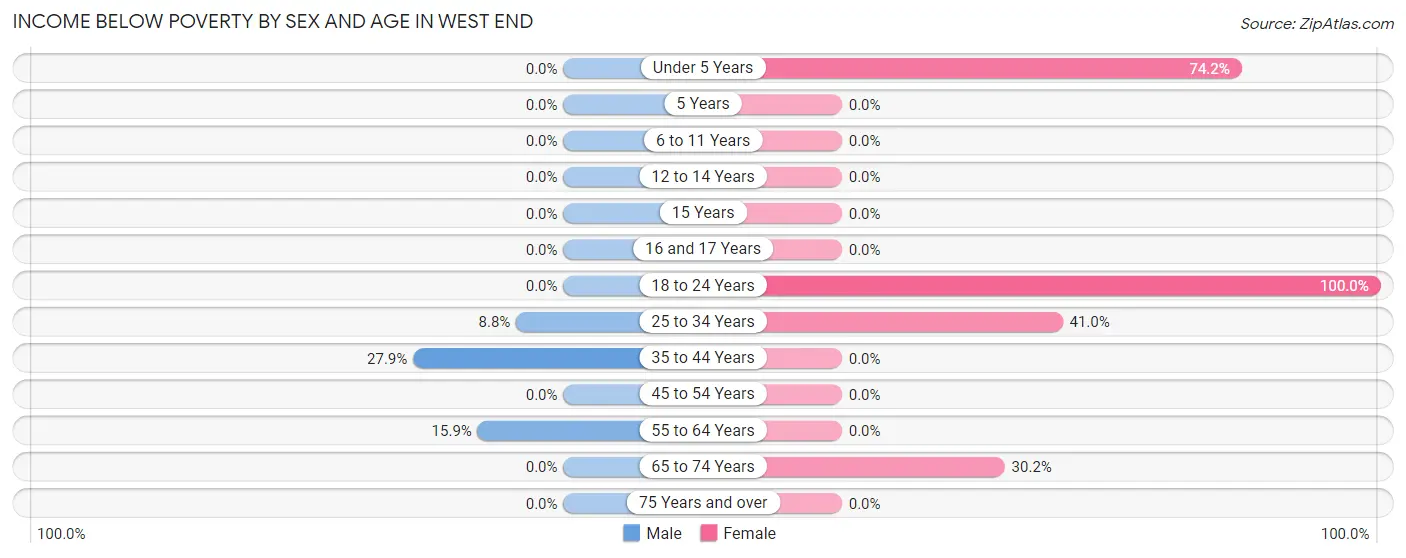
| Age Bracket | Male | Female |
| Under 5 Years | 0 (0.0%) | 23 (74.2%) |
| 5 Years | 0 (0.0%) | 0 (0.0%) |
| 6 to 11 Years | 0 (0.0%) | 0 (0.0%) |
| 12 to 14 Years | 0 (0.0%) | 0 (0.0%) |
| 15 Years | 0 (0.0%) | 0 (0.0%) |
| 16 and 17 Years | 0 (0.0%) | 0 (0.0%) |
| 18 to 24 Years | 0 (0.0%) | 43 (100.0%) |
| 25 to 34 Years | 22 (8.8%) | 25 (41.0%) |
| 35 to 44 Years | 41 (27.9%) | 0 (0.0%) |
| 45 to 54 Years | 0 (0.0%) | 0 (0.0%) |
| 55 to 64 Years | 28 (15.9%) | 0 (0.0%) |
| 65 to 74 Years | 0 (0.0%) | 39 (30.2%) |
| 75 Years and over | 0 (0.0%) | 0 (0.0%) |
| Total | 91 (6.8%) | 130 (16.2%) |
Income Above Poverty by Sex and Age in West End
According to the poverty statistics in West End, males aged under 5 years and females aged 6 to 11 years are the age groups that are most secure financially, with 100.0% of males and 100.0% of females in these age groups living above the poverty line.
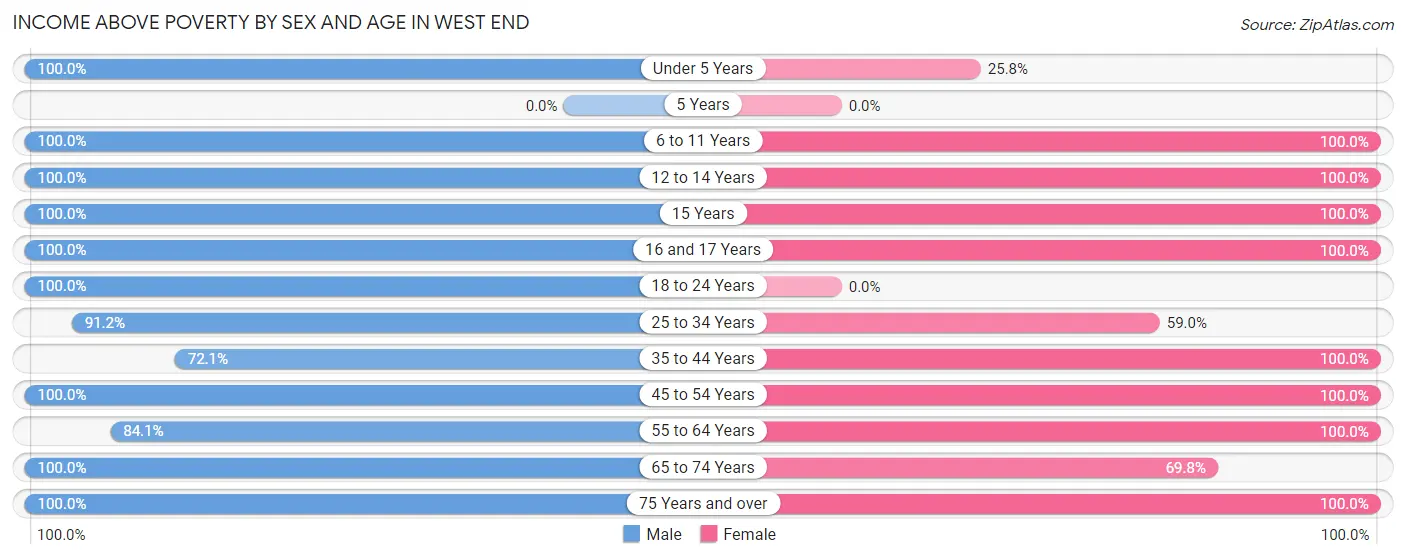
| Age Bracket | Male | Female |
| Under 5 Years | 10 (100.0%) | 8 (25.8%) |
| 5 Years | 0 (0.0%) | 0 (0.0%) |
| 6 to 11 Years | 84 (100.0%) | 66 (100.0%) |
| 12 to 14 Years | 70 (100.0%) | 28 (100.0%) |
| 15 Years | 51 (100.0%) | 60 (100.0%) |
| 16 and 17 Years | 20 (100.0%) | 8 (100.0%) |
| 18 to 24 Years | 99 (100.0%) | 0 (0.0%) |
| 25 to 34 Years | 229 (91.2%) | 36 (59.0%) |
| 35 to 44 Years | 106 (72.1%) | 75 (100.0%) |
| 45 to 54 Years | 210 (100.0%) | 131 (100.0%) |
| 55 to 64 Years | 148 (84.1%) | 123 (100.0%) |
| 65 to 74 Years | 167 (100.0%) | 90 (69.8%) |
| 75 Years and over | 54 (100.0%) | 48 (100.0%) |
| Total | 1,248 (93.2%) | 673 (83.8%) |
Income Below Poverty Among Married-Couple Families in West End
The poverty statistics for married-couple families in West End show that 6.0% or 22 of the total 368 families live below the poverty line. Families with 1 or 2 children have the highest poverty rate of 81.5%, comprising of 22 families. On the other hand, families with no children have the lowest poverty rate of 0.0%, which includes 0 families.
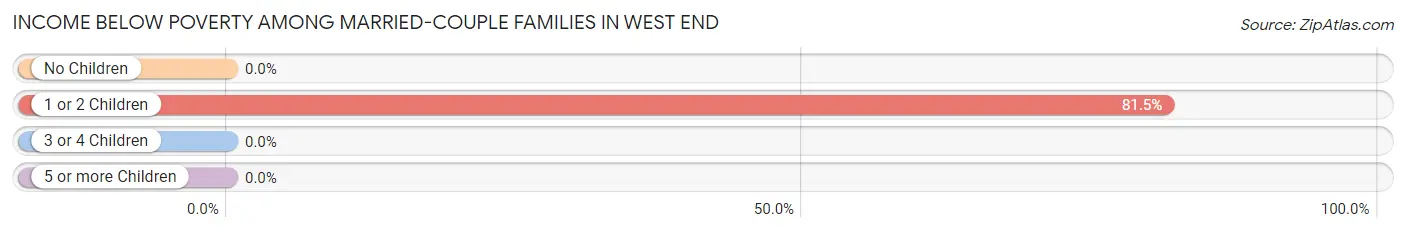
| Children | Above Poverty | Below Poverty |
| No Children | 310 (100.0%) | 0 (0.0%) |
| 1 or 2 Children | 5 (18.5%) | 22 (81.5%) |
| 3 or 4 Children | 31 (100.0%) | 0 (0.0%) |
| 5 or more Children | 0 (0.0%) | 0 (0.0%) |
| Total | 346 (94.0%) | 22 (6.0%) |
Income Below Poverty Among Single-Parent Households in West End
| Children | Single Father | Single Mother |
| No Children | 0 (0.0%) | 0 (0.0%) |
| 1 or 2 Children | 0 (0.0%) | 0 (0.0%) |
| 3 or 4 Children | 0 (0.0%) | 0 (0.0%) |
| 5 or more Children | 0 (0.0%) | 0 (0.0%) |
| Total | 0 (0.0%) | 0 (0.0%) |
Income Below Poverty Among Married-Couple vs Single-Parent Households in West End
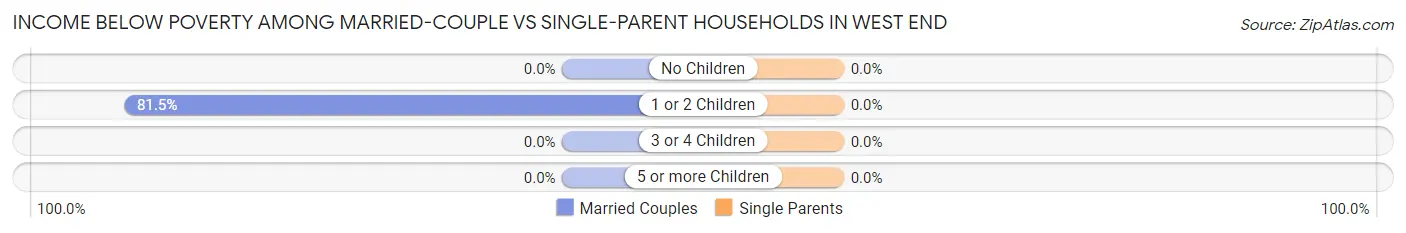
| Children | Married-Couple Families | Single-Parent Households |
| No Children | 0 (0.0%) | 0 (0.0%) |
| 1 or 2 Children | 22 (81.5%) | 0 (0.0%) |
| 3 or 4 Children | 0 (0.0%) | 0 (0.0%) |
| 5 or more Children | 0 (0.0%) | 0 (0.0%) |
| Total | 22 (6.0%) | 0 (0.0%) |
Race in West End
The most populous races in West End are White / Caucasian (2,020 | 94.3%), Hispanic or Latino (241 | 11.3%), and Two or more Races (122 | 5.7%).
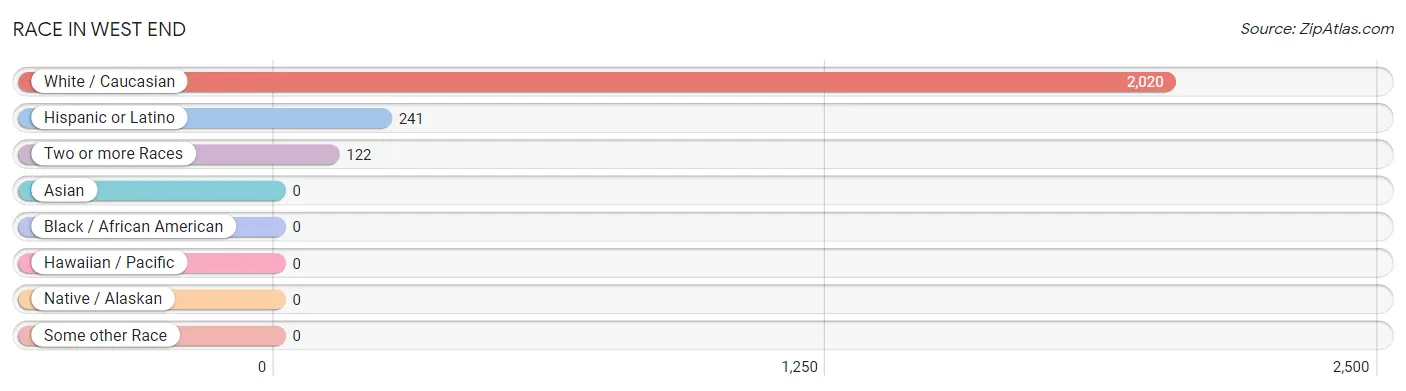
| Race | # Population | % Population |
| Asian | 0 | 0.0% |
| Black / African American | 0 | 0.0% |
| Hawaiian / Pacific | 0 | 0.0% |
| Hispanic or Latino | 241 | 11.3% |
| Native / Alaskan | 0 | 0.0% |
| White / Caucasian | 2,020 | 94.3% |
| Two or more Races | 122 | 5.7% |
| Some other Race | 0 | 0.0% |
| Total | 2,142 | 100.0% |
Ancestry in West End
The most populous ancestries reported in West End are Irish (482 | 22.5%), German (396 | 18.5%), English (356 | 16.6%), Italian (243 | 11.3%), and French (171 | 8.0%), together accounting for 76.9% of all West End residents.
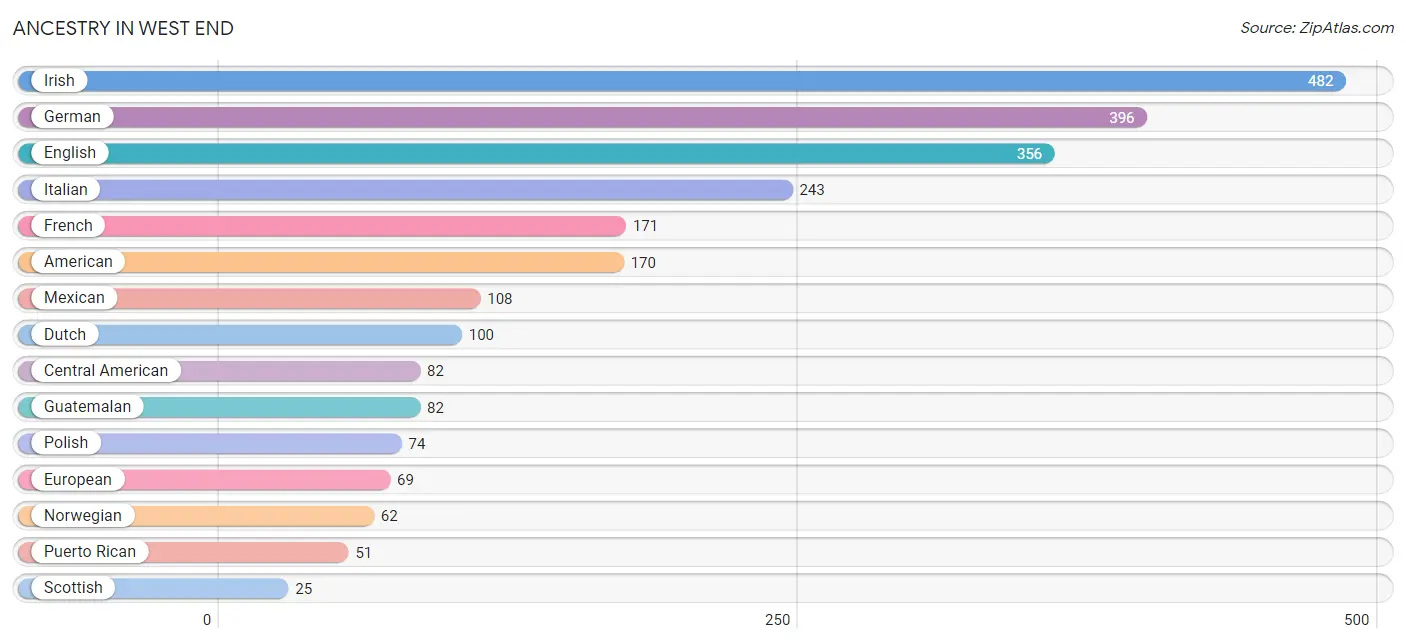
| Ancestry | # Population | % Population |
| American | 170 | 7.9% |
| Canadian | 12 | 0.6% |
| Central American | 82 | 3.8% |
| Dutch | 100 | 4.7% |
| English | 356 | 16.6% |
| European | 69 | 3.2% |
| Finnish | 8 | 0.4% |
| French | 171 | 8.0% |
| German | 396 | 18.5% |
| Guatemalan | 82 | 3.8% |
| Irish | 482 | 22.5% |
| Italian | 243 | 11.3% |
| Lithuanian | 12 | 0.6% |
| Mexican | 108 | 5.0% |
| Norwegian | 62 | 2.9% |
| Polish | 74 | 3.5% |
| Puerto Rican | 51 | 2.4% |
| Scottish | 25 | 1.2% |
| Slovak | 9 | 0.4% |
| Swedish | 5 | 0.2% |
| Welsh | 13 | 0.6% | View All 21 Rows |
Immigrants in West End
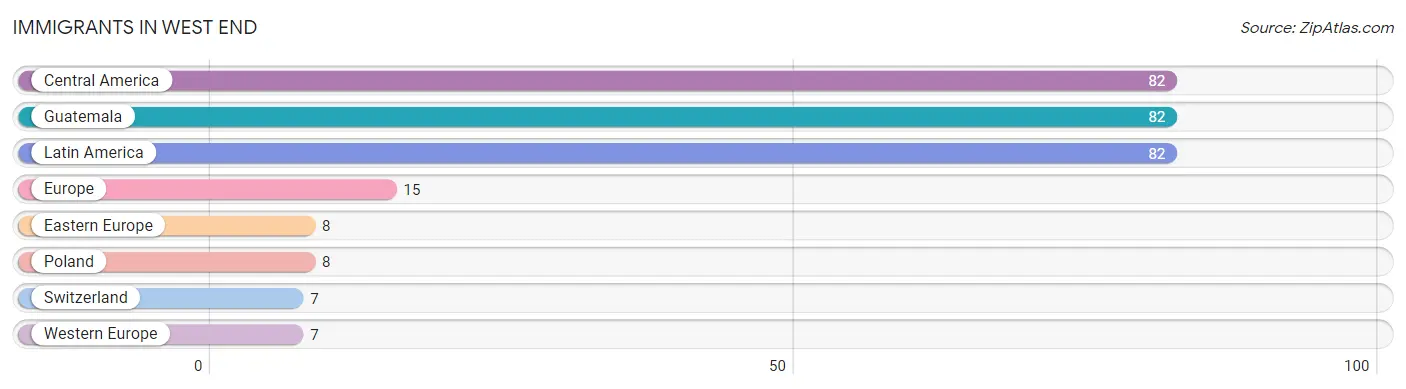
The most numerous immigrant groups reported in West End came from Central America (82 | 3.8%), Guatemala (82 | 3.8%), Latin America (82 | 3.8%), Europe (15 | 0.7%), and Eastern Europe (8 | 0.4%), together accounting for 12.6% of all West End residents.
| Immigration Origin | # Population | % Population |
| Central America | 82 | 3.8% |
| Eastern Europe | 8 | 0.4% |
| Europe | 15 | 0.7% |
| Guatemala | 82 | 3.8% |
| Latin America | 82 | 3.8% |
| Poland | 8 | 0.4% |
| Switzerland | 7 | 0.3% |
| Western Europe | 7 | 0.3% | View All 8 Rows |
Sex and Age in West End
Sex and Age in West End
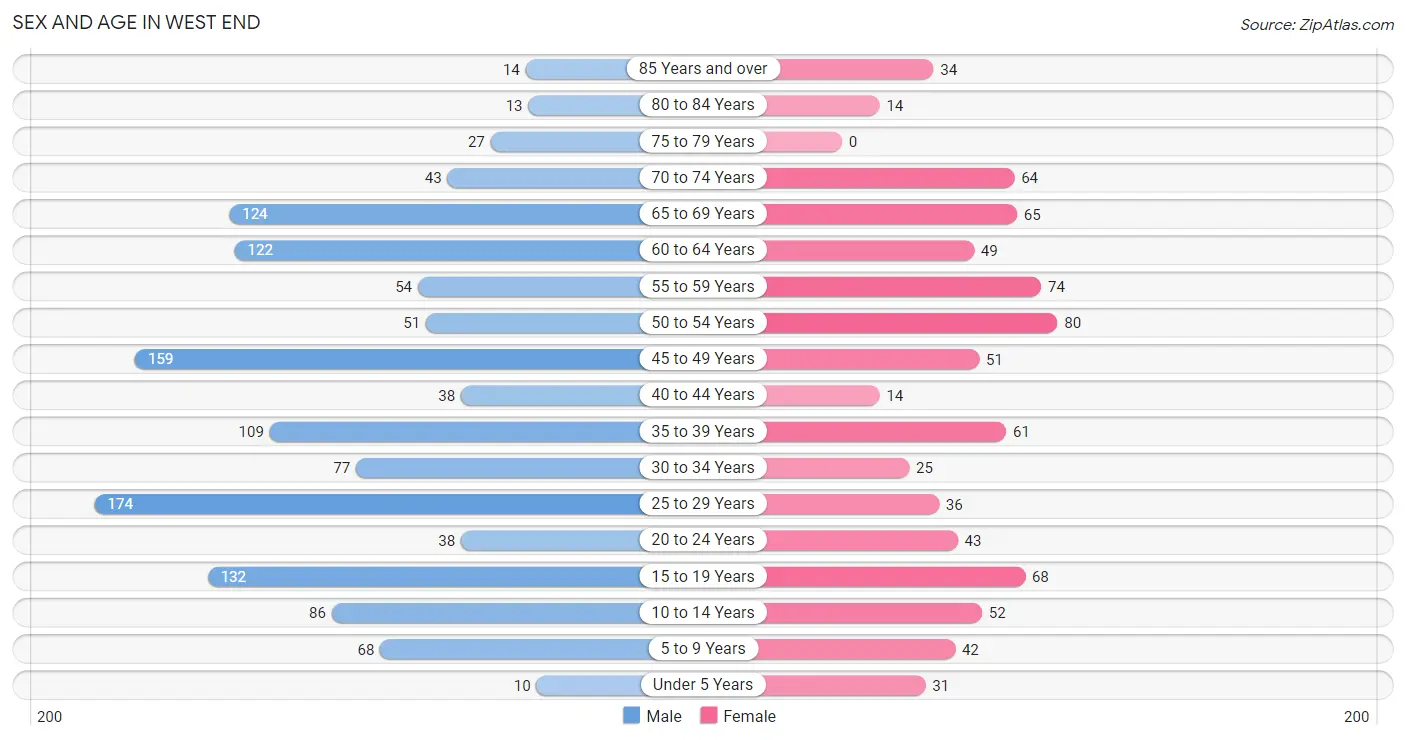
The most populous age groups in West End are 25 to 29 Years (174 | 13.0%) for men and 50 to 54 Years (80 | 10.0%) for women.
| Age Bracket | Male | Female |
| Under 5 Years | 10 (0.7%) | 31 (3.9%) |
| 5 to 9 Years | 68 (5.1%) | 42 (5.2%) |
| 10 to 14 Years | 86 (6.4%) | 52 (6.5%) |
| 15 to 19 Years | 132 (9.9%) | 68 (8.5%) |
| 20 to 24 Years | 38 (2.8%) | 43 (5.3%) |
| 25 to 29 Years | 174 (13.0%) | 36 (4.5%) |
| 30 to 34 Years | 77 (5.8%) | 25 (3.1%) |
| 35 to 39 Years | 109 (8.1%) | 61 (7.6%) |
| 40 to 44 Years | 38 (2.8%) | 14 (1.7%) |
| 45 to 49 Years | 159 (11.9%) | 51 (6.4%) |
| 50 to 54 Years | 51 (3.8%) | 80 (10.0%) |
| 55 to 59 Years | 54 (4.0%) | 74 (9.2%) |
| 60 to 64 Years | 122 (9.1%) | 49 (6.1%) |
| 65 to 69 Years | 124 (9.3%) | 65 (8.1%) |
| 70 to 74 Years | 43 (3.2%) | 64 (8.0%) |
| 75 to 79 Years | 27 (2.0%) | 0 (0.0%) |
| 80 to 84 Years | 13 (1.0%) | 14 (1.7%) |
| 85 Years and over | 14 (1.1%) | 34 (4.2%) |
| Total | 1,339 (100.0%) | 803 (100.0%) |
Families and Households in West End
Median Family Size in West End
The median family size in West End is 3.07 persons per family, with single female/mother families (8 | 1.7%) accounting for the largest median family size of 4 persons per family. On the other hand, married-couple families (368 | 77.1%) represent the smallest median family size with 2.91 persons per family.
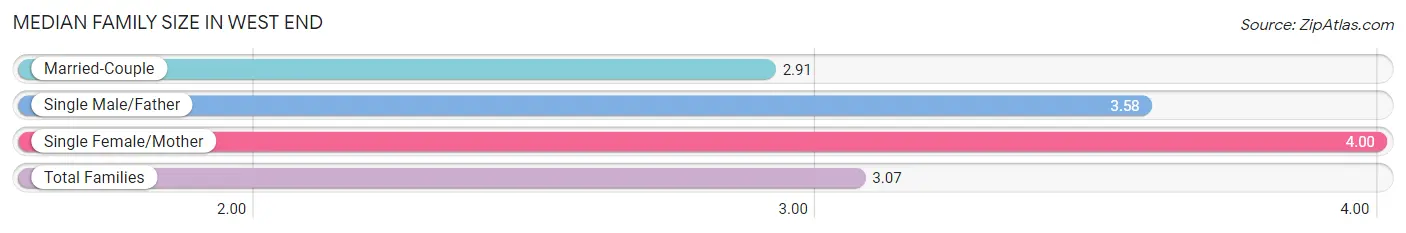
| Family Type | # Families | Family Size |
| Married-Couple | 368 (77.1%) | 2.91 |
| Single Male/Father | 101 (21.2%) | 3.58 |
| Single Female/Mother | 8 (1.7%) | 4.00 |
| Total Families | 477 (100.0%) | 3.07 |
Median Household Size in West End
The median household size in West End is 2.42 persons per household, with single female/mother households (8 | 0.9%) accounting for the largest median household size of 5.13 persons per household. non-family households (368 | 43.5%) represent the smallest median household size with 1.44 persons per household.
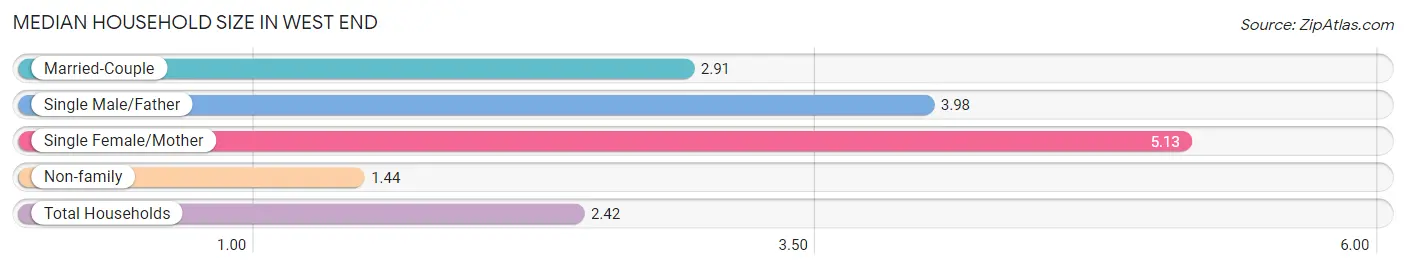
| Household Type | # Households | Household Size |
| Married-Couple | 368 (43.5%) | 2.91 |
| Single Male/Father | 101 (11.9%) | 3.98 |
| Single Female/Mother | 8 (0.9%) | 5.13 |
| Non-family | 368 (43.5%) | 1.44 |
| Total Households | 845 (100.0%) | 2.42 |
Household Size by Marriage Status in West End
Out of a total of 845 households in West End, 477 (56.5%) are family households, while 368 (43.5%) are nonfamily households. The most numerous type of family households are 2-person households, comprising 191, and the most common type of nonfamily households are 1-person households, comprising 201.
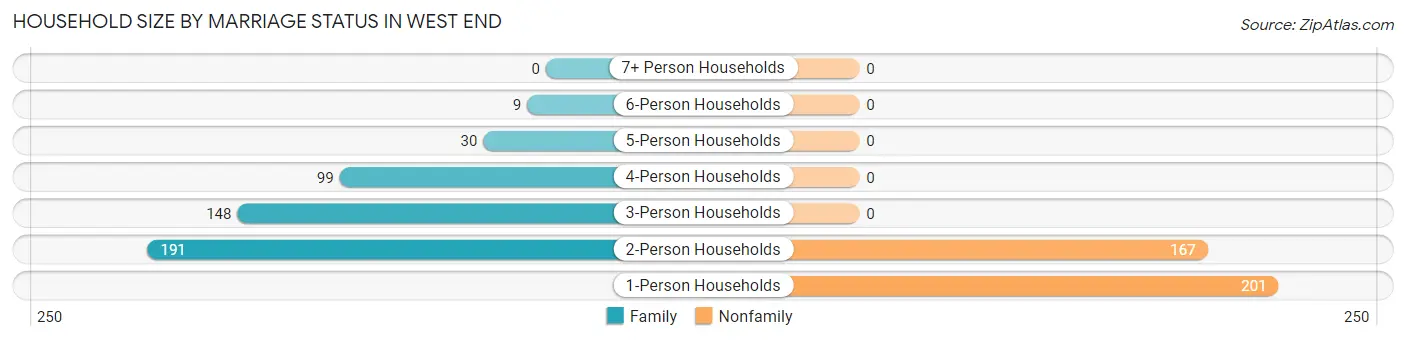
| Household Size | Family Households | Nonfamily Households |
| 1-Person Households | - | 201 (23.8%) |
| 2-Person Households | 191 (22.6%) | 167 (19.8%) |
| 3-Person Households | 148 (17.5%) | 0 (0.0%) |
| 4-Person Households | 99 (11.7%) | 0 (0.0%) |
| 5-Person Households | 30 (3.5%) | 0 (0.0%) |
| 6-Person Households | 9 (1.1%) | 0 (0.0%) |
| 7+ Person Households | 0 (0.0%) | 0 (0.0%) |
| Total | 477 (56.5%) | 368 (43.5%) |
Female Fertility in West End
Fertility by Age in West End
| Age Bracket | Women with Births | Births / 1,000 Women |
| 15 to 19 years | 0 (0.0%) | 0.0 |
| 20 to 34 years | 0 (0.0%) | 0.0 |
| 35 to 50 years | 0 (0.0%) | 0.0 |
| Total | 0 (0.0%) | 0.0 |
Fertility by Age by Marriage Status in West End
| Age Bracket | Married | Unmarried |
| 15 to 19 years | 0 (0.0%) | 0 (0.0%) |
| 20 to 34 years | 0 (0.0%) | 0 (0.0%) |
| 35 to 50 years | 0 (0.0%) | 0 (0.0%) |
| Total | 0 (0.0%) | 0 (0.0%) |
Fertility by Education in West End
| Educational Attainment | Women with Births | Births / 1,000 Women |
| Less than High School | 0 (0.0%) | 0.0 |
| High School Diploma | 0 (0.0%) | 0.0 |
| College or Associate's Degree | 0 (0.0%) | 0.0 |
| Bachelor's Degree | 0 (0.0%) | 0.0 |
| Graduate Degree | 0 (0.0%) | 0.0 |
| Total | 0 (0.0%) | 0.0 |
Fertility by Education by Marriage Status in West End
| Educational Attainment | Married | Unmarried |
| Less than High School | 0 (0.0%) | 0 (0.0%) |
| High School Diploma | 0 (0.0%) | 0 (0.0%) |
| College or Associate's Degree | 0 (0.0%) | 0 (0.0%) |
| Bachelor's Degree | 0 (0.0%) | 0 (0.0%) |
| Graduate Degree | 0 (0.0%) | 0 (0.0%) |
| Total | 0 (0.0%) | 0 (0.0%) |
Employment Characteristics in West End
Employment by Class of Employer in West End
Among the 1,028 employed individuals in West End, private company employees (479 | 46.6%), local government employees (204 | 19.8%), and not-for-profit organizations (143 | 13.9%) make up the most common classes of employment.
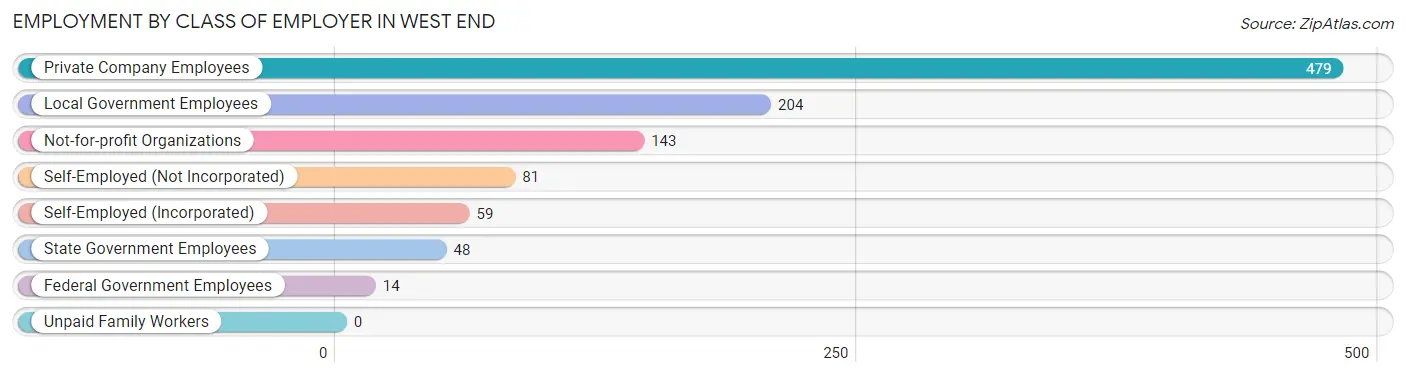
| Employer Class | # Employees | % Employees |
| Private Company Employees | 479 | 46.6% |
| Self-Employed (Incorporated) | 59 | 5.7% |
| Self-Employed (Not Incorporated) | 81 | 7.9% |
| Not-for-profit Organizations | 143 | 13.9% |
| Local Government Employees | 204 | 19.8% |
| State Government Employees | 48 | 4.7% |
| Federal Government Employees | 14 | 1.4% |
| Unpaid Family Workers | 0 | 0.0% |
| Total | 1,028 | 100.0% |
Employment Status by Age in West End
According to the labor force statistics for West End, out of the total population over 16 years of age (1,742), 61.1% or 1,064 individuals are in the labor force, with 3.5% or 37 of them unemployed. The age group with the highest labor force participation rate is 20 to 24 years, with 100.0% or 81 individuals in the labor force. Within the labor force, the 16 to 19 years age range has the highest percentage of unemployed individuals, with 35.3% or 18 of them being unemployed.
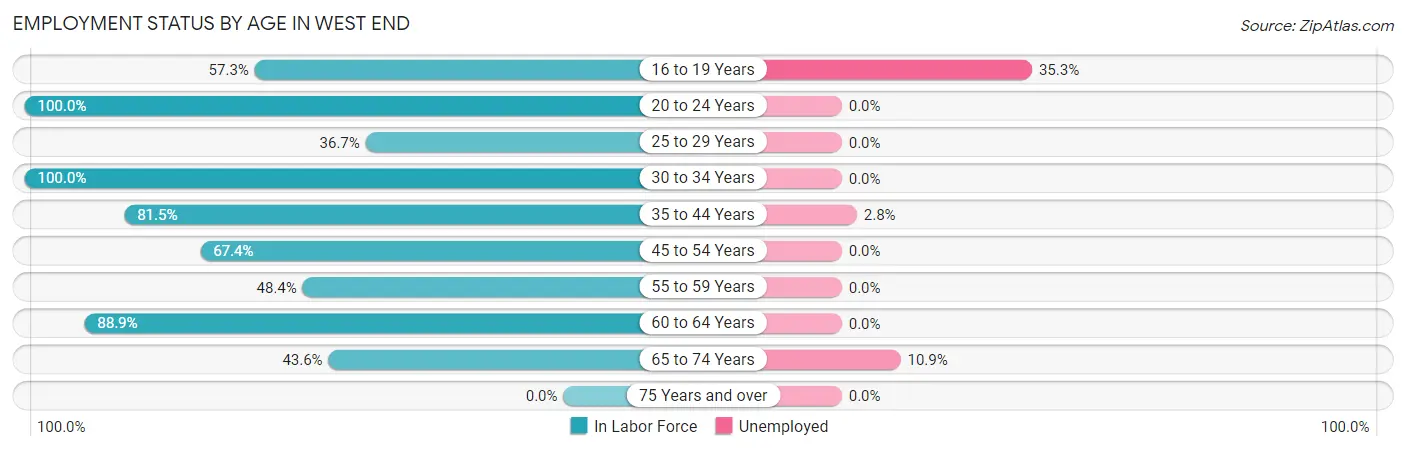
| Age Bracket | In Labor Force | Unemployed |
| 16 to 19 Years | 51 (57.3%) | 18 (35.3%) |
| 20 to 24 Years | 81 (100.0%) | 0 (0.0%) |
| 25 to 29 Years | 77 (36.7%) | 0 (0.0%) |
| 30 to 34 Years | 102 (100.0%) | 0 (0.0%) |
| 35 to 44 Years | 181 (81.5%) | 5 (2.8%) |
| 45 to 54 Years | 230 (67.4%) | 0 (0.0%) |
| 55 to 59 Years | 62 (48.4%) | 0 (0.0%) |
| 60 to 64 Years | 152 (88.9%) | 0 (0.0%) |
| 65 to 74 Years | 129 (43.6%) | 14 (10.9%) |
| 75 Years and over | 0 (0.0%) | 0 (0.0%) |
| Total | 1,064 (61.1%) | 37 (3.5%) |
Employment Status by Educational Attainment in West End
According to labor force statistics for West End, 68.5% of individuals (804) out of the total population between 25 and 64 years of age (1,174) are in the labor force, with 0.6% or 5 of them being unemployed. The group with the highest labor force participation rate are those with the educational attainment of bachelor's degree or higher, with 97.3% or 461 individuals in the labor force. Within the labor force, individuals with college / associate degree education have the highest percentage of unemployment, with 2.3% or 5 of them being unemployed.
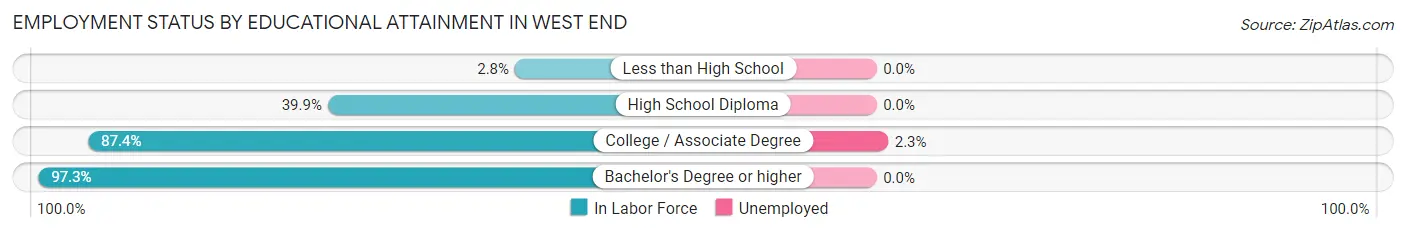
| Educational Attainment | In Labor Force | Unemployed |
| Less than High School | 4 (2.8%) | 0 (0.0%) |
| High School Diploma | 123 (39.9%) | 0 (0.0%) |
| College / Associate Degree | 216 (87.4%) | 6 (2.3%) |
| Bachelor's Degree or higher | 461 (97.3%) | 0 (0.0%) |
| Total | 804 (68.5%) | 7 (0.6%) |
Employment Occupations by Sex in West End
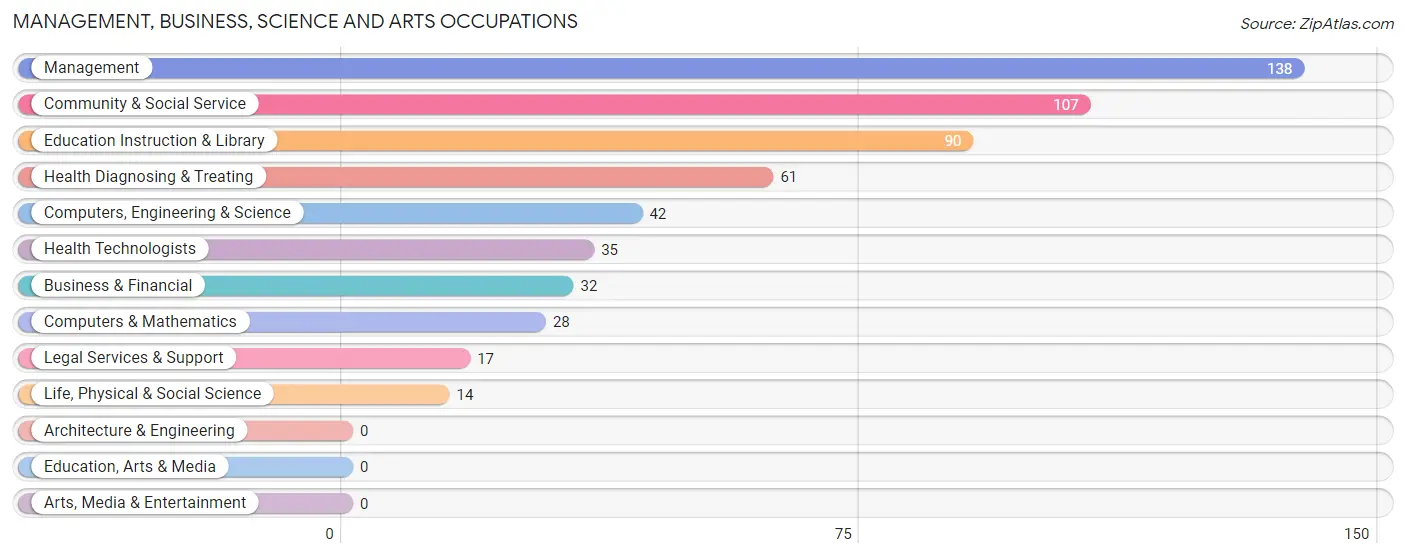
Management, Business, Science and Arts Occupations
The most common Management, Business, Science and Arts occupations in West End are Management (138 | 13.4%), Community & Social Service (107 | 10.4%), Education Instruction & Library (90 | 8.7%), Health Diagnosing & Treating (61 | 5.9%), and Computers, Engineering & Science (42 | 4.1%).
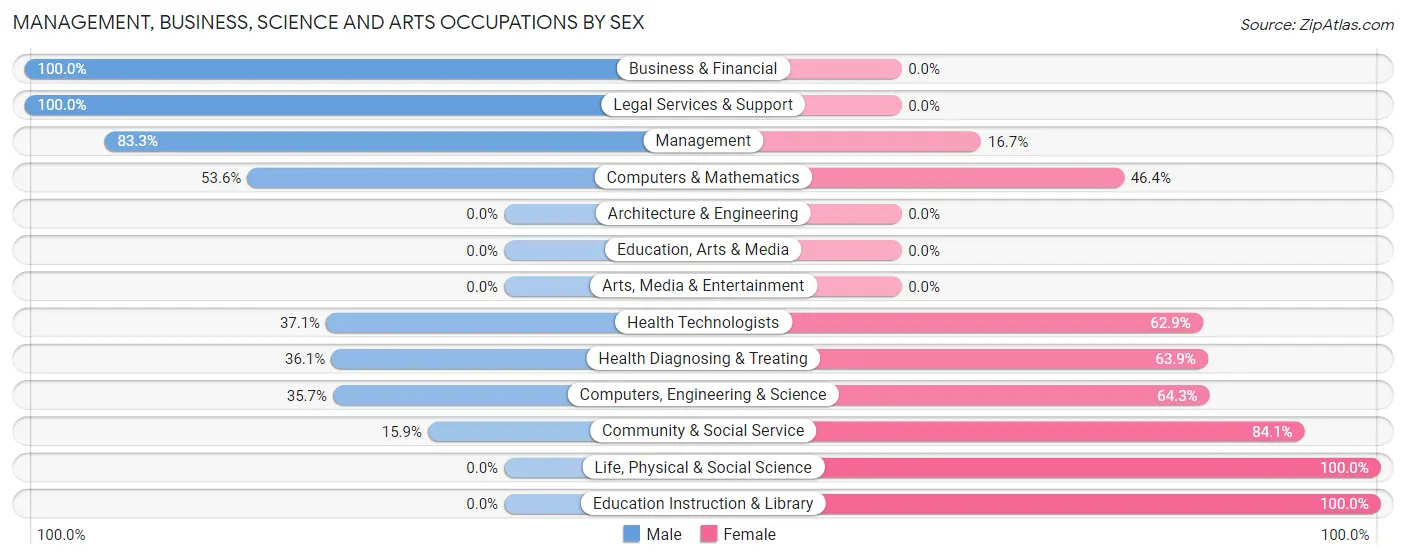
Management, Business, Science and Arts Occupations by Sex
Within the Management, Business, Science and Arts occupations in West End, the most male-oriented occupations are Business & Financial (100.0%), Legal Services & Support (100.0%), and Management (83.3%), while the most female-oriented occupations are Life, Physical & Social Science (100.0%), Education Instruction & Library (100.0%), and Community & Social Service (84.1%).
| Occupation | Male | Female |
| Management | 115 (83.3%) | 23 (16.7%) |
| Business & Financial | 32 (100.0%) | 0 (0.0%) |
| Computers, Engineering & Science | 15 (35.7%) | 27 (64.3%) |
| Computers & Mathematics | 15 (53.6%) | 13 (46.4%) |
| Architecture & Engineering | 0 (0.0%) | 0 (0.0%) |
| Life, Physical & Social Science | 0 (0.0%) | 14 (100.0%) |
| Community & Social Service | 17 (15.9%) | 90 (84.1%) |
| Education, Arts & Media | 0 (0.0%) | 0 (0.0%) |
| Legal Services & Support | 17 (100.0%) | 0 (0.0%) |
| Education Instruction & Library | 0 (0.0%) | 90 (100.0%) |
| Arts, Media & Entertainment | 0 (0.0%) | 0 (0.0%) |
| Health Diagnosing & Treating | 22 (36.1%) | 39 (63.9%) |
| Health Technologists | 13 (37.1%) | 22 (62.9%) |
| Total (Category) | 201 (52.9%) | 179 (47.1%) |
| Total (Overall) | 593 (57.7%) | 435 (42.3%) |
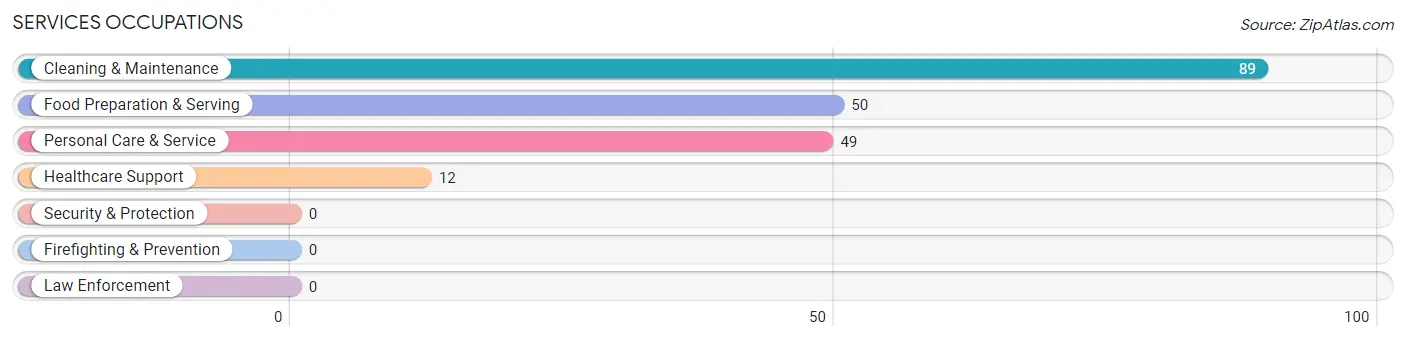
Services Occupations
The most common Services occupations in West End are Cleaning & Maintenance (89 | 8.7%), Food Preparation & Serving (50 | 4.9%), Personal Care & Service (49 | 4.8%), and Healthcare Support (12 | 1.2%).
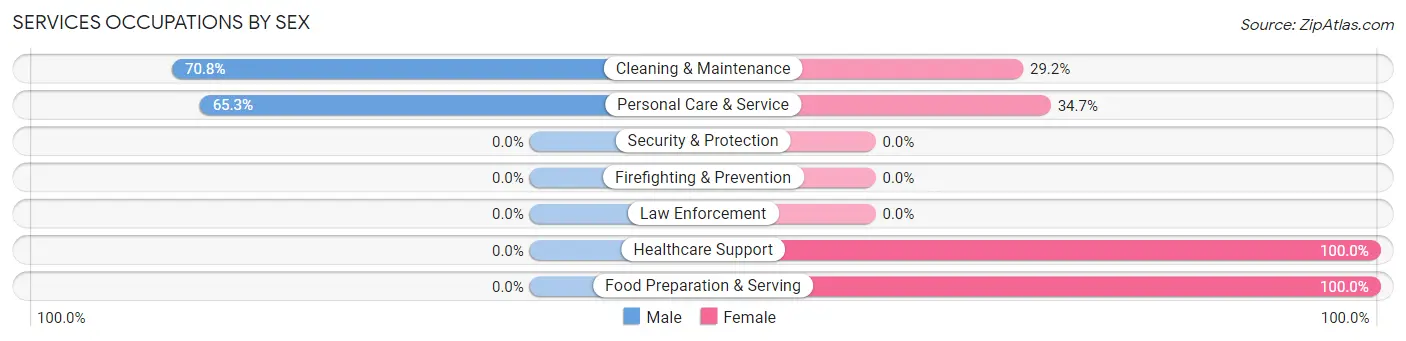
Services Occupations by Sex
Within the Services occupations in West End, the most male-oriented occupations are Cleaning & Maintenance (70.8%), and Personal Care & Service (65.3%), while the most female-oriented occupations are Healthcare Support (100.0%), Food Preparation & Serving (100.0%), and Personal Care & Service (34.7%).
| Occupation | Male | Female |
| Healthcare Support | 0 (0.0%) | 12 (100.0%) |
| Security & Protection | 0 (0.0%) | 0 (0.0%) |
| Firefighting & Prevention | 0 (0.0%) | 0 (0.0%) |
| Law Enforcement | 0 (0.0%) | 0 (0.0%) |
| Food Preparation & Serving | 0 (0.0%) | 50 (100.0%) |
| Cleaning & Maintenance | 63 (70.8%) | 26 (29.2%) |
| Personal Care & Service | 32 (65.3%) | 17 (34.7%) |
| Total (Category) | 95 (47.5%) | 105 (52.5%) |
| Total (Overall) | 593 (57.7%) | 435 (42.3%) |
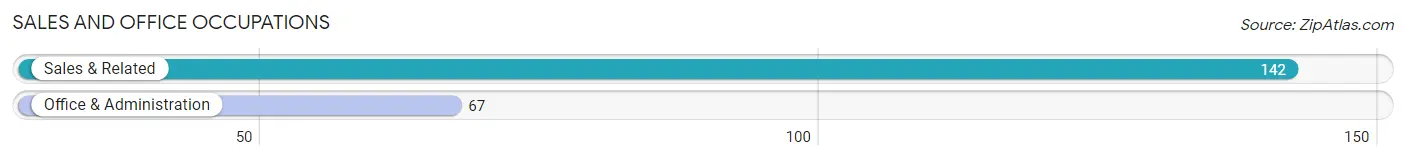
Sales and Office Occupations
The most common Sales and Office occupations in West End are Sales & Related (142 | 13.8%), and Office & Administration (67 | 6.5%).
Sales and Office Occupations by Sex
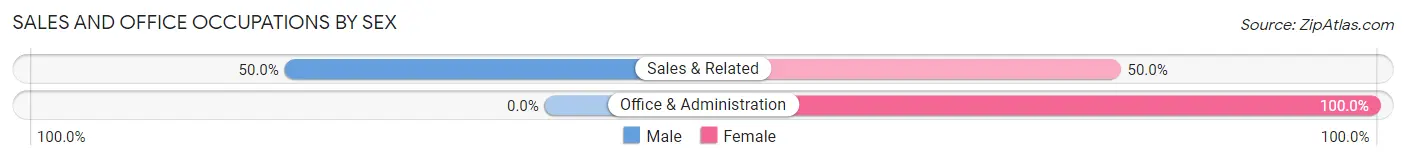
| Occupation | Male | Female |
| Sales & Related | 71 (50.0%) | 71 (50.0%) |
| Office & Administration | 0 (0.0%) | 67 (100.0%) |
| Total (Category) | 71 (34.0%) | 138 (66.0%) |
| Total (Overall) | 593 (57.7%) | 435 (42.3%) |
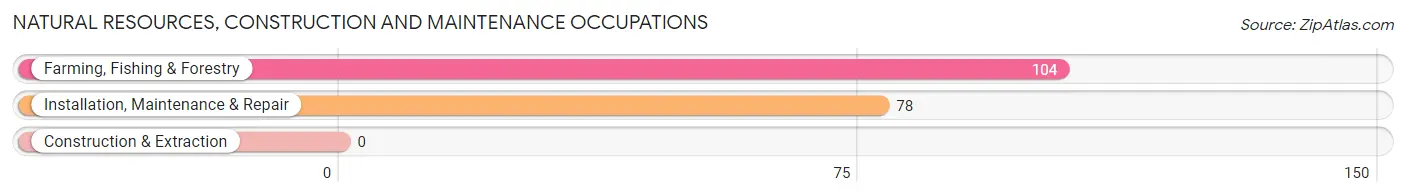
Natural Resources, Construction and Maintenance Occupations
The most common Natural Resources, Construction and Maintenance occupations in West End are Farming, Fishing & Forestry (104 | 10.1%), and Installation, Maintenance & Repair (78 | 7.6%).
Natural Resources, Construction and Maintenance Occupations by Sex
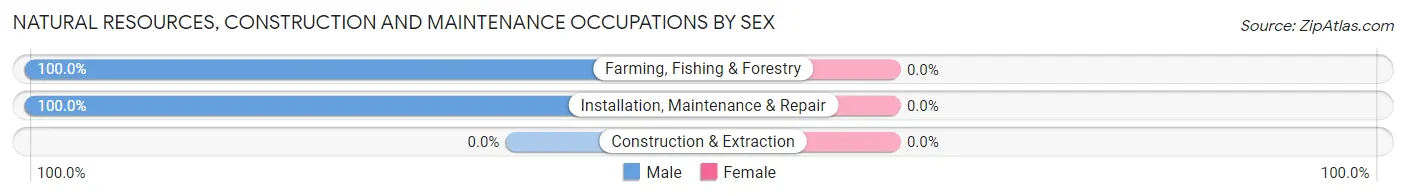
| Occupation | Male | Female |
| Farming, Fishing & Forestry | 104 (100.0%) | 0 (0.0%) |
| Construction & Extraction | 0 (0.0%) | 0 (0.0%) |
| Installation, Maintenance & Repair | 78 (100.0%) | 0 (0.0%) |
| Total (Category) | 182 (100.0%) | 0 (0.0%) |
| Total (Overall) | 593 (57.7%) | 435 (42.3%) |
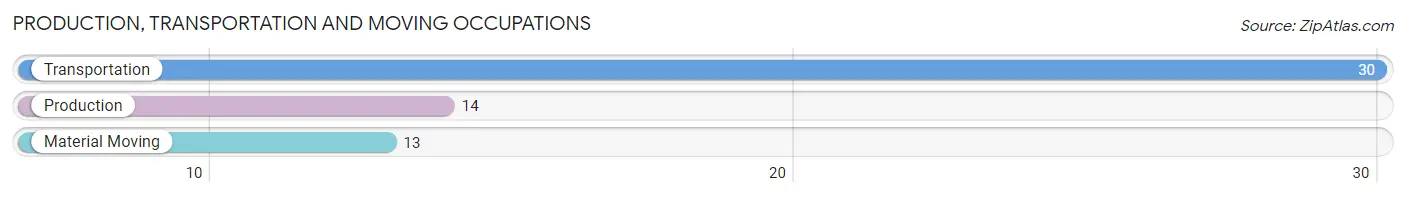
Production, Transportation and Moving Occupations
The most common Production, Transportation and Moving occupations in West End are Transportation (30 | 2.9%), Production (14 | 1.4%), and Material Moving (13 | 1.3%).
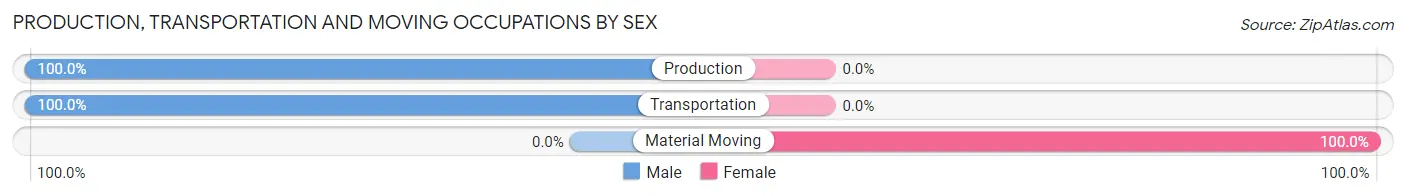
Production, Transportation and Moving Occupations by Sex
| Occupation | Male | Female |
| Production | 14 (100.0%) | 0 (0.0%) |
| Transportation | 30 (100.0%) | 0 (0.0%) |
| Material Moving | 0 (0.0%) | 13 (100.0%) |
| Total (Category) | 44 (77.2%) | 13 (22.8%) |
| Total (Overall) | 593 (57.7%) | 435 (42.3%) |
Employment Industries by Sex in West End
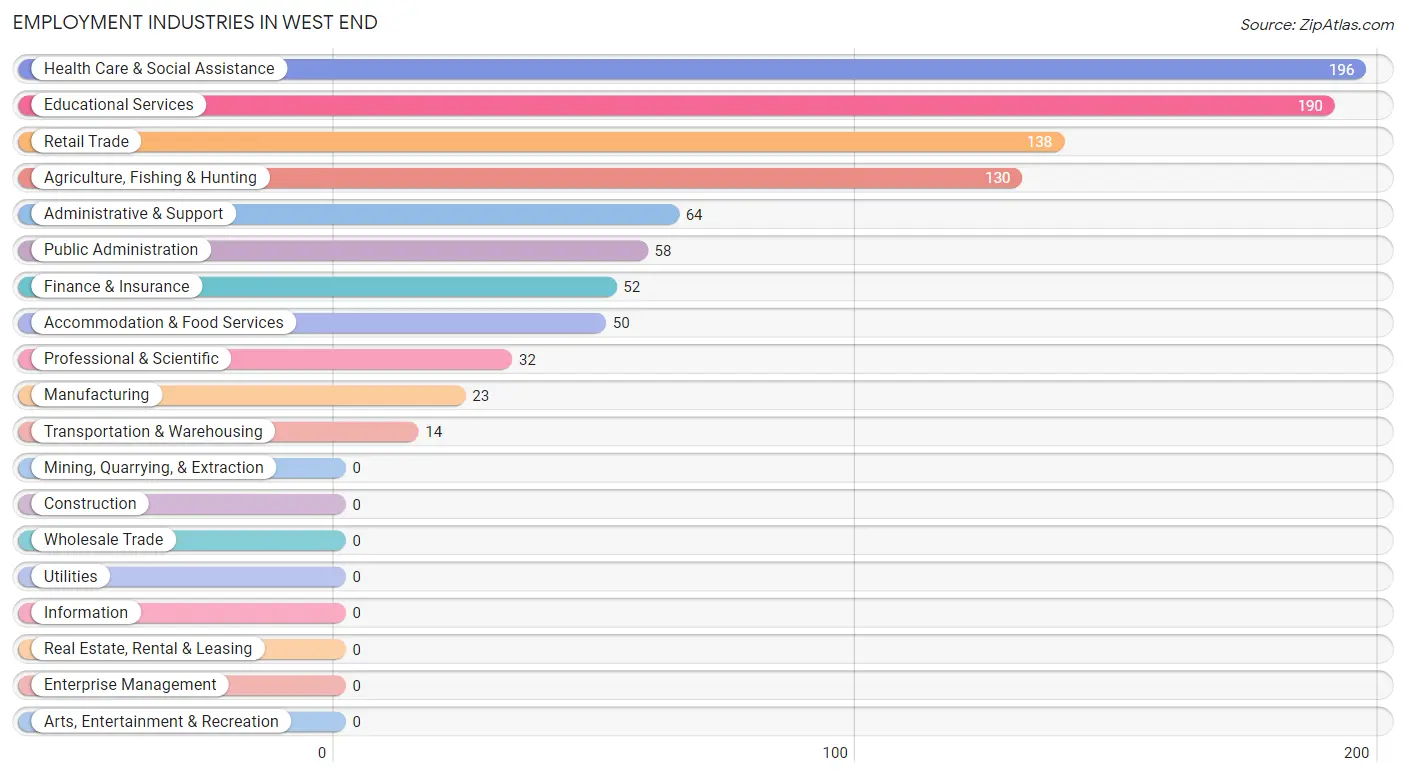
Employment Industries in West End
The major employment industries in West End include Health Care & Social Assistance (196 | 19.1%), Educational Services (190 | 18.5%), Retail Trade (138 | 13.4%), Agriculture, Fishing & Hunting (130 | 12.7%), and Administrative & Support (64 | 6.2%).
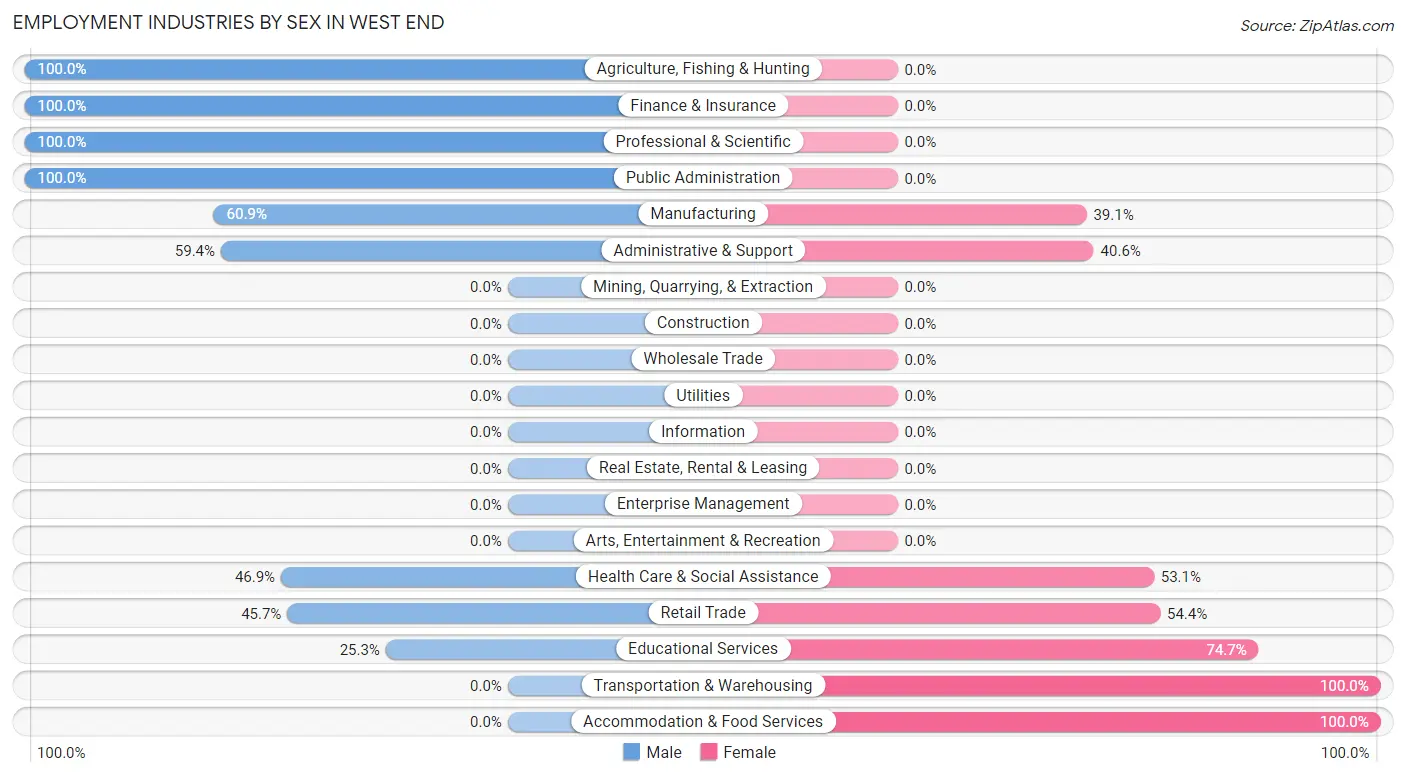
Employment Industries by Sex in West End
The West End industries that see more men than women are Agriculture, Fishing & Hunting (100.0%), Finance & Insurance (100.0%), and Professional & Scientific (100.0%), whereas the industries that tend to have a higher number of women are Transportation & Warehousing (100.0%), Accommodation & Food Services (100.0%), and Educational Services (74.7%).
| Industry | Male | Female |
| Agriculture, Fishing & Hunting | 130 (100.0%) | 0 (0.0%) |
| Mining, Quarrying, & Extraction | 0 (0.0%) | 0 (0.0%) |
| Construction | 0 (0.0%) | 0 (0.0%) |
| Manufacturing | 14 (60.9%) | 9 (39.1%) |
| Wholesale Trade | 0 (0.0%) | 0 (0.0%) |
| Retail Trade | 63 (45.7%) | 75 (54.3%) |
| Transportation & Warehousing | 0 (0.0%) | 14 (100.0%) |
| Utilities | 0 (0.0%) | 0 (0.0%) |
| Information | 0 (0.0%) | 0 (0.0%) |
| Finance & Insurance | 52 (100.0%) | 0 (0.0%) |
| Real Estate, Rental & Leasing | 0 (0.0%) | 0 (0.0%) |
| Professional & Scientific | 32 (100.0%) | 0 (0.0%) |
| Enterprise Management | 0 (0.0%) | 0 (0.0%) |
| Administrative & Support | 38 (59.4%) | 26 (40.6%) |
| Educational Services | 48 (25.3%) | 142 (74.7%) |
| Health Care & Social Assistance | 92 (46.9%) | 104 (53.1%) |
| Arts, Entertainment & Recreation | 0 (0.0%) | 0 (0.0%) |
| Accommodation & Food Services | 0 (0.0%) | 50 (100.0%) |
| Public Administration | 58 (100.0%) | 0 (0.0%) |
| Total | 593 (57.7%) | 435 (42.3%) |
Education in West End
School Enrollment in West End
The most common levels of schooling among the 439 students in West End are middle school (160 | 36.4%), high school (146 | 33.3%), and elementary school (97 | 22.1%).
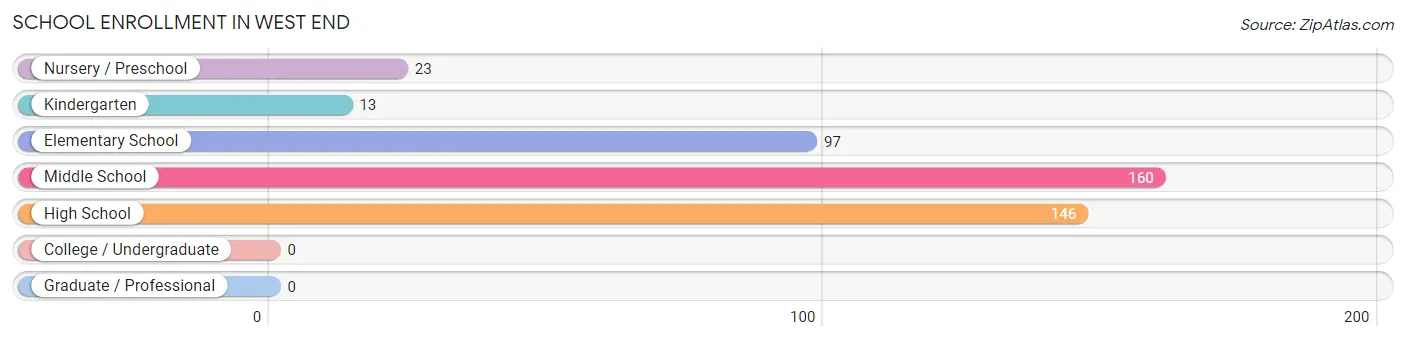
| School Level | # Students | % Students |
| Nursery / Preschool | 23 | 5.2% |
| Kindergarten | 13 | 3.0% |
| Elementary School | 97 | 22.1% |
| Middle School | 160 | 36.4% |
| High School | 146 | 33.3% |
| College / Undergraduate | 0 | 0.0% |
| Graduate / Professional | 0 | 0.0% |
| Total | 439 | 100.0% |
School Enrollment by Age by Funding Source in West End
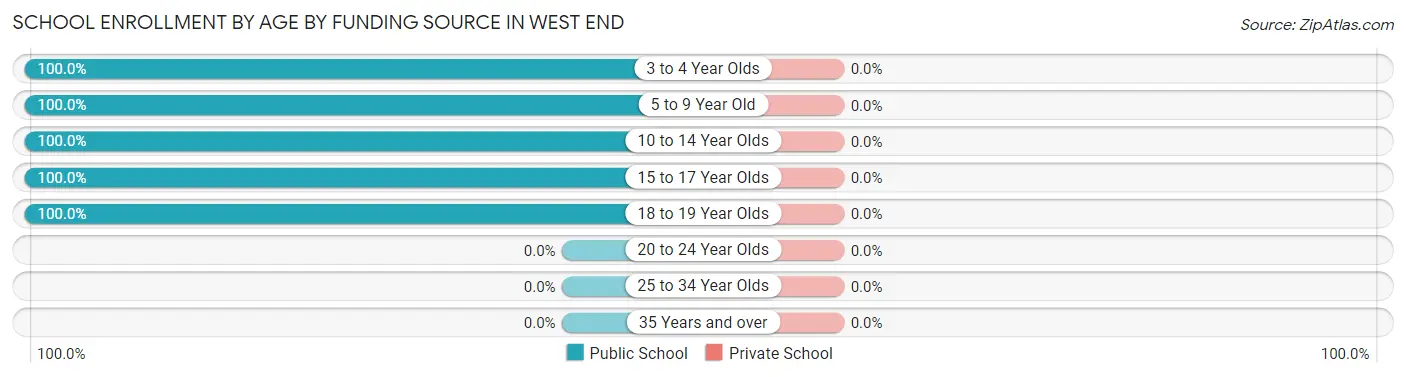
| Age Bracket | Public School | Private School |
| 3 to 4 Year Olds | 23 (100.0%) | 0 (0.0%) |
| 5 to 9 Year Old | 110 (100.0%) | 0 (0.0%) |
| 10 to 14 Year Olds | 138 (100.0%) | 0 (0.0%) |
| 15 to 17 Year Olds | 132 (100.0%) | 0 (0.0%) |
| 18 to 19 Year Olds | 36 (100.0%) | 0 (0.0%) |
| 20 to 24 Year Olds | 0 (0.0%) | 0 (0.0%) |
| 25 to 34 Year Olds | 0 (0.0%) | 0 (0.0%) |
| 35 Years and over | 0 (0.0%) | 0 (0.0%) |
| Total | 439 (100.0%) | 0 (0.0%) |
Educational Attainment by Field of Study in West End
Arts & humanities (153 | 26.6%), education (88 | 15.3%), science & technology (77 | 13.4%), liberal arts & history (72 | 12.5%), and psychology (65 | 11.3%) are the most common fields of study among 575 individuals in West End who have obtained a bachelor's degree or higher.
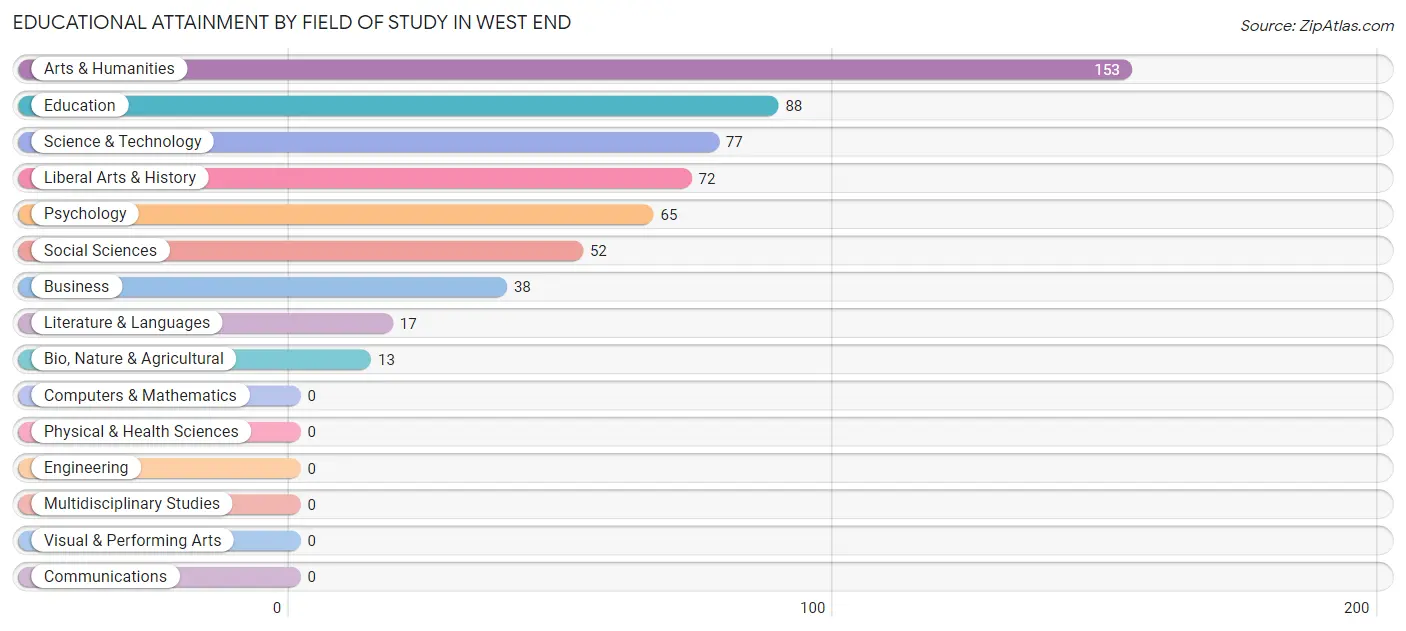
| Field of Study | # Graduates | % Graduates |
| Computers & Mathematics | 0 | 0.0% |
| Bio, Nature & Agricultural | 13 | 2.3% |
| Physical & Health Sciences | 0 | 0.0% |
| Psychology | 65 | 11.3% |
| Social Sciences | 52 | 9.0% |
| Engineering | 0 | 0.0% |
| Multidisciplinary Studies | 0 | 0.0% |
| Science & Technology | 77 | 13.4% |
| Business | 38 | 6.6% |
| Education | 88 | 15.3% |
| Literature & Languages | 17 | 3.0% |
| Liberal Arts & History | 72 | 12.5% |
| Visual & Performing Arts | 0 | 0.0% |
| Communications | 0 | 0.0% |
| Arts & Humanities | 153 | 26.6% |
| Total | 575 | 100.0% |
Transportation & Commute in West End
Vehicle Availability by Sex in West End
The most prevalent vehicle ownership categories in West End are males with 2 vehicles (357, accounting for 60.2%) and females with 2 vehicles (298, making up 82.1%).
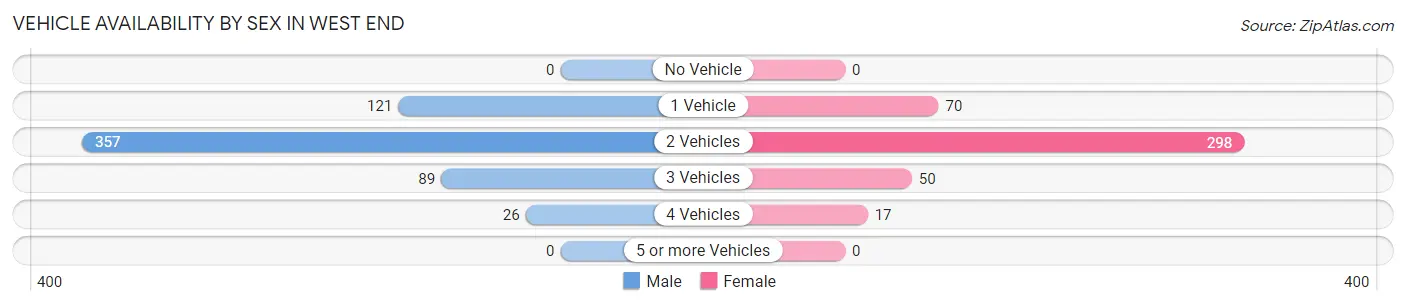
| Vehicles Available | Male | Female |
| No Vehicle | 0 (0.0%) | 0 (0.0%) |
| 1 Vehicle | 121 (20.4%) | 70 (16.1%) |
| 2 Vehicles | 357 (60.2%) | 298 (68.5%) |
| 3 Vehicles | 89 (15.0%) | 50 (11.5%) |
| 4 Vehicles | 26 (4.4%) | 17 (3.9%) |
| 5 or more Vehicles | 0 (0.0%) | 0 (0.0%) |
| Total | 593 (100.0%) | 435 (100.0%) |
Commute Time in West End
The most frequently occuring commute durations in West End are 15 to 19 minutes (250 commuters, 26.2%), 45 to 59 minutes (134 commuters, 14.0%), and 5 to 9 minutes (133 commuters, 13.9%).
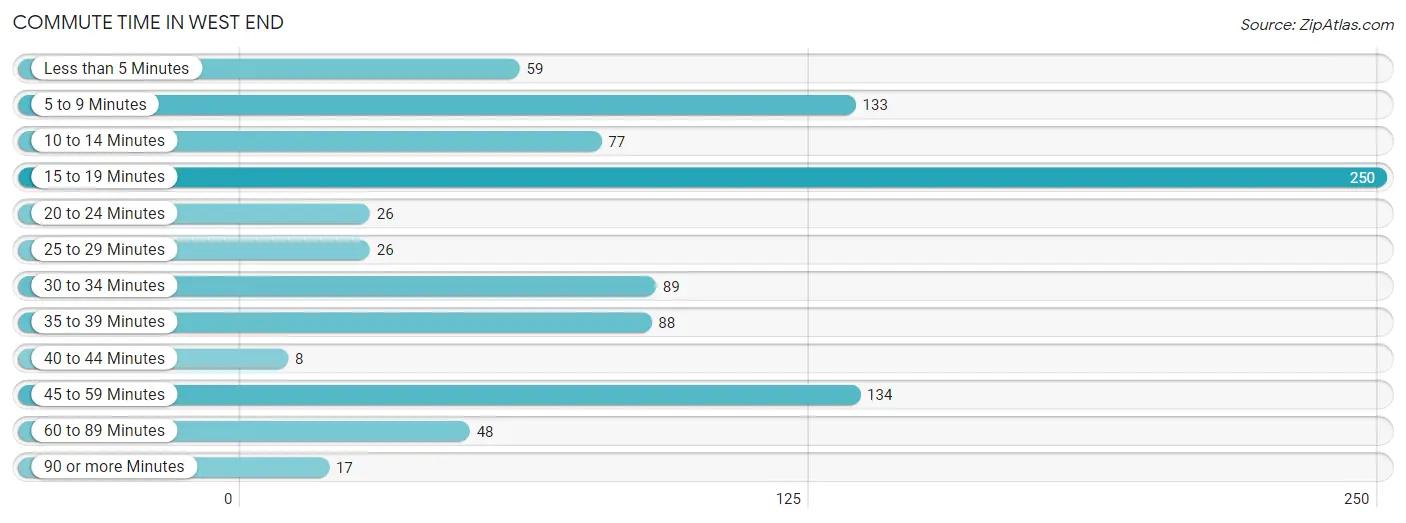
| Commute Time | # Commuters | % Commuters |
| Less than 5 Minutes | 59 | 6.2% |
| 5 to 9 Minutes | 133 | 13.9% |
| 10 to 14 Minutes | 77 | 8.1% |
| 15 to 19 Minutes | 250 | 26.2% |
| 20 to 24 Minutes | 26 | 2.7% |
| 25 to 29 Minutes | 26 | 2.7% |
| 30 to 34 Minutes | 89 | 9.3% |
| 35 to 39 Minutes | 88 | 9.2% |
| 40 to 44 Minutes | 8 | 0.8% |
| 45 to 59 Minutes | 134 | 14.0% |
| 60 to 89 Minutes | 48 | 5.0% |
| 90 or more Minutes | 17 | 1.8% |
Commute Time by Sex in West End
The most common commute times in West End are 15 to 19 minutes (159 commuters, 28.4%) for males and 15 to 19 minutes (91 commuters, 23.0%) for females.
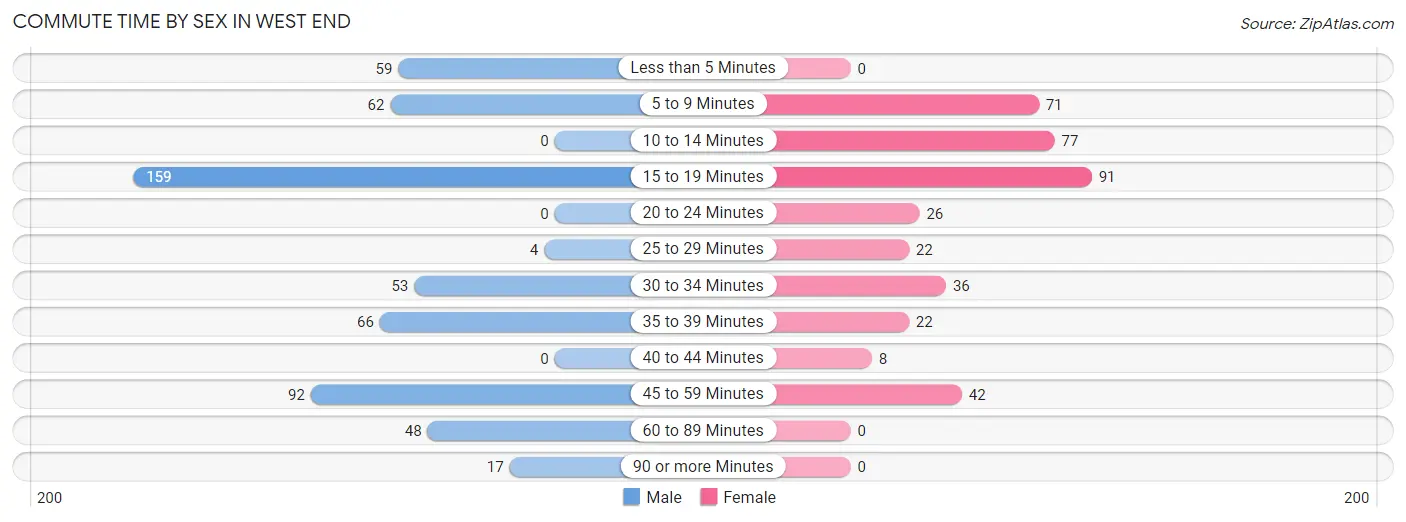
| Commute Time | Male | Female |
| Less than 5 Minutes | 59 (10.5%) | 0 (0.0%) |
| 5 to 9 Minutes | 62 (11.1%) | 71 (18.0%) |
| 10 to 14 Minutes | 0 (0.0%) | 77 (19.5%) |
| 15 to 19 Minutes | 159 (28.4%) | 91 (23.0%) |
| 20 to 24 Minutes | 0 (0.0%) | 26 (6.6%) |
| 25 to 29 Minutes | 4 (0.7%) | 22 (5.6%) |
| 30 to 34 Minutes | 53 (9.5%) | 36 (9.1%) |
| 35 to 39 Minutes | 66 (11.8%) | 22 (5.6%) |
| 40 to 44 Minutes | 0 (0.0%) | 8 (2.0%) |
| 45 to 59 Minutes | 92 (16.4%) | 42 (10.6%) |
| 60 to 89 Minutes | 48 (8.6%) | 0 (0.0%) |
| 90 or more Minutes | 17 (3.0%) | 0 (0.0%) |
Time of Departure to Work by Sex in West End
The most frequent times of departure to work in West End are 7:30 AM to 7:59 AM (172, 30.7%) for males and 9:00 AM to 9:59 AM (88, 22.3%) for females.
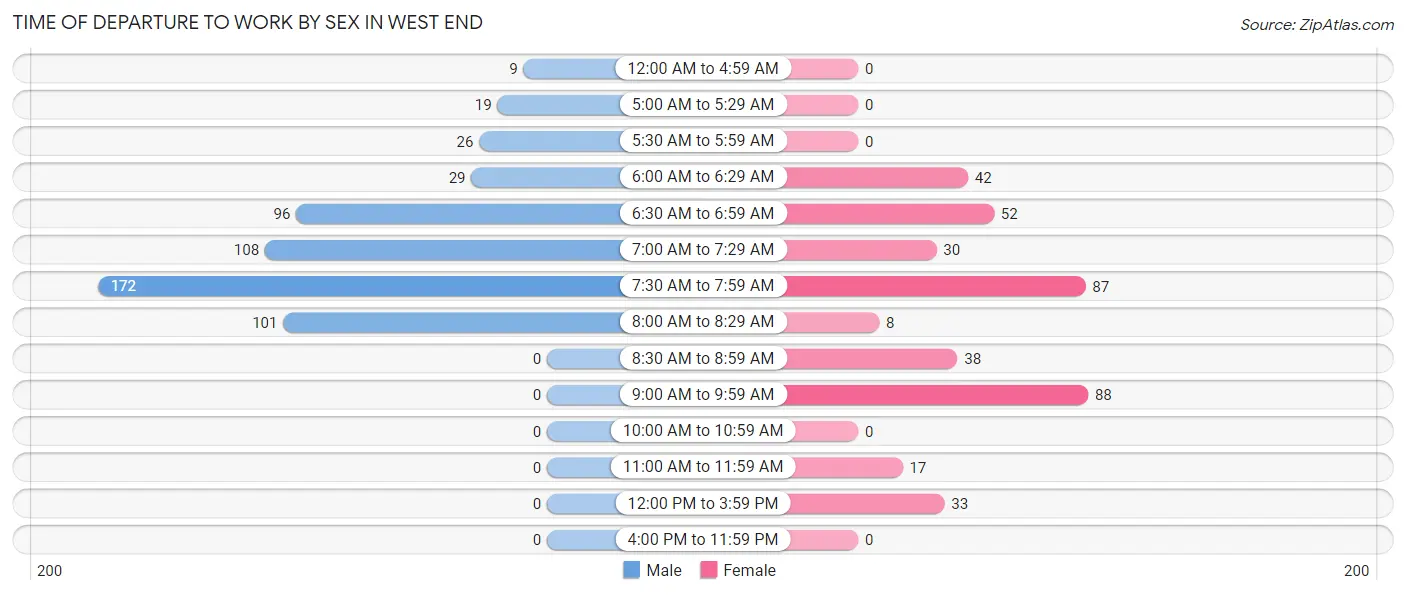
| Time of Departure | Male | Female |
| 12:00 AM to 4:59 AM | 9 (1.6%) | 0 (0.0%) |
| 5:00 AM to 5:29 AM | 19 (3.4%) | 0 (0.0%) |
| 5:30 AM to 5:59 AM | 26 (4.6%) | 0 (0.0%) |
| 6:00 AM to 6:29 AM | 29 (5.2%) | 42 (10.6%) |
| 6:30 AM to 6:59 AM | 96 (17.1%) | 52 (13.2%) |
| 7:00 AM to 7:29 AM | 108 (19.3%) | 30 (7.6%) |
| 7:30 AM to 7:59 AM | 172 (30.7%) | 87 (22.0%) |
| 8:00 AM to 8:29 AM | 101 (18.0%) | 8 (2.0%) |
| 8:30 AM to 8:59 AM | 0 (0.0%) | 38 (9.6%) |
| 9:00 AM to 9:59 AM | 0 (0.0%) | 88 (22.3%) |
| 10:00 AM to 10:59 AM | 0 (0.0%) | 0 (0.0%) |
| 11:00 AM to 11:59 AM | 0 (0.0%) | 17 (4.3%) |
| 12:00 PM to 3:59 PM | 0 (0.0%) | 33 (8.4%) |
| 4:00 PM to 11:59 PM | 0 (0.0%) | 0 (0.0%) |
| Total | 560 (100.0%) | 395 (100.0%) |
Housing Occupancy in West End
Occupancy by Ownership in West End
Of the total 845 dwellings in West End, owner-occupied units account for 603 (71.4%), while renter-occupied units make up 242 (28.6%).

| Occupancy | # Housing Units | % Housing Units |
| Owner Occupied Housing Units | 603 | 71.4% |
| Renter-Occupied Housing Units | 242 | 28.6% |
| Total Occupied Housing Units | 845 | 100.0% |
Occupancy by Household Size in West End
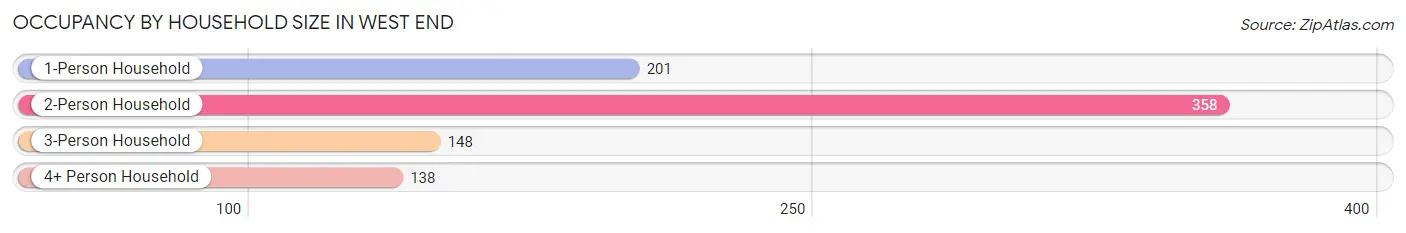
| Household Size | # Housing Units | % Housing Units |
| 1-Person Household | 201 | 23.8% |
| 2-Person Household | 358 | 42.4% |
| 3-Person Household | 148 | 17.5% |
| 4+ Person Household | 138 | 16.3% |
| Total Housing Units | 845 | 100.0% |
Occupancy by Ownership by Household Size in West End
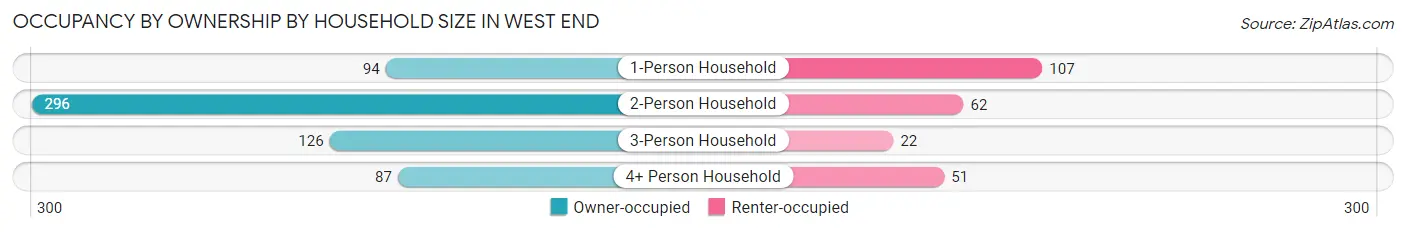
| Household Size | Owner-occupied | Renter-occupied |
| 1-Person Household | 94 (46.8%) | 107 (53.2%) |
| 2-Person Household | 296 (82.7%) | 62 (17.3%) |
| 3-Person Household | 126 (85.1%) | 22 (14.9%) |
| 4+ Person Household | 87 (63.0%) | 51 (37.0%) |
| Total Housing Units | 603 (71.4%) | 242 (28.6%) |
Occupancy by Educational Attainment in West End

| Household Size | Owner-occupied | Renter-occupied |
| Less than High School | 0 (0.0%) | 0 (0.0%) |
| High School Diploma | 130 (54.2%) | 110 (45.8%) |
| College/Associate Degree | 213 (79.5%) | 55 (20.5%) |
| Bachelor's Degree or higher | 260 (77.1%) | 77 (22.9%) |
Occupancy by Age of Householder in West End
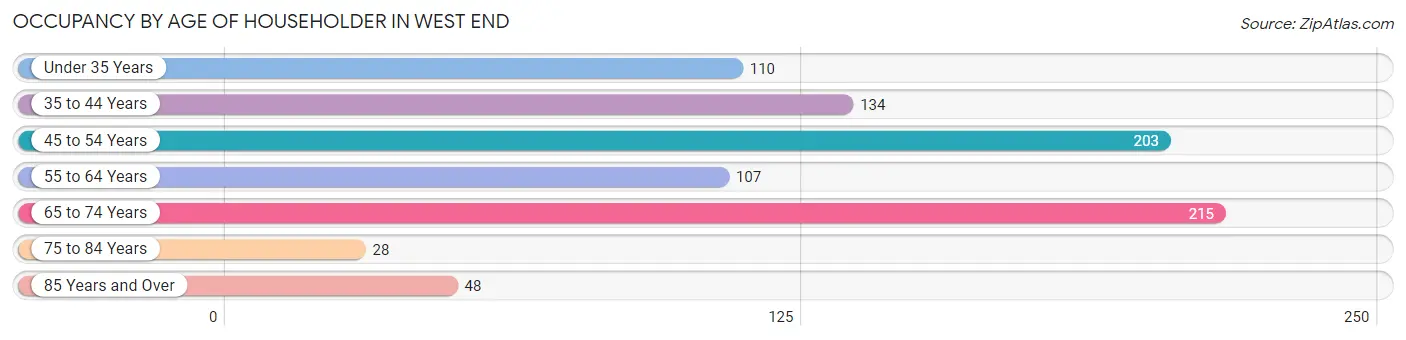
| Age Bracket | # Households | % Households |
| Under 35 Years | 110 | 13.0% |
| 35 to 44 Years | 134 | 15.9% |
| 45 to 54 Years | 203 | 24.0% |
| 55 to 64 Years | 107 | 12.7% |
| 65 to 74 Years | 215 | 25.4% |
| 75 to 84 Years | 28 | 3.3% |
| 85 Years and Over | 48 | 5.7% |
| Total | 845 | 100.0% |
Housing Finances in West End
Median Income by Occupancy in West End
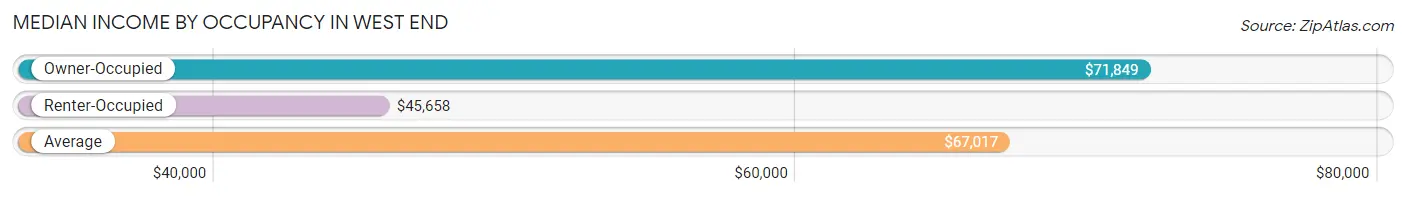
| Occupancy Type | # Households | Median Income |
| Owner-Occupied | 603 (71.4%) | $71,849 |
| Renter-Occupied | 242 (28.6%) | $45,658 |
| Average | 845 (100.0%) | $67,017 |
Occupancy by Householder Income Bracket in West End
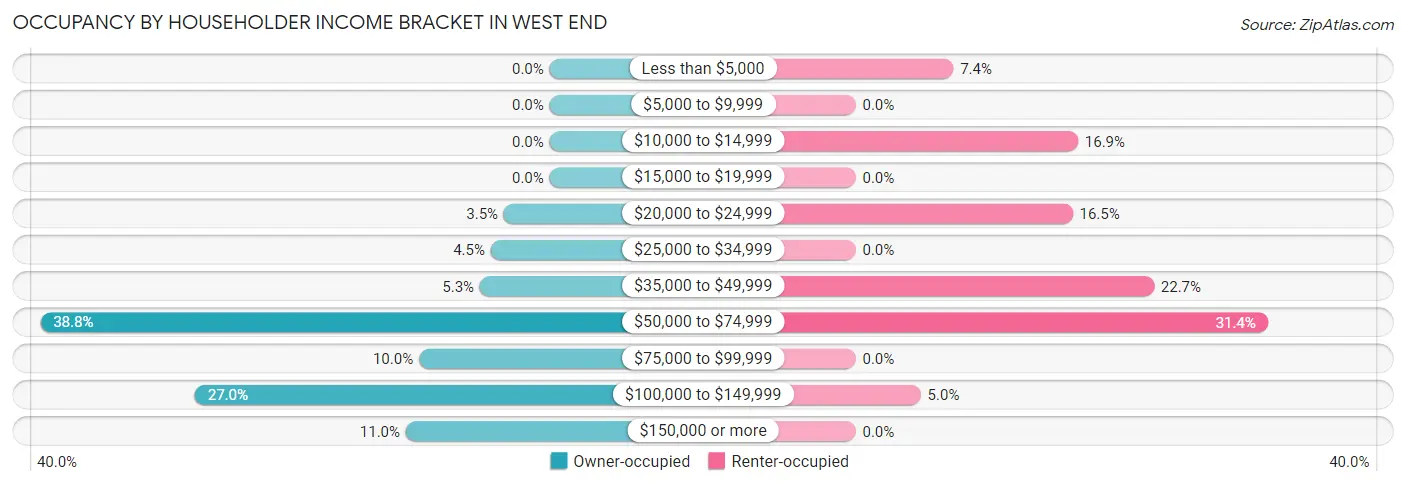
| Income Bracket | Owner-occupied | Renter-occupied |
| Less than $5,000 | 0 (0.0%) | 18 (7.4%) |
| $5,000 to $9,999 | 0 (0.0%) | 0 (0.0%) |
| $10,000 to $14,999 | 0 (0.0%) | 41 (16.9%) |
| $15,000 to $19,999 | 0 (0.0%) | 0 (0.0%) |
| $20,000 to $24,999 | 21 (3.5%) | 40 (16.5%) |
| $25,000 to $34,999 | 27 (4.5%) | 0 (0.0%) |
| $35,000 to $49,999 | 32 (5.3%) | 55 (22.7%) |
| $50,000 to $74,999 | 234 (38.8%) | 76 (31.4%) |
| $75,000 to $99,999 | 60 (10.0%) | 0 (0.0%) |
| $100,000 to $149,999 | 163 (27.0%) | 12 (5.0%) |
| $150,000 or more | 66 (11.0%) | 0 (0.0%) |
| Total | 603 (100.0%) | 242 (100.0%) |
Monthly Housing Cost Tiers in West End
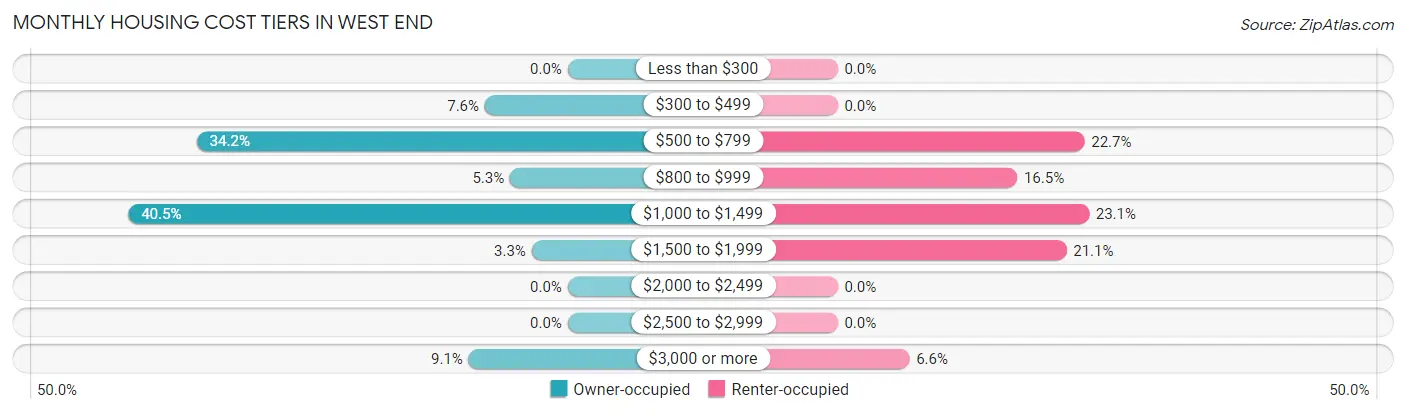
| Monthly Cost | Owner-occupied | Renter-occupied |
| Less than $300 | 0 (0.0%) | 0 (0.0%) |
| $300 to $499 | 46 (7.6%) | 0 (0.0%) |
| $500 to $799 | 206 (34.2%) | 55 (22.7%) |
| $800 to $999 | 32 (5.3%) | 40 (16.5%) |
| $1,000 to $1,499 | 244 (40.5%) | 56 (23.1%) |
| $1,500 to $1,999 | 20 (3.3%) | 51 (21.1%) |
| $2,000 to $2,499 | 0 (0.0%) | 0 (0.0%) |
| $2,500 to $2,999 | 0 (0.0%) | 0 (0.0%) |
| $3,000 or more | 55 (9.1%) | 16 (6.6%) |
| Total | 603 (100.0%) | 242 (100.0%) |
Physical Housing Characteristics in West End
Housing Structures in West End
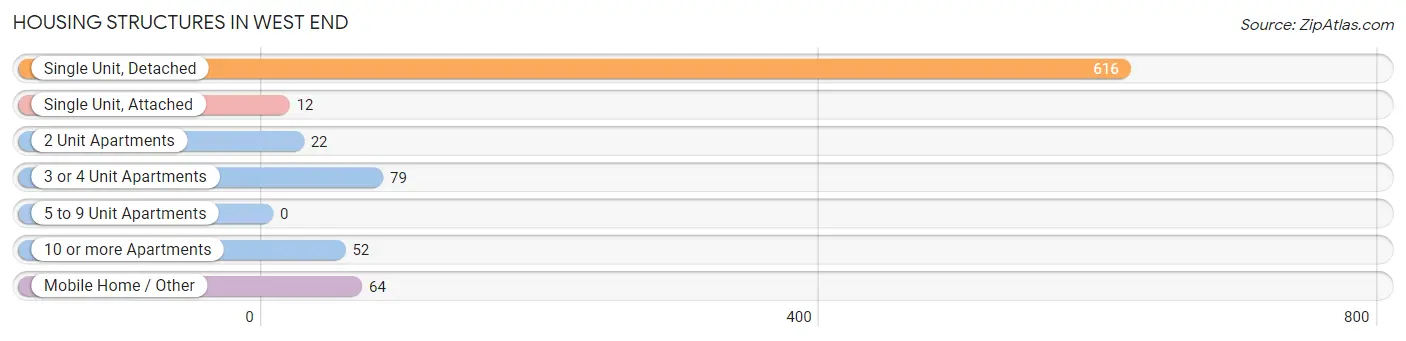
| Structure Type | # Housing Units | % Housing Units |
| Single Unit, Detached | 616 | 72.9% |
| Single Unit, Attached | 12 | 1.4% |
| 2 Unit Apartments | 22 | 2.6% |
| 3 or 4 Unit Apartments | 79 | 9.3% |
| 5 to 9 Unit Apartments | 0 | 0.0% |
| 10 or more Apartments | 52 | 6.1% |
| Mobile Home / Other | 64 | 7.6% |
| Total | 845 | 100.0% |
Housing Structures by Occupancy in West End
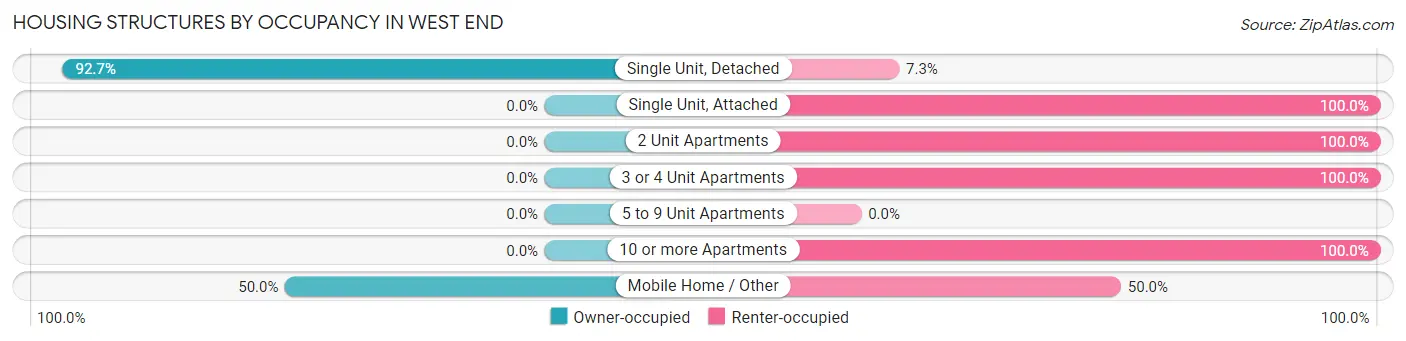
| Structure Type | Owner-occupied | Renter-occupied |
| Single Unit, Detached | 571 (92.7%) | 45 (7.3%) |
| Single Unit, Attached | 0 (0.0%) | 12 (100.0%) |
| 2 Unit Apartments | 0 (0.0%) | 22 (100.0%) |
| 3 or 4 Unit Apartments | 0 (0.0%) | 79 (100.0%) |
| 5 to 9 Unit Apartments | 0 (0.0%) | 0 (0.0%) |
| 10 or more Apartments | 0 (0.0%) | 52 (100.0%) |
| Mobile Home / Other | 32 (50.0%) | 32 (50.0%) |
| Total | 603 (71.4%) | 242 (28.6%) |
Housing Structures by Number of Rooms in West End
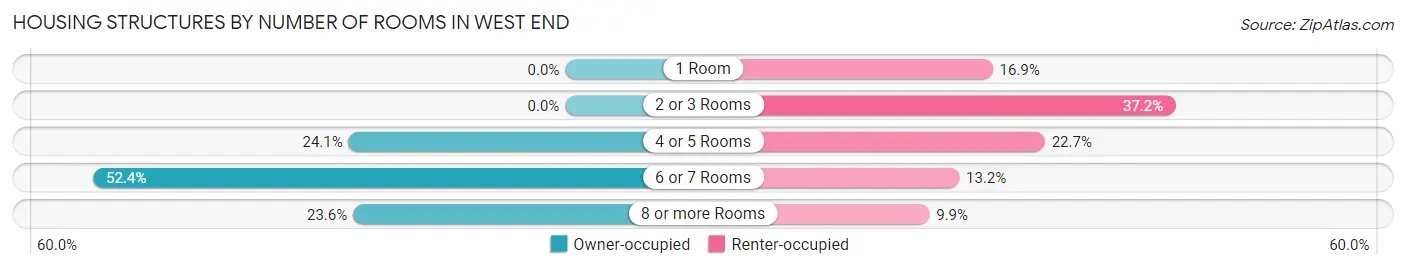
| Number of Rooms | Owner-occupied | Renter-occupied |
| 1 Room | 0 (0.0%) | 41 (16.9%) |
| 2 or 3 Rooms | 0 (0.0%) | 90 (37.2%) |
| 4 or 5 Rooms | 145 (24.0%) | 55 (22.7%) |
| 6 or 7 Rooms | 316 (52.4%) | 32 (13.2%) |
| 8 or more Rooms | 142 (23.5%) | 24 (9.9%) |
| Total | 603 (100.0%) | 242 (100.0%) |
Housing Structure by Heating Type in West End
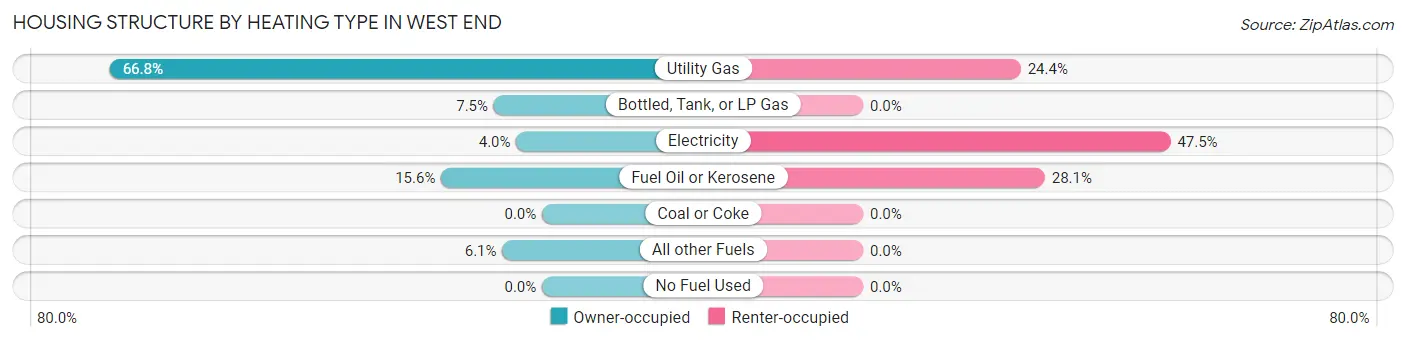
| Heating Type | Owner-occupied | Renter-occupied |
| Utility Gas | 403 (66.8%) | 59 (24.4%) |
| Bottled, Tank, or LP Gas | 45 (7.5%) | 0 (0.0%) |
| Electricity | 24 (4.0%) | 115 (47.5%) |
| Fuel Oil or Kerosene | 94 (15.6%) | 68 (28.1%) |
| Coal or Coke | 0 (0.0%) | 0 (0.0%) |
| All other Fuels | 37 (6.1%) | 0 (0.0%) |
| No Fuel Used | 0 (0.0%) | 0 (0.0%) |
| Total | 603 (100.0%) | 242 (100.0%) |
Household Vehicle Usage in West End
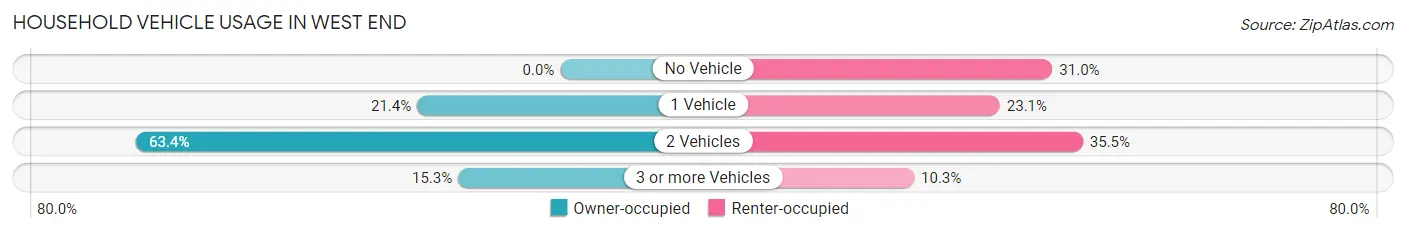
| Vehicles per Household | Owner-occupied | Renter-occupied |
| No Vehicle | 0 (0.0%) | 75 (31.0%) |
| 1 Vehicle | 129 (21.4%) | 56 (23.1%) |
| 2 Vehicles | 382 (63.3%) | 86 (35.5%) |
| 3 or more Vehicles | 92 (15.3%) | 25 (10.3%) |
| Total | 603 (100.0%) | 242 (100.0%) |
Real Estate & Mortgages in West End
Real Estate and Mortgage Overview in West End
| Characteristic | Without Mortgage | With Mortgage |
| Housing Units | 207 | 396 |
| Median Property Value | $143,800 | $150,400 |
| Median Household Income | $75,625 | $33 |
| Monthly Housing Costs | $548 | $55 |
| Real Estate Taxes | $2,648 | $0 |
Property Value by Mortgage Status in West End
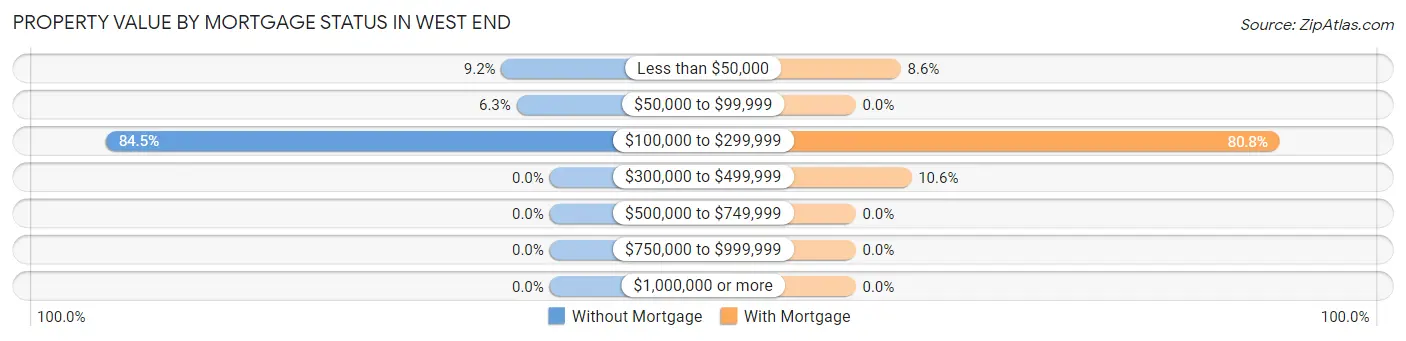
| Property Value | Without Mortgage | With Mortgage |
| Less than $50,000 | 19 (9.2%) | 34 (8.6%) |
| $50,000 to $99,999 | 13 (6.3%) | 0 (0.0%) |
| $100,000 to $299,999 | 175 (84.5%) | 320 (80.8%) |
| $300,000 to $499,999 | 0 (0.0%) | 42 (10.6%) |
| $500,000 to $749,999 | 0 (0.0%) | 0 (0.0%) |
| $750,000 to $999,999 | 0 (0.0%) | 0 (0.0%) |
| $1,000,000 or more | 0 (0.0%) | 0 (0.0%) |
| Total | 207 (100.0%) | 396 (100.0%) |
Household Income by Mortgage Status in West End
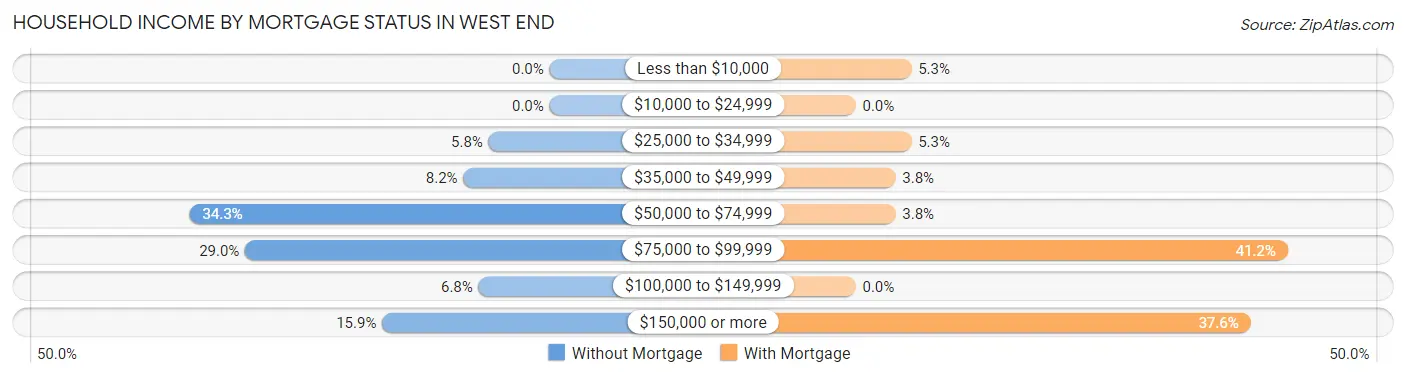
| Household Income | Without Mortgage | With Mortgage |
| Less than $10,000 | 0 (0.0%) | 21 (5.3%) |
| $10,000 to $24,999 | 0 (0.0%) | 0 (0.0%) |
| $25,000 to $34,999 | 12 (5.8%) | 21 (5.3%) |
| $35,000 to $49,999 | 17 (8.2%) | 15 (3.8%) |
| $50,000 to $74,999 | 71 (34.3%) | 15 (3.8%) |
| $75,000 to $99,999 | 60 (29.0%) | 163 (41.2%) |
| $100,000 to $149,999 | 14 (6.8%) | 0 (0.0%) |
| $150,000 or more | 33 (15.9%) | 149 (37.6%) |
| Total | 207 (100.0%) | 396 (100.0%) |
Property Value to Household Income Ratio in West End
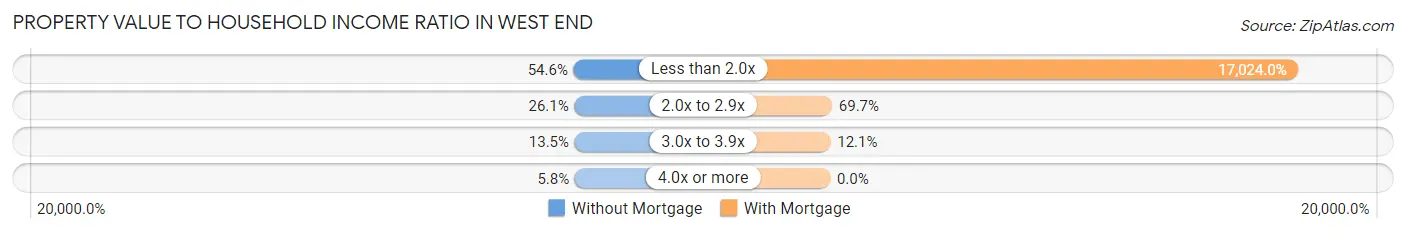
| Value-to-Income Ratio | Without Mortgage | With Mortgage |
| Less than 2.0x | 113 (54.6%) | 67,415 (17,024.0%) |
| 2.0x to 2.9x | 54 (26.1%) | 276 (69.7%) |
| 3.0x to 3.9x | 28 (13.5%) | 48 (12.1%) |
| 4.0x or more | 12 (5.8%) | 0 (0.0%) |
| Total | 207 (100.0%) | 396 (100.0%) |
Real Estate Taxes by Mortgage Status in West End
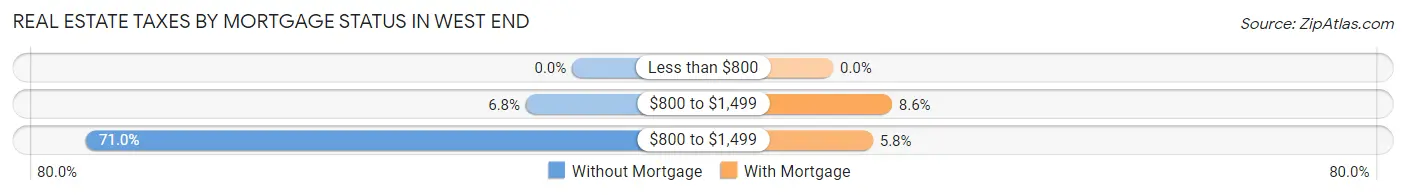
| Property Taxes | Without Mortgage | With Mortgage |
| Less than $800 | 0 (0.0%) | 0 (0.0%) |
| $800 to $1,499 | 14 (6.8%) | 34 (8.6%) |
| $800 to $1,499 | 147 (71.0%) | 23 (5.8%) |
| Total | 207 (100.0%) | 396 (100.0%) |
Health & Disability in West End
Health Insurance Coverage by Age in West End
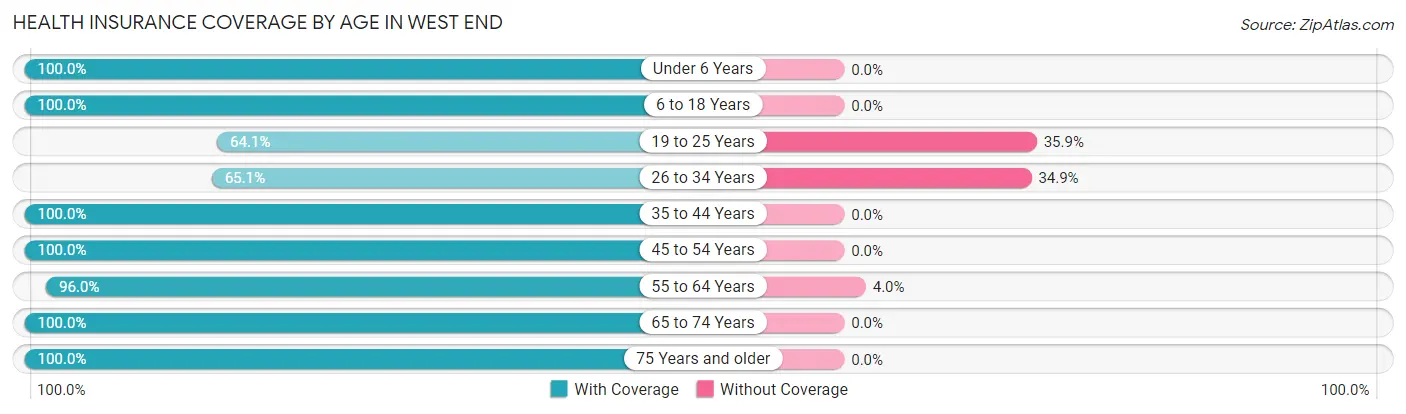
| Age Bracket | With Coverage | Without Coverage |
| Under 6 Years | 41 (100.0%) | 0 (0.0%) |
| 6 to 18 Years | 401 (100.0%) | 0 (0.0%) |
| 19 to 25 Years | 159 (64.1%) | 89 (35.9%) |
| 26 to 34 Years | 125 (65.1%) | 67 (34.9%) |
| 35 to 44 Years | 222 (100.0%) | 0 (0.0%) |
| 45 to 54 Years | 341 (100.0%) | 0 (0.0%) |
| 55 to 64 Years | 287 (96.0%) | 12 (4.0%) |
| 65 to 74 Years | 296 (100.0%) | 0 (0.0%) |
| 75 Years and older | 102 (100.0%) | 0 (0.0%) |
| Total | 1,974 (92.2%) | 168 (7.8%) |
Health Insurance Coverage by Citizenship Status in West End
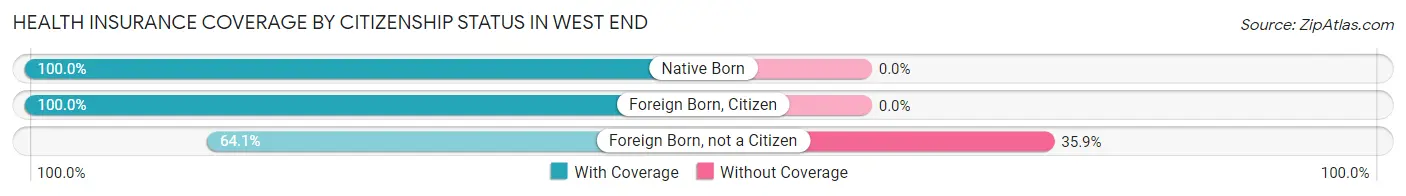
| Citizenship Status | With Coverage | Without Coverage |
| Native Born | 41 (100.0%) | 0 (0.0%) |
| Foreign Born, Citizen | 401 (100.0%) | 0 (0.0%) |
| Foreign Born, not a Citizen | 159 (64.1%) | 89 (35.9%) |
Health Insurance Coverage by Household Income in West End
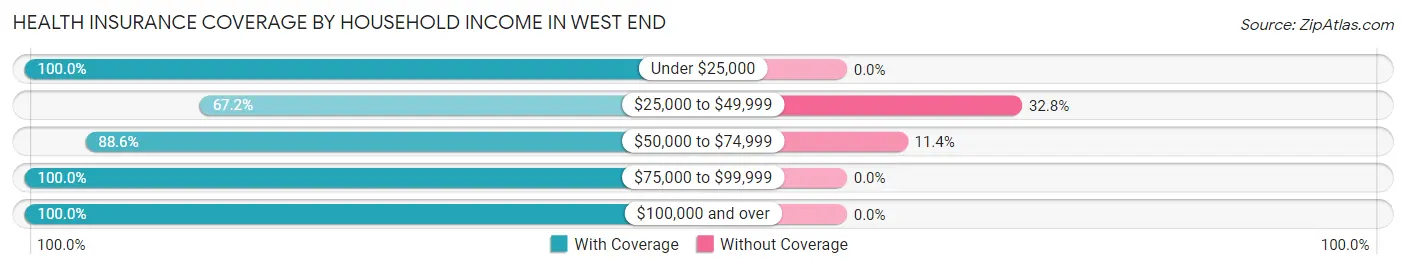
| Household Income | With Coverage | Without Coverage |
| Under $25,000 | 196 (100.0%) | 0 (0.0%) |
| $25,000 to $49,999 | 131 (67.2%) | 64 (32.8%) |
| $50,000 to $74,999 | 810 (88.6%) | 104 (11.4%) |
| $75,000 to $99,999 | 100 (100.0%) | 0 (0.0%) |
| $100,000 and over | 639 (100.0%) | 0 (0.0%) |
Public vs Private Health Insurance Coverage by Age in West End
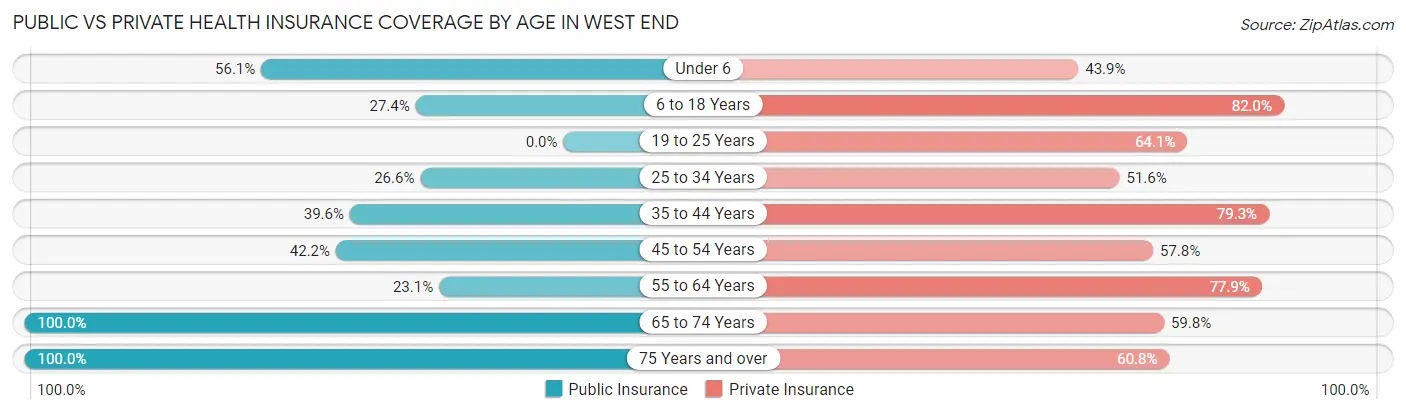
| Age Bracket | Public Insurance | Private Insurance |
| Under 6 | 23 (56.1%) | 18 (43.9%) |
| 6 to 18 Years | 110 (27.4%) | 329 (82.0%) |
| 19 to 25 Years | 0 (0.0%) | 159 (64.1%) |
| 25 to 34 Years | 51 (26.6%) | 99 (51.6%) |
| 35 to 44 Years | 88 (39.6%) | 176 (79.3%) |
| 45 to 54 Years | 144 (42.2%) | 197 (57.8%) |
| 55 to 64 Years | 69 (23.1%) | 233 (77.9%) |
| 65 to 74 Years | 296 (100.0%) | 177 (59.8%) |
| 75 Years and over | 102 (100.0%) | 62 (60.8%) |
| Total | 883 (41.2%) | 1,450 (67.7%) |
Disability Status by Sex by Age in West End
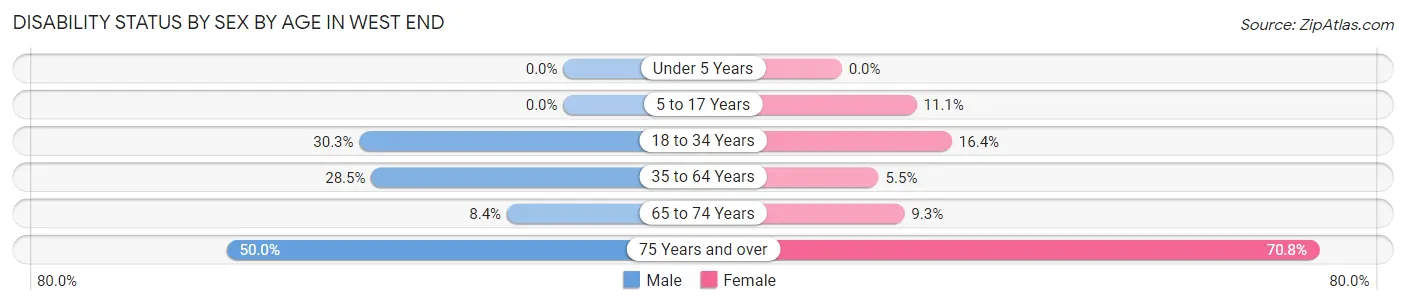
| Age Bracket | Male | Female |
| Under 5 Years | 0 (0.0%) | 0 (0.0%) |
| 5 to 17 Years | 0 (0.0%) | 18 (11.1%) |
| 18 to 34 Years | 106 (30.3%) | 17 (16.4%) |
| 35 to 64 Years | 152 (28.5%) | 18 (5.5%) |
| 65 to 74 Years | 14 (8.4%) | 12 (9.3%) |
| 75 Years and over | 27 (50.0%) | 34 (70.8%) |
Disability Class by Sex by Age in West End
Disability Class: Hearing Difficulty
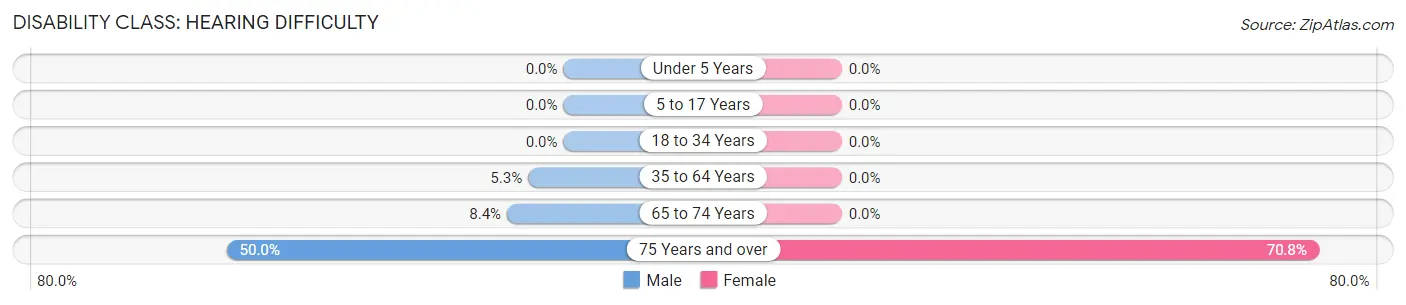
| Age Bracket | Male | Female |
| Under 5 Years | 0 (0.0%) | 0 (0.0%) |
| 5 to 17 Years | 0 (0.0%) | 0 (0.0%) |
| 18 to 34 Years | 0 (0.0%) | 0 (0.0%) |
| 35 to 64 Years | 28 (5.2%) | 0 (0.0%) |
| 65 to 74 Years | 14 (8.4%) | 0 (0.0%) |
| 75 Years and over | 27 (50.0%) | 34 (70.8%) |
Disability Class: Vision Difficulty
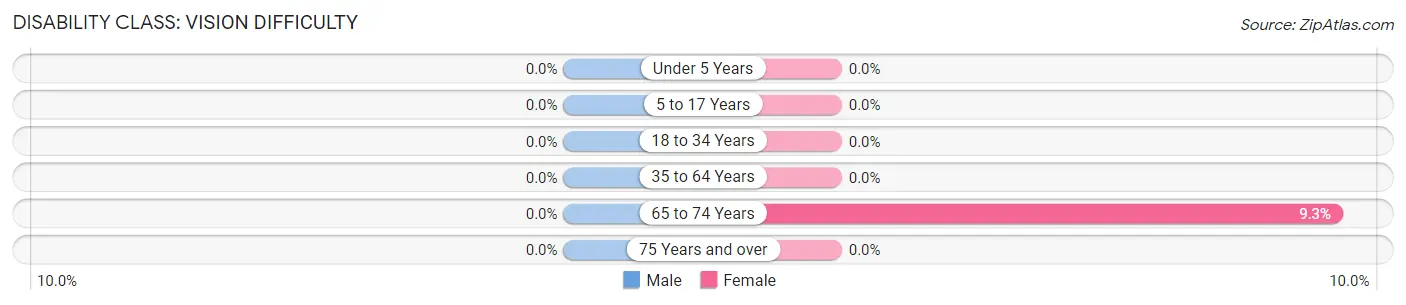
| Age Bracket | Male | Female |
| Under 5 Years | 0 (0.0%) | 0 (0.0%) |
| 5 to 17 Years | 0 (0.0%) | 0 (0.0%) |
| 18 to 34 Years | 0 (0.0%) | 0 (0.0%) |
| 35 to 64 Years | 0 (0.0%) | 0 (0.0%) |
| 65 to 74 Years | 0 (0.0%) | 12 (9.3%) |
| 75 Years and over | 0 (0.0%) | 0 (0.0%) |
Disability Class: Cognitive Difficulty
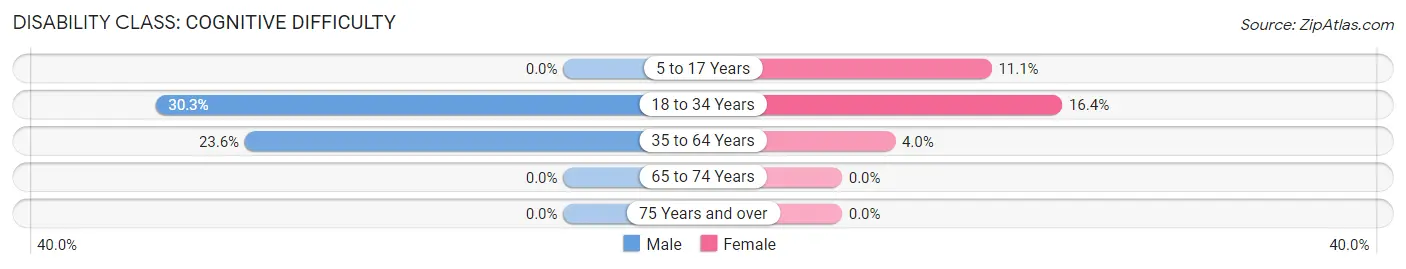
| Age Bracket | Male | Female |
| 5 to 17 Years | 0 (0.0%) | 18 (11.1%) |
| 18 to 34 Years | 106 (30.3%) | 17 (16.4%) |
| 35 to 64 Years | 126 (23.6%) | 13 (4.0%) |
| 65 to 74 Years | 0 (0.0%) | 0 (0.0%) |
| 75 Years and over | 0 (0.0%) | 0 (0.0%) |
Disability Class: Ambulatory Difficulty
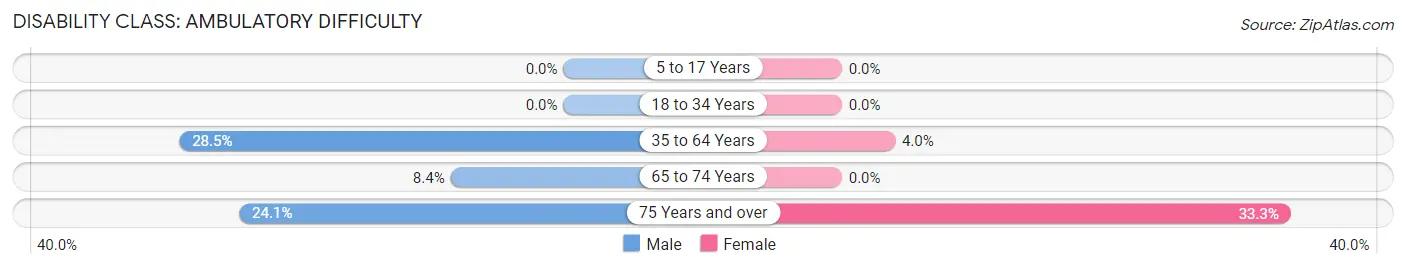
| Age Bracket | Male | Female |
| 5 to 17 Years | 0 (0.0%) | 0 (0.0%) |
| 18 to 34 Years | 0 (0.0%) | 0 (0.0%) |
| 35 to 64 Years | 152 (28.5%) | 13 (4.0%) |
| 65 to 74 Years | 14 (8.4%) | 0 (0.0%) |
| 75 Years and over | 13 (24.1%) | 16 (33.3%) |
Disability Class: Self-Care Difficulty
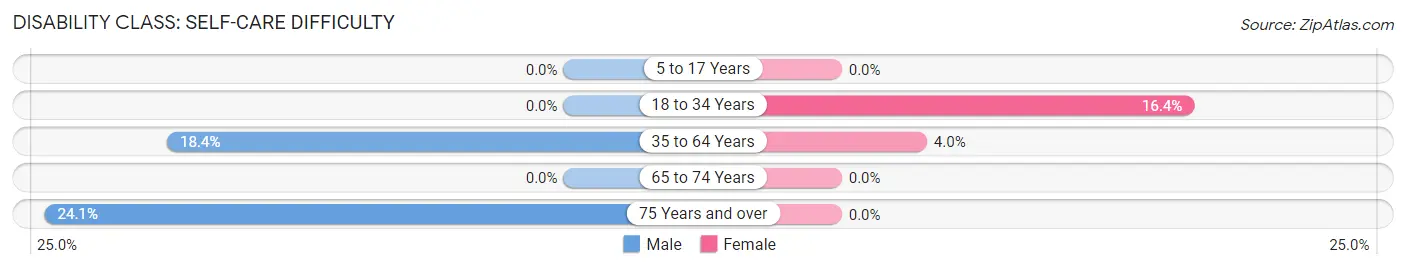
| Age Bracket | Male | Female |
| 5 to 17 Years | 0 (0.0%) | 0 (0.0%) |
| 18 to 34 Years | 0 (0.0%) | 17 (16.4%) |
| 35 to 64 Years | 98 (18.4%) | 13 (4.0%) |
| 65 to 74 Years | 0 (0.0%) | 0 (0.0%) |
| 75 Years and over | 13 (24.1%) | 0 (0.0%) |
Technology Access in West End
Computing Device Access in West End
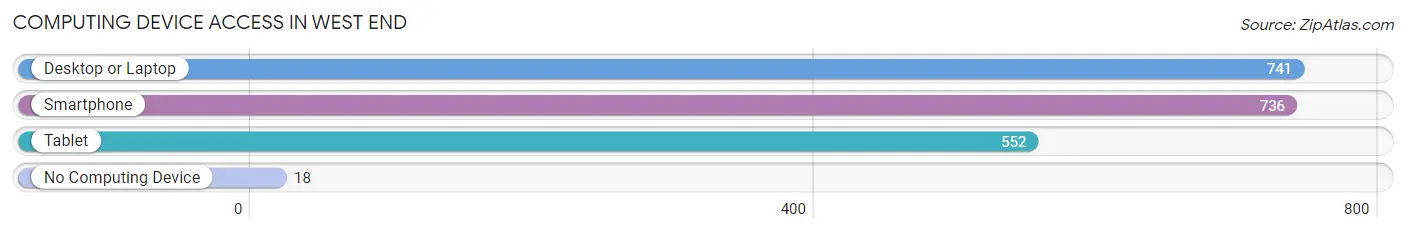
| Device Type | # Households | % Households |
| Desktop or Laptop | 741 | 87.7% |
| Smartphone | 736 | 87.1% |
| Tablet | 552 | 65.3% |
| No Computing Device | 18 | 2.1% |
| Total | 845 | 100.0% |
Internet Access in West End
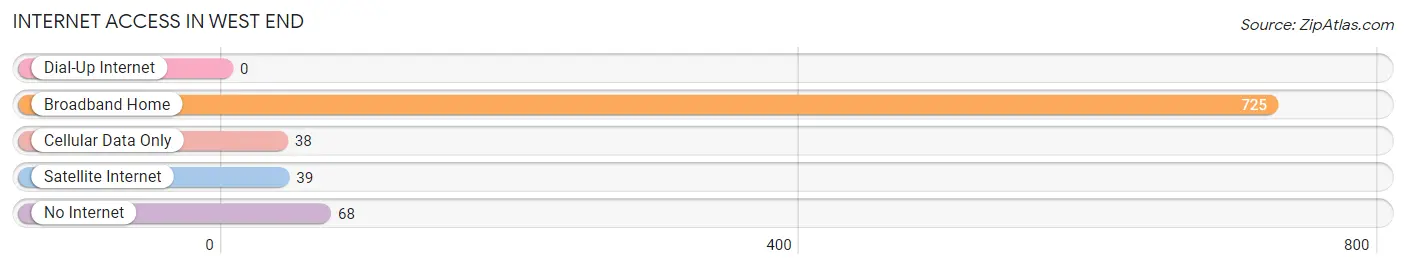
| Internet Type | # Households | % Households |
| Dial-Up Internet | 0 | 0.0% |
| Broadband Home | 725 | 85.8% |
| Cellular Data Only | 38 | 4.5% |
| Satellite Internet | 39 | 4.6% |
| No Internet | 68 | 8.1% |
| Total | 845 | 100.0% |
West End Summary
West End is a hamlet located in the Town of Hempstead in Nassau County, New York. It is situated on the south shore of Long Island, approximately 25 miles east of New York City. The hamlet is bordered by the hamlets of East Rockaway, Lynbrook, and Malverne.
History
The area now known as West End was originally inhabited by the Rockaway Indians, a sub-tribe of the Lenape people. The first European settlers arrived in the area in the late 1600s, and the hamlet was officially established in 1790. The hamlet was originally known as “West Hempstead”, but the name was changed to “West End” in 1873.
The hamlet was primarily an agricultural community until the late 19th century, when it began to develop into a residential area. The first railroad station in West End was built in 1869, and the hamlet was connected to the Long Island Rail Road in 1873. This allowed for easy access to New York City, and the population of West End began to grow rapidly.
In the early 20th century, West End became a popular summer resort destination for wealthy New Yorkers. The area was home to several large estates, and many of the homes were designed by prominent architects. The hamlet also became known for its many golf courses, which attracted visitors from all over the country.
Geography
West End is located on the south shore of Long Island, approximately 25 miles east of New York City. The hamlet is bordered by the hamlets of East Rockaway, Lynbrook, and Malverne. The total area of West End is 2.2 square miles, and the population was 8,945 as of the 2010 census.
The hamlet is situated on a peninsula, with the Atlantic Ocean to the south and the Hempstead Bay to the north. The area is mostly flat, with some low hills in the northern part of the hamlet. The climate in West End is humid subtropical, with hot, humid summers and mild winters.
Economy
West End is primarily a residential community, and the majority of the population is employed in the service sector. The hamlet is home to several small businesses, including restaurants, retail stores, and professional services. The hamlet is also home to several large corporations, including Northwell Health, a healthcare provider, and the New York Institute of Technology, a private university.
The median household income in West End is $90,845, and the median home value is $541,000. The unemployment rate is 3.2%, which is lower than the national average.
Demographics
As of the 2010 census, the population of West End was 8,945. The racial makeup of the hamlet was 79.2% White, 11.2% African American, 4.2% Asian, and 5.4% Hispanic or Latino. The median age of the population was 43.7 years.
The majority of the population (77.2%) is married, and the median household size is 2.7 people. The median household income is $90,845, and the median home value is $541,000. The unemployment rate is 3.2%.
Conclusion
West End is a hamlet located in the Town of Hempstead in Nassau County, New York. It is situated on the south shore of Long Island, approximately 25 miles east of New York City. The hamlet was originally inhabited by the Rockaway Indians, and was officially established in 1790. The hamlet was primarily an agricultural community until the late 19th century, when it began to develop into a residential area. Today, West End is primarily a residential community, and the majority of the population is employed in the service sector. The median household income is $90,845, and the median home value is $541,000. The population of West End is 8,945, and the racial makeup of the hamlet is 79.2% White, 11.2% African American, 4.2% Asian, and 5.4% Hispanic or Latino.
Common Questions
What is Per Capita Income in West End?
Per Capita income in West End is $31,702.
What is the Median Family Income in West End?
Median Family Income in West End is $70,625.
What is the Median Household income in West End?
Median Household Income in West End is $67,017.
What is Income or Wage Gap in West End?
Income or Wage Gap in West End is 20.5%.
Women in West End earn 79.5 cents for every dollar earned by a man.
What is Inequality or Gini Index in West End?
Inequality or Gini Index in West End is 0.35.
What is the Total Population of West End?
Total Population of West End is 2,142.
What is the Total Male Population of West End?
Total Male Population of West End is 1,339.
What is the Total Female Population of West End?
Total Female Population of West End is 803.
What is the Ratio of Males per 100 Females in West End?
There are 166.75 Males per 100 Females in West End.
What is the Ratio of Females per 100 Males in West End?
There are 59.97 Females per 100 Males in West End.
What is the Median Population Age in West End?
Median Population Age in West End is 40.6 Years.
What is the Average Family Size in West End
Average Family Size in West End is 3.1 People.
What is the Average Household Size in West End
Average Household Size in West End is 2.4 People.
How Large is the Labor Force in West End?
There are 1,064 People in the Labor Forcein in West End.
What is the Percentage of People in the Labor Force in West End?
61.1% of People are in the Labor Force in West End.
What is the Unemployment Rate in West End?
Unemployment Rate in West End is 3.5%.