Prattsville, NY Map & Demographics
Prattsville Map
Prattsville Overview
$29,384
PER CAPITA INCOME
$123,750
AVG FAMILY INCOME
$26,354
AVG HOUSEHOLD INCOME
0.50
INEQUALITY / GINI INDEX
98
TOTAL POPULATION
45
MALE POPULATION
53
FEMALE POPULATION
84.91
MALES / 100 FEMALES
117.78
FEMALES / 100 MALES
66.3
MEDIAN AGE
5.1
AVG FAMILY SIZE
1.9
AVG HOUSEHOLD SIZE
36
LABOR FORCE [ PEOPLE ]
40.9%
PERCENT IN LABOR FORCE
16.7%
UNEMPLOYMENT RATE
Prattsville Zip Codes
Prattsville Area Codes
Income in Prattsville
Income Overview in Prattsville
Per Capita Income in Prattsville is $29,384, while median incomes of families and households are $123,750 and $26,354 respectively.
| Characteristic | Number | Measure |
| Per Capita Income | 98 | $29,384 |
| Median Family Income | 10 | $123,750 |
| Mean Family Income | 10 | $112,730 |
| Median Household Income | 53 | $26,354 |
| Mean Household Income | 53 | $43,660 |
| Income Deficit | 10 | $0 |
| Wage / Income Gap (%) | 98 | 0.00% |
| Wage / Income Gap ($) | 98 | 100.00¢ per $1 |
| Gini / Inequality Index | 98 | 0.50 |
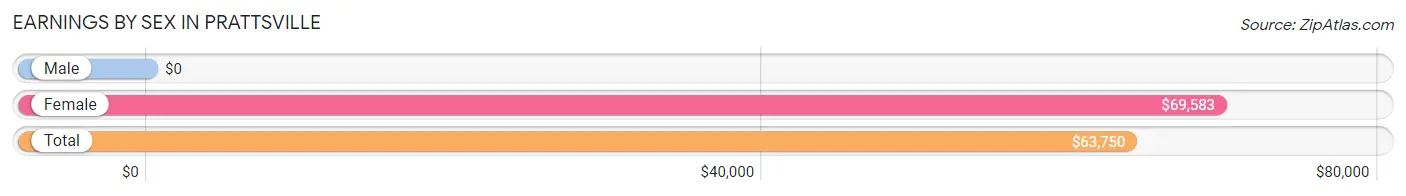
Earnings by Sex in Prattsville
| Sex | Number | Average Earnings |
| Male | 23 (65.7%) | $0 |
| Female | 12 (34.3%) | $69,583 |
| Total | 35 (100.0%) | $63,750 |
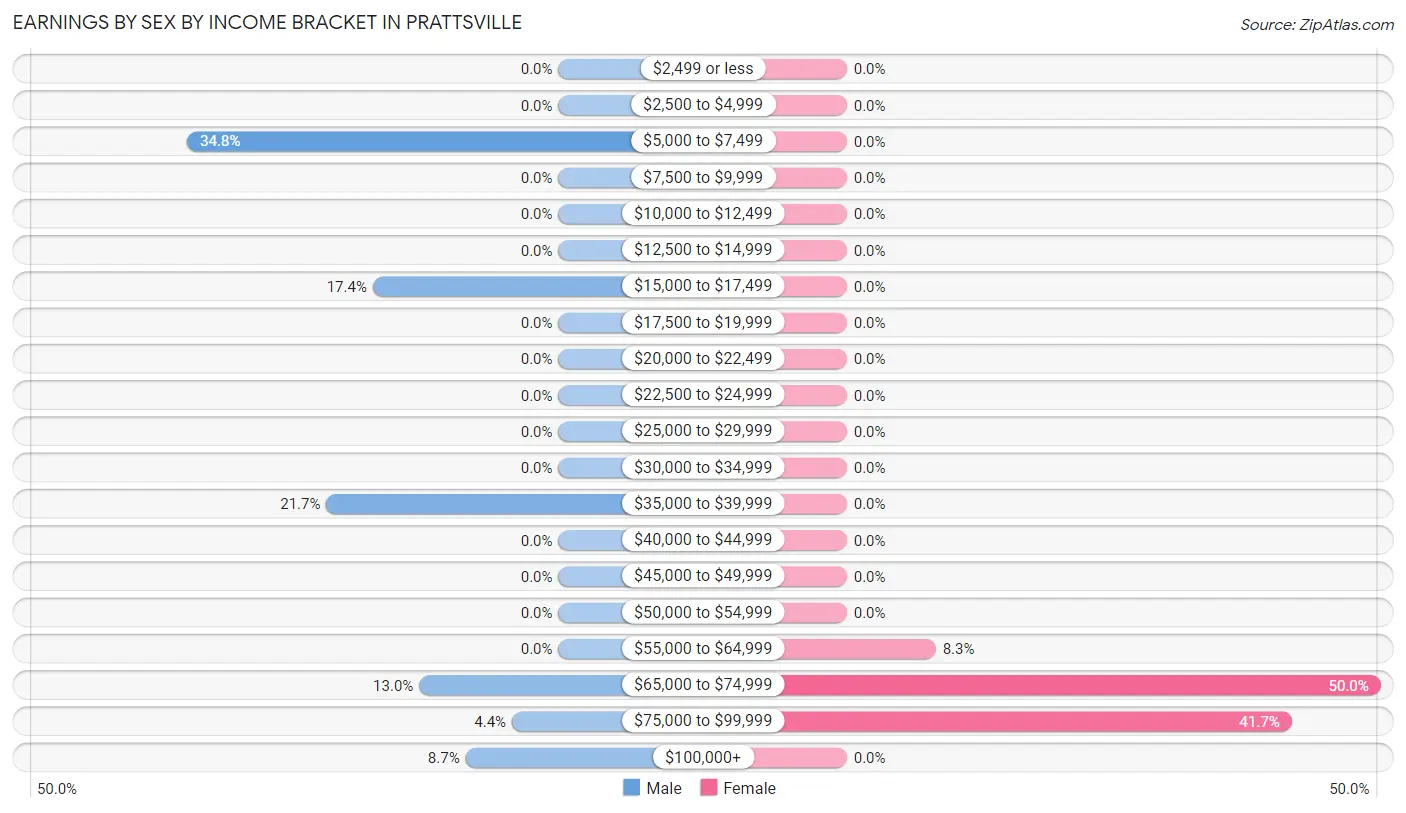
Earnings by Sex by Income Bracket in Prattsville
The most common earnings brackets in Prattsville are $5,000 to $7,499 for men (8 | 34.8%) and $65,000 to $74,999 for women (6 | 50.0%).
| Income | Male | Female |
| $2,499 or less | 0 (0.0%) | 0 (0.0%) |
| $2,500 to $4,999 | 0 (0.0%) | 0 (0.0%) |
| $5,000 to $7,499 | 8 (34.8%) | 0 (0.0%) |
| $7,500 to $9,999 | 0 (0.0%) | 0 (0.0%) |
| $10,000 to $12,499 | 0 (0.0%) | 0 (0.0%) |
| $12,500 to $14,999 | 0 (0.0%) | 0 (0.0%) |
| $15,000 to $17,499 | 4 (17.4%) | 0 (0.0%) |
| $17,500 to $19,999 | 0 (0.0%) | 0 (0.0%) |
| $20,000 to $22,499 | 0 (0.0%) | 0 (0.0%) |
| $22,500 to $24,999 | 0 (0.0%) | 0 (0.0%) |
| $25,000 to $29,999 | 0 (0.0%) | 0 (0.0%) |
| $30,000 to $34,999 | 0 (0.0%) | 0 (0.0%) |
| $35,000 to $39,999 | 5 (21.7%) | 0 (0.0%) |
| $40,000 to $44,999 | 0 (0.0%) | 0 (0.0%) |
| $45,000 to $49,999 | 0 (0.0%) | 0 (0.0%) |
| $50,000 to $54,999 | 0 (0.0%) | 0 (0.0%) |
| $55,000 to $64,999 | 0 (0.0%) | 1 (8.3%) |
| $65,000 to $74,999 | 3 (13.0%) | 6 (50.0%) |
| $75,000 to $99,999 | 1 (4.3%) | 5 (41.7%) |
| $100,000+ | 2 (8.7%) | 0 (0.0%) |
| Total | 23 (100.0%) | 12 (100.0%) |
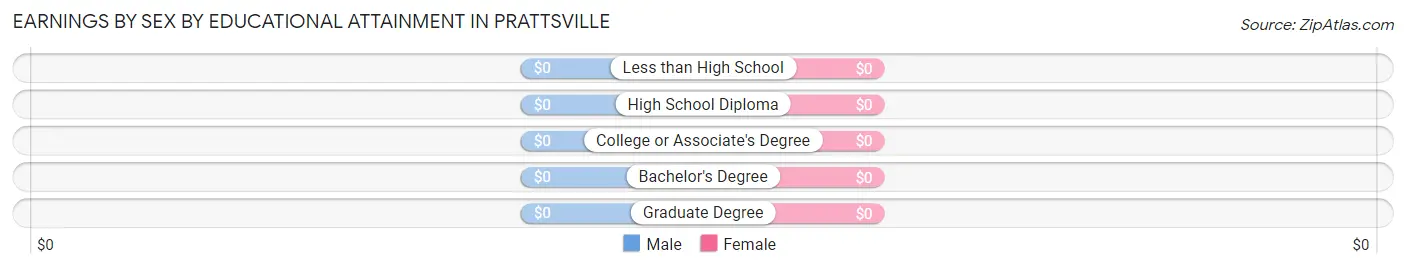
Earnings by Sex by Educational Attainment in Prattsville
| Educational Attainment | Male Income | Female Income |
| Less than High School | - | - |
| High School Diploma | - | - |
| College or Associate's Degree | - | - |
| Bachelor's Degree | - | - |
| Graduate Degree | - | - |
| Total | $35,750 | $69,583 |
Family Income in Prattsville
Family Income Brackets in Prattsville
According to the Prattsville family income data, there are 5 families falling into the $150,000 to $199,999 income range, which is the most common income bracket and makes up 50.0% of all families.
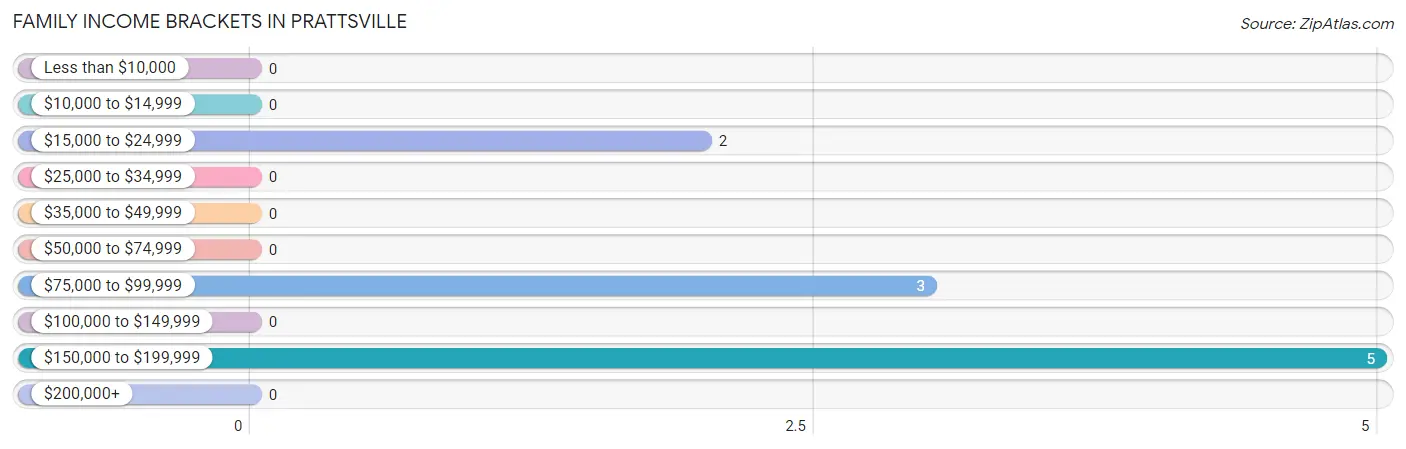
| Income Bracket | # Families | % Families |
| Less than $10,000 | 0 | 0.0% |
| $10,000 to $14,999 | 0 | 0.0% |
| $15,000 to $24,999 | 2 | 20.0% |
| $25,000 to $34,999 | 0 | 0.0% |
| $35,000 to $49,999 | 0 | 0.0% |
| $50,000 to $74,999 | 0 | 0.0% |
| $75,000 to $99,999 | 3 | 30.0% |
| $100,000 to $149,999 | 0 | 0.0% |
| $150,000 to $199,999 | 5 | 50.0% |
| $200,000+ | 0 | 0.0% |
Family Income by Famaliy Size in Prattsville
3-person families (5 | 50.0%) account for the highest median family income in Prattsville with $166,250 per family, while 3-person families (5 | 50.0%) have the highest median income of $55,417 per family member.
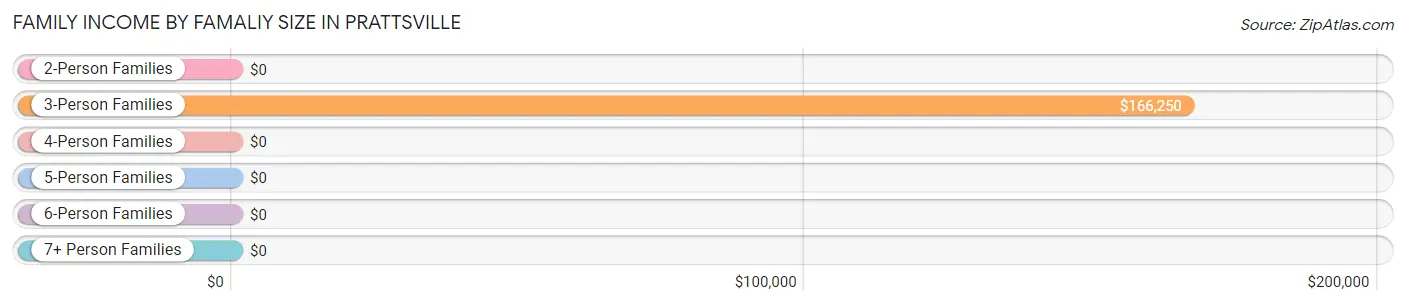
| Income Bracket | # Families | Median Income |
| 2-Person Families | 3 (30.0%) | $0 |
| 3-Person Families | 5 (50.0%) | $166,250 |
| 4-Person Families | 2 (20.0%) | $0 |
| 5-Person Families | 0 (0.0%) | $0 |
| 6-Person Families | 0 (0.0%) | $0 |
| 7+ Person Families | 0 (0.0%) | $0 |
| Total | 10 (100.0%) | $123,750 |
Family Income by Number of Earners in Prattsville
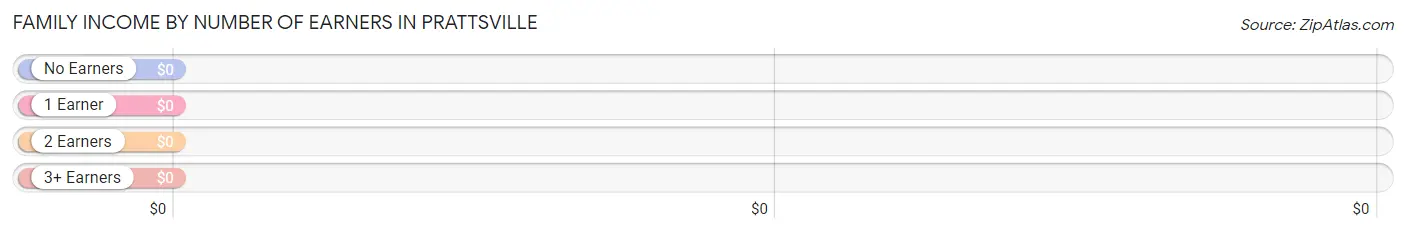
| Number of Earners | # Families | Median Income |
| No Earners | 2 (20.0%) | $0 |
| 1 Earner | 3 (30.0%) | $0 |
| 2 Earners | 4 (40.0%) | $0 |
| 3+ Earners | 1 (10.0%) | $0 |
| Total | 10 (100.0%) | $123,750 |
Household Income in Prattsville
Household Income Brackets in Prattsville
With 14 households falling in the category, the $25,000 to $34,999 income range is the most frequent in Prattsville, accounting for 26.4% of all households.
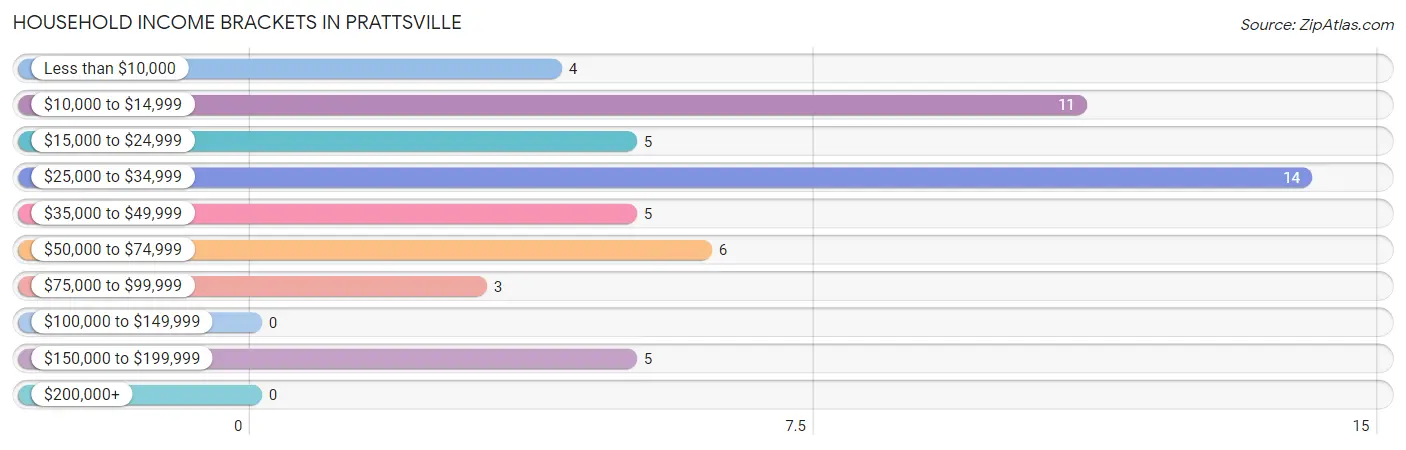
| Income Bracket | # Households | % Households |
| Less than $10,000 | 4 | 7.5% |
| $10,000 to $14,999 | 11 | 20.8% |
| $15,000 to $24,999 | 5 | 9.4% |
| $25,000 to $34,999 | 14 | 26.4% |
| $35,000 to $49,999 | 5 | 9.4% |
| $50,000 to $74,999 | 6 | 11.3% |
| $75,000 to $99,999 | 3 | 5.7% |
| $100,000 to $149,999 | 0 | 0.0% |
| $150,000 to $199,999 | 5 | 9.4% |
| $200,000+ | 0 | 0.0% |
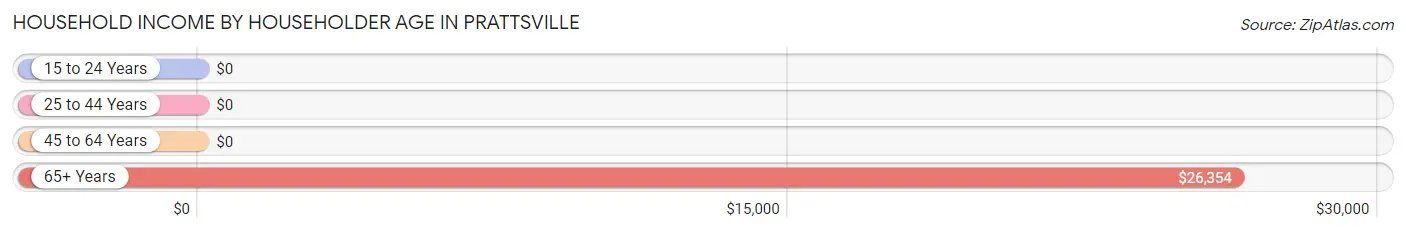
Household Income by Householder Age in Prattsville
The median household income in Prattsville is $26,354, with the highest median household income of $26,354 found in the 65+ years age bracket for the primary householder. A total of 41 households (77.4%) fall into this category.
| Income Bracket | # Households | Median Income |
| 15 to 24 Years | 0 (0.0%) | $0 |
| 25 to 44 Years | 2 (3.8%) | $0 |
| 45 to 64 Years | 10 (18.9%) | $0 |
| 65+ Years | 41 (77.4%) | $26,354 |
| Total | 53 (100.0%) | $26,354 |
Poverty in Prattsville
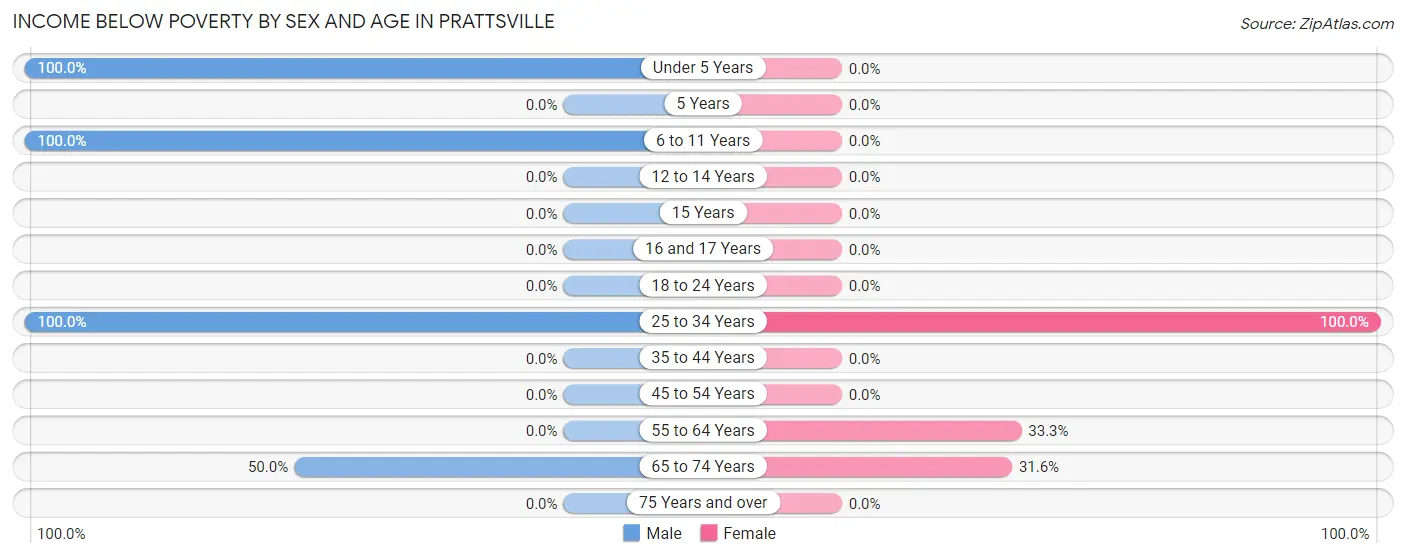
Income Below Poverty by Sex and Age in Prattsville
With 42.2% poverty level for males and 22.6% for females among the residents of Prattsville, under 5 year old males and 25 to 34 year old females are the most vulnerable to poverty, with 4 males (100.0%) and 2 females (100.0%) in their respective age groups living below the poverty level.
| Age Bracket | Male | Female |
| Under 5 Years | 4 (100.0%) | 0 (0.0%) |
| 5 Years | 0 (0.0%) | 0 (0.0%) |
| 6 to 11 Years | 6 (100.0%) | 0 (0.0%) |
| 12 to 14 Years | 0 (0.0%) | 0 (0.0%) |
| 15 Years | 0 (0.0%) | 0 (0.0%) |
| 16 and 17 Years | 0 (0.0%) | 0 (0.0%) |
| 18 to 24 Years | 0 (0.0%) | 0 (0.0%) |
| 25 to 34 Years | 4 (100.0%) | 2 (100.0%) |
| 35 to 44 Years | 0 (0.0%) | 0 (0.0%) |
| 45 to 54 Years | 0 (0.0%) | 0 (0.0%) |
| 55 to 64 Years | 0 (0.0%) | 4 (33.3%) |
| 65 to 74 Years | 5 (50.0%) | 6 (31.6%) |
| 75 Years and over | 0 (0.0%) | 0 (0.0%) |
| Total | 19 (42.2%) | 12 (22.6%) |
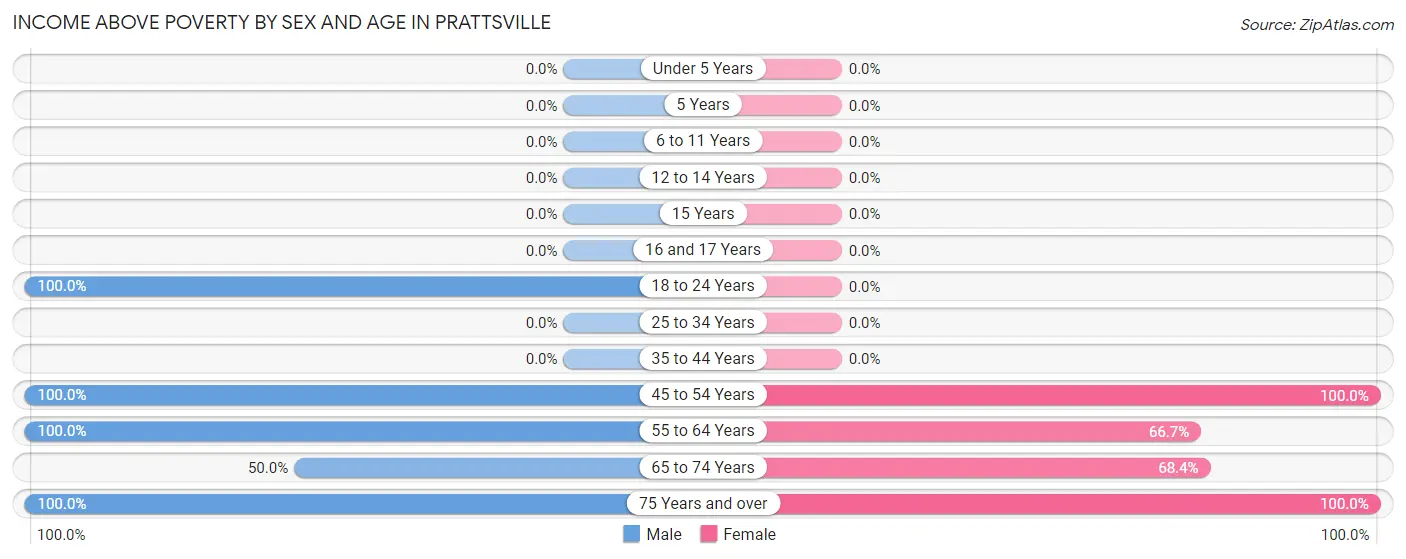
Income Above Poverty by Sex and Age in Prattsville
According to the poverty statistics in Prattsville, males aged 18 to 24 years and females aged 45 to 54 years are the age groups that are most secure financially, with 100.0% of males and 100.0% of females in these age groups living above the poverty line.
| Age Bracket | Male | Female |
| Under 5 Years | 0 (0.0%) | 0 (0.0%) |
| 5 Years | 0 (0.0%) | 0 (0.0%) |
| 6 to 11 Years | 0 (0.0%) | 0 (0.0%) |
| 12 to 14 Years | 0 (0.0%) | 0 (0.0%) |
| 15 Years | 0 (0.0%) | 0 (0.0%) |
| 16 and 17 Years | 0 (0.0%) | 0 (0.0%) |
| 18 to 24 Years | 4 (100.0%) | 0 (0.0%) |
| 25 to 34 Years | 0 (0.0%) | 0 (0.0%) |
| 35 to 44 Years | 0 (0.0%) | 0 (0.0%) |
| 45 to 54 Years | 6 (100.0%) | 1 (100.0%) |
| 55 to 64 Years | 8 (100.0%) | 8 (66.7%) |
| 65 to 74 Years | 5 (50.0%) | 13 (68.4%) |
| 75 Years and over | 3 (100.0%) | 19 (100.0%) |
| Total | 26 (57.8%) | 41 (77.4%) |
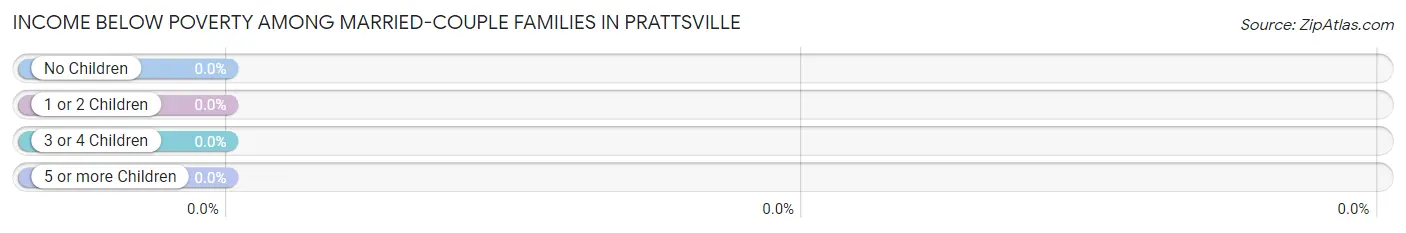
Income Below Poverty Among Married-Couple Families in Prattsville
| Children | Above Poverty | Below Poverty |
| No Children | 4 (100.0%) | 0 (0.0%) |
| 1 or 2 Children | 0 (0.0%) | 0 (0.0%) |
| 3 or 4 Children | 0 (0.0%) | 0 (0.0%) |
| 5 or more Children | 0 (0.0%) | 0 (0.0%) |
| Total | 4 (100.0%) | 0 (0.0%) |
Income Below Poverty Among Single-Parent Households in Prattsville
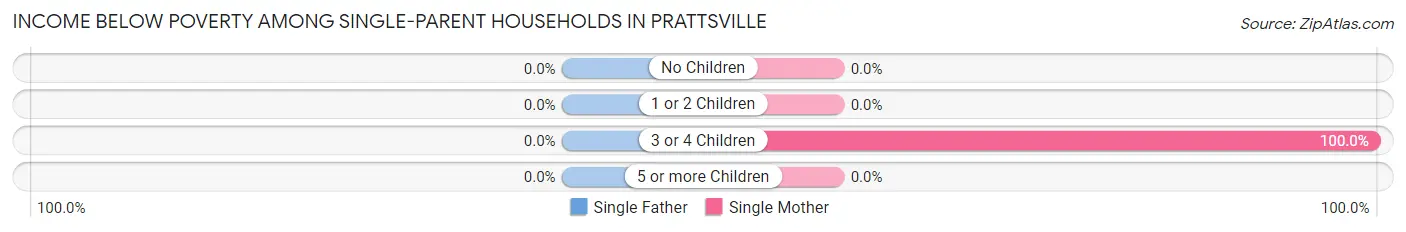
| Children | Single Father | Single Mother |
| No Children | 0 (0.0%) | 0 (0.0%) |
| 1 or 2 Children | 0 (0.0%) | 0 (0.0%) |
| 3 or 4 Children | 0 (0.0%) | 2 (100.0%) |
| 5 or more Children | 0 (0.0%) | 0 (0.0%) |
| Total | 0 (0.0%) | 2 (50.0%) |
Income Below Poverty Among Married-Couple vs Single-Parent Households in Prattsville
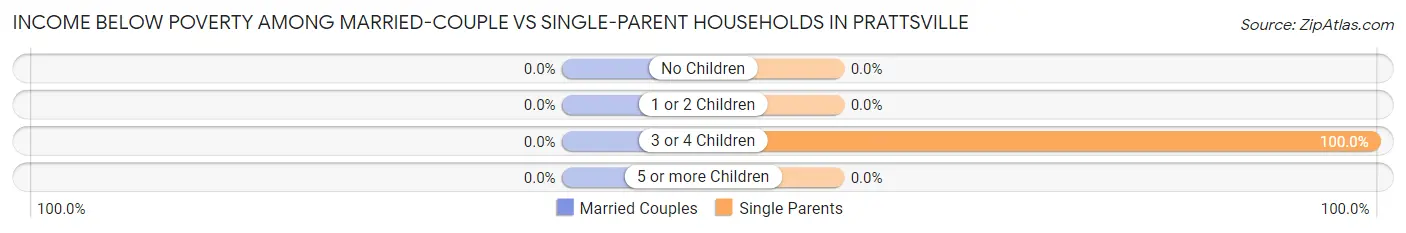
| Children | Married-Couple Families | Single-Parent Households |
| No Children | 0 (0.0%) | 0 (0.0%) |
| 1 or 2 Children | 0 (0.0%) | 0 (0.0%) |
| 3 or 4 Children | 0 (0.0%) | 2 (100.0%) |
| 5 or more Children | 0 (0.0%) | 0 (0.0%) |
| Total | 0 (0.0%) | 2 (33.3%) |
Race in Prattsville
The most populous races in Prattsville are White / Caucasian (87 | 88.8%), and Two or more Races (11 | 11.2%).
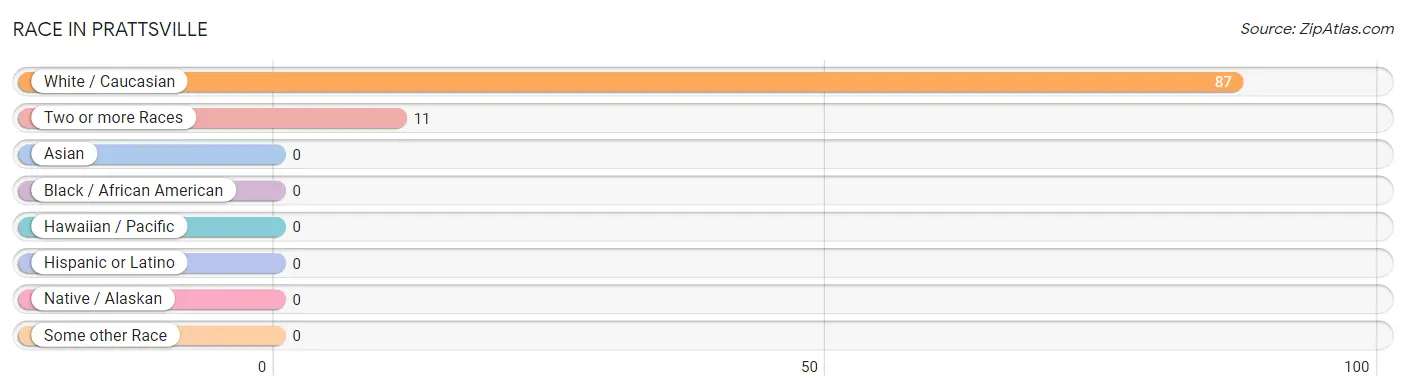
| Race | # Population | % Population |
| Asian | 0 | 0.0% |
| Black / African American | 0 | 0.0% |
| Hawaiian / Pacific | 0 | 0.0% |
| Hispanic or Latino | 0 | 0.0% |
| Native / Alaskan | 0 | 0.0% |
| White / Caucasian | 87 | 88.8% |
| Two or more Races | 11 | 11.2% |
| Some other Race | 0 | 0.0% |
| Total | 98 | 100.0% |
Ancestry in Prattsville
The most populous ancestries reported in Prattsville are German (37 | 37.8%), French (22 | 22.5%), Italian (16 | 16.3%), Dutch (9 | 9.2%), and American (8 | 8.2%), together accounting for 93.9% of all Prattsville residents.
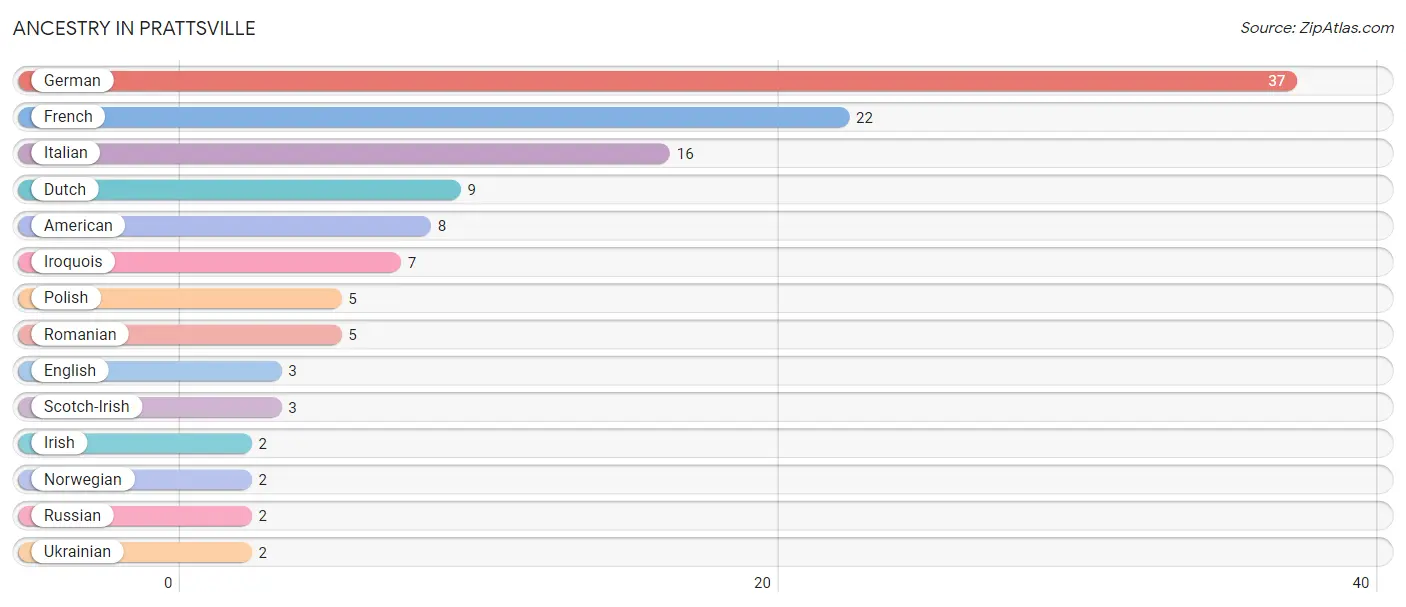
| Ancestry | # Population | % Population |
| American | 8 | 8.2% |
| Dutch | 9 | 9.2% |
| English | 3 | 3.1% |
| French | 22 | 22.5% |
| German | 37 | 37.8% |
| Irish | 2 | 2.0% |
| Iroquois | 7 | 7.1% |
| Italian | 16 | 16.3% |
| Norwegian | 2 | 2.0% |
| Polish | 5 | 5.1% |
| Romanian | 5 | 5.1% |
| Russian | 2 | 2.0% |
| Scotch-Irish | 3 | 3.1% |
| Ukrainian | 2 | 2.0% | View All 14 Rows |
Immigrants in Prattsville
The most numerous immigrant groups reported in Prattsville came from Europe (9 | 9.2%), Eastern Europe (5 | 5.1%), Romania (5 | 5.1%), Germany (4 | 4.1%), and Western Europe (4 | 4.1%), together accounting for 27.5% of all Prattsville residents.
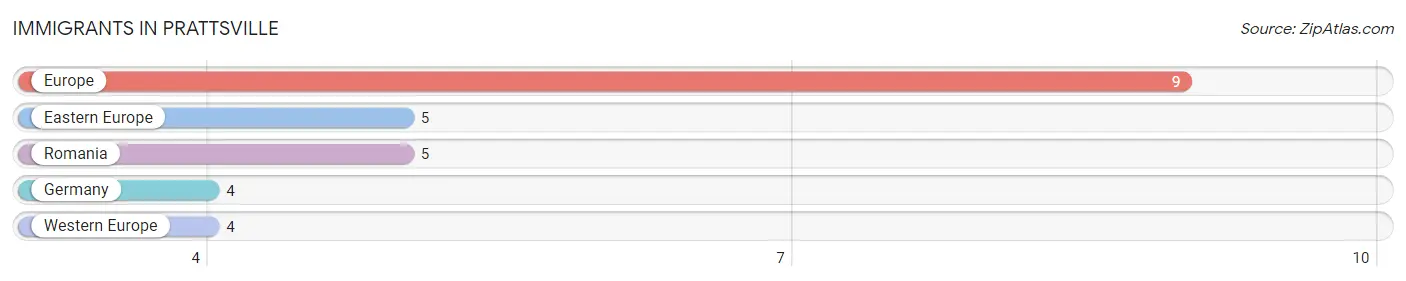
| Immigration Origin | # Population | % Population |
| Eastern Europe | 5 | 5.1% |
| Europe | 9 | 9.2% |
| Germany | 4 | 4.1% |
| Romania | 5 | 5.1% |
| Western Europe | 4 | 4.1% | View All 5 Rows |
Sex and Age in Prattsville
Sex and Age in Prattsville
The most populous age groups in Prattsville are 55 to 59 Years (8 | 17.8%) for men and 85 Years and over (17 | 32.1%) for women.
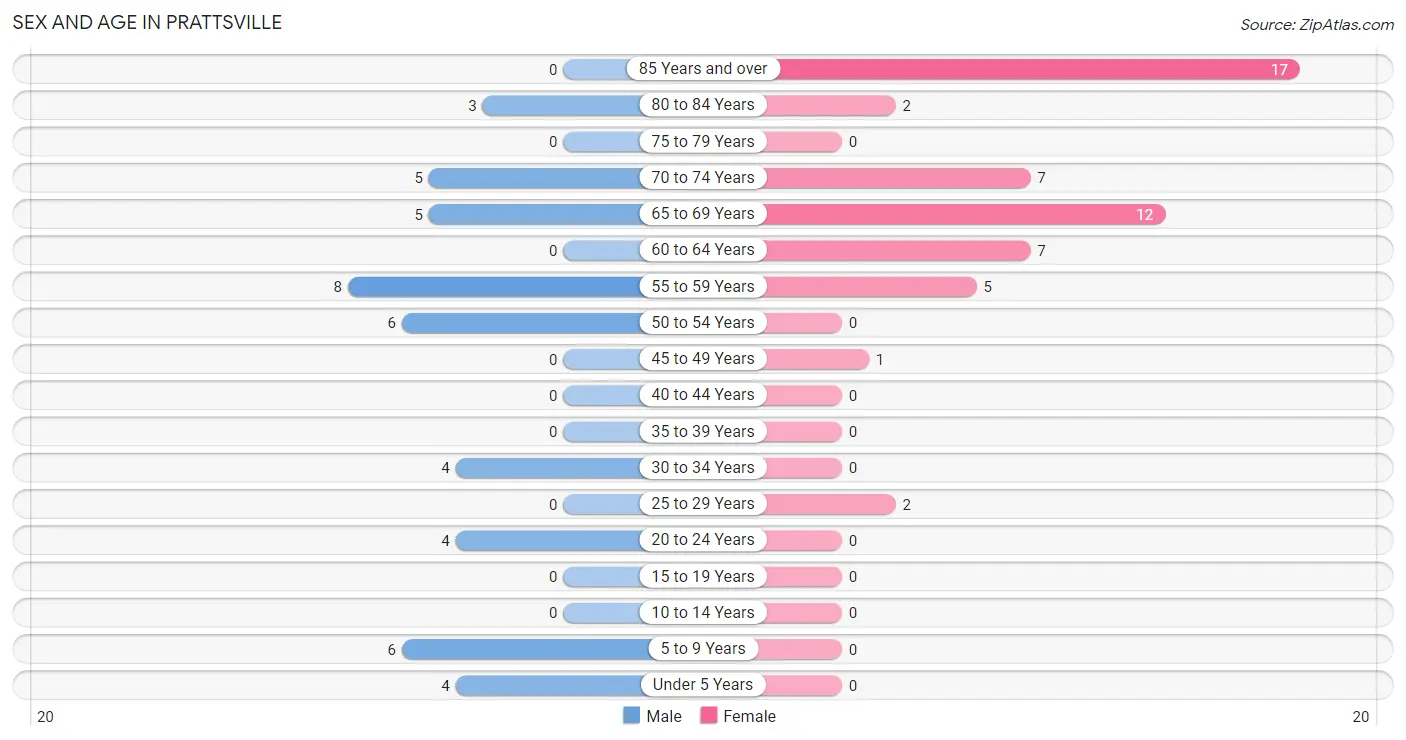
| Age Bracket | Male | Female |
| Under 5 Years | 4 (8.9%) | 0 (0.0%) |
| 5 to 9 Years | 6 (13.3%) | 0 (0.0%) |
| 10 to 14 Years | 0 (0.0%) | 0 (0.0%) |
| 15 to 19 Years | 0 (0.0%) | 0 (0.0%) |
| 20 to 24 Years | 4 (8.9%) | 0 (0.0%) |
| 25 to 29 Years | 0 (0.0%) | 2 (3.8%) |
| 30 to 34 Years | 4 (8.9%) | 0 (0.0%) |
| 35 to 39 Years | 0 (0.0%) | 0 (0.0%) |
| 40 to 44 Years | 0 (0.0%) | 0 (0.0%) |
| 45 to 49 Years | 0 (0.0%) | 1 (1.9%) |
| 50 to 54 Years | 6 (13.3%) | 0 (0.0%) |
| 55 to 59 Years | 8 (17.8%) | 5 (9.4%) |
| 60 to 64 Years | 0 (0.0%) | 7 (13.2%) |
| 65 to 69 Years | 5 (11.1%) | 12 (22.6%) |
| 70 to 74 Years | 5 (11.1%) | 7 (13.2%) |
| 75 to 79 Years | 0 (0.0%) | 0 (0.0%) |
| 80 to 84 Years | 3 (6.7%) | 2 (3.8%) |
| 85 Years and over | 0 (0.0%) | 17 (32.1%) |
| Total | 45 (100.0%) | 53 (100.0%) |
Families and Households in Prattsville
Median Family Size in Prattsville
The median family size in Prattsville is 5.10 persons per family, with single male/father families (2 | 20.0%) accounting for the largest median family size of 7.5 persons per family. On the other hand, married-couple families (4 | 40.0%) represent the smallest median family size with 3.00 persons per family.
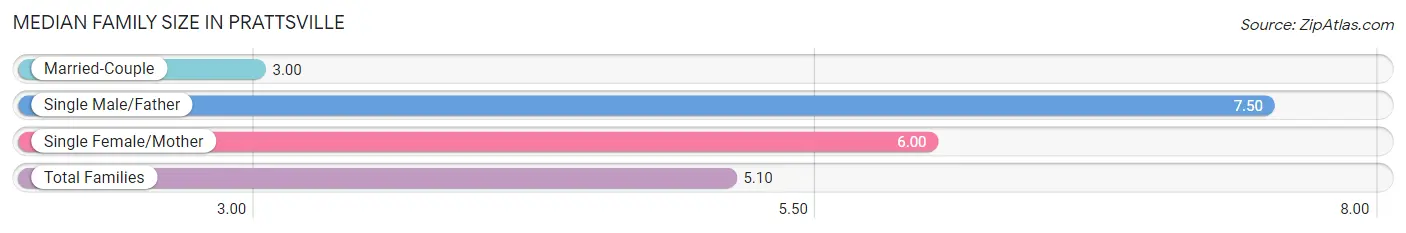
| Family Type | # Families | Family Size |
| Married-Couple | 4 (40.0%) | 3.00 |
| Single Male/Father | 2 (20.0%) | 7.50 |
| Single Female/Mother | 4 (40.0%) | 6.00 |
| Total Families | 10 (100.0%) | 5.10 |
Median Household Size in Prattsville
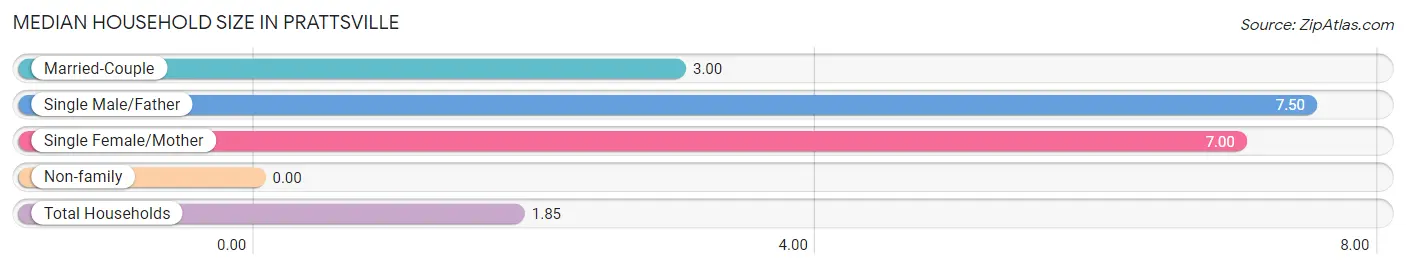
| Household Type | # Households | Household Size |
| Married-Couple | 4 (7.5%) | 3.00 |
| Single Male/Father | 2 (3.8%) | 7.50 |
| Single Female/Mother | 4 (7.5%) | 7.00 |
| Non-family | 43 (81.1%) | - |
| Total Households | 53 (100.0%) | 1.85 |
Household Size by Marriage Status in Prattsville
Out of a total of 53 households in Prattsville, 10 (18.9%) are family households, while 43 (81.1%) are nonfamily households. The most numerous type of family households are 3-person households, comprising 5, and the most common type of nonfamily households are 1-person households, comprising 43.
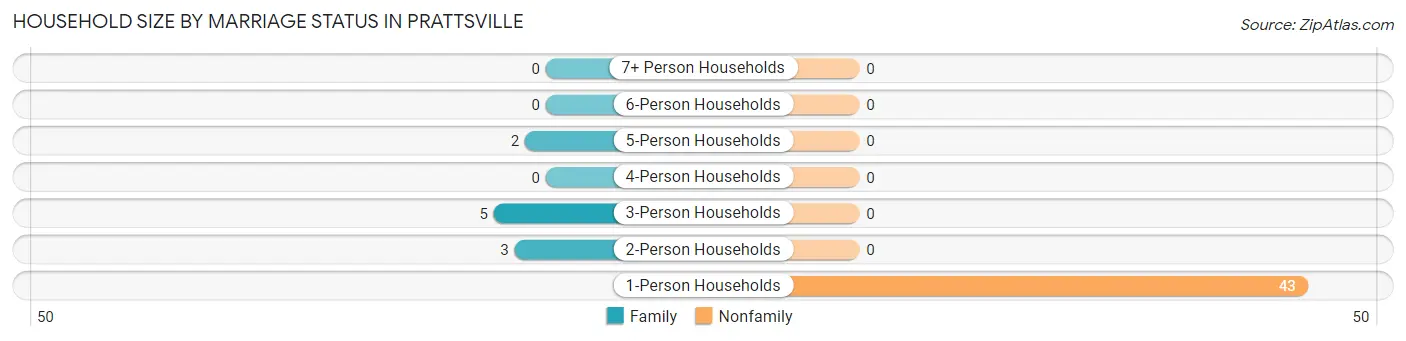
| Household Size | Family Households | Nonfamily Households |
| 1-Person Households | - | 43 (81.1%) |
| 2-Person Households | 3 (5.7%) | 0 (0.0%) |
| 3-Person Households | 5 (9.4%) | 0 (0.0%) |
| 4-Person Households | 0 (0.0%) | 0 (0.0%) |
| 5-Person Households | 2 (3.8%) | 0 (0.0%) |
| 6-Person Households | 0 (0.0%) | 0 (0.0%) |
| 7+ Person Households | 0 (0.0%) | 0 (0.0%) |
| Total | 10 (18.9%) | 43 (81.1%) |
Female Fertility in Prattsville
Fertility by Age in Prattsville
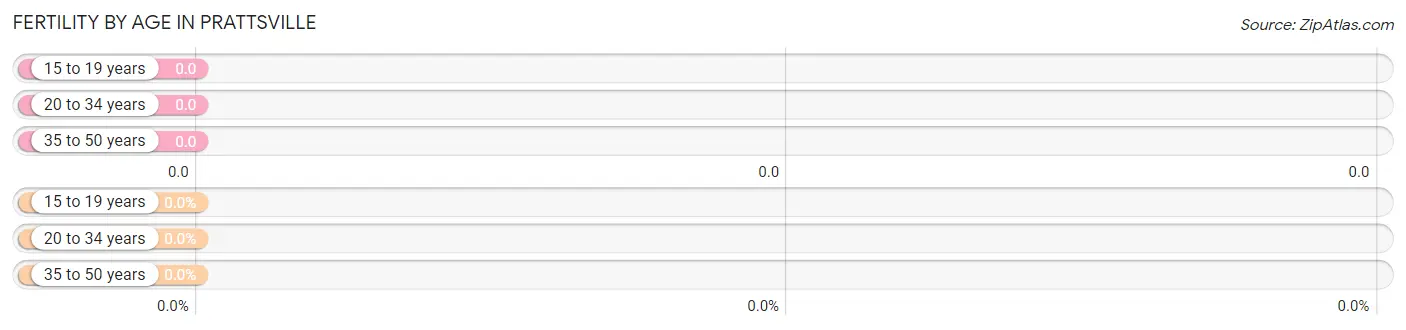
| Age Bracket | Women with Births | Births / 1,000 Women |
| 15 to 19 years | 0 (0.0%) | 0.0 |
| 20 to 34 years | 0 (0.0%) | 0.0 |
| 35 to 50 years | 0 (0.0%) | 0.0 |
| Total | 0 (0.0%) | 0.0 |
Fertility by Age by Marriage Status in Prattsville
| Age Bracket | Married | Unmarried |
| 15 to 19 years | 0 (0.0%) | 0 (0.0%) |
| 20 to 34 years | 0 (0.0%) | 0 (0.0%) |
| 35 to 50 years | 0 (0.0%) | 0 (0.0%) |
| Total | 0 (0.0%) | 0 (0.0%) |
Fertility by Education in Prattsville
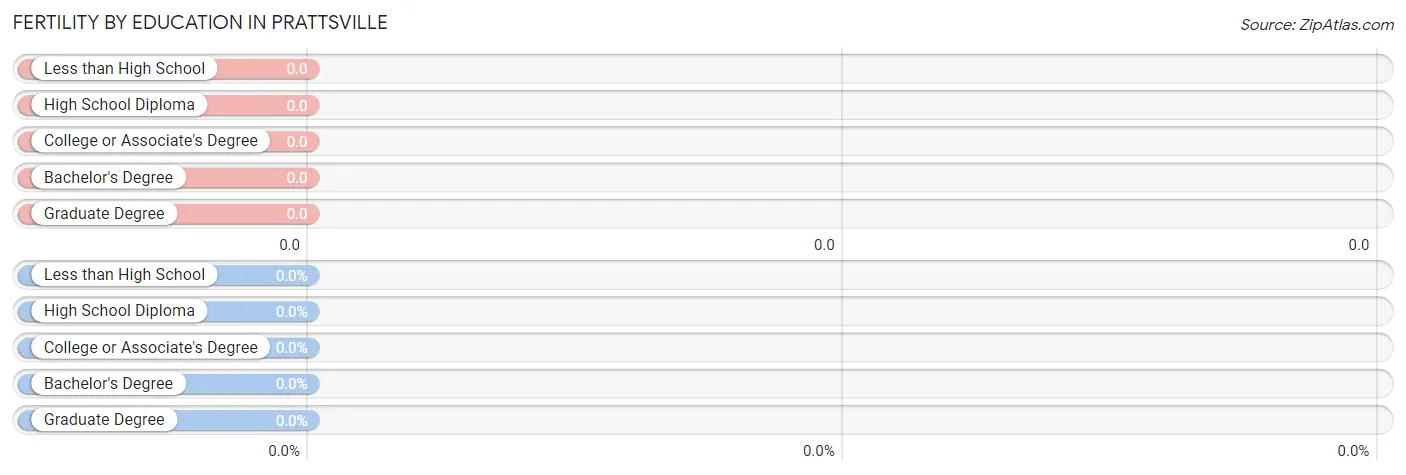
| Educational Attainment | Women with Births | Births / 1,000 Women |
| Less than High School | 0 (0.0%) | 0.0 |
| High School Diploma | 0 (0.0%) | 0.0 |
| College or Associate's Degree | 0 (0.0%) | 0.0 |
| Bachelor's Degree | 0 (0.0%) | 0.0 |
| Graduate Degree | 0 (0.0%) | 0.0 |
| Total | 0 (0.0%) | 0.0 |
Fertility by Education by Marriage Status in Prattsville
| Educational Attainment | Married | Unmarried |
| Less than High School | 0 (0.0%) | 0 (0.0%) |
| High School Diploma | 0 (0.0%) | 0 (0.0%) |
| College or Associate's Degree | 0 (0.0%) | 0 (0.0%) |
| Bachelor's Degree | 0 (0.0%) | 0 (0.0%) |
| Graduate Degree | 0 (0.0%) | 0 (0.0%) |
| Total | 0 (0.0%) | 0 (0.0%) |
Employment Characteristics in Prattsville
Employment by Class of Employer in Prattsville
Among the 30 employed individuals in Prattsville, private company employees (18 | 60.0%), local government employees (6 | 20.0%), and state government employees (6 | 20.0%) make up the most common classes of employment.
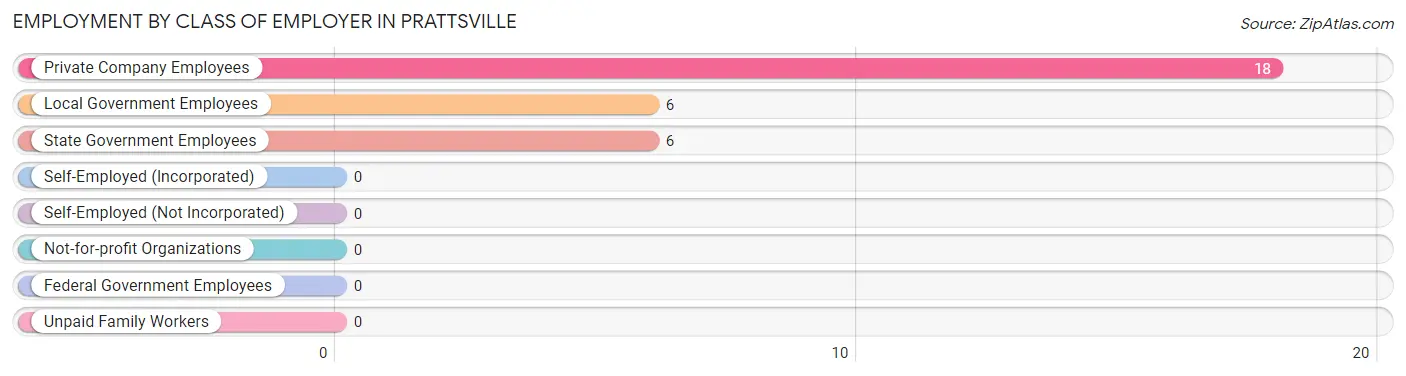
| Employer Class | # Employees | % Employees |
| Private Company Employees | 18 | 60.0% |
| Self-Employed (Incorporated) | 0 | 0.0% |
| Self-Employed (Not Incorporated) | 0 | 0.0% |
| Not-for-profit Organizations | 0 | 0.0% |
| Local Government Employees | 6 | 20.0% |
| State Government Employees | 6 | 20.0% |
| Federal Government Employees | 0 | 0.0% |
| Unpaid Family Workers | 0 | 0.0% |
| Total | 30 | 100.0% |
Employment Status by Age in Prattsville
According to the labor force statistics for Prattsville, out of the total population over 16 years of age (88), 40.9% or 36 individuals are in the labor force, with 16.7% or 6 of them unemployed. The age group with the highest labor force participation rate is 20 to 24 years, with 100.0% or 4 individuals in the labor force. Within the labor force, the 25 to 29 years age range has the highest percentage of unemployed individuals, with 100.0% or 2 of them being unemployed.
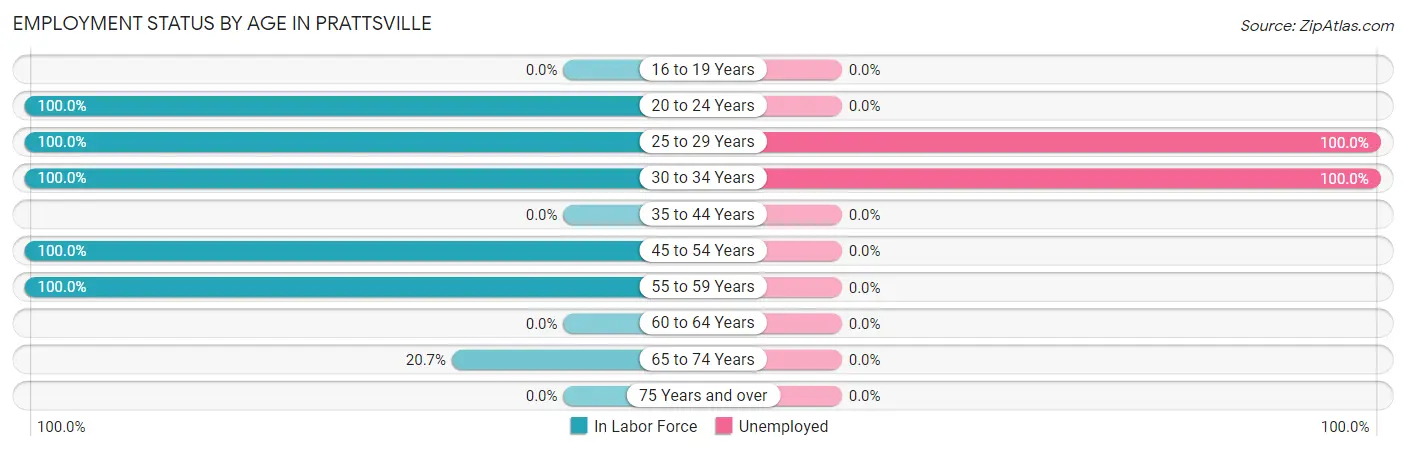
| Age Bracket | In Labor Force | Unemployed |
| 16 to 19 Years | 0 (0.0%) | 0 (0.0%) |
| 20 to 24 Years | 4 (100.0%) | 0 (0.0%) |
| 25 to 29 Years | 2 (100.0%) | 2 (100.0%) |
| 30 to 34 Years | 4 (100.0%) | 4 (100.0%) |
| 35 to 44 Years | 0 (0.0%) | 0 (0.0%) |
| 45 to 54 Years | 7 (100.0%) | 0 (0.0%) |
| 55 to 59 Years | 13 (100.0%) | 0 (0.0%) |
| 60 to 64 Years | 0 (0.0%) | 0 (0.0%) |
| 65 to 74 Years | 6 (20.7%) | 0 (0.0%) |
| 75 Years and over | 0 (0.0%) | 0 (0.0%) |
| Total | 36 (40.9%) | 6 (16.7%) |
Employment Status by Educational Attainment in Prattsville
According to labor force statistics for Prattsville, 78.8% of individuals (26) out of the total population between 25 and 64 years of age (33) are in the labor force, with 23.1% or 6 of them being unemployed. The group with the highest labor force participation rate are those with the educational attainment of less than high school, with 100.0% or 4 individuals in the labor force. Within the labor force, individuals with less than high school education have the highest percentage of unemployment, with 100.0% or 4 of them being unemployed.
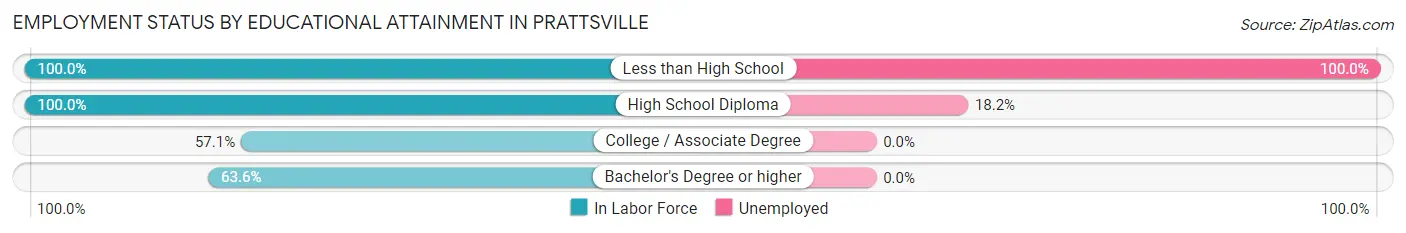
| Educational Attainment | In Labor Force | Unemployed |
| Less than High School | 4 (100.0%) | 4 (100.0%) |
| High School Diploma | 11 (100.0%) | 2 (18.2%) |
| College / Associate Degree | 4 (57.1%) | 0 (0.0%) |
| Bachelor's Degree or higher | 7 (63.6%) | 0 (0.0%) |
| Total | 26 (78.8%) | 8 (23.1%) |
Employment Occupations by Sex in Prattsville
Management, Business, Science and Arts Occupations
The most common Management, Business, Science and Arts occupations in Prattsville are Business & Financial (5 | 16.7%), and Management (2 | 6.7%).
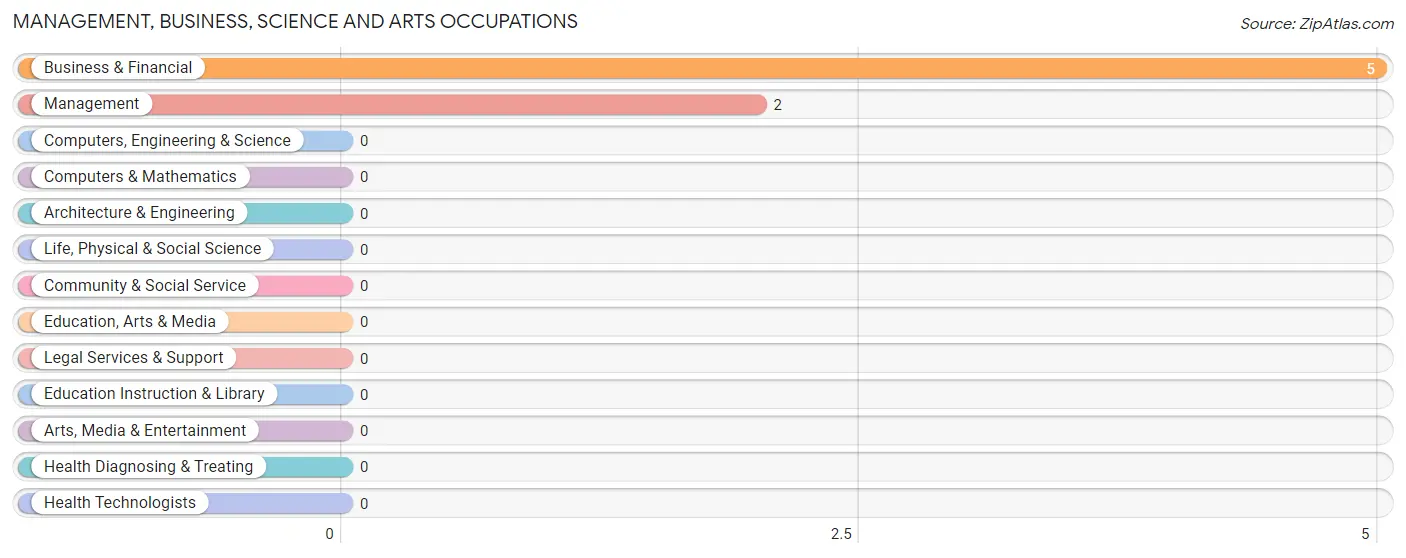
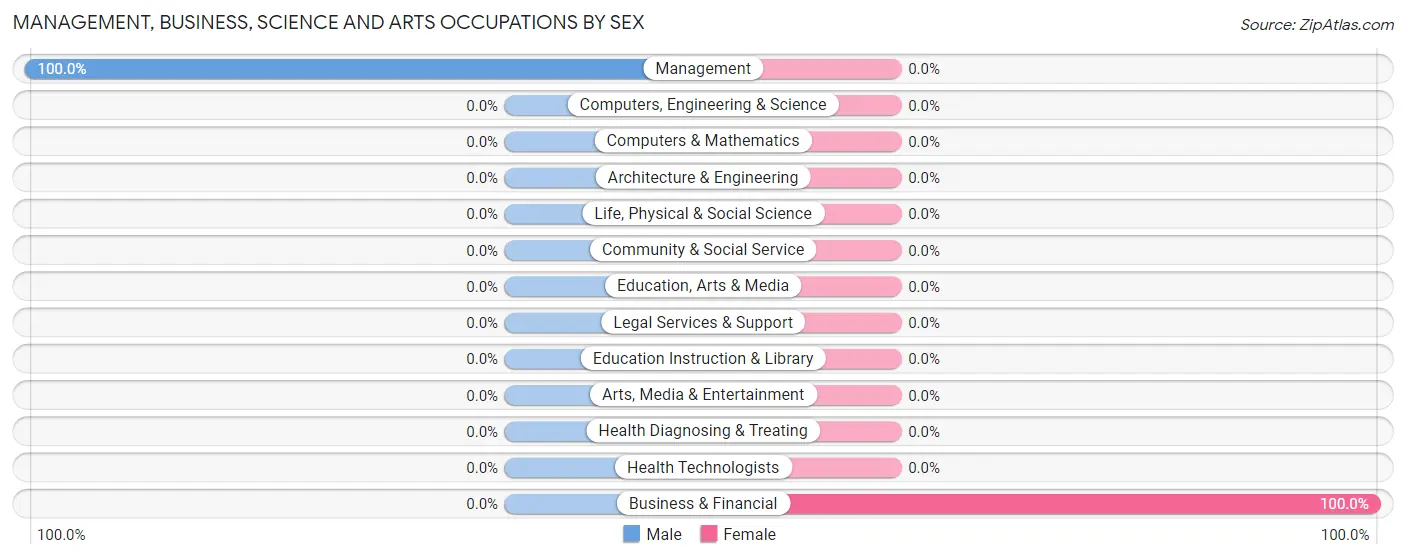
Management, Business, Science and Arts Occupations by Sex
| Occupation | Male | Female |
| Management | 2 (100.0%) | 0 (0.0%) |
| Business & Financial | 0 (0.0%) | 5 (100.0%) |
| Computers, Engineering & Science | 0 (0.0%) | 0 (0.0%) |
| Computers & Mathematics | 0 (0.0%) | 0 (0.0%) |
| Architecture & Engineering | 0 (0.0%) | 0 (0.0%) |
| Life, Physical & Social Science | 0 (0.0%) | 0 (0.0%) |
| Community & Social Service | 0 (0.0%) | 0 (0.0%) |
| Education, Arts & Media | 0 (0.0%) | 0 (0.0%) |
| Legal Services & Support | 0 (0.0%) | 0 (0.0%) |
| Education Instruction & Library | 0 (0.0%) | 0 (0.0%) |
| Arts, Media & Entertainment | 0 (0.0%) | 0 (0.0%) |
| Health Diagnosing & Treating | 0 (0.0%) | 0 (0.0%) |
| Health Technologists | 0 (0.0%) | 0 (0.0%) |
| Total (Category) | 2 (28.6%) | 5 (71.4%) |
| Total (Overall) | 18 (60.0%) | 12 (40.0%) |
Services Occupations
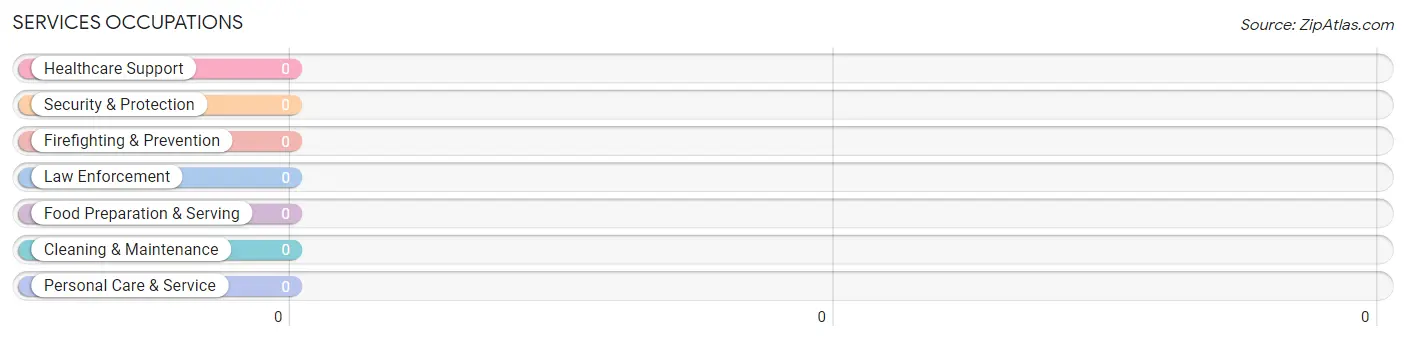
Services Occupations by Sex
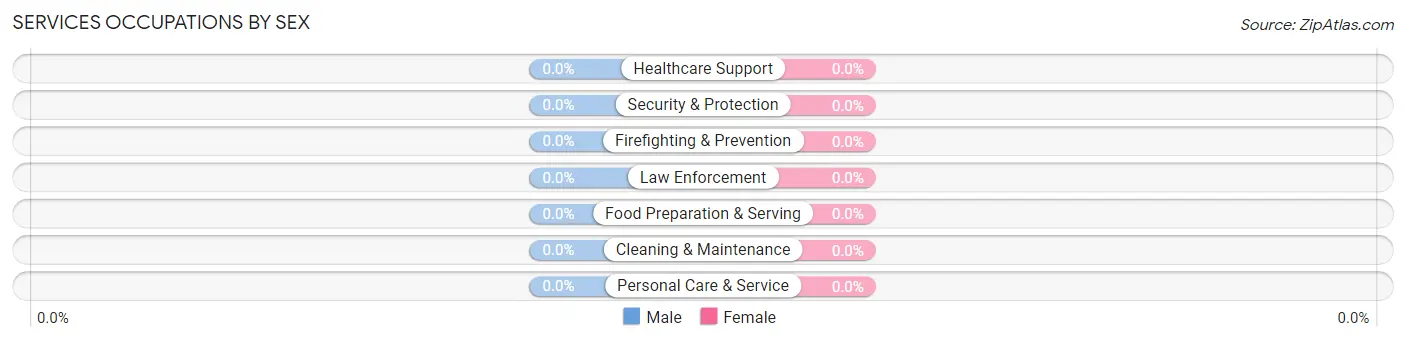
| Occupation | Male | Female |
| Healthcare Support | 0 (0.0%) | 0 (0.0%) |
| Security & Protection | 0 (0.0%) | 0 (0.0%) |
| Firefighting & Prevention | 0 (0.0%) | 0 (0.0%) |
| Law Enforcement | 0 (0.0%) | 0 (0.0%) |
| Food Preparation & Serving | 0 (0.0%) | 0 (0.0%) |
| Cleaning & Maintenance | 0 (0.0%) | 0 (0.0%) |
| Personal Care & Service | 0 (0.0%) | 0 (0.0%) |
| Total (Category) | 0 (0.0%) | 0 (0.0%) |
| Total (Overall) | 18 (60.0%) | 12 (40.0%) |
Sales and Office Occupations
The most common Sales and Office occupations in Prattsville are Office & Administration (15 | 50.0%), and Sales & Related (1 | 3.3%).
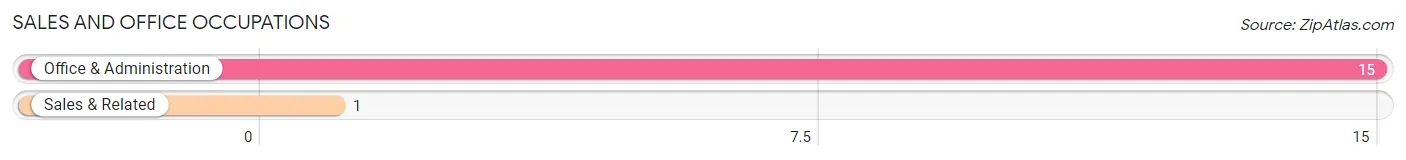
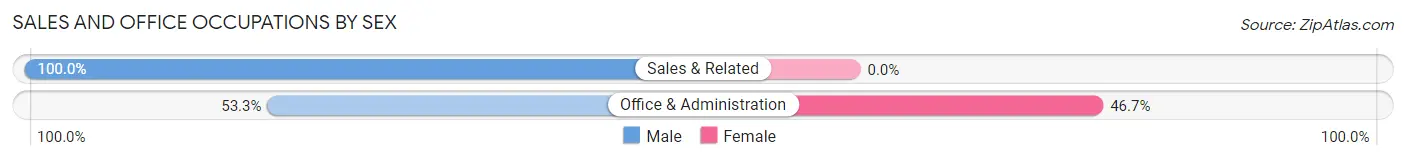
Sales and Office Occupations by Sex
| Occupation | Male | Female |
| Sales & Related | 1 (100.0%) | 0 (0.0%) |
| Office & Administration | 8 (53.3%) | 7 (46.7%) |
| Total (Category) | 9 (56.2%) | 7 (43.8%) |
| Total (Overall) | 18 (60.0%) | 12 (40.0%) |
Natural Resources, Construction and Maintenance Occupations
The most common Natural Resources, Construction and Maintenance occupations in Prattsville are , and Installation, Maintenance & Repair (4 | 13.3%).
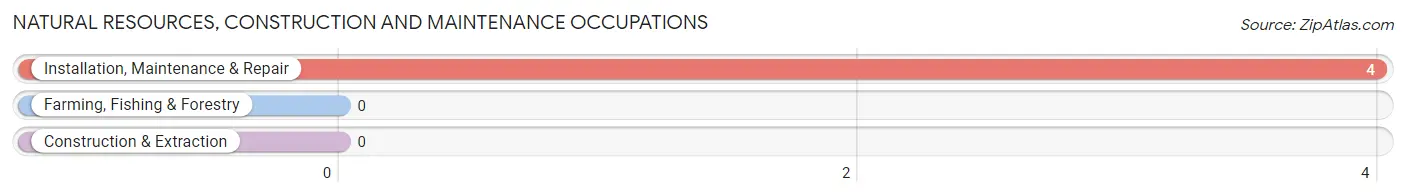
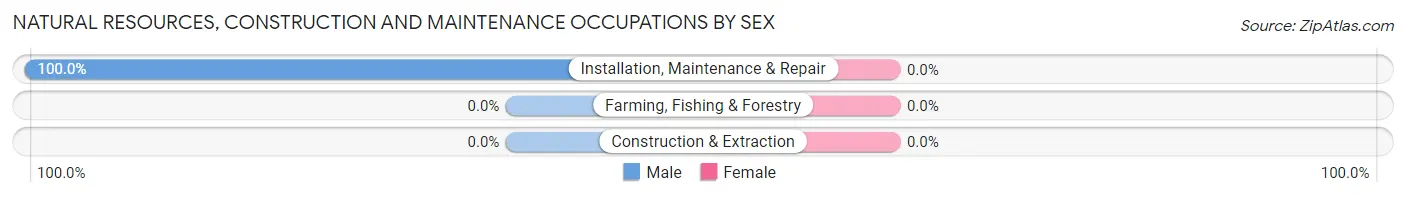
Natural Resources, Construction and Maintenance Occupations by Sex
| Occupation | Male | Female |
| Farming, Fishing & Forestry | 0 (0.0%) | 0 (0.0%) |
| Construction & Extraction | 0 (0.0%) | 0 (0.0%) |
| Installation, Maintenance & Repair | 4 (100.0%) | 0 (0.0%) |
| Total (Category) | 4 (100.0%) | 0 (0.0%) |
| Total (Overall) | 18 (60.0%) | 12 (40.0%) |
Production, Transportation and Moving Occupations
The most common Production, Transportation and Moving occupations in Prattsville are , and Transportation (3 | 10.0%).
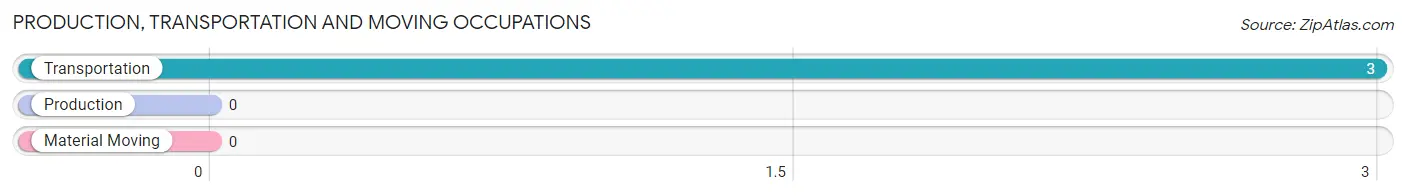
Production, Transportation and Moving Occupations by Sex
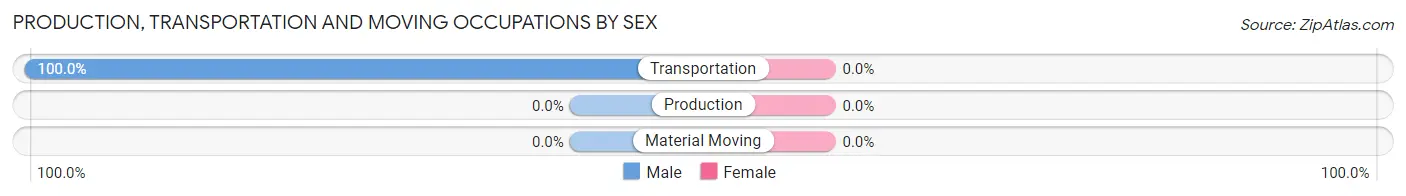
| Occupation | Male | Female |
| Production | 0 (0.0%) | 0 (0.0%) |
| Transportation | 3 (100.0%) | 0 (0.0%) |
| Material Moving | 0 (0.0%) | 0 (0.0%) |
| Total (Category) | 3 (100.0%) | 0 (0.0%) |
| Total (Overall) | 18 (60.0%) | 12 (40.0%) |
Employment Industries by Sex in Prattsville
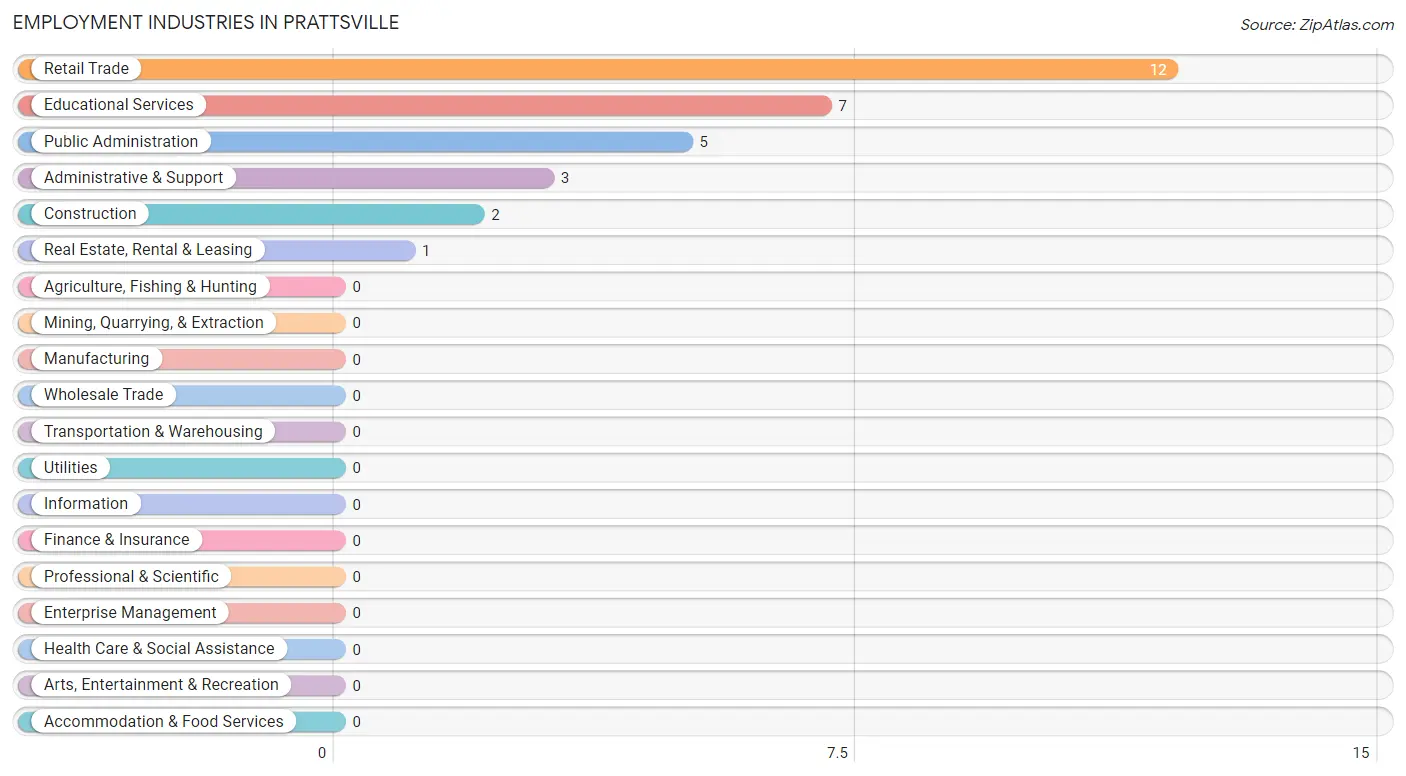
Employment Industries in Prattsville
The major employment industries in Prattsville include Retail Trade (12 | 40.0%), Educational Services (7 | 23.3%), Public Administration (5 | 16.7%), Administrative & Support (3 | 10.0%), and Construction (2 | 6.7%).
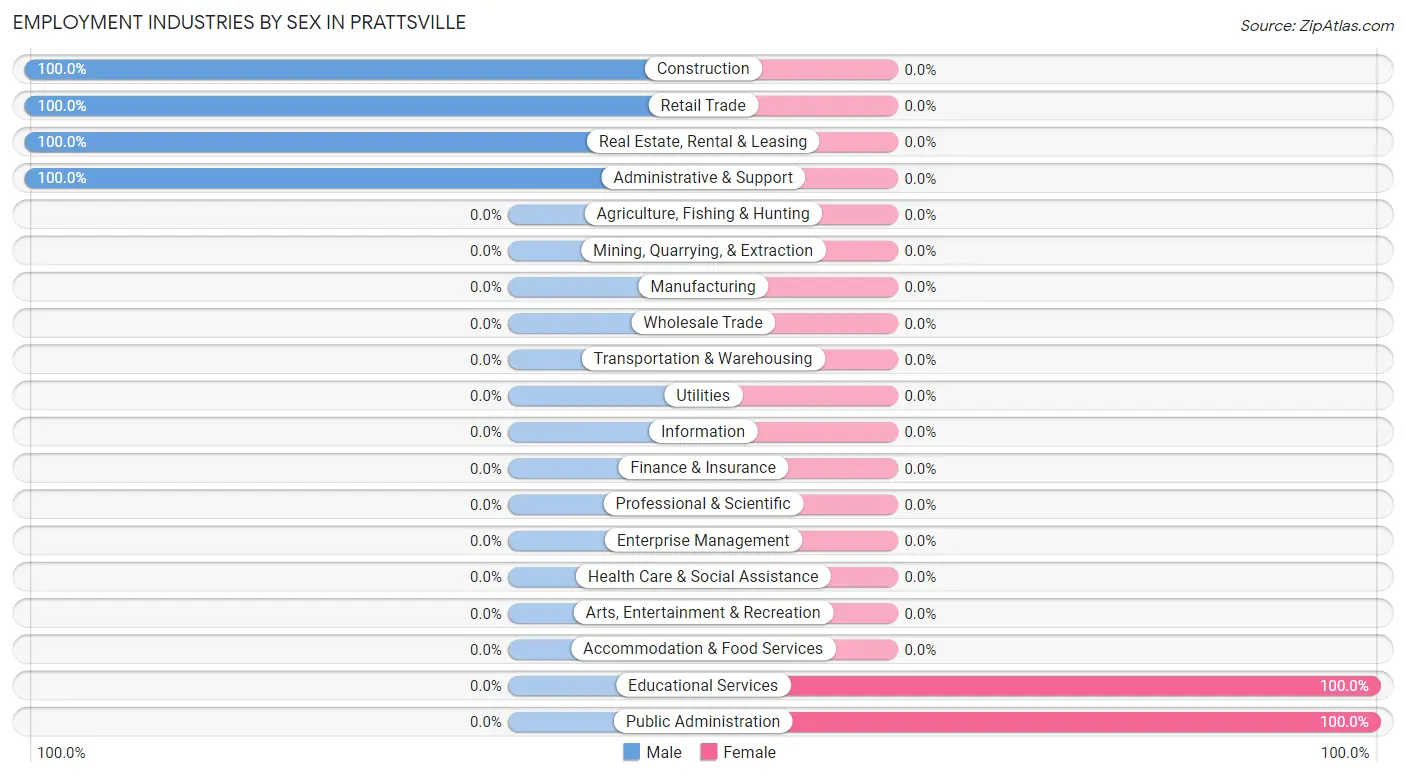
Employment Industries by Sex in Prattsville
The Prattsville industries that see more men than women are Construction (100.0%), Retail Trade (100.0%), and Real Estate, Rental & Leasing (100.0%), whereas the industries that tend to have a higher number of women are Educational Services (100.0%), and Public Administration (100.0%).
| Industry | Male | Female |
| Agriculture, Fishing & Hunting | 0 (0.0%) | 0 (0.0%) |
| Mining, Quarrying, & Extraction | 0 (0.0%) | 0 (0.0%) |
| Construction | 2 (100.0%) | 0 (0.0%) |
| Manufacturing | 0 (0.0%) | 0 (0.0%) |
| Wholesale Trade | 0 (0.0%) | 0 (0.0%) |
| Retail Trade | 12 (100.0%) | 0 (0.0%) |
| Transportation & Warehousing | 0 (0.0%) | 0 (0.0%) |
| Utilities | 0 (0.0%) | 0 (0.0%) |
| Information | 0 (0.0%) | 0 (0.0%) |
| Finance & Insurance | 0 (0.0%) | 0 (0.0%) |
| Real Estate, Rental & Leasing | 1 (100.0%) | 0 (0.0%) |
| Professional & Scientific | 0 (0.0%) | 0 (0.0%) |
| Enterprise Management | 0 (0.0%) | 0 (0.0%) |
| Administrative & Support | 3 (100.0%) | 0 (0.0%) |
| Educational Services | 0 (0.0%) | 7 (100.0%) |
| Health Care & Social Assistance | 0 (0.0%) | 0 (0.0%) |
| Arts, Entertainment & Recreation | 0 (0.0%) | 0 (0.0%) |
| Accommodation & Food Services | 0 (0.0%) | 0 (0.0%) |
| Public Administration | 0 (0.0%) | 5 (100.0%) |
| Total | 18 (60.0%) | 12 (40.0%) |
Education in Prattsville
School Enrollment in Prattsville
The most common levels of schooling among the 6 students in Prattsville are kindergarten (3 | 50.0%), and elementary school (3 | 50.0%).
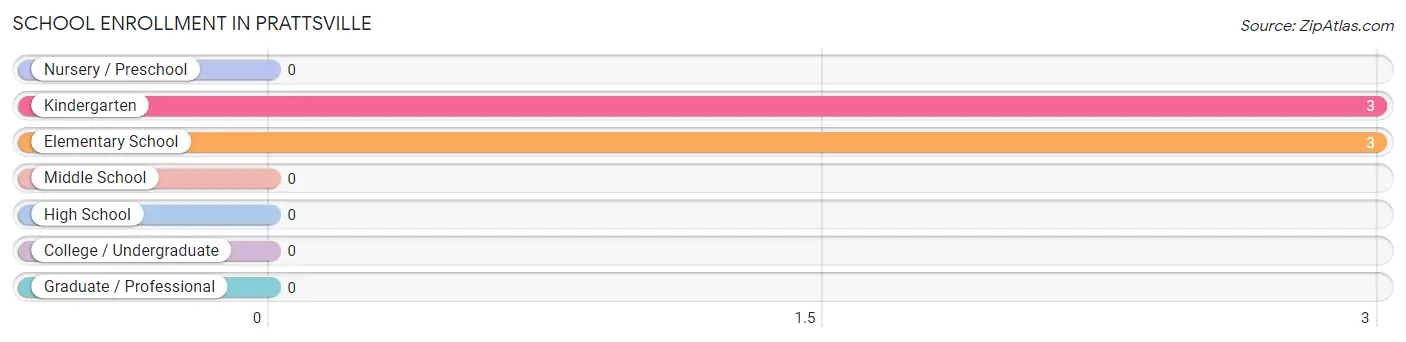
| School Level | # Students | % Students |
| Nursery / Preschool | 0 | 0.0% |
| Kindergarten | 3 | 50.0% |
| Elementary School | 3 | 50.0% |
| Middle School | 0 | 0.0% |
| High School | 0 | 0.0% |
| College / Undergraduate | 0 | 0.0% |
| Graduate / Professional | 0 | 0.0% |
| Total | 6 | 100.0% |
School Enrollment by Age by Funding Source in Prattsville
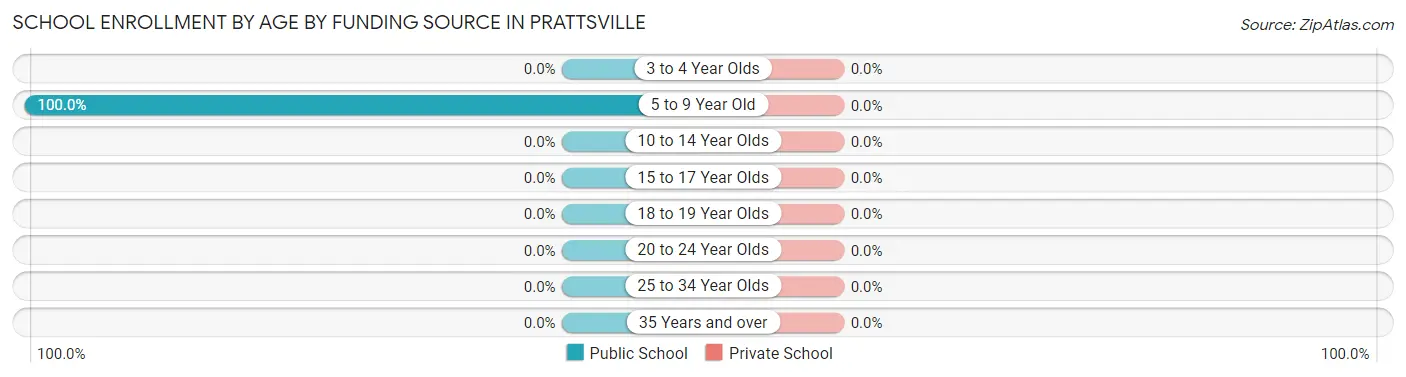
| Age Bracket | Public School | Private School |
| 3 to 4 Year Olds | 0 (0.0%) | 0 (0.0%) |
| 5 to 9 Year Old | 6 (100.0%) | 0 (0.0%) |
| 10 to 14 Year Olds | 0 (0.0%) | 0 (0.0%) |
| 15 to 17 Year Olds | 0 (0.0%) | 0 (0.0%) |
| 18 to 19 Year Olds | 0 (0.0%) | 0 (0.0%) |
| 20 to 24 Year Olds | 0 (0.0%) | 0 (0.0%) |
| 25 to 34 Year Olds | 0 (0.0%) | 0 (0.0%) |
| 35 Years and over | 0 (0.0%) | 0 (0.0%) |
| Total | 6 (100.0%) | 0 (0.0%) |
Educational Attainment by Field of Study in Prattsville
Business (5 | 27.8%), visual & performing arts (5 | 27.8%), arts & humanities (4 | 22.2%), social sciences (2 | 11.1%), and engineering (2 | 11.1%) are the most common fields of study among 18 individuals in Prattsville who have obtained a bachelor's degree or higher.
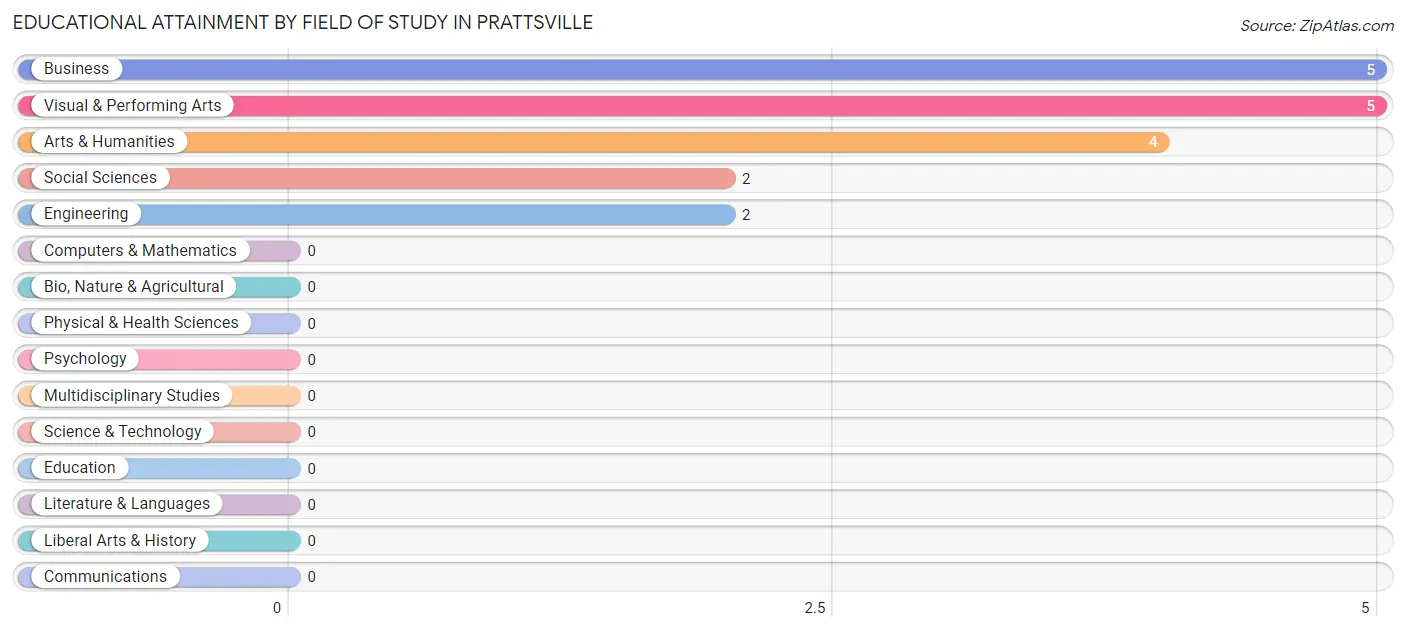
| Field of Study | # Graduates | % Graduates |
| Computers & Mathematics | 0 | 0.0% |
| Bio, Nature & Agricultural | 0 | 0.0% |
| Physical & Health Sciences | 0 | 0.0% |
| Psychology | 0 | 0.0% |
| Social Sciences | 2 | 11.1% |
| Engineering | 2 | 11.1% |
| Multidisciplinary Studies | 0 | 0.0% |
| Science & Technology | 0 | 0.0% |
| Business | 5 | 27.8% |
| Education | 0 | 0.0% |
| Literature & Languages | 0 | 0.0% |
| Liberal Arts & History | 0 | 0.0% |
| Visual & Performing Arts | 5 | 27.8% |
| Communications | 0 | 0.0% |
| Arts & Humanities | 4 | 22.2% |
| Total | 18 | 100.0% |
Transportation & Commute in Prattsville
Vehicle Availability by Sex in Prattsville
The most prevalent vehicle ownership categories in Prattsville are males with 2 vehicles (13, accounting for 72.2%) and females with 2 vehicles (0, making up 108.3%).
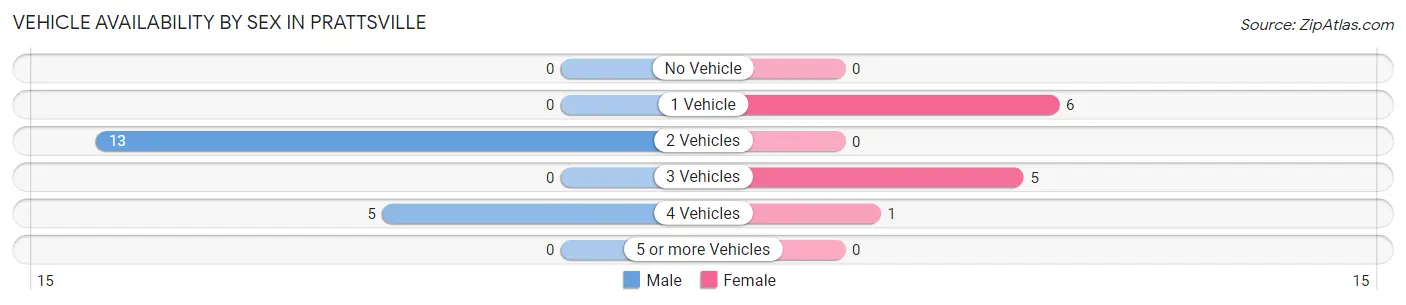
| Vehicles Available | Male | Female |
| No Vehicle | 0 (0.0%) | 0 (0.0%) |
| 1 Vehicle | 0 (0.0%) | 6 (50.0%) |
| 2 Vehicles | 13 (72.2%) | 0 (0.0%) |
| 3 Vehicles | 0 (0.0%) | 5 (41.7%) |
| 4 Vehicles | 5 (27.8%) | 1 (8.3%) |
| 5 or more Vehicles | 0 (0.0%) | 0 (0.0%) |
| Total | 18 (100.0%) | 12 (100.0%) |
Commute Time in Prattsville
The most frequently occuring commute durations in Prattsville are 60 to 89 minutes (12 commuters, 40.0%), 15 to 19 minutes (9 commuters, 30.0%), and 40 to 44 minutes (7 commuters, 23.3%).
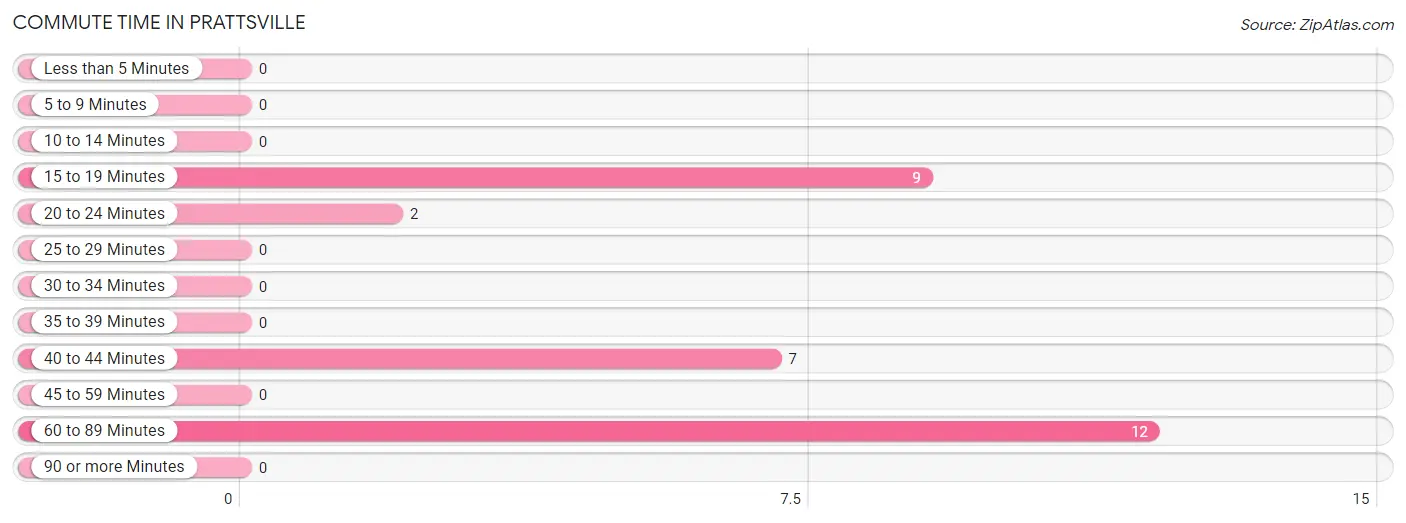
| Commute Time | # Commuters | % Commuters |
| Less than 5 Minutes | 0 | 0.0% |
| 5 to 9 Minutes | 0 | 0.0% |
| 10 to 14 Minutes | 0 | 0.0% |
| 15 to 19 Minutes | 9 | 30.0% |
| 20 to 24 Minutes | 2 | 6.7% |
| 25 to 29 Minutes | 0 | 0.0% |
| 30 to 34 Minutes | 0 | 0.0% |
| 35 to 39 Minutes | 0 | 0.0% |
| 40 to 44 Minutes | 7 | 23.3% |
| 45 to 59 Minutes | 0 | 0.0% |
| 60 to 89 Minutes | 12 | 40.0% |
| 90 or more Minutes | 0 | 0.0% |
Commute Time by Sex in Prattsville
The most common commute times in Prattsville are 15 to 19 minutes (9 commuters, 50.0%) for males and 60 to 89 minutes (12 commuters, 100.0%) for females.
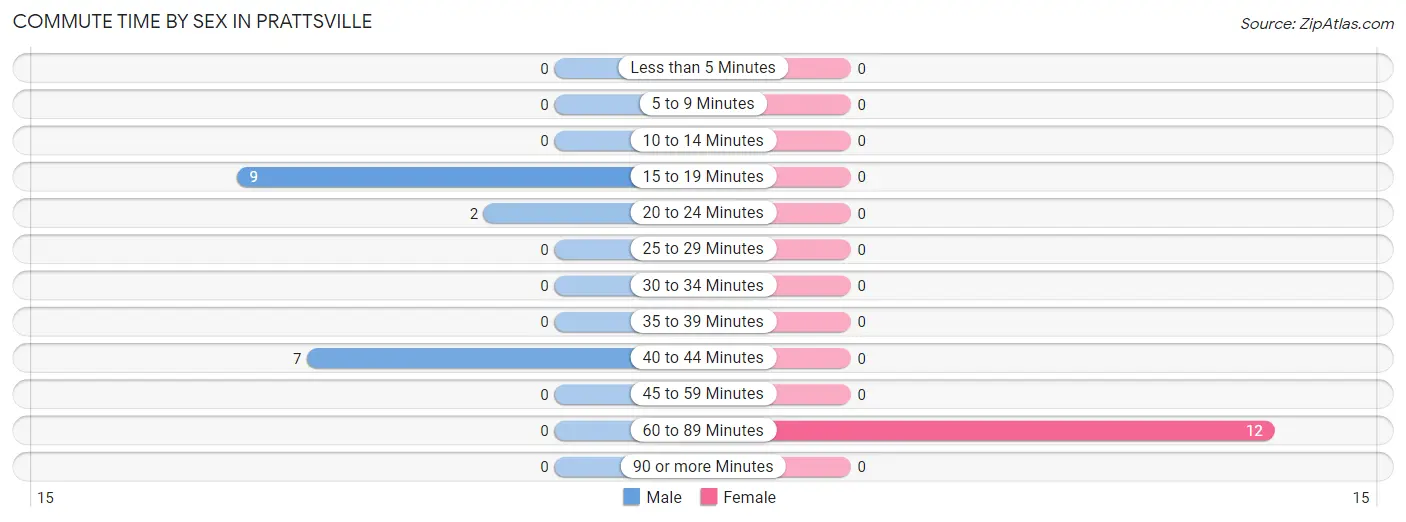
| Commute Time | Male | Female |
| Less than 5 Minutes | 0 (0.0%) | 0 (0.0%) |
| 5 to 9 Minutes | 0 (0.0%) | 0 (0.0%) |
| 10 to 14 Minutes | 0 (0.0%) | 0 (0.0%) |
| 15 to 19 Minutes | 9 (50.0%) | 0 (0.0%) |
| 20 to 24 Minutes | 2 (11.1%) | 0 (0.0%) |
| 25 to 29 Minutes | 0 (0.0%) | 0 (0.0%) |
| 30 to 34 Minutes | 0 (0.0%) | 0 (0.0%) |
| 35 to 39 Minutes | 0 (0.0%) | 0 (0.0%) |
| 40 to 44 Minutes | 7 (38.9%) | 0 (0.0%) |
| 45 to 59 Minutes | 0 (0.0%) | 0 (0.0%) |
| 60 to 89 Minutes | 0 (0.0%) | 12 (100.0%) |
| 90 or more Minutes | 0 (0.0%) | 0 (0.0%) |
Time of Departure to Work by Sex in Prattsville
The most frequent times of departure to work in Prattsville are 7:00 AM to 7:29 AM (12, 66.7%) for males and 5:30 AM to 5:59 AM (11, 91.7%) for females.
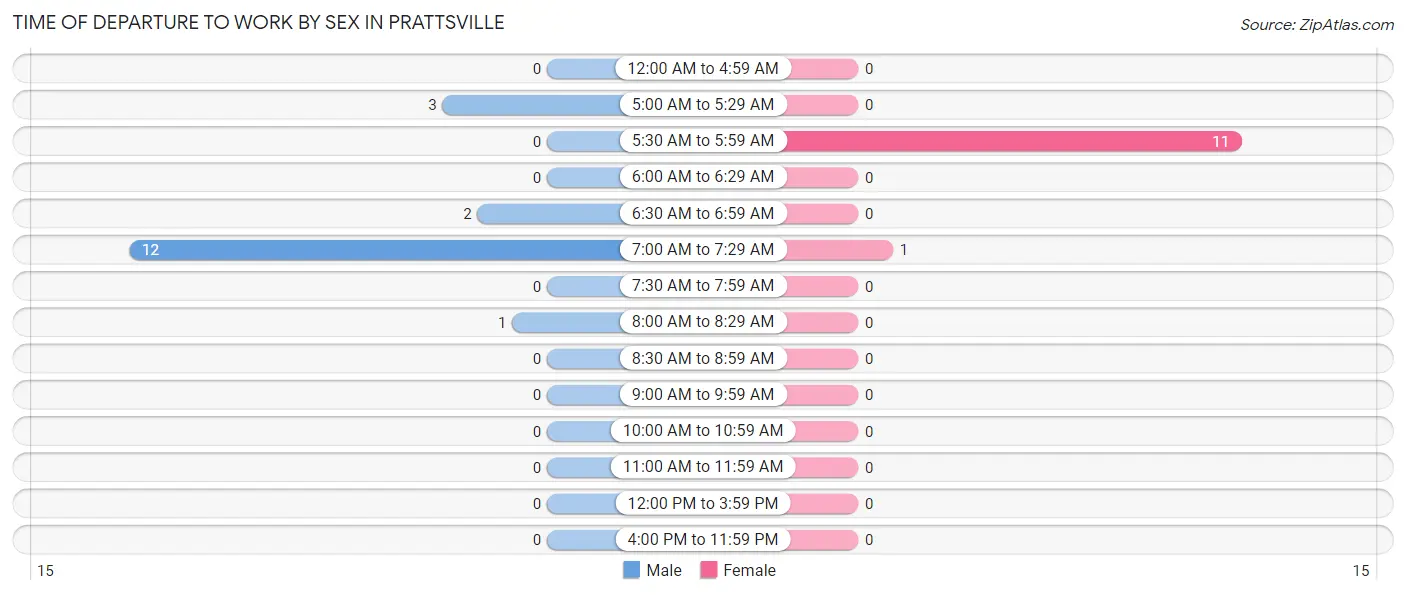
| Time of Departure | Male | Female |
| 12:00 AM to 4:59 AM | 0 (0.0%) | 0 (0.0%) |
| 5:00 AM to 5:29 AM | 3 (16.7%) | 0 (0.0%) |
| 5:30 AM to 5:59 AM | 0 (0.0%) | 11 (91.7%) |
| 6:00 AM to 6:29 AM | 0 (0.0%) | 0 (0.0%) |
| 6:30 AM to 6:59 AM | 2 (11.1%) | 0 (0.0%) |
| 7:00 AM to 7:29 AM | 12 (66.7%) | 1 (8.3%) |
| 7:30 AM to 7:59 AM | 0 (0.0%) | 0 (0.0%) |
| 8:00 AM to 8:29 AM | 1 (5.6%) | 0 (0.0%) |
| 8:30 AM to 8:59 AM | 0 (0.0%) | 0 (0.0%) |
| 9:00 AM to 9:59 AM | 0 (0.0%) | 0 (0.0%) |
| 10:00 AM to 10:59 AM | 0 (0.0%) | 0 (0.0%) |
| 11:00 AM to 11:59 AM | 0 (0.0%) | 0 (0.0%) |
| 12:00 PM to 3:59 PM | 0 (0.0%) | 0 (0.0%) |
| 4:00 PM to 11:59 PM | 0 (0.0%) | 0 (0.0%) |
| Total | 18 (100.0%) | 12 (100.0%) |
Housing Occupancy in Prattsville
Occupancy by Ownership in Prattsville
Of the total 53 dwellings in Prattsville, owner-occupied units account for 18 (34.0%), while renter-occupied units make up 35 (66.0%).
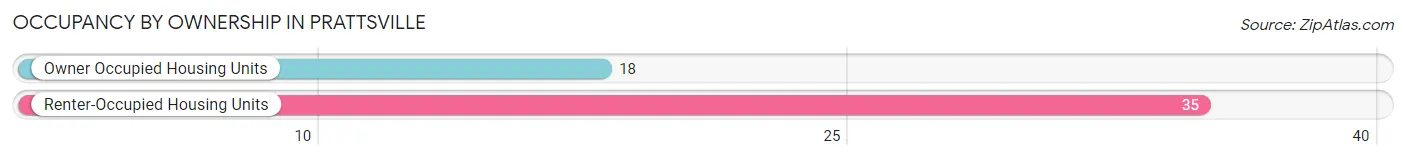
| Occupancy | # Housing Units | % Housing Units |
| Owner Occupied Housing Units | 18 | 34.0% |
| Renter-Occupied Housing Units | 35 | 66.0% |
| Total Occupied Housing Units | 53 | 100.0% |
Occupancy by Household Size in Prattsville
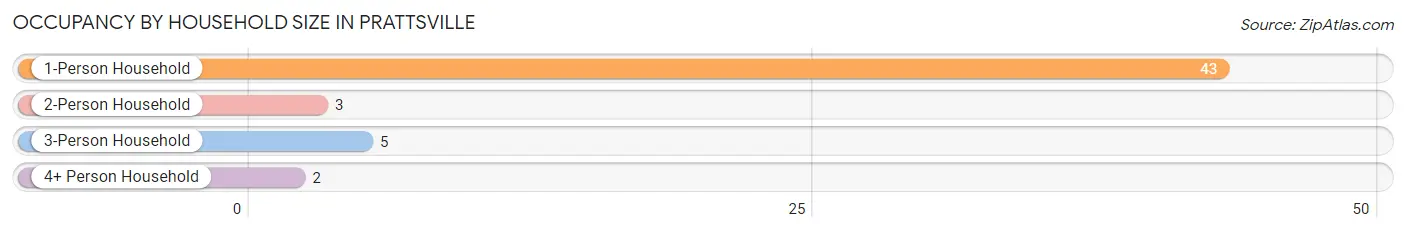
| Household Size | # Housing Units | % Housing Units |
| 1-Person Household | 43 | 81.1% |
| 2-Person Household | 3 | 5.7% |
| 3-Person Household | 5 | 9.4% |
| 4+ Person Household | 2 | 3.8% |
| Total Housing Units | 53 | 100.0% |
Occupancy by Ownership by Household Size in Prattsville
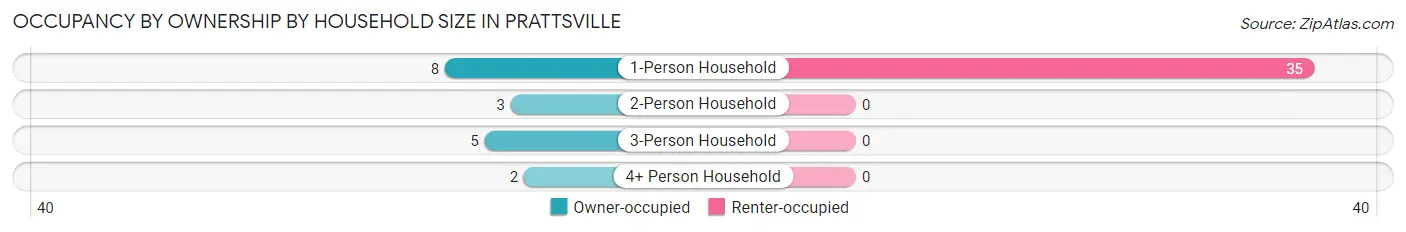
| Household Size | Owner-occupied | Renter-occupied |
| 1-Person Household | 8 (18.6%) | 35 (81.4%) |
| 2-Person Household | 3 (100.0%) | 0 (0.0%) |
| 3-Person Household | 5 (100.0%) | 0 (0.0%) |
| 4+ Person Household | 2 (100.0%) | 0 (0.0%) |
| Total Housing Units | 18 (34.0%) | 35 (66.0%) |
Occupancy by Educational Attainment in Prattsville
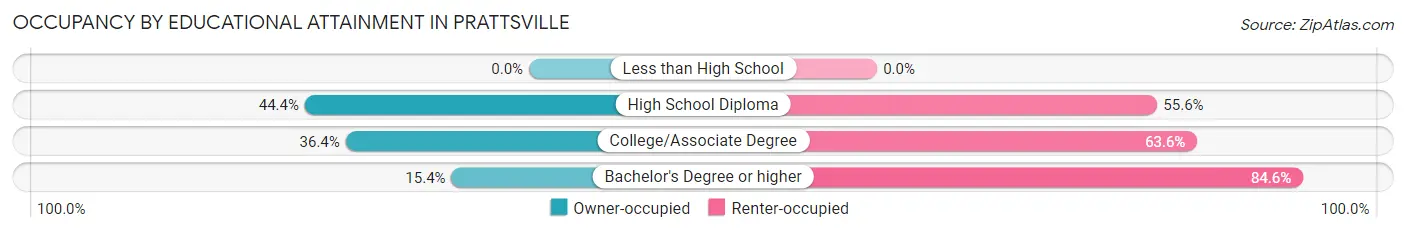
| Household Size | Owner-occupied | Renter-occupied |
| Less than High School | 0 (0.0%) | 0 (0.0%) |
| High School Diploma | 8 (44.4%) | 10 (55.6%) |
| College/Associate Degree | 8 (36.4%) | 14 (63.6%) |
| Bachelor's Degree or higher | 2 (15.4%) | 11 (84.6%) |
Occupancy by Age of Householder in Prattsville
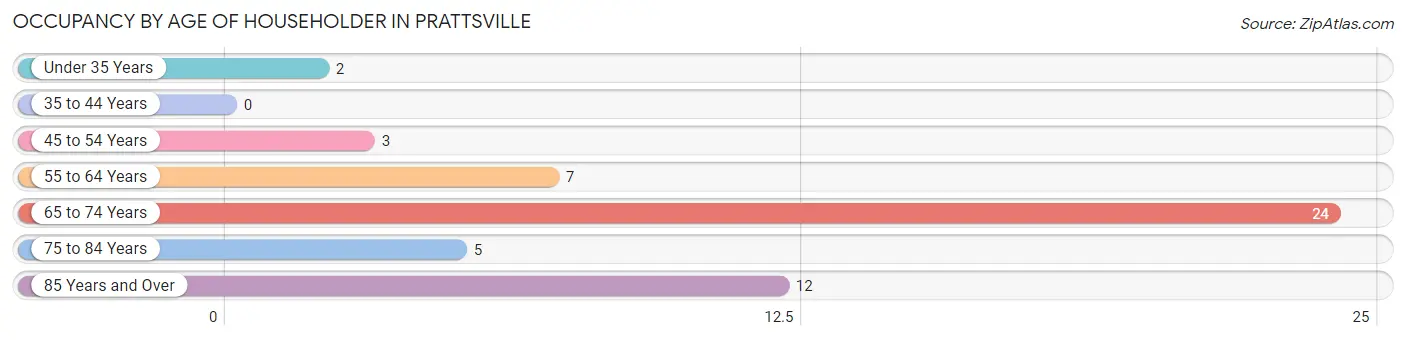
| Age Bracket | # Households | % Households |
| Under 35 Years | 2 | 3.8% |
| 35 to 44 Years | 0 | 0.0% |
| 45 to 54 Years | 3 | 5.7% |
| 55 to 64 Years | 7 | 13.2% |
| 65 to 74 Years | 24 | 45.3% |
| 75 to 84 Years | 5 | 9.4% |
| 85 Years and Over | 12 | 22.6% |
| Total | 53 | 100.0% |
Housing Finances in Prattsville
Median Income by Occupancy in Prattsville
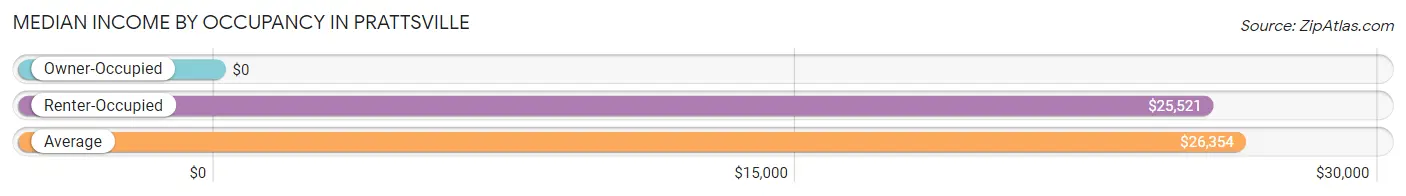
| Occupancy Type | # Households | Median Income |
| Owner-Occupied | 18 (34.0%) | $0 |
| Renter-Occupied | 35 (66.0%) | $25,521 |
| Average | 53 (100.0%) | $26,354 |
Occupancy by Householder Income Bracket in Prattsville
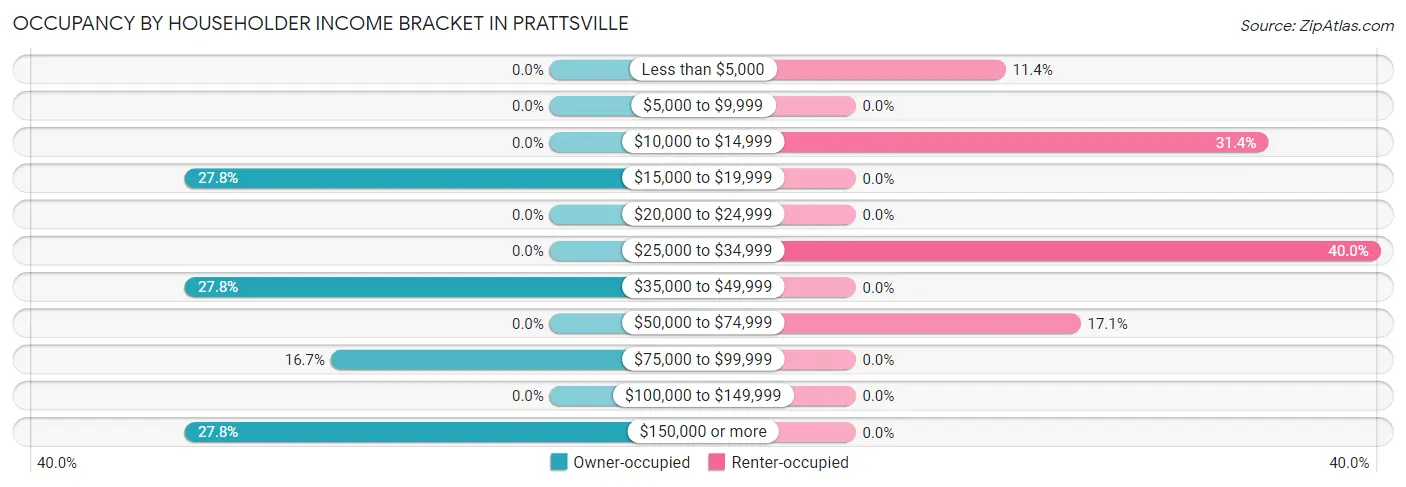
| Income Bracket | Owner-occupied | Renter-occupied |
| Less than $5,000 | 0 (0.0%) | 4 (11.4%) |
| $5,000 to $9,999 | 0 (0.0%) | 0 (0.0%) |
| $10,000 to $14,999 | 0 (0.0%) | 11 (31.4%) |
| $15,000 to $19,999 | 5 (27.8%) | 0 (0.0%) |
| $20,000 to $24,999 | 0 (0.0%) | 0 (0.0%) |
| $25,000 to $34,999 | 0 (0.0%) | 14 (40.0%) |
| $35,000 to $49,999 | 5 (27.8%) | 0 (0.0%) |
| $50,000 to $74,999 | 0 (0.0%) | 6 (17.1%) |
| $75,000 to $99,999 | 3 (16.7%) | 0 (0.0%) |
| $100,000 to $149,999 | 0 (0.0%) | 0 (0.0%) |
| $150,000 or more | 5 (27.8%) | 0 (0.0%) |
| Total | 18 (100.0%) | 35 (100.0%) |
Monthly Housing Cost Tiers in Prattsville
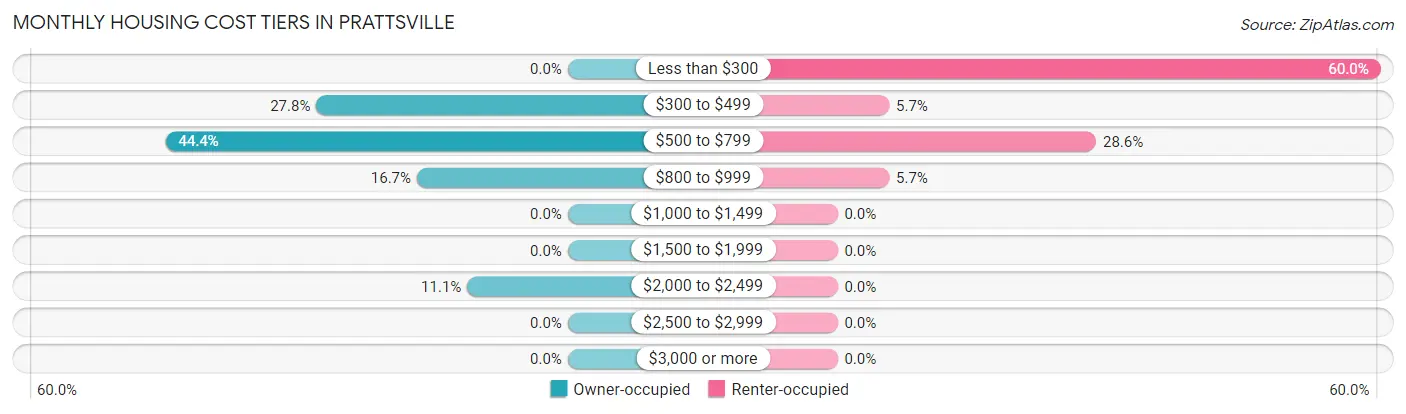
| Monthly Cost | Owner-occupied | Renter-occupied |
| Less than $300 | 0 (0.0%) | 21 (60.0%) |
| $300 to $499 | 5 (27.8%) | 2 (5.7%) |
| $500 to $799 | 8 (44.4%) | 10 (28.6%) |
| $800 to $999 | 3 (16.7%) | 2 (5.7%) |
| $1,000 to $1,499 | 0 (0.0%) | 0 (0.0%) |
| $1,500 to $1,999 | 0 (0.0%) | 0 (0.0%) |
| $2,000 to $2,499 | 2 (11.1%) | 0 (0.0%) |
| $2,500 to $2,999 | 0 (0.0%) | 0 (0.0%) |
| $3,000 or more | 0 (0.0%) | 0 (0.0%) |
| Total | 18 (100.0%) | 35 (100.0%) |
Physical Housing Characteristics in Prattsville
Housing Structures in Prattsville
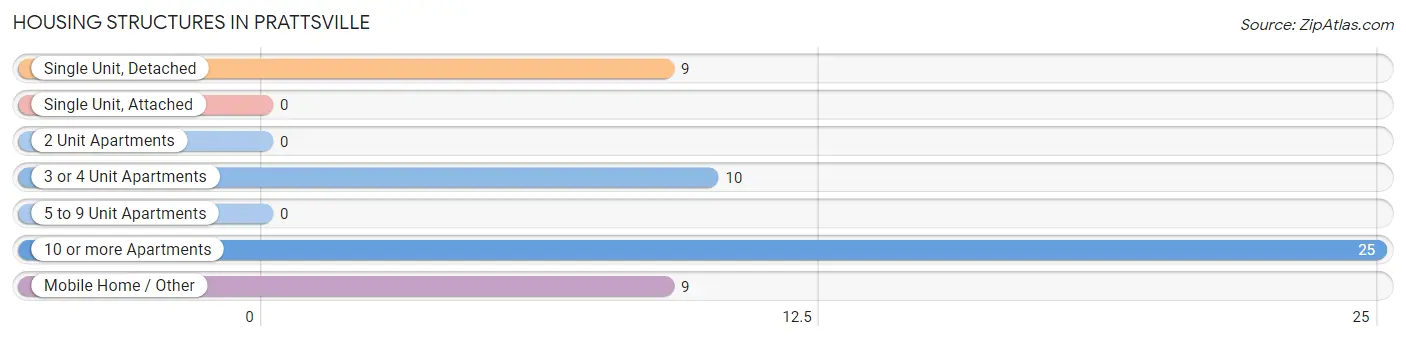
| Structure Type | # Housing Units | % Housing Units |
| Single Unit, Detached | 9 | 17.0% |
| Single Unit, Attached | 0 | 0.0% |
| 2 Unit Apartments | 0 | 0.0% |
| 3 or 4 Unit Apartments | 10 | 18.9% |
| 5 to 9 Unit Apartments | 0 | 0.0% |
| 10 or more Apartments | 25 | 47.2% |
| Mobile Home / Other | 9 | 17.0% |
| Total | 53 | 100.0% |
Housing Structures by Occupancy in Prattsville
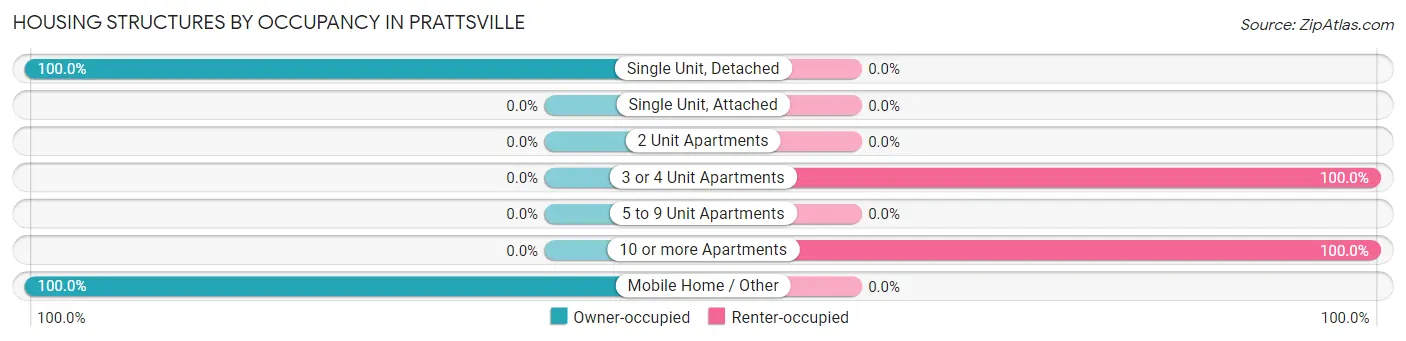
| Structure Type | Owner-occupied | Renter-occupied |
| Single Unit, Detached | 9 (100.0%) | 0 (0.0%) |
| Single Unit, Attached | 0 (0.0%) | 0 (0.0%) |
| 2 Unit Apartments | 0 (0.0%) | 0 (0.0%) |
| 3 or 4 Unit Apartments | 0 (0.0%) | 10 (100.0%) |
| 5 to 9 Unit Apartments | 0 (0.0%) | 0 (0.0%) |
| 10 or more Apartments | 0 (0.0%) | 25 (100.0%) |
| Mobile Home / Other | 9 (100.0%) | 0 (0.0%) |
| Total | 18 (34.0%) | 35 (66.0%) |
Housing Structures by Number of Rooms in Prattsville
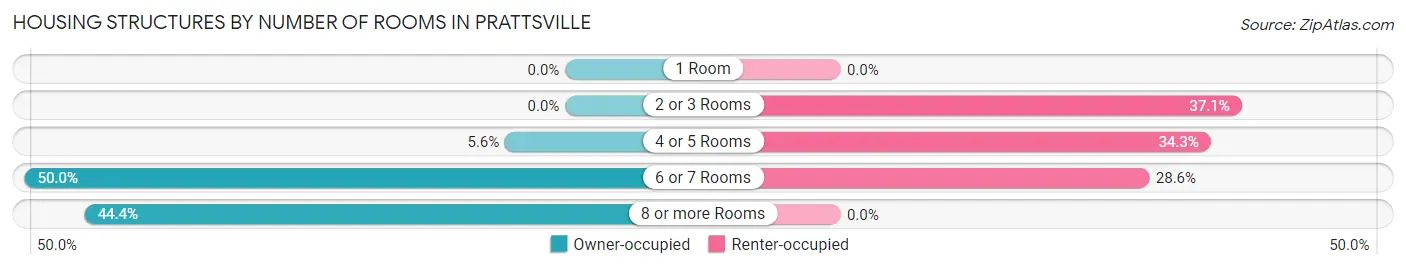
| Number of Rooms | Owner-occupied | Renter-occupied |
| 1 Room | 0 (0.0%) | 0 (0.0%) |
| 2 or 3 Rooms | 0 (0.0%) | 13 (37.1%) |
| 4 or 5 Rooms | 1 (5.6%) | 12 (34.3%) |
| 6 or 7 Rooms | 9 (50.0%) | 10 (28.6%) |
| 8 or more Rooms | 8 (44.4%) | 0 (0.0%) |
| Total | 18 (100.0%) | 35 (100.0%) |
Housing Structure by Heating Type in Prattsville
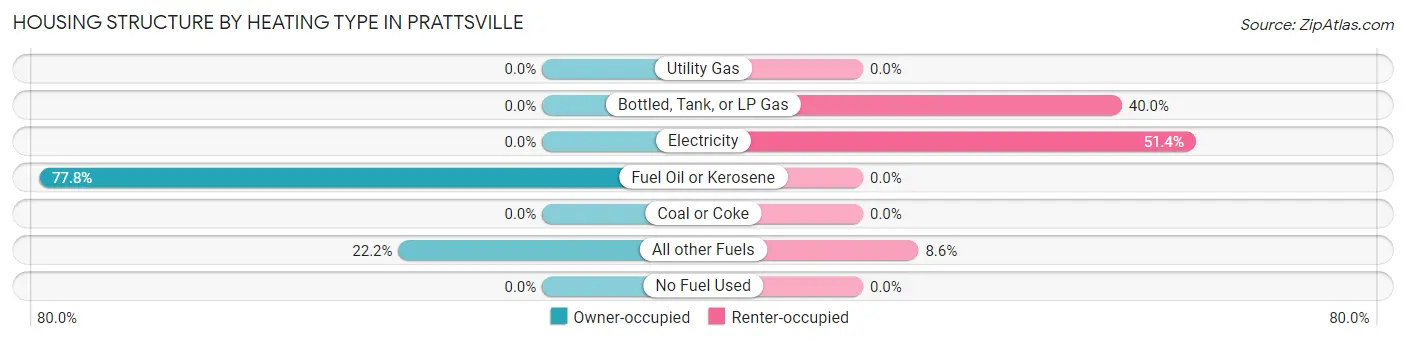
| Heating Type | Owner-occupied | Renter-occupied |
| Utility Gas | 0 (0.0%) | 0 (0.0%) |
| Bottled, Tank, or LP Gas | 0 (0.0%) | 14 (40.0%) |
| Electricity | 0 (0.0%) | 18 (51.4%) |
| Fuel Oil or Kerosene | 14 (77.8%) | 0 (0.0%) |
| Coal or Coke | 0 (0.0%) | 0 (0.0%) |
| All other Fuels | 4 (22.2%) | 3 (8.6%) |
| No Fuel Used | 0 (0.0%) | 0 (0.0%) |
| Total | 18 (100.0%) | 35 (100.0%) |
Household Vehicle Usage in Prattsville
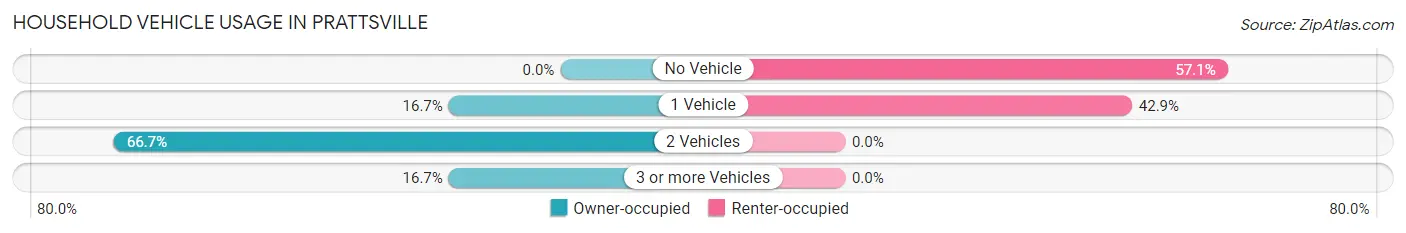
| Vehicles per Household | Owner-occupied | Renter-occupied |
| No Vehicle | 0 (0.0%) | 20 (57.1%) |
| 1 Vehicle | 3 (16.7%) | 15 (42.9%) |
| 2 Vehicles | 12 (66.7%) | 0 (0.0%) |
| 3 or more Vehicles | 3 (16.7%) | 0 (0.0%) |
| Total | 18 (100.0%) | 35 (100.0%) |
Real Estate & Mortgages in Prattsville
Real Estate and Mortgage Overview in Prattsville
| Characteristic | Without Mortgage | With Mortgage |
| Housing Units | 18 | 0 |
| Median Property Value | $200,000 | $0 |
| Median Household Income | - | - |
| Monthly Housing Costs | $650 | $0 |
| Real Estate Taxes | $2,286 | $0 |
Property Value by Mortgage Status in Prattsville
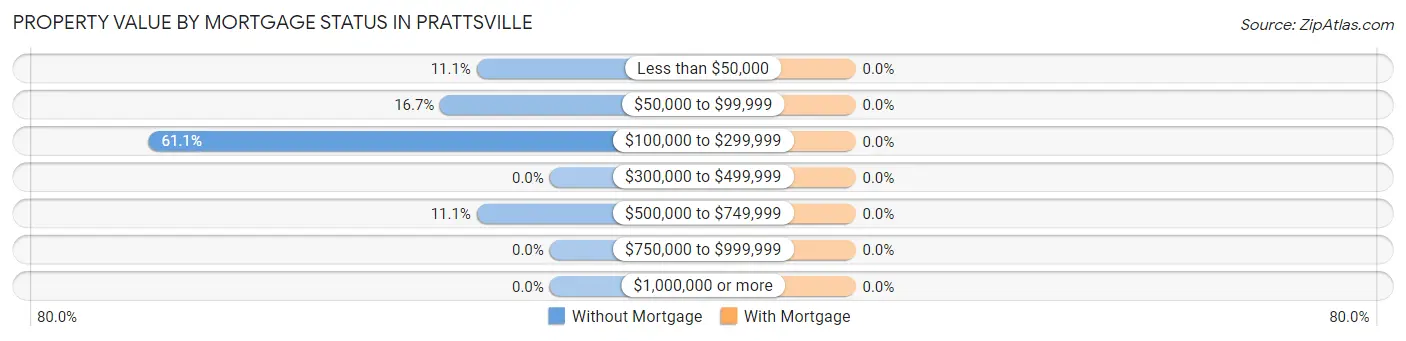
| Property Value | Without Mortgage | With Mortgage |
| Less than $50,000 | 2 (11.1%) | 0 (0.0%) |
| $50,000 to $99,999 | 3 (16.7%) | 0 (0.0%) |
| $100,000 to $299,999 | 11 (61.1%) | 0 (0.0%) |
| $300,000 to $499,999 | 0 (0.0%) | 0 (0.0%) |
| $500,000 to $749,999 | 2 (11.1%) | 0 (0.0%) |
| $750,000 to $999,999 | 0 (0.0%) | 0 (0.0%) |
| $1,000,000 or more | 0 (0.0%) | 0 (0.0%) |
| Total | 18 (100.0%) | 0 (0.0%) |
Household Income by Mortgage Status in Prattsville
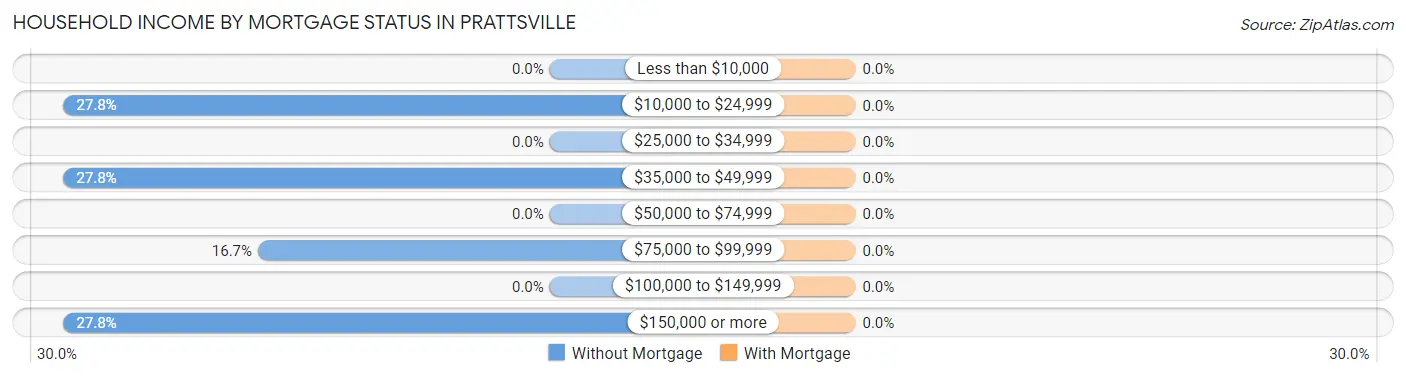
| Household Income | Without Mortgage | With Mortgage |
| Less than $10,000 | 0 (0.0%) | 0 (0.0%) |
| $10,000 to $24,999 | 5 (27.8%) | 0 (0.0%) |
| $25,000 to $34,999 | 0 (0.0%) | 0 (0.0%) |
| $35,000 to $49,999 | 5 (27.8%) | 0 (0.0%) |
| $50,000 to $74,999 | 0 (0.0%) | 0 (0.0%) |
| $75,000 to $99,999 | 3 (16.7%) | 0 (0.0%) |
| $100,000 to $149,999 | 0 (0.0%) | 0 (0.0%) |
| $150,000 or more | 5 (27.8%) | 0 (0.0%) |
| Total | 18 (100.0%) | 0 (0.0%) |
Property Value to Household Income Ratio in Prattsville
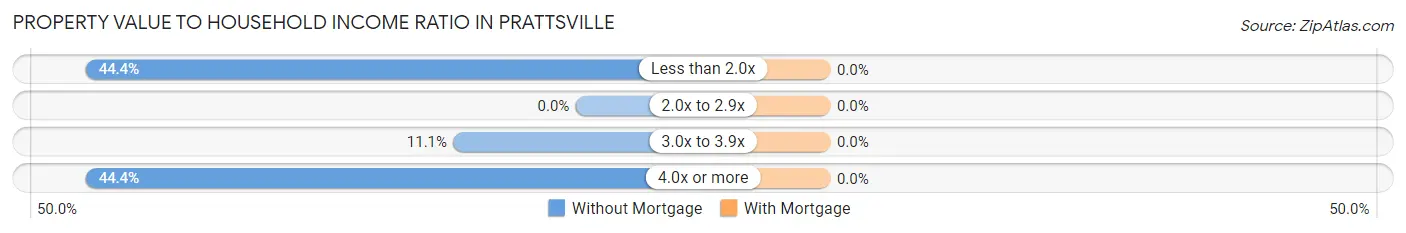
| Value-to-Income Ratio | Without Mortgage | With Mortgage |
| Less than 2.0x | 8 (44.4%) | 0 (0.0%) |
| 2.0x to 2.9x | 0 (0.0%) | 0 (0.0%) |
| 3.0x to 3.9x | 2 (11.1%) | 0 (0.0%) |
| 4.0x or more | 8 (44.4%) | 0 (0.0%) |
| Total | 18 (100.0%) | 0 (0.0%) |
Real Estate Taxes by Mortgage Status in Prattsville
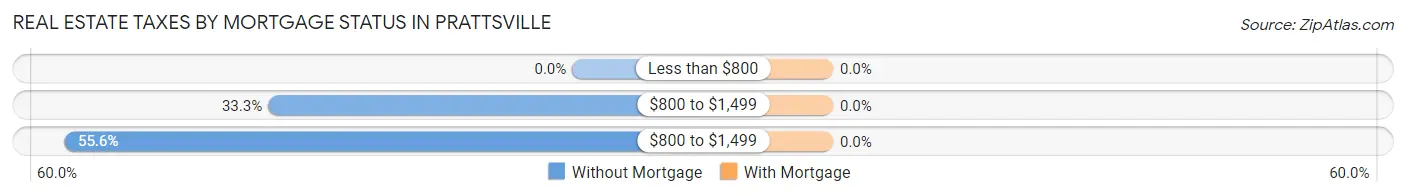
| Property Taxes | Without Mortgage | With Mortgage |
| Less than $800 | 0 (0.0%) | 0 (0.0%) |
| $800 to $1,499 | 6 (33.3%) | 0 (0.0%) |
| $800 to $1,499 | 10 (55.6%) | 0 (0.0%) |
| Total | 18 (100.0%) | 0 (0.0%) |
Health & Disability in Prattsville
Health Insurance Coverage by Age in Prattsville
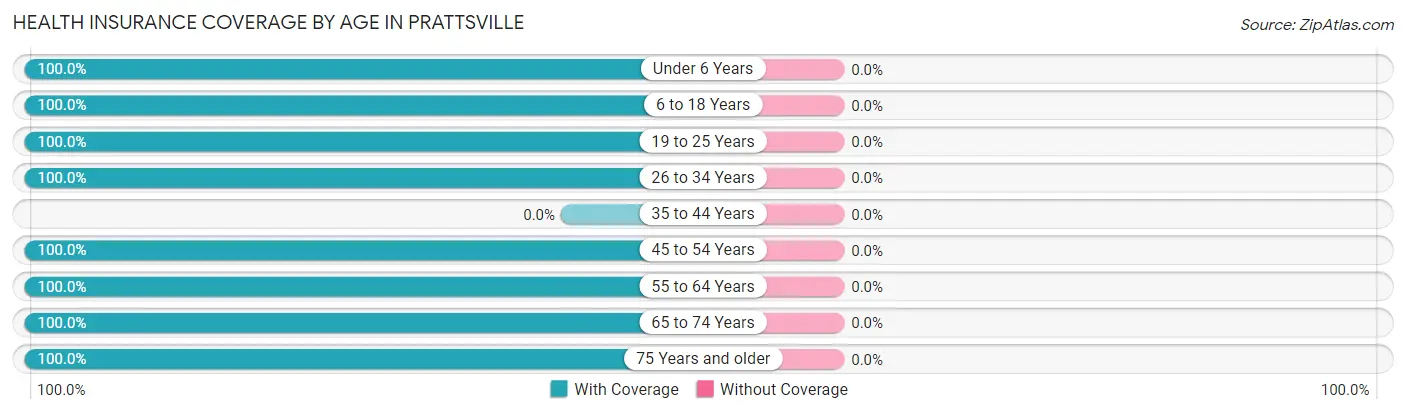
| Age Bracket | With Coverage | Without Coverage |
| Under 6 Years | 4 (100.0%) | 0 (0.0%) |
| 6 to 18 Years | 6 (100.0%) | 0 (0.0%) |
| 19 to 25 Years | 4 (100.0%) | 0 (0.0%) |
| 26 to 34 Years | 6 (100.0%) | 0 (0.0%) |
| 35 to 44 Years | 0 (0.0%) | 0 (0.0%) |
| 45 to 54 Years | 7 (100.0%) | 0 (0.0%) |
| 55 to 64 Years | 20 (100.0%) | 0 (0.0%) |
| 65 to 74 Years | 29 (100.0%) | 0 (0.0%) |
| 75 Years and older | 22 (100.0%) | 0 (0.0%) |
| Total | 98 (100.0%) | 0 (0.0%) |
Health Insurance Coverage by Citizenship Status in Prattsville
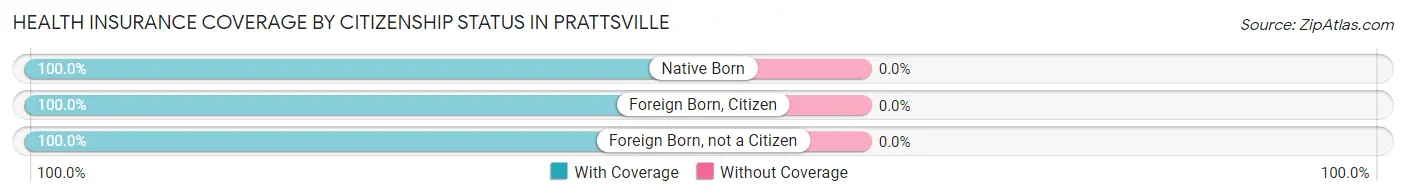
| Citizenship Status | With Coverage | Without Coverage |
| Native Born | 4 (100.0%) | 0 (0.0%) |
| Foreign Born, Citizen | 6 (100.0%) | 0 (0.0%) |
| Foreign Born, not a Citizen | 4 (100.0%) | 0 (0.0%) |
Health Insurance Coverage by Household Income in Prattsville
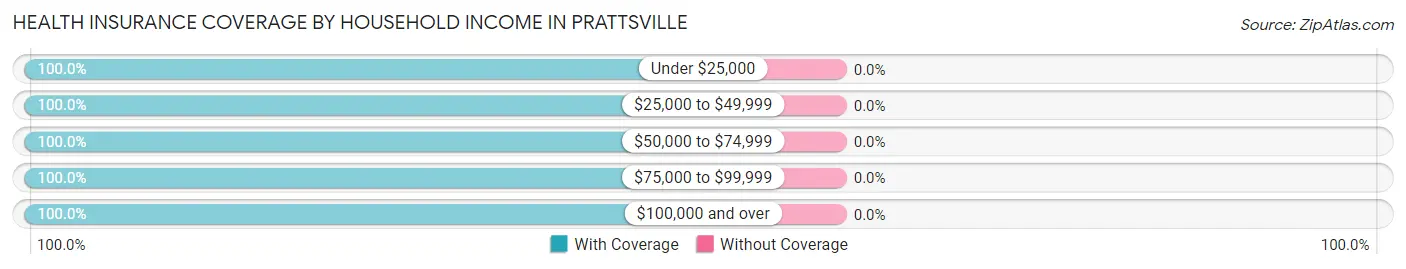
| Household Income | With Coverage | Without Coverage |
| Under $25,000 | 34 (100.0%) | 0 (0.0%) |
| $25,000 to $49,999 | 19 (100.0%) | 0 (0.0%) |
| $50,000 to $74,999 | 6 (100.0%) | 0 (0.0%) |
| $75,000 to $99,999 | 6 (100.0%) | 0 (0.0%) |
| $100,000 and over | 33 (100.0%) | 0 (0.0%) |
Public vs Private Health Insurance Coverage by Age in Prattsville
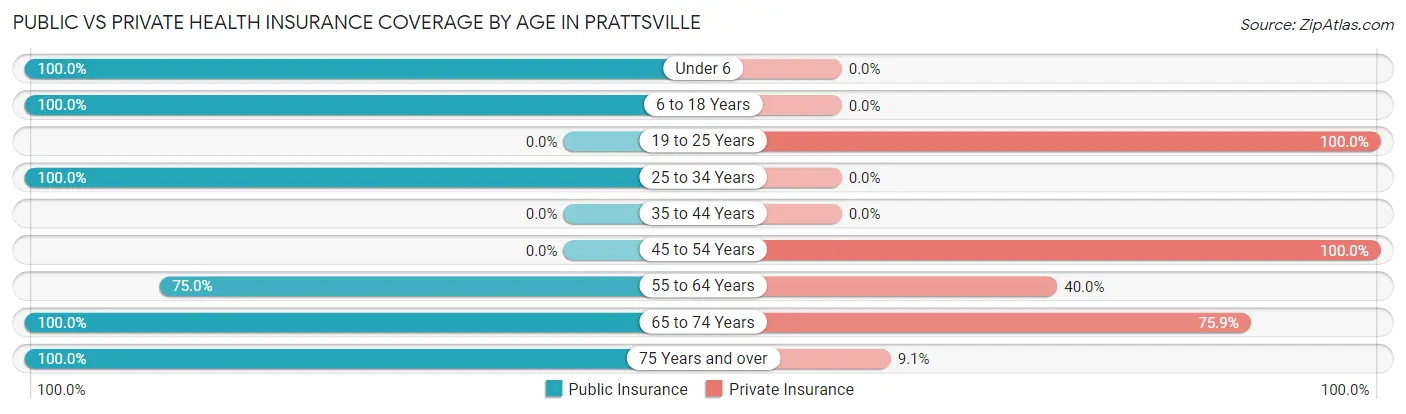
| Age Bracket | Public Insurance | Private Insurance |
| Under 6 | 4 (100.0%) | 0 (0.0%) |
| 6 to 18 Years | 6 (100.0%) | 0 (0.0%) |
| 19 to 25 Years | 0 (0.0%) | 4 (100.0%) |
| 25 to 34 Years | 6 (100.0%) | 0 (0.0%) |
| 35 to 44 Years | 0 (0.0%) | 0 (0.0%) |
| 45 to 54 Years | 0 (0.0%) | 7 (100.0%) |
| 55 to 64 Years | 15 (75.0%) | 8 (40.0%) |
| 65 to 74 Years | 29 (100.0%) | 22 (75.9%) |
| 75 Years and over | 22 (100.0%) | 2 (9.1%) |
| Total | 82 (83.7%) | 43 (43.9%) |
Disability Status by Sex by Age in Prattsville
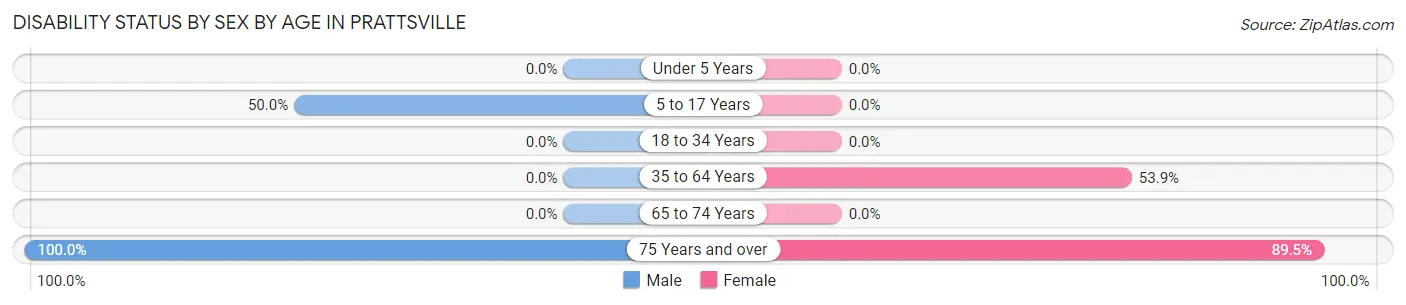
| Age Bracket | Male | Female |
| Under 5 Years | 0 (0.0%) | 0 (0.0%) |
| 5 to 17 Years | 3 (50.0%) | 0 (0.0%) |
| 18 to 34 Years | 0 (0.0%) | 0 (0.0%) |
| 35 to 64 Years | 0 (0.0%) | 7 (53.8%) |
| 65 to 74 Years | 0 (0.0%) | 0 (0.0%) |
| 75 Years and over | 3 (100.0%) | 17 (89.5%) |
Disability Class by Sex by Age in Prattsville
Disability Class: Hearing Difficulty
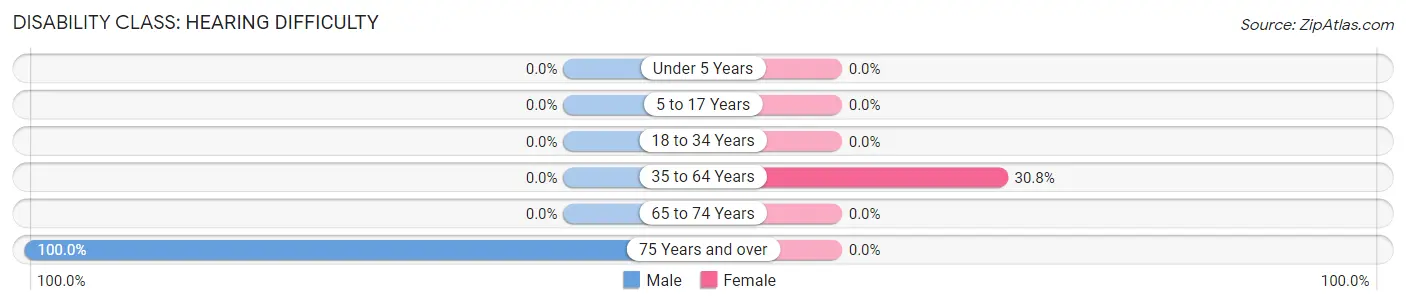
| Age Bracket | Male | Female |
| Under 5 Years | 0 (0.0%) | 0 (0.0%) |
| 5 to 17 Years | 0 (0.0%) | 0 (0.0%) |
| 18 to 34 Years | 0 (0.0%) | 0 (0.0%) |
| 35 to 64 Years | 0 (0.0%) | 4 (30.8%) |
| 65 to 74 Years | 0 (0.0%) | 0 (0.0%) |
| 75 Years and over | 3 (100.0%) | 0 (0.0%) |
Disability Class: Vision Difficulty
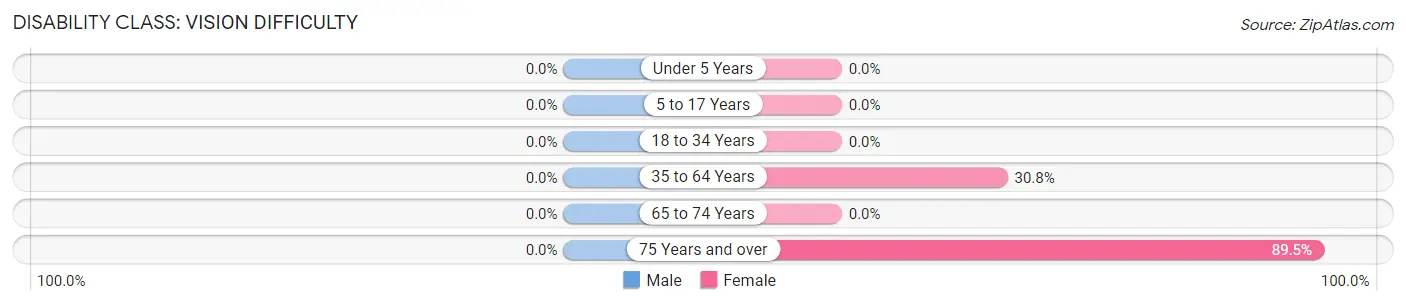
| Age Bracket | Male | Female |
| Under 5 Years | 0 (0.0%) | 0 (0.0%) |
| 5 to 17 Years | 0 (0.0%) | 0 (0.0%) |
| 18 to 34 Years | 0 (0.0%) | 0 (0.0%) |
| 35 to 64 Years | 0 (0.0%) | 4 (30.8%) |
| 65 to 74 Years | 0 (0.0%) | 0 (0.0%) |
| 75 Years and over | 0 (0.0%) | 17 (89.5%) |
Disability Class: Cognitive Difficulty
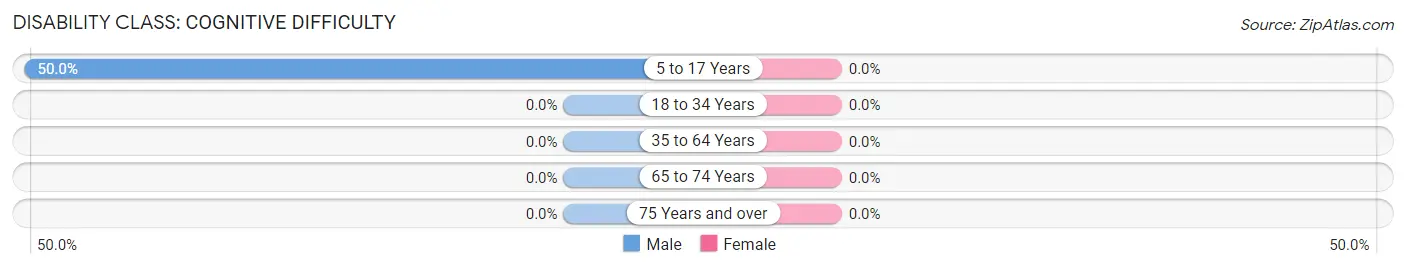
| Age Bracket | Male | Female |
| 5 to 17 Years | 3 (50.0%) | 0 (0.0%) |
| 18 to 34 Years | 0 (0.0%) | 0 (0.0%) |
| 35 to 64 Years | 0 (0.0%) | 0 (0.0%) |
| 65 to 74 Years | 0 (0.0%) | 0 (0.0%) |
| 75 Years and over | 0 (0.0%) | 0 (0.0%) |
Disability Class: Ambulatory Difficulty
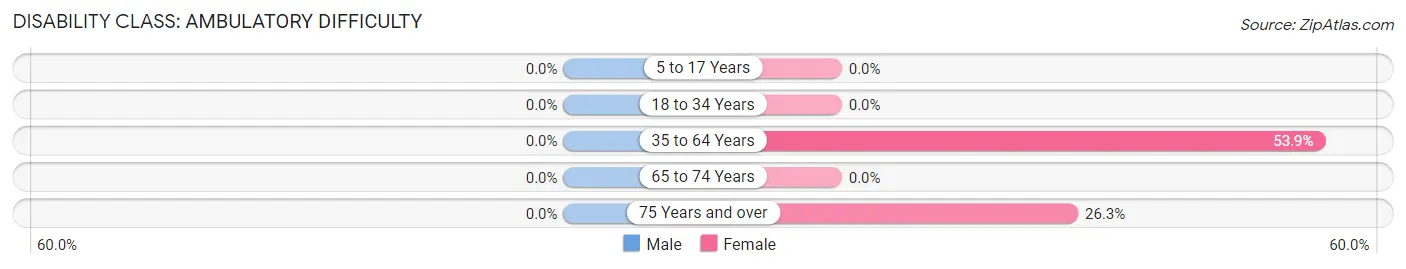
| Age Bracket | Male | Female |
| 5 to 17 Years | 0 (0.0%) | 0 (0.0%) |
| 18 to 34 Years | 0 (0.0%) | 0 (0.0%) |
| 35 to 64 Years | 0 (0.0%) | 7 (53.8%) |
| 65 to 74 Years | 0 (0.0%) | 0 (0.0%) |
| 75 Years and over | 0 (0.0%) | 5 (26.3%) |
Disability Class: Self-Care Difficulty
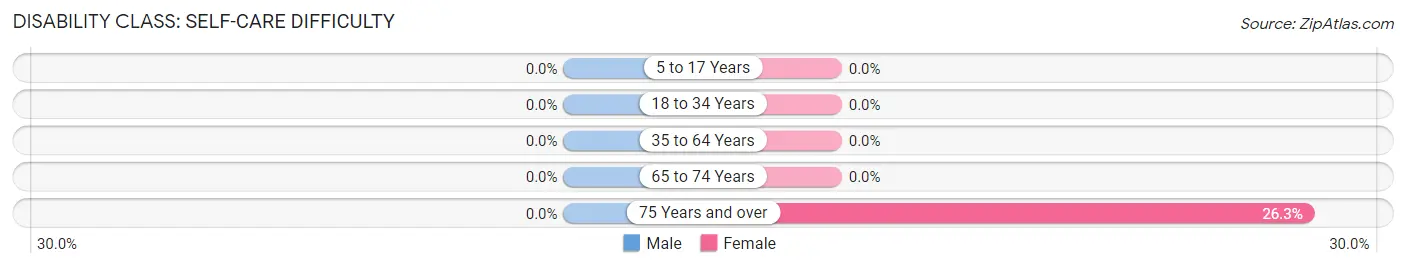
| Age Bracket | Male | Female |
| 5 to 17 Years | 0 (0.0%) | 0 (0.0%) |
| 18 to 34 Years | 0 (0.0%) | 0 (0.0%) |
| 35 to 64 Years | 0 (0.0%) | 0 (0.0%) |
| 65 to 74 Years | 0 (0.0%) | 0 (0.0%) |
| 75 Years and over | 0 (0.0%) | 5 (26.3%) |
Technology Access in Prattsville
Computing Device Access in Prattsville
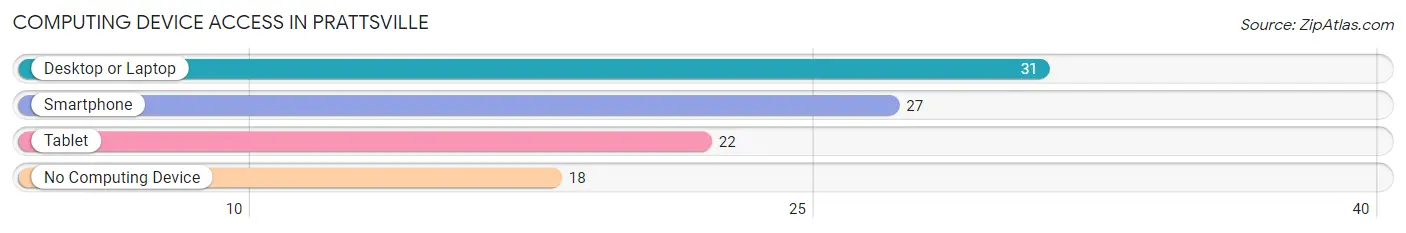
| Device Type | # Households | % Households |
| Desktop or Laptop | 31 | 58.5% |
| Smartphone | 27 | 50.9% |
| Tablet | 22 | 41.5% |
| No Computing Device | 18 | 34.0% |
| Total | 53 | 100.0% |
Internet Access in Prattsville
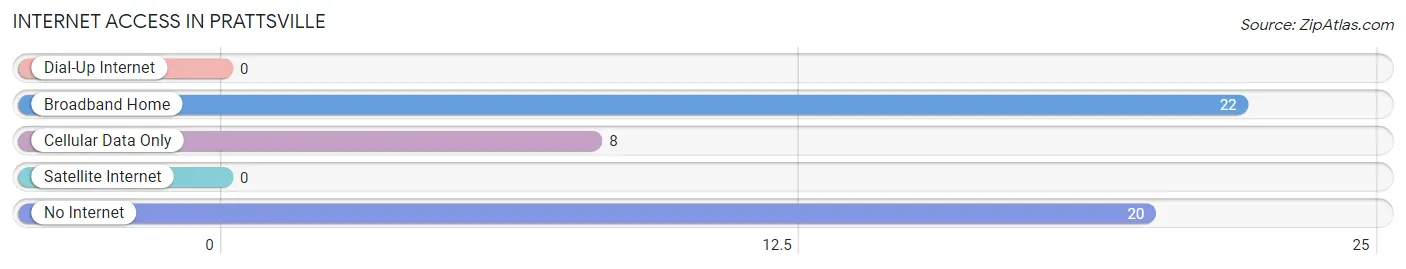
| Internet Type | # Households | % Households |
| Dial-Up Internet | 0 | 0.0% |
| Broadband Home | 22 | 41.5% |
| Cellular Data Only | 8 | 15.1% |
| Satellite Internet | 0 | 0.0% |
| No Internet | 20 | 37.7% |
| Total | 53 | 100.0% |
Prattsville Summary
Prattsville, NY is a small town located in Greene County, New York. It is situated in the Catskill Mountains, about two hours north of New York City. The town was founded in 1786 by John Pratt, a Revolutionary War veteran, and was named after him. The town has a population of about 1,000 people and covers an area of about 10 square miles.
History
Prattsville was founded in 1786 by John Pratt, a Revolutionary War veteran. He purchased the land from the local Native American tribes and named the town after himself. The town was originally a farming community, and the main crops were wheat, corn, and potatoes. In the early 19th century, the town began to grow and develop. The first school was built in 1810, and the first church was built in 1820.
In the mid-19th century, the town began to experience a period of growth and prosperity. The first post office was established in 1845, and the first newspaper was published in 1848. The town also saw the construction of several mills, including a sawmill, a gristmill, and a woolen mill.
In the late 19th century, the town experienced a period of decline. The mills closed, and the population began to decline. In the early 20th century, the town experienced a period of revitalization. The first bank was established in 1910, and the first telephone service was established in 1912.
Geography
Prattsville is located in Greene County, New York. It is situated in the Catskill Mountains, about two hours north of New York City. The town covers an area of about 10 square miles and is bordered by the towns of Lexington, Windham, and Ashland. The terrain is mostly hilly, with some flat areas. The highest point in the town is 1,890 feet above sea level.
The town is located in the Catskill Mountains, which are part of the Appalachian Mountains. The Catskills are known for their scenic beauty and are a popular destination for outdoor recreation. The town is home to several state parks, including the Catskill State Park and the Kaaterskill State Park.
Economy
The economy of Prattsville is largely based on tourism and agriculture. The town is home to several small businesses, including restaurants, shops, and bed and breakfasts. The town is also home to several farms, which produce a variety of crops, including apples, corn, and hay.
The town is also home to several small manufacturing companies, which produce a variety of products, including furniture, clothing, and wood products. The town is also home to several wineries, which produce a variety of wines.
Demographics
As of the 2010 census, the population of Prattsville was 1,039. The racial makeup of the town was 97.3% White, 0.7% African American, 0.2% Native American, 0.2% Asian, 0.1% Pacific Islander, 0.3% from other races, and 1.3% from two or more races. Hispanic or Latino of any race were 1.3% of the population.
The median household income in Prattsville was $41,250, and the median family income was $50,000. The per capita income was $20,945. About 11.3% of families and 14.2% of the population were below the poverty line, including 18.2% of those under age 18 and 8.3% of those age 65 or over.
Common Questions
What is Per Capita Income in Prattsville?
Per Capita income in Prattsville is $29,384.
What is the Median Family Income in Prattsville?
Median Family Income in Prattsville is $123,750.
What is the Median Household income in Prattsville?
Median Household Income in Prattsville is $26,354.
What is Inequality or Gini Index in Prattsville?
Inequality or Gini Index in Prattsville is 0.50.
What is the Total Population of Prattsville?
Total Population of Prattsville is 98.
What is the Total Male Population of Prattsville?
Total Male Population of Prattsville is 45.
What is the Total Female Population of Prattsville?
Total Female Population of Prattsville is 53.
What is the Ratio of Males per 100 Females in Prattsville?
There are 84.91 Males per 100 Females in Prattsville.
What is the Ratio of Females per 100 Males in Prattsville?
There are 117.78 Females per 100 Males in Prattsville.
What is the Median Population Age in Prattsville?
Median Population Age in Prattsville is 66.3 Years.
What is the Average Family Size in Prattsville
Average Family Size in Prattsville is 5.1 People.
What is the Average Household Size in Prattsville
Average Household Size in Prattsville is 1.9 People.
How Large is the Labor Force in Prattsville?
There are 36 People in the Labor Forcein in Prattsville.
What is the Percentage of People in the Labor Force in Prattsville?
40.9% of People are in the Labor Force in Prattsville.
What is the Unemployment Rate in Prattsville?
Unemployment Rate in Prattsville is 16.7%.