New Square, NY Map & Demographics
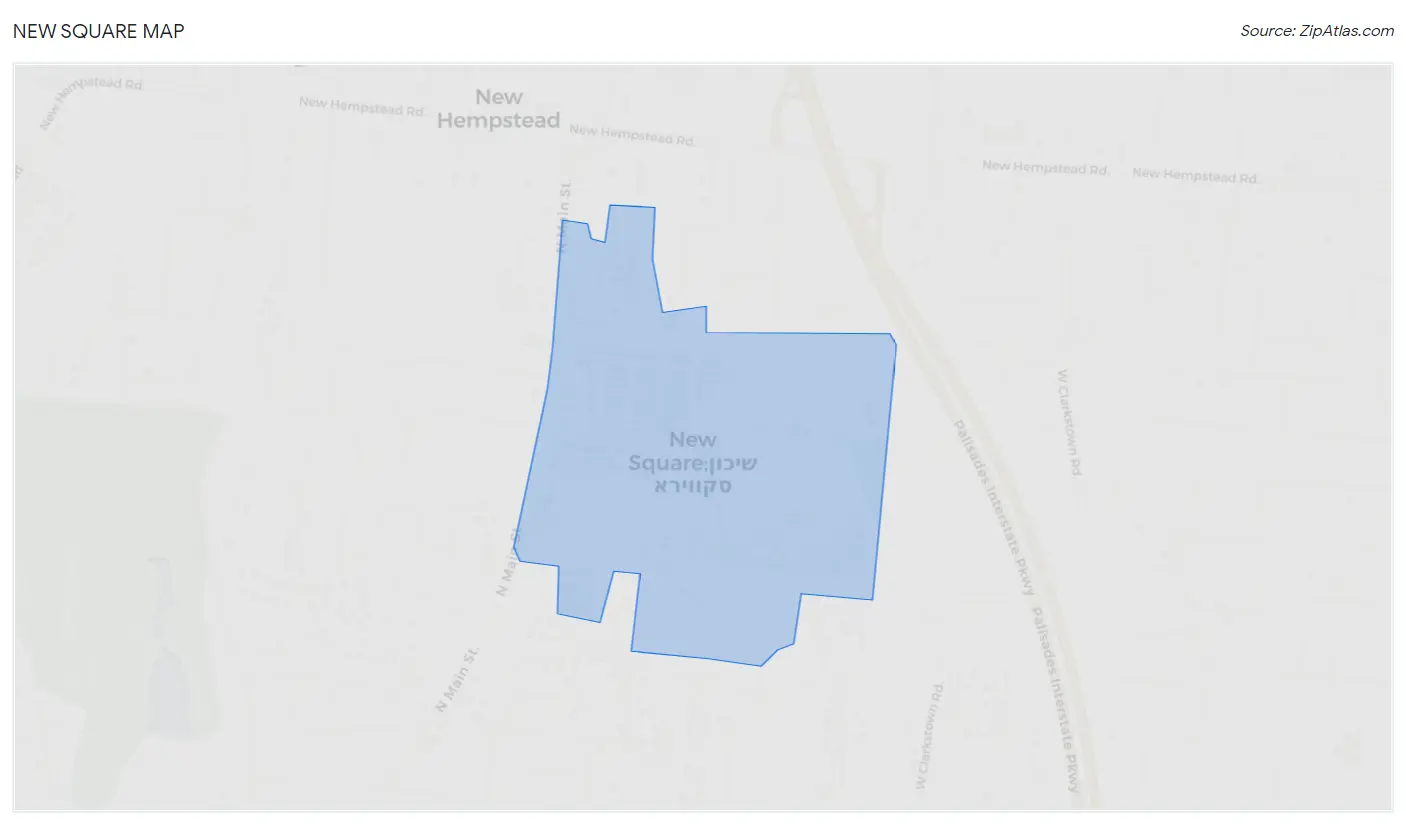
New Square Map
New Square Overview
$10,232
PER CAPITA INCOME
$27,438
AVG FAMILY INCOME
$27,488
AVG HOUSEHOLD INCOME
57.2%
WAGE / INCOME GAP [ % ]
42.8¢/ $1
WAGE / INCOME GAP [ $ ]
0.53
INEQUALITY / GINI INDEX
9,578
TOTAL POPULATION
4,814
MALE POPULATION
4,764
FEMALE POPULATION
101.05
MALES / 100 FEMALES
98.96
FEMALES / 100 MALES
15.7
MEDIAN AGE
5.3
AVG FAMILY SIZE
5.4
AVG HOUSEHOLD SIZE
2,814
LABOR FORCE [ PEOPLE ]
59.8%
PERCENT IN LABOR FORCE
8.1%
UNEMPLOYMENT RATE
Income in New Square
Income Overview in New Square
Per Capita Income in New Square is $10,232, while median incomes of families and households are $27,438 and $27,488 respectively.
| Characteristic | Number | Measure |
| Per Capita Income | 9,578 | $10,232 |
| Median Family Income | 1,747 | $27,438 |
| Mean Family Income | 1,747 | $54,341 |
| Median Household Income | 1,766 | $27,488 |
| Mean Household Income | 1,766 | $55,524 |
| Income Deficit | 1,747 | $0 |
| Wage / Income Gap (%) | 9,578 | 57.24% |
| Wage / Income Gap ($) | 9,578 | 42.76¢ per $1 |
| Gini / Inequality Index | 9,578 | 0.53 |
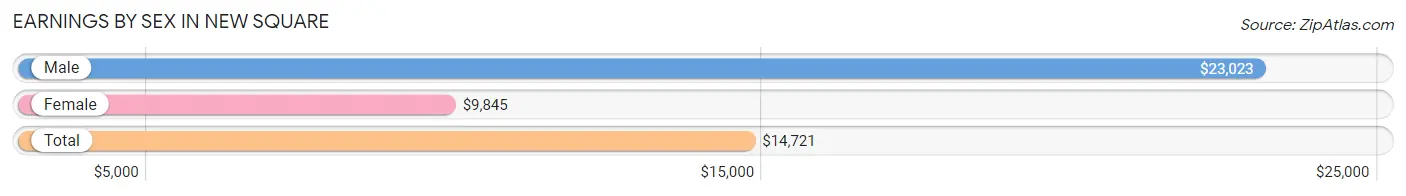
Earnings by Sex in New Square
Average Earnings in New Square are $14,721, $23,023 for men and $9,845 for women, a difference of 57.2%.
| Sex | Number | Average Earnings |
| Male | 1,570 (55.7%) | $23,023 |
| Female | 1,250 (44.3%) | $9,845 |
| Total | 2,820 (100.0%) | $14,721 |
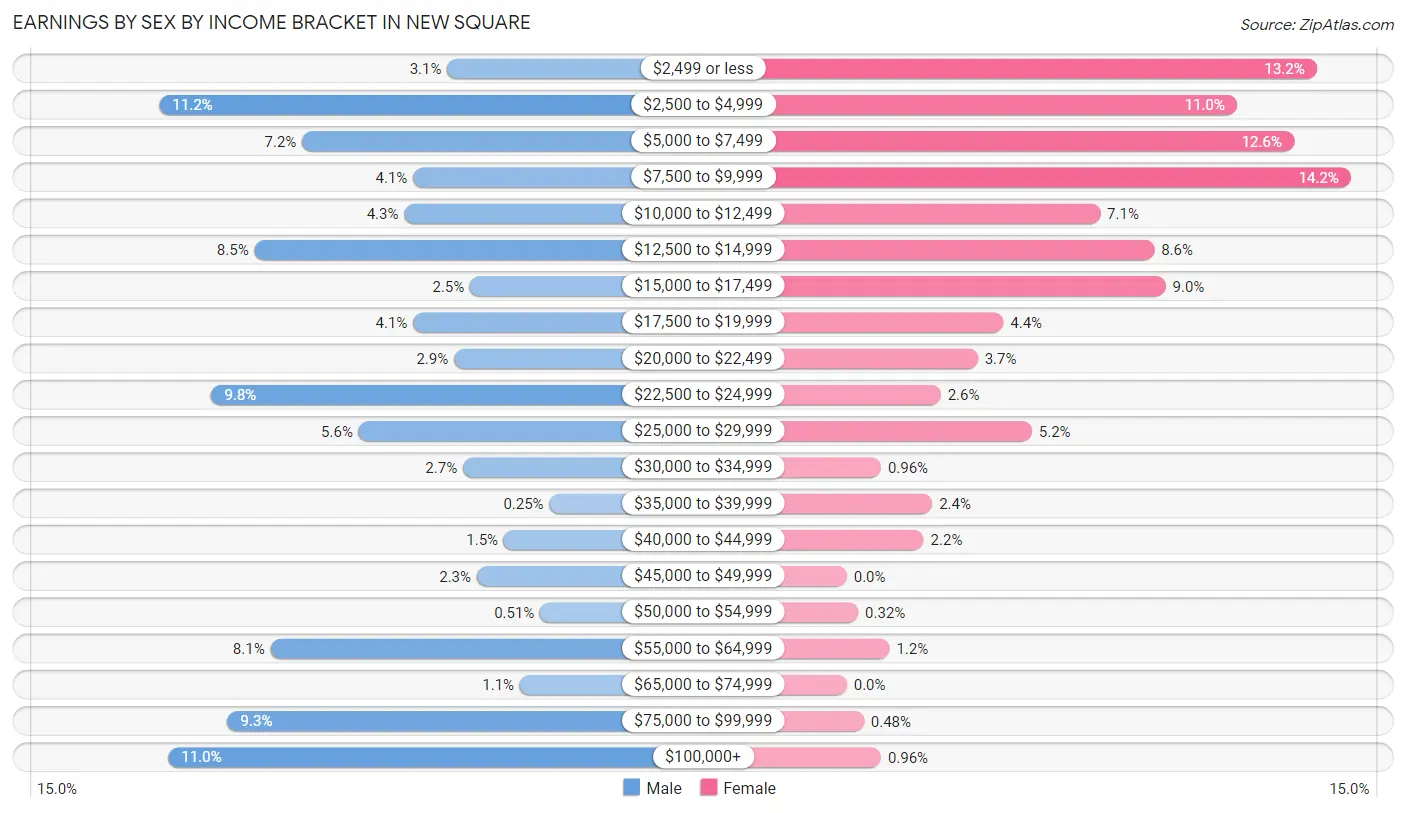
Earnings by Sex by Income Bracket in New Square
The most common earnings brackets in New Square are $2,500 to $4,999 for men (176 | 11.2%) and $7,500 to $9,999 for women (177 | 14.2%).
| Income | Male | Female |
| $2,499 or less | 49 (3.1%) | 165 (13.2%) |
| $2,500 to $4,999 | 176 (11.2%) | 137 (11.0%) |
| $5,000 to $7,499 | 113 (7.2%) | 157 (12.6%) |
| $7,500 to $9,999 | 64 (4.1%) | 177 (14.2%) |
| $10,000 to $12,499 | 68 (4.3%) | 89 (7.1%) |
| $12,500 to $14,999 | 134 (8.5%) | 108 (8.6%) |
| $15,000 to $17,499 | 39 (2.5%) | 112 (9.0%) |
| $17,500 to $19,999 | 64 (4.1%) | 55 (4.4%) |
| $20,000 to $22,499 | 46 (2.9%) | 46 (3.7%) |
| $22,500 to $24,999 | 153 (9.8%) | 33 (2.6%) |
| $25,000 to $29,999 | 88 (5.6%) | 65 (5.2%) |
| $30,000 to $34,999 | 42 (2.7%) | 12 (1.0%) |
| $35,000 to $39,999 | 4 (0.3%) | 30 (2.4%) |
| $40,000 to $44,999 | 24 (1.5%) | 27 (2.2%) |
| $45,000 to $49,999 | 36 (2.3%) | 0 (0.0%) |
| $50,000 to $54,999 | 8 (0.5%) | 4 (0.3%) |
| $55,000 to $64,999 | 127 (8.1%) | 15 (1.2%) |
| $65,000 to $74,999 | 17 (1.1%) | 0 (0.0%) |
| $75,000 to $99,999 | 146 (9.3%) | 6 (0.5%) |
| $100,000+ | 172 (11.0%) | 12 (1.0%) |
| Total | 1,570 (100.0%) | 1,250 (100.0%) |
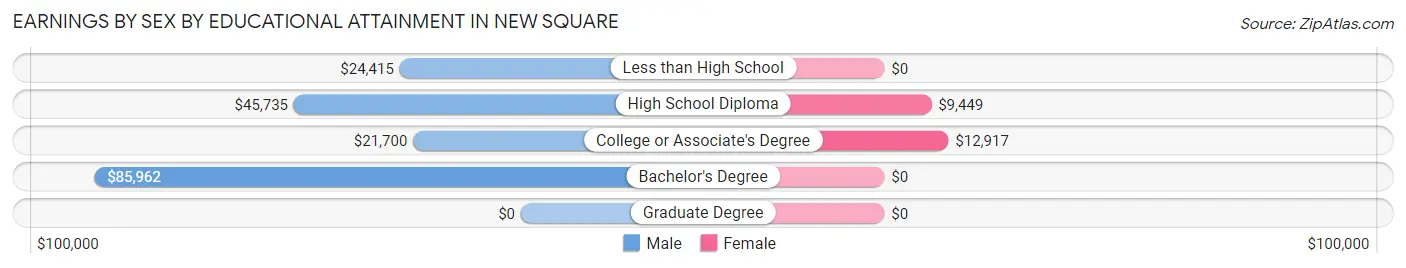
Earnings by Sex by Educational Attainment in New Square
Average earnings in New Square are $24,389 for men and $9,668 for women, a difference of 60.4%. Men with an educational attainment of bachelor's degree enjoy the highest average annual earnings of $85,962, while those with college or associate's degree education earn the least with $21,700. Women with an educational attainment of college or associate's degree earn the most with the average annual earnings of $12,917, while those with high school diploma education have the smallest earnings of $9,449.
| Educational Attainment | Male Income | Female Income |
| Less than High School | $24,415 | $0 |
| High School Diploma | $45,735 | $9,449 |
| College or Associate's Degree | $21,700 | $12,917 |
| Bachelor's Degree | $85,962 | $0 |
| Graduate Degree | - | - |
| Total | $24,389 | $9,668 |
Family Income in New Square
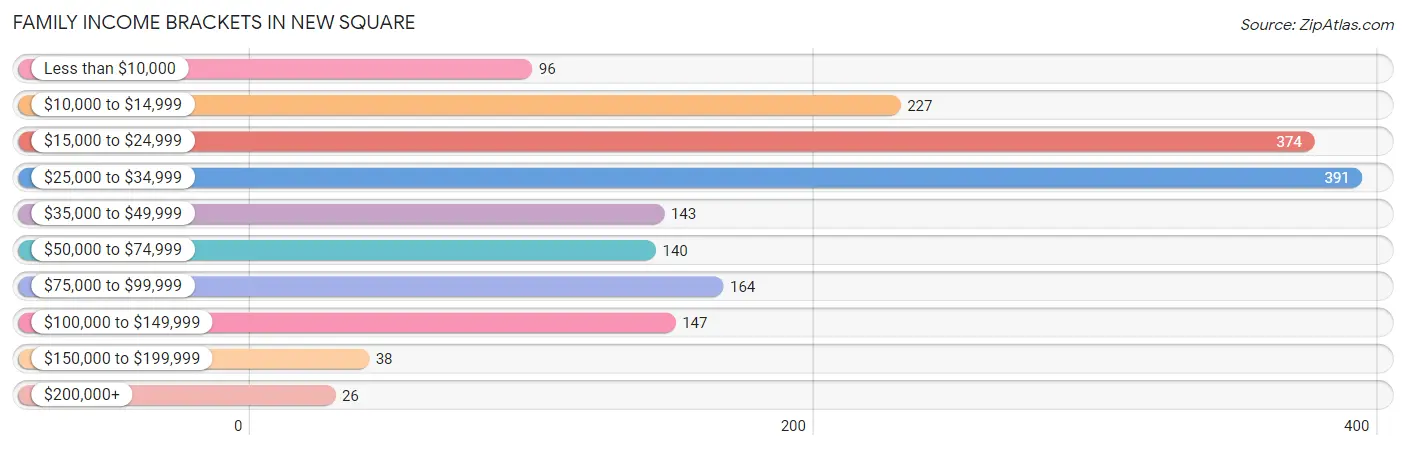
Family Income Brackets in New Square
According to the New Square family income data, there are 391 families falling into the $25,000 to $34,999 income range, which is the most common income bracket and makes up 22.4% of all families. Conversely, the $200,000+ income bracket is the least frequent group with only 26 families (1.5%) belonging to this category.
| Income Bracket | # Families | % Families |
| Less than $10,000 | 96 | 5.5% |
| $10,000 to $14,999 | 227 | 13.0% |
| $15,000 to $24,999 | 374 | 21.4% |
| $25,000 to $34,999 | 391 | 22.4% |
| $35,000 to $49,999 | 143 | 8.2% |
| $50,000 to $74,999 | 140 | 8.0% |
| $75,000 to $99,999 | 164 | 9.4% |
| $100,000 to $149,999 | 147 | 8.4% |
| $150,000 to $199,999 | 38 | 2.2% |
| $200,000+ | 26 | 1.5% |
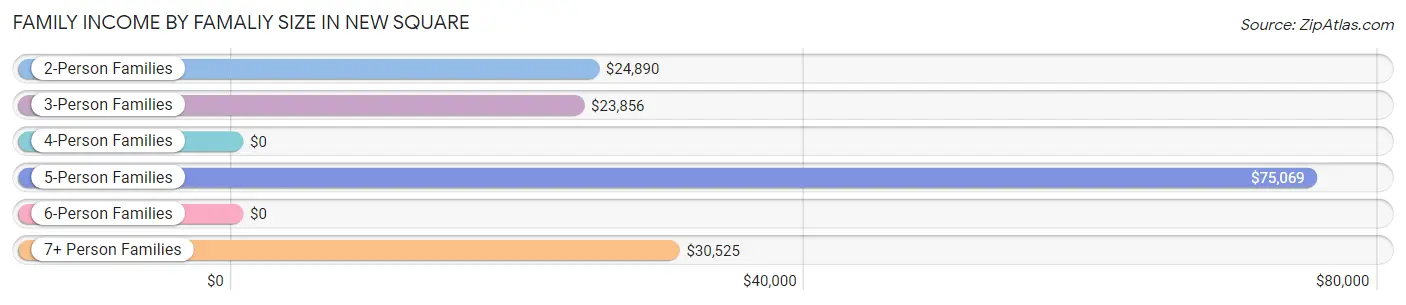
Family Income by Famaliy Size in New Square
5-person families (212 | 12.1%) account for the highest median family income in New Square with $75,069 per family, while 5-person families (212 | 12.1%) have the highest median income of $15,014 per family member.
| Income Bracket | # Families | Median Income |
| 2-Person Families | 197 (11.3%) | $24,890 |
| 3-Person Families | 262 (15.0%) | $23,856 |
| 4-Person Families | 268 (15.3%) | $0 |
| 5-Person Families | 212 (12.1%) | $75,069 |
| 6-Person Families | 231 (13.2%) | $0 |
| 7+ Person Families | 577 (33.0%) | $30,525 |
| Total | 1,747 (100.0%) | $27,438 |
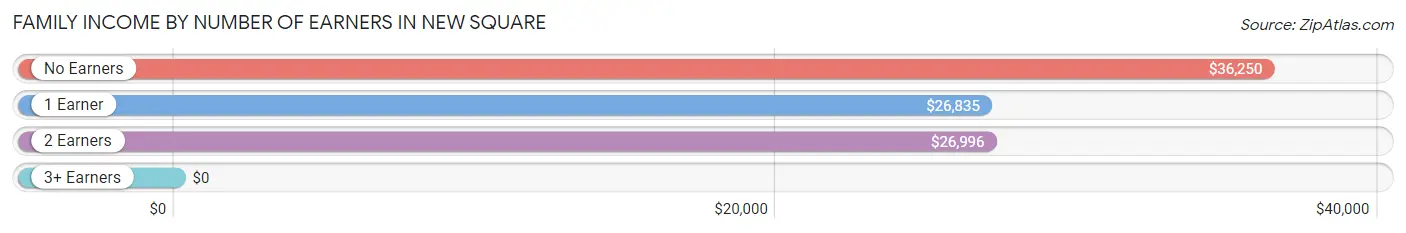
Family Income by Number of Earners in New Square
| Number of Earners | # Families | Median Income |
| No Earners | 28 (1.6%) | $36,250 |
| 1 Earner | 861 (49.3%) | $26,835 |
| 2 Earners | 762 (43.6%) | $26,996 |
| 3+ Earners | 96 (5.5%) | $0 |
| Total | 1,747 (100.0%) | $27,438 |
Household Income in New Square
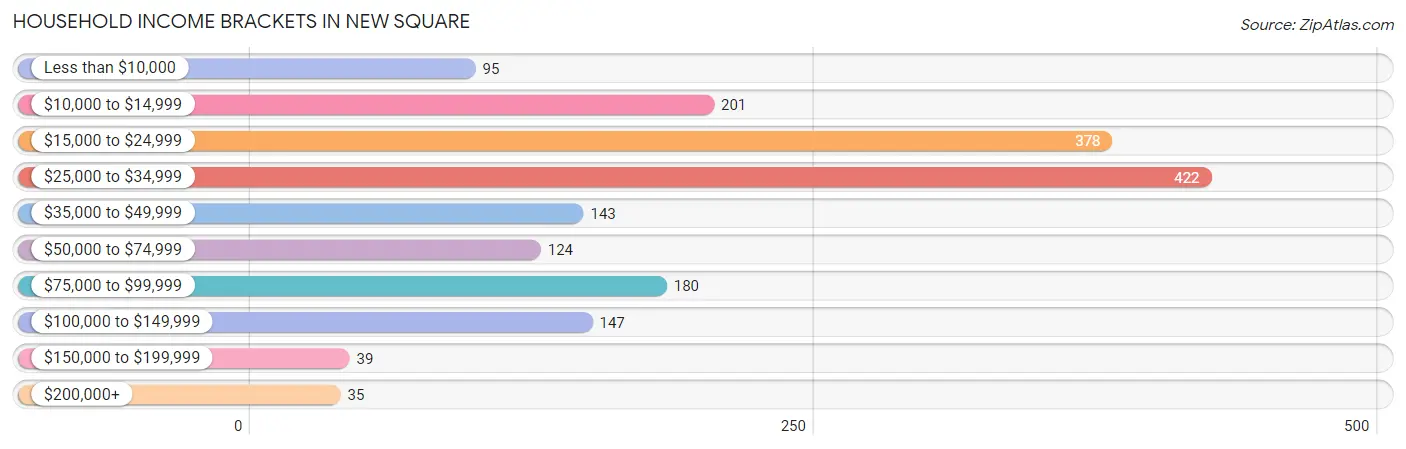
Household Income Brackets in New Square
With 422 households falling in the category, the $25,000 to $34,999 income range is the most frequent in New Square, accounting for 23.9% of all households. In contrast, only 35 households (2.0%) fall into the $200,000+ income bracket, making it the least populous group.
| Income Bracket | # Households | % Households |
| Less than $10,000 | 95 | 5.4% |
| $10,000 to $14,999 | 201 | 11.4% |
| $15,000 to $24,999 | 378 | 21.4% |
| $25,000 to $34,999 | 422 | 23.9% |
| $35,000 to $49,999 | 143 | 8.1% |
| $50,000 to $74,999 | 124 | 7.0% |
| $75,000 to $99,999 | 180 | 10.2% |
| $100,000 to $149,999 | 147 | 8.3% |
| $150,000 to $199,999 | 39 | 2.2% |
| $200,000+ | 35 | 2.0% |
Household Income by Householder Age in New Square
The median household income in New Square is $27,488, with the highest median household income of $37,708 found in the 65+ years age bracket for the primary householder. A total of 87 households (4.9%) fall into this category. Meanwhile, the 15 to 24 years age bracket for the primary householder has the lowest median household income of $19,107, with 350 households (19.8%) in this group.
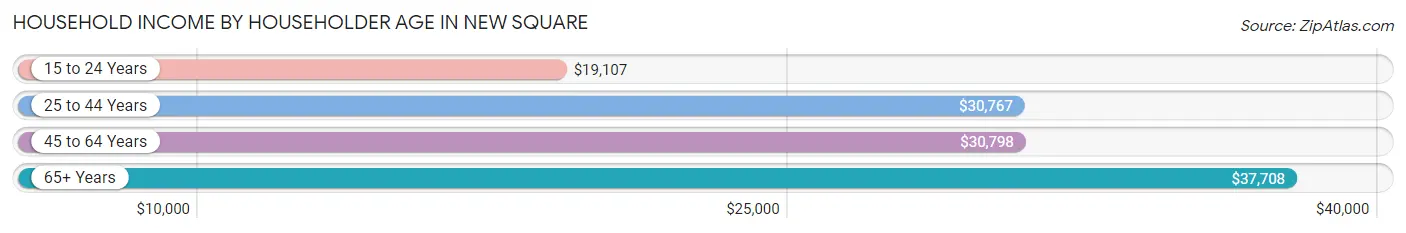
| Income Bracket | # Households | Median Income |
| 15 to 24 Years | 350 (19.8%) | $19,107 |
| 25 to 44 Years | 905 (51.2%) | $30,767 |
| 45 to 64 Years | 424 (24.0%) | $30,798 |
| 65+ Years | 87 (4.9%) | $37,708 |
| Total | 1,766 (100.0%) | $27,488 |
Poverty in New Square
Income Below Poverty by Sex and Age in New Square
With 67.8% poverty level for males and 60.5% for females among the residents of New Square, 5 year old males and 12 to 14 year old females are the most vulnerable to poverty, with 132 males (91.0%) and 257 females (77.9%) in their respective age groups living below the poverty level.
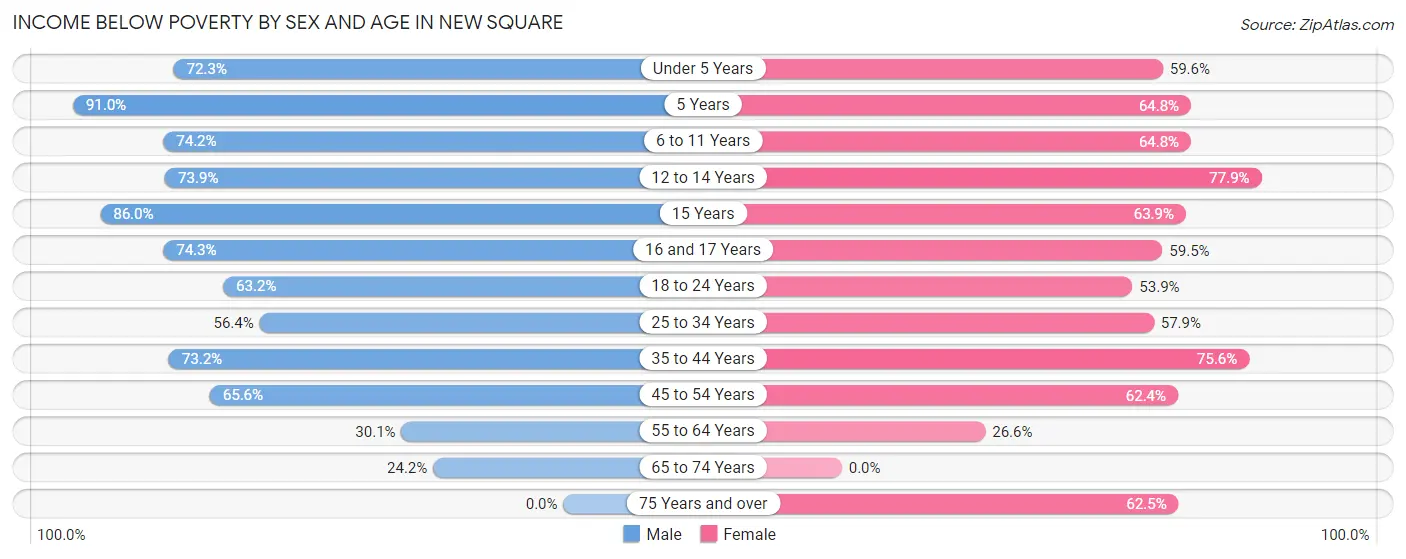
| Age Bracket | Male | Female |
| Under 5 Years | 476 (72.3%) | 488 (59.6%) |
| 5 Years | 132 (91.0%) | 116 (64.8%) |
| 6 to 11 Years | 660 (74.2%) | 670 (64.8%) |
| 12 to 14 Years | 329 (73.9%) | 257 (77.9%) |
| 15 Years | 159 (86.0%) | 83 (63.8%) |
| 16 and 17 Years | 248 (74.3%) | 122 (59.5%) |
| 18 to 24 Years | 425 (63.1%) | 315 (53.9%) |
| 25 to 34 Years | 366 (56.4%) | 333 (57.9%) |
| 35 to 44 Years | 246 (73.2%) | 220 (75.6%) |
| 45 to 54 Years | 145 (65.6%) | 174 (62.4%) |
| 55 to 64 Years | 52 (30.1%) | 57 (26.6%) |
| 65 to 74 Years | 22 (24.2%) | 0 (0.0%) |
| 75 Years and over | 0 (0.0%) | 15 (62.5%) |
| Total | 3,260 (67.8%) | 2,850 (60.5%) |
Income Above Poverty by Sex and Age in New Square
According to the poverty statistics in New Square, males aged 75 years and over and females aged 65 to 74 years are the age groups that are most secure financially, with 100.0% of males and 100.0% of females in these age groups living above the poverty line.
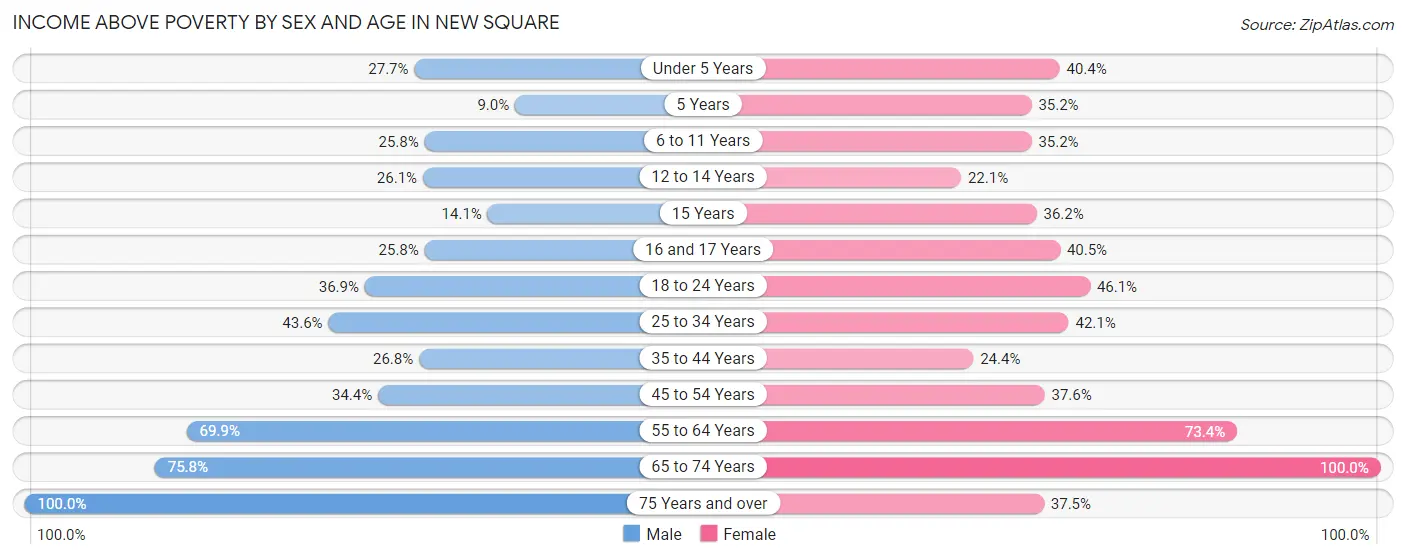
| Age Bracket | Male | Female |
| Under 5 Years | 182 (27.7%) | 331 (40.4%) |
| 5 Years | 13 (9.0%) | 63 (35.2%) |
| 6 to 11 Years | 229 (25.8%) | 364 (35.2%) |
| 12 to 14 Years | 116 (26.1%) | 73 (22.1%) |
| 15 Years | 26 (14.1%) | 47 (36.1%) |
| 16 and 17 Years | 86 (25.8%) | 83 (40.5%) |
| 18 to 24 Years | 248 (36.8%) | 269 (46.1%) |
| 25 to 34 Years | 283 (43.6%) | 242 (42.1%) |
| 35 to 44 Years | 90 (26.8%) | 71 (24.4%) |
| 45 to 54 Years | 76 (34.4%) | 105 (37.6%) |
| 55 to 64 Years | 121 (69.9%) | 157 (73.4%) |
| 65 to 74 Years | 69 (75.8%) | 49 (100.0%) |
| 75 Years and over | 8 (100.0%) | 9 (37.5%) |
| Total | 1,547 (32.2%) | 1,863 (39.5%) |
Income Below Poverty Among Married-Couple Families in New Square
The poverty statistics for married-couple families in New Square show that 55.3% or 920 of the total 1,665 families live below the poverty line. Families with 5 or more children have the highest poverty rate of 74.2%, comprising of 411 families. On the other hand, families with no children have the lowest poverty rate of 19.4%, which includes 38 families.
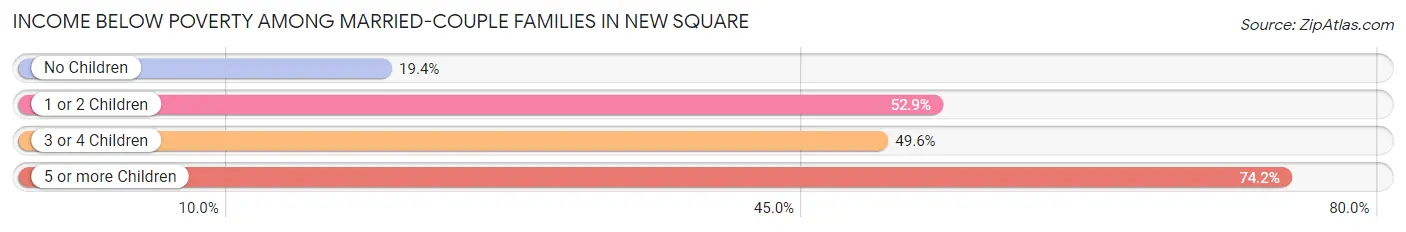
| Children | Above Poverty | Below Poverty |
| No Children | 158 (80.6%) | 38 (19.4%) |
| 1 or 2 Children | 240 (47.1%) | 270 (52.9%) |
| 3 or 4 Children | 204 (50.4%) | 201 (49.6%) |
| 5 or more Children | 143 (25.8%) | 411 (74.2%) |
| Total | 745 (44.7%) | 920 (55.3%) |
Income Below Poverty Among Single-Parent Households in New Square
According to the poverty data in New Square, 19.1% or 4 single-father households and 100.0% or 61 single-mother households are living below the poverty line. Among single-father households, those with 1 or 2 children have the highest poverty rate, with 4 households (19.1%) experiencing poverty. Likewise, among single-mother households, those with no children have the highest poverty rate, with 21 households (100.0%) falling below the poverty line.
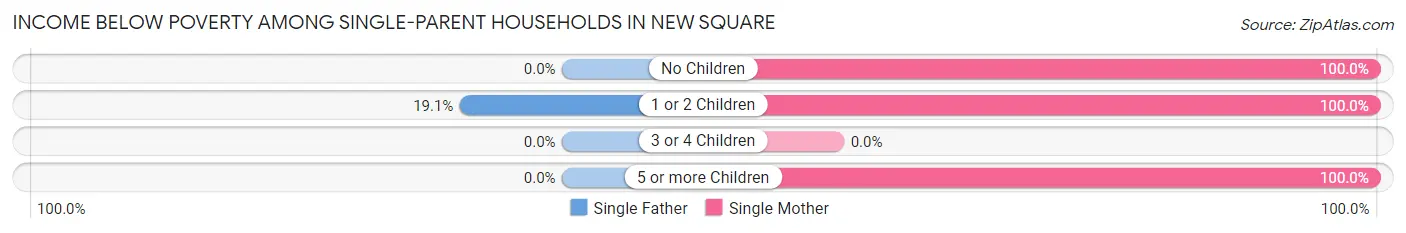
| Children | Single Father | Single Mother |
| No Children | 0 (0.0%) | 21 (100.0%) |
| 1 or 2 Children | 4 (19.1%) | 21 (100.0%) |
| 3 or 4 Children | 0 (0.0%) | 0 (0.0%) |
| 5 or more Children | 0 (0.0%) | 19 (100.0%) |
| Total | 4 (19.1%) | 61 (100.0%) |
Income Below Poverty Among Married-Couple vs Single-Parent Households in New Square
The poverty data for New Square shows that 920 of the married-couple family households (55.3%) and 65 of the single-parent households (79.3%) are living below the poverty level. Within the married-couple family households, those with 5 or more children have the highest poverty rate, with 411 households (74.2%) falling below the poverty line. Among the single-parent households, those with no children have the highest poverty rate, with 21 household (100.0%) living below poverty.
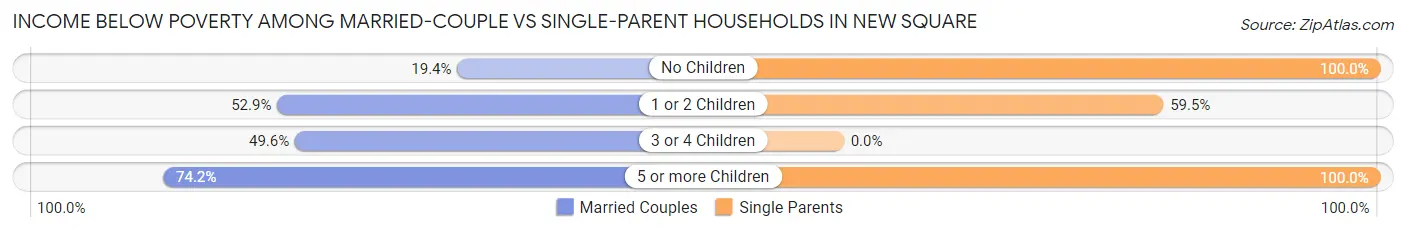
| Children | Married-Couple Families | Single-Parent Households |
| No Children | 38 (19.4%) | 21 (100.0%) |
| 1 or 2 Children | 270 (52.9%) | 25 (59.5%) |
| 3 or 4 Children | 201 (49.6%) | 0 (0.0%) |
| 5 or more Children | 411 (74.2%) | 19 (100.0%) |
| Total | 920 (55.3%) | 65 (79.3%) |
Race in New Square
The most populous races in New Square are White / Caucasian (9,428 | 98.4%), Two or more Races (92 | 1.0%), and Hispanic or Latino (36 | 0.4%).
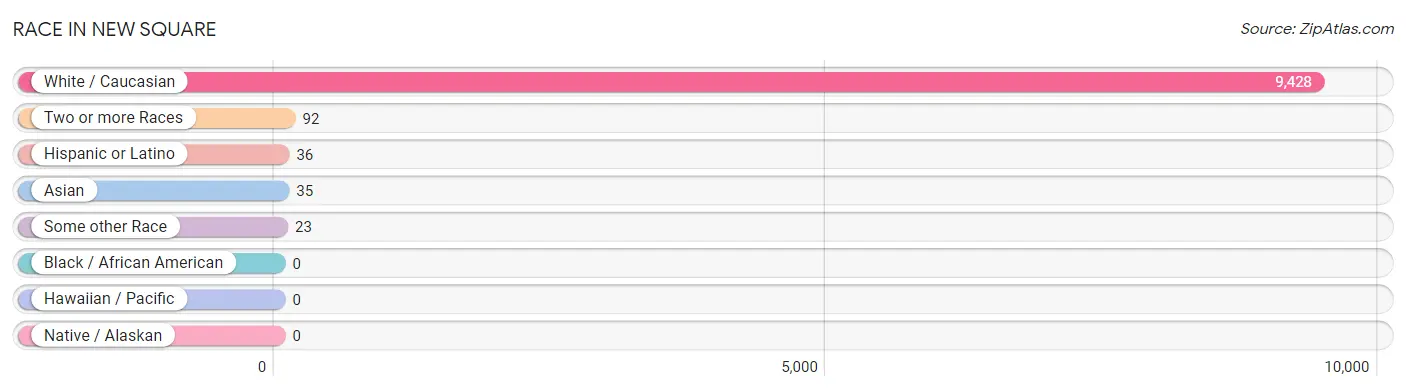
| Race | # Population | % Population |
| Asian | 35 | 0.4% |
| Black / African American | 0 | 0.0% |
| Hawaiian / Pacific | 0 | 0.0% |
| Hispanic or Latino | 36 | 0.4% |
| Native / Alaskan | 0 | 0.0% |
| White / Caucasian | 9,428 | 98.4% |
| Two or more Races | 92 | 1.0% |
| Some other Race | 23 | 0.2% |
| Total | 9,578 | 100.0% |
Ancestry in New Square
The most populous ancestries reported in New Square are Hungarian (3,731 | 39.0%), American (2,392 | 25.0%), Polish (619 | 6.5%), European (145 | 1.5%), and Romanian (137 | 1.4%), together accounting for 73.3% of all New Square residents.
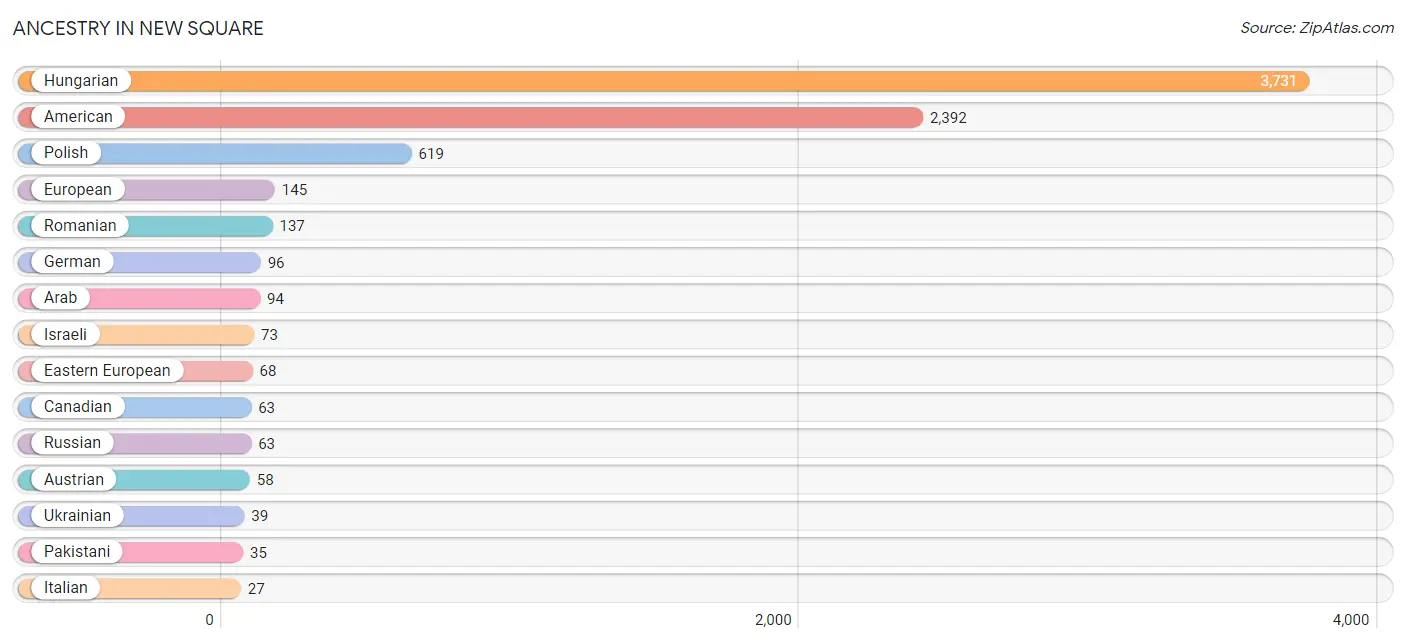
| Ancestry | # Population | % Population |
| Alsatian | 16 | 0.2% |
| American | 2,392 | 25.0% |
| Arab | 94 | 1.0% |
| Armenian | 23 | 0.2% |
| Austrian | 58 | 0.6% |
| Canadian | 63 | 0.7% |
| Czech | 17 | 0.2% |
| Czechoslovakian | 10 | 0.1% |
| Danish | 5 | 0.1% |
| Eastern European | 68 | 0.7% |
| English | 21 | 0.2% |
| European | 145 | 1.5% |
| German | 96 | 1.0% |
| Hungarian | 3,731 | 39.0% |
| Irish | 5 | 0.1% |
| Israeli | 73 | 0.8% |
| Italian | 27 | 0.3% |
| Norwegian | 16 | 0.2% |
| Pakistani | 35 | 0.4% |
| Polish | 619 | 6.5% |
| Puerto Rican | 1 | 0.0% |
| Romanian | 137 | 1.4% |
| Russian | 63 | 0.7% |
| Swedish | 17 | 0.2% |
| Swiss | 19 | 0.2% |
| Ukrainian | 39 | 0.4% | View All 26 Rows |
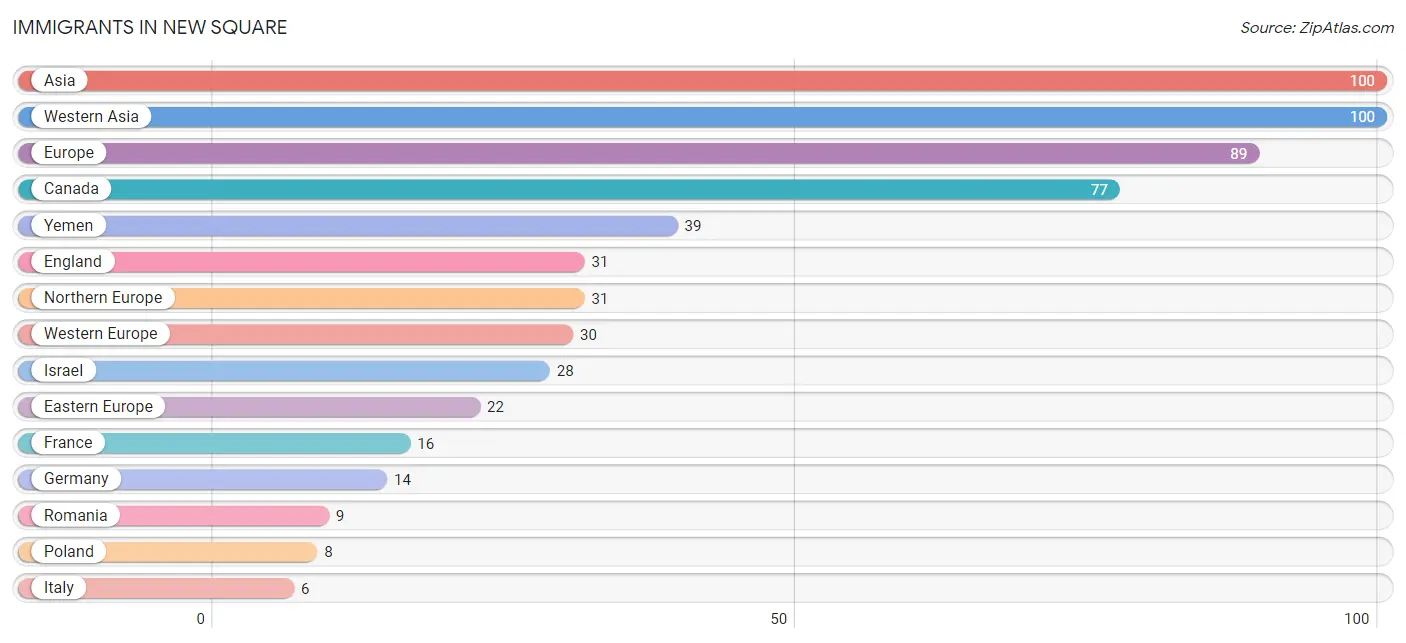
Immigrants in New Square
The most numerous immigrant groups reported in New Square came from Asia (100 | 1.0%), Western Asia (100 | 1.0%), Europe (89 | 0.9%), Canada (77 | 0.8%), and Yemen (39 | 0.4%), together accounting for 4.2% of all New Square residents.
| Immigration Origin | # Population | % Population |
| Asia | 100 | 1.0% |
| Canada | 77 | 0.8% |
| Czechoslovakia | 5 | 0.1% |
| Eastern Europe | 22 | 0.2% |
| England | 31 | 0.3% |
| Europe | 89 | 0.9% |
| France | 16 | 0.2% |
| Germany | 14 | 0.2% |
| Israel | 28 | 0.3% |
| Italy | 6 | 0.1% |
| Northern Europe | 31 | 0.3% |
| Poland | 8 | 0.1% |
| Romania | 9 | 0.1% |
| Southern Europe | 6 | 0.1% |
| Western Asia | 100 | 1.0% |
| Western Europe | 30 | 0.3% |
| Yemen | 39 | 0.4% | View All 17 Rows |
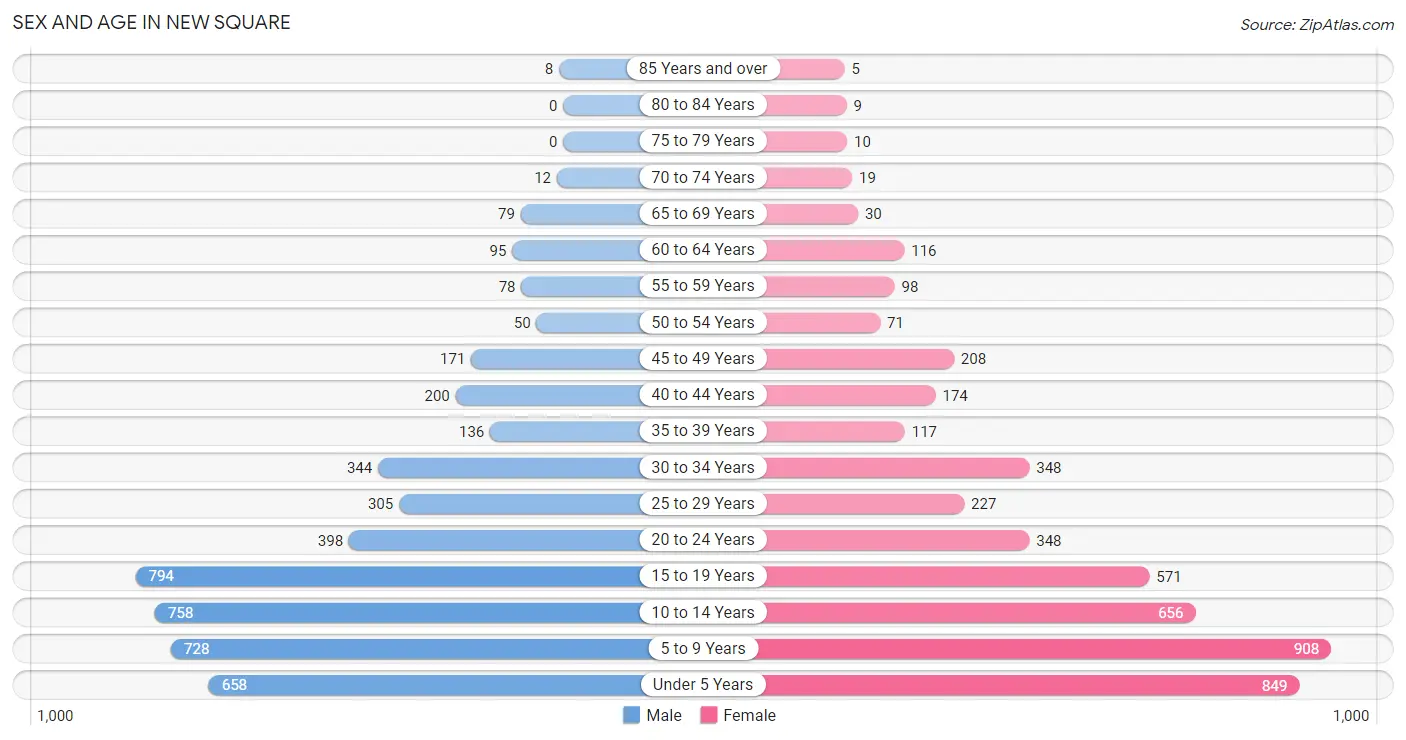
Sex and Age in New Square
Sex and Age in New Square
The most populous age groups in New Square are 15 to 19 Years (794 | 16.5%) for men and 5 to 9 Years (908 | 19.1%) for women.
| Age Bracket | Male | Female |
| Under 5 Years | 658 (13.7%) | 849 (17.8%) |
| 5 to 9 Years | 728 (15.1%) | 908 (19.1%) |
| 10 to 14 Years | 758 (15.8%) | 656 (13.8%) |
| 15 to 19 Years | 794 (16.5%) | 571 (12.0%) |
| 20 to 24 Years | 398 (8.3%) | 348 (7.3%) |
| 25 to 29 Years | 305 (6.3%) | 227 (4.8%) |
| 30 to 34 Years | 344 (7.1%) | 348 (7.3%) |
| 35 to 39 Years | 136 (2.8%) | 117 (2.5%) |
| 40 to 44 Years | 200 (4.2%) | 174 (3.6%) |
| 45 to 49 Years | 171 (3.5%) | 208 (4.4%) |
| 50 to 54 Years | 50 (1.0%) | 71 (1.5%) |
| 55 to 59 Years | 78 (1.6%) | 98 (2.1%) |
| 60 to 64 Years | 95 (2.0%) | 116 (2.4%) |
| 65 to 69 Years | 79 (1.6%) | 30 (0.6%) |
| 70 to 74 Years | 12 (0.3%) | 19 (0.4%) |
| 75 to 79 Years | 0 (0.0%) | 10 (0.2%) |
| 80 to 84 Years | 0 (0.0%) | 9 (0.2%) |
| 85 Years and over | 8 (0.2%) | 5 (0.1%) |
| Total | 4,814 (100.0%) | 4,764 (100.0%) |
Families and Households in New Square
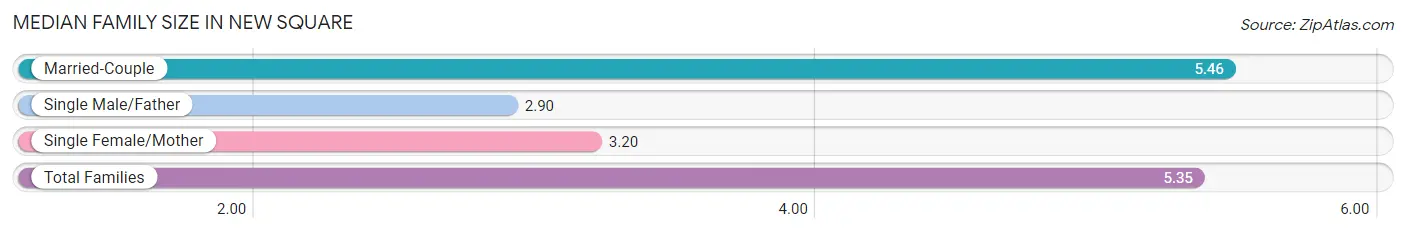
Median Family Size in New Square
The median family size in New Square is 5.35 persons per family, with married-couple families (1,665 | 95.3%) accounting for the largest median family size of 5.46 persons per family. On the other hand, single male/father families (21 | 1.2%) represent the smallest median family size with 2.90 persons per family.
| Family Type | # Families | Family Size |
| Married-Couple | 1,665 (95.3%) | 5.46 |
| Single Male/Father | 21 (1.2%) | 2.90 |
| Single Female/Mother | 61 (3.5%) | 3.20 |
| Total Families | 1,747 (100.0%) | 5.35 |
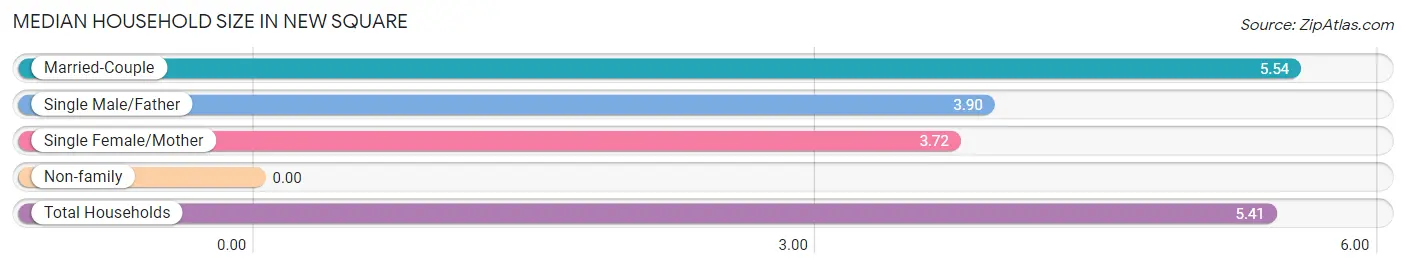
Median Household Size in New Square
| Household Type | # Households | Household Size |
| Married-Couple | 1,665 (94.3%) | 5.54 |
| Single Male/Father | 21 (1.2%) | 3.90 |
| Single Female/Mother | 61 (3.5%) | 3.72 |
| Non-family | 19 (1.1%) | - |
| Total Households | 1,766 (100.0%) | 5.41 |
Household Size by Marriage Status in New Square
Out of a total of 1,766 households in New Square, 1,747 (98.9%) are family households, while 19 (1.1%) are nonfamily households. The most numerous type of family households are 7+ person households, comprising 586, and the most common type of nonfamily households are 1-person households, comprising 19.
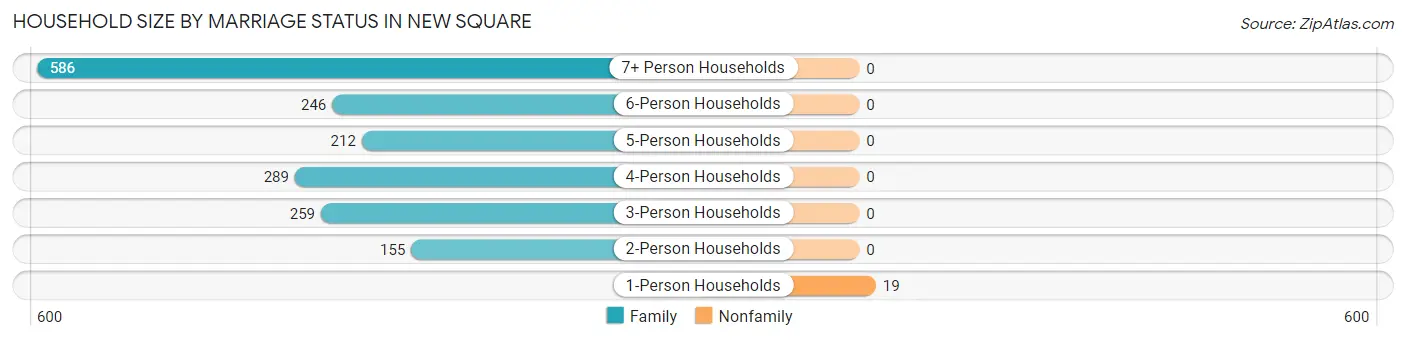
| Household Size | Family Households | Nonfamily Households |
| 1-Person Households | - | 19 (1.1%) |
| 2-Person Households | 155 (8.8%) | 0 (0.0%) |
| 3-Person Households | 259 (14.7%) | 0 (0.0%) |
| 4-Person Households | 289 (16.4%) | 0 (0.0%) |
| 5-Person Households | 212 (12.0%) | 0 (0.0%) |
| 6-Person Households | 246 (13.9%) | 0 (0.0%) |
| 7+ Person Households | 586 (33.2%) | 0 (0.0%) |
| Total | 1,747 (98.9%) | 19 (1.1%) |
Female Fertility in New Square
Fertility by Age in New Square
Average fertility rate in New Square is 201.0 births per 1,000 women. Women in the age bracket of 20 to 34 years have the highest fertility rate with 327.0 births per 1,000 women. Women in the age bracket of 20 to 34 years acount for 75.1% of all women with births.
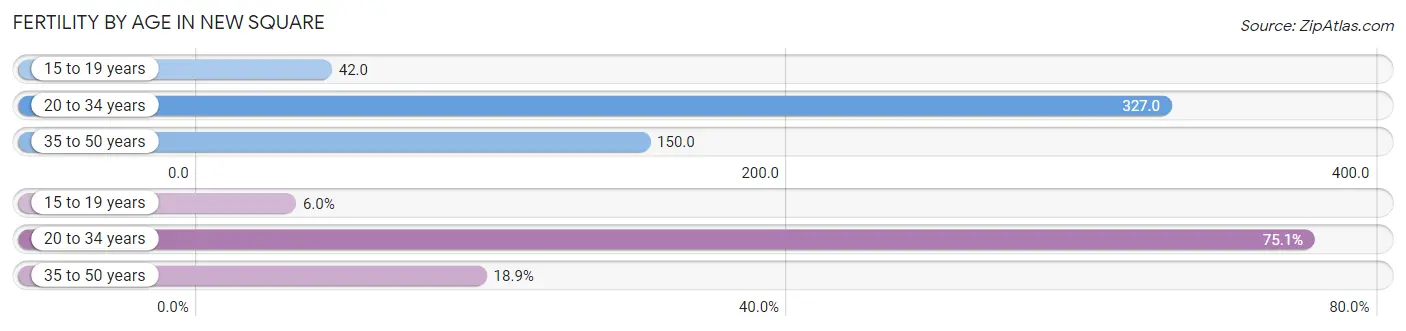
| Age Bracket | Women with Births | Births / 1,000 Women |
| 15 to 19 years | 24 (6.0%) | 42.0 |
| 20 to 34 years | 302 (75.1%) | 327.0 |
| 35 to 50 years | 76 (18.9%) | 150.0 |
| Total | 402 (100.0%) | 201.0 |
Fertility by Age by Marriage Status in New Square
94.0% of women with births (402) in New Square are married. The highest percentage of unmarried women with births falls into 15 to 19 years age bracket with 100.0% of them unmarried at the time of birth, while the lowest percentage of unmarried women with births belong to 20 to 34 years age bracket with 0.0% of them unmarried.
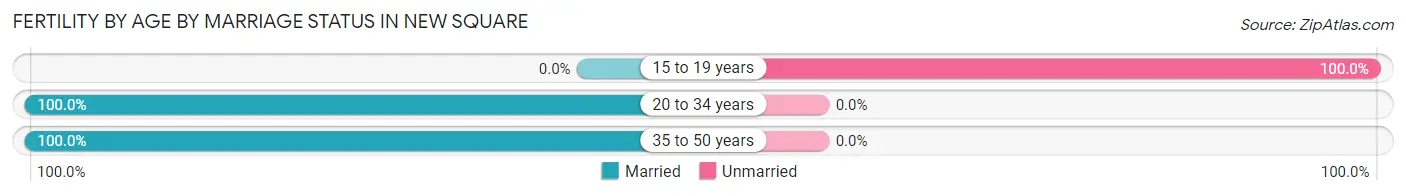
| Age Bracket | Married | Unmarried |
| 15 to 19 years | 0 (0.0%) | 24 (100.0%) |
| 20 to 34 years | 302 (100.0%) | 0 (0.0%) |
| 35 to 50 years | 76 (100.0%) | 0 (0.0%) |
| Total | 378 (94.0%) | 24 (6.0%) |
Fertility by Education in New Square
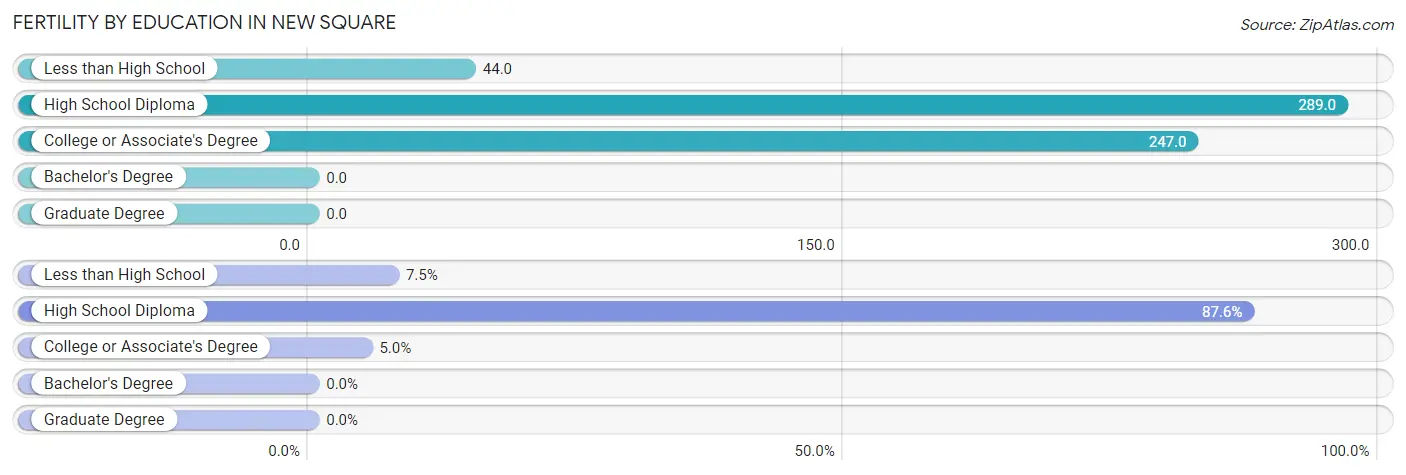
| Educational Attainment | Women with Births | Births / 1,000 Women |
| Less than High School | 30 (7.5%) | 44.0 |
| High School Diploma | 352 (87.6%) | 289.0 |
| College or Associate's Degree | 20 (5.0%) | 247.0 |
| Bachelor's Degree | 0 (0.0%) | 0.0 |
| Graduate Degree | 0 (0.0%) | 0.0 |
| Total | 402 (100.0%) | 201.0 |
Fertility by Education by Marriage Status in New Square
6.0% of women with births in New Square are unmarried. Women with the educational attainment of high school diploma are most likely to be married with 100.0% of them married at childbirth, while women with the educational attainment of less than high school are least likely to be married with 80.0% of them unmarried at childbirth.
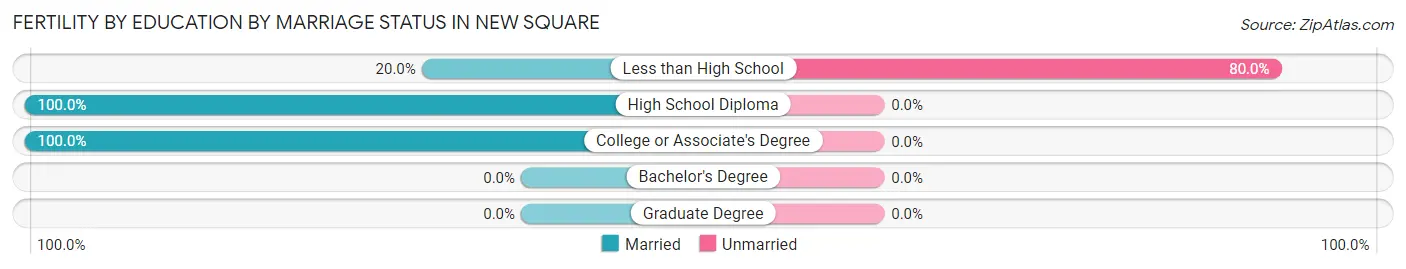
| Educational Attainment | Married | Unmarried |
| Less than High School | 6 (20.0%) | 24 (80.0%) |
| High School Diploma | 352 (100.0%) | 0 (0.0%) |
| College or Associate's Degree | 20 (100.0%) | 0 (0.0%) |
| Bachelor's Degree | 0 (0.0%) | 0 (0.0%) |
| Graduate Degree | 0 (0.0%) | 0 (0.0%) |
| Total | 378 (94.0%) | 24 (6.0%) |
Employment Characteristics in New Square
Employment by Class of Employer in New Square
Among the 2,539 employed individuals in New Square, not-for-profit organizations (1,246 | 49.1%), private company employees (1,144 | 45.1%), and self-employed (incorporated) (52 | 2.1%) make up the most common classes of employment.
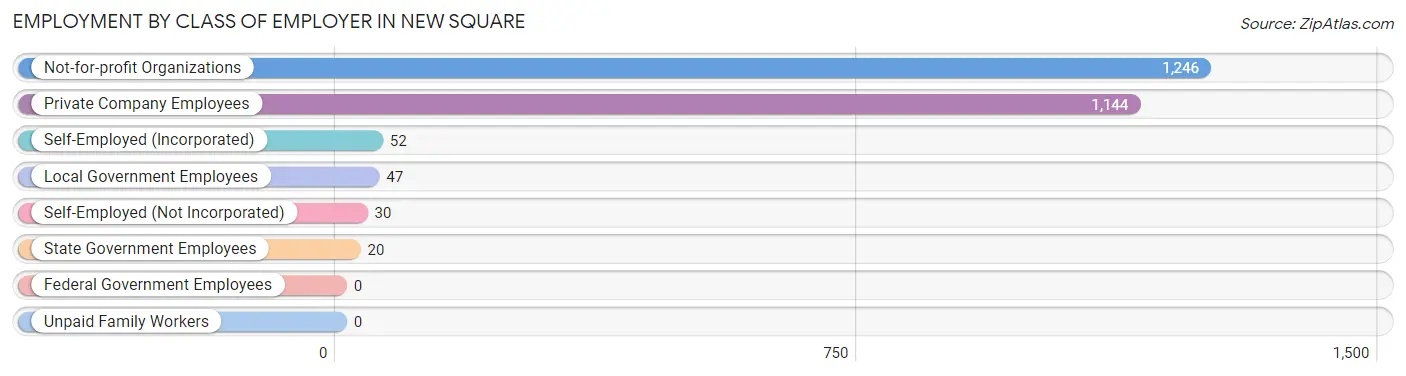
| Employer Class | # Employees | % Employees |
| Private Company Employees | 1,144 | 45.1% |
| Self-Employed (Incorporated) | 52 | 2.1% |
| Self-Employed (Not Incorporated) | 30 | 1.2% |
| Not-for-profit Organizations | 1,246 | 49.1% |
| Local Government Employees | 47 | 1.8% |
| State Government Employees | 20 | 0.8% |
| Federal Government Employees | 0 | 0.0% |
| Unpaid Family Workers | 0 | 0.0% |
| Total | 2,539 | 100.0% |
Employment Status by Age in New Square
According to the labor force statistics for New Square, out of the total population over 16 years of age (4,706), 59.8% or 2,814 individuals are in the labor force, with 8.1% or 228 of them unemployed. The age group with the highest labor force participation rate is 55 to 59 years, with 81.8% or 144 individuals in the labor force. Within the labor force, the 65 to 74 years age range has the highest percentage of unemployed individuals, with 24.0% or 18 of them being unemployed.
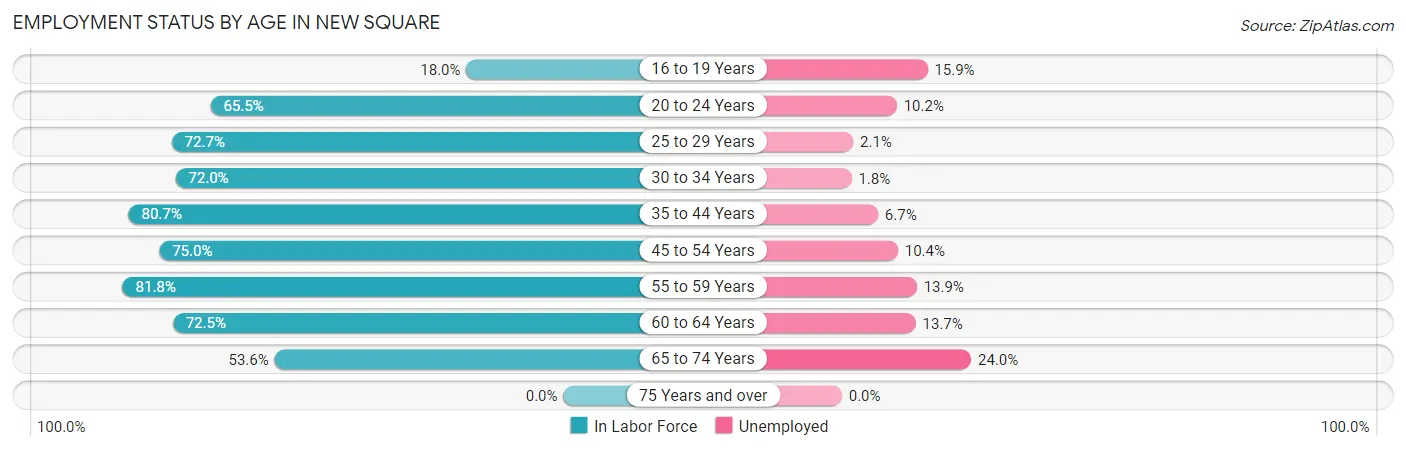
| Age Bracket | In Labor Force | Unemployed |
| 16 to 19 Years | 189 (18.0%) | 30 (15.9%) |
| 20 to 24 Years | 489 (65.5%) | 50 (10.2%) |
| 25 to 29 Years | 387 (72.7%) | 8 (2.1%) |
| 30 to 34 Years | 498 (72.0%) | 9 (1.8%) |
| 35 to 44 Years | 506 (80.7%) | 34 (6.7%) |
| 45 to 54 Years | 375 (75.0%) | 39 (10.4%) |
| 55 to 59 Years | 144 (81.8%) | 20 (13.9%) |
| 60 to 64 Years | 153 (72.5%) | 21 (13.7%) |
| 65 to 74 Years | 75 (53.6%) | 18 (24.0%) |
| 75 Years and over | 0 (0.0%) | 0 (0.0%) |
| Total | 2,814 (59.8%) | 228 (8.1%) |
Employment Status by Educational Attainment in New Square
According to labor force statistics for New Square, 75.3% of individuals (2,062) out of the total population between 25 and 64 years of age (2,738) are in the labor force, with 6.3% or 130 of them being unemployed. The group with the highest labor force participation rate are those with the educational attainment of bachelor's degree or higher, with 100.0% or 53 individuals in the labor force. Within the labor force, individuals with less than high school education have the highest percentage of unemployment, with 13.1% or 55 of them being unemployed.
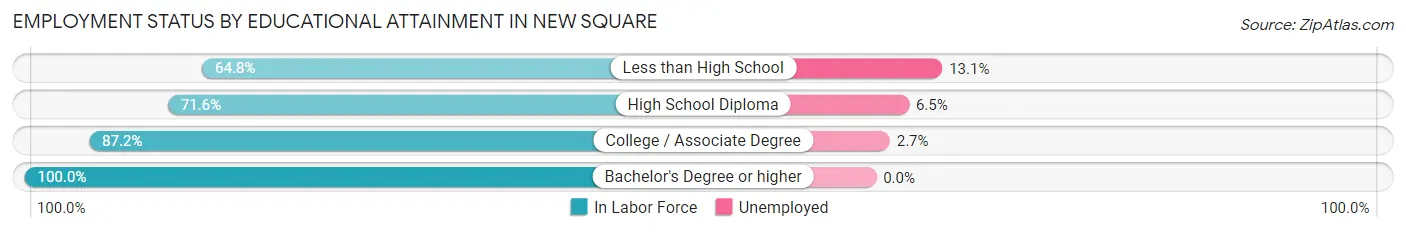
| Educational Attainment | In Labor Force | Unemployed |
| Less than High School | 419 (64.8%) | 85 (13.1%) |
| High School Diploma | 855 (71.6%) | 78 (6.5%) |
| College / Associate Degree | 736 (87.2%) | 23 (2.7%) |
| Bachelor's Degree or higher | 53 (100.0%) | 0 (0.0%) |
| Total | 2,062 (75.3%) | 172 (6.3%) |
Employment Occupations by Sex in New Square
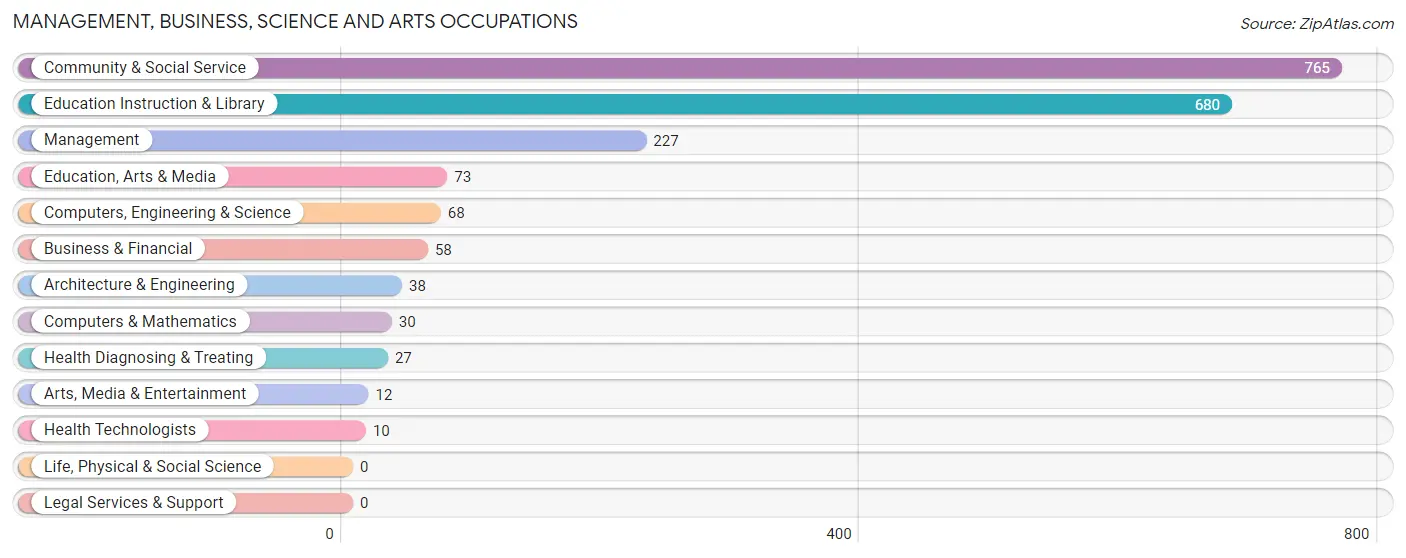
Management, Business, Science and Arts Occupations
The most common Management, Business, Science and Arts occupations in New Square are Community & Social Service (765 | 29.6%), Education Instruction & Library (680 | 26.3%), Management (227 | 8.8%), Education, Arts & Media (73 | 2.8%), and Computers, Engineering & Science (68 | 2.6%).
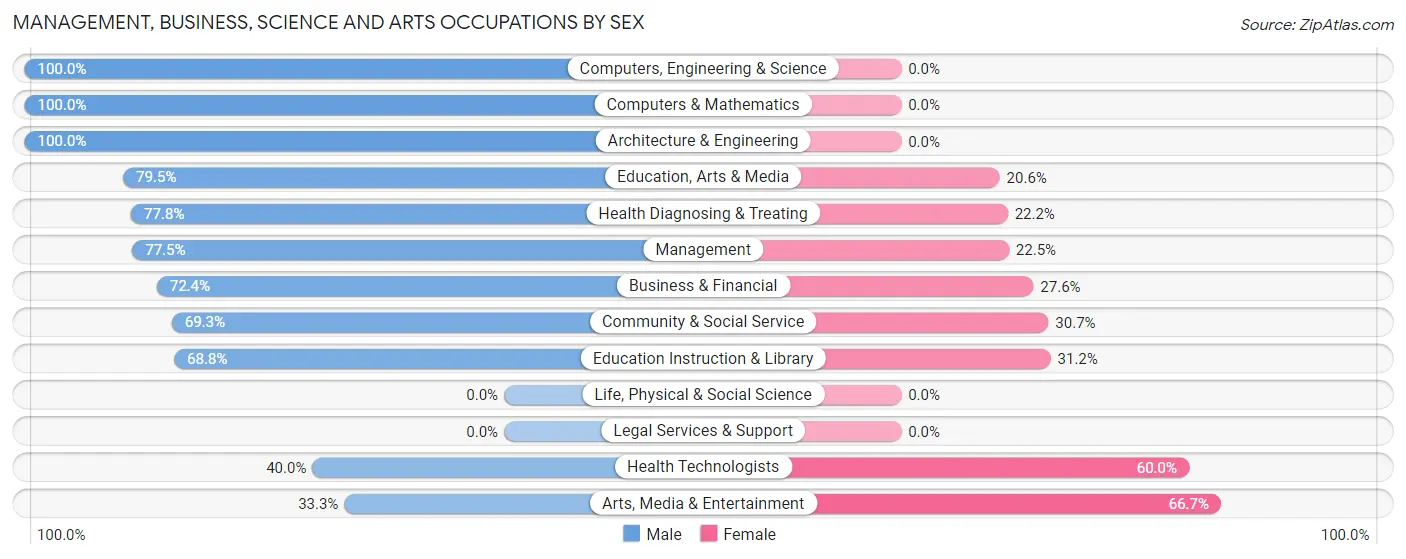
Management, Business, Science and Arts Occupations by Sex
Within the Management, Business, Science and Arts occupations in New Square, the most male-oriented occupations are Computers, Engineering & Science (100.0%), Computers & Mathematics (100.0%), and Architecture & Engineering (100.0%), while the most female-oriented occupations are Arts, Media & Entertainment (66.7%), Health Technologists (60.0%), and Education Instruction & Library (31.2%).
| Occupation | Male | Female |
| Management | 176 (77.5%) | 51 (22.5%) |
| Business & Financial | 42 (72.4%) | 16 (27.6%) |
| Computers, Engineering & Science | 68 (100.0%) | 0 (0.0%) |
| Computers & Mathematics | 30 (100.0%) | 0 (0.0%) |
| Architecture & Engineering | 38 (100.0%) | 0 (0.0%) |
| Life, Physical & Social Science | 0 (0.0%) | 0 (0.0%) |
| Community & Social Service | 530 (69.3%) | 235 (30.7%) |
| Education, Arts & Media | 58 (79.4%) | 15 (20.5%) |
| Legal Services & Support | 0 (0.0%) | 0 (0.0%) |
| Education Instruction & Library | 468 (68.8%) | 212 (31.2%) |
| Arts, Media & Entertainment | 4 (33.3%) | 8 (66.7%) |
| Health Diagnosing & Treating | 21 (77.8%) | 6 (22.2%) |
| Health Technologists | 4 (40.0%) | 6 (60.0%) |
| Total (Category) | 837 (73.1%) | 308 (26.9%) |
| Total (Overall) | 1,460 (56.4%) | 1,127 (43.6%) |
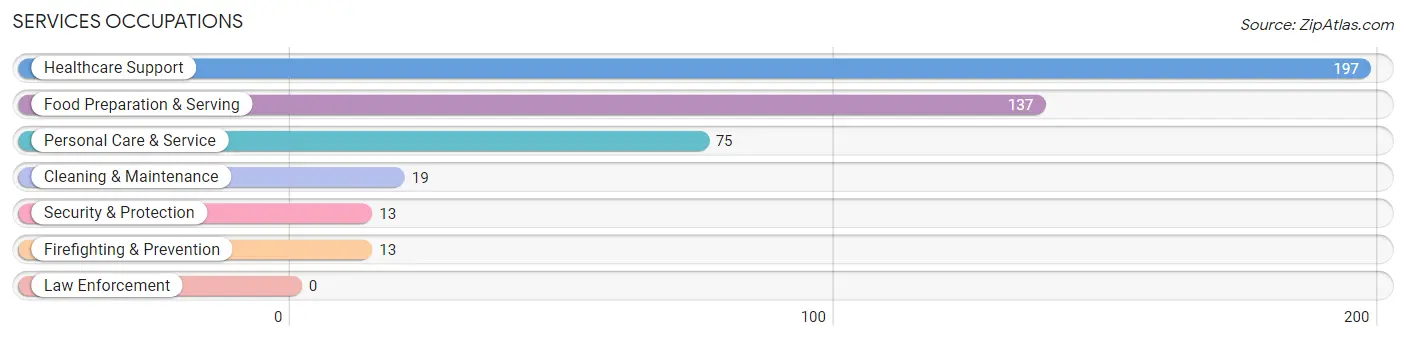
Services Occupations
The most common Services occupations in New Square are Healthcare Support (197 | 7.6%), Food Preparation & Serving (137 | 5.3%), Personal Care & Service (75 | 2.9%), Cleaning & Maintenance (19 | 0.7%), and Security & Protection (13 | 0.5%).
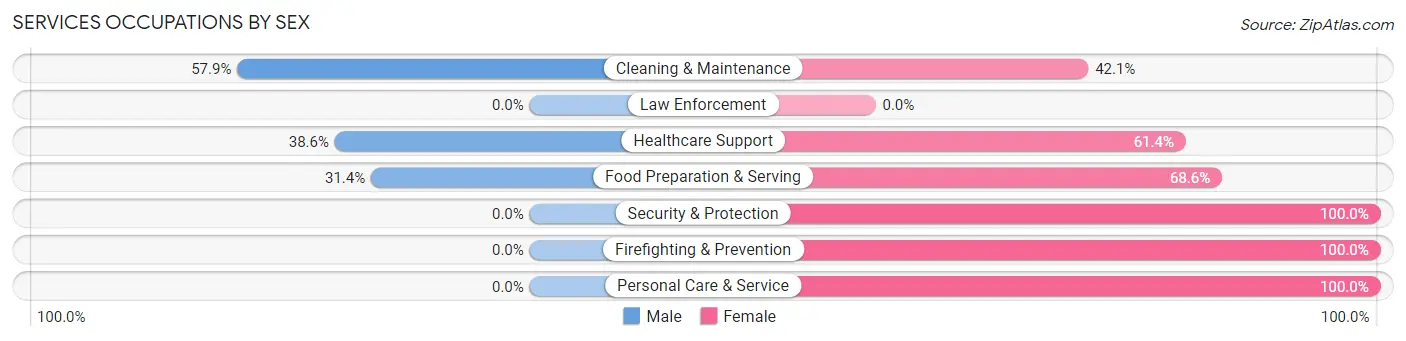
Services Occupations by Sex
Within the Services occupations in New Square, the most male-oriented occupations are Cleaning & Maintenance (57.9%), Healthcare Support (38.6%), and Food Preparation & Serving (31.4%), while the most female-oriented occupations are Security & Protection (100.0%), Firefighting & Prevention (100.0%), and Personal Care & Service (100.0%).
| Occupation | Male | Female |
| Healthcare Support | 76 (38.6%) | 121 (61.4%) |
| Security & Protection | 0 (0.0%) | 13 (100.0%) |
| Firefighting & Prevention | 0 (0.0%) | 13 (100.0%) |
| Law Enforcement | 0 (0.0%) | 0 (0.0%) |
| Food Preparation & Serving | 43 (31.4%) | 94 (68.6%) |
| Cleaning & Maintenance | 11 (57.9%) | 8 (42.1%) |
| Personal Care & Service | 0 (0.0%) | 75 (100.0%) |
| Total (Category) | 130 (29.5%) | 311 (70.5%) |
| Total (Overall) | 1,460 (56.4%) | 1,127 (43.6%) |
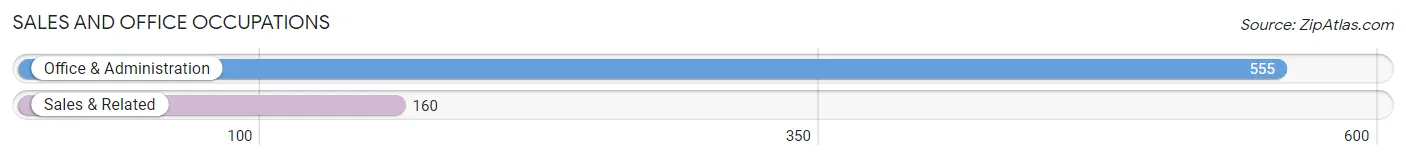
Sales and Office Occupations
The most common Sales and Office occupations in New Square are Office & Administration (555 | 21.4%), and Sales & Related (160 | 6.2%).
Sales and Office Occupations by Sex
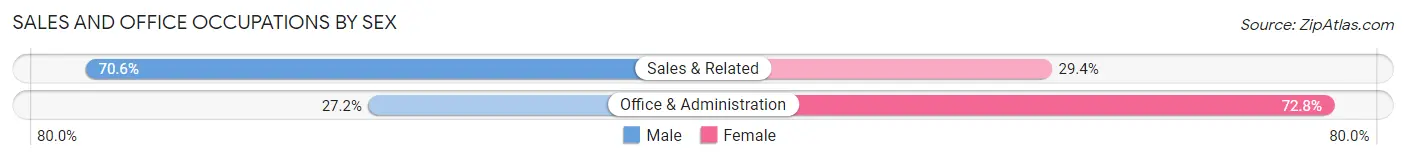
| Occupation | Male | Female |
| Sales & Related | 113 (70.6%) | 47 (29.4%) |
| Office & Administration | 151 (27.2%) | 404 (72.8%) |
| Total (Category) | 264 (36.9%) | 451 (63.1%) |
| Total (Overall) | 1,460 (56.4%) | 1,127 (43.6%) |
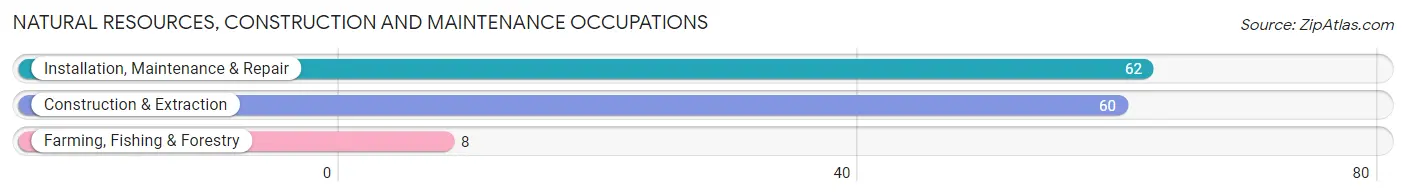
Natural Resources, Construction and Maintenance Occupations
The most common Natural Resources, Construction and Maintenance occupations in New Square are Installation, Maintenance & Repair (62 | 2.4%), Construction & Extraction (60 | 2.3%), and Farming, Fishing & Forestry (8 | 0.3%).
Natural Resources, Construction and Maintenance Occupations by Sex
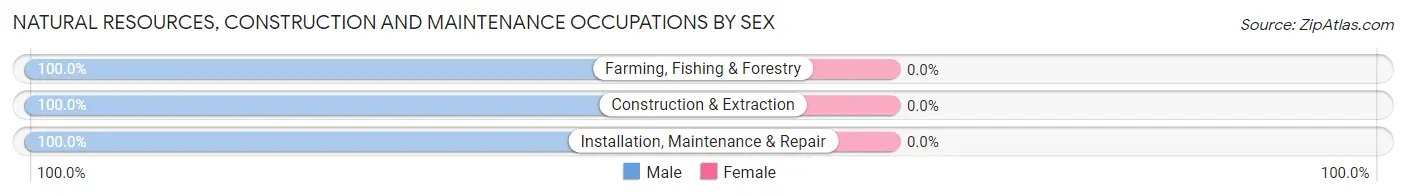
| Occupation | Male | Female |
| Farming, Fishing & Forestry | 8 (100.0%) | 0 (0.0%) |
| Construction & Extraction | 60 (100.0%) | 0 (0.0%) |
| Installation, Maintenance & Repair | 62 (100.0%) | 0 (0.0%) |
| Total (Category) | 130 (100.0%) | 0 (0.0%) |
| Total (Overall) | 1,460 (56.4%) | 1,127 (43.6%) |
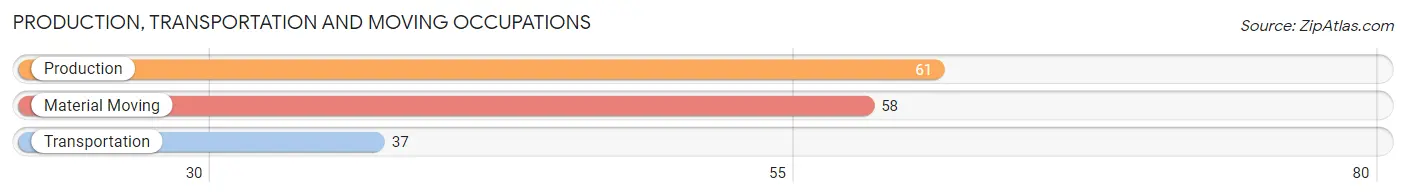
Production, Transportation and Moving Occupations
The most common Production, Transportation and Moving occupations in New Square are Production (61 | 2.4%), Material Moving (58 | 2.2%), and Transportation (37 | 1.4%).
Production, Transportation and Moving Occupations by Sex
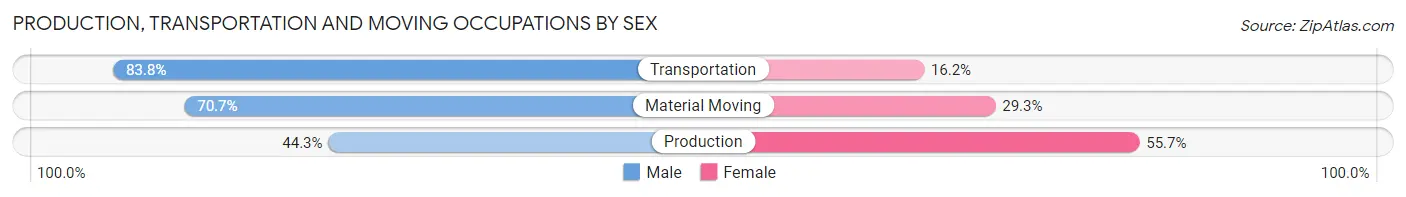
| Occupation | Male | Female |
| Production | 27 (44.3%) | 34 (55.7%) |
| Transportation | 31 (83.8%) | 6 (16.2%) |
| Material Moving | 41 (70.7%) | 17 (29.3%) |
| Total (Category) | 99 (63.5%) | 57 (36.5%) |
| Total (Overall) | 1,460 (56.4%) | 1,127 (43.6%) |
Employment Industries by Sex in New Square
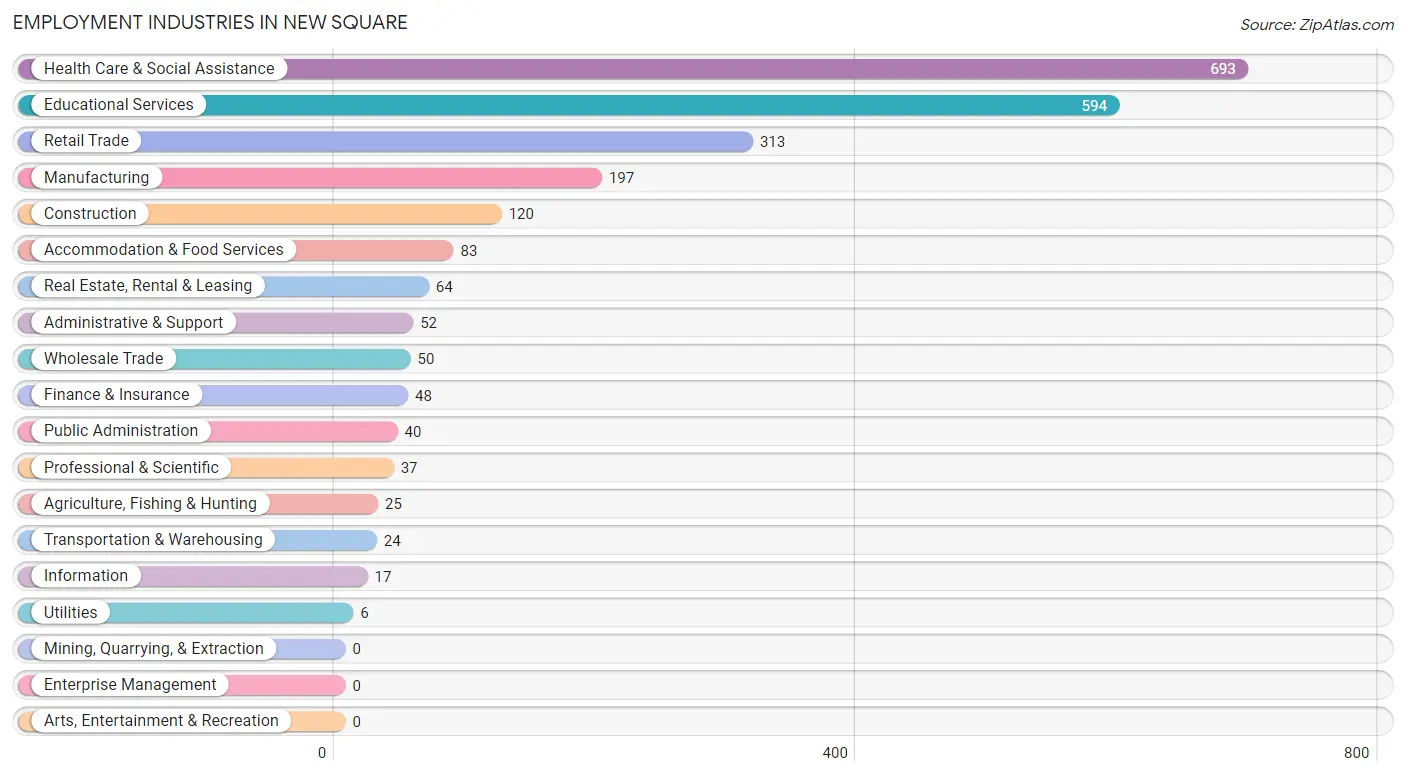
Employment Industries in New Square
The major employment industries in New Square include Health Care & Social Assistance (693 | 26.8%), Educational Services (594 | 23.0%), Retail Trade (313 | 12.1%), Manufacturing (197 | 7.6%), and Construction (120 | 4.6%).
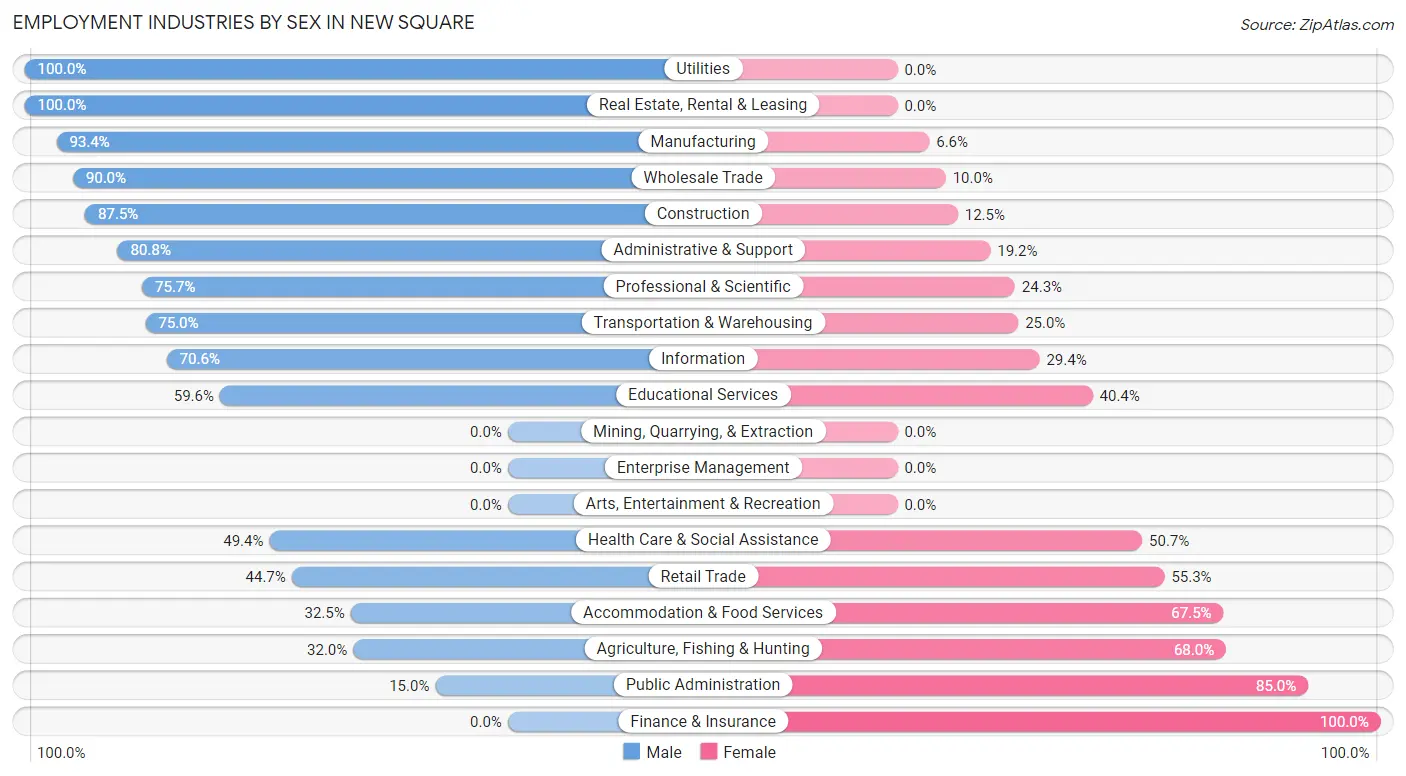
Employment Industries by Sex in New Square
The New Square industries that see more men than women are Utilities (100.0%), Real Estate, Rental & Leasing (100.0%), and Manufacturing (93.4%), whereas the industries that tend to have a higher number of women are Finance & Insurance (100.0%), Public Administration (85.0%), and Agriculture, Fishing & Hunting (68.0%).
| Industry | Male | Female |
| Agriculture, Fishing & Hunting | 8 (32.0%) | 17 (68.0%) |
| Mining, Quarrying, & Extraction | 0 (0.0%) | 0 (0.0%) |
| Construction | 105 (87.5%) | 15 (12.5%) |
| Manufacturing | 184 (93.4%) | 13 (6.6%) |
| Wholesale Trade | 45 (90.0%) | 5 (10.0%) |
| Retail Trade | 140 (44.7%) | 173 (55.3%) |
| Transportation & Warehousing | 18 (75.0%) | 6 (25.0%) |
| Utilities | 6 (100.0%) | 0 (0.0%) |
| Information | 12 (70.6%) | 5 (29.4%) |
| Finance & Insurance | 0 (0.0%) | 48 (100.0%) |
| Real Estate, Rental & Leasing | 64 (100.0%) | 0 (0.0%) |
| Professional & Scientific | 28 (75.7%) | 9 (24.3%) |
| Enterprise Management | 0 (0.0%) | 0 (0.0%) |
| Administrative & Support | 42 (80.8%) | 10 (19.2%) |
| Educational Services | 354 (59.6%) | 240 (40.4%) |
| Health Care & Social Assistance | 342 (49.3%) | 351 (50.6%) |
| Arts, Entertainment & Recreation | 0 (0.0%) | 0 (0.0%) |
| Accommodation & Food Services | 27 (32.5%) | 56 (67.5%) |
| Public Administration | 6 (15.0%) | 34 (85.0%) |
| Total | 1,460 (56.4%) | 1,127 (43.6%) |
Education in New Square
School Enrollment in New Square
The most common levels of schooling among the 4,922 students in New Square are elementary school (1,405 | 28.5%), middle school (1,320 | 26.8%), and high school (1,057 | 21.5%).
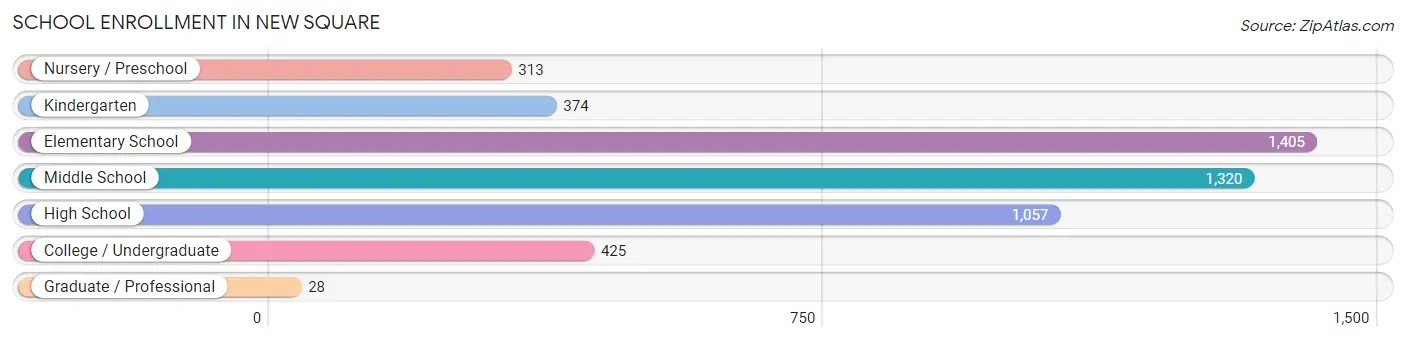
| School Level | # Students | % Students |
| Nursery / Preschool | 313 | 6.4% |
| Kindergarten | 374 | 7.6% |
| Elementary School | 1,405 | 28.5% |
| Middle School | 1,320 | 26.8% |
| High School | 1,057 | 21.5% |
| College / Undergraduate | 425 | 8.6% |
| Graduate / Professional | 28 | 0.6% |
| Total | 4,922 | 100.0% |
School Enrollment by Age by Funding Source in New Square
Out of a total of 4,922 students who are enrolled in schools in New Square, 4,671 (94.9%) attend a private institution, while the remaining 251 (5.1%) are enrolled in public schools. The age group of 25 to 34 year olds has the highest likelihood of being enrolled in private schools, with 24 (100.0% in the age bracket) enrolled. Conversely, the age group of 35 years and over has the lowest likelihood of being enrolled in a private school, with 6 (25.0% in the age bracket) attending a public institution.
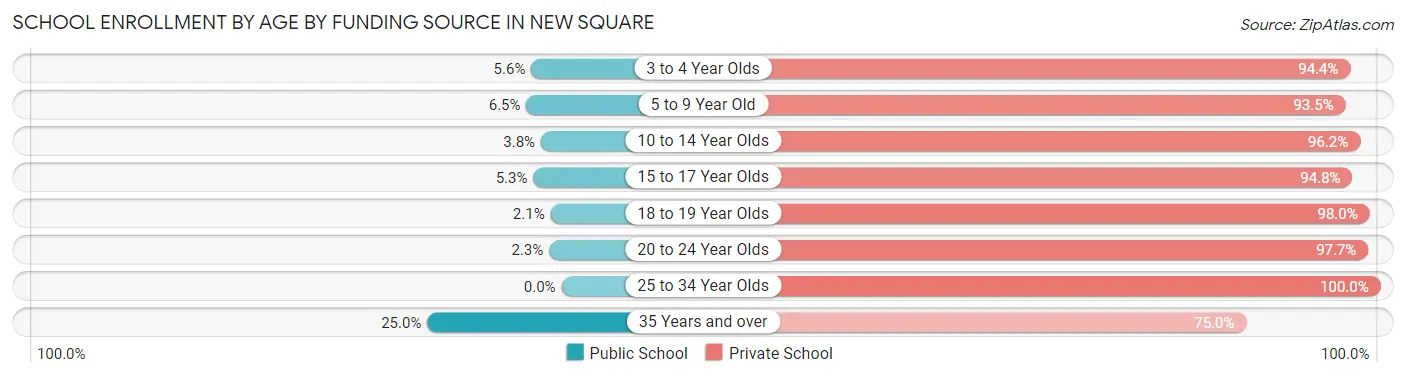
| Age Bracket | Public School | Private School |
| 3 to 4 Year Olds | 29 (5.6%) | 486 (94.4%) |
| 5 to 9 Year Old | 107 (6.5%) | 1,529 (93.5%) |
| 10 to 14 Year Olds | 54 (3.8%) | 1,360 (96.2%) |
| 15 to 17 Year Olds | 44 (5.2%) | 794 (94.8%) |
| 18 to 19 Year Olds | 7 (2.1%) | 334 (98.0%) |
| 20 to 24 Year Olds | 3 (2.3%) | 127 (97.7%) |
| 25 to 34 Year Olds | 0 (0.0%) | 24 (100.0%) |
| 35 Years and over | 6 (25.0%) | 18 (75.0%) |
| Total | 251 (5.1%) | 4,671 (94.9%) |
Educational Attainment by Field of Study in New Square
Education (22 | 31.4%), liberal arts & history (22 | 31.4%), social sciences (10 | 14.3%), physical & health sciences (6 | 8.6%), and bio, nature & agricultural (5 | 7.1%) are the most common fields of study among 70 individuals in New Square who have obtained a bachelor's degree or higher.
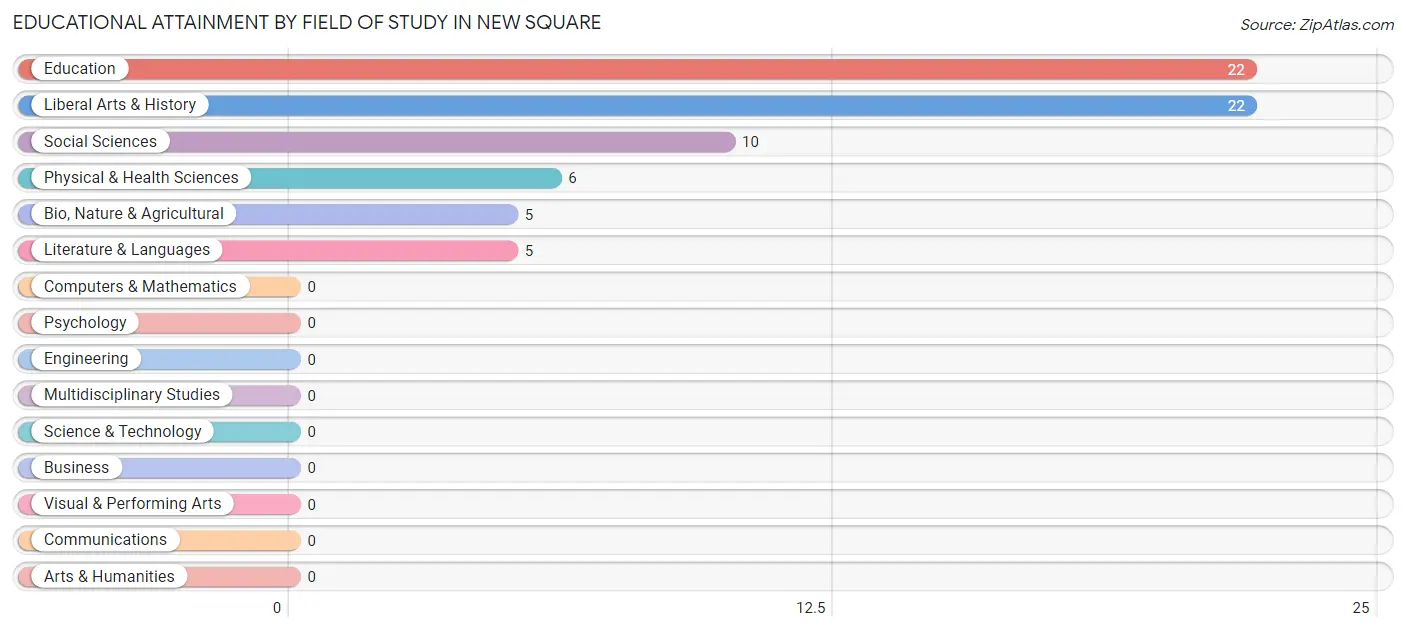
| Field of Study | # Graduates | % Graduates |
| Computers & Mathematics | 0 | 0.0% |
| Bio, Nature & Agricultural | 5 | 7.1% |
| Physical & Health Sciences | 6 | 8.6% |
| Psychology | 0 | 0.0% |
| Social Sciences | 10 | 14.3% |
| Engineering | 0 | 0.0% |
| Multidisciplinary Studies | 0 | 0.0% |
| Science & Technology | 0 | 0.0% |
| Business | 0 | 0.0% |
| Education | 22 | 31.4% |
| Literature & Languages | 5 | 7.1% |
| Liberal Arts & History | 22 | 31.4% |
| Visual & Performing Arts | 0 | 0.0% |
| Communications | 0 | 0.0% |
| Arts & Humanities | 0 | 0.0% |
| Total | 70 | 100.0% |
Transportation & Commute in New Square
Vehicle Availability by Sex in New Square
The most prevalent vehicle ownership categories in New Square are males with no vehicle (855, accounting for 58.6%) and females with no vehicle (720, making up 79.2%).
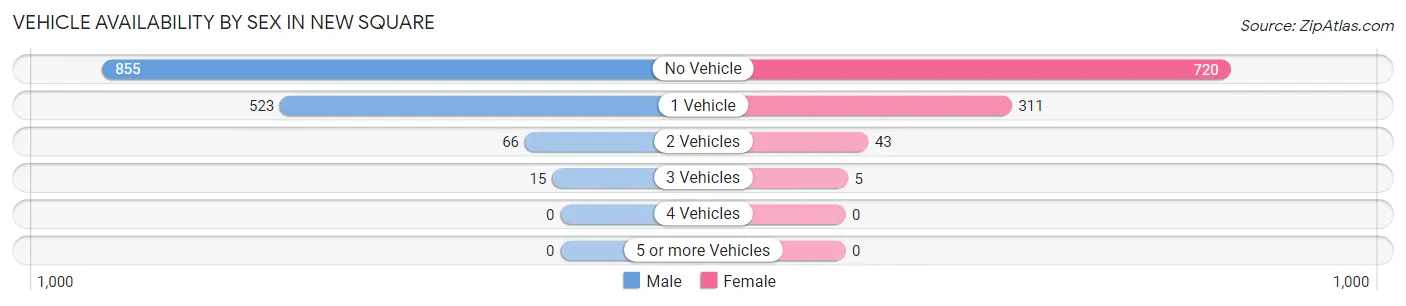
| Vehicles Available | Male | Female |
| No Vehicle | 855 (58.6%) | 720 (66.7%) |
| 1 Vehicle | 523 (35.8%) | 311 (28.8%) |
| 2 Vehicles | 66 (4.5%) | 43 (4.0%) |
| 3 Vehicles | 15 (1.0%) | 5 (0.5%) |
| 4 Vehicles | 0 (0.0%) | 0 (0.0%) |
| 5 or more Vehicles | 0 (0.0%) | 0 (0.0%) |
| Total | 1,459 (100.0%) | 1,079 (100.0%) |
Commute Time in New Square
The most frequently occuring commute durations in New Square are 5 to 9 minutes (720 commuters, 30.1%), 10 to 14 minutes (537 commuters, 22.5%), and 15 to 19 minutes (519 commuters, 21.7%).
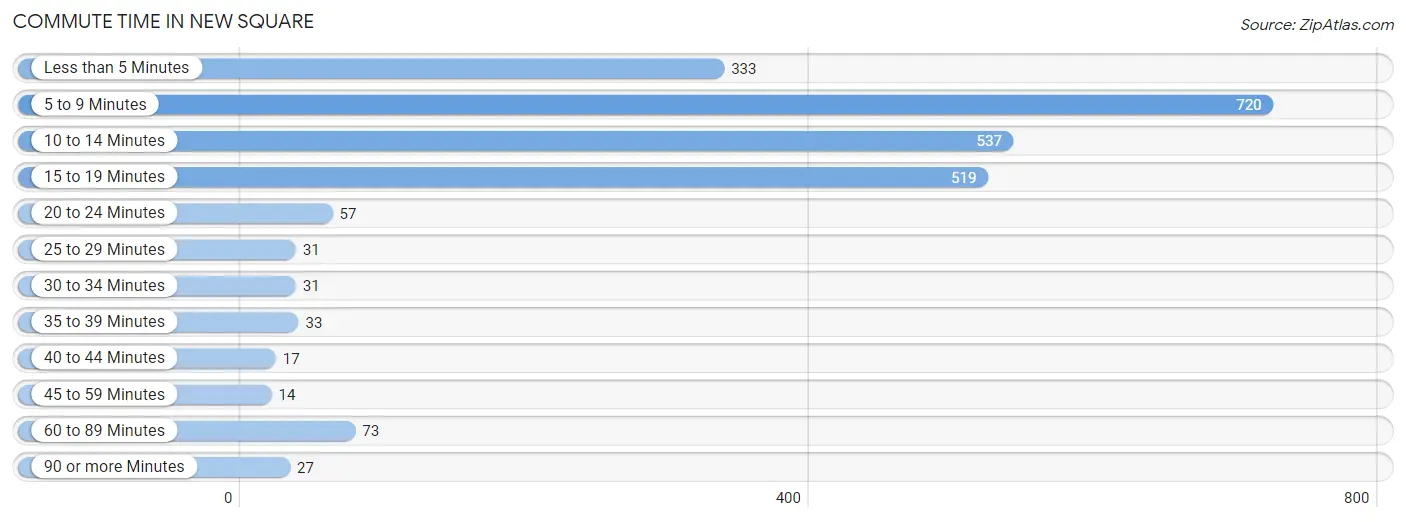
| Commute Time | # Commuters | % Commuters |
| Less than 5 Minutes | 333 | 13.9% |
| 5 to 9 Minutes | 720 | 30.1% |
| 10 to 14 Minutes | 537 | 22.5% |
| 15 to 19 Minutes | 519 | 21.7% |
| 20 to 24 Minutes | 57 | 2.4% |
| 25 to 29 Minutes | 31 | 1.3% |
| 30 to 34 Minutes | 31 | 1.3% |
| 35 to 39 Minutes | 33 | 1.4% |
| 40 to 44 Minutes | 17 | 0.7% |
| 45 to 59 Minutes | 14 | 0.6% |
| 60 to 89 Minutes | 73 | 3.0% |
| 90 or more Minutes | 27 | 1.1% |
Commute Time by Sex in New Square
The most common commute times in New Square are 5 to 9 minutes (351 commuters, 25.0%) for males and 5 to 9 minutes (369 commuters, 37.3%) for females.
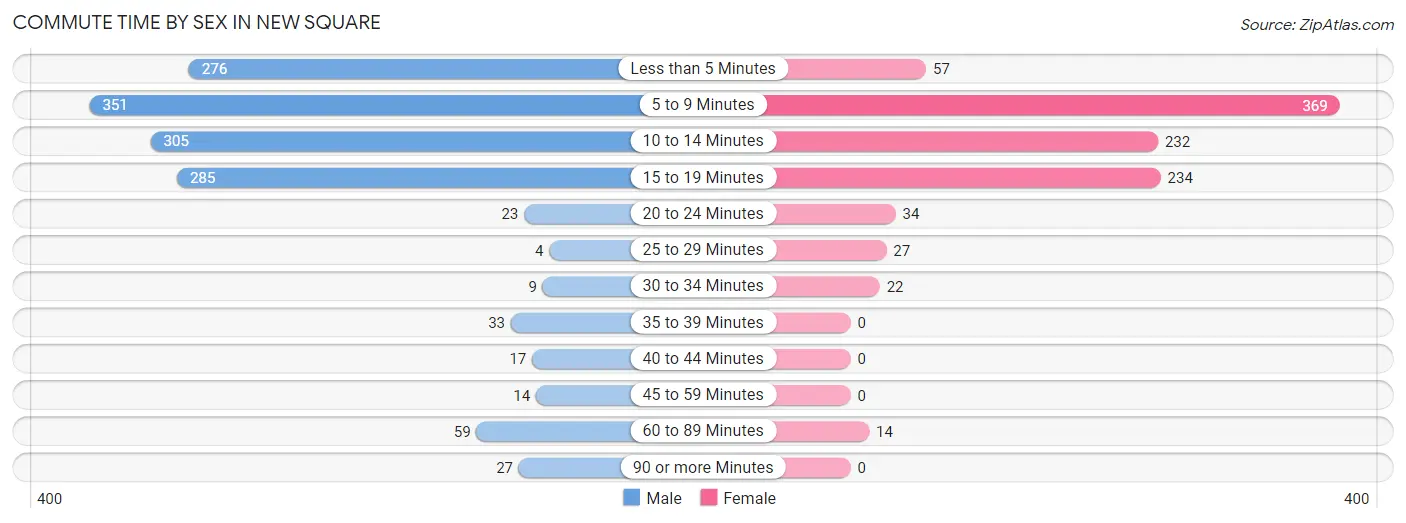
| Commute Time | Male | Female |
| Less than 5 Minutes | 276 (19.7%) | 57 (5.8%) |
| 5 to 9 Minutes | 351 (25.0%) | 369 (37.3%) |
| 10 to 14 Minutes | 305 (21.7%) | 232 (23.5%) |
| 15 to 19 Minutes | 285 (20.3%) | 234 (23.7%) |
| 20 to 24 Minutes | 23 (1.6%) | 34 (3.4%) |
| 25 to 29 Minutes | 4 (0.3%) | 27 (2.7%) |
| 30 to 34 Minutes | 9 (0.6%) | 22 (2.2%) |
| 35 to 39 Minutes | 33 (2.4%) | 0 (0.0%) |
| 40 to 44 Minutes | 17 (1.2%) | 0 (0.0%) |
| 45 to 59 Minutes | 14 (1.0%) | 0 (0.0%) |
| 60 to 89 Minutes | 59 (4.2%) | 14 (1.4%) |
| 90 or more Minutes | 27 (1.9%) | 0 (0.0%) |
Time of Departure to Work by Sex in New Square
The most frequent times of departure to work in New Square are 9:00 AM to 9:59 AM (298, 21.2%) for males and 9:00 AM to 9:59 AM (326, 33.0%) for females.
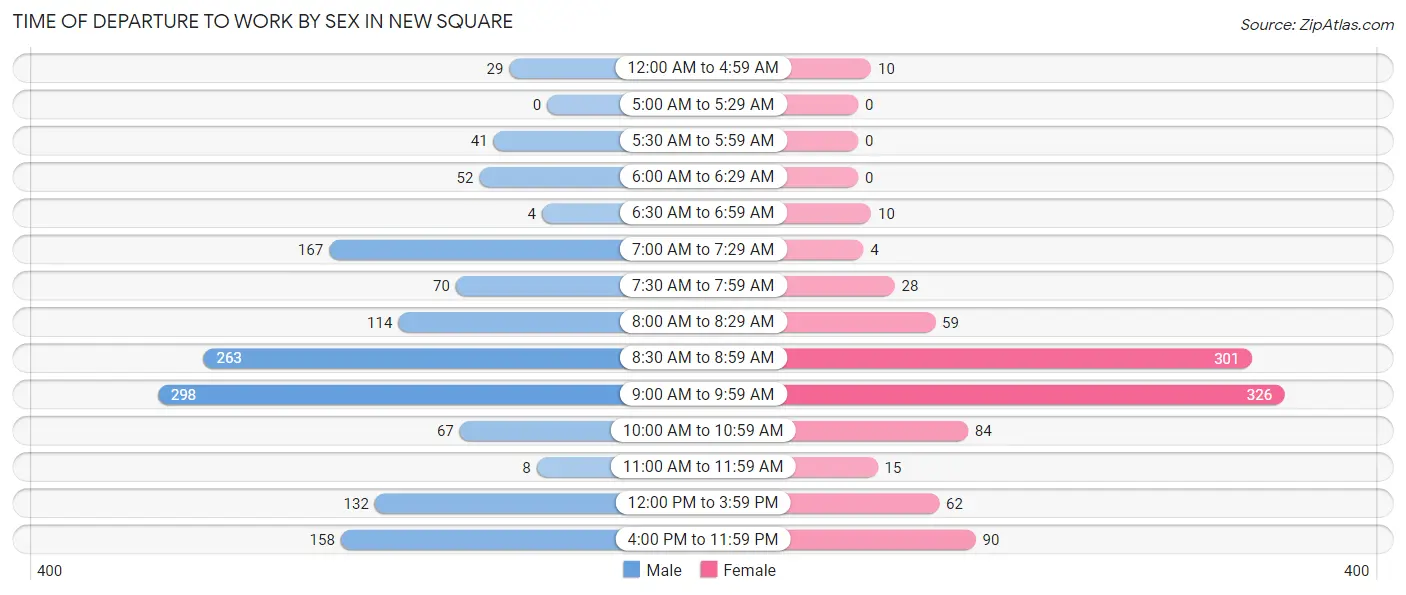
| Time of Departure | Male | Female |
| 12:00 AM to 4:59 AM | 29 (2.1%) | 10 (1.0%) |
| 5:00 AM to 5:29 AM | 0 (0.0%) | 0 (0.0%) |
| 5:30 AM to 5:59 AM | 41 (2.9%) | 0 (0.0%) |
| 6:00 AM to 6:29 AM | 52 (3.7%) | 0 (0.0%) |
| 6:30 AM to 6:59 AM | 4 (0.3%) | 10 (1.0%) |
| 7:00 AM to 7:29 AM | 167 (11.9%) | 4 (0.4%) |
| 7:30 AM to 7:59 AM | 70 (5.0%) | 28 (2.8%) |
| 8:00 AM to 8:29 AM | 114 (8.1%) | 59 (6.0%) |
| 8:30 AM to 8:59 AM | 263 (18.8%) | 301 (30.4%) |
| 9:00 AM to 9:59 AM | 298 (21.2%) | 326 (33.0%) |
| 10:00 AM to 10:59 AM | 67 (4.8%) | 84 (8.5%) |
| 11:00 AM to 11:59 AM | 8 (0.6%) | 15 (1.5%) |
| 12:00 PM to 3:59 PM | 132 (9.4%) | 62 (6.3%) |
| 4:00 PM to 11:59 PM | 158 (11.3%) | 90 (9.1%) |
| Total | 1,403 (100.0%) | 989 (100.0%) |
Housing Occupancy in New Square
Occupancy by Ownership in New Square
Of the total 1,766 dwellings in New Square, owner-occupied units account for 262 (14.8%), while renter-occupied units make up 1,504 (85.2%).
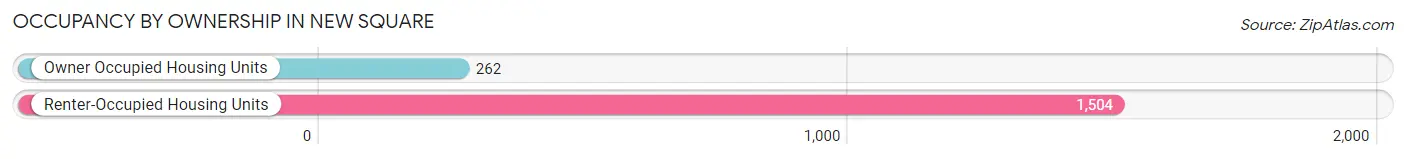
| Occupancy | # Housing Units | % Housing Units |
| Owner Occupied Housing Units | 262 | 14.8% |
| Renter-Occupied Housing Units | 1,504 | 85.2% |
| Total Occupied Housing Units | 1,766 | 100.0% |
Occupancy by Household Size in New Square
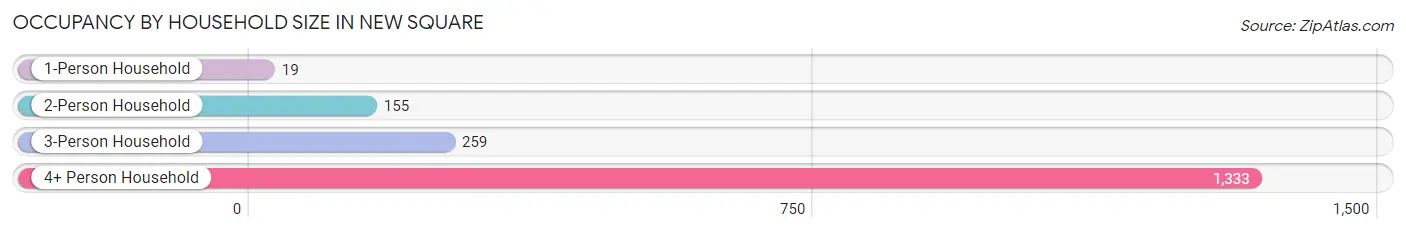
| Household Size | # Housing Units | % Housing Units |
| 1-Person Household | 19 | 1.1% |
| 2-Person Household | 155 | 8.8% |
| 3-Person Household | 259 | 14.7% |
| 4+ Person Household | 1,333 | 75.5% |
| Total Housing Units | 1,766 | 100.0% |
Occupancy by Ownership by Household Size in New Square
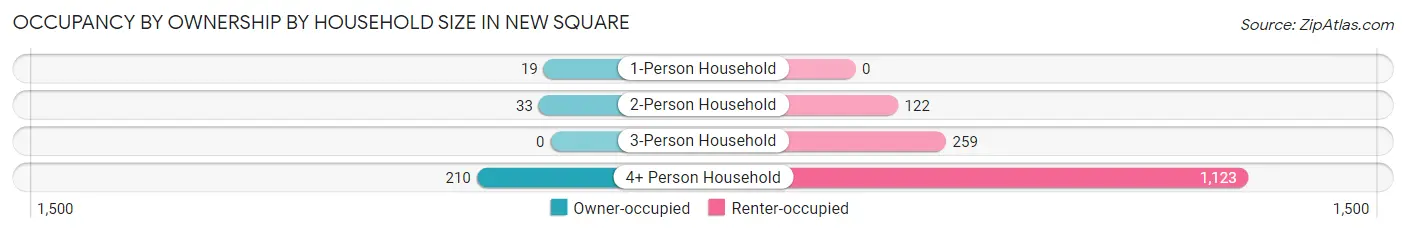
| Household Size | Owner-occupied | Renter-occupied |
| 1-Person Household | 19 (100.0%) | 0 (0.0%) |
| 2-Person Household | 33 (21.3%) | 122 (78.7%) |
| 3-Person Household | 0 (0.0%) | 259 (100.0%) |
| 4+ Person Household | 210 (15.8%) | 1,123 (84.3%) |
| Total Housing Units | 262 (14.8%) | 1,504 (85.2%) |
Occupancy by Educational Attainment in New Square
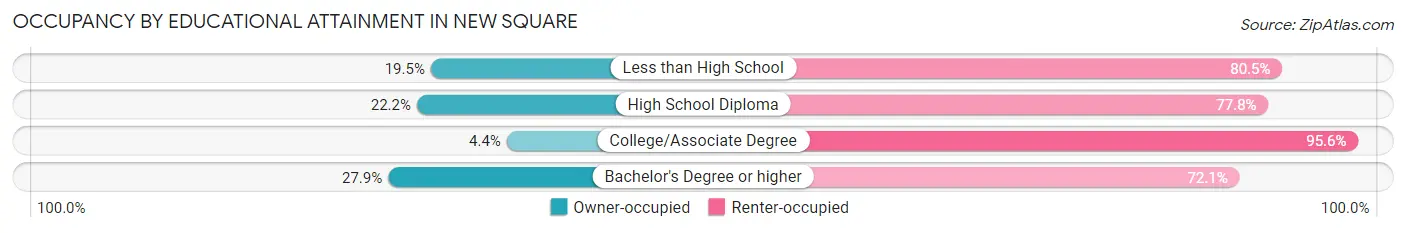
| Household Size | Owner-occupied | Renter-occupied |
| Less than High School | 67 (19.5%) | 277 (80.5%) |
| High School Diploma | 145 (22.2%) | 507 (77.8%) |
| College/Associate Degree | 31 (4.4%) | 671 (95.6%) |
| Bachelor's Degree or higher | 19 (27.9%) | 49 (72.1%) |
Occupancy by Age of Householder in New Square
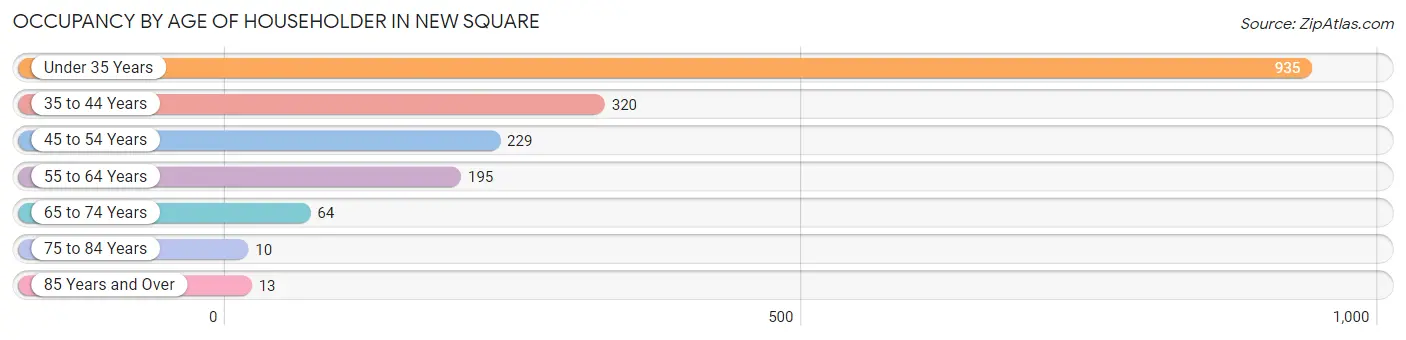
| Age Bracket | # Households | % Households |
| Under 35 Years | 935 | 52.9% |
| 35 to 44 Years | 320 | 18.1% |
| 45 to 54 Years | 229 | 13.0% |
| 55 to 64 Years | 195 | 11.0% |
| 65 to 74 Years | 64 | 3.6% |
| 75 to 84 Years | 10 | 0.6% |
| 85 Years and Over | 13 | 0.7% |
| Total | 1,766 | 100.0% |
Housing Finances in New Square
Median Income by Occupancy in New Square
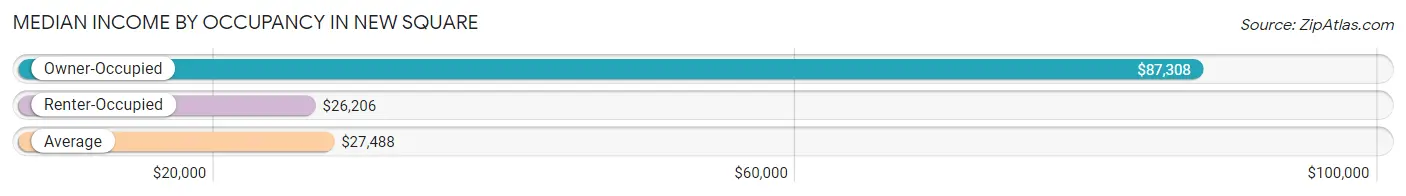
| Occupancy Type | # Households | Median Income |
| Owner-Occupied | 262 (14.8%) | $87,308 |
| Renter-Occupied | 1,504 (85.2%) | $26,206 |
| Average | 1,766 (100.0%) | $27,488 |
Occupancy by Householder Income Bracket in New Square
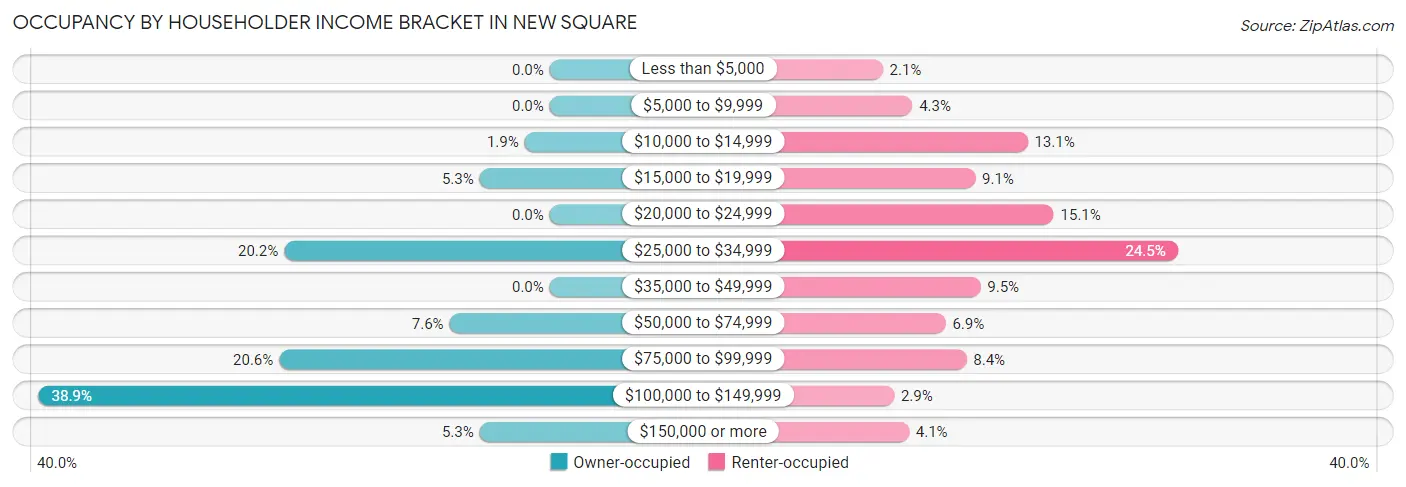
| Income Bracket | Owner-occupied | Renter-occupied |
| Less than $5,000 | 0 (0.0%) | 31 (2.1%) |
| $5,000 to $9,999 | 0 (0.0%) | 65 (4.3%) |
| $10,000 to $14,999 | 5 (1.9%) | 197 (13.1%) |
| $15,000 to $19,999 | 14 (5.3%) | 137 (9.1%) |
| $20,000 to $24,999 | 0 (0.0%) | 227 (15.1%) |
| $25,000 to $34,999 | 53 (20.2%) | 369 (24.5%) |
| $35,000 to $49,999 | 0 (0.0%) | 143 (9.5%) |
| $50,000 to $74,999 | 20 (7.6%) | 103 (6.9%) |
| $75,000 to $99,999 | 54 (20.6%) | 127 (8.4%) |
| $100,000 to $149,999 | 102 (38.9%) | 44 (2.9%) |
| $150,000 or more | 14 (5.3%) | 61 (4.1%) |
| Total | 262 (100.0%) | 1,504 (100.0%) |
Monthly Housing Cost Tiers in New Square
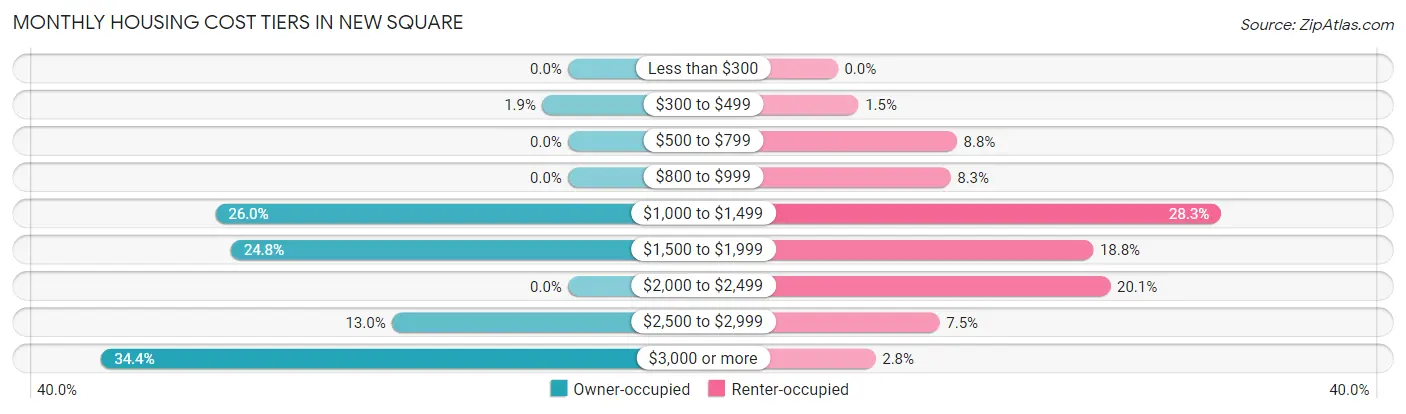
| Monthly Cost | Owner-occupied | Renter-occupied |
| Less than $300 | 0 (0.0%) | 0 (0.0%) |
| $300 to $499 | 5 (1.9%) | 23 (1.5%) |
| $500 to $799 | 0 (0.0%) | 132 (8.8%) |
| $800 to $999 | 0 (0.0%) | 125 (8.3%) |
| $1,000 to $1,499 | 68 (26.0%) | 425 (28.3%) |
| $1,500 to $1,999 | 65 (24.8%) | 283 (18.8%) |
| $2,000 to $2,499 | 0 (0.0%) | 302 (20.1%) |
| $2,500 to $2,999 | 34 (13.0%) | 113 (7.5%) |
| $3,000 or more | 90 (34.4%) | 42 (2.8%) |
| Total | 262 (100.0%) | 1,504 (100.0%) |
Physical Housing Characteristics in New Square
Housing Structures in New Square
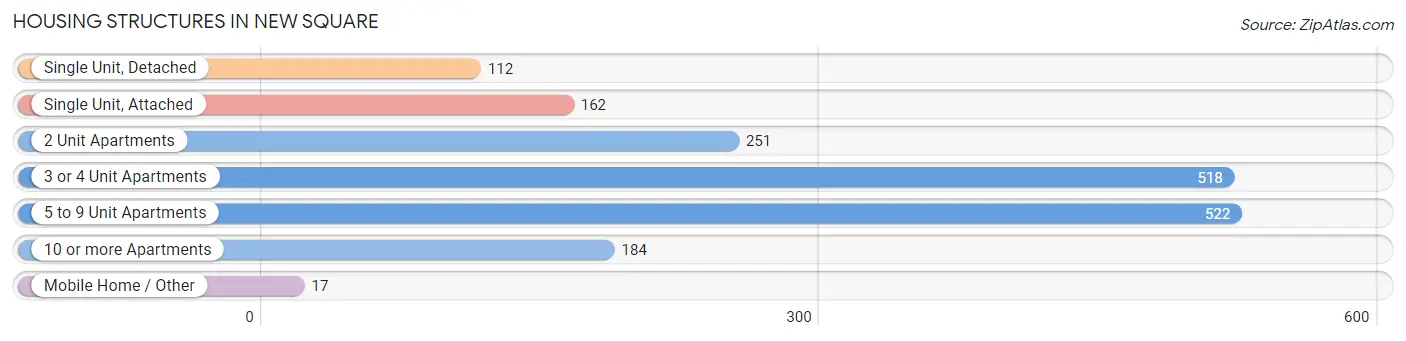
| Structure Type | # Housing Units | % Housing Units |
| Single Unit, Detached | 112 | 6.3% |
| Single Unit, Attached | 162 | 9.2% |
| 2 Unit Apartments | 251 | 14.2% |
| 3 or 4 Unit Apartments | 518 | 29.3% |
| 5 to 9 Unit Apartments | 522 | 29.6% |
| 10 or more Apartments | 184 | 10.4% |
| Mobile Home / Other | 17 | 1.0% |
| Total | 1,766 | 100.0% |
Housing Structures by Occupancy in New Square
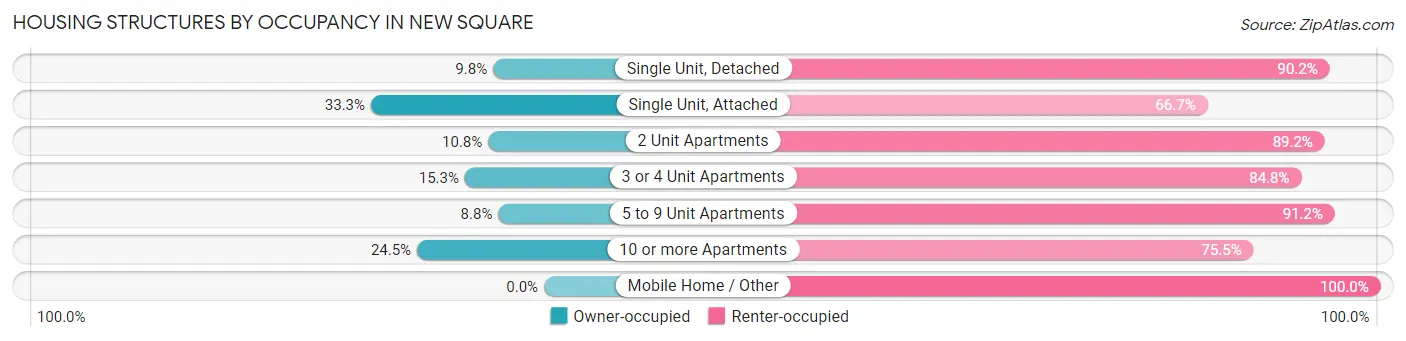
| Structure Type | Owner-occupied | Renter-occupied |
| Single Unit, Detached | 11 (9.8%) | 101 (90.2%) |
| Single Unit, Attached | 54 (33.3%) | 108 (66.7%) |
| 2 Unit Apartments | 27 (10.8%) | 224 (89.2%) |
| 3 or 4 Unit Apartments | 79 (15.2%) | 439 (84.8%) |
| 5 to 9 Unit Apartments | 46 (8.8%) | 476 (91.2%) |
| 10 or more Apartments | 45 (24.5%) | 139 (75.5%) |
| Mobile Home / Other | 0 (0.0%) | 17 (100.0%) |
| Total | 262 (14.8%) | 1,504 (85.2%) |
Housing Structures by Number of Rooms in New Square
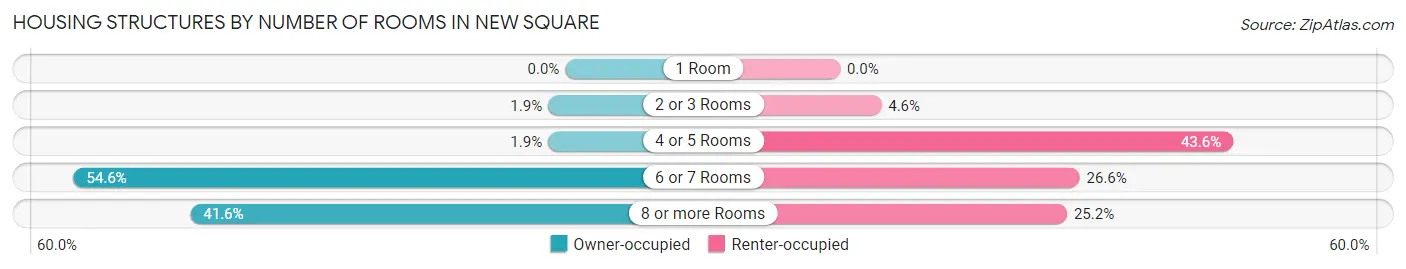
| Number of Rooms | Owner-occupied | Renter-occupied |
| 1 Room | 0 (0.0%) | 0 (0.0%) |
| 2 or 3 Rooms | 5 (1.9%) | 69 (4.6%) |
| 4 or 5 Rooms | 5 (1.9%) | 656 (43.6%) |
| 6 or 7 Rooms | 143 (54.6%) | 400 (26.6%) |
| 8 or more Rooms | 109 (41.6%) | 379 (25.2%) |
| Total | 262 (100.0%) | 1,504 (100.0%) |
Housing Structure by Heating Type in New Square
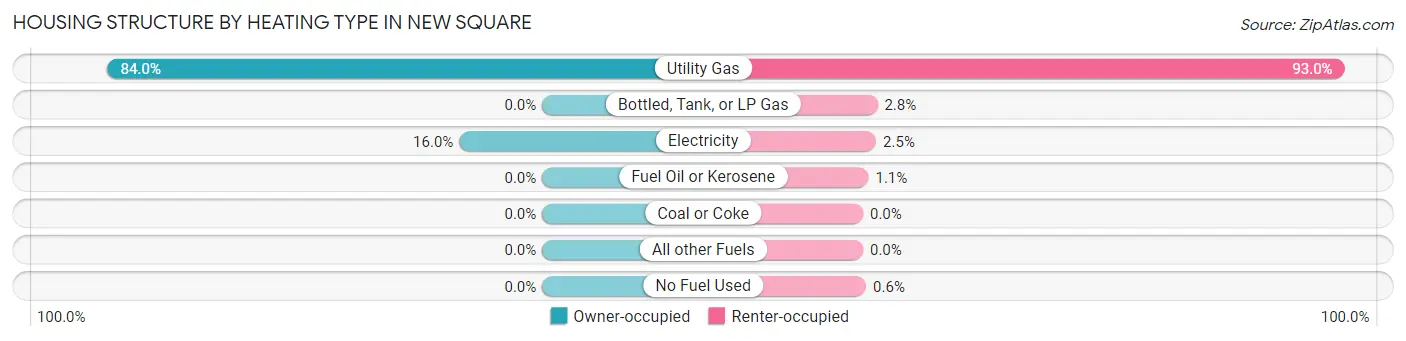
| Heating Type | Owner-occupied | Renter-occupied |
| Utility Gas | 220 (84.0%) | 1,399 (93.0%) |
| Bottled, Tank, or LP Gas | 0 (0.0%) | 42 (2.8%) |
| Electricity | 42 (16.0%) | 38 (2.5%) |
| Fuel Oil or Kerosene | 0 (0.0%) | 16 (1.1%) |
| Coal or Coke | 0 (0.0%) | 0 (0.0%) |
| All other Fuels | 0 (0.0%) | 0 (0.0%) |
| No Fuel Used | 0 (0.0%) | 9 (0.6%) |
| Total | 262 (100.0%) | 1,504 (100.0%) |
Household Vehicle Usage in New Square
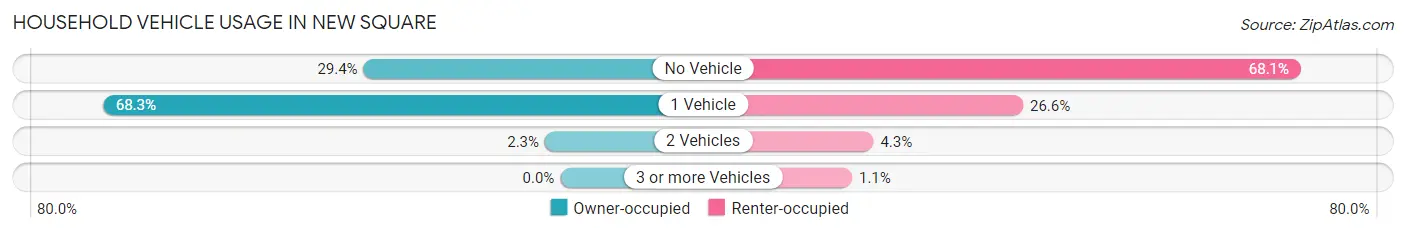
| Vehicles per Household | Owner-occupied | Renter-occupied |
| No Vehicle | 77 (29.4%) | 1,024 (68.1%) |
| 1 Vehicle | 179 (68.3%) | 400 (26.6%) |
| 2 Vehicles | 6 (2.3%) | 64 (4.3%) |
| 3 or more Vehicles | 0 (0.0%) | 16 (1.1%) |
| Total | 262 (100.0%) | 1,504 (100.0%) |
Real Estate & Mortgages in New Square
Real Estate and Mortgage Overview in New Square
| Characteristic | Without Mortgage | With Mortgage |
| Housing Units | 84 | 178 |
| Median Property Value | $592,400 | $540,300 |
| Median Household Income | $125,543 | $8 |
| Monthly Housing Costs | $1,467 | $90 |
| Real Estate Taxes | $10,001 | $28 |
Property Value by Mortgage Status in New Square
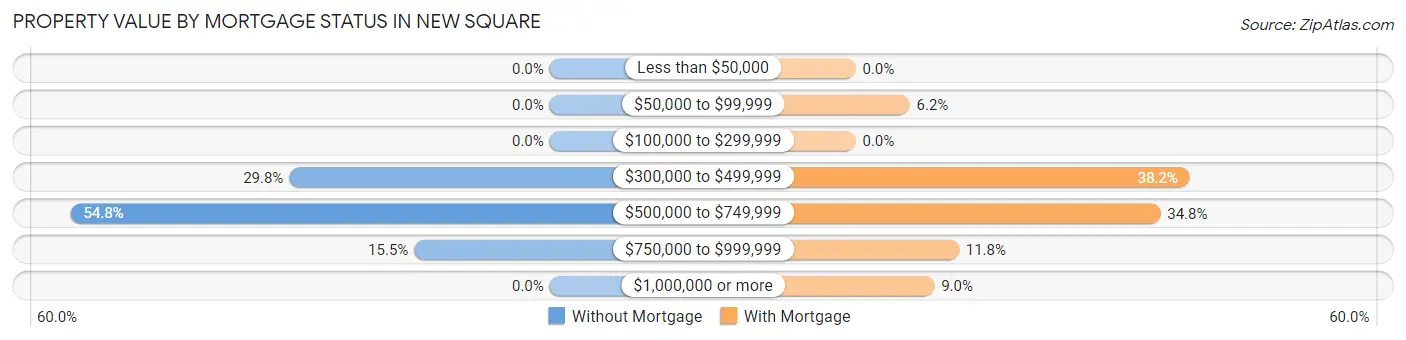
| Property Value | Without Mortgage | With Mortgage |
| Less than $50,000 | 0 (0.0%) | 0 (0.0%) |
| $50,000 to $99,999 | 0 (0.0%) | 11 (6.2%) |
| $100,000 to $299,999 | 0 (0.0%) | 0 (0.0%) |
| $300,000 to $499,999 | 25 (29.8%) | 68 (38.2%) |
| $500,000 to $749,999 | 46 (54.8%) | 62 (34.8%) |
| $750,000 to $999,999 | 13 (15.5%) | 21 (11.8%) |
| $1,000,000 or more | 0 (0.0%) | 16 (9.0%) |
| Total | 84 (100.0%) | 178 (100.0%) |
Household Income by Mortgage Status in New Square
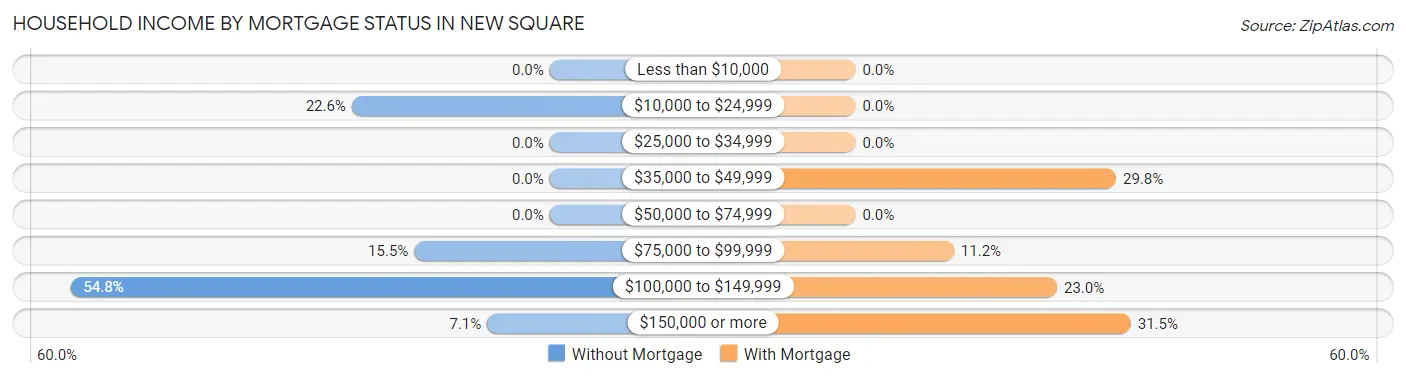
| Household Income | Without Mortgage | With Mortgage |
| Less than $10,000 | 0 (0.0%) | 0 (0.0%) |
| $10,000 to $24,999 | 19 (22.6%) | 0 (0.0%) |
| $25,000 to $34,999 | 0 (0.0%) | 0 (0.0%) |
| $35,000 to $49,999 | 0 (0.0%) | 53 (29.8%) |
| $50,000 to $74,999 | 0 (0.0%) | 0 (0.0%) |
| $75,000 to $99,999 | 13 (15.5%) | 20 (11.2%) |
| $100,000 to $149,999 | 46 (54.8%) | 41 (23.0%) |
| $150,000 or more | 6 (7.1%) | 56 (31.5%) |
| Total | 84 (100.0%) | 178 (100.0%) |
Property Value to Household Income Ratio in New Square
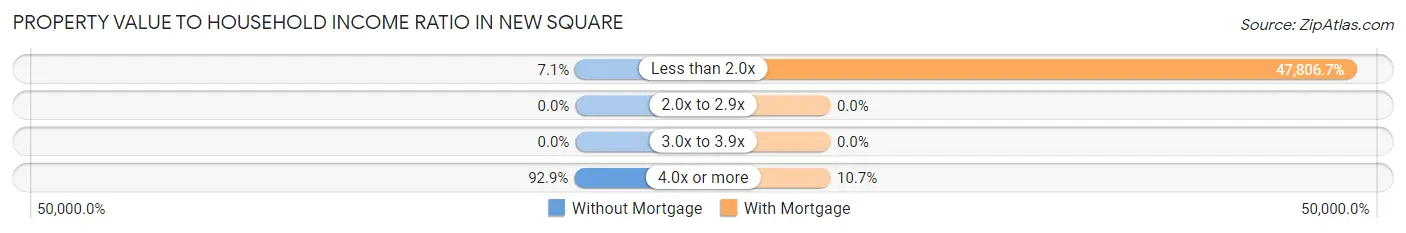
| Value-to-Income Ratio | Without Mortgage | With Mortgage |
| Less than 2.0x | 6 (7.1%) | 85,096 (47,806.7%) |
| 2.0x to 2.9x | 0 (0.0%) | 0 (0.0%) |
| 3.0x to 3.9x | 0 (0.0%) | 0 (0.0%) |
| 4.0x or more | 78 (92.9%) | 19 (10.7%) |
| Total | 84 (100.0%) | 178 (100.0%) |
Real Estate Taxes by Mortgage Status in New Square
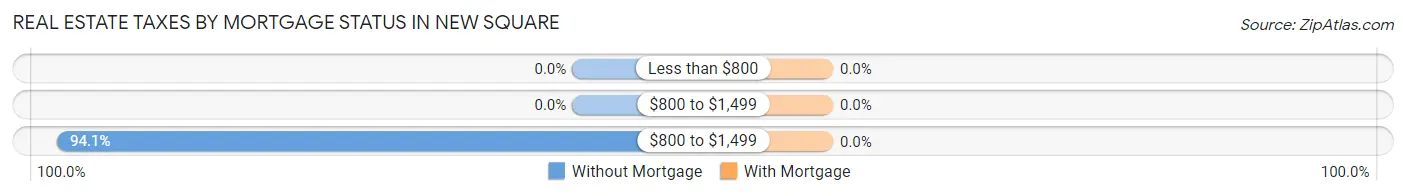
| Property Taxes | Without Mortgage | With Mortgage |
| Less than $800 | 0 (0.0%) | 0 (0.0%) |
| $800 to $1,499 | 0 (0.0%) | 0 (0.0%) |
| $800 to $1,499 | 79 (94.1%) | 0 (0.0%) |
| Total | 84 (100.0%) | 178 (100.0%) |
Health & Disability in New Square
Health Insurance Coverage by Age in New Square
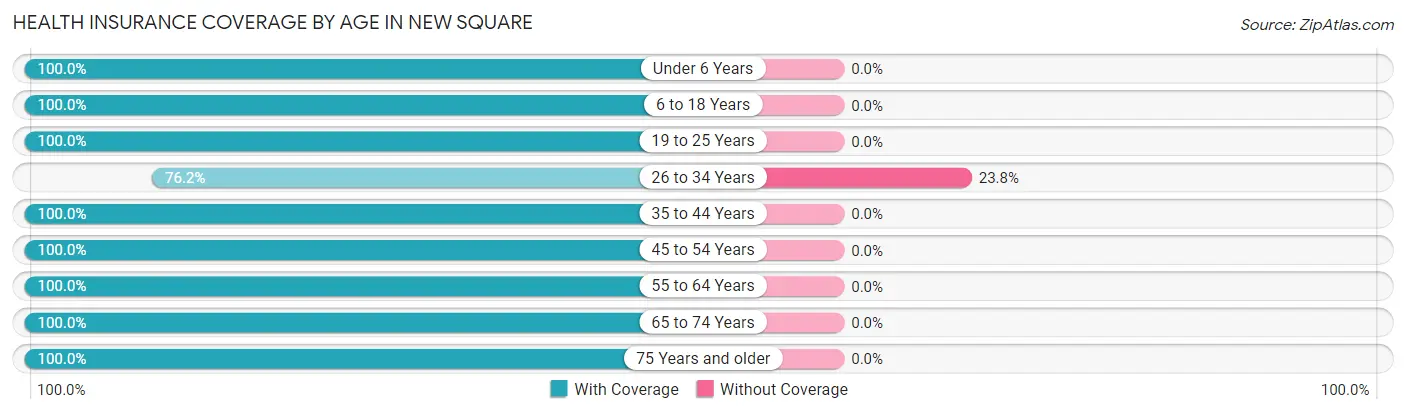
| Age Bracket | With Coverage | Without Coverage |
| Under 6 Years | 1,831 (100.0%) | 0 (0.0%) |
| 6 to 18 Years | 3,959 (100.0%) | 0 (0.0%) |
| 19 to 25 Years | 1,017 (100.0%) | 0 (0.0%) |
| 26 to 34 Years | 827 (76.2%) | 258 (23.8%) |
| 35 to 44 Years | 627 (100.0%) | 0 (0.0%) |
| 45 to 54 Years | 500 (100.0%) | 0 (0.0%) |
| 55 to 64 Years | 387 (100.0%) | 0 (0.0%) |
| 65 to 74 Years | 140 (100.0%) | 0 (0.0%) |
| 75 Years and older | 32 (100.0%) | 0 (0.0%) |
| Total | 9,320 (97.3%) | 258 (2.7%) |
Health Insurance Coverage by Citizenship Status in New Square
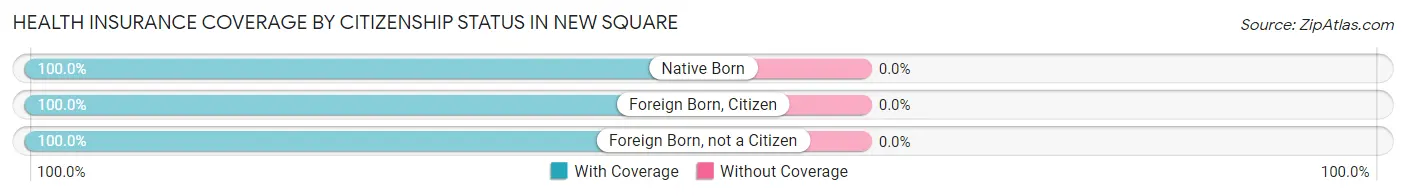
| Citizenship Status | With Coverage | Without Coverage |
| Native Born | 1,831 (100.0%) | 0 (0.0%) |
| Foreign Born, Citizen | 3,959 (100.0%) | 0 (0.0%) |
| Foreign Born, not a Citizen | 1,017 (100.0%) | 0 (0.0%) |
Health Insurance Coverage by Household Income in New Square
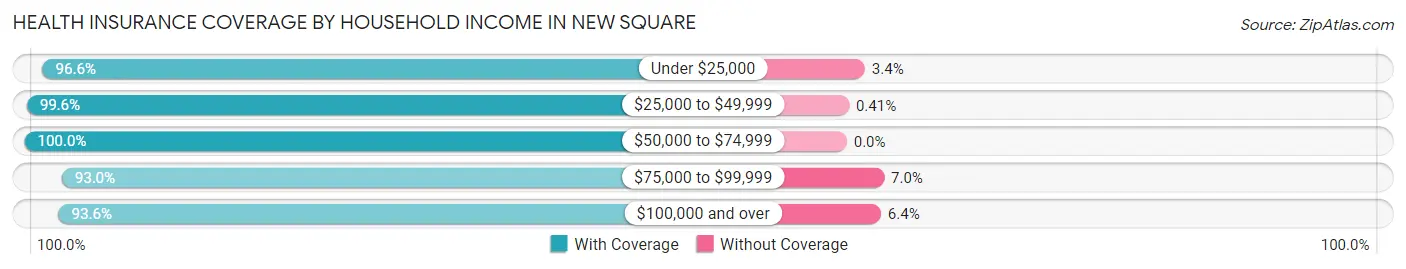
| Household Income | With Coverage | Without Coverage |
| Under $25,000 | 3,108 (96.6%) | 109 (3.4%) |
| $25,000 to $49,999 | 3,647 (99.6%) | 15 (0.4%) |
| $50,000 to $74,999 | 663 (100.0%) | 0 (0.0%) |
| $75,000 to $99,999 | 812 (93.0%) | 61 (7.0%) |
| $100,000 and over | 1,070 (93.6%) | 73 (6.4%) |
Public vs Private Health Insurance Coverage by Age in New Square
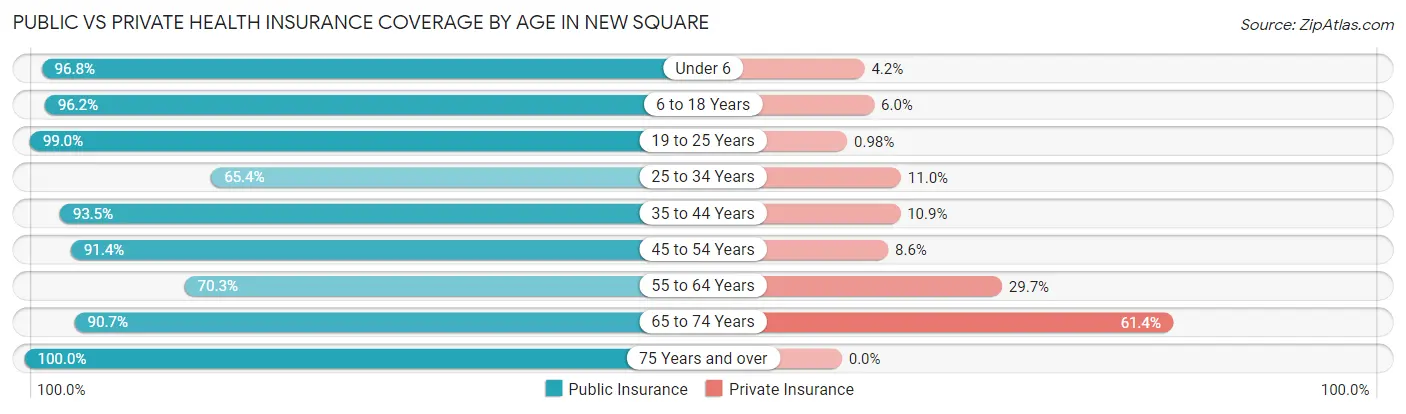
| Age Bracket | Public Insurance | Private Insurance |
| Under 6 | 1,773 (96.8%) | 77 (4.2%) |
| 6 to 18 Years | 3,810 (96.2%) | 237 (6.0%) |
| 19 to 25 Years | 1,007 (99.0%) | 10 (1.0%) |
| 25 to 34 Years | 709 (65.3%) | 119 (11.0%) |
| 35 to 44 Years | 586 (93.5%) | 68 (10.8%) |
| 45 to 54 Years | 457 (91.4%) | 43 (8.6%) |
| 55 to 64 Years | 272 (70.3%) | 115 (29.7%) |
| 65 to 74 Years | 127 (90.7%) | 86 (61.4%) |
| 75 Years and over | 32 (100.0%) | 0 (0.0%) |
| Total | 8,773 (91.6%) | 755 (7.9%) |
Disability Status by Sex by Age in New Square
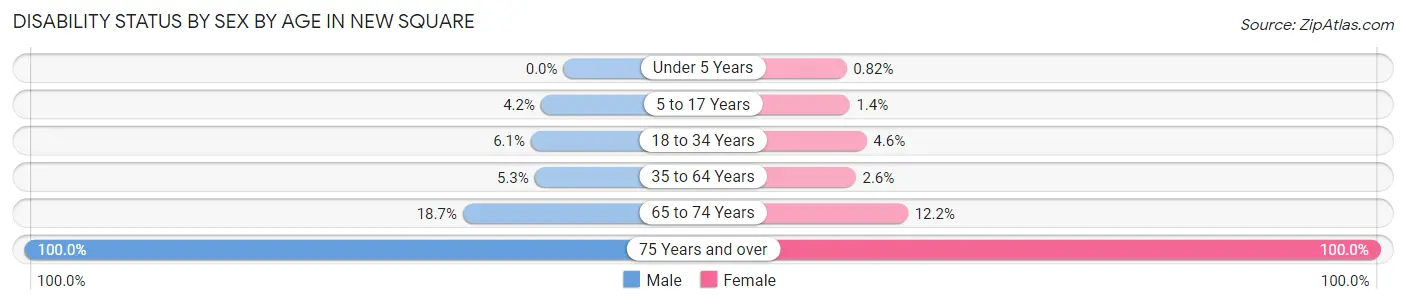
| Age Bracket | Male | Female |
| Under 5 Years | 0 (0.0%) | 7 (0.8%) |
| 5 to 17 Years | 84 (4.2%) | 27 (1.4%) |
| 18 to 34 Years | 80 (6.0%) | 53 (4.6%) |
| 35 to 64 Years | 39 (5.3%) | 20 (2.5%) |
| 65 to 74 Years | 17 (18.7%) | 6 (12.2%) |
| 75 Years and over | 8 (100.0%) | 24 (100.0%) |
Disability Class by Sex by Age in New Square
Disability Class: Hearing Difficulty
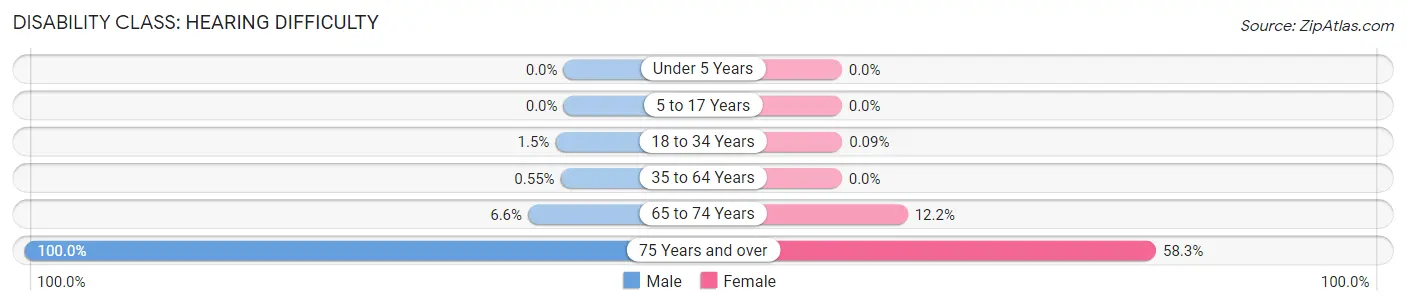
| Age Bracket | Male | Female |
| Under 5 Years | 0 (0.0%) | 0 (0.0%) |
| 5 to 17 Years | 0 (0.0%) | 0 (0.0%) |
| 18 to 34 Years | 20 (1.5%) | 1 (0.1%) |
| 35 to 64 Years | 4 (0.5%) | 0 (0.0%) |
| 65 to 74 Years | 6 (6.6%) | 6 (12.2%) |
| 75 Years and over | 8 (100.0%) | 14 (58.3%) |
Disability Class: Vision Difficulty
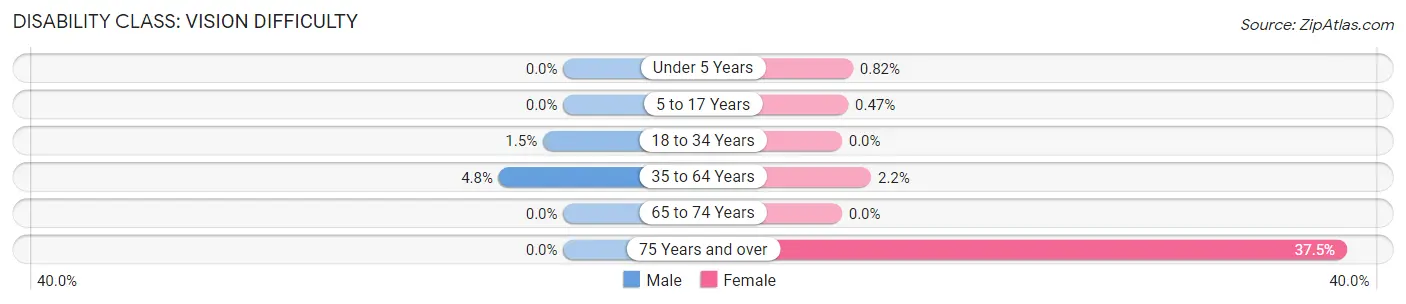
| Age Bracket | Male | Female |
| Under 5 Years | 0 (0.0%) | 7 (0.8%) |
| 5 to 17 Years | 0 (0.0%) | 9 (0.5%) |
| 18 to 34 Years | 20 (1.5%) | 0 (0.0%) |
| 35 to 64 Years | 35 (4.8%) | 17 (2.2%) |
| 65 to 74 Years | 0 (0.0%) | 0 (0.0%) |
| 75 Years and over | 0 (0.0%) | 9 (37.5%) |
Disability Class: Cognitive Difficulty
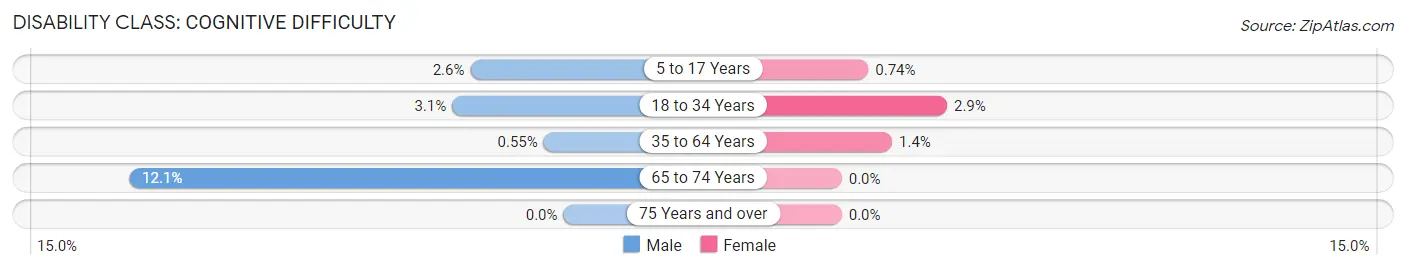
| Age Bracket | Male | Female |
| 5 to 17 Years | 52 (2.6%) | 14 (0.7%) |
| 18 to 34 Years | 41 (3.1%) | 34 (2.9%) |
| 35 to 64 Years | 4 (0.5%) | 11 (1.4%) |
| 65 to 74 Years | 11 (12.1%) | 0 (0.0%) |
| 75 Years and over | 0 (0.0%) | 0 (0.0%) |
Disability Class: Ambulatory Difficulty
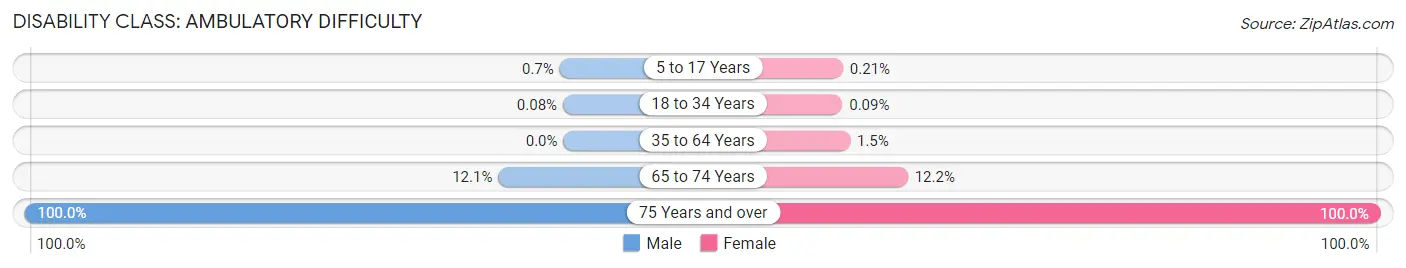
| Age Bracket | Male | Female |
| 5 to 17 Years | 14 (0.7%) | 4 (0.2%) |
| 18 to 34 Years | 1 (0.1%) | 1 (0.1%) |
| 35 to 64 Years | 0 (0.0%) | 12 (1.5%) |
| 65 to 74 Years | 11 (12.1%) | 6 (12.2%) |
| 75 Years and over | 8 (100.0%) | 24 (100.0%) |
Disability Class: Self-Care Difficulty
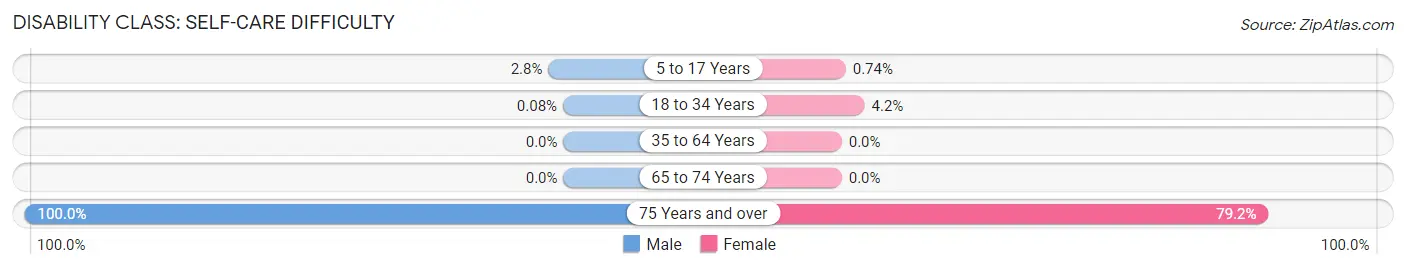
| Age Bracket | Male | Female |
| 5 to 17 Years | 56 (2.8%) | 14 (0.7%) |
| 18 to 34 Years | 1 (0.1%) | 49 (4.2%) |
| 35 to 64 Years | 0 (0.0%) | 0 (0.0%) |
| 65 to 74 Years | 0 (0.0%) | 0 (0.0%) |
| 75 Years and over | 8 (100.0%) | 19 (79.2%) |
Technology Access in New Square
Computing Device Access in New Square
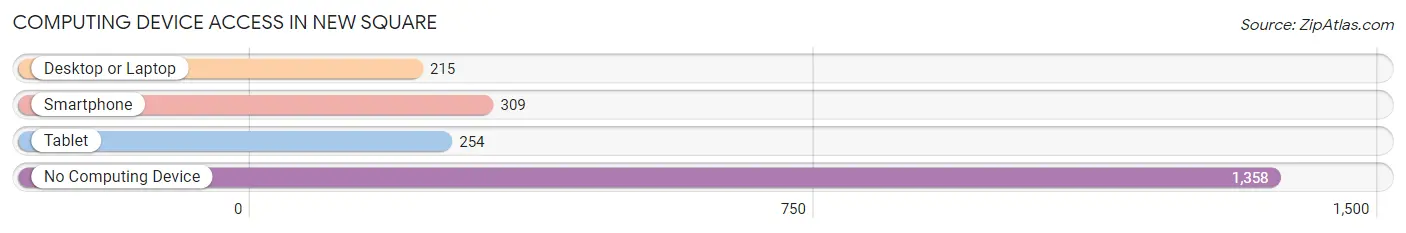
| Device Type | # Households | % Households |
| Desktop or Laptop | 215 | 12.2% |
| Smartphone | 309 | 17.5% |
| Tablet | 254 | 14.4% |
| No Computing Device | 1,358 | 76.9% |
| Total | 1,766 | 100.0% |
Internet Access in New Square
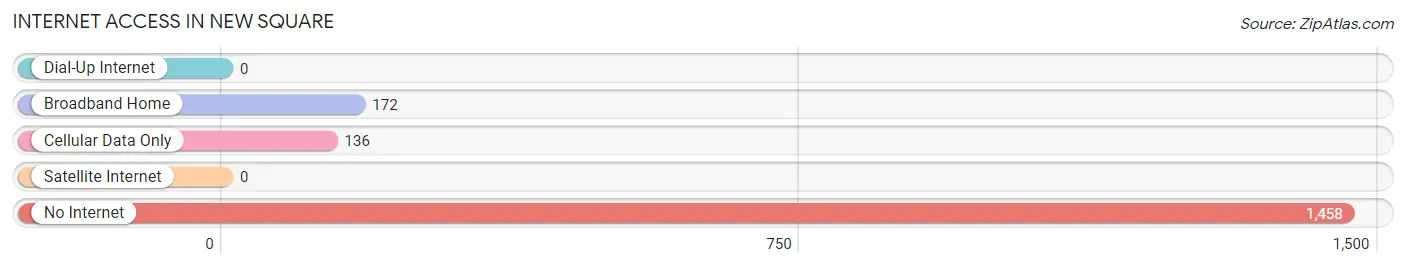
| Internet Type | # Households | % Households |
| Dial-Up Internet | 0 | 0.0% |
| Broadband Home | 172 | 9.7% |
| Cellular Data Only | 136 | 7.7% |
| Satellite Internet | 0 | 0.0% |
| No Internet | 1,458 | 82.6% |
| Total | 1,766 | 100.0% |
New Square Summary
New Square is a village located in the town of Ramapo in Rockland County, New York. It is located approximately 25 miles northwest of New York City. The village was founded in 1954 by Grand Rabbi Jacob Joseph Twersky, a Holocaust survivor, and is home to a large Hasidic Jewish population. As of the 2010 census, the village had a population of 6,944.
History
New Square was founded in 1954 by Grand Rabbi Jacob Joseph Twersky, a Holocaust survivor. Twersky had been living in Brooklyn, New York, and was looking for a place to establish a new Hasidic community. He purchased a large tract of land in the town of Ramapo, and the first settlers arrived in 1954. The village was incorporated in 1961.
Geography
New Square is located in the town of Ramapo in Rockland County, New York. It is located approximately 25 miles northwest of New York City. The village has a total area of 0.9 square miles, all of which is land. The terrain is mostly flat, with some rolling hills.
Economy
The economy of New Square is largely based on small businesses and services. Many of the businesses are owned and operated by members of the Hasidic community. These businesses include grocery stores, clothing stores, restaurants, and other retail establishments. The village also has a number of religious institutions, including synagogues, schools, and a yeshiva.
Demographics
As of the 2010 census, the population of New Square was 6,944. The racial makeup of the village was 97.7% White, 0.2% African American, 0.1% Native American, 0.2% Asian, 0.1% Pacific Islander, 0.7% from other races, and 1.1% from two or more races. Hispanic or Latino of any race were 2.2% of the population.
The median household income in New Square was $45,938 in 2010. The per capita income was $17,945. About 8.3% of the population was below the poverty line.
The village is home to a large Hasidic Jewish population. As of 2010, 97.3% of the population identified as Jewish, and the remaining 2.7% identified as non-Jewish. The majority of the population (94.3%) spoke Yiddish as their primary language. English was the primary language for the remaining 5.7% of the population.
Common Questions
What is Per Capita Income in New Square?
Per Capita income in New Square is $10,232.
What is the Median Family Income in New Square?
Median Family Income in New Square is $27,438.
What is the Median Household income in New Square?
Median Household Income in New Square is $27,488.
What is Income or Wage Gap in New Square?
Income or Wage Gap in New Square is 57.2%.
Women in New Square earn 42.8 cents for every dollar earned by a man.
What is Inequality or Gini Index in New Square?
Inequality or Gini Index in New Square is 0.53.
What is the Total Population of New Square?
Total Population of New Square is 9,578.
What is the Total Male Population of New Square?
Total Male Population of New Square is 4,814.
What is the Total Female Population of New Square?
Total Female Population of New Square is 4,764.
What is the Ratio of Males per 100 Females in New Square?
There are 101.05 Males per 100 Females in New Square.
What is the Ratio of Females per 100 Males in New Square?
There are 98.96 Females per 100 Males in New Square.
What is the Median Population Age in New Square?
Median Population Age in New Square is 15.7 Years.
What is the Average Family Size in New Square
Average Family Size in New Square is 5.3 People.
What is the Average Household Size in New Square
Average Household Size in New Square is 5.4 People.
How Large is the Labor Force in New Square?
There are 2,814 People in the Labor Forcein in New Square.
What is the Percentage of People in the Labor Force in New Square?
59.8% of People are in the Labor Force in New Square.
What is the Unemployment Rate in New Square?
Unemployment Rate in New Square is 8.1%.