Quogue, NY Map & Demographics
Quogue Map
Quogue Overview
$60,853
PER CAPITA INCOME
$159,896
AVG FAMILY INCOME
0.53
INEQUALITY / GINI INDEX
640
TOTAL POPULATION
266
MALE POPULATION
374
FEMALE POPULATION
71.12
MALES / 100 FEMALES
140.60
FEMALES / 100 MALES
56.0
MEDIAN AGE
2.7
AVG FAMILY SIZE
2.5
AVG HOUSEHOLD SIZE
334
LABOR FORCE [ PEOPLE ]
63.1%
PERCENT IN LABOR FORCE
Quogue Zip Codes
Quogue Area Codes
Income in Quogue
Income Overview in Quogue
| Characteristic | Number | Measure |
| Per Capita Income | 640 | $60,853 |
| Median Family Income | 209 | $159,896 |
| Mean Family Income | 209 | $172,184 |
| Median Household Income | 253 | $0 |
| Mean Household Income | 253 | $149,950 |
| Income Deficit | 209 | $0 |
| Wage / Income Gap (%) | 640 | 0.00% |
| Wage / Income Gap ($) | 640 | 100.00¢ per $1 |
| Gini / Inequality Index | 640 | 0.53 |
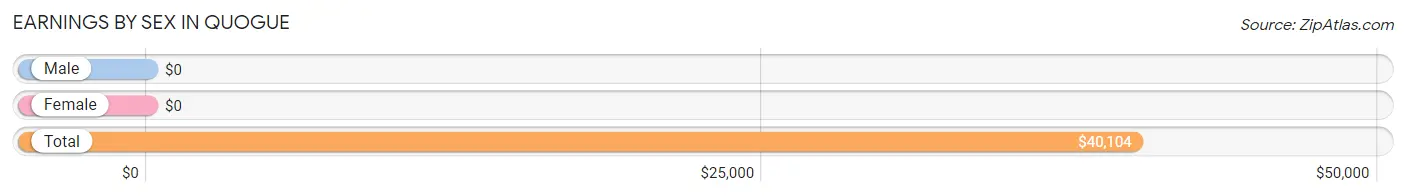
Earnings by Sex in Quogue
| Sex | Number | Average Earnings |
| Male | 178 (53.3%) | $0 |
| Female | 156 (46.7%) | $0 |
| Total | 334 (100.0%) | $40,104 |
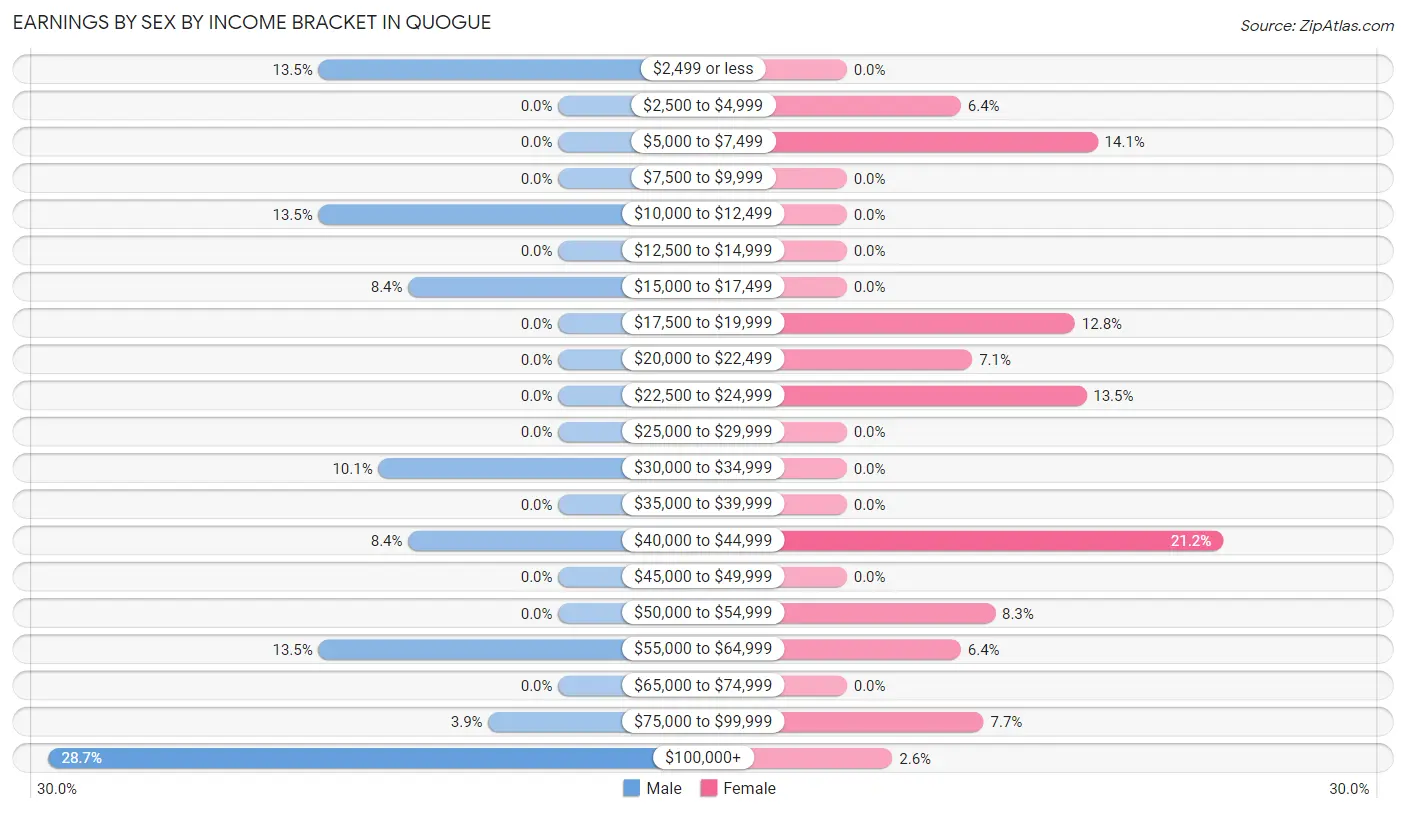
Earnings by Sex by Income Bracket in Quogue
The most common earnings brackets in Quogue are $100,000+ for men (51 | 28.6%) and $40,000 to $44,999 for women (33 | 21.1%).
| Income | Male | Female |
| $2,499 or less | 24 (13.5%) | 0 (0.0%) |
| $2,500 to $4,999 | 0 (0.0%) | 10 (6.4%) |
| $5,000 to $7,499 | 0 (0.0%) | 22 (14.1%) |
| $7,500 to $9,999 | 0 (0.0%) | 0 (0.0%) |
| $10,000 to $12,499 | 24 (13.5%) | 0 (0.0%) |
| $12,500 to $14,999 | 0 (0.0%) | 0 (0.0%) |
| $15,000 to $17,499 | 15 (8.4%) | 0 (0.0%) |
| $17,500 to $19,999 | 0 (0.0%) | 20 (12.8%) |
| $20,000 to $22,499 | 0 (0.0%) | 11 (7.0%) |
| $22,500 to $24,999 | 0 (0.0%) | 21 (13.5%) |
| $25,000 to $29,999 | 0 (0.0%) | 0 (0.0%) |
| $30,000 to $34,999 | 18 (10.1%) | 0 (0.0%) |
| $35,000 to $39,999 | 0 (0.0%) | 0 (0.0%) |
| $40,000 to $44,999 | 15 (8.4%) | 33 (21.1%) |
| $45,000 to $49,999 | 0 (0.0%) | 0 (0.0%) |
| $50,000 to $54,999 | 0 (0.0%) | 13 (8.3%) |
| $55,000 to $64,999 | 24 (13.5%) | 10 (6.4%) |
| $65,000 to $74,999 | 0 (0.0%) | 0 (0.0%) |
| $75,000 to $99,999 | 7 (3.9%) | 12 (7.7%) |
| $100,000+ | 51 (28.6%) | 4 (2.6%) |
| Total | 178 (100.0%) | 156 (100.0%) |
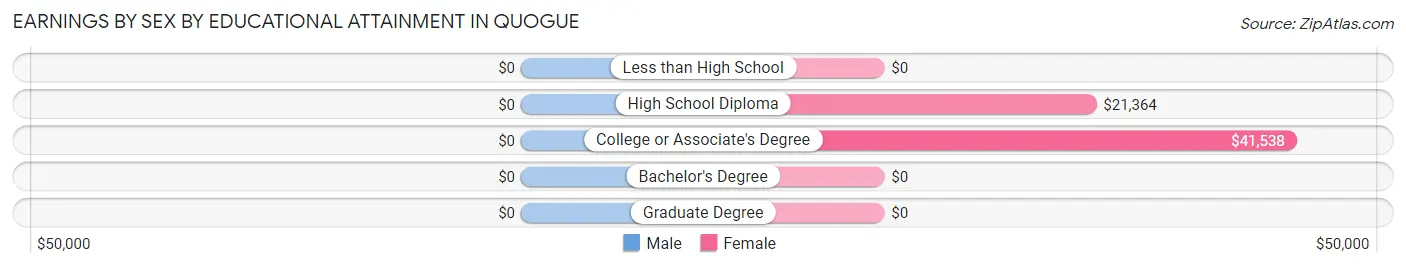
Earnings by Sex by Educational Attainment in Quogue
| Educational Attainment | Male Income | Female Income |
| Less than High School | - | - |
| High School Diploma | - | - |
| College or Associate's Degree | - | - |
| Bachelor's Degree | - | - |
| Graduate Degree | - | - |
| Total | $63,802 | $0 |
Family Income in Quogue
Family Income Brackets in Quogue
According to the Quogue family income data, there are 72 families falling into the $150,000 to $199,999 income range, which is the most common income bracket and makes up 34.4% of all families.
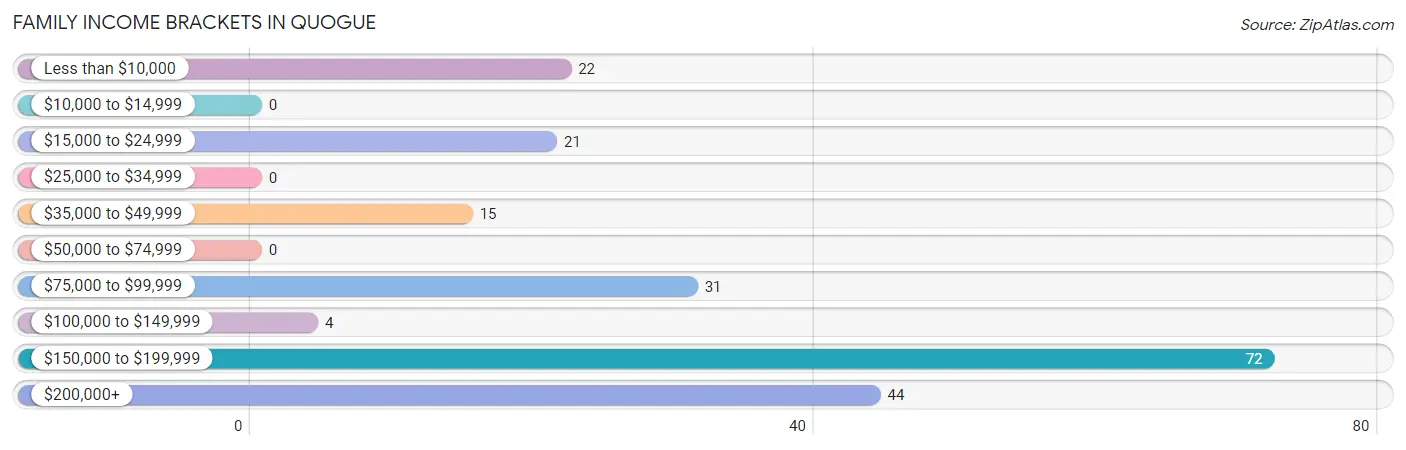
| Income Bracket | # Families | % Families |
| Less than $10,000 | 22 | 10.5% |
| $10,000 to $14,999 | 0 | 0.0% |
| $15,000 to $24,999 | 21 | 10.0% |
| $25,000 to $34,999 | 0 | 0.0% |
| $35,000 to $49,999 | 15 | 7.2% |
| $50,000 to $74,999 | 0 | 0.0% |
| $75,000 to $99,999 | 31 | 14.8% |
| $100,000 to $149,999 | 4 | 1.9% |
| $150,000 to $199,999 | 72 | 34.4% |
| $200,000+ | 44 | 21.1% |
Family Income by Famaliy Size in Quogue
2-person families (155 | 74.2%) account for the highest median family income in Quogue with $175,362 per family, while 2-person families (155 | 74.2%) have the highest median income of $87,681 per family member.
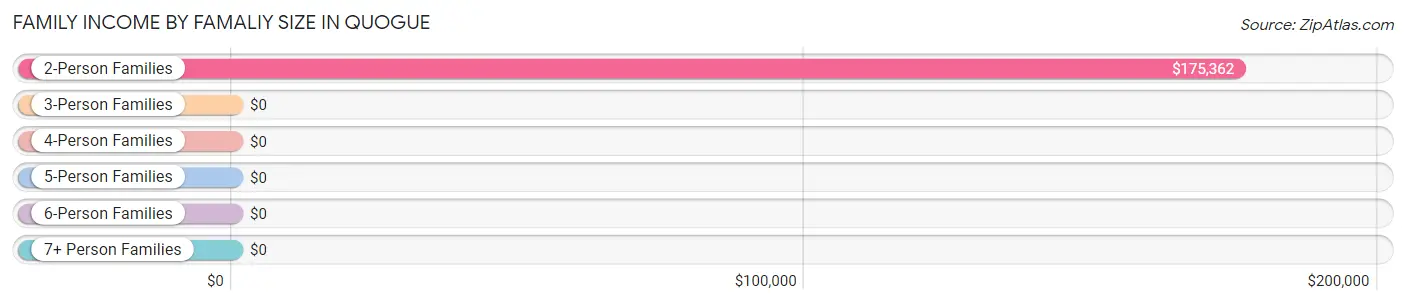
| Income Bracket | # Families | Median Income |
| 2-Person Families | 155 (74.2%) | $175,362 |
| 3-Person Families | 11 (5.3%) | $0 |
| 4-Person Families | 31 (14.8%) | $0 |
| 5-Person Families | 12 (5.7%) | $0 |
| 6-Person Families | 0 (0.0%) | $0 |
| 7+ Person Families | 0 (0.0%) | $0 |
| Total | 209 (100.0%) | $159,896 |
Family Income by Number of Earners in Quogue
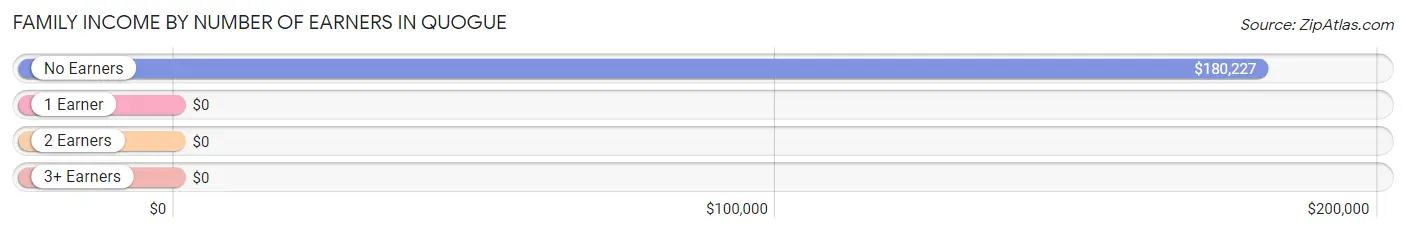
| Number of Earners | # Families | Median Income |
| No Earners | 46 (22.0%) | $180,227 |
| 1 Earner | 57 (27.3%) | $0 |
| 2 Earners | 96 (45.9%) | $0 |
| 3+ Earners | 10 (4.8%) | $0 |
| Total | 209 (100.0%) | $159,896 |
Household Income in Quogue
Household Income Brackets in Quogue
With 72 households falling in the category, the $150,000 to $199,999 income range is the most frequent in Quogue, accounting for 28.5% of all households.
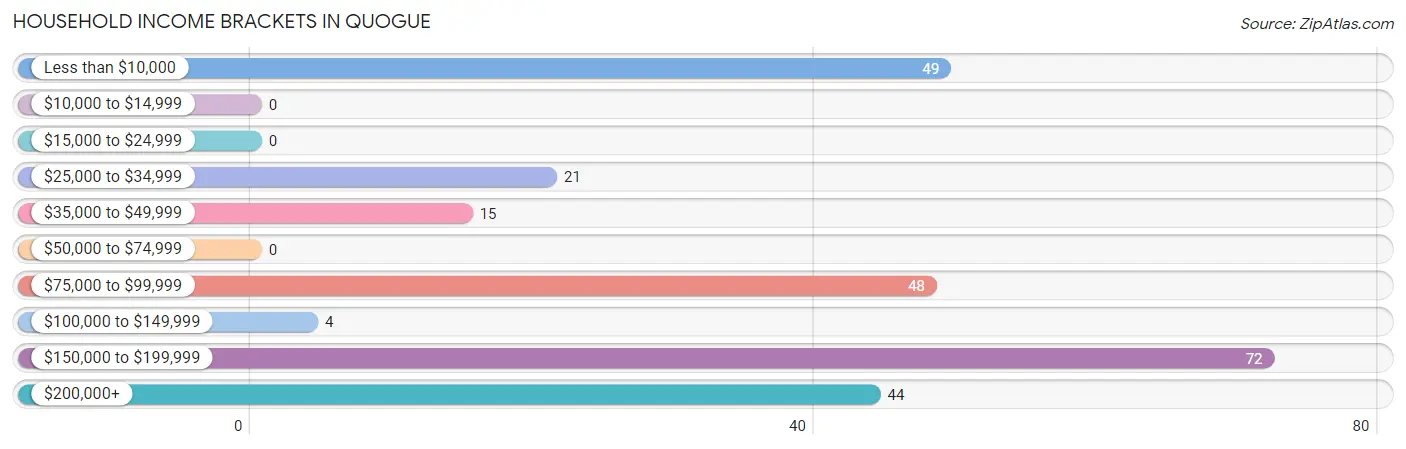
| Income Bracket | # Households | % Households |
| Less than $10,000 | 49 | 19.4% |
| $10,000 to $14,999 | 0 | 0.0% |
| $15,000 to $24,999 | 0 | 0.0% |
| $25,000 to $34,999 | 21 | 8.3% |
| $35,000 to $49,999 | 15 | 5.9% |
| $50,000 to $74,999 | 0 | 0.0% |
| $75,000 to $99,999 | 48 | 19.0% |
| $100,000 to $149,999 | 4 | 1.6% |
| $150,000 to $199,999 | 72 | 28.5% |
| $200,000+ | 44 | 17.4% |
Household Income by Householder Age in Quogue
The median household income in Quogue is $0, with the highest median household income of $175,230 found in the 65+ years age bracket for the primary householder. A total of 125 households (49.4%) fall into this category.
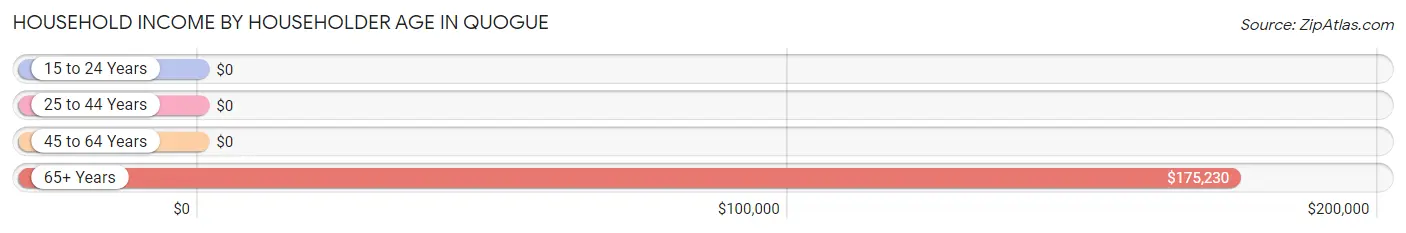
| Income Bracket | # Households | Median Income |
| 15 to 24 Years | 0 (0.0%) | $0 |
| 25 to 44 Years | 32 (12.7%) | $0 |
| 45 to 64 Years | 96 (37.9%) | $0 |
| 65+ Years | 125 (49.4%) | $175,230 |
| Total | 253 (100.0%) | $0 |
Poverty in Quogue
Income Below Poverty by Sex and Age in Quogue
With 18.8% poverty level for males and 38.5% for females among the residents of Quogue, 16 and 17 year old males and 6 to 11 year old females are the most vulnerable to poverty, with 24 males (100.0%) and 46 females (100.0%) in their respective age groups living below the poverty level.
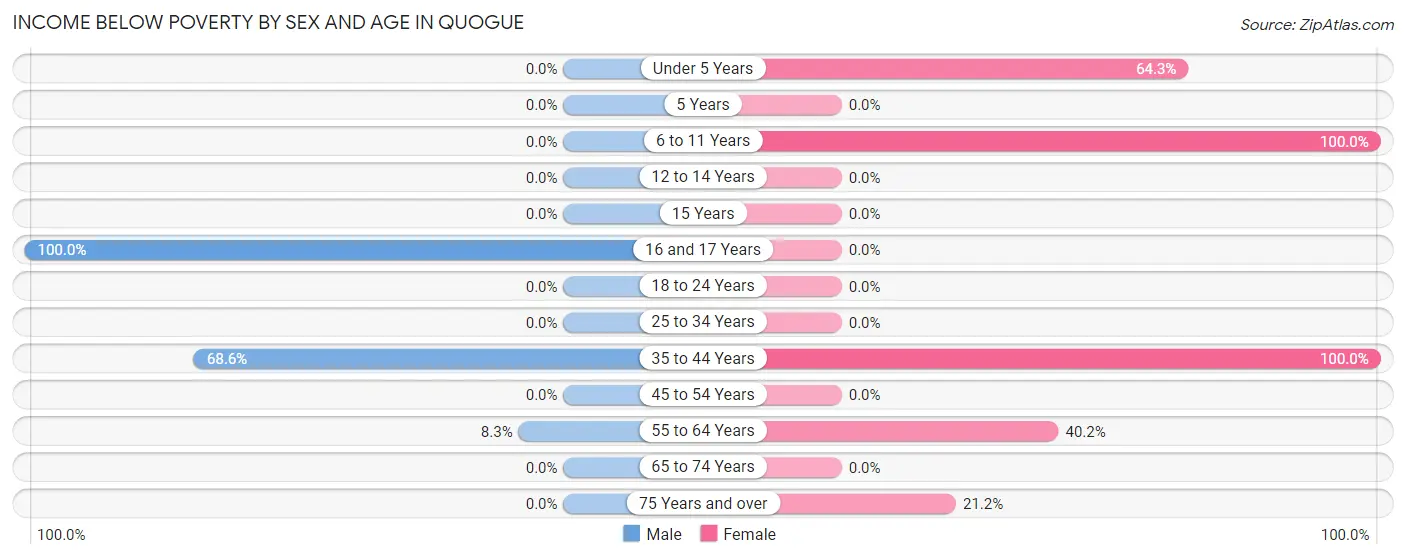
| Age Bracket | Male | Female |
| Under 5 Years | 0 (0.0%) | 27 (64.3%) |
| 5 Years | 0 (0.0%) | 0 (0.0%) |
| 6 to 11 Years | 0 (0.0%) | 46 (100.0%) |
| 12 to 14 Years | 0 (0.0%) | 0 (0.0%) |
| 15 Years | 0 (0.0%) | 0 (0.0%) |
| 16 and 17 Years | 24 (100.0%) | 0 (0.0%) |
| 18 to 24 Years | 0 (0.0%) | 0 (0.0%) |
| 25 to 34 Years | 0 (0.0%) | 0 (0.0%) |
| 35 to 44 Years | 24 (68.6%) | 22 (100.0%) |
| 45 to 54 Years | 0 (0.0%) | 0 (0.0%) |
| 55 to 64 Years | 2 (8.3%) | 35 (40.2%) |
| 65 to 74 Years | 0 (0.0%) | 0 (0.0%) |
| 75 Years and over | 0 (0.0%) | 14 (21.2%) |
| Total | 50 (18.8%) | 144 (38.5%) |
Income Above Poverty by Sex and Age in Quogue
According to the poverty statistics in Quogue, males aged 6 to 11 years and females aged 16 and 17 years are the age groups that are most secure financially, with 100.0% of males and 100.0% of females in these age groups living above the poverty line.
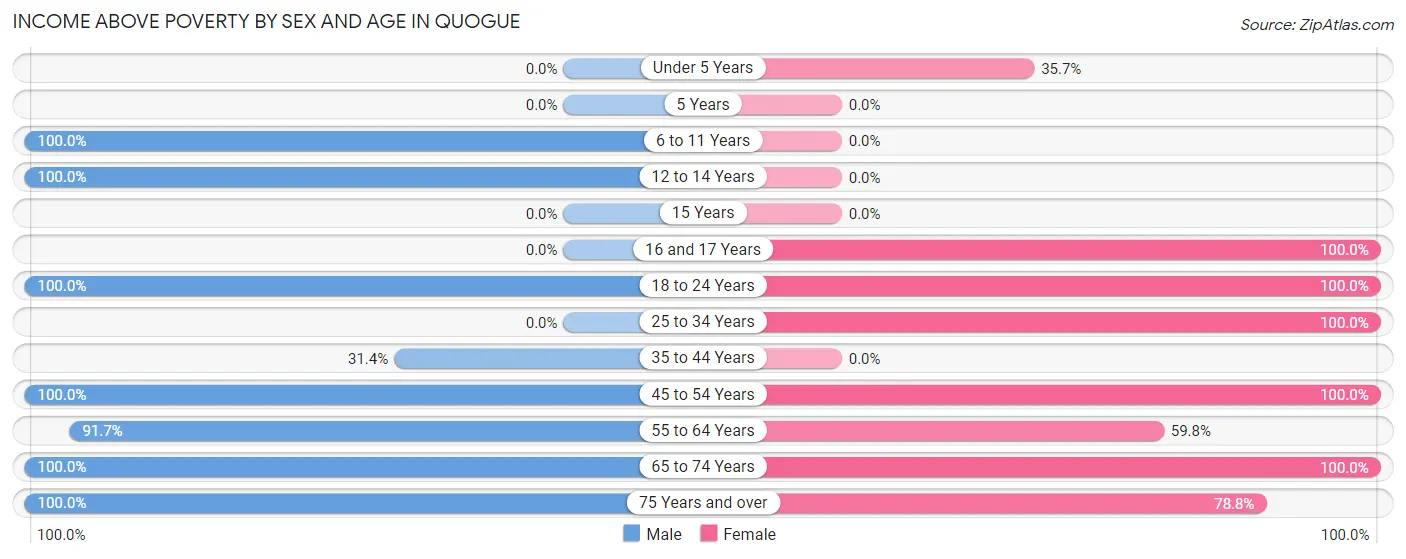
| Age Bracket | Male | Female |
| Under 5 Years | 0 (0.0%) | 15 (35.7%) |
| 5 Years | 0 (0.0%) | 0 (0.0%) |
| 6 to 11 Years | 12 (100.0%) | 0 (0.0%) |
| 12 to 14 Years | 11 (100.0%) | 0 (0.0%) |
| 15 Years | 0 (0.0%) | 0 (0.0%) |
| 16 and 17 Years | 0 (0.0%) | 13 (100.0%) |
| 18 to 24 Years | 30 (100.0%) | 18 (100.0%) |
| 25 to 34 Years | 0 (0.0%) | 13 (100.0%) |
| 35 to 44 Years | 11 (31.4%) | 0 (0.0%) |
| 45 to 54 Years | 30 (100.0%) | 24 (100.0%) |
| 55 to 64 Years | 22 (91.7%) | 52 (59.8%) |
| 65 to 74 Years | 62 (100.0%) | 43 (100.0%) |
| 75 Years and over | 38 (100.0%) | 52 (78.8%) |
| Total | 216 (81.2%) | 230 (61.5%) |
Income Below Poverty Among Married-Couple Families in Quogue
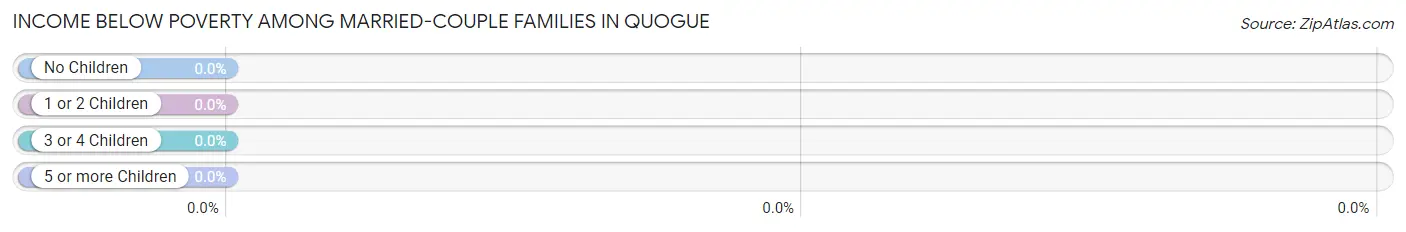
| Children | Above Poverty | Below Poverty |
| No Children | 120 (100.0%) | 0 (0.0%) |
| 1 or 2 Children | 33 (100.0%) | 0 (0.0%) |
| 3 or 4 Children | 0 (0.0%) | 0 (0.0%) |
| 5 or more Children | 0 (0.0%) | 0 (0.0%) |
| Total | 153 (100.0%) | 0 (0.0%) |
Income Below Poverty Among Single-Parent Households in Quogue
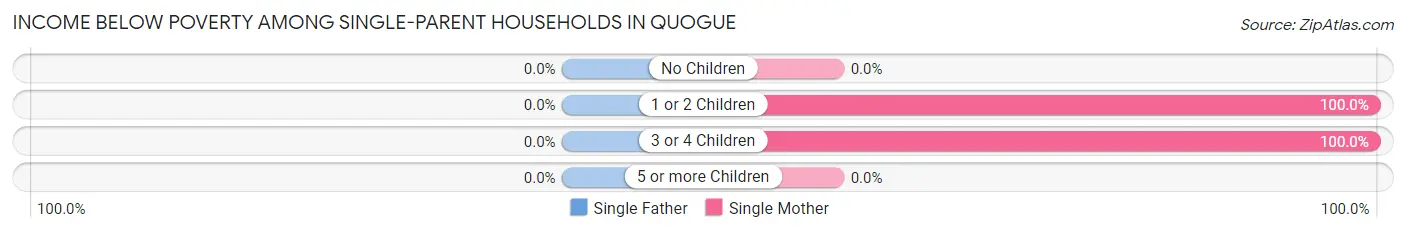
| Children | Single Father | Single Mother |
| No Children | 0 (0.0%) | 0 (0.0%) |
| 1 or 2 Children | 0 (0.0%) | 22 (100.0%) |
| 3 or 4 Children | 0 (0.0%) | 21 (100.0%) |
| 5 or more Children | 0 (0.0%) | 0 (0.0%) |
| Total | 0 (0.0%) | 43 (76.8%) |
Income Below Poverty Among Married-Couple vs Single-Parent Households in Quogue
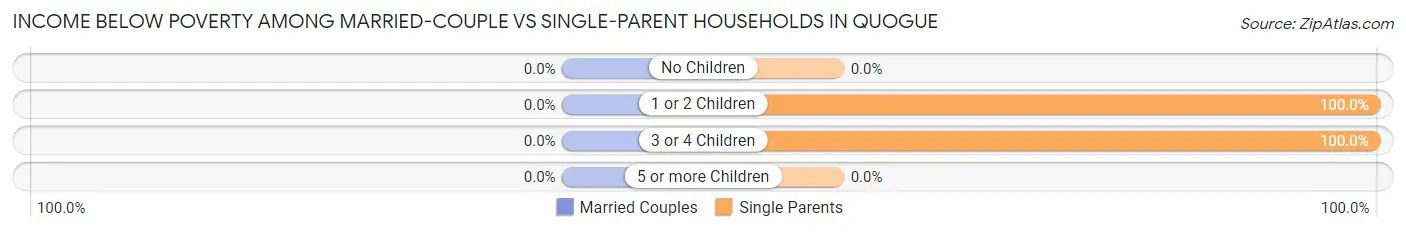
| Children | Married-Couple Families | Single-Parent Households |
| No Children | 0 (0.0%) | 0 (0.0%) |
| 1 or 2 Children | 0 (0.0%) | 22 (100.0%) |
| 3 or 4 Children | 0 (0.0%) | 21 (100.0%) |
| 5 or more Children | 0 (0.0%) | 0 (0.0%) |
| Total | 0 (0.0%) | 43 (76.8%) |
Race in Quogue
The most populous races in Quogue are White / Caucasian (490 | 76.6%), Hispanic or Latino (133 | 20.8%), and Two or more Races (133 | 20.8%).
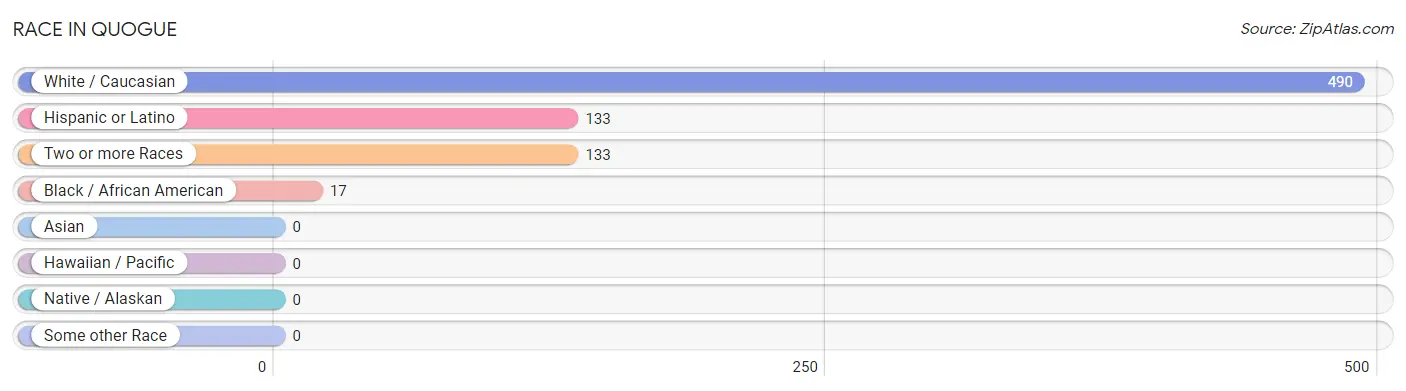
| Race | # Population | % Population |
| Asian | 0 | 0.0% |
| Black / African American | 17 | 2.7% |
| Hawaiian / Pacific | 0 | 0.0% |
| Hispanic or Latino | 133 | 20.8% |
| Native / Alaskan | 0 | 0.0% |
| White / Caucasian | 490 | 76.6% |
| Two or more Races | 133 | 20.8% |
| Some other Race | 0 | 0.0% |
| Total | 640 | 100.0% |
Ancestry in Quogue
The most populous ancestries reported in Quogue are Irish (135 | 21.1%), European (114 | 17.8%), Ecuadorian (95 | 14.8%), South American (95 | 14.8%), and English (84 | 13.1%), together accounting for 81.7% of all Quogue residents.
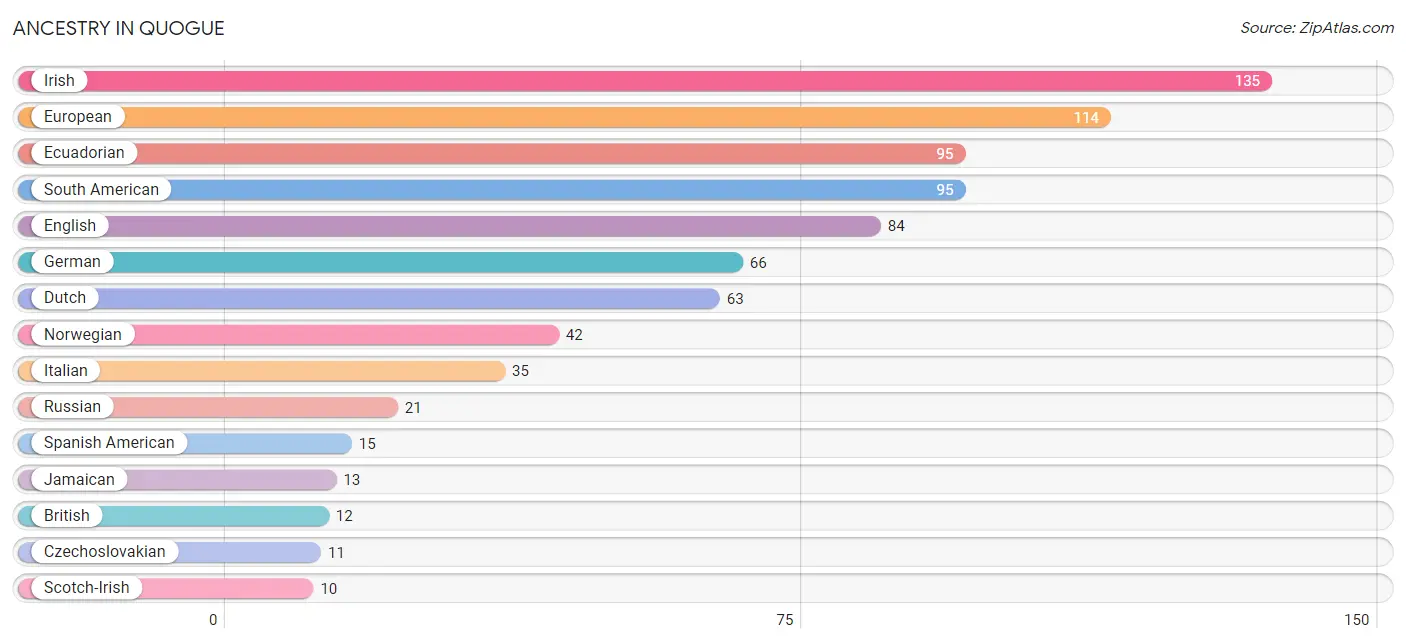
| Ancestry | # Population | % Population |
| British | 12 | 1.9% |
| Czechoslovakian | 11 | 1.7% |
| Dutch | 63 | 9.8% |
| Ecuadorian | 95 | 14.8% |
| English | 84 | 13.1% |
| European | 114 | 17.8% |
| German | 66 | 10.3% |
| Hungarian | 7 | 1.1% |
| Irish | 135 | 21.1% |
| Italian | 35 | 5.5% |
| Jamaican | 13 | 2.0% |
| Norwegian | 42 | 6.6% |
| Russian | 21 | 3.3% |
| Scotch-Irish | 10 | 1.6% |
| South American | 95 | 14.8% |
| Spanish American | 15 | 2.3% | View All 16 Rows |
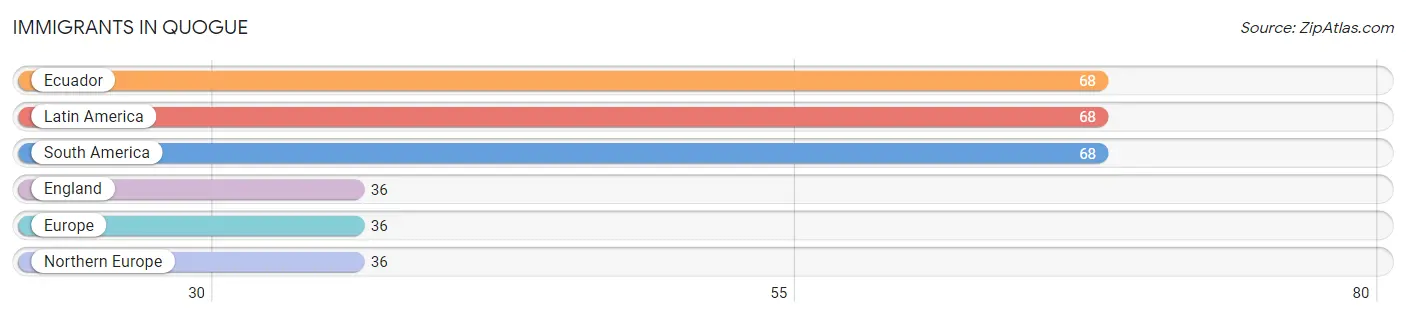
Immigrants in Quogue
The most numerous immigrant groups reported in Quogue came from Ecuador (68 | 10.6%), Latin America (68 | 10.6%), South America (68 | 10.6%), England (36 | 5.6%), and Europe (36 | 5.6%), together accounting for 43.1% of all Quogue residents.
| Immigration Origin | # Population | % Population |
| Ecuador | 68 | 10.6% |
| England | 36 | 5.6% |
| Europe | 36 | 5.6% |
| Latin America | 68 | 10.6% |
| Northern Europe | 36 | 5.6% |
| South America | 68 | 10.6% | View All 6 Rows |
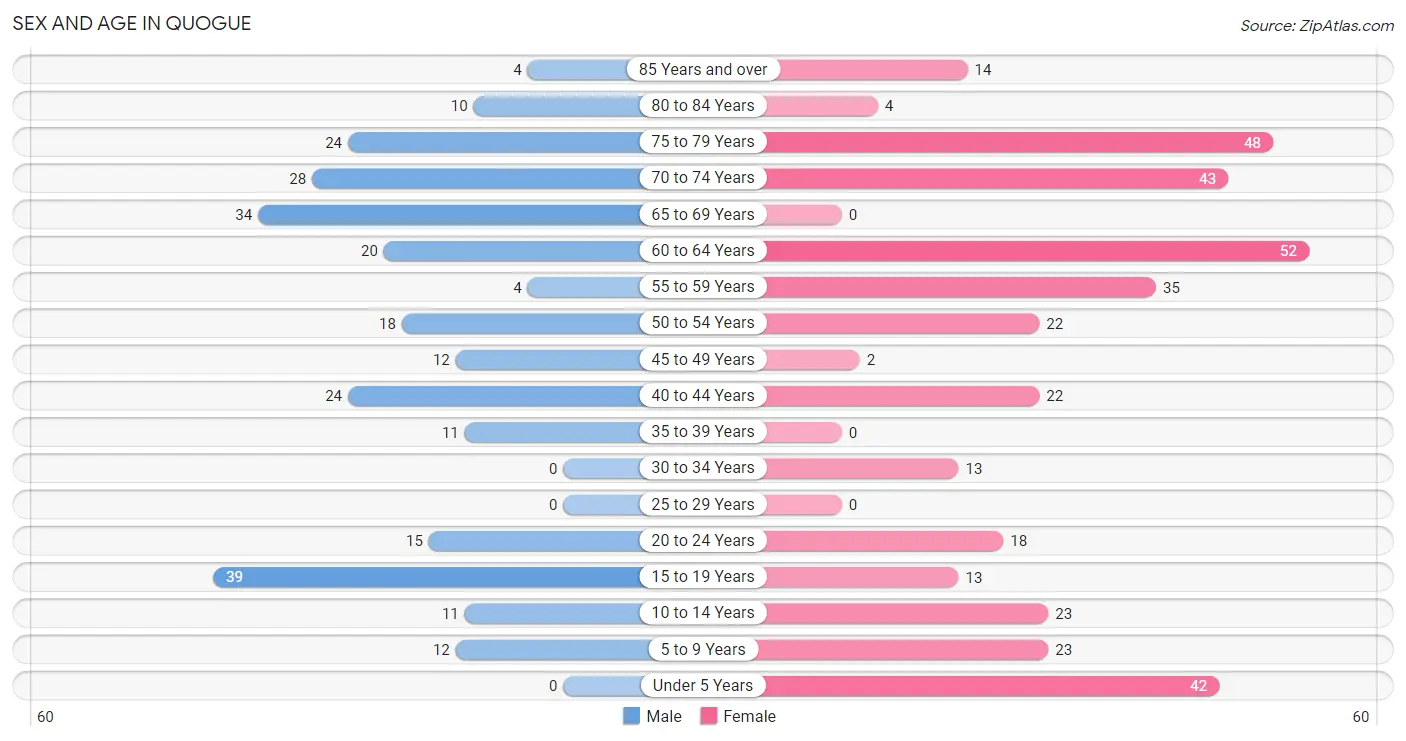
Sex and Age in Quogue
Sex and Age in Quogue
The most populous age groups in Quogue are 15 to 19 Years (39 | 14.7%) for men and 60 to 64 Years (52 | 13.9%) for women.
| Age Bracket | Male | Female |
| Under 5 Years | 0 (0.0%) | 42 (11.2%) |
| 5 to 9 Years | 12 (4.5%) | 23 (6.1%) |
| 10 to 14 Years | 11 (4.1%) | 23 (6.1%) |
| 15 to 19 Years | 39 (14.7%) | 13 (3.5%) |
| 20 to 24 Years | 15 (5.6%) | 18 (4.8%) |
| 25 to 29 Years | 0 (0.0%) | 0 (0.0%) |
| 30 to 34 Years | 0 (0.0%) | 13 (3.5%) |
| 35 to 39 Years | 11 (4.1%) | 0 (0.0%) |
| 40 to 44 Years | 24 (9.0%) | 22 (5.9%) |
| 45 to 49 Years | 12 (4.5%) | 2 (0.5%) |
| 50 to 54 Years | 18 (6.8%) | 22 (5.9%) |
| 55 to 59 Years | 4 (1.5%) | 35 (9.4%) |
| 60 to 64 Years | 20 (7.5%) | 52 (13.9%) |
| 65 to 69 Years | 34 (12.8%) | 0 (0.0%) |
| 70 to 74 Years | 28 (10.5%) | 43 (11.5%) |
| 75 to 79 Years | 24 (9.0%) | 48 (12.8%) |
| 80 to 84 Years | 10 (3.8%) | 4 (1.1%) |
| 85 Years and over | 4 (1.5%) | 14 (3.7%) |
| Total | 266 (100.0%) | 374 (100.0%) |
Families and Households in Quogue
Median Family Size in Quogue
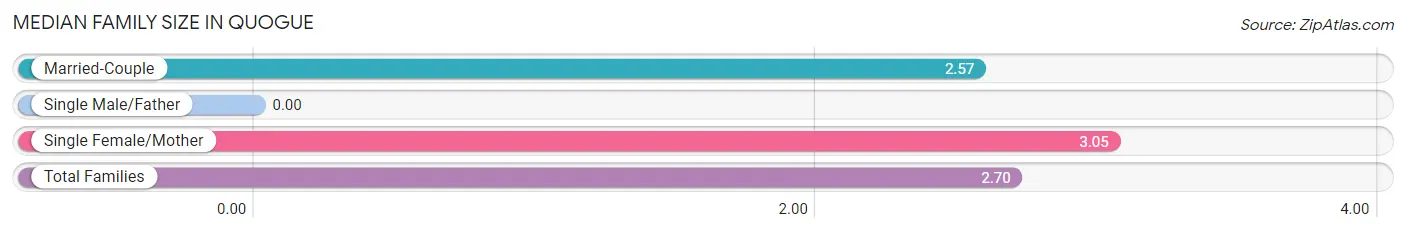
| Family Type | # Families | Family Size |
| Married-Couple | 153 (73.2%) | 2.57 |
| Single Male/Father | 0 (0.0%) | - |
| Single Female/Mother | 56 (26.8%) | 3.05 |
| Total Families | 209 (100.0%) | 2.70 |
Median Household Size in Quogue
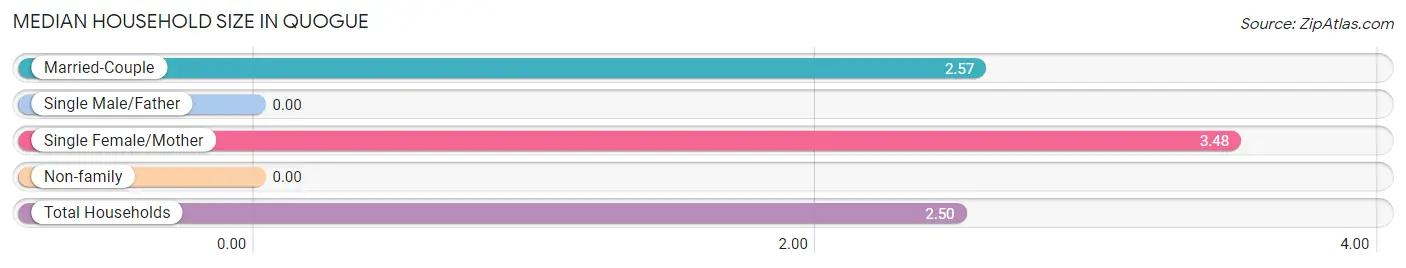
| Household Type | # Households | Household Size |
| Married-Couple | 153 (60.5%) | 2.57 |
| Single Male/Father | 0 (0.0%) | - |
| Single Female/Mother | 56 (22.1%) | 3.48 |
| Non-family | 44 (17.4%) | - |
| Total Households | 253 (100.0%) | 2.50 |
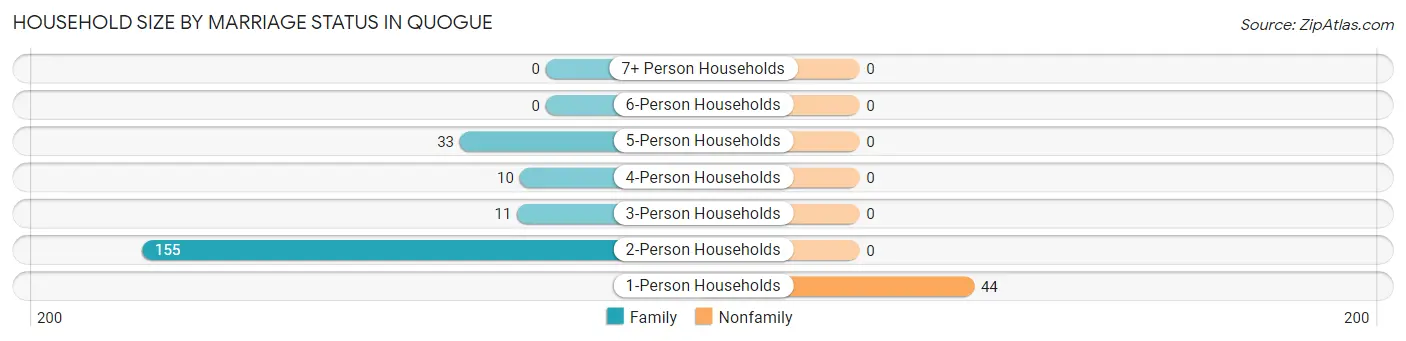
Household Size by Marriage Status in Quogue
Out of a total of 253 households in Quogue, 209 (82.6%) are family households, while 44 (17.4%) are nonfamily households. The most numerous type of family households are 2-person households, comprising 155, and the most common type of nonfamily households are 1-person households, comprising 44.
| Household Size | Family Households | Nonfamily Households |
| 1-Person Households | - | 44 (17.4%) |
| 2-Person Households | 155 (61.3%) | 0 (0.0%) |
| 3-Person Households | 11 (4.3%) | 0 (0.0%) |
| 4-Person Households | 10 (4.0%) | 0 (0.0%) |
| 5-Person Households | 33 (13.0%) | 0 (0.0%) |
| 6-Person Households | 0 (0.0%) | 0 (0.0%) |
| 7+ Person Households | 0 (0.0%) | 0 (0.0%) |
| Total | 209 (82.6%) | 44 (17.4%) |
Female Fertility in Quogue
Fertility by Age in Quogue
| Age Bracket | Women with Births | Births / 1,000 Women |
| 15 to 19 years | 0 (0.0%) | 0.0 |
| 20 to 34 years | 0 (0.0%) | 0.0 |
| 35 to 50 years | 0 (0.0%) | 0.0 |
| Total | 0 (0.0%) | 0.0 |
Fertility by Age by Marriage Status in Quogue
| Age Bracket | Married | Unmarried |
| 15 to 19 years | 0 (0.0%) | 0 (0.0%) |
| 20 to 34 years | 0 (0.0%) | 0 (0.0%) |
| 35 to 50 years | 0 (0.0%) | 0 (0.0%) |
| Total | 0 (0.0%) | 0 (0.0%) |
Fertility by Education in Quogue
| Educational Attainment | Women with Births | Births / 1,000 Women |
| Less than High School | 0 (0.0%) | 0.0 |
| High School Diploma | 0 (0.0%) | 0.0 |
| College or Associate's Degree | 0 (0.0%) | 0.0 |
| Bachelor's Degree | 0 (0.0%) | 0.0 |
| Graduate Degree | 0 (0.0%) | 0.0 |
| Total | 0 (0.0%) | 0.0 |
Fertility by Education by Marriage Status in Quogue
| Educational Attainment | Married | Unmarried |
| Less than High School | 0 (0.0%) | 0 (0.0%) |
| High School Diploma | 0 (0.0%) | 0 (0.0%) |
| College or Associate's Degree | 0 (0.0%) | 0 (0.0%) |
| Bachelor's Degree | 0 (0.0%) | 0 (0.0%) |
| Graduate Degree | 0 (0.0%) | 0 (0.0%) |
| Total | 0 (0.0%) | 0 (0.0%) |
Employment Characteristics in Quogue
Employment by Class of Employer in Quogue
Among the 334 employed individuals in Quogue, private company employees (170 | 50.9%), not-for-profit organizations (60 | 18.0%), and self-employed (not incorporated) (34 | 10.2%) make up the most common classes of employment.
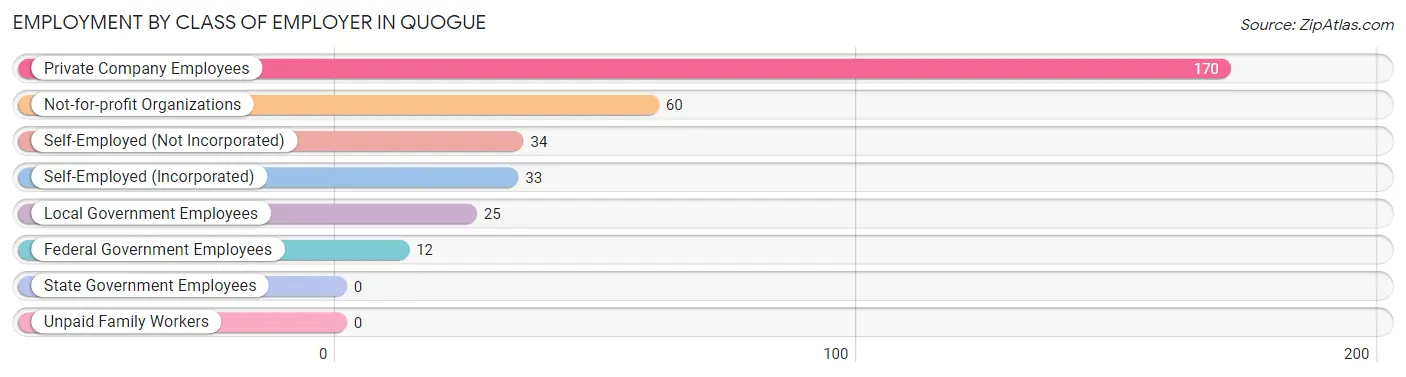
| Employer Class | # Employees | % Employees |
| Private Company Employees | 170 | 50.9% |
| Self-Employed (Incorporated) | 33 | 9.9% |
| Self-Employed (Not Incorporated) | 34 | 10.2% |
| Not-for-profit Organizations | 60 | 18.0% |
| Local Government Employees | 25 | 7.5% |
| State Government Employees | 0 | 0.0% |
| Federal Government Employees | 12 | 3.6% |
| Unpaid Family Workers | 0 | 0.0% |
| Total | 334 | 100.0% |
Employment Status by Age in Quogue
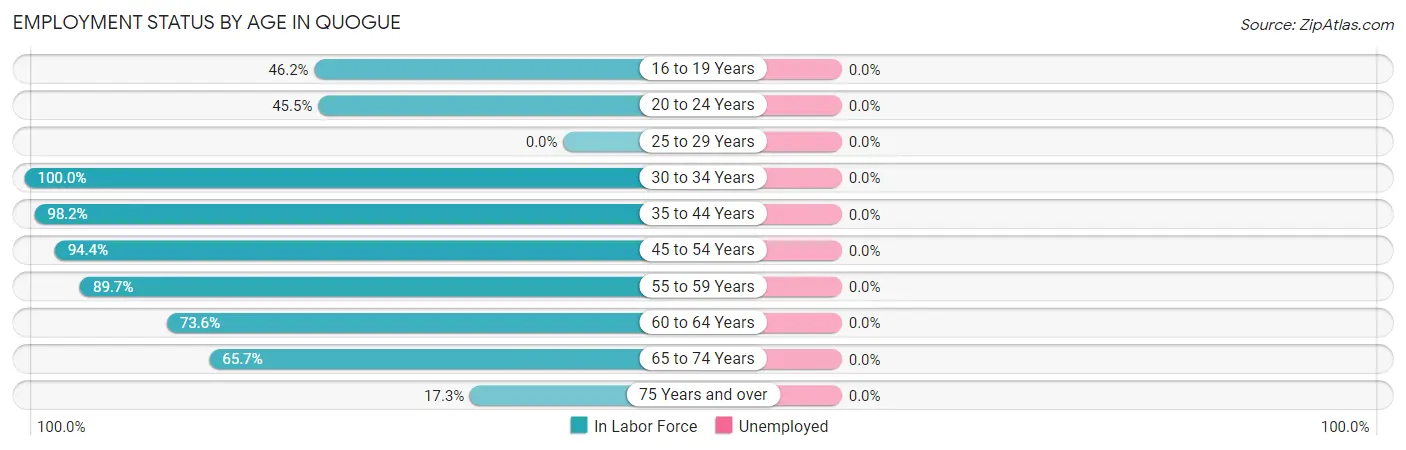
| Age Bracket | In Labor Force | Unemployed |
| 16 to 19 Years | 24 (46.2%) | 0 (0.0%) |
| 20 to 24 Years | 15 (45.5%) | 0 (0.0%) |
| 25 to 29 Years | 0 (0.0%) | 0 (0.0%) |
| 30 to 34 Years | 13 (100.0%) | 0 (0.0%) |
| 35 to 44 Years | 56 (98.2%) | 0 (0.0%) |
| 45 to 54 Years | 51 (94.4%) | 0 (0.0%) |
| 55 to 59 Years | 35 (89.7%) | 0 (0.0%) |
| 60 to 64 Years | 53 (73.6%) | 0 (0.0%) |
| 65 to 74 Years | 69 (65.7%) | 0 (0.0%) |
| 75 Years and over | 18 (17.3%) | 0 (0.0%) |
| Total | 334 (63.1%) | 0 (0.0%) |
Employment Status by Educational Attainment in Quogue
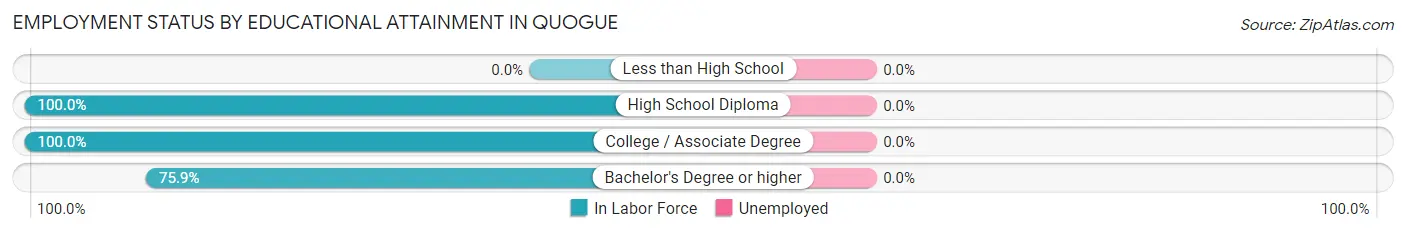
| Educational Attainment | In Labor Force | Unemployed |
| Less than High School | 0 (0.0%) | 0 (0.0%) |
| High School Diploma | 103 (100.0%) | 0 (0.0%) |
| College / Associate Degree | 39 (100.0%) | 0 (0.0%) |
| Bachelor's Degree or higher | 66 (75.9%) | 0 (0.0%) |
| Total | 208 (88.5%) | 0 (0.0%) |
Employment Occupations by Sex in Quogue
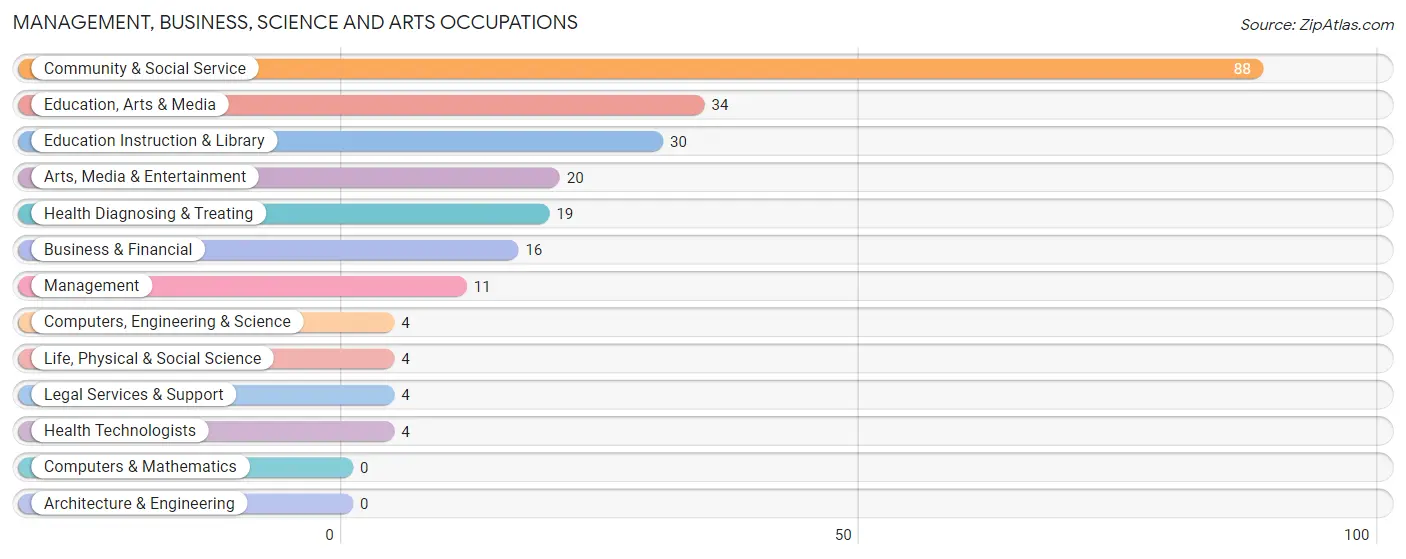
Management, Business, Science and Arts Occupations
The most common Management, Business, Science and Arts occupations in Quogue are Community & Social Service (88 | 26.4%), Education, Arts & Media (34 | 10.2%), Education Instruction & Library (30 | 9.0%), Arts, Media & Entertainment (20 | 6.0%), and Health Diagnosing & Treating (19 | 5.7%).
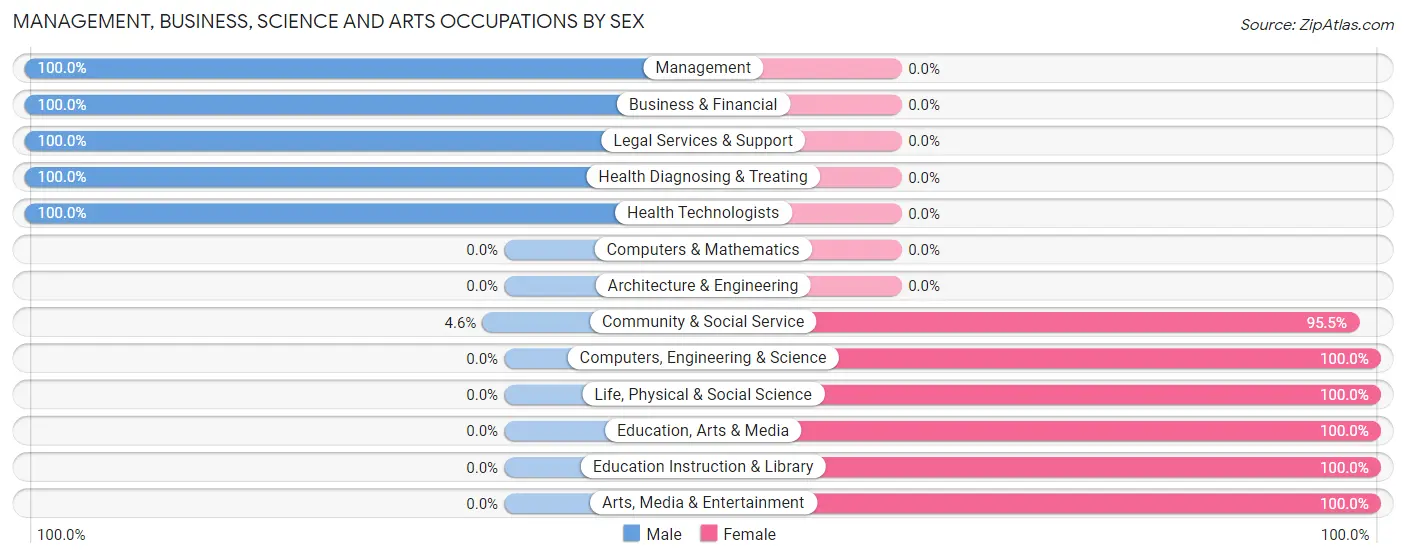
Management, Business, Science and Arts Occupations by Sex
Within the Management, Business, Science and Arts occupations in Quogue, the most male-oriented occupations are Management (100.0%), Business & Financial (100.0%), and Legal Services & Support (100.0%), while the most female-oriented occupations are Computers, Engineering & Science (100.0%), Life, Physical & Social Science (100.0%), and Education, Arts & Media (100.0%).
| Occupation | Male | Female |
| Management | 11 (100.0%) | 0 (0.0%) |
| Business & Financial | 16 (100.0%) | 0 (0.0%) |
| Computers, Engineering & Science | 0 (0.0%) | 4 (100.0%) |
| Computers & Mathematics | 0 (0.0%) | 0 (0.0%) |
| Architecture & Engineering | 0 (0.0%) | 0 (0.0%) |
| Life, Physical & Social Science | 0 (0.0%) | 4 (100.0%) |
| Community & Social Service | 4 (4.5%) | 84 (95.5%) |
| Education, Arts & Media | 0 (0.0%) | 34 (100.0%) |
| Legal Services & Support | 4 (100.0%) | 0 (0.0%) |
| Education Instruction & Library | 0 (0.0%) | 30 (100.0%) |
| Arts, Media & Entertainment | 0 (0.0%) | 20 (100.0%) |
| Health Diagnosing & Treating | 19 (100.0%) | 0 (0.0%) |
| Health Technologists | 4 (100.0%) | 0 (0.0%) |
| Total (Category) | 50 (36.2%) | 88 (63.8%) |
| Total (Overall) | 178 (53.3%) | 156 (46.7%) |
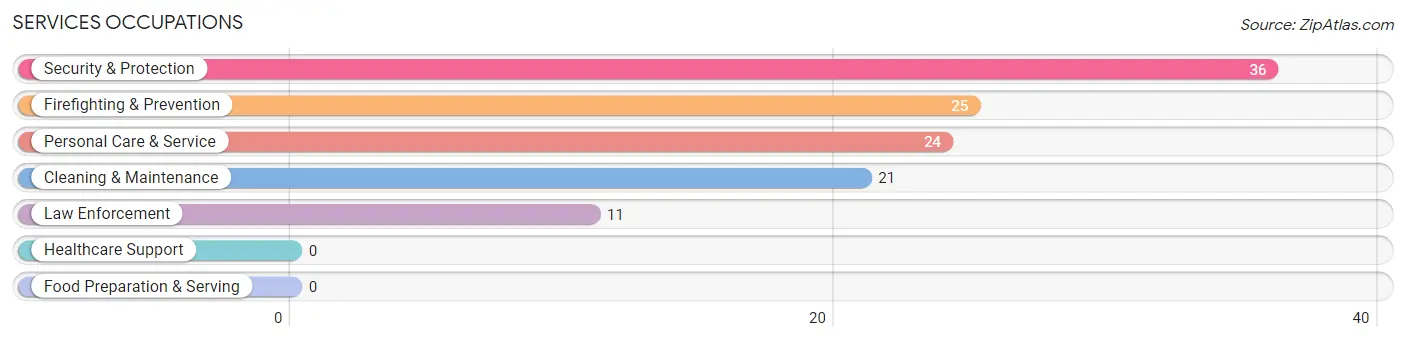
Services Occupations
The most common Services occupations in Quogue are Security & Protection (36 | 10.8%), Firefighting & Prevention (25 | 7.5%), Personal Care & Service (24 | 7.2%), Cleaning & Maintenance (21 | 6.3%), and Law Enforcement (11 | 3.3%).
Services Occupations by Sex
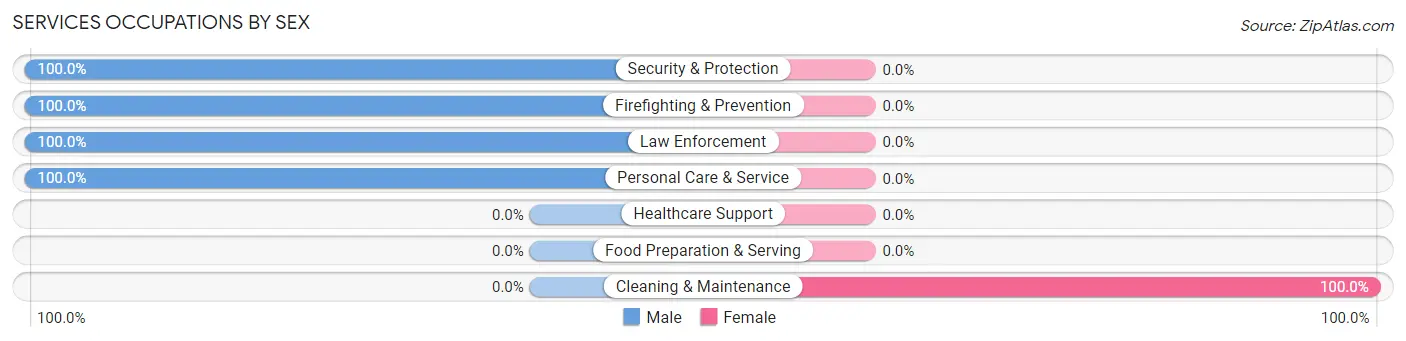
| Occupation | Male | Female |
| Healthcare Support | 0 (0.0%) | 0 (0.0%) |
| Security & Protection | 36 (100.0%) | 0 (0.0%) |
| Firefighting & Prevention | 25 (100.0%) | 0 (0.0%) |
| Law Enforcement | 11 (100.0%) | 0 (0.0%) |
| Food Preparation & Serving | 0 (0.0%) | 0 (0.0%) |
| Cleaning & Maintenance | 0 (0.0%) | 21 (100.0%) |
| Personal Care & Service | 24 (100.0%) | 0 (0.0%) |
| Total (Category) | 60 (74.1%) | 21 (25.9%) |
| Total (Overall) | 178 (53.3%) | 156 (46.7%) |
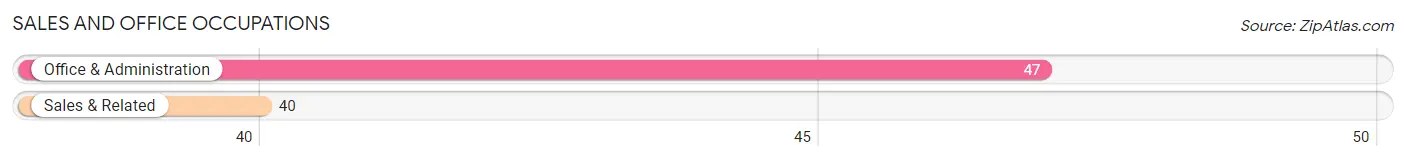
Sales and Office Occupations
The most common Sales and Office occupations in Quogue are Office & Administration (47 | 14.1%), and Sales & Related (40 | 12.0%).
Sales and Office Occupations by Sex
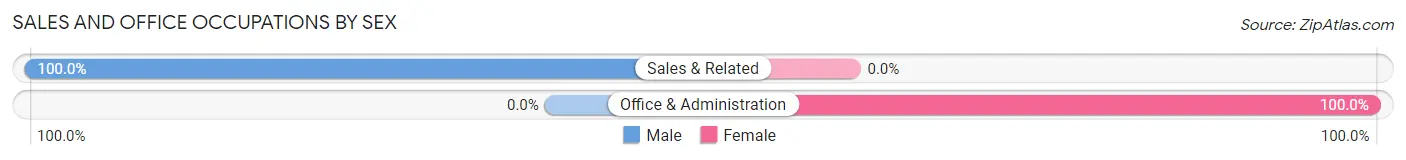
| Occupation | Male | Female |
| Sales & Related | 40 (100.0%) | 0 (0.0%) |
| Office & Administration | 0 (0.0%) | 47 (100.0%) |
| Total (Category) | 40 (46.0%) | 47 (54.0%) |
| Total (Overall) | 178 (53.3%) | 156 (46.7%) |
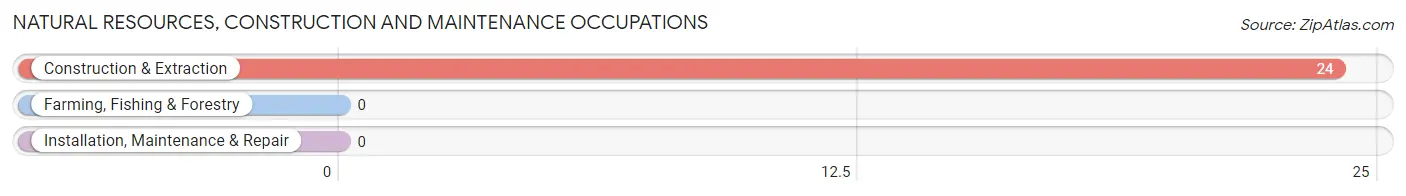
Natural Resources, Construction and Maintenance Occupations
The most common Natural Resources, Construction and Maintenance occupations in Quogue are , and Construction & Extraction (24 | 7.2%).
Natural Resources, Construction and Maintenance Occupations by Sex
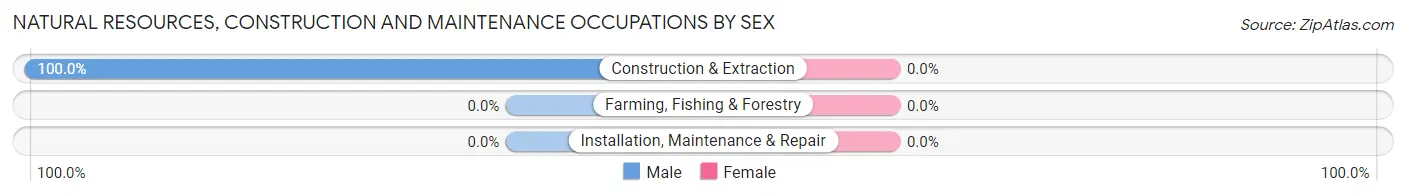
| Occupation | Male | Female |
| Farming, Fishing & Forestry | 0 (0.0%) | 0 (0.0%) |
| Construction & Extraction | 24 (100.0%) | 0 (0.0%) |
| Installation, Maintenance & Repair | 0 (0.0%) | 0 (0.0%) |
| Total (Category) | 24 (100.0%) | 0 (0.0%) |
| Total (Overall) | 178 (53.3%) | 156 (46.7%) |
Production, Transportation and Moving Occupations
The most common Production, Transportation and Moving occupations in Quogue are , and Transportation (4 | 1.2%).
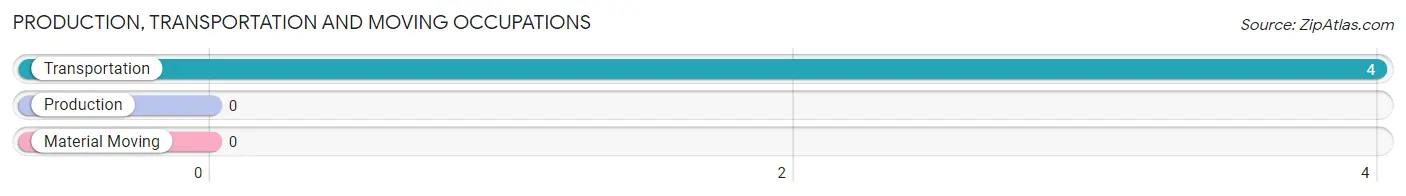
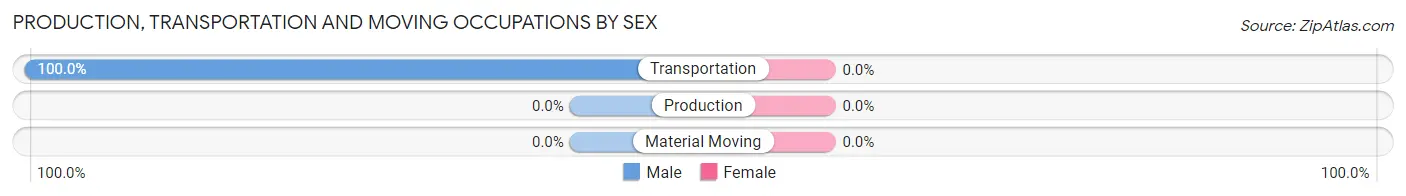
Production, Transportation and Moving Occupations by Sex
| Occupation | Male | Female |
| Production | 0 (0.0%) | 0 (0.0%) |
| Transportation | 4 (100.0%) | 0 (0.0%) |
| Material Moving | 0 (0.0%) | 0 (0.0%) |
| Total (Category) | 4 (100.0%) | 0 (0.0%) |
| Total (Overall) | 178 (53.3%) | 156 (46.7%) |
Employment Industries by Sex in Quogue
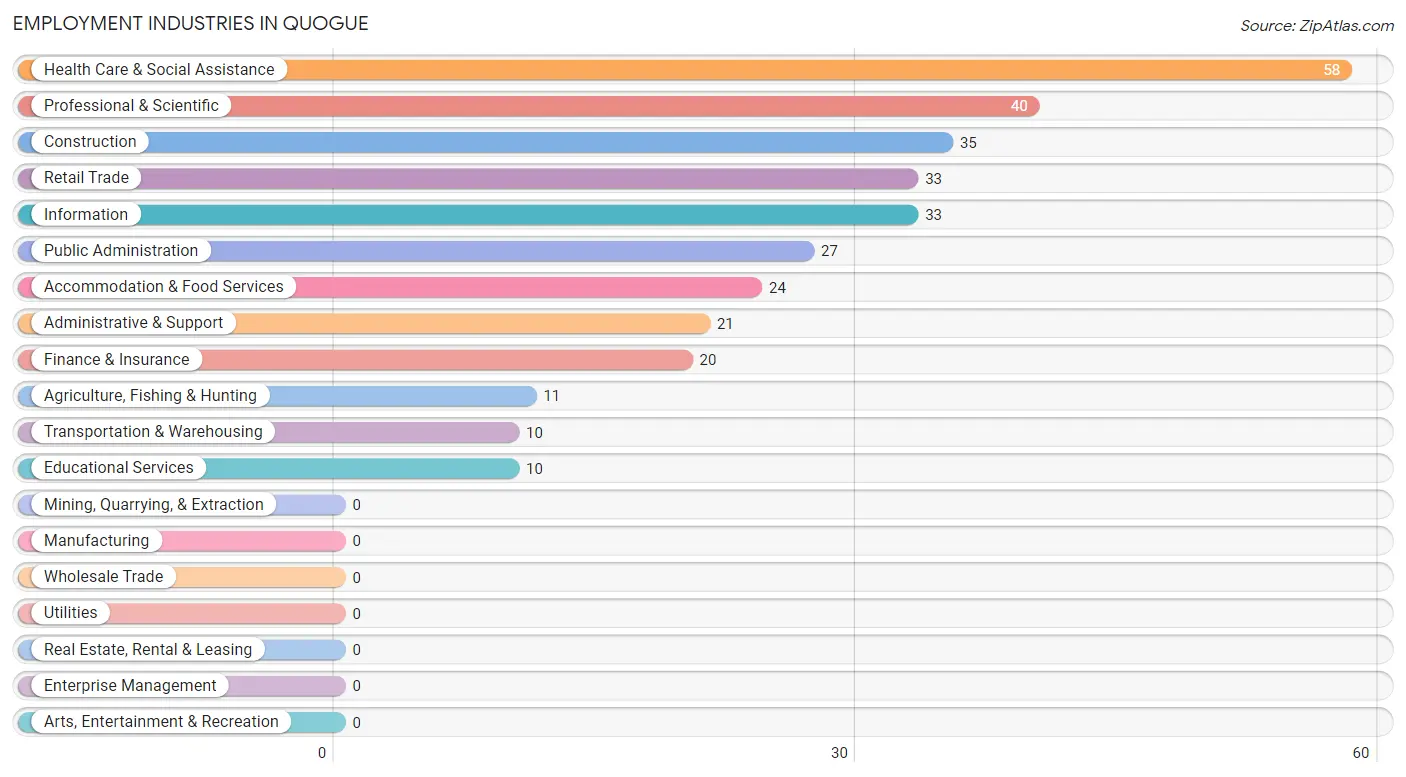
Employment Industries in Quogue
The major employment industries in Quogue include Health Care & Social Assistance (58 | 17.4%), Professional & Scientific (40 | 12.0%), Construction (35 | 10.5%), Retail Trade (33 | 9.9%), and Information (33 | 9.9%).
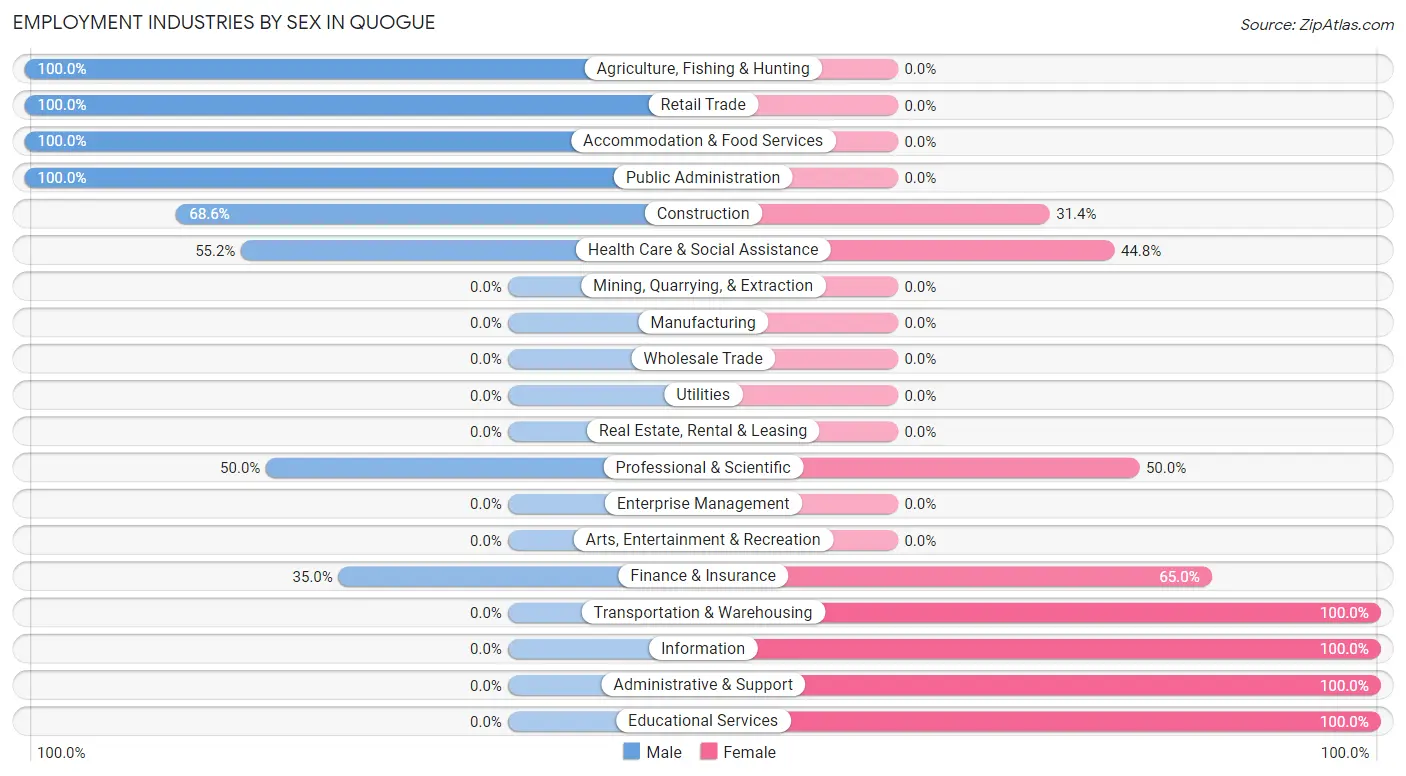
Employment Industries by Sex in Quogue
The Quogue industries that see more men than women are Agriculture, Fishing & Hunting (100.0%), Retail Trade (100.0%), and Accommodation & Food Services (100.0%), whereas the industries that tend to have a higher number of women are Transportation & Warehousing (100.0%), Information (100.0%), and Administrative & Support (100.0%).
| Industry | Male | Female |
| Agriculture, Fishing & Hunting | 11 (100.0%) | 0 (0.0%) |
| Mining, Quarrying, & Extraction | 0 (0.0%) | 0 (0.0%) |
| Construction | 24 (68.6%) | 11 (31.4%) |
| Manufacturing | 0 (0.0%) | 0 (0.0%) |
| Wholesale Trade | 0 (0.0%) | 0 (0.0%) |
| Retail Trade | 33 (100.0%) | 0 (0.0%) |
| Transportation & Warehousing | 0 (0.0%) | 10 (100.0%) |
| Utilities | 0 (0.0%) | 0 (0.0%) |
| Information | 0 (0.0%) | 33 (100.0%) |
| Finance & Insurance | 7 (35.0%) | 13 (65.0%) |
| Real Estate, Rental & Leasing | 0 (0.0%) | 0 (0.0%) |
| Professional & Scientific | 20 (50.0%) | 20 (50.0%) |
| Enterprise Management | 0 (0.0%) | 0 (0.0%) |
| Administrative & Support | 0 (0.0%) | 21 (100.0%) |
| Educational Services | 0 (0.0%) | 10 (100.0%) |
| Health Care & Social Assistance | 32 (55.2%) | 26 (44.8%) |
| Arts, Entertainment & Recreation | 0 (0.0%) | 0 (0.0%) |
| Accommodation & Food Services | 24 (100.0%) | 0 (0.0%) |
| Public Administration | 27 (100.0%) | 0 (0.0%) |
| Total | 178 (53.3%) | 156 (46.7%) |
Education in Quogue
School Enrollment in Quogue
The most common levels of schooling among the 139 students in Quogue are middle school (46 | 33.1%), high school (37 | 26.6%), and college / undergraduate (33 | 23.7%).
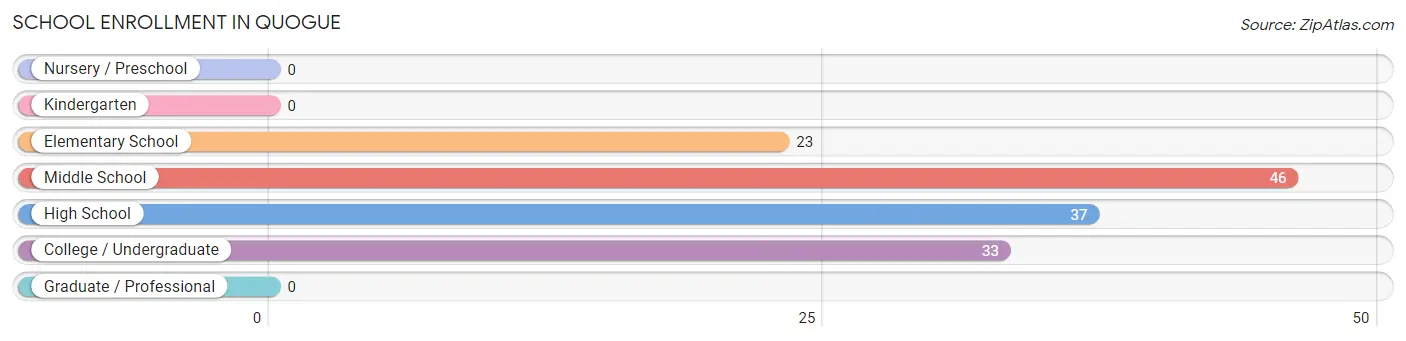
| School Level | # Students | % Students |
| Nursery / Preschool | 0 | 0.0% |
| Kindergarten | 0 | 0.0% |
| Elementary School | 23 | 16.6% |
| Middle School | 46 | 33.1% |
| High School | 37 | 26.6% |
| College / Undergraduate | 33 | 23.7% |
| Graduate / Professional | 0 | 0.0% |
| Total | 139 | 100.0% |
School Enrollment by Age by Funding Source in Quogue
Out of a total of 139 students who are enrolled in schools in Quogue, 31 (22.3%) attend a private institution, while the remaining 108 (77.7%) are enrolled in public schools. The age group of 20 to 24 year olds has the highest likelihood of being enrolled in private schools, with 18 (100.0% in the age bracket) enrolled. Conversely, the age group of 5 to 9 year old has the lowest likelihood of being enrolled in a private school, with 35 (100.0% in the age bracket) attending a public institution.
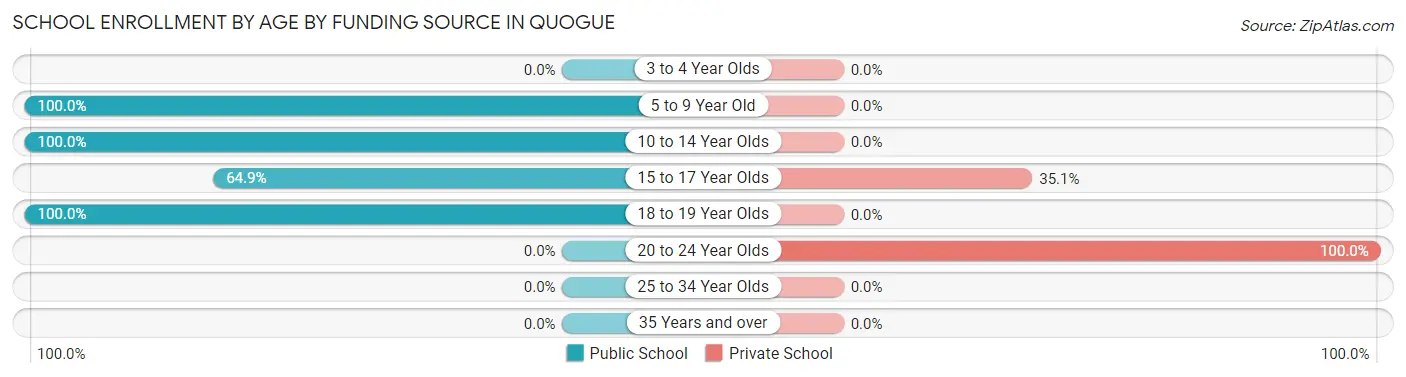
| Age Bracket | Public School | Private School |
| 3 to 4 Year Olds | 0 (0.0%) | 0 (0.0%) |
| 5 to 9 Year Old | 35 (100.0%) | 0 (0.0%) |
| 10 to 14 Year Olds | 34 (100.0%) | 0 (0.0%) |
| 15 to 17 Year Olds | 24 (64.9%) | 13 (35.1%) |
| 18 to 19 Year Olds | 15 (100.0%) | 0 (0.0%) |
| 20 to 24 Year Olds | 0 (0.0%) | 18 (100.0%) |
| 25 to 34 Year Olds | 0 (0.0%) | 0 (0.0%) |
| 35 Years and over | 0 (0.0%) | 0 (0.0%) |
| Total | 108 (77.7%) | 31 (22.3%) |
Educational Attainment by Field of Study in Quogue
Arts & humanities (36 | 21.6%), science & technology (35 | 21.0%), education (35 | 21.0%), business (20 | 12.0%), and literature & languages (14 | 8.4%) are the most common fields of study among 167 individuals in Quogue who have obtained a bachelor's degree or higher.
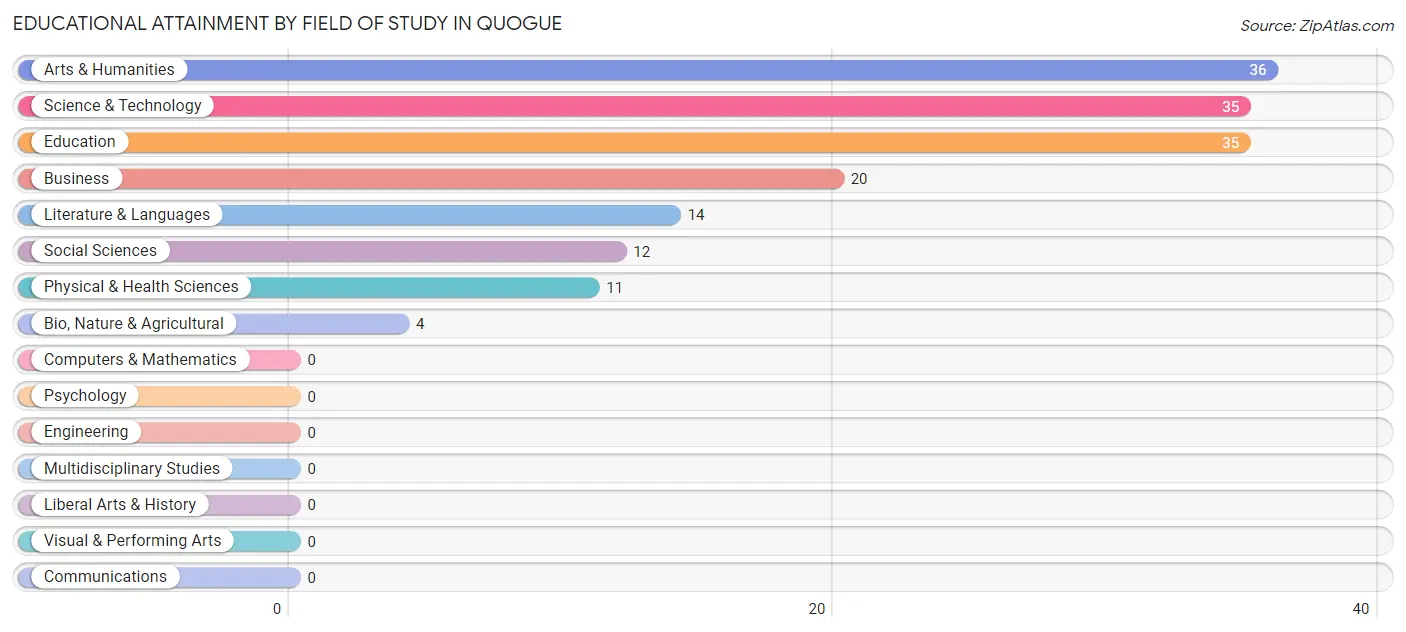
| Field of Study | # Graduates | % Graduates |
| Computers & Mathematics | 0 | 0.0% |
| Bio, Nature & Agricultural | 4 | 2.4% |
| Physical & Health Sciences | 11 | 6.6% |
| Psychology | 0 | 0.0% |
| Social Sciences | 12 | 7.2% |
| Engineering | 0 | 0.0% |
| Multidisciplinary Studies | 0 | 0.0% |
| Science & Technology | 35 | 21.0% |
| Business | 20 | 12.0% |
| Education | 35 | 21.0% |
| Literature & Languages | 14 | 8.4% |
| Liberal Arts & History | 0 | 0.0% |
| Visual & Performing Arts | 0 | 0.0% |
| Communications | 0 | 0.0% |
| Arts & Humanities | 36 | 21.6% |
| Total | 167 | 100.0% |
Transportation & Commute in Quogue
Vehicle Availability by Sex in Quogue
The most prevalent vehicle ownership categories in Quogue are males with 2 vehicles (66, accounting for 37.1%) and females with 2 vehicles (47, making up 42.3%).
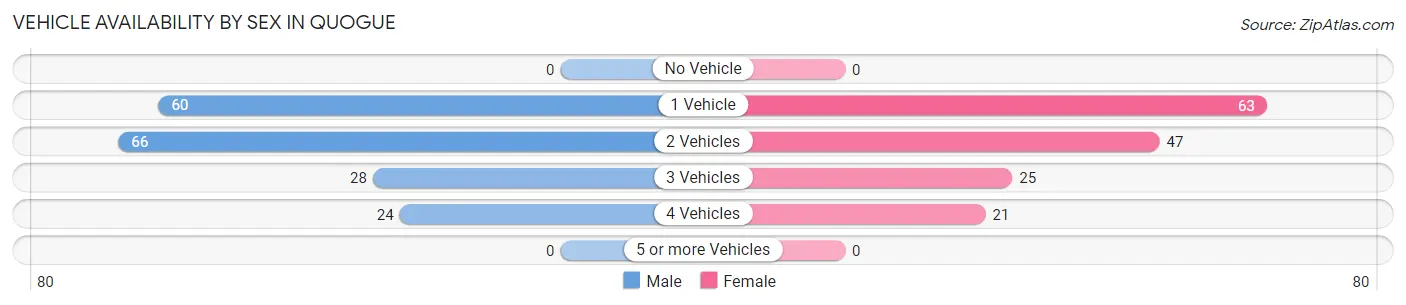
| Vehicles Available | Male | Female |
| No Vehicle | 0 (0.0%) | 0 (0.0%) |
| 1 Vehicle | 60 (33.7%) | 63 (40.4%) |
| 2 Vehicles | 66 (37.1%) | 47 (30.1%) |
| 3 Vehicles | 28 (15.7%) | 25 (16.0%) |
| 4 Vehicles | 24 (13.5%) | 21 (13.5%) |
| 5 or more Vehicles | 0 (0.0%) | 0 (0.0%) |
| Total | 178 (100.0%) | 156 (100.0%) |
Commute Time in Quogue
The most frequently occuring commute durations in Quogue are 20 to 24 minutes (83 commuters, 32.2%), 5 to 9 minutes (47 commuters, 18.2%), and 10 to 14 minutes (32 commuters, 12.4%).
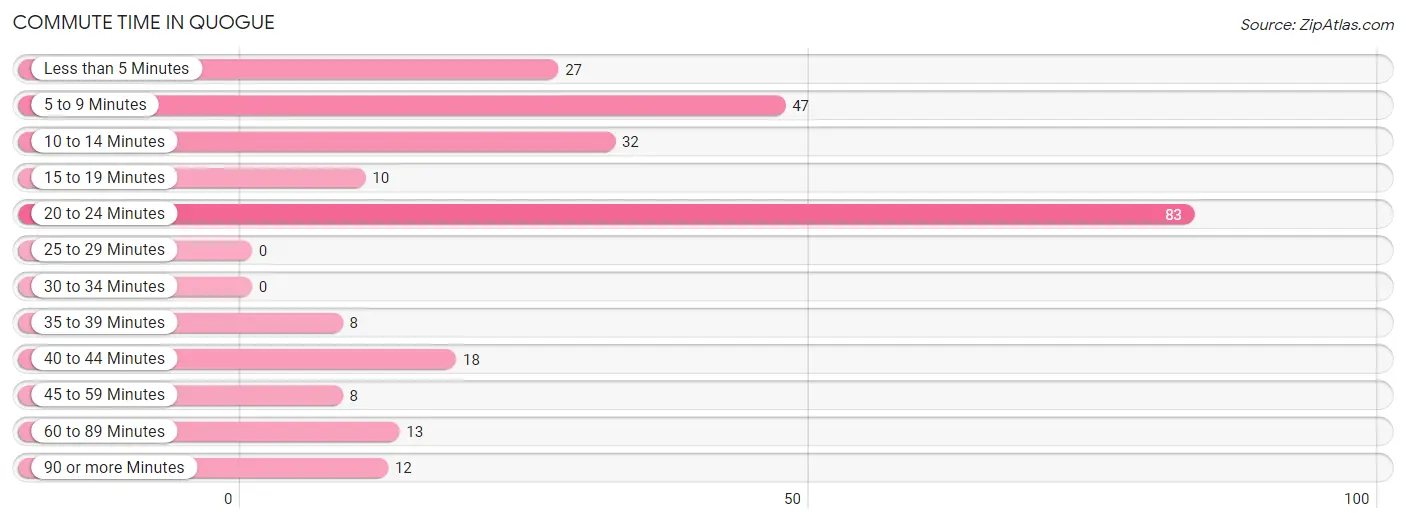
| Commute Time | # Commuters | % Commuters |
| Less than 5 Minutes | 27 | 10.5% |
| 5 to 9 Minutes | 47 | 18.2% |
| 10 to 14 Minutes | 32 | 12.4% |
| 15 to 19 Minutes | 10 | 3.9% |
| 20 to 24 Minutes | 83 | 32.2% |
| 25 to 29 Minutes | 0 | 0.0% |
| 30 to 34 Minutes | 0 | 0.0% |
| 35 to 39 Minutes | 8 | 3.1% |
| 40 to 44 Minutes | 18 | 7.0% |
| 45 to 59 Minutes | 8 | 3.1% |
| 60 to 89 Minutes | 13 | 5.0% |
| 90 or more Minutes | 12 | 4.6% |
Commute Time by Sex in Quogue
The most common commute times in Quogue are 20 to 24 minutes (70 commuters, 45.2%) for males and 5 to 9 minutes (32 commuters, 31.1%) for females.
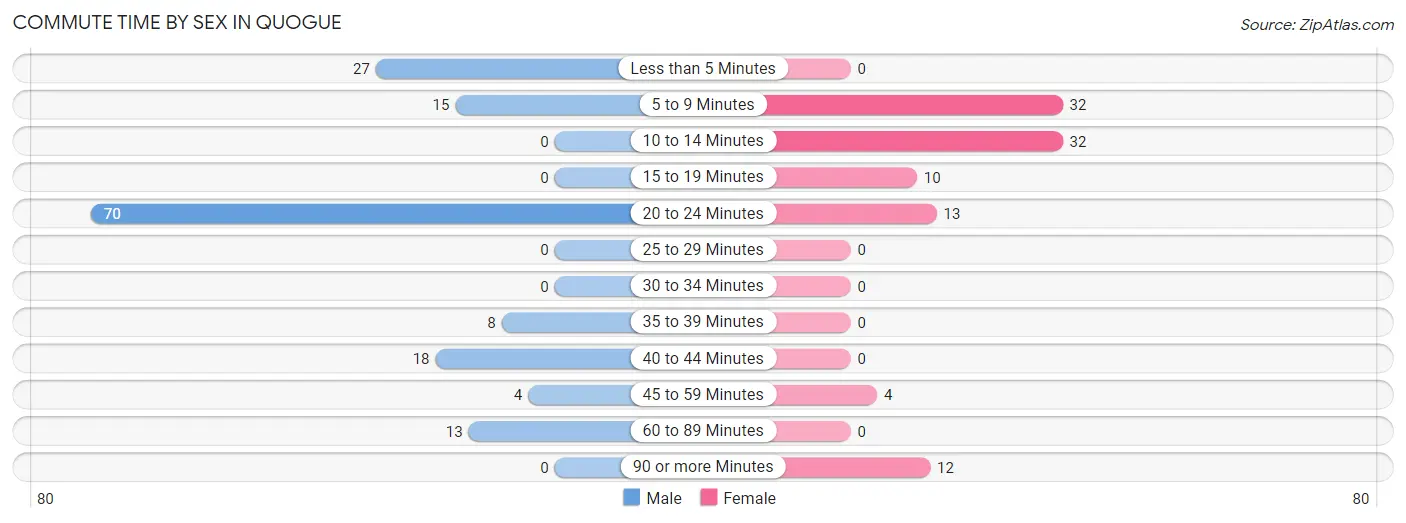
| Commute Time | Male | Female |
| Less than 5 Minutes | 27 (17.4%) | 0 (0.0%) |
| 5 to 9 Minutes | 15 (9.7%) | 32 (31.1%) |
| 10 to 14 Minutes | 0 (0.0%) | 32 (31.1%) |
| 15 to 19 Minutes | 0 (0.0%) | 10 (9.7%) |
| 20 to 24 Minutes | 70 (45.2%) | 13 (12.6%) |
| 25 to 29 Minutes | 0 (0.0%) | 0 (0.0%) |
| 30 to 34 Minutes | 0 (0.0%) | 0 (0.0%) |
| 35 to 39 Minutes | 8 (5.2%) | 0 (0.0%) |
| 40 to 44 Minutes | 18 (11.6%) | 0 (0.0%) |
| 45 to 59 Minutes | 4 (2.6%) | 4 (3.9%) |
| 60 to 89 Minutes | 13 (8.4%) | 0 (0.0%) |
| 90 or more Minutes | 0 (0.0%) | 12 (11.7%) |
Time of Departure to Work by Sex in Quogue
The most frequent times of departure to work in Quogue are 7:00 AM to 7:29 AM (49, 31.6%) for males and 8:00 AM to 8:29 AM (57, 55.3%) for females.
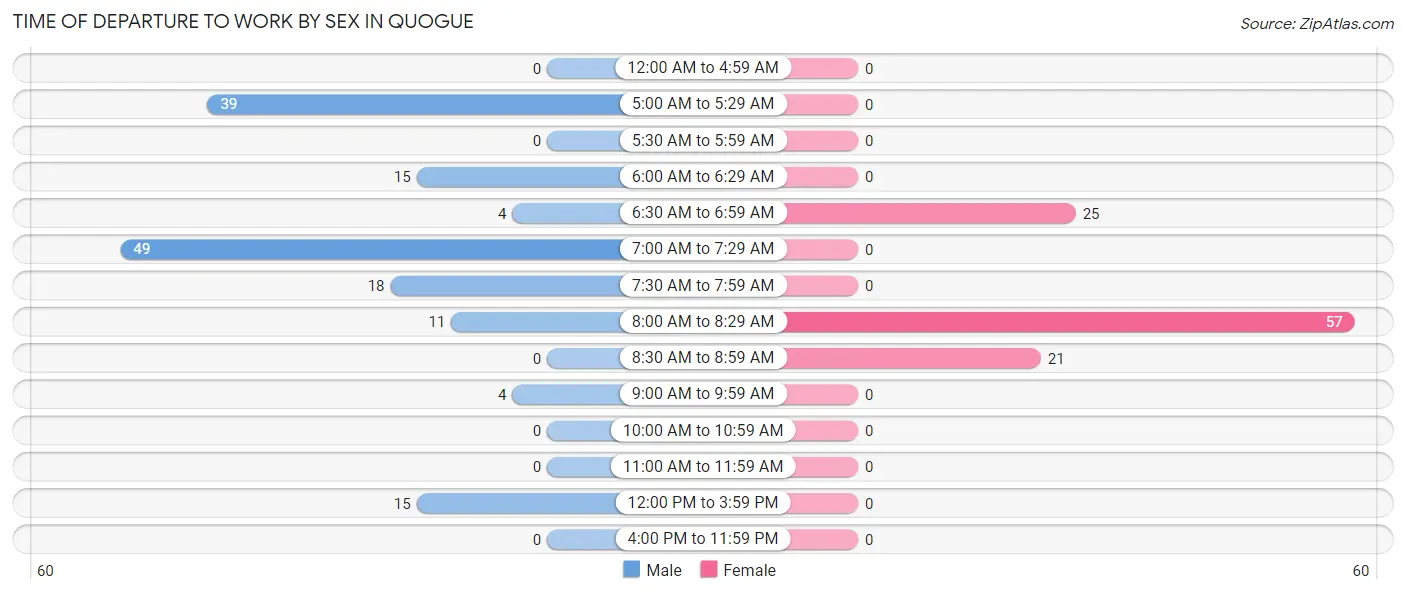
| Time of Departure | Male | Female |
| 12:00 AM to 4:59 AM | 0 (0.0%) | 0 (0.0%) |
| 5:00 AM to 5:29 AM | 39 (25.2%) | 0 (0.0%) |
| 5:30 AM to 5:59 AM | 0 (0.0%) | 0 (0.0%) |
| 6:00 AM to 6:29 AM | 15 (9.7%) | 0 (0.0%) |
| 6:30 AM to 6:59 AM | 4 (2.6%) | 25 (24.3%) |
| 7:00 AM to 7:29 AM | 49 (31.6%) | 0 (0.0%) |
| 7:30 AM to 7:59 AM | 18 (11.6%) | 0 (0.0%) |
| 8:00 AM to 8:29 AM | 11 (7.1%) | 57 (55.3%) |
| 8:30 AM to 8:59 AM | 0 (0.0%) | 21 (20.4%) |
| 9:00 AM to 9:59 AM | 4 (2.6%) | 0 (0.0%) |
| 10:00 AM to 10:59 AM | 0 (0.0%) | 0 (0.0%) |
| 11:00 AM to 11:59 AM | 0 (0.0%) | 0 (0.0%) |
| 12:00 PM to 3:59 PM | 15 (9.7%) | 0 (0.0%) |
| 4:00 PM to 11:59 PM | 0 (0.0%) | 0 (0.0%) |
| Total | 155 (100.0%) | 103 (100.0%) |
Housing Occupancy in Quogue
Occupancy by Ownership in Quogue
Of the total 253 dwellings in Quogue, owner-occupied units account for 188 (74.3%), while renter-occupied units make up 65 (25.7%).
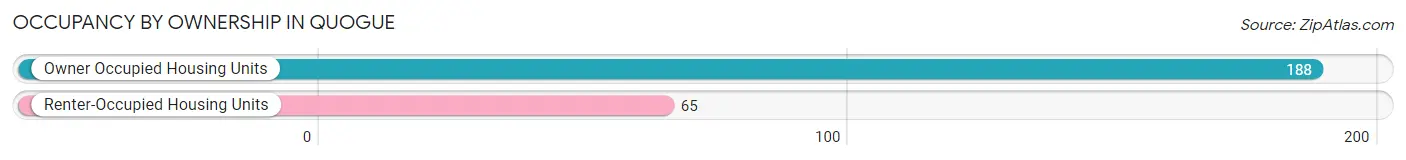
| Occupancy | # Housing Units | % Housing Units |
| Owner Occupied Housing Units | 188 | 74.3% |
| Renter-Occupied Housing Units | 65 | 25.7% |
| Total Occupied Housing Units | 253 | 100.0% |
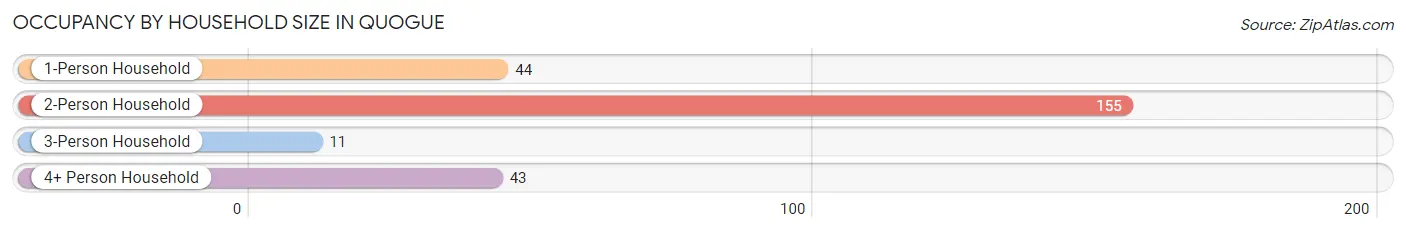
Occupancy by Household Size in Quogue
| Household Size | # Housing Units | % Housing Units |
| 1-Person Household | 44 | 17.4% |
| 2-Person Household | 155 | 61.3% |
| 3-Person Household | 11 | 4.3% |
| 4+ Person Household | 43 | 17.0% |
| Total Housing Units | 253 | 100.0% |
Occupancy by Ownership by Household Size in Quogue
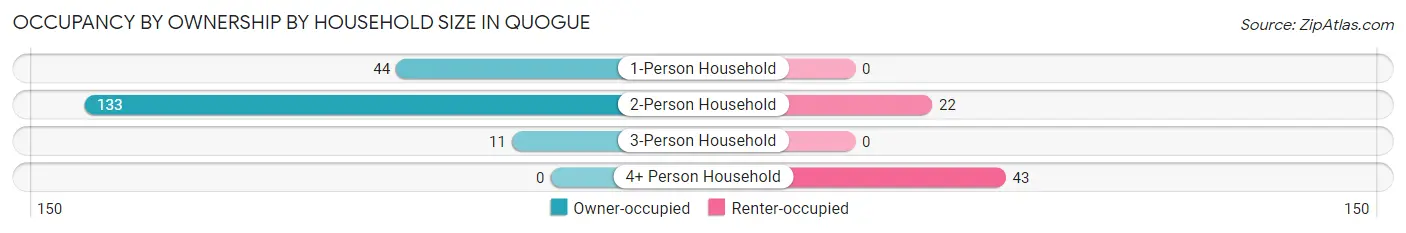
| Household Size | Owner-occupied | Renter-occupied |
| 1-Person Household | 44 (100.0%) | 0 (0.0%) |
| 2-Person Household | 133 (85.8%) | 22 (14.2%) |
| 3-Person Household | 11 (100.0%) | 0 (0.0%) |
| 4+ Person Household | 0 (0.0%) | 43 (100.0%) |
| Total Housing Units | 188 (74.3%) | 65 (25.7%) |
Occupancy by Educational Attainment in Quogue
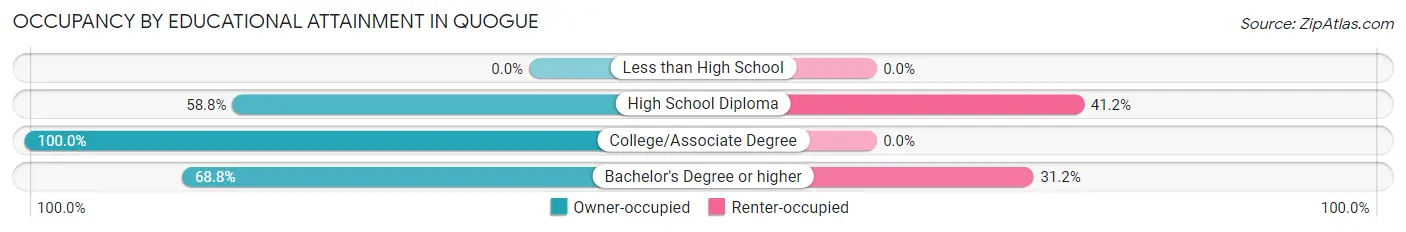
| Household Size | Owner-occupied | Renter-occupied |
| Less than High School | 0 (0.0%) | 0 (0.0%) |
| High School Diploma | 30 (58.8%) | 21 (41.2%) |
| College/Associate Degree | 61 (100.0%) | 0 (0.0%) |
| Bachelor's Degree or higher | 97 (68.8%) | 44 (31.2%) |
Occupancy by Age of Householder in Quogue
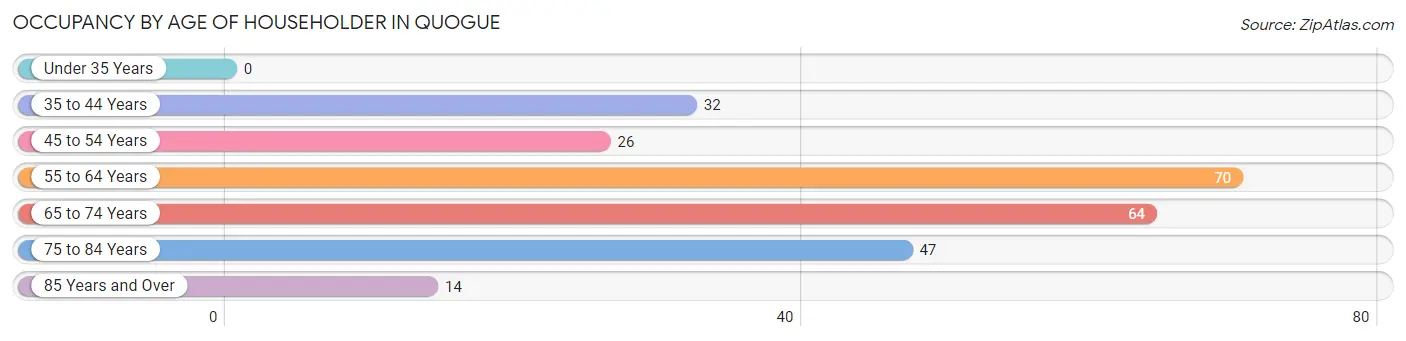
| Age Bracket | # Households | % Households |
| Under 35 Years | 0 | 0.0% |
| 35 to 44 Years | 32 | 12.7% |
| 45 to 54 Years | 26 | 10.3% |
| 55 to 64 Years | 70 | 27.7% |
| 65 to 74 Years | 64 | 25.3% |
| 75 to 84 Years | 47 | 18.6% |
| 85 Years and Over | 14 | 5.5% |
| Total | 253 | 100.0% |
Housing Finances in Quogue
Median Income by Occupancy in Quogue
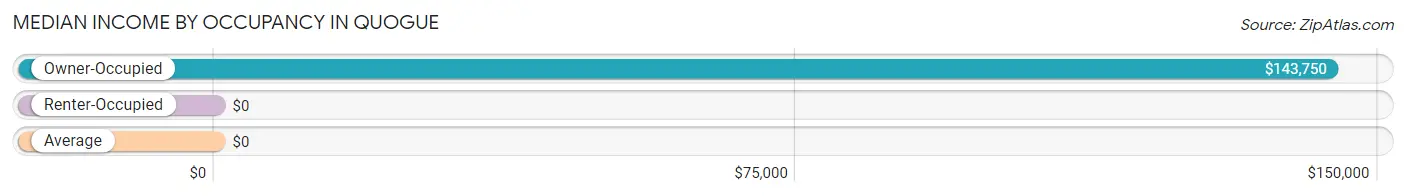
| Occupancy Type | # Households | Median Income |
| Owner-Occupied | 188 (74.3%) | $143,750 |
| Renter-Occupied | 65 (25.7%) | $0 |
| Average | 253 (100.0%) | $0 |
Occupancy by Householder Income Bracket in Quogue
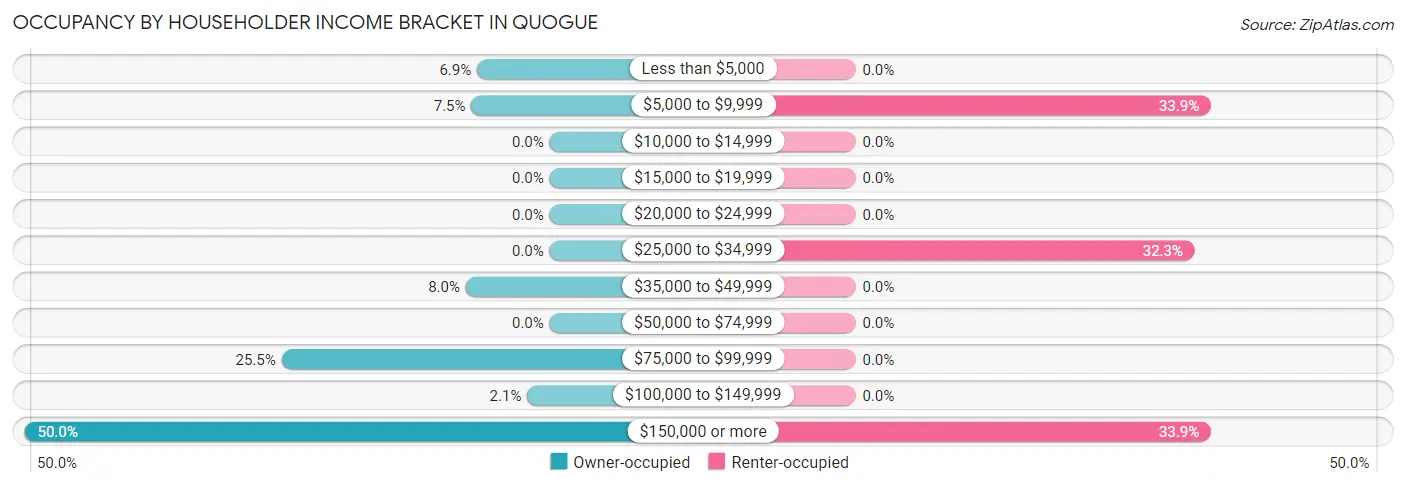
| Income Bracket | Owner-occupied | Renter-occupied |
| Less than $5,000 | 13 (6.9%) | 0 (0.0%) |
| $5,000 to $9,999 | 14 (7.4%) | 22 (33.9%) |
| $10,000 to $14,999 | 0 (0.0%) | 0 (0.0%) |
| $15,000 to $19,999 | 0 (0.0%) | 0 (0.0%) |
| $20,000 to $24,999 | 0 (0.0%) | 0 (0.0%) |
| $25,000 to $34,999 | 0 (0.0%) | 21 (32.3%) |
| $35,000 to $49,999 | 15 (8.0%) | 0 (0.0%) |
| $50,000 to $74,999 | 0 (0.0%) | 0 (0.0%) |
| $75,000 to $99,999 | 48 (25.5%) | 0 (0.0%) |
| $100,000 to $149,999 | 4 (2.1%) | 0 (0.0%) |
| $150,000 or more | 94 (50.0%) | 22 (33.9%) |
| Total | 188 (100.0%) | 65 (100.0%) |
Monthly Housing Cost Tiers in Quogue
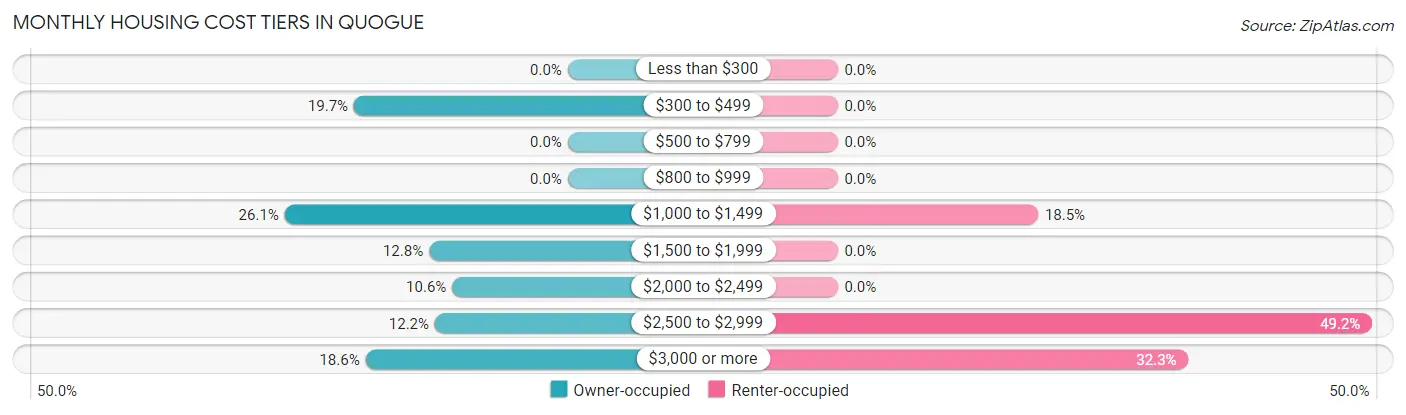
| Monthly Cost | Owner-occupied | Renter-occupied |
| Less than $300 | 0 (0.0%) | 0 (0.0%) |
| $300 to $499 | 37 (19.7%) | 0 (0.0%) |
| $500 to $799 | 0 (0.0%) | 0 (0.0%) |
| $800 to $999 | 0 (0.0%) | 0 (0.0%) |
| $1,000 to $1,499 | 49 (26.1%) | 12 (18.5%) |
| $1,500 to $1,999 | 24 (12.8%) | 0 (0.0%) |
| $2,000 to $2,499 | 20 (10.6%) | 0 (0.0%) |
| $2,500 to $2,999 | 23 (12.2%) | 32 (49.2%) |
| $3,000 or more | 35 (18.6%) | 21 (32.3%) |
| Total | 188 (100.0%) | 65 (100.0%) |
Physical Housing Characteristics in Quogue
Housing Structures in Quogue
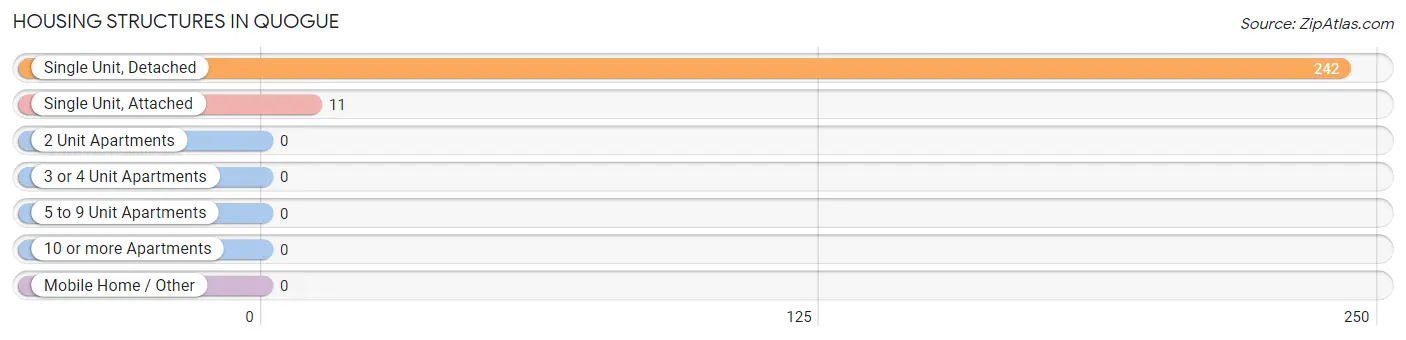
| Structure Type | # Housing Units | % Housing Units |
| Single Unit, Detached | 242 | 95.7% |
| Single Unit, Attached | 11 | 4.3% |
| 2 Unit Apartments | 0 | 0.0% |
| 3 or 4 Unit Apartments | 0 | 0.0% |
| 5 to 9 Unit Apartments | 0 | 0.0% |
| 10 or more Apartments | 0 | 0.0% |
| Mobile Home / Other | 0 | 0.0% |
| Total | 253 | 100.0% |
Housing Structures by Occupancy in Quogue
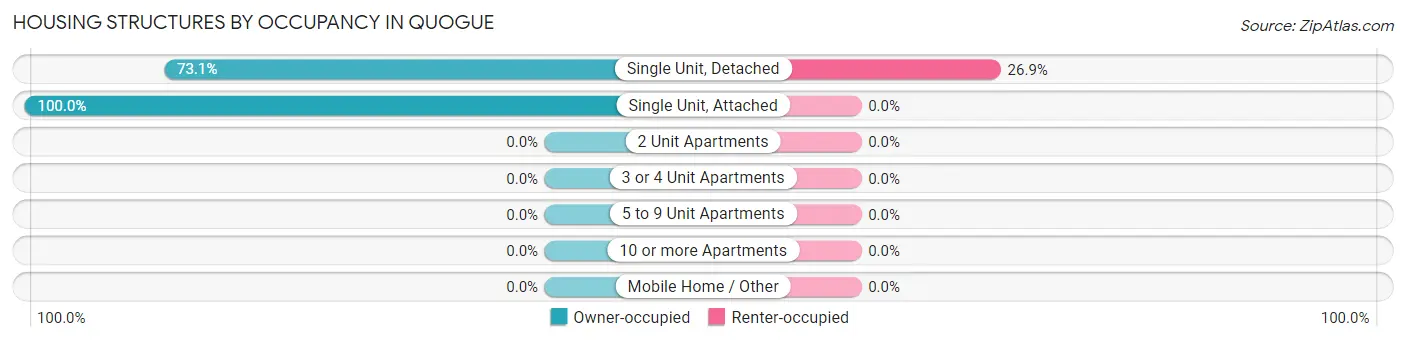
| Structure Type | Owner-occupied | Renter-occupied |
| Single Unit, Detached | 177 (73.1%) | 65 (26.9%) |
| Single Unit, Attached | 11 (100.0%) | 0 (0.0%) |
| 2 Unit Apartments | 0 (0.0%) | 0 (0.0%) |
| 3 or 4 Unit Apartments | 0 (0.0%) | 0 (0.0%) |
| 5 to 9 Unit Apartments | 0 (0.0%) | 0 (0.0%) |
| 10 or more Apartments | 0 (0.0%) | 0 (0.0%) |
| Mobile Home / Other | 0 (0.0%) | 0 (0.0%) |
| Total | 188 (74.3%) | 65 (25.7%) |
Housing Structures by Number of Rooms in Quogue
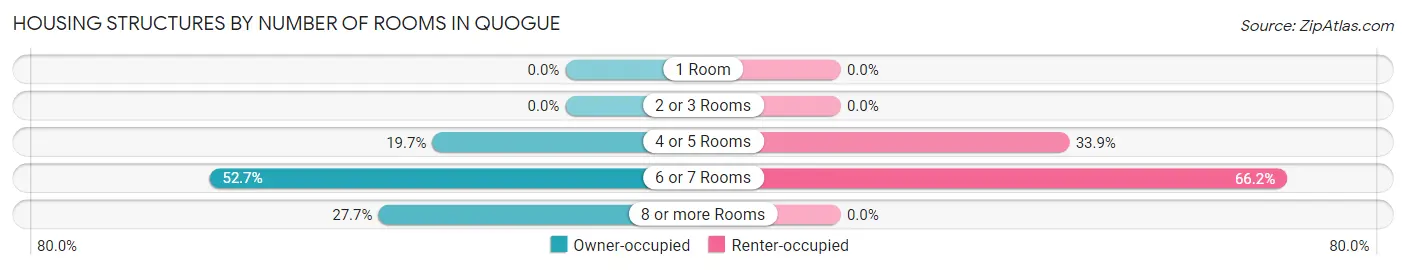
| Number of Rooms | Owner-occupied | Renter-occupied |
| 1 Room | 0 (0.0%) | 0 (0.0%) |
| 2 or 3 Rooms | 0 (0.0%) | 0 (0.0%) |
| 4 or 5 Rooms | 37 (19.7%) | 22 (33.9%) |
| 6 or 7 Rooms | 99 (52.7%) | 43 (66.1%) |
| 8 or more Rooms | 52 (27.7%) | 0 (0.0%) |
| Total | 188 (100.0%) | 65 (100.0%) |
Housing Structure by Heating Type in Quogue
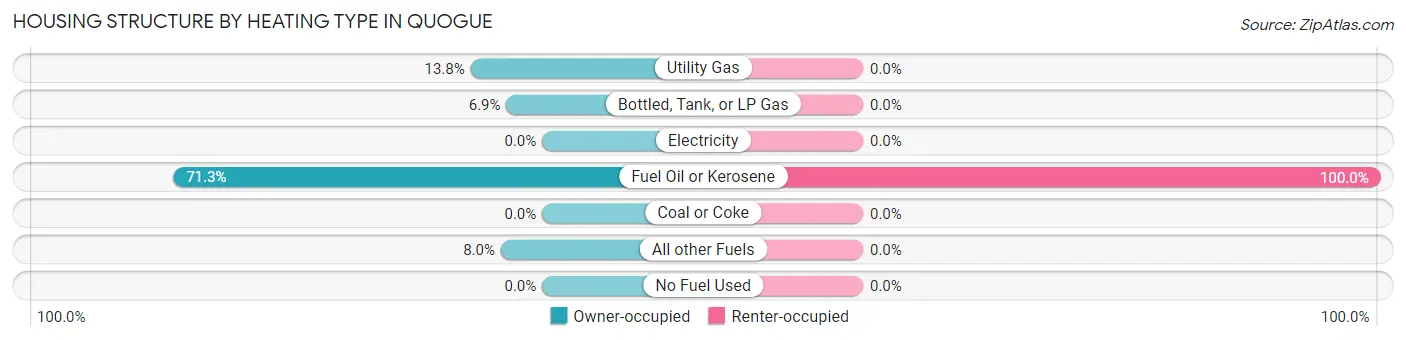
| Heating Type | Owner-occupied | Renter-occupied |
| Utility Gas | 26 (13.8%) | 0 (0.0%) |
| Bottled, Tank, or LP Gas | 13 (6.9%) | 0 (0.0%) |
| Electricity | 0 (0.0%) | 0 (0.0%) |
| Fuel Oil or Kerosene | 134 (71.3%) | 65 (100.0%) |
| Coal or Coke | 0 (0.0%) | 0 (0.0%) |
| All other Fuels | 15 (8.0%) | 0 (0.0%) |
| No Fuel Used | 0 (0.0%) | 0 (0.0%) |
| Total | 188 (100.0%) | 65 (100.0%) |
Household Vehicle Usage in Quogue
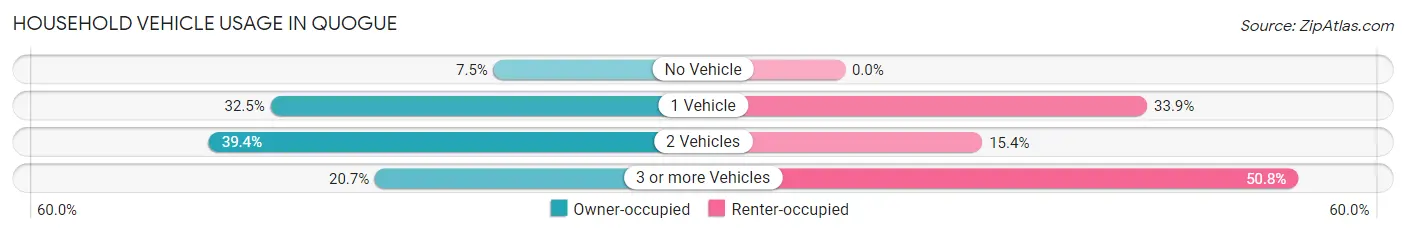
| Vehicles per Household | Owner-occupied | Renter-occupied |
| No Vehicle | 14 (7.4%) | 0 (0.0%) |
| 1 Vehicle | 61 (32.5%) | 22 (33.9%) |
| 2 Vehicles | 74 (39.4%) | 10 (15.4%) |
| 3 or more Vehicles | 39 (20.7%) | 33 (50.8%) |
| Total | 188 (100.0%) | 65 (100.0%) |
Real Estate & Mortgages in Quogue
Real Estate and Mortgage Overview in Quogue
| Characteristic | Without Mortgage | With Mortgage |
| Housing Units | 144 | 44 |
| Median Property Value | $1,606,300 | $0 |
| Median Household Income | - | - |
| Monthly Housing Costs | $1,297 | $31 |
| Real Estate Taxes | $6,683 | $0 |
Property Value by Mortgage Status in Quogue
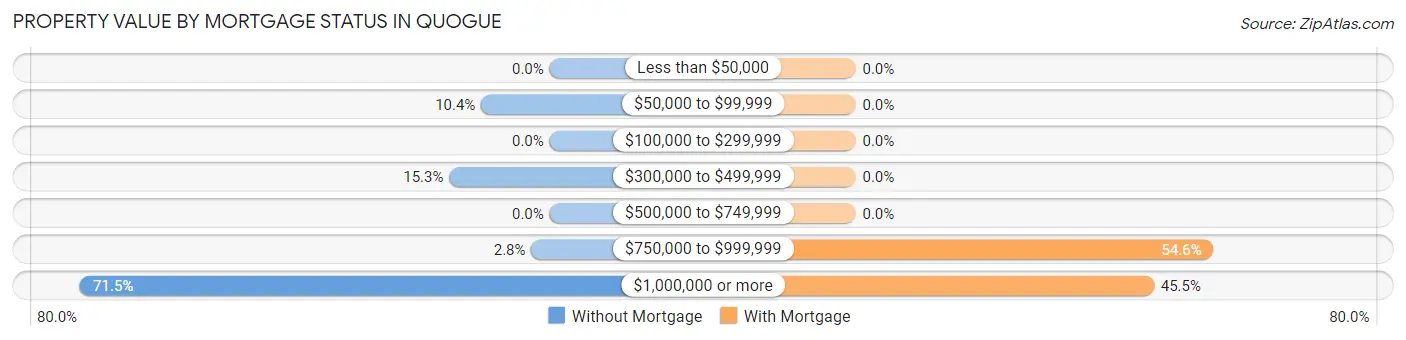
| Property Value | Without Mortgage | With Mortgage |
| Less than $50,000 | 0 (0.0%) | 0 (0.0%) |
| $50,000 to $99,999 | 15 (10.4%) | 0 (0.0%) |
| $100,000 to $299,999 | 0 (0.0%) | 0 (0.0%) |
| $300,000 to $499,999 | 22 (15.3%) | 0 (0.0%) |
| $500,000 to $749,999 | 0 (0.0%) | 0 (0.0%) |
| $750,000 to $999,999 | 4 (2.8%) | 24 (54.5%) |
| $1,000,000 or more | 103 (71.5%) | 20 (45.5%) |
| Total | 144 (100.0%) | 44 (100.0%) |
Household Income by Mortgage Status in Quogue
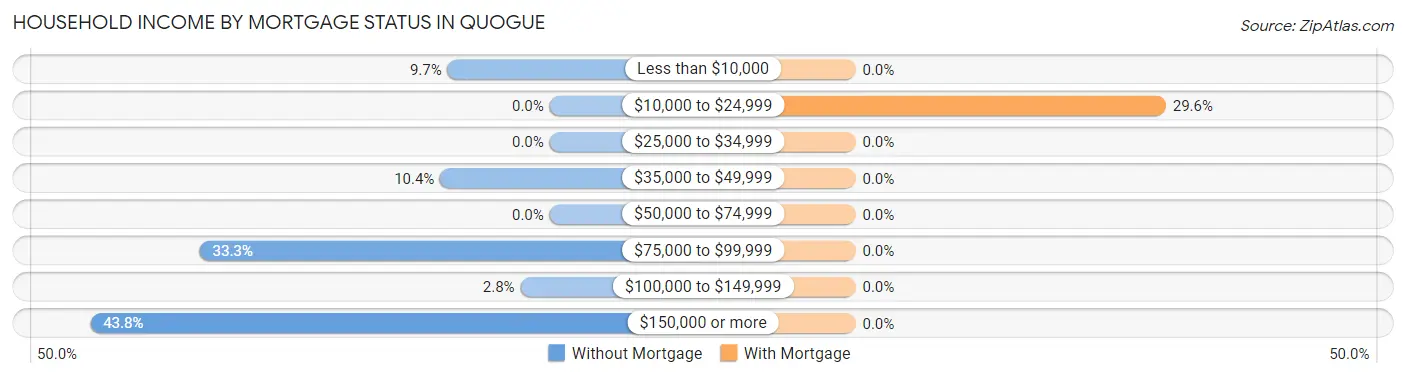
| Household Income | Without Mortgage | With Mortgage |
| Less than $10,000 | 14 (9.7%) | 0 (0.0%) |
| $10,000 to $24,999 | 0 (0.0%) | 13 (29.5%) |
| $25,000 to $34,999 | 0 (0.0%) | 0 (0.0%) |
| $35,000 to $49,999 | 15 (10.4%) | 0 (0.0%) |
| $50,000 to $74,999 | 0 (0.0%) | 0 (0.0%) |
| $75,000 to $99,999 | 48 (33.3%) | 0 (0.0%) |
| $100,000 to $149,999 | 4 (2.8%) | 0 (0.0%) |
| $150,000 or more | 63 (43.8%) | 0 (0.0%) |
| Total | 144 (100.0%) | 44 (100.0%) |
Property Value to Household Income Ratio in Quogue
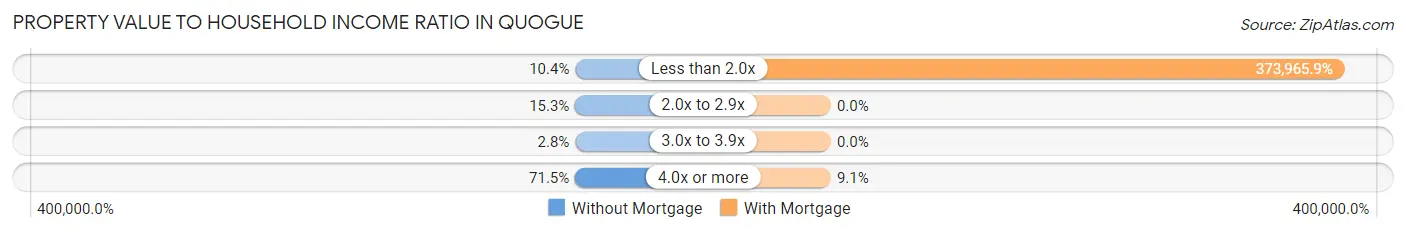
| Value-to-Income Ratio | Without Mortgage | With Mortgage |
| Less than 2.0x | 15 (10.4%) | 164,545 (373,965.9%) |
| 2.0x to 2.9x | 22 (15.3%) | 0 (0.0%) |
| 3.0x to 3.9x | 4 (2.8%) | 0 (0.0%) |
| 4.0x or more | 103 (71.5%) | 4 (9.1%) |
| Total | 144 (100.0%) | 44 (100.0%) |
Real Estate Taxes by Mortgage Status in Quogue
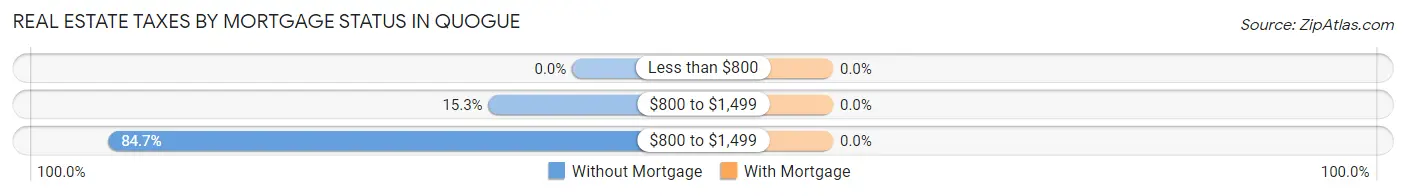
| Property Taxes | Without Mortgage | With Mortgage |
| Less than $800 | 0 (0.0%) | 0 (0.0%) |
| $800 to $1,499 | 22 (15.3%) | 0 (0.0%) |
| $800 to $1,499 | 122 (84.7%) | 0 (0.0%) |
| Total | 144 (100.0%) | 44 (100.0%) |
Health & Disability in Quogue
Health Insurance Coverage by Age in Quogue
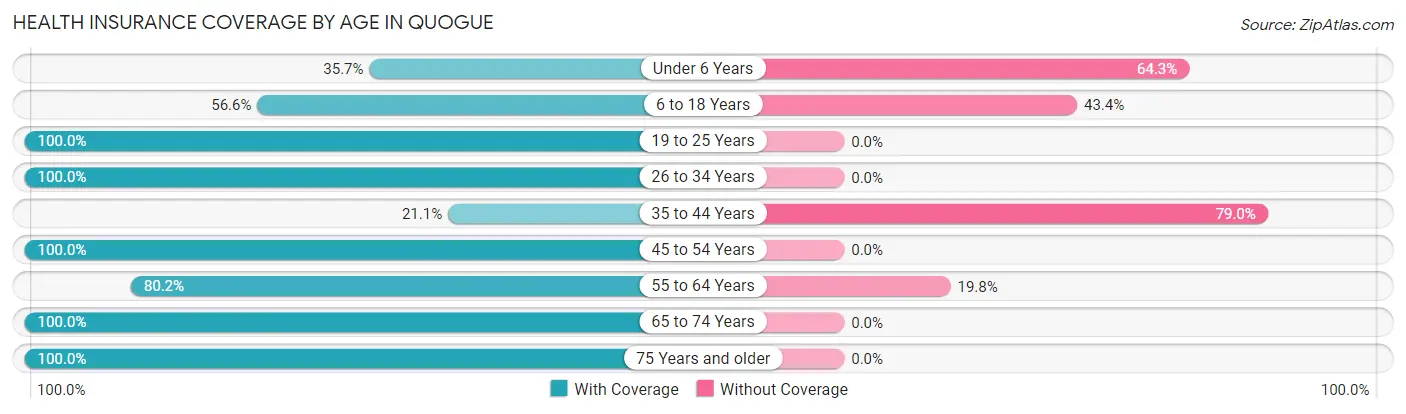
| Age Bracket | With Coverage | Without Coverage |
| Under 6 Years | 15 (35.7%) | 27 (64.3%) |
| 6 to 18 Years | 60 (56.6%) | 46 (43.4%) |
| 19 to 25 Years | 48 (100.0%) | 0 (0.0%) |
| 26 to 34 Years | 13 (100.0%) | 0 (0.0%) |
| 35 to 44 Years | 12 (21.0%) | 45 (78.9%) |
| 45 to 54 Years | 54 (100.0%) | 0 (0.0%) |
| 55 to 64 Years | 89 (80.2%) | 22 (19.8%) |
| 65 to 74 Years | 105 (100.0%) | 0 (0.0%) |
| 75 Years and older | 104 (100.0%) | 0 (0.0%) |
| Total | 500 (78.1%) | 140 (21.9%) |
Health Insurance Coverage by Citizenship Status in Quogue
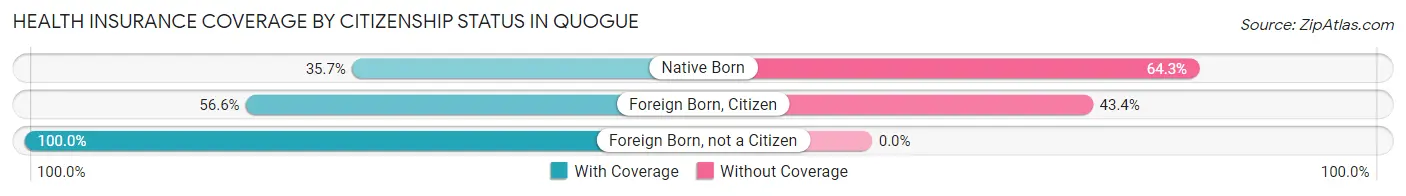
| Citizenship Status | With Coverage | Without Coverage |
| Native Born | 15 (35.7%) | 27 (64.3%) |
| Foreign Born, Citizen | 60 (56.6%) | 46 (43.4%) |
| Foreign Born, not a Citizen | 48 (100.0%) | 0 (0.0%) |
Health Insurance Coverage by Household Income in Quogue
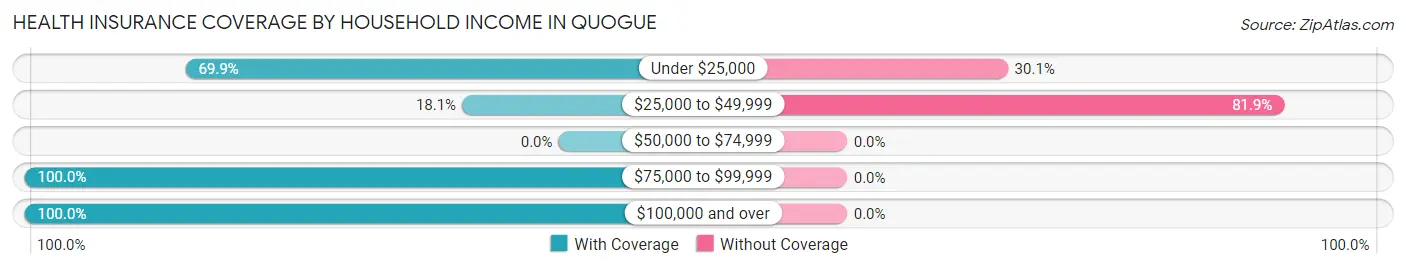
| Household Income | With Coverage | Without Coverage |
| Under $25,000 | 51 (69.9%) | 22 (30.1%) |
| $25,000 to $49,999 | 26 (18.1%) | 118 (81.9%) |
| $50,000 to $74,999 | 0 (0.0%) | 0 (0.0%) |
| $75,000 to $99,999 | 77 (100.0%) | 0 (0.0%) |
| $100,000 and over | 338 (100.0%) | 0 (0.0%) |
Public vs Private Health Insurance Coverage by Age in Quogue
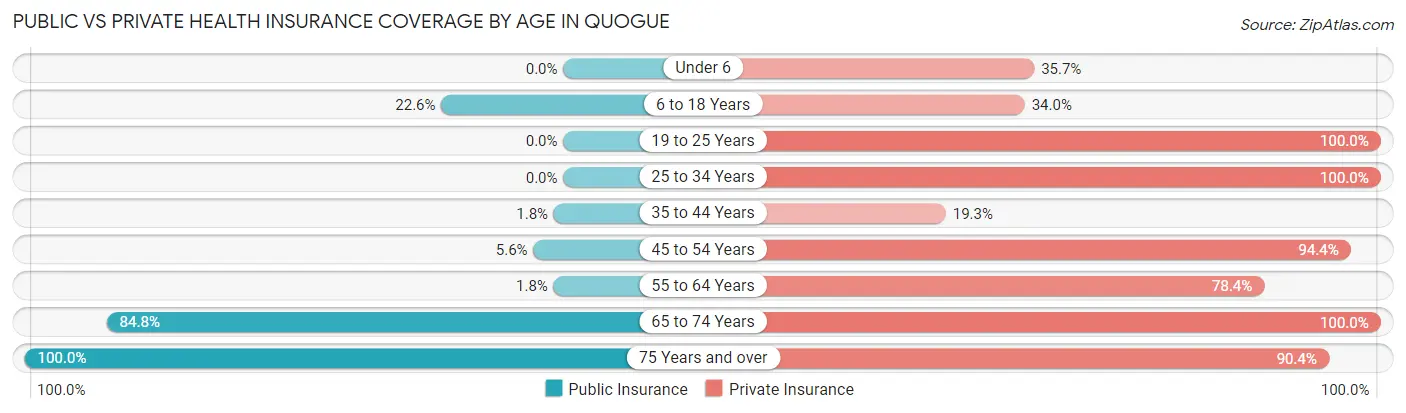
| Age Bracket | Public Insurance | Private Insurance |
| Under 6 | 0 (0.0%) | 15 (35.7%) |
| 6 to 18 Years | 24 (22.6%) | 36 (34.0%) |
| 19 to 25 Years | 0 (0.0%) | 48 (100.0%) |
| 25 to 34 Years | 0 (0.0%) | 13 (100.0%) |
| 35 to 44 Years | 1 (1.8%) | 11 (19.3%) |
| 45 to 54 Years | 3 (5.6%) | 51 (94.4%) |
| 55 to 64 Years | 2 (1.8%) | 87 (78.4%) |
| 65 to 74 Years | 89 (84.8%) | 105 (100.0%) |
| 75 Years and over | 104 (100.0%) | 94 (90.4%) |
| Total | 223 (34.8%) | 460 (71.9%) |
Disability Status by Sex by Age in Quogue
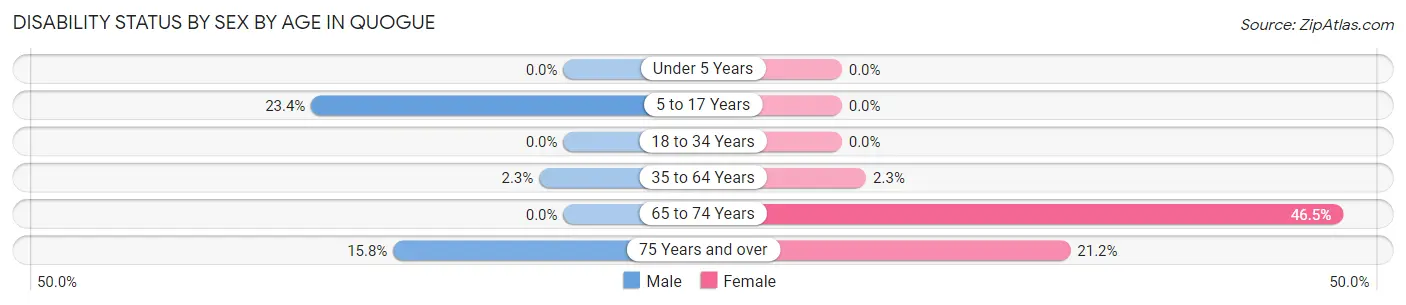
| Age Bracket | Male | Female |
| Under 5 Years | 0 (0.0%) | 0 (0.0%) |
| 5 to 17 Years | 11 (23.4%) | 0 (0.0%) |
| 18 to 34 Years | 0 (0.0%) | 0 (0.0%) |
| 35 to 64 Years | 2 (2.2%) | 3 (2.3%) |
| 65 to 74 Years | 0 (0.0%) | 20 (46.5%) |
| 75 Years and over | 6 (15.8%) | 14 (21.2%) |
Disability Class by Sex by Age in Quogue
Disability Class: Hearing Difficulty
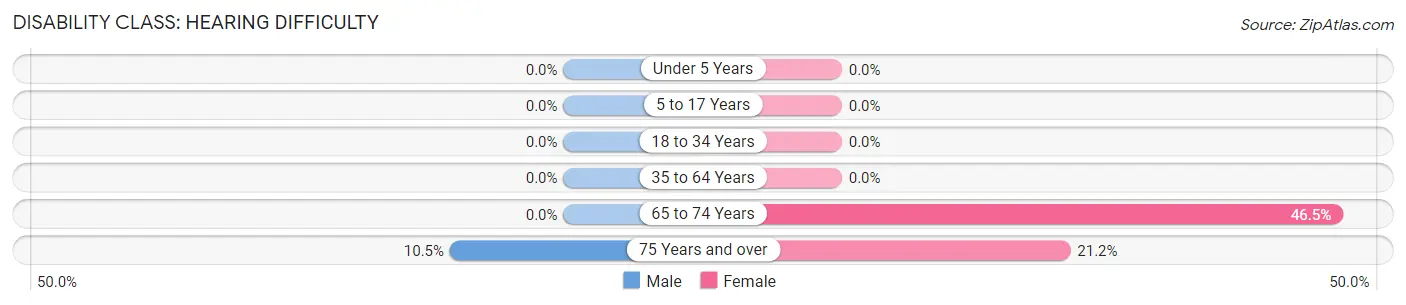
| Age Bracket | Male | Female |
| Under 5 Years | 0 (0.0%) | 0 (0.0%) |
| 5 to 17 Years | 0 (0.0%) | 0 (0.0%) |
| 18 to 34 Years | 0 (0.0%) | 0 (0.0%) |
| 35 to 64 Years | 0 (0.0%) | 0 (0.0%) |
| 65 to 74 Years | 0 (0.0%) | 20 (46.5%) |
| 75 Years and over | 4 (10.5%) | 14 (21.2%) |
Disability Class: Vision Difficulty
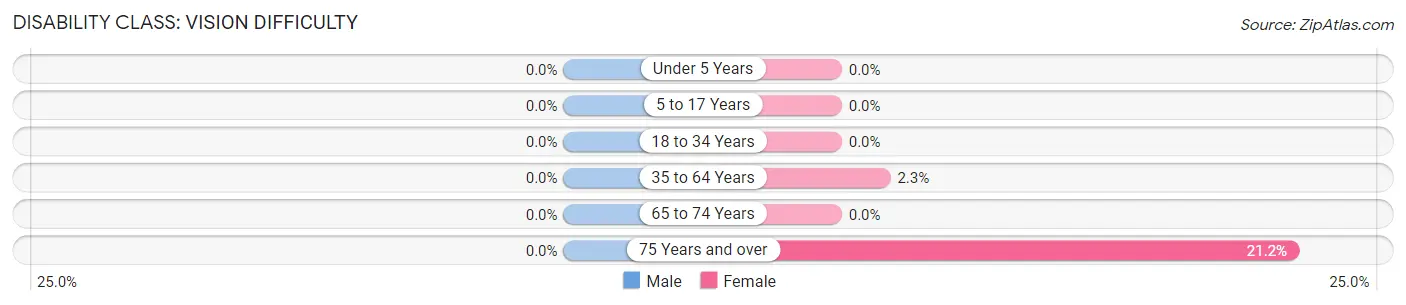
| Age Bracket | Male | Female |
| Under 5 Years | 0 (0.0%) | 0 (0.0%) |
| 5 to 17 Years | 0 (0.0%) | 0 (0.0%) |
| 18 to 34 Years | 0 (0.0%) | 0 (0.0%) |
| 35 to 64 Years | 0 (0.0%) | 3 (2.3%) |
| 65 to 74 Years | 0 (0.0%) | 0 (0.0%) |
| 75 Years and over | 0 (0.0%) | 14 (21.2%) |
Disability Class: Cognitive Difficulty
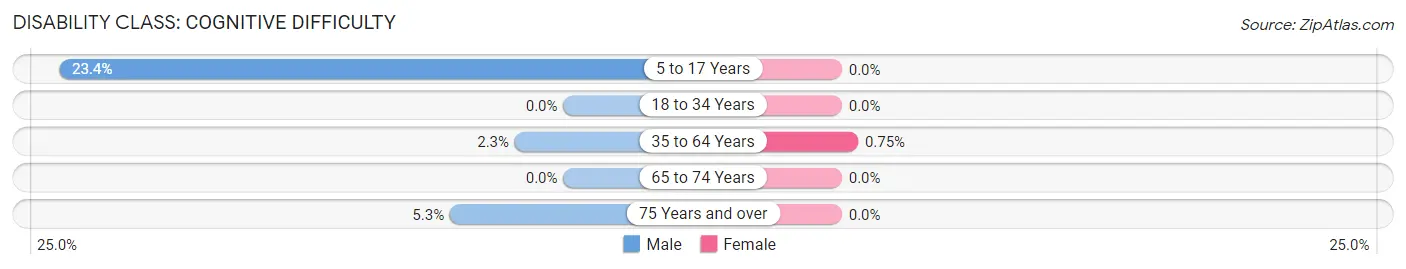
| Age Bracket | Male | Female |
| 5 to 17 Years | 11 (23.4%) | 0 (0.0%) |
| 18 to 34 Years | 0 (0.0%) | 0 (0.0%) |
| 35 to 64 Years | 2 (2.2%) | 1 (0.7%) |
| 65 to 74 Years | 0 (0.0%) | 0 (0.0%) |
| 75 Years and over | 2 (5.3%) | 0 (0.0%) |
Disability Class: Ambulatory Difficulty
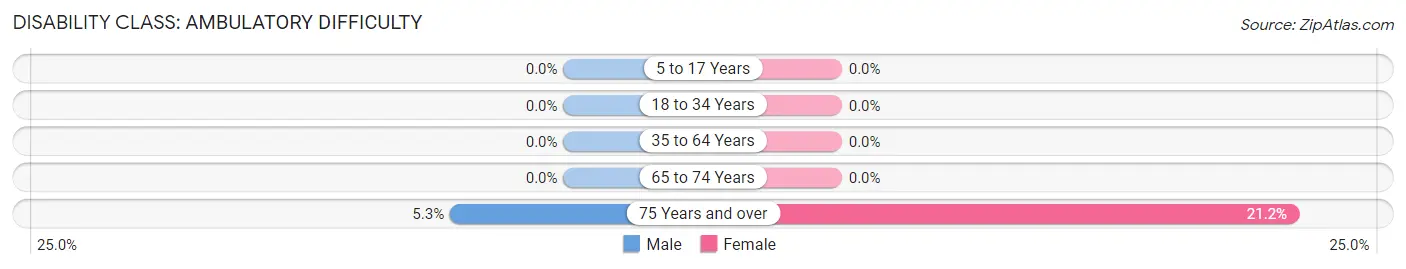
| Age Bracket | Male | Female |
| 5 to 17 Years | 0 (0.0%) | 0 (0.0%) |
| 18 to 34 Years | 0 (0.0%) | 0 (0.0%) |
| 35 to 64 Years | 0 (0.0%) | 0 (0.0%) |
| 65 to 74 Years | 0 (0.0%) | 0 (0.0%) |
| 75 Years and over | 2 (5.3%) | 14 (21.2%) |
Disability Class: Self-Care Difficulty
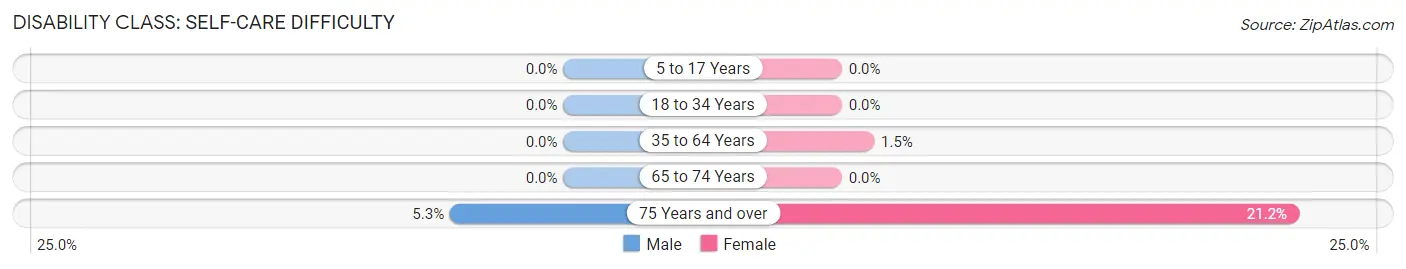
| Age Bracket | Male | Female |
| 5 to 17 Years | 0 (0.0%) | 0 (0.0%) |
| 18 to 34 Years | 0 (0.0%) | 0 (0.0%) |
| 35 to 64 Years | 0 (0.0%) | 2 (1.5%) |
| 65 to 74 Years | 0 (0.0%) | 0 (0.0%) |
| 75 Years and over | 2 (5.3%) | 14 (21.2%) |
Technology Access in Quogue
Computing Device Access in Quogue
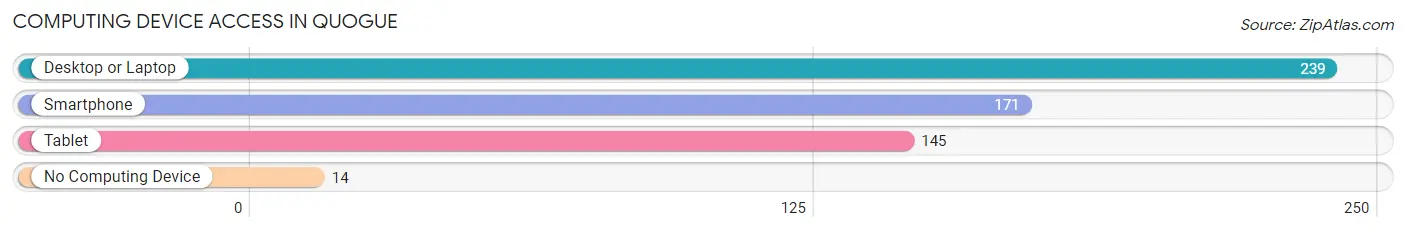
| Device Type | # Households | % Households |
| Desktop or Laptop | 239 | 94.5% |
| Smartphone | 171 | 67.6% |
| Tablet | 145 | 57.3% |
| No Computing Device | 14 | 5.5% |
| Total | 253 | 100.0% |
Internet Access in Quogue
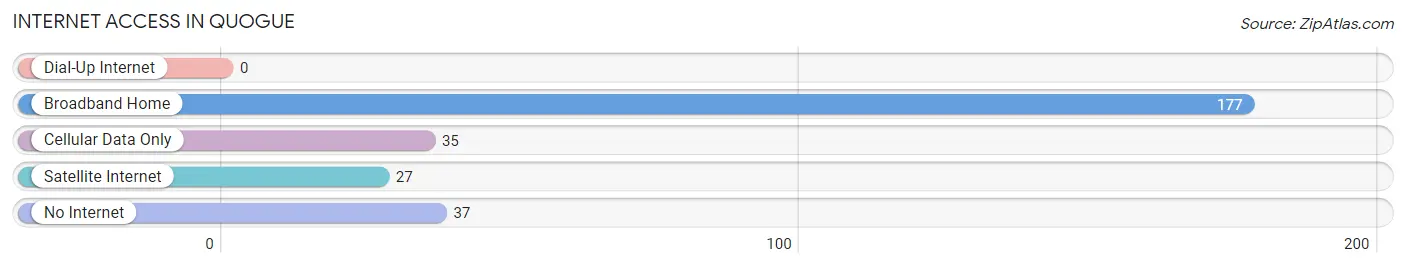
| Internet Type | # Households | % Households |
| Dial-Up Internet | 0 | 0.0% |
| Broadband Home | 177 | 70.0% |
| Cellular Data Only | 35 | 13.8% |
| Satellite Internet | 27 | 10.7% |
| No Internet | 37 | 14.6% |
| Total | 253 | 100.0% |
Quogue Summary
Quogue is a village located in the Town of Southampton in Suffolk County, New York, United States. It is located on the South Shore of Long Island, approximately 90 miles east of New York City. The population was 969 at the 2010 census.
History
The area now known as Quogue was originally inhabited by the Shinnecock Indians. The first European settlers arrived in the area in 1659, and the village was officially incorporated in 1859. The name Quogue is derived from the Shinnecock Indian word for “place of the pines”.
The village was a popular summer resort destination in the late 19th and early 20th centuries, and many of the original Victorian-style homes still stand today. Quogue was also home to the Quogue Field Club, a private golf club founded in 1892.
Geography
Quogue is located at 40°51'25" North, 72°37'17" West (40.856944, -72.621389). According to the United States Census Bureau, the village has a total area of 2.2 square miles, all of it land.
Economy
Quogue is a popular summer resort destination, and the village’s economy is largely based on tourism. The village is home to several hotels, restaurants, and shops, as well as a number of private golf clubs.
Demographics
As of the census of 2010, there were 969 people, 441 households, and 270 families residing in the village. The population density was 441.4 people per square mile. The racial makeup of the village was 94.2% White, 2.2% African American, 0.3% Native American, 0.9% Asian, 0.1% Pacific Islander, 0.7% from other races, and 1.6% from two or more races. Hispanic or Latino of any race were 3.2% of the population.
The median income for a household in the village was $90,938, and the median income for a family was $118,938. The per capita income for the village was $58,938. About 4.2% of families and 6.2% of the population were below the poverty line, including 8.2% of those under age 18 and 4.2% of those age 65 or over.
Common Questions
What is Per Capita Income in Quogue?
Per Capita income in Quogue is $60,853.
What is the Median Family Income in Quogue?
Median Family Income in Quogue is $159,896.
What is Inequality or Gini Index in Quogue?
Inequality or Gini Index in Quogue is 0.53.
What is the Total Population of Quogue?
Total Population of Quogue is 640.
What is the Total Male Population of Quogue?
Total Male Population of Quogue is 266.
What is the Total Female Population of Quogue?
Total Female Population of Quogue is 374.
What is the Ratio of Males per 100 Females in Quogue?
There are 71.12 Males per 100 Females in Quogue.
What is the Ratio of Females per 100 Males in Quogue?
There are 140.60 Females per 100 Males in Quogue.
What is the Median Population Age in Quogue?
Median Population Age in Quogue is 56.0 Years.
What is the Average Family Size in Quogue
Average Family Size in Quogue is 2.7 People.
What is the Average Household Size in Quogue
Average Household Size in Quogue is 2.5 People.
How Large is the Labor Force in Quogue?
There are 334 People in the Labor Forcein in Quogue.
What is the Percentage of People in the Labor Force in Quogue?
63.1% of People are in the Labor Force in Quogue.