Bloomingburg, NY Map & Demographics
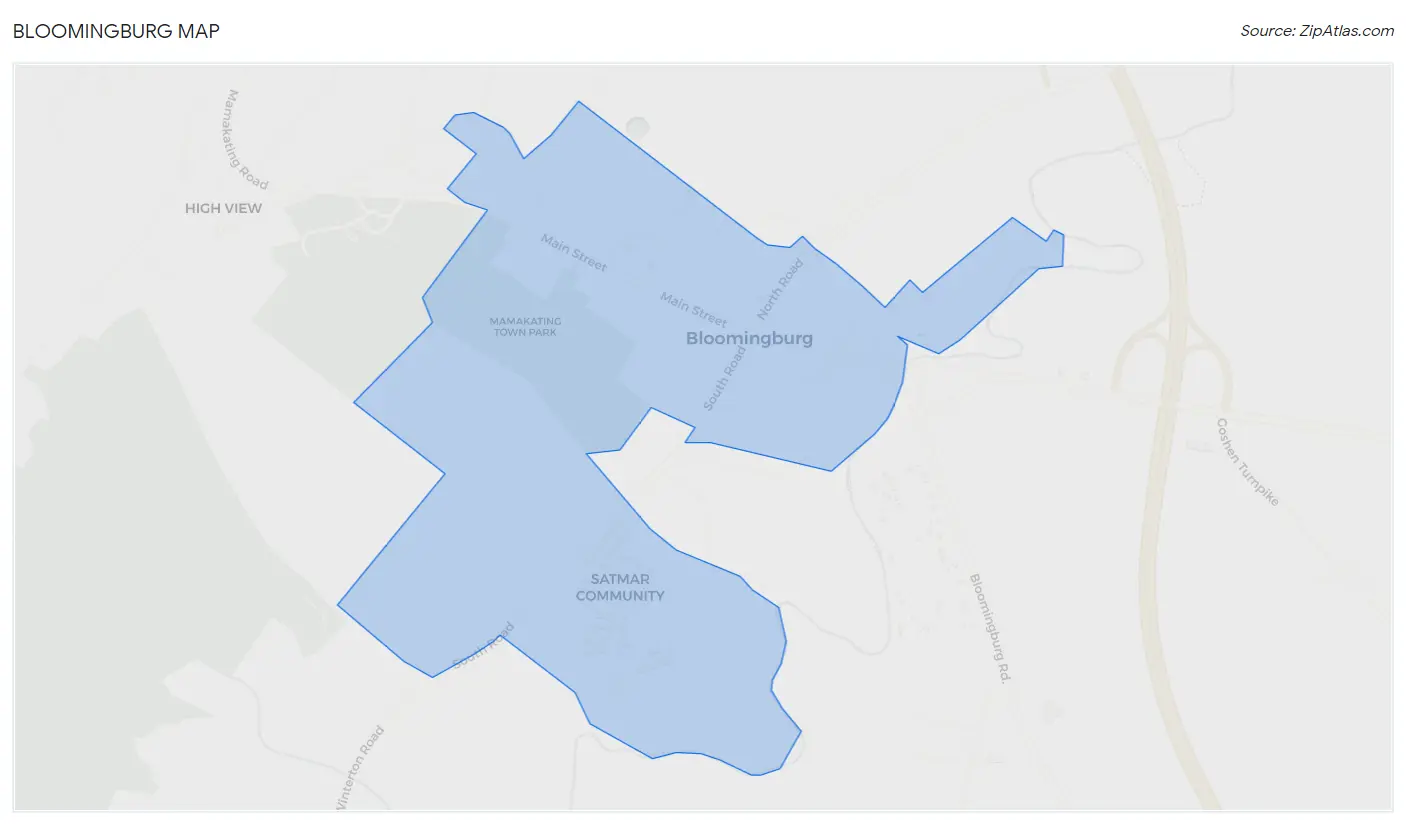
Bloomingburg Map
Bloomingburg Overview
$10,922
PER CAPITA INCOME
$46,719
AVG FAMILY INCOME
$42,500
AVG HOUSEHOLD INCOME
52.4%
WAGE / INCOME GAP [ % ]
47.6¢/ $1
WAGE / INCOME GAP [ $ ]
$15,725
FAMILY INCOME DEFICIT
0.33
INEQUALITY / GINI INDEX
962
TOTAL POPULATION
473
MALE POPULATION
489
FEMALE POPULATION
96.73
MALES / 100 FEMALES
103.38
FEMALES / 100 MALES
15.0
MEDIAN AGE
5.8
AVG FAMILY SIZE
4.3
AVG HOUSEHOLD SIZE
245
LABOR FORCE [ PEOPLE ]
54.7%
PERCENT IN LABOR FORCE
3.7%
UNEMPLOYMENT RATE
Bloomingburg Zip Codes
Bloomingburg Area Codes
Income in Bloomingburg
Income Overview in Bloomingburg
Per Capita Income in Bloomingburg is $10,922, while median incomes of families and households are $46,719 and $42,500 respectively.
| Characteristic | Number | Measure |
| Per Capita Income | 962 | $10,922 |
| Median Family Income | 149 | $46,719 |
| Mean Family Income | 149 | $50,262 |
| Median Household Income | 222 | $42,500 |
| Mean Household Income | 222 | $43,582 |
| Income Deficit | 149 | $15,725 |
| Wage / Income Gap (%) | 962 | 52.35% |
| Wage / Income Gap ($) | 962 | 47.65¢ per $1 |
| Gini / Inequality Index | 962 | 0.33 |
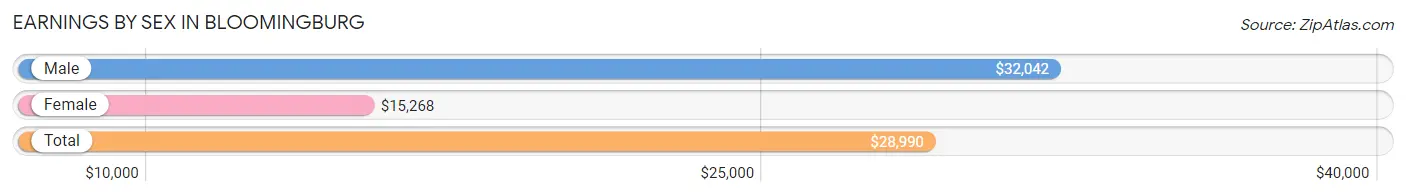
Earnings by Sex in Bloomingburg
Average Earnings in Bloomingburg are $28,990, $32,042 for men and $15,268 for women, a difference of 52.3%.
| Sex | Number | Average Earnings |
| Male | 165 (63.7%) | $32,042 |
| Female | 94 (36.3%) | $15,268 |
| Total | 259 (100.0%) | $28,990 |
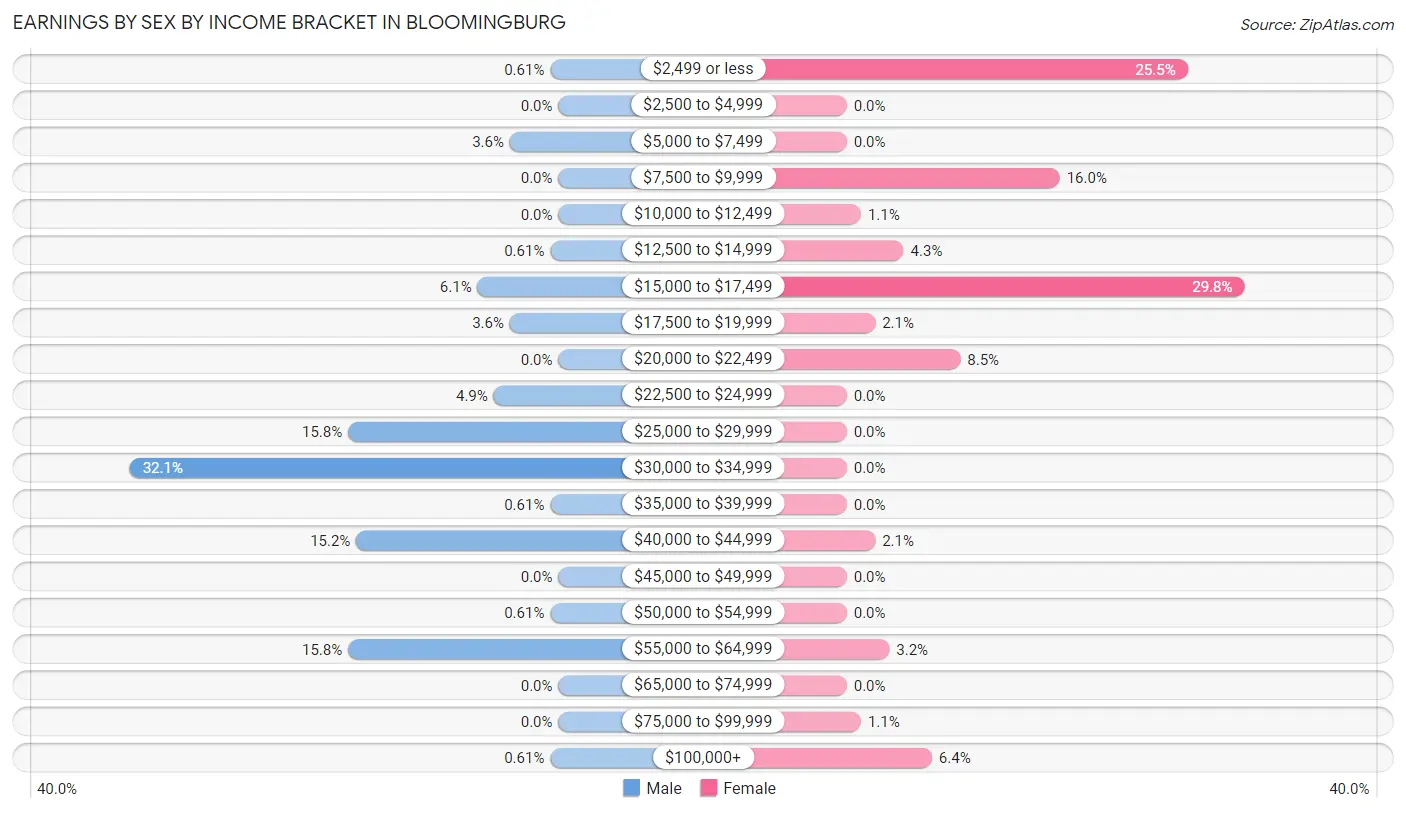
Earnings by Sex by Income Bracket in Bloomingburg
The most common earnings brackets in Bloomingburg are $30,000 to $34,999 for men (53 | 32.1%) and $15,000 to $17,499 for women (28 | 29.8%).
| Income | Male | Female |
| $2,499 or less | 1 (0.6%) | 24 (25.5%) |
| $2,500 to $4,999 | 0 (0.0%) | 0 (0.0%) |
| $5,000 to $7,499 | 6 (3.6%) | 0 (0.0%) |
| $7,500 to $9,999 | 0 (0.0%) | 15 (16.0%) |
| $10,000 to $12,499 | 0 (0.0%) | 1 (1.1%) |
| $12,500 to $14,999 | 1 (0.6%) | 4 (4.3%) |
| $15,000 to $17,499 | 10 (6.1%) | 28 (29.8%) |
| $17,500 to $19,999 | 6 (3.6%) | 2 (2.1%) |
| $20,000 to $22,499 | 0 (0.0%) | 8 (8.5%) |
| $22,500 to $24,999 | 8 (4.9%) | 0 (0.0%) |
| $25,000 to $29,999 | 26 (15.8%) | 0 (0.0%) |
| $30,000 to $34,999 | 53 (32.1%) | 0 (0.0%) |
| $35,000 to $39,999 | 1 (0.6%) | 0 (0.0%) |
| $40,000 to $44,999 | 25 (15.1%) | 2 (2.1%) |
| $45,000 to $49,999 | 0 (0.0%) | 0 (0.0%) |
| $50,000 to $54,999 | 1 (0.6%) | 0 (0.0%) |
| $55,000 to $64,999 | 26 (15.8%) | 3 (3.2%) |
| $65,000 to $74,999 | 0 (0.0%) | 0 (0.0%) |
| $75,000 to $99,999 | 0 (0.0%) | 1 (1.1%) |
| $100,000+ | 1 (0.6%) | 6 (6.4%) |
| Total | 165 (100.0%) | 94 (100.0%) |
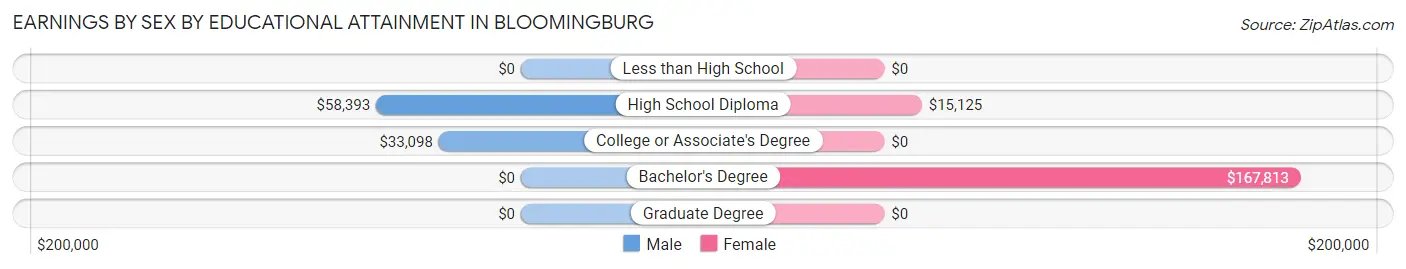
Earnings by Sex by Educational Attainment in Bloomingburg
Average earnings in Bloomingburg are $32,989 for men and $16,250 for women, a difference of 50.7%. Men with an educational attainment of high school diploma enjoy the highest average annual earnings of $58,393, while those with college or associate's degree education earn the least with $33,098. Women with an educational attainment of bachelor's degree earn the most with the average annual earnings of $167,813, while those with high school diploma education have the smallest earnings of $15,125.
| Educational Attainment | Male Income | Female Income |
| Less than High School | - | - |
| High School Diploma | $58,393 | $15,125 |
| College or Associate's Degree | $33,098 | $0 |
| Bachelor's Degree | - | - |
| Graduate Degree | - | - |
| Total | $32,989 | $16,250 |
Family Income in Bloomingburg
Family Income Brackets in Bloomingburg
According to the Bloomingburg family income data, there are 47 families falling into the $50,000 to $74,999 income range, which is the most common income bracket and makes up 31.5% of all families.
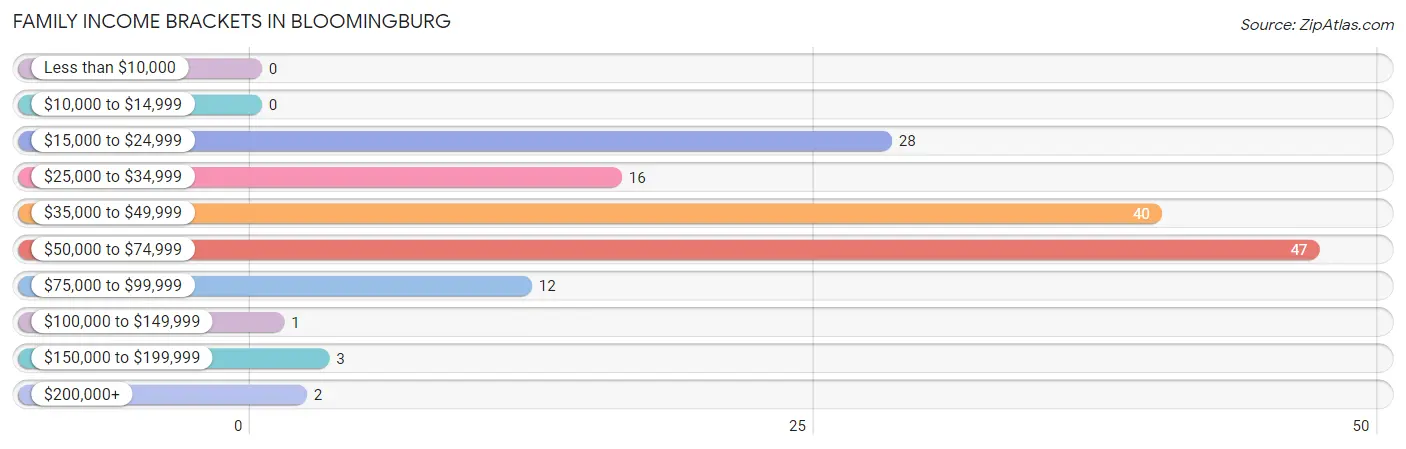
| Income Bracket | # Families | % Families |
| Less than $10,000 | 0 | 0.0% |
| $10,000 to $14,999 | 0 | 0.0% |
| $15,000 to $24,999 | 28 | 18.8% |
| $25,000 to $34,999 | 16 | 10.7% |
| $35,000 to $49,999 | 40 | 26.8% |
| $50,000 to $74,999 | 47 | 31.5% |
| $75,000 to $99,999 | 12 | 8.1% |
| $100,000 to $149,999 | 1 | 0.7% |
| $150,000 to $199,999 | 3 | 2.0% |
| $200,000+ | 2 | 1.3% |
Family Income by Famaliy Size in Bloomingburg
2-person families (40 | 26.9%) account for the highest median family income in Bloomingburg with $52,000 per family, while 2-person families (40 | 26.9%) have the highest median income of $26,000 per family member.
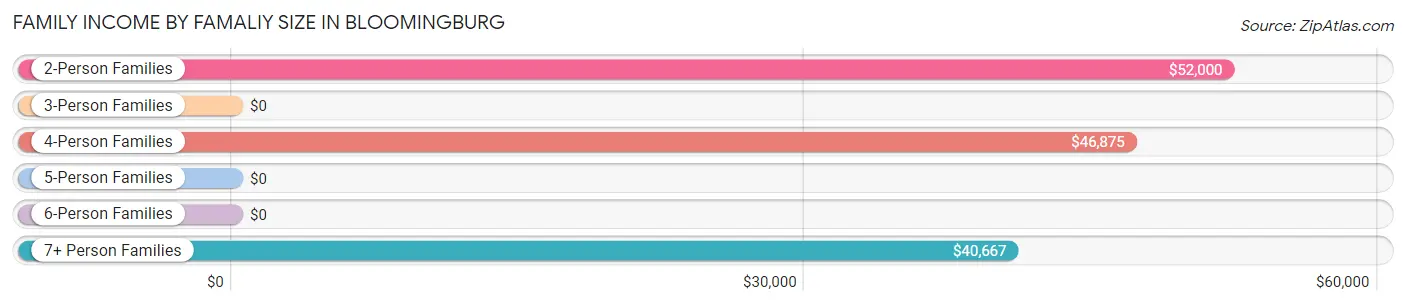
| Income Bracket | # Families | Median Income |
| 2-Person Families | 40 (26.9%) | $52,000 |
| 3-Person Families | 0 (0.0%) | $0 |
| 4-Person Families | 48 (32.2%) | $46,875 |
| 5-Person Families | 0 (0.0%) | $0 |
| 6-Person Families | 19 (12.8%) | $0 |
| 7+ Person Families | 42 (28.2%) | $40,667 |
| Total | 149 (100.0%) | $46,719 |
Family Income by Number of Earners in Bloomingburg
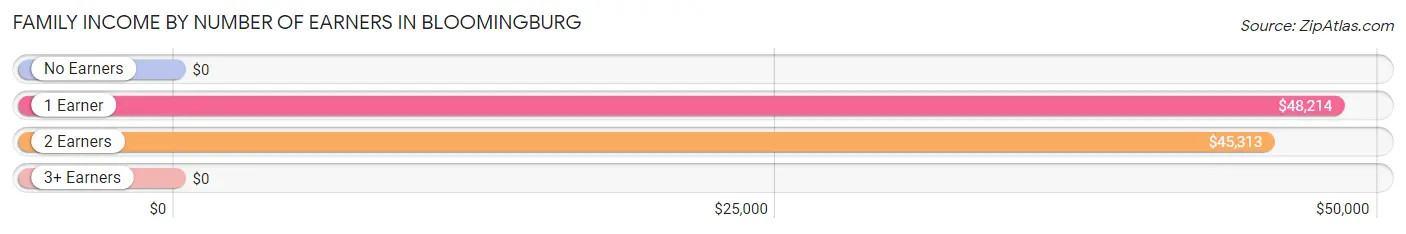
| Number of Earners | # Families | Median Income |
| No Earners | 4 (2.7%) | $0 |
| 1 Earner | 112 (75.2%) | $48,214 |
| 2 Earners | 32 (21.5%) | $45,313 |
| 3+ Earners | 1 (0.7%) | $0 |
| Total | 149 (100.0%) | $46,719 |
Household Income in Bloomingburg
Household Income Brackets in Bloomingburg
With 68 households falling in the category, the $35,000 to $49,999 income range is the most frequent in Bloomingburg, accounting for 30.6% of all households. In contrast, only 1 households (0.4%) fall into the $100,000 to $149,999 income bracket, making it the least populous group.
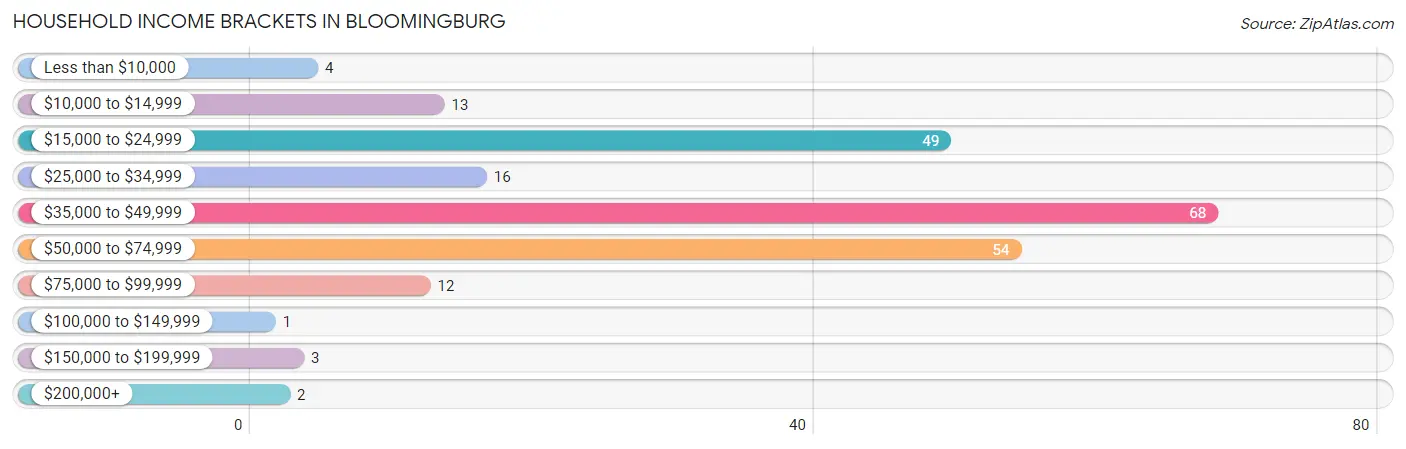
| Income Bracket | # Households | % Households |
| Less than $10,000 | 4 | 1.8% |
| $10,000 to $14,999 | 13 | 5.9% |
| $15,000 to $24,999 | 49 | 22.1% |
| $25,000 to $34,999 | 16 | 7.2% |
| $35,000 to $49,999 | 68 | 30.6% |
| $50,000 to $74,999 | 54 | 24.3% |
| $75,000 to $99,999 | 12 | 5.4% |
| $100,000 to $149,999 | 1 | 0.5% |
| $150,000 to $199,999 | 3 | 1.4% |
| $200,000+ | 2 | 0.9% |
Household Income by Householder Age in Bloomingburg
The median household income in Bloomingburg is $42,500, with the highest median household income of $50,208 found in the 65+ years age bracket for the primary householder. A total of 58 households (26.1%) fall into this category. Meanwhile, the 45 to 64 years age bracket for the primary householder has the lowest median household income of $0, with 28 households (12.6%) in this group.
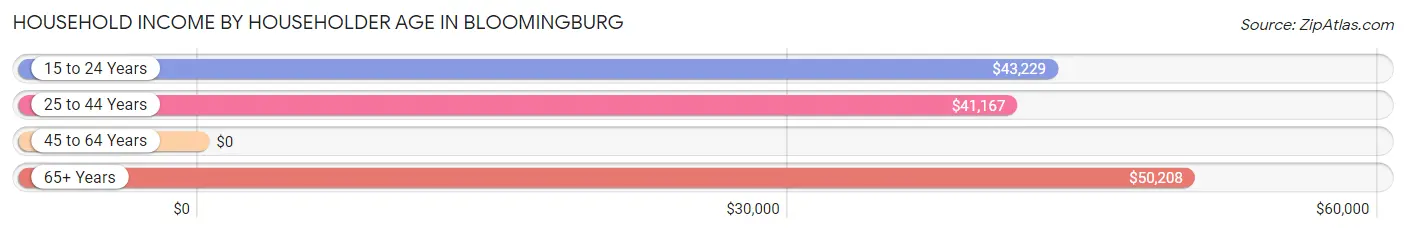
| Income Bracket | # Households | Median Income |
| 15 to 24 Years | 50 (22.5%) | $43,229 |
| 25 to 44 Years | 86 (38.7%) | $41,167 |
| 45 to 64 Years | 28 (12.6%) | $0 |
| 65+ Years | 58 (26.1%) | $50,208 |
| Total | 222 (100.0%) | $42,500 |
Poverty in Bloomingburg
Income Below Poverty by Sex and Age in Bloomingburg
With 60.0% poverty level for males and 57.1% for females among the residents of Bloomingburg, 15 year old males and 12 to 14 year old females are the most vulnerable to poverty, with 33 males (100.0%) and 30 females (100.0%) in their respective age groups living below the poverty level.
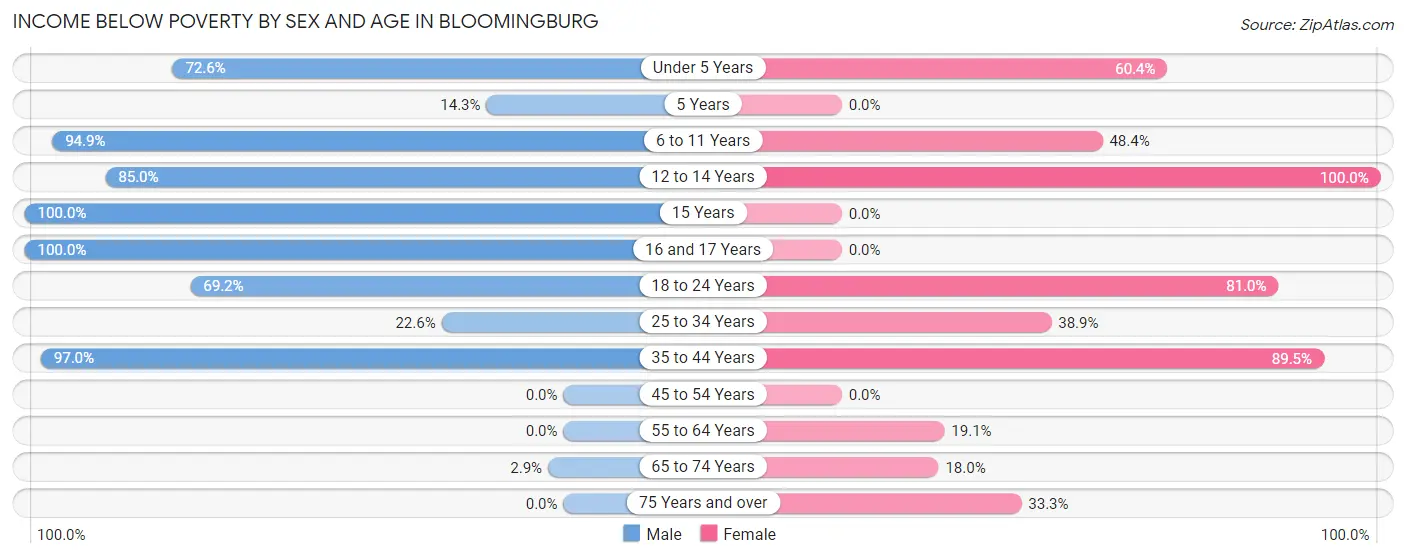
| Age Bracket | Male | Female |
| Under 5 Years | 74 (72.6%) | 87 (60.4%) |
| 5 Years | 2 (14.3%) | 0 (0.0%) |
| 6 to 11 Years | 74 (94.9%) | 45 (48.4%) |
| 12 to 14 Years | 17 (85.0%) | 30 (100.0%) |
| 15 Years | 33 (100.0%) | 0 (0.0%) |
| 16 and 17 Years | 14 (100.0%) | 0 (0.0%) |
| 18 to 24 Years | 18 (69.2%) | 47 (81.0%) |
| 25 to 34 Years | 19 (22.6%) | 21 (38.9%) |
| 35 to 44 Years | 32 (97.0%) | 34 (89.5%) |
| 45 to 54 Years | 0 (0.0%) | 0 (0.0%) |
| 55 to 64 Years | 0 (0.0%) | 4 (19.1%) |
| 65 to 74 Years | 1 (2.9%) | 7 (17.9%) |
| 75 Years and over | 0 (0.0%) | 4 (33.3%) |
| Total | 284 (60.0%) | 279 (57.1%) |
Income Above Poverty by Sex and Age in Bloomingburg
According to the poverty statistics in Bloomingburg, males aged 45 to 54 years and females aged 65 to 74 years are the age groups that are most secure financially, with 100.0% of males and 82.1% of females in these age groups living above the poverty line.
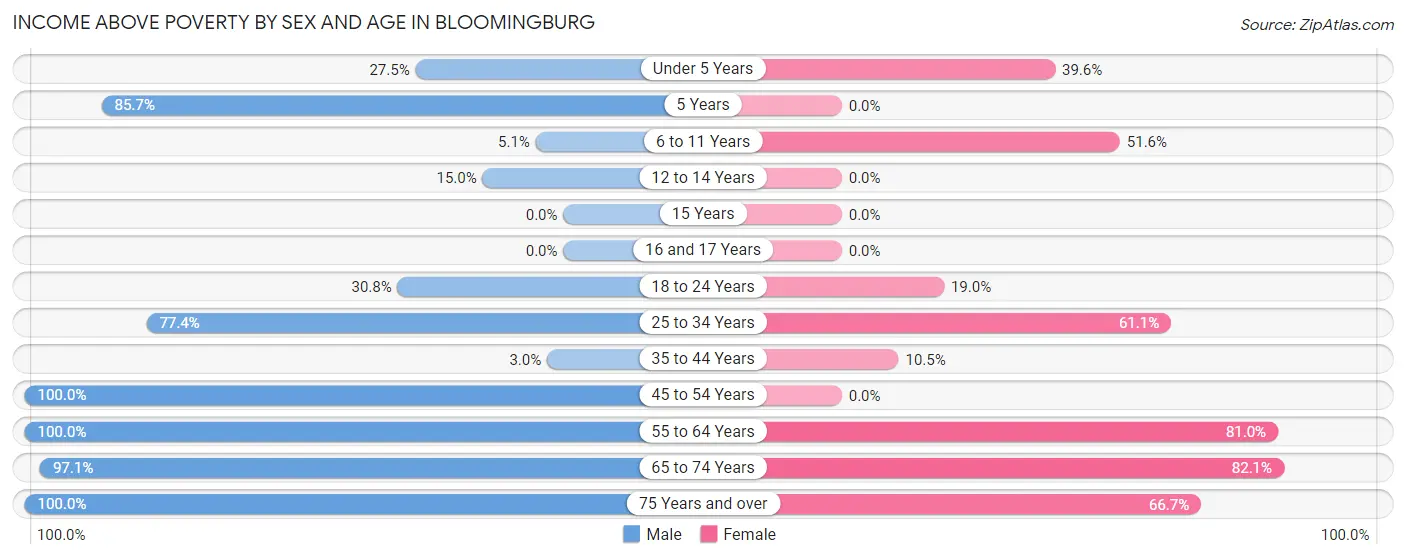
| Age Bracket | Male | Female |
| Under 5 Years | 28 (27.5%) | 57 (39.6%) |
| 5 Years | 12 (85.7%) | 0 (0.0%) |
| 6 to 11 Years | 4 (5.1%) | 48 (51.6%) |
| 12 to 14 Years | 3 (15.0%) | 0 (0.0%) |
| 15 Years | 0 (0.0%) | 0 (0.0%) |
| 16 and 17 Years | 0 (0.0%) | 0 (0.0%) |
| 18 to 24 Years | 8 (30.8%) | 11 (19.0%) |
| 25 to 34 Years | 65 (77.4%) | 33 (61.1%) |
| 35 to 44 Years | 1 (3.0%) | 4 (10.5%) |
| 45 to 54 Years | 12 (100.0%) | 0 (0.0%) |
| 55 to 64 Years | 14 (100.0%) | 17 (80.9%) |
| 65 to 74 Years | 34 (97.1%) | 32 (82.1%) |
| 75 Years and over | 8 (100.0%) | 8 (66.7%) |
| Total | 189 (40.0%) | 210 (42.9%) |
Income Below Poverty Among Married-Couple Families in Bloomingburg
The poverty statistics for married-couple families in Bloomingburg show that 46.6% or 69 of the total 148 families live below the poverty line. Families with 3 or 4 children have the highest poverty rate of 95.0%, comprising of 19 families. On the other hand, families with no children have the lowest poverty rate of 0.0%, which includes 0 families.
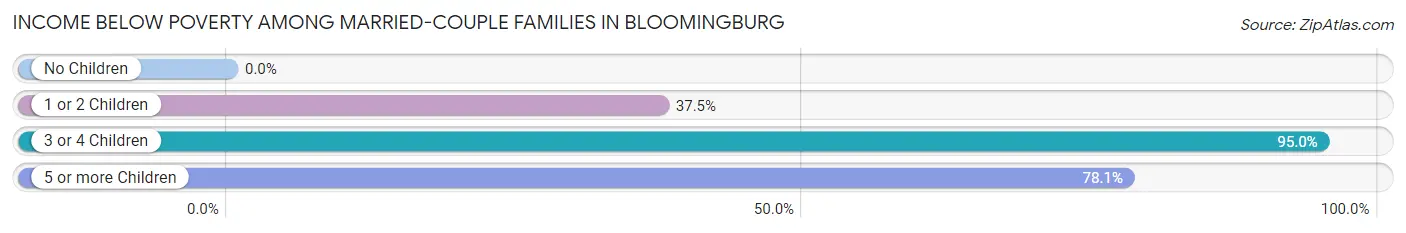
| Children | Above Poverty | Below Poverty |
| No Children | 39 (100.0%) | 0 (0.0%) |
| 1 or 2 Children | 30 (62.5%) | 18 (37.5%) |
| 3 or 4 Children | 1 (5.0%) | 19 (95.0%) |
| 5 or more Children | 9 (22.0%) | 32 (78.0%) |
| Total | 79 (53.4%) | 69 (46.6%) |
Income Below Poverty Among Single-Parent Households in Bloomingburg
| Children | Single Father | Single Mother |
| No Children | 0 (0.0%) | 0 (0.0%) |
| 1 or 2 Children | 0 (0.0%) | 0 (0.0%) |
| 3 or 4 Children | 0 (0.0%) | 0 (0.0%) |
| 5 or more Children | 0 (0.0%) | 0 (0.0%) |
| Total | 0 (0.0%) | 0 (0.0%) |
Income Below Poverty Among Married-Couple vs Single-Parent Households in Bloomingburg
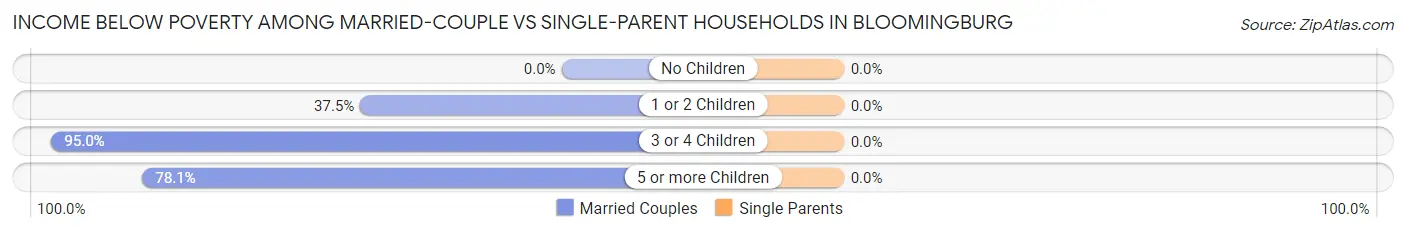
| Children | Married-Couple Families | Single-Parent Households |
| No Children | 0 (0.0%) | 0 (0.0%) |
| 1 or 2 Children | 18 (37.5%) | 0 (0.0%) |
| 3 or 4 Children | 19 (95.0%) | 0 (0.0%) |
| 5 or more Children | 32 (78.0%) | 0 (0.0%) |
| Total | 69 (46.6%) | 0 (0.0%) |
Race in Bloomingburg
The most populous races in Bloomingburg are White / Caucasian (905 | 94.1%), Hispanic or Latino (55 | 5.7%), and Some other Race (49 | 5.1%).
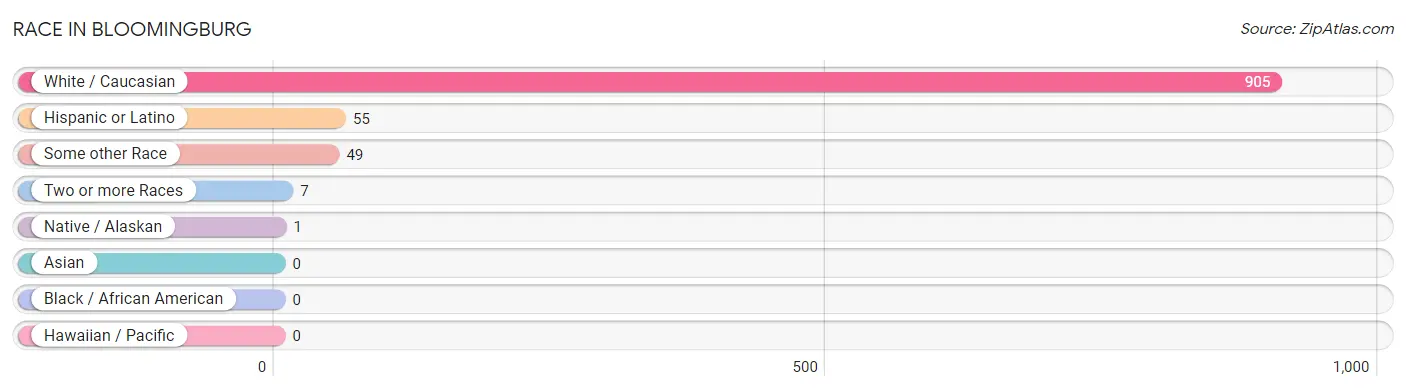
| Race | # Population | % Population |
| Asian | 0 | 0.0% |
| Black / African American | 0 | 0.0% |
| Hawaiian / Pacific | 0 | 0.0% |
| Hispanic or Latino | 55 | 5.7% |
| Native / Alaskan | 1 | 0.1% |
| White / Caucasian | 905 | 94.1% |
| Two or more Races | 7 | 0.7% |
| Some other Race | 49 | 5.1% |
| Total | 962 | 100.0% |
Ancestry in Bloomingburg
The most populous ancestries reported in Bloomingburg are Hungarian (395 | 41.1%), Romanian (223 | 23.2%), Austrian (157 | 16.3%), Polish (120 | 12.5%), and European (79 | 8.2%), together accounting for 101.2% of all Bloomingburg residents.
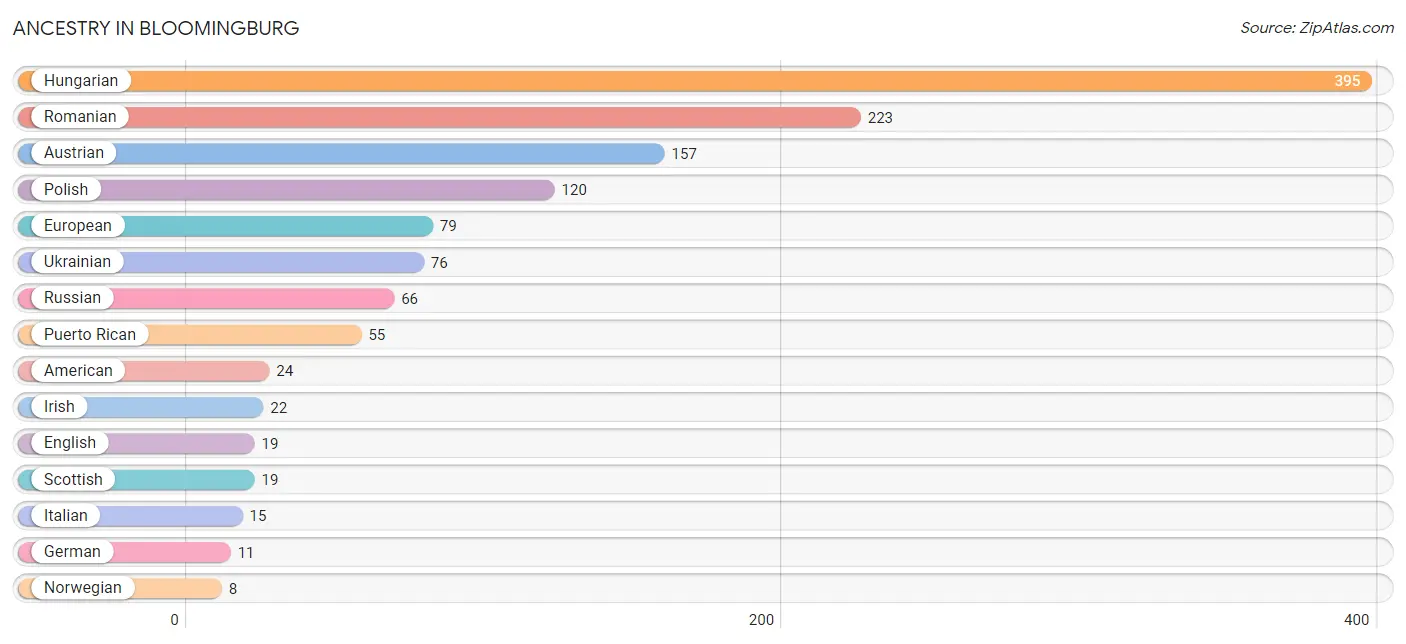
| Ancestry | # Population | % Population |
| American | 24 | 2.5% |
| Austrian | 157 | 16.3% |
| Cherokee | 1 | 0.1% |
| Dutch | 5 | 0.5% |
| English | 19 | 2.0% |
| European | 79 | 8.2% |
| French American Indian | 1 | 0.1% |
| German | 11 | 1.1% |
| Greek | 3 | 0.3% |
| Hungarian | 395 | 41.1% |
| Irish | 22 | 2.3% |
| Italian | 15 | 1.6% |
| Norwegian | 8 | 0.8% |
| Polish | 120 | 12.5% |
| Puerto Rican | 55 | 5.7% |
| Romanian | 223 | 23.2% |
| Russian | 66 | 6.9% |
| Scottish | 19 | 2.0% |
| Ukrainian | 76 | 7.9% |
| Welsh | 1 | 0.1% | View All 20 Rows |
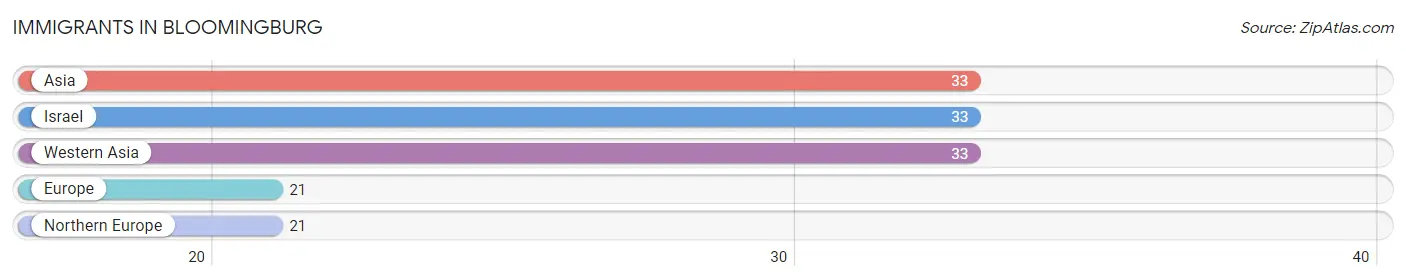
Immigrants in Bloomingburg
The most numerous immigrant groups reported in Bloomingburg came from Asia (33 | 3.4%), Israel (33 | 3.4%), Western Asia (33 | 3.4%), Europe (21 | 2.2%), and Northern Europe (21 | 2.2%), together accounting for 14.6% of all Bloomingburg residents.
| Immigration Origin | # Population | % Population |
| Asia | 33 | 3.4% |
| Europe | 21 | 2.2% |
| Israel | 33 | 3.4% |
| Northern Europe | 21 | 2.2% |
| Western Asia | 33 | 3.4% | View All 5 Rows |
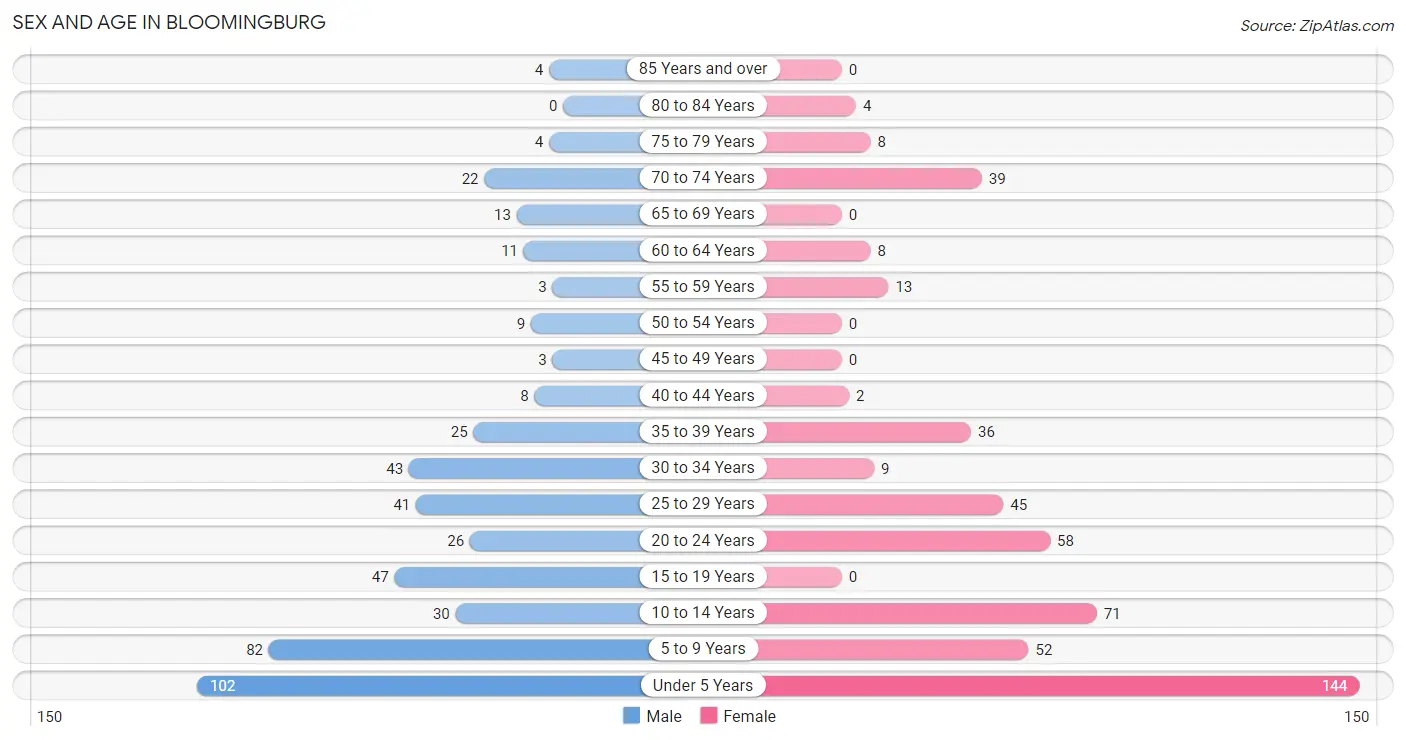
Sex and Age in Bloomingburg
Sex and Age in Bloomingburg
The most populous age groups in Bloomingburg are Under 5 Years (102 | 21.6%) for men and Under 5 Years (144 | 29.4%) for women.
| Age Bracket | Male | Female |
| Under 5 Years | 102 (21.6%) | 144 (29.4%) |
| 5 to 9 Years | 82 (17.3%) | 52 (10.6%) |
| 10 to 14 Years | 30 (6.3%) | 71 (14.5%) |
| 15 to 19 Years | 47 (9.9%) | 0 (0.0%) |
| 20 to 24 Years | 26 (5.5%) | 58 (11.9%) |
| 25 to 29 Years | 41 (8.7%) | 45 (9.2%) |
| 30 to 34 Years | 43 (9.1%) | 9 (1.8%) |
| 35 to 39 Years | 25 (5.3%) | 36 (7.4%) |
| 40 to 44 Years | 8 (1.7%) | 2 (0.4%) |
| 45 to 49 Years | 3 (0.6%) | 0 (0.0%) |
| 50 to 54 Years | 9 (1.9%) | 0 (0.0%) |
| 55 to 59 Years | 3 (0.6%) | 13 (2.7%) |
| 60 to 64 Years | 11 (2.3%) | 8 (1.6%) |
| 65 to 69 Years | 13 (2.8%) | 0 (0.0%) |
| 70 to 74 Years | 22 (4.6%) | 39 (8.0%) |
| 75 to 79 Years | 4 (0.9%) | 8 (1.6%) |
| 80 to 84 Years | 0 (0.0%) | 4 (0.8%) |
| 85 Years and over | 4 (0.9%) | 0 (0.0%) |
| Total | 473 (100.0%) | 489 (100.0%) |
Families and Households in Bloomingburg
Median Family Size in Bloomingburg
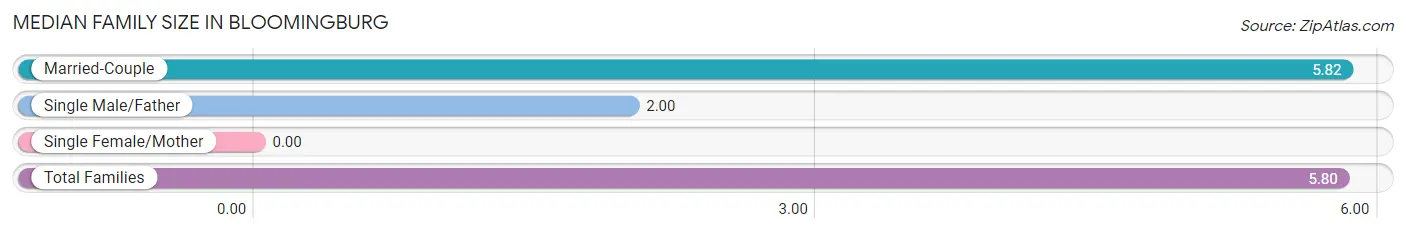
| Family Type | # Families | Family Size |
| Married-Couple | 148 (99.3%) | 5.82 |
| Single Male/Father | 1 (0.7%) | 2.00 |
| Single Female/Mother | 0 (0.0%) | - |
| Total Families | 149 (100.0%) | 5.80 |
Median Household Size in Bloomingburg
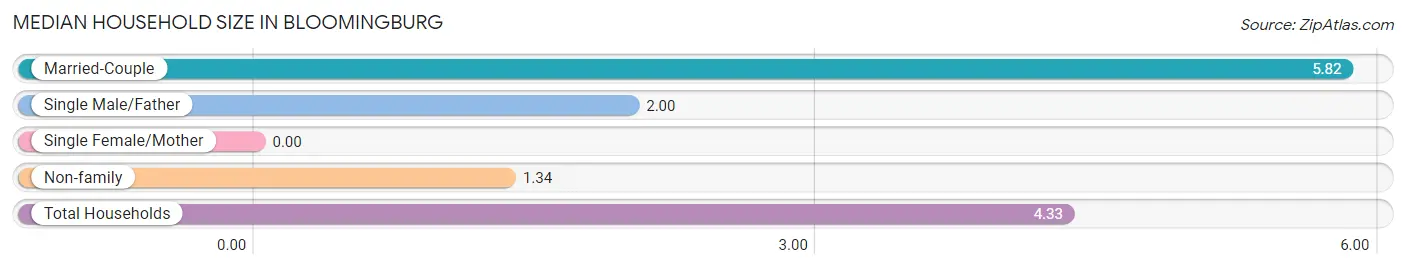
| Household Type | # Households | Household Size |
| Married-Couple | 148 (66.7%) | 5.82 |
| Single Male/Father | 1 (0.4%) | 2.00 |
| Single Female/Mother | 0 (0.0%) | - |
| Non-family | 73 (32.9%) | 1.34 |
| Total Households | 222 (100.0%) | 4.33 |
Household Size by Marriage Status in Bloomingburg
Out of a total of 222 households in Bloomingburg, 149 (67.1%) are family households, while 73 (32.9%) are nonfamily households. The most numerous type of family households are 4-person households, comprising 48, and the most common type of nonfamily households are 1-person households, comprising 49.
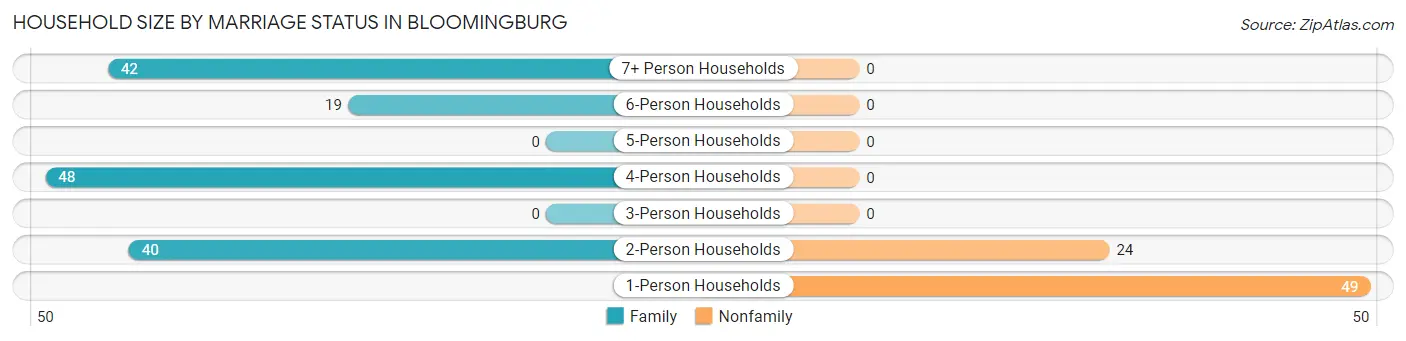
| Household Size | Family Households | Nonfamily Households |
| 1-Person Households | - | 49 (22.1%) |
| 2-Person Households | 40 (18.0%) | 24 (10.8%) |
| 3-Person Households | 0 (0.0%) | 0 (0.0%) |
| 4-Person Households | 48 (21.6%) | 0 (0.0%) |
| 5-Person Households | 0 (0.0%) | 0 (0.0%) |
| 6-Person Households | 19 (8.6%) | 0 (0.0%) |
| 7+ Person Households | 42 (18.9%) | 0 (0.0%) |
| Total | 149 (67.1%) | 73 (32.9%) |
Female Fertility in Bloomingburg
Fertility by Age in Bloomingburg
Average fertility rate in Bloomingburg is 227.0 births per 1,000 women. Women in the age bracket of 35 to 50 years have the highest fertility rate with 263.0 births per 1,000 women. Women in the age bracket of 20 to 34 years acount for 70.6% of all women with births.
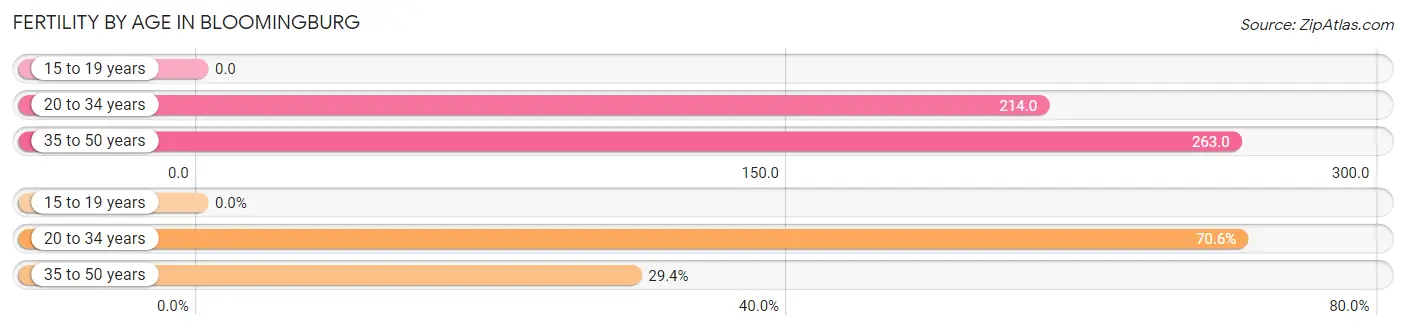
| Age Bracket | Women with Births | Births / 1,000 Women |
| 15 to 19 years | 0 (0.0%) | 0.0 |
| 20 to 34 years | 24 (70.6%) | 214.0 |
| 35 to 50 years | 10 (29.4%) | 263.0 |
| Total | 34 (100.0%) | 227.0 |
Fertility by Age by Marriage Status in Bloomingburg
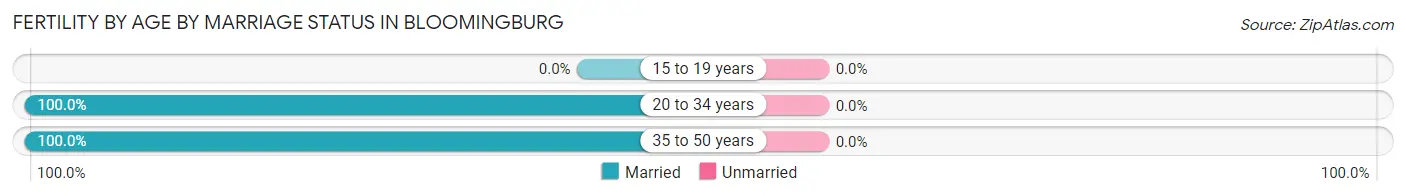
| Age Bracket | Married | Unmarried |
| 15 to 19 years | 0 (0.0%) | 0 (0.0%) |
| 20 to 34 years | 24 (100.0%) | 0 (0.0%) |
| 35 to 50 years | 10 (100.0%) | 0 (0.0%) |
| Total | 34 (100.0%) | 0 (0.0%) |
Fertility by Education in Bloomingburg
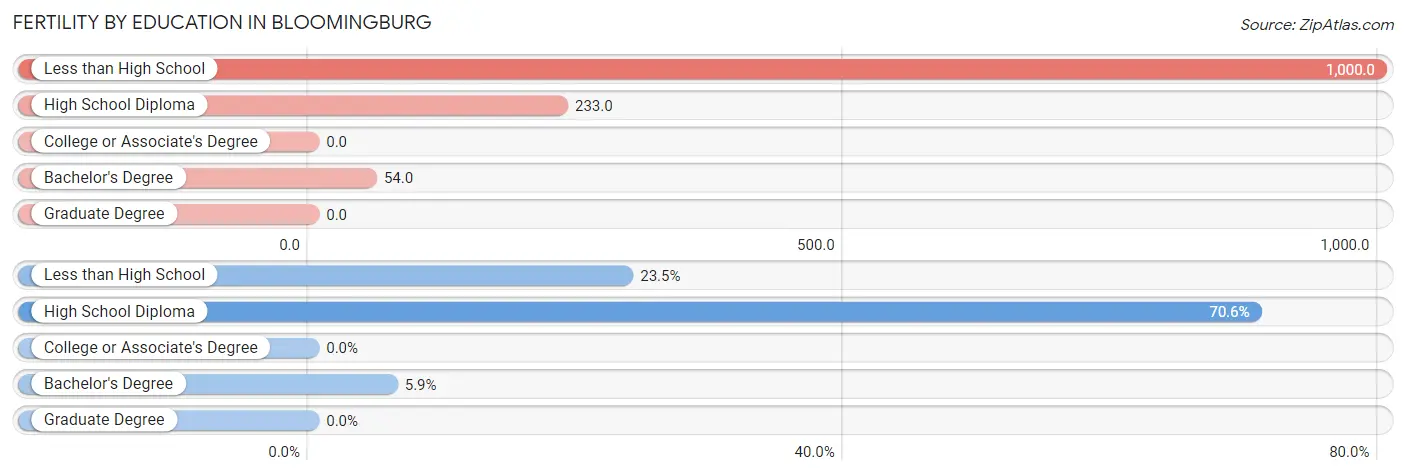
| Educational Attainment | Women with Births | Births / 1,000 Women |
| Less than High School | 8 (23.5%) | 1,000.0 |
| High School Diploma | 24 (70.6%) | 233.0 |
| College or Associate's Degree | 0 (0.0%) | 0.0 |
| Bachelor's Degree | 2 (5.9%) | 54.0 |
| Graduate Degree | 0 (0.0%) | 0.0 |
| Total | 34 (100.0%) | 227.0 |
Fertility by Education by Marriage Status in Bloomingburg
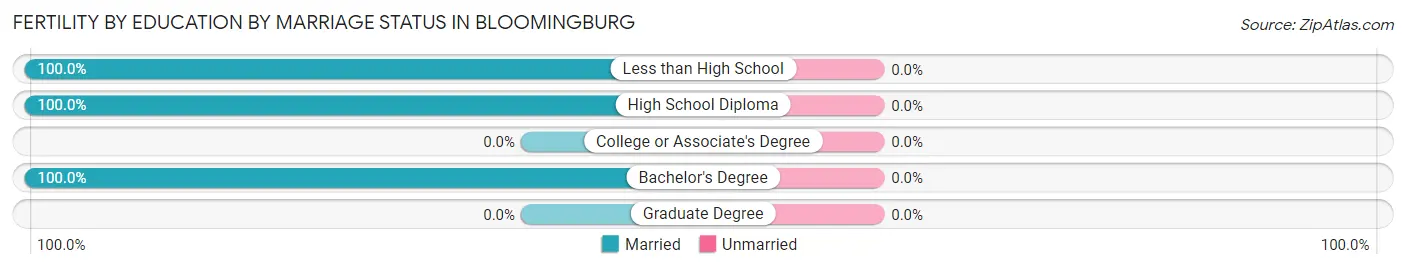
| Educational Attainment | Married | Unmarried |
| Less than High School | 8 (100.0%) | 0 (0.0%) |
| High School Diploma | 24 (100.0%) | 0 (0.0%) |
| College or Associate's Degree | 0 (0.0%) | 0 (0.0%) |
| Bachelor's Degree | 2 (100.0%) | 0 (0.0%) |
| Graduate Degree | 0 (0.0%) | 0 (0.0%) |
| Total | 34 (100.0%) | 0 (0.0%) |
Employment Characteristics in Bloomingburg
Employment by Class of Employer in Bloomingburg
Among the 234 employed individuals in Bloomingburg, private company employees (167 | 71.4%), not-for-profit organizations (36 | 15.4%), and self-employed (incorporated) (24 | 10.3%) make up the most common classes of employment.
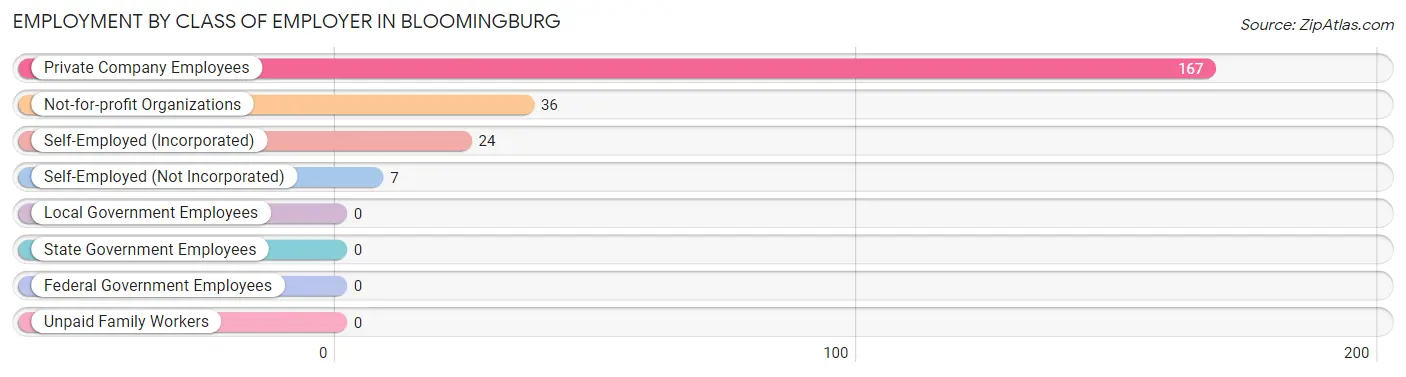
| Employer Class | # Employees | % Employees |
| Private Company Employees | 167 | 71.4% |
| Self-Employed (Incorporated) | 24 | 10.3% |
| Self-Employed (Not Incorporated) | 7 | 3.0% |
| Not-for-profit Organizations | 36 | 15.4% |
| Local Government Employees | 0 | 0.0% |
| State Government Employees | 0 | 0.0% |
| Federal Government Employees | 0 | 0.0% |
| Unpaid Family Workers | 0 | 0.0% |
| Total | 234 | 100.0% |
Employment Status by Age in Bloomingburg
According to the labor force statistics for Bloomingburg, out of the total population over 16 years of age (448), 54.7% or 245 individuals are in the labor force, with 3.7% or 9 of them unemployed. The age group with the highest labor force participation rate is 45 to 54 years, with 91.7% or 11 individuals in the labor force. Within the labor force, the 25 to 29 years age range has the highest percentage of unemployed individuals, with 17.0% or 9 of them being unemployed.
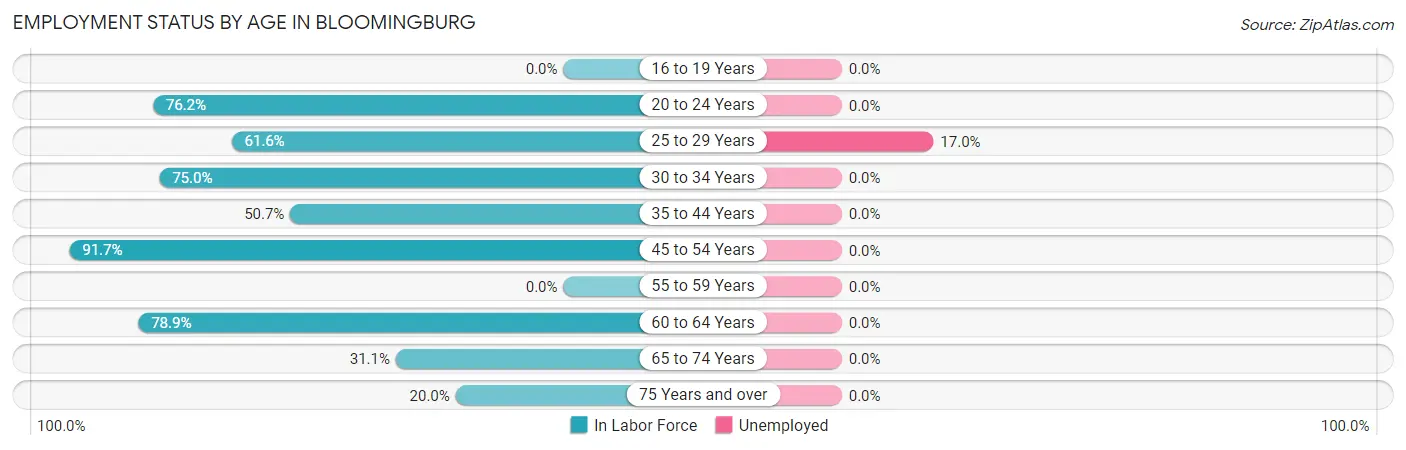
| Age Bracket | In Labor Force | Unemployed |
| 16 to 19 Years | 0 (0.0%) | 0 (0.0%) |
| 20 to 24 Years | 64 (76.2%) | 0 (0.0%) |
| 25 to 29 Years | 53 (61.6%) | 9 (17.0%) |
| 30 to 34 Years | 39 (75.0%) | 0 (0.0%) |
| 35 to 44 Years | 36 (50.7%) | 0 (0.0%) |
| 45 to 54 Years | 11 (91.7%) | 0 (0.0%) |
| 55 to 59 Years | 0 (0.0%) | 0 (0.0%) |
| 60 to 64 Years | 15 (78.9%) | 0 (0.0%) |
| 65 to 74 Years | 23 (31.1%) | 0 (0.0%) |
| 75 Years and over | 4 (20.0%) | 0 (0.0%) |
| Total | 245 (54.7%) | 9 (3.7%) |
Employment Status by Educational Attainment in Bloomingburg
According to labor force statistics for Bloomingburg, 60.2% of individuals (154) out of the total population between 25 and 64 years of age (256) are in the labor force, with 5.8% or 9 of them being unemployed. The group with the highest labor force participation rate are those with the educational attainment of college / associate degree, with 98.9% or 92 individuals in the labor force. Within the labor force, individuals with college / associate degree education have the highest percentage of unemployment, with 9.8% or 9 of them being unemployed.
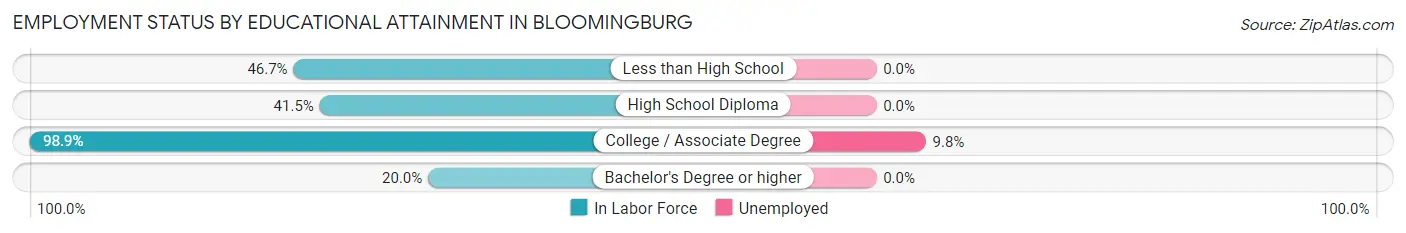
| Educational Attainment | In Labor Force | Unemployed |
| Less than High School | 7 (46.7%) | 0 (0.0%) |
| High School Diploma | 49 (41.5%) | 0 (0.0%) |
| College / Associate Degree | 92 (98.9%) | 9 (9.8%) |
| Bachelor's Degree or higher | 6 (20.0%) | 0 (0.0%) |
| Total | 154 (60.2%) | 15 (5.8%) |
Employment Occupations by Sex in Bloomingburg
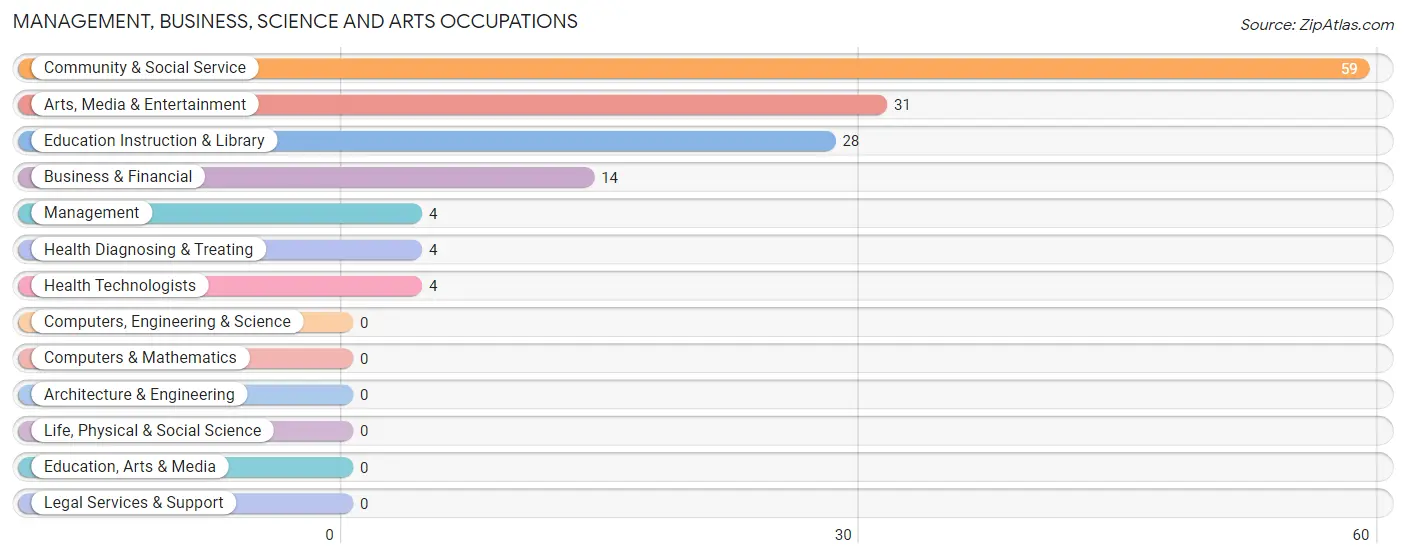
Management, Business, Science and Arts Occupations
The most common Management, Business, Science and Arts occupations in Bloomingburg are Community & Social Service (59 | 25.0%), Arts, Media & Entertainment (31 | 13.1%), Education Instruction & Library (28 | 11.9%), Business & Financial (14 | 5.9%), and Management (4 | 1.7%).
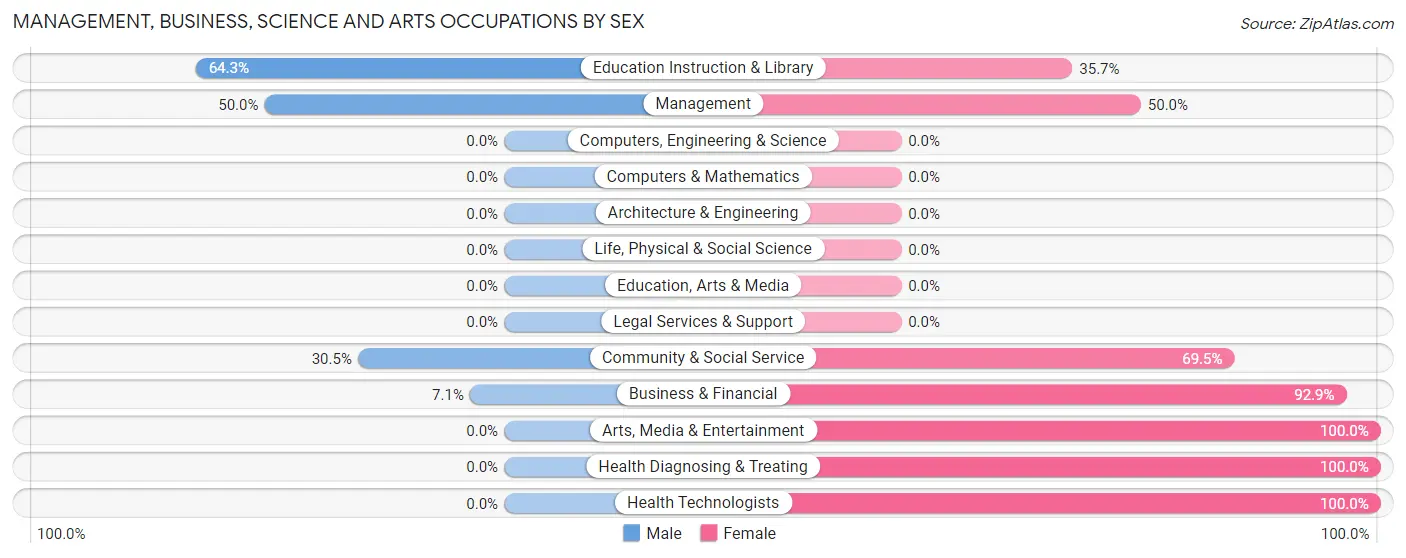
Management, Business, Science and Arts Occupations by Sex
Within the Management, Business, Science and Arts occupations in Bloomingburg, the most male-oriented occupations are Education Instruction & Library (64.3%), Management (50.0%), and Community & Social Service (30.5%), while the most female-oriented occupations are Arts, Media & Entertainment (100.0%), Health Diagnosing & Treating (100.0%), and Health Technologists (100.0%).
| Occupation | Male | Female |
| Management | 2 (50.0%) | 2 (50.0%) |
| Business & Financial | 1 (7.1%) | 13 (92.9%) |
| Computers, Engineering & Science | 0 (0.0%) | 0 (0.0%) |
| Computers & Mathematics | 0 (0.0%) | 0 (0.0%) |
| Architecture & Engineering | 0 (0.0%) | 0 (0.0%) |
| Life, Physical & Social Science | 0 (0.0%) | 0 (0.0%) |
| Community & Social Service | 18 (30.5%) | 41 (69.5%) |
| Education, Arts & Media | 0 (0.0%) | 0 (0.0%) |
| Legal Services & Support | 0 (0.0%) | 0 (0.0%) |
| Education Instruction & Library | 18 (64.3%) | 10 (35.7%) |
| Arts, Media & Entertainment | 0 (0.0%) | 31 (100.0%) |
| Health Diagnosing & Treating | 0 (0.0%) | 4 (100.0%) |
| Health Technologists | 0 (0.0%) | 4 (100.0%) |
| Total (Category) | 21 (25.9%) | 60 (74.1%) |
| Total (Overall) | 157 (66.5%) | 79 (33.5%) |
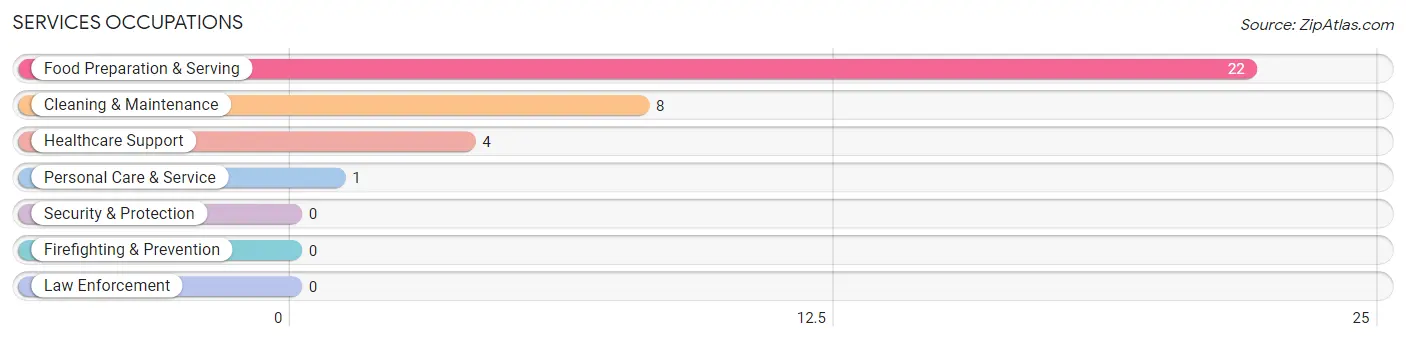
Services Occupations
The most common Services occupations in Bloomingburg are Food Preparation & Serving (22 | 9.3%), Cleaning & Maintenance (8 | 3.4%), Healthcare Support (4 | 1.7%), and Personal Care & Service (1 | 0.4%).
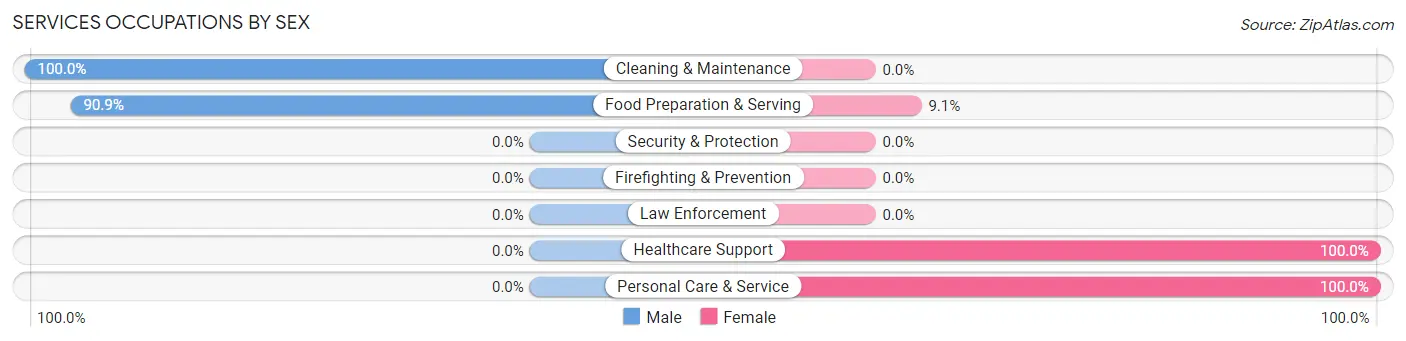
Services Occupations by Sex
Within the Services occupations in Bloomingburg, the most male-oriented occupations are Cleaning & Maintenance (100.0%), and Food Preparation & Serving (90.9%), while the most female-oriented occupations are Healthcare Support (100.0%), Personal Care & Service (100.0%), and Food Preparation & Serving (9.1%).
| Occupation | Male | Female |
| Healthcare Support | 0 (0.0%) | 4 (100.0%) |
| Security & Protection | 0 (0.0%) | 0 (0.0%) |
| Firefighting & Prevention | 0 (0.0%) | 0 (0.0%) |
| Law Enforcement | 0 (0.0%) | 0 (0.0%) |
| Food Preparation & Serving | 20 (90.9%) | 2 (9.1%) |
| Cleaning & Maintenance | 8 (100.0%) | 0 (0.0%) |
| Personal Care & Service | 0 (0.0%) | 1 (100.0%) |
| Total (Category) | 28 (80.0%) | 7 (20.0%) |
| Total (Overall) | 157 (66.5%) | 79 (33.5%) |
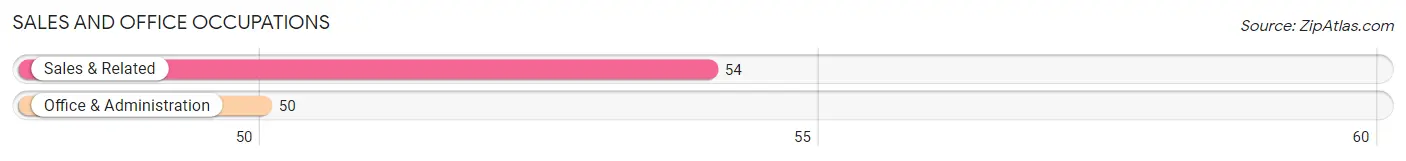
Sales and Office Occupations
The most common Sales and Office occupations in Bloomingburg are Sales & Related (54 | 22.9%), and Office & Administration (50 | 21.2%).
Sales and Office Occupations by Sex
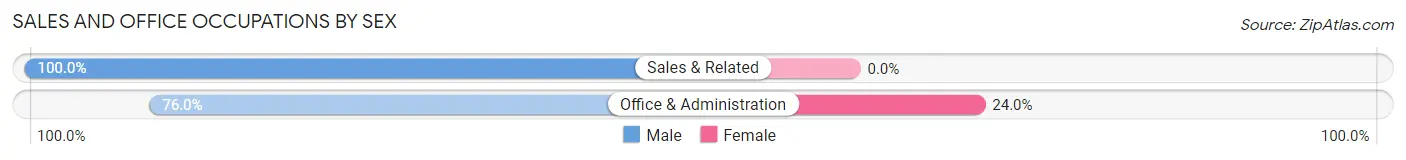
| Occupation | Male | Female |
| Sales & Related | 54 (100.0%) | 0 (0.0%) |
| Office & Administration | 38 (76.0%) | 12 (24.0%) |
| Total (Category) | 92 (88.5%) | 12 (11.5%) |
| Total (Overall) | 157 (66.5%) | 79 (33.5%) |
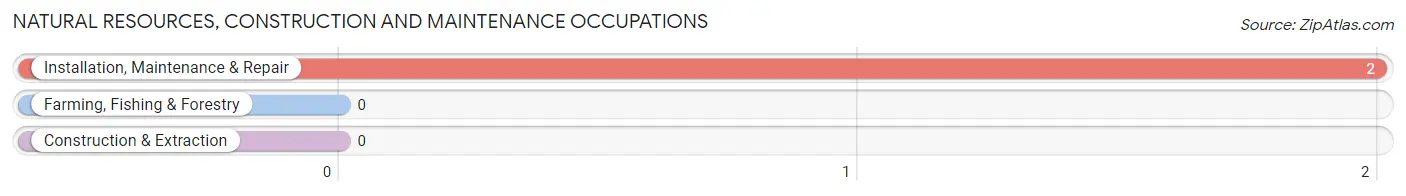
Natural Resources, Construction and Maintenance Occupations
The most common Natural Resources, Construction and Maintenance occupations in Bloomingburg are , and Installation, Maintenance & Repair (2 | 0.9%).
Natural Resources, Construction and Maintenance Occupations by Sex
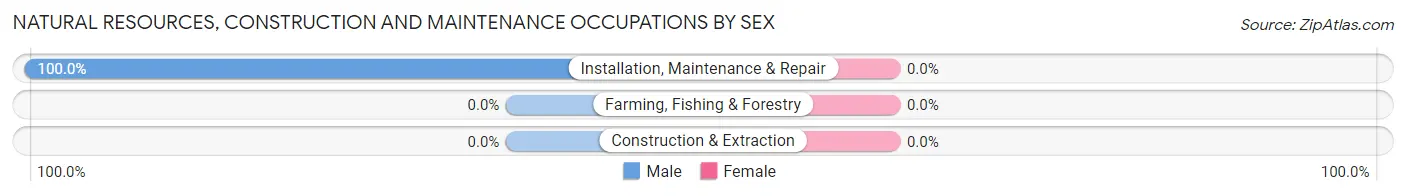
| Occupation | Male | Female |
| Farming, Fishing & Forestry | 0 (0.0%) | 0 (0.0%) |
| Construction & Extraction | 0 (0.0%) | 0 (0.0%) |
| Installation, Maintenance & Repair | 2 (100.0%) | 0 (0.0%) |
| Total (Category) | 2 (100.0%) | 0 (0.0%) |
| Total (Overall) | 157 (66.5%) | 79 (33.5%) |
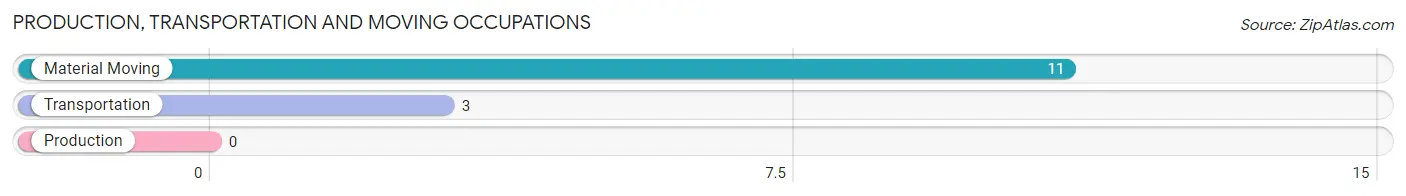
Production, Transportation and Moving Occupations
The most common Production, Transportation and Moving occupations in Bloomingburg are Material Moving (11 | 4.7%), and Transportation (3 | 1.3%).
Production, Transportation and Moving Occupations by Sex
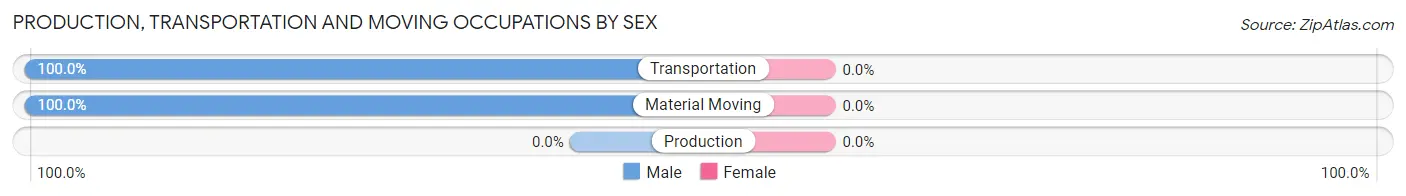
| Occupation | Male | Female |
| Production | 0 (0.0%) | 0 (0.0%) |
| Transportation | 3 (100.0%) | 0 (0.0%) |
| Material Moving | 11 (100.0%) | 0 (0.0%) |
| Total (Category) | 14 (100.0%) | 0 (0.0%) |
| Total (Overall) | 157 (66.5%) | 79 (33.5%) |
Employment Industries by Sex in Bloomingburg
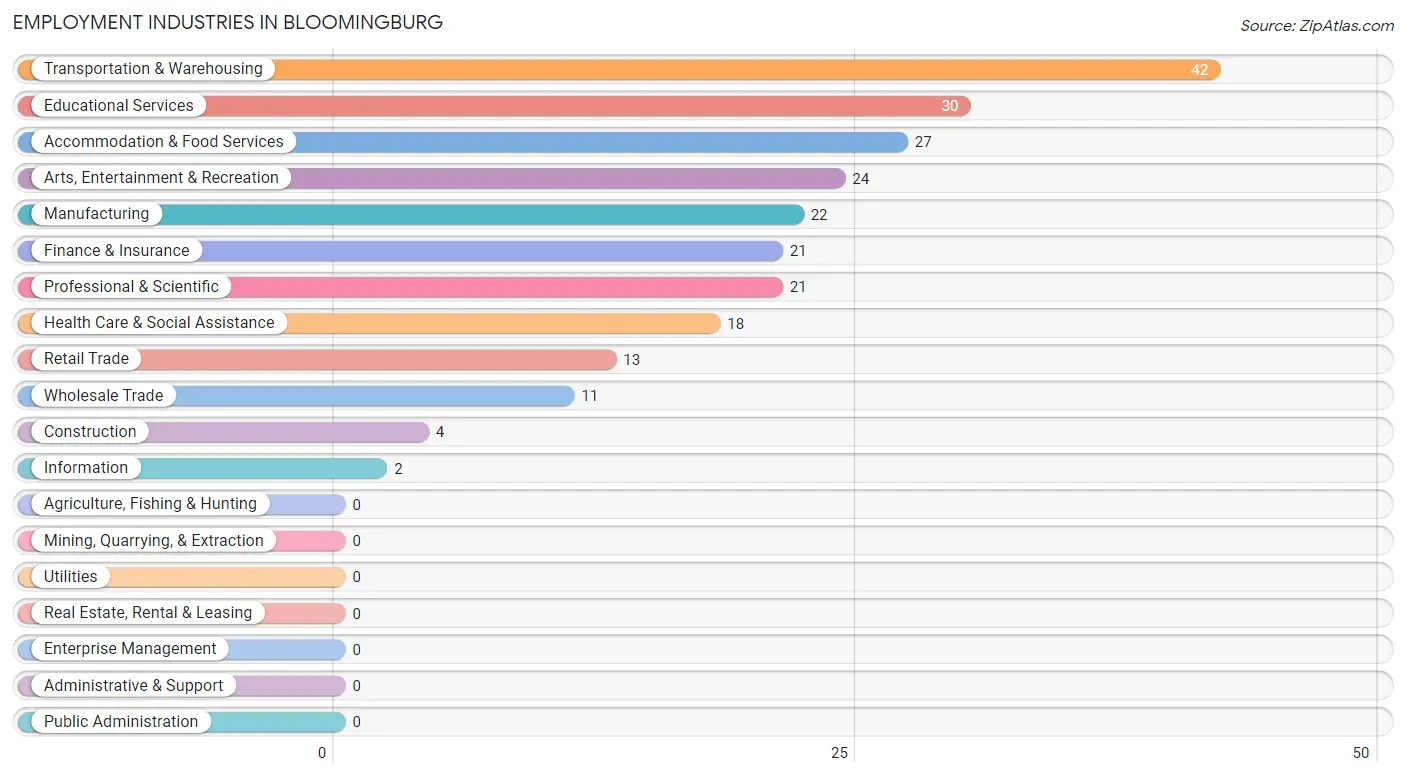
Employment Industries in Bloomingburg
The major employment industries in Bloomingburg include Transportation & Warehousing (42 | 17.8%), Educational Services (30 | 12.7%), Accommodation & Food Services (27 | 11.4%), Arts, Entertainment & Recreation (24 | 10.2%), and Manufacturing (22 | 9.3%).
Employment Industries by Sex in Bloomingburg
The Bloomingburg industries that see more men than women are Construction (100.0%), Manufacturing (100.0%), and Wholesale Trade (100.0%), whereas the industries that tend to have a higher number of women are Professional & Scientific (100.0%), Arts, Entertainment & Recreation (100.0%), and Health Care & Social Assistance (94.4%).
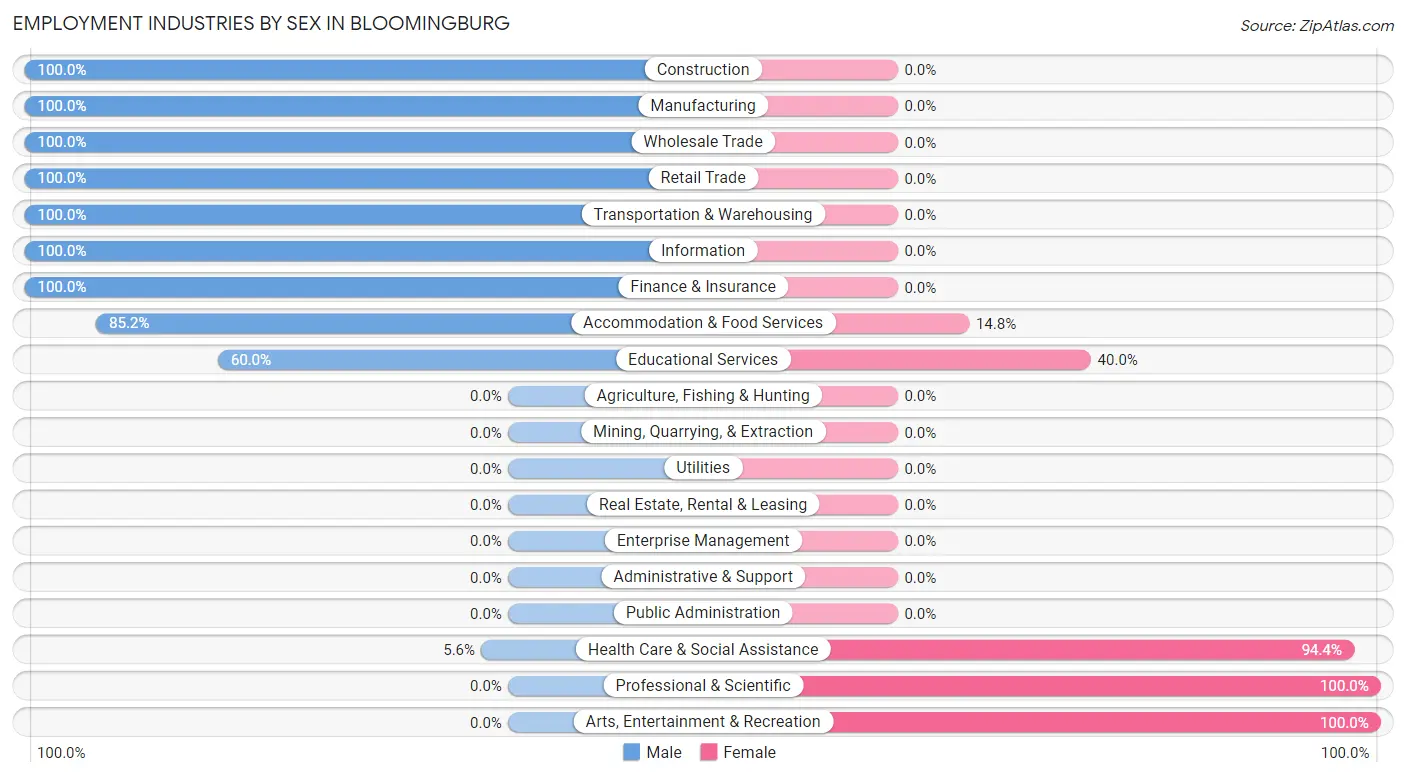
| Industry | Male | Female |
| Agriculture, Fishing & Hunting | 0 (0.0%) | 0 (0.0%) |
| Mining, Quarrying, & Extraction | 0 (0.0%) | 0 (0.0%) |
| Construction | 4 (100.0%) | 0 (0.0%) |
| Manufacturing | 22 (100.0%) | 0 (0.0%) |
| Wholesale Trade | 11 (100.0%) | 0 (0.0%) |
| Retail Trade | 13 (100.0%) | 0 (0.0%) |
| Transportation & Warehousing | 42 (100.0%) | 0 (0.0%) |
| Utilities | 0 (0.0%) | 0 (0.0%) |
| Information | 2 (100.0%) | 0 (0.0%) |
| Finance & Insurance | 21 (100.0%) | 0 (0.0%) |
| Real Estate, Rental & Leasing | 0 (0.0%) | 0 (0.0%) |
| Professional & Scientific | 0 (0.0%) | 21 (100.0%) |
| Enterprise Management | 0 (0.0%) | 0 (0.0%) |
| Administrative & Support | 0 (0.0%) | 0 (0.0%) |
| Educational Services | 18 (60.0%) | 12 (40.0%) |
| Health Care & Social Assistance | 1 (5.6%) | 17 (94.4%) |
| Arts, Entertainment & Recreation | 0 (0.0%) | 24 (100.0%) |
| Accommodation & Food Services | 23 (85.2%) | 4 (14.8%) |
| Public Administration | 0 (0.0%) | 0 (0.0%) |
| Total | 157 (66.5%) | 79 (33.5%) |
Education in Bloomingburg
School Enrollment in Bloomingburg
The most common levels of schooling among the 364 students in Bloomingburg are elementary school (140 | 38.5%), middle school (71 | 19.5%), and kindergarten (44 | 12.1%).
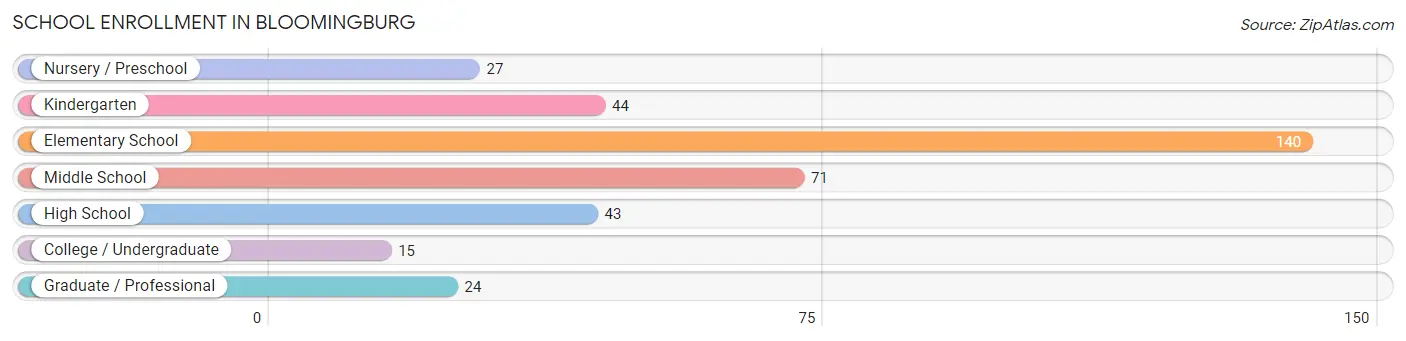
| School Level | # Students | % Students |
| Nursery / Preschool | 27 | 7.4% |
| Kindergarten | 44 | 12.1% |
| Elementary School | 140 | 38.5% |
| Middle School | 71 | 19.5% |
| High School | 43 | 11.8% |
| College / Undergraduate | 15 | 4.1% |
| Graduate / Professional | 24 | 6.6% |
| Total | 364 | 100.0% |
School Enrollment by Age by Funding Source in Bloomingburg
Out of a total of 364 students who are enrolled in schools in Bloomingburg, 326 (89.6%) attend a private institution, while the remaining 38 (10.4%) are enrolled in public schools. The age group of 3 to 4 year olds has the highest likelihood of being enrolled in private schools, with 57 (100.0% in the age bracket) enrolled. Conversely, the age group of 20 to 24 year olds has the lowest likelihood of being enrolled in a private school, with 24 (96.0% in the age bracket) attending a public institution.
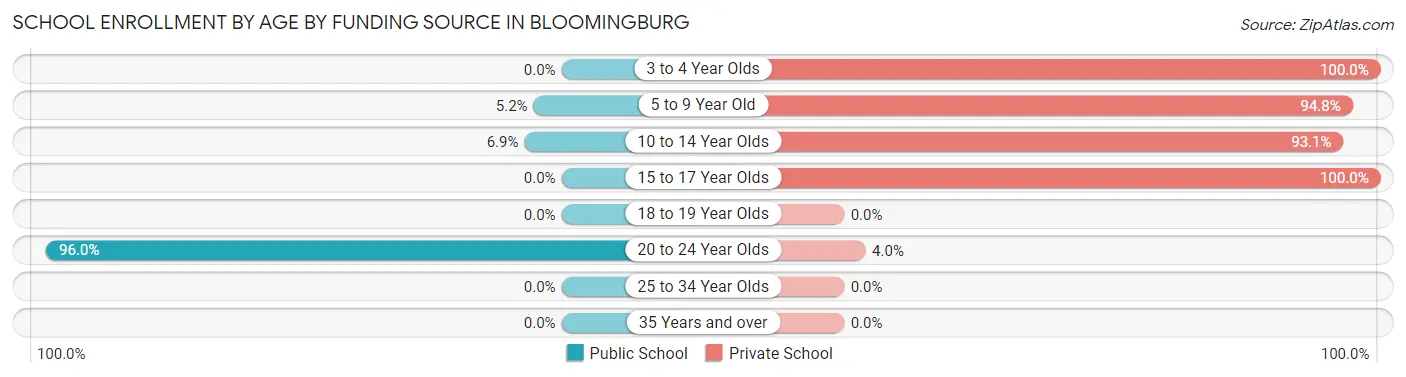
| Age Bracket | Public School | Private School |
| 3 to 4 Year Olds | 0 (0.0%) | 57 (100.0%) |
| 5 to 9 Year Old | 7 (5.2%) | 127 (94.8%) |
| 10 to 14 Year Olds | 7 (6.9%) | 94 (93.1%) |
| 15 to 17 Year Olds | 0 (0.0%) | 47 (100.0%) |
| 18 to 19 Year Olds | 0 (0.0%) | 0 (0.0%) |
| 20 to 24 Year Olds | 24 (96.0%) | 1 (4.0%) |
| 25 to 34 Year Olds | 0 (0.0%) | 0 (0.0%) |
| 35 Years and over | 0 (0.0%) | 0 (0.0%) |
| Total | 38 (10.4%) | 326 (89.6%) |
Educational Attainment by Field of Study in Bloomingburg
Science & technology (15 | 41.7%), physical & health sciences (13 | 36.1%), literature & languages (5 | 13.9%), social sciences (2 | 5.6%), and education (1 | 2.8%) are the most common fields of study among 36 individuals in Bloomingburg who have obtained a bachelor's degree or higher.
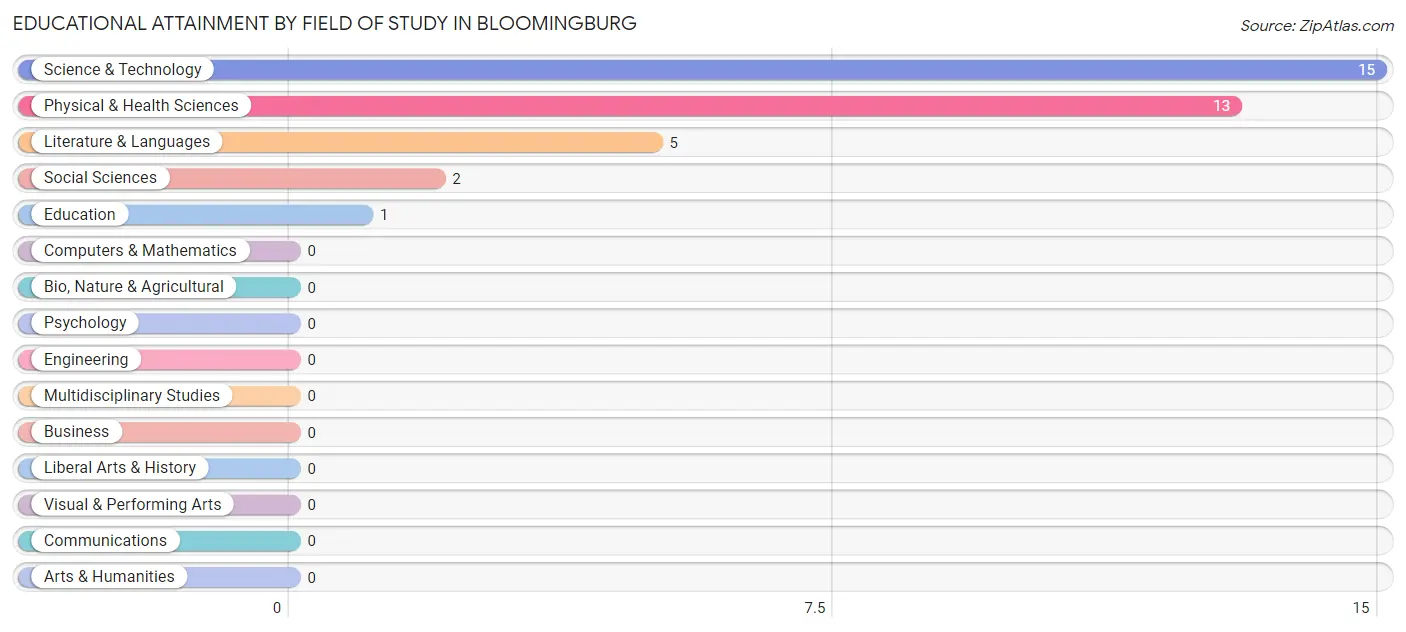
| Field of Study | # Graduates | % Graduates |
| Computers & Mathematics | 0 | 0.0% |
| Bio, Nature & Agricultural | 0 | 0.0% |
| Physical & Health Sciences | 13 | 36.1% |
| Psychology | 0 | 0.0% |
| Social Sciences | 2 | 5.6% |
| Engineering | 0 | 0.0% |
| Multidisciplinary Studies | 0 | 0.0% |
| Science & Technology | 15 | 41.7% |
| Business | 0 | 0.0% |
| Education | 1 | 2.8% |
| Literature & Languages | 5 | 13.9% |
| Liberal Arts & History | 0 | 0.0% |
| Visual & Performing Arts | 0 | 0.0% |
| Communications | 0 | 0.0% |
| Arts & Humanities | 0 | 0.0% |
| Total | 36 | 100.0% |
Transportation & Commute in Bloomingburg
Vehicle Availability by Sex in Bloomingburg
The most prevalent vehicle ownership categories in Bloomingburg are males with no vehicle (60, accounting for 38.7%) and females with no vehicle (30, making up 75.9%).
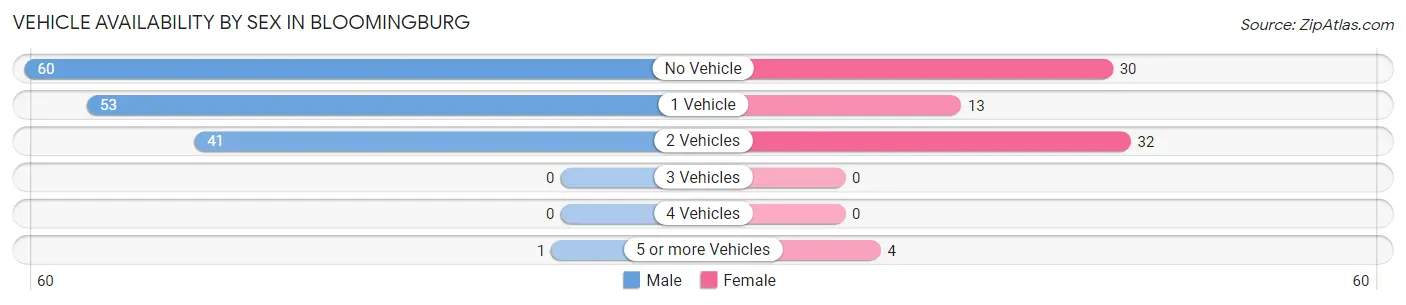
| Vehicles Available | Male | Female |
| No Vehicle | 60 (38.7%) | 30 (38.0%) |
| 1 Vehicle | 53 (34.2%) | 13 (16.5%) |
| 2 Vehicles | 41 (26.5%) | 32 (40.5%) |
| 3 Vehicles | 0 (0.0%) | 0 (0.0%) |
| 4 Vehicles | 0 (0.0%) | 0 (0.0%) |
| 5 or more Vehicles | 1 (0.6%) | 4 (5.1%) |
| Total | 155 (100.0%) | 79 (100.0%) |
Commute Time in Bloomingburg
The most frequently occuring commute durations in Bloomingburg are 45 to 59 minutes (62 commuters, 27.8%), 20 to 24 minutes (42 commuters, 18.8%), and 15 to 19 minutes (36 commuters, 16.1%).
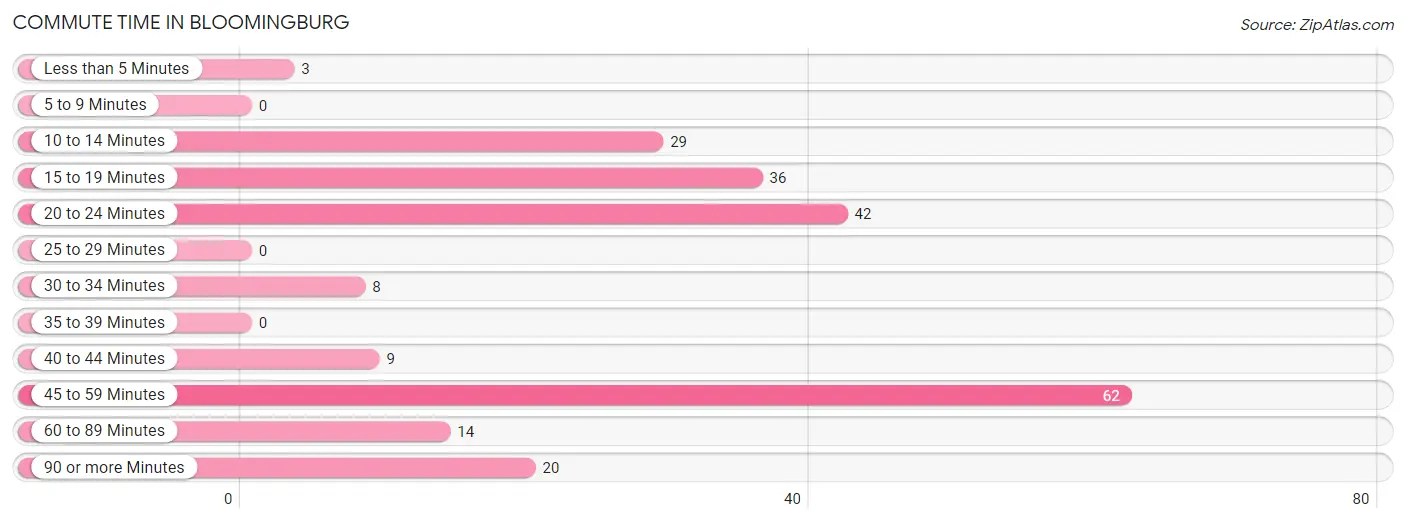
| Commute Time | # Commuters | % Commuters |
| Less than 5 Minutes | 3 | 1.3% |
| 5 to 9 Minutes | 0 | 0.0% |
| 10 to 14 Minutes | 29 | 13.0% |
| 15 to 19 Minutes | 36 | 16.1% |
| 20 to 24 Minutes | 42 | 18.8% |
| 25 to 29 Minutes | 0 | 0.0% |
| 30 to 34 Minutes | 8 | 3.6% |
| 35 to 39 Minutes | 0 | 0.0% |
| 40 to 44 Minutes | 9 | 4.0% |
| 45 to 59 Minutes | 62 | 27.8% |
| 60 to 89 Minutes | 14 | 6.3% |
| 90 or more Minutes | 20 | 9.0% |
Commute Time by Sex in Bloomingburg
The most common commute times in Bloomingburg are 45 to 59 minutes (60 commuters, 39.5%) for males and 20 to 24 minutes (25 commuters, 35.2%) for females.
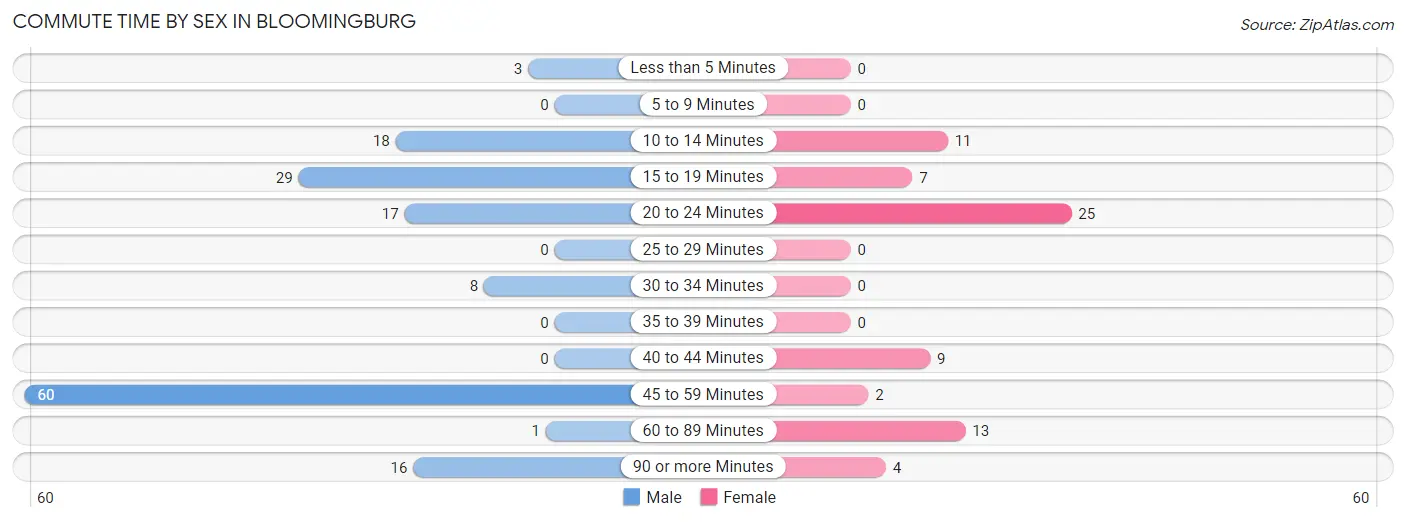
| Commute Time | Male | Female |
| Less than 5 Minutes | 3 (2.0%) | 0 (0.0%) |
| 5 to 9 Minutes | 0 (0.0%) | 0 (0.0%) |
| 10 to 14 Minutes | 18 (11.8%) | 11 (15.5%) |
| 15 to 19 Minutes | 29 (19.1%) | 7 (9.9%) |
| 20 to 24 Minutes | 17 (11.2%) | 25 (35.2%) |
| 25 to 29 Minutes | 0 (0.0%) | 0 (0.0%) |
| 30 to 34 Minutes | 8 (5.3%) | 0 (0.0%) |
| 35 to 39 Minutes | 0 (0.0%) | 0 (0.0%) |
| 40 to 44 Minutes | 0 (0.0%) | 9 (12.7%) |
| 45 to 59 Minutes | 60 (39.5%) | 2 (2.8%) |
| 60 to 89 Minutes | 1 (0.7%) | 13 (18.3%) |
| 90 or more Minutes | 16 (10.5%) | 4 (5.6%) |
Time of Departure to Work by Sex in Bloomingburg
The most frequent times of departure to work in Bloomingburg are 8:00 AM to 8:29 AM (55, 36.2%) for males and 8:00 AM to 8:29 AM (30, 42.2%) for females.
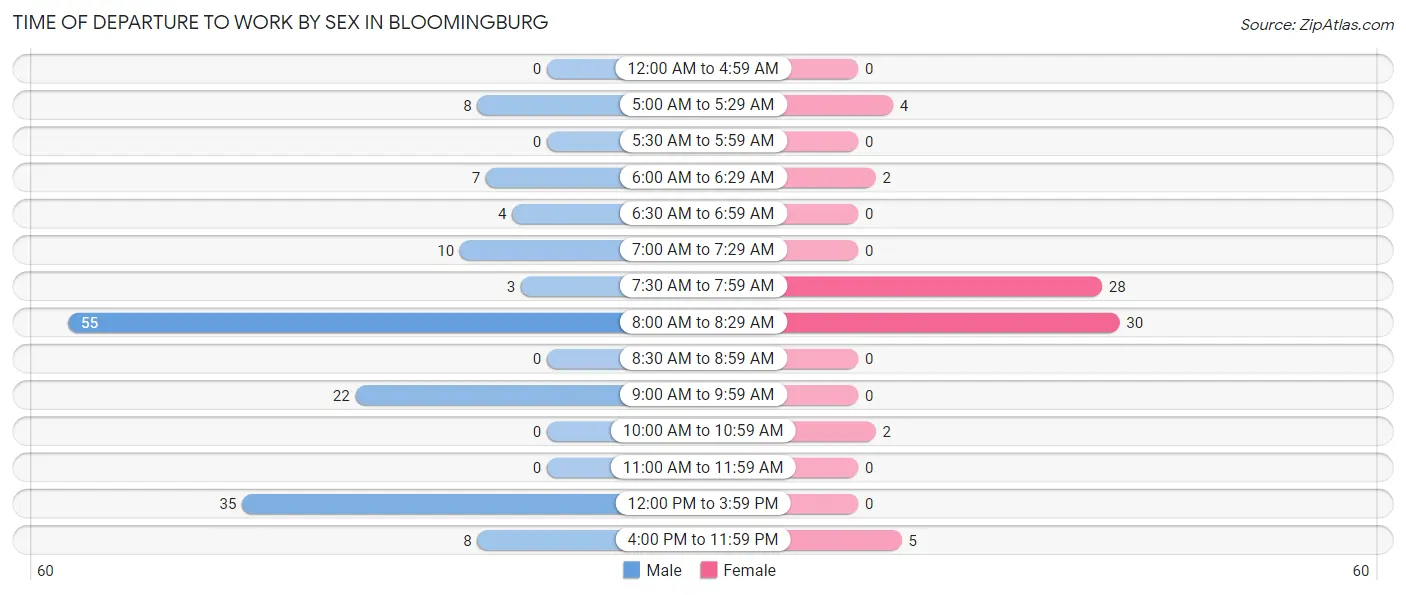
| Time of Departure | Male | Female |
| 12:00 AM to 4:59 AM | 0 (0.0%) | 0 (0.0%) |
| 5:00 AM to 5:29 AM | 8 (5.3%) | 4 (5.6%) |
| 5:30 AM to 5:59 AM | 0 (0.0%) | 0 (0.0%) |
| 6:00 AM to 6:29 AM | 7 (4.6%) | 2 (2.8%) |
| 6:30 AM to 6:59 AM | 4 (2.6%) | 0 (0.0%) |
| 7:00 AM to 7:29 AM | 10 (6.6%) | 0 (0.0%) |
| 7:30 AM to 7:59 AM | 3 (2.0%) | 28 (39.4%) |
| 8:00 AM to 8:29 AM | 55 (36.2%) | 30 (42.2%) |
| 8:30 AM to 8:59 AM | 0 (0.0%) | 0 (0.0%) |
| 9:00 AM to 9:59 AM | 22 (14.5%) | 0 (0.0%) |
| 10:00 AM to 10:59 AM | 0 (0.0%) | 2 (2.8%) |
| 11:00 AM to 11:59 AM | 0 (0.0%) | 0 (0.0%) |
| 12:00 PM to 3:59 PM | 35 (23.0%) | 0 (0.0%) |
| 4:00 PM to 11:59 PM | 8 (5.3%) | 5 (7.0%) |
| Total | 152 (100.0%) | 71 (100.0%) |
Housing Occupancy in Bloomingburg
Occupancy by Ownership in Bloomingburg
Of the total 222 dwellings in Bloomingburg, owner-occupied units account for 49 (22.1%), while renter-occupied units make up 173 (77.9%).
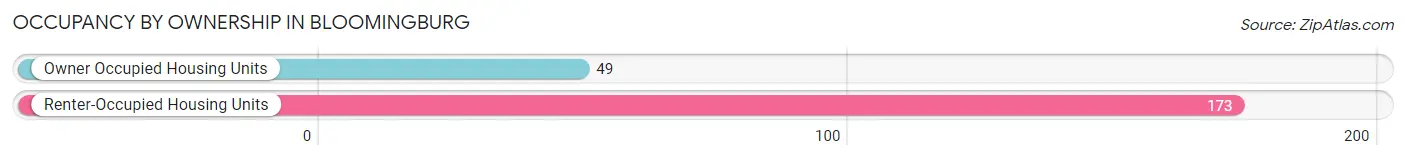
| Occupancy | # Housing Units | % Housing Units |
| Owner Occupied Housing Units | 49 | 22.1% |
| Renter-Occupied Housing Units | 173 | 77.9% |
| Total Occupied Housing Units | 222 | 100.0% |
Occupancy by Household Size in Bloomingburg
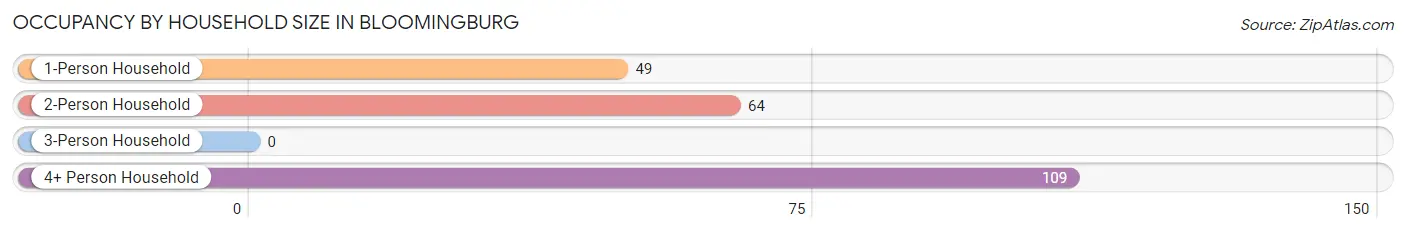
| Household Size | # Housing Units | % Housing Units |
| 1-Person Household | 49 | 22.1% |
| 2-Person Household | 64 | 28.8% |
| 3-Person Household | 0 | 0.0% |
| 4+ Person Household | 109 | 49.1% |
| Total Housing Units | 222 | 100.0% |
Occupancy by Ownership by Household Size in Bloomingburg
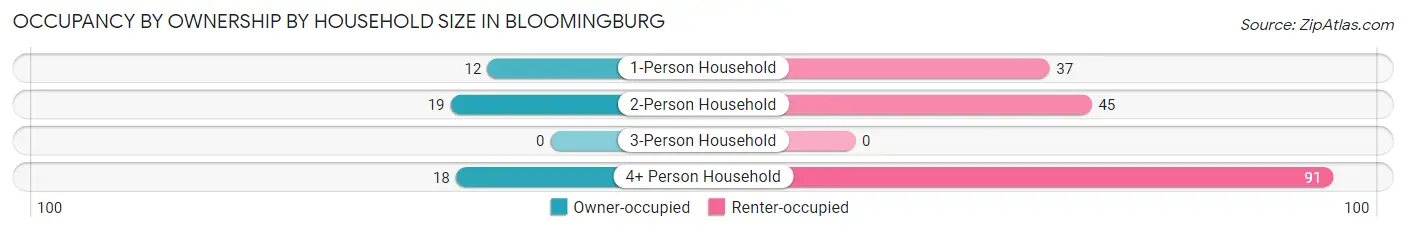
| Household Size | Owner-occupied | Renter-occupied |
| 1-Person Household | 12 (24.5%) | 37 (75.5%) |
| 2-Person Household | 19 (29.7%) | 45 (70.3%) |
| 3-Person Household | 0 (0.0%) | 0 (0.0%) |
| 4+ Person Household | 18 (16.5%) | 91 (83.5%) |
| Total Housing Units | 49 (22.1%) | 173 (77.9%) |
Occupancy by Educational Attainment in Bloomingburg
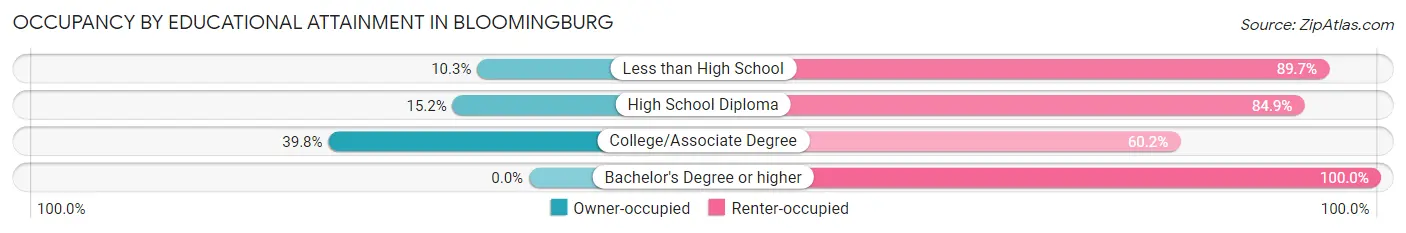
| Household Size | Owner-occupied | Renter-occupied |
| Less than High School | 4 (10.3%) | 35 (89.7%) |
| High School Diploma | 10 (15.1%) | 56 (84.9%) |
| College/Associate Degree | 35 (39.8%) | 53 (60.2%) |
| Bachelor's Degree or higher | 0 (0.0%) | 29 (100.0%) |
Occupancy by Age of Householder in Bloomingburg
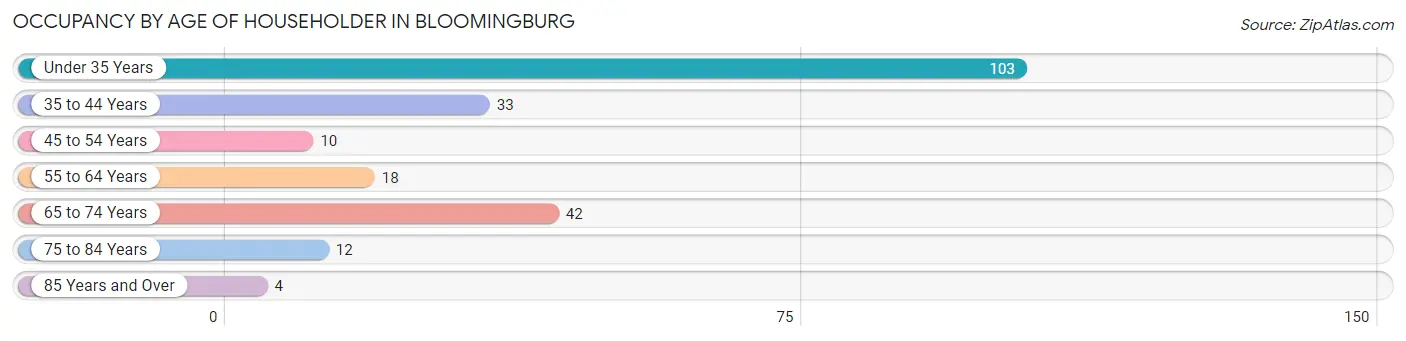
| Age Bracket | # Households | % Households |
| Under 35 Years | 103 | 46.4% |
| 35 to 44 Years | 33 | 14.9% |
| 45 to 54 Years | 10 | 4.5% |
| 55 to 64 Years | 18 | 8.1% |
| 65 to 74 Years | 42 | 18.9% |
| 75 to 84 Years | 12 | 5.4% |
| 85 Years and Over | 4 | 1.8% |
| Total | 222 | 100.0% |
Housing Finances in Bloomingburg
Median Income by Occupancy in Bloomingburg
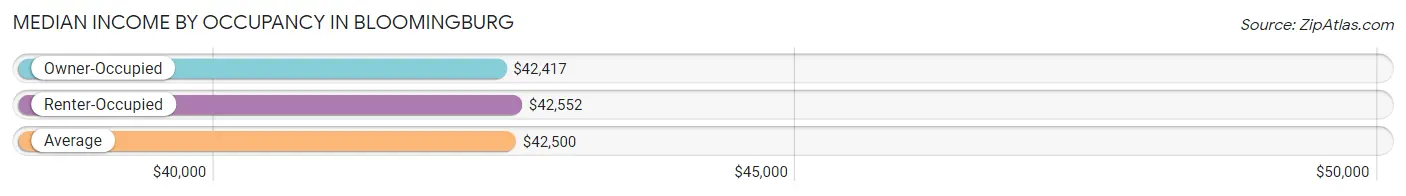
| Occupancy Type | # Households | Median Income |
| Owner-Occupied | 49 (22.1%) | $42,417 |
| Renter-Occupied | 173 (77.9%) | $42,552 |
| Average | 222 (100.0%) | $42,500 |
Occupancy by Householder Income Bracket in Bloomingburg
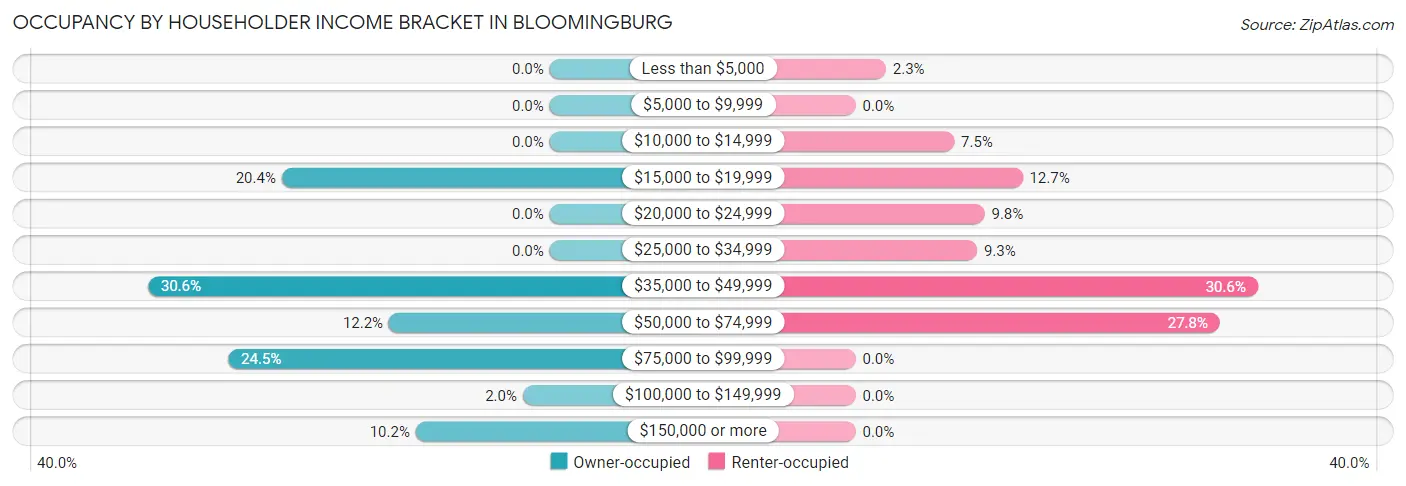
| Income Bracket | Owner-occupied | Renter-occupied |
| Less than $5,000 | 0 (0.0%) | 4 (2.3%) |
| $5,000 to $9,999 | 0 (0.0%) | 0 (0.0%) |
| $10,000 to $14,999 | 0 (0.0%) | 13 (7.5%) |
| $15,000 to $19,999 | 10 (20.4%) | 22 (12.7%) |
| $20,000 to $24,999 | 0 (0.0%) | 17 (9.8%) |
| $25,000 to $34,999 | 0 (0.0%) | 16 (9.2%) |
| $35,000 to $49,999 | 15 (30.6%) | 53 (30.6%) |
| $50,000 to $74,999 | 6 (12.2%) | 48 (27.8%) |
| $75,000 to $99,999 | 12 (24.5%) | 0 (0.0%) |
| $100,000 to $149,999 | 1 (2.0%) | 0 (0.0%) |
| $150,000 or more | 5 (10.2%) | 0 (0.0%) |
| Total | 49 (100.0%) | 173 (100.0%) |
Monthly Housing Cost Tiers in Bloomingburg
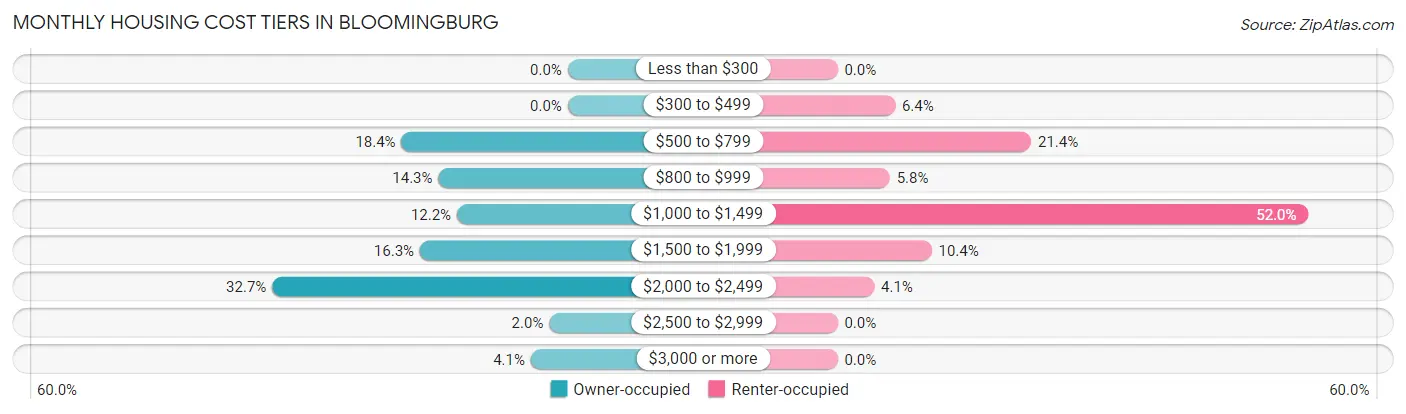
| Monthly Cost | Owner-occupied | Renter-occupied |
| Less than $300 | 0 (0.0%) | 0 (0.0%) |
| $300 to $499 | 0 (0.0%) | 11 (6.4%) |
| $500 to $799 | 9 (18.4%) | 37 (21.4%) |
| $800 to $999 | 7 (14.3%) | 10 (5.8%) |
| $1,000 to $1,499 | 6 (12.2%) | 90 (52.0%) |
| $1,500 to $1,999 | 8 (16.3%) | 18 (10.4%) |
| $2,000 to $2,499 | 16 (32.7%) | 7 (4.1%) |
| $2,500 to $2,999 | 1 (2.0%) | 0 (0.0%) |
| $3,000 or more | 2 (4.1%) | 0 (0.0%) |
| Total | 49 (100.0%) | 173 (100.0%) |
Physical Housing Characteristics in Bloomingburg
Housing Structures in Bloomingburg
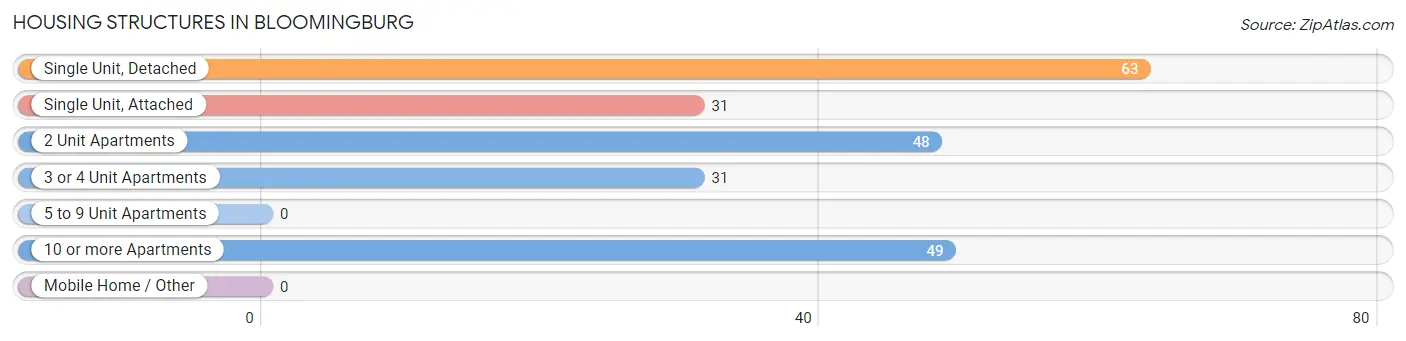
| Structure Type | # Housing Units | % Housing Units |
| Single Unit, Detached | 63 | 28.4% |
| Single Unit, Attached | 31 | 14.0% |
| 2 Unit Apartments | 48 | 21.6% |
| 3 or 4 Unit Apartments | 31 | 14.0% |
| 5 to 9 Unit Apartments | 0 | 0.0% |
| 10 or more Apartments | 49 | 22.1% |
| Mobile Home / Other | 0 | 0.0% |
| Total | 222 | 100.0% |
Housing Structures by Occupancy in Bloomingburg
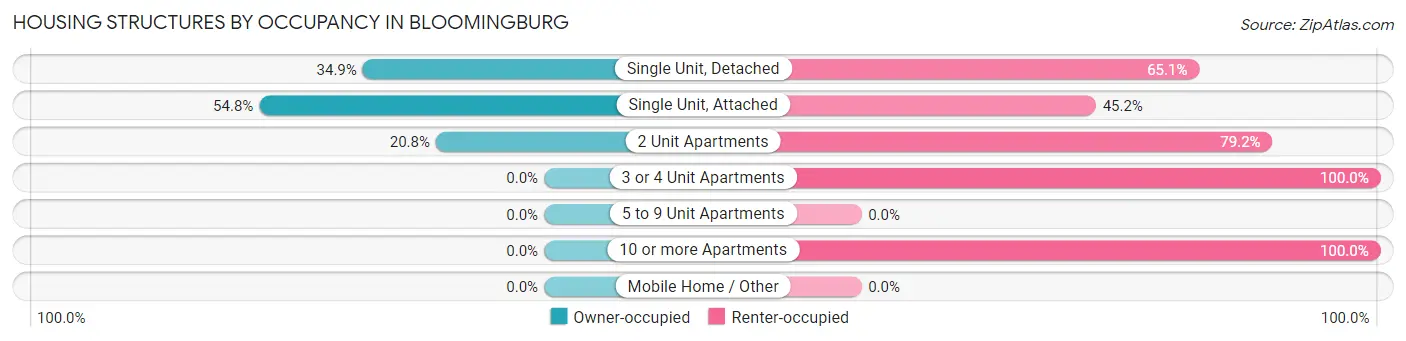
| Structure Type | Owner-occupied | Renter-occupied |
| Single Unit, Detached | 22 (34.9%) | 41 (65.1%) |
| Single Unit, Attached | 17 (54.8%) | 14 (45.2%) |
| 2 Unit Apartments | 10 (20.8%) | 38 (79.2%) |
| 3 or 4 Unit Apartments | 0 (0.0%) | 31 (100.0%) |
| 5 to 9 Unit Apartments | 0 (0.0%) | 0 (0.0%) |
| 10 or more Apartments | 0 (0.0%) | 49 (100.0%) |
| Mobile Home / Other | 0 (0.0%) | 0 (0.0%) |
| Total | 49 (22.1%) | 173 (77.9%) |
Housing Structures by Number of Rooms in Bloomingburg
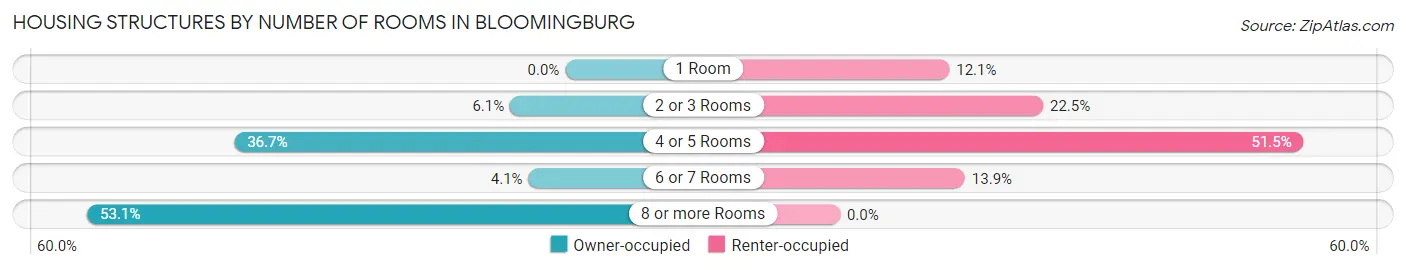
| Number of Rooms | Owner-occupied | Renter-occupied |
| 1 Room | 0 (0.0%) | 21 (12.1%) |
| 2 or 3 Rooms | 3 (6.1%) | 39 (22.5%) |
| 4 or 5 Rooms | 18 (36.7%) | 89 (51.4%) |
| 6 or 7 Rooms | 2 (4.1%) | 24 (13.9%) |
| 8 or more Rooms | 26 (53.1%) | 0 (0.0%) |
| Total | 49 (100.0%) | 173 (100.0%) |
Housing Structure by Heating Type in Bloomingburg
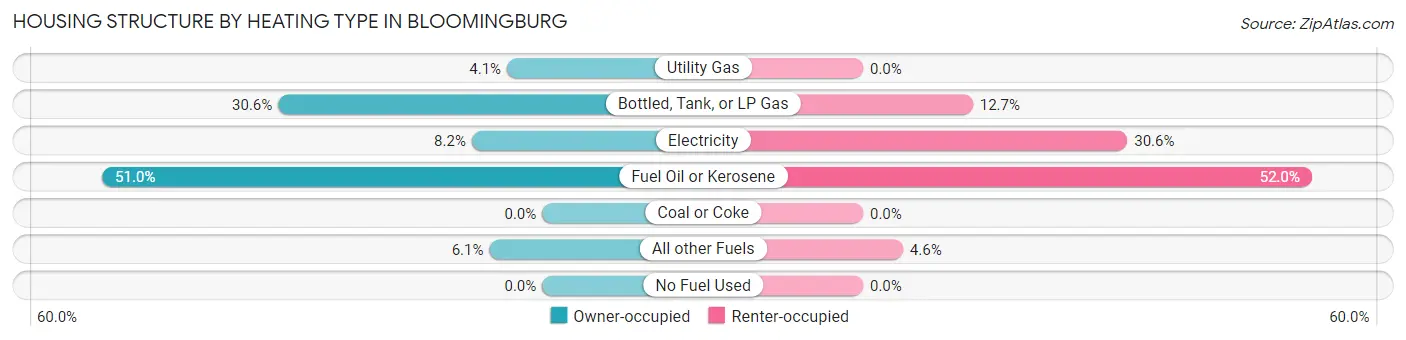
| Heating Type | Owner-occupied | Renter-occupied |
| Utility Gas | 2 (4.1%) | 0 (0.0%) |
| Bottled, Tank, or LP Gas | 15 (30.6%) | 22 (12.7%) |
| Electricity | 4 (8.2%) | 53 (30.6%) |
| Fuel Oil or Kerosene | 25 (51.0%) | 90 (52.0%) |
| Coal or Coke | 0 (0.0%) | 0 (0.0%) |
| All other Fuels | 3 (6.1%) | 8 (4.6%) |
| No Fuel Used | 0 (0.0%) | 0 (0.0%) |
| Total | 49 (100.0%) | 173 (100.0%) |
Household Vehicle Usage in Bloomingburg
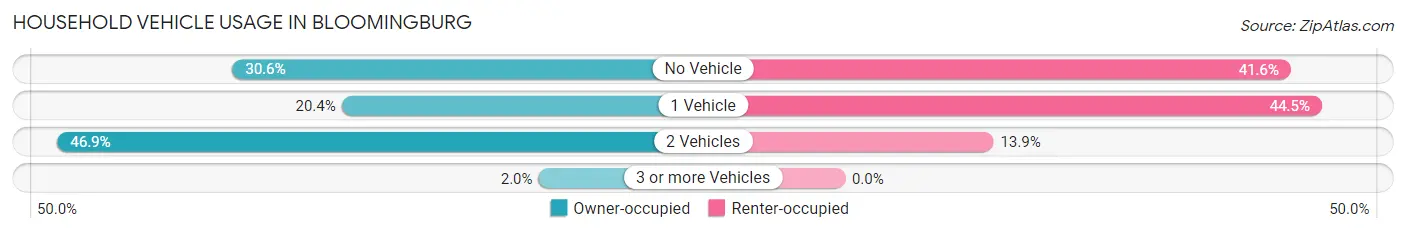
| Vehicles per Household | Owner-occupied | Renter-occupied |
| No Vehicle | 15 (30.6%) | 72 (41.6%) |
| 1 Vehicle | 10 (20.4%) | 77 (44.5%) |
| 2 Vehicles | 23 (46.9%) | 24 (13.9%) |
| 3 or more Vehicles | 1 (2.0%) | 0 (0.0%) |
| Total | 49 (100.0%) | 173 (100.0%) |
Real Estate & Mortgages in Bloomingburg
Real Estate and Mortgage Overview in Bloomingburg
| Characteristic | Without Mortgage | With Mortgage |
| Housing Units | 10 | 39 |
| Median Property Value | - | - |
| Median Household Income | $50,625 | $5 |
| Monthly Housing Costs | $650 | $2 |
| Real Estate Taxes | $4,000 | $0 |
Property Value by Mortgage Status in Bloomingburg
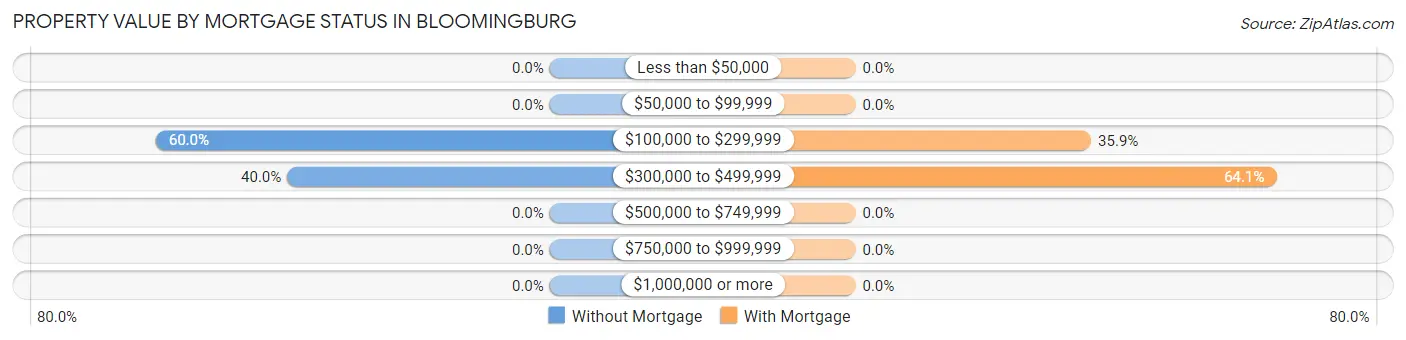
| Property Value | Without Mortgage | With Mortgage |
| Less than $50,000 | 0 (0.0%) | 0 (0.0%) |
| $50,000 to $99,999 | 0 (0.0%) | 0 (0.0%) |
| $100,000 to $299,999 | 6 (60.0%) | 14 (35.9%) |
| $300,000 to $499,999 | 4 (40.0%) | 25 (64.1%) |
| $500,000 to $749,999 | 0 (0.0%) | 0 (0.0%) |
| $750,000 to $999,999 | 0 (0.0%) | 0 (0.0%) |
| $1,000,000 or more | 0 (0.0%) | 0 (0.0%) |
| Total | 10 (100.0%) | 39 (100.0%) |
Household Income by Mortgage Status in Bloomingburg
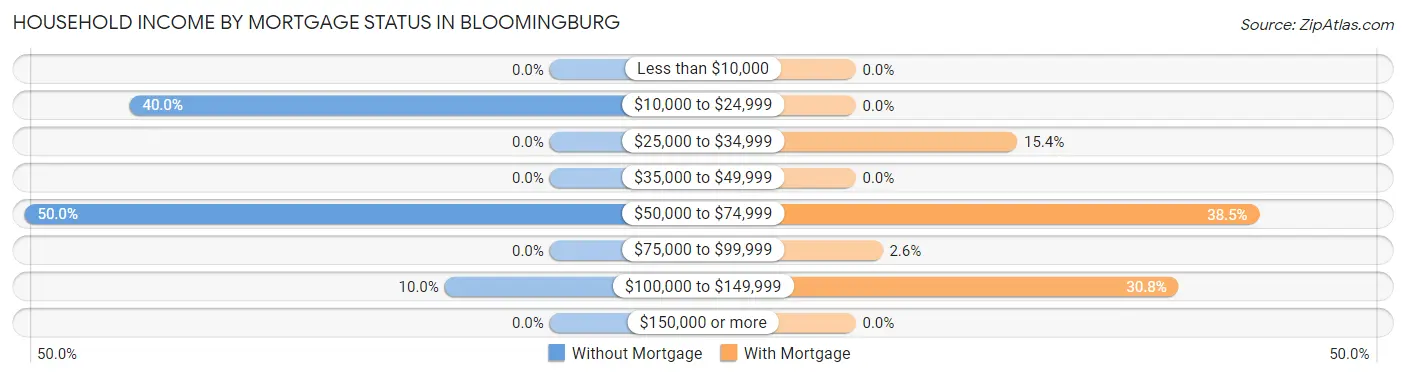
| Household Income | Without Mortgage | With Mortgage |
| Less than $10,000 | 0 (0.0%) | 0 (0.0%) |
| $10,000 to $24,999 | 4 (40.0%) | 0 (0.0%) |
| $25,000 to $34,999 | 0 (0.0%) | 6 (15.4%) |
| $35,000 to $49,999 | 0 (0.0%) | 0 (0.0%) |
| $50,000 to $74,999 | 5 (50.0%) | 15 (38.5%) |
| $75,000 to $99,999 | 0 (0.0%) | 1 (2.6%) |
| $100,000 to $149,999 | 1 (10.0%) | 12 (30.8%) |
| $150,000 or more | 0 (0.0%) | 0 (0.0%) |
| Total | 10 (100.0%) | 39 (100.0%) |
Property Value to Household Income Ratio in Bloomingburg
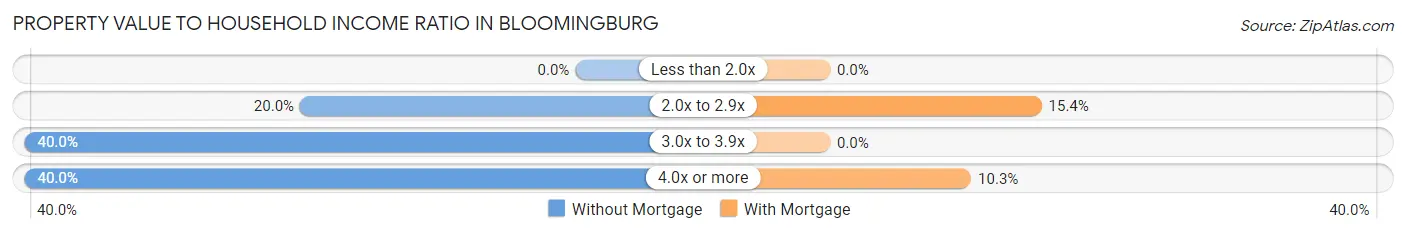
| Value-to-Income Ratio | Without Mortgage | With Mortgage |
| Less than 2.0x | 0 (0.0%) | 0 (0.0%) |
| 2.0x to 2.9x | 2 (20.0%) | 6 (15.4%) |
| 3.0x to 3.9x | 4 (40.0%) | 0 (0.0%) |
| 4.0x or more | 4 (40.0%) | 4 (10.3%) |
| Total | 10 (100.0%) | 39 (100.0%) |
Real Estate Taxes by Mortgage Status in Bloomingburg
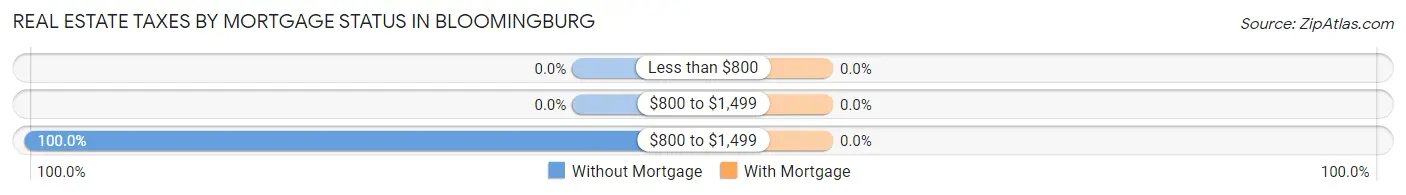
| Property Taxes | Without Mortgage | With Mortgage |
| Less than $800 | 0 (0.0%) | 0 (0.0%) |
| $800 to $1,499 | 0 (0.0%) | 0 (0.0%) |
| $800 to $1,499 | 10 (100.0%) | 0 (0.0%) |
| Total | 10 (100.0%) | 39 (100.0%) |
Health & Disability in Bloomingburg
Health Insurance Coverage by Age in Bloomingburg
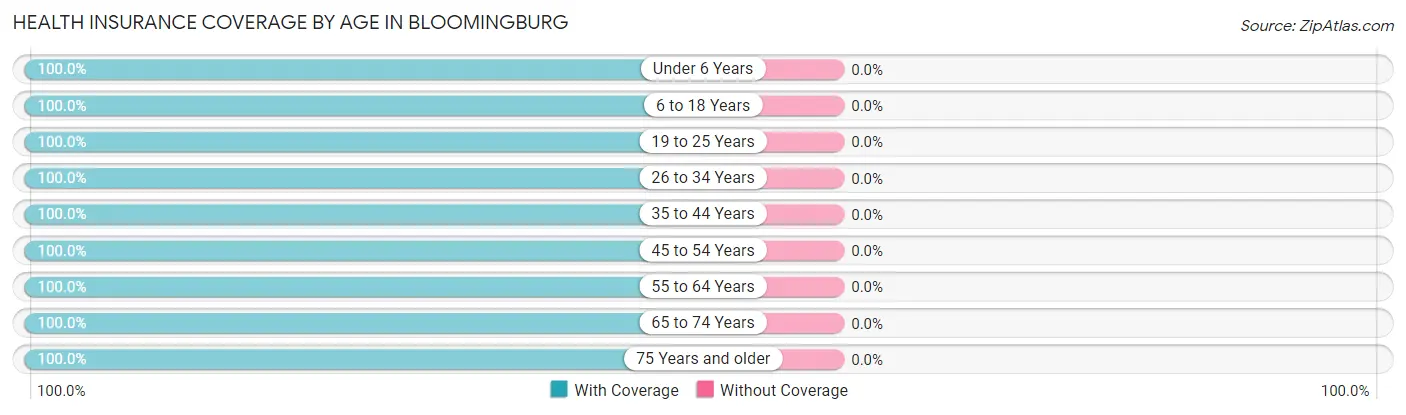
| Age Bracket | With Coverage | Without Coverage |
| Under 6 Years | 260 (100.0%) | 0 (0.0%) |
| 6 to 18 Years | 268 (100.0%) | 0 (0.0%) |
| 19 to 25 Years | 127 (100.0%) | 0 (0.0%) |
| 26 to 34 Years | 95 (100.0%) | 0 (0.0%) |
| 35 to 44 Years | 71 (100.0%) | 0 (0.0%) |
| 45 to 54 Years | 12 (100.0%) | 0 (0.0%) |
| 55 to 64 Years | 35 (100.0%) | 0 (0.0%) |
| 65 to 74 Years | 74 (100.0%) | 0 (0.0%) |
| 75 Years and older | 20 (100.0%) | 0 (0.0%) |
| Total | 962 (100.0%) | 0 (0.0%) |
Health Insurance Coverage by Citizenship Status in Bloomingburg
| Citizenship Status | With Coverage | Without Coverage |
| Native Born | 260 (100.0%) | 0 (0.0%) |
| Foreign Born, Citizen | 268 (100.0%) | 0 (0.0%) |
| Foreign Born, not a Citizen | 127 (100.0%) | 0 (0.0%) |
Health Insurance Coverage by Household Income in Bloomingburg
| Household Income | With Coverage | Without Coverage |
| Under $25,000 | 171 (100.0%) | 0 (0.0%) |
| $25,000 to $49,999 | 574 (100.0%) | 0 (0.0%) |
| $50,000 to $74,999 | 147 (100.0%) | 0 (0.0%) |
| $75,000 to $99,999 | 39 (100.0%) | 0 (0.0%) |
| $100,000 and over | 31 (100.0%) | 0 (0.0%) |
Public vs Private Health Insurance Coverage by Age in Bloomingburg
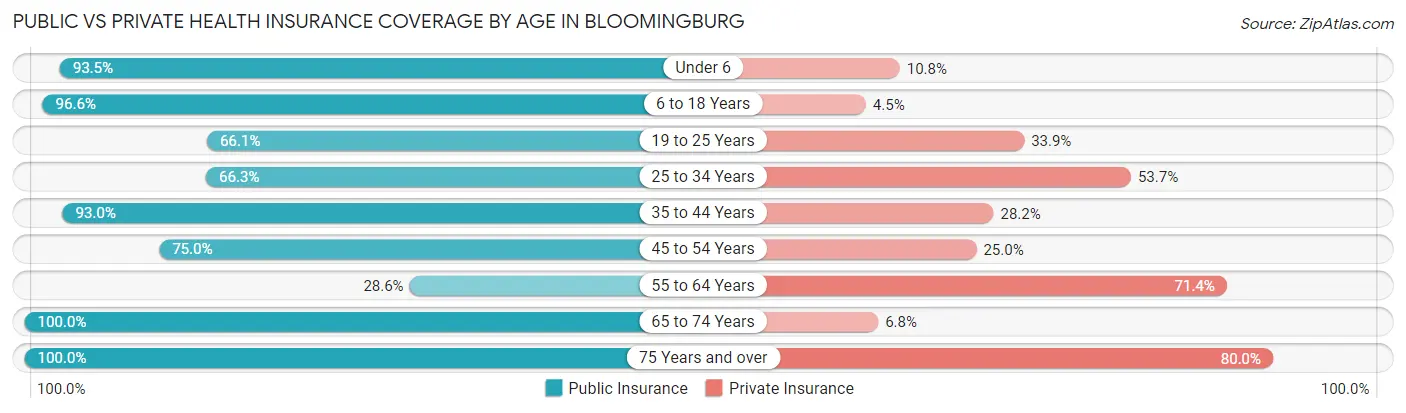
| Age Bracket | Public Insurance | Private Insurance |
| Under 6 | 243 (93.5%) | 28 (10.8%) |
| 6 to 18 Years | 259 (96.6%) | 12 (4.5%) |
| 19 to 25 Years | 84 (66.1%) | 43 (33.9%) |
| 25 to 34 Years | 63 (66.3%) | 51 (53.7%) |
| 35 to 44 Years | 66 (93.0%) | 20 (28.2%) |
| 45 to 54 Years | 9 (75.0%) | 3 (25.0%) |
| 55 to 64 Years | 10 (28.6%) | 25 (71.4%) |
| 65 to 74 Years | 74 (100.0%) | 5 (6.8%) |
| 75 Years and over | 20 (100.0%) | 16 (80.0%) |
| Total | 828 (86.1%) | 203 (21.1%) |
Disability Status by Sex by Age in Bloomingburg
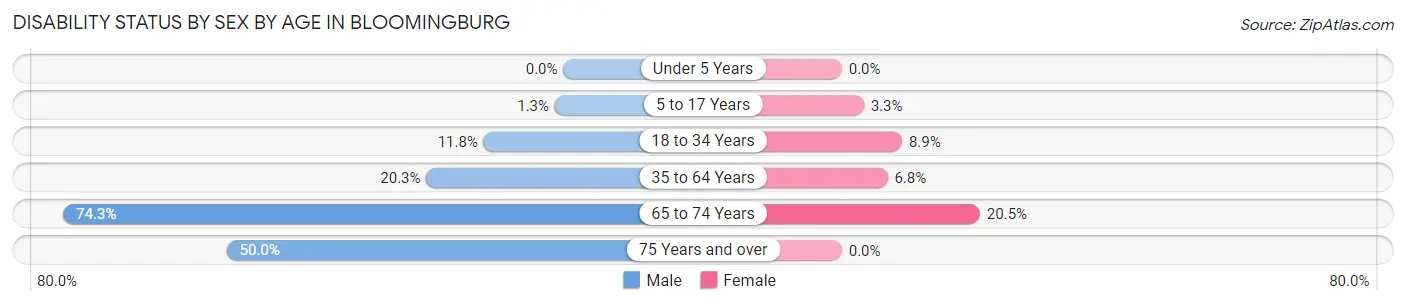
| Age Bracket | Male | Female |
| Under 5 Years | 0 (0.0%) | 0 (0.0%) |
| 5 to 17 Years | 2 (1.3%) | 4 (3.3%) |
| 18 to 34 Years | 13 (11.8%) | 10 (8.9%) |
| 35 to 64 Years | 12 (20.3%) | 4 (6.8%) |
| 65 to 74 Years | 26 (74.3%) | 8 (20.5%) |
| 75 Years and over | 4 (50.0%) | 0 (0.0%) |
Disability Class by Sex by Age in Bloomingburg
Disability Class: Hearing Difficulty
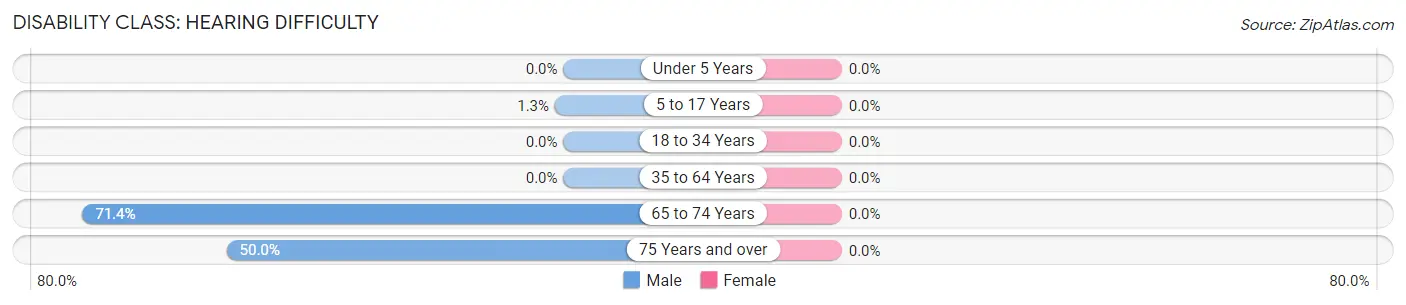
| Age Bracket | Male | Female |
| Under 5 Years | 0 (0.0%) | 0 (0.0%) |
| 5 to 17 Years | 2 (1.3%) | 0 (0.0%) |
| 18 to 34 Years | 0 (0.0%) | 0 (0.0%) |
| 35 to 64 Years | 0 (0.0%) | 0 (0.0%) |
| 65 to 74 Years | 25 (71.4%) | 0 (0.0%) |
| 75 Years and over | 4 (50.0%) | 0 (0.0%) |
Disability Class: Vision Difficulty
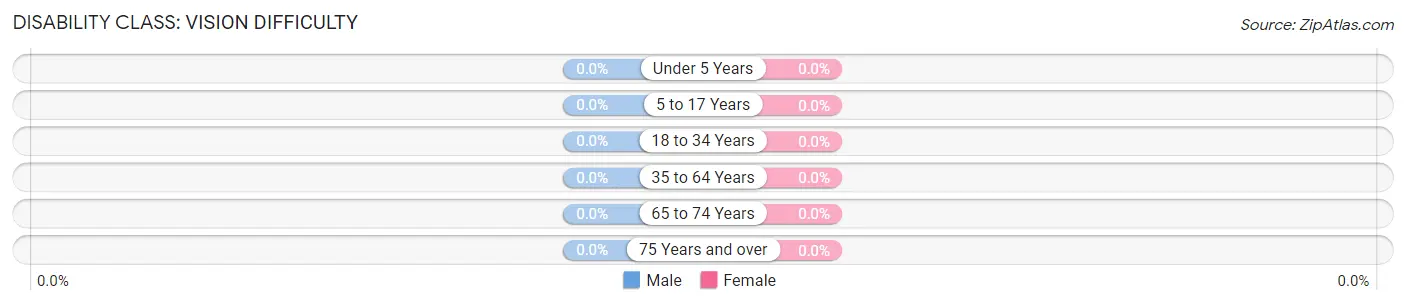
| Age Bracket | Male | Female |
| Under 5 Years | 0 (0.0%) | 0 (0.0%) |
| 5 to 17 Years | 0 (0.0%) | 0 (0.0%) |
| 18 to 34 Years | 0 (0.0%) | 0 (0.0%) |
| 35 to 64 Years | 0 (0.0%) | 0 (0.0%) |
| 65 to 74 Years | 0 (0.0%) | 0 (0.0%) |
| 75 Years and over | 0 (0.0%) | 0 (0.0%) |
Disability Class: Cognitive Difficulty
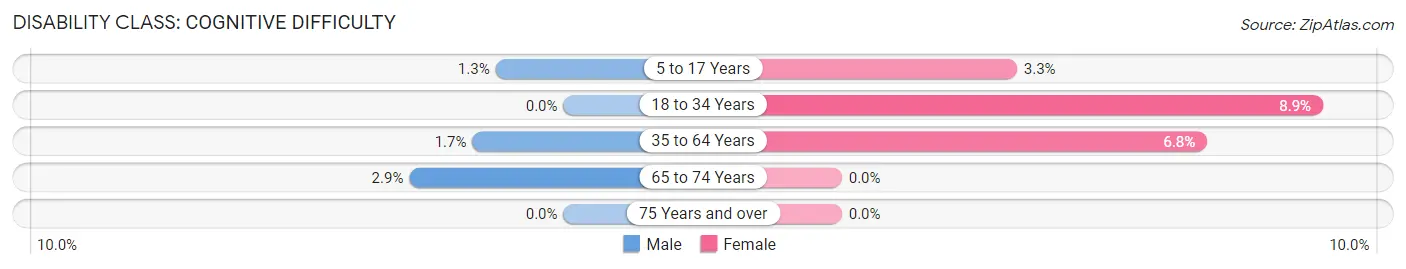
| Age Bracket | Male | Female |
| 5 to 17 Years | 2 (1.3%) | 4 (3.3%) |
| 18 to 34 Years | 0 (0.0%) | 10 (8.9%) |
| 35 to 64 Years | 1 (1.7%) | 4 (6.8%) |
| 65 to 74 Years | 1 (2.9%) | 0 (0.0%) |
| 75 Years and over | 0 (0.0%) | 0 (0.0%) |
Disability Class: Ambulatory Difficulty
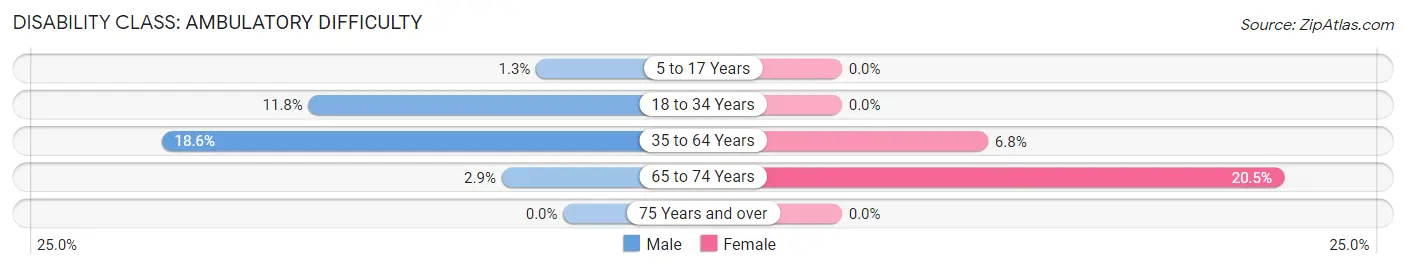
| Age Bracket | Male | Female |
| 5 to 17 Years | 2 (1.3%) | 0 (0.0%) |
| 18 to 34 Years | 13 (11.8%) | 0 (0.0%) |
| 35 to 64 Years | 11 (18.6%) | 4 (6.8%) |
| 65 to 74 Years | 1 (2.9%) | 8 (20.5%) |
| 75 Years and over | 0 (0.0%) | 0 (0.0%) |
Disability Class: Self-Care Difficulty
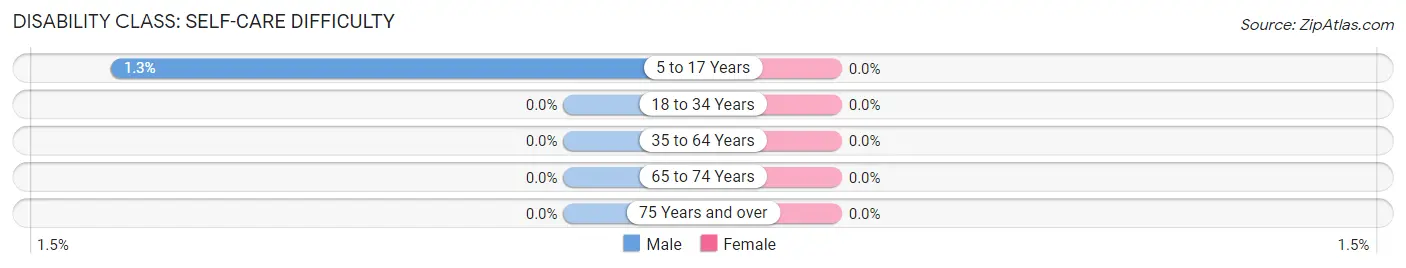
| Age Bracket | Male | Female |
| 5 to 17 Years | 2 (1.3%) | 0 (0.0%) |
| 18 to 34 Years | 0 (0.0%) | 0 (0.0%) |
| 35 to 64 Years | 0 (0.0%) | 0 (0.0%) |
| 65 to 74 Years | 0 (0.0%) | 0 (0.0%) |
| 75 Years and over | 0 (0.0%) | 0 (0.0%) |
Technology Access in Bloomingburg
Computing Device Access in Bloomingburg
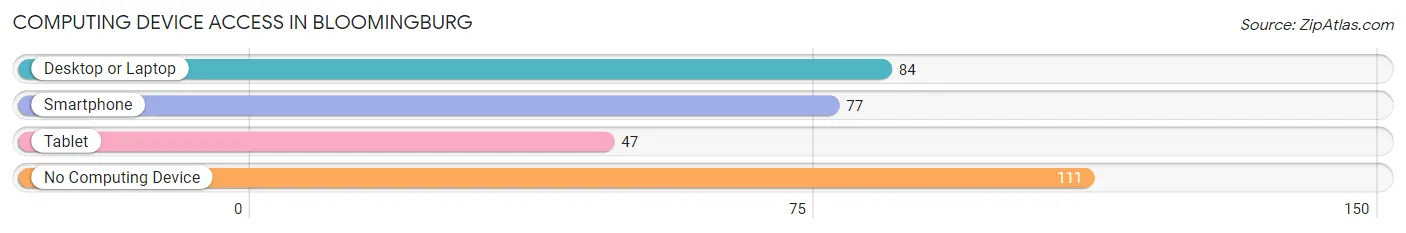
| Device Type | # Households | % Households |
| Desktop or Laptop | 84 | 37.8% |
| Smartphone | 77 | 34.7% |
| Tablet | 47 | 21.2% |
| No Computing Device | 111 | 50.0% |
| Total | 222 | 100.0% |
Internet Access in Bloomingburg
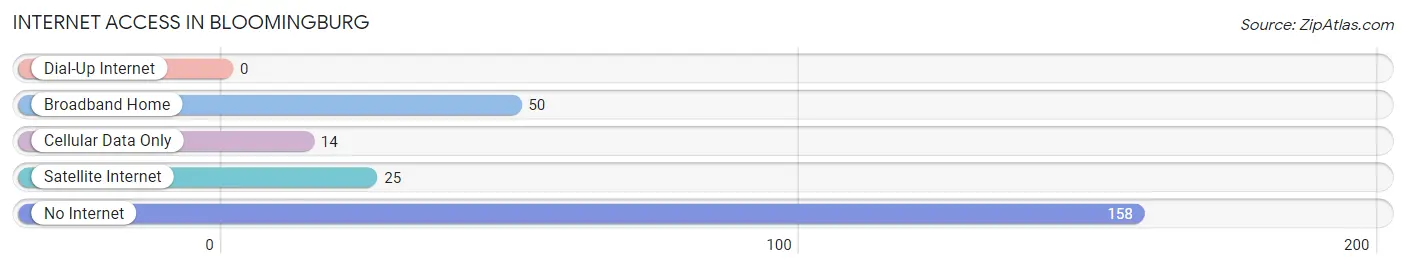
| Internet Type | # Households | % Households |
| Dial-Up Internet | 0 | 0.0% |
| Broadband Home | 50 | 22.5% |
| Cellular Data Only | 14 | 6.3% |
| Satellite Internet | 25 | 11.3% |
| No Internet | 158 | 71.2% |
| Total | 222 | 100.0% |
Bloomingburg Summary
Bloomingburg, New York is a small village located in the Town of Mamakating in Sullivan County, New York. The village is situated in the foothills of the Shawangunk Mountains, approximately 70 miles northwest of New York City. The village has a population of approximately 400 people and covers an area of 0.6 square miles.
History
The area that is now Bloomingburg was first settled in the late 1700s by Dutch and German immigrants. The village was originally known as “Mamakating Flats” and was part of the Town of Mamakating. In 1845, the village was renamed “Bloomingburg” after the local Bloomingburg Hotel. The hotel was built in 1844 by John Bloom, a local businessman.
In the late 1800s, Bloomingburg was a popular destination for tourists and vacationers. The village was home to several hotels, including the Bloomingburg Hotel, the Mamakating House, and the Mountain House. The village also had several stores, a post office, a blacksmith shop, and a school.
In the early 1900s, the village began to decline as the popularity of the area as a tourist destination waned. The village was also affected by the Great Depression and World War II. In the 1950s, the village began to experience a resurgence as new businesses opened and the population began to grow.
Geography
Bloomingburg is located in the foothills of the Shawangunk Mountains in Sullivan County, New York. The village is situated at an elevation of 1,000 feet and covers an area of 0.6 square miles. The village is bordered by the Town of Mamakating to the north, the Town of Wawarsing to the east, the Town of Crawford to the south, and the Town of Deerpark to the west.
The village is located approximately 70 miles northwest of New York City and is accessible via Interstate 84 and State Route 17. The nearest major airport is Stewart International Airport, located approximately 30 miles away in Newburgh, New York.
Economy
The economy of Bloomingburg is largely based on tourism and agriculture. The village is home to several small businesses, including restaurants, shops, and a bed and breakfast. The village is also home to several farms, which produce a variety of fruits and vegetables.
The village is also home to several manufacturing companies, including a furniture manufacturer and a plastics manufacturer. The village is also home to a small airport, which is used for private and corporate flights.
Demographics
As of the 2010 census, the population of Bloomingburg was 400. The racial makeup of the village was 94.3% White, 2.3% African American, 0.5% Native American, 0.8% Asian, and 2.0% from other races. The median household income was $45,833 and the median family income was $50,000.
The village is home to several churches, including the Bloomingburg United Methodist Church, the Bloomingburg Presbyterian Church, and the Bloomingburg Baptist Church. The village is also home to a public library and a volunteer fire department.
Common Questions
What is Per Capita Income in Bloomingburg?
Per Capita income in Bloomingburg is $10,922.
What is the Median Family Income in Bloomingburg?
Median Family Income in Bloomingburg is $46,719.
What is the Median Household income in Bloomingburg?
Median Household Income in Bloomingburg is $42,500.
What is Income or Wage Gap in Bloomingburg?
Income or Wage Gap in Bloomingburg is 52.4%.
Women in Bloomingburg earn 47.6 cents for every dollar earned by a man.
What is Family Income Deficit in Bloomingburg?
Family Income Deficit in Bloomingburg is $15,725.
Families that are below poverty line in Bloomingburg earn $15,725 less on average than the poverty threshold level.
What is Inequality or Gini Index in Bloomingburg?
Inequality or Gini Index in Bloomingburg is 0.33.
What is the Total Population of Bloomingburg?
Total Population of Bloomingburg is 962.
What is the Total Male Population of Bloomingburg?
Total Male Population of Bloomingburg is 473.
What is the Total Female Population of Bloomingburg?
Total Female Population of Bloomingburg is 489.
What is the Ratio of Males per 100 Females in Bloomingburg?
There are 96.73 Males per 100 Females in Bloomingburg.
What is the Ratio of Females per 100 Males in Bloomingburg?
There are 103.38 Females per 100 Males in Bloomingburg.
What is the Median Population Age in Bloomingburg?
Median Population Age in Bloomingburg is 15.0 Years.
What is the Average Family Size in Bloomingburg
Average Family Size in Bloomingburg is 5.8 People.
What is the Average Household Size in Bloomingburg
Average Household Size in Bloomingburg is 4.3 People.
How Large is the Labor Force in Bloomingburg?
There are 245 People in the Labor Forcein in Bloomingburg.
What is the Percentage of People in the Labor Force in Bloomingburg?
54.7% of People are in the Labor Force in Bloomingburg.
What is the Unemployment Rate in Bloomingburg?
Unemployment Rate in Bloomingburg is 3.7%.