Zip Codes with the Highest Poverty Level Among Children Under the Age of 5 in New York, NY

RELATED REPORTS & OPTIONS

Highest Poverty | Child 0-5
Population
Families and Households
Female Fertility
Female Fertility (Unmarried)
Race (Community Size)
Race (Percentage)
Ancestry (Community Size)
AfghanAfricanAlbanianAlsatianAmericanApacheArabArgentineanArmenianAssyrian / Chaldean / SyriacAustralianAustrianBahamianBarbadianBasqueBelgianBelizeanBermudanBhutaneseBlackfeetBolivianBrazilianBritishBritish West IndianBulgarianBurmeseCajunCambodianCanadianCape VerdeanCarpatho RusynCelticCentral AmericanCentral American IndianCherokeeChickasawChileanChippewaChoctawColombianCosta RicanCreekCroatianCubanCypriotCzechCzechoslovakianDanishDelawareDominicanDutchDutch West IndianEastern EuropeanEcuadorianEgyptianEnglishEstonianEthiopianEuropeanFilipinoFinnishFrenchFrench American IndianFrench CanadianGermanGhanaianGreekGuamanian / ChamorroGuatemalanGuyaneseHaitianHmongHonduranHungarianIcelanderIndian (Asian)IndonesianIranianIraqiIrishIroquoisIsraeliItalianJamaicanJapaneseJordanianKenyanKoreanLaotianLatvianLebaneseLiberianLithuanianLuxembourgerMacedonianMalaysianMalteseMexicanMexican American IndianMongolianMoroccanNative HawaiianNew ZealanderNicaraguanNigerianNorthern EuropeanNorwegianOkinawanPakistaniPalestinianPanamanianParaguayanPennsylvania GermanPeruvianPolishPortuguesePuebloPuerto RicanRomanianRussianSalvadoranSamoanScandinavianScotch-IrishScottishSenegaleseSerbianSierra LeoneanSiouxSlavicSlovakSloveneSomaliSouth AfricanSouth AmericanSouth American IndianSoviet UnionSpaniardSpanishSpanish AmericanSpanish American IndianSri LankanSubsaharan AfricanSudaneseSwedishSwissSyrianThaiTrinidadian and TobagonianTurkishU.S. Virgin IslanderUgandanUkrainianUruguayanVenezuelanVietnameseWelshWest IndianYugoslavianZimbabwean
Ancestry (Percentage)
AfghanAfricanAlbanianAlsatianAmericanApacheArabArgentineanArmenianAssyrian / Chaldean / SyriacAustralianAustrianBahamianBarbadianBasqueBelgianBelizeanBermudanBhutaneseBlackfeetBolivianBrazilianBritishBritish West IndianBulgarianBurmeseCajunCambodianCanadianCape VerdeanCarpatho RusynCelticCentral AmericanCentral American IndianCherokeeChickasawChileanChippewaChoctawColombianCosta RicanCreekCroatianCubanCypriotCzechCzechoslovakianDanishDelawareDominicanDutchDutch West IndianEastern EuropeanEcuadorianEgyptianEnglishEstonianEthiopianEuropeanFilipinoFinnishFrenchFrench American IndianFrench CanadianGermanGhanaianGreekGuamanian / ChamorroGuatemalanGuyaneseHaitianHmongHonduranHungarianIcelanderIndian (Asian)IndonesianIranianIraqiIrishIroquoisIsraeliItalianJamaicanJapaneseJordanianKenyanKoreanLaotianLatvianLebaneseLiberianLithuanianLuxembourgerMacedonianMalaysianMalteseMexicanMexican American IndianMongolianMoroccanNative HawaiianNew ZealanderNicaraguanNigerianNorthern EuropeanNorwegianOkinawanPakistaniPalestinianPanamanianParaguayanPennsylvania GermanPeruvianPolishPortuguesePuebloPuerto RicanRomanianRussianSalvadoranSamoanScandinavianScotch-IrishScottishSenegaleseSerbianSierra LeoneanSiouxSlavicSlovakSloveneSomaliSouth AfricanSouth AmericanSouth American IndianSoviet UnionSpaniardSpanishSpanish AmericanSpanish American IndianSri LankanSubsaharan AfricanSudaneseSwedishSwissSyrianThaiTrinidadian and TobagonianTurkishU.S. Virgin IslanderUgandanUkrainianUruguayanVenezuelanVietnameseWelshWest IndianYugoslavianZimbabwean
Immigrant Origin (Total)
AfghanistanAfricaAlbaniaArgentinaArmeniaAsiaAustraliaAustriaBahamasBangladeshBarbadosBelarusBelgiumBelizeBoliviaBosnia and HerzegovinaBrazilBulgariaBurma / MyanmarCambodiaCameroonCanadaCaribbeanCentral AmericaChileChinaColombiaCongoCosta RicaCroatiaCubaCzechoslovakiaDenmarkDominicaDominican RepublicEastern AfricaEastern AsiaEastern EuropeEcuadorEgyptEl SalvadorEnglandEritreaEthiopiaEuropeFranceGermanyGhanaGreeceGrenadaGuatemalaGuyanaHaitiHondurasHong KongHungaryIndiaIndonesiaIranIraqIrelandIsraelItalyJamaicaJapanJordanKazakhstanKenyaKoreaKuwaitLatin AmericaLatviaLebanonLiberiaLithuaniaMalaysiaMexicoMiddle AfricaMoldovaMoroccoNepalNetherlandsNicaraguaNigeriaNorth MacedoniaNorthern AfricaNorthern EuropeNorwayOceaniaPakistanPanamaPeruPhilippinesPolandPortugalRomaniaRussiaSaudi ArabiaScotlandSenegalSerbiaSierra LeoneSingaporeSomaliaSouth AfricaSouth AmericaSouth Central AsiaSouth Eastern AsiaSouthern EuropeSpainSri LankaSt. Vincent and the GrenadinesSudanSwedenSwitzerlandSyriaTaiwanThailandTrinidad and TobagoTurkeyUgandaUkraineUruguayUzbekistanVenezuelaVietnamWest IndiesWestern AfricaWestern AsiaWestern EuropeYemenZaireZimbabwe
Immigrant Origin (Percentage)
AfghanistanAfricaAlbaniaArgentinaArmeniaAsiaAustraliaAustriaBahamasBangladeshBarbadosBelarusBelgiumBelizeBoliviaBosnia and HerzegovinaBrazilBulgariaBurma / MyanmarCambodiaCameroonCanadaCaribbeanCentral AmericaChileChinaColombiaCongoCosta RicaCroatiaCubaCzechoslovakiaDenmarkDominicaDominican RepublicEastern AfricaEastern AsiaEastern EuropeEcuadorEgyptEl SalvadorEnglandEritreaEthiopiaEuropeFranceGermanyGhanaGreeceGrenadaGuatemalaGuyanaHaitiHondurasHong KongHungaryIndiaIndonesiaIranIraqIrelandIsraelItalyJamaicaJapanJordanKazakhstanKenyaKoreaKuwaitLatin AmericaLatviaLebanonLiberiaLithuaniaMalaysiaMexicoMiddle AfricaMoldovaMoroccoNepalNetherlandsNicaraguaNigeriaNorth MacedoniaNorthern AfricaNorthern EuropeNorwayOceaniaPakistanPanamaPeruPhilippinesPolandPortugalRomaniaRussiaSaudi ArabiaScotlandSenegalSerbiaSierra LeoneSingaporeSomaliaSouth AfricaSouth AmericaSouth Central AsiaSouth Eastern AsiaSouthern EuropeSpainSri LankaSt. Vincent and the GrenadinesSudanSwedenSwitzerlandSyriaTaiwanThailandTrinidad and TobagoTurkeyUgandaUkraineUruguayUzbekistanVenezuelaVietnamWest IndiesWestern AfricaWestern AsiaWestern EuropeYemenZaireZimbabwe
Income
Income (Families)
Income (Households)
Poverty
Poverty (Families)
Unemployment
Employment Occupations
Employment Industries
Employer Class
Commute Time
Commute Means
School Enrollment
Education by Degree Field
Occupancy
Finances
Physical Characteristics
New York
Compare Zip Codes
Comparison Subject

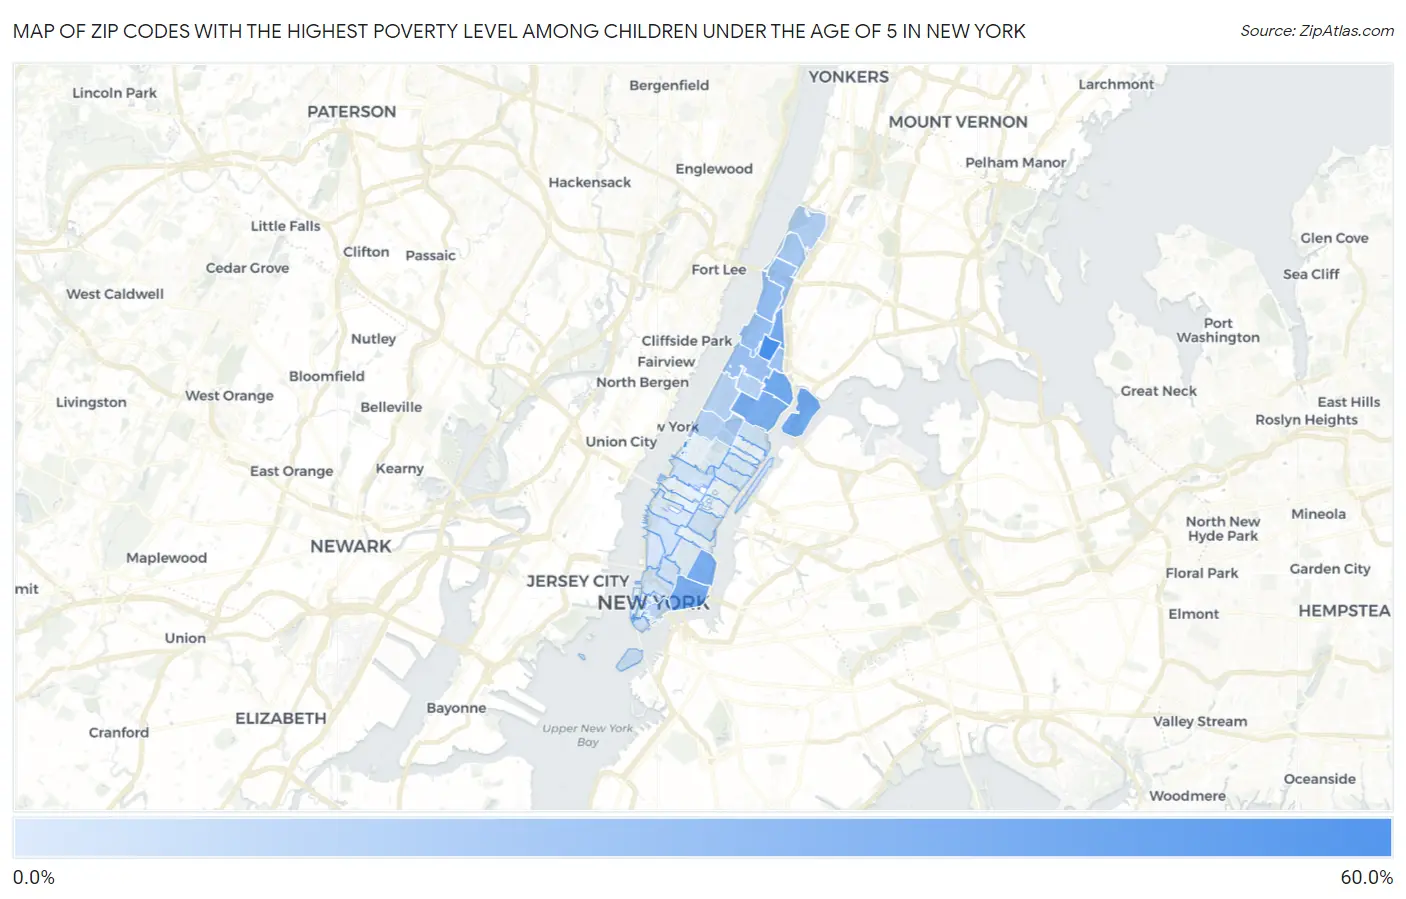
Map of Zip Codes with the Highest Poverty Level Among Children Under the Age of 5 in New York

0.0%
60.0%
Zip Codes with the Highest Poverty Level Among Children Under the Age of 5 in New York Map

Zip Codes with the Highest Poverty Level Among Children Under the Age of 5 in New York, NY

Zip Code Child Poverty vs State vs National
1.1003057.6%18.7%(+38.9)#5618.1%(+39.6)#1,857
2.1006950.3%18.7%(+31.5)#9718.1%(+32.2)#2,498
3.1003538.2%18.7%(+19.5)#17818.1%(+20.2)#4,357
4.1003937.9%18.7%(+19.1)#18518.1%(+19.8)#4,435
5.1000935.3%18.7%(+16.5)#20718.1%(+17.2)#5,015
6.1000235.3%18.7%(+16.5)#20818.1%(+17.2)#5,016
7.1002934.4%18.7%(+15.7)#21818.1%(+16.4)#5,200
8.1003225.8%18.7%(+7.06)#32418.1%(+7.74)#7,712
9.1003123.7%18.7%(+4.96)#34918.1%(+5.65)#8,484
10.1002722.7%18.7%(+3.98)#37218.1%(+4.67)#8,866
11.1003322.2%18.7%(+3.42)#39218.1%(+4.11)#9,126
12.1003721.5%18.7%(+2.79)#40518.1%(+3.48)#9,366
13.1004018.0%18.7%(-0.751)#47918.1%(-0.066)#10,959
14.1003414.9%18.7%(-3.84)#55718.1%(-3.16)#12,520
15.1002513.6%18.7%(-5.14)#59718.1%(-4.45)#13,264
16.1002413.6%18.7%(-5.17)#60018.1%(-4.49)#13,286
17.1002612.7%18.7%(-6.07)#62418.1%(-5.39)#13,814
18.1003811.1%18.7%(-7.61)#66118.1%(-6.92)#14,731
19.100046.2%18.7%(-12.5)#83418.1%(-11.8)#17,890
20.101286.0%18.7%(-12.7)#84818.1%(-12.0)#18,066
21.100165.5%18.7%(-13.3)#87518.1%(-12.6)#18,459
22.100125.3%18.7%(-13.5)#88518.1%(-12.8)#18,585
23.100115.0%18.7%(-13.8)#89718.1%(-13.1)#18,778
24.100135.0%18.7%(-13.8)#90118.1%(-13.1)#18,792
25.100444.6%18.7%(-14.2)#91918.1%(-13.5)#19,055
26.100194.5%18.7%(-14.2)#92018.1%(-13.5)#19,072
27.100654.1%18.7%(-14.7)#94018.1%(-14.0)#19,441
28.100213.1%18.7%(-15.6)#96618.1%(-14.9)#20,067
29.100143.0%18.7%(-15.8)#97218.1%(-15.1)#20,194
30.100011.9%18.7%(-16.9)#1,02118.1%(-16.2)#20,914
31.100031.1%18.7%(-17.6)#1,04318.1%(-16.9)#21,322

Common Questions

What are the Top 10 Zip Codes with the Highest Poverty Level Among Children Under the Age of 5 in New York, NY?
Top 10 Zip Codes with the Highest Poverty Level Among Children Under the Age of 5 in New York, NY are:
#1
57.6%
#2
50.3%
#3
38.2%
#4
37.9%
#5
35.3%
#6
35.3%
#7
34.4%
#8
25.8%
#9
23.7%
#10
22.7%
What zip code has the Highest Poverty Level Among Children Under the Age of 5 in New York, NY?
10030 has the Highest Poverty Level Among Children Under the Age of 5 in New York, NY with 57.6%.
What is the Poverty Level Among Children Under the Age of 5 in New York, NY?
Poverty Level Among Children Under the Age of 5 in New York is 22.1%.
What is the Poverty Level Among Children Under the Age of 5 in New York?
Poverty Level Among Children Under the Age of 5 in New York is 18.7%.
What is the Poverty Level Among Children Under the Age of 5 in the United States?
Poverty Level Among Children Under the Age of 5 in the United States is 18.1%.