Zip Codes with the Highest Poverty Level Among Children Under the Age of 5 in New York
RELATED REPORTS & OPTIONS
Highest Poverty | Child 0-5
New York
Compare Zip Codes
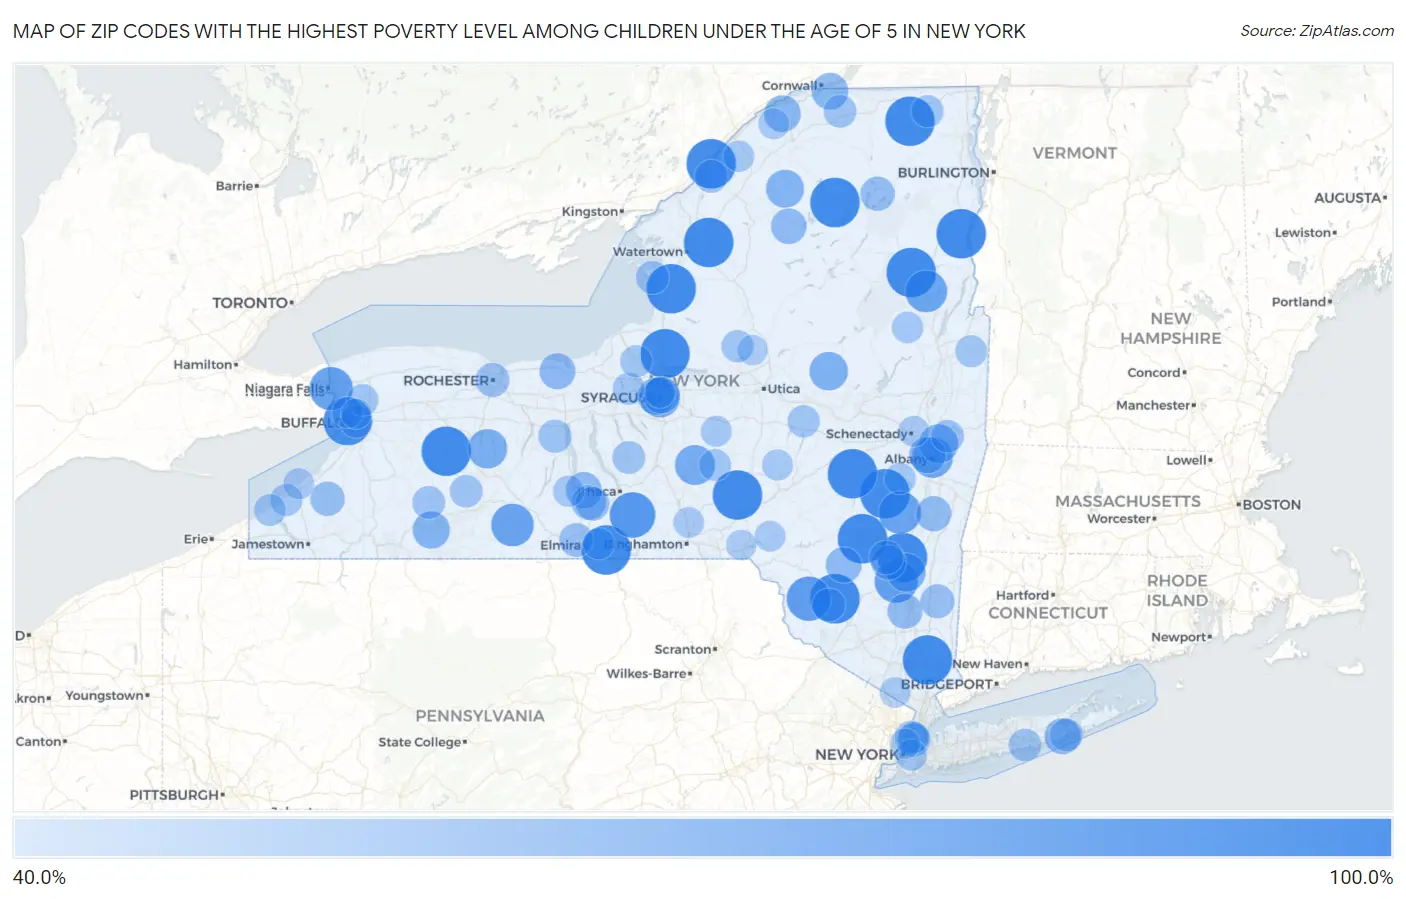
Map of Zip Codes with the Highest Poverty Level Among Children Under the Age of 5 in New York
40.0%
100.0%
Zip Codes with the Highest Poverty Level Among Children Under the Age of 5 in New York
| Zip Code | Child Poverty | vs State | vs National | |
| 1. | 12733 | 100.0% | 18.7%(+81.3)#1 | 18.1%(+81.9)#28 |
| 2. | 12956 | 100.0% | 18.7%(+81.3)#2 | 18.1%(+81.9)#65 |
| 3. | 13780 | 100.0% | 18.7%(+81.3)#3 | 18.1%(+81.9)#110 |
| 4. | 14825 | 100.0% | 18.7%(+81.3)#4 | 18.1%(+81.9)#142 |
| 5. | 12857 | 100.0% | 18.7%(+81.3)#5 | 18.1%(+81.9)#148 |
| 6. | 12475 | 100.0% | 18.7%(+81.3)#6 | 18.1%(+81.9)#249 |
| 7. | 14549 | 100.0% | 18.7%(+81.3)#7 | 18.1%(+81.9)#282 |
| 8. | 12955 | 100.0% | 18.7%(+81.3)#9 | 18.1%(+81.9)#313 |
| 9. | 13614 | 100.0% | 18.7%(+81.3)#10 | 18.1%(+81.9)#314 |
| 10. | 12480 | 100.0% | 18.7%(+81.3)#11 | 18.1%(+81.9)#321 |
| 11. | 13103 | 100.0% | 18.7%(+81.3)#12 | 18.1%(+81.9)#389 |
| 12. | 12460 | 100.0% | 18.7%(+81.3)#13 | 18.1%(+81.9)#396 |
| 13. | 10535 | 100.0% | 18.7%(+81.3)#14 | 18.1%(+81.9)#399 |
| 14. | 12194 | 100.0% | 18.7%(+81.3)#15 | 18.1%(+81.9)#439 |
| 15. | 12973 | 100.0% | 18.7%(+81.3)#16 | 18.1%(+81.9)#449 |
| 16. | 13674 | 100.0% | 18.7%(+81.3)#17 | 18.1%(+81.9)#478 |
| 17. | 13643 | 100.0% | 18.7%(+81.3)#18 | 18.1%(+81.9)#538 |
| 18. | 14201 | 96.2% | 18.7%(+77.5)#19 | 18.1%(+78.2)#569 |
| 19. | 13864 | 89.8% | 18.7%(+71.1)#20 | 18.1%(+71.8)#641 |
| 20. | 12783 | 86.1% | 18.7%(+67.3)#21 | 18.1%(+68.0)#687 |
| 21. | 14301 | 83.6% | 18.7%(+64.9)#22 | 18.1%(+65.5)#735 |
| 22. | 12472 | 83.3% | 18.7%(+64.6)#23 | 18.1%(+65.3)#741 |
| 23. | 14819 | 81.6% | 18.7%(+62.8)#24 | 18.1%(+63.5)#778 |
| 24. | 12413 | 81.3% | 18.7%(+62.6)#25 | 18.1%(+63.3)#784 |
| 25. | 12860 | 80.0% | 18.7%(+61.3)#26 | 18.1%(+61.9)#818 |
| 26. | 12207 | 76.8% | 18.7%(+58.1)#27 | 18.1%(+58.8)#903 |
| 27. | 13202 | 75.1% | 18.7%(+56.3)#28 | 18.1%(+57.0)#951 |
| 28. | 13136 | 75.0% | 18.7%(+56.3)#29 | 18.1%(+56.9)#968 |
| 29. | 14435 | 73.2% | 18.7%(+54.5)#30 | 18.1%(+55.2)#1,041 |
| 30. | 12183 | 72.4% | 18.7%(+53.6)#31 | 18.1%(+54.3)#1,071 |
| 31. | 12466 | 71.3% | 18.7%(+52.5)#32 | 18.1%(+53.2)#1,106 |
| 32. | 13470 | 71.1% | 18.7%(+52.3)#33 | 18.1%(+53.0)#1,113 |
| 33. | 13684 | 69.4% | 18.7%(+50.7)#34 | 18.1%(+51.4)#1,174 |
| 34. | 14739 | 67.6% | 18.7%(+48.8)#35 | 18.1%(+49.5)#1,247 |
| 35. | 13204 | 67.5% | 18.7%(+48.8)#36 | 18.1%(+49.5)#1,253 |
| 36. | 13203 | 67.0% | 18.7%(+48.2)#37 | 18.1%(+48.9)#1,272 |
| 37. | 13655 | 66.3% | 18.7%(+47.6)#38 | 18.1%(+48.3)#1,327 |
| 38. | 13621 | 66.3% | 18.7%(+47.6)#39 | 18.1%(+48.2)#1,329 |
| 39. | 12206 | 66.1% | 18.7%(+47.4)#40 | 18.1%(+48.1)#1,335 |
| 40. | 14818 | 64.3% | 18.7%(+45.5)#41 | 18.1%(+46.2)#1,425 |
| 41. | 11959 | 64.3% | 18.7%(+45.5)#42 | 18.1%(+46.2)#1,428 |
| 42. | 14551 | 64.2% | 18.7%(+45.5)#43 | 18.1%(+46.1)#1,438 |
| 43. | 12725 | 64.0% | 18.7%(+45.3)#44 | 18.1%(+45.9)#1,452 |
| 44. | 13690 | 63.3% | 18.7%(+44.6)#45 | 18.1%(+45.3)#1,483 |
| 45. | 12172 | 62.5% | 18.7%(+43.8)#46 | 18.1%(+44.4)#1,535 |
| 46. | 12547 | 61.9% | 18.7%(+43.2)#47 | 18.1%(+43.9)#1,558 |
| 47. | 12491 | 60.9% | 18.7%(+42.2)#48 | 18.1%(+42.9)#1,627 |
| 48. | 14869 | 60.3% | 18.7%(+41.5)#49 | 18.1%(+42.2)#1,658 |
| 49. | 14138 | 60.2% | 18.7%(+41.5)#50 | 18.1%(+42.2)#1,662 |
| 50. | 12945 | 60.0% | 18.7%(+41.3)#51 | 18.1%(+41.9)#1,690 |
| 51. | 12433 | 59.3% | 18.7%(+40.6)#52 | 18.1%(+41.3)#1,742 |
| 52. | 14805 | 59.3% | 18.7%(+40.5)#53 | 18.1%(+41.2)#1,748 |
| 53. | 14608 | 59.2% | 18.7%(+40.5)#54 | 18.1%(+41.2)#1,752 |
| 54. | 12585 | 59.1% | 18.7%(+40.3)#55 | 18.1%(+41.0)#1,761 |
| 55. | 14903 | 58.8% | 18.7%(+40.1)#56 | 18.1%(+40.8)#1,777 |
| 56. | 10030 | 57.6% | 18.7%(+38.9)#57 | 18.1%(+39.6)#1,857 |
| 57. | 10454 | 57.5% | 18.7%(+38.8)#58 | 18.1%(+39.5)#1,862 |
| 58. | 12751 | 57.5% | 18.7%(+38.7)#59 | 18.1%(+39.4)#1,865 |
| 59. | 14463 | 57.1% | 18.7%(+38.4)#60 | 18.1%(+39.1)#1,893 |
| 60. | 14212 | 57.1% | 18.7%(+38.4)#61 | 18.1%(+39.1)#1,898 |
| 61. | 13646 | 57.0% | 18.7%(+38.3)#62 | 18.1%(+38.9)#1,906 |
| 62. | 13650 | 56.9% | 18.7%(+38.2)#63 | 18.1%(+38.9)#1,915 |
| 63. | 11942 | 56.5% | 18.7%(+37.7)#64 | 18.1%(+38.4)#1,951 |
| 64. | 13092 | 56.2% | 18.7%(+37.5)#65 | 18.1%(+38.2)#1,965 |
| 65. | 14717 | 56.2% | 18.7%(+37.5)#66 | 18.1%(+38.2)#1,968 |
| 66. | 12182 | 56.1% | 18.7%(+37.3)#67 | 18.1%(+38.0)#1,980 |
| 67. | 12957 | 56.0% | 18.7%(+37.3)#68 | 18.1%(+37.9)#1,987 |
| 68. | 14822 | 55.8% | 18.7%(+37.0)#69 | 18.1%(+37.7)#2,006 |
| 69. | 11713 | 55.7% | 18.7%(+37.0)#70 | 18.1%(+37.7)#2,008 |
| 70. | 12935 | 54.9% | 18.7%(+36.2)#71 | 18.1%(+36.8)#2,077 |
| 71. | 13303 | 54.5% | 18.7%(+35.8)#72 | 18.1%(+36.5)#2,100 |
| 72. | 13361 | 54.5% | 18.7%(+35.8)#73 | 18.1%(+36.5)#2,102 |
| 73. | 13112 | 54.4% | 18.7%(+35.7)#74 | 18.1%(+36.4)#2,107 |
| 74. | 13135 | 54.4% | 18.7%(+35.6)#75 | 18.1%(+36.3)#2,113 |
| 75. | 14716 | 54.3% | 18.7%(+35.6)#76 | 18.1%(+36.3)#2,116 |
| 76. | 12838 | 54.1% | 18.7%(+35.3)#77 | 18.1%(+36.0)#2,138 |
| 77. | 13844 | 53.8% | 18.7%(+35.1)#78 | 18.1%(+35.8)#2,156 |
| 78. | 14787 | 53.7% | 18.7%(+34.9)#79 | 18.1%(+35.6)#2,174 |
| 79. | 14068 | 53.7% | 18.7%(+34.9)#80 | 18.1%(+35.6)#2,176 |
| 80. | 10451 | 53.1% | 18.7%(+34.3)#81 | 18.1%(+35.0)#2,242 |
| 81. | 14861 | 52.9% | 18.7%(+34.2)#82 | 18.1%(+34.9)#2,250 |
| 82. | 12810 | 52.8% | 18.7%(+34.0)#83 | 18.1%(+34.7)#2,271 |
| 83. | 12193 | 52.7% | 18.7%(+34.0)#84 | 18.1%(+34.6)#2,279 |
| 84. | 14878 | 52.6% | 18.7%(+33.9)#85 | 18.1%(+34.6)#2,286 |
| 85. | 11206 | 52.6% | 18.7%(+33.8)#86 | 18.1%(+34.5)#2,291 |
| 86. | 14207 | 52.3% | 18.7%(+33.6)#87 | 18.1%(+34.3)#2,317 |
| 87. | 13654 | 52.0% | 18.7%(+33.2)#88 | 18.1%(+33.9)#2,344 |
| 88. | 13334 | 51.7% | 18.7%(+32.9)#89 | 18.1%(+33.6)#2,369 |
| 89. | 13810 | 51.5% | 18.7%(+32.8)#90 | 18.1%(+33.5)#2,379 |
| 90. | 13660 | 51.5% | 18.7%(+32.7)#91 | 18.1%(+33.4)#2,384 |
| 91. | 14048 | 51.3% | 18.7%(+32.5)#92 | 18.1%(+33.2)#2,405 |
| 92. | 13856 | 51.0% | 18.7%(+32.3)#93 | 18.1%(+32.9)#2,427 |
| 93. | 12308 | 50.9% | 18.7%(+32.1)#94 | 18.1%(+32.8)#2,440 |
| 94. | 13744 | 50.7% | 18.7%(+32.0)#95 | 18.1%(+32.7)#2,452 |
| 95. | 13208 | 50.7% | 18.7%(+31.9)#96 | 18.1%(+32.6)#2,455 |
| 96. | 10952 | 50.5% | 18.7%(+31.7)#97 | 18.1%(+32.4)#2,481 |
| 97. | 10069 | 50.3% | 18.7%(+31.5)#98 | 18.1%(+32.2)#2,498 |
| 98. | 14215 | 50.1% | 18.7%(+31.3)#99 | 18.1%(+32.0)#2,515 |
| 99. | 13754 | 50.0% | 18.7%(+31.3)#100 | 18.1%(+31.9)#2,527 |
| 100. | 13486 | 50.0% | 18.7%(+31.3)#101 | 18.1%(+31.9)#2,560 |
Common Questions
What are the Top 10 Zip Codes with the Highest Poverty Level Among Children Under the Age of 5 in New York?
Top 10 Zip Codes with the Highest Poverty Level Among Children Under the Age of 5 in New York are:
What zip code has the Highest Poverty Level Among Children Under the Age of 5 in New York?
12733 has the Highest Poverty Level Among Children Under the Age of 5 in New York with 100.0%.
What is the Poverty Level Among Children Under the Age of 5 in the State of New York?
Poverty Level Among Children Under the Age of 5 in New York is 18.7%.
What is the Poverty Level Among Children Under the Age of 5 in the United States?
Poverty Level Among Children Under the Age of 5 in the United States is 18.1%.