North Collins, NY Map & Demographics
North Collins Map
North Collins Overview
$26,818
PER CAPITA INCOME
$74,643
AVG FAMILY INCOME
$49,028
AVG HOUSEHOLD INCOME
41.3%
WAGE / INCOME GAP [ % ]
58.7¢/ $1
WAGE / INCOME GAP [ $ ]
$13,188
FAMILY INCOME DEFICIT
0.43
INEQUALITY / GINI INDEX
1,204
TOTAL POPULATION
594
MALE POPULATION
610
FEMALE POPULATION
97.38
MALES / 100 FEMALES
102.69
FEMALES / 100 MALES
40.5
MEDIAN AGE
3.0
AVG FAMILY SIZE
2.3
AVG HOUSEHOLD SIZE
597
LABOR FORCE [ PEOPLE ]
61.6%
PERCENT IN LABOR FORCE
11.1%
UNEMPLOYMENT RATE
North Collins Zip Codes
North Collins Area Codes
Income in North Collins
Income Overview in North Collins
Per Capita Income in North Collins is $26,818, while median incomes of families and households are $74,643 and $49,028 respectively.
| Characteristic | Number | Measure |
| Per Capita Income | 1,204 | $26,818 |
| Median Family Income | 272 | $74,643 |
| Mean Family Income | 272 | $83,122 |
| Median Household Income | 523 | $49,028 |
| Mean Household Income | 523 | $62,212 |
| Income Deficit | 272 | $13,188 |
| Wage / Income Gap (%) | 1,204 | 41.29% |
| Wage / Income Gap ($) | 1,204 | 58.71¢ per $1 |
| Gini / Inequality Index | 1,204 | 0.43 |
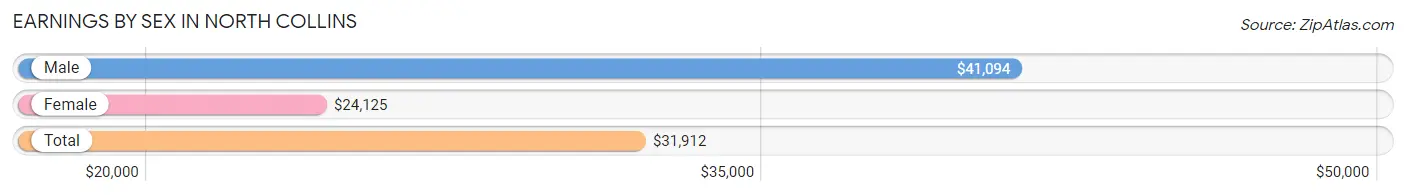
Earnings by Sex in North Collins
Average Earnings in North Collins are $31,912, $41,094 for men and $24,125 for women, a difference of 41.3%.
| Sex | Number | Average Earnings |
| Male | 301 (50.0%) | $41,094 |
| Female | 301 (50.0%) | $24,125 |
| Total | 602 (100.0%) | $31,912 |
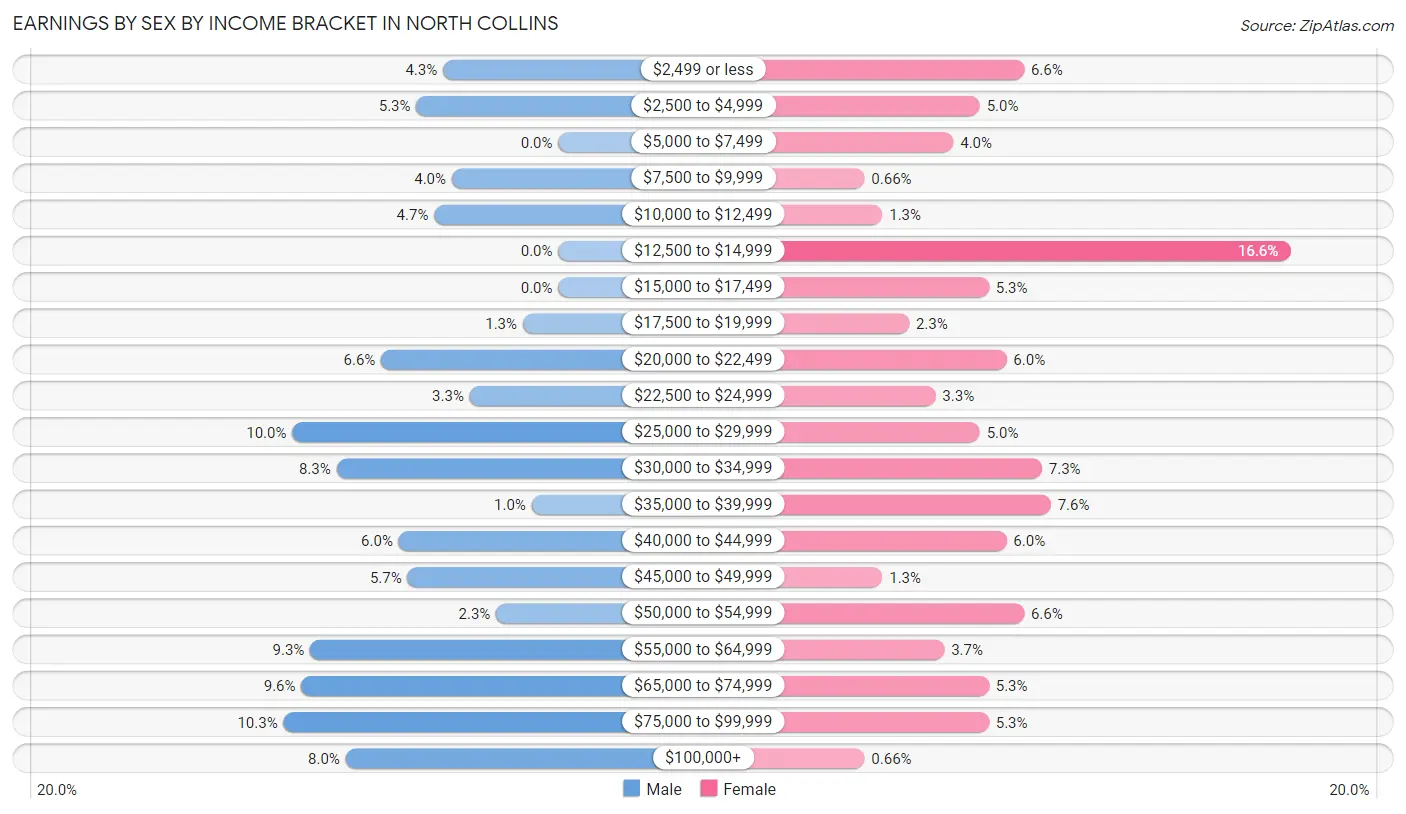
Earnings by Sex by Income Bracket in North Collins
The most common earnings brackets in North Collins are $75,000 to $99,999 for men (31 | 10.3%) and $12,500 to $14,999 for women (50 | 16.6%).
| Income | Male | Female |
| $2,499 or less | 13 (4.3%) | 20 (6.6%) |
| $2,500 to $4,999 | 16 (5.3%) | 15 (5.0%) |
| $5,000 to $7,499 | 0 (0.0%) | 12 (4.0%) |
| $7,500 to $9,999 | 12 (4.0%) | 2 (0.7%) |
| $10,000 to $12,499 | 14 (4.6%) | 4 (1.3%) |
| $12,500 to $14,999 | 0 (0.0%) | 50 (16.6%) |
| $15,000 to $17,499 | 0 (0.0%) | 16 (5.3%) |
| $17,500 to $19,999 | 4 (1.3%) | 7 (2.3%) |
| $20,000 to $22,499 | 20 (6.6%) | 18 (6.0%) |
| $22,500 to $24,999 | 10 (3.3%) | 10 (3.3%) |
| $25,000 to $29,999 | 30 (10.0%) | 15 (5.0%) |
| $30,000 to $34,999 | 25 (8.3%) | 22 (7.3%) |
| $35,000 to $39,999 | 3 (1.0%) | 23 (7.6%) |
| $40,000 to $44,999 | 18 (6.0%) | 18 (6.0%) |
| $45,000 to $49,999 | 17 (5.7%) | 4 (1.3%) |
| $50,000 to $54,999 | 7 (2.3%) | 20 (6.6%) |
| $55,000 to $64,999 | 28 (9.3%) | 11 (3.6%) |
| $65,000 to $74,999 | 29 (9.6%) | 16 (5.3%) |
| $75,000 to $99,999 | 31 (10.3%) | 16 (5.3%) |
| $100,000+ | 24 (8.0%) | 2 (0.7%) |
| Total | 301 (100.0%) | 301 (100.0%) |
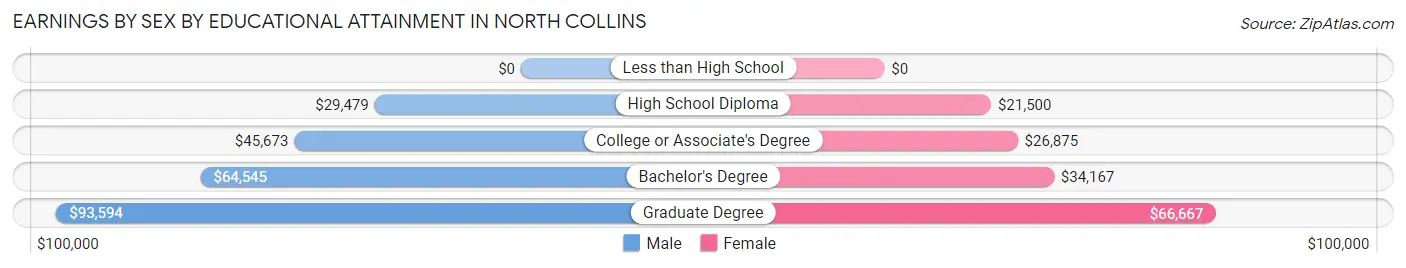
Earnings by Sex by Educational Attainment in North Collins
Average earnings in North Collins are $45,956 for men and $29,028 for women, a difference of 36.8%. Men with an educational attainment of graduate degree enjoy the highest average annual earnings of $93,594, while those with high school diploma education earn the least with $29,479. Women with an educational attainment of graduate degree earn the most with the average annual earnings of $66,667, while those with high school diploma education have the smallest earnings of $21,500.
| Educational Attainment | Male Income | Female Income |
| Less than High School | - | - |
| High School Diploma | $29,479 | $21,500 |
| College or Associate's Degree | $45,673 | $26,875 |
| Bachelor's Degree | $64,545 | $34,167 |
| Graduate Degree | $93,594 | $66,667 |
| Total | $45,956 | $29,028 |
Family Income in North Collins
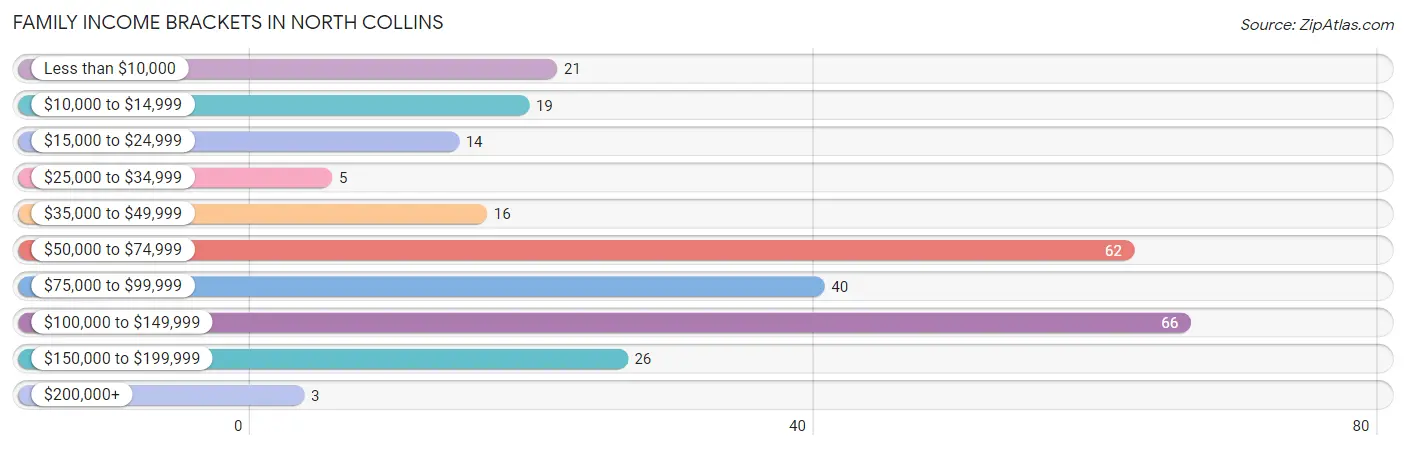
Family Income Brackets in North Collins
According to the North Collins family income data, there are 66 families falling into the $100,000 to $149,999 income range, which is the most common income bracket and makes up 24.3% of all families. Conversely, the $200,000+ income bracket is the least frequent group with only 3 families (1.1%) belonging to this category.
| Income Bracket | # Families | % Families |
| Less than $10,000 | 21 | 7.7% |
| $10,000 to $14,999 | 19 | 7.0% |
| $15,000 to $24,999 | 14 | 5.1% |
| $25,000 to $34,999 | 5 | 1.8% |
| $35,000 to $49,999 | 16 | 5.9% |
| $50,000 to $74,999 | 62 | 22.8% |
| $75,000 to $99,999 | 40 | 14.7% |
| $100,000 to $149,999 | 66 | 24.3% |
| $150,000 to $199,999 | 26 | 9.6% |
| $200,000+ | 3 | 1.1% |
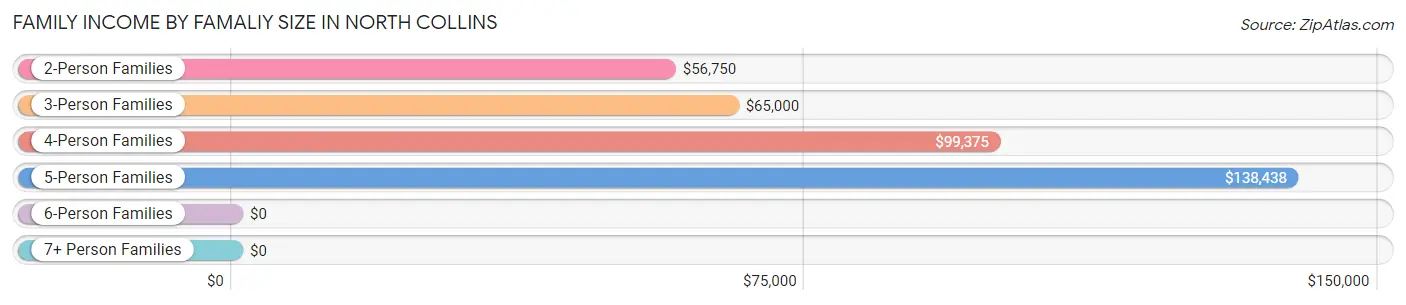
Family Income by Famaliy Size in North Collins
5-person families (33 | 12.1%) account for the highest median family income in North Collins with $138,438 per family, while 2-person families (121 | 44.5%) have the highest median income of $28,375 per family member.
| Income Bracket | # Families | Median Income |
| 2-Person Families | 121 (44.5%) | $56,750 |
| 3-Person Families | 60 (22.1%) | $65,000 |
| 4-Person Families | 53 (19.5%) | $99,375 |
| 5-Person Families | 33 (12.1%) | $138,438 |
| 6-Person Families | 0 (0.0%) | $0 |
| 7+ Person Families | 5 (1.8%) | $0 |
| Total | 272 (100.0%) | $74,643 |
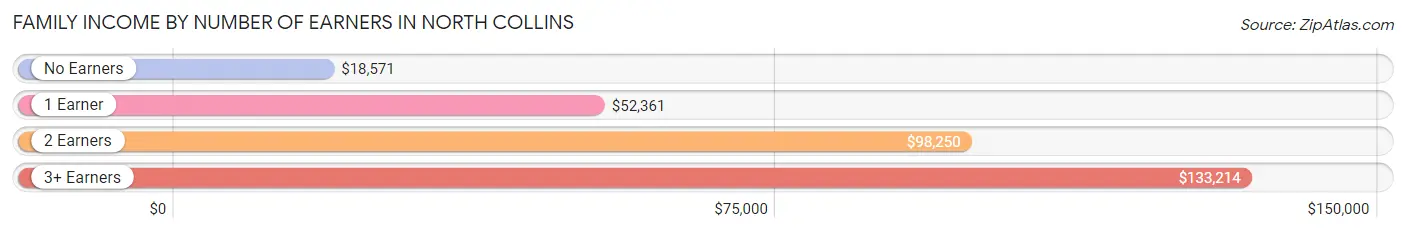
Family Income by Number of Earners in North Collins
The median family income in North Collins is $74,643, with families comprising 3+ earners (46) having the highest median family income of $133,214, while families with no earners (38) have the lowest median family income of $18,571, accounting for 16.9% and 14.0% of families, respectively.
| Number of Earners | # Families | Median Income |
| No Earners | 38 (14.0%) | $18,571 |
| 1 Earner | 87 (32.0%) | $52,361 |
| 2 Earners | 101 (37.1%) | $98,250 |
| 3+ Earners | 46 (16.9%) | $133,214 |
| Total | 272 (100.0%) | $74,643 |
Household Income in North Collins
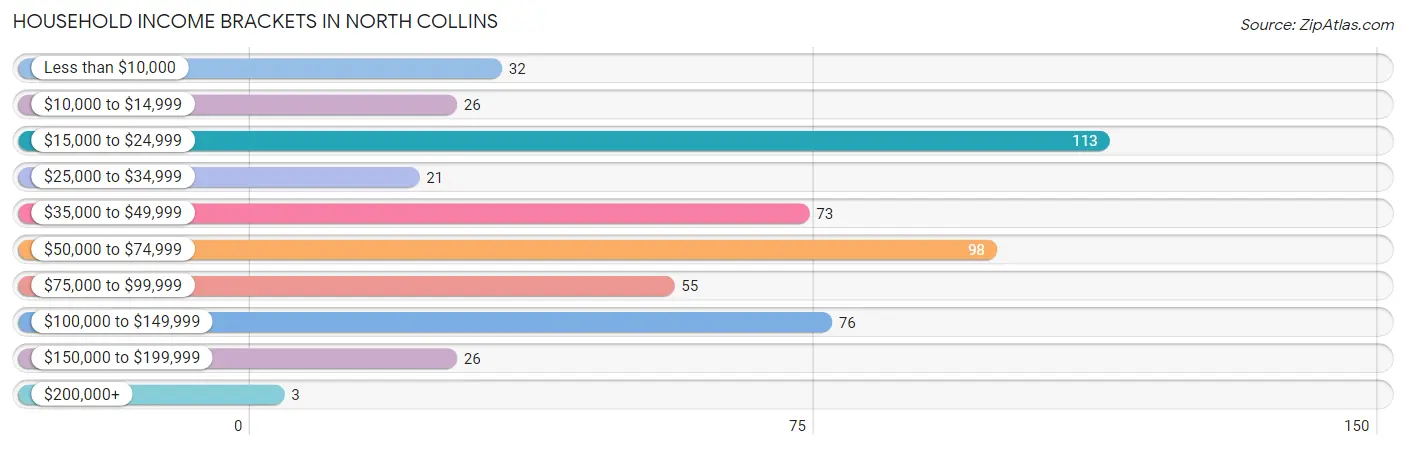
Household Income Brackets in North Collins
With 113 households falling in the category, the $15,000 to $24,999 income range is the most frequent in North Collins, accounting for 21.6% of all households. In contrast, only 3 households (0.6%) fall into the $200,000+ income bracket, making it the least populous group.
| Income Bracket | # Households | % Households |
| Less than $10,000 | 32 | 6.1% |
| $10,000 to $14,999 | 26 | 5.0% |
| $15,000 to $24,999 | 113 | 21.6% |
| $25,000 to $34,999 | 21 | 4.0% |
| $35,000 to $49,999 | 73 | 14.0% |
| $50,000 to $74,999 | 98 | 18.7% |
| $75,000 to $99,999 | 55 | 10.5% |
| $100,000 to $149,999 | 76 | 14.5% |
| $150,000 to $199,999 | 26 | 5.0% |
| $200,000+ | 3 | 0.6% |
Household Income by Householder Age in North Collins
The median household income in North Collins is $49,028, with the highest median household income of $65,179 found in the 25 to 44 years age bracket for the primary householder. A total of 146 households (27.9%) fall into this category. Meanwhile, the 15 to 24 years age bracket for the primary householder has the lowest median household income of $0, with 7 households (1.3%) in this group.
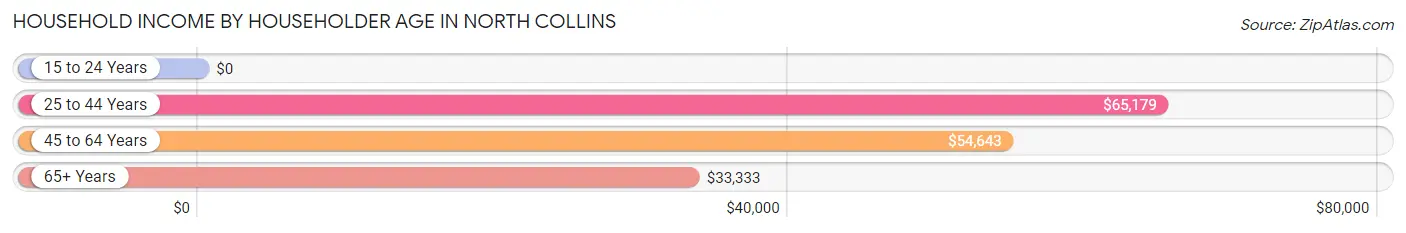
| Income Bracket | # Households | Median Income |
| 15 to 24 Years | 7 (1.3%) | $0 |
| 25 to 44 Years | 146 (27.9%) | $65,179 |
| 45 to 64 Years | 242 (46.3%) | $54,643 |
| 65+ Years | 128 (24.5%) | $33,333 |
| Total | 523 (100.0%) | $49,028 |
Poverty in North Collins
Income Below Poverty by Sex and Age in North Collins
With 13.5% poverty level for males and 20.5% for females among the residents of North Collins, under 5 year old males and 18 to 24 year old females are the most vulnerable to poverty, with 10 males (66.7%) and 23 females (76.7%) in their respective age groups living below the poverty level.
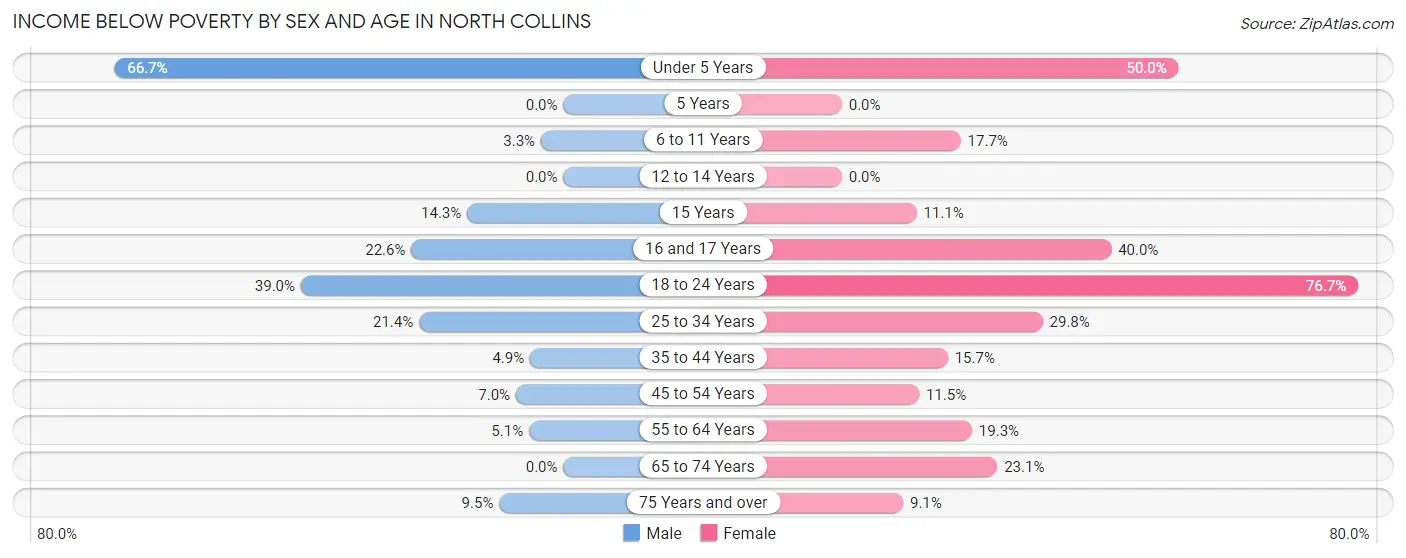
| Age Bracket | Male | Female |
| Under 5 Years | 10 (66.7%) | 10 (50.0%) |
| 5 Years | 0 (0.0%) | 0 (0.0%) |
| 6 to 11 Years | 1 (3.3%) | 9 (17.6%) |
| 12 to 14 Years | 0 (0.0%) | 0 (0.0%) |
| 15 Years | 1 (14.3%) | 2 (11.1%) |
| 16 and 17 Years | 7 (22.6%) | 4 (40.0%) |
| 18 to 24 Years | 23 (39.0%) | 23 (76.7%) |
| 25 to 34 Years | 18 (21.4%) | 17 (29.8%) |
| 35 to 44 Years | 4 (4.9%) | 14 (15.7%) |
| 45 to 54 Years | 5 (7.0%) | 11 (11.5%) |
| 55 to 64 Years | 5 (5.1%) | 17 (19.3%) |
| 65 to 74 Years | 0 (0.0%) | 9 (23.1%) |
| 75 Years and over | 4 (9.5%) | 6 (9.1%) |
| Total | 78 (13.5%) | 122 (20.5%) |
Income Above Poverty by Sex and Age in North Collins
According to the poverty statistics in North Collins, males aged 5 years and females aged 5 years are the age groups that are most secure financially, with 100.0% of males and 100.0% of females in these age groups living above the poverty line.
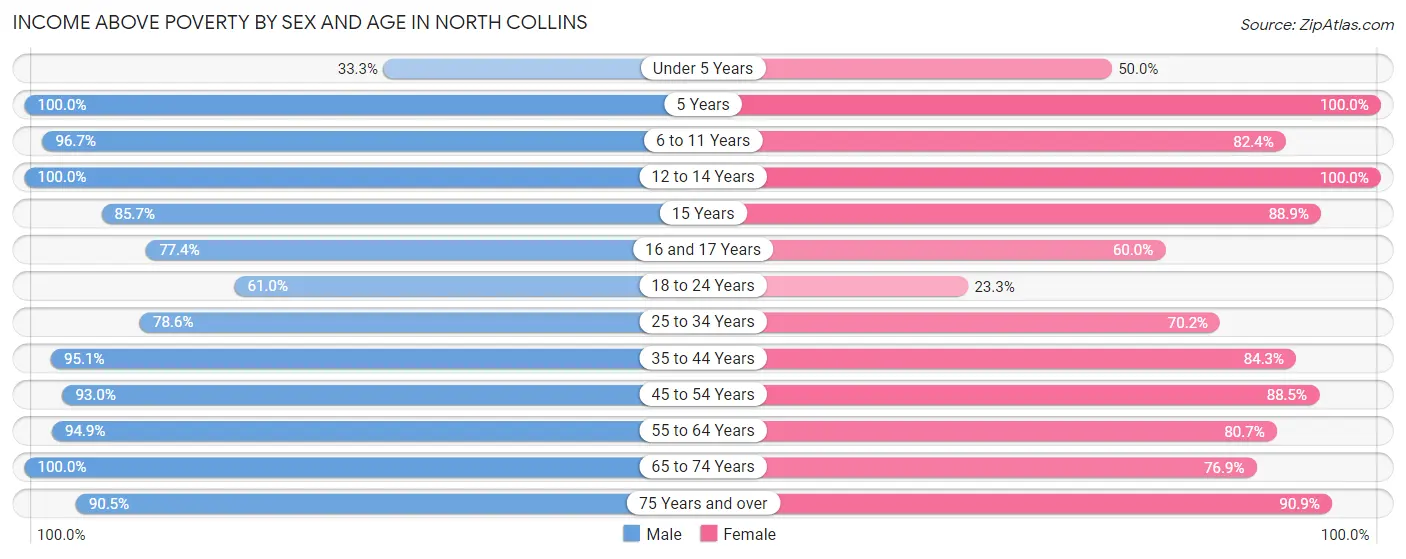
| Age Bracket | Male | Female |
| Under 5 Years | 5 (33.3%) | 10 (50.0%) |
| 5 Years | 8 (100.0%) | 2 (100.0%) |
| 6 to 11 Years | 29 (96.7%) | 42 (82.4%) |
| 12 to 14 Years | 25 (100.0%) | 30 (100.0%) |
| 15 Years | 6 (85.7%) | 16 (88.9%) |
| 16 and 17 Years | 24 (77.4%) | 6 (60.0%) |
| 18 to 24 Years | 36 (61.0%) | 7 (23.3%) |
| 25 to 34 Years | 66 (78.6%) | 40 (70.2%) |
| 35 to 44 Years | 77 (95.1%) | 75 (84.3%) |
| 45 to 54 Years | 66 (93.0%) | 85 (88.5%) |
| 55 to 64 Years | 93 (94.9%) | 71 (80.7%) |
| 65 to 74 Years | 28 (100.0%) | 30 (76.9%) |
| 75 Years and over | 38 (90.5%) | 60 (90.9%) |
| Total | 501 (86.5%) | 474 (79.5%) |
Income Below Poverty Among Married-Couple Families in North Collins
The poverty statistics for married-couple families in North Collins show that 6.3% or 12 of the total 190 families live below the poverty line. Families with 3 or 4 children have the highest poverty rate of 13.3%, comprising of 2 families. On the other hand, families with 1 or 2 children have the lowest poverty rate of 0.0%, which includes 0 families.
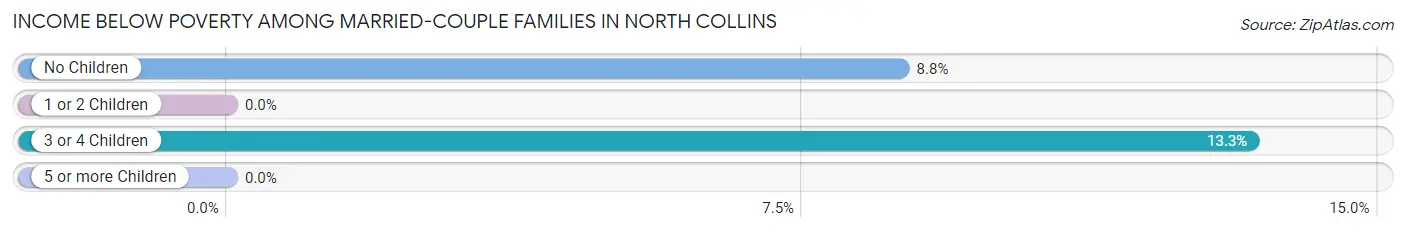
| Children | Above Poverty | Below Poverty |
| No Children | 104 (91.2%) | 10 (8.8%) |
| 1 or 2 Children | 58 (100.0%) | 0 (0.0%) |
| 3 or 4 Children | 13 (86.7%) | 2 (13.3%) |
| 5 or more Children | 3 (100.0%) | 0 (0.0%) |
| Total | 178 (93.7%) | 12 (6.3%) |
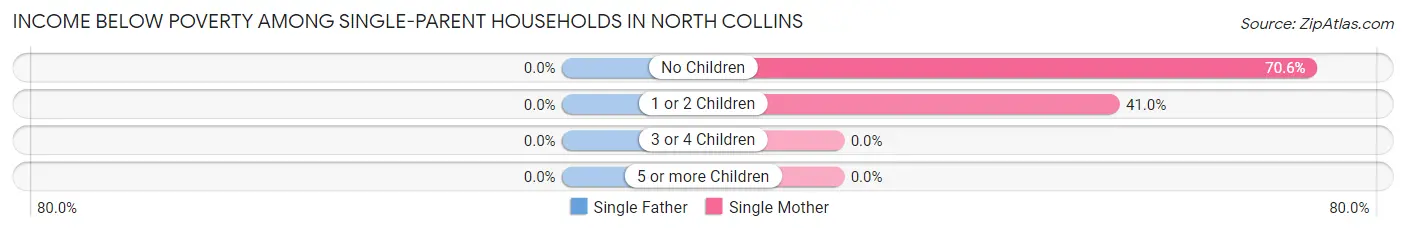
Income Below Poverty Among Single-Parent Households in North Collins
| Children | Single Father | Single Mother |
| No Children | 0 (0.0%) | 12 (70.6%) |
| 1 or 2 Children | 0 (0.0%) | 16 (41.0%) |
| 3 or 4 Children | 0 (0.0%) | 0 (0.0%) |
| 5 or more Children | 0 (0.0%) | 0 (0.0%) |
| Total | 0 (0.0%) | 28 (50.0%) |
Income Below Poverty Among Married-Couple vs Single-Parent Households in North Collins
The poverty data for North Collins shows that 12 of the married-couple family households (6.3%) and 28 of the single-parent households (34.2%) are living below the poverty level. Within the married-couple family households, those with 3 or 4 children have the highest poverty rate, with 2 households (13.3%) falling below the poverty line. Among the single-parent households, those with no children have the highest poverty rate, with 12 household (63.2%) living below poverty.
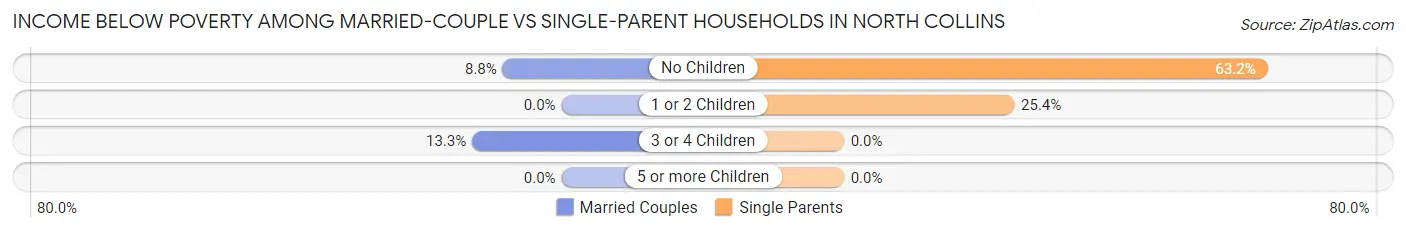
| Children | Married-Couple Families | Single-Parent Households |
| No Children | 10 (8.8%) | 12 (63.2%) |
| 1 or 2 Children | 0 (0.0%) | 16 (25.4%) |
| 3 or 4 Children | 2 (13.3%) | 0 (0.0%) |
| 5 or more Children | 0 (0.0%) | 0 (0.0%) |
| Total | 12 (6.3%) | 28 (34.2%) |
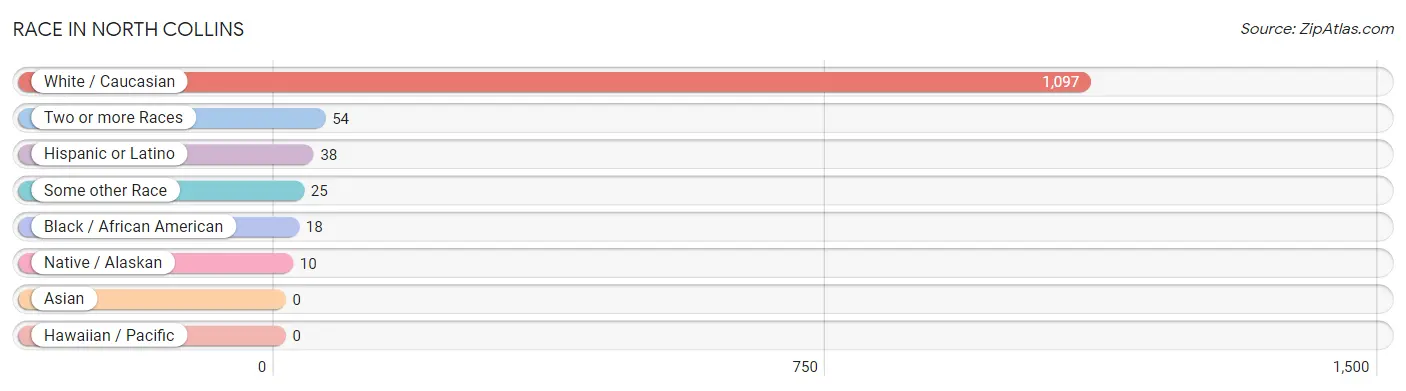
Race in North Collins
The most populous races in North Collins are White / Caucasian (1,097 | 91.1%), Two or more Races (54 | 4.5%), and Hispanic or Latino (38 | 3.2%).
| Race | # Population | % Population |
| Asian | 0 | 0.0% |
| Black / African American | 18 | 1.5% |
| Hawaiian / Pacific | 0 | 0.0% |
| Hispanic or Latino | 38 | 3.2% |
| Native / Alaskan | 10 | 0.8% |
| White / Caucasian | 1,097 | 91.1% |
| Two or more Races | 54 | 4.5% |
| Some other Race | 25 | 2.1% |
| Total | 1,204 | 100.0% |
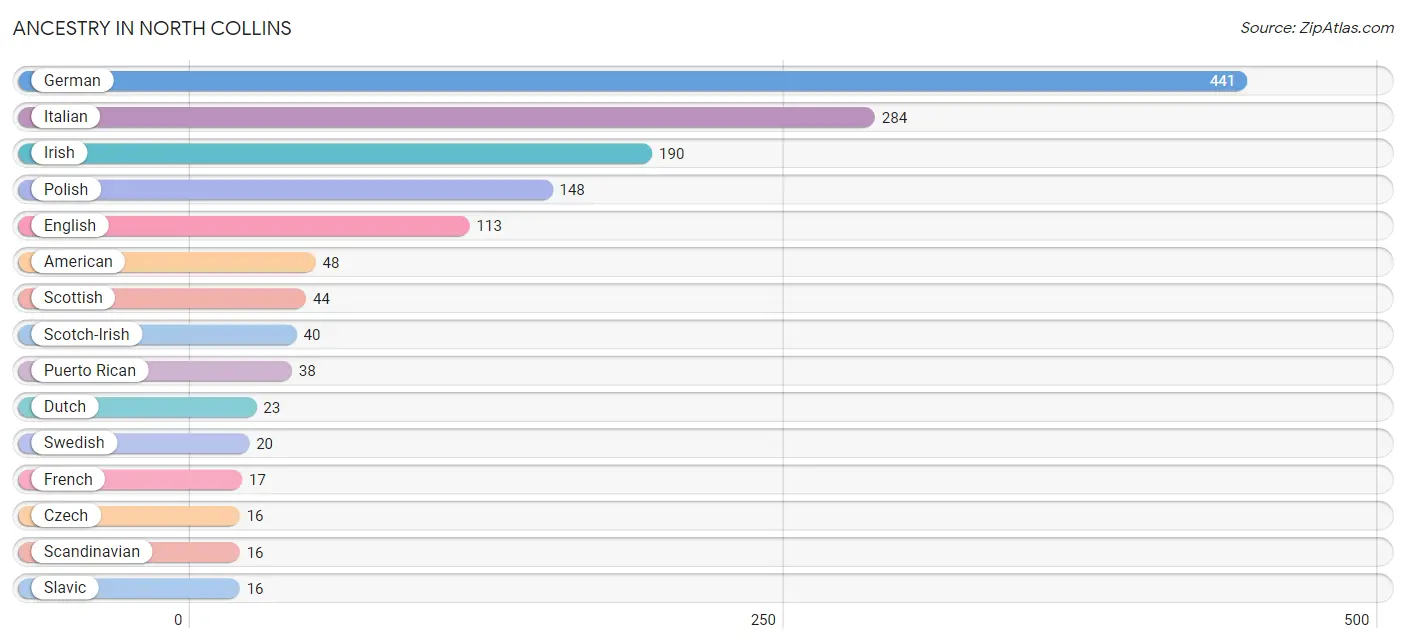
Ancestry in North Collins
The most populous ancestries reported in North Collins are German (441 | 36.6%), Italian (284 | 23.6%), Irish (190 | 15.8%), Polish (148 | 12.3%), and English (113 | 9.4%), together accounting for 97.7% of all North Collins residents.
| Ancestry | # Population | % Population |
| American | 48 | 4.0% |
| Canadian | 5 | 0.4% |
| Czech | 16 | 1.3% |
| Czechoslovakian | 4 | 0.3% |
| Dutch | 23 | 1.9% |
| English | 113 | 9.4% |
| French | 17 | 1.4% |
| German | 441 | 36.6% |
| Irish | 190 | 15.8% |
| Iroquois | 10 | 0.8% |
| Italian | 284 | 23.6% |
| Jamaican | 13 | 1.1% |
| Pennsylvania German | 4 | 0.3% |
| Polish | 148 | 12.3% |
| Puerto Rican | 38 | 3.2% |
| Russian | 12 | 1.0% |
| Scandinavian | 16 | 1.3% |
| Scotch-Irish | 40 | 3.3% |
| Scottish | 44 | 3.6% |
| Slavic | 16 | 1.3% |
| Swedish | 20 | 1.7% |
| Welsh | 12 | 1.0% | View All 22 Rows |
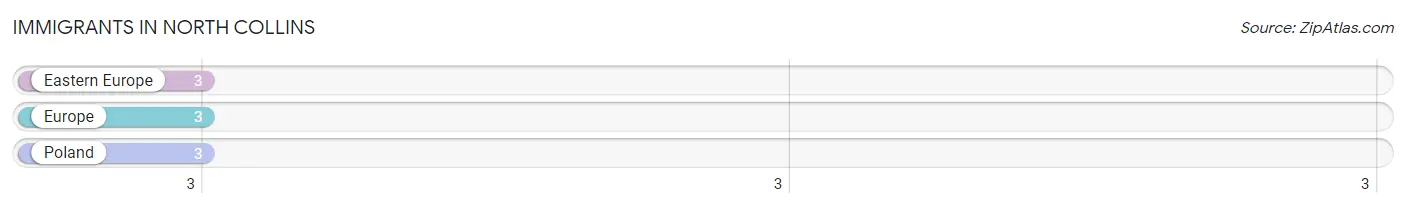
Immigrants in North Collins
The most numerous immigrant groups reported in North Collins came from Eastern Europe (3 | 0.3%), Europe (3 | 0.3%), and Poland (3 | 0.3%), together accounting for 0.7% of all North Collins residents.
| Immigration Origin | # Population | % Population |
| Eastern Europe | 3 | 0.3% |
| Europe | 3 | 0.3% |
| Poland | 3 | 0.3% | View All 3 Rows |
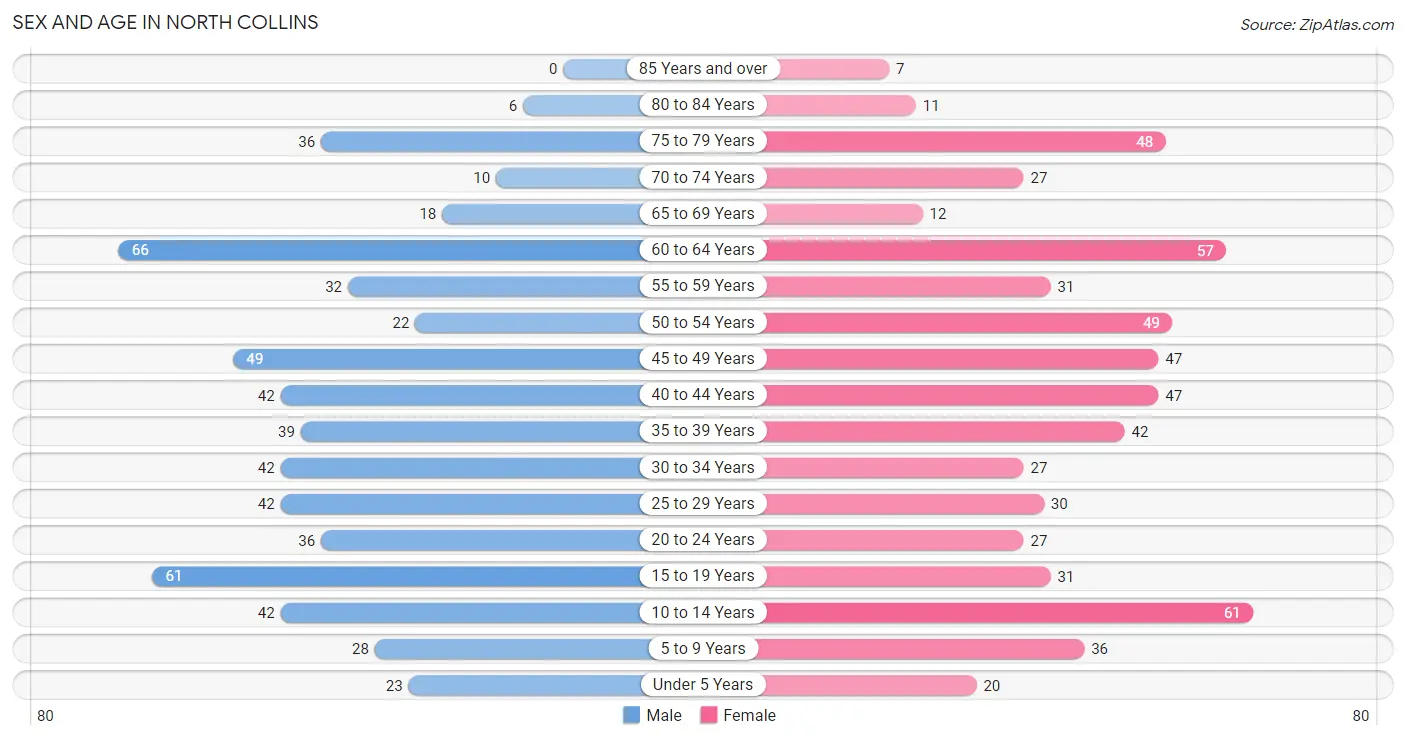
Sex and Age in North Collins
Sex and Age in North Collins
The most populous age groups in North Collins are 60 to 64 Years (66 | 11.1%) for men and 10 to 14 Years (61 | 10.0%) for women.
| Age Bracket | Male | Female |
| Under 5 Years | 23 (3.9%) | 20 (3.3%) |
| 5 to 9 Years | 28 (4.7%) | 36 (5.9%) |
| 10 to 14 Years | 42 (7.1%) | 61 (10.0%) |
| 15 to 19 Years | 61 (10.3%) | 31 (5.1%) |
| 20 to 24 Years | 36 (6.1%) | 27 (4.4%) |
| 25 to 29 Years | 42 (7.1%) | 30 (4.9%) |
| 30 to 34 Years | 42 (7.1%) | 27 (4.4%) |
| 35 to 39 Years | 39 (6.6%) | 42 (6.9%) |
| 40 to 44 Years | 42 (7.1%) | 47 (7.7%) |
| 45 to 49 Years | 49 (8.3%) | 47 (7.7%) |
| 50 to 54 Years | 22 (3.7%) | 49 (8.0%) |
| 55 to 59 Years | 32 (5.4%) | 31 (5.1%) |
| 60 to 64 Years | 66 (11.1%) | 57 (9.3%) |
| 65 to 69 Years | 18 (3.0%) | 12 (2.0%) |
| 70 to 74 Years | 10 (1.7%) | 27 (4.4%) |
| 75 to 79 Years | 36 (6.1%) | 48 (7.9%) |
| 80 to 84 Years | 6 (1.0%) | 11 (1.8%) |
| 85 Years and over | 0 (0.0%) | 7 (1.1%) |
| Total | 594 (100.0%) | 610 (100.0%) |
Families and Households in North Collins
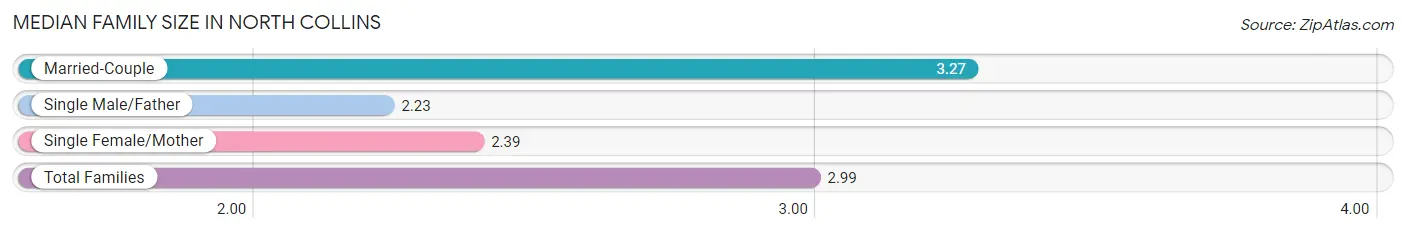
Median Family Size in North Collins
The median family size in North Collins is 2.99 persons per family, with married-couple families (190 | 69.9%) accounting for the largest median family size of 3.27 persons per family. On the other hand, single male/father families (26 | 9.6%) represent the smallest median family size with 2.23 persons per family.
| Family Type | # Families | Family Size |
| Married-Couple | 190 (69.9%) | 3.27 |
| Single Male/Father | 26 (9.6%) | 2.23 |
| Single Female/Mother | 56 (20.6%) | 2.39 |
| Total Families | 272 (100.0%) | 2.99 |
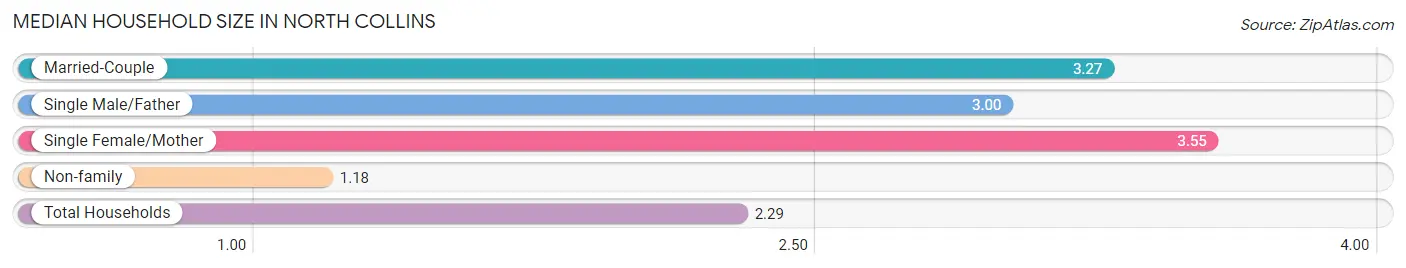
Median Household Size in North Collins
The median household size in North Collins is 2.29 persons per household, with single female/mother households (56 | 10.7%) accounting for the largest median household size of 3.55 persons per household. non-family households (251 | 48.0%) represent the smallest median household size with 1.18 persons per household.
| Household Type | # Households | Household Size |
| Married-Couple | 190 (36.3%) | 3.27 |
| Single Male/Father | 26 (5.0%) | 3.00 |
| Single Female/Mother | 56 (10.7%) | 3.55 |
| Non-family | 251 (48.0%) | 1.18 |
| Total Households | 523 (100.0%) | 2.29 |
Household Size by Marriage Status in North Collins
Out of a total of 523 households in North Collins, 272 (52.0%) are family households, while 251 (48.0%) are nonfamily households. The most numerous type of family households are 2-person households, comprising 103, and the most common type of nonfamily households are 1-person households, comprising 215.
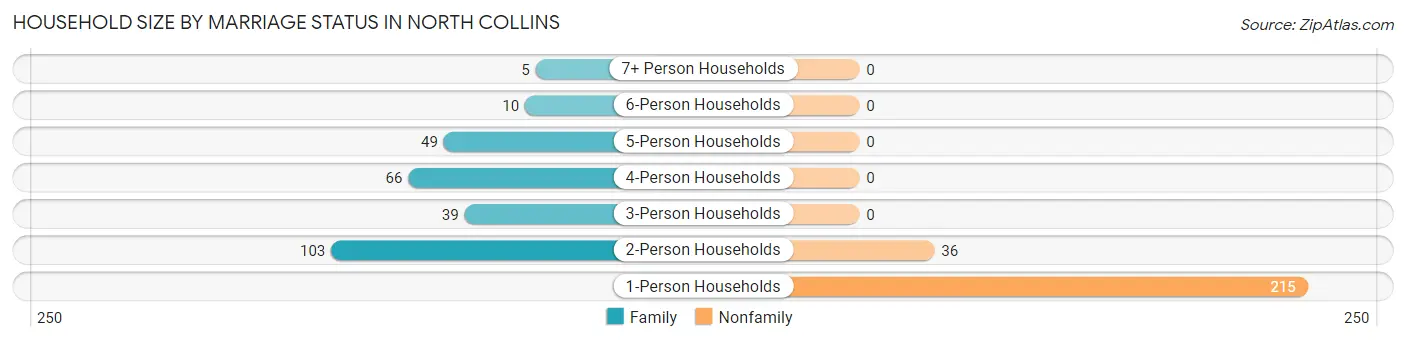
| Household Size | Family Households | Nonfamily Households |
| 1-Person Households | - | 215 (41.1%) |
| 2-Person Households | 103 (19.7%) | 36 (6.9%) |
| 3-Person Households | 39 (7.5%) | 0 (0.0%) |
| 4-Person Households | 66 (12.6%) | 0 (0.0%) |
| 5-Person Households | 49 (9.4%) | 0 (0.0%) |
| 6-Person Households | 10 (1.9%) | 0 (0.0%) |
| 7+ Person Households | 5 (1.0%) | 0 (0.0%) |
| Total | 272 (52.0%) | 251 (48.0%) |
Female Fertility in North Collins
Fertility by Age in North Collins
Average fertility rate in North Collins is 27.0 births per 1,000 women. Women in the age bracket of 35 to 50 years have the highest fertility rate with 35.0 births per 1,000 women. Women in the age bracket of 35 to 50 years acount for 71.4% of all women with births.
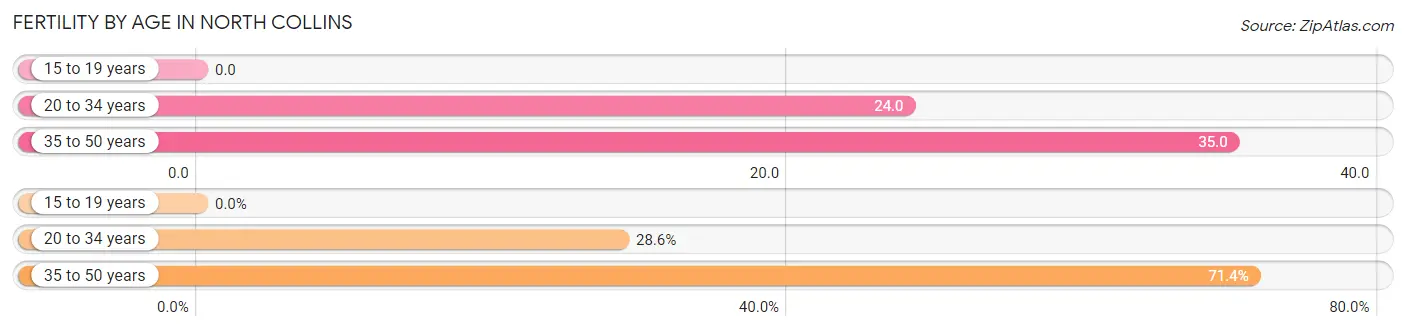
| Age Bracket | Women with Births | Births / 1,000 Women |
| 15 to 19 years | 0 (0.0%) | 0.0 |
| 20 to 34 years | 2 (28.6%) | 24.0 |
| 35 to 50 years | 5 (71.4%) | 35.0 |
| Total | 7 (100.0%) | 27.0 |
Fertility by Age by Marriage Status in North Collins
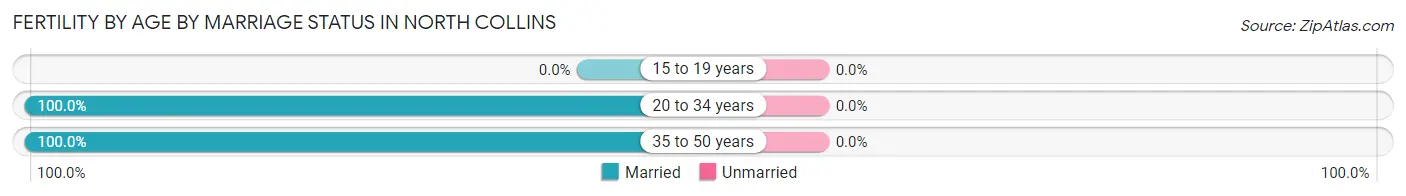
| Age Bracket | Married | Unmarried |
| 15 to 19 years | 0 (0.0%) | 0 (0.0%) |
| 20 to 34 years | 2 (100.0%) | 0 (0.0%) |
| 35 to 50 years | 5 (100.0%) | 0 (0.0%) |
| Total | 7 (100.0%) | 0 (0.0%) |
Fertility by Education in North Collins
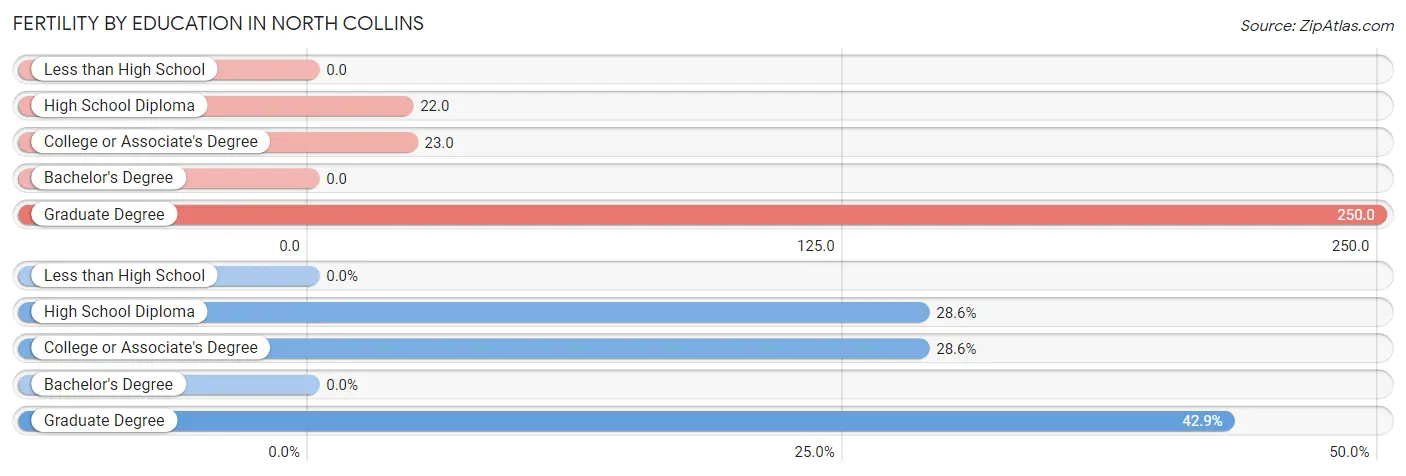
| Educational Attainment | Women with Births | Births / 1,000 Women |
| Less than High School | 0 (0.0%) | 0.0 |
| High School Diploma | 2 (28.6%) | 22.0 |
| College or Associate's Degree | 2 (28.6%) | 23.0 |
| Bachelor's Degree | 0 (0.0%) | 0.0 |
| Graduate Degree | 3 (42.9%) | 250.0 |
| Total | 7 (100.0%) | 27.0 |
Fertility by Education by Marriage Status in North Collins
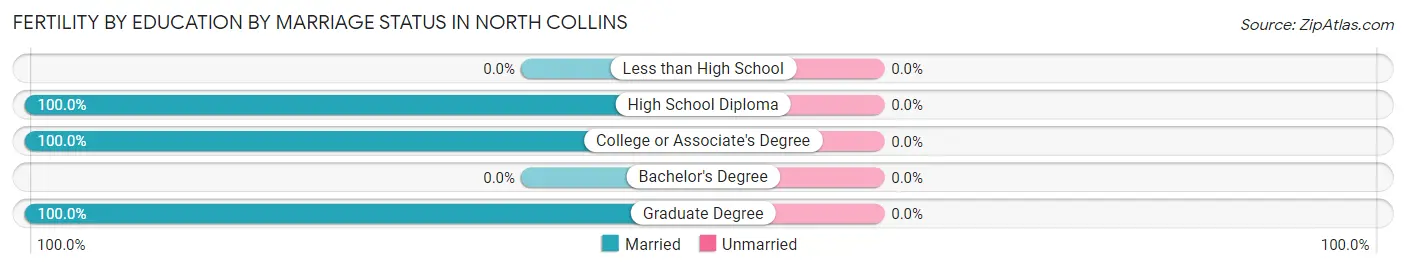
| Educational Attainment | Married | Unmarried |
| Less than High School | 0 (0.0%) | 0 (0.0%) |
| High School Diploma | 2 (100.0%) | 0 (0.0%) |
| College or Associate's Degree | 2 (100.0%) | 0 (0.0%) |
| Bachelor's Degree | 0 (0.0%) | 0 (0.0%) |
| Graduate Degree | 3 (100.0%) | 0 (0.0%) |
| Total | 7 (100.0%) | 0 (0.0%) |
Employment Characteristics in North Collins
Employment by Class of Employer in North Collins
Among the 508 employed individuals in North Collins, private company employees (316 | 62.2%), local government employees (61 | 12.0%), and state government employees (56 | 11.0%) make up the most common classes of employment.
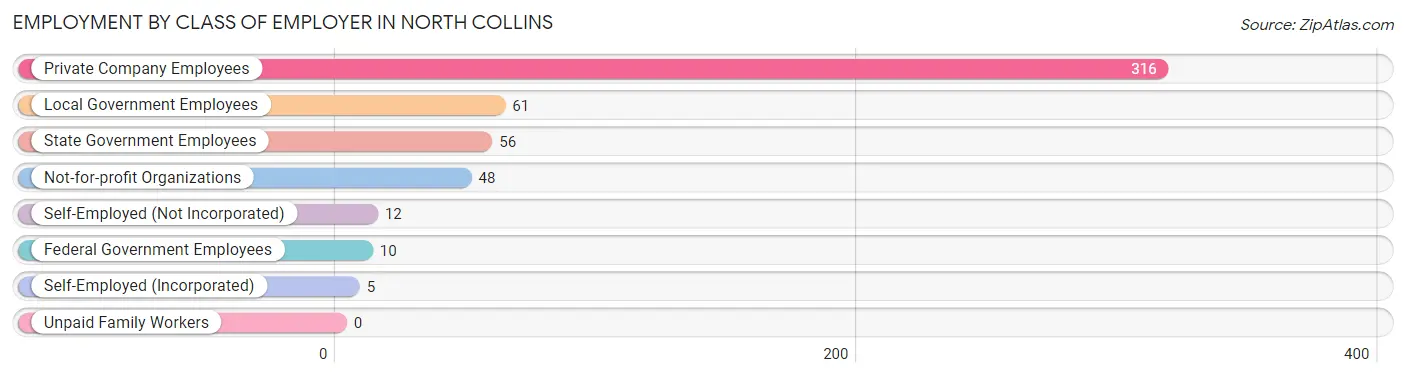
| Employer Class | # Employees | % Employees |
| Private Company Employees | 316 | 62.2% |
| Self-Employed (Incorporated) | 5 | 1.0% |
| Self-Employed (Not Incorporated) | 12 | 2.4% |
| Not-for-profit Organizations | 48 | 9.5% |
| Local Government Employees | 61 | 12.0% |
| State Government Employees | 56 | 11.0% |
| Federal Government Employees | 10 | 2.0% |
| Unpaid Family Workers | 0 | 0.0% |
| Total | 508 | 100.0% |
Employment Status by Age in North Collins
According to the labor force statistics for North Collins, out of the total population over 16 years of age (969), 61.6% or 597 individuals are in the labor force, with 11.1% or 66 of them unemployed. The age group with the highest labor force participation rate is 35 to 44 years, with 92.9% or 158 individuals in the labor force. Within the labor force, the 16 to 19 years age range has the highest percentage of unemployed individuals, with 29.4% or 10 of them being unemployed.
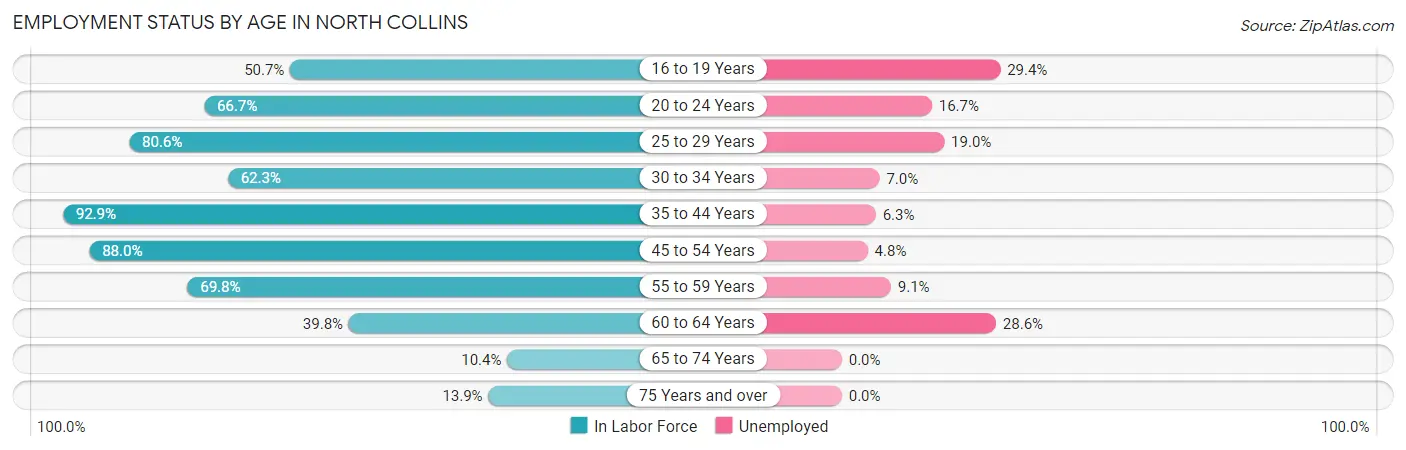
| Age Bracket | In Labor Force | Unemployed |
| 16 to 19 Years | 34 (50.7%) | 10 (29.4%) |
| 20 to 24 Years | 42 (66.7%) | 7 (16.7%) |
| 25 to 29 Years | 58 (80.6%) | 11 (19.0%) |
| 30 to 34 Years | 43 (62.3%) | 3 (7.0%) |
| 35 to 44 Years | 158 (92.9%) | 10 (6.3%) |
| 45 to 54 Years | 147 (88.0%) | 7 (4.8%) |
| 55 to 59 Years | 44 (69.8%) | 4 (9.1%) |
| 60 to 64 Years | 49 (39.8%) | 14 (28.6%) |
| 65 to 74 Years | 7 (10.4%) | 0 (0.0%) |
| 75 Years and over | 15 (13.9%) | 0 (0.0%) |
| Total | 597 (61.6%) | 66 (11.1%) |
Employment Status by Educational Attainment in North Collins
According to labor force statistics for North Collins, 75.2% of individuals (499) out of the total population between 25 and 64 years of age (664) are in the labor force, with 9.8% or 49 of them being unemployed. The group with the highest labor force participation rate are those with the educational attainment of bachelor's degree or higher, with 90.7% or 97 individuals in the labor force. Within the labor force, individuals with high school diploma education have the highest percentage of unemployment, with 16.8% or 36 of them being unemployed.
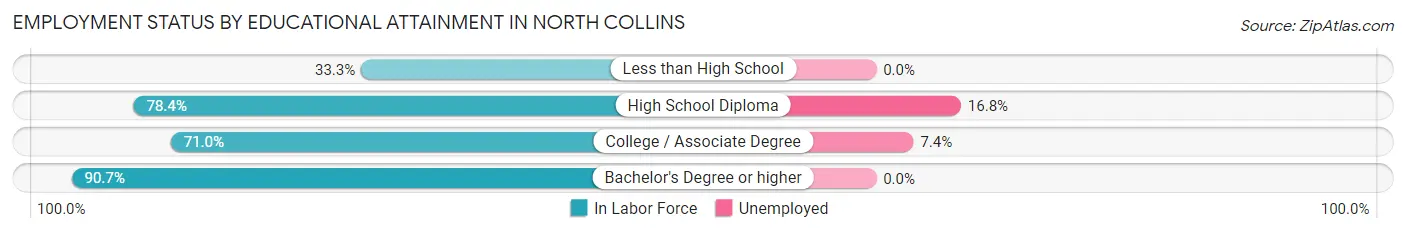
| Educational Attainment | In Labor Force | Unemployed |
| Less than High School | 12 (33.3%) | 0 (0.0%) |
| High School Diploma | 214 (78.4%) | 46 (16.8%) |
| College / Associate Degree | 176 (71.0%) | 18 (7.4%) |
| Bachelor's Degree or higher | 97 (90.7%) | 0 (0.0%) |
| Total | 499 (75.2%) | 65 (9.8%) |
Employment Occupations by Sex in North Collins
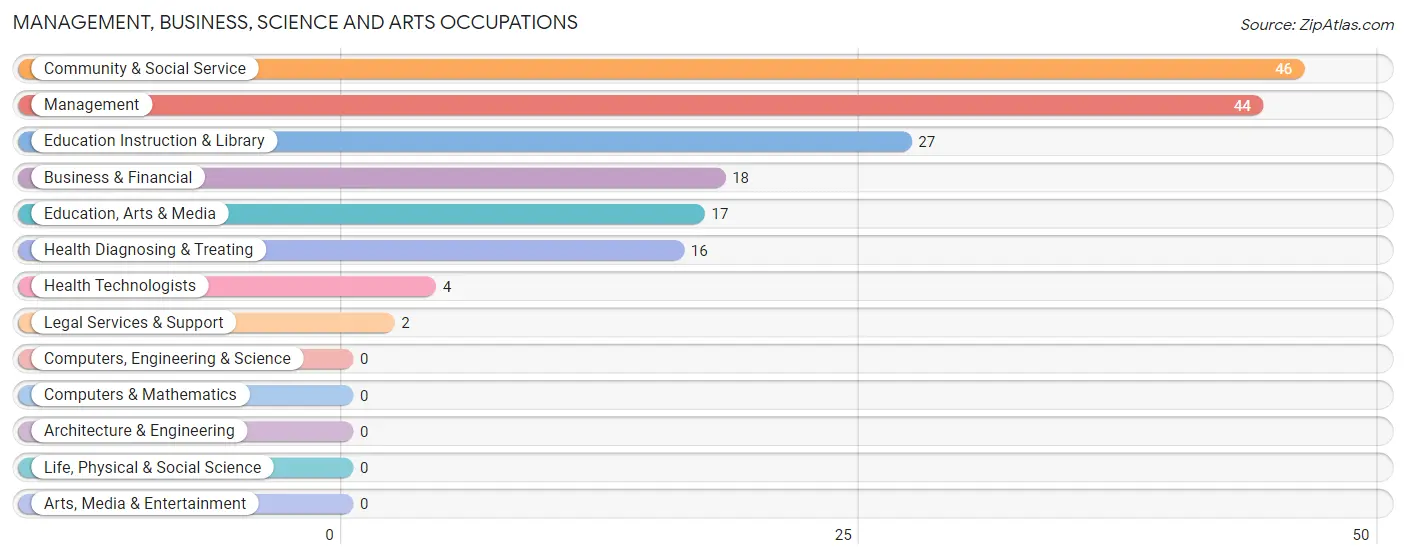
Management, Business, Science and Arts Occupations
The most common Management, Business, Science and Arts occupations in North Collins are Community & Social Service (46 | 8.7%), Management (44 | 8.3%), Education Instruction & Library (27 | 5.1%), Business & Financial (18 | 3.4%), and Education, Arts & Media (17 | 3.2%).
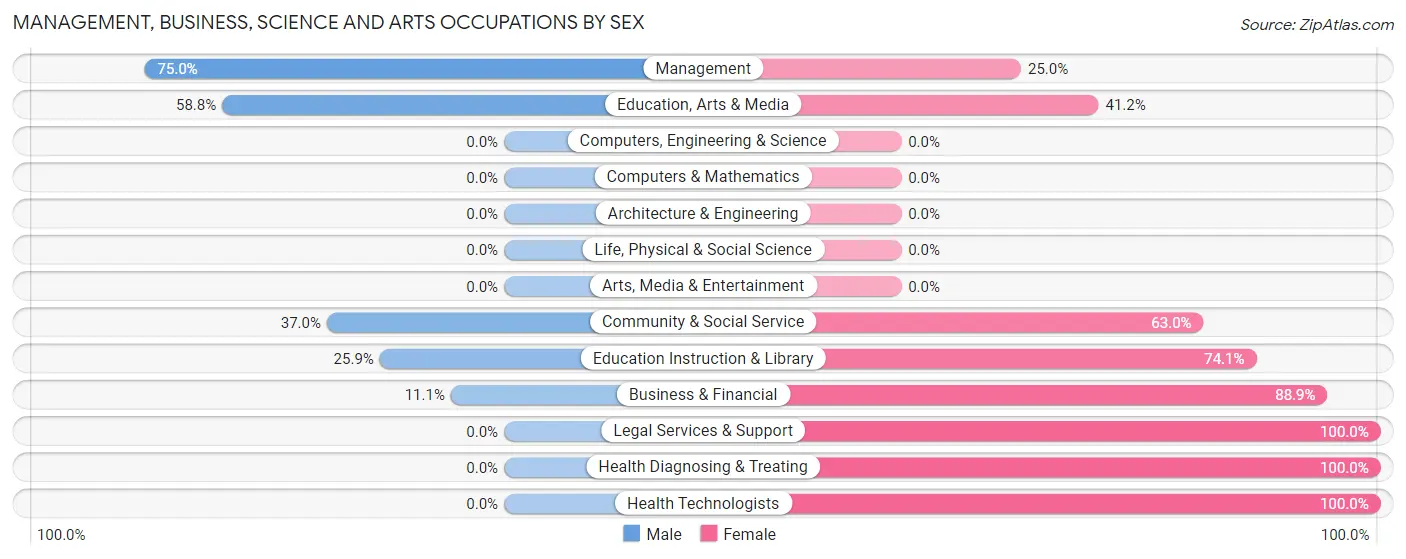
Management, Business, Science and Arts Occupations by Sex
Within the Management, Business, Science and Arts occupations in North Collins, the most male-oriented occupations are Management (75.0%), Education, Arts & Media (58.8%), and Community & Social Service (37.0%), while the most female-oriented occupations are Legal Services & Support (100.0%), Health Diagnosing & Treating (100.0%), and Health Technologists (100.0%).
| Occupation | Male | Female |
| Management | 33 (75.0%) | 11 (25.0%) |
| Business & Financial | 2 (11.1%) | 16 (88.9%) |
| Computers, Engineering & Science | 0 (0.0%) | 0 (0.0%) |
| Computers & Mathematics | 0 (0.0%) | 0 (0.0%) |
| Architecture & Engineering | 0 (0.0%) | 0 (0.0%) |
| Life, Physical & Social Science | 0 (0.0%) | 0 (0.0%) |
| Community & Social Service | 17 (37.0%) | 29 (63.0%) |
| Education, Arts & Media | 10 (58.8%) | 7 (41.2%) |
| Legal Services & Support | 0 (0.0%) | 2 (100.0%) |
| Education Instruction & Library | 7 (25.9%) | 20 (74.1%) |
| Arts, Media & Entertainment | 0 (0.0%) | 0 (0.0%) |
| Health Diagnosing & Treating | 0 (0.0%) | 16 (100.0%) |
| Health Technologists | 0 (0.0%) | 4 (100.0%) |
| Total (Category) | 52 (41.9%) | 72 (58.1%) |
| Total (Overall) | 265 (49.9%) | 266 (50.1%) |
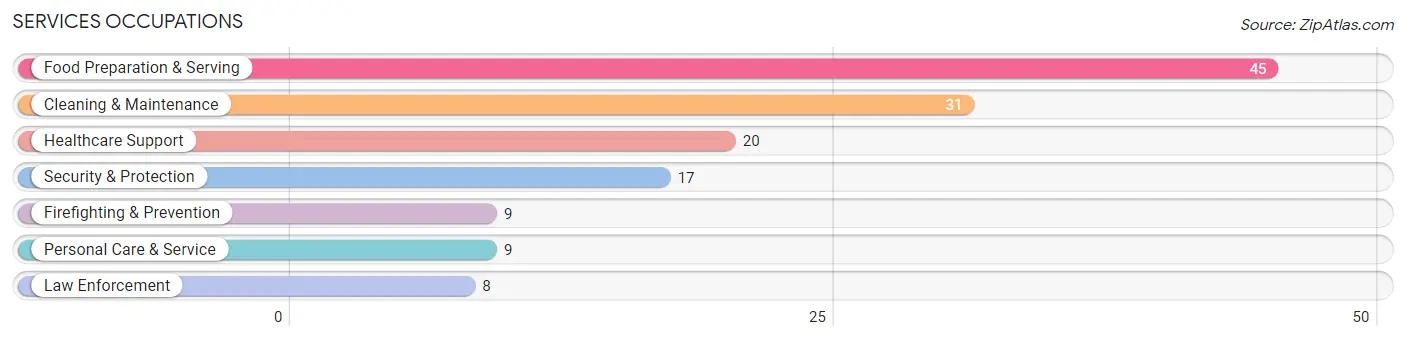
Services Occupations
The most common Services occupations in North Collins are Food Preparation & Serving (45 | 8.5%), Cleaning & Maintenance (31 | 5.8%), Healthcare Support (20 | 3.8%), Security & Protection (17 | 3.2%), and Firefighting & Prevention (9 | 1.7%).
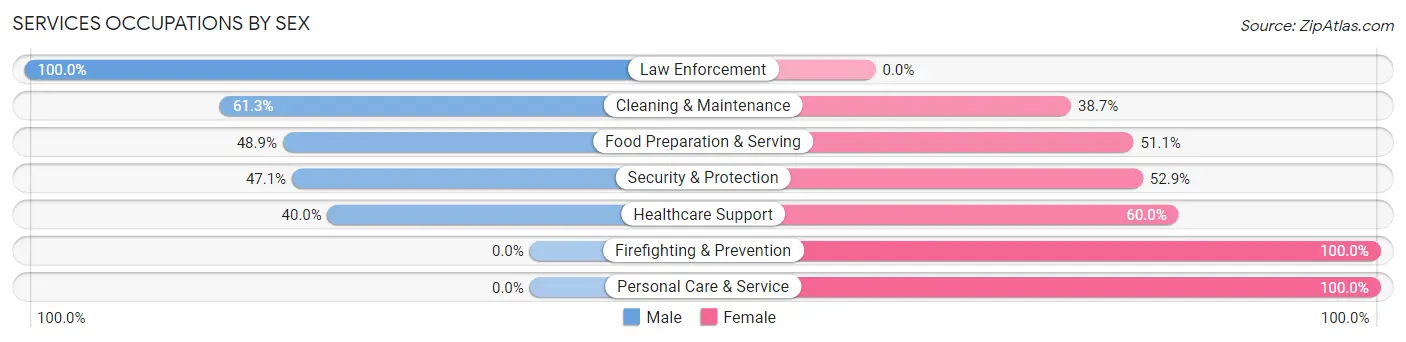
Services Occupations by Sex
Within the Services occupations in North Collins, the most male-oriented occupations are Law Enforcement (100.0%), Cleaning & Maintenance (61.3%), and Food Preparation & Serving (48.9%), while the most female-oriented occupations are Firefighting & Prevention (100.0%), Personal Care & Service (100.0%), and Healthcare Support (60.0%).
| Occupation | Male | Female |
| Healthcare Support | 8 (40.0%) | 12 (60.0%) |
| Security & Protection | 8 (47.1%) | 9 (52.9%) |
| Firefighting & Prevention | 0 (0.0%) | 9 (100.0%) |
| Law Enforcement | 8 (100.0%) | 0 (0.0%) |
| Food Preparation & Serving | 22 (48.9%) | 23 (51.1%) |
| Cleaning & Maintenance | 19 (61.3%) | 12 (38.7%) |
| Personal Care & Service | 0 (0.0%) | 9 (100.0%) |
| Total (Category) | 57 (46.7%) | 65 (53.3%) |
| Total (Overall) | 265 (49.9%) | 266 (50.1%) |
Sales and Office Occupations
The most common Sales and Office occupations in North Collins are Sales & Related (77 | 14.5%), and Office & Administration (74 | 13.9%).
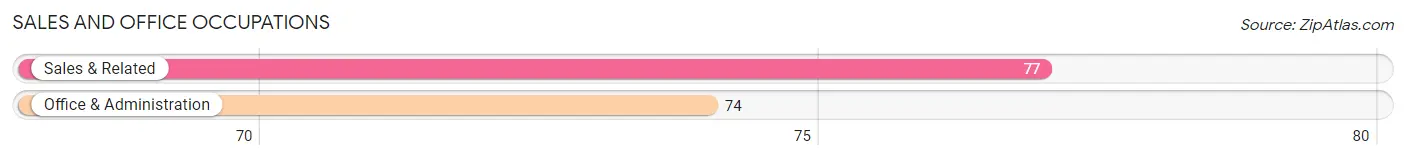
Sales and Office Occupations by Sex
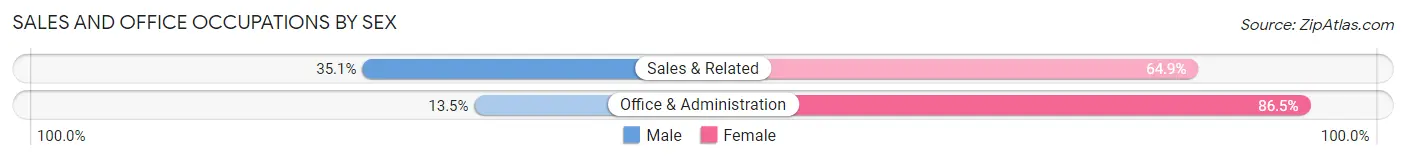
| Occupation | Male | Female |
| Sales & Related | 27 (35.1%) | 50 (64.9%) |
| Office & Administration | 10 (13.5%) | 64 (86.5%) |
| Total (Category) | 37 (24.5%) | 114 (75.5%) |
| Total (Overall) | 265 (49.9%) | 266 (50.1%) |
Natural Resources, Construction and Maintenance Occupations
The most common Natural Resources, Construction and Maintenance occupations in North Collins are Installation, Maintenance & Repair (30 | 5.7%), and Construction & Extraction (10 | 1.9%).
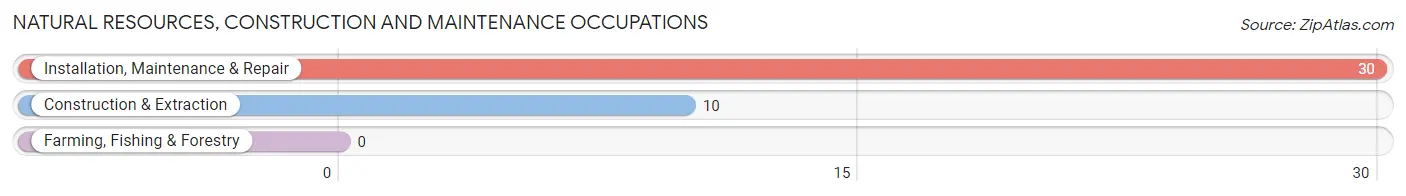
Natural Resources, Construction and Maintenance Occupations by Sex
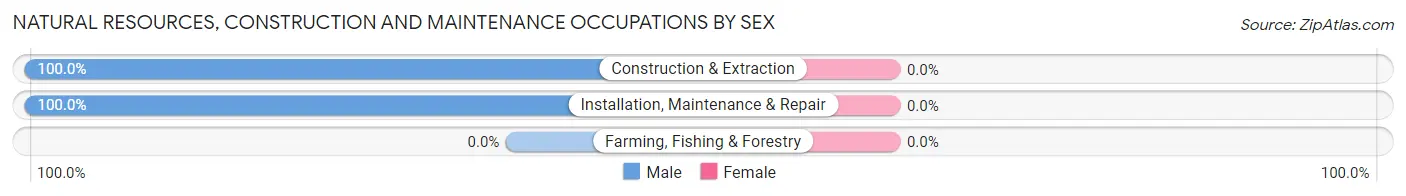
| Occupation | Male | Female |
| Farming, Fishing & Forestry | 0 (0.0%) | 0 (0.0%) |
| Construction & Extraction | 10 (100.0%) | 0 (0.0%) |
| Installation, Maintenance & Repair | 30 (100.0%) | 0 (0.0%) |
| Total (Category) | 40 (100.0%) | 0 (0.0%) |
| Total (Overall) | 265 (49.9%) | 266 (50.1%) |
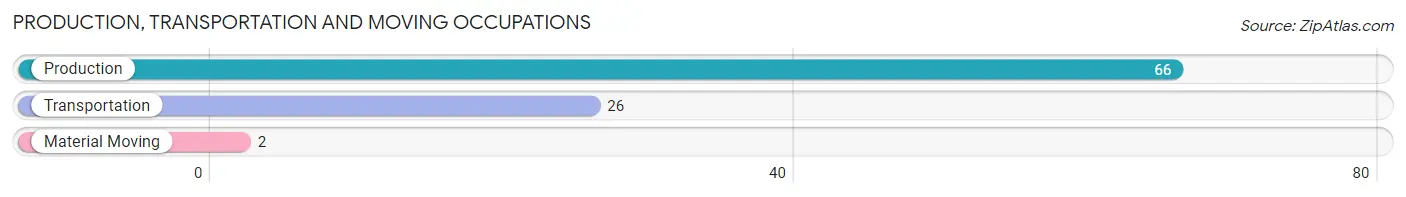
Production, Transportation and Moving Occupations
The most common Production, Transportation and Moving occupations in North Collins are Production (66 | 12.4%), Transportation (26 | 4.9%), and Material Moving (2 | 0.4%).
Production, Transportation and Moving Occupations by Sex
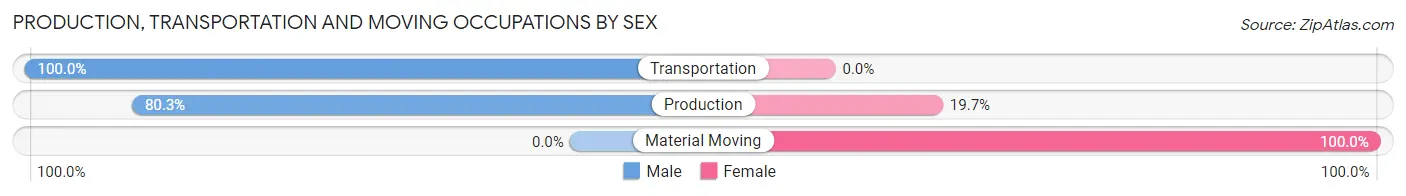
| Occupation | Male | Female |
| Production | 53 (80.3%) | 13 (19.7%) |
| Transportation | 26 (100.0%) | 0 (0.0%) |
| Material Moving | 0 (0.0%) | 2 (100.0%) |
| Total (Category) | 79 (84.0%) | 15 (16.0%) |
| Total (Overall) | 265 (49.9%) | 266 (50.1%) |
Employment Industries by Sex in North Collins
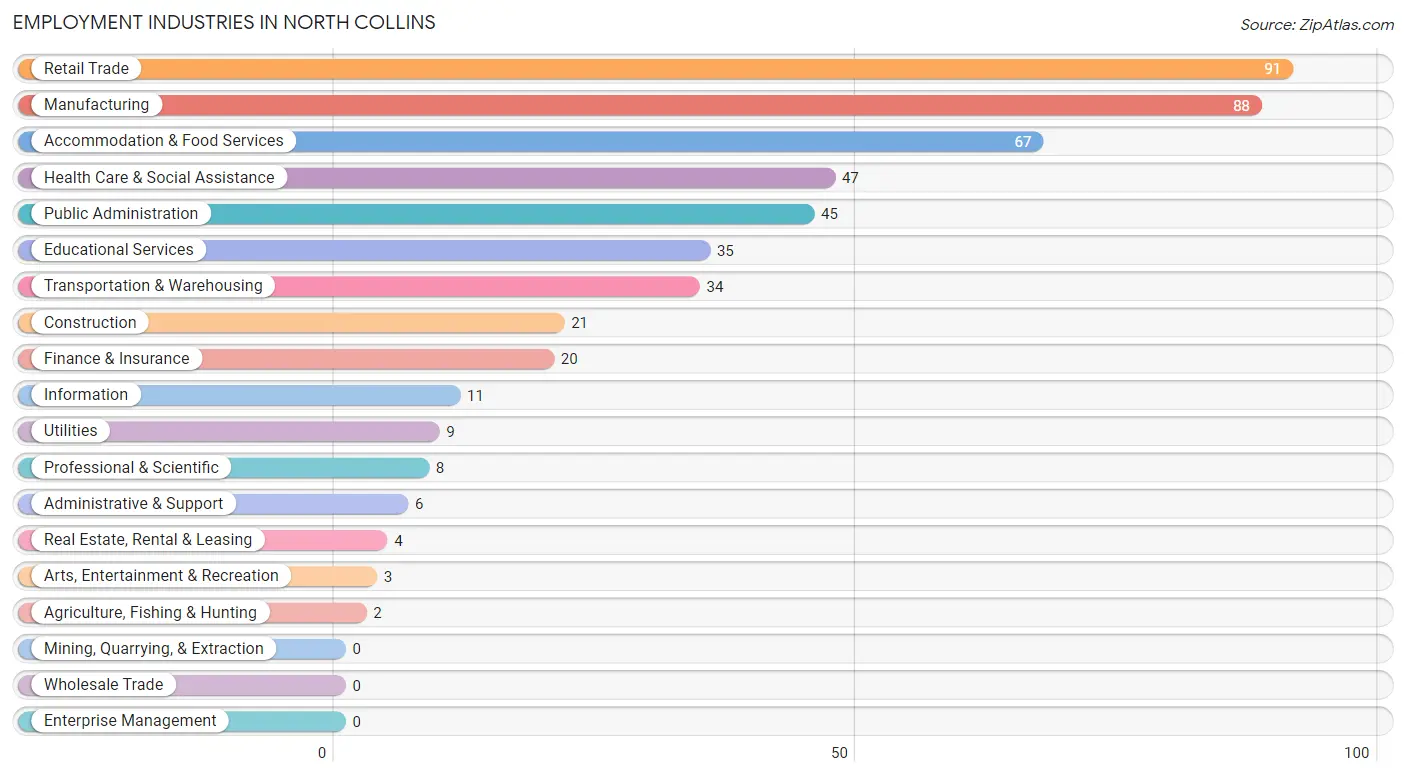
Employment Industries in North Collins
The major employment industries in North Collins include Retail Trade (91 | 17.1%), Manufacturing (88 | 16.6%), Accommodation & Food Services (67 | 12.6%), Health Care & Social Assistance (47 | 8.8%), and Public Administration (45 | 8.5%).
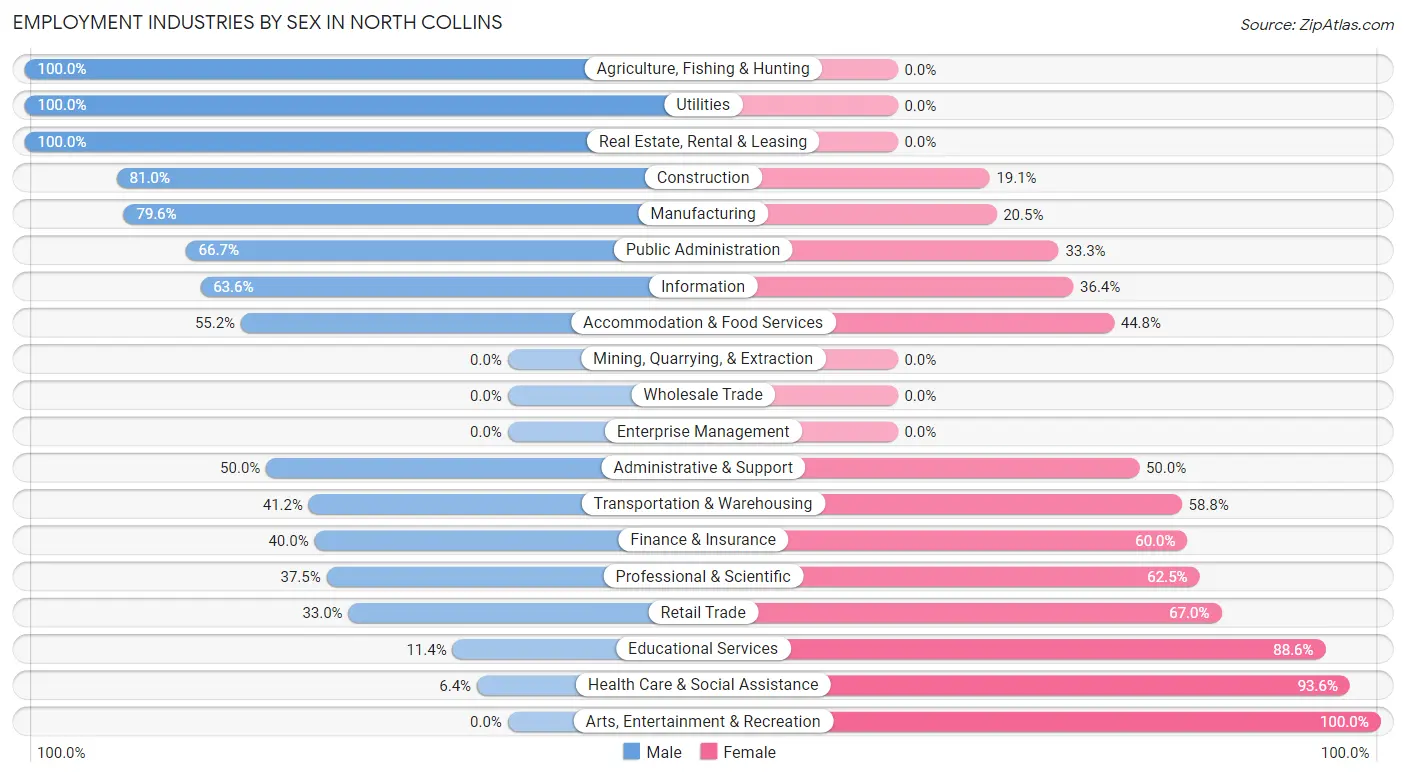
Employment Industries by Sex in North Collins
The North Collins industries that see more men than women are Agriculture, Fishing & Hunting (100.0%), Utilities (100.0%), and Real Estate, Rental & Leasing (100.0%), whereas the industries that tend to have a higher number of women are Arts, Entertainment & Recreation (100.0%), Health Care & Social Assistance (93.6%), and Educational Services (88.6%).
| Industry | Male | Female |
| Agriculture, Fishing & Hunting | 2 (100.0%) | 0 (0.0%) |
| Mining, Quarrying, & Extraction | 0 (0.0%) | 0 (0.0%) |
| Construction | 17 (80.9%) | 4 (19.1%) |
| Manufacturing | 70 (79.5%) | 18 (20.4%) |
| Wholesale Trade | 0 (0.0%) | 0 (0.0%) |
| Retail Trade | 30 (33.0%) | 61 (67.0%) |
| Transportation & Warehousing | 14 (41.2%) | 20 (58.8%) |
| Utilities | 9 (100.0%) | 0 (0.0%) |
| Information | 7 (63.6%) | 4 (36.4%) |
| Finance & Insurance | 8 (40.0%) | 12 (60.0%) |
| Real Estate, Rental & Leasing | 4 (100.0%) | 0 (0.0%) |
| Professional & Scientific | 3 (37.5%) | 5 (62.5%) |
| Enterprise Management | 0 (0.0%) | 0 (0.0%) |
| Administrative & Support | 3 (50.0%) | 3 (50.0%) |
| Educational Services | 4 (11.4%) | 31 (88.6%) |
| Health Care & Social Assistance | 3 (6.4%) | 44 (93.6%) |
| Arts, Entertainment & Recreation | 0 (0.0%) | 3 (100.0%) |
| Accommodation & Food Services | 37 (55.2%) | 30 (44.8%) |
| Public Administration | 30 (66.7%) | 15 (33.3%) |
| Total | 265 (49.9%) | 266 (50.1%) |
Education in North Collins
School Enrollment in North Collins
The most common levels of schooling among the 313 students in North Collins are middle school (93 | 29.7%), high school (81 | 25.9%), and college / undergraduate (57 | 18.2%).
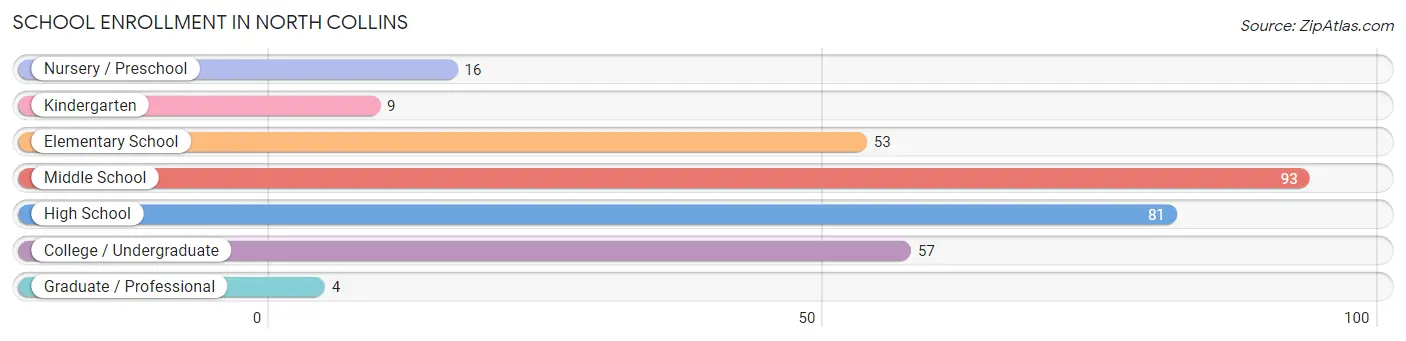
| School Level | # Students | % Students |
| Nursery / Preschool | 16 | 5.1% |
| Kindergarten | 9 | 2.9% |
| Elementary School | 53 | 16.9% |
| Middle School | 93 | 29.7% |
| High School | 81 | 25.9% |
| College / Undergraduate | 57 | 18.2% |
| Graduate / Professional | 4 | 1.3% |
| Total | 313 | 100.0% |
School Enrollment by Age by Funding Source in North Collins
Out of a total of 313 students who are enrolled in schools in North Collins, 34 (10.9%) attend a private institution, while the remaining 279 (89.1%) are enrolled in public schools. The age group of 35 years and over has the highest likelihood of being enrolled in private schools, with 10 (100.0% in the age bracket) enrolled. Conversely, the age group of 3 to 4 year olds has the lowest likelihood of being enrolled in a private school, with 11 (100.0% in the age bracket) attending a public institution.
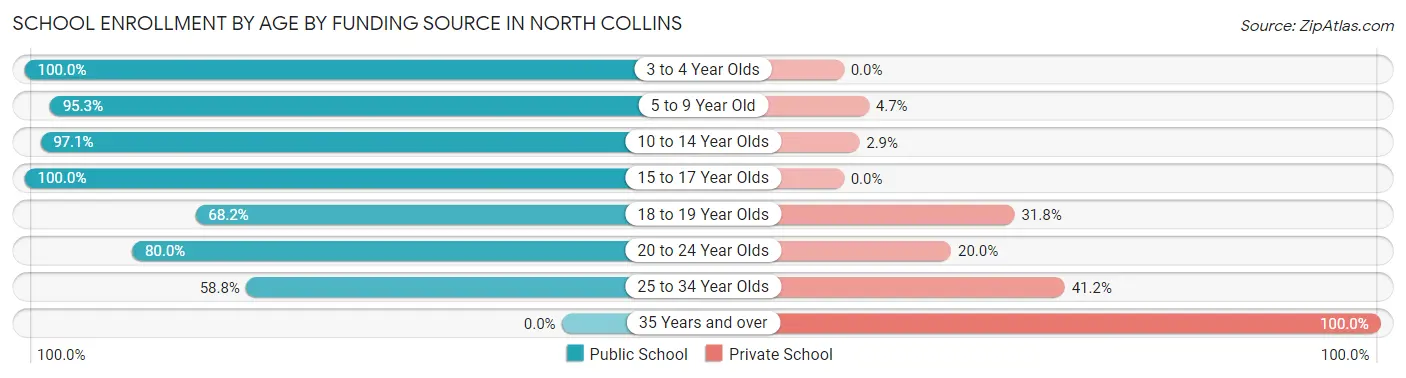
| Age Bracket | Public School | Private School |
| 3 to 4 Year Olds | 11 (100.0%) | 0 (0.0%) |
| 5 to 9 Year Old | 61 (95.3%) | 3 (4.7%) |
| 10 to 14 Year Olds | 100 (97.1%) | 3 (2.9%) |
| 15 to 17 Year Olds | 66 (100.0%) | 0 (0.0%) |
| 18 to 19 Year Olds | 15 (68.2%) | 7 (31.8%) |
| 20 to 24 Year Olds | 16 (80.0%) | 4 (20.0%) |
| 25 to 34 Year Olds | 10 (58.8%) | 7 (41.2%) |
| 35 Years and over | 0 (0.0%) | 10 (100.0%) |
| Total | 279 (89.1%) | 34 (10.9%) |
Educational Attainment by Field of Study in North Collins
Science & technology (29 | 20.4%), education (25 | 17.6%), bio, nature & agricultural (19 | 13.4%), business (14 | 9.9%), and liberal arts & history (11 | 7.7%) are the most common fields of study among 142 individuals in North Collins who have obtained a bachelor's degree or higher.
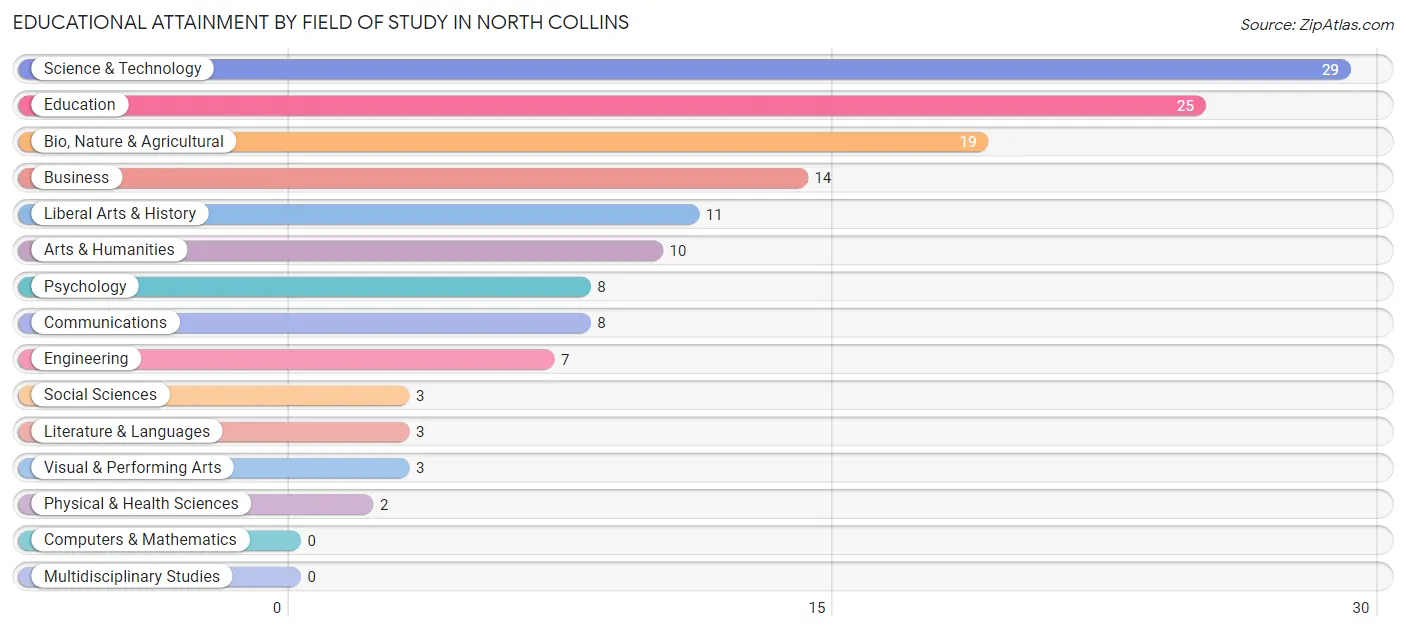
| Field of Study | # Graduates | % Graduates |
| Computers & Mathematics | 0 | 0.0% |
| Bio, Nature & Agricultural | 19 | 13.4% |
| Physical & Health Sciences | 2 | 1.4% |
| Psychology | 8 | 5.6% |
| Social Sciences | 3 | 2.1% |
| Engineering | 7 | 4.9% |
| Multidisciplinary Studies | 0 | 0.0% |
| Science & Technology | 29 | 20.4% |
| Business | 14 | 9.9% |
| Education | 25 | 17.6% |
| Literature & Languages | 3 | 2.1% |
| Liberal Arts & History | 11 | 7.7% |
| Visual & Performing Arts | 3 | 2.1% |
| Communications | 8 | 5.6% |
| Arts & Humanities | 10 | 7.0% |
| Total | 142 | 100.0% |
Transportation & Commute in North Collins
Vehicle Availability by Sex in North Collins
The most prevalent vehicle ownership categories in North Collins are males with 2 vehicles (112, accounting for 42.6%) and females with 2 vehicles (120, making up 45.7%).
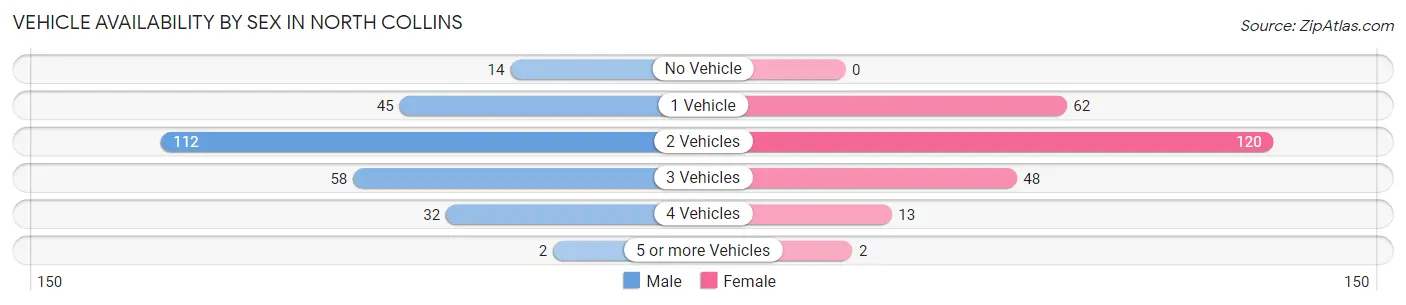
| Vehicles Available | Male | Female |
| No Vehicle | 14 (5.3%) | 0 (0.0%) |
| 1 Vehicle | 45 (17.1%) | 62 (25.3%) |
| 2 Vehicles | 112 (42.6%) | 120 (49.0%) |
| 3 Vehicles | 58 (22.1%) | 48 (19.6%) |
| 4 Vehicles | 32 (12.2%) | 13 (5.3%) |
| 5 or more Vehicles | 2 (0.8%) | 2 (0.8%) |
| Total | 263 (100.0%) | 245 (100.0%) |
Commute Time in North Collins
The most frequently occuring commute durations in North Collins are less than 5 minutes (76 commuters, 16.0%), 20 to 24 minutes (66 commuters, 13.9%), and 10 to 14 minutes (61 commuters, 12.8%).
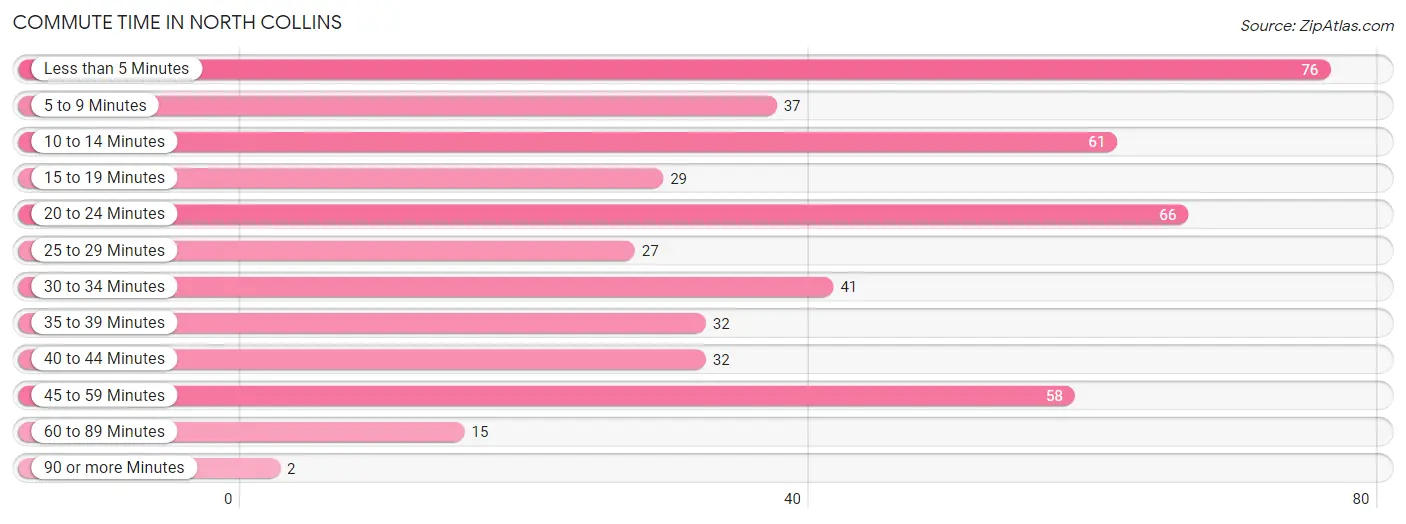
| Commute Time | # Commuters | % Commuters |
| Less than 5 Minutes | 76 | 16.0% |
| 5 to 9 Minutes | 37 | 7.8% |
| 10 to 14 Minutes | 61 | 12.8% |
| 15 to 19 Minutes | 29 | 6.1% |
| 20 to 24 Minutes | 66 | 13.9% |
| 25 to 29 Minutes | 27 | 5.7% |
| 30 to 34 Minutes | 41 | 8.6% |
| 35 to 39 Minutes | 32 | 6.7% |
| 40 to 44 Minutes | 32 | 6.7% |
| 45 to 59 Minutes | 58 | 12.2% |
| 60 to 89 Minutes | 15 | 3.2% |
| 90 or more Minutes | 2 | 0.4% |
Commute Time by Sex in North Collins
The most common commute times in North Collins are less than 5 minutes (51 commuters, 20.7%) for males and 20 to 24 minutes (40 commuters, 17.4%) for females.
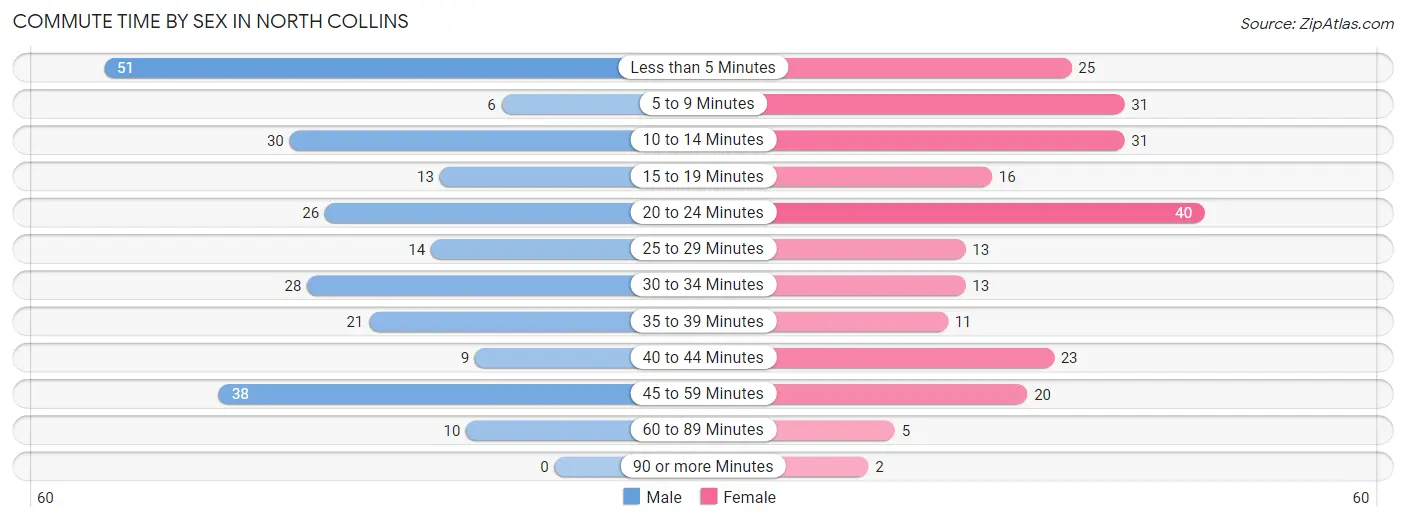
| Commute Time | Male | Female |
| Less than 5 Minutes | 51 (20.7%) | 25 (10.9%) |
| 5 to 9 Minutes | 6 (2.4%) | 31 (13.5%) |
| 10 to 14 Minutes | 30 (12.2%) | 31 (13.5%) |
| 15 to 19 Minutes | 13 (5.3%) | 16 (7.0%) |
| 20 to 24 Minutes | 26 (10.6%) | 40 (17.4%) |
| 25 to 29 Minutes | 14 (5.7%) | 13 (5.7%) |
| 30 to 34 Minutes | 28 (11.4%) | 13 (5.7%) |
| 35 to 39 Minutes | 21 (8.5%) | 11 (4.8%) |
| 40 to 44 Minutes | 9 (3.7%) | 23 (10.0%) |
| 45 to 59 Minutes | 38 (15.4%) | 20 (8.7%) |
| 60 to 89 Minutes | 10 (4.1%) | 5 (2.2%) |
| 90 or more Minutes | 0 (0.0%) | 2 (0.9%) |
Time of Departure to Work by Sex in North Collins
The most frequent times of departure to work in North Collins are 4:00 PM to 11:59 PM (41, 16.7%) for males and 7:30 AM to 7:59 AM (57, 24.8%) for females.
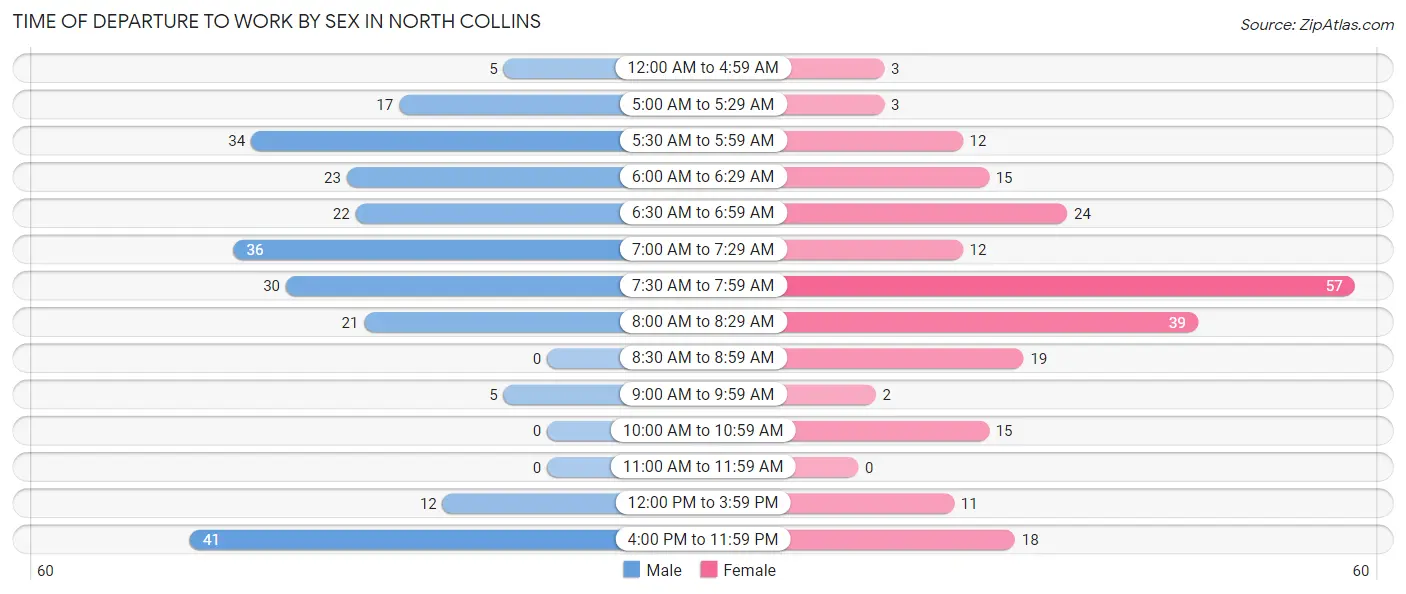
| Time of Departure | Male | Female |
| 12:00 AM to 4:59 AM | 5 (2.0%) | 3 (1.3%) |
| 5:00 AM to 5:29 AM | 17 (6.9%) | 3 (1.3%) |
| 5:30 AM to 5:59 AM | 34 (13.8%) | 12 (5.2%) |
| 6:00 AM to 6:29 AM | 23 (9.3%) | 15 (6.5%) |
| 6:30 AM to 6:59 AM | 22 (8.9%) | 24 (10.4%) |
| 7:00 AM to 7:29 AM | 36 (14.6%) | 12 (5.2%) |
| 7:30 AM to 7:59 AM | 30 (12.2%) | 57 (24.8%) |
| 8:00 AM to 8:29 AM | 21 (8.5%) | 39 (17.0%) |
| 8:30 AM to 8:59 AM | 0 (0.0%) | 19 (8.3%) |
| 9:00 AM to 9:59 AM | 5 (2.0%) | 2 (0.9%) |
| 10:00 AM to 10:59 AM | 0 (0.0%) | 15 (6.5%) |
| 11:00 AM to 11:59 AM | 0 (0.0%) | 0 (0.0%) |
| 12:00 PM to 3:59 PM | 12 (4.9%) | 11 (4.8%) |
| 4:00 PM to 11:59 PM | 41 (16.7%) | 18 (7.8%) |
| Total | 246 (100.0%) | 230 (100.0%) |
Housing Occupancy in North Collins
Occupancy by Ownership in North Collins
Of the total 523 dwellings in North Collins, owner-occupied units account for 305 (58.3%), while renter-occupied units make up 218 (41.7%).
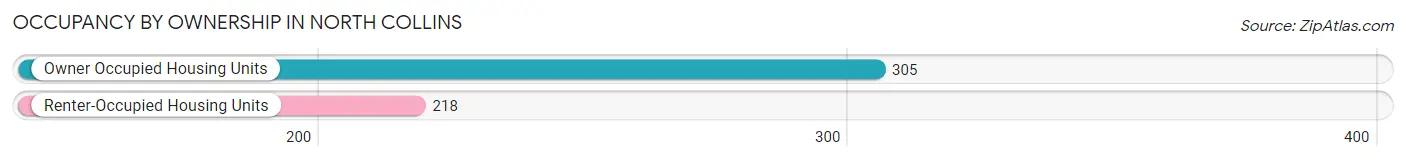
| Occupancy | # Housing Units | % Housing Units |
| Owner Occupied Housing Units | 305 | 58.3% |
| Renter-Occupied Housing Units | 218 | 41.7% |
| Total Occupied Housing Units | 523 | 100.0% |
Occupancy by Household Size in North Collins
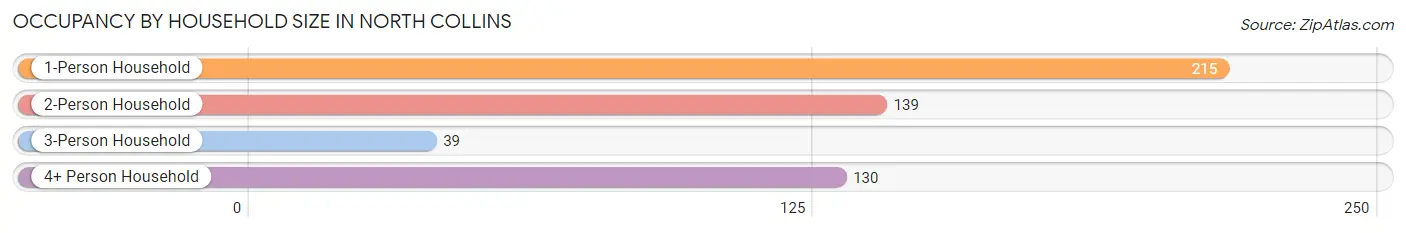
| Household Size | # Housing Units | % Housing Units |
| 1-Person Household | 215 | 41.1% |
| 2-Person Household | 139 | 26.6% |
| 3-Person Household | 39 | 7.5% |
| 4+ Person Household | 130 | 24.9% |
| Total Housing Units | 523 | 100.0% |
Occupancy by Ownership by Household Size in North Collins
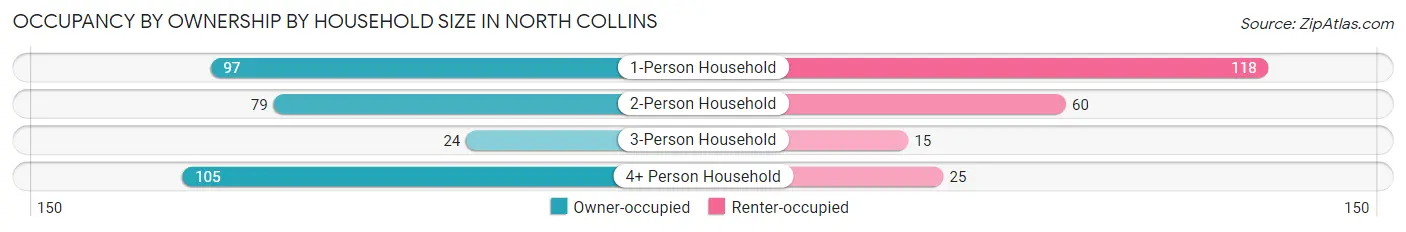
| Household Size | Owner-occupied | Renter-occupied |
| 1-Person Household | 97 (45.1%) | 118 (54.9%) |
| 2-Person Household | 79 (56.8%) | 60 (43.2%) |
| 3-Person Household | 24 (61.5%) | 15 (38.5%) |
| 4+ Person Household | 105 (80.8%) | 25 (19.2%) |
| Total Housing Units | 305 (58.3%) | 218 (41.7%) |
Occupancy by Educational Attainment in North Collins
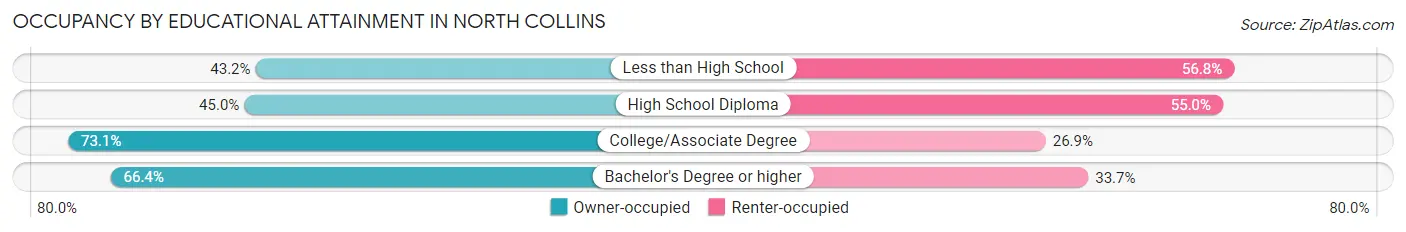
| Household Size | Owner-occupied | Renter-occupied |
| Less than High School | 16 (43.2%) | 21 (56.8%) |
| High School Diploma | 95 (45.0%) | 116 (55.0%) |
| College/Associate Degree | 125 (73.1%) | 46 (26.9%) |
| Bachelor's Degree or higher | 69 (66.3%) | 35 (33.7%) |
Occupancy by Age of Householder in North Collins
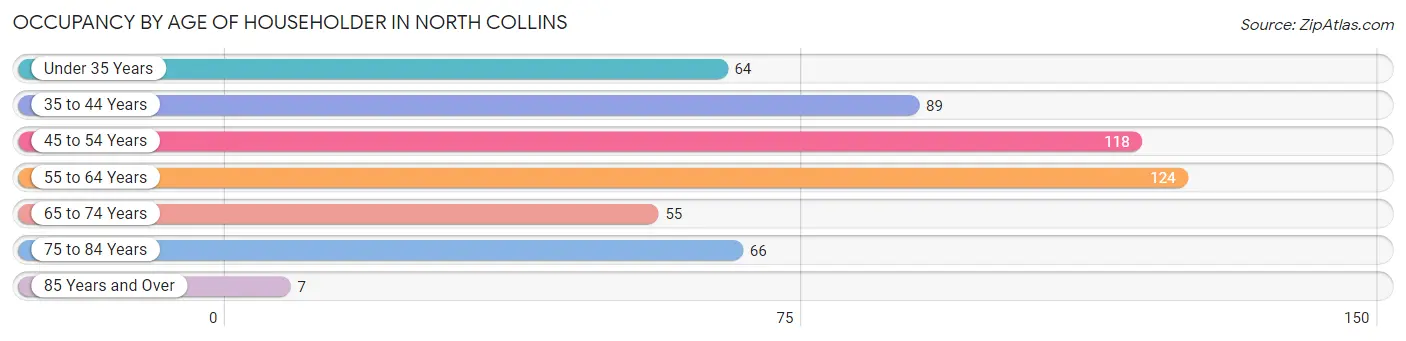
| Age Bracket | # Households | % Households |
| Under 35 Years | 64 | 12.2% |
| 35 to 44 Years | 89 | 17.0% |
| 45 to 54 Years | 118 | 22.6% |
| 55 to 64 Years | 124 | 23.7% |
| 65 to 74 Years | 55 | 10.5% |
| 75 to 84 Years | 66 | 12.6% |
| 85 Years and Over | 7 | 1.3% |
| Total | 523 | 100.0% |
Housing Finances in North Collins
Median Income by Occupancy in North Collins
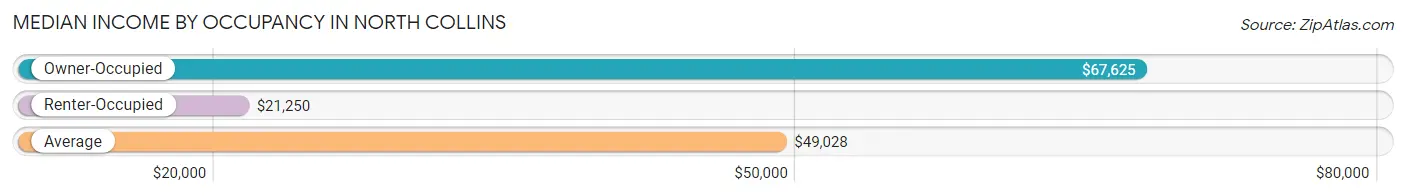
| Occupancy Type | # Households | Median Income |
| Owner-Occupied | 305 (58.3%) | $67,625 |
| Renter-Occupied | 218 (41.7%) | $21,250 |
| Average | 523 (100.0%) | $49,028 |
Occupancy by Householder Income Bracket in North Collins
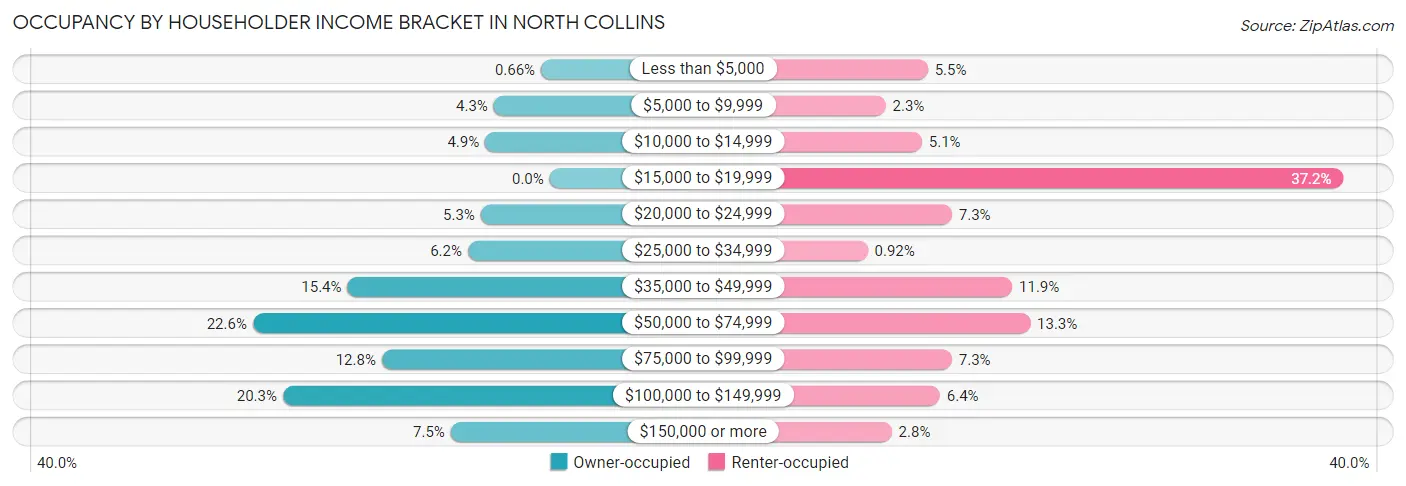
| Income Bracket | Owner-occupied | Renter-occupied |
| Less than $5,000 | 2 (0.7%) | 12 (5.5%) |
| $5,000 to $9,999 | 13 (4.3%) | 5 (2.3%) |
| $10,000 to $14,999 | 15 (4.9%) | 11 (5.1%) |
| $15,000 to $19,999 | 0 (0.0%) | 81 (37.2%) |
| $20,000 to $24,999 | 16 (5.2%) | 16 (7.3%) |
| $25,000 to $34,999 | 19 (6.2%) | 2 (0.9%) |
| $35,000 to $49,999 | 47 (15.4%) | 26 (11.9%) |
| $50,000 to $74,999 | 69 (22.6%) | 29 (13.3%) |
| $75,000 to $99,999 | 39 (12.8%) | 16 (7.3%) |
| $100,000 to $149,999 | 62 (20.3%) | 14 (6.4%) |
| $150,000 or more | 23 (7.5%) | 6 (2.8%) |
| Total | 305 (100.0%) | 218 (100.0%) |
Monthly Housing Cost Tiers in North Collins
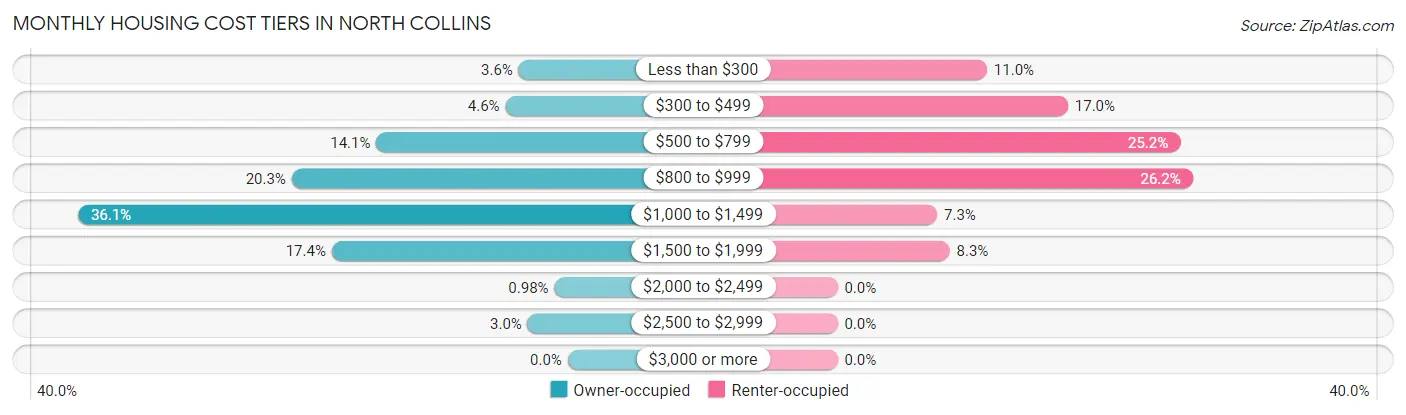
| Monthly Cost | Owner-occupied | Renter-occupied |
| Less than $300 | 11 (3.6%) | 24 (11.0%) |
| $300 to $499 | 14 (4.6%) | 37 (17.0%) |
| $500 to $799 | 43 (14.1%) | 55 (25.2%) |
| $800 to $999 | 62 (20.3%) | 57 (26.2%) |
| $1,000 to $1,499 | 110 (36.1%) | 16 (7.3%) |
| $1,500 to $1,999 | 53 (17.4%) | 18 (8.3%) |
| $2,000 to $2,499 | 3 (1.0%) | 0 (0.0%) |
| $2,500 to $2,999 | 9 (2.9%) | 0 (0.0%) |
| $3,000 or more | 0 (0.0%) | 0 (0.0%) |
| Total | 305 (100.0%) | 218 (100.0%) |
Physical Housing Characteristics in North Collins
Housing Structures in North Collins
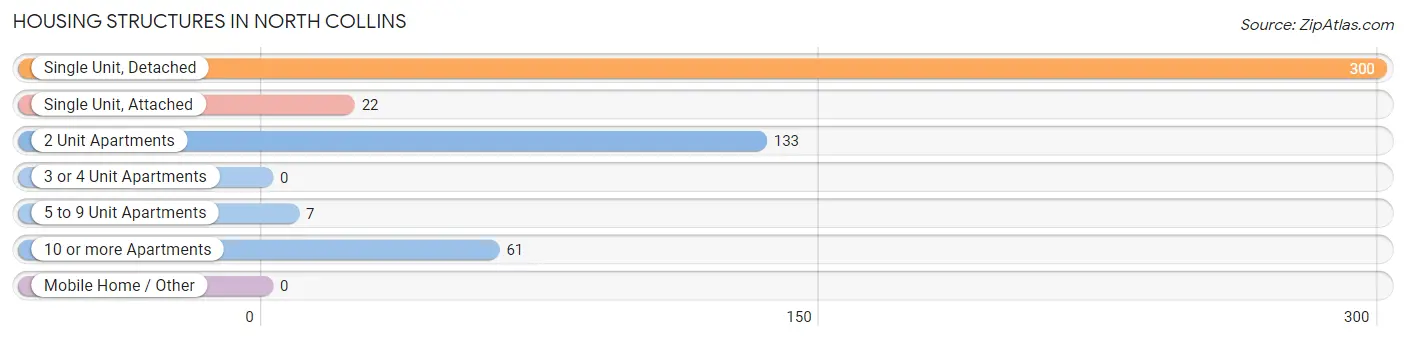
| Structure Type | # Housing Units | % Housing Units |
| Single Unit, Detached | 300 | 57.4% |
| Single Unit, Attached | 22 | 4.2% |
| 2 Unit Apartments | 133 | 25.4% |
| 3 or 4 Unit Apartments | 0 | 0.0% |
| 5 to 9 Unit Apartments | 7 | 1.3% |
| 10 or more Apartments | 61 | 11.7% |
| Mobile Home / Other | 0 | 0.0% |
| Total | 523 | 100.0% |
Housing Structures by Occupancy in North Collins
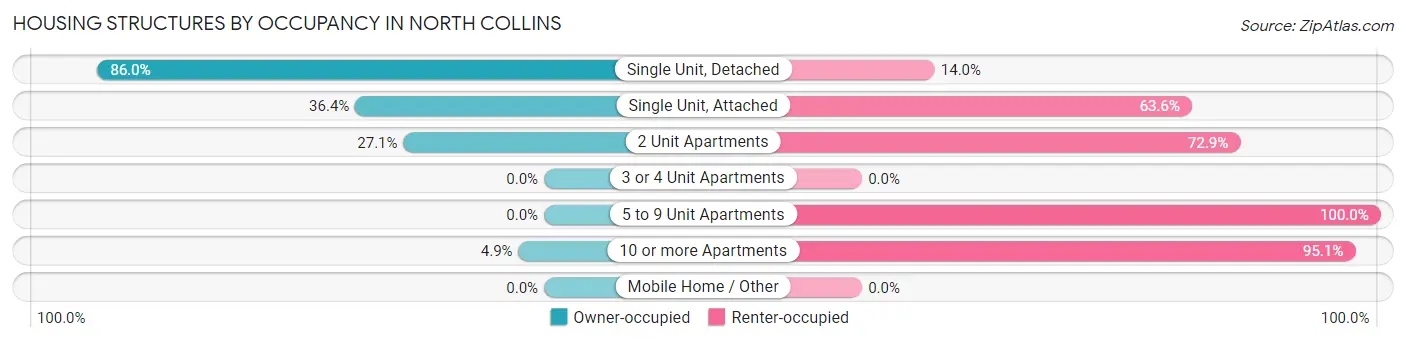
| Structure Type | Owner-occupied | Renter-occupied |
| Single Unit, Detached | 258 (86.0%) | 42 (14.0%) |
| Single Unit, Attached | 8 (36.4%) | 14 (63.6%) |
| 2 Unit Apartments | 36 (27.1%) | 97 (72.9%) |
| 3 or 4 Unit Apartments | 0 (0.0%) | 0 (0.0%) |
| 5 to 9 Unit Apartments | 0 (0.0%) | 7 (100.0%) |
| 10 or more Apartments | 3 (4.9%) | 58 (95.1%) |
| Mobile Home / Other | 0 (0.0%) | 0 (0.0%) |
| Total | 305 (58.3%) | 218 (41.7%) |
Housing Structures by Number of Rooms in North Collins
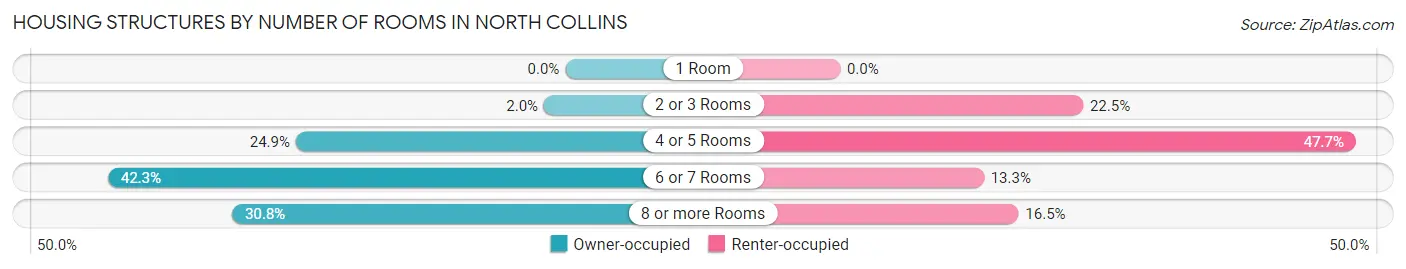
| Number of Rooms | Owner-occupied | Renter-occupied |
| 1 Room | 0 (0.0%) | 0 (0.0%) |
| 2 or 3 Rooms | 6 (2.0%) | 49 (22.5%) |
| 4 or 5 Rooms | 76 (24.9%) | 104 (47.7%) |
| 6 or 7 Rooms | 129 (42.3%) | 29 (13.3%) |
| 8 or more Rooms | 94 (30.8%) | 36 (16.5%) |
| Total | 305 (100.0%) | 218 (100.0%) |
Housing Structure by Heating Type in North Collins
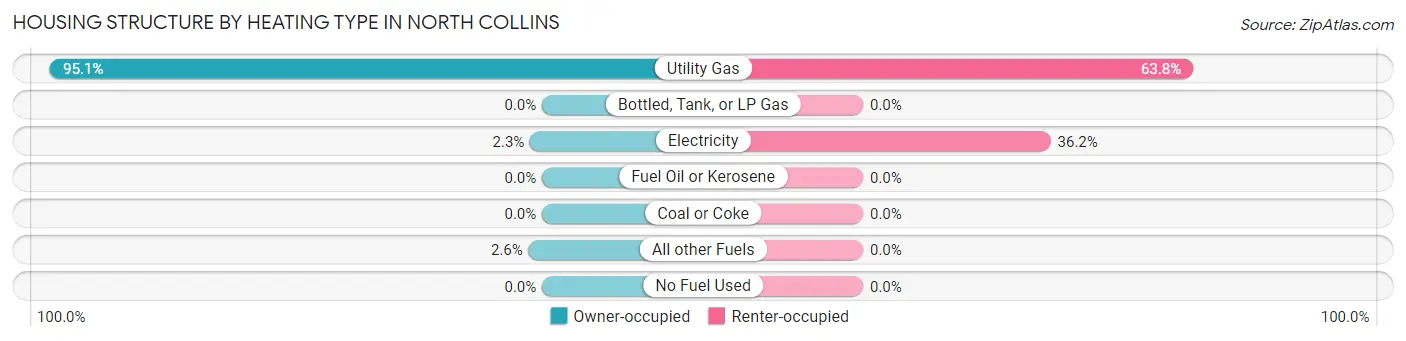
| Heating Type | Owner-occupied | Renter-occupied |
| Utility Gas | 290 (95.1%) | 139 (63.8%) |
| Bottled, Tank, or LP Gas | 0 (0.0%) | 0 (0.0%) |
| Electricity | 7 (2.3%) | 79 (36.2%) |
| Fuel Oil or Kerosene | 0 (0.0%) | 0 (0.0%) |
| Coal or Coke | 0 (0.0%) | 0 (0.0%) |
| All other Fuels | 8 (2.6%) | 0 (0.0%) |
| No Fuel Used | 0 (0.0%) | 0 (0.0%) |
| Total | 305 (100.0%) | 218 (100.0%) |
Household Vehicle Usage in North Collins
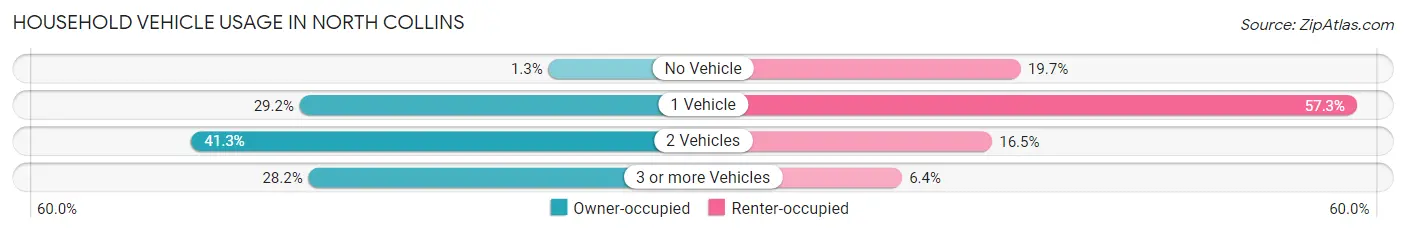
| Vehicles per Household | Owner-occupied | Renter-occupied |
| No Vehicle | 4 (1.3%) | 43 (19.7%) |
| 1 Vehicle | 89 (29.2%) | 125 (57.3%) |
| 2 Vehicles | 126 (41.3%) | 36 (16.5%) |
| 3 or more Vehicles | 86 (28.2%) | 14 (6.4%) |
| Total | 305 (100.0%) | 218 (100.0%) |
Real Estate & Mortgages in North Collins
Real Estate and Mortgage Overview in North Collins
| Characteristic | Without Mortgage | With Mortgage |
| Housing Units | 82 | 223 |
| Median Property Value | $109,700 | $124,000 |
| Median Household Income | $66,250 | $23 |
| Monthly Housing Costs | $673 | $0 |
| Real Estate Taxes | $3,545 | $4 |
Property Value by Mortgage Status in North Collins
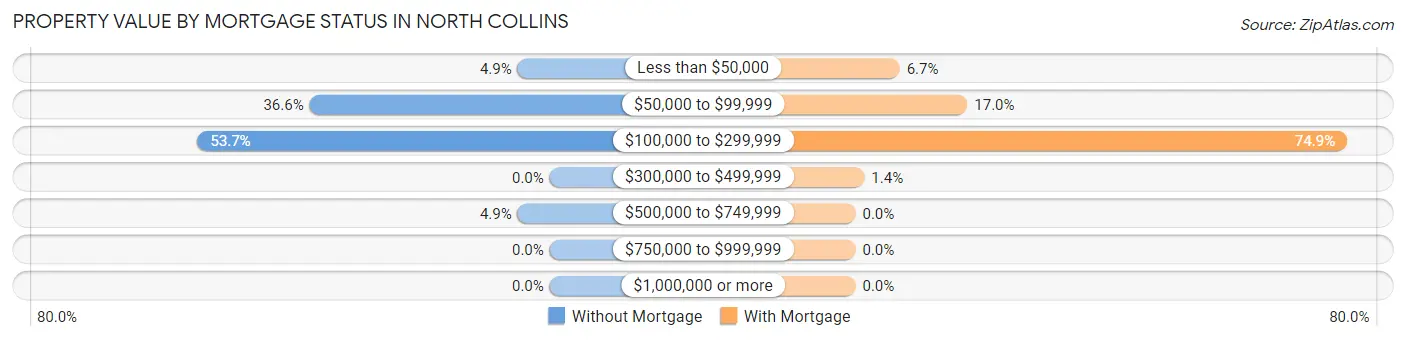
| Property Value | Without Mortgage | With Mortgage |
| Less than $50,000 | 4 (4.9%) | 15 (6.7%) |
| $50,000 to $99,999 | 30 (36.6%) | 38 (17.0%) |
| $100,000 to $299,999 | 44 (53.7%) | 167 (74.9%) |
| $300,000 to $499,999 | 0 (0.0%) | 3 (1.3%) |
| $500,000 to $749,999 | 4 (4.9%) | 0 (0.0%) |
| $750,000 to $999,999 | 0 (0.0%) | 0 (0.0%) |
| $1,000,000 or more | 0 (0.0%) | 0 (0.0%) |
| Total | 82 (100.0%) | 223 (100.0%) |
Household Income by Mortgage Status in North Collins
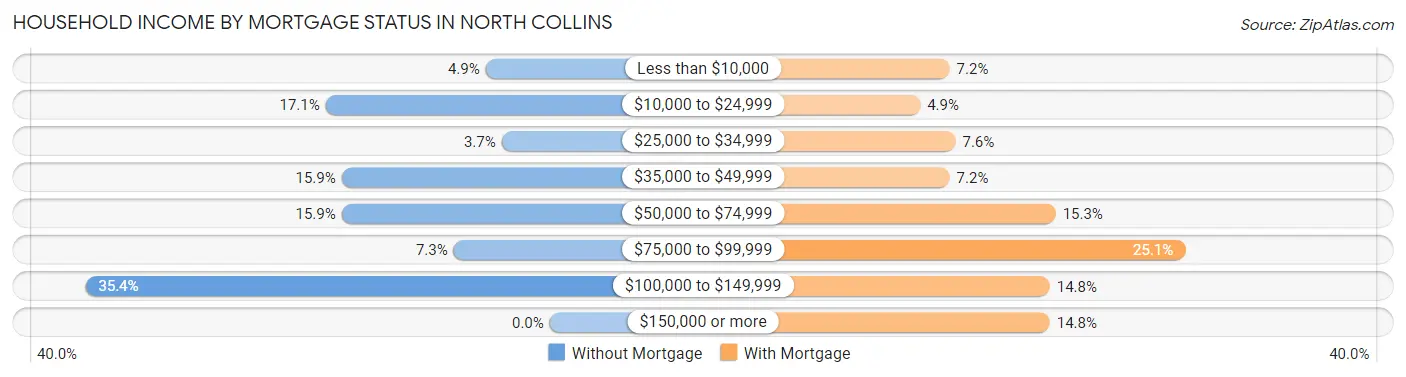
| Household Income | Without Mortgage | With Mortgage |
| Less than $10,000 | 4 (4.9%) | 16 (7.2%) |
| $10,000 to $24,999 | 14 (17.1%) | 11 (4.9%) |
| $25,000 to $34,999 | 3 (3.7%) | 17 (7.6%) |
| $35,000 to $49,999 | 13 (15.9%) | 16 (7.2%) |
| $50,000 to $74,999 | 13 (15.9%) | 34 (15.2%) |
| $75,000 to $99,999 | 6 (7.3%) | 56 (25.1%) |
| $100,000 to $149,999 | 29 (35.4%) | 33 (14.8%) |
| $150,000 or more | 0 (0.0%) | 33 (14.8%) |
| Total | 82 (100.0%) | 223 (100.0%) |
Property Value to Household Income Ratio in North Collins
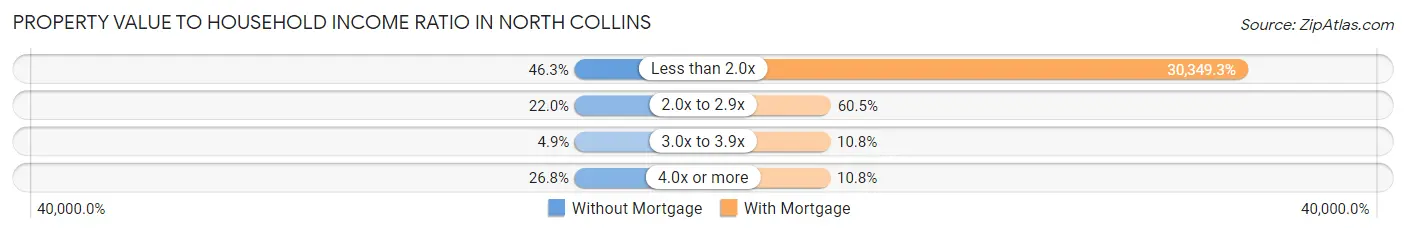
| Value-to-Income Ratio | Without Mortgage | With Mortgage |
| Less than 2.0x | 38 (46.3%) | 67,679 (30,349.3%) |
| 2.0x to 2.9x | 18 (22.0%) | 135 (60.5%) |
| 3.0x to 3.9x | 4 (4.9%) | 24 (10.8%) |
| 4.0x or more | 22 (26.8%) | 24 (10.8%) |
| Total | 82 (100.0%) | 223 (100.0%) |
Real Estate Taxes by Mortgage Status in North Collins
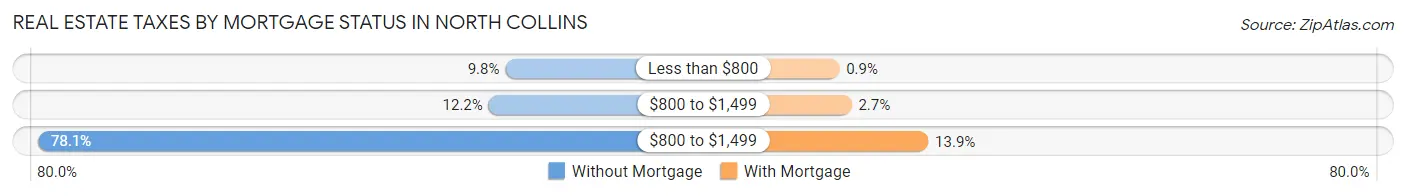
| Property Taxes | Without Mortgage | With Mortgage |
| Less than $800 | 8 (9.8%) | 2 (0.9%) |
| $800 to $1,499 | 10 (12.2%) | 6 (2.7%) |
| $800 to $1,499 | 64 (78.0%) | 31 (13.9%) |
| Total | 82 (100.0%) | 223 (100.0%) |
Health & Disability in North Collins
Health Insurance Coverage by Age in North Collins
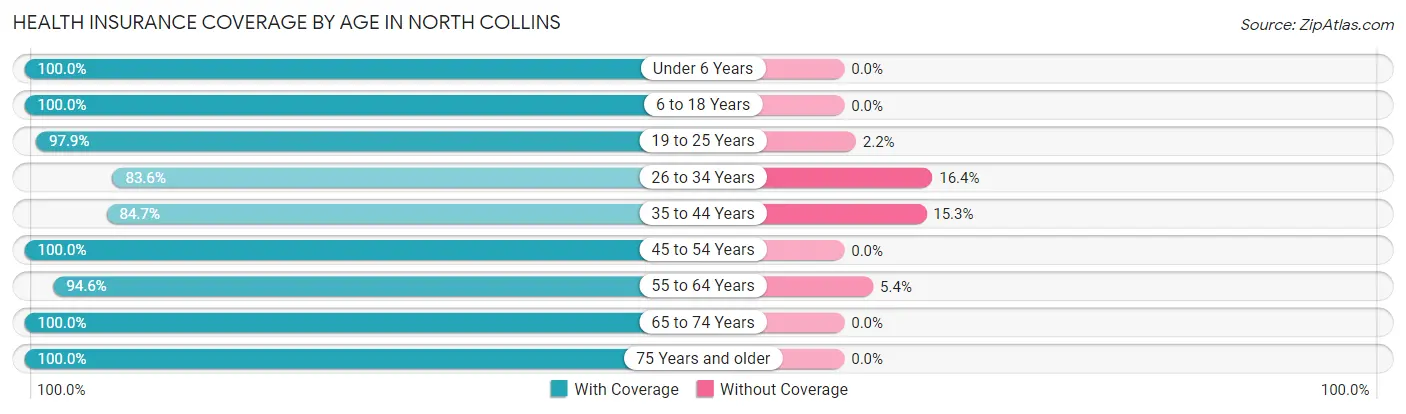
| Age Bracket | With Coverage | Without Coverage |
| Under 6 Years | 53 (100.0%) | 0 (0.0%) |
| 6 to 18 Years | 232 (100.0%) | 0 (0.0%) |
| 19 to 25 Years | 91 (97.9%) | 2 (2.1%) |
| 26 to 34 Years | 107 (83.6%) | 21 (16.4%) |
| 35 to 44 Years | 144 (84.7%) | 26 (15.3%) |
| 45 to 54 Years | 167 (100.0%) | 0 (0.0%) |
| 55 to 64 Years | 176 (94.6%) | 10 (5.4%) |
| 65 to 74 Years | 67 (100.0%) | 0 (0.0%) |
| 75 Years and older | 108 (100.0%) | 0 (0.0%) |
| Total | 1,145 (95.1%) | 59 (4.9%) |
Health Insurance Coverage by Citizenship Status in North Collins
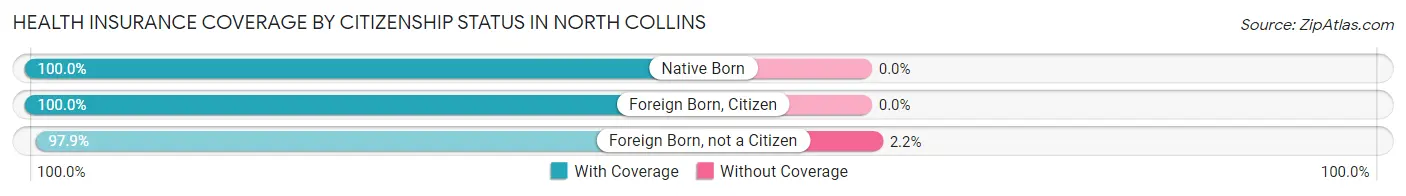
| Citizenship Status | With Coverage | Without Coverage |
| Native Born | 53 (100.0%) | 0 (0.0%) |
| Foreign Born, Citizen | 232 (100.0%) | 0 (0.0%) |
| Foreign Born, not a Citizen | 91 (97.9%) | 2 (2.1%) |
Health Insurance Coverage by Household Income in North Collins
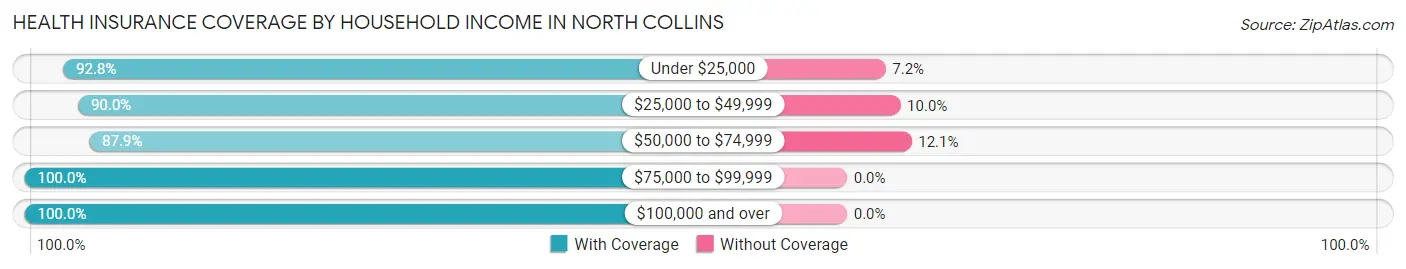
| Household Income | With Coverage | Without Coverage |
| Under $25,000 | 244 (92.8%) | 19 (7.2%) |
| $25,000 to $49,999 | 126 (90.0%) | 14 (10.0%) |
| $50,000 to $74,999 | 189 (87.9%) | 26 (12.1%) |
| $75,000 to $99,999 | 182 (100.0%) | 0 (0.0%) |
| $100,000 and over | 396 (100.0%) | 0 (0.0%) |
Public vs Private Health Insurance Coverage by Age in North Collins
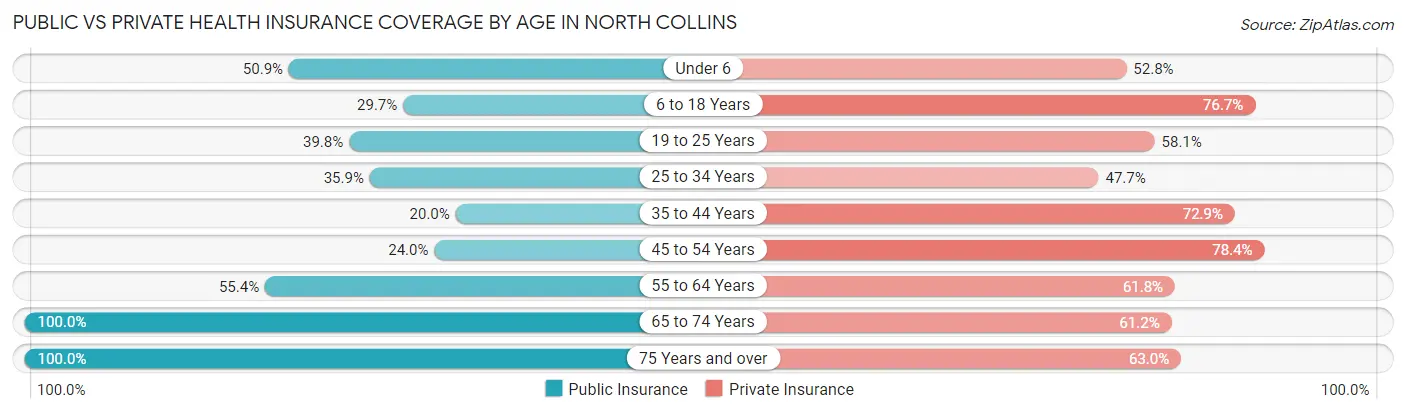
| Age Bracket | Public Insurance | Private Insurance |
| Under 6 | 27 (50.9%) | 28 (52.8%) |
| 6 to 18 Years | 69 (29.7%) | 178 (76.7%) |
| 19 to 25 Years | 37 (39.8%) | 54 (58.1%) |
| 25 to 34 Years | 46 (35.9%) | 61 (47.7%) |
| 35 to 44 Years | 34 (20.0%) | 124 (72.9%) |
| 45 to 54 Years | 40 (23.9%) | 131 (78.4%) |
| 55 to 64 Years | 103 (55.4%) | 115 (61.8%) |
| 65 to 74 Years | 67 (100.0%) | 41 (61.2%) |
| 75 Years and over | 108 (100.0%) | 68 (63.0%) |
| Total | 531 (44.1%) | 800 (66.4%) |
Disability Status by Sex by Age in North Collins
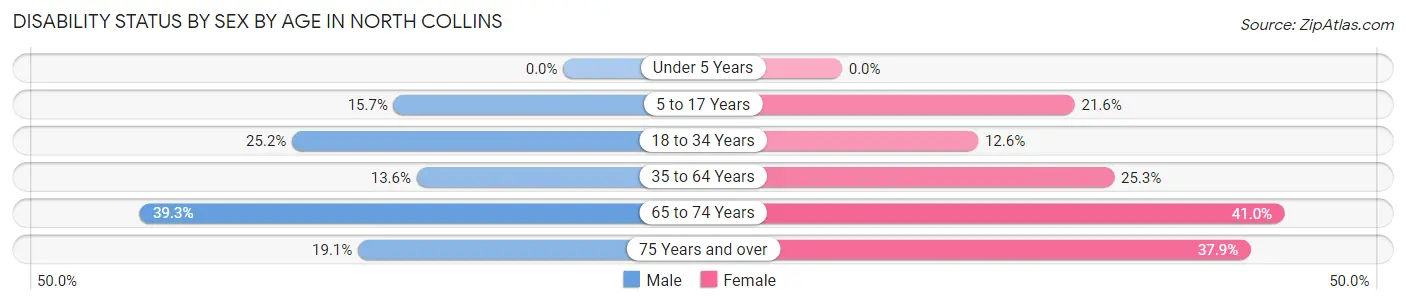
| Age Bracket | Male | Female |
| Under 5 Years | 0 (0.0%) | 0 (0.0%) |
| 5 to 17 Years | 17 (15.7%) | 27 (21.6%) |
| 18 to 34 Years | 36 (25.2%) | 11 (12.6%) |
| 35 to 64 Years | 34 (13.6%) | 69 (25.3%) |
| 65 to 74 Years | 11 (39.3%) | 16 (41.0%) |
| 75 Years and over | 8 (19.1%) | 25 (37.9%) |
Disability Class by Sex by Age in North Collins
Disability Class: Hearing Difficulty
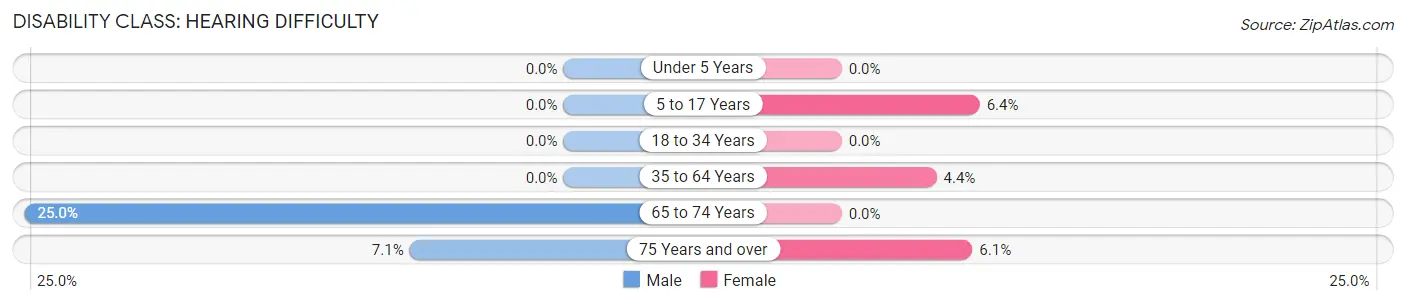
| Age Bracket | Male | Female |
| Under 5 Years | 0 (0.0%) | 0 (0.0%) |
| 5 to 17 Years | 0 (0.0%) | 8 (6.4%) |
| 18 to 34 Years | 0 (0.0%) | 0 (0.0%) |
| 35 to 64 Years | 0 (0.0%) | 12 (4.4%) |
| 65 to 74 Years | 7 (25.0%) | 0 (0.0%) |
| 75 Years and over | 3 (7.1%) | 4 (6.1%) |
Disability Class: Vision Difficulty
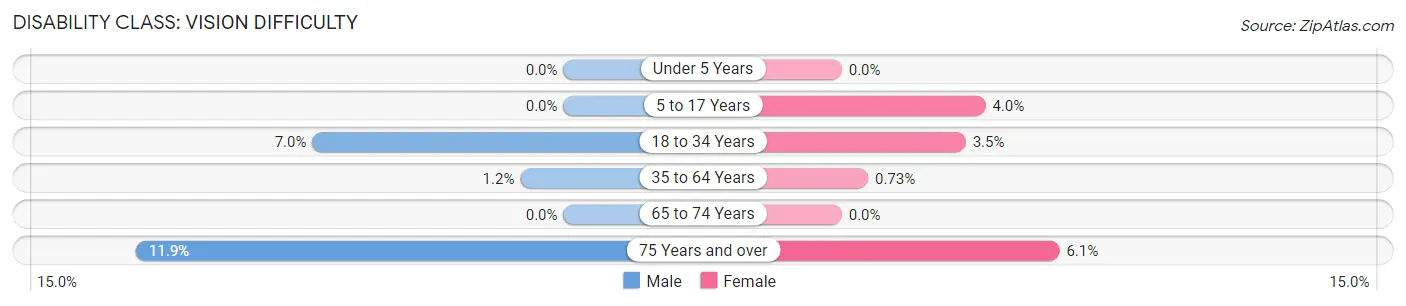
| Age Bracket | Male | Female |
| Under 5 Years | 0 (0.0%) | 0 (0.0%) |
| 5 to 17 Years | 0 (0.0%) | 5 (4.0%) |
| 18 to 34 Years | 10 (7.0%) | 3 (3.5%) |
| 35 to 64 Years | 3 (1.2%) | 2 (0.7%) |
| 65 to 74 Years | 0 (0.0%) | 0 (0.0%) |
| 75 Years and over | 5 (11.9%) | 4 (6.1%) |
Disability Class: Cognitive Difficulty
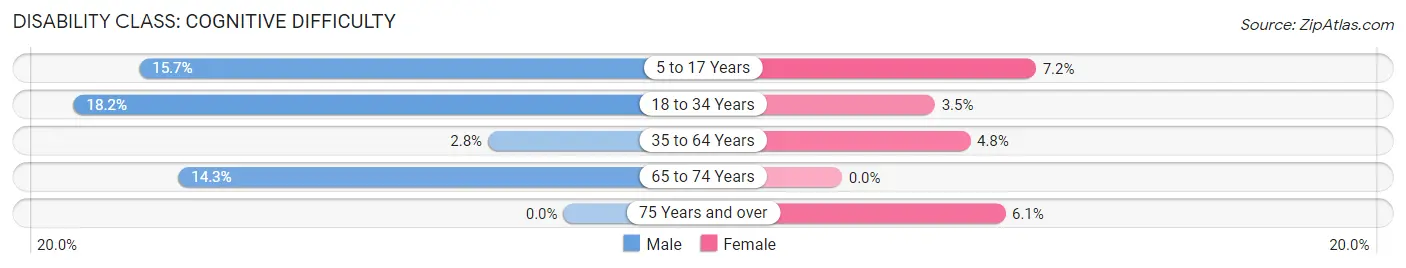
| Age Bracket | Male | Female |
| 5 to 17 Years | 17 (15.7%) | 9 (7.2%) |
| 18 to 34 Years | 26 (18.2%) | 3 (3.5%) |
| 35 to 64 Years | 7 (2.8%) | 13 (4.8%) |
| 65 to 74 Years | 4 (14.3%) | 0 (0.0%) |
| 75 Years and over | 0 (0.0%) | 4 (6.1%) |
Disability Class: Ambulatory Difficulty
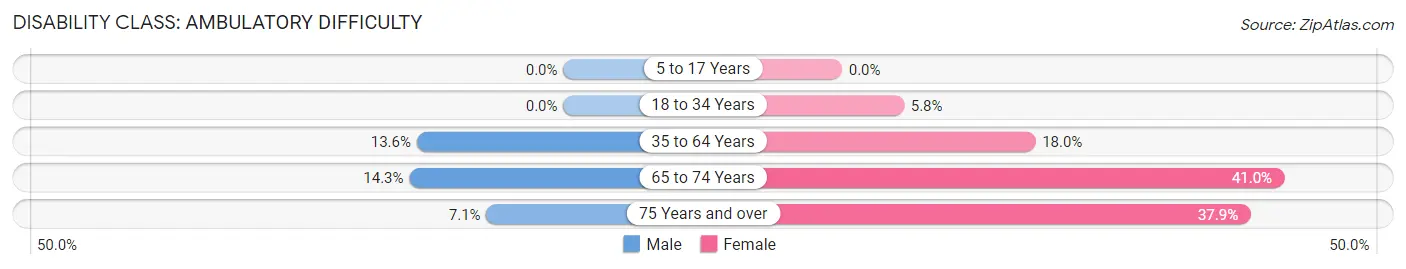
| Age Bracket | Male | Female |
| 5 to 17 Years | 0 (0.0%) | 0 (0.0%) |
| 18 to 34 Years | 0 (0.0%) | 5 (5.8%) |
| 35 to 64 Years | 34 (13.6%) | 49 (17.9%) |
| 65 to 74 Years | 4 (14.3%) | 16 (41.0%) |
| 75 Years and over | 3 (7.1%) | 25 (37.9%) |
Disability Class: Self-Care Difficulty
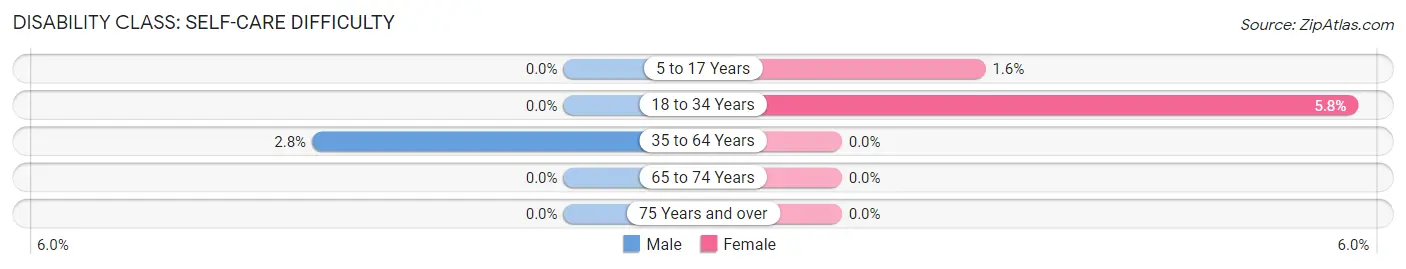
| Age Bracket | Male | Female |
| 5 to 17 Years | 0 (0.0%) | 2 (1.6%) |
| 18 to 34 Years | 0 (0.0%) | 5 (5.8%) |
| 35 to 64 Years | 7 (2.8%) | 0 (0.0%) |
| 65 to 74 Years | 0 (0.0%) | 0 (0.0%) |
| 75 Years and over | 0 (0.0%) | 0 (0.0%) |
Technology Access in North Collins
Computing Device Access in North Collins
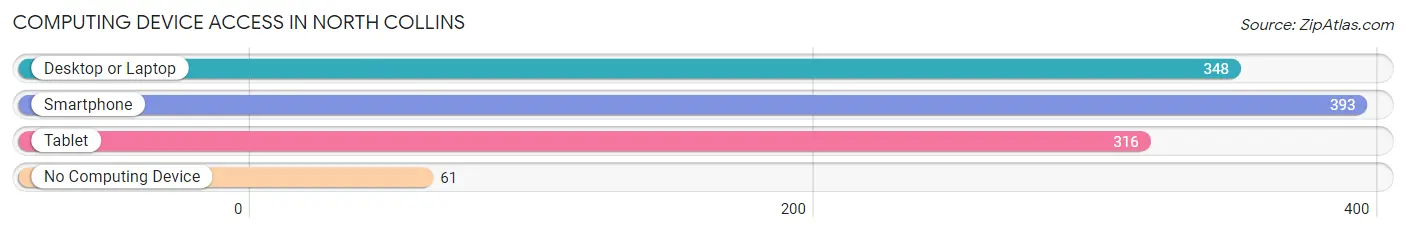
| Device Type | # Households | % Households |
| Desktop or Laptop | 348 | 66.5% |
| Smartphone | 393 | 75.1% |
| Tablet | 316 | 60.4% |
| No Computing Device | 61 | 11.7% |
| Total | 523 | 100.0% |
Internet Access in North Collins
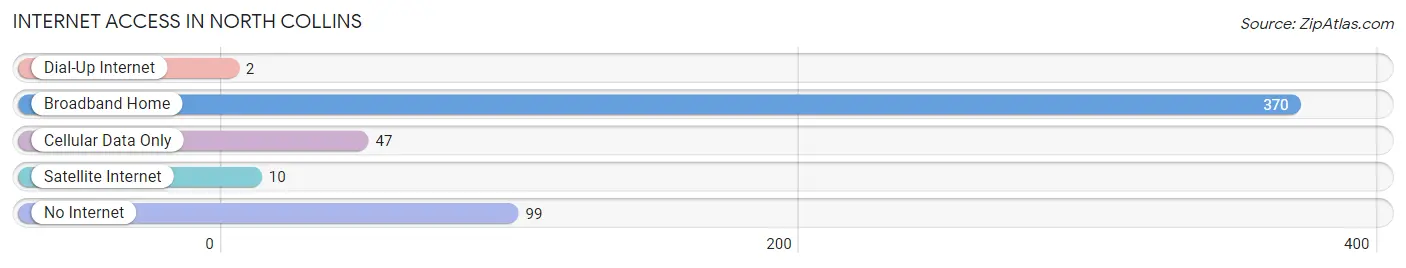
| Internet Type | # Households | % Households |
| Dial-Up Internet | 2 | 0.4% |
| Broadband Home | 370 | 70.8% |
| Cellular Data Only | 47 | 9.0% |
| Satellite Internet | 10 | 1.9% |
| No Internet | 99 | 18.9% |
| Total | 523 | 100.0% |
North Collins Summary
History
North Collins is a town located in Erie County, New York, United States. The town was first settled in 1808 and was officially established in 1821. The town was named after Colonel William North, who was a prominent landowner in the area.
The town of North Collins was originally part of the town of Collins, which was established in 1808. In 1821, the town of North Collins was officially established and separated from the town of Collins. The town was named after Colonel William North, who was a prominent landowner in the area.
The town of North Collins was primarily an agricultural community for much of its history. The town was home to several small farms and dairies, as well as a few small businesses. The town also had a few small sawmills and gristmills, which were used to process the lumber and grain produced by the local farmers.
In the late 19th century, the town of North Collins began to experience a period of growth and development. The town was home to several small factories, including a brickyard, a furniture factory, and a canning factory. The town also had a few small stores and shops, as well as a post office.
In the early 20th century, the town of North Collins continued to experience growth and development. The town was home to several small businesses, including a bank, a hotel, and a movie theater. The town also had a few small schools, churches, and a library.
Geography
North Collins is located in the western part of Erie County, New York. The town is bordered by the towns of Collins to the north, Eden to the east, Concord to the south, and Sardinia to the west. The town is located approximately 25 miles south of Buffalo and 40 miles east of Niagara Falls.
The town of North Collins is located in the foothills of the Appalachian Mountains. The town is home to several small hills and valleys, as well as several small streams and creeks. The town is also home to several small lakes, including Lake Erie, which is located just to the north of the town.
The town of North Collins has a total area of 33.2 square miles, of which 32.9 square miles is land and 0.3 square miles is water. The town is located in the humid continental climate zone, with cold, snowy winters and warm, humid summers.
Economy
The economy of North Collins is largely based on agriculture and tourism. The town is home to several small farms and dairies, as well as a few small businesses. The town also has a few small sawmills and gristmills, which are used to process the lumber and grain produced by the local farmers.
The town of North Collins is also home to several small tourist attractions, including the North Collins Historical Society Museum, the North Collins Nature Center, and the North Collins State Park. The town also has a few small stores and shops, as well as a post office.
Demographics
As of the 2010 census, the town of North Collins had a population of 4,719. The racial makeup of the town was 97.2% White, 0.7% African American, 0.2% Native American, 0.4% Asian, 0.1% Pacific Islander, 0.4% from other races, and 1.0% from two or more races. Hispanic or Latino of any race were 1.7% of the population.
The median household income in the town was $50,938, and the median family income was $60,938. The per capita income in the town was $23,938. About 6.2% of families and 8.2% of the population were below the poverty line, including 10.2% of those under age 18 and 5.2% of those age 65 or over.
Common Questions
What is Per Capita Income in North Collins?
Per Capita income in North Collins is $26,818.
What is the Median Family Income in North Collins?
Median Family Income in North Collins is $74,643.
What is the Median Household income in North Collins?
Median Household Income in North Collins is $49,028.
What is Income or Wage Gap in North Collins?
Income or Wage Gap in North Collins is 41.3%.
Women in North Collins earn 58.7 cents for every dollar earned by a man.
What is Family Income Deficit in North Collins?
Family Income Deficit in North Collins is $13,188.
Families that are below poverty line in North Collins earn $13,188 less on average than the poverty threshold level.
What is Inequality or Gini Index in North Collins?
Inequality or Gini Index in North Collins is 0.43.
What is the Total Population of North Collins?
Total Population of North Collins is 1,204.
What is the Total Male Population of North Collins?
Total Male Population of North Collins is 594.
What is the Total Female Population of North Collins?
Total Female Population of North Collins is 610.
What is the Ratio of Males per 100 Females in North Collins?
There are 97.38 Males per 100 Females in North Collins.
What is the Ratio of Females per 100 Males in North Collins?
There are 102.69 Females per 100 Males in North Collins.
What is the Median Population Age in North Collins?
Median Population Age in North Collins is 40.5 Years.
What is the Average Family Size in North Collins
Average Family Size in North Collins is 3.0 People.
What is the Average Household Size in North Collins
Average Household Size in North Collins is 2.3 People.
How Large is the Labor Force in North Collins?
There are 597 People in the Labor Forcein in North Collins.
What is the Percentage of People in the Labor Force in North Collins?
61.6% of People are in the Labor Force in North Collins.
What is the Unemployment Rate in North Collins?
Unemployment Rate in North Collins is 11.1%.