Zip Codes with the Highest Poverty Level Among Children Under the Age of 5 in Buffalo, NY

RELATED REPORTS & OPTIONS

Highest Poverty | Child 0-5
Population
Families and Households
Female Fertility
Female Fertility (Unmarried)
Race (Community Size)
Race (Percentage)
Ancestry (Community Size)
AfghanAfricanAlbanianAlsatianAmericanArabArgentineanArmenianAustralianAustrianBahamianBarbadianBelgianBelizeanBhutaneseBlackfeetBolivianBrazilianBritishBritish West IndianBulgarianBurmeseCajunCambodianCanadianCarpatho RusynCelticCentral AmericanCentral American IndianCherokeeChileanChippewaColombianCosta RicanCreekCroatianCubanCzechCzechoslovakianDanishDominicanDutchDutch West IndianEastern EuropeanEcuadorianEgyptianEnglishEstonianEthiopianEuropeanFilipinoFinnishFrenchFrench American IndianFrench CanadianGermanGerman RussianGhanaianGreekGuamanian / ChamorroGuatemalanGuyaneseHaitianHonduranHungarianIcelanderIndian (Asian)IndonesianIranianIraqiIrishIroquoisIsraeliItalianJamaicanJapaneseJordanianKenyanKoreanLaotianLatvianLebaneseLithuanianMacedonianMalaysianMalteseMexicanMexican American IndianMongolianMoroccanNative HawaiianNavajoNicaraguanNigerianNorthern EuropeanNorwegianOkinawanPakistaniPalestinianPanamanianPennsylvania GermanPeruvianPolishPortuguesePuerto RicanRomanianRussianSalvadoranSamoanScandinavianScotch-IrishScottishSerbianSiouxSlavicSlovakSloveneSomaliSouth AfricanSouth AmericanSouth American IndianSpaniardSpanishSri LankanSubsaharan AfricanSudaneseSwedishSwissSyrianTaiwaneseThaiTrinidadian and TobagonianTurkishUkrainianVenezuelanVietnameseWelshWest IndianYugoslavian
Ancestry (Percentage)
AfghanAfricanAlbanianAlsatianAmericanArabArgentineanArmenianAustralianAustrianBahamianBarbadianBelgianBelizeanBhutaneseBlackfeetBolivianBrazilianBritishBritish West IndianBulgarianBurmeseCajunCambodianCanadianCarpatho RusynCelticCentral AmericanCentral American IndianCherokeeChileanChippewaColombianCosta RicanCreekCroatianCubanCzechCzechoslovakianDanishDominicanDutchDutch West IndianEastern EuropeanEcuadorianEgyptianEnglishEstonianEthiopianEuropeanFilipinoFinnishFrenchFrench American IndianFrench CanadianGermanGerman RussianGhanaianGreekGuamanian / ChamorroGuatemalanGuyaneseHaitianHonduranHungarianIcelanderIndian (Asian)IndonesianIranianIraqiIrishIroquoisIsraeliItalianJamaicanJapaneseJordanianKenyanKoreanLaotianLatvianLebaneseLithuanianMacedonianMalaysianMalteseMexicanMexican American IndianMongolianMoroccanNative HawaiianNavajoNicaraguanNigerianNorthern EuropeanNorwegianOkinawanPakistaniPalestinianPanamanianPennsylvania GermanPeruvianPolishPortuguesePuerto RicanRomanianRussianSalvadoranSamoanScandinavianScotch-IrishScottishSerbianSiouxSlavicSlovakSloveneSomaliSouth AfricanSouth AmericanSouth American IndianSpaniardSpanishSri LankanSubsaharan AfricanSudaneseSwedishSwissSyrianTaiwaneseThaiTrinidadian and TobagonianTurkishUkrainianVenezuelanVietnameseWelshWest IndianYugoslavian
Immigrant Origin (Total)
AfghanistanAfricaAlbaniaArgentinaAsiaAustraliaAustriaBangladeshBarbadosBelarusBosnia and HerzegovinaBrazilBulgariaBurma / MyanmarCameroonCanadaCaribbeanCentral AmericaChinaColombiaCongoCosta RicaCroatiaCubaCzechoslovakiaDominican RepublicEastern AfricaEastern AsiaEastern EuropeEcuadorEgyptEl SalvadorEnglandEritreaEthiopiaEuropeFranceGermanyGhanaGreeceGuatemalaGuyanaHaitiHondurasHong KongHungaryIndiaIndonesiaIranIraqIrelandIsraelItalyJamaicaJapanJordanKazakhstanKenyaKoreaKuwaitLaosLatin AmericaLatviaLebanonLiberiaLithuaniaMalaysiaMexicoMiddle AfricaMoldovaMoroccoNepalNetherlandsNigeriaNorth MacedoniaNorthern AfricaNorthern EuropeNorwayOceaniaPakistanPanamaPeruPhilippinesPolandRomaniaRussiaSaudi ArabiaScotlandSerbiaSierra LeoneSingaporeSomaliaSouth AfricaSouth AmericaSouth Central AsiaSouth Eastern AsiaSouthern EuropeSpainSri LankaSt. Vincent and the GrenadinesSudanSwedenSwitzerlandSyriaTaiwanThailandTrinidad and TobagoTurkeyUgandaUkraineUzbekistanVenezuelaVietnamWest IndiesWestern AfricaWestern AsiaWestern EuropeYemenZaire
Immigrant Origin (Percentage)
AfghanistanAfricaAlbaniaArgentinaAsiaAustraliaAustriaBangladeshBarbadosBelarusBosnia and HerzegovinaBrazilBulgariaBurma / MyanmarCameroonCanadaCaribbeanCentral AmericaChinaColombiaCongoCosta RicaCroatiaCubaCzechoslovakiaDominican RepublicEastern AfricaEastern AsiaEastern EuropeEcuadorEgyptEl SalvadorEnglandEritreaEthiopiaEuropeFranceGermanyGhanaGreeceGuatemalaGuyanaHaitiHondurasHong KongHungaryIndiaIndonesiaIranIraqIrelandIsraelItalyJamaicaJapanJordanKazakhstanKenyaKoreaKuwaitLaosLatin AmericaLatviaLebanonLiberiaLithuaniaMalaysiaMexicoMiddle AfricaMoldovaMoroccoNepalNetherlandsNigeriaNorth MacedoniaNorthern AfricaNorthern EuropeNorwayOceaniaPakistanPanamaPeruPhilippinesPolandRomaniaRussiaSaudi ArabiaScotlandSerbiaSierra LeoneSingaporeSomaliaSouth AfricaSouth AmericaSouth Central AsiaSouth Eastern AsiaSouthern EuropeSpainSri LankaSt. Vincent and the GrenadinesSudanSwedenSwitzerlandSyriaTaiwanThailandTrinidad and TobagoTurkeyUgandaUkraineUzbekistanVenezuelaVietnamWest IndiesWestern AfricaWestern AsiaWestern EuropeYemenZaire
Income
Income (Families)
Income (Households)
Poverty
Poverty (Families)
Unemployment
Employment Occupations
Employment Industries
Employer Class
Commute Time
Commute Means
School Enrollment
Education by Degree Field
Occupancy
Finances
Physical Characteristics
Buffalo
Compare Zip Codes
Comparison Subject

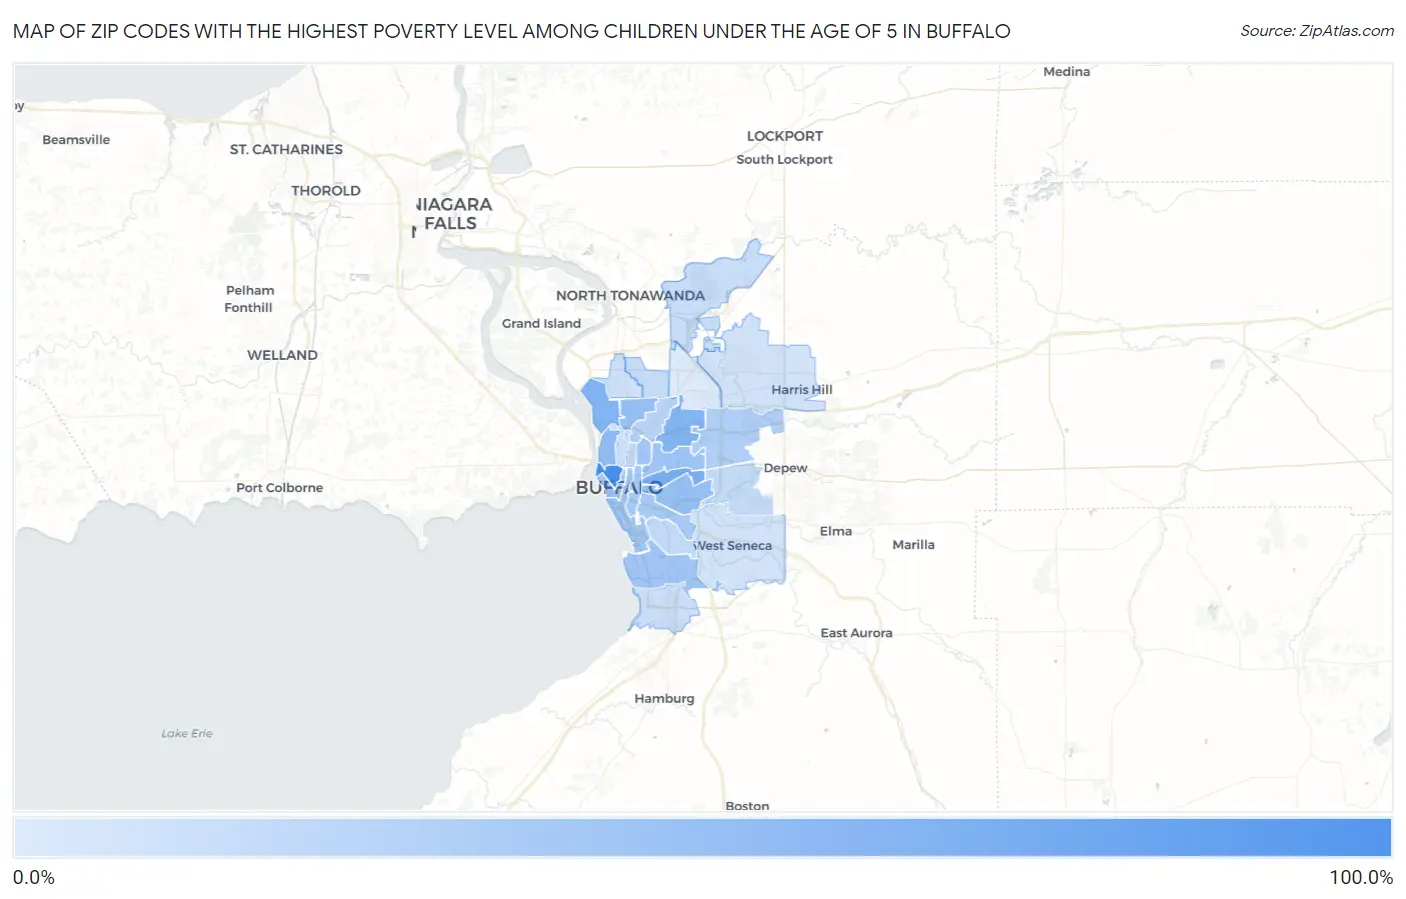
Map of Zip Codes with the Highest Poverty Level Among Children Under the Age of 5 in Buffalo

0.0%
100.0%
Zip Codes with the Highest Poverty Level Among Children Under the Age of 5 in Buffalo Map

Zip Codes with the Highest Poverty Level Among Children Under the Age of 5 in Buffalo, NY

Zip Code Child Poverty vs State vs National
1.1420196.2%18.7%(+77.5)#1818.1%(+78.2)#569
2.1421257.1%18.7%(+38.4)#6018.1%(+39.1)#1,898
3.1420752.3%18.7%(+33.6)#8618.1%(+34.3)#2,317
4.1421550.1%18.7%(+31.3)#9818.1%(+32.0)#2,515
5.1421341.0%18.7%(+22.3)#16118.1%(+23.0)#3,825
6.1421638.4%18.7%(+19.6)#17618.1%(+20.3)#4,330
7.1420638.1%18.7%(+19.3)#18318.1%(+20.0)#4,396
8.1421132.5%18.7%(+13.8)#24318.1%(+14.5)#5,713
9.1420832.1%18.7%(+13.3)#24818.1%(+14.0)#5,817
10.1421831.3%18.7%(+12.5)#25818.1%(+13.2)#6,007
11.1420329.7%18.7%(+10.9)#26918.1%(+11.6)#6,453
12.1420228.7%18.7%(+9.92)#27918.1%(+10.6)#6,748
13.1421027.6%18.7%(+8.86)#29618.1%(+9.55)#7,088
14.1420427.1%18.7%(+8.33)#30318.1%(+9.02)#7,286
15.1422522.8%18.7%(+4.02)#37018.1%(+4.71)#8,851
16.1421419.3%18.7%(+0.514)#45118.1%(+1.20)#10,377
17.1420914.9%18.7%(-3.86)#55918.1%(-3.18)#12,537
18.1422013.8%18.7%(-4.94)#58818.1%(-4.26)#13,152
19.1422712.3%18.7%(-6.46)#63118.1%(-5.78)#14,045
20.1422311.6%18.7%(-7.12)#64918.1%(-6.43)#14,452
21.1422811.0%18.7%(-7.74)#66818.1%(-7.05)#14,823
22.142198.9%18.7%(-9.87)#73218.1%(-9.19)#16,147
23.142178.6%18.7%(-10.2)#74418.1%(-9.50)#16,378
24.142226.8%18.7%(-12.0)#81818.1%(-11.3)#17,534
25.142246.0%18.7%(-12.8)#85018.1%(-12.1)#18,092
26.142215.7%18.7%(-13.0)#86418.1%(-12.4)#18,279
27.142260.74%18.7%(-18.0)#1,05718.1%(-17.3)#21,527

Common Questions

What are the Top 10 Zip Codes with the Highest Poverty Level Among Children Under the Age of 5 in Buffalo, NY?
Top 10 Zip Codes with the Highest Poverty Level Among Children Under the Age of 5 in Buffalo, NY are:
#1
96.2%
#2
57.1%
#3
52.3%
#4
50.1%
#5
41.0%
#6
38.4%
#7
38.1%
#8
32.5%
#9
32.1%
#10
31.3%
What zip code has the Highest Poverty Level Among Children Under the Age of 5 in Buffalo, NY?
14201 has the Highest Poverty Level Among Children Under the Age of 5 in Buffalo, NY with 96.2%.
What is the Poverty Level Among Children Under the Age of 5 in Buffalo, NY?
Poverty Level Among Children Under the Age of 5 in Buffalo is 40.3%.
What is the Poverty Level Among Children Under the Age of 5 in New York?
Poverty Level Among Children Under the Age of 5 in New York is 18.7%.
What is the Poverty Level Among Children Under the Age of 5 in the United States?
Poverty Level Among Children Under the Age of 5 in the United States is 18.1%.