Troy, NY Map & Demographics
Troy Map
Troy Overview
$33,743
PER CAPITA INCOME
$67,174
AVG FAMILY INCOME
$54,837
AVG HOUSEHOLD INCOME
12.2%
WAGE / INCOME GAP [ % ]
87.8¢/ $1
WAGE / INCOME GAP [ $ ]
$10,171
FAMILY INCOME DEFICIT
0.48
INEQUALITY / GINI INDEX
51,268
TOTAL POPULATION
25,082
MALE POPULATION
26,186
FEMALE POPULATION
95.78
MALES / 100 FEMALES
104.40
FEMALES / 100 MALES
32.8
MEDIAN AGE
2.9
AVG FAMILY SIZE
2.1
AVG HOUSEHOLD SIZE
26,388
LABOR FORCE [ PEOPLE ]
60.2%
PERCENT IN LABOR FORCE
9.7%
UNEMPLOYMENT RATE
Troy Area Codes
Income in Troy
Income Overview in Troy
Per Capita Income in Troy is $33,743, while median incomes of families and households are $67,174 and $54,837 respectively.
| Characteristic | Number | Measure |
| Per Capita Income | 51,268 | $33,743 |
| Median Family Income | 9,911 | $67,174 |
| Mean Family Income | 9,911 | $91,864 |
| Median Household Income | 21,574 | $54,837 |
| Mean Household Income | 21,574 | $76,015 |
| Income Deficit | 9,911 | $10,171 |
| Wage / Income Gap (%) | 51,268 | 12.18% |
| Wage / Income Gap ($) | 51,268 | 87.82¢ per $1 |
| Gini / Inequality Index | 51,268 | 0.48 |
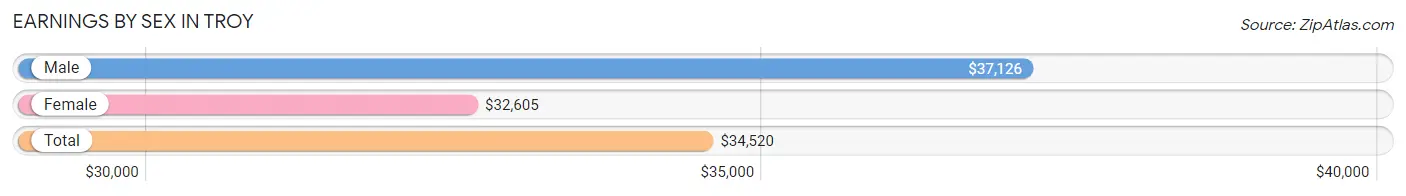
Earnings by Sex in Troy
Average Earnings in Troy are $34,520, $37,126 for men and $32,605 for women, a difference of 12.2%.
| Sex | Number | Average Earnings |
| Male | 14,241 (49.7%) | $37,126 |
| Female | 14,427 (50.3%) | $32,605 |
| Total | 28,668 (100.0%) | $34,520 |
Earnings by Sex by Income Bracket in Troy
The most common earnings brackets in Troy are $100,000+ for men (1,541 | 10.8%) and $55,000 to $64,999 for women (1,281 | 8.9%).
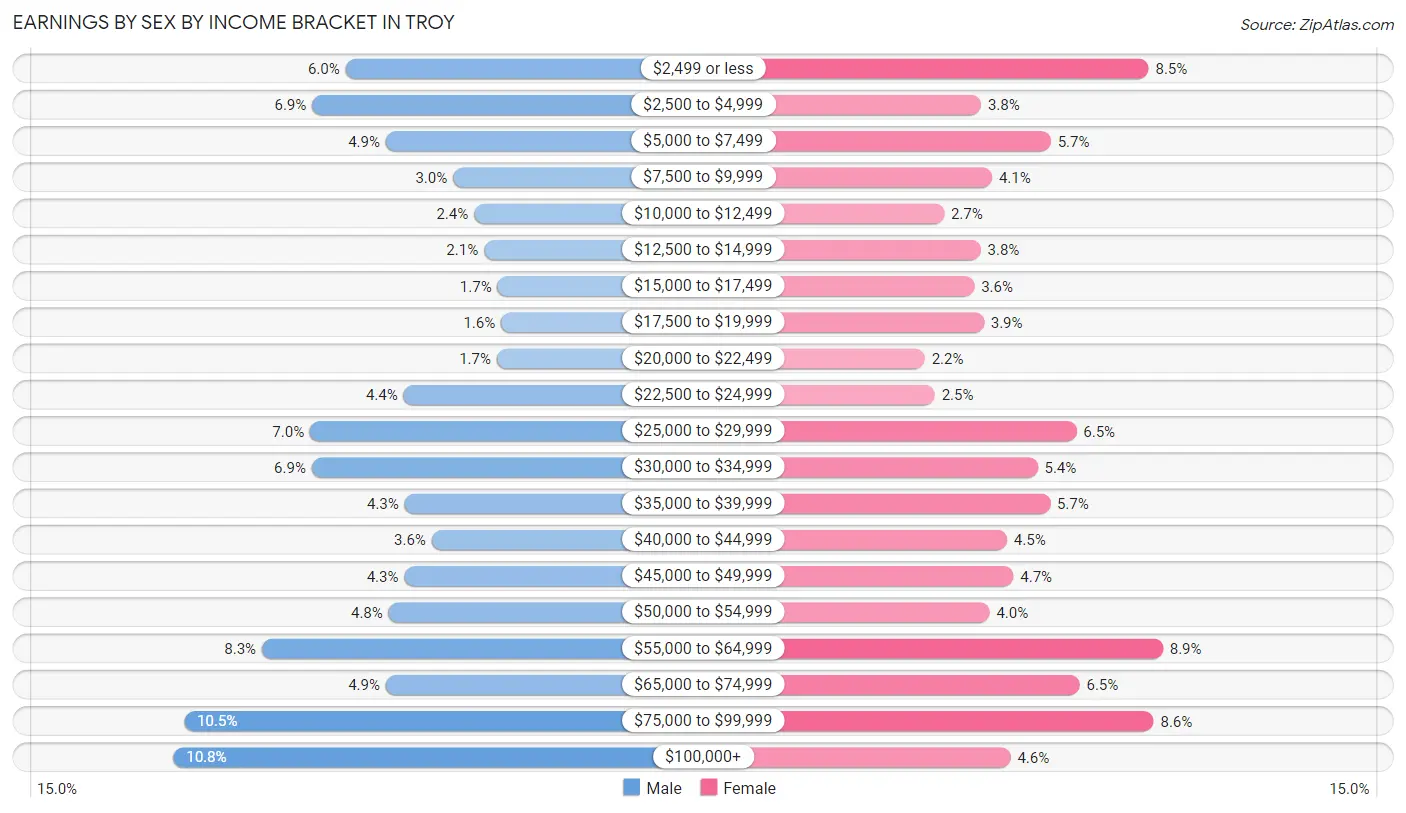
| Income | Male | Female |
| $2,499 or less | 851 (6.0%) | 1,224 (8.5%) |
| $2,500 to $4,999 | 986 (6.9%) | 544 (3.8%) |
| $5,000 to $7,499 | 691 (4.9%) | 827 (5.7%) |
| $7,500 to $9,999 | 422 (3.0%) | 588 (4.1%) |
| $10,000 to $12,499 | 338 (2.4%) | 394 (2.7%) |
| $12,500 to $14,999 | 298 (2.1%) | 543 (3.8%) |
| $15,000 to $17,499 | 244 (1.7%) | 517 (3.6%) |
| $17,500 to $19,999 | 229 (1.6%) | 555 (3.8%) |
| $20,000 to $22,499 | 247 (1.7%) | 316 (2.2%) |
| $22,500 to $24,999 | 620 (4.3%) | 357 (2.5%) |
| $25,000 to $29,999 | 994 (7.0%) | 930 (6.5%) |
| $30,000 to $34,999 | 987 (6.9%) | 773 (5.4%) |
| $35,000 to $39,999 | 615 (4.3%) | 824 (5.7%) |
| $40,000 to $44,999 | 507 (3.6%) | 649 (4.5%) |
| $45,000 to $49,999 | 617 (4.3%) | 675 (4.7%) |
| $50,000 to $54,999 | 680 (4.8%) | 579 (4.0%) |
| $55,000 to $64,999 | 1,186 (8.3%) | 1,281 (8.9%) |
| $65,000 to $74,999 | 690 (4.9%) | 944 (6.5%) |
| $75,000 to $99,999 | 1,498 (10.5%) | 1,243 (8.6%) |
| $100,000+ | 1,541 (10.8%) | 664 (4.6%) |
| Total | 14,241 (100.0%) | 14,427 (100.0%) |
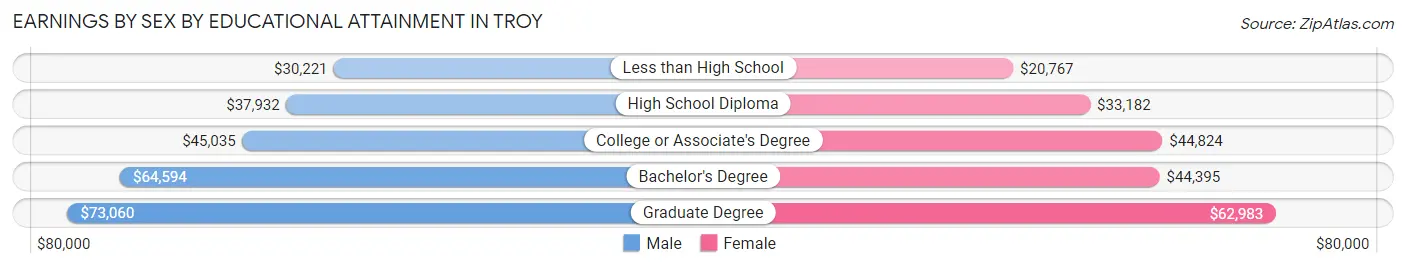
Earnings by Sex by Educational Attainment in Troy
Average earnings in Troy are $50,205 for men and $42,467 for women, a difference of 15.4%. Men with an educational attainment of graduate degree enjoy the highest average annual earnings of $73,060, while those with less than high school education earn the least with $30,221. Women with an educational attainment of graduate degree earn the most with the average annual earnings of $62,983, while those with less than high school education have the smallest earnings of $20,767.
| Educational Attainment | Male Income | Female Income |
| Less than High School | $30,221 | $20,767 |
| High School Diploma | $37,932 | $33,182 |
| College or Associate's Degree | $45,035 | $44,824 |
| Bachelor's Degree | $64,594 | $44,395 |
| Graduate Degree | $73,060 | $62,983 |
| Total | $50,205 | $42,467 |
Family Income in Troy
Family Income Brackets in Troy
According to the Troy family income data, there are 1,715 families falling into the $50,000 to $74,999 income range, which is the most common income bracket and makes up 17.3% of all families. Conversely, the $10,000 to $14,999 income bracket is the least frequent group with only 327 families (3.3%) belonging to this category.
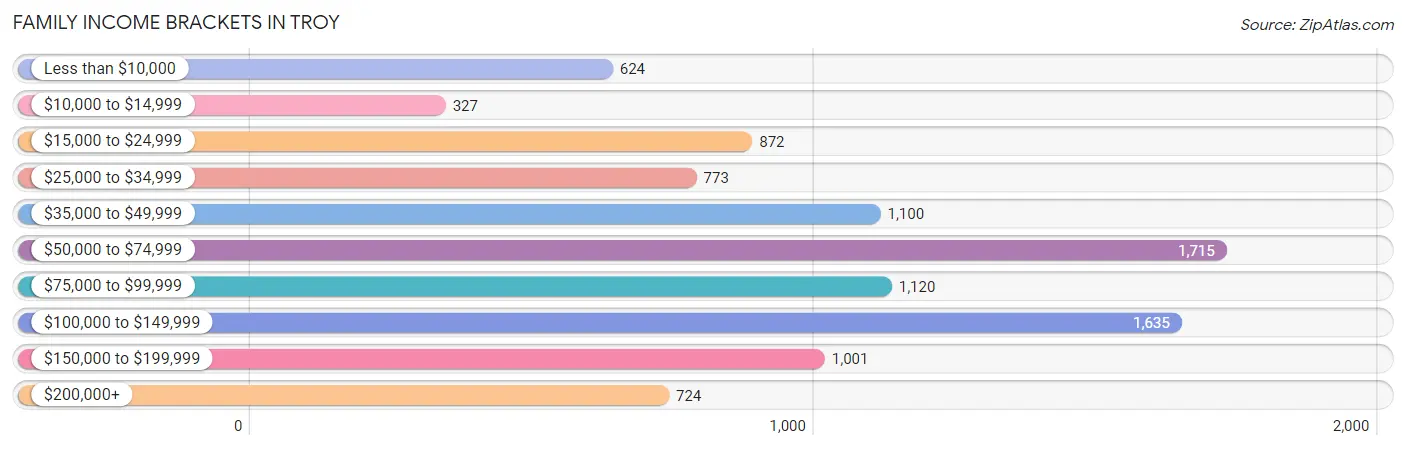
| Income Bracket | # Families | % Families |
| Less than $10,000 | 624 | 6.3% |
| $10,000 to $14,999 | 327 | 3.3% |
| $15,000 to $24,999 | 872 | 8.8% |
| $25,000 to $34,999 | 773 | 7.8% |
| $35,000 to $49,999 | 1,100 | 11.1% |
| $50,000 to $74,999 | 1,715 | 17.3% |
| $75,000 to $99,999 | 1,120 | 11.3% |
| $100,000 to $149,999 | 1,635 | 16.5% |
| $150,000 to $199,999 | 1,001 | 10.1% |
| $200,000+ | 724 | 7.3% |
Family Income by Famaliy Size in Troy
6-person families (133 | 1.3%) account for the highest median family income in Troy with $90,250 per family, while 2-person families (4,817 | 48.6%) have the highest median income of $33,125 per family member.
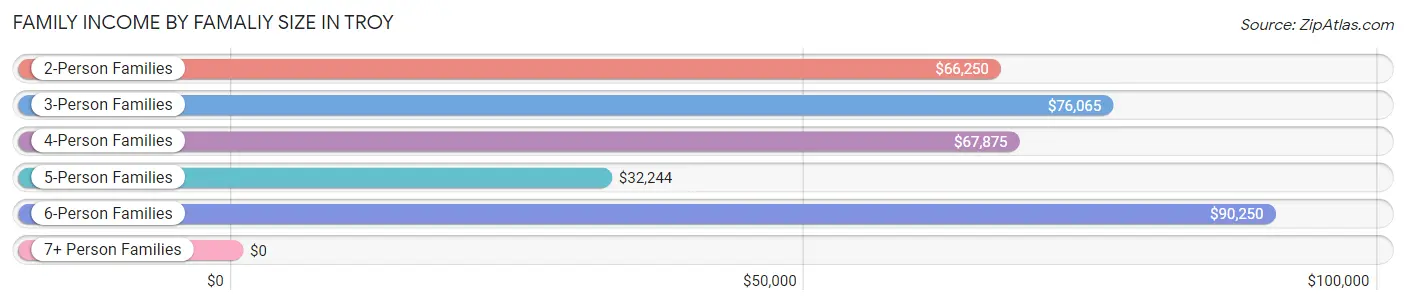
| Income Bracket | # Families | Median Income |
| 2-Person Families | 4,817 (48.6%) | $66,250 |
| 3-Person Families | 2,659 (26.8%) | $76,065 |
| 4-Person Families | 1,752 (17.7%) | $67,875 |
| 5-Person Families | 463 (4.7%) | $32,244 |
| 6-Person Families | 133 (1.3%) | $90,250 |
| 7+ Person Families | 87 (0.9%) | $0 |
| Total | 9,911 (100.0%) | $67,174 |
Family Income by Number of Earners in Troy
The median family income in Troy is $67,174, with families comprising 3+ earners (908) having the highest median family income of $139,592, while families with no earners (1,511) have the lowest median family income of $34,770, accounting for 9.2% and 15.2% of families, respectively.
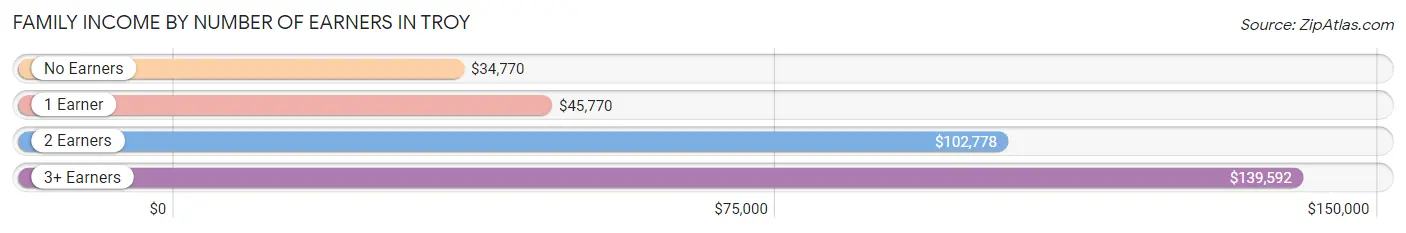
| Number of Earners | # Families | Median Income |
| No Earners | 1,511 (15.2%) | $34,770 |
| 1 Earner | 3,962 (40.0%) | $45,770 |
| 2 Earners | 3,530 (35.6%) | $102,778 |
| 3+ Earners | 908 (9.2%) | $139,592 |
| Total | 9,911 (100.0%) | $67,174 |
Household Income in Troy
Household Income Brackets in Troy
With 3,560 households falling in the category, the $50,000 to $74,999 income range is the most frequent in Troy, accounting for 16.5% of all households. In contrast, only 1,014 households (4.7%) fall into the $200,000+ income bracket, making it the least populous group.
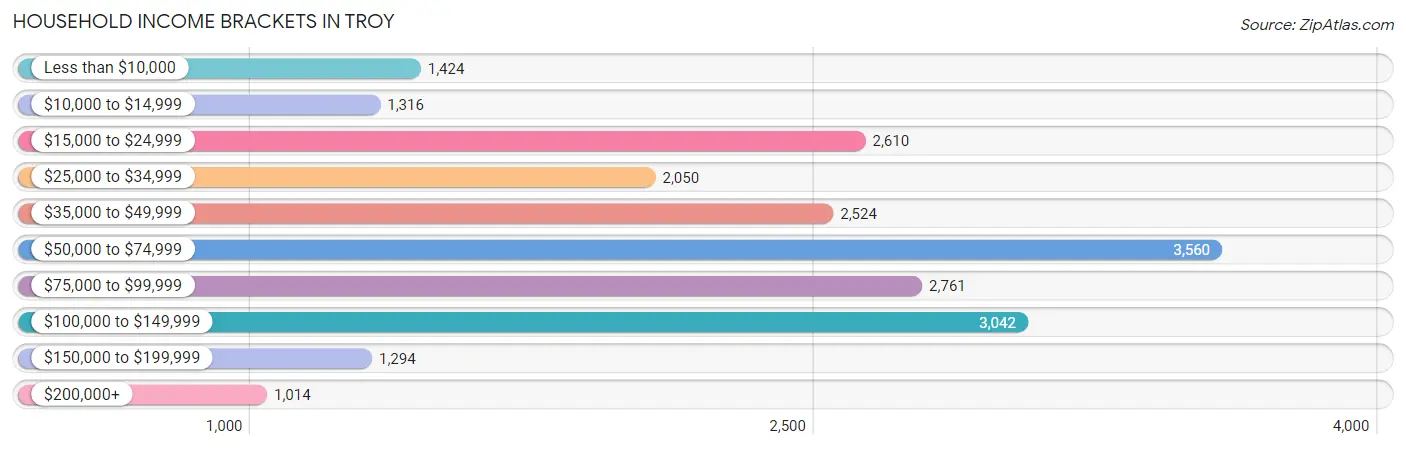
| Income Bracket | # Households | % Households |
| Less than $10,000 | 1,424 | 6.6% |
| $10,000 to $14,999 | 1,316 | 6.1% |
| $15,000 to $24,999 | 2,610 | 12.1% |
| $25,000 to $34,999 | 2,050 | 9.5% |
| $35,000 to $49,999 | 2,524 | 11.7% |
| $50,000 to $74,999 | 3,560 | 16.5% |
| $75,000 to $99,999 | 2,761 | 12.8% |
| $100,000 to $149,999 | 3,042 | 14.1% |
| $150,000 to $199,999 | 1,294 | 6.0% |
| $200,000+ | 1,014 | 4.7% |
Household Income by Householder Age in Troy
The median household income in Troy is $54,837, with the highest median household income of $62,927 found in the 45 to 64 years age bracket for the primary householder. A total of 6,845 households (31.7%) fall into this category. Meanwhile, the 15 to 24 years age bracket for the primary householder has the lowest median household income of $37,991, with 1,552 households (7.2%) in this group.
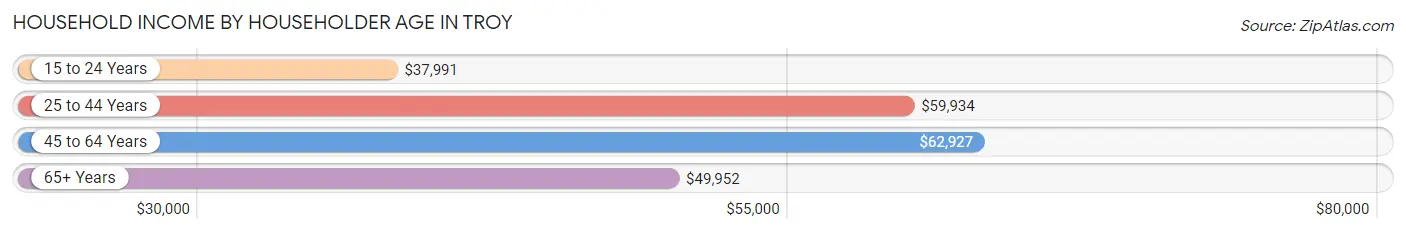
| Income Bracket | # Households | Median Income |
| 15 to 24 Years | 1,552 (7.2%) | $37,991 |
| 25 to 44 Years | 8,449 (39.2%) | $59,934 |
| 45 to 64 Years | 6,845 (31.7%) | $62,927 |
| 65+ Years | 4,728 (21.9%) | $49,952 |
| Total | 21,574 (100.0%) | $54,837 |
Poverty in Troy
Income Below Poverty by Sex and Age in Troy
With 19.8% poverty level for males and 26.4% for females among the residents of Troy, 5 year old males and 5 year old females are the most vulnerable to poverty, with 68 males (47.5%) and 117 females (56.2%) in their respective age groups living below the poverty level.
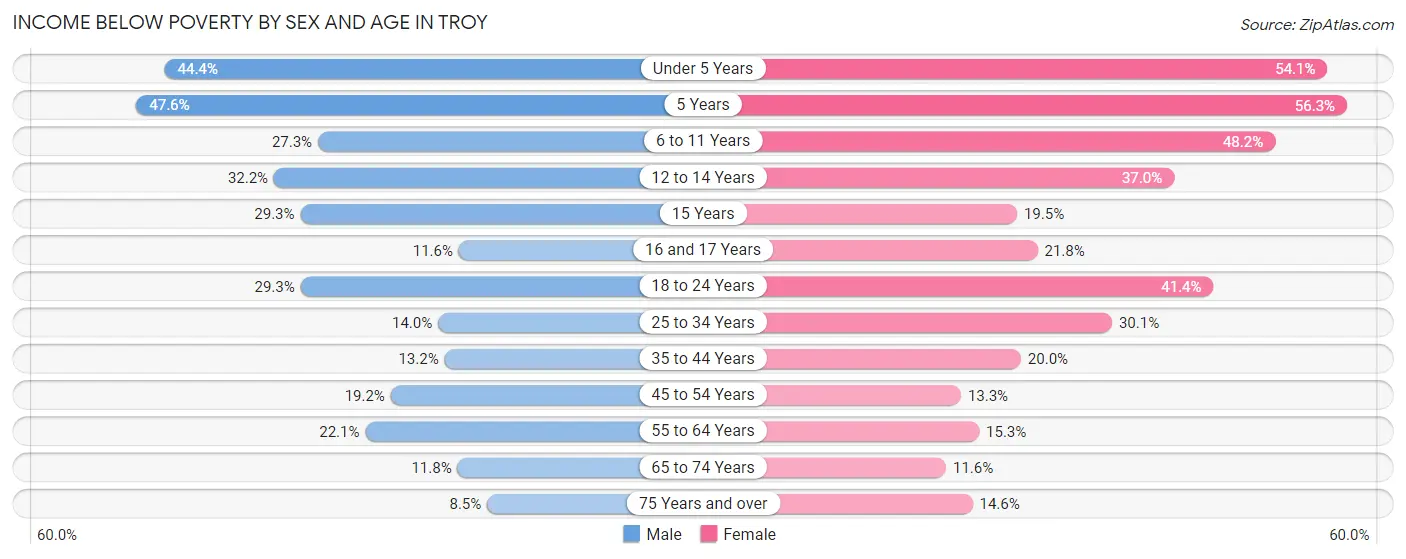
| Age Bracket | Male | Female |
| Under 5 Years | 365 (44.4%) | 631 (54.1%) |
| 5 Years | 68 (47.5%) | 117 (56.2%) |
| 6 to 11 Years | 431 (27.3%) | 807 (48.2%) |
| 12 to 14 Years | 225 (32.2%) | 283 (37.0%) |
| 15 Years | 58 (29.3%) | 24 (19.5%) |
| 16 and 17 Years | 66 (11.6%) | 148 (21.8%) |
| 18 to 24 Years | 823 (29.3%) | 1,200 (41.4%) |
| 25 to 34 Years | 616 (14.0%) | 1,407 (30.1%) |
| 35 to 44 Years | 400 (13.2%) | 585 (20.0%) |
| 45 to 54 Years | 440 (19.2%) | 377 (13.3%) |
| 55 to 64 Years | 592 (22.1%) | 434 (15.3%) |
| 65 to 74 Years | 209 (11.8%) | 275 (11.6%) |
| 75 Years and over | 97 (8.5%) | 206 (14.6%) |
| Total | 4,390 (19.8%) | 6,494 (26.4%) |
Income Above Poverty by Sex and Age in Troy
According to the poverty statistics in Troy, males aged 75 years and over and females aged 65 to 74 years are the age groups that are most secure financially, with 91.5% of males and 88.4% of females in these age groups living above the poverty line.
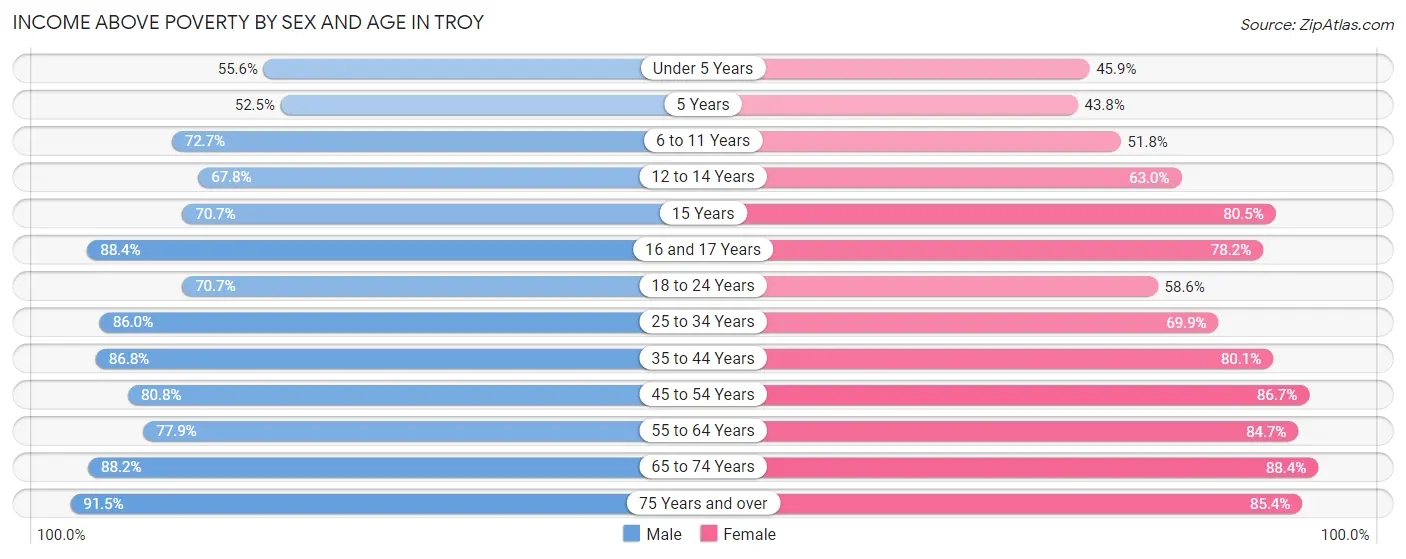
| Age Bracket | Male | Female |
| Under 5 Years | 457 (55.6%) | 536 (45.9%) |
| 5 Years | 75 (52.4%) | 91 (43.8%) |
| 6 to 11 Years | 1,146 (72.7%) | 866 (51.8%) |
| 12 to 14 Years | 473 (67.8%) | 482 (63.0%) |
| 15 Years | 140 (70.7%) | 99 (80.5%) |
| 16 and 17 Years | 501 (88.4%) | 531 (78.2%) |
| 18 to 24 Years | 1,989 (70.7%) | 1,700 (58.6%) |
| 25 to 34 Years | 3,798 (86.0%) | 3,269 (69.9%) |
| 35 to 44 Years | 2,621 (86.8%) | 2,347 (80.0%) |
| 45 to 54 Years | 1,848 (80.8%) | 2,464 (86.7%) |
| 55 to 64 Years | 2,091 (77.9%) | 2,404 (84.7%) |
| 65 to 74 Years | 1,563 (88.2%) | 2,093 (88.4%) |
| 75 Years and over | 1,045 (91.5%) | 1,209 (85.4%) |
| Total | 17,747 (80.2%) | 18,091 (73.6%) |
Income Below Poverty Among Married-Couple Families in Troy
The poverty statistics for married-couple families in Troy show that 7.9% or 390 of the total 4,970 families live below the poverty line. Families with 5 or more children have the highest poverty rate of 55.0%, comprising of 11 families. On the other hand, families with no children have the lowest poverty rate of 3.0%, which includes 98 families.
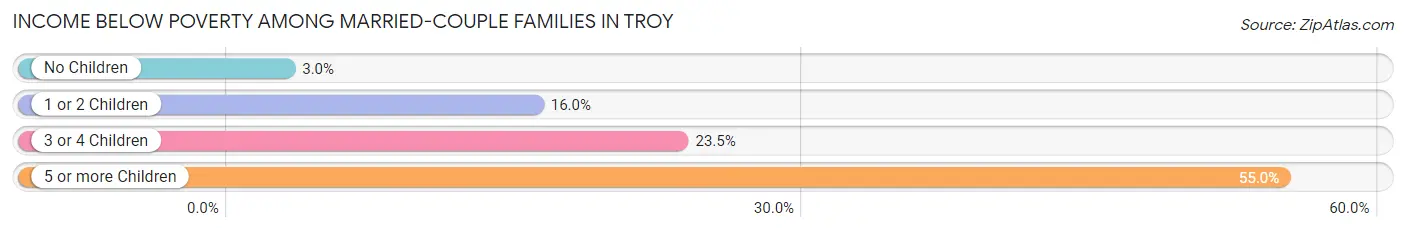
| Children | Above Poverty | Below Poverty |
| No Children | 3,181 (97.0%) | 98 (3.0%) |
| 1 or 2 Children | 1,247 (84.0%) | 237 (16.0%) |
| 3 or 4 Children | 143 (76.5%) | 44 (23.5%) |
| 5 or more Children | 9 (45.0%) | 11 (55.0%) |
| Total | 4,580 (92.1%) | 390 (7.9%) |
Income Below Poverty Among Single-Parent Households in Troy
According to the poverty data in Troy, 15.5% or 140 single-father households and 34.1% or 1,378 single-mother households are living below the poverty line. Among single-father households, those with 5 or more children have the highest poverty rate, with 17 households (100.0%) experiencing poverty. Likewise, among single-mother households, those with 3 or 4 children have the highest poverty rate, with 264 households (74.0%) falling below the poverty line.
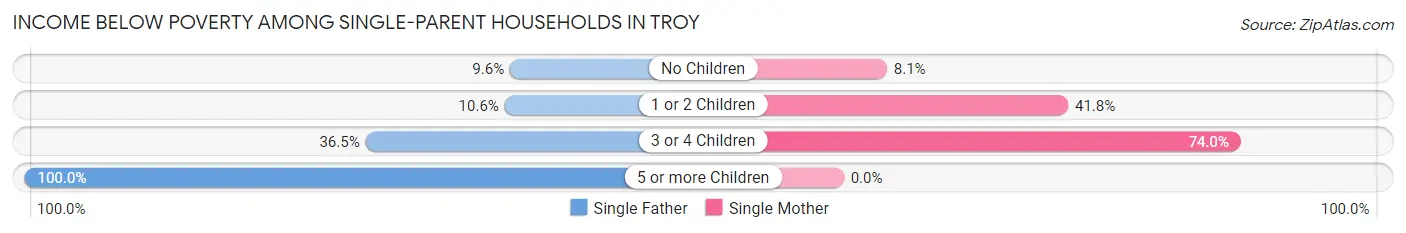
| Children | Single Father | Single Mother |
| No Children | 35 (9.6%) | 100 (8.1%) |
| 1 or 2 Children | 42 (10.6%) | 1,014 (41.8%) |
| 3 or 4 Children | 46 (36.5%) | 264 (74.0%) |
| 5 or more Children | 17 (100.0%) | 0 (0.0%) |
| Total | 140 (15.5%) | 1,378 (34.1%) |
Income Below Poverty Among Married-Couple vs Single-Parent Households in Troy
The poverty data for Troy shows that 390 of the married-couple family households (7.9%) and 1,518 of the single-parent households (30.7%) are living below the poverty level. Within the married-couple family households, those with 5 or more children have the highest poverty rate, with 11 households (55.0%) falling below the poverty line. Among the single-parent households, those with 3 or 4 children have the highest poverty rate, with 310 household (64.2%) living below poverty.
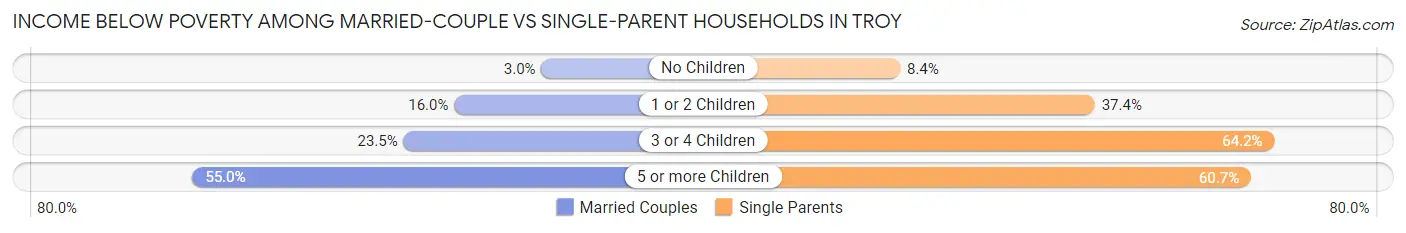
| Children | Married-Couple Families | Single-Parent Households |
| No Children | 98 (3.0%) | 135 (8.4%) |
| 1 or 2 Children | 237 (16.0%) | 1,056 (37.4%) |
| 3 or 4 Children | 44 (23.5%) | 310 (64.2%) |
| 5 or more Children | 11 (55.0%) | 17 (60.7%) |
| Total | 390 (7.9%) | 1,518 (30.7%) |
Race in Troy
The most populous races in Troy are White / Caucasian (33,635 | 65.6%), Black / African American (8,613 | 16.8%), and Two or more Races (4,737 | 9.2%).
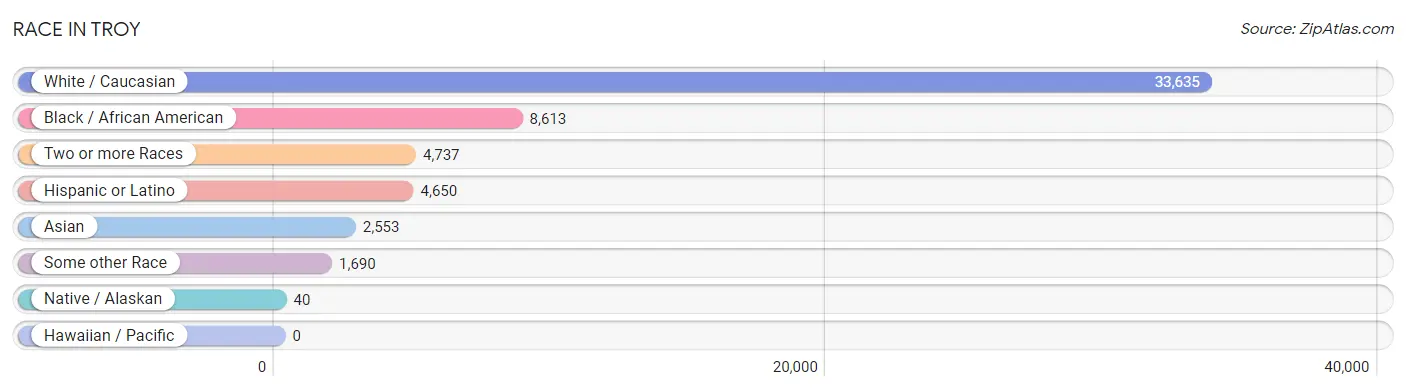
| Race | # Population | % Population |
| Asian | 2,553 | 5.0% |
| Black / African American | 8,613 | 16.8% |
| Hawaiian / Pacific | 0 | 0.0% |
| Hispanic or Latino | 4,650 | 9.1% |
| Native / Alaskan | 40 | 0.1% |
| White / Caucasian | 33,635 | 65.6% |
| Two or more Races | 4,737 | 9.2% |
| Some other Race | 1,690 | 3.3% |
| Total | 51,268 | 100.0% |
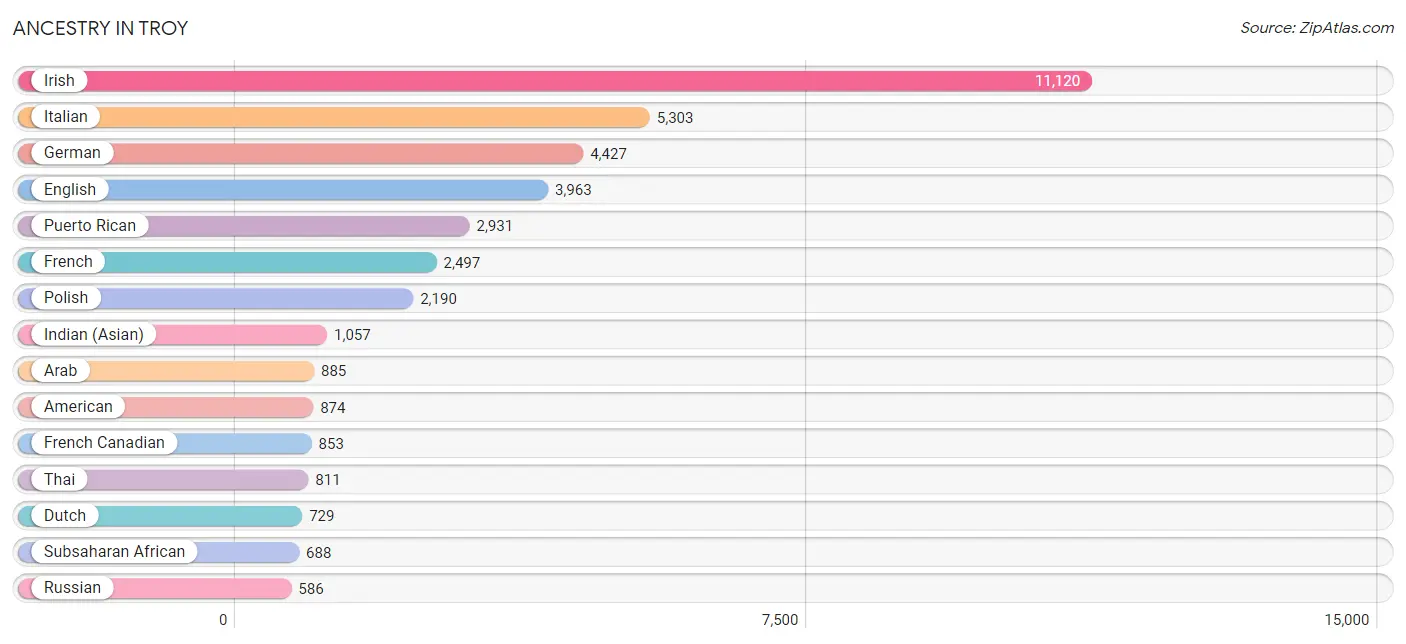
Ancestry in Troy
The most populous ancestries reported in Troy are Irish (11,120 | 21.7%), Italian (5,303 | 10.3%), German (4,427 | 8.6%), English (3,963 | 7.7%), and Puerto Rican (2,931 | 5.7%), together accounting for 54.1% of all Troy residents.
| Ancestry | # Population | % Population |
| Afghan | 8 | 0.0% |
| African | 226 | 0.4% |
| Albanian | 31 | 0.1% |
| American | 874 | 1.7% |
| Apache | 5 | 0.0% |
| Arab | 885 | 1.7% |
| Argentinean | 96 | 0.2% |
| Armenian | 424 | 0.8% |
| Australian | 14 | 0.0% |
| Austrian | 233 | 0.4% |
| Barbadian | 47 | 0.1% |
| Belgian | 22 | 0.0% |
| Bhutanese | 49 | 0.1% |
| Blackfeet | 1 | 0.0% |
| Brazilian | 8 | 0.0% |
| British | 204 | 0.4% |
| British West Indian | 66 | 0.1% |
| Burmese | 158 | 0.3% |
| Canadian | 102 | 0.2% |
| Celtic | 21 | 0.0% |
| Central American | 156 | 0.3% |
| Central American Indian | 34 | 0.1% |
| Cherokee | 179 | 0.4% |
| Chippewa | 16 | 0.0% |
| Colombian | 40 | 0.1% |
| Cree | 6 | 0.0% |
| Croatian | 172 | 0.3% |
| Cuban | 222 | 0.4% |
| Czech | 86 | 0.2% |
| Czechoslovakian | 37 | 0.1% |
| Danish | 155 | 0.3% |
| Dominican | 345 | 0.7% |
| Dutch | 729 | 1.4% |
| Eastern European | 155 | 0.3% |
| Ecuadorian | 62 | 0.1% |
| Egyptian | 38 | 0.1% |
| English | 3,963 | 7.7% |
| European | 365 | 0.7% |
| Filipino | 1 | 0.0% |
| Finnish | 56 | 0.1% |
| French | 2,497 | 4.9% |
| French American Indian | 9 | 0.0% |
| French Canadian | 853 | 1.7% |
| German | 4,427 | 8.6% |
| German Russian | 20 | 0.0% |
| Ghanaian | 205 | 0.4% |
| Greek | 285 | 0.6% |
| Guatemalan | 32 | 0.1% |
| Guyanese | 157 | 0.3% |
| Haitian | 287 | 0.6% |
| Honduran | 74 | 0.1% |
| Hungarian | 143 | 0.3% |
| Icelander | 19 | 0.0% |
| Indian (Asian) | 1,057 | 2.1% |
| Indonesian | 30 | 0.1% |
| Iranian | 232 | 0.4% |
| Irish | 11,120 | 21.7% |
| Iroquois | 20 | 0.0% |
| Israeli | 60 | 0.1% |
| Italian | 5,303 | 10.3% |
| Jamaican | 341 | 0.7% |
| Japanese | 13 | 0.0% |
| Kenyan | 22 | 0.0% |
| Korean | 72 | 0.1% |
| Latvian | 20 | 0.0% |
| Lebanese | 138 | 0.3% |
| Liberian | 13 | 0.0% |
| Lithuanian | 87 | 0.2% |
| Mexican | 375 | 0.7% |
| Mexican American Indian | 31 | 0.1% |
| Mongolian | 1 | 0.0% |
| Native Hawaiian | 69 | 0.1% |
| Nigerian | 42 | 0.1% |
| Northern European | 77 | 0.2% |
| Norwegian | 74 | 0.1% |
| Palestinian | 3 | 0.0% |
| Peruvian | 3 | 0.0% |
| Polish | 2,190 | 4.3% |
| Portuguese | 215 | 0.4% |
| Puerto Rican | 2,931 | 5.7% |
| Romanian | 73 | 0.1% |
| Russian | 586 | 1.1% |
| Salvadoran | 50 | 0.1% |
| Samoan | 9 | 0.0% |
| Scandinavian | 129 | 0.3% |
| Scotch-Irish | 141 | 0.3% |
| Scottish | 547 | 1.1% |
| Slavic | 26 | 0.1% |
| Slovak | 16 | 0.0% |
| Somali | 17 | 0.0% |
| South African | 96 | 0.2% |
| South American | 213 | 0.4% |
| Spaniard | 19 | 0.0% |
| Spanish | 47 | 0.1% |
| Sri Lankan | 20 | 0.0% |
| Subsaharan African | 688 | 1.3% |
| Sudanese | 12 | 0.0% |
| Swedish | 260 | 0.5% |
| Swiss | 56 | 0.1% |
| Syrian | 56 | 0.1% |
| Thai | 811 | 1.6% |
| Trinidadian and Tobagonian | 29 | 0.1% |
| Turkish | 29 | 0.1% |
| U.S. Virgin Islander | 11 | 0.0% |
| Ukrainian | 444 | 0.9% |
| Venezuelan | 12 | 0.0% |
| Vietnamese | 21 | 0.0% |
| Welsh | 356 | 0.7% |
| West Indian | 351 | 0.7% |
| Yugoslavian | 12 | 0.0% |
| Yuman | 3 | 0.0% | View All 111 Rows |
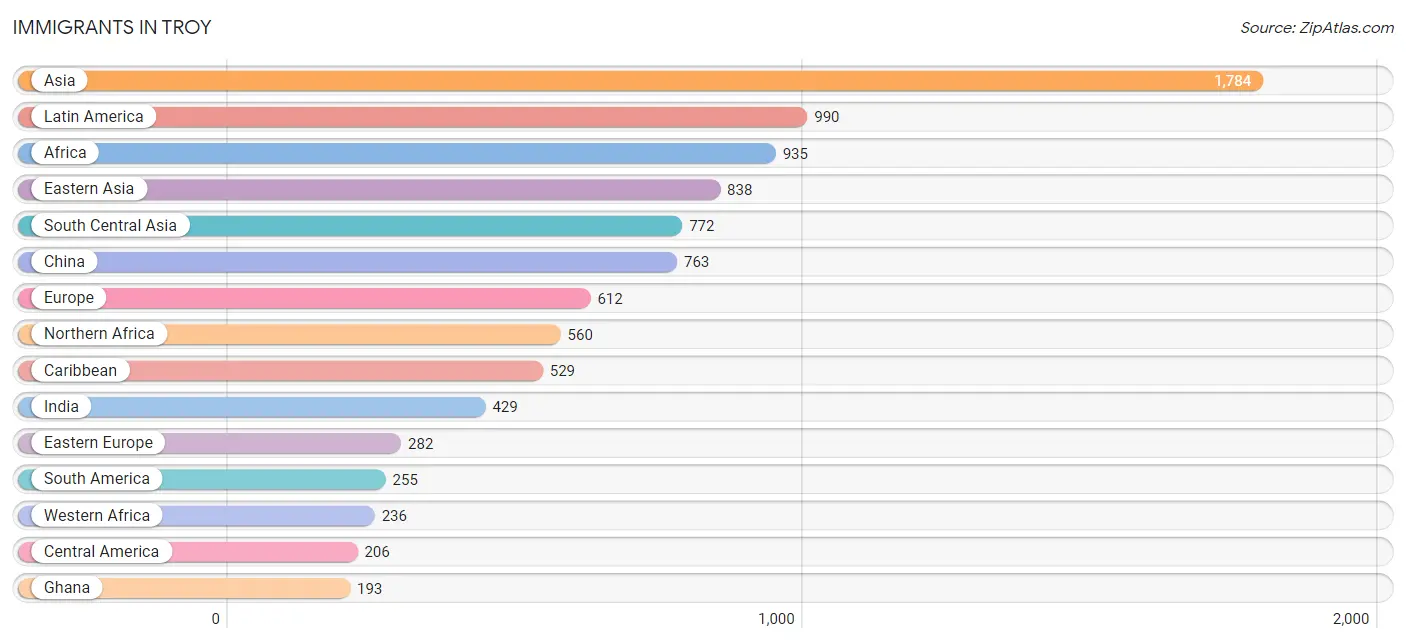
Immigrants in Troy
The most numerous immigrant groups reported in Troy came from Asia (1,784 | 3.5%), Latin America (990 | 1.9%), Africa (935 | 1.8%), Eastern Asia (838 | 1.6%), and South Central Asia (772 | 1.5%), together accounting for 10.4% of all Troy residents.
| Immigration Origin | # Population | % Population |
| Afghanistan | 8 | 0.0% |
| Africa | 935 | 1.8% |
| Albania | 16 | 0.0% |
| Argentina | 10 | 0.0% |
| Asia | 1,784 | 3.5% |
| Australia | 28 | 0.1% |
| Austria | 37 | 0.1% |
| Bangladesh | 33 | 0.1% |
| Belarus | 39 | 0.1% |
| Brazil | 59 | 0.1% |
| Canada | 153 | 0.3% |
| Caribbean | 529 | 1.0% |
| Central America | 206 | 0.4% |
| China | 763 | 1.5% |
| Colombia | 45 | 0.1% |
| Dominican Republic | 153 | 0.3% |
| Eastern Africa | 124 | 0.2% |
| Eastern Asia | 838 | 1.6% |
| Eastern Europe | 282 | 0.5% |
| Ecuador | 21 | 0.0% |
| Egypt | 150 | 0.3% |
| El Salvador | 26 | 0.1% |
| England | 17 | 0.0% |
| Europe | 612 | 1.2% |
| Germany | 78 | 0.2% |
| Ghana | 193 | 0.4% |
| Greece | 64 | 0.1% |
| Guatemala | 5 | 0.0% |
| Guyana | 107 | 0.2% |
| Haiti | 115 | 0.2% |
| Honduras | 21 | 0.0% |
| India | 429 | 0.8% |
| Indonesia | 24 | 0.1% |
| Iran | 98 | 0.2% |
| Ireland | 76 | 0.2% |
| Italy | 18 | 0.0% |
| Jamaica | 100 | 0.2% |
| Kazakhstan | 41 | 0.1% |
| Kenya | 22 | 0.0% |
| Korea | 75 | 0.2% |
| Latin America | 990 | 1.9% |
| Lebanon | 6 | 0.0% |
| Mexico | 154 | 0.3% |
| Middle Africa | 15 | 0.0% |
| Nepal | 48 | 0.1% |
| Netherlands | 6 | 0.0% |
| Nigeria | 33 | 0.1% |
| Northern Africa | 560 | 1.1% |
| Northern Europe | 127 | 0.3% |
| Oceania | 28 | 0.1% |
| Pakistan | 49 | 0.1% |
| Peru | 13 | 0.0% |
| Philippines | 56 | 0.1% |
| Poland | 110 | 0.2% |
| Romania | 20 | 0.0% |
| Russia | 56 | 0.1% |
| Somalia | 34 | 0.1% |
| South America | 255 | 0.5% |
| South Central Asia | 772 | 1.5% |
| South Eastern Asia | 109 | 0.2% |
| Southern Europe | 82 | 0.2% |
| St. Vincent and the Grenadines | 51 | 0.1% |
| Sudan | 19 | 0.0% |
| Syria | 8 | 0.0% |
| Taiwan | 11 | 0.0% |
| Trinidad and Tobago | 78 | 0.2% |
| Turkey | 48 | 0.1% |
| Ukraine | 41 | 0.1% |
| Uzbekistan | 66 | 0.1% |
| Vietnam | 8 | 0.0% |
| Western Africa | 236 | 0.5% |
| Western Asia | 65 | 0.1% |
| Western Europe | 121 | 0.2% |
| Zimbabwe | 9 | 0.0% | View All 74 Rows |
Sex and Age in Troy
Sex and Age in Troy
The most populous age groups in Troy are 15 to 19 Years (3,120 | 12.4%) for men and 20 to 24 Years (2,666 | 10.2%) for women.
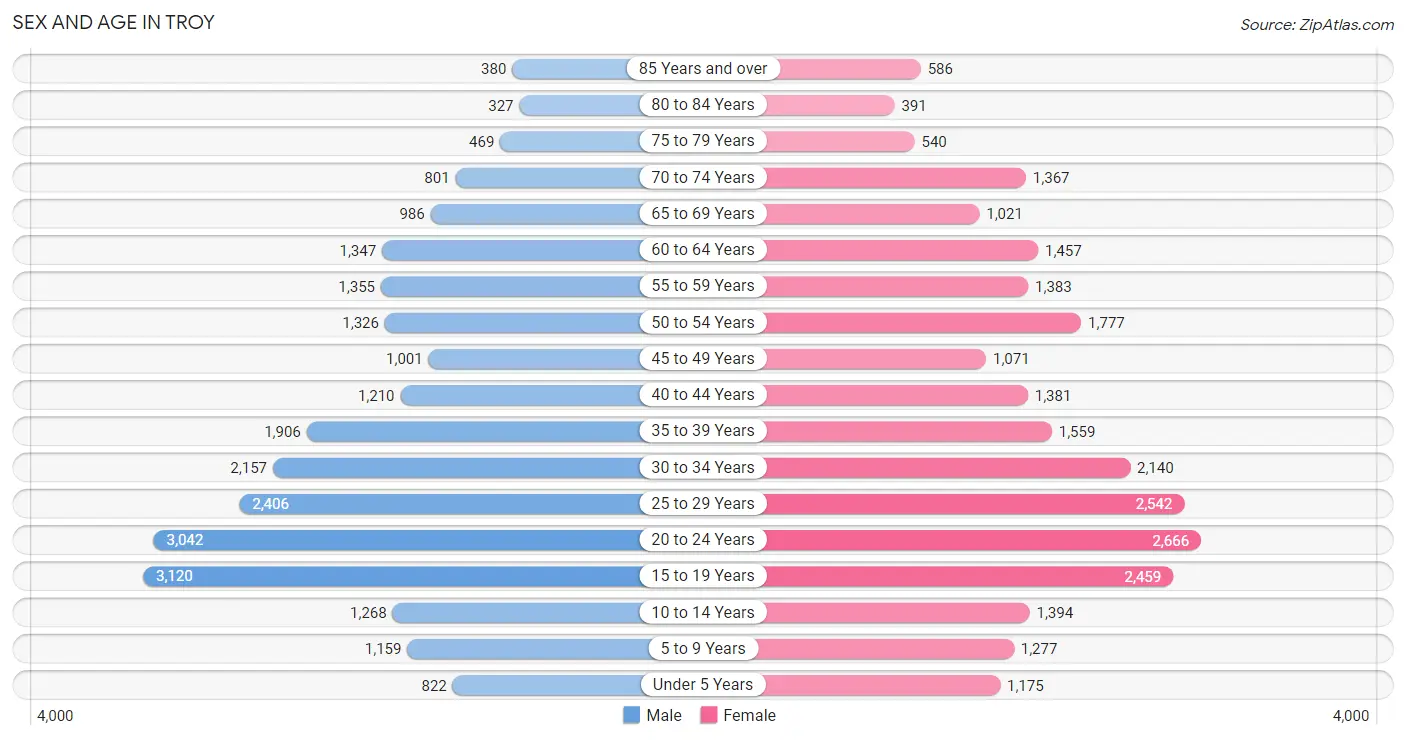
| Age Bracket | Male | Female |
| Under 5 Years | 822 (3.3%) | 1,175 (4.5%) |
| 5 to 9 Years | 1,159 (4.6%) | 1,277 (4.9%) |
| 10 to 14 Years | 1,268 (5.1%) | 1,394 (5.3%) |
| 15 to 19 Years | 3,120 (12.4%) | 2,459 (9.4%) |
| 20 to 24 Years | 3,042 (12.1%) | 2,666 (10.2%) |
| 25 to 29 Years | 2,406 (9.6%) | 2,542 (9.7%) |
| 30 to 34 Years | 2,157 (8.6%) | 2,140 (8.2%) |
| 35 to 39 Years | 1,906 (7.6%) | 1,559 (5.9%) |
| 40 to 44 Years | 1,210 (4.8%) | 1,381 (5.3%) |
| 45 to 49 Years | 1,001 (4.0%) | 1,071 (4.1%) |
| 50 to 54 Years | 1,326 (5.3%) | 1,777 (6.8%) |
| 55 to 59 Years | 1,355 (5.4%) | 1,383 (5.3%) |
| 60 to 64 Years | 1,347 (5.4%) | 1,457 (5.6%) |
| 65 to 69 Years | 986 (3.9%) | 1,021 (3.9%) |
| 70 to 74 Years | 801 (3.2%) | 1,367 (5.2%) |
| 75 to 79 Years | 469 (1.9%) | 540 (2.1%) |
| 80 to 84 Years | 327 (1.3%) | 391 (1.5%) |
| 85 Years and over | 380 (1.5%) | 586 (2.2%) |
| Total | 25,082 (100.0%) | 26,186 (100.0%) |
Families and Households in Troy
Median Family Size in Troy
The median family size in Troy is 2.91 persons per family, with single male/father families (905 | 9.1%) accounting for the largest median family size of 3.1 persons per family. On the other hand, married-couple families (4,970 | 50.1%) represent the smallest median family size with 2.88 persons per family.
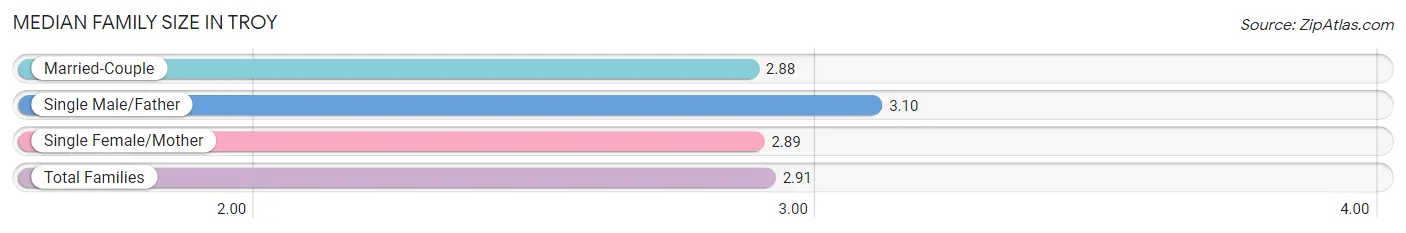
| Family Type | # Families | Family Size |
| Married-Couple | 4,970 (50.1%) | 2.88 |
| Single Male/Father | 905 (9.1%) | 3.10 |
| Single Female/Mother | 4,036 (40.7%) | 2.89 |
| Total Families | 9,911 (100.0%) | 2.91 |
Median Household Size in Troy
The median household size in Troy is 2.14 persons per household, with single male/father households (905 | 4.2%) accounting for the largest median household size of 3.46 persons per household. non-family households (11,663 | 54.1%) represent the smallest median household size with 1.37 persons per household.
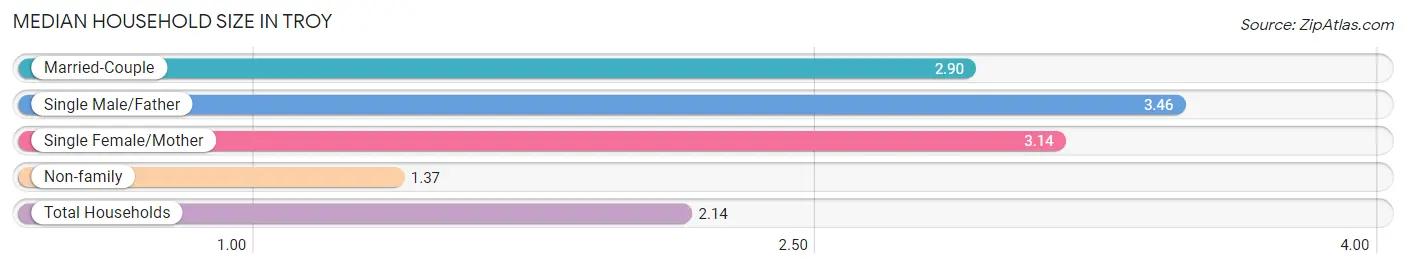
| Household Type | # Households | Household Size |
| Married-Couple | 4,970 (23.0%) | 2.90 |
| Single Male/Father | 905 (4.2%) | 3.46 |
| Single Female/Mother | 4,036 (18.7%) | 3.14 |
| Non-family | 11,663 (54.1%) | 1.37 |
| Total Households | 21,574 (100.0%) | 2.14 |
Household Size by Marriage Status in Troy
Out of a total of 21,574 households in Troy, 9,911 (45.9%) are family households, while 11,663 (54.1%) are nonfamily households. The most numerous type of family households are 2-person households, comprising 4,374, and the most common type of nonfamily households are 1-person households, comprising 8,807.
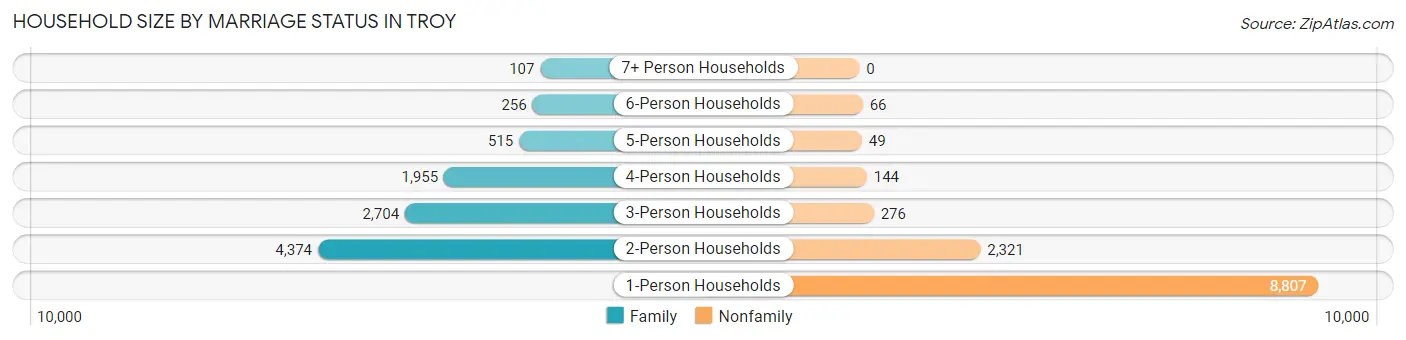
| Household Size | Family Households | Nonfamily Households |
| 1-Person Households | - | 8,807 (40.8%) |
| 2-Person Households | 4,374 (20.3%) | 2,321 (10.8%) |
| 3-Person Households | 2,704 (12.5%) | 276 (1.3%) |
| 4-Person Households | 1,955 (9.1%) | 144 (0.7%) |
| 5-Person Households | 515 (2.4%) | 49 (0.2%) |
| 6-Person Households | 256 (1.2%) | 66 (0.3%) |
| 7+ Person Households | 107 (0.5%) | 0 (0.0%) |
| Total | 9,911 (45.9%) | 11,663 (54.1%) |
Female Fertility in Troy
Fertility by Age in Troy
Average fertility rate in Troy is 23.0 births per 1,000 women. Women in the age bracket of 20 to 34 years have the highest fertility rate with 31.0 births per 1,000 women. Women in the age bracket of 20 to 34 years acount for 72.2% of all women with births.
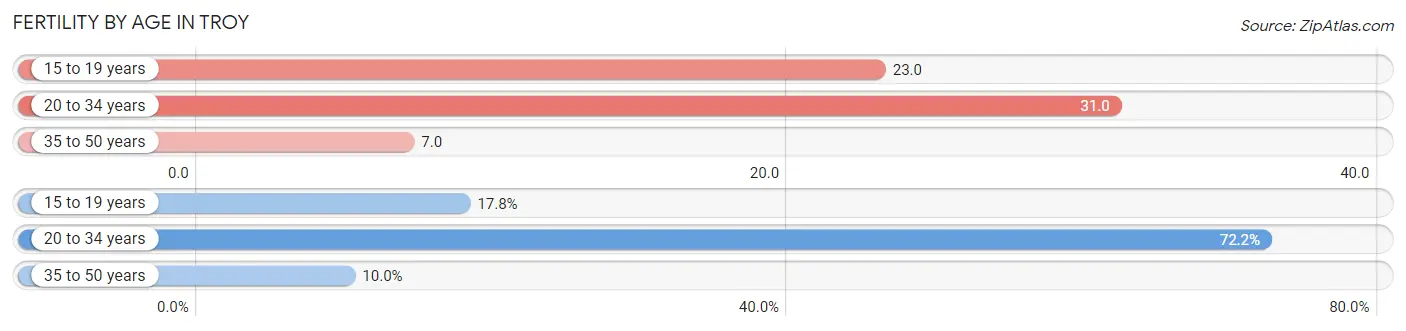
| Age Bracket | Women with Births | Births / 1,000 Women |
| 15 to 19 years | 57 (17.8%) | 23.0 |
| 20 to 34 years | 231 (72.2%) | 31.0 |
| 35 to 50 years | 32 (10.0%) | 7.0 |
| Total | 320 (100.0%) | 23.0 |
Fertility by Age by Marriage Status in Troy
30.9% of women with births (320) in Troy are married. The highest percentage of unmarried women with births falls into 15 to 19 years age bracket with 100.0% of them unmarried at the time of birth, while the lowest percentage of unmarried women with births belong to 35 to 50 years age bracket with 21.9% of them unmarried.
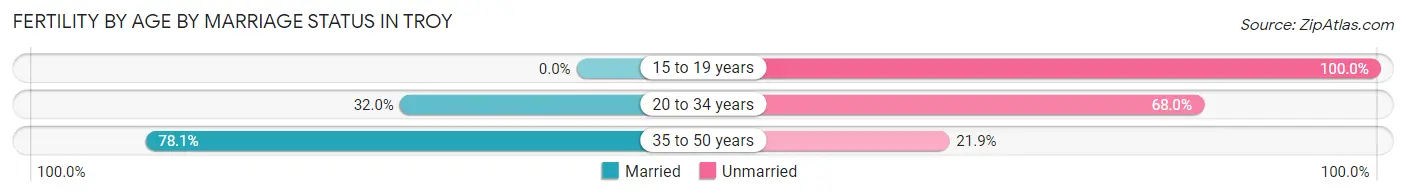
| Age Bracket | Married | Unmarried |
| 15 to 19 years | 0 (0.0%) | 57 (100.0%) |
| 20 to 34 years | 74 (32.0%) | 157 (68.0%) |
| 35 to 50 years | 25 (78.1%) | 7 (21.9%) |
| Total | 99 (30.9%) | 221 (69.1%) |
Fertility by Education in Troy
Average fertility rate in Troy is 23.0 births per 1,000 women. Women with the education attainment of less than high school have the highest fertility rate of 47.0 births per 1,000 women, while women with the education attainment of bachelor's degree have the lowest fertility at 15.0 births per 1,000 women. Women with the education attainment of less than high school represent 30.9% of all women with births.
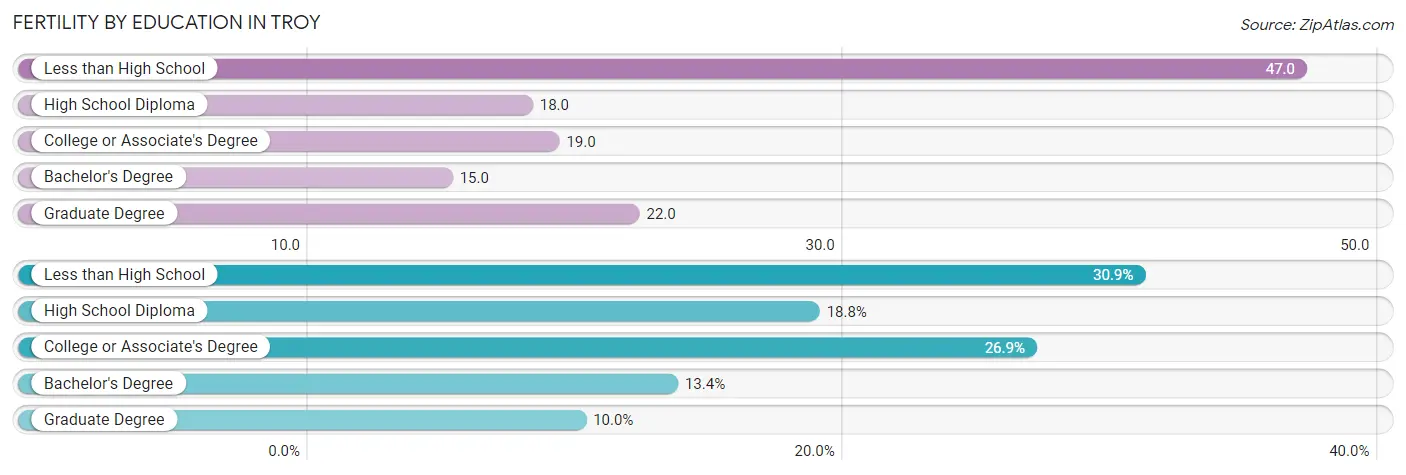
| Educational Attainment | Women with Births | Births / 1,000 Women |
| Less than High School | 99 (30.9%) | 47.0 |
| High School Diploma | 60 (18.8%) | 18.0 |
| College or Associate's Degree | 86 (26.9%) | 19.0 |
| Bachelor's Degree | 43 (13.4%) | 15.0 |
| Graduate Degree | 32 (10.0%) | 22.0 |
| Total | 320 (100.0%) | 23.0 |
Fertility by Education by Marriage Status in Troy
69.1% of women with births in Troy are unmarried. Women with the educational attainment of graduate degree are most likely to be married with 100.0% of them married at childbirth, while women with the educational attainment of less than high school are least likely to be married with 90.9% of them unmarried at childbirth.
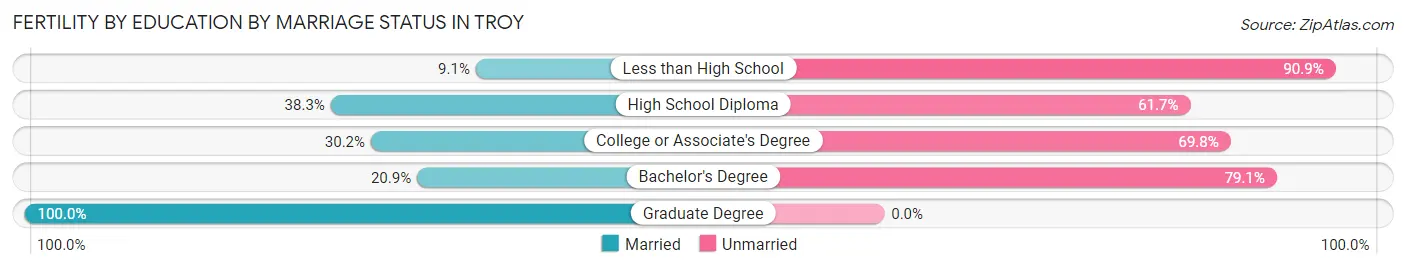
| Educational Attainment | Married | Unmarried |
| Less than High School | 9 (9.1%) | 90 (90.9%) |
| High School Diploma | 23 (38.3%) | 37 (61.7%) |
| College or Associate's Degree | 26 (30.2%) | 60 (69.8%) |
| Bachelor's Degree | 9 (20.9%) | 34 (79.1%) |
| Graduate Degree | 32 (100.0%) | 0 (0.0%) |
| Total | 99 (30.9%) | 221 (69.1%) |
Employment Characteristics in Troy
Employment by Class of Employer in Troy
Among the 23,172 employed individuals in Troy, private company employees (13,324 | 57.5%), not-for-profit organizations (4,177 | 18.0%), and state government employees (2,249 | 9.7%) make up the most common classes of employment.
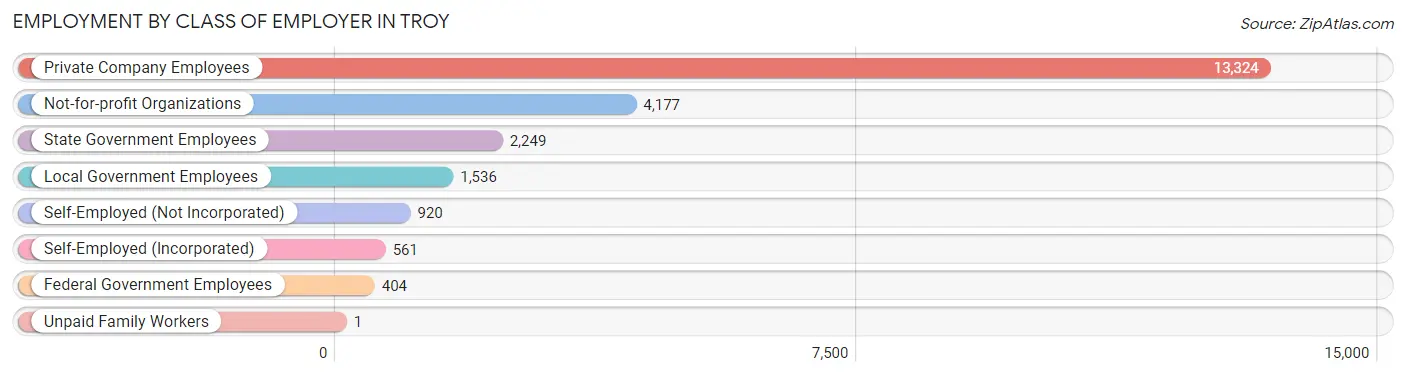
| Employer Class | # Employees | % Employees |
| Private Company Employees | 13,324 | 57.5% |
| Self-Employed (Incorporated) | 561 | 2.4% |
| Self-Employed (Not Incorporated) | 920 | 4.0% |
| Not-for-profit Organizations | 4,177 | 18.0% |
| Local Government Employees | 1,536 | 6.6% |
| State Government Employees | 2,249 | 9.7% |
| Federal Government Employees | 404 | 1.7% |
| Unpaid Family Workers | 1 | 0.0% |
| Total | 23,172 | 100.0% |
Employment Status by Age in Troy
According to the labor force statistics for Troy, out of the total population over 16 years of age (43,834), 60.2% or 26,388 individuals are in the labor force, with 9.7% or 2,560 of them unemployed. The age group with the highest labor force participation rate is 35 to 44 years, with 88.2% or 5,341 individuals in the labor force. Within the labor force, the 16 to 19 years age range has the highest percentage of unemployed individuals, with 33.0% or 481 of them being unemployed.
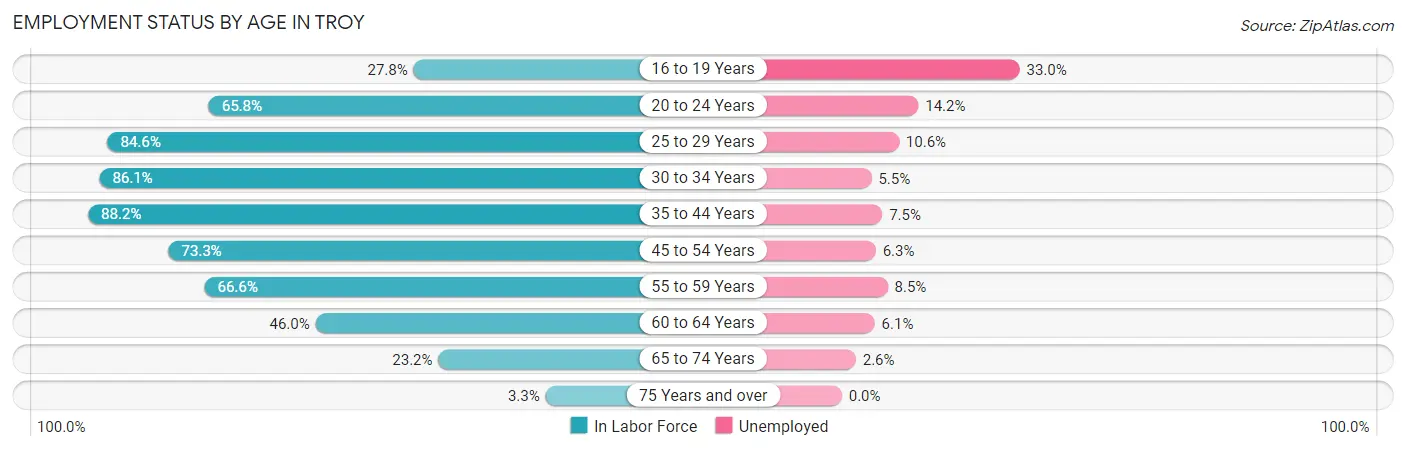
| Age Bracket | In Labor Force | Unemployed |
| 16 to 19 Years | 1,457 (27.8%) | 481 (33.0%) |
| 20 to 24 Years | 3,756 (65.8%) | 533 (14.2%) |
| 25 to 29 Years | 4,186 (84.6%) | 444 (10.6%) |
| 30 to 34 Years | 3,700 (86.1%) | 204 (5.5%) |
| 35 to 44 Years | 5,341 (88.2%) | 401 (7.5%) |
| 45 to 54 Years | 3,793 (73.3%) | 239 (6.3%) |
| 55 to 59 Years | 1,824 (66.6%) | 155 (8.5%) |
| 60 to 64 Years | 1,290 (46.0%) | 79 (6.1%) |
| 65 to 74 Years | 969 (23.2%) | 25 (2.6%) |
| 75 Years and over | 89 (3.3%) | 0 (0.0%) |
| Total | 26,388 (60.2%) | 2,560 (9.7%) |
Employment Status by Educational Attainment in Troy
According to labor force statistics for Troy, 77.4% of individuals (20,138) out of the total population between 25 and 64 years of age (26,018) are in the labor force, with 7.5% or 1,510 of them being unemployed. The group with the highest labor force participation rate are those with the educational attainment of bachelor's degree or higher, with 89.3% or 7,991 individuals in the labor force. Within the labor force, individuals with less than high school education have the highest percentage of unemployment, with 14.1% or 252 of them being unemployed.
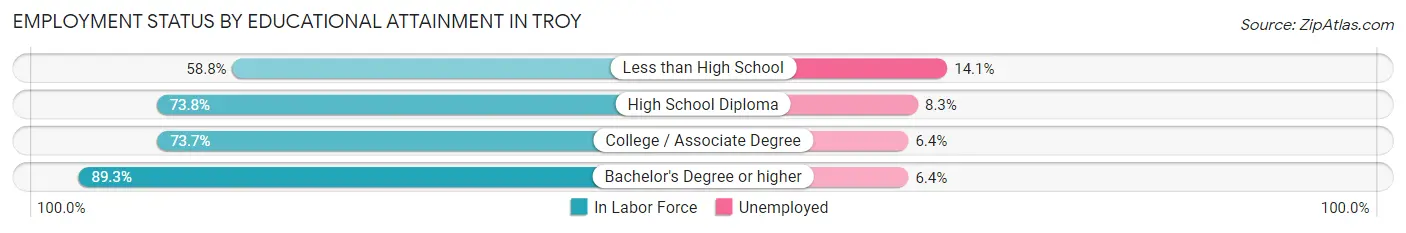
| Educational Attainment | In Labor Force | Unemployed |
| Less than High School | 1,786 (58.8%) | 428 (14.1%) |
| High School Diploma | 4,728 (73.8%) | 532 (8.3%) |
| College / Associate Degree | 5,620 (73.7%) | 488 (6.4%) |
| Bachelor's Degree or higher | 7,991 (89.3%) | 573 (6.4%) |
| Total | 20,138 (77.4%) | 1,951 (7.5%) |
Employment Occupations by Sex in Troy
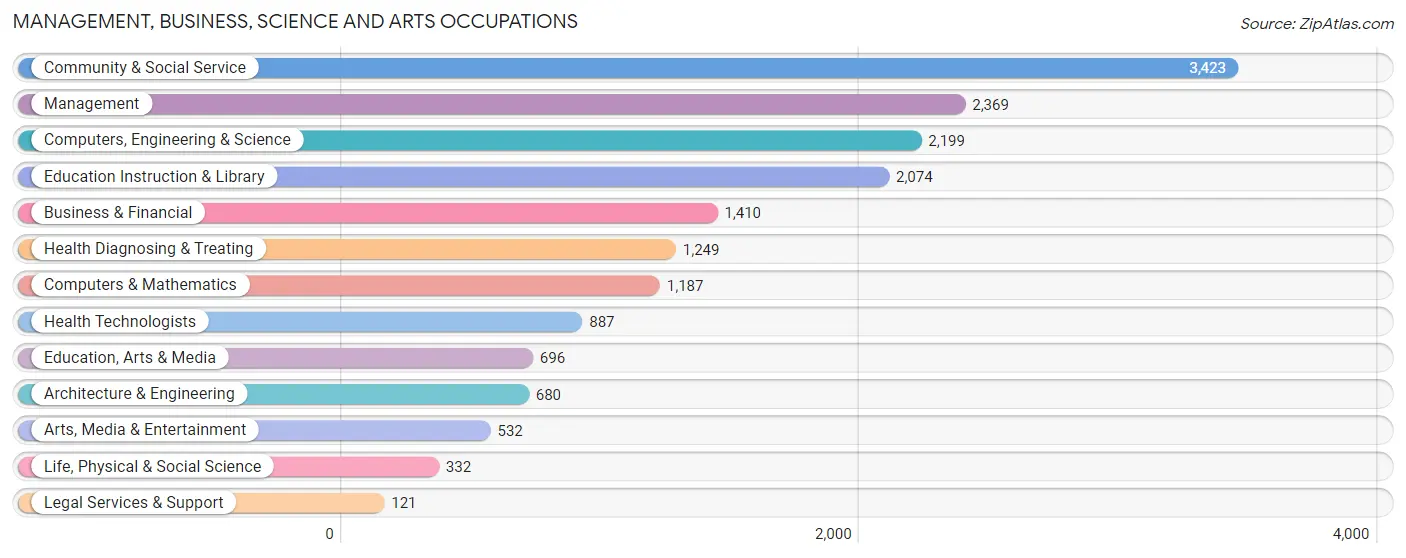
Management, Business, Science and Arts Occupations
The most common Management, Business, Science and Arts occupations in Troy are Community & Social Service (3,423 | 14.4%), Management (2,369 | 10.0%), Computers, Engineering & Science (2,199 | 9.2%), Education Instruction & Library (2,074 | 8.7%), and Business & Financial (1,410 | 5.9%).
Management, Business, Science and Arts Occupations by Sex
Within the Management, Business, Science and Arts occupations in Troy, the most male-oriented occupations are Architecture & Engineering (70.9%), Computers & Mathematics (67.5%), and Computers, Engineering & Science (67.2%), while the most female-oriented occupations are Health Technologists (87.3%), Health Diagnosing & Treating (81.2%), and Education, Arts & Media (68.2%).

| Occupation | Male | Female |
| Management | 1,345 (56.8%) | 1,024 (43.2%) |
| Business & Financial | 706 (50.1%) | 704 (49.9%) |
| Computers, Engineering & Science | 1,478 (67.2%) | 721 (32.8%) |
| Computers & Mathematics | 801 (67.5%) | 386 (32.5%) |
| Architecture & Engineering | 482 (70.9%) | 198 (29.1%) |
| Life, Physical & Social Science | 195 (58.7%) | 137 (41.3%) |
| Community & Social Service | 1,528 (44.6%) | 1,895 (55.4%) |
| Education, Arts & Media | 221 (31.8%) | 475 (68.2%) |
| Legal Services & Support | 44 (36.4%) | 77 (63.6%) |
| Education Instruction & Library | 980 (47.2%) | 1,094 (52.7%) |
| Arts, Media & Entertainment | 283 (53.2%) | 249 (46.8%) |
| Health Diagnosing & Treating | 235 (18.8%) | 1,014 (81.2%) |
| Health Technologists | 113 (12.7%) | 774 (87.3%) |
| Total (Category) | 5,292 (49.7%) | 5,358 (50.3%) |
| Total (Overall) | 12,021 (50.5%) | 11,777 (49.5%) |
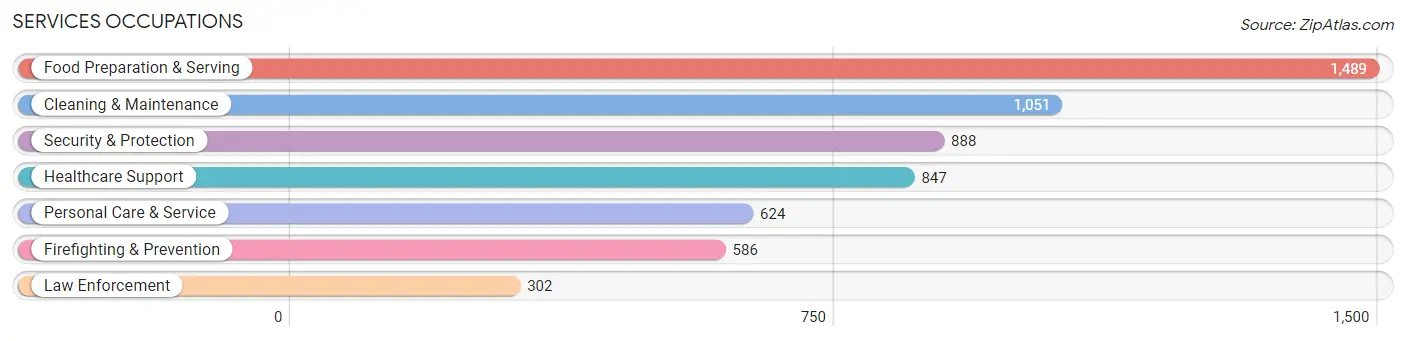
Services Occupations
The most common Services occupations in Troy are Food Preparation & Serving (1,489 | 6.3%), Cleaning & Maintenance (1,051 | 4.4%), Security & Protection (888 | 3.7%), Healthcare Support (847 | 3.6%), and Personal Care & Service (624 | 2.6%).
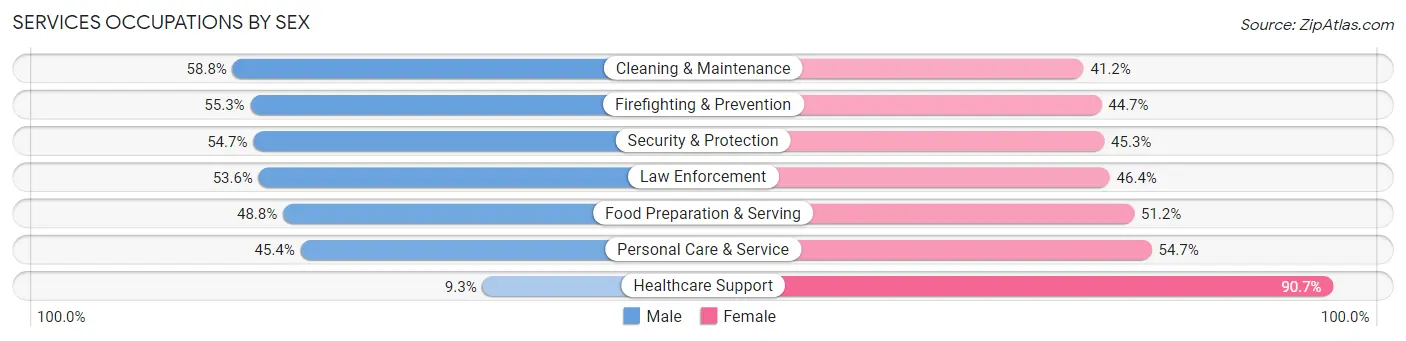
Services Occupations by Sex
Within the Services occupations in Troy, the most male-oriented occupations are Cleaning & Maintenance (58.8%), Firefighting & Prevention (55.3%), and Security & Protection (54.7%), while the most female-oriented occupations are Healthcare Support (90.7%), Personal Care & Service (54.6%), and Food Preparation & Serving (51.2%).
| Occupation | Male | Female |
| Healthcare Support | 79 (9.3%) | 768 (90.7%) |
| Security & Protection | 486 (54.7%) | 402 (45.3%) |
| Firefighting & Prevention | 324 (55.3%) | 262 (44.7%) |
| Law Enforcement | 162 (53.6%) | 140 (46.4%) |
| Food Preparation & Serving | 727 (48.8%) | 762 (51.2%) |
| Cleaning & Maintenance | 618 (58.8%) | 433 (41.2%) |
| Personal Care & Service | 283 (45.4%) | 341 (54.6%) |
| Total (Category) | 2,193 (44.8%) | 2,706 (55.2%) |
| Total (Overall) | 12,021 (50.5%) | 11,777 (49.5%) |
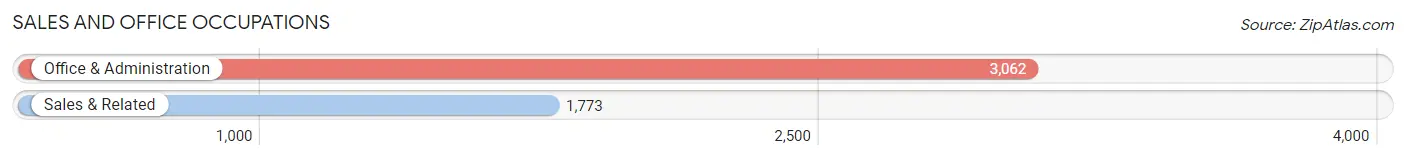
Sales and Office Occupations
The most common Sales and Office occupations in Troy are Office & Administration (3,062 | 12.9%), and Sales & Related (1,773 | 7.4%).
Sales and Office Occupations by Sex
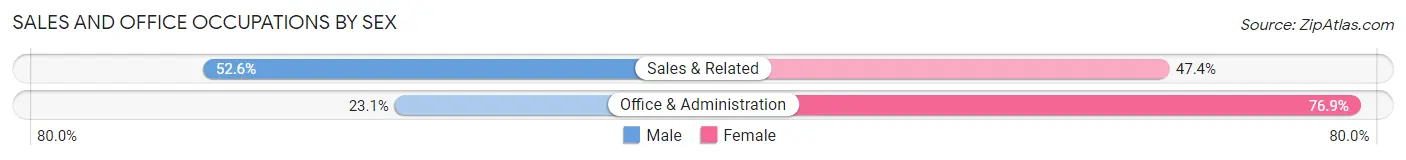
| Occupation | Male | Female |
| Sales & Related | 932 (52.6%) | 841 (47.4%) |
| Office & Administration | 706 (23.1%) | 2,356 (76.9%) |
| Total (Category) | 1,638 (33.9%) | 3,197 (66.1%) |
| Total (Overall) | 12,021 (50.5%) | 11,777 (49.5%) |
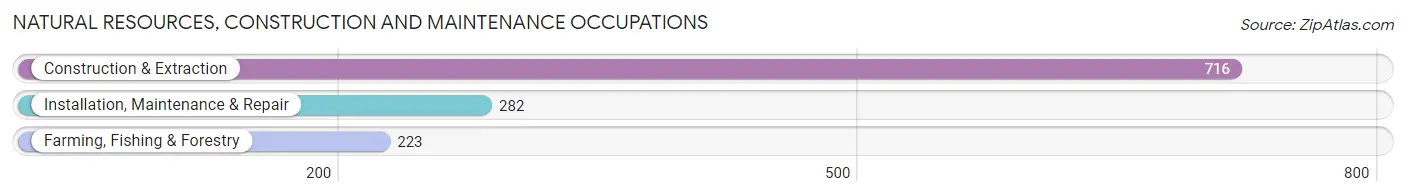
Natural Resources, Construction and Maintenance Occupations
The most common Natural Resources, Construction and Maintenance occupations in Troy are Construction & Extraction (716 | 3.0%), Installation, Maintenance & Repair (282 | 1.2%), and Farming, Fishing & Forestry (223 | 0.9%).
Natural Resources, Construction and Maintenance Occupations by Sex
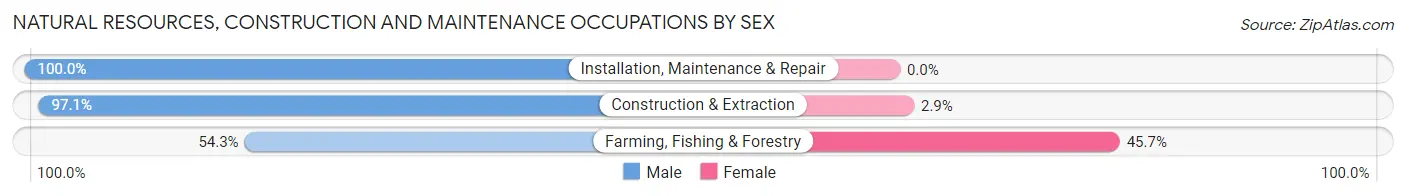
| Occupation | Male | Female |
| Farming, Fishing & Forestry | 121 (54.3%) | 102 (45.7%) |
| Construction & Extraction | 695 (97.1%) | 21 (2.9%) |
| Installation, Maintenance & Repair | 282 (100.0%) | 0 (0.0%) |
| Total (Category) | 1,098 (89.9%) | 123 (10.1%) |
| Total (Overall) | 12,021 (50.5%) | 11,777 (49.5%) |
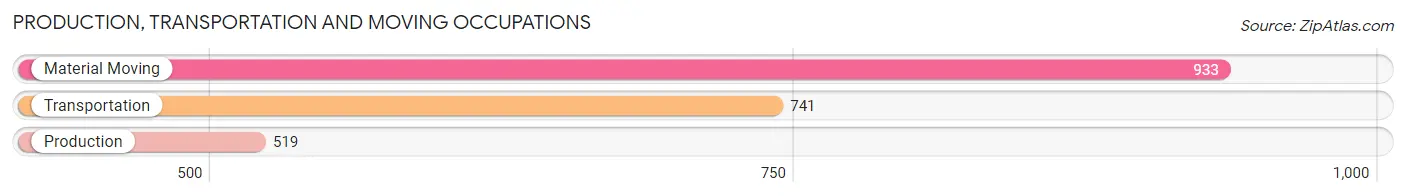
Production, Transportation and Moving Occupations
The most common Production, Transportation and Moving occupations in Troy are Material Moving (933 | 3.9%), Transportation (741 | 3.1%), and Production (519 | 2.2%).
Production, Transportation and Moving Occupations by Sex
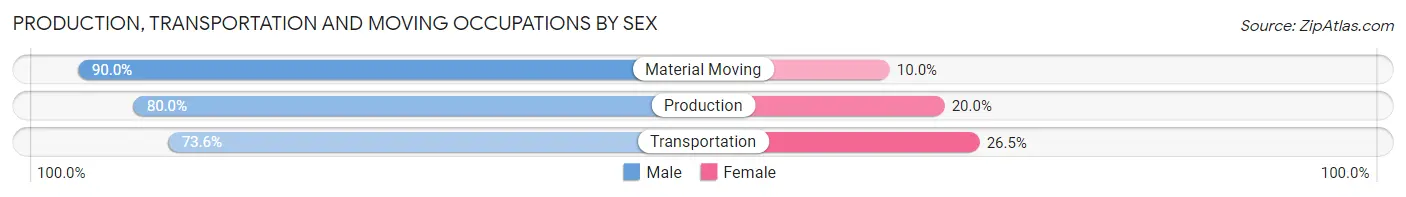
| Occupation | Male | Female |
| Production | 415 (80.0%) | 104 (20.0%) |
| Transportation | 545 (73.6%) | 196 (26.5%) |
| Material Moving | 840 (90.0%) | 93 (10.0%) |
| Total (Category) | 1,800 (82.1%) | 393 (17.9%) |
| Total (Overall) | 12,021 (50.5%) | 11,777 (49.5%) |
Employment Industries by Sex in Troy
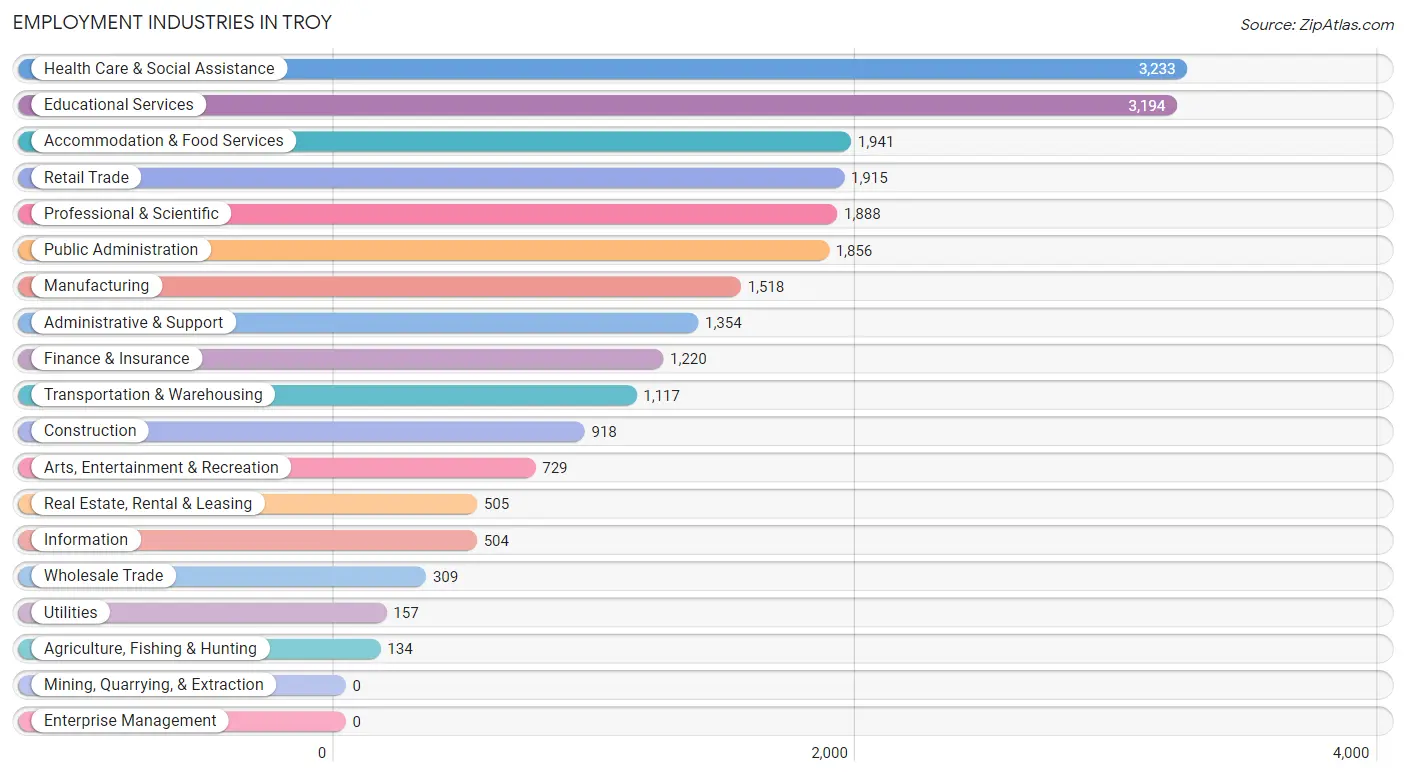
Employment Industries in Troy
The major employment industries in Troy include Health Care & Social Assistance (3,233 | 13.6%), Educational Services (3,194 | 13.4%), Accommodation & Food Services (1,941 | 8.2%), Retail Trade (1,915 | 8.1%), and Professional & Scientific (1,888 | 7.9%).
Employment Industries by Sex in Troy
The Troy industries that see more men than women are Construction (92.0%), Utilities (80.2%), and Wholesale Trade (76.7%), whereas the industries that tend to have a higher number of women are Health Care & Social Assistance (80.5%), Real Estate, Rental & Leasing (63.6%), and Educational Services (53.9%).
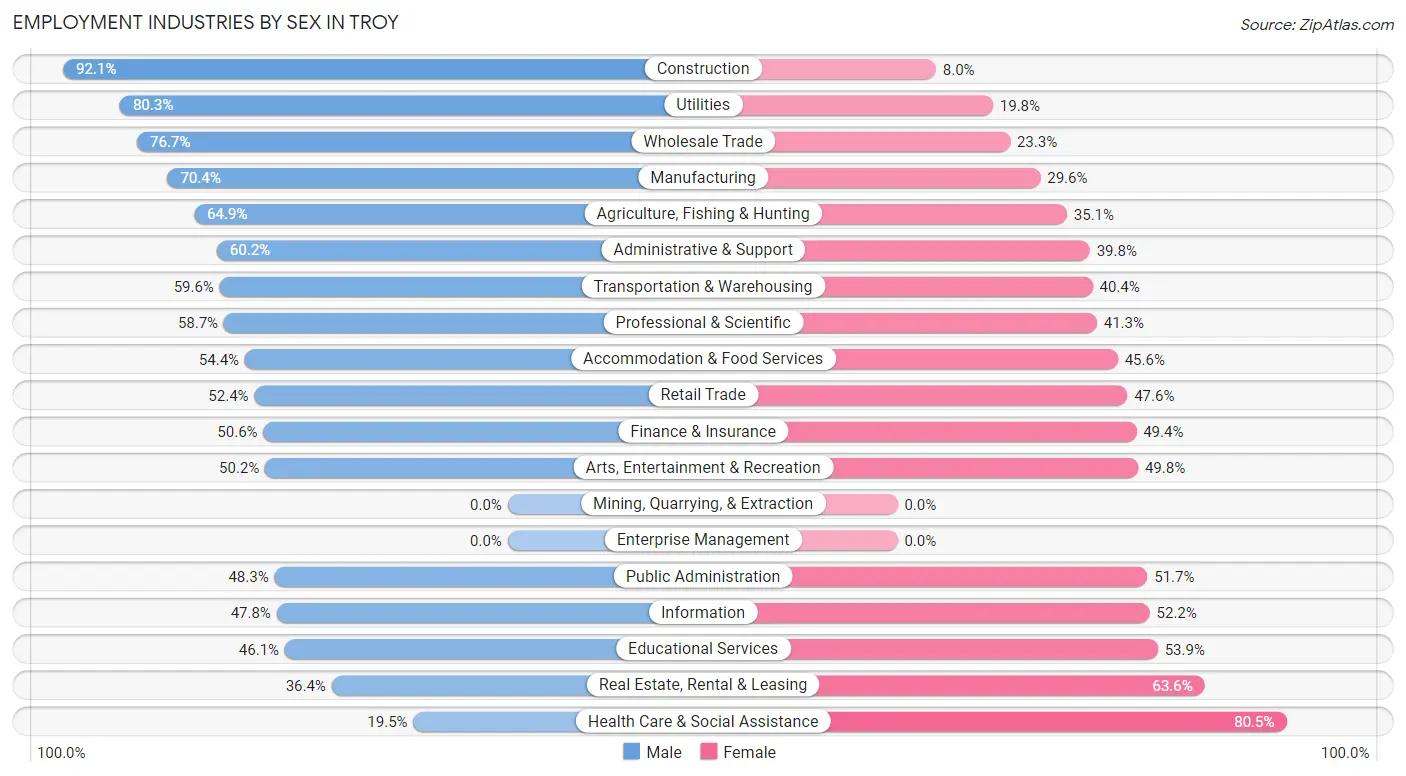
| Industry | Male | Female |
| Agriculture, Fishing & Hunting | 87 (64.9%) | 47 (35.1%) |
| Mining, Quarrying, & Extraction | 0 (0.0%) | 0 (0.0%) |
| Construction | 845 (92.0%) | 73 (8.0%) |
| Manufacturing | 1,069 (70.4%) | 449 (29.6%) |
| Wholesale Trade | 237 (76.7%) | 72 (23.3%) |
| Retail Trade | 1,004 (52.4%) | 911 (47.6%) |
| Transportation & Warehousing | 666 (59.6%) | 451 (40.4%) |
| Utilities | 126 (80.2%) | 31 (19.8%) |
| Information | 241 (47.8%) | 263 (52.2%) |
| Finance & Insurance | 617 (50.6%) | 603 (49.4%) |
| Real Estate, Rental & Leasing | 184 (36.4%) | 321 (63.6%) |
| Professional & Scientific | 1,109 (58.7%) | 779 (41.3%) |
| Enterprise Management | 0 (0.0%) | 0 (0.0%) |
| Administrative & Support | 815 (60.2%) | 539 (39.8%) |
| Educational Services | 1,473 (46.1%) | 1,721 (53.9%) |
| Health Care & Social Assistance | 631 (19.5%) | 2,602 (80.5%) |
| Arts, Entertainment & Recreation | 366 (50.2%) | 363 (49.8%) |
| Accommodation & Food Services | 1,056 (54.4%) | 885 (45.6%) |
| Public Administration | 896 (48.3%) | 960 (51.7%) |
| Total | 12,021 (50.5%) | 11,777 (49.5%) |
Education in Troy
School Enrollment in Troy
The most common levels of schooling among the 15,173 students in Troy are college / undergraduate (6,882 | 45.4%), elementary school (2,471 | 16.3%), and high school (2,280 | 15.0%).
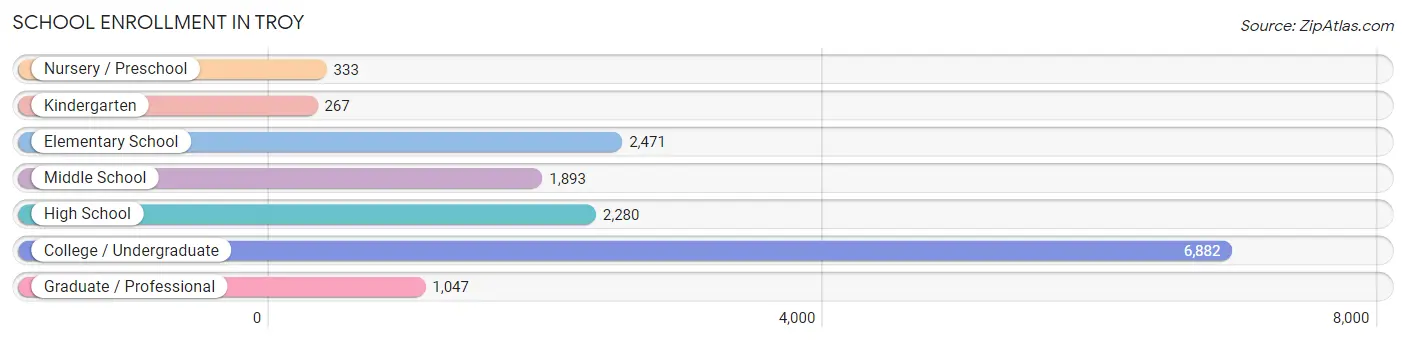
| School Level | # Students | % Students |
| Nursery / Preschool | 333 | 2.2% |
| Kindergarten | 267 | 1.8% |
| Elementary School | 2,471 | 16.3% |
| Middle School | 1,893 | 12.5% |
| High School | 2,280 | 15.0% |
| College / Undergraduate | 6,882 | 45.4% |
| Graduate / Professional | 1,047 | 6.9% |
| Total | 15,173 | 100.0% |
School Enrollment by Age by Funding Source in Troy
Out of a total of 15,173 students who are enrolled in schools in Troy, 6,843 (45.1%) attend a private institution, while the remaining 8,330 (54.9%) are enrolled in public schools. The age group of 18 to 19 year olds has the highest likelihood of being enrolled in private schools, with 2,814 (85.0% in the age bracket) enrolled. Conversely, the age group of 5 to 9 year old has the lowest likelihood of being enrolled in a private school, with 2,294 (95.6% in the age bracket) attending a public institution.
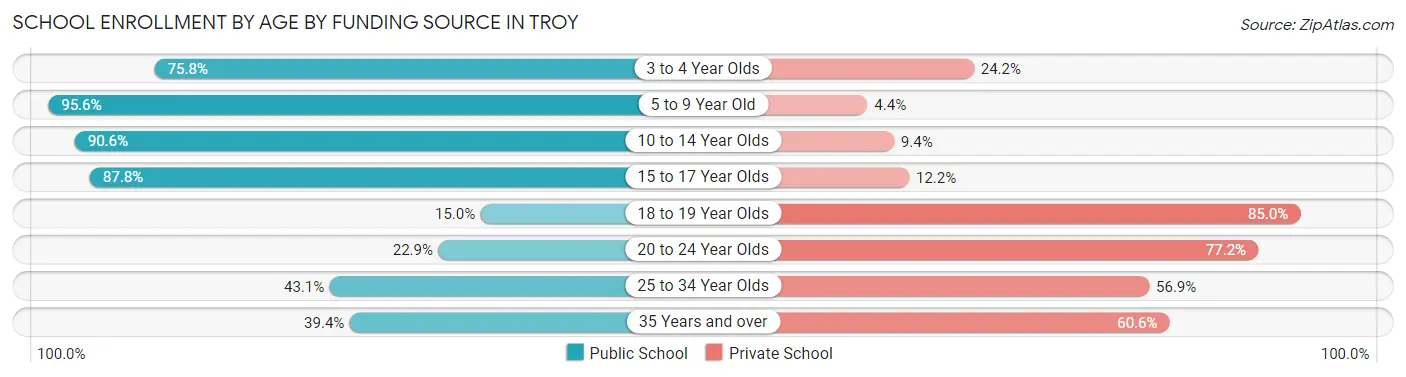
| Age Bracket | Public School | Private School |
| 3 to 4 Year Olds | 222 (75.8%) | 71 (24.2%) |
| 5 to 9 Year Old | 2,294 (95.6%) | 106 (4.4%) |
| 10 to 14 Year Olds | 2,402 (90.6%) | 248 (9.4%) |
| 15 to 17 Year Olds | 1,501 (87.8%) | 208 (12.2%) |
| 18 to 19 Year Olds | 496 (15.0%) | 2,814 (85.0%) |
| 20 to 24 Year Olds | 730 (22.9%) | 2,465 (77.1%) |
| 25 to 34 Year Olds | 494 (43.1%) | 652 (56.9%) |
| 35 Years and over | 185 (39.4%) | 285 (60.6%) |
| Total | 8,330 (54.9%) | 6,843 (45.1%) |
Educational Attainment by Field of Study in Troy
Business (1,346 | 11.3%), education (1,289 | 10.8%), social sciences (1,156 | 9.7%), science & technology (1,116 | 9.3%), and literature & languages (1,108 | 9.3%) are the most common fields of study among 11,959 individuals in Troy who have obtained a bachelor's degree or higher.
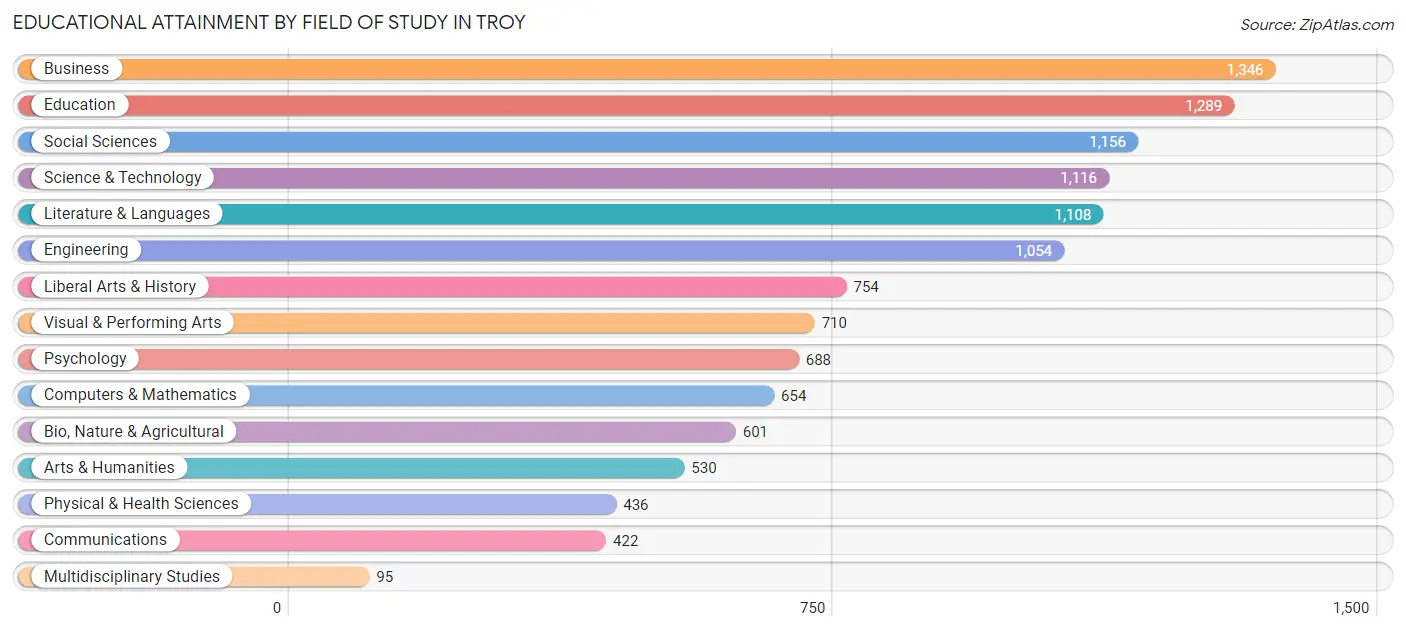
| Field of Study | # Graduates | % Graduates |
| Computers & Mathematics | 654 | 5.5% |
| Bio, Nature & Agricultural | 601 | 5.0% |
| Physical & Health Sciences | 436 | 3.6% |
| Psychology | 688 | 5.8% |
| Social Sciences | 1,156 | 9.7% |
| Engineering | 1,054 | 8.8% |
| Multidisciplinary Studies | 95 | 0.8% |
| Science & Technology | 1,116 | 9.3% |
| Business | 1,346 | 11.3% |
| Education | 1,289 | 10.8% |
| Literature & Languages | 1,108 | 9.3% |
| Liberal Arts & History | 754 | 6.3% |
| Visual & Performing Arts | 710 | 5.9% |
| Communications | 422 | 3.5% |
| Arts & Humanities | 530 | 4.4% |
| Total | 11,959 | 100.0% |
Transportation & Commute in Troy
Vehicle Availability by Sex in Troy
The most prevalent vehicle ownership categories in Troy are males with 1 vehicle (4,386, accounting for 38.3%) and females with 1 vehicle (4,381, making up 39.8%).
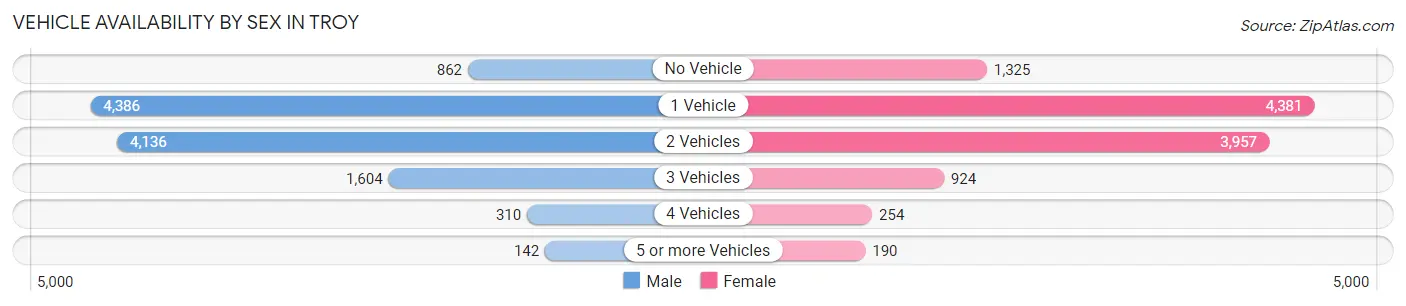
| Vehicles Available | Male | Female |
| No Vehicle | 862 (7.5%) | 1,325 (12.0%) |
| 1 Vehicle | 4,386 (38.3%) | 4,381 (39.7%) |
| 2 Vehicles | 4,136 (36.1%) | 3,957 (35.9%) |
| 3 Vehicles | 1,604 (14.0%) | 924 (8.4%) |
| 4 Vehicles | 310 (2.7%) | 254 (2.3%) |
| 5 or more Vehicles | 142 (1.2%) | 190 (1.7%) |
| Total | 11,440 (100.0%) | 11,031 (100.0%) |
Commute Time in Troy
The most frequently occuring commute durations in Troy are 15 to 19 minutes (4,611 commuters, 22.3%), 20 to 24 minutes (3,744 commuters, 18.1%), and 10 to 14 minutes (2,815 commuters, 13.6%).
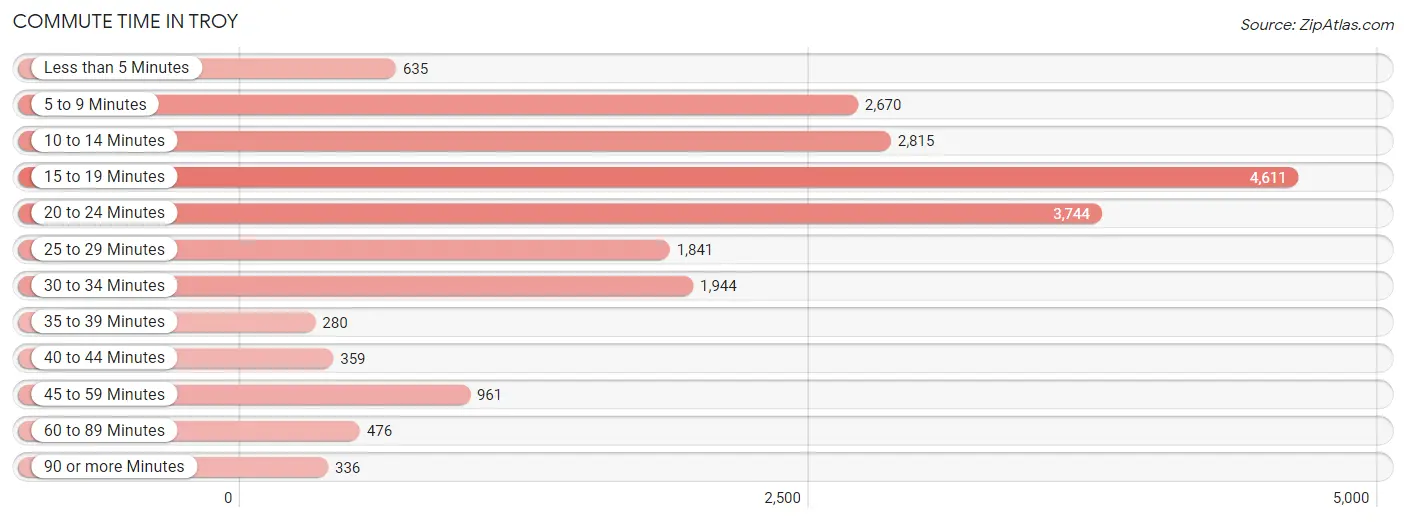
| Commute Time | # Commuters | % Commuters |
| Less than 5 Minutes | 635 | 3.1% |
| 5 to 9 Minutes | 2,670 | 12.9% |
| 10 to 14 Minutes | 2,815 | 13.6% |
| 15 to 19 Minutes | 4,611 | 22.3% |
| 20 to 24 Minutes | 3,744 | 18.1% |
| 25 to 29 Minutes | 1,841 | 8.9% |
| 30 to 34 Minutes | 1,944 | 9.4% |
| 35 to 39 Minutes | 280 | 1.3% |
| 40 to 44 Minutes | 359 | 1.7% |
| 45 to 59 Minutes | 961 | 4.6% |
| 60 to 89 Minutes | 476 | 2.3% |
| 90 or more Minutes | 336 | 1.6% |
Commute Time by Sex in Troy
The most common commute times in Troy are 15 to 19 minutes (2,257 commuters, 21.5%) for males and 15 to 19 minutes (2,354 commuters, 23.1%) for females.
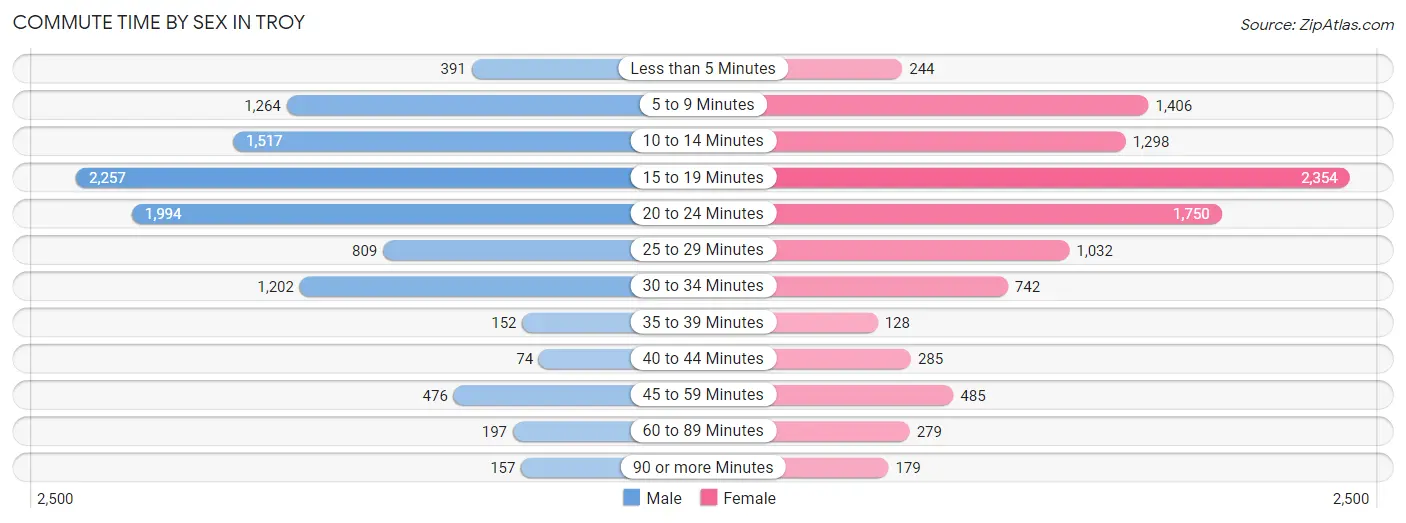
| Commute Time | Male | Female |
| Less than 5 Minutes | 391 (3.7%) | 244 (2.4%) |
| 5 to 9 Minutes | 1,264 (12.0%) | 1,406 (13.8%) |
| 10 to 14 Minutes | 1,517 (14.5%) | 1,298 (12.8%) |
| 15 to 19 Minutes | 2,257 (21.5%) | 2,354 (23.1%) |
| 20 to 24 Minutes | 1,994 (19.0%) | 1,750 (17.2%) |
| 25 to 29 Minutes | 809 (7.7%) | 1,032 (10.1%) |
| 30 to 34 Minutes | 1,202 (11.5%) | 742 (7.3%) |
| 35 to 39 Minutes | 152 (1.5%) | 128 (1.3%) |
| 40 to 44 Minutes | 74 (0.7%) | 285 (2.8%) |
| 45 to 59 Minutes | 476 (4.5%) | 485 (4.8%) |
| 60 to 89 Minutes | 197 (1.9%) | 279 (2.7%) |
| 90 or more Minutes | 157 (1.5%) | 179 (1.8%) |
Time of Departure to Work by Sex in Troy
The most frequent times of departure to work in Troy are 7:00 AM to 7:29 AM (1,453, 13.9%) for males and 7:00 AM to 7:29 AM (1,704, 16.7%) for females.
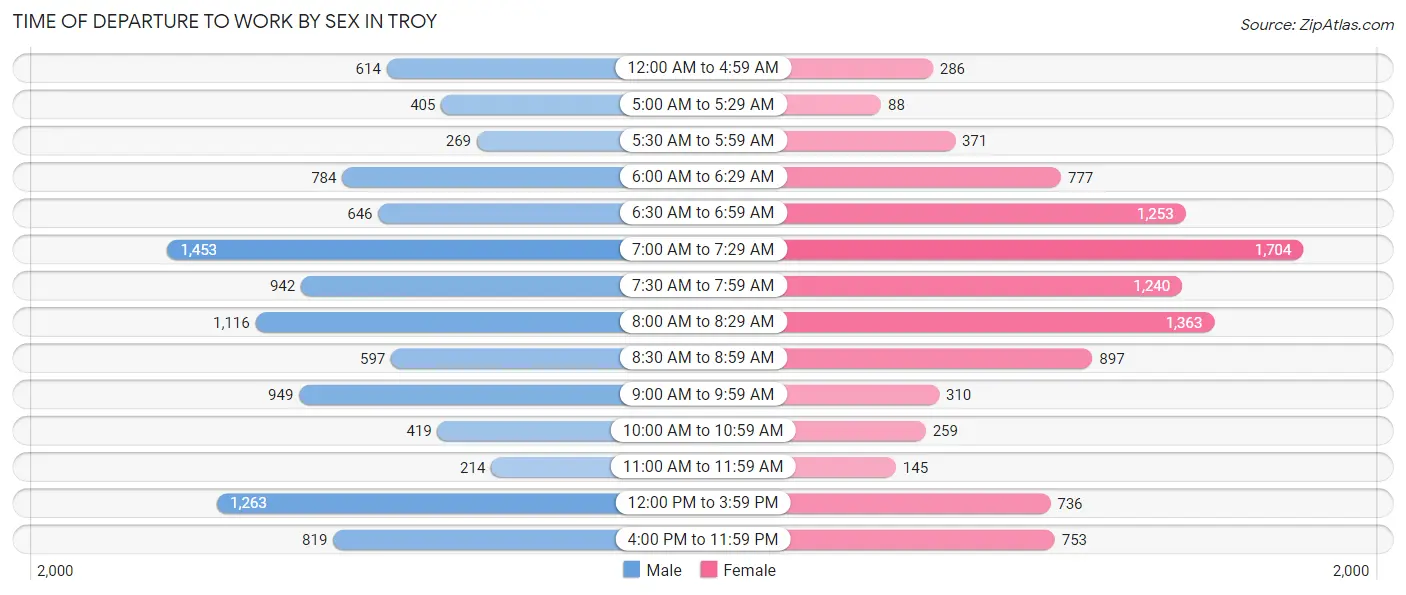
| Time of Departure | Male | Female |
| 12:00 AM to 4:59 AM | 614 (5.9%) | 286 (2.8%) |
| 5:00 AM to 5:29 AM | 405 (3.9%) | 88 (0.9%) |
| 5:30 AM to 5:59 AM | 269 (2.6%) | 371 (3.6%) |
| 6:00 AM to 6:29 AM | 784 (7.5%) | 777 (7.6%) |
| 6:30 AM to 6:59 AM | 646 (6.2%) | 1,253 (12.3%) |
| 7:00 AM to 7:29 AM | 1,453 (13.9%) | 1,704 (16.7%) |
| 7:30 AM to 7:59 AM | 942 (9.0%) | 1,240 (12.2%) |
| 8:00 AM to 8:29 AM | 1,116 (10.6%) | 1,363 (13.4%) |
| 8:30 AM to 8:59 AM | 597 (5.7%) | 897 (8.8%) |
| 9:00 AM to 9:59 AM | 949 (9.0%) | 310 (3.0%) |
| 10:00 AM to 10:59 AM | 419 (4.0%) | 259 (2.5%) |
| 11:00 AM to 11:59 AM | 214 (2.0%) | 145 (1.4%) |
| 12:00 PM to 3:59 PM | 1,263 (12.0%) | 736 (7.2%) |
| 4:00 PM to 11:59 PM | 819 (7.8%) | 753 (7.4%) |
| Total | 10,490 (100.0%) | 10,182 (100.0%) |
Housing Occupancy in Troy
Occupancy by Ownership in Troy
Of the total 21,574 dwellings in Troy, owner-occupied units account for 7,449 (34.5%), while renter-occupied units make up 14,125 (65.5%).
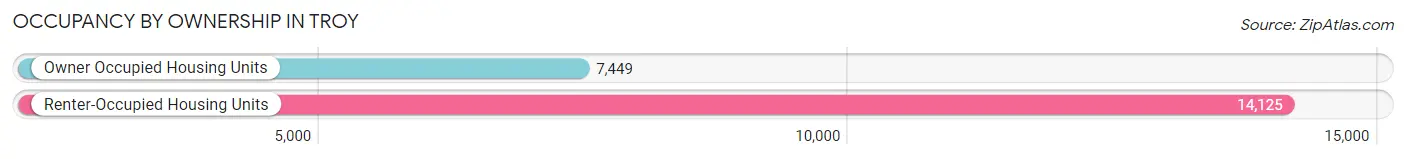
| Occupancy | # Housing Units | % Housing Units |
| Owner Occupied Housing Units | 7,449 | 34.5% |
| Renter-Occupied Housing Units | 14,125 | 65.5% |
| Total Occupied Housing Units | 21,574 | 100.0% |
Occupancy by Household Size in Troy
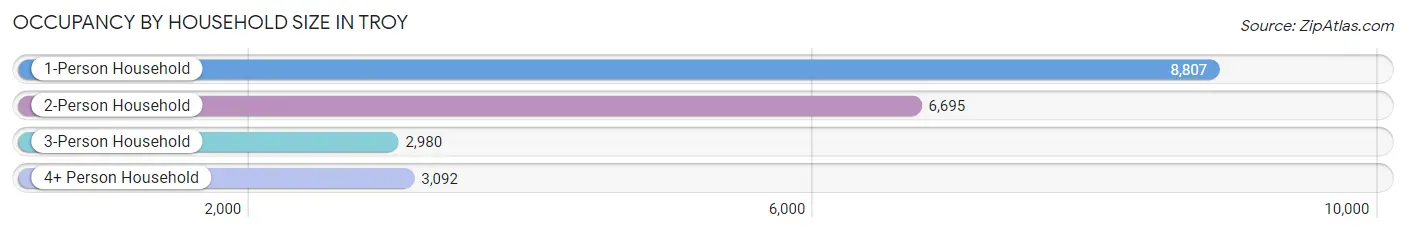
| Household Size | # Housing Units | % Housing Units |
| 1-Person Household | 8,807 | 40.8% |
| 2-Person Household | 6,695 | 31.0% |
| 3-Person Household | 2,980 | 13.8% |
| 4+ Person Household | 3,092 | 14.3% |
| Total Housing Units | 21,574 | 100.0% |
Occupancy by Ownership by Household Size in Troy
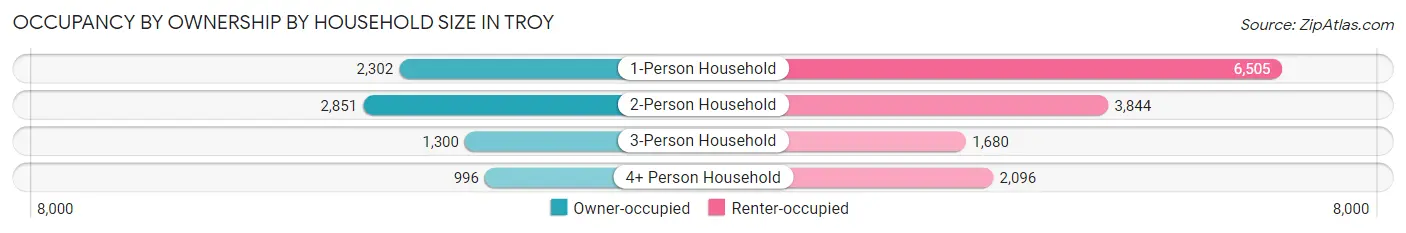
| Household Size | Owner-occupied | Renter-occupied |
| 1-Person Household | 2,302 (26.1%) | 6,505 (73.9%) |
| 2-Person Household | 2,851 (42.6%) | 3,844 (57.4%) |
| 3-Person Household | 1,300 (43.6%) | 1,680 (56.4%) |
| 4+ Person Household | 996 (32.2%) | 2,096 (67.8%) |
| Total Housing Units | 7,449 (34.5%) | 14,125 (65.5%) |
Occupancy by Educational Attainment in Troy
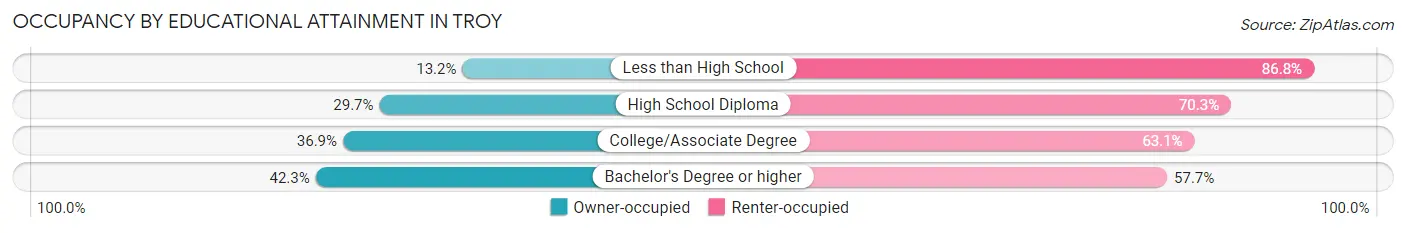
| Household Size | Owner-occupied | Renter-occupied |
| Less than High School | 305 (13.2%) | 2,002 (86.8%) |
| High School Diploma | 1,495 (29.7%) | 3,546 (70.3%) |
| College/Associate Degree | 2,529 (36.9%) | 4,325 (63.1%) |
| Bachelor's Degree or higher | 3,120 (42.3%) | 4,252 (57.7%) |
Occupancy by Age of Householder in Troy
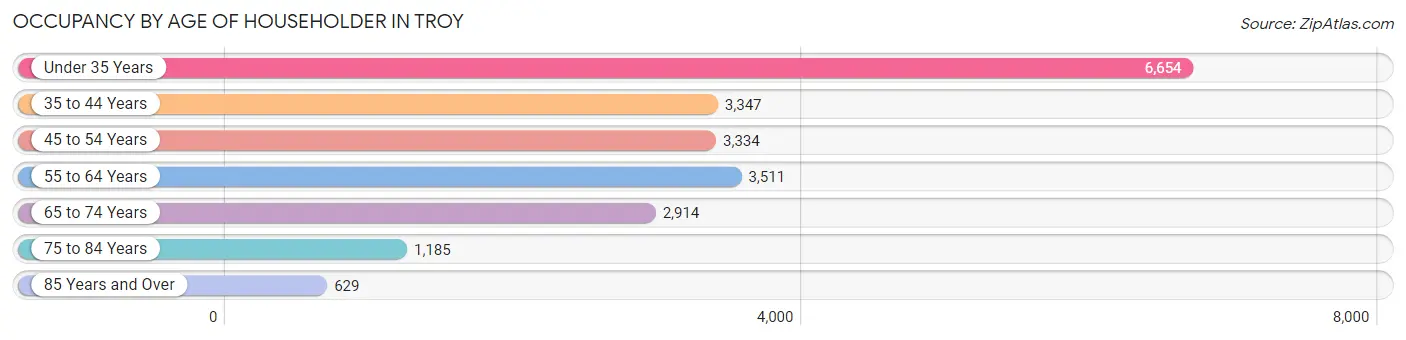
| Age Bracket | # Households | % Households |
| Under 35 Years | 6,654 | 30.8% |
| 35 to 44 Years | 3,347 | 15.5% |
| 45 to 54 Years | 3,334 | 15.4% |
| 55 to 64 Years | 3,511 | 16.3% |
| 65 to 74 Years | 2,914 | 13.5% |
| 75 to 84 Years | 1,185 | 5.5% |
| 85 Years and Over | 629 | 2.9% |
| Total | 21,574 | 100.0% |
Housing Finances in Troy
Median Income by Occupancy in Troy
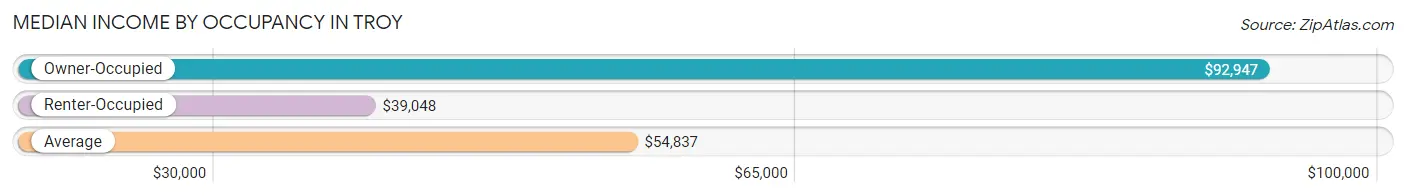
| Occupancy Type | # Households | Median Income |
| Owner-Occupied | 7,449 (34.5%) | $92,947 |
| Renter-Occupied | 14,125 (65.5%) | $39,048 |
| Average | 21,574 (100.0%) | $54,837 |
Occupancy by Householder Income Bracket in Troy
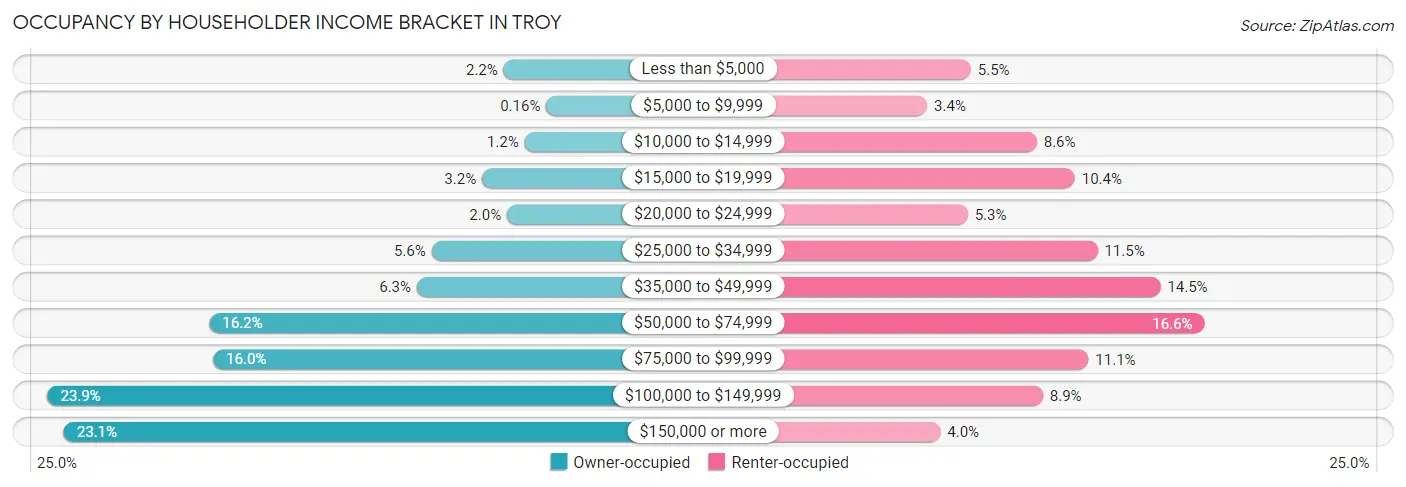
| Income Bracket | Owner-occupied | Renter-occupied |
| Less than $5,000 | 163 (2.2%) | 775 (5.5%) |
| $5,000 to $9,999 | 12 (0.2%) | 482 (3.4%) |
| $10,000 to $14,999 | 89 (1.2%) | 1,219 (8.6%) |
| $15,000 to $19,999 | 240 (3.2%) | 1,474 (10.4%) |
| $20,000 to $24,999 | 151 (2.0%) | 754 (5.3%) |
| $25,000 to $34,999 | 419 (5.6%) | 1,627 (11.5%) |
| $35,000 to $49,999 | 471 (6.3%) | 2,051 (14.5%) |
| $50,000 to $74,999 | 1,207 (16.2%) | 2,346 (16.6%) |
| $75,000 to $99,999 | 1,193 (16.0%) | 1,567 (11.1%) |
| $100,000 to $149,999 | 1,781 (23.9%) | 1,260 (8.9%) |
| $150,000 or more | 1,723 (23.1%) | 570 (4.0%) |
| Total | 7,449 (100.0%) | 14,125 (100.0%) |
Monthly Housing Cost Tiers in Troy
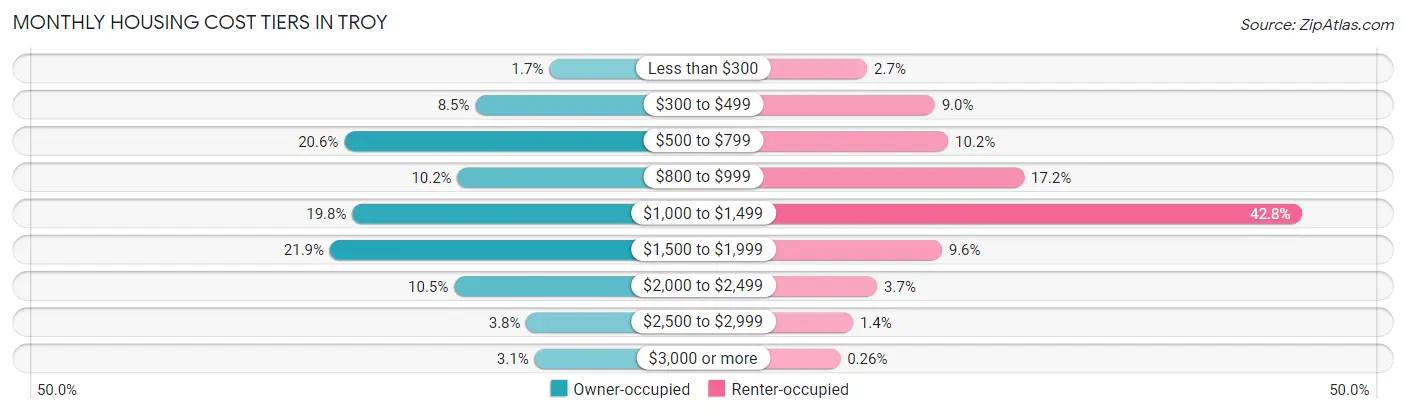
| Monthly Cost | Owner-occupied | Renter-occupied |
| Less than $300 | 127 (1.7%) | 387 (2.7%) |
| $300 to $499 | 634 (8.5%) | 1,266 (9.0%) |
| $500 to $799 | 1,533 (20.6%) | 1,440 (10.2%) |
| $800 to $999 | 756 (10.2%) | 2,426 (17.2%) |
| $1,000 to $1,499 | 1,477 (19.8%) | 6,044 (42.8%) |
| $1,500 to $1,999 | 1,631 (21.9%) | 1,357 (9.6%) |
| $2,000 to $2,499 | 779 (10.5%) | 517 (3.7%) |
| $2,500 to $2,999 | 284 (3.8%) | 202 (1.4%) |
| $3,000 or more | 228 (3.1%) | 37 (0.3%) |
| Total | 7,449 (100.0%) | 14,125 (100.0%) |
Physical Housing Characteristics in Troy
Housing Structures in Troy
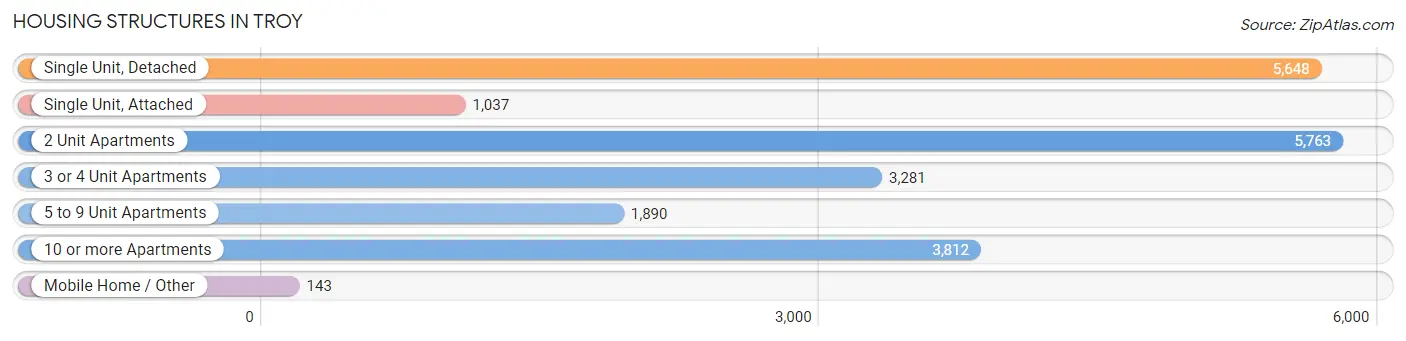
| Structure Type | # Housing Units | % Housing Units |
| Single Unit, Detached | 5,648 | 26.2% |
| Single Unit, Attached | 1,037 | 4.8% |
| 2 Unit Apartments | 5,763 | 26.7% |
| 3 or 4 Unit Apartments | 3,281 | 15.2% |
| 5 to 9 Unit Apartments | 1,890 | 8.8% |
| 10 or more Apartments | 3,812 | 17.7% |
| Mobile Home / Other | 143 | 0.7% |
| Total | 21,574 | 100.0% |
Housing Structures by Occupancy in Troy
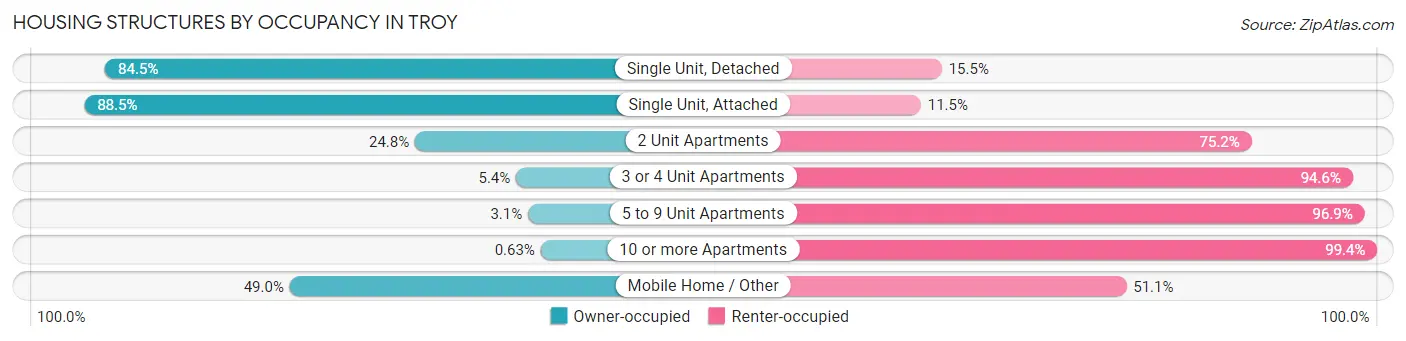
| Structure Type | Owner-occupied | Renter-occupied |
| Single Unit, Detached | 4,772 (84.5%) | 876 (15.5%) |
| Single Unit, Attached | 918 (88.5%) | 119 (11.5%) |
| 2 Unit Apartments | 1,431 (24.8%) | 4,332 (75.2%) |
| 3 or 4 Unit Apartments | 176 (5.4%) | 3,105 (94.6%) |
| 5 to 9 Unit Apartments | 58 (3.1%) | 1,832 (96.9%) |
| 10 or more Apartments | 24 (0.6%) | 3,788 (99.4%) |
| Mobile Home / Other | 70 (48.9%) | 73 (51.0%) |
| Total | 7,449 (34.5%) | 14,125 (65.5%) |
Housing Structures by Number of Rooms in Troy
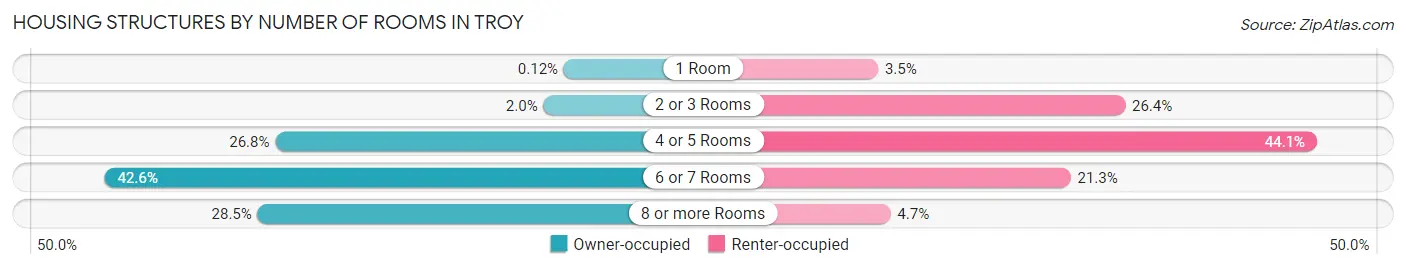
| Number of Rooms | Owner-occupied | Renter-occupied |
| 1 Room | 9 (0.1%) | 497 (3.5%) |
| 2 or 3 Rooms | 150 (2.0%) | 3,725 (26.4%) |
| 4 or 5 Rooms | 1,997 (26.8%) | 6,231 (44.1%) |
| 6 or 7 Rooms | 3,174 (42.6%) | 3,013 (21.3%) |
| 8 or more Rooms | 2,119 (28.4%) | 659 (4.7%) |
| Total | 7,449 (100.0%) | 14,125 (100.0%) |
Housing Structure by Heating Type in Troy
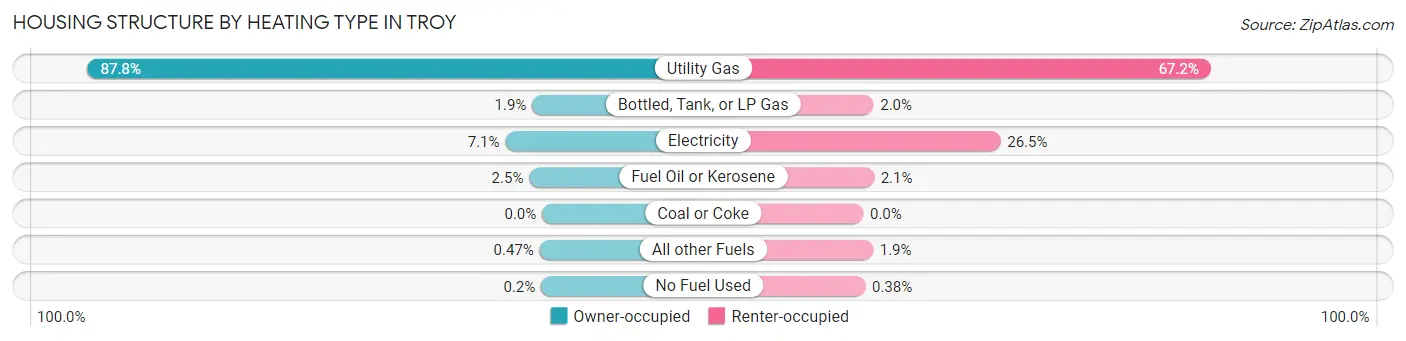
| Heating Type | Owner-occupied | Renter-occupied |
| Utility Gas | 6,542 (87.8%) | 9,489 (67.2%) |
| Bottled, Tank, or LP Gas | 143 (1.9%) | 279 (2.0%) |
| Electricity | 529 (7.1%) | 3,746 (26.5%) |
| Fuel Oil or Kerosene | 185 (2.5%) | 291 (2.1%) |
| Coal or Coke | 0 (0.0%) | 0 (0.0%) |
| All other Fuels | 35 (0.5%) | 266 (1.9%) |
| No Fuel Used | 15 (0.2%) | 54 (0.4%) |
| Total | 7,449 (100.0%) | 14,125 (100.0%) |
Household Vehicle Usage in Troy
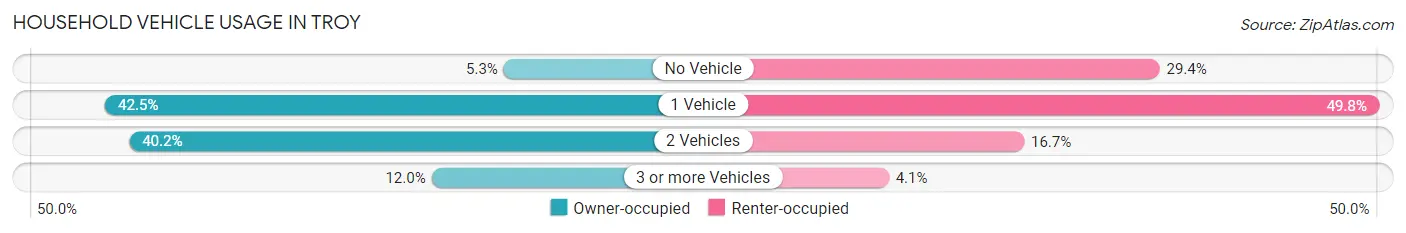
| Vehicles per Household | Owner-occupied | Renter-occupied |
| No Vehicle | 393 (5.3%) | 4,148 (29.4%) |
| 1 Vehicle | 3,164 (42.5%) | 7,038 (49.8%) |
| 2 Vehicles | 2,997 (40.2%) | 2,361 (16.7%) |
| 3 or more Vehicles | 895 (12.0%) | 578 (4.1%) |
| Total | 7,449 (100.0%) | 14,125 (100.0%) |
Real Estate & Mortgages in Troy
Real Estate and Mortgage Overview in Troy
| Characteristic | Without Mortgage | With Mortgage |
| Housing Units | 2,888 | 4,561 |
| Median Property Value | $165,000 | $182,900 |
| Median Household Income | $75,125 | $1,152 |
| Monthly Housing Costs | $669 | $219 |
| Real Estate Taxes | $4,190 | $170 |
Property Value by Mortgage Status in Troy
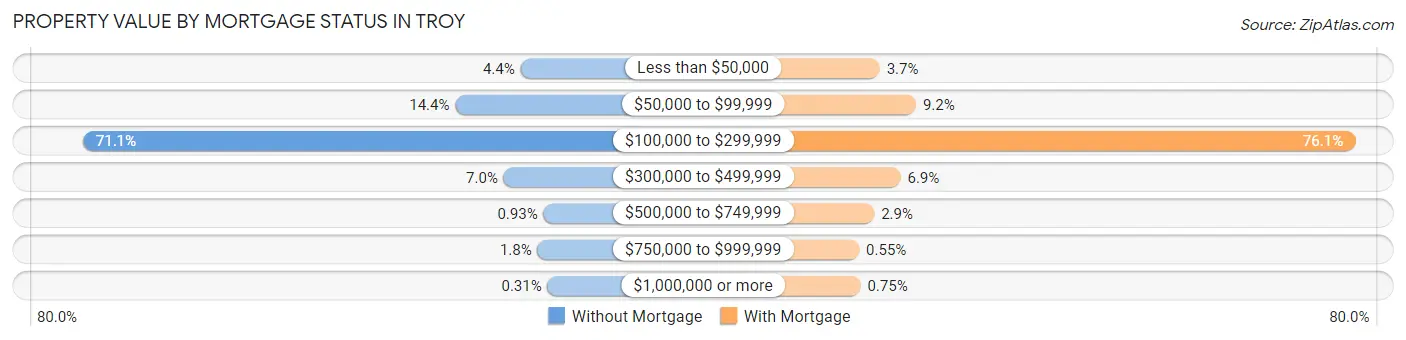
| Property Value | Without Mortgage | With Mortgage |
| Less than $50,000 | 128 (4.4%) | 168 (3.7%) |
| $50,000 to $99,999 | 415 (14.4%) | 420 (9.2%) |
| $100,000 to $299,999 | 2,054 (71.1%) | 3,471 (76.1%) |
| $300,000 to $499,999 | 202 (7.0%) | 313 (6.9%) |
| $500,000 to $749,999 | 27 (0.9%) | 130 (2.9%) |
| $750,000 to $999,999 | 53 (1.8%) | 25 (0.5%) |
| $1,000,000 or more | 9 (0.3%) | 34 (0.7%) |
| Total | 2,888 (100.0%) | 4,561 (100.0%) |
Household Income by Mortgage Status in Troy
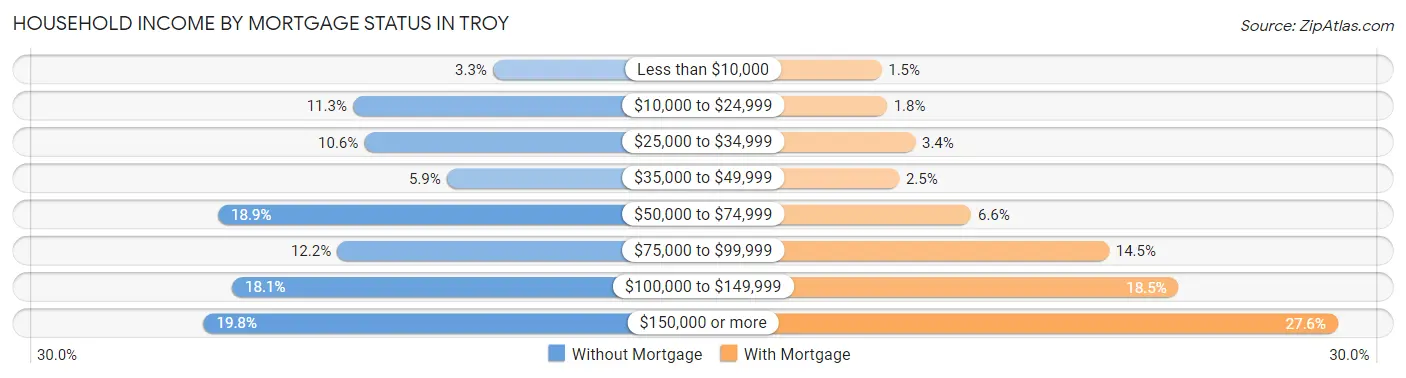
| Household Income | Without Mortgage | With Mortgage |
| Less than $10,000 | 94 (3.3%) | 67 (1.5%) |
| $10,000 to $24,999 | 325 (11.3%) | 81 (1.8%) |
| $25,000 to $34,999 | 306 (10.6%) | 155 (3.4%) |
| $35,000 to $49,999 | 170 (5.9%) | 113 (2.5%) |
| $50,000 to $74,999 | 547 (18.9%) | 301 (6.6%) |
| $75,000 to $99,999 | 351 (12.1%) | 660 (14.5%) |
| $100,000 to $149,999 | 524 (18.1%) | 842 (18.5%) |
| $150,000 or more | 571 (19.8%) | 1,257 (27.6%) |
| Total | 2,888 (100.0%) | 4,561 (100.0%) |
Property Value to Household Income Ratio in Troy
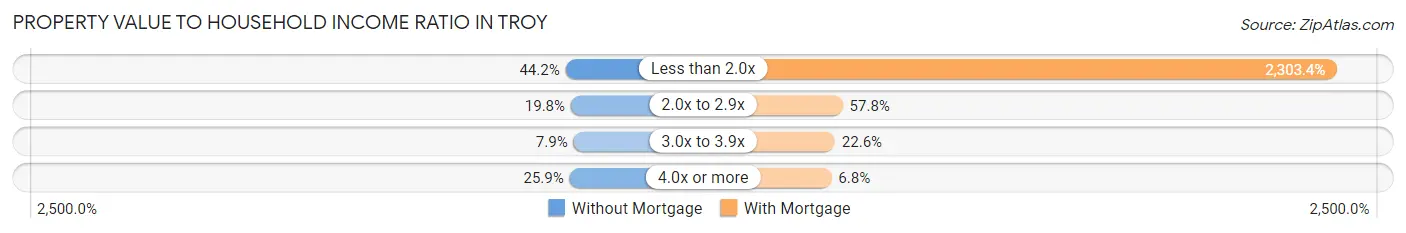
| Value-to-Income Ratio | Without Mortgage | With Mortgage |
| Less than 2.0x | 1,276 (44.2%) | 105,059 (2,303.4%) |
| 2.0x to 2.9x | 571 (19.8%) | 2,638 (57.8%) |
| 3.0x to 3.9x | 229 (7.9%) | 1,030 (22.6%) |
| 4.0x or more | 748 (25.9%) | 308 (6.8%) |
| Total | 2,888 (100.0%) | 4,561 (100.0%) |
Real Estate Taxes by Mortgage Status in Troy
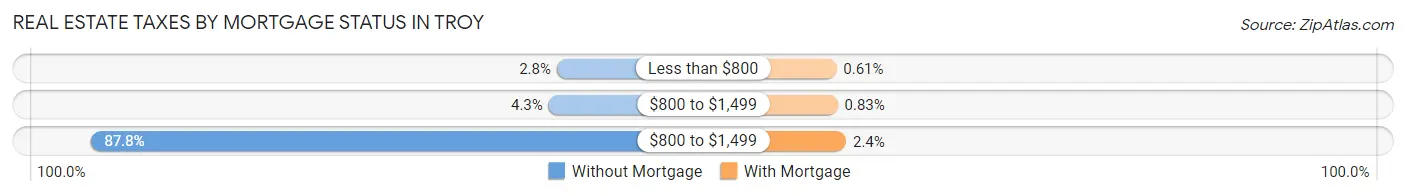
| Property Taxes | Without Mortgage | With Mortgage |
| Less than $800 | 81 (2.8%) | 28 (0.6%) |
| $800 to $1,499 | 124 (4.3%) | 38 (0.8%) |
| $800 to $1,499 | 2,536 (87.8%) | 108 (2.4%) |
| Total | 2,888 (100.0%) | 4,561 (100.0%) |
Health & Disability in Troy
Health Insurance Coverage by Age in Troy
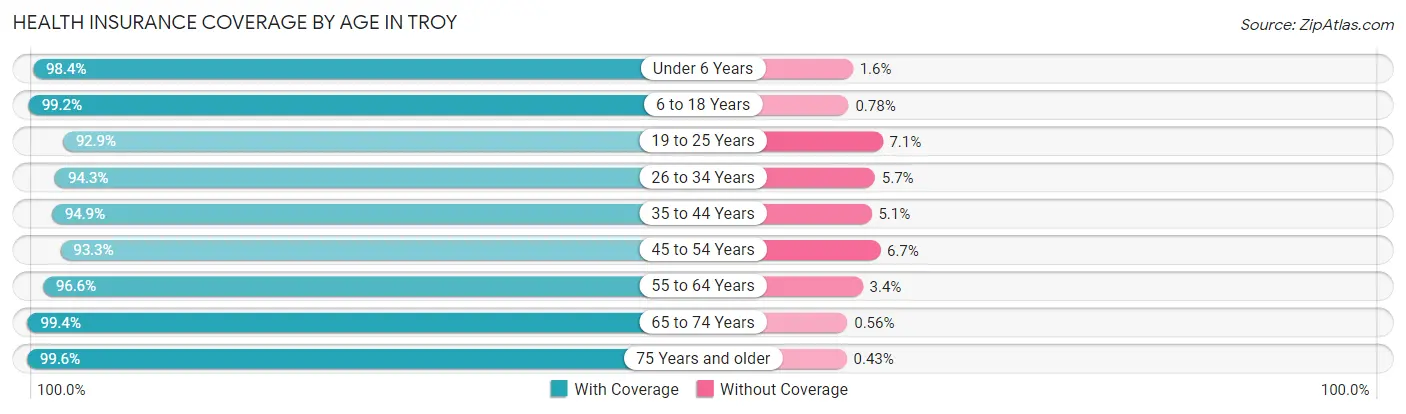
| Age Bracket | With Coverage | Without Coverage |
| Under 6 Years | 2,323 (98.4%) | 37 (1.6%) |
| 6 to 18 Years | 8,090 (99.2%) | 64 (0.8%) |
| 19 to 25 Years | 8,033 (92.9%) | 615 (7.1%) |
| 26 to 34 Years | 7,780 (94.3%) | 470 (5.7%) |
| 35 to 44 Years | 5,651 (94.9%) | 302 (5.1%) |
| 45 to 54 Years | 4,764 (93.3%) | 340 (6.7%) |
| 55 to 64 Years | 5,333 (96.6%) | 188 (3.4%) |
| 65 to 74 Years | 4,117 (99.4%) | 23 (0.6%) |
| 75 Years and older | 2,546 (99.6%) | 11 (0.4%) |
| Total | 48,637 (96.0%) | 2,050 (4.0%) |
Health Insurance Coverage by Citizenship Status in Troy
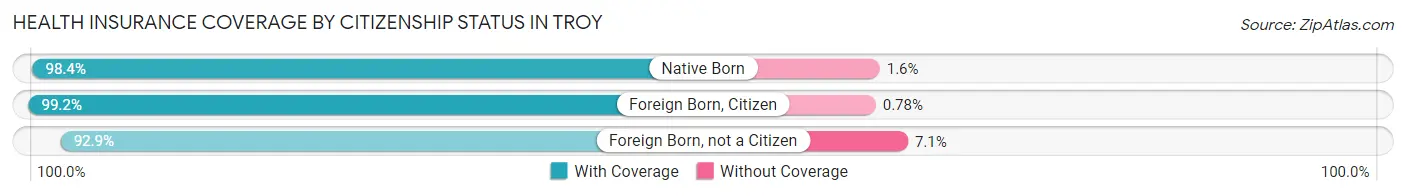
| Citizenship Status | With Coverage | Without Coverage |
| Native Born | 2,323 (98.4%) | 37 (1.6%) |
| Foreign Born, Citizen | 8,090 (99.2%) | 64 (0.8%) |
| Foreign Born, not a Citizen | 8,033 (92.9%) | 615 (7.1%) |
Health Insurance Coverage by Household Income in Troy
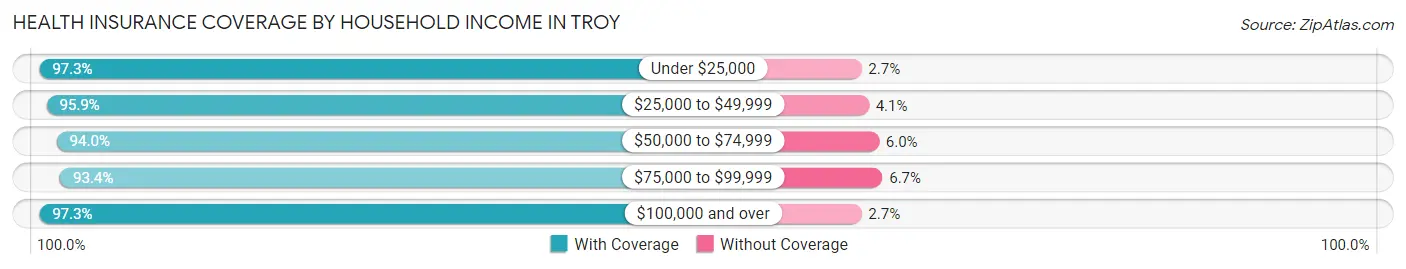
| Household Income | With Coverage | Without Coverage |
| Under $25,000 | 8,591 (97.3%) | 242 (2.7%) |
| $25,000 to $49,999 | 9,115 (95.9%) | 390 (4.1%) |
| $50,000 to $74,999 | 7,435 (94.0%) | 475 (6.0%) |
| $75,000 to $99,999 | 5,445 (93.3%) | 388 (6.7%) |
| $100,000 and over | 13,680 (97.3%) | 385 (2.7%) |
Public vs Private Health Insurance Coverage by Age in Troy
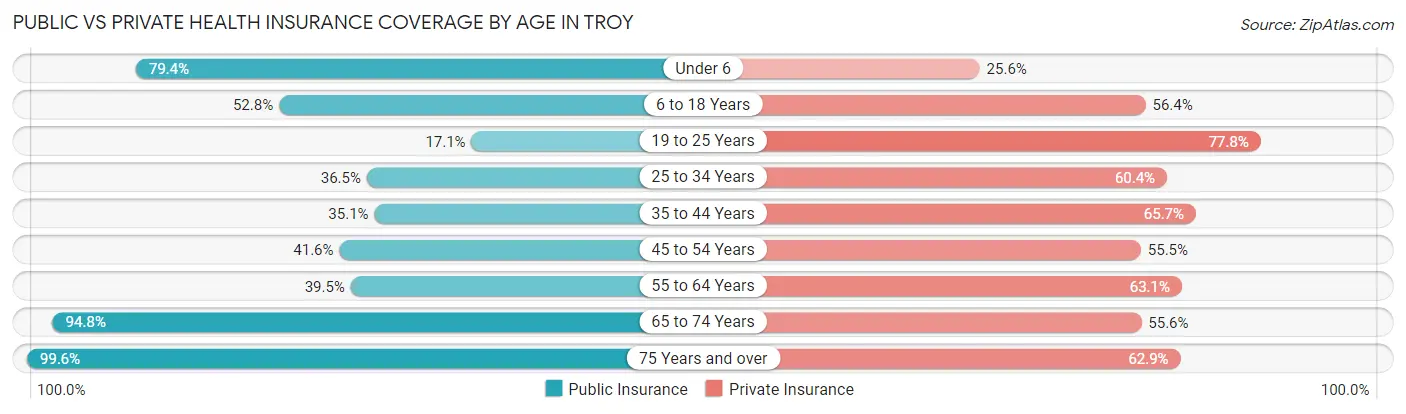
| Age Bracket | Public Insurance | Private Insurance |
| Under 6 | 1,873 (79.4%) | 604 (25.6%) |
| 6 to 18 Years | 4,304 (52.8%) | 4,597 (56.4%) |
| 19 to 25 Years | 1,475 (17.1%) | 6,724 (77.7%) |
| 25 to 34 Years | 3,010 (36.5%) | 4,979 (60.4%) |
| 35 to 44 Years | 2,088 (35.1%) | 3,912 (65.7%) |
| 45 to 54 Years | 2,122 (41.6%) | 2,833 (55.5%) |
| 55 to 64 Years | 2,179 (39.5%) | 3,484 (63.1%) |
| 65 to 74 Years | 3,925 (94.8%) | 2,302 (55.6%) |
| 75 Years and over | 2,546 (99.6%) | 1,607 (62.8%) |
| Total | 23,522 (46.4%) | 31,042 (61.2%) |
Disability Status by Sex by Age in Troy
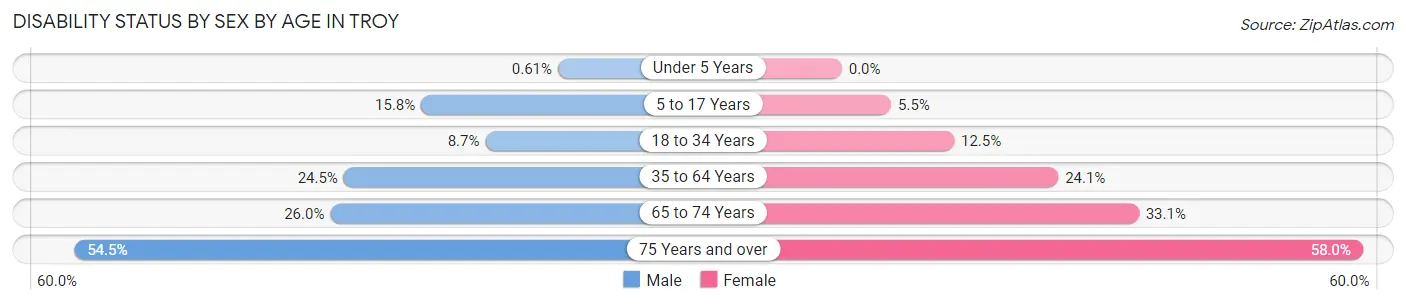
| Age Bracket | Male | Female |
| Under 5 Years | 5 (0.6%) | 0 (0.0%) |
| 5 to 17 Years | 518 (15.8%) | 191 (5.5%) |
| 18 to 34 Years | 845 (8.7%) | 1,118 (12.5%) |
| 35 to 64 Years | 1,949 (24.5%) | 2,075 (24.1%) |
| 65 to 74 Years | 460 (26.0%) | 783 (33.1%) |
| 75 Years and over | 622 (54.5%) | 821 (58.0%) |
Disability Class by Sex by Age in Troy
Disability Class: Hearing Difficulty
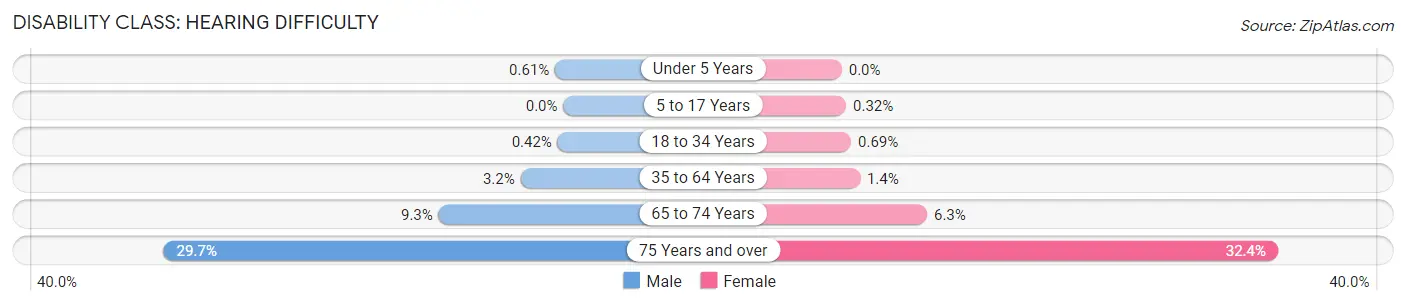
| Age Bracket | Male | Female |
| Under 5 Years | 5 (0.6%) | 0 (0.0%) |
| 5 to 17 Years | 0 (0.0%) | 11 (0.3%) |
| 18 to 34 Years | 41 (0.4%) | 62 (0.7%) |
| 35 to 64 Years | 253 (3.2%) | 116 (1.3%) |
| 65 to 74 Years | 164 (9.3%) | 150 (6.3%) |
| 75 Years and over | 339 (29.7%) | 458 (32.4%) |
Disability Class: Vision Difficulty
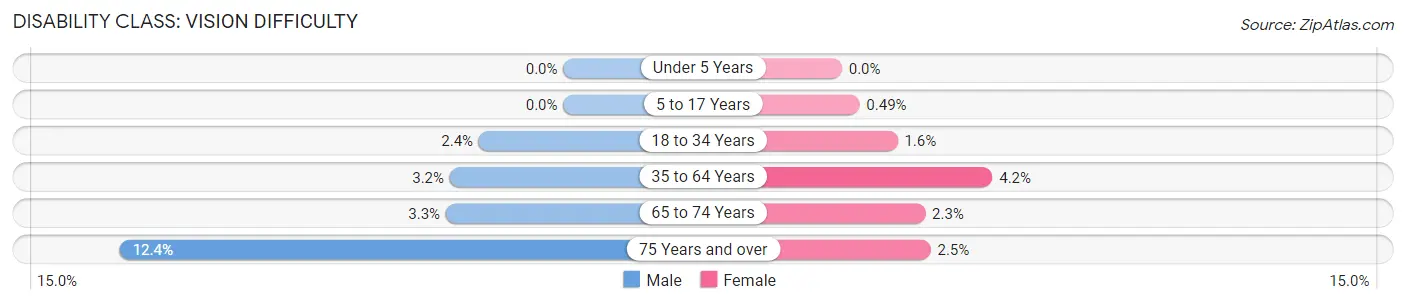
| Age Bracket | Male | Female |
| Under 5 Years | 0 (0.0%) | 0 (0.0%) |
| 5 to 17 Years | 0 (0.0%) | 17 (0.5%) |
| 18 to 34 Years | 228 (2.4%) | 139 (1.5%) |
| 35 to 64 Years | 252 (3.2%) | 361 (4.2%) |
| 65 to 74 Years | 58 (3.3%) | 55 (2.3%) |
| 75 Years and over | 141 (12.3%) | 35 (2.5%) |
Disability Class: Cognitive Difficulty
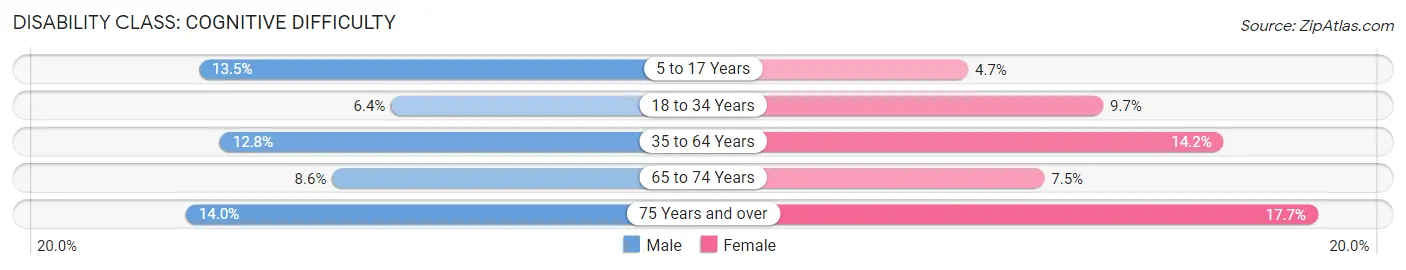
| Age Bracket | Male | Female |
| 5 to 17 Years | 442 (13.5%) | 163 (4.7%) |
| 18 to 34 Years | 621 (6.4%) | 868 (9.7%) |
| 35 to 64 Years | 1,016 (12.8%) | 1,220 (14.2%) |
| 65 to 74 Years | 152 (8.6%) | 178 (7.5%) |
| 75 Years and over | 160 (14.0%) | 250 (17.7%) |
Disability Class: Ambulatory Difficulty
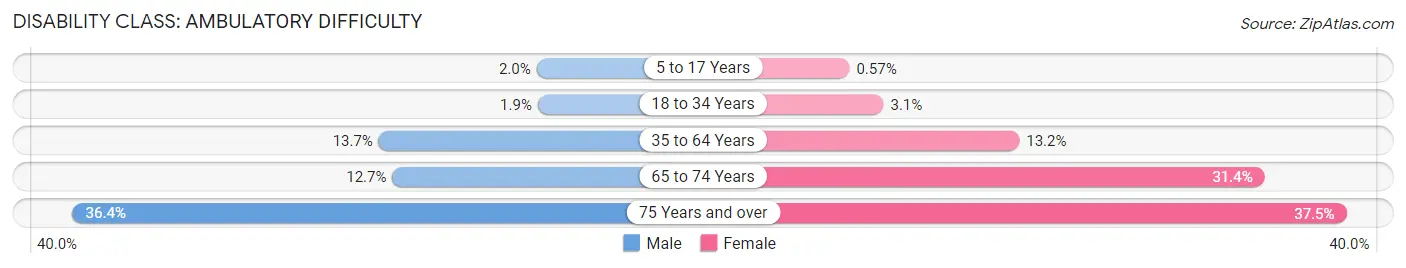
| Age Bracket | Male | Female |
| 5 to 17 Years | 65 (2.0%) | 20 (0.6%) |
| 18 to 34 Years | 185 (1.9%) | 277 (3.1%) |
| 35 to 64 Years | 1,092 (13.7%) | 1,135 (13.2%) |
| 65 to 74 Years | 225 (12.7%) | 743 (31.4%) |
| 75 Years and over | 416 (36.4%) | 530 (37.5%) |
Disability Class: Self-Care Difficulty
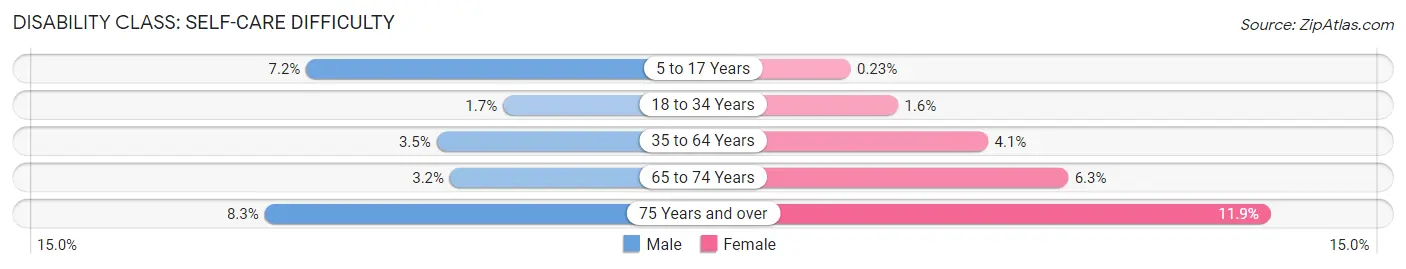
| Age Bracket | Male | Female |
| 5 to 17 Years | 234 (7.2%) | 8 (0.2%) |
| 18 to 34 Years | 163 (1.7%) | 139 (1.5%) |
| 35 to 64 Years | 281 (3.5%) | 350 (4.1%) |
| 65 to 74 Years | 56 (3.2%) | 149 (6.3%) |
| 75 Years and over | 95 (8.3%) | 169 (11.9%) |
Technology Access in Troy
Computing Device Access in Troy
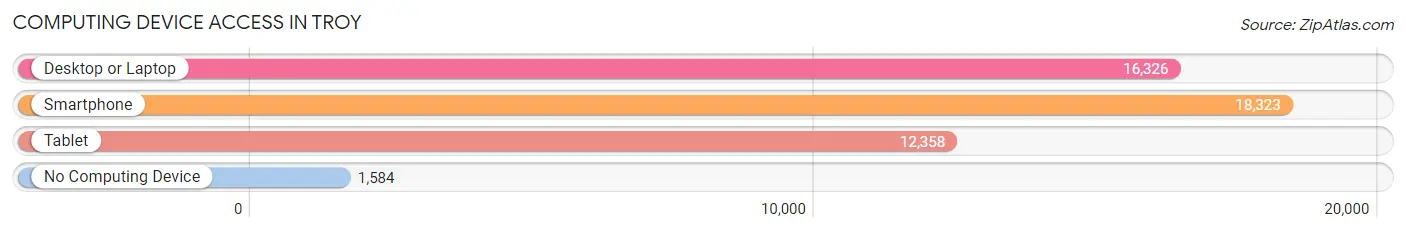
| Device Type | # Households | % Households |
| Desktop or Laptop | 16,326 | 75.7% |
| Smartphone | 18,323 | 84.9% |
| Tablet | 12,358 | 57.3% |
| No Computing Device | 1,584 | 7.3% |
| Total | 21,574 | 100.0% |
Internet Access in Troy
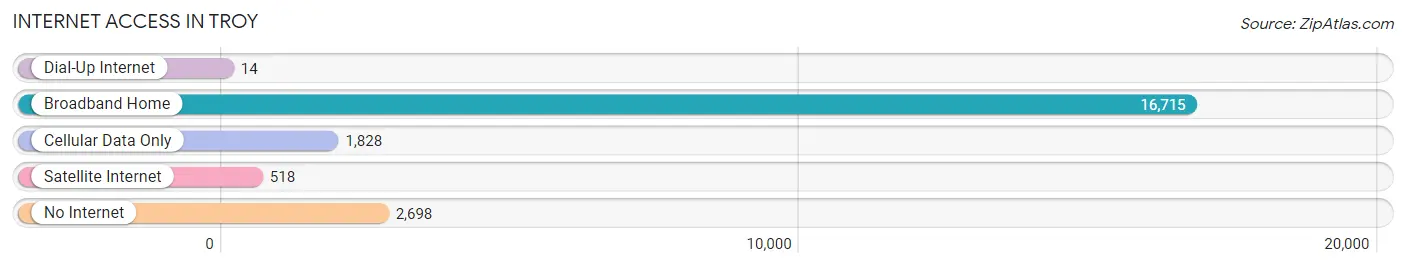
| Internet Type | # Households | % Households |
| Dial-Up Internet | 14 | 0.1% |
| Broadband Home | 16,715 | 77.5% |
| Cellular Data Only | 1,828 | 8.5% |
| Satellite Internet | 518 | 2.4% |
| No Internet | 2,698 | 12.5% |
| Total | 21,574 | 100.0% |
Troy Summary
Troy, New York is a city located in Rensselaer County, New York, United States. It is located on the eastern bank of the Hudson River, about 10 miles (16 km) north of Albany. Troy is the county seat of Rensselaer County and the fourth-largest city in the state of New York. The city has a population of approximately 50,000 people, making it the sixth-largest city in the state.
History
Troy was founded in 1787 by Abraham Jacob Lansing, a Dutch settler. The city was named after the ancient city of Troy in Asia Minor. The city was incorporated in 1816 and quickly became an important industrial center. The city was the site of the first iron works in the United States, established in 1793. The city was also the site of the first cotton mill in the United States, established in 1813.
Troy was an important center of the industrial revolution in the United States. The city was home to several major industries, including iron and steel production, textiles, and paper manufacturing. The city was also home to several major railroads, including the Delaware and Hudson Railroad and the Troy and Schenectady Railroad.
Troy was also an important center of the abolitionist movement in the United States. The city was home to several prominent abolitionists, including Harriet Tubman and Sojourner Truth. The city was also the site of the first women's rights convention in the United States, held in 1848.
Geography
Troy is located in the eastern part of Rensselaer County, on the eastern bank of the Hudson River. The city is located about 10 miles (16 km) north of Albany. The city is located at the confluence of the Hudson and Mohawk Rivers. The city is located in the Hudson Valley region of New York.
The city has a total area of 8.3 square miles (21.5 km2), of which 8.2 square miles (21.3 km2) is land and 0.1 square miles (0.2 km2) is water. The city is located in a humid continental climate zone, with cold, snowy winters and hot, humid summers.
Economy
Troy is an important industrial center in the state of New York. The city is home to several major industries, including iron and steel production, textiles, and paper manufacturing. The city is also home to several major railroads, including the Delaware and Hudson Railroad and the Troy and Schenectady Railroad.
The city is also home to several major educational institutions, including Rensselaer Polytechnic Institute, Russell Sage College, and Hudson Valley Community College. The city is also home to several major healthcare facilities, including Samaritan Hospital and St. Mary's Hospital.
Demographics
As of the 2010 census, the city had a population of 50,129. The racial makeup of the city was 79.2% White, 11.3% African American, 0.3% Native American, 2.2% Asian, 0.1% Pacific Islander, 4.2% from other races, and 2.9% from two or more races. Hispanic or Latino of any race were 11.3% of the population.
The median income for a household in the city was $37,837, and the median income for a family was $45,837. The per capita income for the city was $20,837. About 17.2% of families and 20.7% of the population were below the poverty line, including 28.3% of those under age 18 and 11.2% of those age 65 or over.
Common Questions
What is Per Capita Income in Troy?
Per Capita income in Troy is $33,743.
What is the Median Family Income in Troy?
Median Family Income in Troy is $67,174.
What is the Median Household income in Troy?
Median Household Income in Troy is $54,837.
What is Income or Wage Gap in Troy?
Income or Wage Gap in Troy is 12.2%.
Women in Troy earn 87.8 cents for every dollar earned by a man.
What is Family Income Deficit in Troy?
Family Income Deficit in Troy is $10,171.
Families that are below poverty line in Troy earn $10,171 less on average than the poverty threshold level.
What is Inequality or Gini Index in Troy?
Inequality or Gini Index in Troy is 0.48.
What is the Total Population of Troy?
Total Population of Troy is 51,268.
What is the Total Male Population of Troy?
Total Male Population of Troy is 25,082.
What is the Total Female Population of Troy?
Total Female Population of Troy is 26,186.
What is the Ratio of Males per 100 Females in Troy?
There are 95.78 Males per 100 Females in Troy.
What is the Ratio of Females per 100 Males in Troy?
There are 104.40 Females per 100 Males in Troy.
What is the Median Population Age in Troy?
Median Population Age in Troy is 32.8 Years.
What is the Average Family Size in Troy
Average Family Size in Troy is 2.9 People.
What is the Average Household Size in Troy
Average Household Size in Troy is 2.1 People.
How Large is the Labor Force in Troy?
There are 26,388 People in the Labor Forcein in Troy.
What is the Percentage of People in the Labor Force in Troy?
60.2% of People are in the Labor Force in Troy.
What is the Unemployment Rate in Troy?
Unemployment Rate in Troy is 9.7%.