Deposit, NY Map & Demographics
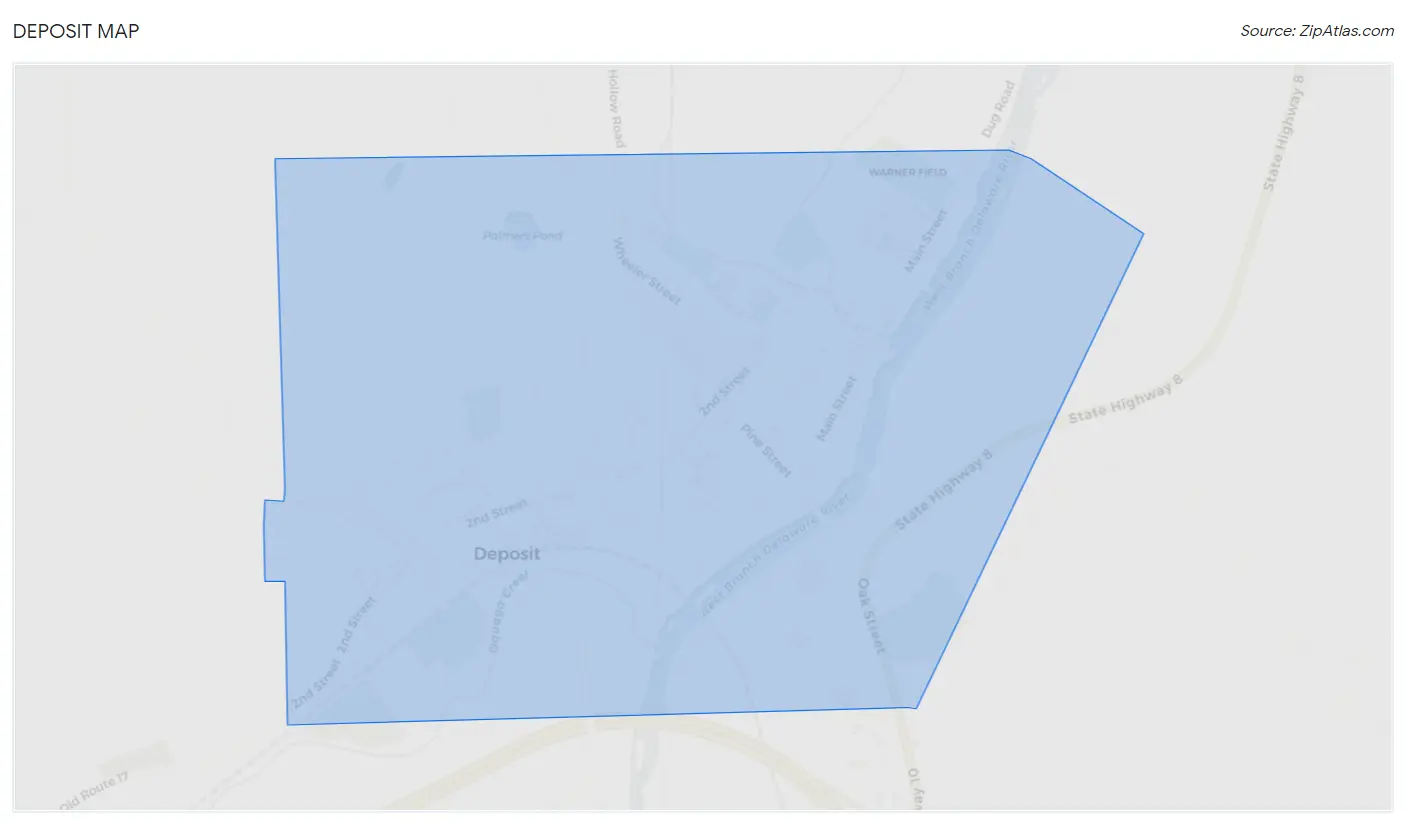
Deposit Map
Deposit Overview
$27,030
PER CAPITA INCOME
$60,625
AVG FAMILY INCOME
$43,618
AVG HOUSEHOLD INCOME
30.4%
WAGE / INCOME GAP [ % ]
69.6¢/ $1
WAGE / INCOME GAP [ $ ]
0.50
INEQUALITY / GINI INDEX
1,403
TOTAL POPULATION
606
MALE POPULATION
797
FEMALE POPULATION
76.04
MALES / 100 FEMALES
131.52
FEMALES / 100 MALES
42.0
MEDIAN AGE
2.6
AVG FAMILY SIZE
2.3
AVG HOUSEHOLD SIZE
588
LABOR FORCE [ PEOPLE ]
51.5%
PERCENT IN LABOR FORCE
1.7%
UNEMPLOYMENT RATE
Deposit Zip Codes
Deposit Area Codes
Income in Deposit
Income Overview in Deposit
Per Capita Income in Deposit is $27,030, while median incomes of families and households are $60,625 and $43,618 respectively.
| Characteristic | Number | Measure |
| Per Capita Income | 1,403 | $27,030 |
| Median Family Income | 421 | $60,625 |
| Mean Family Income | 421 | $74,068 |
| Median Household Income | 621 | $43,618 |
| Mean Household Income | 621 | $60,945 |
| Income Deficit | 421 | $0 |
| Wage / Income Gap (%) | 1,403 | 30.38% |
| Wage / Income Gap ($) | 1,403 | 69.62¢ per $1 |
| Gini / Inequality Index | 1,403 | 0.50 |
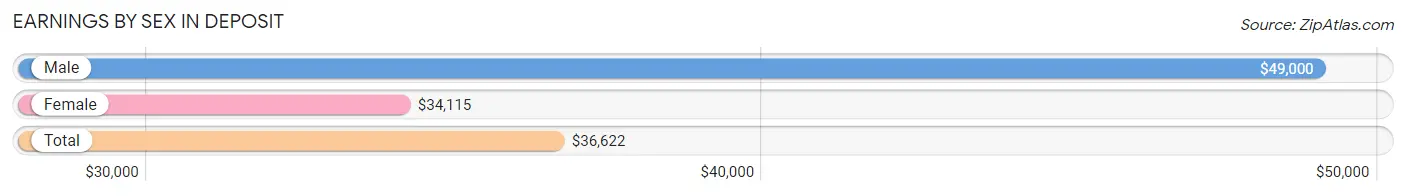
Earnings by Sex in Deposit
Average Earnings in Deposit are $36,622, $49,000 for men and $34,115 for women, a difference of 30.4%.
| Sex | Number | Average Earnings |
| Male | 294 (47.2%) | $49,000 |
| Female | 329 (52.8%) | $34,115 |
| Total | 623 (100.0%) | $36,622 |
Earnings by Sex by Income Bracket in Deposit
The most common earnings brackets in Deposit are $75,000 to $99,999 for men (86 | 29.2%) and $35,000 to $39,999 for women (71 | 21.6%).
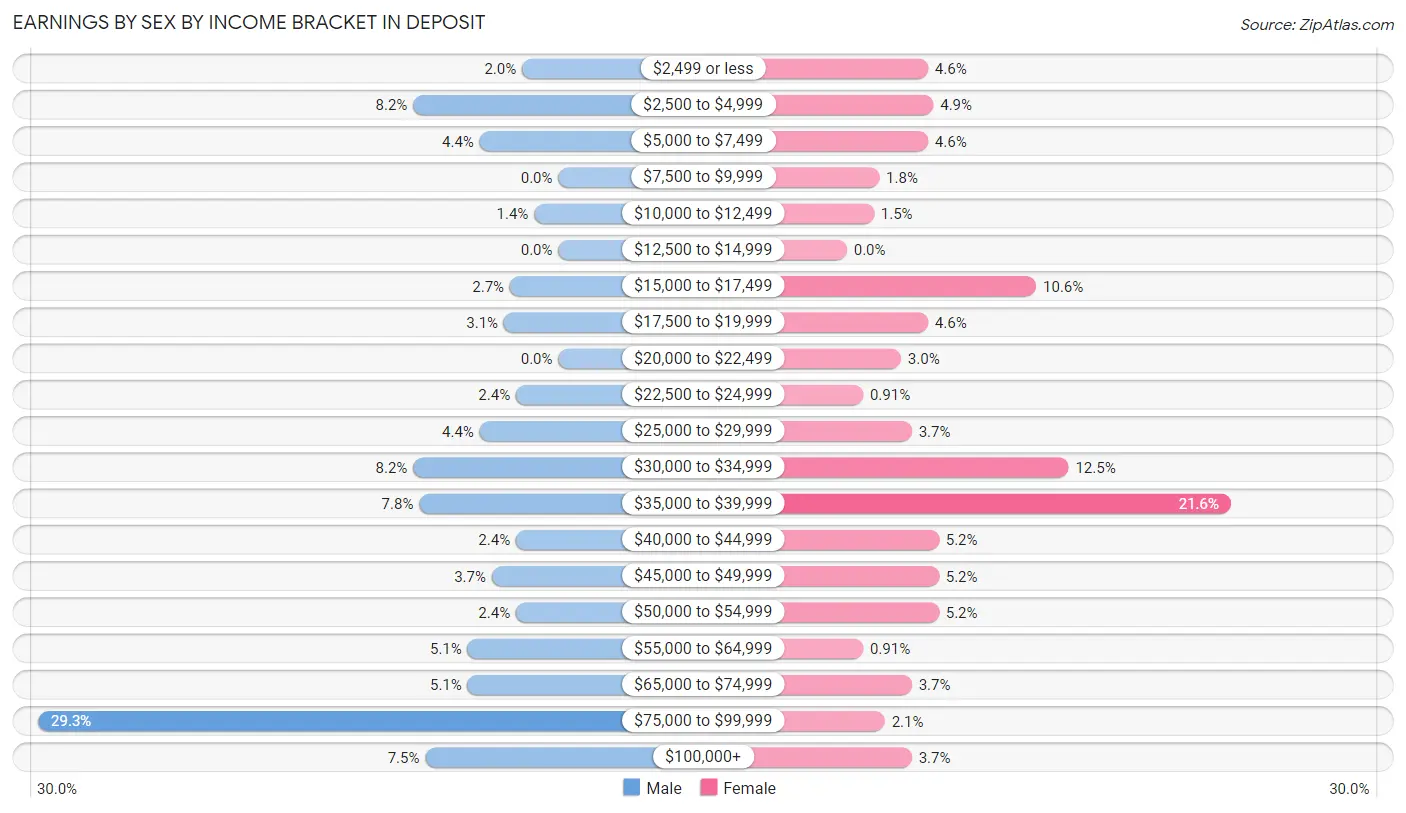
| Income | Male | Female |
| $2,499 or less | 6 (2.0%) | 15 (4.6%) |
| $2,500 to $4,999 | 24 (8.2%) | 16 (4.9%) |
| $5,000 to $7,499 | 13 (4.4%) | 15 (4.6%) |
| $7,500 to $9,999 | 0 (0.0%) | 6 (1.8%) |
| $10,000 to $12,499 | 4 (1.4%) | 5 (1.5%) |
| $12,500 to $14,999 | 0 (0.0%) | 0 (0.0%) |
| $15,000 to $17,499 | 8 (2.7%) | 35 (10.6%) |
| $17,500 to $19,999 | 9 (3.1%) | 15 (4.6%) |
| $20,000 to $22,499 | 0 (0.0%) | 10 (3.0%) |
| $22,500 to $24,999 | 7 (2.4%) | 3 (0.9%) |
| $25,000 to $29,999 | 13 (4.4%) | 12 (3.6%) |
| $30,000 to $34,999 | 24 (8.2%) | 41 (12.5%) |
| $35,000 to $39,999 | 23 (7.8%) | 71 (21.6%) |
| $40,000 to $44,999 | 7 (2.4%) | 17 (5.2%) |
| $45,000 to $49,999 | 11 (3.7%) | 17 (5.2%) |
| $50,000 to $54,999 | 7 (2.4%) | 17 (5.2%) |
| $55,000 to $64,999 | 15 (5.1%) | 3 (0.9%) |
| $65,000 to $74,999 | 15 (5.1%) | 12 (3.6%) |
| $75,000 to $99,999 | 86 (29.2%) | 7 (2.1%) |
| $100,000+ | 22 (7.5%) | 12 (3.6%) |
| Total | 294 (100.0%) | 329 (100.0%) |
Earnings by Sex by Educational Attainment in Deposit
Average earnings in Deposit are $58,194 for men and $35,518 for women, a difference of 39.0%. Men with an educational attainment of college or associate's degree enjoy the highest average annual earnings of $83,250, while those with high school diploma education earn the least with $40,313. Women with an educational attainment of graduate degree earn the most with the average annual earnings of $225,625, while those with bachelor's degree education have the smallest earnings of $31,250.
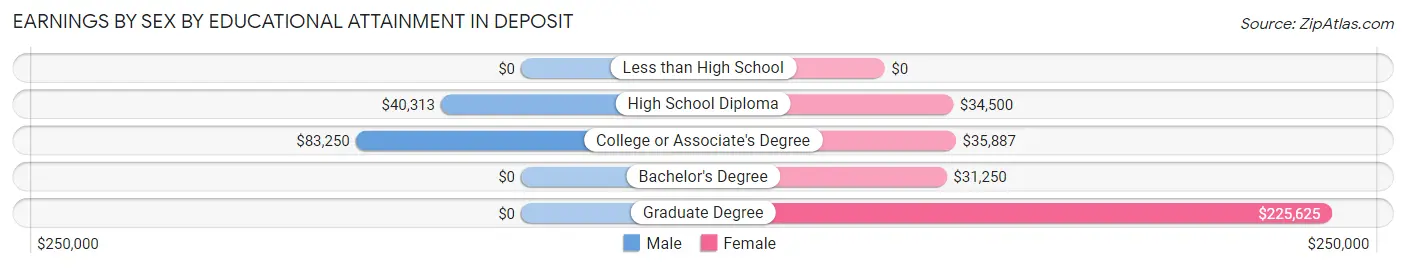
| Educational Attainment | Male Income | Female Income |
| Less than High School | - | - |
| High School Diploma | $40,313 | $34,500 |
| College or Associate's Degree | $83,250 | $35,887 |
| Bachelor's Degree | - | - |
| Graduate Degree | - | - |
| Total | $58,194 | $35,518 |
Family Income in Deposit
Family Income Brackets in Deposit
According to the Deposit family income data, there are 101 families falling into the $100,000 to $149,999 income range, which is the most common income bracket and makes up 24.0% of all families. Conversely, the $200,000+ income bracket is the least frequent group with only 11 families (2.6%) belonging to this category.
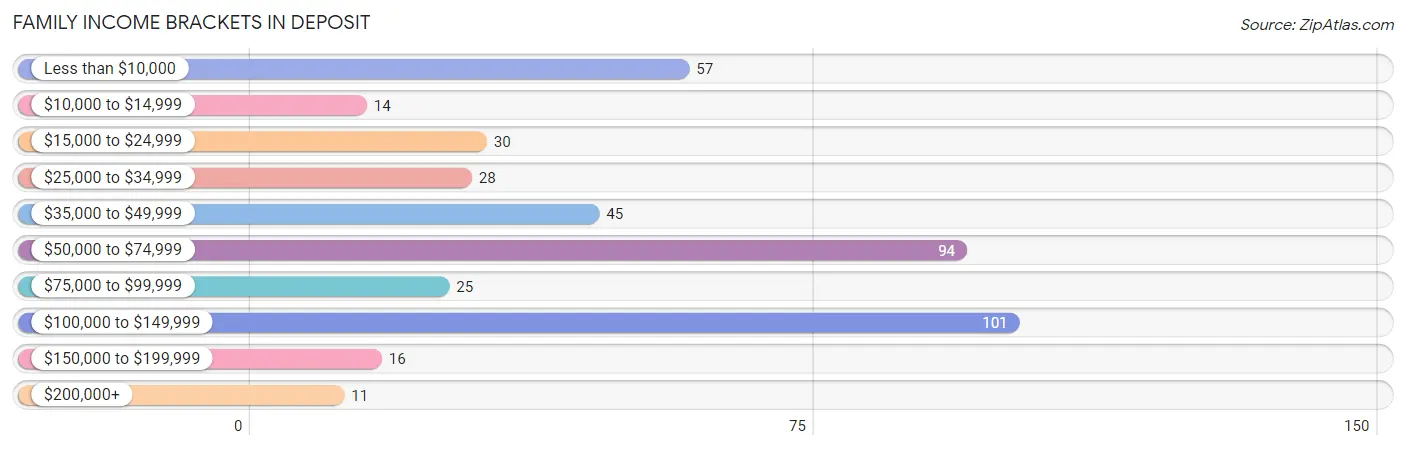
| Income Bracket | # Families | % Families |
| Less than $10,000 | 57 | 13.5% |
| $10,000 to $14,999 | 14 | 3.3% |
| $15,000 to $24,999 | 30 | 7.1% |
| $25,000 to $34,999 | 28 | 6.7% |
| $35,000 to $49,999 | 45 | 10.7% |
| $50,000 to $74,999 | 94 | 22.3% |
| $75,000 to $99,999 | 25 | 5.9% |
| $100,000 to $149,999 | 101 | 24.0% |
| $150,000 to $199,999 | 16 | 3.8% |
| $200,000+ | 11 | 2.6% |
Family Income by Famaliy Size in Deposit
3-person families (142 | 33.7%) account for the highest median family income in Deposit with $70,000 per family, while 2-person families (214 | 50.8%) have the highest median income of $27,916 per family member.
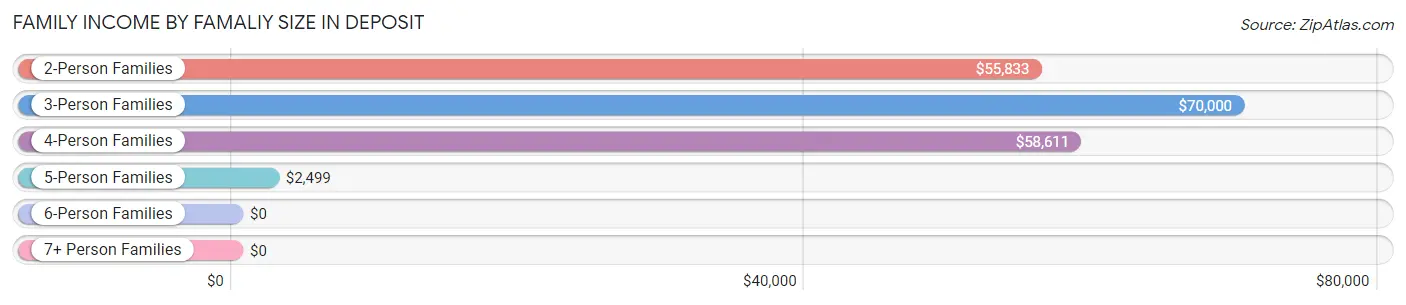
| Income Bracket | # Families | Median Income |
| 2-Person Families | 214 (50.8%) | $55,833 |
| 3-Person Families | 142 (33.7%) | $70,000 |
| 4-Person Families | 46 (10.9%) | $58,611 |
| 5-Person Families | 13 (3.1%) | $2,499 |
| 6-Person Families | 2 (0.5%) | $0 |
| 7+ Person Families | 4 (0.9%) | $0 |
| Total | 421 (100.0%) | $60,625 |
Family Income by Number of Earners in Deposit
The median family income in Deposit is $60,625, with families comprising 3+ earners (25) having the highest median family income of $172,917, while families with no earners (108) have the lowest median family income of $21,667, accounting for 5.9% and 25.7% of families, respectively.
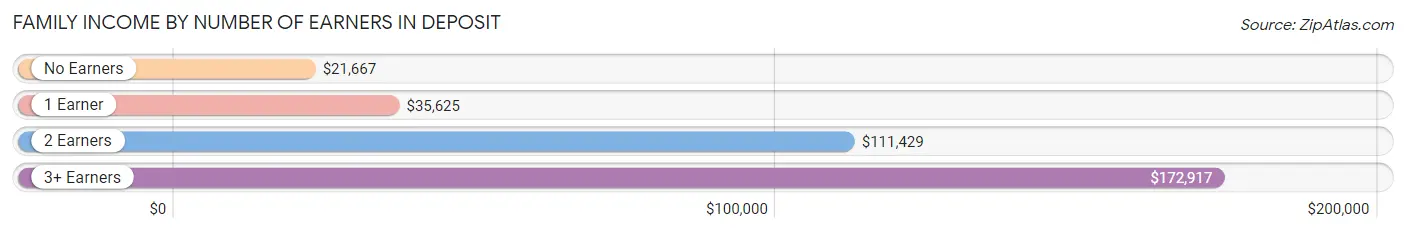
| Number of Earners | # Families | Median Income |
| No Earners | 108 (25.7%) | $21,667 |
| 1 Earner | 122 (29.0%) | $35,625 |
| 2 Earners | 166 (39.4%) | $111,429 |
| 3+ Earners | 25 (5.9%) | $172,917 |
| Total | 421 (100.0%) | $60,625 |
Household Income in Deposit
Household Income Brackets in Deposit
With 104 households falling in the category, the $100,000 to $149,999 income range is the most frequent in Deposit, accounting for 16.8% of all households. In contrast, only 11 households (1.8%) fall into the $200,000+ income bracket, making it the least populous group.
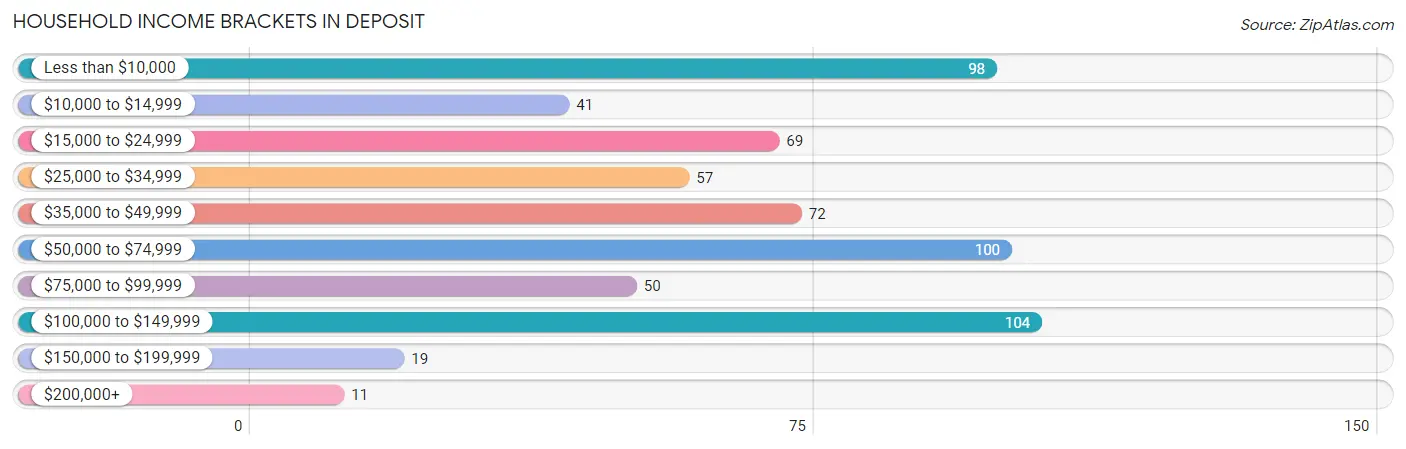
| Income Bracket | # Households | % Households |
| Less than $10,000 | 98 | 15.8% |
| $10,000 to $14,999 | 41 | 6.6% |
| $15,000 to $24,999 | 69 | 11.1% |
| $25,000 to $34,999 | 57 | 9.2% |
| $35,000 to $49,999 | 72 | 11.6% |
| $50,000 to $74,999 | 100 | 16.1% |
| $75,000 to $99,999 | 50 | 8.1% |
| $100,000 to $149,999 | 104 | 16.7% |
| $150,000 to $199,999 | 19 | 3.1% |
| $200,000+ | 11 | 1.8% |
Household Income by Householder Age in Deposit
The median household income in Deposit is $43,618, with the highest median household income of $67,083 found in the 25 to 44 years age bracket for the primary householder. A total of 185 households (29.8%) fall into this category. Meanwhile, the 15 to 24 years age bracket for the primary householder has the lowest median household income of $0, with 13 households (2.1%) in this group.
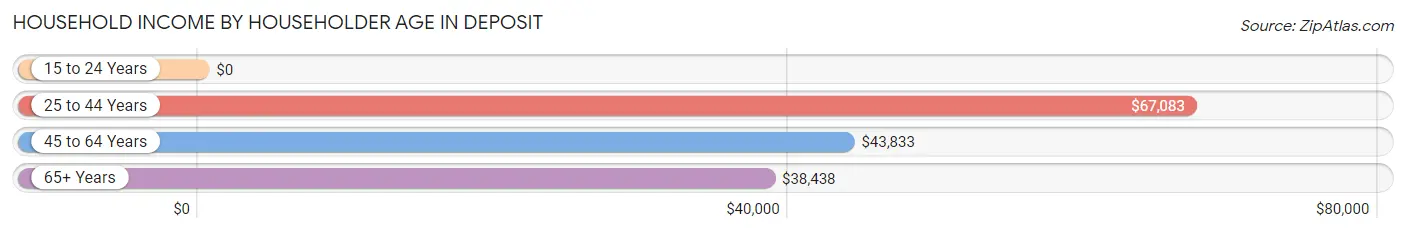
| Income Bracket | # Households | Median Income |
| 15 to 24 Years | 13 (2.1%) | $0 |
| 25 to 44 Years | 185 (29.8%) | $67,083 |
| 45 to 64 Years | 262 (42.2%) | $43,833 |
| 65+ Years | 161 (25.9%) | $38,438 |
| Total | 621 (100.0%) | $43,618 |
Poverty in Deposit
Income Below Poverty by Sex and Age in Deposit
With 24.2% poverty level for males and 24.7% for females among the residents of Deposit, 12 to 14 year old males and 5 year old females are the most vulnerable to poverty, with 17 males (89.5%) and 4 females (50.0%) in their respective age groups living below the poverty level.
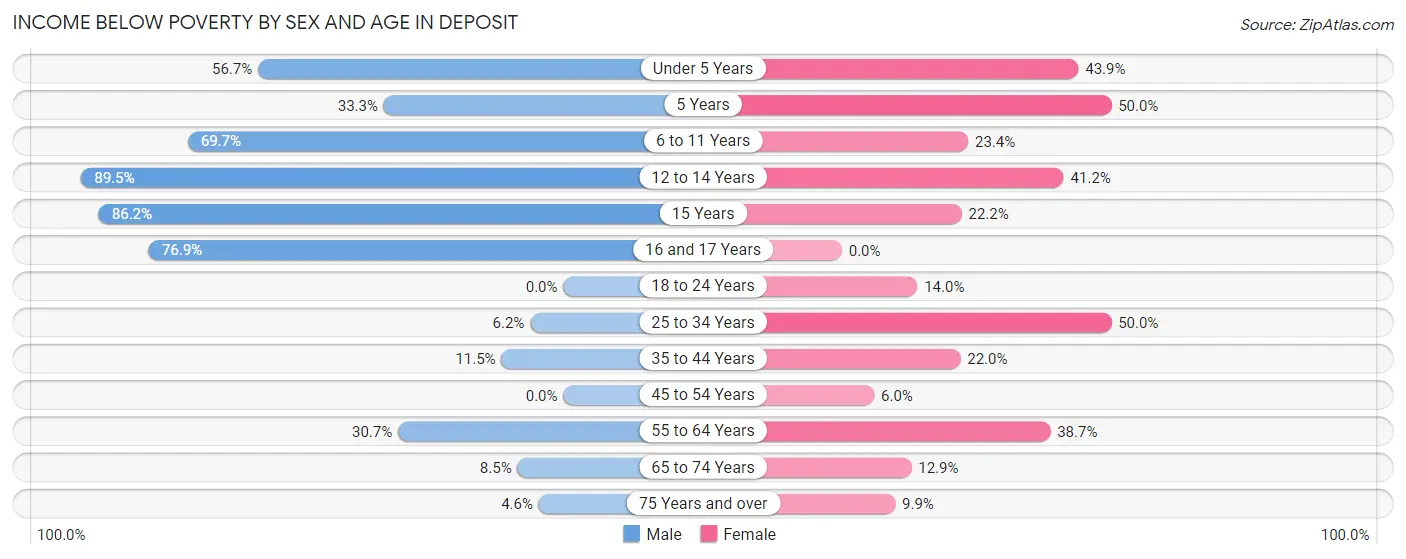
| Age Bracket | Male | Female |
| Under 5 Years | 17 (56.7%) | 18 (43.9%) |
| 5 Years | 3 (33.3%) | 4 (50.0%) |
| 6 to 11 Years | 23 (69.7%) | 15 (23.4%) |
| 12 to 14 Years | 17 (89.5%) | 7 (41.2%) |
| 15 Years | 25 (86.2%) | 2 (22.2%) |
| 16 and 17 Years | 10 (76.9%) | 0 (0.0%) |
| 18 to 24 Years | 0 (0.0%) | 7 (14.0%) |
| 25 to 34 Years | 4 (6.1%) | 46 (50.0%) |
| 35 to 44 Years | 10 (11.5%) | 22 (22.0%) |
| 45 to 54 Years | 0 (0.0%) | 6 (6.0%) |
| 55 to 64 Years | 31 (30.7%) | 53 (38.7%) |
| 65 to 74 Years | 4 (8.5%) | 8 (12.9%) |
| 75 Years and over | 2 (4.5%) | 9 (9.9%) |
| Total | 146 (24.2%) | 197 (24.7%) |
Income Above Poverty by Sex and Age in Deposit
According to the poverty statistics in Deposit, males aged 18 to 24 years and females aged 16 and 17 years are the age groups that are most secure financially, with 100.0% of males and 100.0% of females in these age groups living above the poverty line.
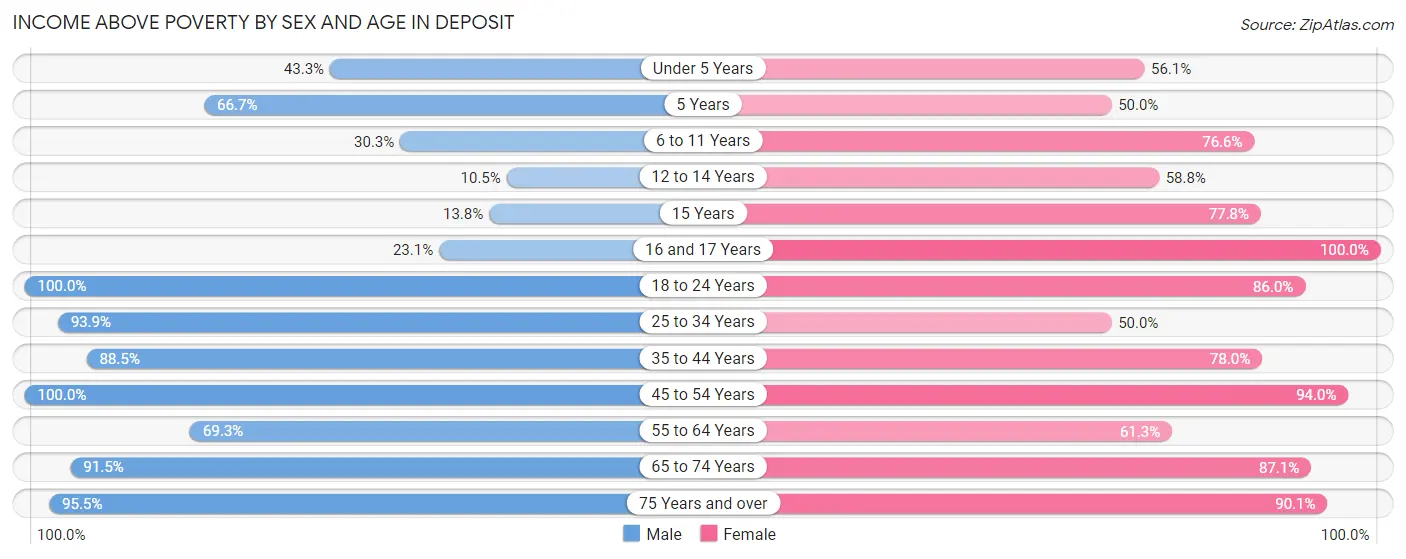
| Age Bracket | Male | Female |
| Under 5 Years | 13 (43.3%) | 23 (56.1%) |
| 5 Years | 6 (66.7%) | 4 (50.0%) |
| 6 to 11 Years | 10 (30.3%) | 49 (76.6%) |
| 12 to 14 Years | 2 (10.5%) | 10 (58.8%) |
| 15 Years | 4 (13.8%) | 7 (77.8%) |
| 16 and 17 Years | 3 (23.1%) | 26 (100.0%) |
| 18 to 24 Years | 35 (100.0%) | 43 (86.0%) |
| 25 to 34 Years | 61 (93.9%) | 46 (50.0%) |
| 35 to 44 Years | 77 (88.5%) | 78 (78.0%) |
| 45 to 54 Years | 92 (100.0%) | 94 (94.0%) |
| 55 to 64 Years | 70 (69.3%) | 84 (61.3%) |
| 65 to 74 Years | 43 (91.5%) | 54 (87.1%) |
| 75 Years and over | 42 (95.5%) | 82 (90.1%) |
| Total | 458 (75.8%) | 600 (75.3%) |
Income Below Poverty Among Married-Couple Families in Deposit
The poverty statistics for married-couple families in Deposit show that 2.9% or 8 of the total 279 families live below the poverty line. Families with 3 or 4 children have the highest poverty rate of 50.0%, comprising of 2 families. On the other hand, families with 1 or 2 children have the lowest poverty rate of 0.0%, which includes 0 families.
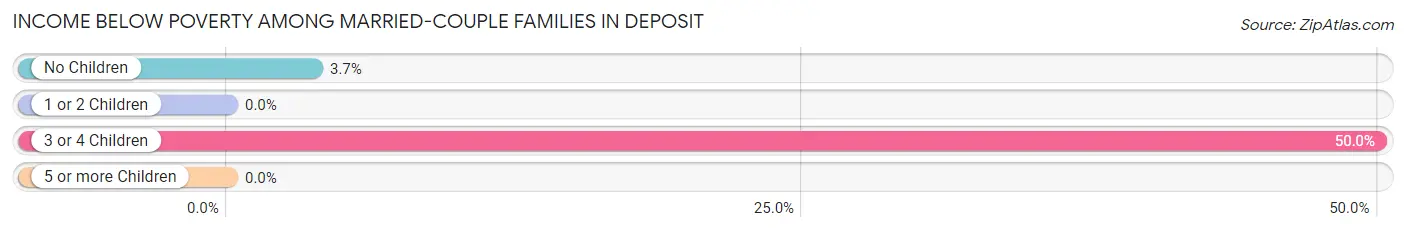
| Children | Above Poverty | Below Poverty |
| No Children | 156 (96.3%) | 6 (3.7%) |
| 1 or 2 Children | 113 (100.0%) | 0 (0.0%) |
| 3 or 4 Children | 2 (50.0%) | 2 (50.0%) |
| 5 or more Children | 0 (0.0%) | 0 (0.0%) |
| Total | 271 (97.1%) | 8 (2.9%) |
Income Below Poverty Among Single-Parent Households in Deposit
According to the poverty data in Deposit, 46.2% or 12 single-father households and 60.3% or 70 single-mother households are living below the poverty line. Among single-father households, those with 1 or 2 children have the highest poverty rate, with 12 households (54.5%) experiencing poverty. Likewise, among single-mother households, those with 3 or 4 children have the highest poverty rate, with 18 households (100.0%) falling below the poverty line.
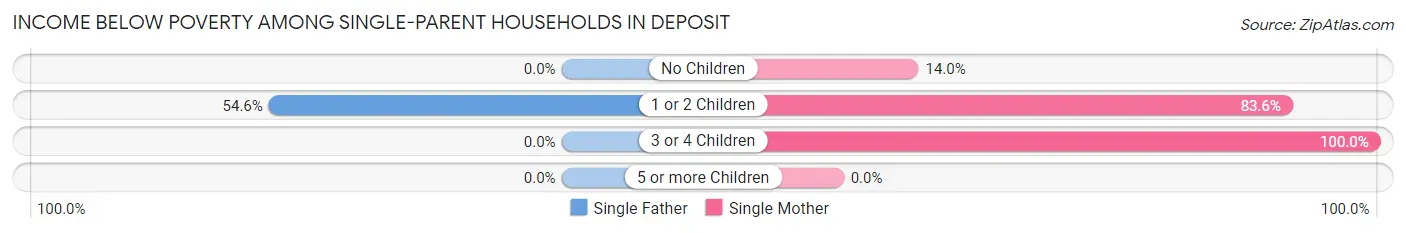
| Children | Single Father | Single Mother |
| No Children | 0 (0.0%) | 6 (14.0%) |
| 1 or 2 Children | 12 (54.5%) | 46 (83.6%) |
| 3 or 4 Children | 0 (0.0%) | 18 (100.0%) |
| 5 or more Children | 0 (0.0%) | 0 (0.0%) |
| Total | 12 (46.2%) | 70 (60.3%) |
Income Below Poverty Among Married-Couple vs Single-Parent Households in Deposit
The poverty data for Deposit shows that 8 of the married-couple family households (2.9%) and 82 of the single-parent households (57.8%) are living below the poverty level. Within the married-couple family households, those with 3 or 4 children have the highest poverty rate, with 2 households (50.0%) falling below the poverty line. Among the single-parent households, those with 3 or 4 children have the highest poverty rate, with 18 household (100.0%) living below poverty.
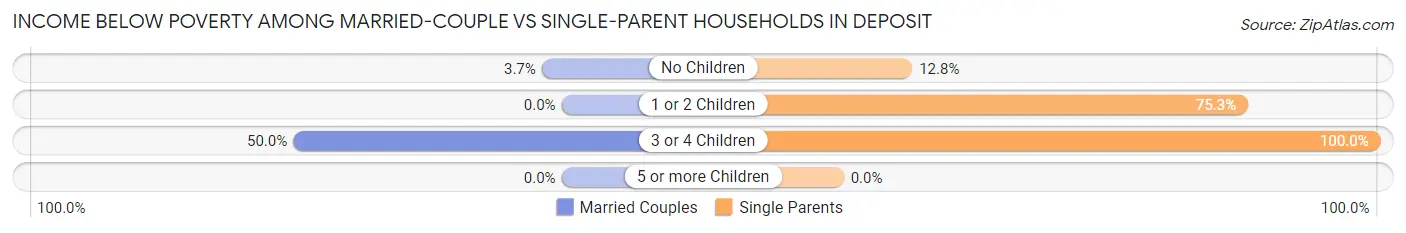
| Children | Married-Couple Families | Single-Parent Households |
| No Children | 6 (3.7%) | 6 (12.8%) |
| 1 or 2 Children | 0 (0.0%) | 58 (75.3%) |
| 3 or 4 Children | 2 (50.0%) | 18 (100.0%) |
| 5 or more Children | 0 (0.0%) | 0 (0.0%) |
| Total | 8 (2.9%) | 82 (57.8%) |
Race in Deposit
The most populous races in Deposit are White / Caucasian (1,331 | 94.9%), Hispanic or Latino (37 | 2.6%), and Two or more Races (31 | 2.2%).
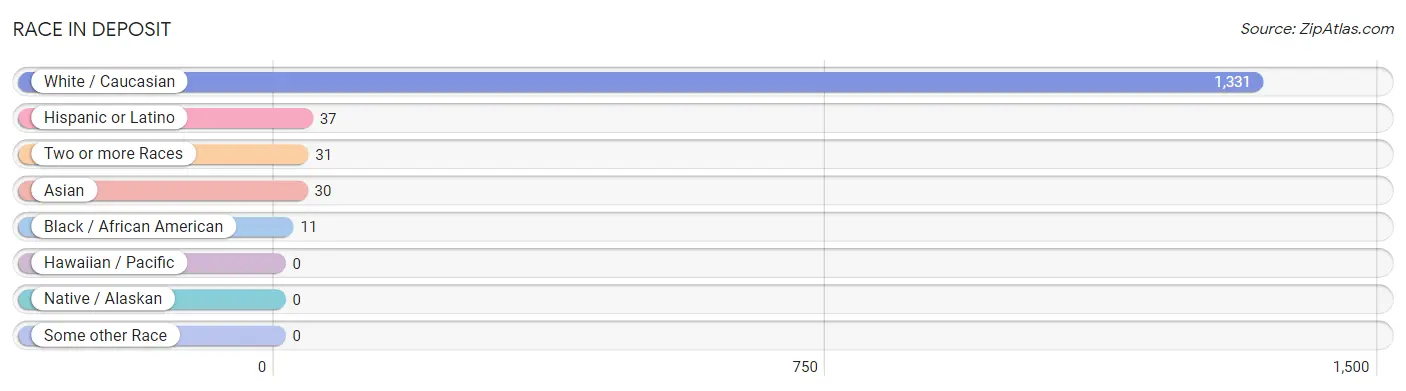
| Race | # Population | % Population |
| Asian | 30 | 2.1% |
| Black / African American | 11 | 0.8% |
| Hawaiian / Pacific | 0 | 0.0% |
| Hispanic or Latino | 37 | 2.6% |
| Native / Alaskan | 0 | 0.0% |
| White / Caucasian | 1,331 | 94.9% |
| Two or more Races | 31 | 2.2% |
| Some other Race | 0 | 0.0% |
| Total | 1,403 | 100.0% |
Ancestry in Deposit
The most populous ancestries reported in Deposit are German (278 | 19.8%), English (229 | 16.3%), Irish (170 | 12.1%), Polish (84 | 6.0%), and Scottish (80 | 5.7%), together accounting for 59.9% of all Deposit residents.
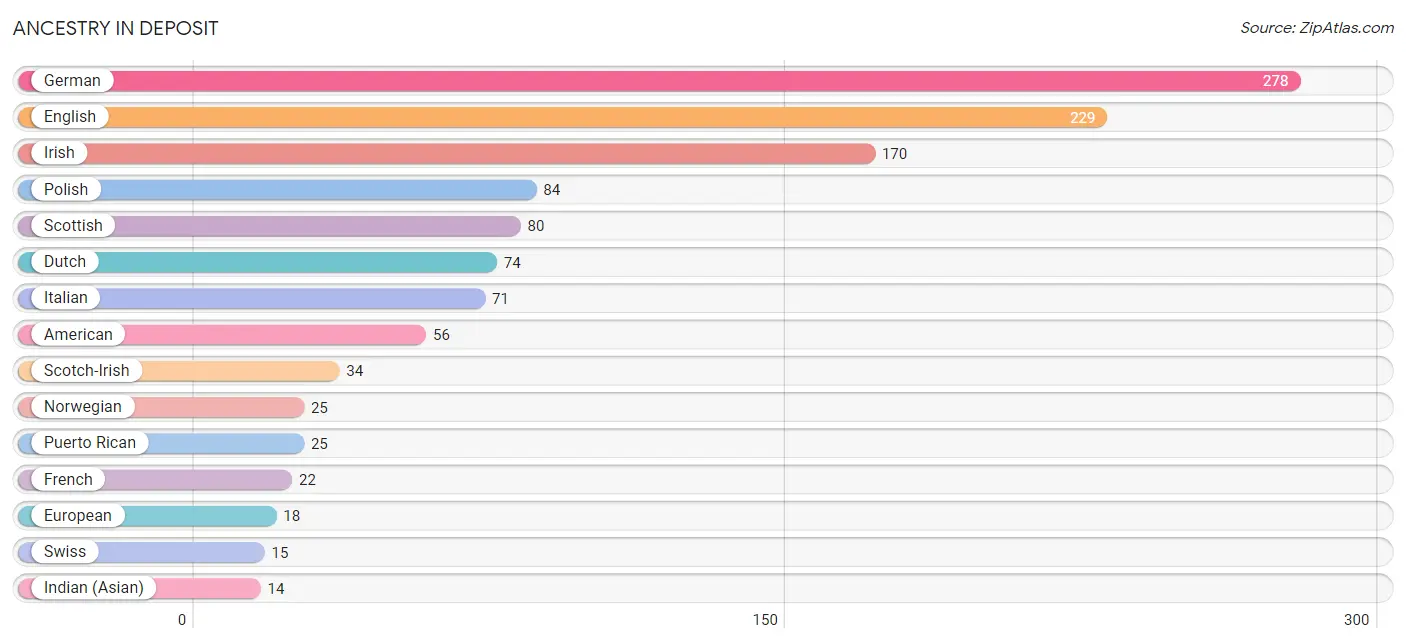
| Ancestry | # Population | % Population |
| American | 56 | 4.0% |
| Arab | 5 | 0.4% |
| Burmese | 2 | 0.1% |
| Cherokee | 3 | 0.2% |
| Colombian | 12 | 0.9% |
| Czech | 4 | 0.3% |
| Dutch | 74 | 5.3% |
| English | 229 | 16.3% |
| European | 18 | 1.3% |
| French | 22 | 1.6% |
| French Canadian | 8 | 0.6% |
| German | 278 | 19.8% |
| Indian (Asian) | 14 | 1.0% |
| Irish | 170 | 12.1% |
| Italian | 71 | 5.1% |
| Jamaican | 7 | 0.5% |
| Moroccan | 5 | 0.4% |
| Norwegian | 25 | 1.8% |
| Pennsylvania German | 10 | 0.7% |
| Polish | 84 | 6.0% |
| Puerto Rican | 25 | 1.8% |
| Scandinavian | 9 | 0.6% |
| Scotch-Irish | 34 | 2.4% |
| Scottish | 80 | 5.7% |
| South American | 12 | 0.9% |
| Sri Lankan | 4 | 0.3% |
| Swiss | 15 | 1.1% |
| Thai | 10 | 0.7% | View All 28 Rows |
Immigrants in Deposit
The most numerous immigrant groups reported in Deposit came from Asia (18 | 1.3%), Europe (12 | 0.9%), India (10 | 0.7%), South Central Asia (10 | 0.7%), and China (8 | 0.6%), together accounting for 4.1% of all Deposit residents.
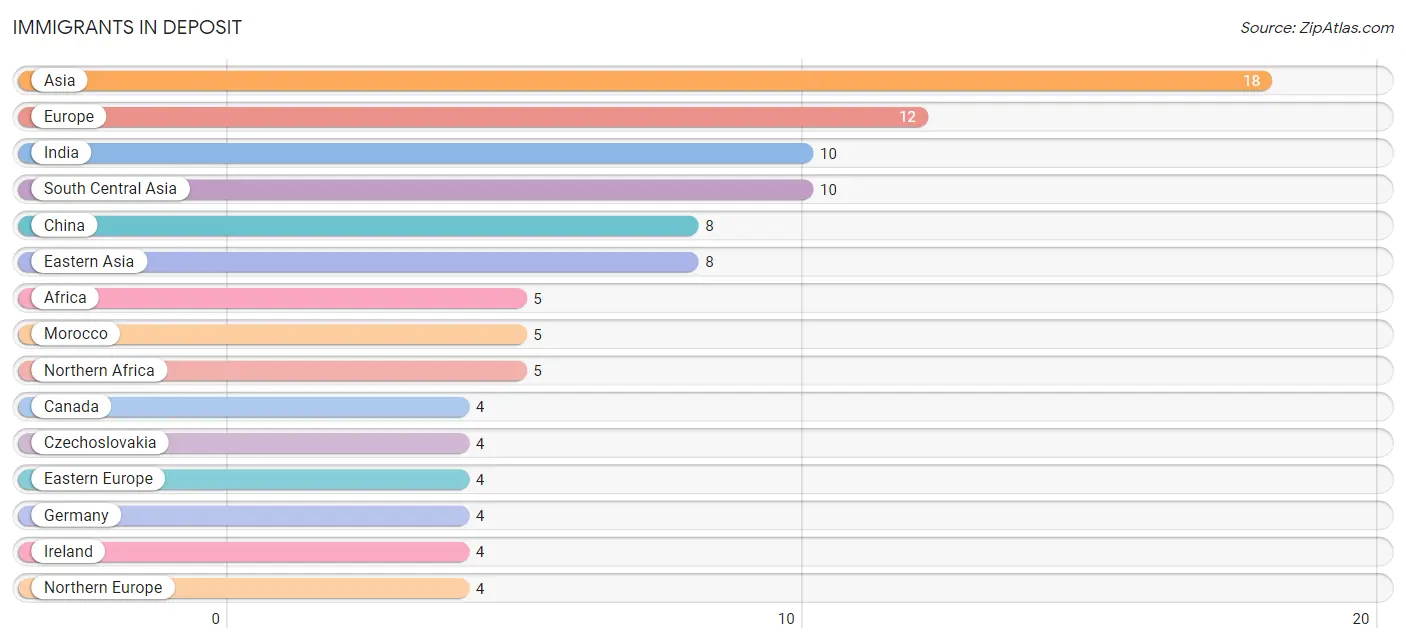
| Immigration Origin | # Population | % Population |
| Africa | 5 | 0.4% |
| Asia | 18 | 1.3% |
| Canada | 4 | 0.3% |
| China | 8 | 0.6% |
| Czechoslovakia | 4 | 0.3% |
| Eastern Asia | 8 | 0.6% |
| Eastern Europe | 4 | 0.3% |
| Europe | 12 | 0.9% |
| Germany | 4 | 0.3% |
| India | 10 | 0.7% |
| Ireland | 4 | 0.3% |
| Morocco | 5 | 0.4% |
| Northern Africa | 5 | 0.4% |
| Northern Europe | 4 | 0.3% |
| South Central Asia | 10 | 0.7% |
| Western Europe | 4 | 0.3% | View All 16 Rows |
Sex and Age in Deposit
Sex and Age in Deposit
The most populous age groups in Deposit are 50 to 54 Years (66 | 10.9%) for men and 45 to 49 Years (77 | 9.7%) for women.
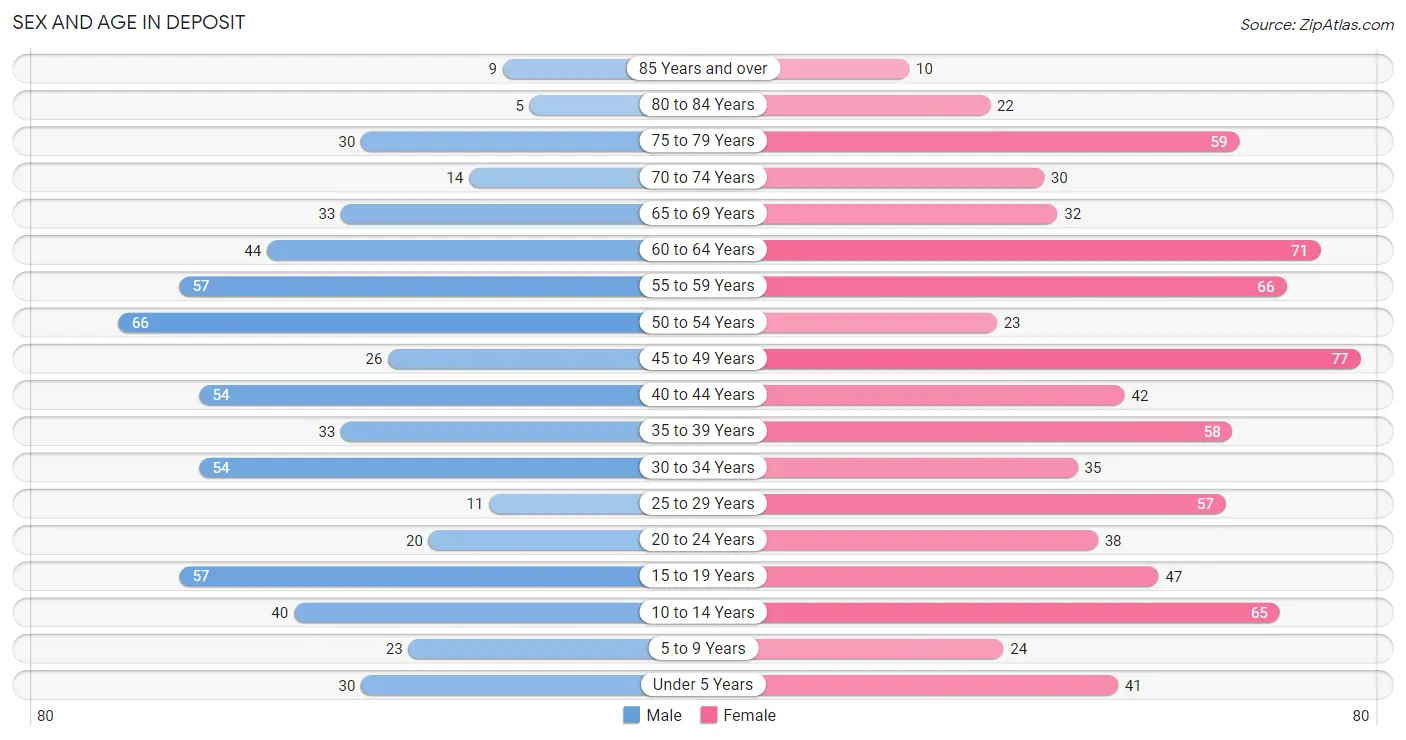
| Age Bracket | Male | Female |
| Under 5 Years | 30 (5.0%) | 41 (5.1%) |
| 5 to 9 Years | 23 (3.8%) | 24 (3.0%) |
| 10 to 14 Years | 40 (6.6%) | 65 (8.2%) |
| 15 to 19 Years | 57 (9.4%) | 47 (5.9%) |
| 20 to 24 Years | 20 (3.3%) | 38 (4.8%) |
| 25 to 29 Years | 11 (1.8%) | 57 (7.1%) |
| 30 to 34 Years | 54 (8.9%) | 35 (4.4%) |
| 35 to 39 Years | 33 (5.4%) | 58 (7.3%) |
| 40 to 44 Years | 54 (8.9%) | 42 (5.3%) |
| 45 to 49 Years | 26 (4.3%) | 77 (9.7%) |
| 50 to 54 Years | 66 (10.9%) | 23 (2.9%) |
| 55 to 59 Years | 57 (9.4%) | 66 (8.3%) |
| 60 to 64 Years | 44 (7.3%) | 71 (8.9%) |
| 65 to 69 Years | 33 (5.4%) | 32 (4.0%) |
| 70 to 74 Years | 14 (2.3%) | 30 (3.8%) |
| 75 to 79 Years | 30 (5.0%) | 59 (7.4%) |
| 80 to 84 Years | 5 (0.8%) | 22 (2.8%) |
| 85 Years and over | 9 (1.5%) | 10 (1.3%) |
| Total | 606 (100.0%) | 797 (100.0%) |
Families and Households in Deposit
Median Family Size in Deposit
The median family size in Deposit is 2.63 persons per family, with married-couple families (279 | 66.3%) accounting for the largest median family size of 2.72 persons per family. On the other hand, single male/father families (26 | 6.2%) represent the smallest median family size with 2.27 persons per family.
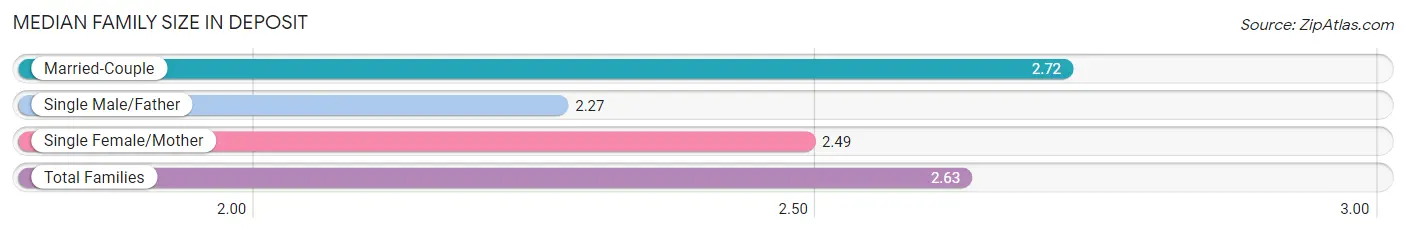
| Family Type | # Families | Family Size |
| Married-Couple | 279 (66.3%) | 2.72 |
| Single Male/Father | 26 (6.2%) | 2.27 |
| Single Female/Mother | 116 (27.6%) | 2.49 |
| Total Families | 421 (100.0%) | 2.63 |
Median Household Size in Deposit
The median household size in Deposit is 2.26 persons per household, with single male/father households (26 | 4.2%) accounting for the largest median household size of 3.42 persons per household. non-family households (200 | 32.2%) represent the smallest median household size with 1.18 persons per household.
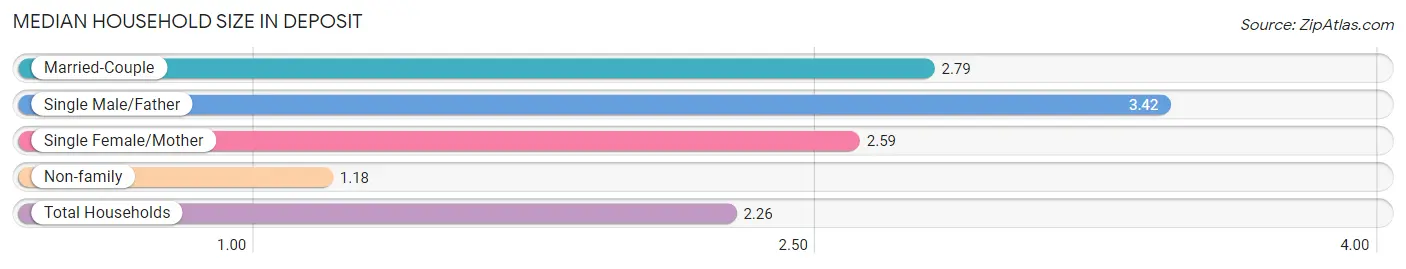
| Household Type | # Households | Household Size |
| Married-Couple | 279 (44.9%) | 2.79 |
| Single Male/Father | 26 (4.2%) | 3.42 |
| Single Female/Mother | 116 (18.7%) | 2.59 |
| Non-family | 200 (32.2%) | 1.18 |
| Total Households | 621 (100.0%) | 2.26 |
Household Size by Marriage Status in Deposit
Out of a total of 621 households in Deposit, 421 (67.8%) are family households, while 200 (32.2%) are nonfamily households. The most numerous type of family households are 2-person households, comprising 204, and the most common type of nonfamily households are 1-person households, comprising 174.
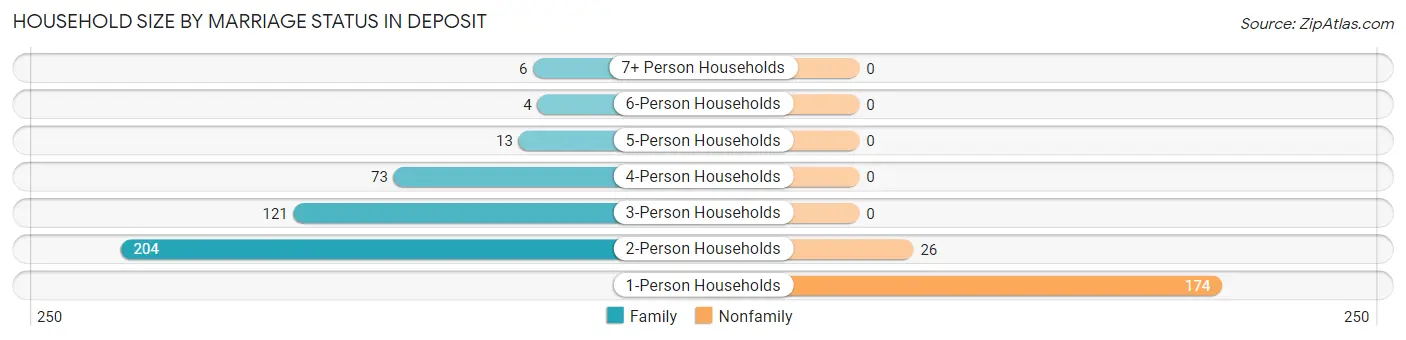
| Household Size | Family Households | Nonfamily Households |
| 1-Person Households | - | 174 (28.0%) |
| 2-Person Households | 204 (32.9%) | 26 (4.2%) |
| 3-Person Households | 121 (19.5%) | 0 (0.0%) |
| 4-Person Households | 73 (11.8%) | 0 (0.0%) |
| 5-Person Households | 13 (2.1%) | 0 (0.0%) |
| 6-Person Households | 4 (0.6%) | 0 (0.0%) |
| 7+ Person Households | 6 (1.0%) | 0 (0.0%) |
| Total | 421 (67.8%) | 200 (32.2%) |
Female Fertility in Deposit
Fertility by Age in Deposit
Average fertility rate in Deposit is 37.0 births per 1,000 women. Women in the age bracket of 20 to 34 years have the highest fertility rate with 100.0 births per 1,000 women. Women in the age bracket of 20 to 34 years acount for 100.0% of all women with births.
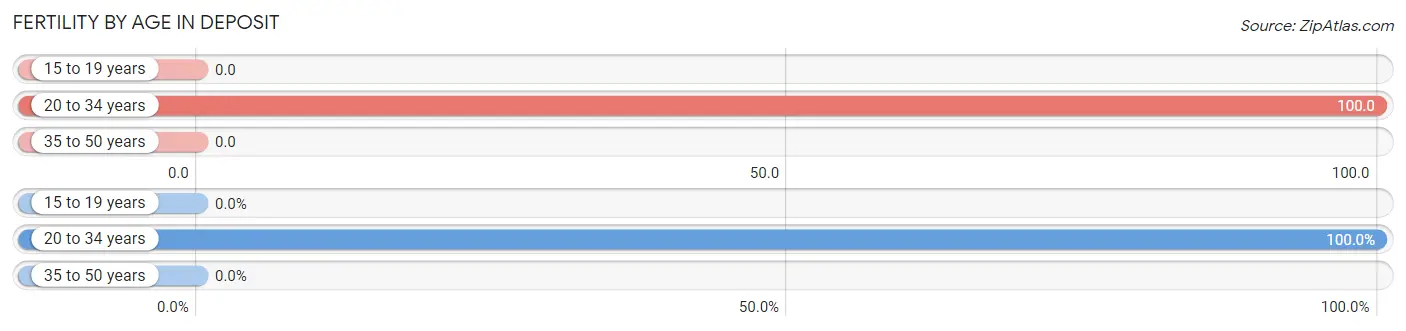
| Age Bracket | Women with Births | Births / 1,000 Women |
| 15 to 19 years | 0 (0.0%) | 0.0 |
| 20 to 34 years | 13 (100.0%) | 100.0 |
| 35 to 50 years | 0 (0.0%) | 0.0 |
| Total | 13 (100.0%) | 37.0 |
Fertility by Age by Marriage Status in Deposit
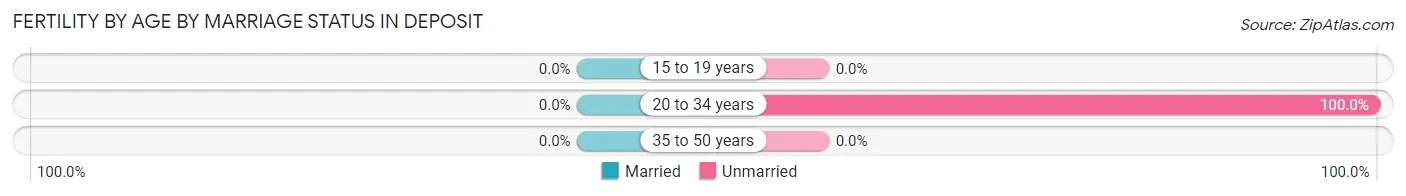
| Age Bracket | Married | Unmarried |
| 15 to 19 years | 0 (0.0%) | 0 (0.0%) |
| 20 to 34 years | 0 (0.0%) | 13 (100.0%) |
| 35 to 50 years | 0 (0.0%) | 0 (0.0%) |
| Total | 0 (0.0%) | 13 (100.0%) |
Fertility by Education in Deposit
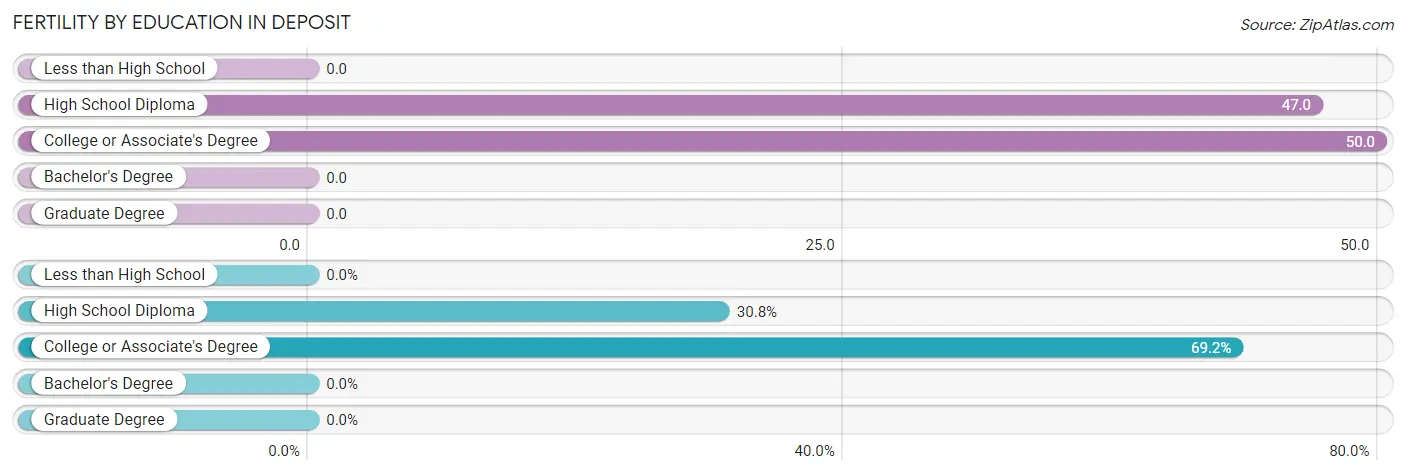
| Educational Attainment | Women with Births | Births / 1,000 Women |
| Less than High School | 0 (0.0%) | 0.0 |
| High School Diploma | 4 (30.8%) | 47.0 |
| College or Associate's Degree | 9 (69.2%) | 50.0 |
| Bachelor's Degree | 0 (0.0%) | 0.0 |
| Graduate Degree | 0 (0.0%) | 0.0 |
| Total | 13 (100.0%) | 37.0 |
Fertility by Education by Marriage Status in Deposit
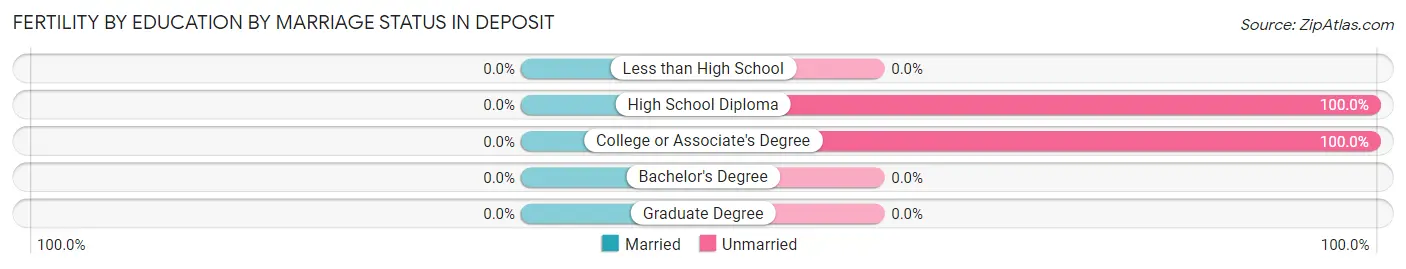
| Educational Attainment | Married | Unmarried |
| Less than High School | 0 (0.0%) | 0 (0.0%) |
| High School Diploma | 0 (0.0%) | 4 (100.0%) |
| College or Associate's Degree | 0 (0.0%) | 9 (100.0%) |
| Bachelor's Degree | 0 (0.0%) | 0 (0.0%) |
| Graduate Degree | 0 (0.0%) | 0 (0.0%) |
| Total | 0 (0.0%) | 13 (100.0%) |
Employment Characteristics in Deposit
Employment by Class of Employer in Deposit
Among the 575 employed individuals in Deposit, private company employees (355 | 61.7%), not-for-profit organizations (98 | 17.0%), and local government employees (67 | 11.7%) make up the most common classes of employment.
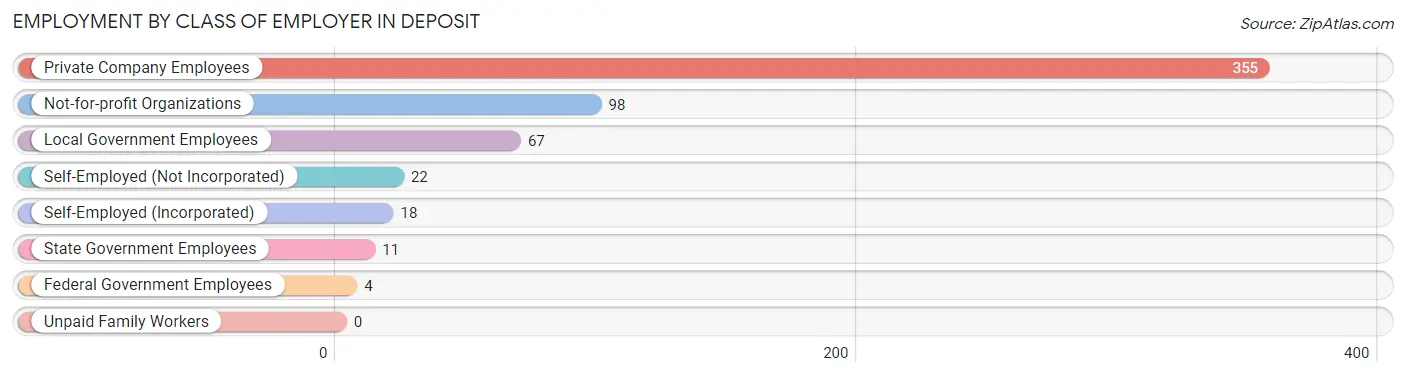
| Employer Class | # Employees | % Employees |
| Private Company Employees | 355 | 61.7% |
| Self-Employed (Incorporated) | 18 | 3.1% |
| Self-Employed (Not Incorporated) | 22 | 3.8% |
| Not-for-profit Organizations | 98 | 17.0% |
| Local Government Employees | 67 | 11.7% |
| State Government Employees | 11 | 1.9% |
| Federal Government Employees | 4 | 0.7% |
| Unpaid Family Workers | 0 | 0.0% |
| Total | 575 | 100.0% |
Employment Status by Age in Deposit
According to the labor force statistics for Deposit, out of the total population over 16 years of age (1,142), 51.5% or 588 individuals are in the labor force, with 1.7% or 10 of them unemployed. The age group with the highest labor force participation rate is 35 to 44 years, with 89.8% or 168 individuals in the labor force. Within the labor force, the 60 to 64 years age range has the highest percentage of unemployed individuals, with 14.3% or 3 of them being unemployed.
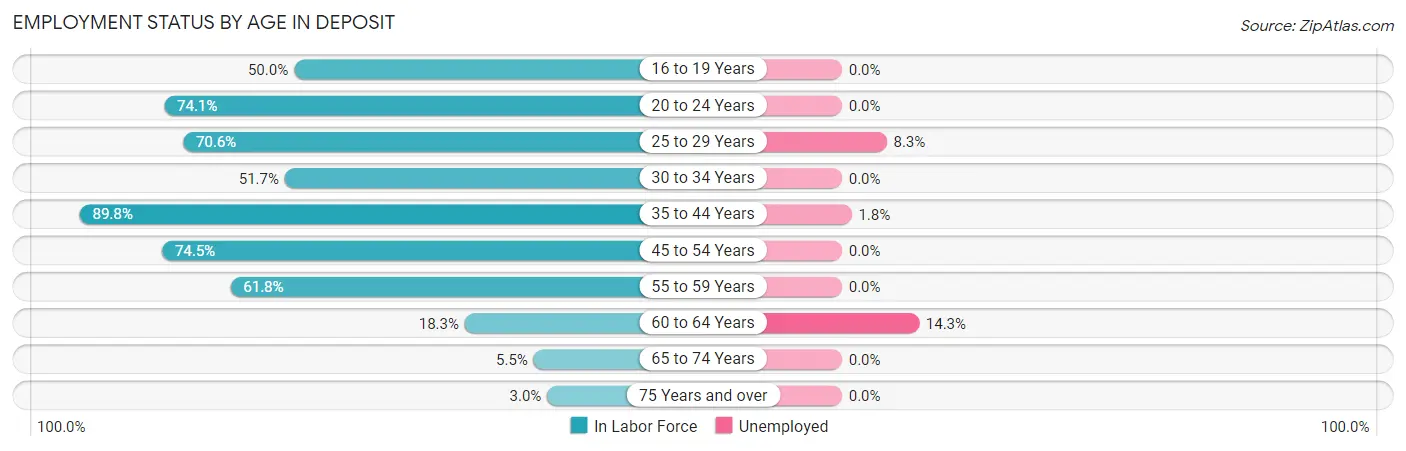
| Age Bracket | In Labor Force | Unemployed |
| 16 to 19 Years | 33 (50.0%) | 0 (0.0%) |
| 20 to 24 Years | 43 (74.1%) | 0 (0.0%) |
| 25 to 29 Years | 48 (70.6%) | 4 (8.3%) |
| 30 to 34 Years | 46 (51.7%) | 0 (0.0%) |
| 35 to 44 Years | 168 (89.8%) | 3 (1.8%) |
| 45 to 54 Years | 143 (74.5%) | 0 (0.0%) |
| 55 to 59 Years | 76 (61.8%) | 0 (0.0%) |
| 60 to 64 Years | 21 (18.3%) | 3 (14.3%) |
| 65 to 74 Years | 6 (5.5%) | 0 (0.0%) |
| 75 Years and over | 4 (3.0%) | 0 (0.0%) |
| Total | 588 (51.5%) | 10 (1.7%) |
Employment Status by Educational Attainment in Deposit
According to labor force statistics for Deposit, 64.9% of individuals (502) out of the total population between 25 and 64 years of age (774) are in the labor force, with 2.0% or 10 of them being unemployed. The group with the highest labor force participation rate are those with the educational attainment of college / associate degree, with 80.1% or 237 individuals in the labor force. Within the labor force, individuals with college / associate degree education have the highest percentage of unemployment, with 4.2% or 10 of them being unemployed.
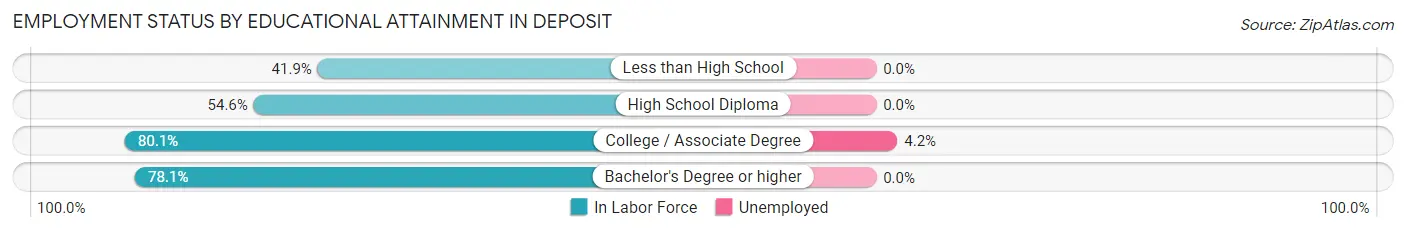
| Educational Attainment | In Labor Force | Unemployed |
| Less than High School | 36 (41.9%) | 0 (0.0%) |
| High School Diploma | 179 (54.6%) | 0 (0.0%) |
| College / Associate Degree | 237 (80.1%) | 12 (4.2%) |
| Bachelor's Degree or higher | 50 (78.1%) | 0 (0.0%) |
| Total | 502 (64.9%) | 15 (2.0%) |
Employment Occupations by Sex in Deposit
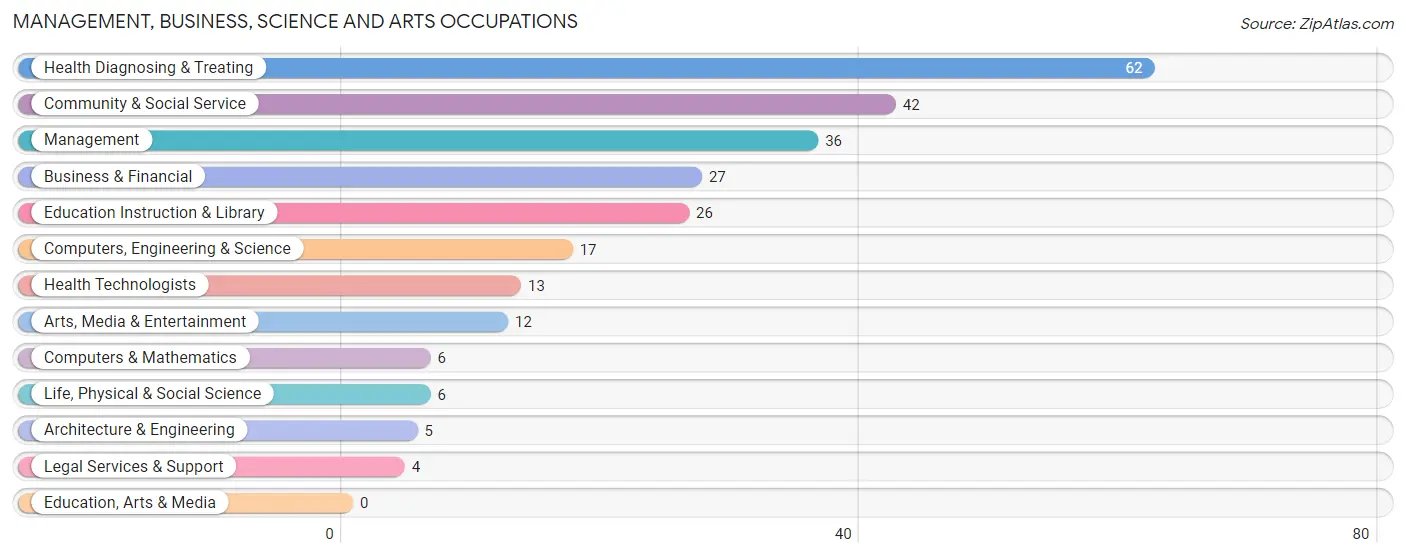
Management, Business, Science and Arts Occupations
The most common Management, Business, Science and Arts occupations in Deposit are Health Diagnosing & Treating (62 | 10.7%), Community & Social Service (42 | 7.3%), Management (36 | 6.2%), Business & Financial (27 | 4.7%), and Education Instruction & Library (26 | 4.5%).
Management, Business, Science and Arts Occupations by Sex
Within the Management, Business, Science and Arts occupations in Deposit, the most male-oriented occupations are Architecture & Engineering (100.0%), Business & Financial (81.5%), and Management (47.2%), while the most female-oriented occupations are Computers & Mathematics (100.0%), Legal Services & Support (100.0%), and Arts, Media & Entertainment (100.0%).
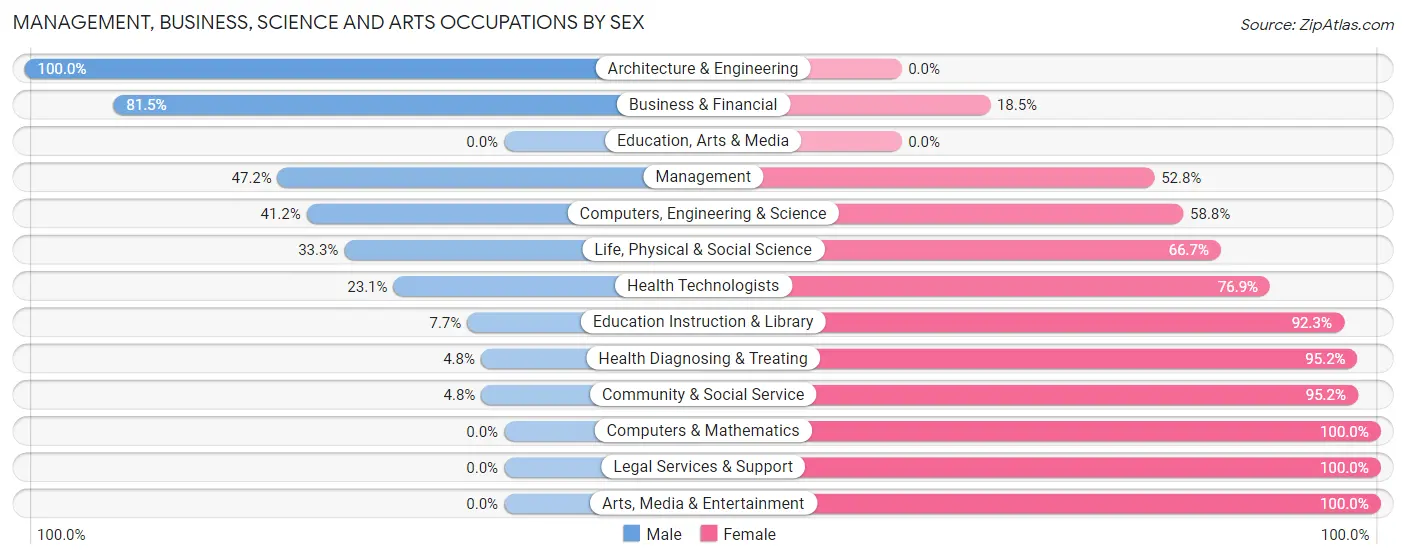
| Occupation | Male | Female |
| Management | 17 (47.2%) | 19 (52.8%) |
| Business & Financial | 22 (81.5%) | 5 (18.5%) |
| Computers, Engineering & Science | 7 (41.2%) | 10 (58.8%) |
| Computers & Mathematics | 0 (0.0%) | 6 (100.0%) |
| Architecture & Engineering | 5 (100.0%) | 0 (0.0%) |
| Life, Physical & Social Science | 2 (33.3%) | 4 (66.7%) |
| Community & Social Service | 2 (4.8%) | 40 (95.2%) |
| Education, Arts & Media | 0 (0.0%) | 0 (0.0%) |
| Legal Services & Support | 0 (0.0%) | 4 (100.0%) |
| Education Instruction & Library | 2 (7.7%) | 24 (92.3%) |
| Arts, Media & Entertainment | 0 (0.0%) | 12 (100.0%) |
| Health Diagnosing & Treating | 3 (4.8%) | 59 (95.2%) |
| Health Technologists | 3 (23.1%) | 10 (76.9%) |
| Total (Category) | 51 (27.7%) | 133 (72.3%) |
| Total (Overall) | 261 (45.2%) | 317 (54.8%) |
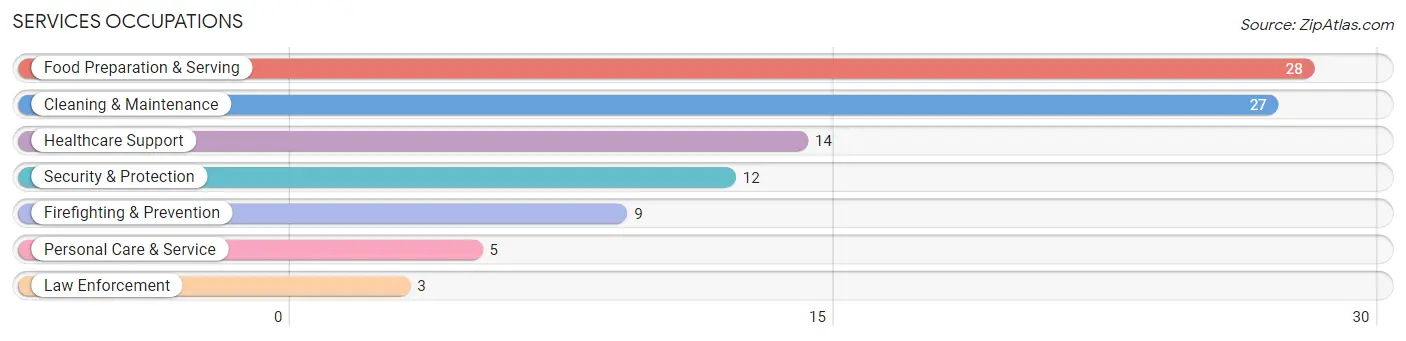
Services Occupations
The most common Services occupations in Deposit are Food Preparation & Serving (28 | 4.8%), Cleaning & Maintenance (27 | 4.7%), Healthcare Support (14 | 2.4%), Security & Protection (12 | 2.1%), and Firefighting & Prevention (9 | 1.6%).
Services Occupations by Sex
Within the Services occupations in Deposit, the most male-oriented occupations are Cleaning & Maintenance (59.3%), and Food Preparation & Serving (42.9%), while the most female-oriented occupations are Healthcare Support (100.0%), Security & Protection (100.0%), and Firefighting & Prevention (100.0%).
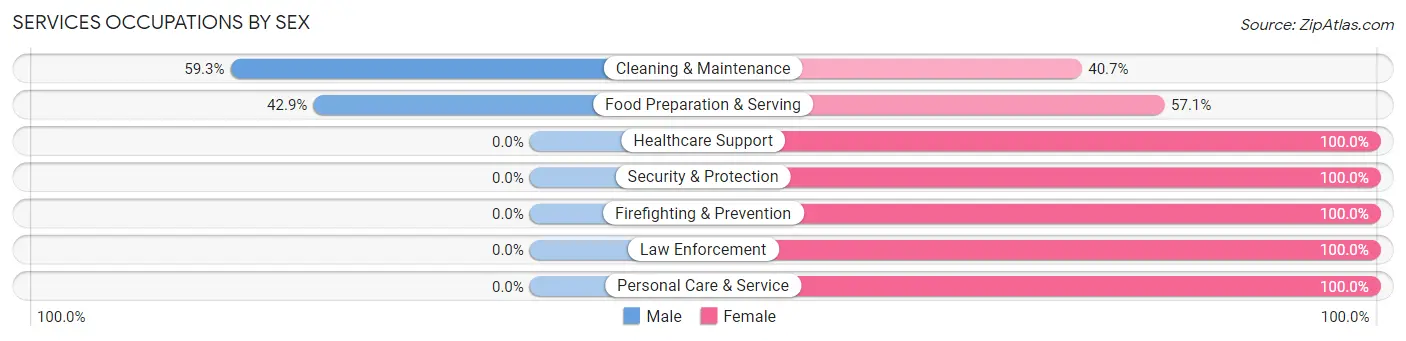
| Occupation | Male | Female |
| Healthcare Support | 0 (0.0%) | 14 (100.0%) |
| Security & Protection | 0 (0.0%) | 12 (100.0%) |
| Firefighting & Prevention | 0 (0.0%) | 9 (100.0%) |
| Law Enforcement | 0 (0.0%) | 3 (100.0%) |
| Food Preparation & Serving | 12 (42.9%) | 16 (57.1%) |
| Cleaning & Maintenance | 16 (59.3%) | 11 (40.7%) |
| Personal Care & Service | 0 (0.0%) | 5 (100.0%) |
| Total (Category) | 28 (32.6%) | 58 (67.4%) |
| Total (Overall) | 261 (45.2%) | 317 (54.8%) |
Sales and Office Occupations
The most common Sales and Office occupations in Deposit are Office & Administration (83 | 14.4%), and Sales & Related (21 | 3.6%).
Sales and Office Occupations by Sex
| Occupation | Male | Female |
| Sales & Related | 6 (28.6%) | 15 (71.4%) |
| Office & Administration | 10 (12.0%) | 73 (87.9%) |
| Total (Category) | 16 (15.4%) | 88 (84.6%) |
| Total (Overall) | 261 (45.2%) | 317 (54.8%) |
Natural Resources, Construction and Maintenance Occupations
The most common Natural Resources, Construction and Maintenance occupations in Deposit are Construction & Extraction (57 | 9.9%), and Installation, Maintenance & Repair (55 | 9.5%).
Natural Resources, Construction and Maintenance Occupations by Sex
| Occupation | Male | Female |
| Farming, Fishing & Forestry | 0 (0.0%) | 0 (0.0%) |
| Construction & Extraction | 57 (100.0%) | 0 (0.0%) |
| Installation, Maintenance & Repair | 55 (100.0%) | 0 (0.0%) |
| Total (Category) | 112 (100.0%) | 0 (0.0%) |
| Total (Overall) | 261 (45.2%) | 317 (54.8%) |
Production, Transportation and Moving Occupations
The most common Production, Transportation and Moving occupations in Deposit are Production (71 | 12.3%), and Material Moving (21 | 3.6%).
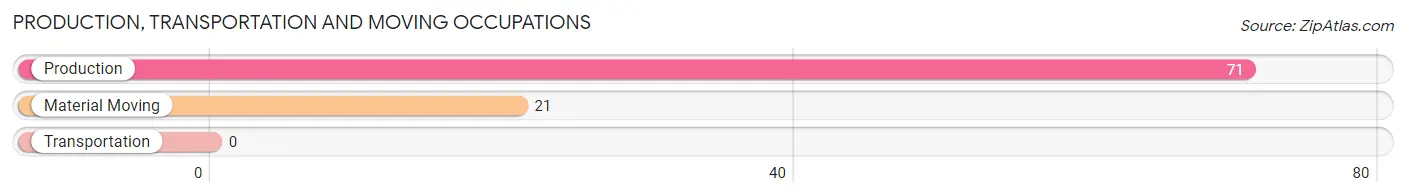
Production, Transportation and Moving Occupations by Sex
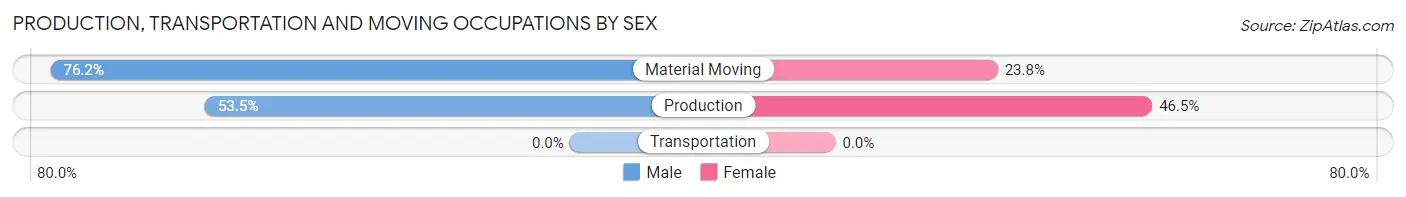
| Occupation | Male | Female |
| Production | 38 (53.5%) | 33 (46.5%) |
| Transportation | 0 (0.0%) | 0 (0.0%) |
| Material Moving | 16 (76.2%) | 5 (23.8%) |
| Total (Category) | 54 (58.7%) | 38 (41.3%) |
| Total (Overall) | 261 (45.2%) | 317 (54.8%) |
Employment Industries by Sex in Deposit
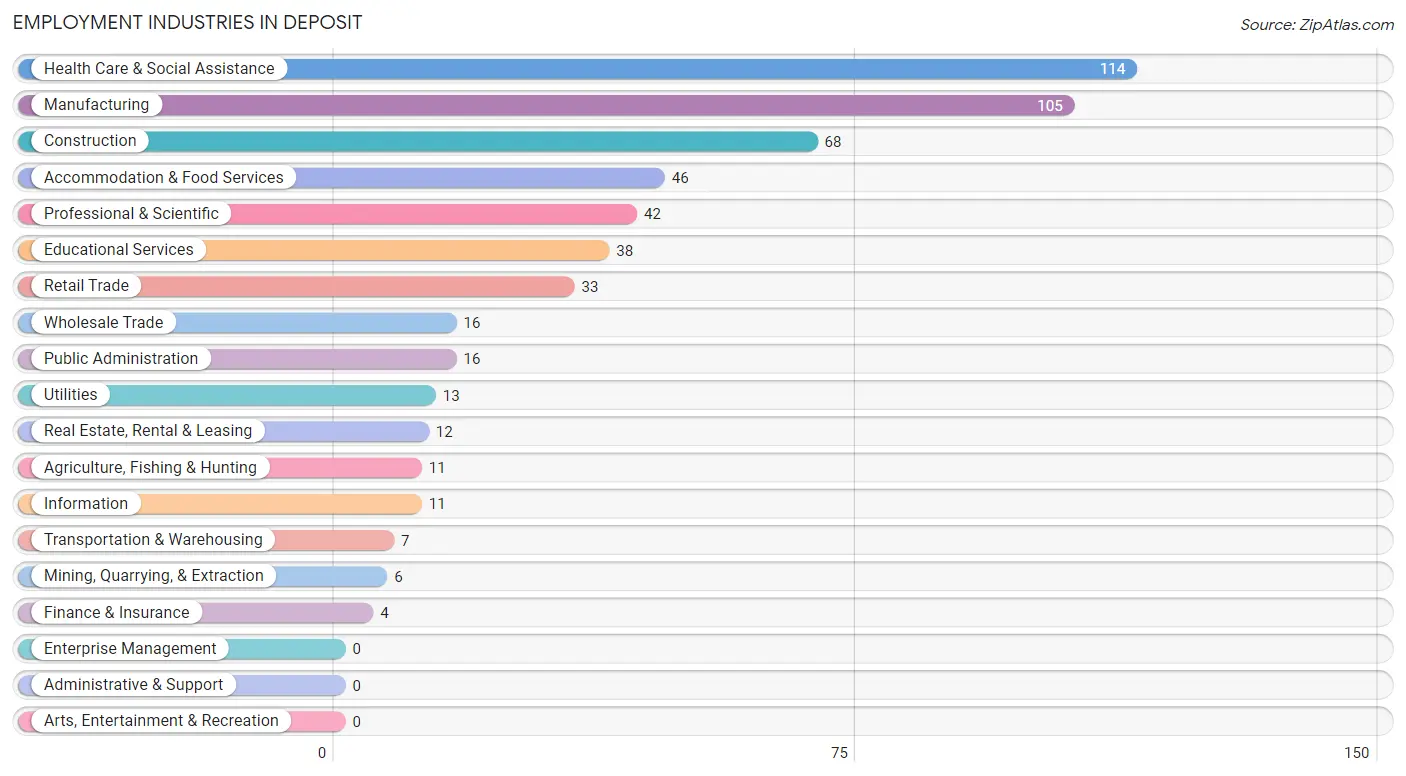
Employment Industries in Deposit
The major employment industries in Deposit include Health Care & Social Assistance (114 | 19.7%), Manufacturing (105 | 18.2%), Construction (68 | 11.8%), Accommodation & Food Services (46 | 8.0%), and Professional & Scientific (42 | 7.3%).
Employment Industries by Sex in Deposit
The Deposit industries that see more men than women are Mining, Quarrying, & Extraction (100.0%), Utilities (100.0%), and Construction (88.2%), whereas the industries that tend to have a higher number of women are Agriculture, Fishing & Hunting (100.0%), Transportation & Warehousing (100.0%), and Finance & Insurance (100.0%).
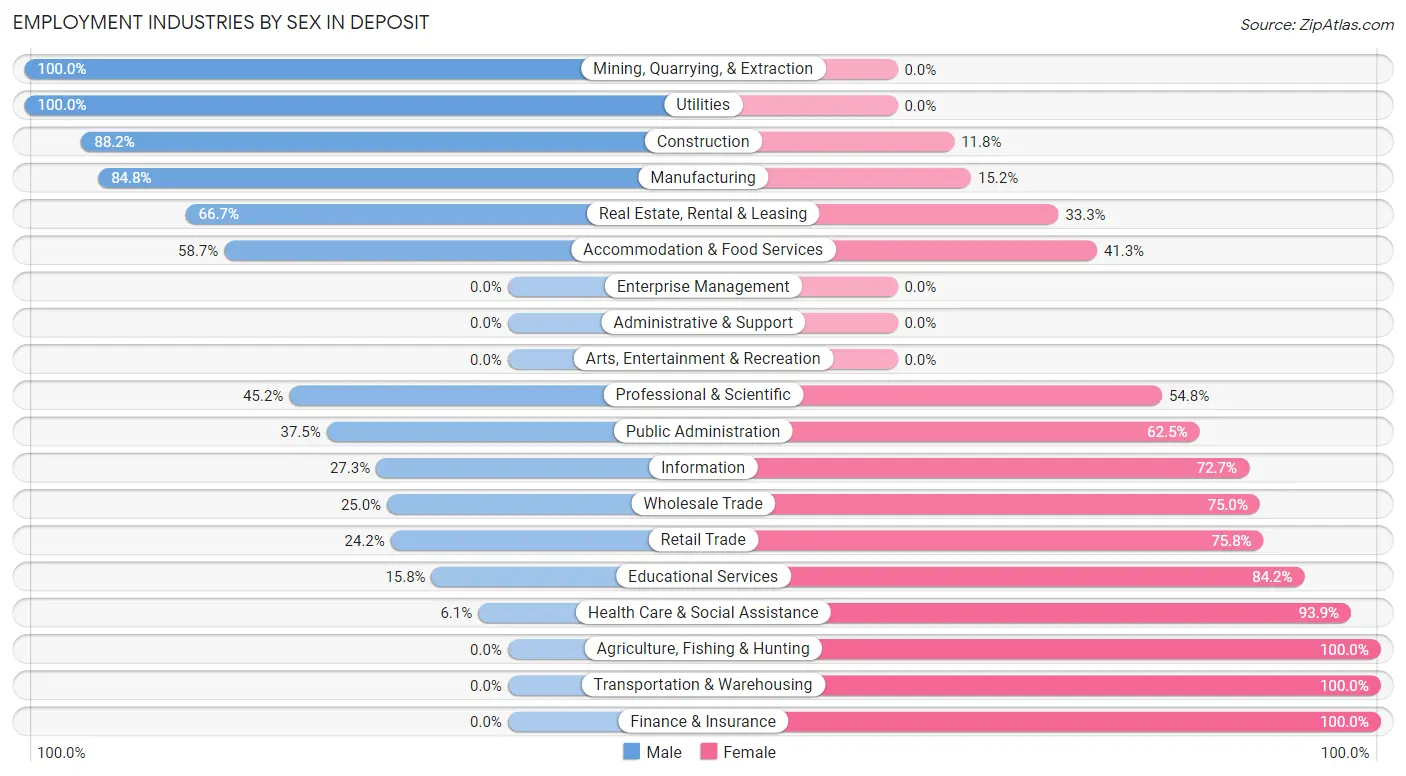
| Industry | Male | Female |
| Agriculture, Fishing & Hunting | 0 (0.0%) | 11 (100.0%) |
| Mining, Quarrying, & Extraction | 6 (100.0%) | 0 (0.0%) |
| Construction | 60 (88.2%) | 8 (11.8%) |
| Manufacturing | 89 (84.8%) | 16 (15.2%) |
| Wholesale Trade | 4 (25.0%) | 12 (75.0%) |
| Retail Trade | 8 (24.2%) | 25 (75.8%) |
| Transportation & Warehousing | 0 (0.0%) | 7 (100.0%) |
| Utilities | 13 (100.0%) | 0 (0.0%) |
| Information | 3 (27.3%) | 8 (72.7%) |
| Finance & Insurance | 0 (0.0%) | 4 (100.0%) |
| Real Estate, Rental & Leasing | 8 (66.7%) | 4 (33.3%) |
| Professional & Scientific | 19 (45.2%) | 23 (54.8%) |
| Enterprise Management | 0 (0.0%) | 0 (0.0%) |
| Administrative & Support | 0 (0.0%) | 0 (0.0%) |
| Educational Services | 6 (15.8%) | 32 (84.2%) |
| Health Care & Social Assistance | 7 (6.1%) | 107 (93.9%) |
| Arts, Entertainment & Recreation | 0 (0.0%) | 0 (0.0%) |
| Accommodation & Food Services | 27 (58.7%) | 19 (41.3%) |
| Public Administration | 6 (37.5%) | 10 (62.5%) |
| Total | 261 (45.2%) | 317 (54.8%) |
Education in Deposit
School Enrollment in Deposit
The most common levels of schooling among the 303 students in Deposit are middle school (107 | 35.3%), high school (86 | 28.4%), and elementary school (35 | 11.6%).
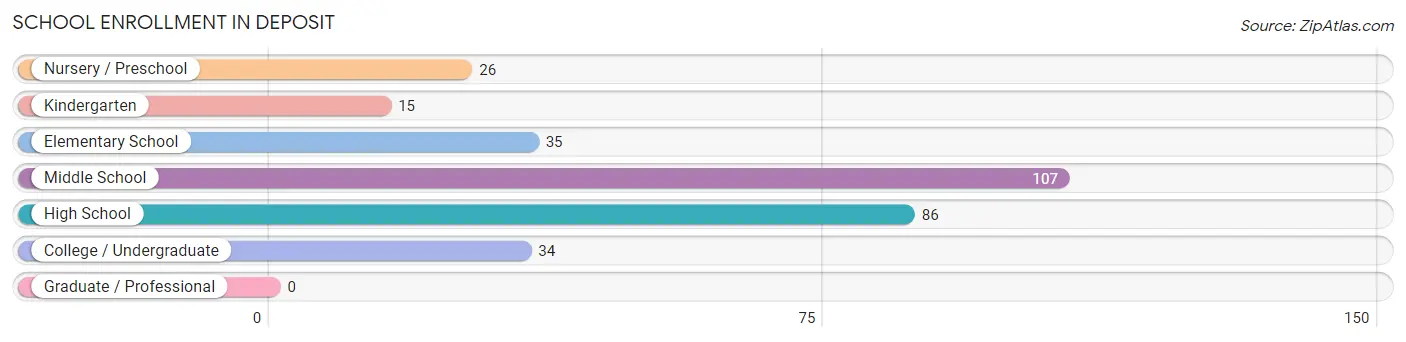
| School Level | # Students | % Students |
| Nursery / Preschool | 26 | 8.6% |
| Kindergarten | 15 | 5.0% |
| Elementary School | 35 | 11.6% |
| Middle School | 107 | 35.3% |
| High School | 86 | 28.4% |
| College / Undergraduate | 34 | 11.2% |
| Graduate / Professional | 0 | 0.0% |
| Total | 303 | 100.0% |
School Enrollment by Age by Funding Source in Deposit
Out of a total of 303 students who are enrolled in schools in Deposit, 10 (3.3%) attend a private institution, while the remaining 293 (96.7%) are enrolled in public schools. The age group of 5 to 9 year old has the highest likelihood of being enrolled in private schools, with 7 (14.9% in the age bracket) enrolled. Conversely, the age group of 3 to 4 year olds has the lowest likelihood of being enrolled in a private school, with 24 (100.0% in the age bracket) attending a public institution.

| Age Bracket | Public School | Private School |
| 3 to 4 Year Olds | 24 (100.0%) | 0 (0.0%) |
| 5 to 9 Year Old | 40 (85.1%) | 7 (14.9%) |
| 10 to 14 Year Olds | 102 (97.1%) | 3 (2.9%) |
| 15 to 17 Year Olds | 77 (100.0%) | 0 (0.0%) |
| 18 to 19 Year Olds | 18 (100.0%) | 0 (0.0%) |
| 20 to 24 Year Olds | 12 (100.0%) | 0 (0.0%) |
| 25 to 34 Year Olds | 4 (100.0%) | 0 (0.0%) |
| 35 Years and over | 16 (100.0%) | 0 (0.0%) |
| Total | 293 (96.7%) | 10 (3.3%) |
Educational Attainment by Field of Study in Deposit
Science & technology (36 | 31.6%), education (25 | 21.9%), literature & languages (11 | 9.7%), engineering (10 | 8.8%), and bio, nature & agricultural (9 | 7.9%) are the most common fields of study among 114 individuals in Deposit who have obtained a bachelor's degree or higher.
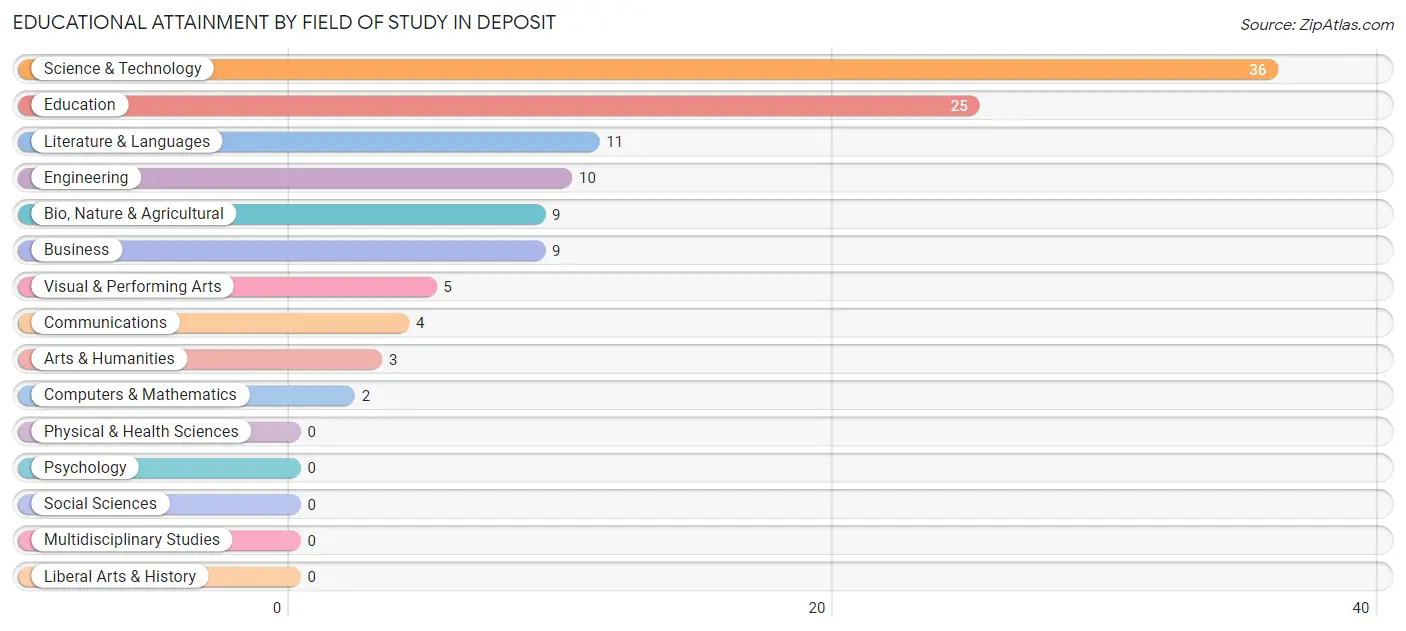
| Field of Study | # Graduates | % Graduates |
| Computers & Mathematics | 2 | 1.8% |
| Bio, Nature & Agricultural | 9 | 7.9% |
| Physical & Health Sciences | 0 | 0.0% |
| Psychology | 0 | 0.0% |
| Social Sciences | 0 | 0.0% |
| Engineering | 10 | 8.8% |
| Multidisciplinary Studies | 0 | 0.0% |
| Science & Technology | 36 | 31.6% |
| Business | 9 | 7.9% |
| Education | 25 | 21.9% |
| Literature & Languages | 11 | 9.7% |
| Liberal Arts & History | 0 | 0.0% |
| Visual & Performing Arts | 5 | 4.4% |
| Communications | 4 | 3.5% |
| Arts & Humanities | 3 | 2.6% |
| Total | 114 | 100.0% |
Transportation & Commute in Deposit
Vehicle Availability by Sex in Deposit
The most prevalent vehicle ownership categories in Deposit are males with 2 vehicles (156, accounting for 60.5%) and females with 2 vehicles (140, making up 49.2%).
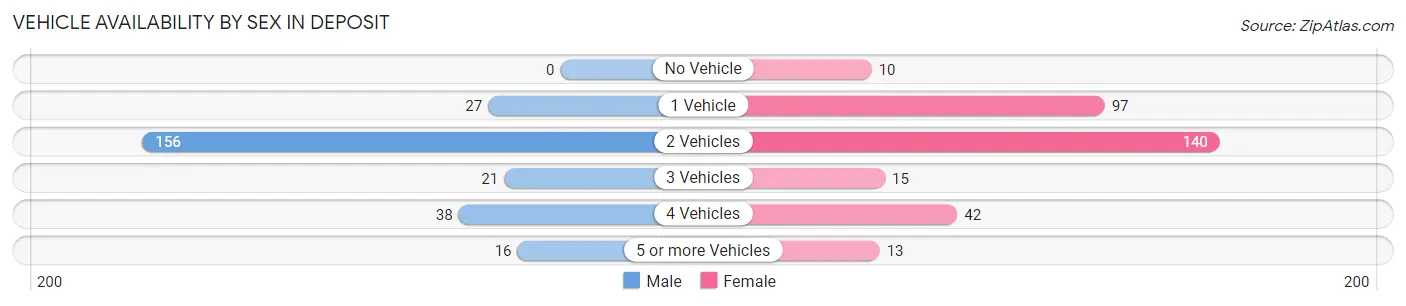
| Vehicles Available | Male | Female |
| No Vehicle | 0 (0.0%) | 10 (3.2%) |
| 1 Vehicle | 27 (10.5%) | 97 (30.6%) |
| 2 Vehicles | 156 (60.5%) | 140 (44.2%) |
| 3 Vehicles | 21 (8.1%) | 15 (4.7%) |
| 4 Vehicles | 38 (14.7%) | 42 (13.3%) |
| 5 or more Vehicles | 16 (6.2%) | 13 (4.1%) |
| Total | 258 (100.0%) | 317 (100.0%) |
Commute Time in Deposit
The most frequently occuring commute durations in Deposit are 25 to 29 minutes (91 commuters, 16.7%), 5 to 9 minutes (82 commuters, 15.1%), and less than 5 minutes (78 commuters, 14.3%).
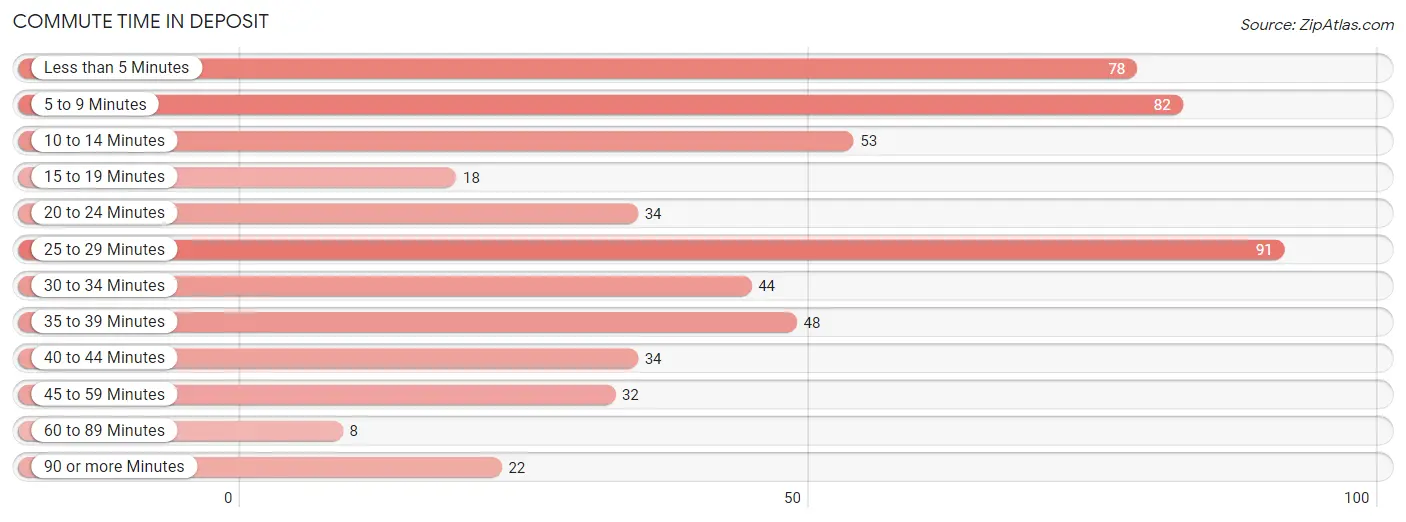
| Commute Time | # Commuters | % Commuters |
| Less than 5 Minutes | 78 | 14.3% |
| 5 to 9 Minutes | 82 | 15.1% |
| 10 to 14 Minutes | 53 | 9.7% |
| 15 to 19 Minutes | 18 | 3.3% |
| 20 to 24 Minutes | 34 | 6.2% |
| 25 to 29 Minutes | 91 | 16.7% |
| 30 to 34 Minutes | 44 | 8.1% |
| 35 to 39 Minutes | 48 | 8.8% |
| 40 to 44 Minutes | 34 | 6.2% |
| 45 to 59 Minutes | 32 | 5.9% |
| 60 to 89 Minutes | 8 | 1.5% |
| 90 or more Minutes | 22 | 4.0% |
Commute Time by Sex in Deposit
The most common commute times in Deposit are 25 to 29 minutes (60 commuters, 25.4%) for males and less than 5 minutes (58 commuters, 18.8%) for females.
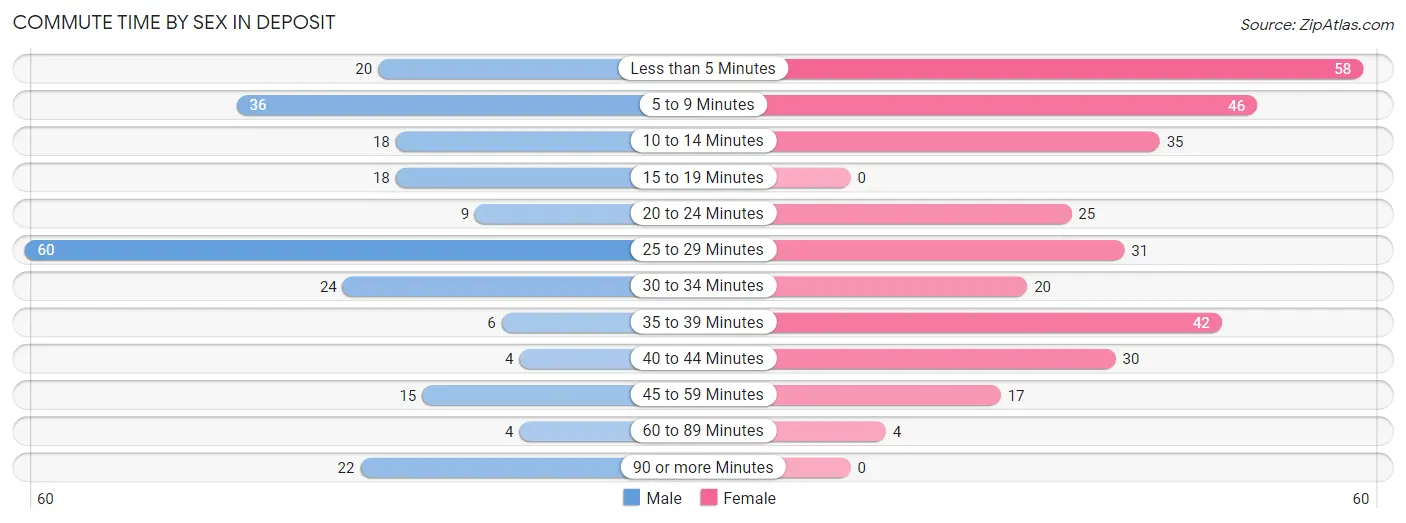
| Commute Time | Male | Female |
| Less than 5 Minutes | 20 (8.5%) | 58 (18.8%) |
| 5 to 9 Minutes | 36 (15.2%) | 46 (14.9%) |
| 10 to 14 Minutes | 18 (7.6%) | 35 (11.4%) |
| 15 to 19 Minutes | 18 (7.6%) | 0 (0.0%) |
| 20 to 24 Minutes | 9 (3.8%) | 25 (8.1%) |
| 25 to 29 Minutes | 60 (25.4%) | 31 (10.1%) |
| 30 to 34 Minutes | 24 (10.2%) | 20 (6.5%) |
| 35 to 39 Minutes | 6 (2.5%) | 42 (13.6%) |
| 40 to 44 Minutes | 4 (1.7%) | 30 (9.7%) |
| 45 to 59 Minutes | 15 (6.4%) | 17 (5.5%) |
| 60 to 89 Minutes | 4 (1.7%) | 4 (1.3%) |
| 90 or more Minutes | 22 (9.3%) | 0 (0.0%) |
Time of Departure to Work by Sex in Deposit
The most frequent times of departure to work in Deposit are 6:00 AM to 6:29 AM (55, 23.3%) for males and 7:00 AM to 7:29 AM (62, 20.1%) for females.
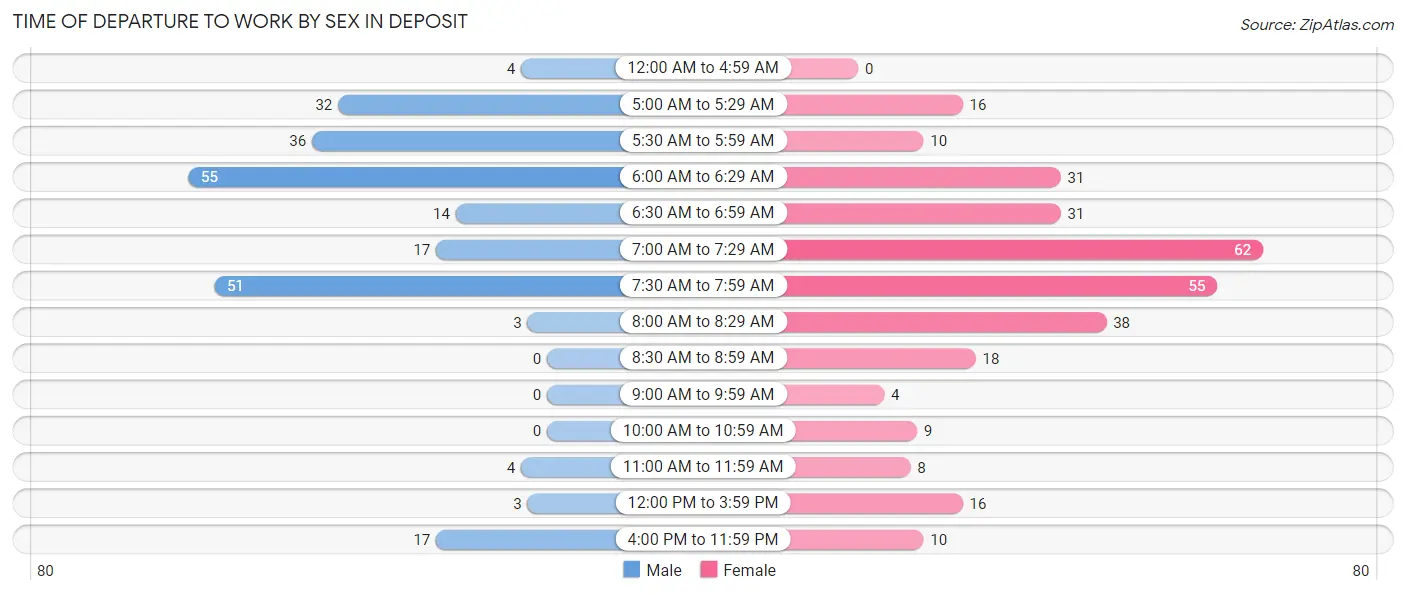
| Time of Departure | Male | Female |
| 12:00 AM to 4:59 AM | 4 (1.7%) | 0 (0.0%) |
| 5:00 AM to 5:29 AM | 32 (13.6%) | 16 (5.2%) |
| 5:30 AM to 5:59 AM | 36 (15.2%) | 10 (3.3%) |
| 6:00 AM to 6:29 AM | 55 (23.3%) | 31 (10.1%) |
| 6:30 AM to 6:59 AM | 14 (5.9%) | 31 (10.1%) |
| 7:00 AM to 7:29 AM | 17 (7.2%) | 62 (20.1%) |
| 7:30 AM to 7:59 AM | 51 (21.6%) | 55 (17.9%) |
| 8:00 AM to 8:29 AM | 3 (1.3%) | 38 (12.3%) |
| 8:30 AM to 8:59 AM | 0 (0.0%) | 18 (5.8%) |
| 9:00 AM to 9:59 AM | 0 (0.0%) | 4 (1.3%) |
| 10:00 AM to 10:59 AM | 0 (0.0%) | 9 (2.9%) |
| 11:00 AM to 11:59 AM | 4 (1.7%) | 8 (2.6%) |
| 12:00 PM to 3:59 PM | 3 (1.3%) | 16 (5.2%) |
| 4:00 PM to 11:59 PM | 17 (7.2%) | 10 (3.3%) |
| Total | 236 (100.0%) | 308 (100.0%) |
Housing Occupancy in Deposit
Occupancy by Ownership in Deposit
Of the total 621 dwellings in Deposit, owner-occupied units account for 443 (71.3%), while renter-occupied units make up 178 (28.7%).

| Occupancy | # Housing Units | % Housing Units |
| Owner Occupied Housing Units | 443 | 71.3% |
| Renter-Occupied Housing Units | 178 | 28.7% |
| Total Occupied Housing Units | 621 | 100.0% |
Occupancy by Household Size in Deposit
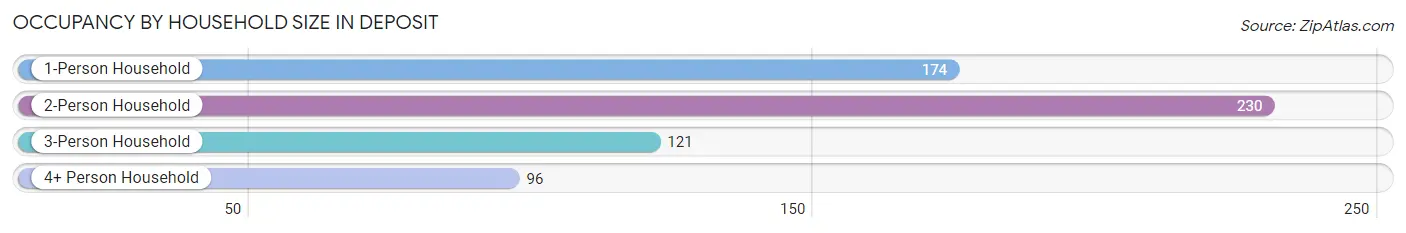
| Household Size | # Housing Units | % Housing Units |
| 1-Person Household | 174 | 28.0% |
| 2-Person Household | 230 | 37.0% |
| 3-Person Household | 121 | 19.5% |
| 4+ Person Household | 96 | 15.5% |
| Total Housing Units | 621 | 100.0% |
Occupancy by Ownership by Household Size in Deposit
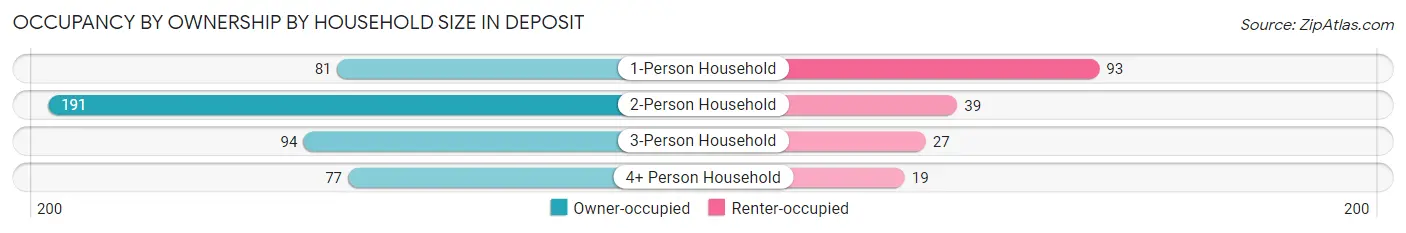
| Household Size | Owner-occupied | Renter-occupied |
| 1-Person Household | 81 (46.6%) | 93 (53.4%) |
| 2-Person Household | 191 (83.0%) | 39 (17.0%) |
| 3-Person Household | 94 (77.7%) | 27 (22.3%) |
| 4+ Person Household | 77 (80.2%) | 19 (19.8%) |
| Total Housing Units | 443 (71.3%) | 178 (28.7%) |
Occupancy by Educational Attainment in Deposit
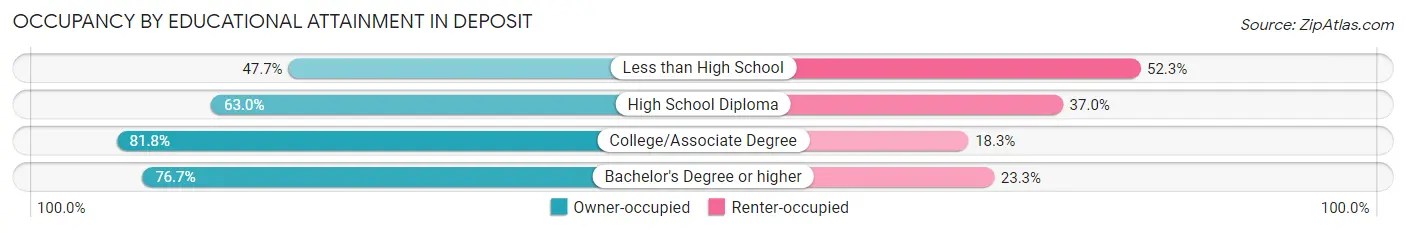
| Household Size | Owner-occupied | Renter-occupied |
| Less than High School | 31 (47.7%) | 34 (52.3%) |
| High School Diploma | 133 (63.0%) | 78 (37.0%) |
| College/Associate Degree | 233 (81.8%) | 52 (18.2%) |
| Bachelor's Degree or higher | 46 (76.7%) | 14 (23.3%) |
Occupancy by Age of Householder in Deposit
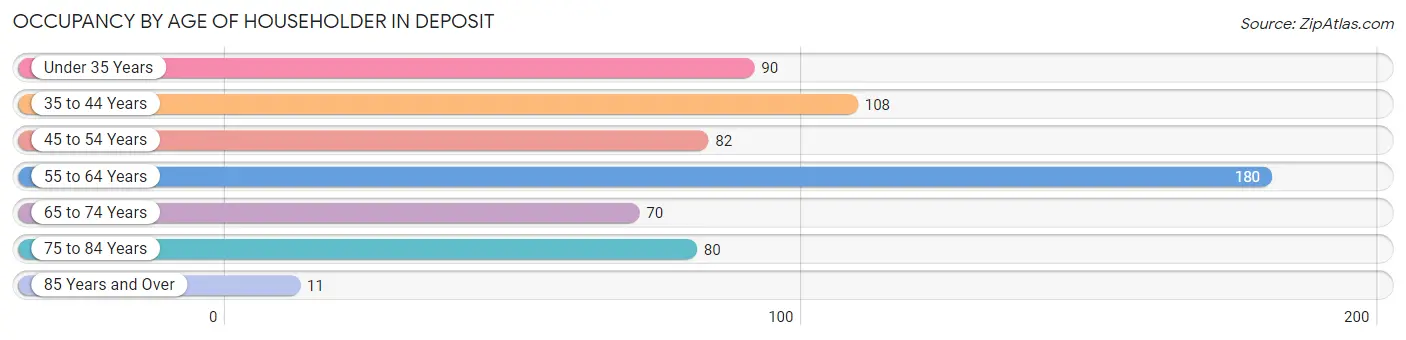
| Age Bracket | # Households | % Households |
| Under 35 Years | 90 | 14.5% |
| 35 to 44 Years | 108 | 17.4% |
| 45 to 54 Years | 82 | 13.2% |
| 55 to 64 Years | 180 | 29.0% |
| 65 to 74 Years | 70 | 11.3% |
| 75 to 84 Years | 80 | 12.9% |
| 85 Years and Over | 11 | 1.8% |
| Total | 621 | 100.0% |
Housing Finances in Deposit
Median Income by Occupancy in Deposit
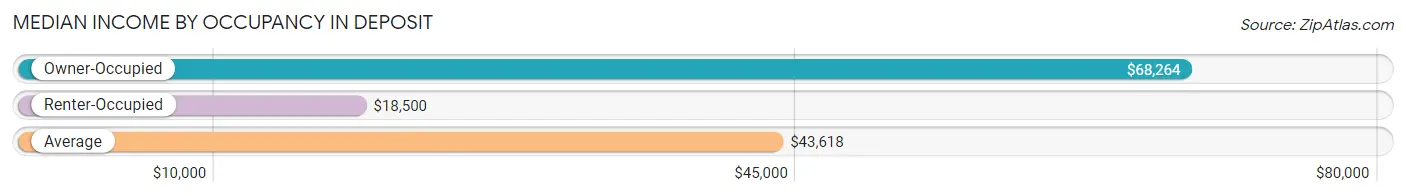
| Occupancy Type | # Households | Median Income |
| Owner-Occupied | 443 (71.3%) | $68,264 |
| Renter-Occupied | 178 (28.7%) | $18,500 |
| Average | 621 (100.0%) | $43,618 |
Occupancy by Householder Income Bracket in Deposit
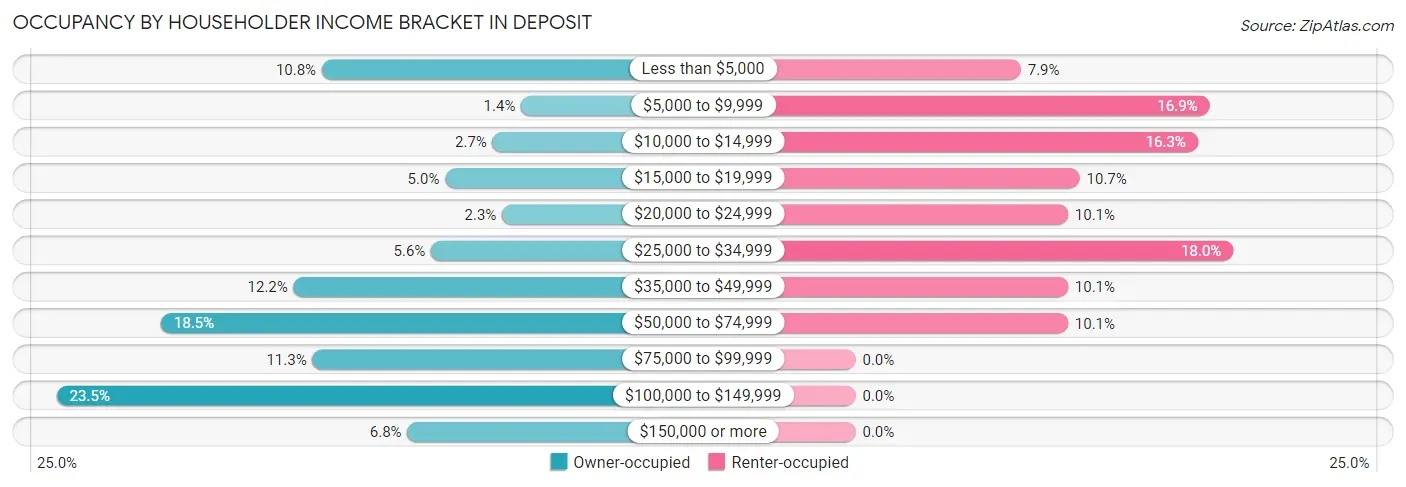
| Income Bracket | Owner-occupied | Renter-occupied |
| Less than $5,000 | 48 (10.8%) | 14 (7.9%) |
| $5,000 to $9,999 | 6 (1.3%) | 30 (16.9%) |
| $10,000 to $14,999 | 12 (2.7%) | 29 (16.3%) |
| $15,000 to $19,999 | 22 (5.0%) | 19 (10.7%) |
| $20,000 to $24,999 | 10 (2.3%) | 18 (10.1%) |
| $25,000 to $34,999 | 25 (5.6%) | 32 (18.0%) |
| $35,000 to $49,999 | 54 (12.2%) | 18 (10.1%) |
| $50,000 to $74,999 | 82 (18.5%) | 18 (10.1%) |
| $75,000 to $99,999 | 50 (11.3%) | 0 (0.0%) |
| $100,000 to $149,999 | 104 (23.5%) | 0 (0.0%) |
| $150,000 or more | 30 (6.8%) | 0 (0.0%) |
| Total | 443 (100.0%) | 178 (100.0%) |
Monthly Housing Cost Tiers in Deposit
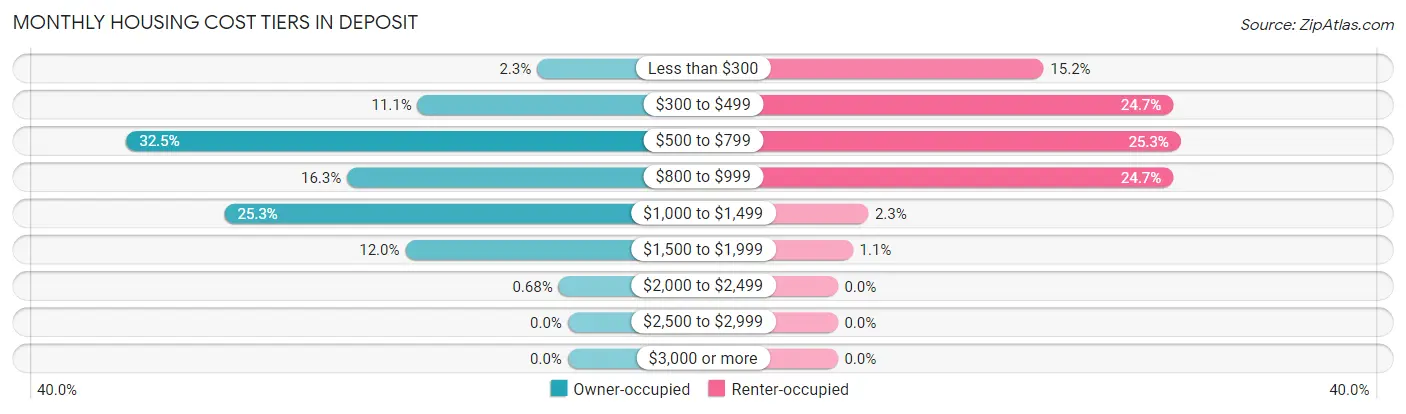
| Monthly Cost | Owner-occupied | Renter-occupied |
| Less than $300 | 10 (2.3%) | 27 (15.2%) |
| $300 to $499 | 49 (11.1%) | 44 (24.7%) |
| $500 to $799 | 144 (32.5%) | 45 (25.3%) |
| $800 to $999 | 72 (16.3%) | 44 (24.7%) |
| $1,000 to $1,499 | 112 (25.3%) | 4 (2.2%) |
| $1,500 to $1,999 | 53 (12.0%) | 2 (1.1%) |
| $2,000 to $2,499 | 3 (0.7%) | 0 (0.0%) |
| $2,500 to $2,999 | 0 (0.0%) | 0 (0.0%) |
| $3,000 or more | 0 (0.0%) | 0 (0.0%) |
| Total | 443 (100.0%) | 178 (100.0%) |
Physical Housing Characteristics in Deposit
Housing Structures in Deposit
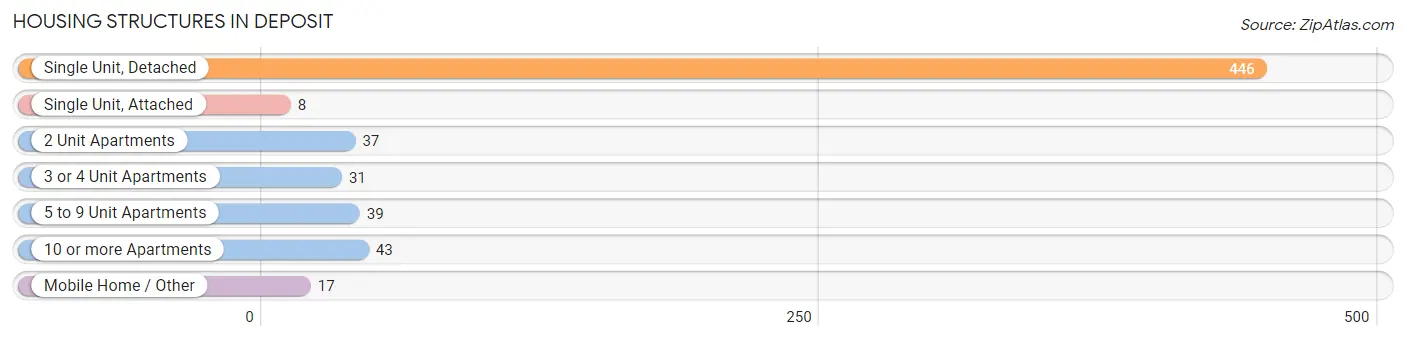
| Structure Type | # Housing Units | % Housing Units |
| Single Unit, Detached | 446 | 71.8% |
| Single Unit, Attached | 8 | 1.3% |
| 2 Unit Apartments | 37 | 6.0% |
| 3 or 4 Unit Apartments | 31 | 5.0% |
| 5 to 9 Unit Apartments | 39 | 6.3% |
| 10 or more Apartments | 43 | 6.9% |
| Mobile Home / Other | 17 | 2.7% |
| Total | 621 | 100.0% |
Housing Structures by Occupancy in Deposit
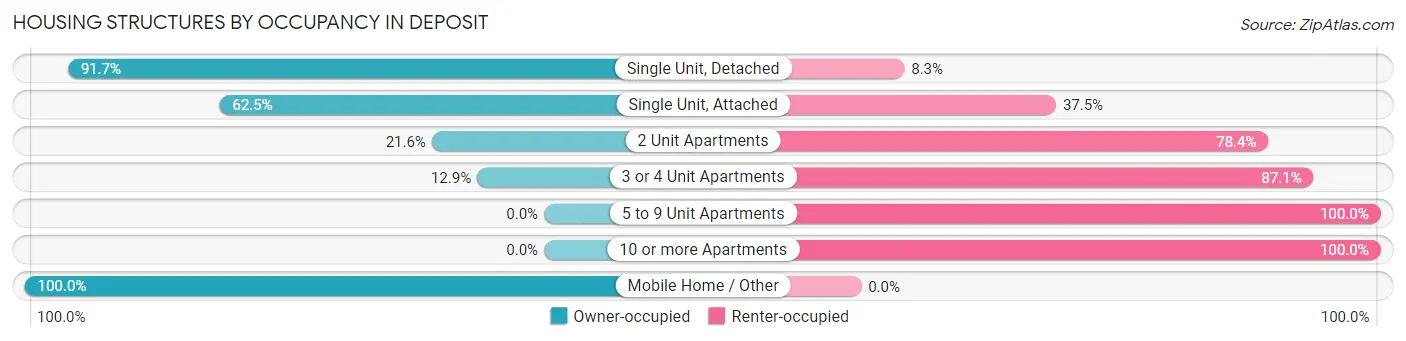
| Structure Type | Owner-occupied | Renter-occupied |
| Single Unit, Detached | 409 (91.7%) | 37 (8.3%) |
| Single Unit, Attached | 5 (62.5%) | 3 (37.5%) |
| 2 Unit Apartments | 8 (21.6%) | 29 (78.4%) |
| 3 or 4 Unit Apartments | 4 (12.9%) | 27 (87.1%) |
| 5 to 9 Unit Apartments | 0 (0.0%) | 39 (100.0%) |
| 10 or more Apartments | 0 (0.0%) | 43 (100.0%) |
| Mobile Home / Other | 17 (100.0%) | 0 (0.0%) |
| Total | 443 (71.3%) | 178 (28.7%) |
Housing Structures by Number of Rooms in Deposit
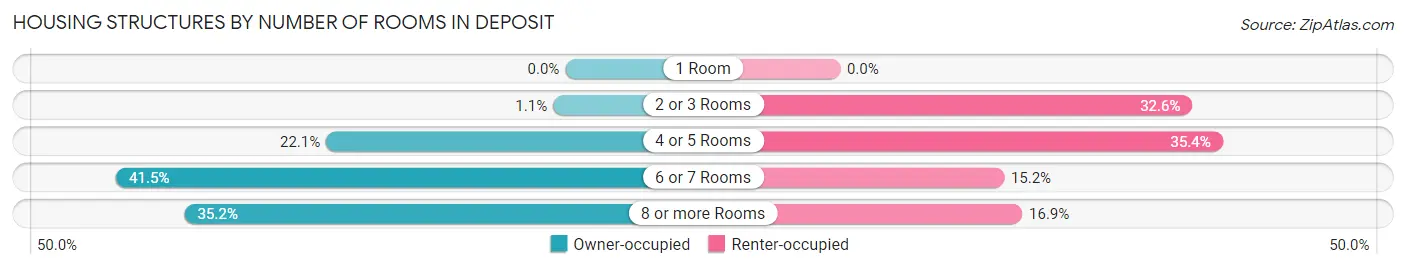
| Number of Rooms | Owner-occupied | Renter-occupied |
| 1 Room | 0 (0.0%) | 0 (0.0%) |
| 2 or 3 Rooms | 5 (1.1%) | 58 (32.6%) |
| 4 or 5 Rooms | 98 (22.1%) | 63 (35.4%) |
| 6 or 7 Rooms | 184 (41.5%) | 27 (15.2%) |
| 8 or more Rooms | 156 (35.2%) | 30 (16.9%) |
| Total | 443 (100.0%) | 178 (100.0%) |
Housing Structure by Heating Type in Deposit
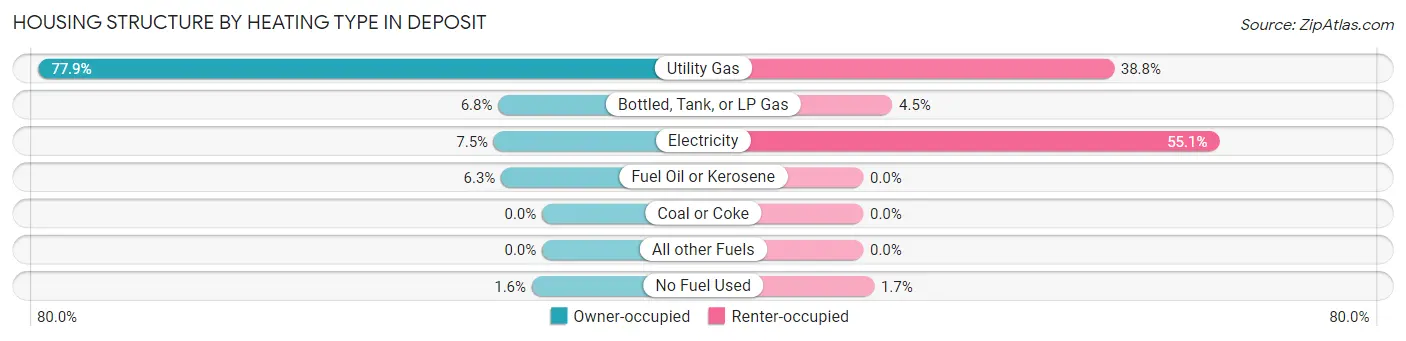
| Heating Type | Owner-occupied | Renter-occupied |
| Utility Gas | 345 (77.9%) | 69 (38.8%) |
| Bottled, Tank, or LP Gas | 30 (6.8%) | 8 (4.5%) |
| Electricity | 33 (7.4%) | 98 (55.1%) |
| Fuel Oil or Kerosene | 28 (6.3%) | 0 (0.0%) |
| Coal or Coke | 0 (0.0%) | 0 (0.0%) |
| All other Fuels | 0 (0.0%) | 0 (0.0%) |
| No Fuel Used | 7 (1.6%) | 3 (1.7%) |
| Total | 443 (100.0%) | 178 (100.0%) |
Household Vehicle Usage in Deposit
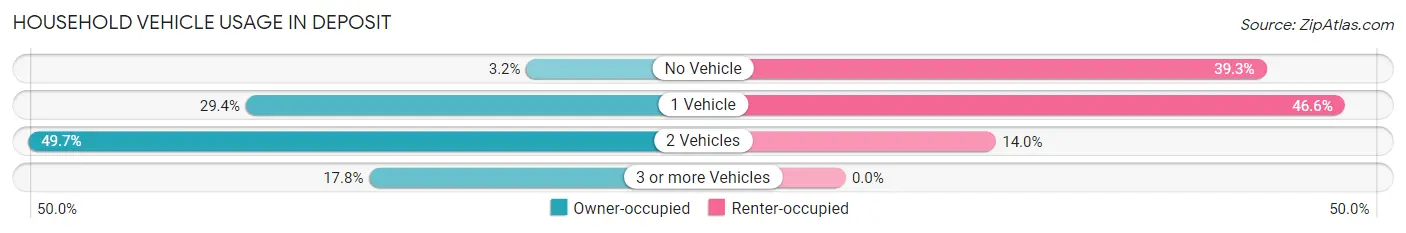
| Vehicles per Household | Owner-occupied | Renter-occupied |
| No Vehicle | 14 (3.2%) | 70 (39.3%) |
| 1 Vehicle | 130 (29.3%) | 83 (46.6%) |
| 2 Vehicles | 220 (49.7%) | 25 (14.0%) |
| 3 or more Vehicles | 79 (17.8%) | 0 (0.0%) |
| Total | 443 (100.0%) | 178 (100.0%) |
Real Estate & Mortgages in Deposit
Real Estate and Mortgage Overview in Deposit
| Characteristic | Without Mortgage | With Mortgage |
| Housing Units | 222 | 221 |
| Median Property Value | $85,000 | $120,700 |
| Median Household Income | $38,500 | $8 |
| Monthly Housing Costs | $622 | $0 |
| Real Estate Taxes | $2,667 | $3 |
Property Value by Mortgage Status in Deposit
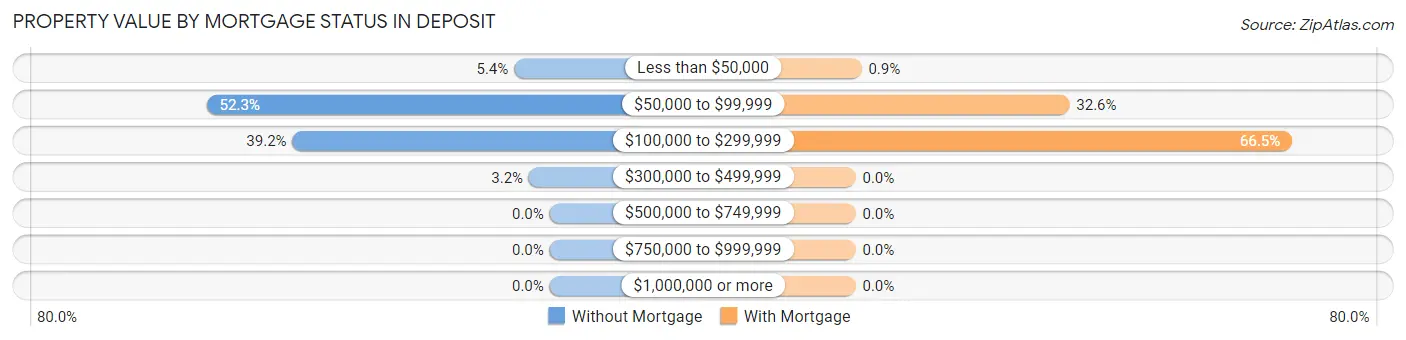
| Property Value | Without Mortgage | With Mortgage |
| Less than $50,000 | 12 (5.4%) | 2 (0.9%) |
| $50,000 to $99,999 | 116 (52.2%) | 72 (32.6%) |
| $100,000 to $299,999 | 87 (39.2%) | 147 (66.5%) |
| $300,000 to $499,999 | 7 (3.2%) | 0 (0.0%) |
| $500,000 to $749,999 | 0 (0.0%) | 0 (0.0%) |
| $750,000 to $999,999 | 0 (0.0%) | 0 (0.0%) |
| $1,000,000 or more | 0 (0.0%) | 0 (0.0%) |
| Total | 222 (100.0%) | 221 (100.0%) |
Household Income by Mortgage Status in Deposit
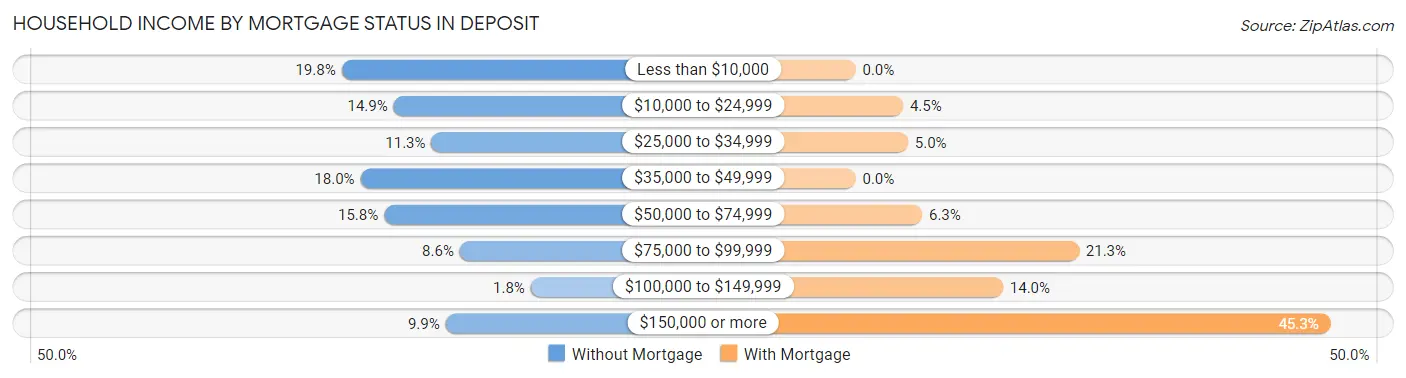
| Household Income | Without Mortgage | With Mortgage |
| Less than $10,000 | 44 (19.8%) | 0 (0.0%) |
| $10,000 to $24,999 | 33 (14.9%) | 10 (4.5%) |
| $25,000 to $34,999 | 25 (11.3%) | 11 (5.0%) |
| $35,000 to $49,999 | 40 (18.0%) | 0 (0.0%) |
| $50,000 to $74,999 | 35 (15.8%) | 14 (6.3%) |
| $75,000 to $99,999 | 19 (8.6%) | 47 (21.3%) |
| $100,000 to $149,999 | 4 (1.8%) | 31 (14.0%) |
| $150,000 or more | 22 (9.9%) | 100 (45.3%) |
| Total | 222 (100.0%) | 221 (100.0%) |
Property Value to Household Income Ratio in Deposit
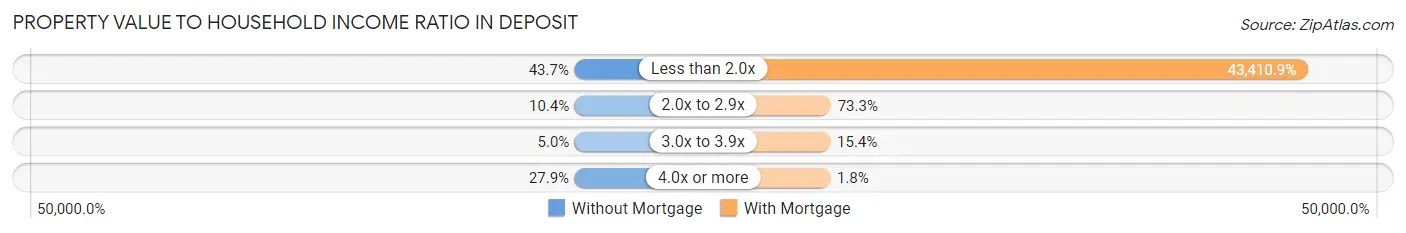
| Value-to-Income Ratio | Without Mortgage | With Mortgage |
| Less than 2.0x | 97 (43.7%) | 95,938 (43,410.9%) |
| 2.0x to 2.9x | 23 (10.4%) | 162 (73.3%) |
| 3.0x to 3.9x | 11 (5.0%) | 34 (15.4%) |
| 4.0x or more | 62 (27.9%) | 4 (1.8%) |
| Total | 222 (100.0%) | 221 (100.0%) |
Real Estate Taxes by Mortgage Status in Deposit
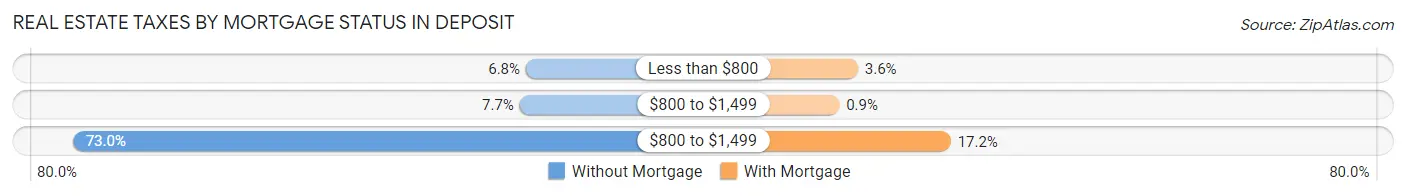
| Property Taxes | Without Mortgage | With Mortgage |
| Less than $800 | 15 (6.8%) | 8 (3.6%) |
| $800 to $1,499 | 17 (7.7%) | 2 (0.9%) |
| $800 to $1,499 | 162 (73.0%) | 38 (17.2%) |
| Total | 222 (100.0%) | 221 (100.0%) |
Health & Disability in Deposit
Health Insurance Coverage by Age in Deposit
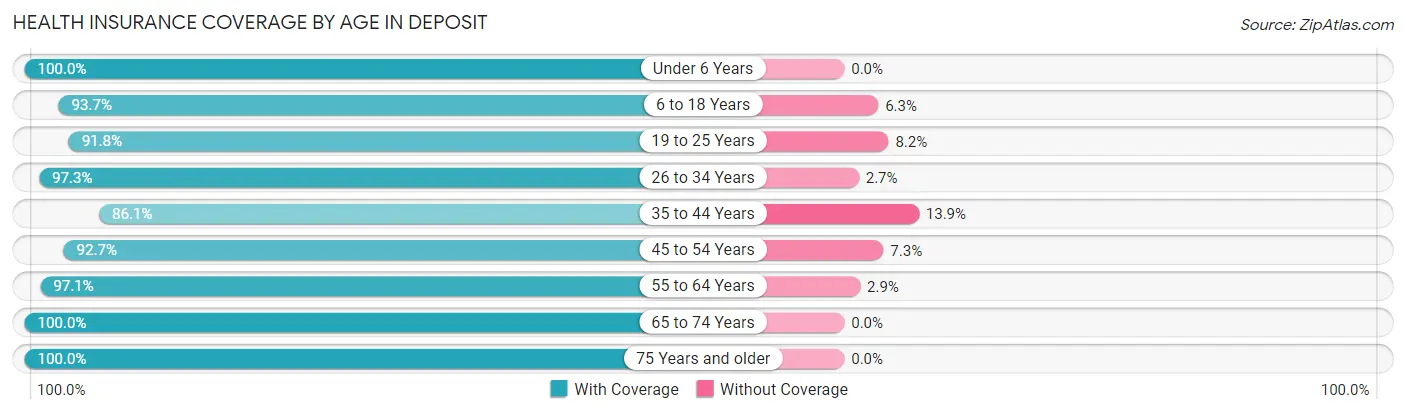
| Age Bracket | With Coverage | Without Coverage |
| Under 6 Years | 88 (100.0%) | 0 (0.0%) |
| 6 to 18 Years | 207 (93.7%) | 14 (6.3%) |
| 19 to 25 Years | 78 (91.8%) | 7 (8.2%) |
| 26 to 34 Years | 144 (97.3%) | 4 (2.7%) |
| 35 to 44 Years | 161 (86.1%) | 26 (13.9%) |
| 45 to 54 Years | 178 (92.7%) | 14 (7.3%) |
| 55 to 64 Years | 231 (97.1%) | 7 (2.9%) |
| 65 to 74 Years | 109 (100.0%) | 0 (0.0%) |
| 75 Years and older | 135 (100.0%) | 0 (0.0%) |
| Total | 1,331 (94.9%) | 72 (5.1%) |
Health Insurance Coverage by Citizenship Status in Deposit
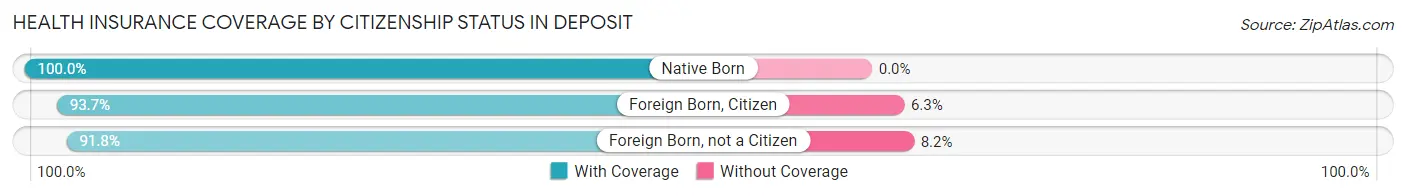
| Citizenship Status | With Coverage | Without Coverage |
| Native Born | 88 (100.0%) | 0 (0.0%) |
| Foreign Born, Citizen | 207 (93.7%) | 14 (6.3%) |
| Foreign Born, not a Citizen | 78 (91.8%) | 7 (8.2%) |
Health Insurance Coverage by Household Income in Deposit
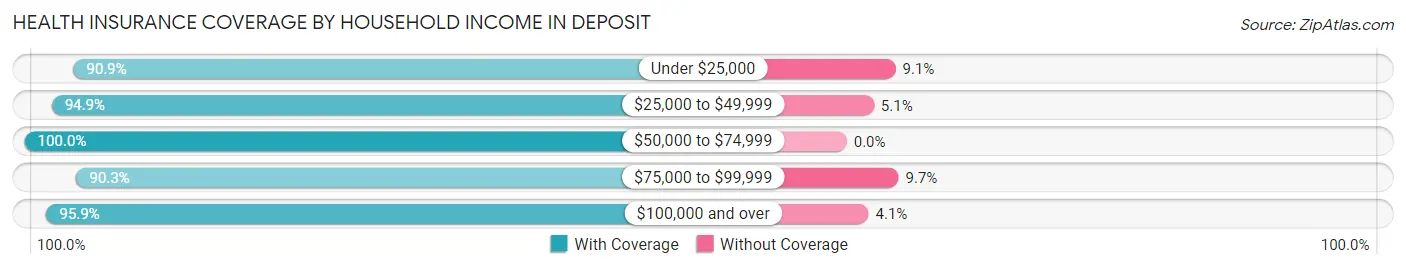
| Household Income | With Coverage | Without Coverage |
| Under $25,000 | 318 (90.9%) | 32 (9.1%) |
| $25,000 to $49,999 | 280 (94.9%) | 15 (5.1%) |
| $50,000 to $74,999 | 288 (100.0%) | 0 (0.0%) |
| $75,000 to $99,999 | 93 (90.3%) | 10 (9.7%) |
| $100,000 and over | 352 (95.9%) | 15 (4.1%) |
Public vs Private Health Insurance Coverage by Age in Deposit
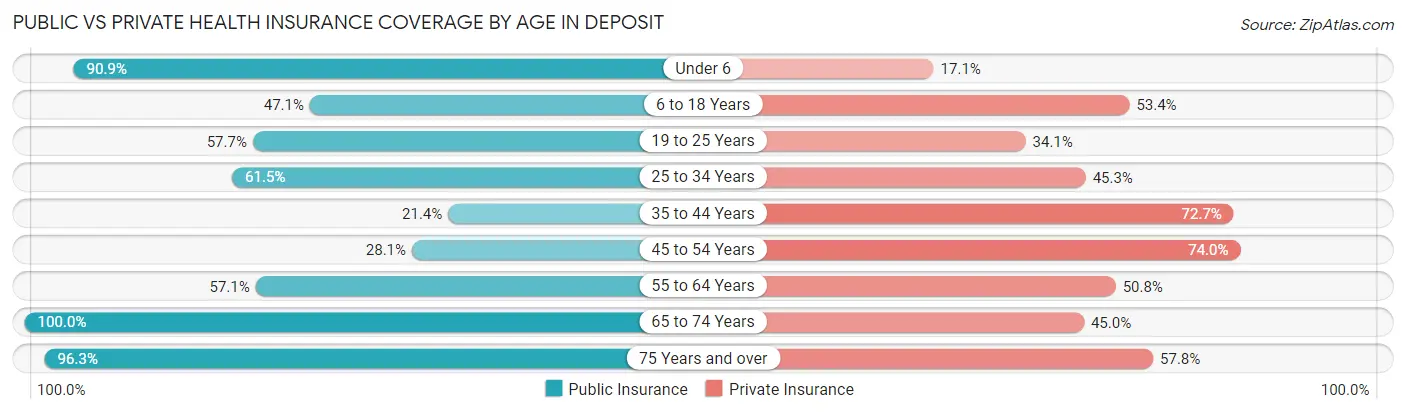
| Age Bracket | Public Insurance | Private Insurance |
| Under 6 | 80 (90.9%) | 15 (17.1%) |
| 6 to 18 Years | 104 (47.1%) | 118 (53.4%) |
| 19 to 25 Years | 49 (57.7%) | 29 (34.1%) |
| 25 to 34 Years | 91 (61.5%) | 67 (45.3%) |
| 35 to 44 Years | 40 (21.4%) | 136 (72.7%) |
| 45 to 54 Years | 54 (28.1%) | 142 (74.0%) |
| 55 to 64 Years | 136 (57.1%) | 121 (50.8%) |
| 65 to 74 Years | 109 (100.0%) | 49 (45.0%) |
| 75 Years and over | 130 (96.3%) | 78 (57.8%) |
| Total | 793 (56.5%) | 755 (53.8%) |
Disability Status by Sex by Age in Deposit
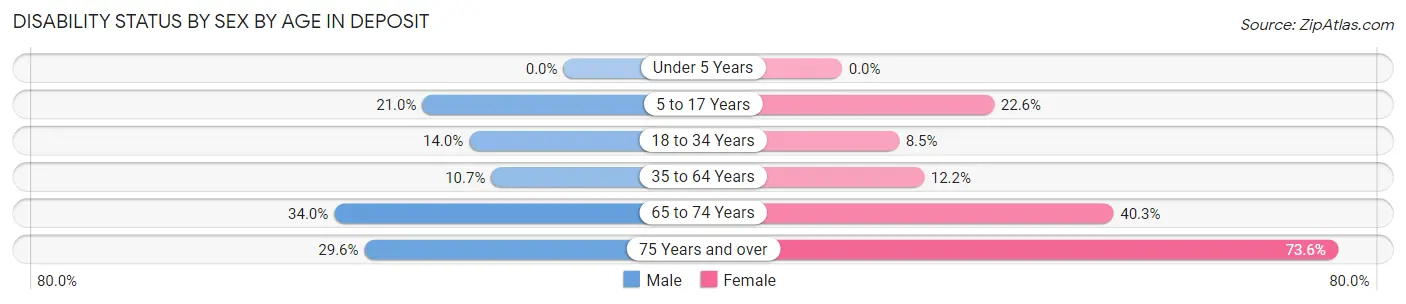
| Age Bracket | Male | Female |
| Under 5 Years | 0 (0.0%) | 0 (0.0%) |
| 5 to 17 Years | 22 (20.9%) | 28 (22.6%) |
| 18 to 34 Years | 14 (14.0%) | 12 (8.5%) |
| 35 to 64 Years | 30 (10.7%) | 41 (12.2%) |
| 65 to 74 Years | 16 (34.0%) | 25 (40.3%) |
| 75 Years and over | 13 (29.5%) | 67 (73.6%) |
Disability Class by Sex by Age in Deposit
Disability Class: Hearing Difficulty
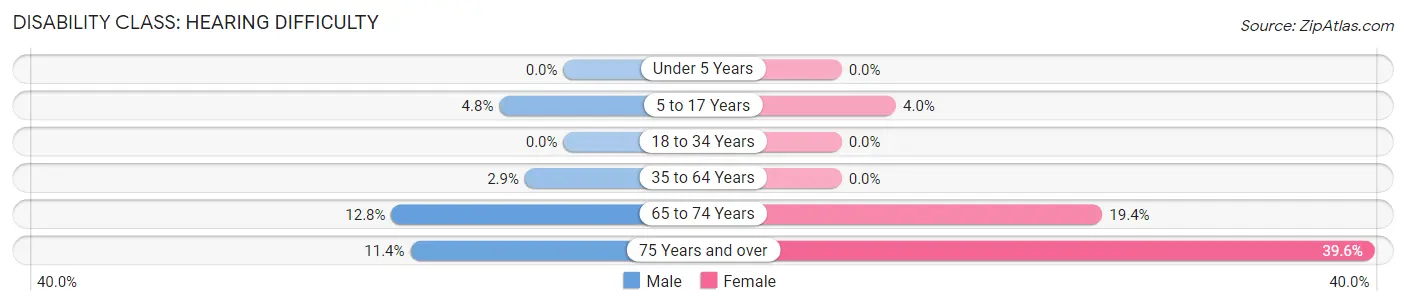
| Age Bracket | Male | Female |
| Under 5 Years | 0 (0.0%) | 0 (0.0%) |
| 5 to 17 Years | 5 (4.8%) | 5 (4.0%) |
| 18 to 34 Years | 0 (0.0%) | 0 (0.0%) |
| 35 to 64 Years | 8 (2.9%) | 0 (0.0%) |
| 65 to 74 Years | 6 (12.8%) | 12 (19.4%) |
| 75 Years and over | 5 (11.4%) | 36 (39.6%) |
Disability Class: Vision Difficulty
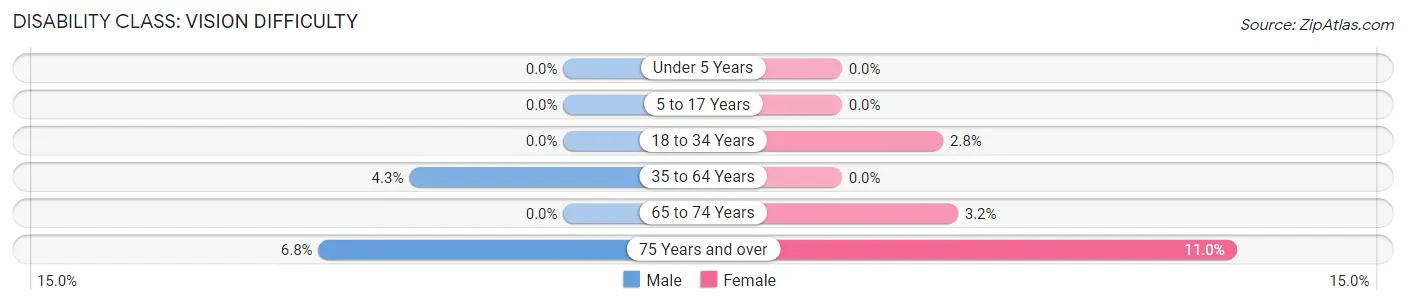
| Age Bracket | Male | Female |
| Under 5 Years | 0 (0.0%) | 0 (0.0%) |
| 5 to 17 Years | 0 (0.0%) | 0 (0.0%) |
| 18 to 34 Years | 0 (0.0%) | 4 (2.8%) |
| 35 to 64 Years | 12 (4.3%) | 0 (0.0%) |
| 65 to 74 Years | 0 (0.0%) | 2 (3.2%) |
| 75 Years and over | 3 (6.8%) | 10 (11.0%) |
Disability Class: Cognitive Difficulty
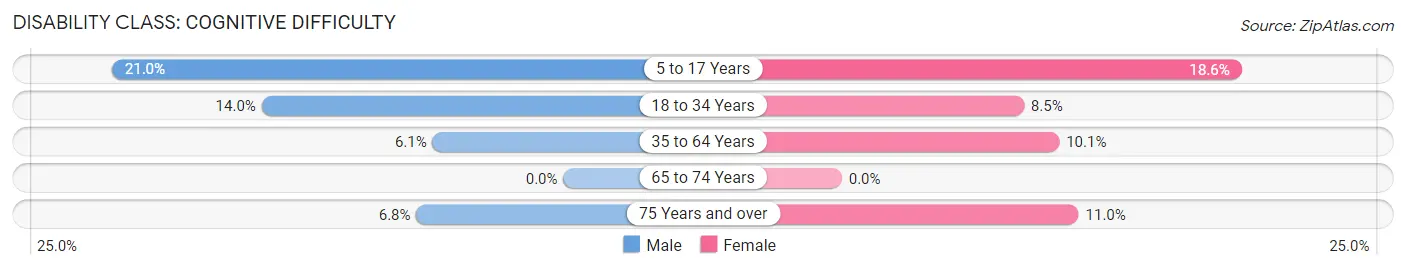
| Age Bracket | Male | Female |
| 5 to 17 Years | 22 (20.9%) | 23 (18.5%) |
| 18 to 34 Years | 14 (14.0%) | 12 (8.5%) |
| 35 to 64 Years | 17 (6.1%) | 34 (10.1%) |
| 65 to 74 Years | 0 (0.0%) | 0 (0.0%) |
| 75 Years and over | 3 (6.8%) | 10 (11.0%) |
Disability Class: Ambulatory Difficulty
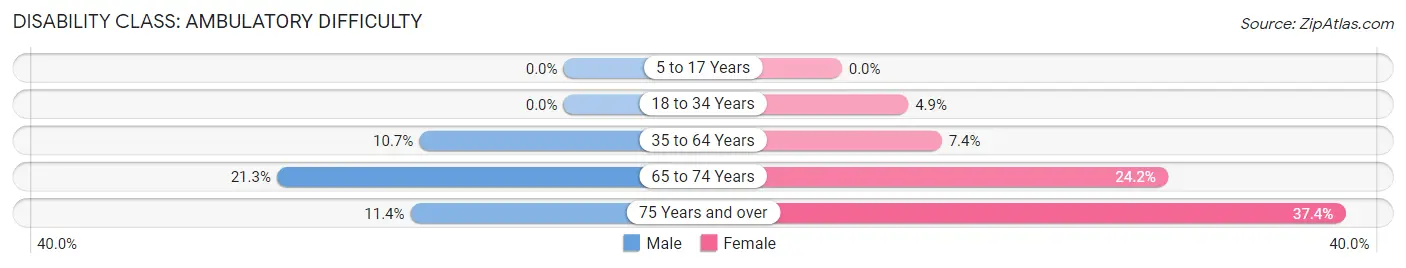
| Age Bracket | Male | Female |
| 5 to 17 Years | 0 (0.0%) | 0 (0.0%) |
| 18 to 34 Years | 0 (0.0%) | 7 (4.9%) |
| 35 to 64 Years | 30 (10.7%) | 25 (7.4%) |
| 65 to 74 Years | 10 (21.3%) | 15 (24.2%) |
| 75 Years and over | 5 (11.4%) | 34 (37.4%) |
Disability Class: Self-Care Difficulty
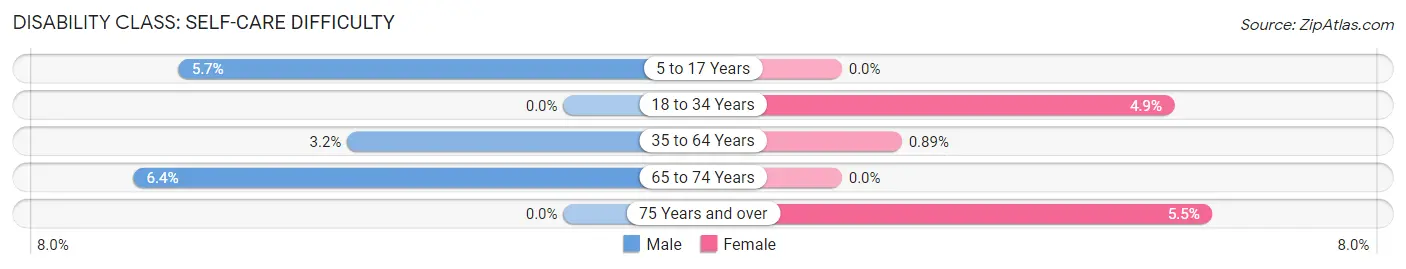
| Age Bracket | Male | Female |
| 5 to 17 Years | 6 (5.7%) | 0 (0.0%) |
| 18 to 34 Years | 0 (0.0%) | 7 (4.9%) |
| 35 to 64 Years | 9 (3.2%) | 3 (0.9%) |
| 65 to 74 Years | 3 (6.4%) | 0 (0.0%) |
| 75 Years and over | 0 (0.0%) | 5 (5.5%) |
Technology Access in Deposit
Computing Device Access in Deposit
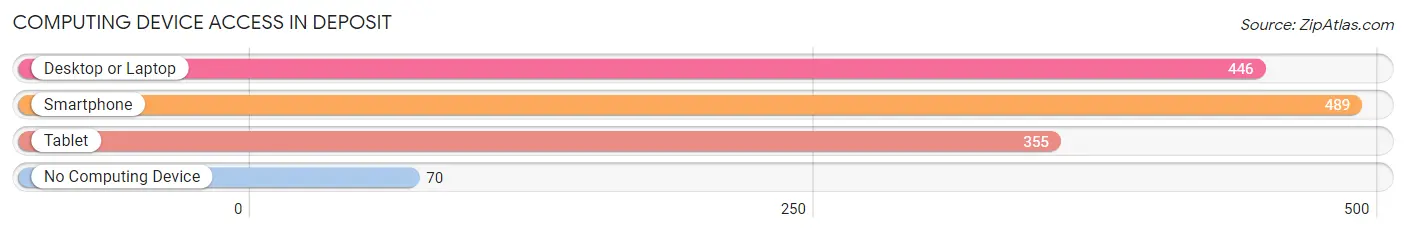
| Device Type | # Households | % Households |
| Desktop or Laptop | 446 | 71.8% |
| Smartphone | 489 | 78.7% |
| Tablet | 355 | 57.2% |
| No Computing Device | 70 | 11.3% |
| Total | 621 | 100.0% |
Internet Access in Deposit
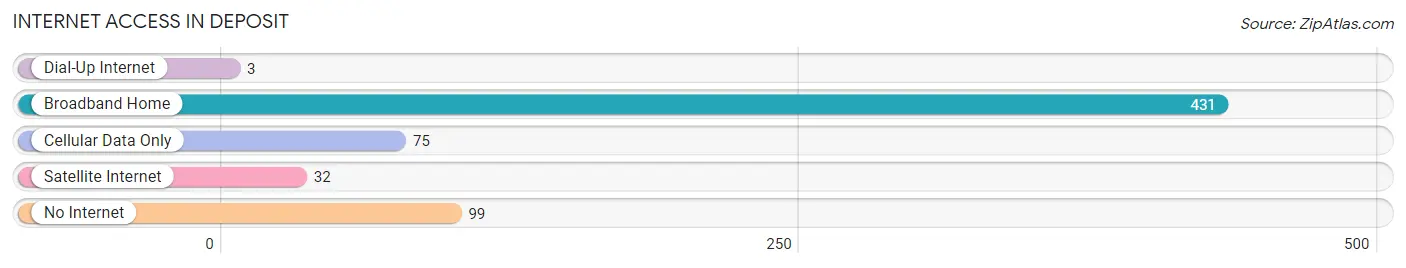
| Internet Type | # Households | % Households |
| Dial-Up Internet | 3 | 0.5% |
| Broadband Home | 431 | 69.4% |
| Cellular Data Only | 75 | 12.1% |
| Satellite Internet | 32 | 5.1% |
| No Internet | 99 | 15.9% |
| Total | 621 | 100.0% |
Deposit Summary
Deposit is a small town located in the western part of New York State, in the Catskill Mountains region. It is situated in the Delaware County, and is part of the Binghamton Metropolitan Statistical Area. The town was founded in 1797 and was named after the deposits of coal and iron ore found in the area. As of the 2010 census, the population of Deposit was 1,477.
Geography
Deposit is located at 42°7'25" North, 75°25'25" West (42.123611, -75.423889). It is situated in the western part of New York State, in the Catskill Mountains region. The town is bordered by the towns of Sanford to the north, Masonville to the east, Hancock to the south, and Colchester to the west. The town covers a total area of 24.2 square miles, of which 24.1 square miles is land and 0.1 square miles is water.
The terrain of Deposit is mostly hilly, with some flat areas in the valleys. The highest point in the town is located at an elevation of 1,890 feet, while the lowest point is at an elevation of 1,400 feet. The town is drained by the East Branch of the Delaware River, which flows through the town from north to south.
Climate
Deposit has a humid continental climate, with cold, snowy winters and warm, humid summers. The average annual temperature is around 45°F, with January being the coldest month and July being the warmest. The average annual precipitation is around 40 inches, with the wettest month being July and the driest month being February.
Demographics
As of the 2010 census, there were 1,477 people, 602 households, and 431 families residing in the town. The population density was 61.2 people per square mile. The racial makeup of the town was 97.2% White, 0.7% African American, 0.2% Native American, 0.2% Asian, 0.1% from other races, and 1.6% from two or more races. Hispanic or Latino of any race were 1.2% of the population.
The median age in the town was 44.2 years, with 24.2% of the population under the age of 18, 6.2% between 18 and 24, 24.2% between 25 and 44, 28.2% between 45 and 64, and 17.2% 65 years of age or older. The median household income was $41,964, and the median family income was $50,000.
Economy
The economy of Deposit is largely based on agriculture and tourism. The town is home to several farms, which produce a variety of crops, including corn, soybeans, hay, and apples. The town is also home to several tourist attractions, including the Deposit Historical Society Museum, the Deposit Historical Park, and the Deposit Railroad Museum.
The town is also home to several small businesses, including restaurants, retail stores, and service providers. The town is served by the Deposit Central School District, which provides educational services to the town's students.
Conclusion
Deposit is a small town located in the western part of New York State, in the Catskill Mountains region. It is situated in the Delaware County, and is part of the Binghamton Metropolitan Statistical Area. The town was founded in 1797 and was named after the deposits of coal and iron ore found in the area. As of the 2010 census, the population of Deposit was 1,477. The town has a humid continental climate, with cold, snowy winters and warm, humid summers. The economy of Deposit is largely based on agriculture and tourism. The town is home to several farms, which produce a variety of crops, as well as several tourist attractions. The town is also home to several small businesses, including restaurants, retail stores, and service providers.
Common Questions
What is Per Capita Income in Deposit?
Per Capita income in Deposit is $27,030.
What is the Median Family Income in Deposit?
Median Family Income in Deposit is $60,625.
What is the Median Household income in Deposit?
Median Household Income in Deposit is $43,618.
What is Income or Wage Gap in Deposit?
Income or Wage Gap in Deposit is 30.4%.
Women in Deposit earn 69.6 cents for every dollar earned by a man.
What is Inequality or Gini Index in Deposit?
Inequality or Gini Index in Deposit is 0.50.
What is the Total Population of Deposit?
Total Population of Deposit is 1,403.
What is the Total Male Population of Deposit?
Total Male Population of Deposit is 606.
What is the Total Female Population of Deposit?
Total Female Population of Deposit is 797.
What is the Ratio of Males per 100 Females in Deposit?
There are 76.04 Males per 100 Females in Deposit.
What is the Ratio of Females per 100 Males in Deposit?
There are 131.52 Females per 100 Males in Deposit.
What is the Median Population Age in Deposit?
Median Population Age in Deposit is 42.0 Years.
What is the Average Family Size in Deposit
Average Family Size in Deposit is 2.6 People.
What is the Average Household Size in Deposit
Average Household Size in Deposit is 2.3 People.
How Large is the Labor Force in Deposit?
There are 588 People in the Labor Forcein in Deposit.
What is the Percentage of People in the Labor Force in Deposit?
51.5% of People are in the Labor Force in Deposit.
What is the Unemployment Rate in Deposit?
Unemployment Rate in Deposit is 1.7%.