Richburg, NY Map & Demographics
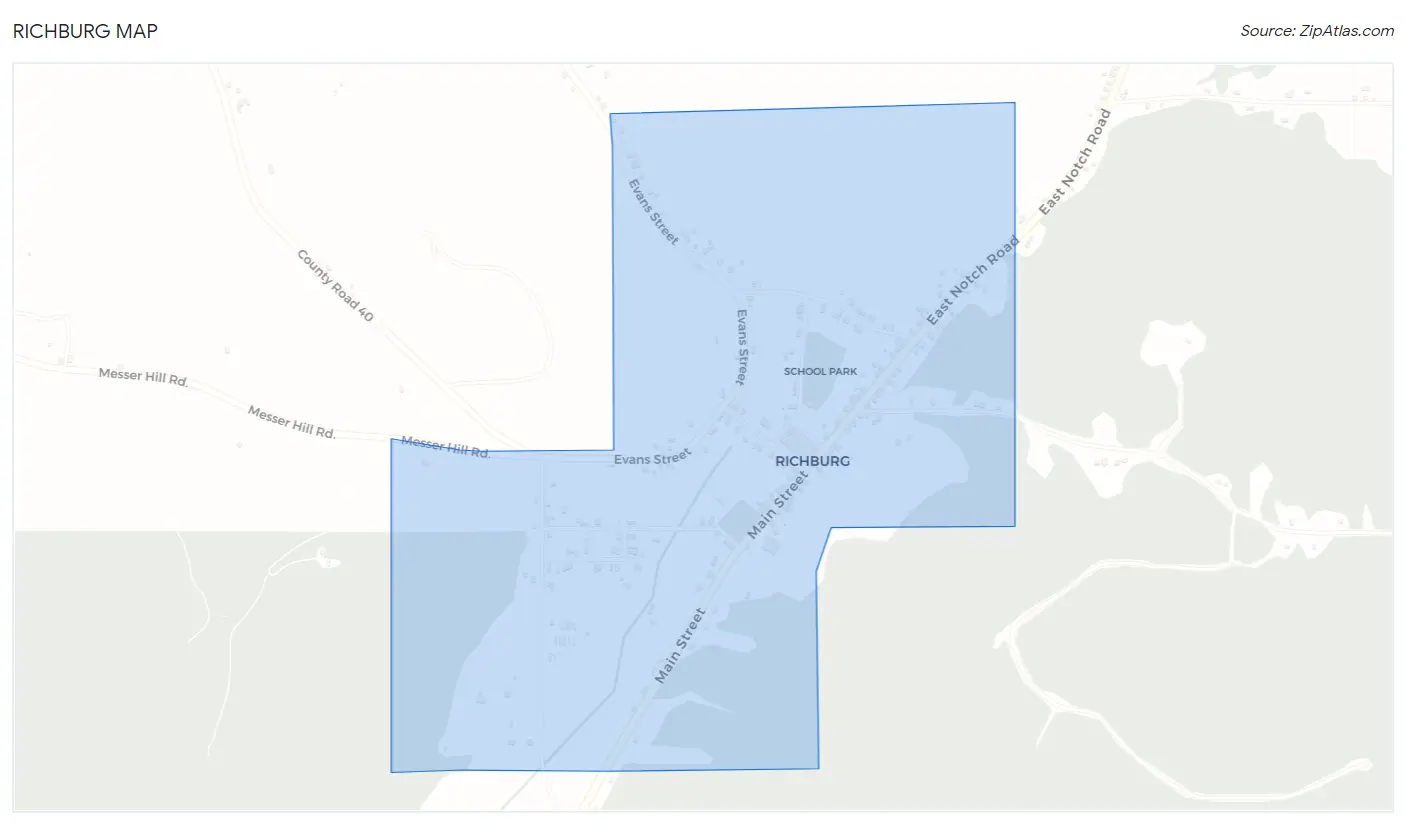
Richburg Map
Richburg Overview
$22,040
PER CAPITA INCOME
$38,750
AVG FAMILY INCOME
$38,594
AVG HOUSEHOLD INCOME
28.9%
WAGE / INCOME GAP [ % ]
71.1¢/ $1
WAGE / INCOME GAP [ $ ]
0.46
INEQUALITY / GINI INDEX
573
TOTAL POPULATION
276
MALE POPULATION
297
FEMALE POPULATION
92.93
MALES / 100 FEMALES
107.61
FEMALES / 100 MALES
40.9
MEDIAN AGE
3.1
AVG FAMILY SIZE
3.4
AVG HOUSEHOLD SIZE
237
LABOR FORCE [ PEOPLE ]
55.0%
PERCENT IN LABOR FORCE
4.2%
UNEMPLOYMENT RATE
Richburg Zip Codes
Income in Richburg
Income Overview in Richburg
Per Capita Income in Richburg is $22,040, while median incomes of families and households are $38,750 and $38,594 respectively.
| Characteristic | Number | Measure |
| Per Capita Income | 573 | $22,040 |
| Median Family Income | 117 | $38,750 |
| Mean Family Income | 117 | $69,569 |
| Median Household Income | 169 | $38,594 |
| Mean Household Income | 169 | $65,394 |
| Income Deficit | 117 | $0 |
| Wage / Income Gap (%) | 573 | 28.89% |
| Wage / Income Gap ($) | 573 | 71.11¢ per $1 |
| Gini / Inequality Index | 573 | 0.46 |
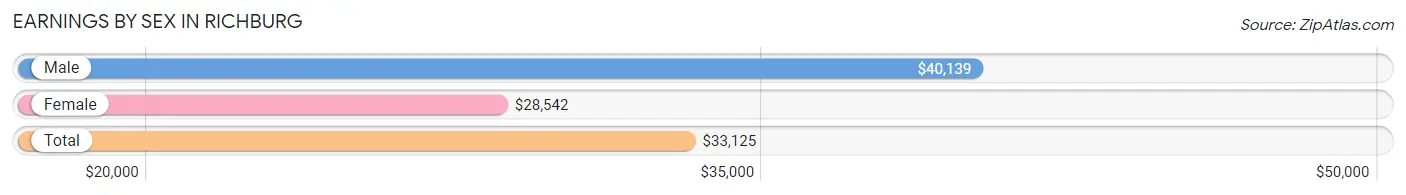
Earnings by Sex in Richburg
Average Earnings in Richburg are $33,125, $40,139 for men and $28,542 for women, a difference of 28.9%.
| Sex | Number | Average Earnings |
| Male | 117 (50.0%) | $40,139 |
| Female | 117 (50.0%) | $28,542 |
| Total | 234 (100.0%) | $33,125 |
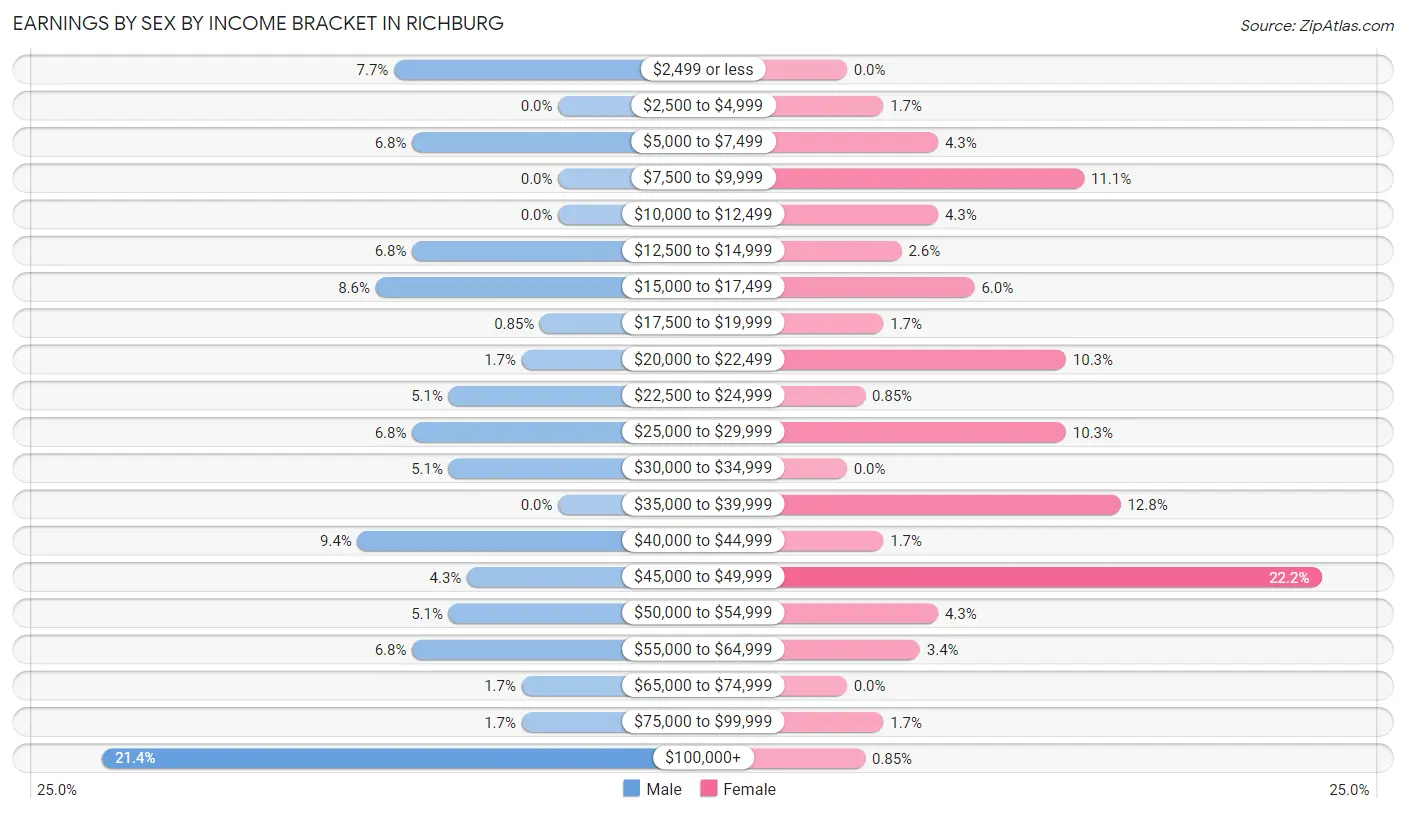
Earnings by Sex by Income Bracket in Richburg
The most common earnings brackets in Richburg are $100,000+ for men (25 | 21.4%) and $45,000 to $49,999 for women (26 | 22.2%).
| Income | Male | Female |
| $2,499 or less | 9 (7.7%) | 0 (0.0%) |
| $2,500 to $4,999 | 0 (0.0%) | 2 (1.7%) |
| $5,000 to $7,499 | 8 (6.8%) | 5 (4.3%) |
| $7,500 to $9,999 | 0 (0.0%) | 13 (11.1%) |
| $10,000 to $12,499 | 0 (0.0%) | 5 (4.3%) |
| $12,500 to $14,999 | 8 (6.8%) | 3 (2.6%) |
| $15,000 to $17,499 | 10 (8.6%) | 7 (6.0%) |
| $17,500 to $19,999 | 1 (0.9%) | 2 (1.7%) |
| $20,000 to $22,499 | 2 (1.7%) | 12 (10.3%) |
| $22,500 to $24,999 | 6 (5.1%) | 1 (0.9%) |
| $25,000 to $29,999 | 8 (6.8%) | 12 (10.3%) |
| $30,000 to $34,999 | 6 (5.1%) | 0 (0.0%) |
| $35,000 to $39,999 | 0 (0.0%) | 15 (12.8%) |
| $40,000 to $44,999 | 11 (9.4%) | 2 (1.7%) |
| $45,000 to $49,999 | 5 (4.3%) | 26 (22.2%) |
| $50,000 to $54,999 | 6 (5.1%) | 5 (4.3%) |
| $55,000 to $64,999 | 8 (6.8%) | 4 (3.4%) |
| $65,000 to $74,999 | 2 (1.7%) | 0 (0.0%) |
| $75,000 to $99,999 | 2 (1.7%) | 2 (1.7%) |
| $100,000+ | 25 (21.4%) | 1 (0.9%) |
| Total | 117 (100.0%) | 117 (100.0%) |
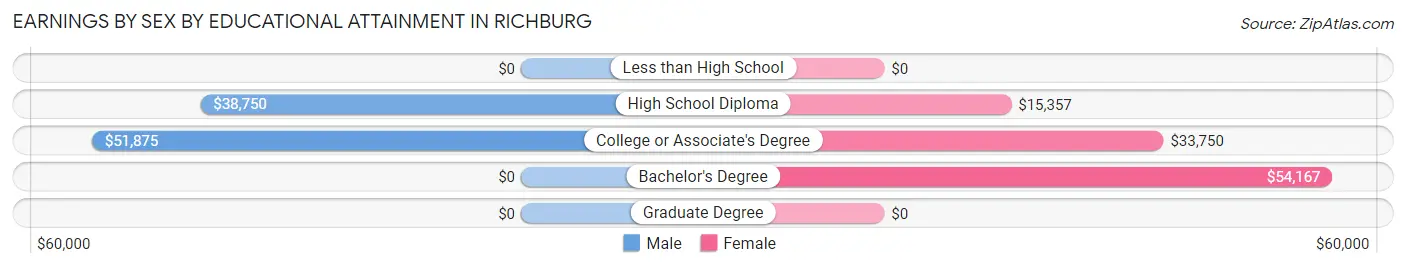
Earnings by Sex by Educational Attainment in Richburg
Average earnings in Richburg are $48,438 for men and $37,500 for women, a difference of 22.6%. Men with an educational attainment of college or associate's degree enjoy the highest average annual earnings of $51,875, while those with high school diploma education earn the least with $38,750. Women with an educational attainment of bachelor's degree earn the most with the average annual earnings of $54,167, while those with high school diploma education have the smallest earnings of $15,357.
| Educational Attainment | Male Income | Female Income |
| Less than High School | - | - |
| High School Diploma | $38,750 | $15,357 |
| College or Associate's Degree | $51,875 | $33,750 |
| Bachelor's Degree | - | - |
| Graduate Degree | - | - |
| Total | $48,438 | $37,500 |
Family Income in Richburg
Family Income Brackets in Richburg
According to the Richburg family income data, there are 33 families falling into the $25,000 to $34,999 income range, which is the most common income bracket and makes up 28.2% of all families. Conversely, the $10,000 to $14,999 income bracket is the least frequent group with only 1 families (0.9%) belonging to this category.
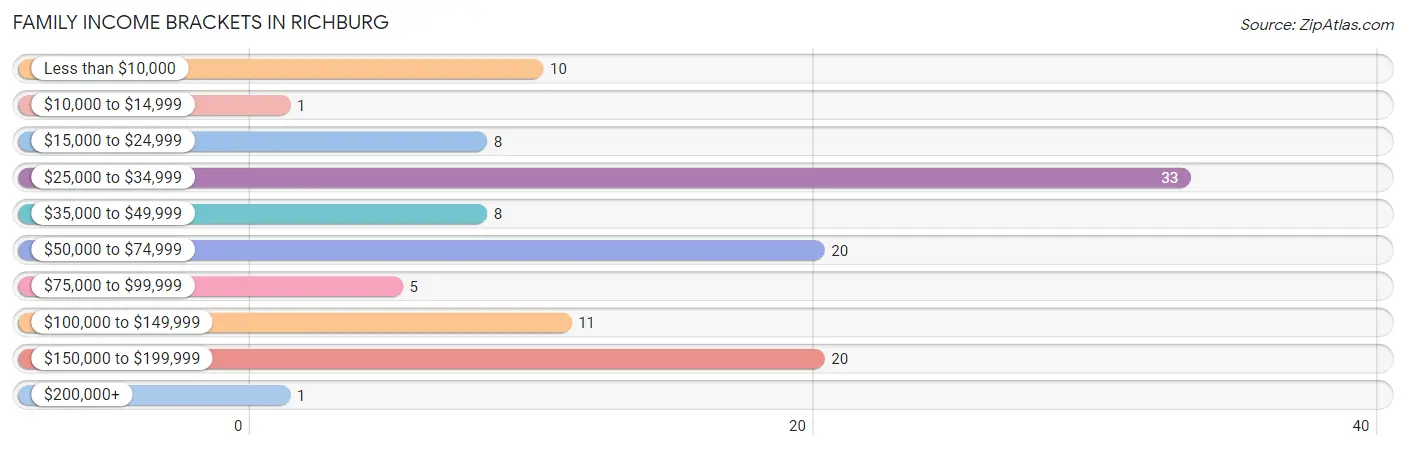
| Income Bracket | # Families | % Families |
| Less than $10,000 | 10 | 8.5% |
| $10,000 to $14,999 | 1 | 0.9% |
| $15,000 to $24,999 | 8 | 6.8% |
| $25,000 to $34,999 | 33 | 28.2% |
| $35,000 to $49,999 | 8 | 6.8% |
| $50,000 to $74,999 | 20 | 17.1% |
| $75,000 to $99,999 | 5 | 4.3% |
| $100,000 to $149,999 | 11 | 9.4% |
| $150,000 to $199,999 | 20 | 17.1% |
| $200,000+ | 1 | 0.9% |
Family Income by Famaliy Size in Richburg
2-person families (51 | 43.6%) account for the highest median family income in Richburg with $36,875 per family, while 2-person families (51 | 43.6%) have the highest median income of $18,438 per family member.
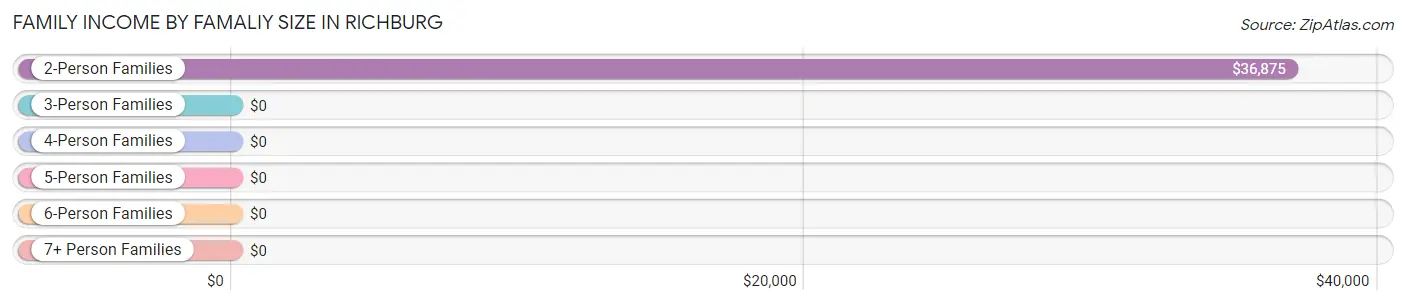
| Income Bracket | # Families | Median Income |
| 2-Person Families | 51 (43.6%) | $36,875 |
| 3-Person Families | 30 (25.6%) | $0 |
| 4-Person Families | 29 (24.8%) | $0 |
| 5-Person Families | 3 (2.6%) | $0 |
| 6-Person Families | 4 (3.4%) | $0 |
| 7+ Person Families | 0 (0.0%) | $0 |
| Total | 117 (100.0%) | $38,750 |
Family Income by Number of Earners in Richburg
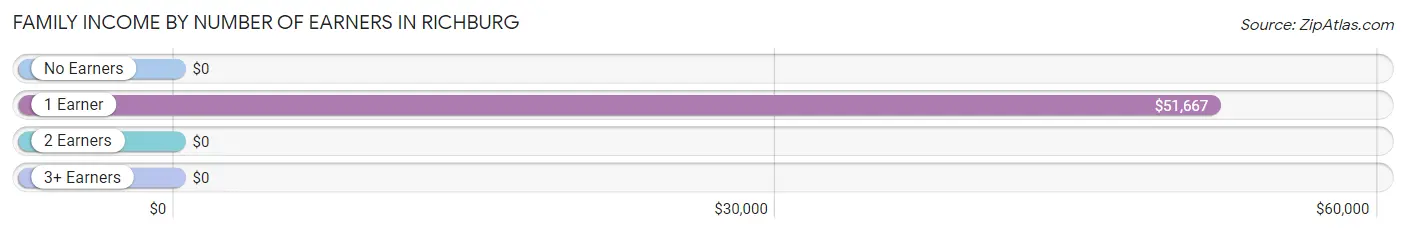
| Number of Earners | # Families | Median Income |
| No Earners | 18 (15.4%) | $0 |
| 1 Earner | 58 (49.6%) | $51,667 |
| 2 Earners | 34 (29.1%) | $0 |
| 3+ Earners | 7 (6.0%) | $0 |
| Total | 117 (100.0%) | $38,750 |
Household Income in Richburg
Household Income Brackets in Richburg
With 43 households falling in the category, the $25,000 to $34,999 income range is the most frequent in Richburg, accounting for 25.4% of all households. In contrast, only 5 households (3.0%) fall into the $10,000 to $14,999 income bracket, making it the least populous group.
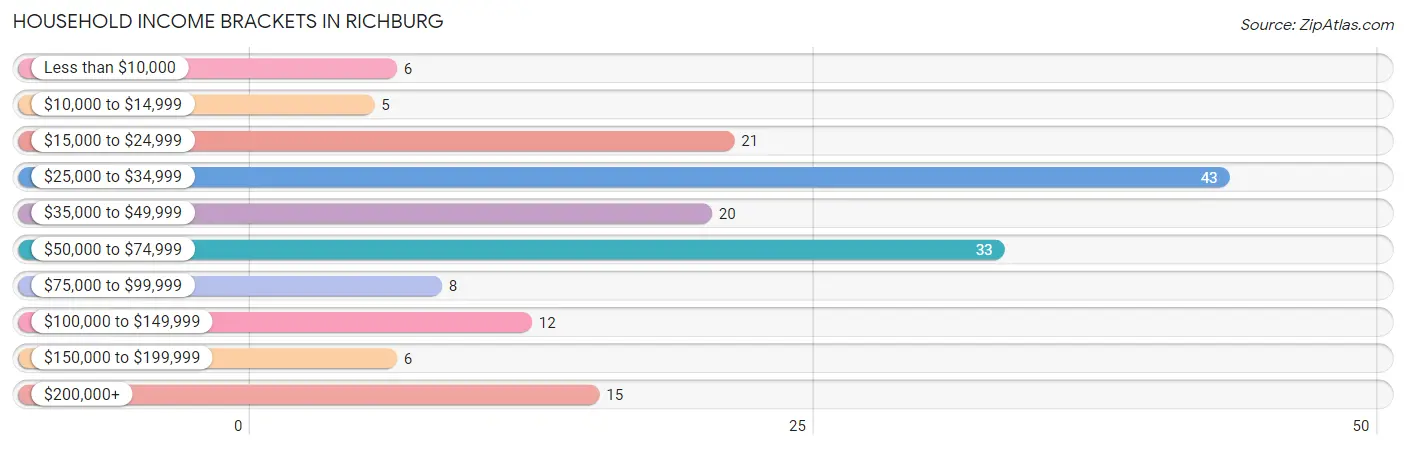
| Income Bracket | # Households | % Households |
| Less than $10,000 | 6 | 3.6% |
| $10,000 to $14,999 | 5 | 3.0% |
| $15,000 to $24,999 | 21 | 12.4% |
| $25,000 to $34,999 | 43 | 25.4% |
| $35,000 to $49,999 | 20 | 11.8% |
| $50,000 to $74,999 | 33 | 19.5% |
| $75,000 to $99,999 | 8 | 4.7% |
| $100,000 to $149,999 | 12 | 7.1% |
| $150,000 to $199,999 | 6 | 3.6% |
| $200,000+ | 15 | 8.9% |
Household Income by Householder Age in Richburg
The median household income in Richburg is $38,594, with the highest median household income of $65,417 found in the 45 to 64 years age bracket for the primary householder. A total of 77 households (45.6%) fall into this category. Meanwhile, the 15 to 24 years age bracket for the primary householder has the lowest median household income of $0, with 19 households (11.2%) in this group.
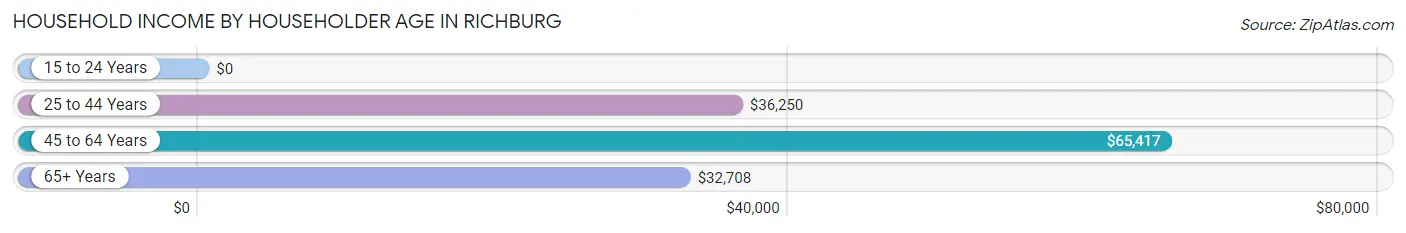
| Income Bracket | # Households | Median Income |
| 15 to 24 Years | 19 (11.2%) | $0 |
| 25 to 44 Years | 24 (14.2%) | $36,250 |
| 45 to 64 Years | 77 (45.6%) | $65,417 |
| 65+ Years | 49 (29.0%) | $32,708 |
| Total | 169 (100.0%) | $38,594 |
Poverty in Richburg
Income Below Poverty by Sex and Age in Richburg
With 32.3% poverty level for males and 21.4% for females among the residents of Richburg, 35 to 44 year old males and under 5 year old females are the most vulnerable to poverty, with 14 males (63.6%) and 8 females (80.0%) in their respective age groups living below the poverty level.
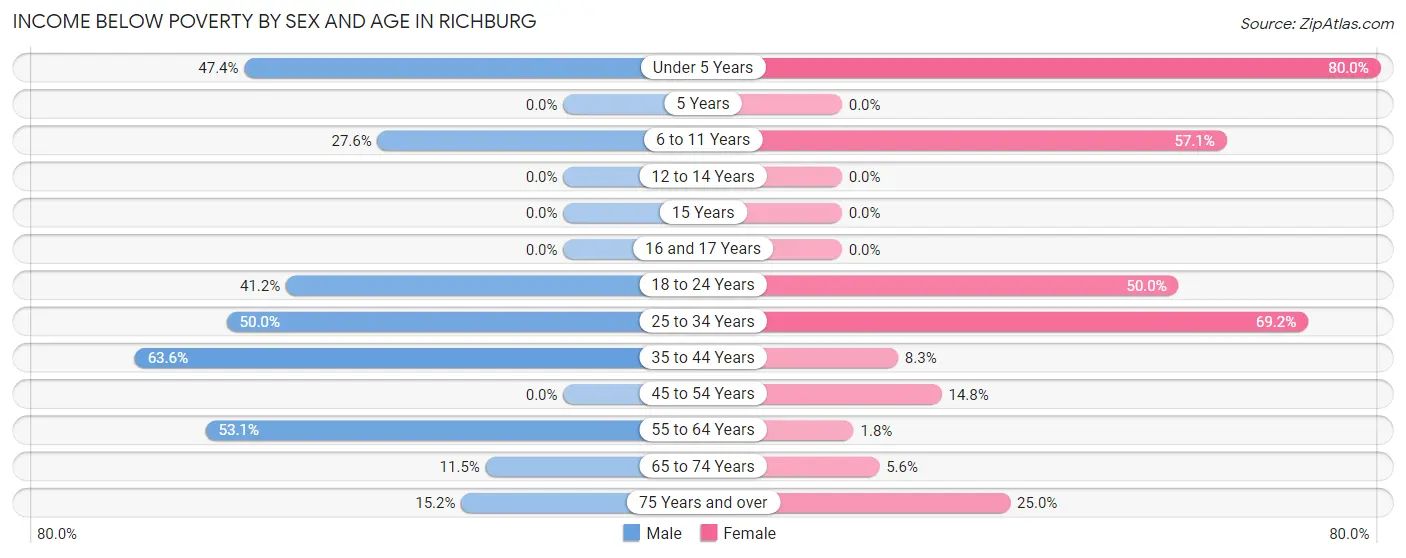
| Age Bracket | Male | Female |
| Under 5 Years | 9 (47.4%) | 8 (80.0%) |
| 5 Years | 0 (0.0%) | 0 (0.0%) |
| 6 to 11 Years | 8 (27.6%) | 8 (57.1%) |
| 12 to 14 Years | 0 (0.0%) | 0 (0.0%) |
| 15 Years | 0 (0.0%) | 0 (0.0%) |
| 16 and 17 Years | 0 (0.0%) | 0 (0.0%) |
| 18 to 24 Years | 14 (41.2%) | 15 (50.0%) |
| 25 to 34 Years | 2 (50.0%) | 9 (69.2%) |
| 35 to 44 Years | 14 (63.6%) | 4 (8.3%) |
| 45 to 54 Years | 0 (0.0%) | 4 (14.8%) |
| 55 to 64 Years | 34 (53.1%) | 1 (1.8%) |
| 65 to 74 Years | 3 (11.5%) | 1 (5.6%) |
| 75 Years and over | 5 (15.1%) | 2 (25.0%) |
| Total | 89 (32.3%) | 52 (21.4%) |
Income Above Poverty by Sex and Age in Richburg
According to the poverty statistics in Richburg, males aged 5 years and females aged 12 to 14 years are the age groups that are most secure financially, with 100.0% of males and 100.0% of females in these age groups living above the poverty line.
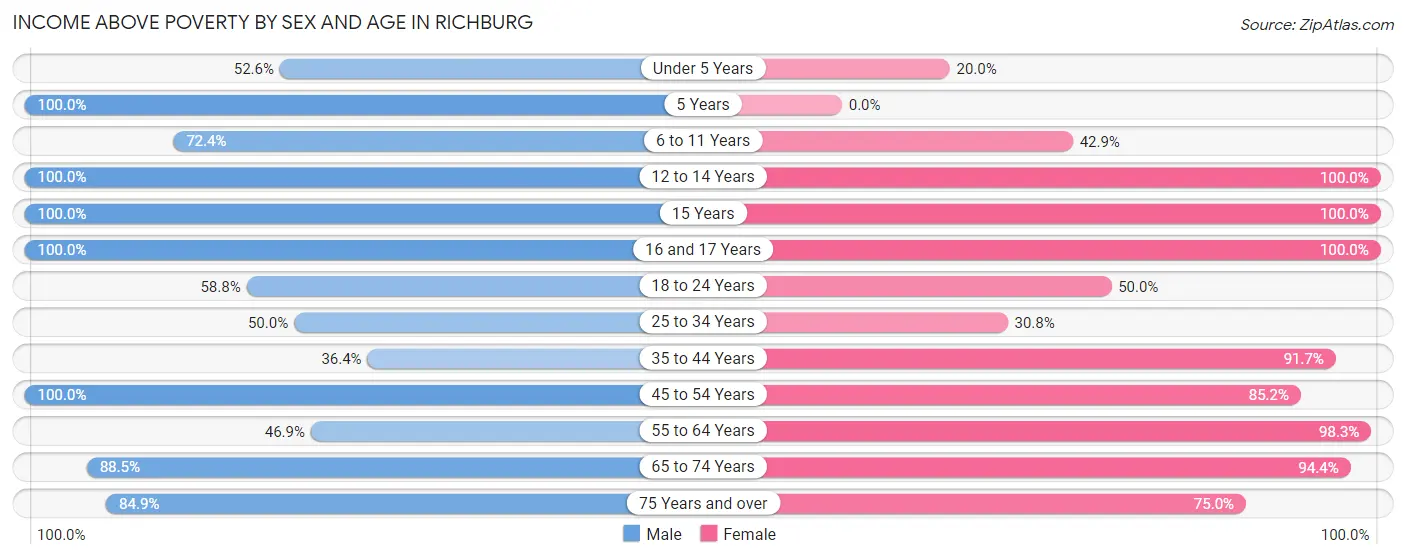
| Age Bracket | Male | Female |
| Under 5 Years | 10 (52.6%) | 2 (20.0%) |
| 5 Years | 1 (100.0%) | 0 (0.0%) |
| 6 to 11 Years | 21 (72.4%) | 6 (42.9%) |
| 12 to 14 Years | 2 (100.0%) | 2 (100.0%) |
| 15 Years | 1 (100.0%) | 10 (100.0%) |
| 16 and 17 Years | 14 (100.0%) | 6 (100.0%) |
| 18 to 24 Years | 20 (58.8%) | 15 (50.0%) |
| 25 to 34 Years | 2 (50.0%) | 4 (30.8%) |
| 35 to 44 Years | 8 (36.4%) | 44 (91.7%) |
| 45 to 54 Years | 27 (100.0%) | 23 (85.2%) |
| 55 to 64 Years | 30 (46.9%) | 56 (98.3%) |
| 65 to 74 Years | 23 (88.5%) | 17 (94.4%) |
| 75 Years and over | 28 (84.9%) | 6 (75.0%) |
| Total | 187 (67.7%) | 191 (78.6%) |
Income Below Poverty Among Married-Couple Families in Richburg
The poverty statistics for married-couple families in Richburg show that 15.4% or 14 of the total 91 families live below the poverty line. Families with 3 or 4 children have the highest poverty rate of 85.7%, comprising of 6 families. On the other hand, families with no children have the lowest poverty rate of 0.0%, which includes 0 families.
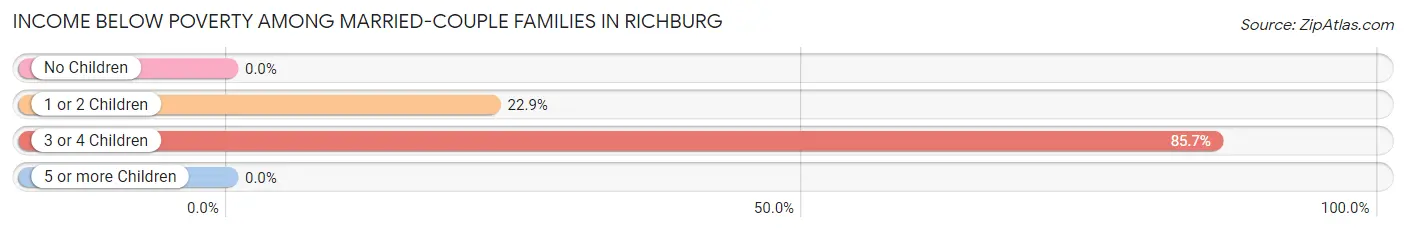
| Children | Above Poverty | Below Poverty |
| No Children | 49 (100.0%) | 0 (0.0%) |
| 1 or 2 Children | 27 (77.1%) | 8 (22.9%) |
| 3 or 4 Children | 1 (14.3%) | 6 (85.7%) |
| 5 or more Children | 0 (0.0%) | 0 (0.0%) |
| Total | 77 (84.6%) | 14 (15.4%) |
Income Below Poverty Among Single-Parent Households in Richburg
According to the poverty data in Richburg, 60.0% or 6 single-father households and 56.2% or 9 single-mother households are living below the poverty line. Among single-father households, those with 1 or 2 children have the highest poverty rate, with 6 households (60.0%) experiencing poverty. Likewise, among single-mother households, those with no children have the highest poverty rate, with 1 households (100.0%) falling below the poverty line.
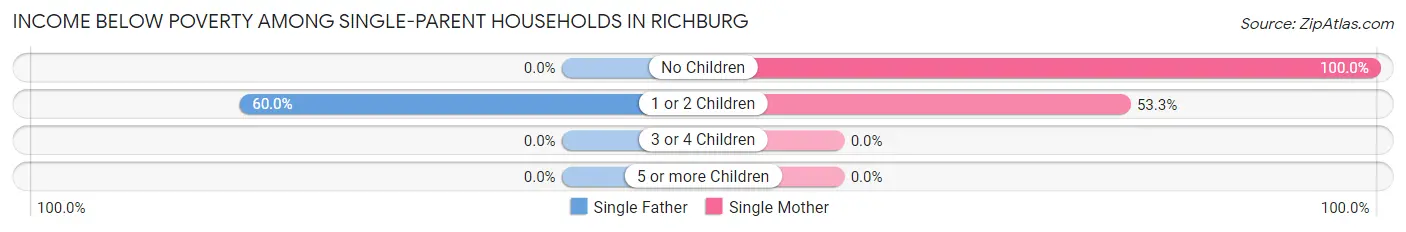
| Children | Single Father | Single Mother |
| No Children | 0 (0.0%) | 1 (100.0%) |
| 1 or 2 Children | 6 (60.0%) | 8 (53.3%) |
| 3 or 4 Children | 0 (0.0%) | 0 (0.0%) |
| 5 or more Children | 0 (0.0%) | 0 (0.0%) |
| Total | 6 (60.0%) | 9 (56.2%) |
Income Below Poverty Among Married-Couple vs Single-Parent Households in Richburg
The poverty data for Richburg shows that 14 of the married-couple family households (15.4%) and 15 of the single-parent households (57.7%) are living below the poverty level. Within the married-couple family households, those with 3 or 4 children have the highest poverty rate, with 6 households (85.7%) falling below the poverty line. Among the single-parent households, those with no children have the highest poverty rate, with 1 household (100.0%) living below poverty.
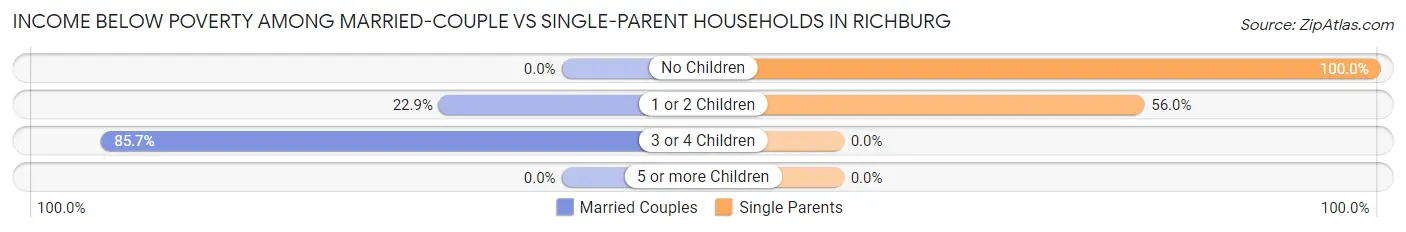
| Children | Married-Couple Families | Single-Parent Households |
| No Children | 0 (0.0%) | 1 (100.0%) |
| 1 or 2 Children | 8 (22.9%) | 14 (56.0%) |
| 3 or 4 Children | 6 (85.7%) | 0 (0.0%) |
| 5 or more Children | 0 (0.0%) | 0 (0.0%) |
| Total | 14 (15.4%) | 15 (57.7%) |
Race in Richburg
The most populous races in Richburg are White / Caucasian (534 | 93.2%), Two or more Races (38 | 6.6%), and Hispanic or Latino (26 | 4.5%).
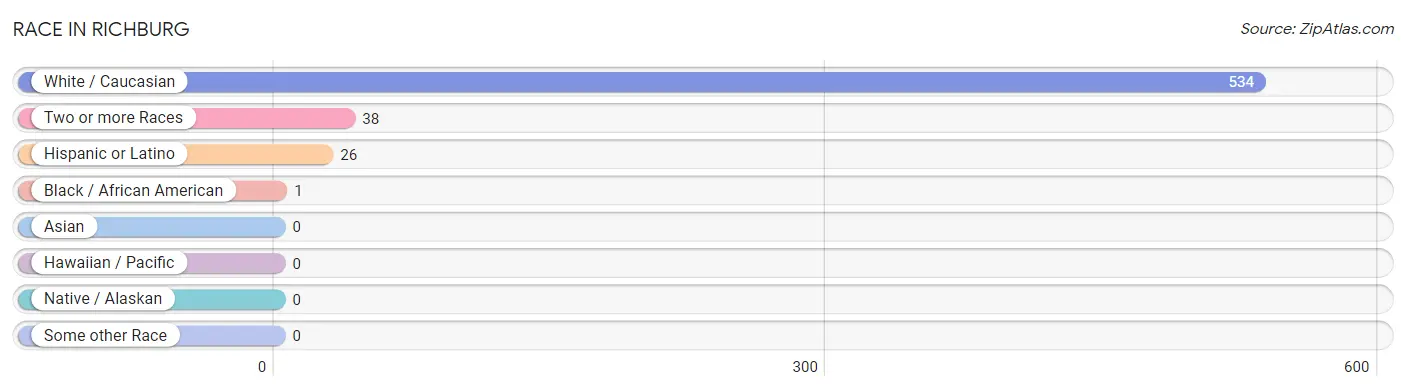
| Race | # Population | % Population |
| Asian | 0 | 0.0% |
| Black / African American | 1 | 0.2% |
| Hawaiian / Pacific | 0 | 0.0% |
| Hispanic or Latino | 26 | 4.5% |
| Native / Alaskan | 0 | 0.0% |
| White / Caucasian | 534 | 93.2% |
| Two or more Races | 38 | 6.6% |
| Some other Race | 0 | 0.0% |
| Total | 573 | 100.0% |
Ancestry in Richburg
The most populous ancestries reported in Richburg are German (85 | 14.8%), English (80 | 14.0%), Irish (54 | 9.4%), American (31 | 5.4%), and Pennsylvania German (30 | 5.2%), together accounting for 48.9% of all Richburg residents.
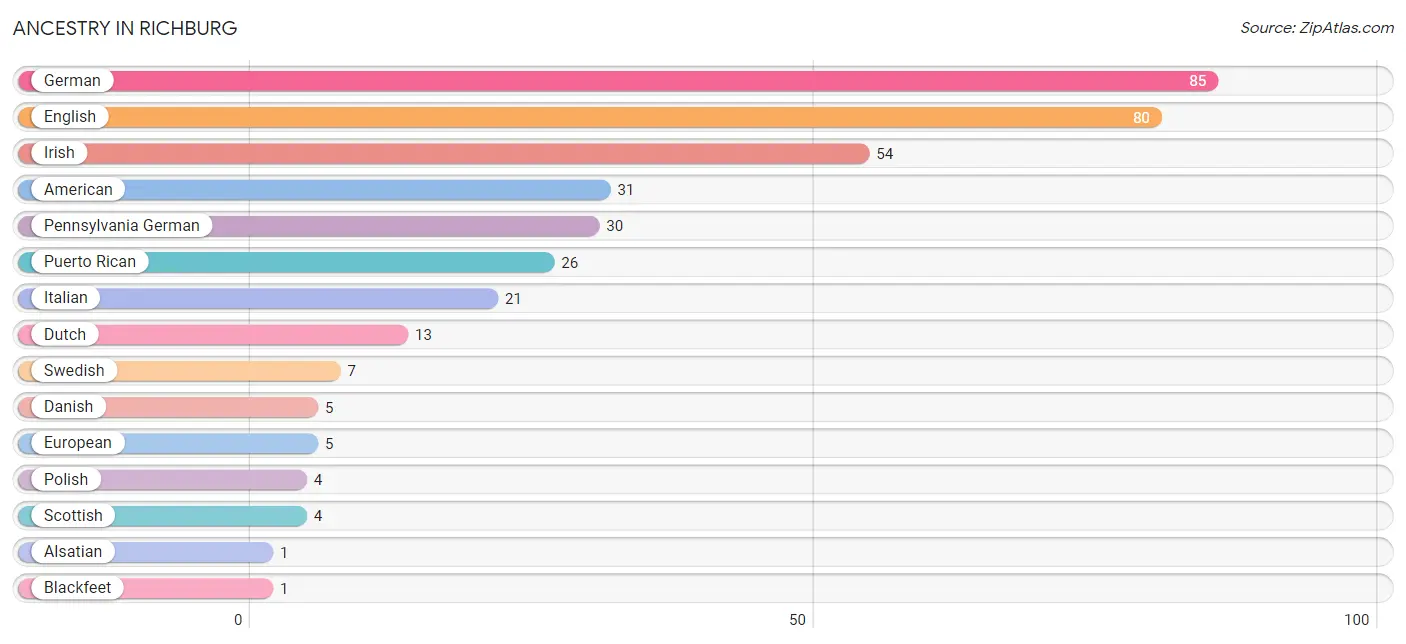
| Ancestry | # Population | % Population |
| Alsatian | 1 | 0.2% |
| American | 31 | 5.4% |
| Blackfeet | 1 | 0.2% |
| British West Indian | 1 | 0.2% |
| Danish | 5 | 0.9% |
| Dutch | 13 | 2.3% |
| English | 80 | 14.0% |
| European | 5 | 0.9% |
| German | 85 | 14.8% |
| Irish | 54 | 9.4% |
| Italian | 21 | 3.7% |
| Pennsylvania German | 30 | 5.2% |
| Polish | 4 | 0.7% |
| Puerto Rican | 26 | 4.5% |
| Scotch-Irish | 1 | 0.2% |
| Scottish | 4 | 0.7% |
| Swedish | 7 | 1.2% | View All 17 Rows |
Immigrants in Richburg
The most numerous immigrant groups reported in Richburg came from Europe (2 | 0.4%), France (2 | 0.4%), and Western Europe (2 | 0.4%), together accounting for 1.1% of all Richburg residents.
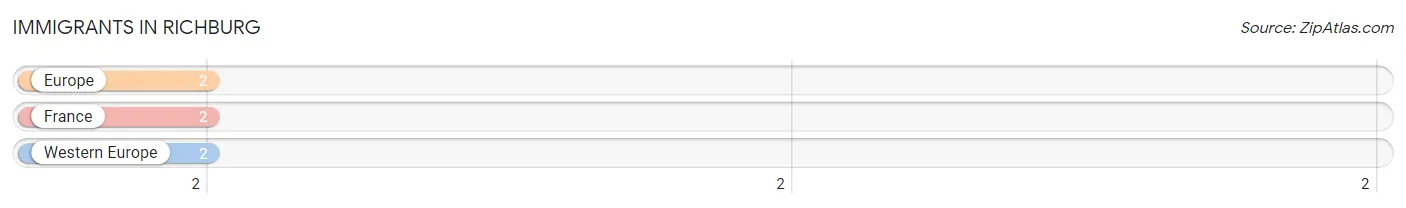
| Immigration Origin | # Population | % Population |
| Europe | 2 | 0.4% |
| France | 2 | 0.4% |
| Western Europe | 2 | 0.4% | View All 3 Rows |
Sex and Age in Richburg
Sex and Age in Richburg
The most populous age groups in Richburg are 60 to 64 Years (40 | 14.5%) for men and 5 to 9 Years (64 | 21.5%) for women.
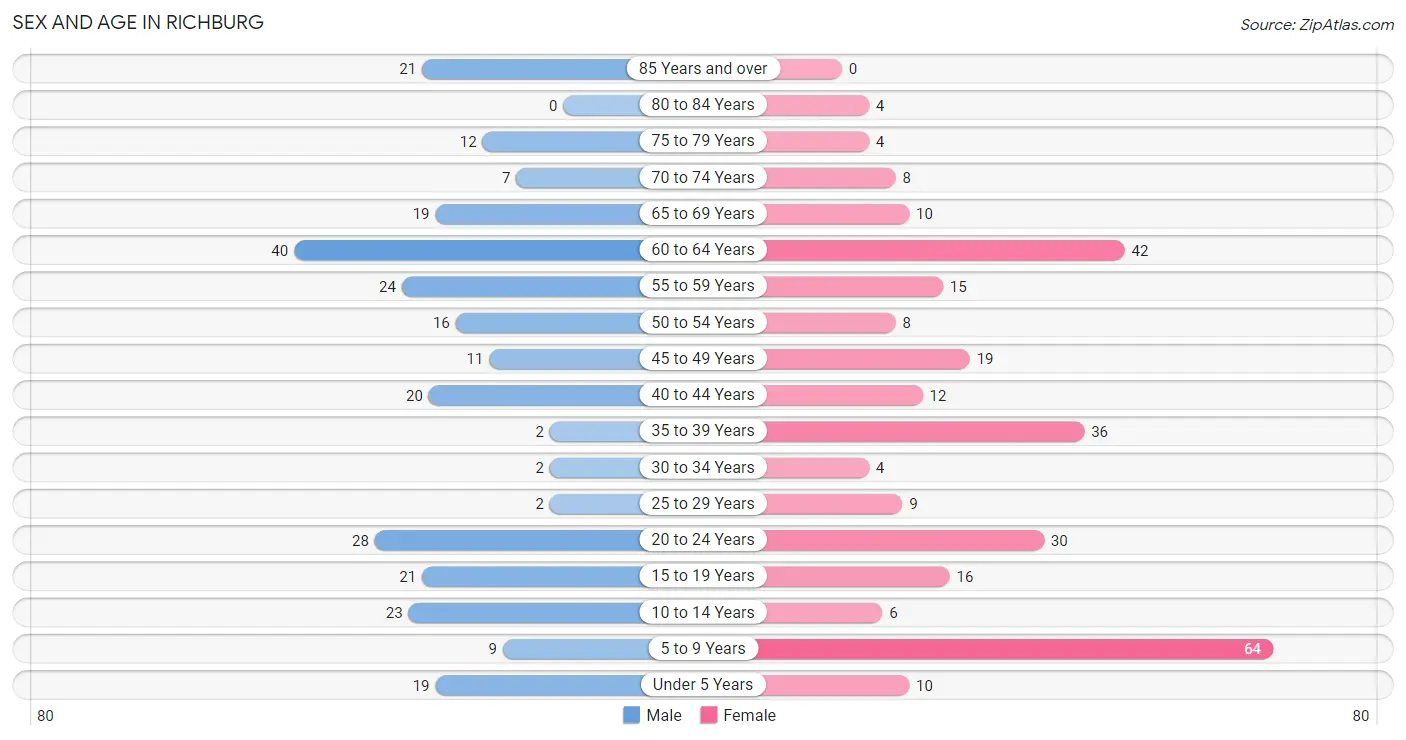
| Age Bracket | Male | Female |
| Under 5 Years | 19 (6.9%) | 10 (3.4%) |
| 5 to 9 Years | 9 (3.3%) | 64 (21.5%) |
| 10 to 14 Years | 23 (8.3%) | 6 (2.0%) |
| 15 to 19 Years | 21 (7.6%) | 16 (5.4%) |
| 20 to 24 Years | 28 (10.1%) | 30 (10.1%) |
| 25 to 29 Years | 2 (0.7%) | 9 (3.0%) |
| 30 to 34 Years | 2 (0.7%) | 4 (1.3%) |
| 35 to 39 Years | 2 (0.7%) | 36 (12.1%) |
| 40 to 44 Years | 20 (7.2%) | 12 (4.0%) |
| 45 to 49 Years | 11 (4.0%) | 19 (6.4%) |
| 50 to 54 Years | 16 (5.8%) | 8 (2.7%) |
| 55 to 59 Years | 24 (8.7%) | 15 (5.1%) |
| 60 to 64 Years | 40 (14.5%) | 42 (14.1%) |
| 65 to 69 Years | 19 (6.9%) | 10 (3.4%) |
| 70 to 74 Years | 7 (2.5%) | 8 (2.7%) |
| 75 to 79 Years | 12 (4.3%) | 4 (1.3%) |
| 80 to 84 Years | 0 (0.0%) | 4 (1.3%) |
| 85 Years and over | 21 (7.6%) | 0 (0.0%) |
| Total | 276 (100.0%) | 297 (100.0%) |
Families and Households in Richburg
Median Family Size in Richburg
The median family size in Richburg is 3.12 persons per family, with married-couple families (91 | 77.8%) accounting for the largest median family size of 3.25 persons per family. On the other hand, single male/father families (10 | 8.6%) represent the smallest median family size with 1.90 persons per family.
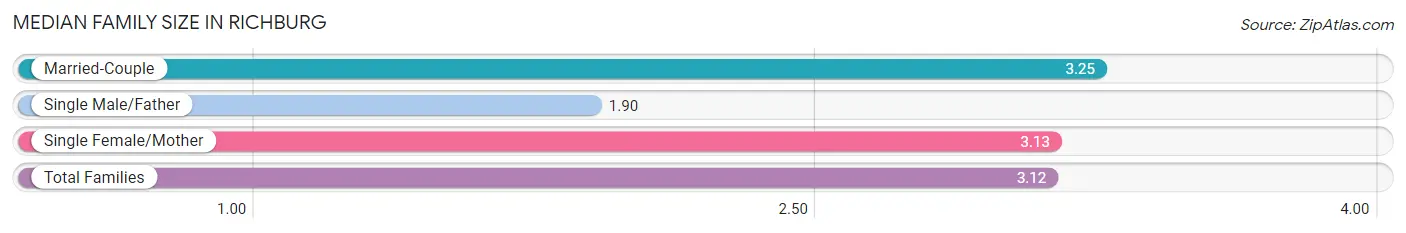
| Family Type | # Families | Family Size |
| Married-Couple | 91 (77.8%) | 3.25 |
| Single Male/Father | 10 (8.6%) | 1.90 |
| Single Female/Mother | 16 (13.7%) | 3.13 |
| Total Families | 117 (100.0%) | 3.12 |
Median Household Size in Richburg
The median household size in Richburg is 3.39 persons per household, with married-couple households (91 | 53.8%) accounting for the largest median household size of 4.55 persons per household. non-family households (52 | 30.8%) represent the smallest median household size with 1.56 persons per household.
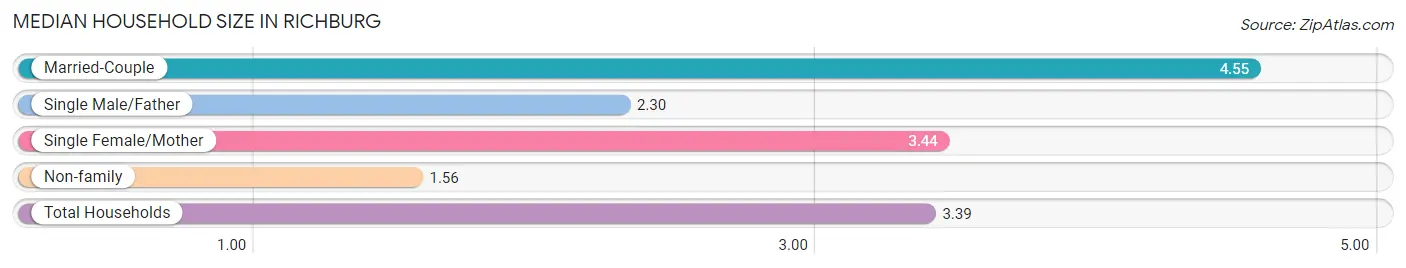
| Household Type | # Households | Household Size |
| Married-Couple | 91 (53.8%) | 4.55 |
| Single Male/Father | 10 (5.9%) | 2.30 |
| Single Female/Mother | 16 (9.5%) | 3.44 |
| Non-family | 52 (30.8%) | 1.56 |
| Total Households | 169 (100.0%) | 3.39 |
Household Size by Marriage Status in Richburg
Out of a total of 169 households in Richburg, 117 (69.2%) are family households, while 52 (30.8%) are nonfamily households. The most numerous type of family households are 2-person households, comprising 43, and the most common type of nonfamily households are 1-person households, comprising 43.
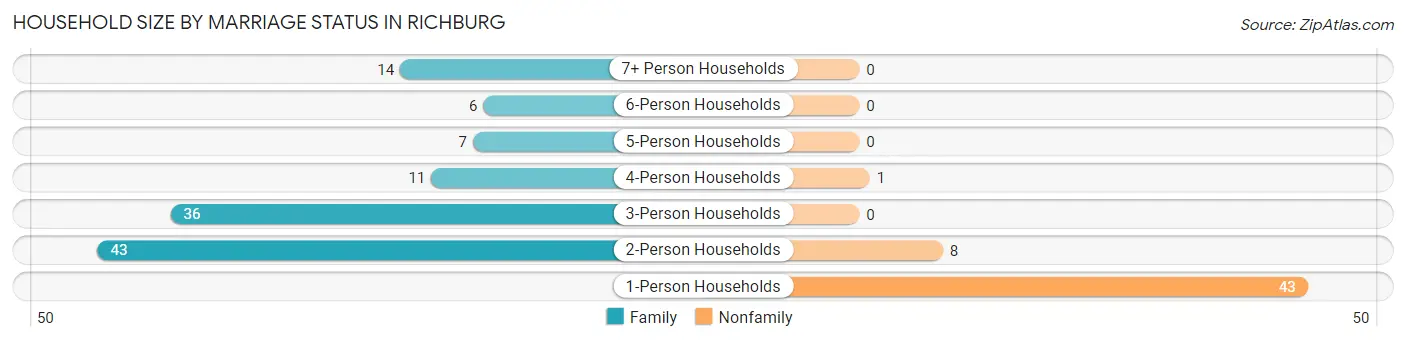
| Household Size | Family Households | Nonfamily Households |
| 1-Person Households | - | 43 (25.4%) |
| 2-Person Households | 43 (25.4%) | 8 (4.7%) |
| 3-Person Households | 36 (21.3%) | 0 (0.0%) |
| 4-Person Households | 11 (6.5%) | 1 (0.6%) |
| 5-Person Households | 7 (4.1%) | 0 (0.0%) |
| 6-Person Households | 6 (3.5%) | 0 (0.0%) |
| 7+ Person Households | 14 (8.3%) | 0 (0.0%) |
| Total | 117 (69.2%) | 52 (30.8%) |
Female Fertility in Richburg
Fertility by Age in Richburg
Average fertility rate in Richburg is 103.0 births per 1,000 women. Women in the age bracket of 20 to 34 years have the highest fertility rate with 302.0 births per 1,000 women. Women in the age bracket of 20 to 34 years acount for 100.0% of all women with births.
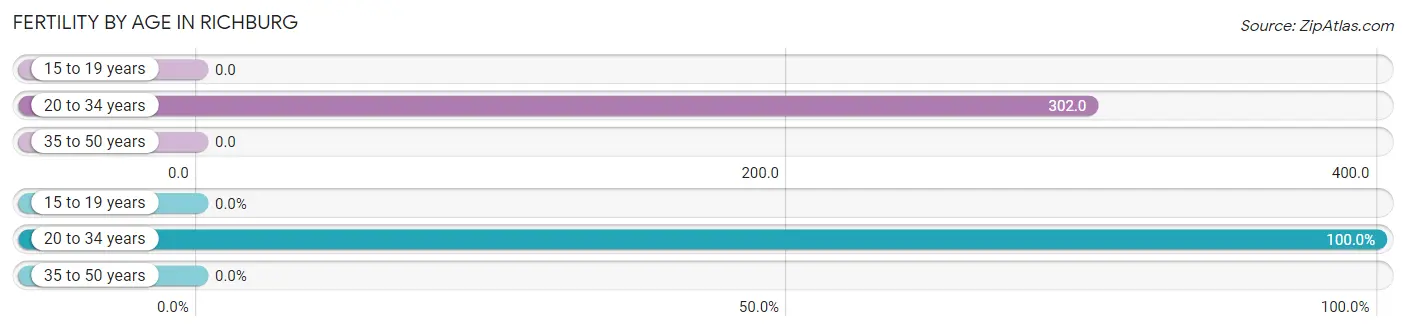
| Age Bracket | Women with Births | Births / 1,000 Women |
| 15 to 19 years | 0 (0.0%) | 0.0 |
| 20 to 34 years | 13 (100.0%) | 302.0 |
| 35 to 50 years | 0 (0.0%) | 0.0 |
| Total | 13 (100.0%) | 103.0 |
Fertility by Age by Marriage Status in Richburg
23.1% of women with births (13) in Richburg are married. The highest percentage of unmarried women with births falls into 20 to 34 years age bracket with 76.9% of them unmarried at the time of birth, while the lowest percentage of unmarried women with births belong to 20 to 34 years age bracket with 76.9% of them unmarried.
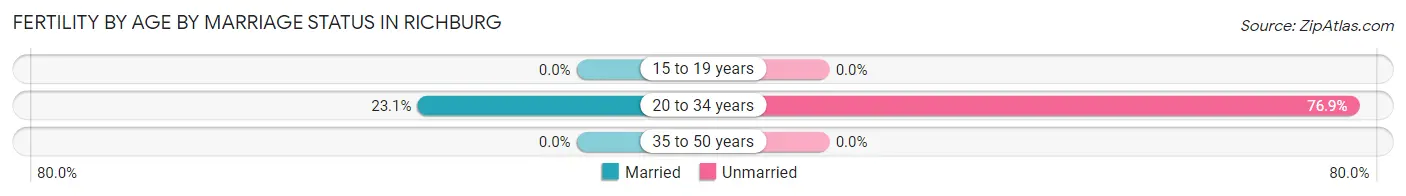
| Age Bracket | Married | Unmarried |
| 15 to 19 years | 0 (0.0%) | 0 (0.0%) |
| 20 to 34 years | 3 (23.1%) | 10 (76.9%) |
| 35 to 50 years | 0 (0.0%) | 0 (0.0%) |
| Total | 3 (23.1%) | 10 (76.9%) |
Fertility by Education in Richburg
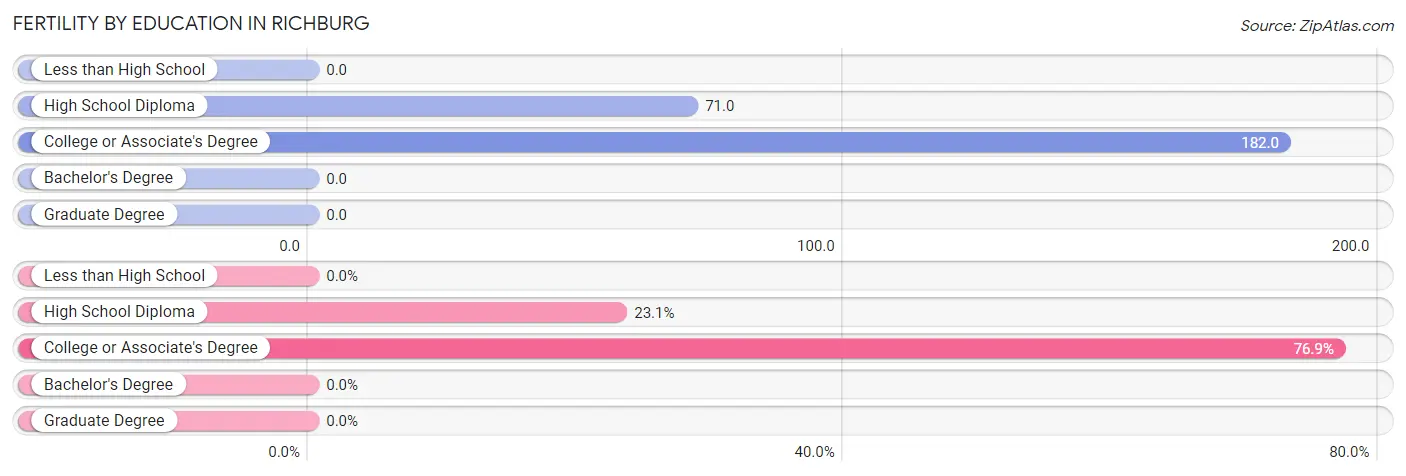
| Educational Attainment | Women with Births | Births / 1,000 Women |
| Less than High School | 0 (0.0%) | 0.0 |
| High School Diploma | 3 (23.1%) | 71.0 |
| College or Associate's Degree | 10 (76.9%) | 182.0 |
| Bachelor's Degree | 0 (0.0%) | 0.0 |
| Graduate Degree | 0 (0.0%) | 0.0 |
| Total | 13 (100.0%) | 103.0 |
Fertility by Education by Marriage Status in Richburg
76.9% of women with births in Richburg are unmarried. Women with the educational attainment of high school diploma are most likely to be married with 100.0% of them married at childbirth, while women with the educational attainment of college or associate's degree are least likely to be married with 100.0% of them unmarried at childbirth.
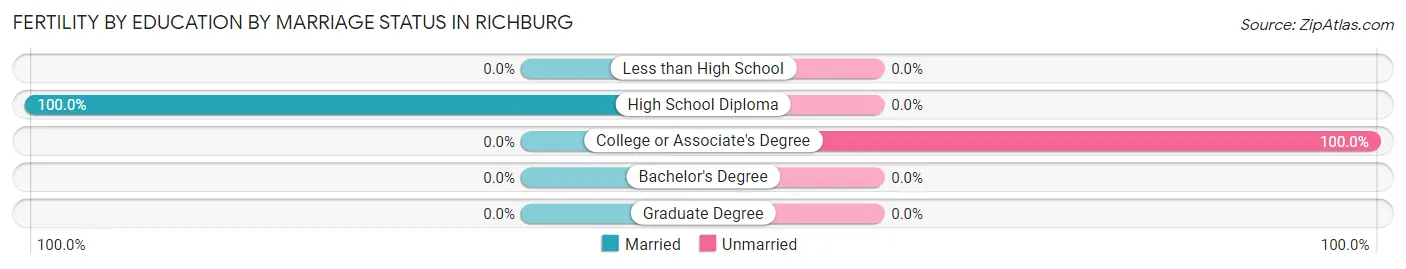
| Educational Attainment | Married | Unmarried |
| Less than High School | 0 (0.0%) | 0 (0.0%) |
| High School Diploma | 3 (100.0%) | 0 (0.0%) |
| College or Associate's Degree | 0 (0.0%) | 10 (100.0%) |
| Bachelor's Degree | 0 (0.0%) | 0 (0.0%) |
| Graduate Degree | 0 (0.0%) | 0 (0.0%) |
| Total | 3 (23.1%) | 10 (76.9%) |
Employment Characteristics in Richburg
Employment by Class of Employer in Richburg
Among the 224 employed individuals in Richburg, private company employees (149 | 66.5%), local government employees (37 | 16.5%), and not-for-profit organizations (23 | 10.3%) make up the most common classes of employment.
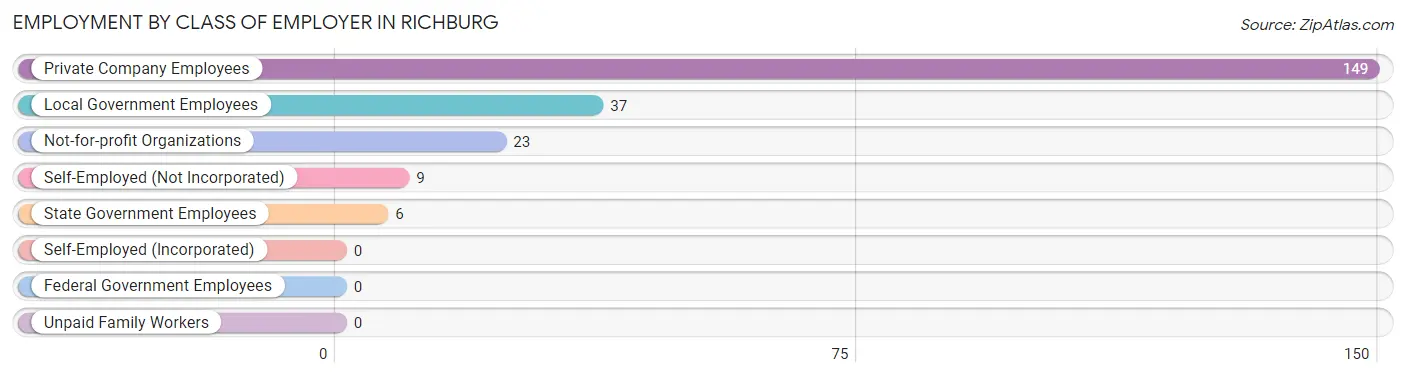
| Employer Class | # Employees | % Employees |
| Private Company Employees | 149 | 66.5% |
| Self-Employed (Incorporated) | 0 | 0.0% |
| Self-Employed (Not Incorporated) | 9 | 4.0% |
| Not-for-profit Organizations | 23 | 10.3% |
| Local Government Employees | 37 | 16.5% |
| State Government Employees | 6 | 2.7% |
| Federal Government Employees | 0 | 0.0% |
| Unpaid Family Workers | 0 | 0.0% |
| Total | 224 | 100.0% |
Employment Status by Age in Richburg
According to the labor force statistics for Richburg, out of the total population over 16 years of age (431), 55.0% or 237 individuals are in the labor force, with 4.2% or 10 of them unemployed. The age group with the highest labor force participation rate is 30 to 34 years, with 100.0% or 6 individuals in the labor force. Within the labor force, the 30 to 34 years age range has the highest percentage of unemployed individuals, with 66.7% or 4 of them being unemployed.
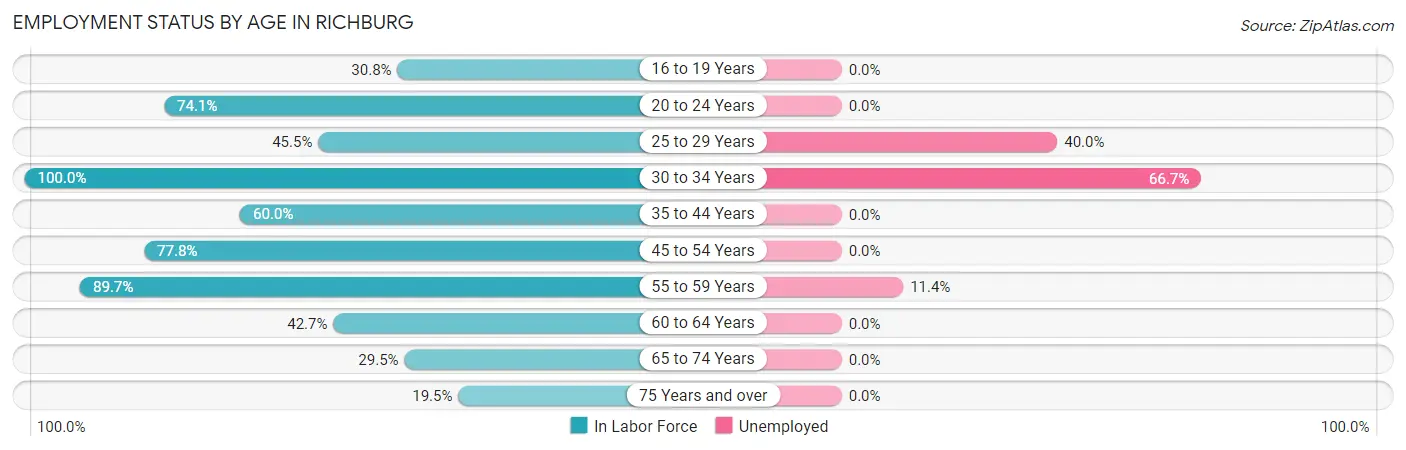
| Age Bracket | In Labor Force | Unemployed |
| 16 to 19 Years | 8 (30.8%) | 0 (0.0%) |
| 20 to 24 Years | 43 (74.1%) | 0 (0.0%) |
| 25 to 29 Years | 5 (45.5%) | 2 (40.0%) |
| 30 to 34 Years | 6 (100.0%) | 4 (66.7%) |
| 35 to 44 Years | 42 (60.0%) | 0 (0.0%) |
| 45 to 54 Years | 42 (77.8%) | 0 (0.0%) |
| 55 to 59 Years | 35 (89.7%) | 4 (11.4%) |
| 60 to 64 Years | 35 (42.7%) | 0 (0.0%) |
| 65 to 74 Years | 13 (29.5%) | 0 (0.0%) |
| 75 Years and over | 8 (19.5%) | 0 (0.0%) |
| Total | 237 (55.0%) | 10 (4.2%) |
Employment Status by Educational Attainment in Richburg
According to labor force statistics for Richburg, 63.0% of individuals (165) out of the total population between 25 and 64 years of age (262) are in the labor force, with 6.1% or 10 of them being unemployed. The group with the highest labor force participation rate are those with the educational attainment of bachelor's degree or higher, with 100.0% or 17 individuals in the labor force. Within the labor force, individuals with college / associate degree education have the highest percentage of unemployment, with 8.0% or 4 of them being unemployed.
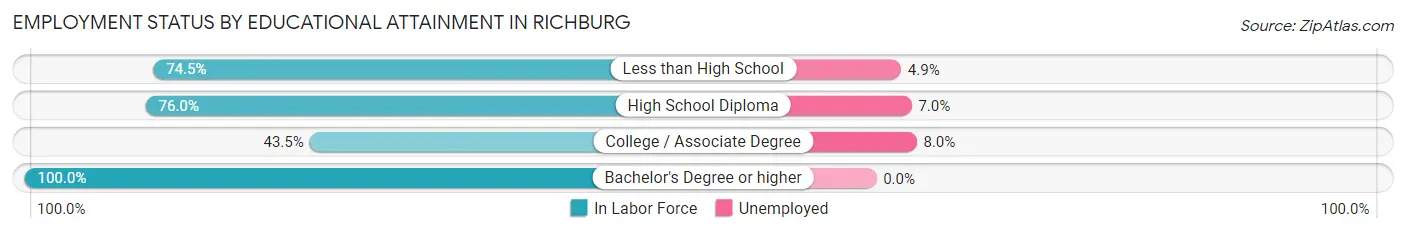
| Educational Attainment | In Labor Force | Unemployed |
| Less than High School | 41 (74.5%) | 3 (4.9%) |
| High School Diploma | 57 (76.0%) | 5 (7.0%) |
| College / Associate Degree | 50 (43.5%) | 9 (8.0%) |
| Bachelor's Degree or higher | 17 (100.0%) | 0 (0.0%) |
| Total | 165 (63.0%) | 16 (6.1%) |
Employment Occupations by Sex in Richburg
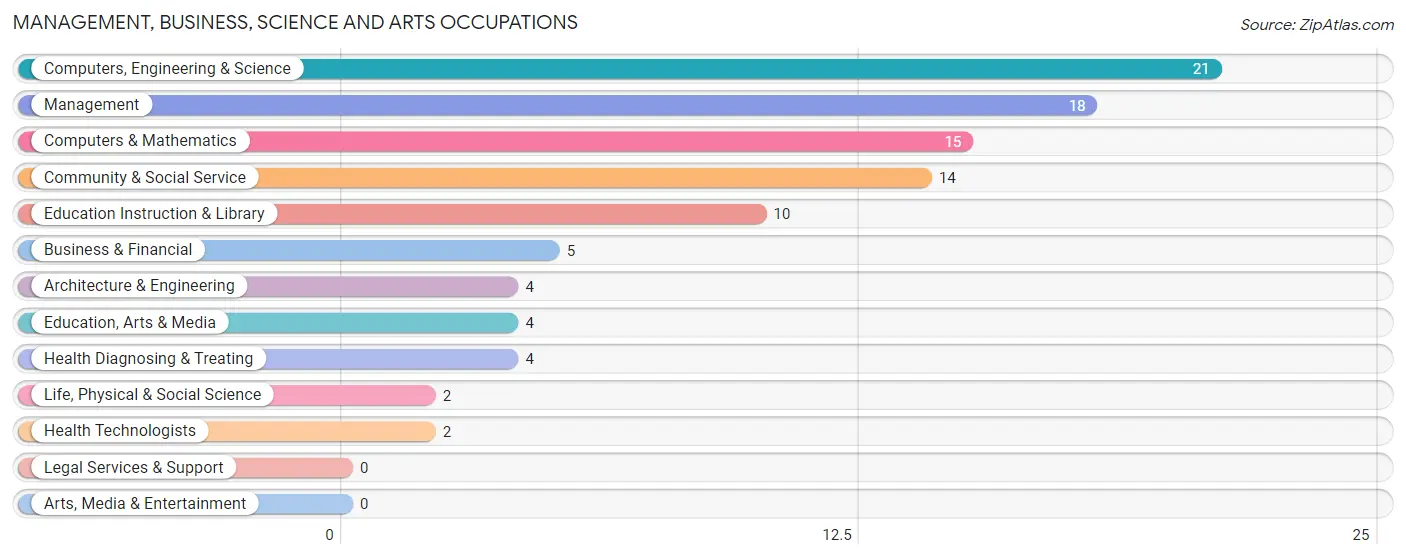
Management, Business, Science and Arts Occupations
The most common Management, Business, Science and Arts occupations in Richburg are Computers, Engineering & Science (21 | 9.2%), Management (18 | 7.9%), Computers & Mathematics (15 | 6.6%), Community & Social Service (14 | 6.2%), and Education Instruction & Library (10 | 4.4%).
Management, Business, Science and Arts Occupations by Sex
Within the Management, Business, Science and Arts occupations in Richburg, the most male-oriented occupations are Life, Physical & Social Science (100.0%), Computers & Mathematics (93.3%), and Computers, Engineering & Science (85.7%), while the most female-oriented occupations are Health Technologists (100.0%), Business & Financial (80.0%), and Education Instruction & Library (70.0%).
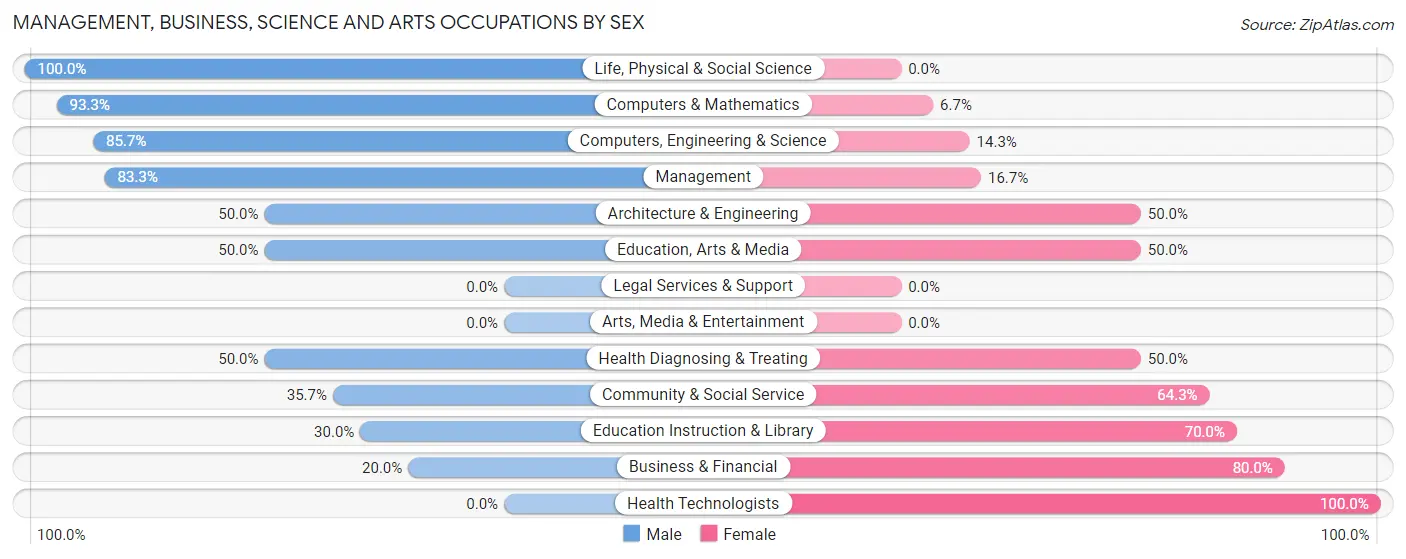
| Occupation | Male | Female |
| Management | 15 (83.3%) | 3 (16.7%) |
| Business & Financial | 1 (20.0%) | 4 (80.0%) |
| Computers, Engineering & Science | 18 (85.7%) | 3 (14.3%) |
| Computers & Mathematics | 14 (93.3%) | 1 (6.7%) |
| Architecture & Engineering | 2 (50.0%) | 2 (50.0%) |
| Life, Physical & Social Science | 2 (100.0%) | 0 (0.0%) |
| Community & Social Service | 5 (35.7%) | 9 (64.3%) |
| Education, Arts & Media | 2 (50.0%) | 2 (50.0%) |
| Legal Services & Support | 0 (0.0%) | 0 (0.0%) |
| Education Instruction & Library | 3 (30.0%) | 7 (70.0%) |
| Arts, Media & Entertainment | 0 (0.0%) | 0 (0.0%) |
| Health Diagnosing & Treating | 2 (50.0%) | 2 (50.0%) |
| Health Technologists | 0 (0.0%) | 2 (100.0%) |
| Total (Category) | 41 (66.1%) | 21 (33.9%) |
| Total (Overall) | 112 (49.3%) | 115 (50.7%) |
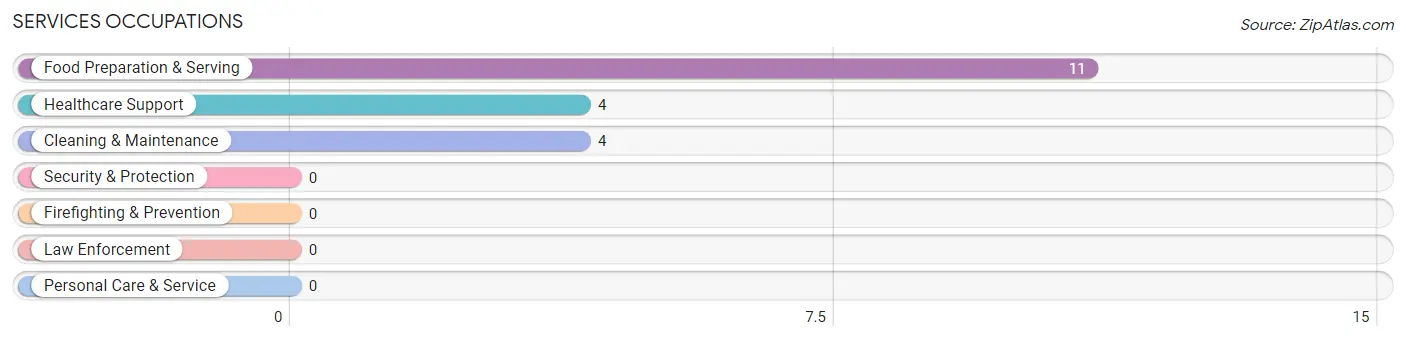
Services Occupations
The most common Services occupations in Richburg are Food Preparation & Serving (11 | 4.9%), Healthcare Support (4 | 1.8%), and Cleaning & Maintenance (4 | 1.8%).
Services Occupations by Sex
Within the Services occupations in Richburg, the most male-oriented occupations are Cleaning & Maintenance (100.0%), and Food Preparation & Serving (54.5%), while the most female-oriented occupations are Healthcare Support (100.0%), and Food Preparation & Serving (45.5%).
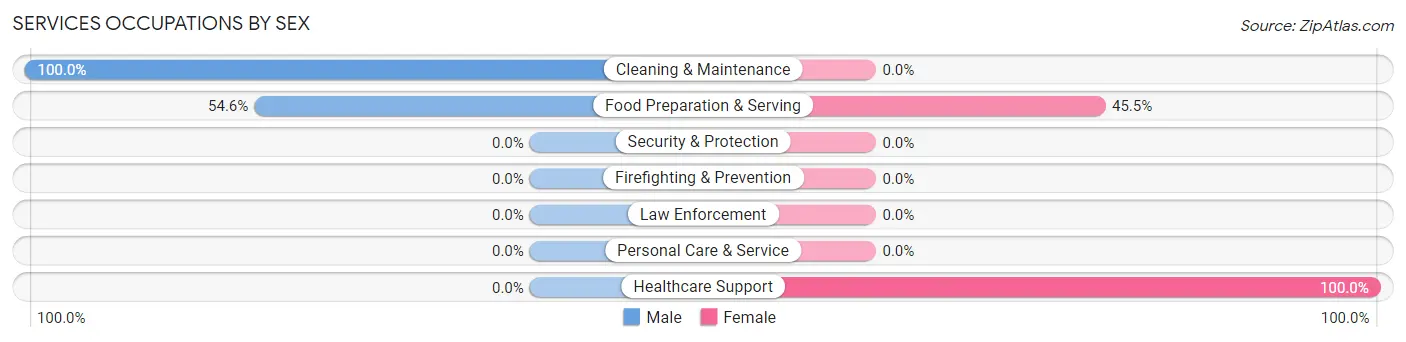
| Occupation | Male | Female |
| Healthcare Support | 0 (0.0%) | 4 (100.0%) |
| Security & Protection | 0 (0.0%) | 0 (0.0%) |
| Firefighting & Prevention | 0 (0.0%) | 0 (0.0%) |
| Law Enforcement | 0 (0.0%) | 0 (0.0%) |
| Food Preparation & Serving | 6 (54.5%) | 5 (45.5%) |
| Cleaning & Maintenance | 4 (100.0%) | 0 (0.0%) |
| Personal Care & Service | 0 (0.0%) | 0 (0.0%) |
| Total (Category) | 10 (52.6%) | 9 (47.4%) |
| Total (Overall) | 112 (49.3%) | 115 (50.7%) |
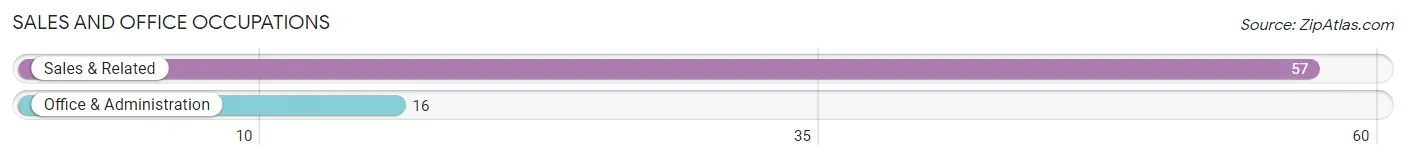
Sales and Office Occupations
The most common Sales and Office occupations in Richburg are Sales & Related (57 | 25.1%), and Office & Administration (16 | 7.0%).
Sales and Office Occupations by Sex
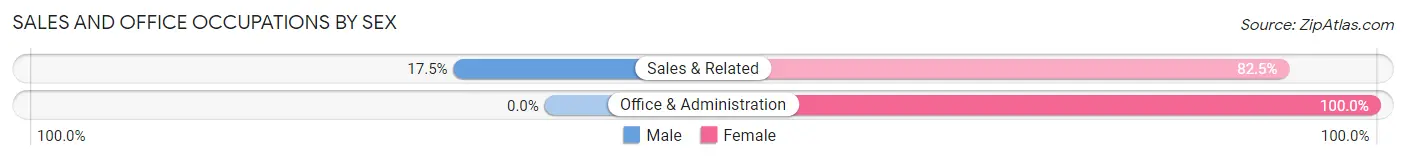
| Occupation | Male | Female |
| Sales & Related | 10 (17.5%) | 47 (82.5%) |
| Office & Administration | 0 (0.0%) | 16 (100.0%) |
| Total (Category) | 10 (13.7%) | 63 (86.3%) |
| Total (Overall) | 112 (49.3%) | 115 (50.7%) |
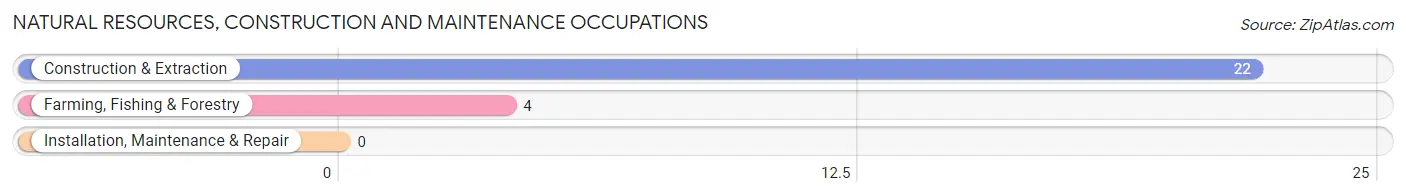
Natural Resources, Construction and Maintenance Occupations
The most common Natural Resources, Construction and Maintenance occupations in Richburg are Construction & Extraction (22 | 9.7%), and Farming, Fishing & Forestry (4 | 1.8%).
Natural Resources, Construction and Maintenance Occupations by Sex
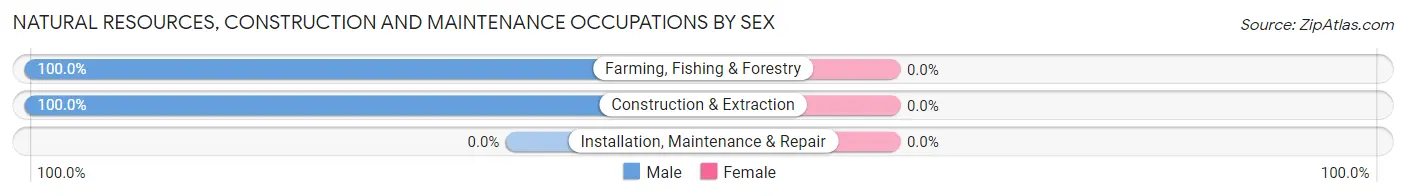
| Occupation | Male | Female |
| Farming, Fishing & Forestry | 4 (100.0%) | 0 (0.0%) |
| Construction & Extraction | 22 (100.0%) | 0 (0.0%) |
| Installation, Maintenance & Repair | 0 (0.0%) | 0 (0.0%) |
| Total (Category) | 26 (100.0%) | 0 (0.0%) |
| Total (Overall) | 112 (49.3%) | 115 (50.7%) |
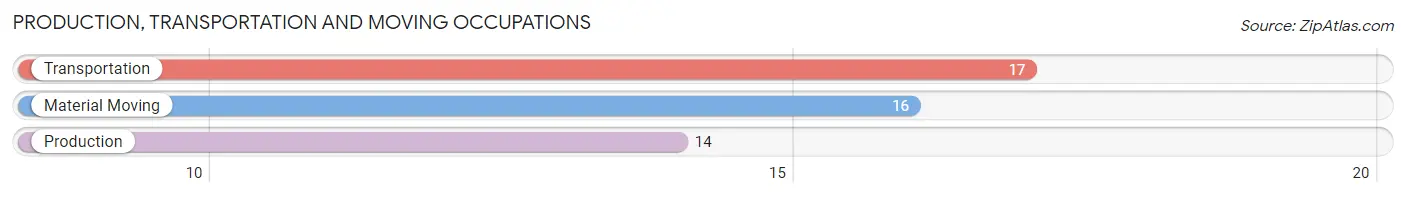
Production, Transportation and Moving Occupations
The most common Production, Transportation and Moving occupations in Richburg are Transportation (17 | 7.5%), Material Moving (16 | 7.0%), and Production (14 | 6.2%).
Production, Transportation and Moving Occupations by Sex
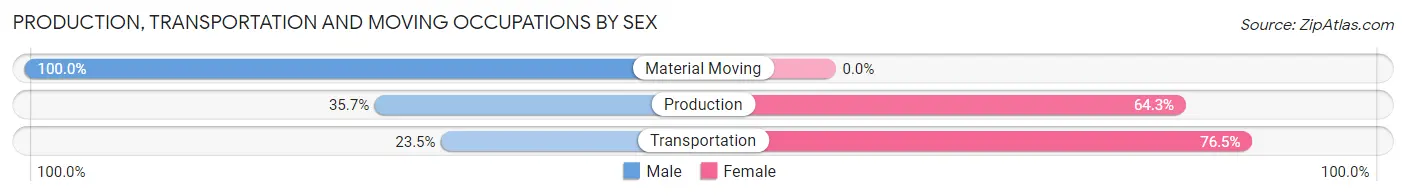
| Occupation | Male | Female |
| Production | 5 (35.7%) | 9 (64.3%) |
| Transportation | 4 (23.5%) | 13 (76.5%) |
| Material Moving | 16 (100.0%) | 0 (0.0%) |
| Total (Category) | 25 (53.2%) | 22 (46.8%) |
| Total (Overall) | 112 (49.3%) | 115 (50.7%) |
Employment Industries by Sex in Richburg
Employment Industries in Richburg
The major employment industries in Richburg include Retail Trade (59 | 26.0%), Educational Services (34 | 15.0%), Construction (33 | 14.5%), Manufacturing (26 | 11.5%), and Professional & Scientific (16 | 7.0%).
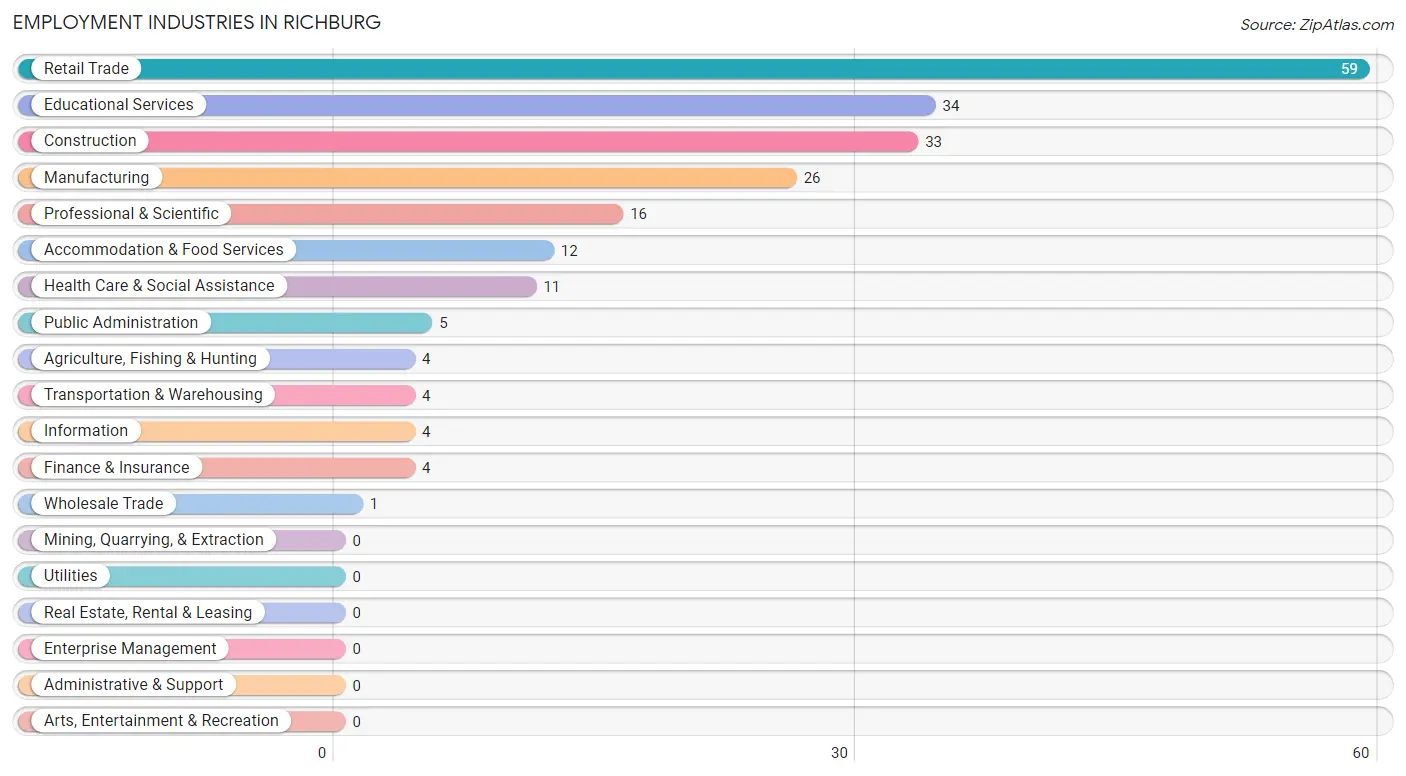
Employment Industries by Sex in Richburg
The Richburg industries that see more men than women are Agriculture, Fishing & Hunting (100.0%), Construction (100.0%), and Wholesale Trade (100.0%), whereas the industries that tend to have a higher number of women are Information (100.0%), Finance & Insurance (100.0%), and Health Care & Social Assistance (81.8%).
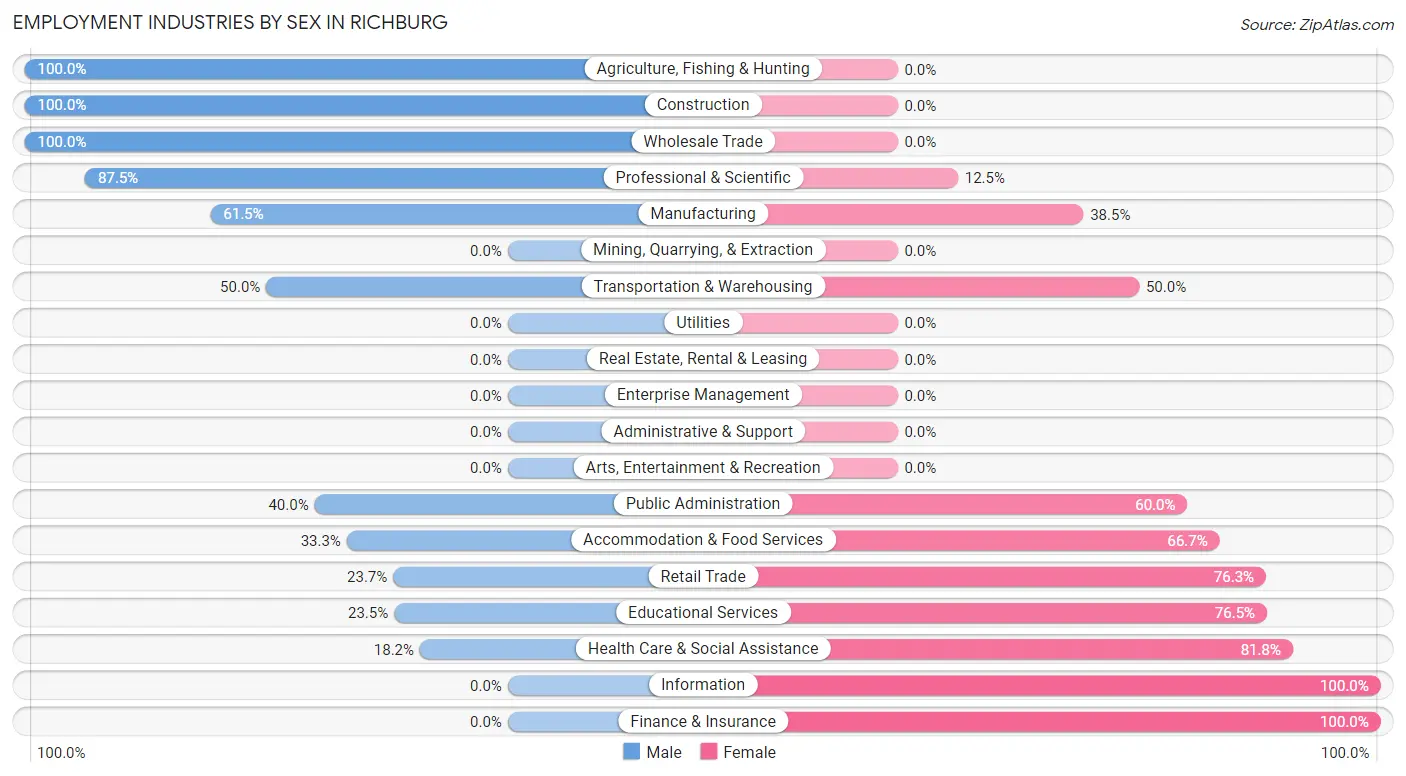
| Industry | Male | Female |
| Agriculture, Fishing & Hunting | 4 (100.0%) | 0 (0.0%) |
| Mining, Quarrying, & Extraction | 0 (0.0%) | 0 (0.0%) |
| Construction | 33 (100.0%) | 0 (0.0%) |
| Manufacturing | 16 (61.5%) | 10 (38.5%) |
| Wholesale Trade | 1 (100.0%) | 0 (0.0%) |
| Retail Trade | 14 (23.7%) | 45 (76.3%) |
| Transportation & Warehousing | 2 (50.0%) | 2 (50.0%) |
| Utilities | 0 (0.0%) | 0 (0.0%) |
| Information | 0 (0.0%) | 4 (100.0%) |
| Finance & Insurance | 0 (0.0%) | 4 (100.0%) |
| Real Estate, Rental & Leasing | 0 (0.0%) | 0 (0.0%) |
| Professional & Scientific | 14 (87.5%) | 2 (12.5%) |
| Enterprise Management | 0 (0.0%) | 0 (0.0%) |
| Administrative & Support | 0 (0.0%) | 0 (0.0%) |
| Educational Services | 8 (23.5%) | 26 (76.5%) |
| Health Care & Social Assistance | 2 (18.2%) | 9 (81.8%) |
| Arts, Entertainment & Recreation | 0 (0.0%) | 0 (0.0%) |
| Accommodation & Food Services | 4 (33.3%) | 8 (66.7%) |
| Public Administration | 2 (40.0%) | 3 (60.0%) |
| Total | 112 (49.3%) | 115 (50.7%) |
Education in Richburg
School Enrollment in Richburg
The most common levels of schooling among the 145 students in Richburg are kindergarten (56 | 38.6%), high school (37 | 25.5%), and middle school (31 | 21.4%).
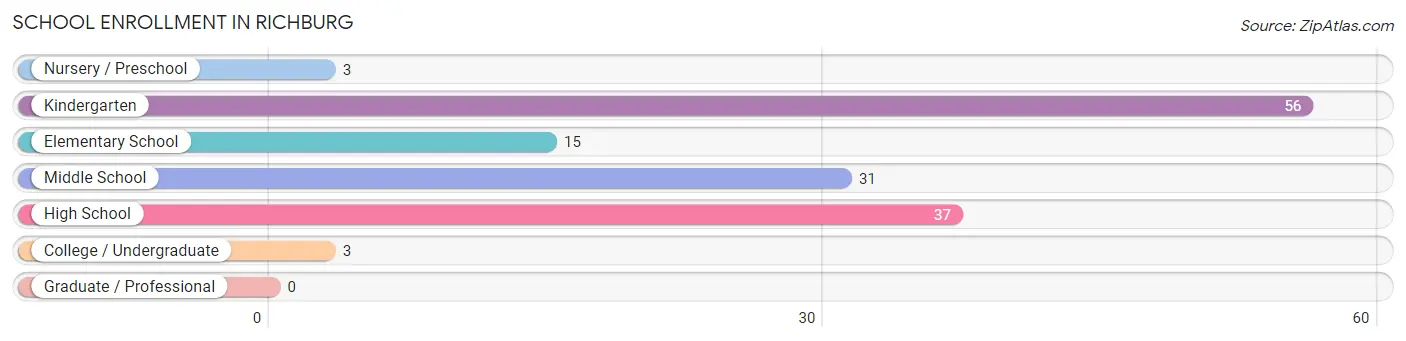
| School Level | # Students | % Students |
| Nursery / Preschool | 3 | 2.1% |
| Kindergarten | 56 | 38.6% |
| Elementary School | 15 | 10.3% |
| Middle School | 31 | 21.4% |
| High School | 37 | 25.5% |
| College / Undergraduate | 3 | 2.1% |
| Graduate / Professional | 0 | 0.0% |
| Total | 145 | 100.0% |
School Enrollment by Age by Funding Source in Richburg
Out of a total of 145 students who are enrolled in schools in Richburg, 55 (37.9%) attend a private institution, while the remaining 90 (62.1%) are enrolled in public schools. The age group of 25 to 34 year olds has the highest likelihood of being enrolled in private schools, with 1 (100.0% in the age bracket) enrolled. Conversely, the age group of 3 to 4 year olds has the lowest likelihood of being enrolled in a private school, with 3 (100.0% in the age bracket) attending a public institution.
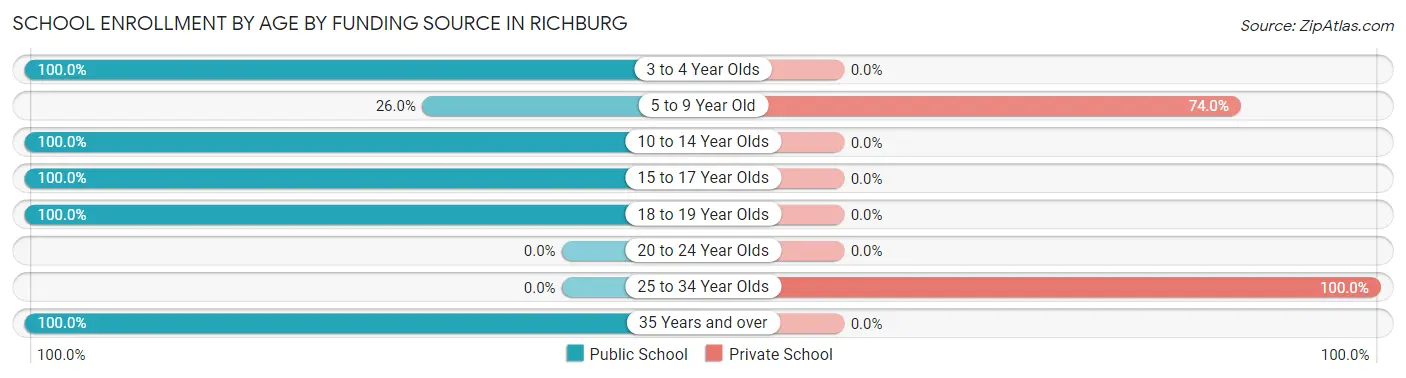
| Age Bracket | Public School | Private School |
| 3 to 4 Year Olds | 3 (100.0%) | 0 (0.0%) |
| 5 to 9 Year Old | 19 (26.0%) | 54 (74.0%) |
| 10 to 14 Year Olds | 29 (100.0%) | 0 (0.0%) |
| 15 to 17 Year Olds | 31 (100.0%) | 0 (0.0%) |
| 18 to 19 Year Olds | 6 (100.0%) | 0 (0.0%) |
| 20 to 24 Year Olds | 0 (0.0%) | 0 (0.0%) |
| 25 to 34 Year Olds | 0 (0.0%) | 1 (100.0%) |
| 35 Years and over | 2 (100.0%) | 0 (0.0%) |
| Total | 90 (62.1%) | 55 (37.9%) |
Educational Attainment by Field of Study in Richburg
Business (5 | 25.0%), bio, nature & agricultural (4 | 20.0%), engineering (4 | 20.0%), science & technology (4 | 20.0%), and liberal arts & history (2 | 10.0%) are the most common fields of study among 20 individuals in Richburg who have obtained a bachelor's degree or higher.
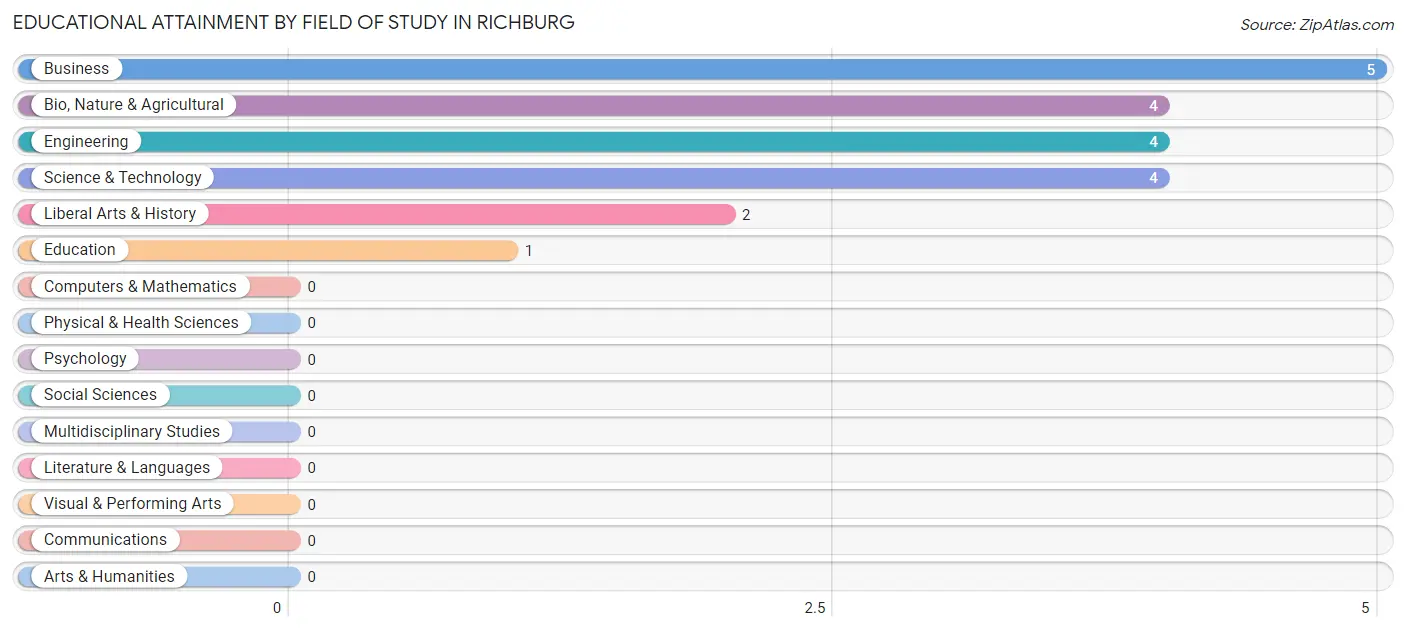
| Field of Study | # Graduates | % Graduates |
| Computers & Mathematics | 0 | 0.0% |
| Bio, Nature & Agricultural | 4 | 20.0% |
| Physical & Health Sciences | 0 | 0.0% |
| Psychology | 0 | 0.0% |
| Social Sciences | 0 | 0.0% |
| Engineering | 4 | 20.0% |
| Multidisciplinary Studies | 0 | 0.0% |
| Science & Technology | 4 | 20.0% |
| Business | 5 | 25.0% |
| Education | 1 | 5.0% |
| Literature & Languages | 0 | 0.0% |
| Liberal Arts & History | 2 | 10.0% |
| Visual & Performing Arts | 0 | 0.0% |
| Communications | 0 | 0.0% |
| Arts & Humanities | 0 | 0.0% |
| Total | 20 | 100.0% |
Transportation & Commute in Richburg
Vehicle Availability by Sex in Richburg
The most prevalent vehicle ownership categories in Richburg are males with 2 vehicles (30, accounting for 27.3%) and females with 2 vehicles (11, making up 26.3%).
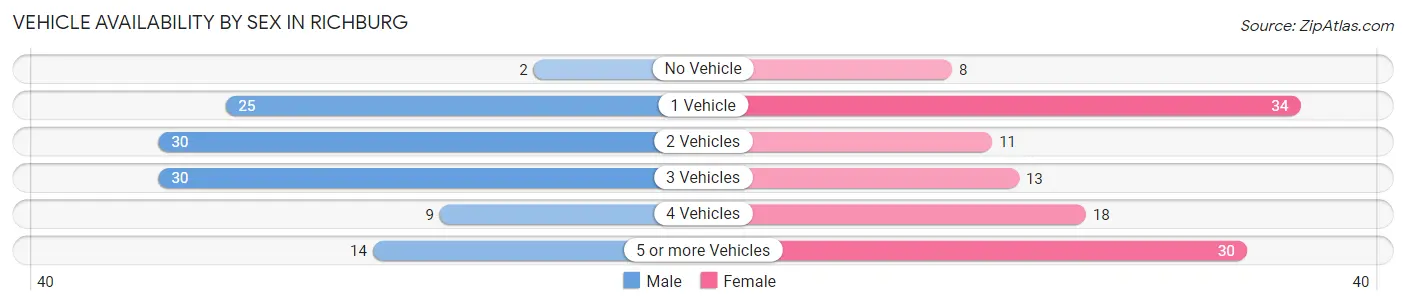
| Vehicles Available | Male | Female |
| No Vehicle | 2 (1.8%) | 8 (7.0%) |
| 1 Vehicle | 25 (22.7%) | 34 (29.8%) |
| 2 Vehicles | 30 (27.3%) | 11 (9.7%) |
| 3 Vehicles | 30 (27.3%) | 13 (11.4%) |
| 4 Vehicles | 9 (8.2%) | 18 (15.8%) |
| 5 or more Vehicles | 14 (12.7%) | 30 (26.3%) |
| Total | 110 (100.0%) | 114 (100.0%) |
Commute Time in Richburg
The most frequently occuring commute durations in Richburg are less than 5 minutes (35 commuters, 19.7%), 5 to 9 minutes (33 commuters, 18.5%), and 35 to 39 minutes (23 commuters, 12.9%).
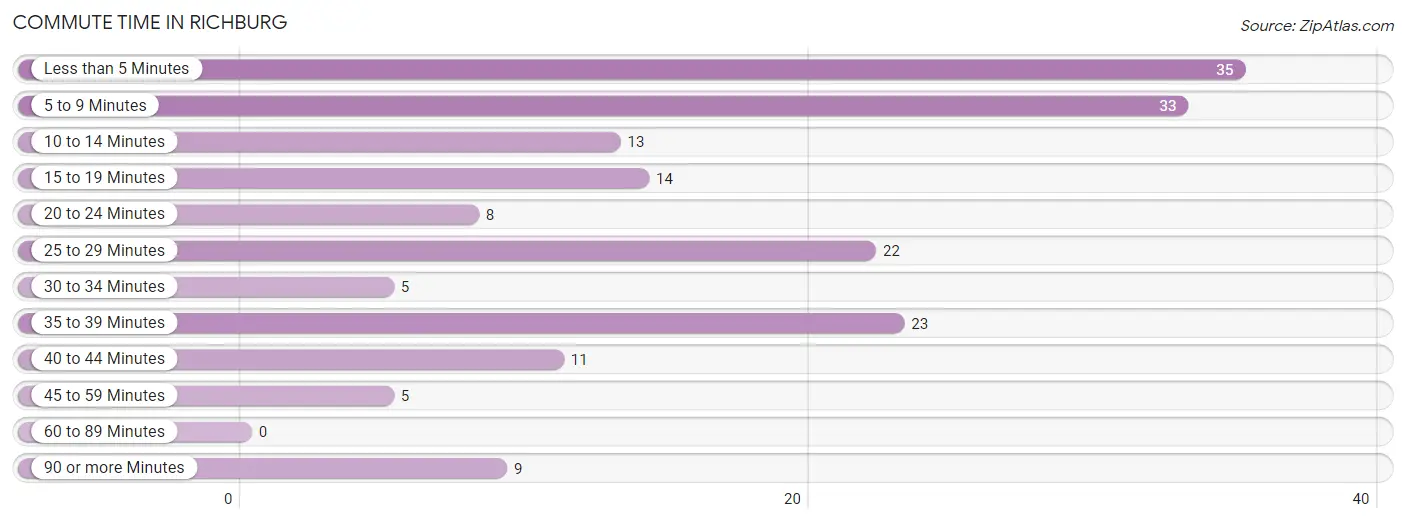
| Commute Time | # Commuters | % Commuters |
| Less than 5 Minutes | 35 | 19.7% |
| 5 to 9 Minutes | 33 | 18.5% |
| 10 to 14 Minutes | 13 | 7.3% |
| 15 to 19 Minutes | 14 | 7.9% |
| 20 to 24 Minutes | 8 | 4.5% |
| 25 to 29 Minutes | 22 | 12.4% |
| 30 to 34 Minutes | 5 | 2.8% |
| 35 to 39 Minutes | 23 | 12.9% |
| 40 to 44 Minutes | 11 | 6.2% |
| 45 to 59 Minutes | 5 | 2.8% |
| 60 to 89 Minutes | 0 | 0.0% |
| 90 or more Minutes | 9 | 5.1% |
Commute Time by Sex in Richburg
The most common commute times in Richburg are less than 5 minutes (19 commuters, 20.2%) for males and 35 to 39 minutes (20 commuters, 23.8%) for females.
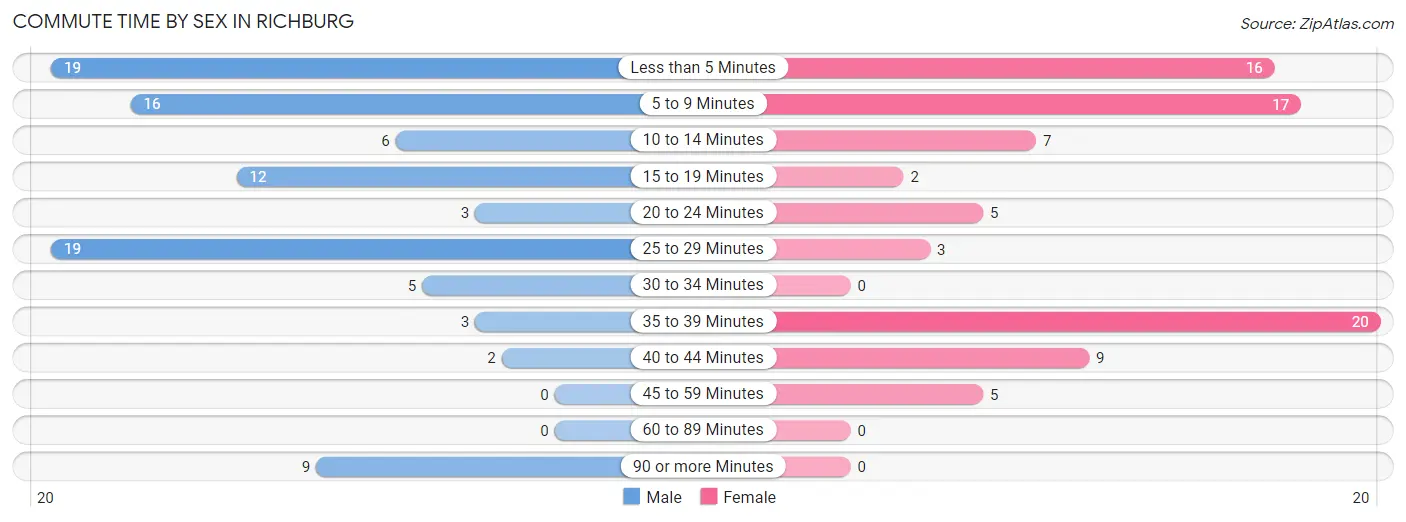
| Commute Time | Male | Female |
| Less than 5 Minutes | 19 (20.2%) | 16 (19.1%) |
| 5 to 9 Minutes | 16 (17.0%) | 17 (20.2%) |
| 10 to 14 Minutes | 6 (6.4%) | 7 (8.3%) |
| 15 to 19 Minutes | 12 (12.8%) | 2 (2.4%) |
| 20 to 24 Minutes | 3 (3.2%) | 5 (5.9%) |
| 25 to 29 Minutes | 19 (20.2%) | 3 (3.6%) |
| 30 to 34 Minutes | 5 (5.3%) | 0 (0.0%) |
| 35 to 39 Minutes | 3 (3.2%) | 20 (23.8%) |
| 40 to 44 Minutes | 2 (2.1%) | 9 (10.7%) |
| 45 to 59 Minutes | 0 (0.0%) | 5 (5.9%) |
| 60 to 89 Minutes | 0 (0.0%) | 0 (0.0%) |
| 90 or more Minutes | 9 (9.6%) | 0 (0.0%) |
Time of Departure to Work by Sex in Richburg
The most frequent times of departure to work in Richburg are 6:00 AM to 6:29 AM (25, 26.6%) for males and 6:00 AM to 6:29 AM (27, 32.1%) for females.
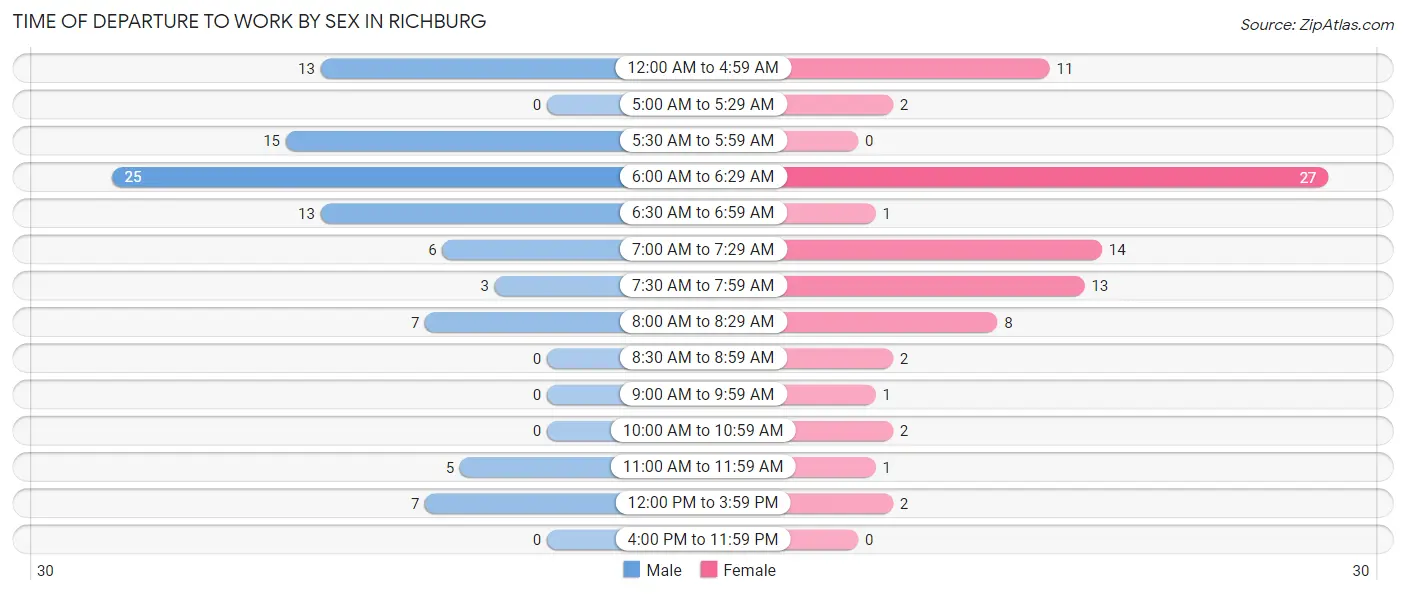
| Time of Departure | Male | Female |
| 12:00 AM to 4:59 AM | 13 (13.8%) | 11 (13.1%) |
| 5:00 AM to 5:29 AM | 0 (0.0%) | 2 (2.4%) |
| 5:30 AM to 5:59 AM | 15 (16.0%) | 0 (0.0%) |
| 6:00 AM to 6:29 AM | 25 (26.6%) | 27 (32.1%) |
| 6:30 AM to 6:59 AM | 13 (13.8%) | 1 (1.2%) |
| 7:00 AM to 7:29 AM | 6 (6.4%) | 14 (16.7%) |
| 7:30 AM to 7:59 AM | 3 (3.2%) | 13 (15.5%) |
| 8:00 AM to 8:29 AM | 7 (7.4%) | 8 (9.5%) |
| 8:30 AM to 8:59 AM | 0 (0.0%) | 2 (2.4%) |
| 9:00 AM to 9:59 AM | 0 (0.0%) | 1 (1.2%) |
| 10:00 AM to 10:59 AM | 0 (0.0%) | 2 (2.4%) |
| 11:00 AM to 11:59 AM | 5 (5.3%) | 1 (1.2%) |
| 12:00 PM to 3:59 PM | 7 (7.4%) | 2 (2.4%) |
| 4:00 PM to 11:59 PM | 0 (0.0%) | 0 (0.0%) |
| Total | 94 (100.0%) | 84 (100.0%) |
Housing Occupancy in Richburg
Occupancy by Ownership in Richburg
Of the total 169 dwellings in Richburg, owner-occupied units account for 119 (70.4%), while renter-occupied units make up 50 (29.6%).
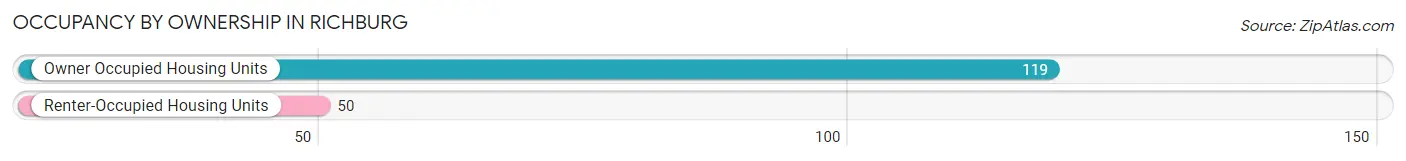
| Occupancy | # Housing Units | % Housing Units |
| Owner Occupied Housing Units | 119 | 70.4% |
| Renter-Occupied Housing Units | 50 | 29.6% |
| Total Occupied Housing Units | 169 | 100.0% |
Occupancy by Household Size in Richburg
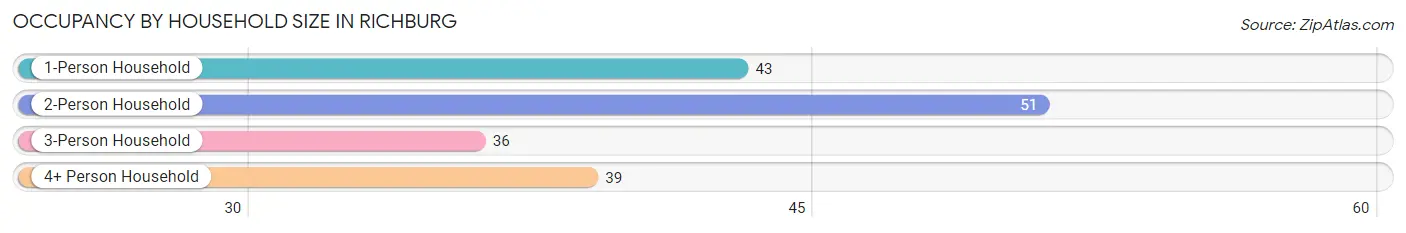
| Household Size | # Housing Units | % Housing Units |
| 1-Person Household | 43 | 25.4% |
| 2-Person Household | 51 | 30.2% |
| 3-Person Household | 36 | 21.3% |
| 4+ Person Household | 39 | 23.1% |
| Total Housing Units | 169 | 100.0% |
Occupancy by Ownership by Household Size in Richburg
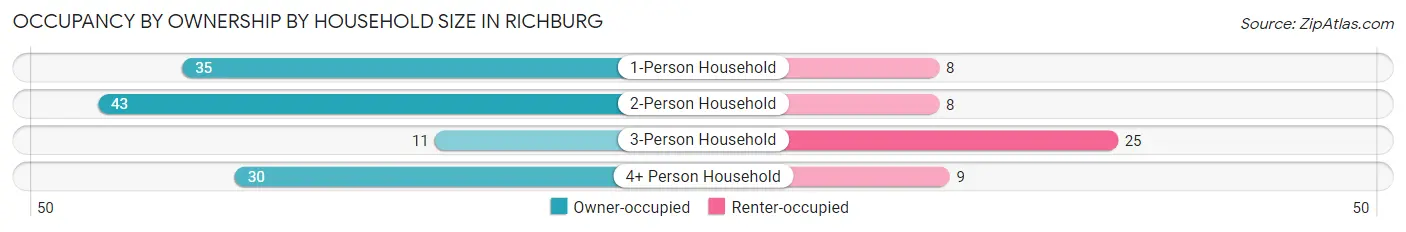
| Household Size | Owner-occupied | Renter-occupied |
| 1-Person Household | 35 (81.4%) | 8 (18.6%) |
| 2-Person Household | 43 (84.3%) | 8 (15.7%) |
| 3-Person Household | 11 (30.6%) | 25 (69.4%) |
| 4+ Person Household | 30 (76.9%) | 9 (23.1%) |
| Total Housing Units | 119 (70.4%) | 50 (29.6%) |
Occupancy by Educational Attainment in Richburg
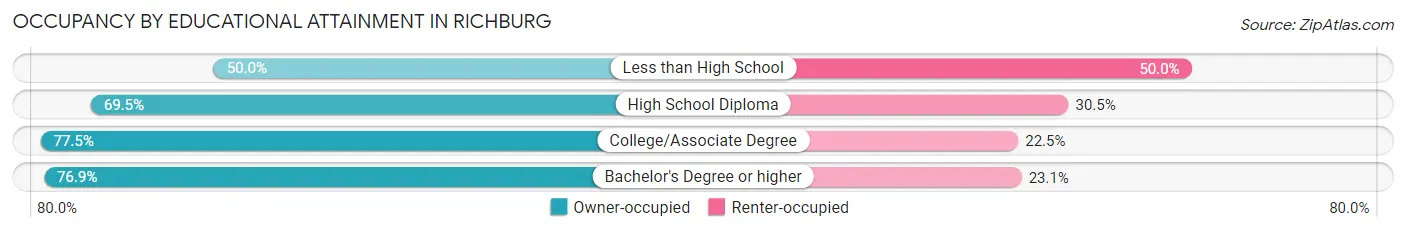
| Household Size | Owner-occupied | Renter-occupied |
| Less than High School | 13 (50.0%) | 13 (50.0%) |
| High School Diploma | 41 (69.5%) | 18 (30.5%) |
| College/Associate Degree | 55 (77.5%) | 16 (22.5%) |
| Bachelor's Degree or higher | 10 (76.9%) | 3 (23.1%) |
Occupancy by Age of Householder in Richburg
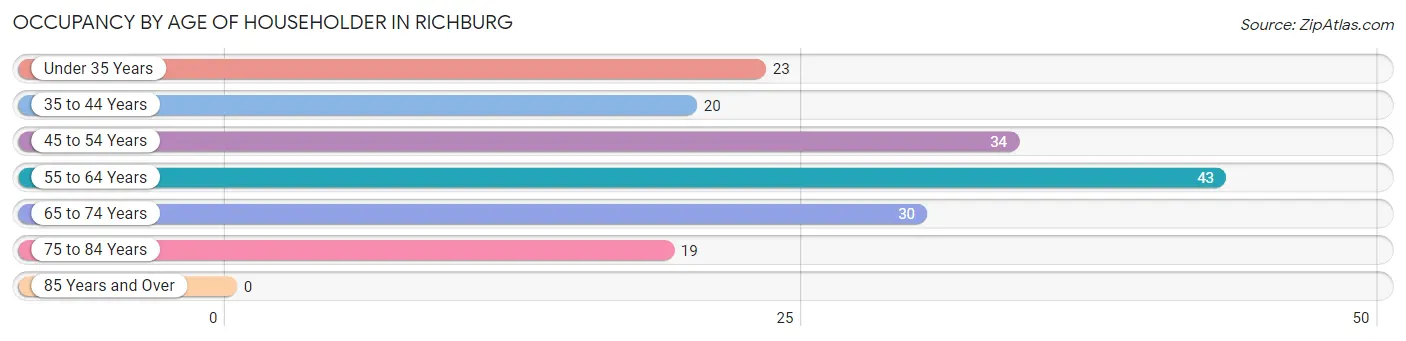
| Age Bracket | # Households | % Households |
| Under 35 Years | 23 | 13.6% |
| 35 to 44 Years | 20 | 11.8% |
| 45 to 54 Years | 34 | 20.1% |
| 55 to 64 Years | 43 | 25.4% |
| 65 to 74 Years | 30 | 17.7% |
| 75 to 84 Years | 19 | 11.2% |
| 85 Years and Over | 0 | 0.0% |
| Total | 169 | 100.0% |
Housing Finances in Richburg
Median Income by Occupancy in Richburg
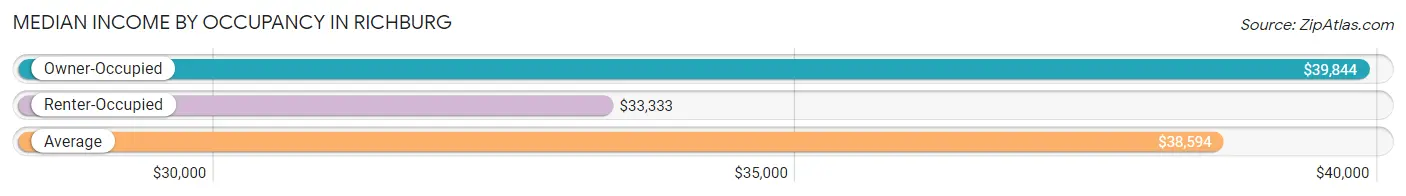
| Occupancy Type | # Households | Median Income |
| Owner-Occupied | 119 (70.4%) | $39,844 |
| Renter-Occupied | 50 (29.6%) | $33,333 |
| Average | 169 (100.0%) | $38,594 |
Occupancy by Householder Income Bracket in Richburg
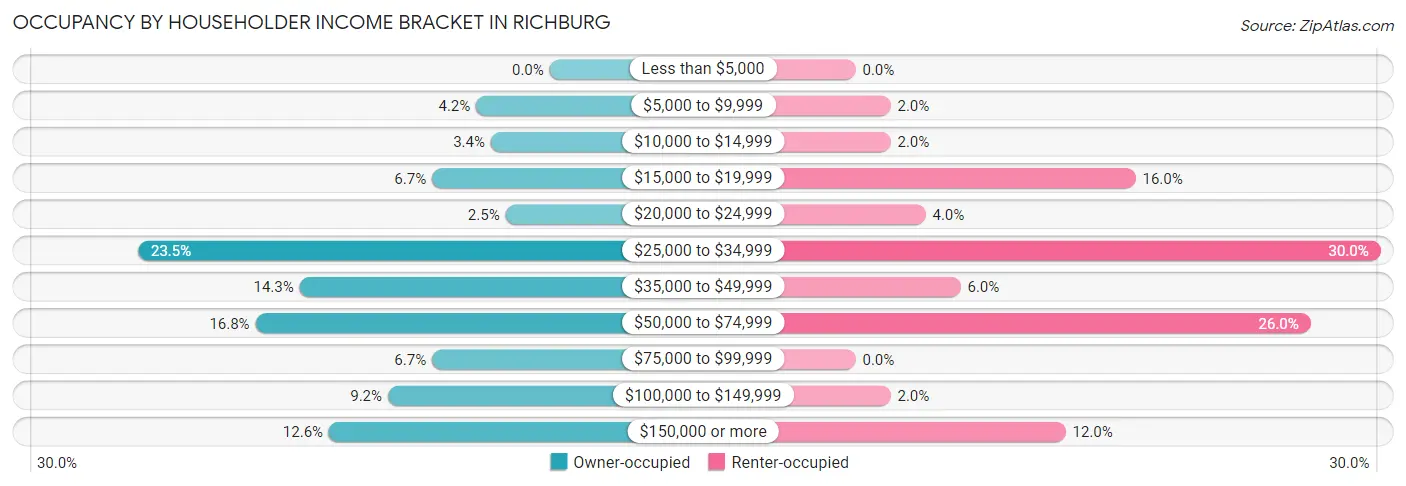
| Income Bracket | Owner-occupied | Renter-occupied |
| Less than $5,000 | 0 (0.0%) | 0 (0.0%) |
| $5,000 to $9,999 | 5 (4.2%) | 1 (2.0%) |
| $10,000 to $14,999 | 4 (3.4%) | 1 (2.0%) |
| $15,000 to $19,999 | 8 (6.7%) | 8 (16.0%) |
| $20,000 to $24,999 | 3 (2.5%) | 2 (4.0%) |
| $25,000 to $34,999 | 28 (23.5%) | 15 (30.0%) |
| $35,000 to $49,999 | 17 (14.3%) | 3 (6.0%) |
| $50,000 to $74,999 | 20 (16.8%) | 13 (26.0%) |
| $75,000 to $99,999 | 8 (6.7%) | 0 (0.0%) |
| $100,000 to $149,999 | 11 (9.2%) | 1 (2.0%) |
| $150,000 or more | 15 (12.6%) | 6 (12.0%) |
| Total | 119 (100.0%) | 50 (100.0%) |
Monthly Housing Cost Tiers in Richburg
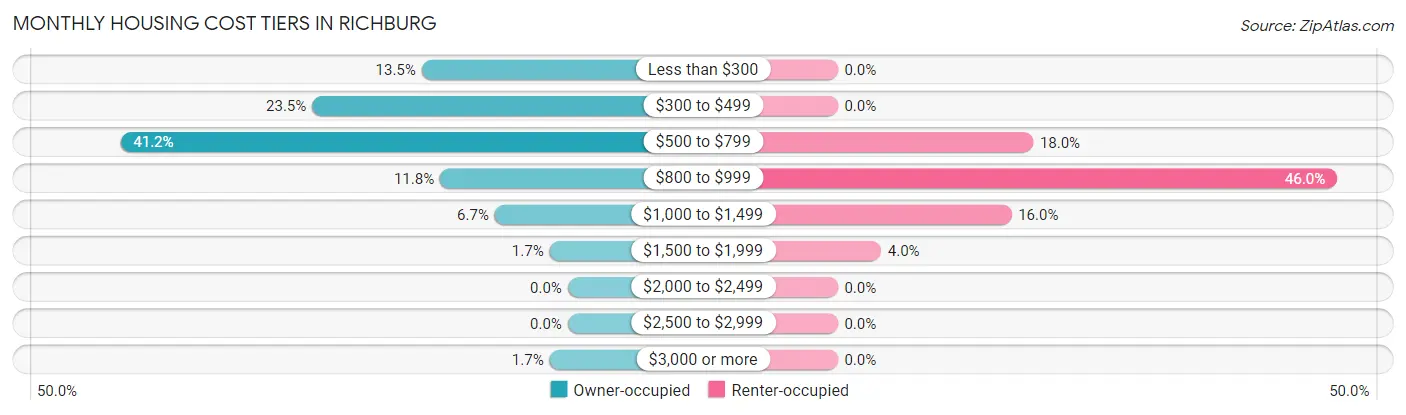
| Monthly Cost | Owner-occupied | Renter-occupied |
| Less than $300 | 16 (13.5%) | 0 (0.0%) |
| $300 to $499 | 28 (23.5%) | 0 (0.0%) |
| $500 to $799 | 49 (41.2%) | 9 (18.0%) |
| $800 to $999 | 14 (11.8%) | 23 (46.0%) |
| $1,000 to $1,499 | 8 (6.7%) | 8 (16.0%) |
| $1,500 to $1,999 | 2 (1.7%) | 2 (4.0%) |
| $2,000 to $2,499 | 0 (0.0%) | 0 (0.0%) |
| $2,500 to $2,999 | 0 (0.0%) | 0 (0.0%) |
| $3,000 or more | 2 (1.7%) | 0 (0.0%) |
| Total | 119 (100.0%) | 50 (100.0%) |
Physical Housing Characteristics in Richburg
Housing Structures in Richburg
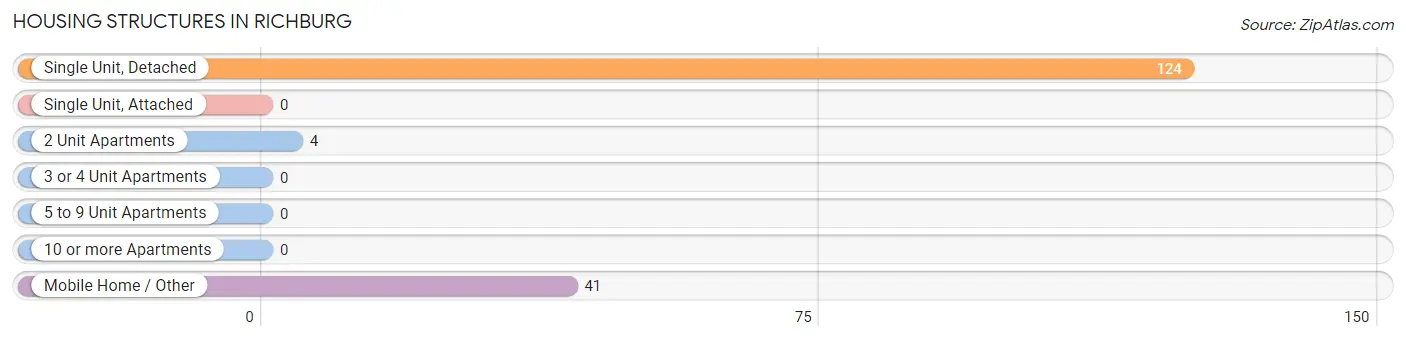
| Structure Type | # Housing Units | % Housing Units |
| Single Unit, Detached | 124 | 73.4% |
| Single Unit, Attached | 0 | 0.0% |
| 2 Unit Apartments | 4 | 2.4% |
| 3 or 4 Unit Apartments | 0 | 0.0% |
| 5 to 9 Unit Apartments | 0 | 0.0% |
| 10 or more Apartments | 0 | 0.0% |
| Mobile Home / Other | 41 | 24.3% |
| Total | 169 | 100.0% |
Housing Structures by Occupancy in Richburg
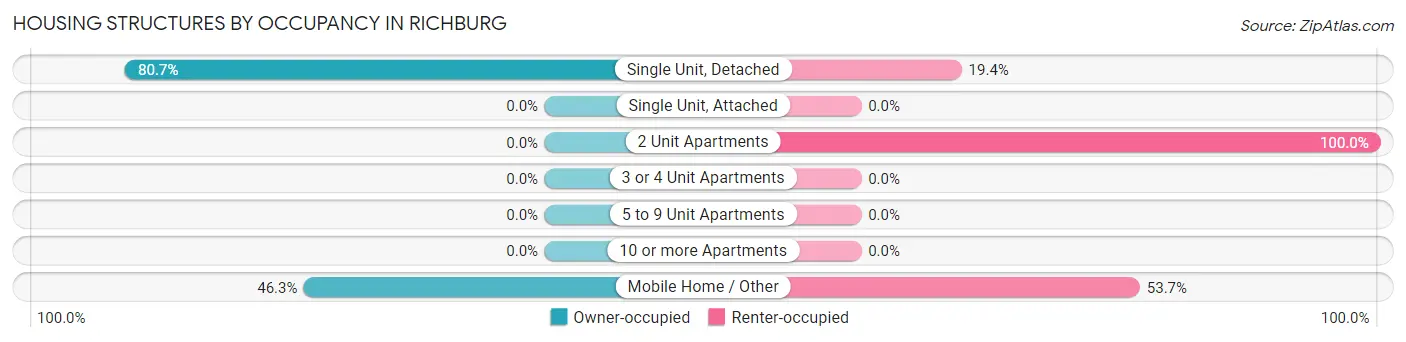
| Structure Type | Owner-occupied | Renter-occupied |
| Single Unit, Detached | 100 (80.6%) | 24 (19.4%) |
| Single Unit, Attached | 0 (0.0%) | 0 (0.0%) |
| 2 Unit Apartments | 0 (0.0%) | 4 (100.0%) |
| 3 or 4 Unit Apartments | 0 (0.0%) | 0 (0.0%) |
| 5 to 9 Unit Apartments | 0 (0.0%) | 0 (0.0%) |
| 10 or more Apartments | 0 (0.0%) | 0 (0.0%) |
| Mobile Home / Other | 19 (46.3%) | 22 (53.7%) |
| Total | 119 (70.4%) | 50 (29.6%) |
Housing Structures by Number of Rooms in Richburg
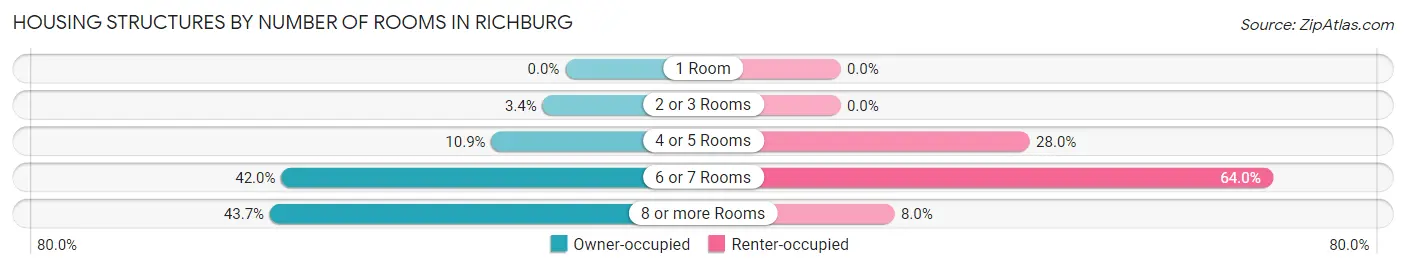
| Number of Rooms | Owner-occupied | Renter-occupied |
| 1 Room | 0 (0.0%) | 0 (0.0%) |
| 2 or 3 Rooms | 4 (3.4%) | 0 (0.0%) |
| 4 or 5 Rooms | 13 (10.9%) | 14 (28.0%) |
| 6 or 7 Rooms | 50 (42.0%) | 32 (64.0%) |
| 8 or more Rooms | 52 (43.7%) | 4 (8.0%) |
| Total | 119 (100.0%) | 50 (100.0%) |
Housing Structure by Heating Type in Richburg
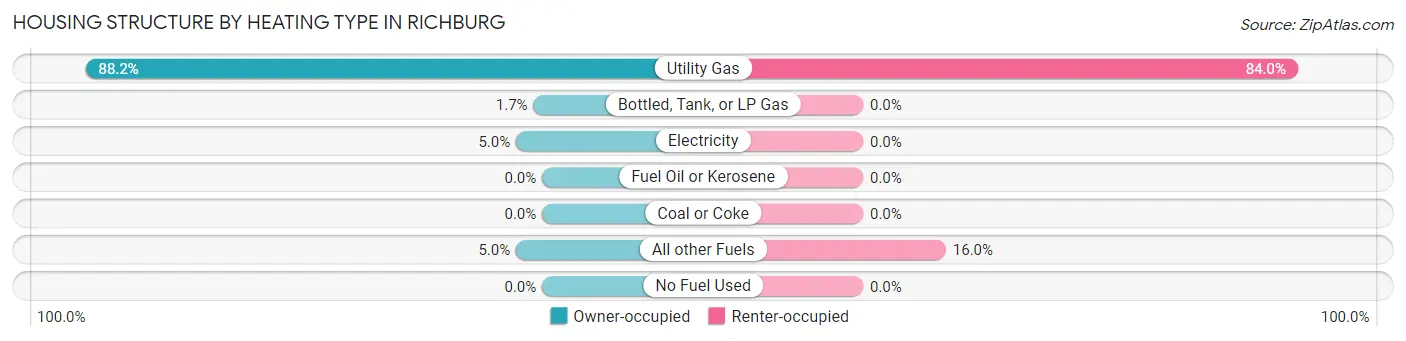
| Heating Type | Owner-occupied | Renter-occupied |
| Utility Gas | 105 (88.2%) | 42 (84.0%) |
| Bottled, Tank, or LP Gas | 2 (1.7%) | 0 (0.0%) |
| Electricity | 6 (5.0%) | 0 (0.0%) |
| Fuel Oil or Kerosene | 0 (0.0%) | 0 (0.0%) |
| Coal or Coke | 0 (0.0%) | 0 (0.0%) |
| All other Fuels | 6 (5.0%) | 8 (16.0%) |
| No Fuel Used | 0 (0.0%) | 0 (0.0%) |
| Total | 119 (100.0%) | 50 (100.0%) |
Household Vehicle Usage in Richburg
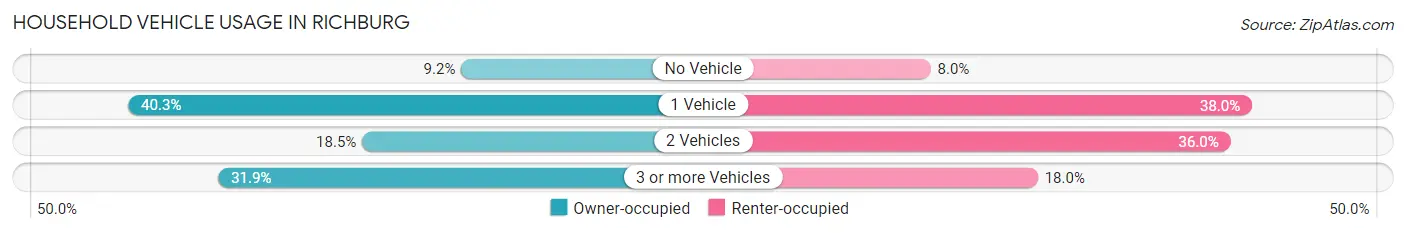
| Vehicles per Household | Owner-occupied | Renter-occupied |
| No Vehicle | 11 (9.2%) | 4 (8.0%) |
| 1 Vehicle | 48 (40.3%) | 19 (38.0%) |
| 2 Vehicles | 22 (18.5%) | 18 (36.0%) |
| 3 or more Vehicles | 38 (31.9%) | 9 (18.0%) |
| Total | 119 (100.0%) | 50 (100.0%) |
Real Estate & Mortgages in Richburg
Real Estate and Mortgage Overview in Richburg
| Characteristic | Without Mortgage | With Mortgage |
| Housing Units | 84 | 35 |
| Median Property Value | $70,500 | $59,300 |
| Median Household Income | $39,286 | $1 |
| Monthly Housing Costs | $487 | $0 |
| Real Estate Taxes | $2,250 | $0 |
Property Value by Mortgage Status in Richburg
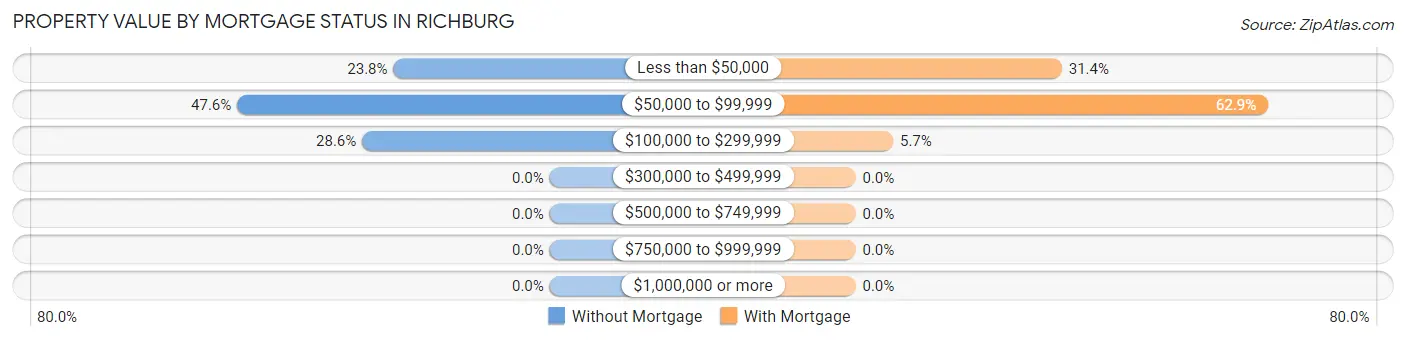
| Property Value | Without Mortgage | With Mortgage |
| Less than $50,000 | 20 (23.8%) | 11 (31.4%) |
| $50,000 to $99,999 | 40 (47.6%) | 22 (62.9%) |
| $100,000 to $299,999 | 24 (28.6%) | 2 (5.7%) |
| $300,000 to $499,999 | 0 (0.0%) | 0 (0.0%) |
| $500,000 to $749,999 | 0 (0.0%) | 0 (0.0%) |
| $750,000 to $999,999 | 0 (0.0%) | 0 (0.0%) |
| $1,000,000 or more | 0 (0.0%) | 0 (0.0%) |
| Total | 84 (100.0%) | 35 (100.0%) |
Household Income by Mortgage Status in Richburg
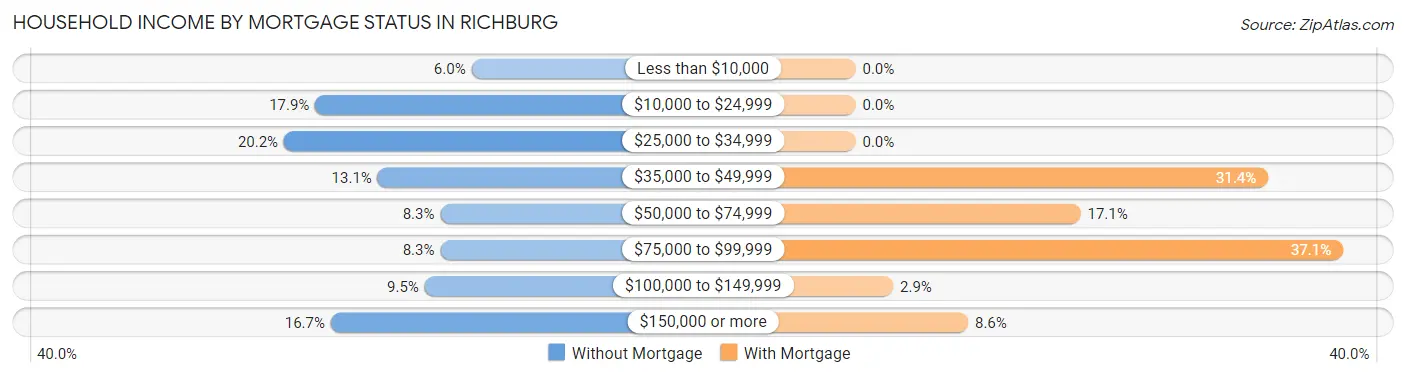
| Household Income | Without Mortgage | With Mortgage |
| Less than $10,000 | 5 (5.9%) | 0 (0.0%) |
| $10,000 to $24,999 | 15 (17.9%) | 0 (0.0%) |
| $25,000 to $34,999 | 17 (20.2%) | 0 (0.0%) |
| $35,000 to $49,999 | 11 (13.1%) | 11 (31.4%) |
| $50,000 to $74,999 | 7 (8.3%) | 6 (17.1%) |
| $75,000 to $99,999 | 7 (8.3%) | 13 (37.1%) |
| $100,000 to $149,999 | 8 (9.5%) | 1 (2.9%) |
| $150,000 or more | 14 (16.7%) | 3 (8.6%) |
| Total | 84 (100.0%) | 35 (100.0%) |
Property Value to Household Income Ratio in Richburg
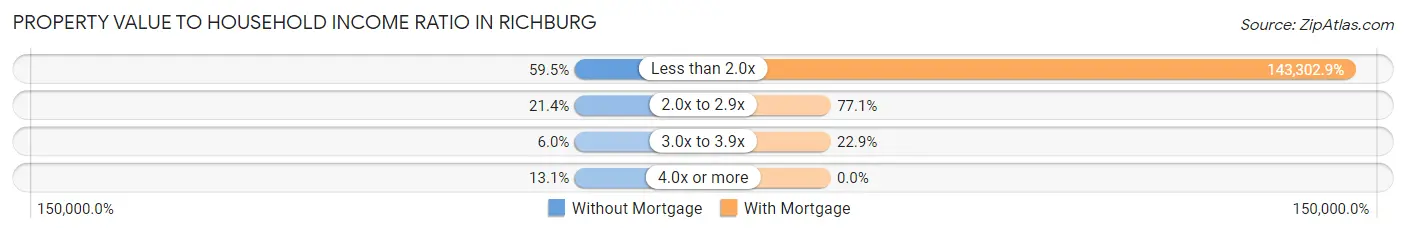
| Value-to-Income Ratio | Without Mortgage | With Mortgage |
| Less than 2.0x | 50 (59.5%) | 50,156 (143,302.9%) |
| 2.0x to 2.9x | 18 (21.4%) | 27 (77.1%) |
| 3.0x to 3.9x | 5 (5.9%) | 8 (22.9%) |
| 4.0x or more | 11 (13.1%) | 0 (0.0%) |
| Total | 84 (100.0%) | 35 (100.0%) |
Real Estate Taxes by Mortgage Status in Richburg
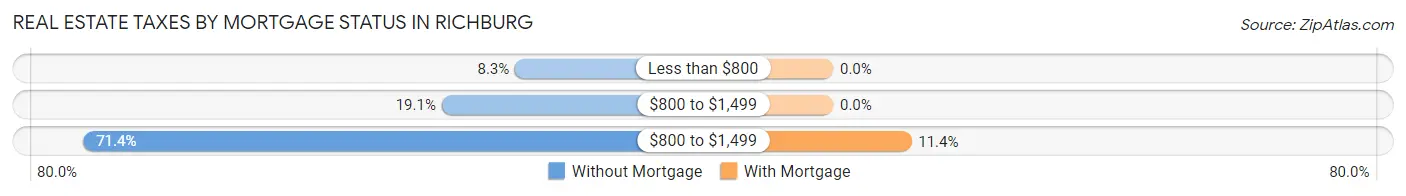
| Property Taxes | Without Mortgage | With Mortgage |
| Less than $800 | 7 (8.3%) | 0 (0.0%) |
| $800 to $1,499 | 16 (19.1%) | 0 (0.0%) |
| $800 to $1,499 | 60 (71.4%) | 4 (11.4%) |
| Total | 84 (100.0%) | 35 (100.0%) |
Health & Disability in Richburg
Health Insurance Coverage by Age in Richburg
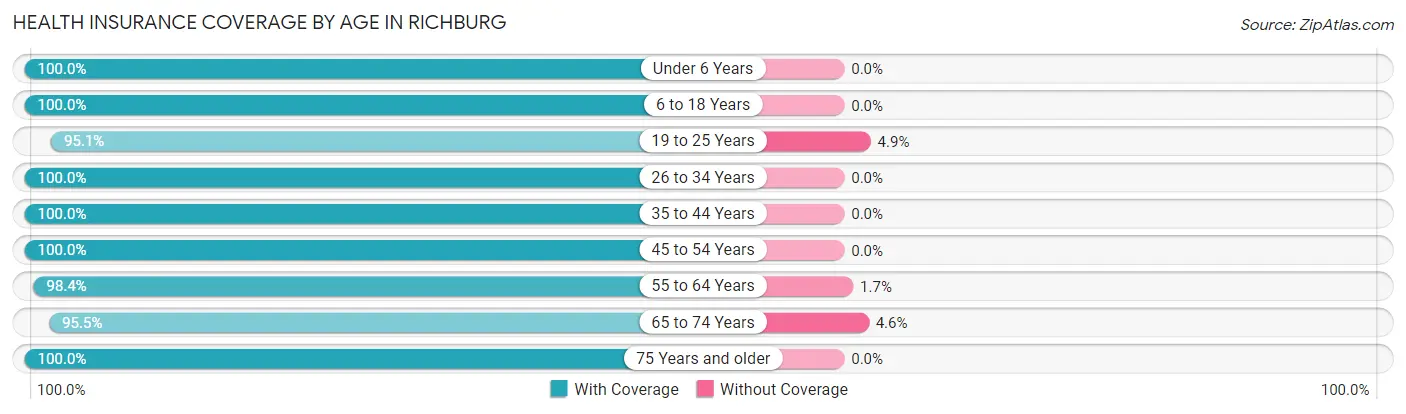
| Age Bracket | With Coverage | Without Coverage |
| Under 6 Years | 84 (100.0%) | 0 (0.0%) |
| 6 to 18 Years | 84 (100.0%) | 0 (0.0%) |
| 19 to 25 Years | 58 (95.1%) | 3 (4.9%) |
| 26 to 34 Years | 14 (100.0%) | 0 (0.0%) |
| 35 to 44 Years | 70 (100.0%) | 0 (0.0%) |
| 45 to 54 Years | 54 (100.0%) | 0 (0.0%) |
| 55 to 64 Years | 119 (98.4%) | 2 (1.7%) |
| 65 to 74 Years | 42 (95.5%) | 2 (4.5%) |
| 75 Years and older | 41 (100.0%) | 0 (0.0%) |
| Total | 566 (98.8%) | 7 (1.2%) |
Health Insurance Coverage by Citizenship Status in Richburg
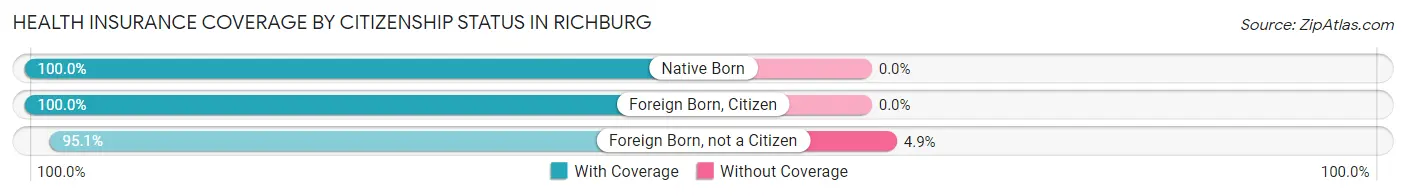
| Citizenship Status | With Coverage | Without Coverage |
| Native Born | 84 (100.0%) | 0 (0.0%) |
| Foreign Born, Citizen | 84 (100.0%) | 0 (0.0%) |
| Foreign Born, not a Citizen | 58 (95.1%) | 3 (4.9%) |
Health Insurance Coverage by Household Income in Richburg
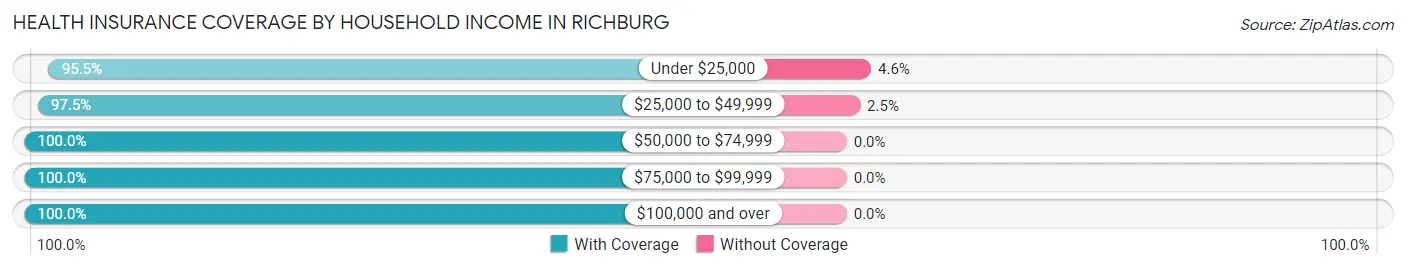
| Household Income | With Coverage | Without Coverage |
| Under $25,000 | 63 (95.5%) | 3 (4.5%) |
| $25,000 to $49,999 | 156 (97.5%) | 4 (2.5%) |
| $50,000 to $74,999 | 85 (100.0%) | 0 (0.0%) |
| $75,000 to $99,999 | 29 (100.0%) | 0 (0.0%) |
| $100,000 and over | 233 (100.0%) | 0 (0.0%) |
Public vs Private Health Insurance Coverage by Age in Richburg
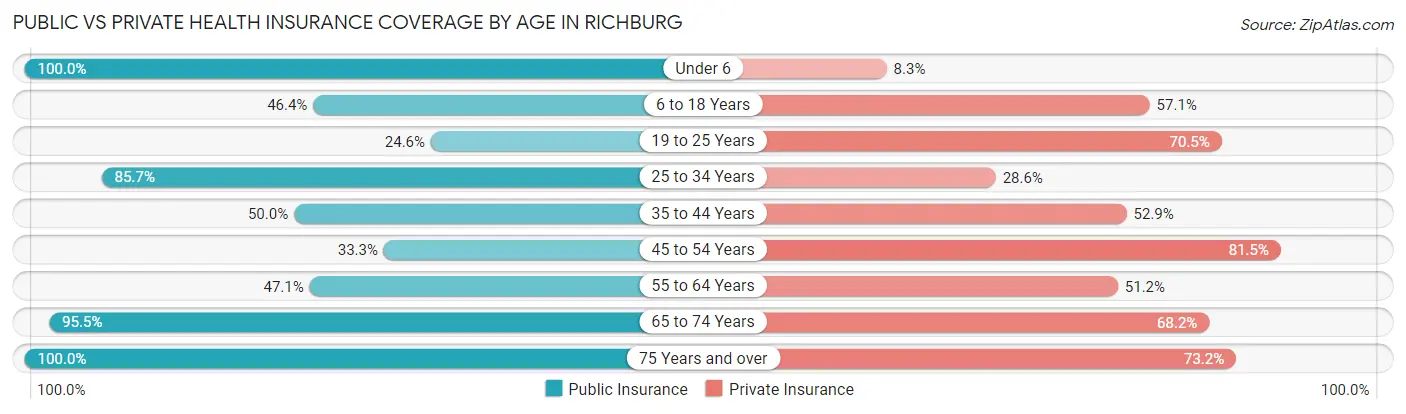
| Age Bracket | Public Insurance | Private Insurance |
| Under 6 | 84 (100.0%) | 7 (8.3%) |
| 6 to 18 Years | 39 (46.4%) | 48 (57.1%) |
| 19 to 25 Years | 15 (24.6%) | 43 (70.5%) |
| 25 to 34 Years | 12 (85.7%) | 4 (28.6%) |
| 35 to 44 Years | 35 (50.0%) | 37 (52.9%) |
| 45 to 54 Years | 18 (33.3%) | 44 (81.5%) |
| 55 to 64 Years | 57 (47.1%) | 62 (51.2%) |
| 65 to 74 Years | 42 (95.5%) | 30 (68.2%) |
| 75 Years and over | 41 (100.0%) | 30 (73.2%) |
| Total | 343 (59.9%) | 305 (53.2%) |
Disability Status by Sex by Age in Richburg
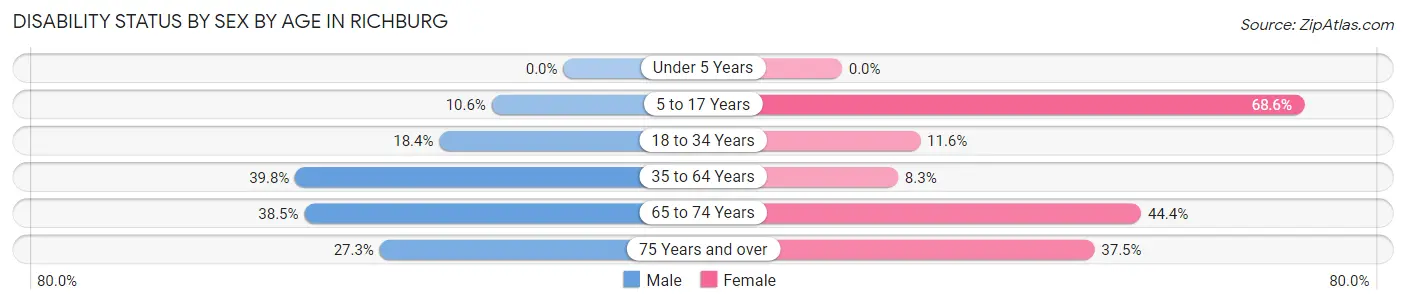
| Age Bracket | Male | Female |
| Under 5 Years | 0 (0.0%) | 0 (0.0%) |
| 5 to 17 Years | 5 (10.6%) | 59 (68.6%) |
| 18 to 34 Years | 7 (18.4%) | 5 (11.6%) |
| 35 to 64 Years | 45 (39.8%) | 11 (8.3%) |
| 65 to 74 Years | 10 (38.5%) | 8 (44.4%) |
| 75 Years and over | 9 (27.3%) | 3 (37.5%) |
Disability Class by Sex by Age in Richburg
Disability Class: Hearing Difficulty
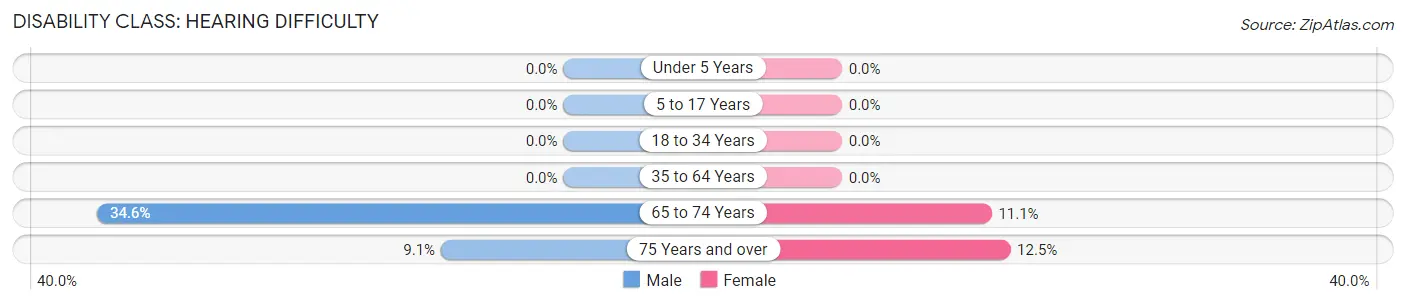
| Age Bracket | Male | Female |
| Under 5 Years | 0 (0.0%) | 0 (0.0%) |
| 5 to 17 Years | 0 (0.0%) | 0 (0.0%) |
| 18 to 34 Years | 0 (0.0%) | 0 (0.0%) |
| 35 to 64 Years | 0 (0.0%) | 0 (0.0%) |
| 65 to 74 Years | 9 (34.6%) | 2 (11.1%) |
| 75 Years and over | 3 (9.1%) | 1 (12.5%) |
Disability Class: Vision Difficulty
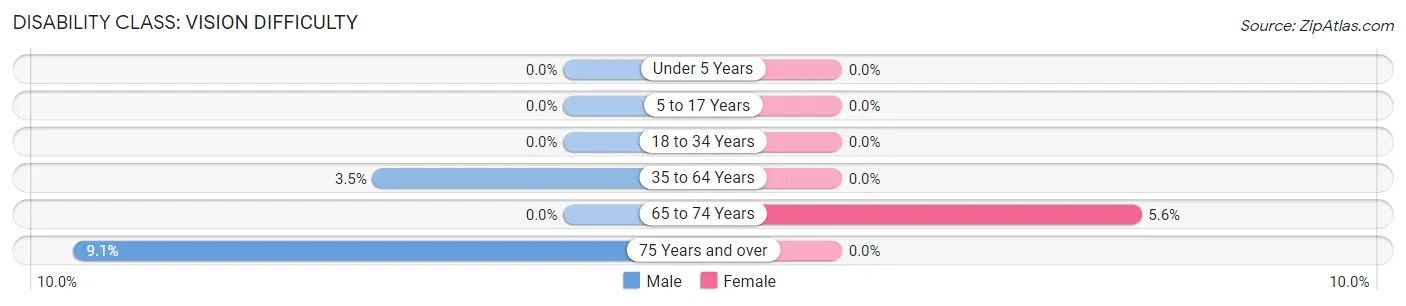
| Age Bracket | Male | Female |
| Under 5 Years | 0 (0.0%) | 0 (0.0%) |
| 5 to 17 Years | 0 (0.0%) | 0 (0.0%) |
| 18 to 34 Years | 0 (0.0%) | 0 (0.0%) |
| 35 to 64 Years | 4 (3.5%) | 0 (0.0%) |
| 65 to 74 Years | 0 (0.0%) | 1 (5.6%) |
| 75 Years and over | 3 (9.1%) | 0 (0.0%) |
Disability Class: Cognitive Difficulty
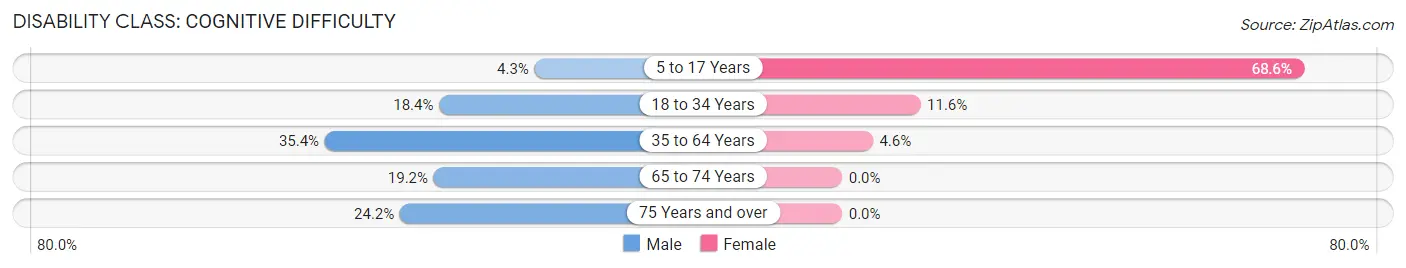
| Age Bracket | Male | Female |
| 5 to 17 Years | 2 (4.3%) | 59 (68.6%) |
| 18 to 34 Years | 7 (18.4%) | 5 (11.6%) |
| 35 to 64 Years | 40 (35.4%) | 6 (4.5%) |
| 65 to 74 Years | 5 (19.2%) | 0 (0.0%) |
| 75 Years and over | 8 (24.2%) | 0 (0.0%) |
Disability Class: Ambulatory Difficulty
| Age Bracket | Male | Female |
| 5 to 17 Years | 3 (6.4%) | 0 (0.0%) |
| 18 to 34 Years | 0 (0.0%) | 0 (0.0%) |
| 35 to 64 Years | 39 (34.5%) | 9 (6.8%) |
| 65 to 74 Years | 4 (15.4%) | 8 (44.4%) |
| 75 Years and over | 8 (24.2%) | 2 (25.0%) |
Disability Class: Self-Care Difficulty
| Age Bracket | Male | Female |
| 5 to 17 Years | 2 (4.3%) | 0 (0.0%) |
| 18 to 34 Years | 0 (0.0%) | 0 (0.0%) |
| 35 to 64 Years | 2 (1.8%) | 5 (3.8%) |
| 65 to 74 Years | 0 (0.0%) | 4 (22.2%) |
| 75 Years and over | 0 (0.0%) | 0 (0.0%) |
Technology Access in Richburg
Computing Device Access in Richburg
| Device Type | # Households | % Households |
| Desktop or Laptop | 121 | 71.6% |
| Smartphone | 131 | 77.5% |
| Tablet | 96 | 56.8% |
| No Computing Device | 21 | 12.4% |
| Total | 169 | 100.0% |
Internet Access in Richburg
| Internet Type | # Households | % Households |
| Dial-Up Internet | 0 | 0.0% |
| Broadband Home | 114 | 67.5% |
| Cellular Data Only | 19 | 11.2% |
| Satellite Internet | 6 | 3.5% |
| No Internet | 23 | 13.6% |
| Total | 169 | 100.0% |
Richburg Summary
Richburg is a small village located in the town of Ischua in Cattaraugus County, New York. It is situated on the banks of the Ischua Creek, a tributary of the Allegheny River. The village is located approximately 25 miles south of Buffalo and 30 miles east of Jamestown. The population of Richburg was estimated to be 545 in the year 2000.
History
Richburg was first settled in 1820 by a group of settlers from Connecticut. The village was originally known as “Richardsburg” after the first settler, Richard Smith. The name was later changed to Richburg. The village was incorporated in 1851.
In the late 19th century, Richburg was a thriving industrial center. It was home to several factories, including a sawmill, a gristmill, a tannery, a woolen mill, and a furniture factory. The village also had a railroad station, which connected it to the rest of the region.
Geography
Richburg is located in the foothills of the Allegheny Mountains. The village is situated on the banks of the Ischua Creek, which flows through the village and empties into the Allegheny River. The village is surrounded by rolling hills and forests.
The climate in Richburg is typical of the Northeastern United States. Summers are warm and humid, while winters are cold and snowy. The average annual temperature is around 50 degrees Fahrenheit.
Economy
The economy of Richburg is largely based on agriculture and tourism. The village is home to several farms, which produce a variety of crops, including corn, soybeans, and hay. The village also has several small businesses, including a grocery store, a hardware store, and a restaurant.
Tourism is an important part of the local economy. The village is home to several attractions, including the Ischua Creek Nature Preserve, the Richburg Historical Society Museum, and the Richburg Railroad Station.
Demographics
The population of Richburg was estimated to be 545 in the year 2000. The racial makeup of the village was 97.3% White, 0.7% African American, 0.2% Native American, 0.2% Asian, and 1.6% from other races. The median household income was $35,000. The median age was 40 years.
Richburg is a small, rural village with a rich history and a strong sense of community. The village is home to a variety of businesses and attractions, and it is a popular destination for tourists. The village is a great place to live, work, and raise a family.
Common Questions
What is Per Capita Income in Richburg?
Per Capita income in Richburg is $22,040.
What is the Median Family Income in Richburg?
Median Family Income in Richburg is $38,750.
What is the Median Household income in Richburg?
Median Household Income in Richburg is $38,594.
What is Income or Wage Gap in Richburg?
Income or Wage Gap in Richburg is 28.9%.
Women in Richburg earn 71.1 cents for every dollar earned by a man.
What is Inequality or Gini Index in Richburg?
Inequality or Gini Index in Richburg is 0.46.
What is the Total Population of Richburg?
Total Population of Richburg is 573.
What is the Total Male Population of Richburg?
Total Male Population of Richburg is 276.
What is the Total Female Population of Richburg?
Total Female Population of Richburg is 297.
What is the Ratio of Males per 100 Females in Richburg?
There are 92.93 Males per 100 Females in Richburg.
What is the Ratio of Females per 100 Males in Richburg?
There are 107.61 Females per 100 Males in Richburg.
What is the Median Population Age in Richburg?
Median Population Age in Richburg is 40.9 Years.
What is the Average Family Size in Richburg
Average Family Size in Richburg is 3.1 People.
What is the Average Household Size in Richburg
Average Household Size in Richburg is 3.4 People.
How Large is the Labor Force in Richburg?
There are 237 People in the Labor Forcein in Richburg.
What is the Percentage of People in the Labor Force in Richburg?
55.0% of People are in the Labor Force in Richburg.
What is the Unemployment Rate in Richburg?
Unemployment Rate in Richburg is 4.2%.