South Blooming Grove, NY Map & Demographics
South Blooming Grove Map
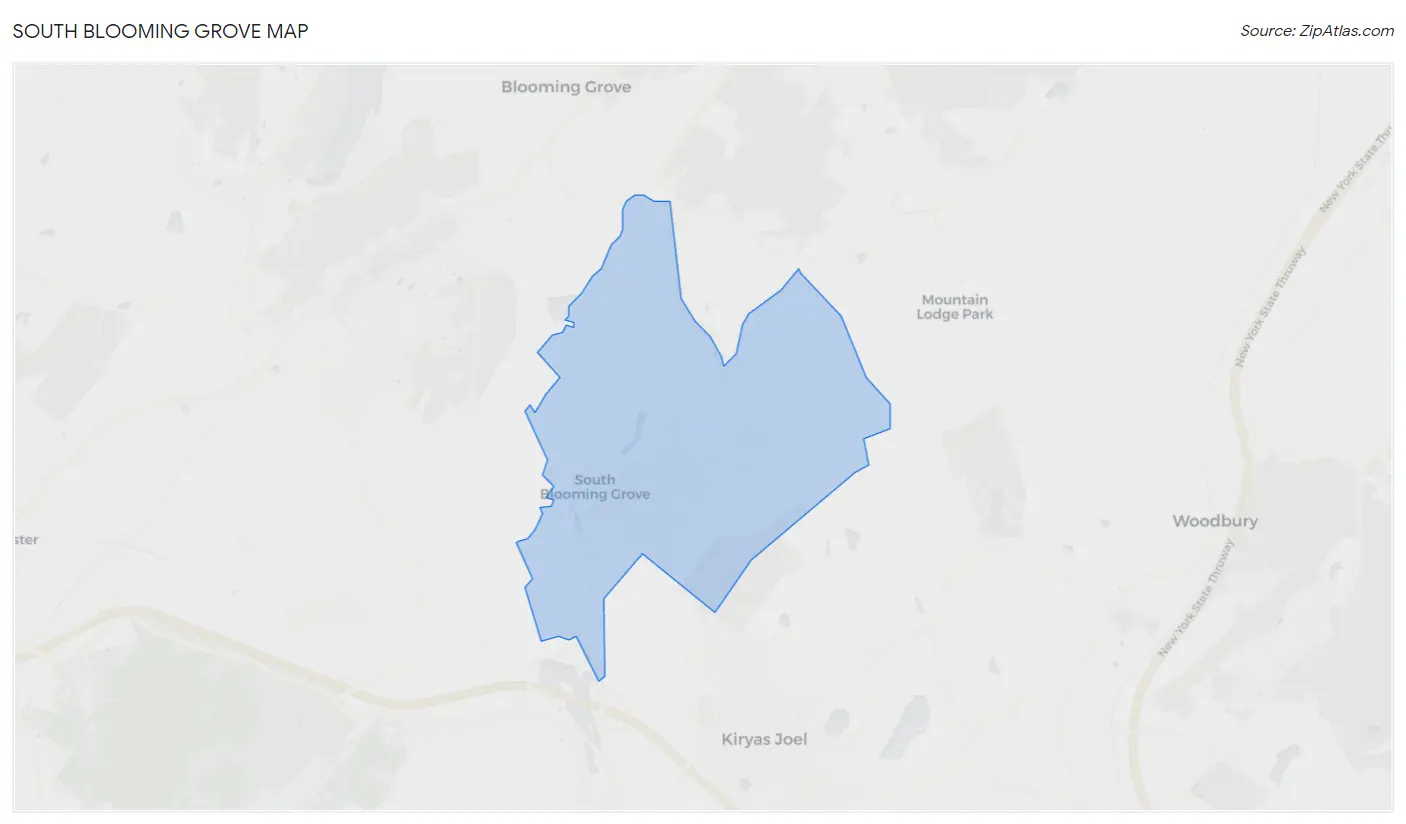
South Blooming Grove Overview
$26,721
PER CAPITA INCOME
$82,679
AVG FAMILY INCOME
$72,063
AVG HOUSEHOLD INCOME
37.6%
WAGE / INCOME GAP [ % ]
62.4¢/ $1
WAGE / INCOME GAP [ $ ]
0.41
INEQUALITY / GINI INDEX
3,858
TOTAL POPULATION
1,866
MALE POPULATION
1,992
FEMALE POPULATION
93.67
MALES / 100 FEMALES
106.75
FEMALES / 100 MALES
25.9
MEDIAN AGE
4.6
AVG FAMILY SIZE
3.3
AVG HOUSEHOLD SIZE
1,438
LABOR FORCE [ PEOPLE ]
61.0%
PERCENT IN LABOR FORCE
13.0%
UNEMPLOYMENT RATE
Income in South Blooming Grove
Income Overview in South Blooming Grove
Per Capita Income in South Blooming Grove is $26,721, while median incomes of families and households are $82,679 and $72,063 respectively.
| Characteristic | Number | Measure |
| Per Capita Income | 3,858 | $26,721 |
| Median Family Income | 707 | $82,679 |
| Mean Family Income | 707 | $94,268 |
| Median Household Income | 1,177 | $72,063 |
| Mean Household Income | 1,177 | $86,458 |
| Income Deficit | 707 | $0 |
| Wage / Income Gap (%) | 3,858 | 37.62% |
| Wage / Income Gap ($) | 3,858 | 62.38¢ per $1 |
| Gini / Inequality Index | 3,858 | 0.41 |
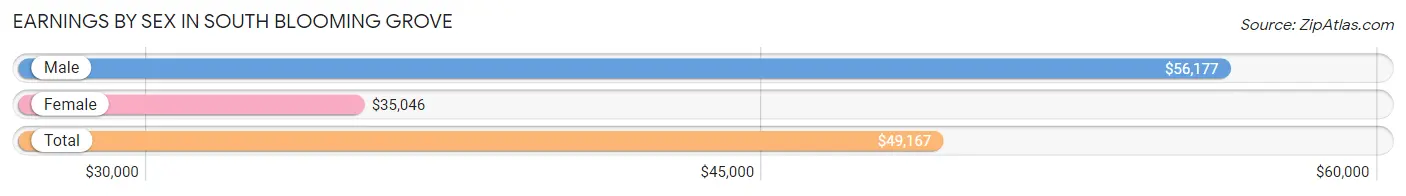
Earnings by Sex in South Blooming Grove
Average Earnings in South Blooming Grove are $49,167, $56,177 for men and $35,046 for women, a difference of 37.6%.
| Sex | Number | Average Earnings |
| Male | 751 (54.8%) | $56,177 |
| Female | 619 (45.2%) | $35,046 |
| Total | 1,370 (100.0%) | $49,167 |
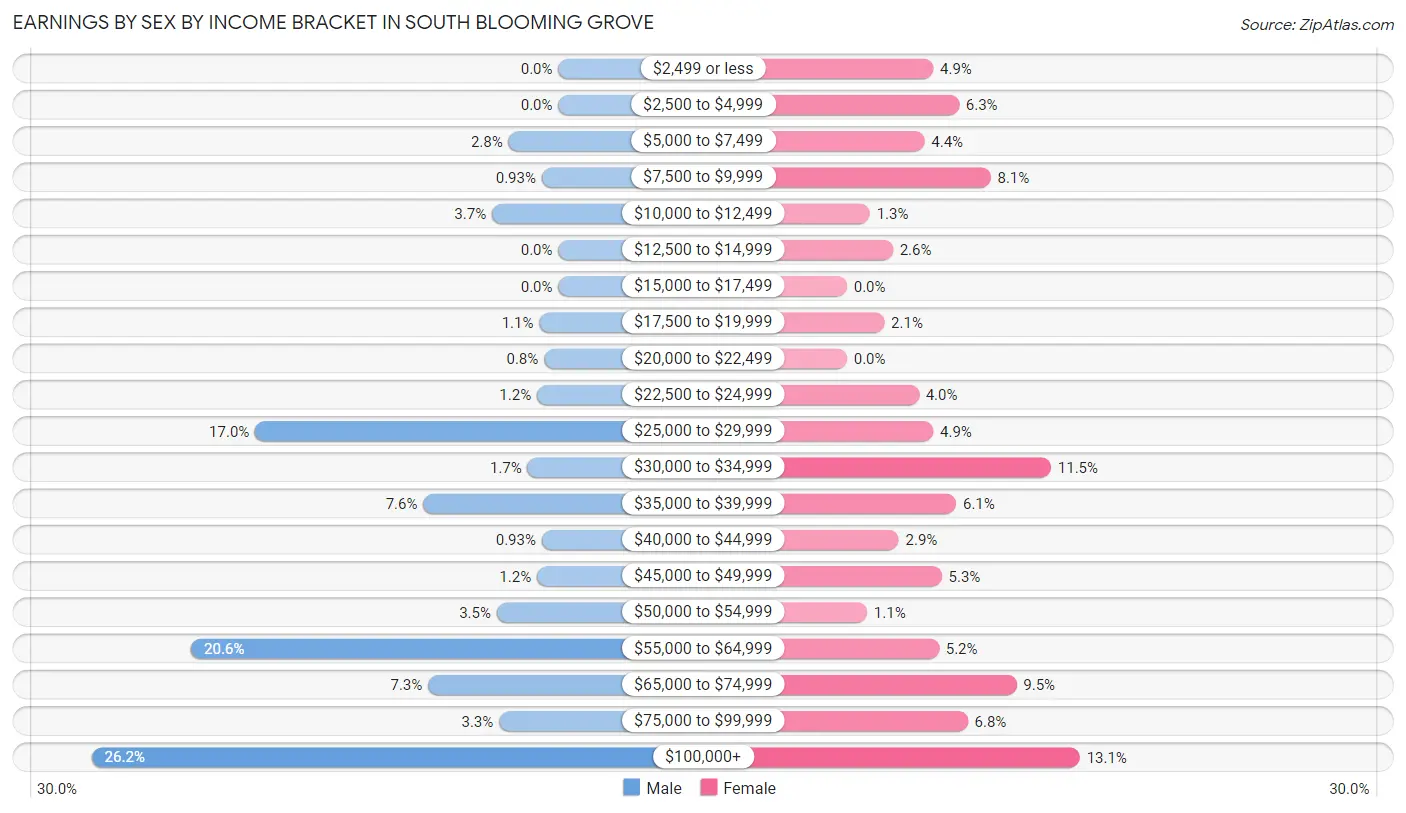
Earnings by Sex by Income Bracket in South Blooming Grove
The most common earnings brackets in South Blooming Grove are $100,000+ for men (197 | 26.2%) and $100,000+ for women (81 | 13.1%).
| Income | Male | Female |
| $2,499 or less | 0 (0.0%) | 30 (4.9%) |
| $2,500 to $4,999 | 0 (0.0%) | 39 (6.3%) |
| $5,000 to $7,499 | 21 (2.8%) | 27 (4.4%) |
| $7,500 to $9,999 | 7 (0.9%) | 50 (8.1%) |
| $10,000 to $12,499 | 28 (3.7%) | 8 (1.3%) |
| $12,500 to $14,999 | 0 (0.0%) | 16 (2.6%) |
| $15,000 to $17,499 | 0 (0.0%) | 0 (0.0%) |
| $17,500 to $19,999 | 8 (1.1%) | 13 (2.1%) |
| $20,000 to $22,499 | 6 (0.8%) | 0 (0.0%) |
| $22,500 to $24,999 | 9 (1.2%) | 25 (4.0%) |
| $25,000 to $29,999 | 128 (17.0%) | 30 (4.9%) |
| $30,000 to $34,999 | 13 (1.7%) | 71 (11.5%) |
| $35,000 to $39,999 | 57 (7.6%) | 38 (6.1%) |
| $40,000 to $44,999 | 7 (0.9%) | 18 (2.9%) |
| $45,000 to $49,999 | 9 (1.2%) | 33 (5.3%) |
| $50,000 to $54,999 | 26 (3.5%) | 7 (1.1%) |
| $55,000 to $64,999 | 155 (20.6%) | 32 (5.2%) |
| $65,000 to $74,999 | 55 (7.3%) | 59 (9.5%) |
| $75,000 to $99,999 | 25 (3.3%) | 42 (6.8%) |
| $100,000+ | 197 (26.2%) | 81 (13.1%) |
| Total | 751 (100.0%) | 619 (100.0%) |
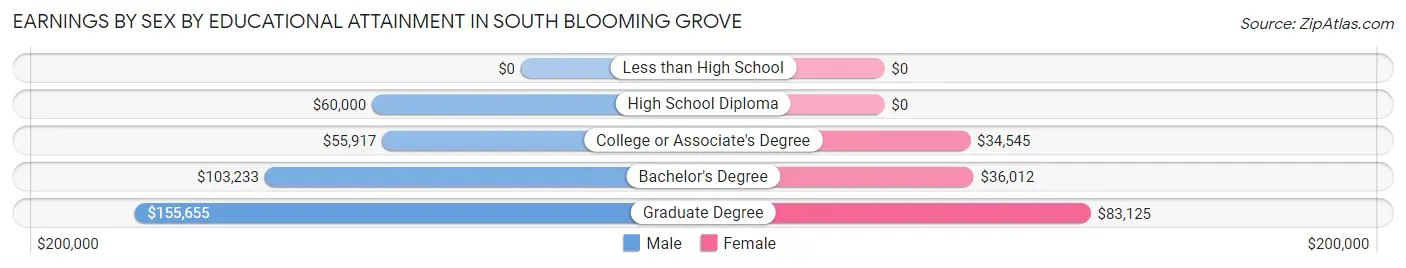
Earnings by Sex by Educational Attainment in South Blooming Grove
Average earnings in South Blooming Grove are $56,760 for men and $36,111 for women, a difference of 36.4%. Men with an educational attainment of graduate degree enjoy the highest average annual earnings of $155,655, while those with college or associate's degree education earn the least with $55,917. Women with an educational attainment of graduate degree earn the most with the average annual earnings of $83,125, while those with college or associate's degree education have the smallest earnings of $34,545.
| Educational Attainment | Male Income | Female Income |
| Less than High School | - | - |
| High School Diploma | $60,000 | $0 |
| College or Associate's Degree | $55,917 | $34,545 |
| Bachelor's Degree | $103,233 | $36,012 |
| Graduate Degree | $155,655 | $83,125 |
| Total | $56,760 | $36,111 |
Family Income in South Blooming Grove
Family Income Brackets in South Blooming Grove
According to the South Blooming Grove family income data, there are 124 families falling into the $75,000 to $99,999 income range, which is the most common income bracket and makes up 17.5% of all families. Conversely, the $10,000 to $14,999 income bracket is the least frequent group with only 7 families (1.0%) belonging to this category.
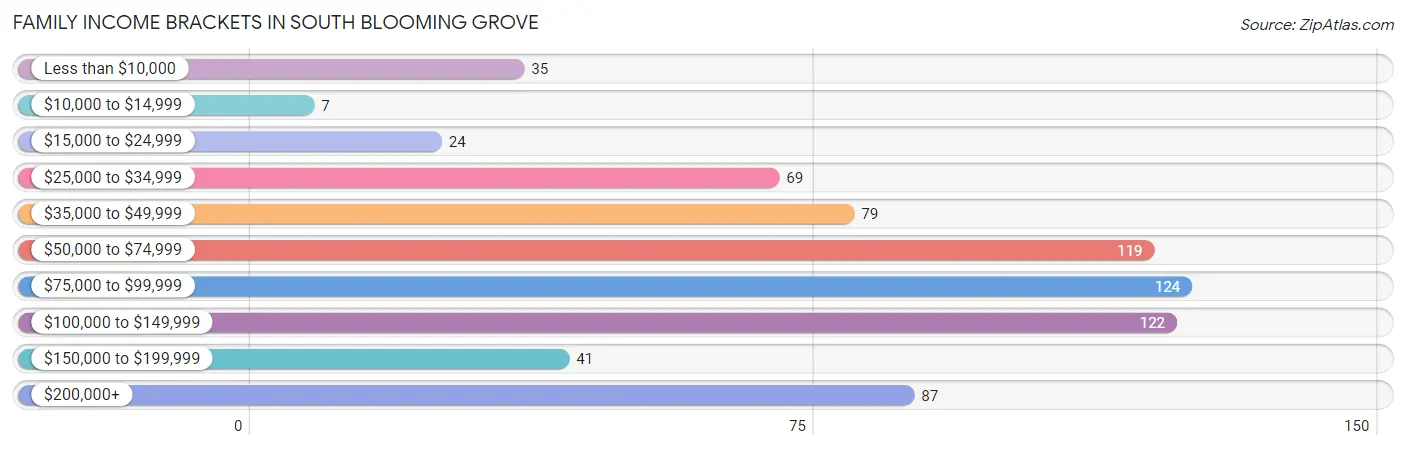
| Income Bracket | # Families | % Families |
| Less than $10,000 | 35 | 5.0% |
| $10,000 to $14,999 | 7 | 1.0% |
| $15,000 to $24,999 | 24 | 3.4% |
| $25,000 to $34,999 | 69 | 9.8% |
| $35,000 to $49,999 | 79 | 11.2% |
| $50,000 to $74,999 | 119 | 16.8% |
| $75,000 to $99,999 | 124 | 17.5% |
| $100,000 to $149,999 | 122 | 17.3% |
| $150,000 to $199,999 | 41 | 5.8% |
| $200,000+ | 87 | 12.3% |
Family Income by Famaliy Size in South Blooming Grove
4-person families (77 | 10.9%) account for the highest median family income in South Blooming Grove with $173,523 per family, while 2-person families (292 | 41.3%) have the highest median income of $50,192 per family member.
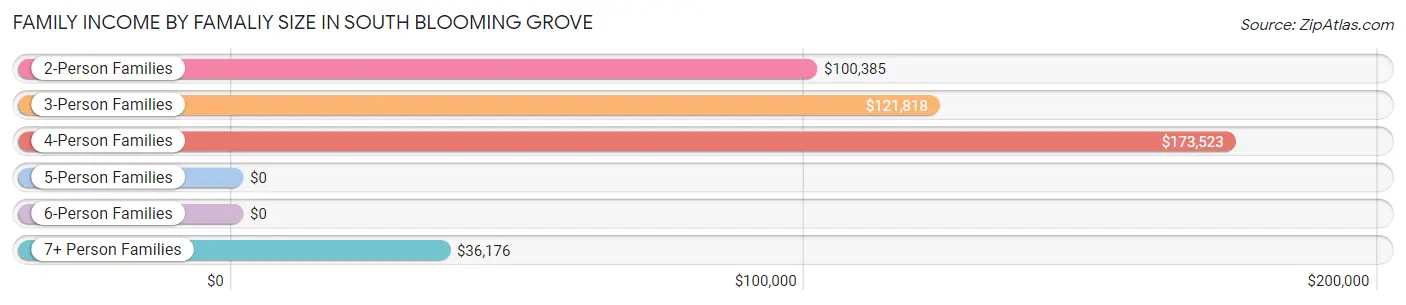
| Income Bracket | # Families | Median Income |
| 2-Person Families | 292 (41.3%) | $100,385 |
| 3-Person Families | 70 (9.9%) | $121,818 |
| 4-Person Families | 77 (10.9%) | $173,523 |
| 5-Person Families | 27 (3.8%) | $0 |
| 6-Person Families | 13 (1.8%) | $0 |
| 7+ Person Families | 228 (32.3%) | $36,176 |
| Total | 707 (100.0%) | $82,679 |
Family Income by Number of Earners in South Blooming Grove
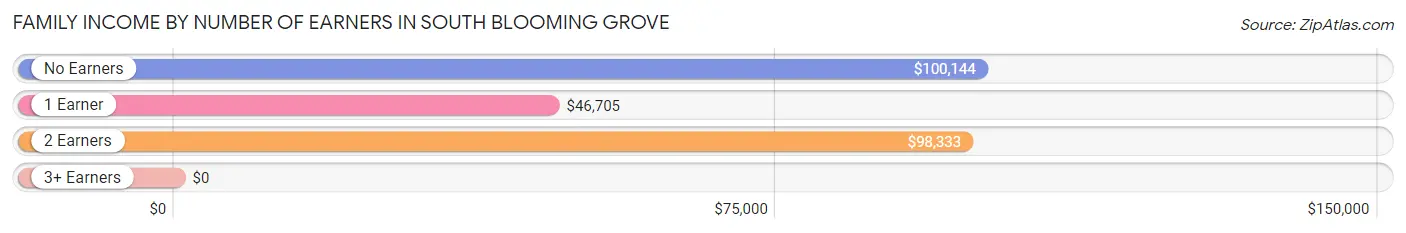
| Number of Earners | # Families | Median Income |
| No Earners | 117 (16.6%) | $100,144 |
| 1 Earner | 275 (38.9%) | $46,705 |
| 2 Earners | 298 (42.1%) | $98,333 |
| 3+ Earners | 17 (2.4%) | $0 |
| Total | 707 (100.0%) | $82,679 |
Household Income in South Blooming Grove
Household Income Brackets in South Blooming Grove
With 246 households falling in the category, the $50,000 to $74,999 income range is the most frequent in South Blooming Grove, accounting for 20.9% of all households. In contrast, only 14 households (1.2%) fall into the $10,000 to $14,999 income bracket, making it the least populous group.
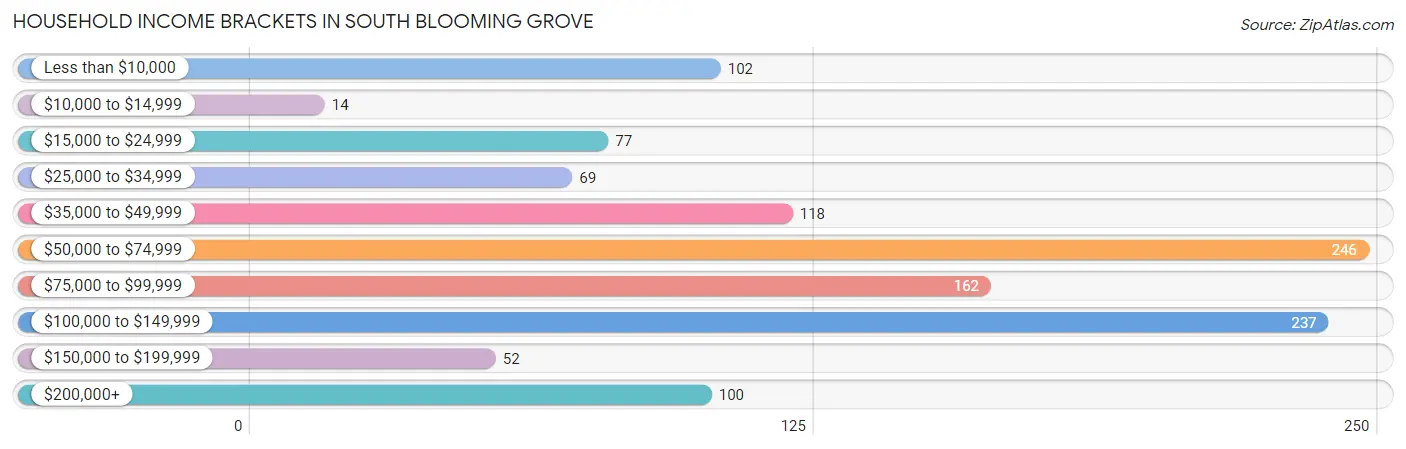
| Income Bracket | # Households | % Households |
| Less than $10,000 | 102 | 8.7% |
| $10,000 to $14,999 | 14 | 1.2% |
| $15,000 to $24,999 | 77 | 6.5% |
| $25,000 to $34,999 | 69 | 5.9% |
| $35,000 to $49,999 | 118 | 10.0% |
| $50,000 to $74,999 | 246 | 20.9% |
| $75,000 to $99,999 | 162 | 13.8% |
| $100,000 to $149,999 | 237 | 20.1% |
| $150,000 to $199,999 | 52 | 4.4% |
| $200,000+ | 100 | 8.5% |
Household Income by Householder Age in South Blooming Grove
The median household income in South Blooming Grove is $72,063, with the highest median household income of $112,938 found in the 45 to 64 years age bracket for the primary householder. A total of 369 households (31.4%) fall into this category. Meanwhile, the 15 to 24 years age bracket for the primary householder has the lowest median household income of $0, with 7 households (0.6%) in this group.
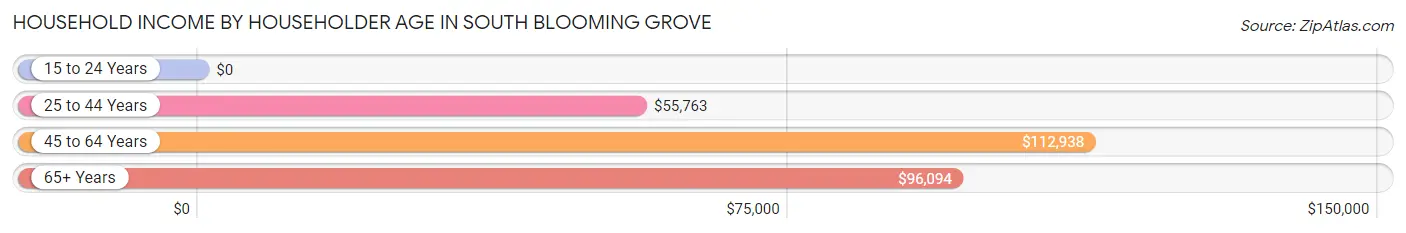
| Income Bracket | # Households | Median Income |
| 15 to 24 Years | 7 (0.6%) | $0 |
| 25 to 44 Years | 552 (46.9%) | $55,763 |
| 45 to 64 Years | 369 (31.4%) | $112,938 |
| 65+ Years | 249 (21.2%) | $96,094 |
| Total | 1,177 (100.0%) | $72,063 |
Poverty in South Blooming Grove
Income Below Poverty by Sex and Age in South Blooming Grove
With 39.7% poverty level for males and 45.3% for females among the residents of South Blooming Grove, 15 year old males and 5 year old females are the most vulnerable to poverty, with 11 males (100.0%) and 29 females (85.3%) in their respective age groups living below the poverty level.
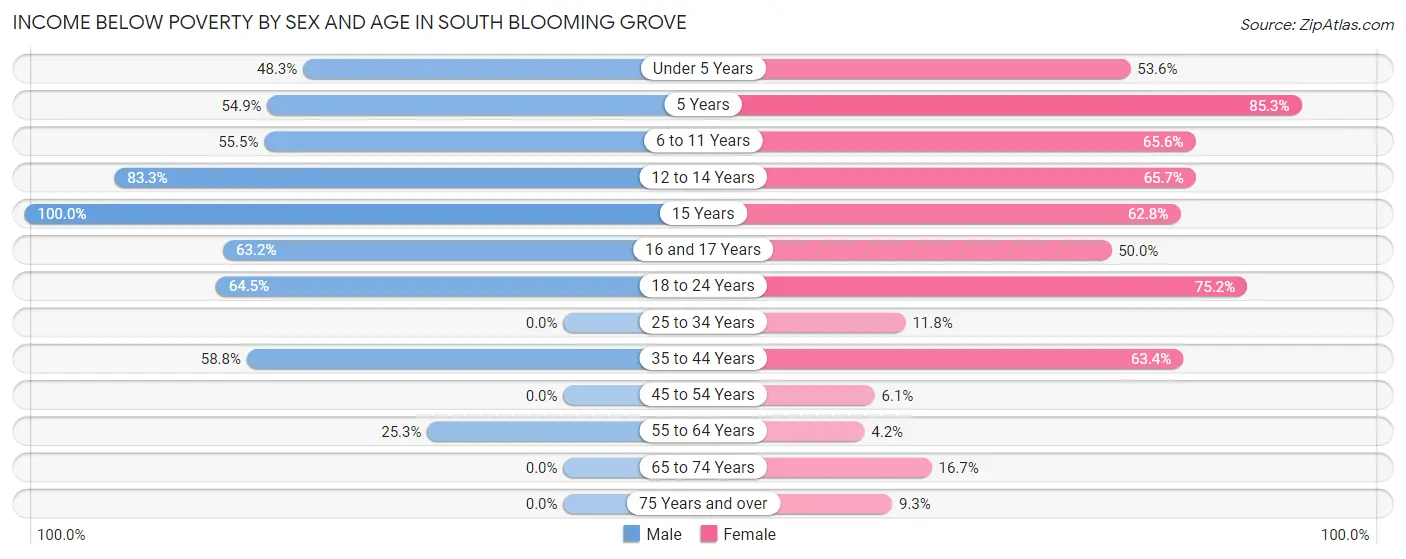
| Age Bracket | Male | Female |
| Under 5 Years | 71 (48.3%) | 98 (53.5%) |
| 5 Years | 67 (54.9%) | 29 (85.3%) |
| 6 to 11 Years | 171 (55.5%) | 181 (65.6%) |
| 12 to 14 Years | 75 (83.3%) | 155 (65.7%) |
| 15 Years | 11 (100.0%) | 59 (62.8%) |
| 16 and 17 Years | 36 (63.2%) | 29 (50.0%) |
| 18 to 24 Years | 89 (64.5%) | 82 (75.2%) |
| 25 to 34 Years | 0 (0.0%) | 24 (11.8%) |
| 35 to 44 Years | 171 (58.8%) | 204 (63.3%) |
| 45 to 54 Years | 0 (0.0%) | 7 (6.1%) |
| 55 to 64 Years | 50 (25.3%) | 7 (4.2%) |
| 65 to 74 Years | 0 (0.0%) | 20 (16.7%) |
| 75 Years and over | 0 (0.0%) | 7 (9.3%) |
| Total | 741 (39.7%) | 902 (45.3%) |
Income Above Poverty by Sex and Age in South Blooming Grove
According to the poverty statistics in South Blooming Grove, males aged 25 to 34 years and females aged 55 to 64 years are the age groups that are most secure financially, with 100.0% of males and 95.8% of females in these age groups living above the poverty line.
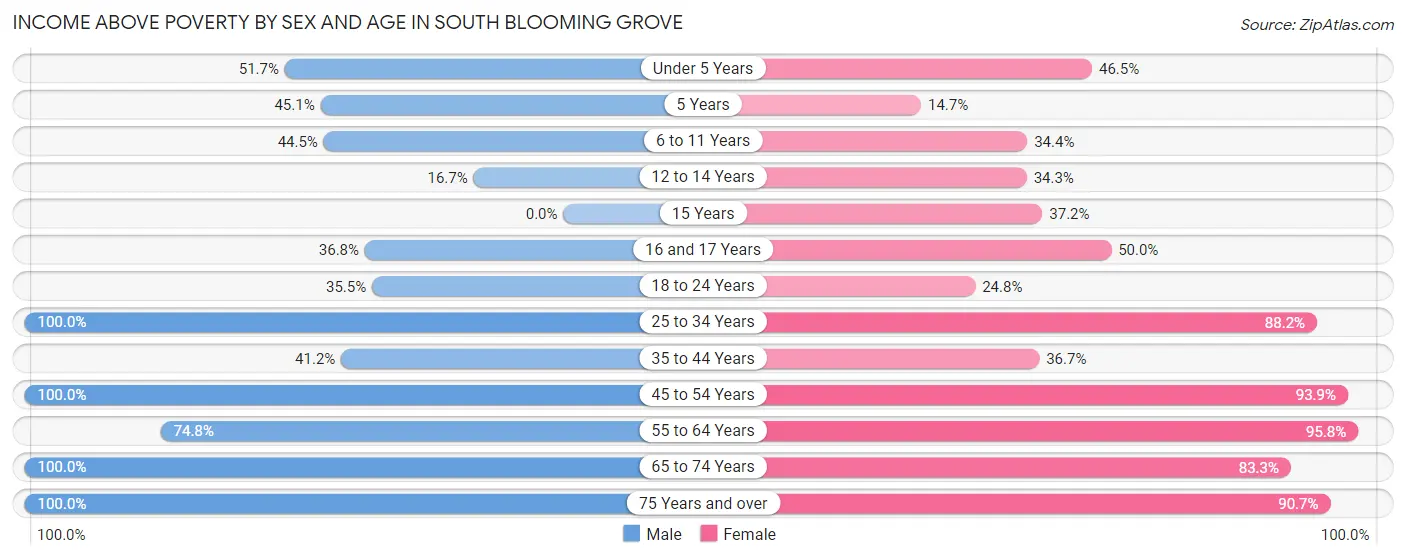
| Age Bracket | Male | Female |
| Under 5 Years | 76 (51.7%) | 85 (46.5%) |
| 5 Years | 55 (45.1%) | 5 (14.7%) |
| 6 to 11 Years | 137 (44.5%) | 95 (34.4%) |
| 12 to 14 Years | 15 (16.7%) | 81 (34.3%) |
| 15 Years | 0 (0.0%) | 35 (37.2%) |
| 16 and 17 Years | 21 (36.8%) | 29 (50.0%) |
| 18 to 24 Years | 49 (35.5%) | 27 (24.8%) |
| 25 to 34 Years | 233 (100.0%) | 179 (88.2%) |
| 35 to 44 Years | 120 (41.2%) | 118 (36.6%) |
| 45 to 54 Years | 91 (100.0%) | 108 (93.9%) |
| 55 to 64 Years | 148 (74.8%) | 160 (95.8%) |
| 65 to 74 Years | 89 (100.0%) | 100 (83.3%) |
| 75 Years and over | 91 (100.0%) | 68 (90.7%) |
| Total | 1,125 (60.3%) | 1,090 (54.7%) |
Income Below Poverty Among Married-Couple Families in South Blooming Grove
The poverty statistics for married-couple families in South Blooming Grove show that 27.7% or 157 of the total 566 families live below the poverty line. Families with 5 or more children have the highest poverty rate of 65.8%, comprising of 150 families. On the other hand, families with no children have the lowest poverty rate of 0.0%, which includes 0 families.
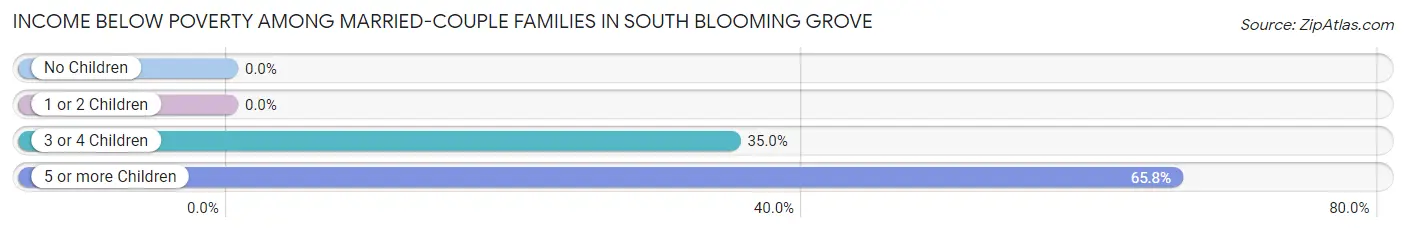
| Children | Above Poverty | Below Poverty |
| No Children | 246 (100.0%) | 0 (0.0%) |
| 1 or 2 Children | 72 (100.0%) | 0 (0.0%) |
| 3 or 4 Children | 13 (65.0%) | 7 (35.0%) |
| 5 or more Children | 78 (34.2%) | 150 (65.8%) |
| Total | 409 (72.3%) | 157 (27.7%) |
Income Below Poverty Among Single-Parent Households in South Blooming Grove
According to the poverty data in South Blooming Grove, 63.2% or 24 single-father households and 13.6% or 14 single-mother households are living below the poverty line. Among single-father households, those with 1 or 2 children have the highest poverty rate, with 24 households (100.0%) experiencing poverty. Likewise, among single-mother households, those with 1 or 2 children have the highest poverty rate, with 7 households (31.8%) falling below the poverty line.
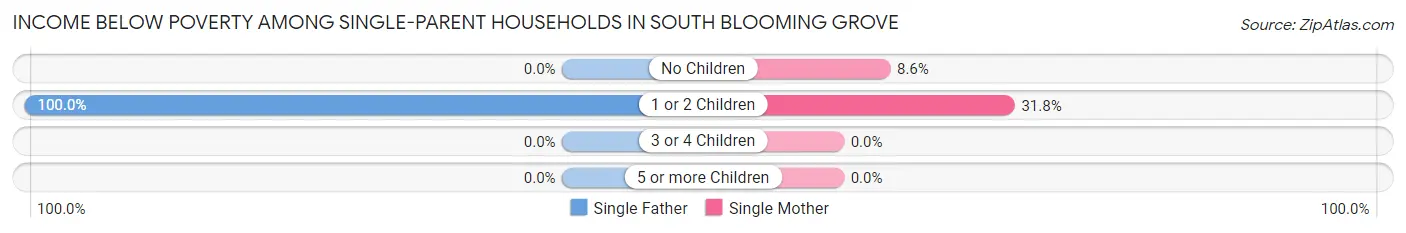
| Children | Single Father | Single Mother |
| No Children | 0 (0.0%) | 7 (8.6%) |
| 1 or 2 Children | 24 (100.0%) | 7 (31.8%) |
| 3 or 4 Children | 0 (0.0%) | 0 (0.0%) |
| 5 or more Children | 0 (0.0%) | 0 (0.0%) |
| Total | 24 (63.2%) | 14 (13.6%) |
Income Below Poverty Among Married-Couple vs Single-Parent Households in South Blooming Grove
The poverty data for South Blooming Grove shows that 157 of the married-couple family households (27.7%) and 38 of the single-parent households (27.0%) are living below the poverty level. Within the married-couple family households, those with 5 or more children have the highest poverty rate, with 150 households (65.8%) falling below the poverty line. Among the single-parent households, those with 1 or 2 children have the highest poverty rate, with 31 household (67.4%) living below poverty.
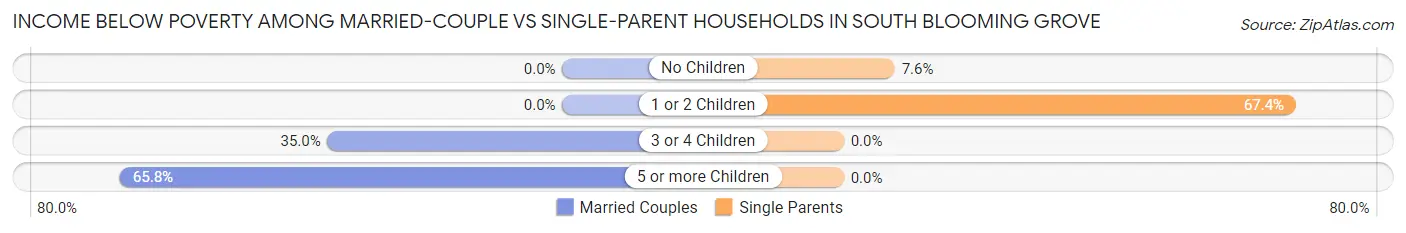
| Children | Married-Couple Families | Single-Parent Households |
| No Children | 0 (0.0%) | 7 (7.6%) |
| 1 or 2 Children | 0 (0.0%) | 31 (67.4%) |
| 3 or 4 Children | 7 (35.0%) | 0 (0.0%) |
| 5 or more Children | 150 (65.8%) | 0 (0.0%) |
| Total | 157 (27.7%) | 38 (27.0%) |
Race in South Blooming Grove
The most populous races in South Blooming Grove are White / Caucasian (3,368 | 87.3%), Hispanic or Latino (350 | 9.1%), and Some other Race (229 | 5.9%).
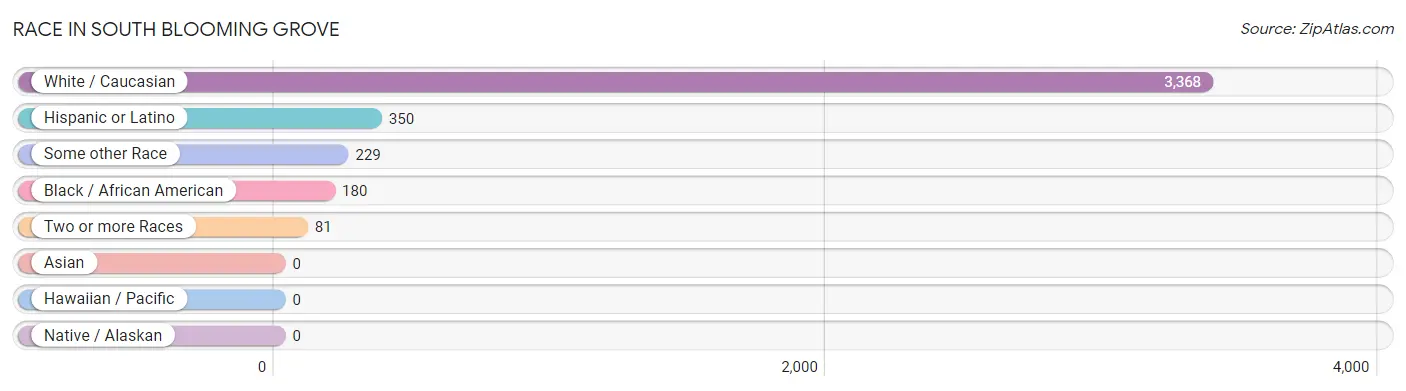
| Race | # Population | % Population |
| Asian | 0 | 0.0% |
| Black / African American | 180 | 4.7% |
| Hawaiian / Pacific | 0 | 0.0% |
| Hispanic or Latino | 350 | 9.1% |
| Native / Alaskan | 0 | 0.0% |
| White / Caucasian | 3,368 | 87.3% |
| Two or more Races | 81 | 2.1% |
| Some other Race | 229 | 5.9% |
| Total | 3,858 | 100.0% |
Ancestry in South Blooming Grove
The most populous ancestries reported in South Blooming Grove are Hungarian (1,233 | 32.0%), Italian (422 | 10.9%), Romanian (264 | 6.8%), German (261 | 6.8%), and Irish (258 | 6.7%), together accounting for 63.2% of all South Blooming Grove residents.
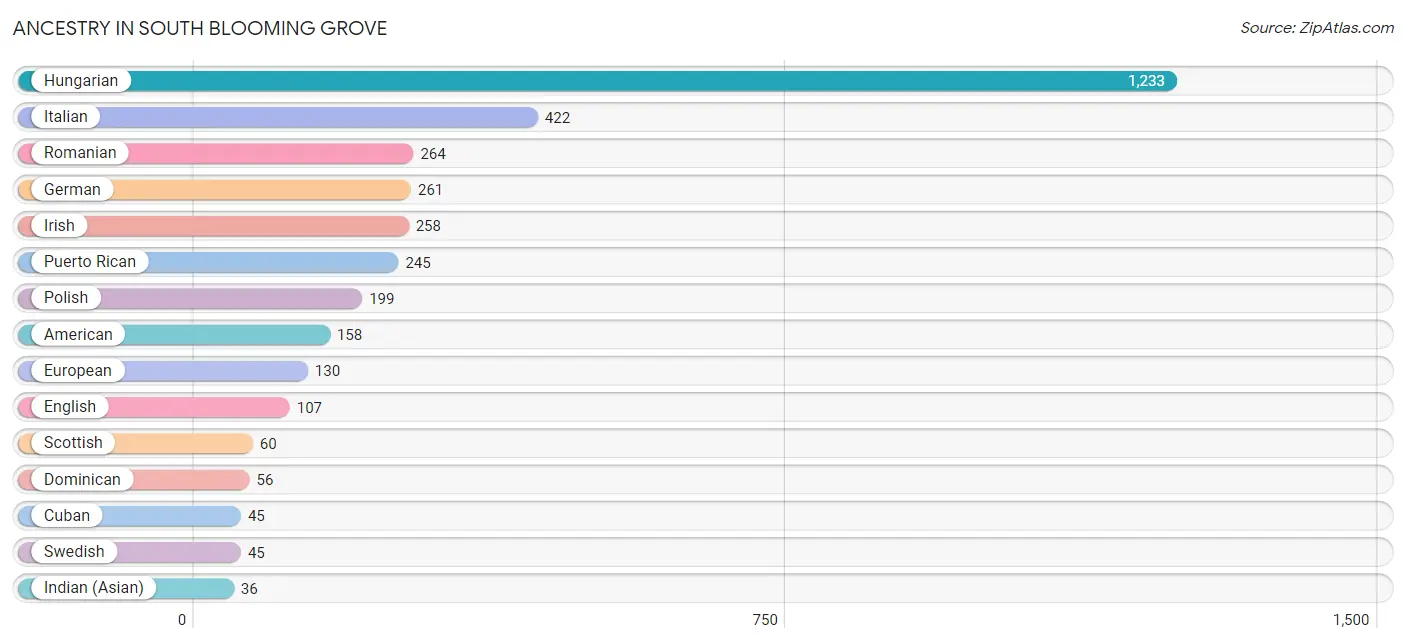
| Ancestry | # Population | % Population |
| American | 158 | 4.1% |
| Arab | 17 | 0.4% |
| Austrian | 32 | 0.8% |
| Cherokee | 11 | 0.3% |
| Cuban | 45 | 1.2% |
| Dominican | 56 | 1.5% |
| Eastern European | 21 | 0.5% |
| Egyptian | 17 | 0.4% |
| English | 107 | 2.8% |
| European | 130 | 3.4% |
| French | 16 | 0.4% |
| German | 261 | 6.8% |
| Greek | 17 | 0.4% |
| Haitian | 9 | 0.2% |
| Hungarian | 1,233 | 32.0% |
| Indian (Asian) | 36 | 0.9% |
| Irish | 258 | 6.7% |
| Italian | 422 | 10.9% |
| Jamaican | 23 | 0.6% |
| Latvian | 16 | 0.4% |
| Mexican | 4 | 0.1% |
| Polish | 199 | 5.2% |
| Portuguese | 18 | 0.5% |
| Puerto Rican | 245 | 6.4% |
| Romanian | 264 | 6.8% |
| Russian | 29 | 0.7% |
| Scottish | 60 | 1.6% |
| Swedish | 45 | 1.2% |
| Swiss | 6 | 0.2% |
| Thai | 36 | 0.9% |
| Welsh | 11 | 0.3% | View All 31 Rows |
Immigrants in South Blooming Grove
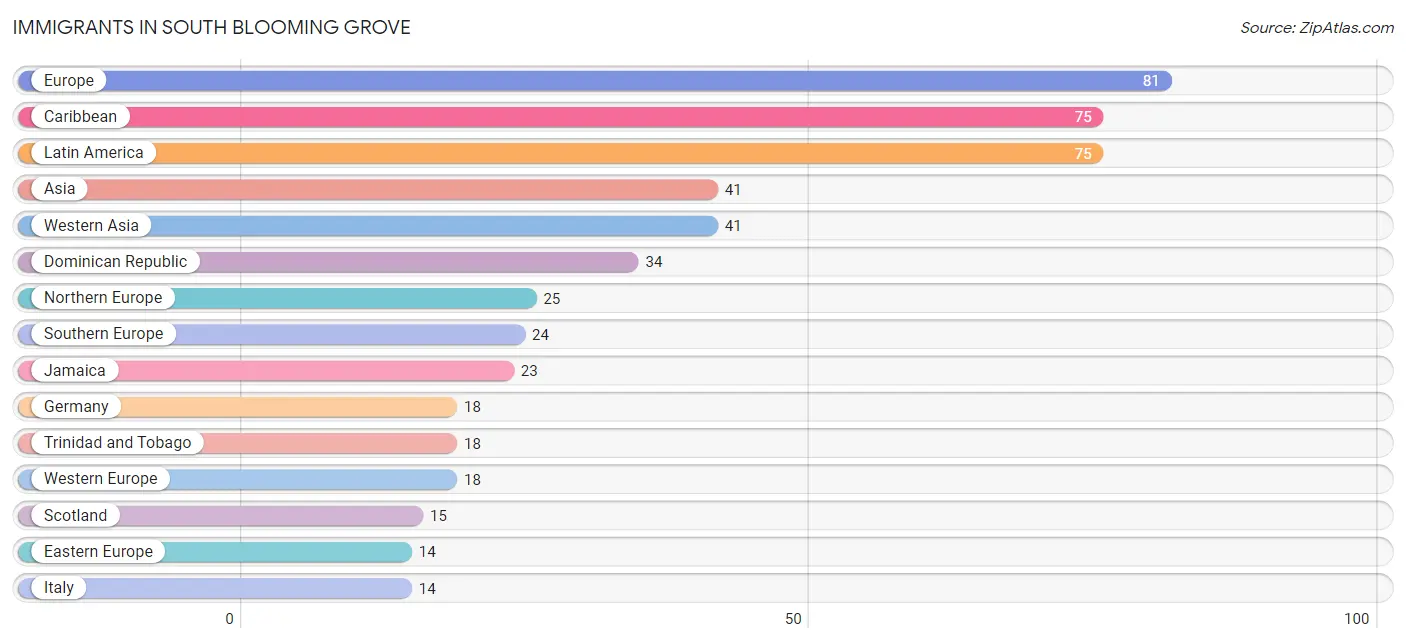
The most numerous immigrant groups reported in South Blooming Grove came from Europe (81 | 2.1%), Caribbean (75 | 1.9%), Latin America (75 | 1.9%), Asia (41 | 1.1%), and Western Asia (41 | 1.1%), together accounting for 8.1% of all South Blooming Grove residents.
| Immigration Origin | # Population | % Population |
| Asia | 41 | 1.1% |
| Canada | 11 | 0.3% |
| Caribbean | 75 | 1.9% |
| Dominican Republic | 34 | 0.9% |
| Eastern Europe | 14 | 0.4% |
| Europe | 81 | 2.1% |
| Germany | 18 | 0.5% |
| Ireland | 10 | 0.3% |
| Italy | 14 | 0.4% |
| Jamaica | 23 | 0.6% |
| Latin America | 75 | 1.9% |
| Northern Europe | 25 | 0.6% |
| Poland | 14 | 0.4% |
| Portugal | 10 | 0.3% |
| Scotland | 15 | 0.4% |
| Southern Europe | 24 | 0.6% |
| Trinidad and Tobago | 18 | 0.5% |
| Western Asia | 41 | 1.1% |
| Western Europe | 18 | 0.5% | View All 19 Rows |
Sex and Age in South Blooming Grove
Sex and Age in South Blooming Grove
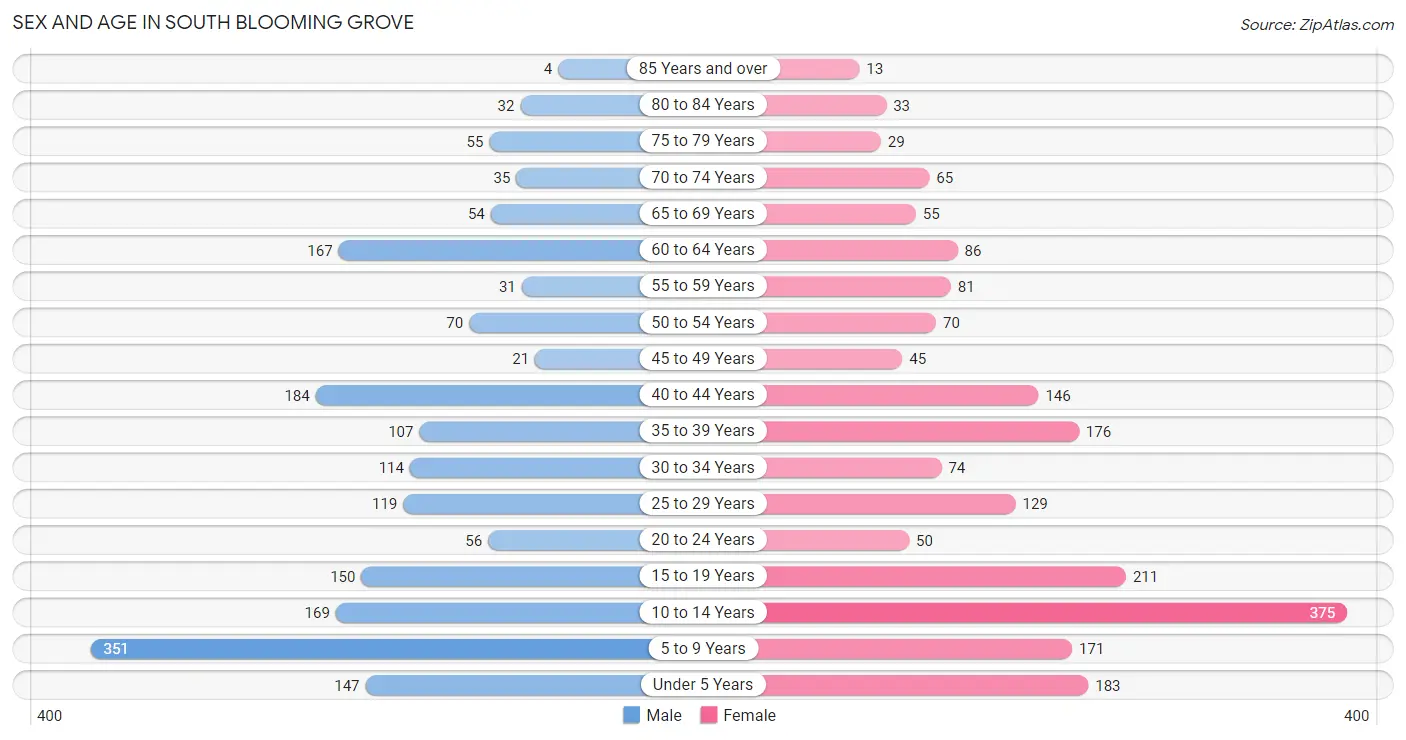
The most populous age groups in South Blooming Grove are 5 to 9 Years (351 | 18.8%) for men and 10 to 14 Years (375 | 18.8%) for women.
| Age Bracket | Male | Female |
| Under 5 Years | 147 (7.9%) | 183 (9.2%) |
| 5 to 9 Years | 351 (18.8%) | 171 (8.6%) |
| 10 to 14 Years | 169 (9.1%) | 375 (18.8%) |
| 15 to 19 Years | 150 (8.0%) | 211 (10.6%) |
| 20 to 24 Years | 56 (3.0%) | 50 (2.5%) |
| 25 to 29 Years | 119 (6.4%) | 129 (6.5%) |
| 30 to 34 Years | 114 (6.1%) | 74 (3.7%) |
| 35 to 39 Years | 107 (5.7%) | 176 (8.8%) |
| 40 to 44 Years | 184 (9.9%) | 146 (7.3%) |
| 45 to 49 Years | 21 (1.1%) | 45 (2.3%) |
| 50 to 54 Years | 70 (3.7%) | 70 (3.5%) |
| 55 to 59 Years | 31 (1.7%) | 81 (4.1%) |
| 60 to 64 Years | 167 (8.9%) | 86 (4.3%) |
| 65 to 69 Years | 54 (2.9%) | 55 (2.8%) |
| 70 to 74 Years | 35 (1.9%) | 65 (3.3%) |
| 75 to 79 Years | 55 (2.9%) | 29 (1.5%) |
| 80 to 84 Years | 32 (1.7%) | 33 (1.7%) |
| 85 Years and over | 4 (0.2%) | 13 (0.6%) |
| Total | 1,866 (100.0%) | 1,992 (100.0%) |
Families and Households in South Blooming Grove
Median Family Size in South Blooming Grove
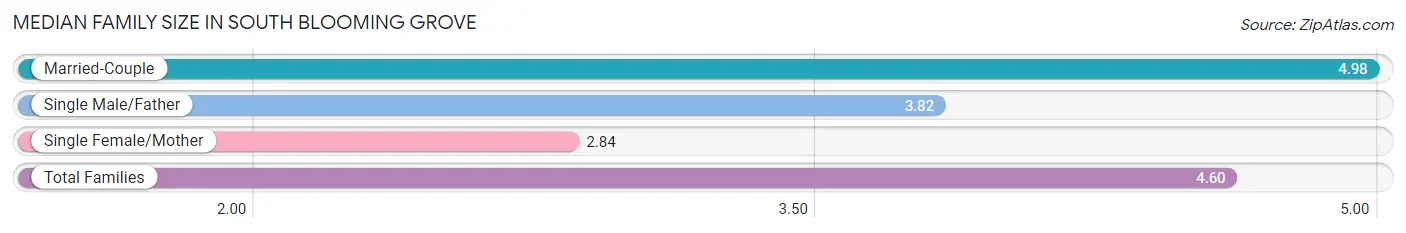
The median family size in South Blooming Grove is 4.60 persons per family, with married-couple families (566 | 80.1%) accounting for the largest median family size of 4.98 persons per family. On the other hand, single female/mother families (103 | 14.6%) represent the smallest median family size with 2.84 persons per family.
| Family Type | # Families | Family Size |
| Married-Couple | 566 (80.1%) | 4.98 |
| Single Male/Father | 38 (5.4%) | 3.82 |
| Single Female/Mother | 103 (14.6%) | 2.84 |
| Total Families | 707 (100.0%) | 4.60 |
Median Household Size in South Blooming Grove
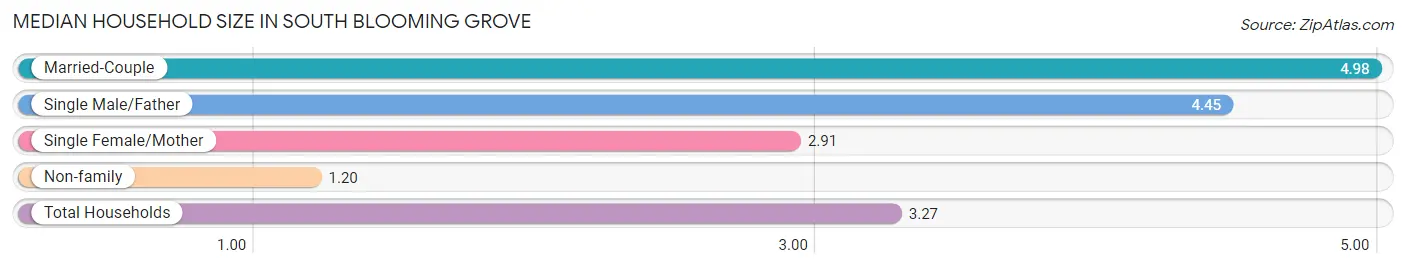
The median household size in South Blooming Grove is 3.27 persons per household, with married-couple households (566 | 48.1%) accounting for the largest median household size of 4.98 persons per household. non-family households (470 | 39.9%) represent the smallest median household size with 1.20 persons per household.
| Household Type | # Households | Household Size |
| Married-Couple | 566 (48.1%) | 4.98 |
| Single Male/Father | 38 (3.2%) | 4.45 |
| Single Female/Mother | 103 (8.7%) | 2.91 |
| Non-family | 470 (39.9%) | 1.20 |
| Total Households | 1,177 (100.0%) | 3.27 |
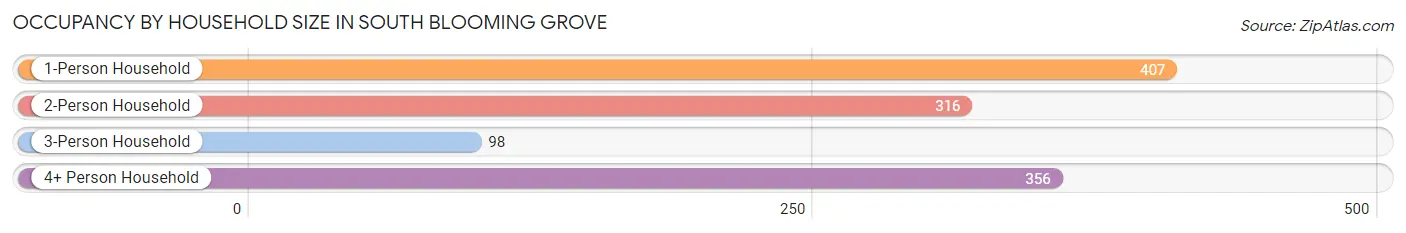
Household Size by Marriage Status in South Blooming Grove
Out of a total of 1,177 households in South Blooming Grove, 707 (60.1%) are family households, while 470 (39.9%) are nonfamily households. The most numerous type of family households are 2-person households, comprising 274, and the most common type of nonfamily households are 1-person households, comprising 407.
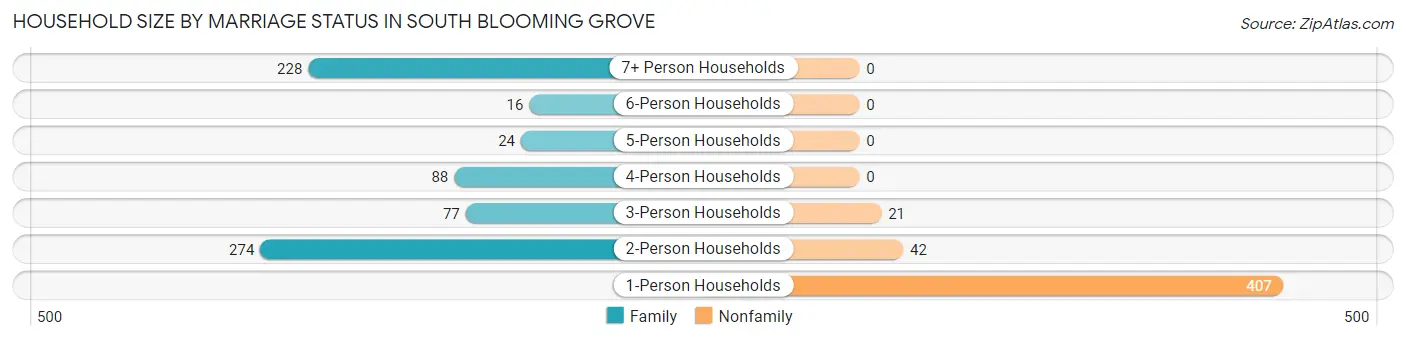
| Household Size | Family Households | Nonfamily Households |
| 1-Person Households | - | 407 (34.6%) |
| 2-Person Households | 274 (23.3%) | 42 (3.6%) |
| 3-Person Households | 77 (6.5%) | 21 (1.8%) |
| 4-Person Households | 88 (7.5%) | 0 (0.0%) |
| 5-Person Households | 24 (2.0%) | 0 (0.0%) |
| 6-Person Households | 16 (1.4%) | 0 (0.0%) |
| 7+ Person Households | 228 (19.4%) | 0 (0.0%) |
| Total | 707 (60.1%) | 470 (39.9%) |
Female Fertility in South Blooming Grove
Fertility by Age in South Blooming Grove
Average fertility rate in South Blooming Grove is 112.0 births per 1,000 women. Women in the age bracket of 35 to 50 years have the highest fertility rate with 221.0 births per 1,000 women. Women in the age bracket of 35 to 50 years acount for 88.3% of all women with births.
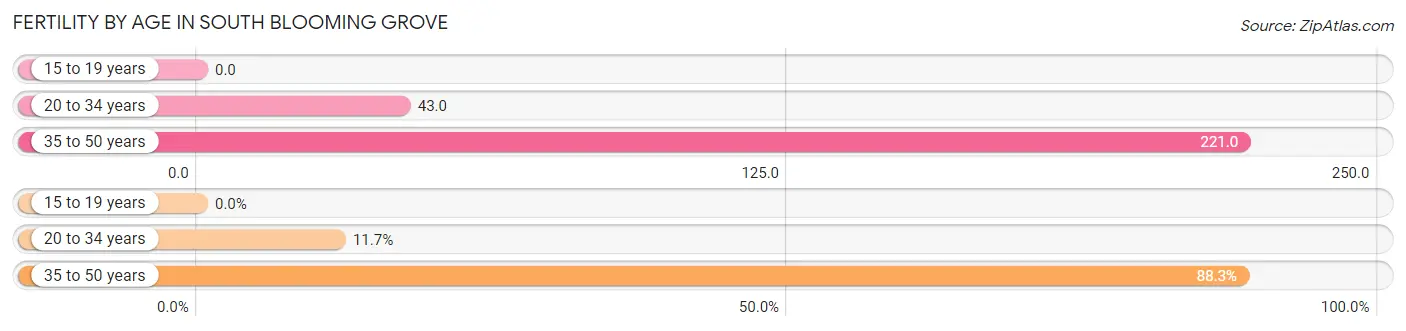
| Age Bracket | Women with Births | Births / 1,000 Women |
| 15 to 19 years | 0 (0.0%) | 0.0 |
| 20 to 34 years | 11 (11.7%) | 43.0 |
| 35 to 50 years | 83 (88.3%) | 221.0 |
| Total | 94 (100.0%) | 112.0 |
Fertility by Age by Marriage Status in South Blooming Grove
95.7% of women with births (94) in South Blooming Grove are married. The highest percentage of unmarried women with births falls into 35 to 50 years age bracket with 4.8% of them unmarried at the time of birth, while the lowest percentage of unmarried women with births belong to 20 to 34 years age bracket with 0.0% of them unmarried.
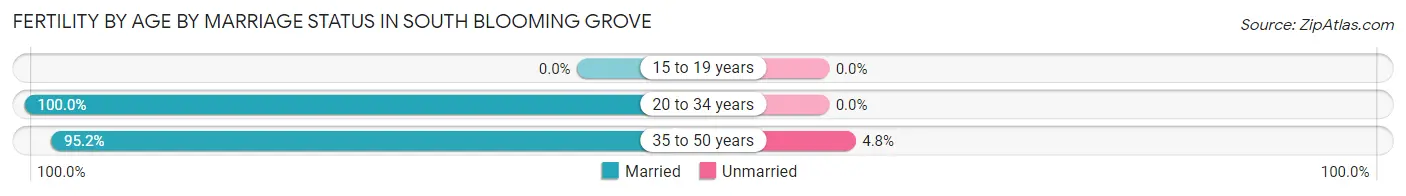
| Age Bracket | Married | Unmarried |
| 15 to 19 years | 0 (0.0%) | 0 (0.0%) |
| 20 to 34 years | 11 (100.0%) | 0 (0.0%) |
| 35 to 50 years | 79 (95.2%) | 4 (4.8%) |
| Total | 90 (95.7%) | 4 (4.3%) |
Fertility by Education in South Blooming Grove
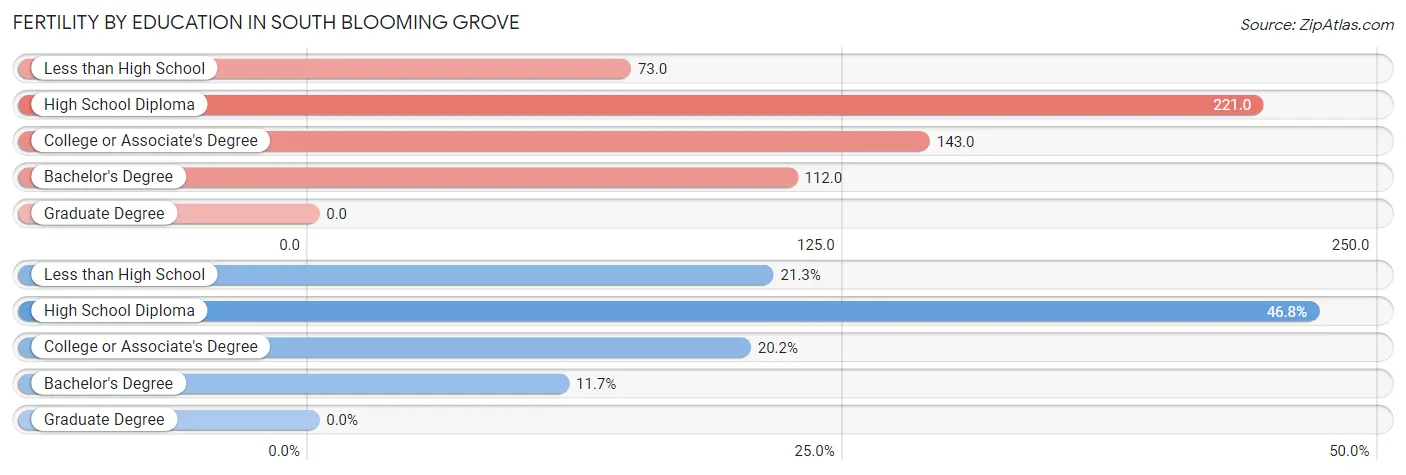
| Educational Attainment | Women with Births | Births / 1,000 Women |
| Less than High School | 20 (21.3%) | 73.0 |
| High School Diploma | 44 (46.8%) | 221.0 |
| College or Associate's Degree | 19 (20.2%) | 143.0 |
| Bachelor's Degree | 11 (11.7%) | 112.0 |
| Graduate Degree | 0 (0.0%) | 0.0 |
| Total | 94 (100.0%) | 112.0 |
Fertility by Education by Marriage Status in South Blooming Grove
4.3% of women with births in South Blooming Grove are unmarried. Women with the educational attainment of less than high school are most likely to be married with 100.0% of them married at childbirth, while women with the educational attainment of high school diploma are least likely to be married with 9.1% of them unmarried at childbirth.
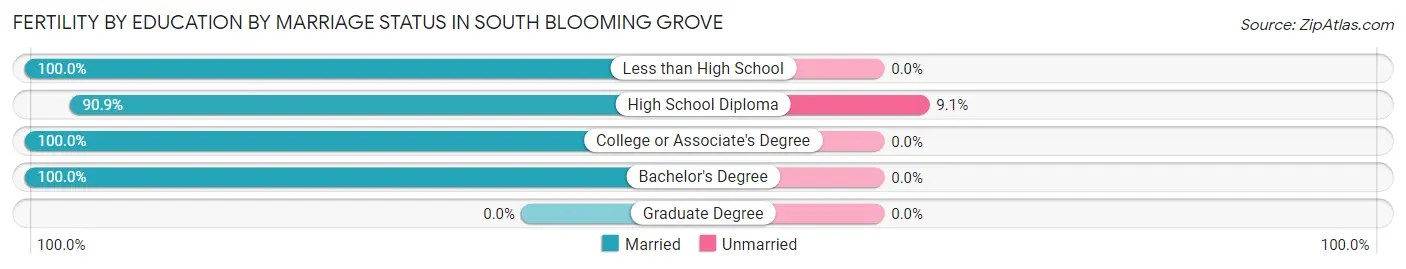
| Educational Attainment | Married | Unmarried |
| Less than High School | 20 (100.0%) | 0 (0.0%) |
| High School Diploma | 40 (90.9%) | 4 (9.1%) |
| College or Associate's Degree | 19 (100.0%) | 0 (0.0%) |
| Bachelor's Degree | 11 (100.0%) | 0 (0.0%) |
| Graduate Degree | 0 (0.0%) | 0 (0.0%) |
| Total | 90 (95.7%) | 4 (4.3%) |
Employment Characteristics in South Blooming Grove
Employment by Class of Employer in South Blooming Grove
Among the 1,252 employed individuals in South Blooming Grove, private company employees (799 | 63.8%), not-for-profit organizations (204 | 16.3%), and local government employees (130 | 10.4%) make up the most common classes of employment.
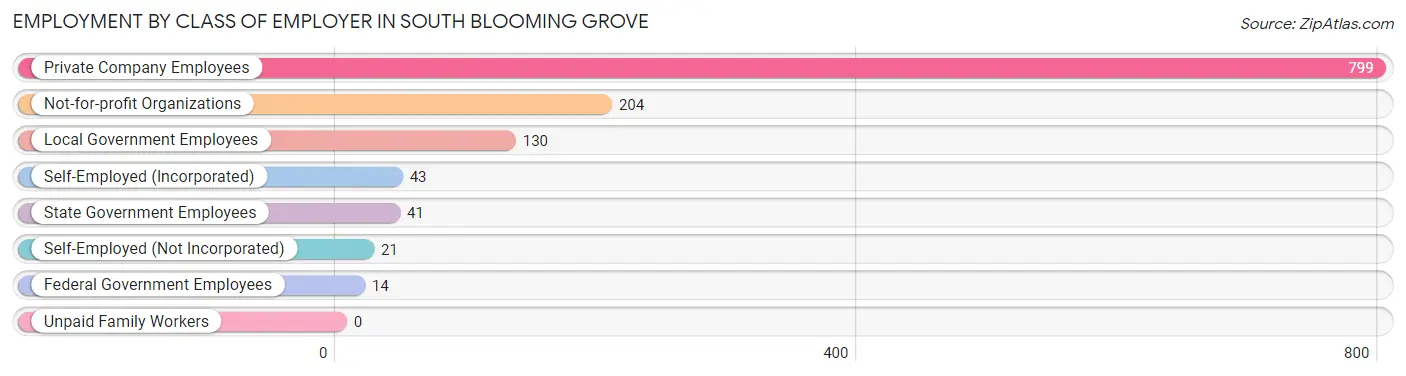
| Employer Class | # Employees | % Employees |
| Private Company Employees | 799 | 63.8% |
| Self-Employed (Incorporated) | 43 | 3.4% |
| Self-Employed (Not Incorporated) | 21 | 1.7% |
| Not-for-profit Organizations | 204 | 16.3% |
| Local Government Employees | 130 | 10.4% |
| State Government Employees | 41 | 3.3% |
| Federal Government Employees | 14 | 1.1% |
| Unpaid Family Workers | 0 | 0.0% |
| Total | 1,252 | 100.0% |
Employment Status by Age in South Blooming Grove
According to the labor force statistics for South Blooming Grove, out of the total population over 16 years of age (2,357), 61.0% or 1,438 individuals are in the labor force, with 13.0% or 187 of them unemployed. The age group with the highest labor force participation rate is 45 to 54 years, with 100.0% or 206 individuals in the labor force. Within the labor force, the 75 years and over age range has the highest percentage of unemployed individuals, with 100.0% or 8 of them being unemployed.
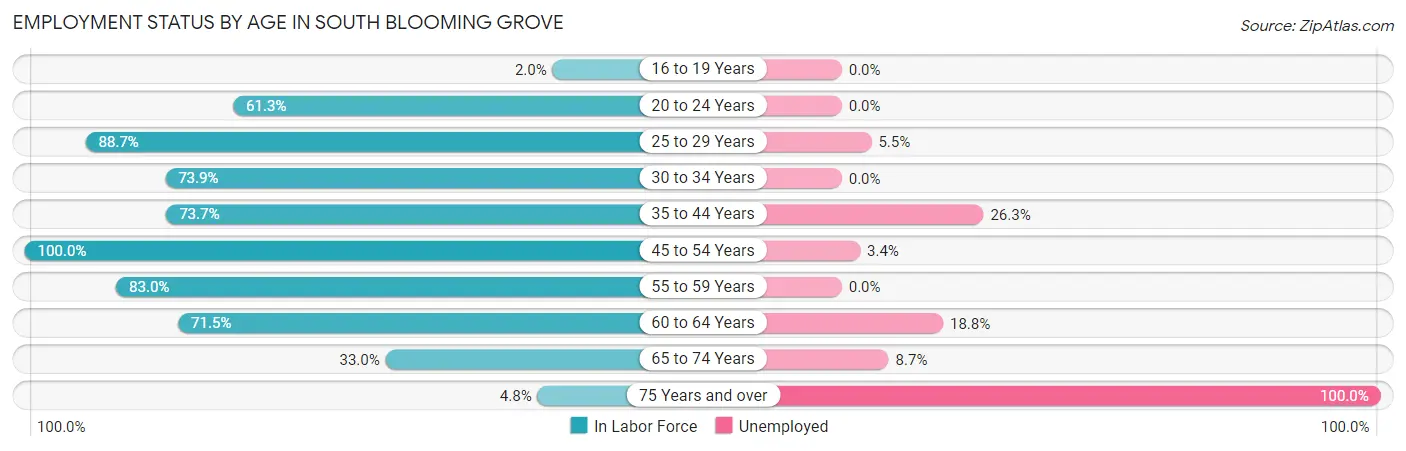
| Age Bracket | In Labor Force | Unemployed |
| 16 to 19 Years | 5 (2.0%) | 0 (0.0%) |
| 20 to 24 Years | 65 (61.3%) | 0 (0.0%) |
| 25 to 29 Years | 220 (88.7%) | 12 (5.5%) |
| 30 to 34 Years | 139 (73.9%) | 0 (0.0%) |
| 35 to 44 Years | 452 (73.7%) | 119 (26.3%) |
| 45 to 54 Years | 206 (100.0%) | 7 (3.4%) |
| 55 to 59 Years | 93 (83.0%) | 0 (0.0%) |
| 60 to 64 Years | 181 (71.5%) | 34 (18.8%) |
| 65 to 74 Years | 69 (33.0%) | 6 (8.7%) |
| 75 Years and over | 8 (4.8%) | 8 (100.0%) |
| Total | 1,438 (61.0%) | 187 (13.0%) |
Employment Status by Educational Attainment in South Blooming Grove
According to labor force statistics for South Blooming Grove, 79.7% of individuals (1,291) out of the total population between 25 and 64 years of age (1,620) are in the labor force, with 13.3% or 172 of them being unemployed. The group with the highest labor force participation rate are those with the educational attainment of college / associate degree, with 88.7% or 564 individuals in the labor force. Within the labor force, individuals with college / associate degree education have the highest percentage of unemployment, with 22.0% or 124 of them being unemployed.
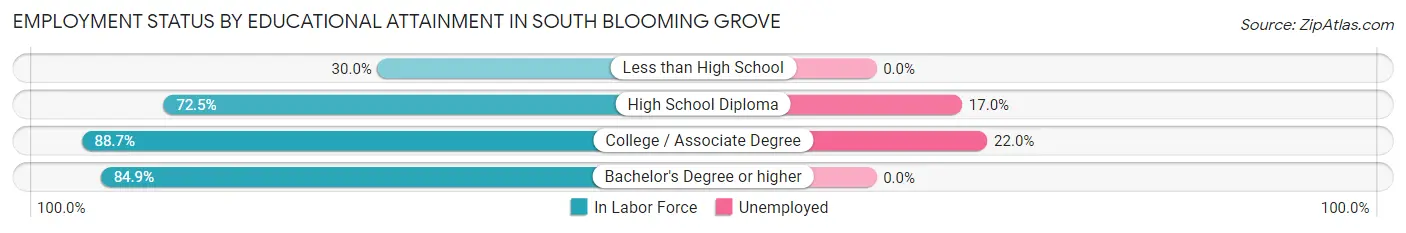
| Educational Attainment | In Labor Force | Unemployed |
| Less than High School | 33 (30.0%) | 0 (0.0%) |
| High School Diploma | 282 (72.5%) | 66 (17.0%) |
| College / Associate Degree | 564 (88.7%) | 140 (22.0%) |
| Bachelor's Degree or higher | 412 (84.9%) | 0 (0.0%) |
| Total | 1,291 (79.7%) | 215 (13.3%) |
Employment Occupations by Sex in South Blooming Grove
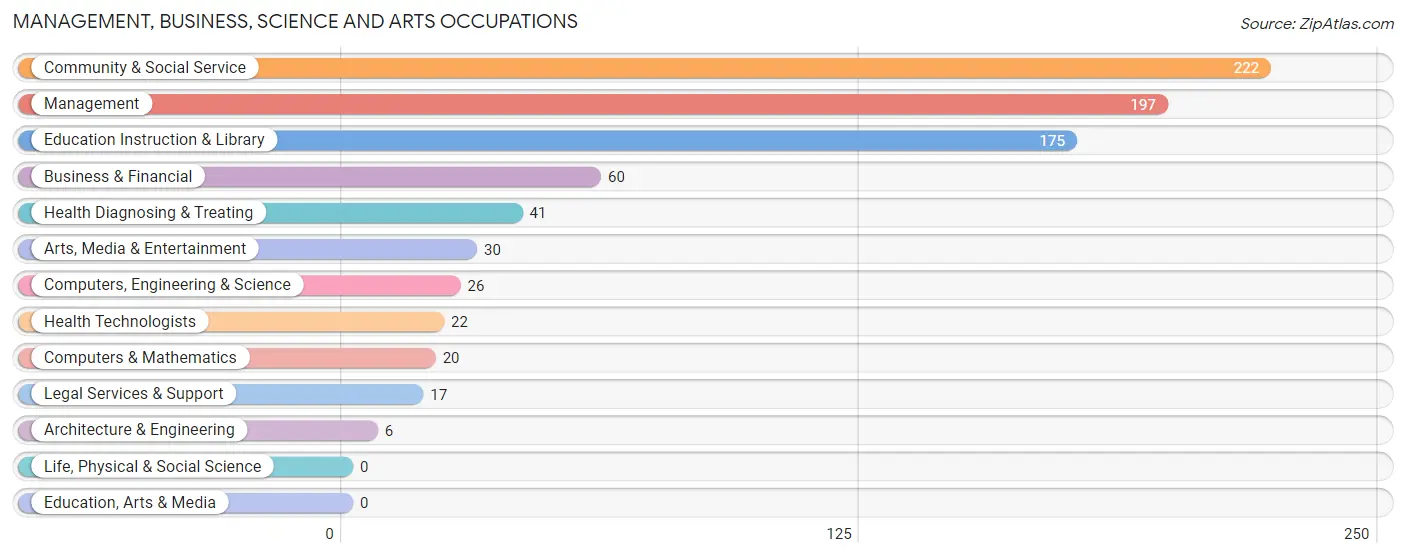
Management, Business, Science and Arts Occupations
The most common Management, Business, Science and Arts occupations in South Blooming Grove are Community & Social Service (222 | 17.9%), Management (197 | 15.9%), Education Instruction & Library (175 | 14.1%), Business & Financial (60 | 4.8%), and Health Diagnosing & Treating (41 | 3.3%).
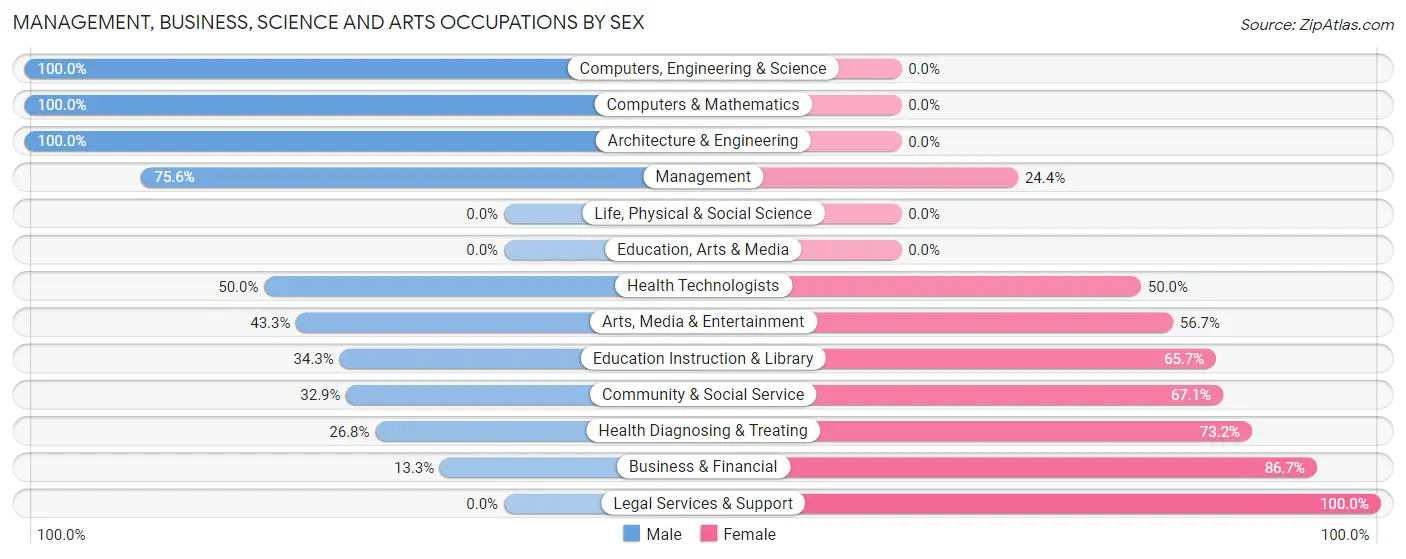
Management, Business, Science and Arts Occupations by Sex
Within the Management, Business, Science and Arts occupations in South Blooming Grove, the most male-oriented occupations are Computers, Engineering & Science (100.0%), Computers & Mathematics (100.0%), and Architecture & Engineering (100.0%), while the most female-oriented occupations are Legal Services & Support (100.0%), Business & Financial (86.7%), and Health Diagnosing & Treating (73.2%).
| Occupation | Male | Female |
| Management | 149 (75.6%) | 48 (24.4%) |
| Business & Financial | 8 (13.3%) | 52 (86.7%) |
| Computers, Engineering & Science | 26 (100.0%) | 0 (0.0%) |
| Computers & Mathematics | 20 (100.0%) | 0 (0.0%) |
| Architecture & Engineering | 6 (100.0%) | 0 (0.0%) |
| Life, Physical & Social Science | 0 (0.0%) | 0 (0.0%) |
| Community & Social Service | 73 (32.9%) | 149 (67.1%) |
| Education, Arts & Media | 0 (0.0%) | 0 (0.0%) |
| Legal Services & Support | 0 (0.0%) | 17 (100.0%) |
| Education Instruction & Library | 60 (34.3%) | 115 (65.7%) |
| Arts, Media & Entertainment | 13 (43.3%) | 17 (56.7%) |
| Health Diagnosing & Treating | 11 (26.8%) | 30 (73.2%) |
| Health Technologists | 11 (50.0%) | 11 (50.0%) |
| Total (Category) | 267 (48.9%) | 279 (51.1%) |
| Total (Overall) | 685 (55.1%) | 558 (44.9%) |
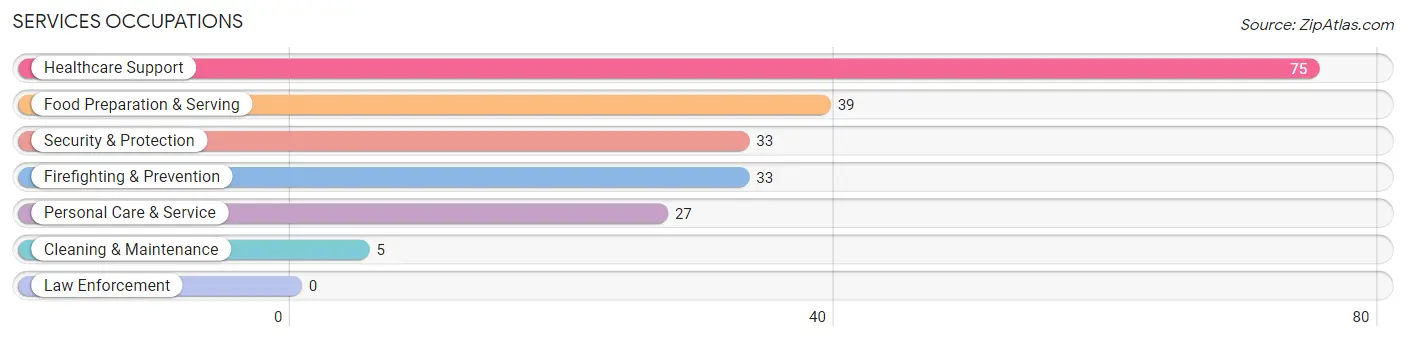
Services Occupations
The most common Services occupations in South Blooming Grove are Healthcare Support (75 | 6.0%), Food Preparation & Serving (39 | 3.1%), Security & Protection (33 | 2.6%), Firefighting & Prevention (33 | 2.6%), and Personal Care & Service (27 | 2.2%).
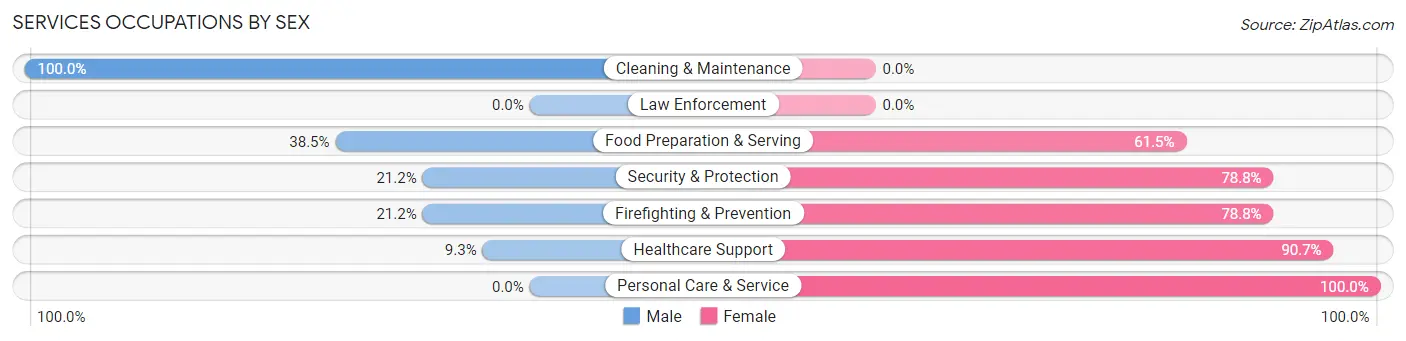
Services Occupations by Sex
Within the Services occupations in South Blooming Grove, the most male-oriented occupations are Cleaning & Maintenance (100.0%), Food Preparation & Serving (38.5%), and Security & Protection (21.2%), while the most female-oriented occupations are Personal Care & Service (100.0%), Healthcare Support (90.7%), and Security & Protection (78.8%).
| Occupation | Male | Female |
| Healthcare Support | 7 (9.3%) | 68 (90.7%) |
| Security & Protection | 7 (21.2%) | 26 (78.8%) |
| Firefighting & Prevention | 7 (21.2%) | 26 (78.8%) |
| Law Enforcement | 0 (0.0%) | 0 (0.0%) |
| Food Preparation & Serving | 15 (38.5%) | 24 (61.5%) |
| Cleaning & Maintenance | 5 (100.0%) | 0 (0.0%) |
| Personal Care & Service | 0 (0.0%) | 27 (100.0%) |
| Total (Category) | 34 (19.0%) | 145 (81.0%) |
| Total (Overall) | 685 (55.1%) | 558 (44.9%) |
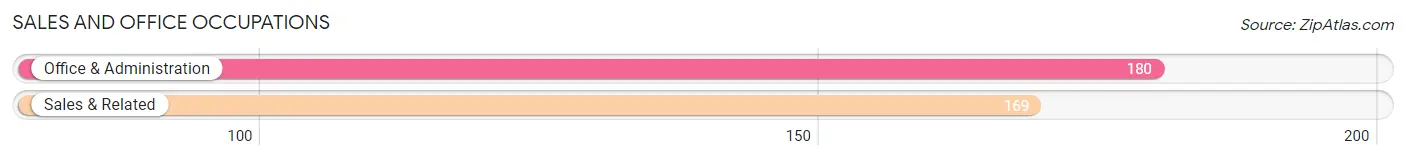
Sales and Office Occupations
The most common Sales and Office occupations in South Blooming Grove are Office & Administration (180 | 14.5%), and Sales & Related (169 | 13.6%).
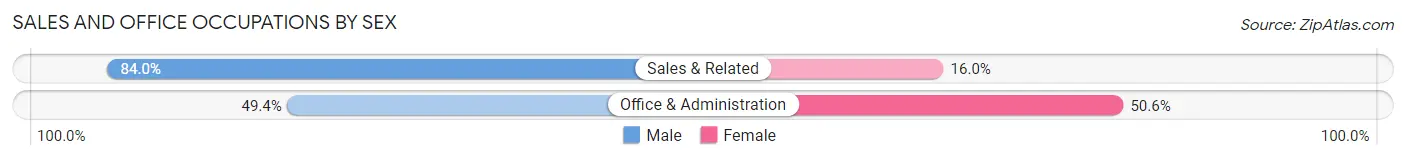
Sales and Office Occupations by Sex
| Occupation | Male | Female |
| Sales & Related | 142 (84.0%) | 27 (16.0%) |
| Office & Administration | 89 (49.4%) | 91 (50.6%) |
| Total (Category) | 231 (66.2%) | 118 (33.8%) |
| Total (Overall) | 685 (55.1%) | 558 (44.9%) |
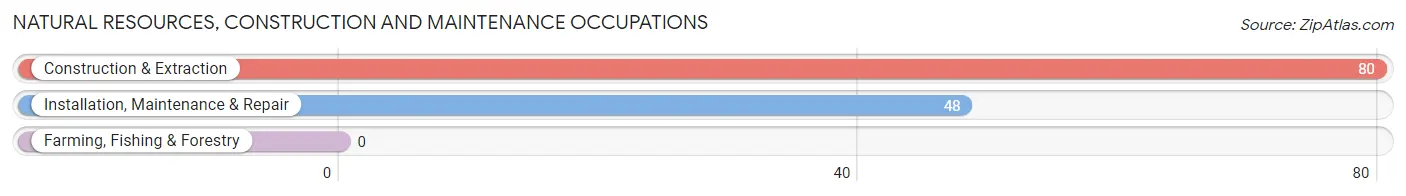
Natural Resources, Construction and Maintenance Occupations
The most common Natural Resources, Construction and Maintenance occupations in South Blooming Grove are Construction & Extraction (80 | 6.4%), and Installation, Maintenance & Repair (48 | 3.9%).
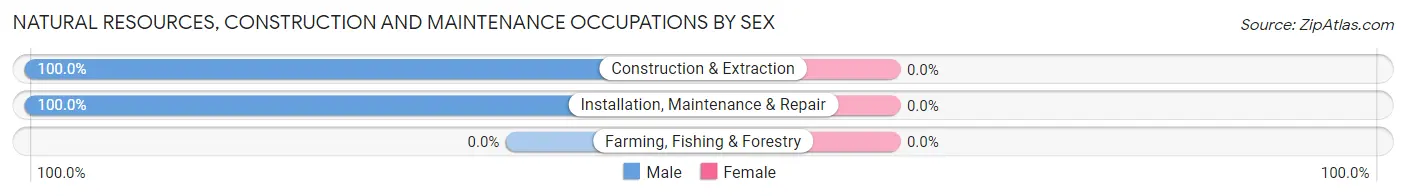
Natural Resources, Construction and Maintenance Occupations by Sex
| Occupation | Male | Female |
| Farming, Fishing & Forestry | 0 (0.0%) | 0 (0.0%) |
| Construction & Extraction | 80 (100.0%) | 0 (0.0%) |
| Installation, Maintenance & Repair | 48 (100.0%) | 0 (0.0%) |
| Total (Category) | 128 (100.0%) | 0 (0.0%) |
| Total (Overall) | 685 (55.1%) | 558 (44.9%) |
Production, Transportation and Moving Occupations
The most common Production, Transportation and Moving occupations in South Blooming Grove are Production (18 | 1.5%), Transportation (17 | 1.4%), and Material Moving (6 | 0.5%).
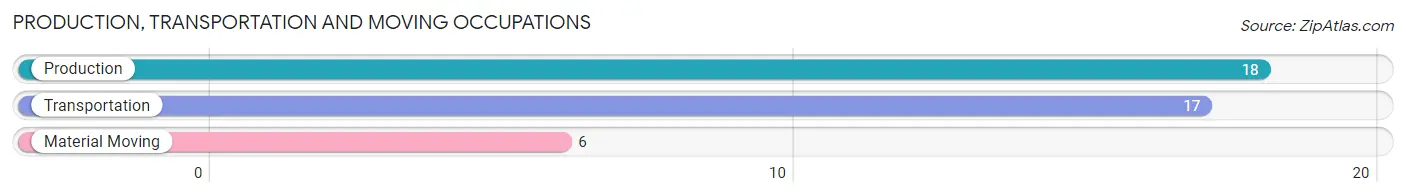
Production, Transportation and Moving Occupations by Sex
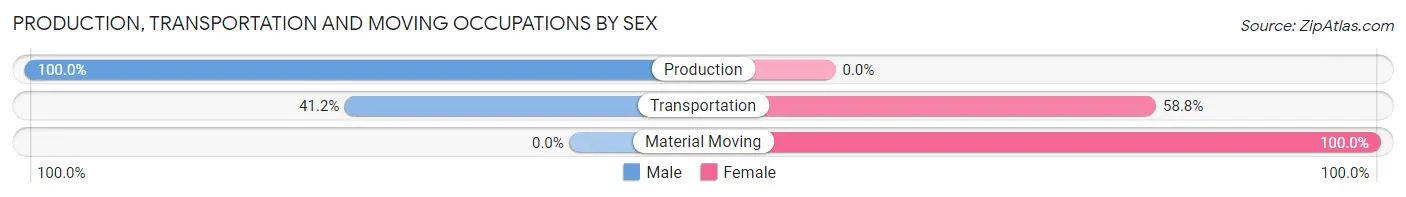
| Occupation | Male | Female |
| Production | 18 (100.0%) | 0 (0.0%) |
| Transportation | 7 (41.2%) | 10 (58.8%) |
| Material Moving | 0 (0.0%) | 6 (100.0%) |
| Total (Category) | 25 (61.0%) | 16 (39.0%) |
| Total (Overall) | 685 (55.1%) | 558 (44.9%) |
Employment Industries by Sex in South Blooming Grove
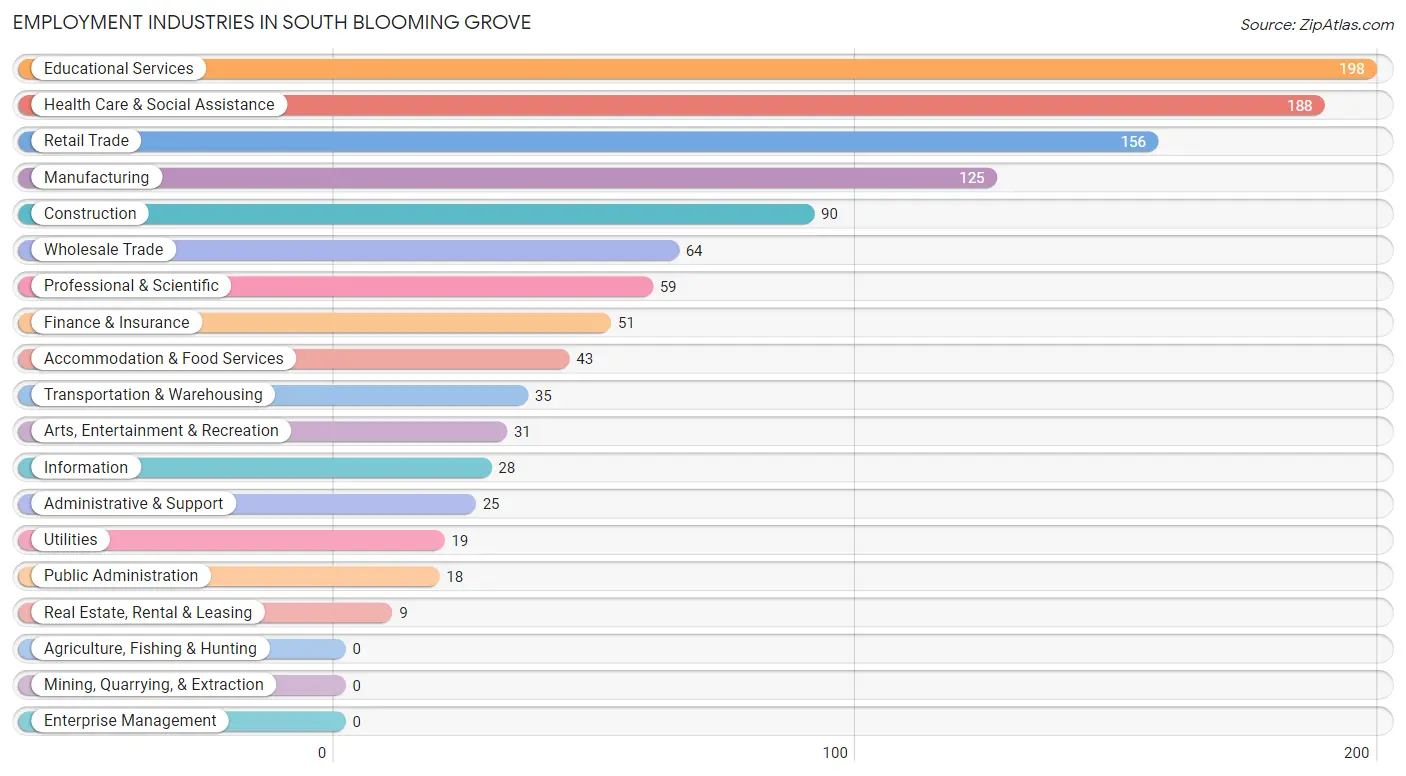
Employment Industries in South Blooming Grove
The major employment industries in South Blooming Grove include Educational Services (198 | 15.9%), Health Care & Social Assistance (188 | 15.1%), Retail Trade (156 | 12.6%), Manufacturing (125 | 10.1%), and Construction (90 | 7.2%).
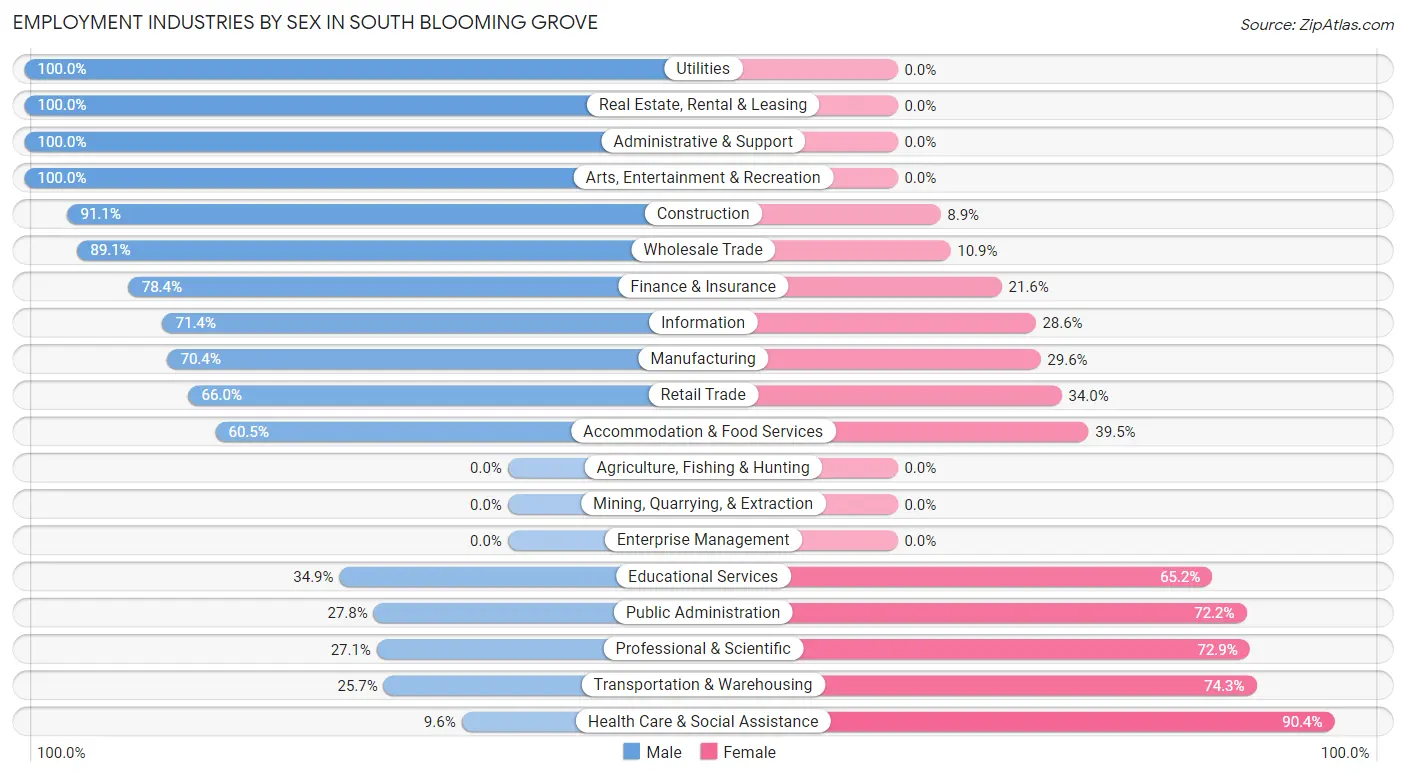
Employment Industries by Sex in South Blooming Grove
The South Blooming Grove industries that see more men than women are Utilities (100.0%), Real Estate, Rental & Leasing (100.0%), and Administrative & Support (100.0%), whereas the industries that tend to have a higher number of women are Health Care & Social Assistance (90.4%), Transportation & Warehousing (74.3%), and Professional & Scientific (72.9%).
| Industry | Male | Female |
| Agriculture, Fishing & Hunting | 0 (0.0%) | 0 (0.0%) |
| Mining, Quarrying, & Extraction | 0 (0.0%) | 0 (0.0%) |
| Construction | 82 (91.1%) | 8 (8.9%) |
| Manufacturing | 88 (70.4%) | 37 (29.6%) |
| Wholesale Trade | 57 (89.1%) | 7 (10.9%) |
| Retail Trade | 103 (66.0%) | 53 (34.0%) |
| Transportation & Warehousing | 9 (25.7%) | 26 (74.3%) |
| Utilities | 19 (100.0%) | 0 (0.0%) |
| Information | 20 (71.4%) | 8 (28.6%) |
| Finance & Insurance | 40 (78.4%) | 11 (21.6%) |
| Real Estate, Rental & Leasing | 9 (100.0%) | 0 (0.0%) |
| Professional & Scientific | 16 (27.1%) | 43 (72.9%) |
| Enterprise Management | 0 (0.0%) | 0 (0.0%) |
| Administrative & Support | 25 (100.0%) | 0 (0.0%) |
| Educational Services | 69 (34.8%) | 129 (65.1%) |
| Health Care & Social Assistance | 18 (9.6%) | 170 (90.4%) |
| Arts, Entertainment & Recreation | 31 (100.0%) | 0 (0.0%) |
| Accommodation & Food Services | 26 (60.5%) | 17 (39.5%) |
| Public Administration | 5 (27.8%) | 13 (72.2%) |
| Total | 685 (55.1%) | 558 (44.9%) |
Education in South Blooming Grove
School Enrollment in South Blooming Grove
The most common levels of schooling among the 1,649 students in South Blooming Grove are middle school (490 | 29.7%), elementary school (411 | 24.9%), and high school (324 | 19.7%).
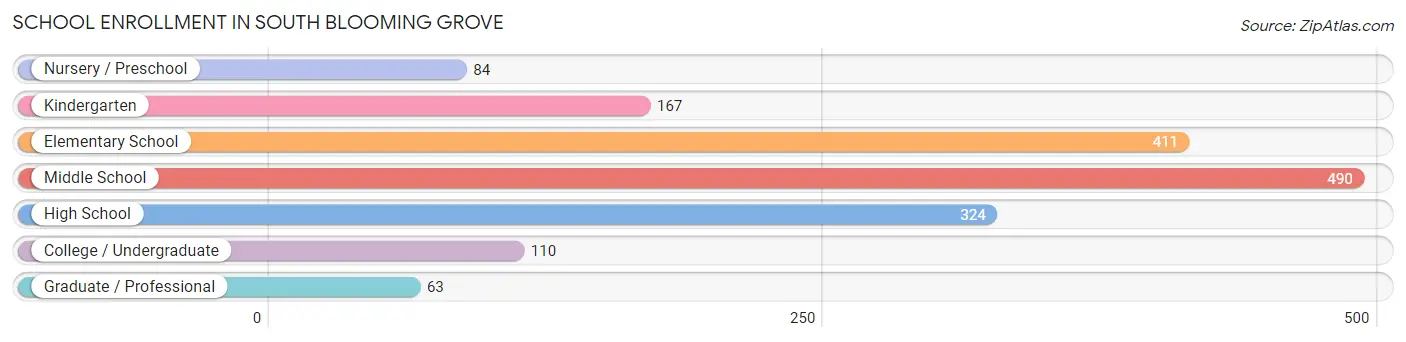
| School Level | # Students | % Students |
| Nursery / Preschool | 84 | 5.1% |
| Kindergarten | 167 | 10.1% |
| Elementary School | 411 | 24.9% |
| Middle School | 490 | 29.7% |
| High School | 324 | 19.7% |
| College / Undergraduate | 110 | 6.7% |
| Graduate / Professional | 63 | 3.8% |
| Total | 1,649 | 100.0% |
School Enrollment by Age by Funding Source in South Blooming Grove
Out of a total of 1,649 students who are enrolled in schools in South Blooming Grove, 1,247 (75.6%) attend a private institution, while the remaining 402 (24.4%) are enrolled in public schools. The age group of 3 to 4 year olds has the highest likelihood of being enrolled in private schools, with 142 (100.0% in the age bracket) enrolled. Conversely, the age group of 35 years and over has the lowest likelihood of being enrolled in a private school, with 17 (100.0% in the age bracket) attending a public institution.
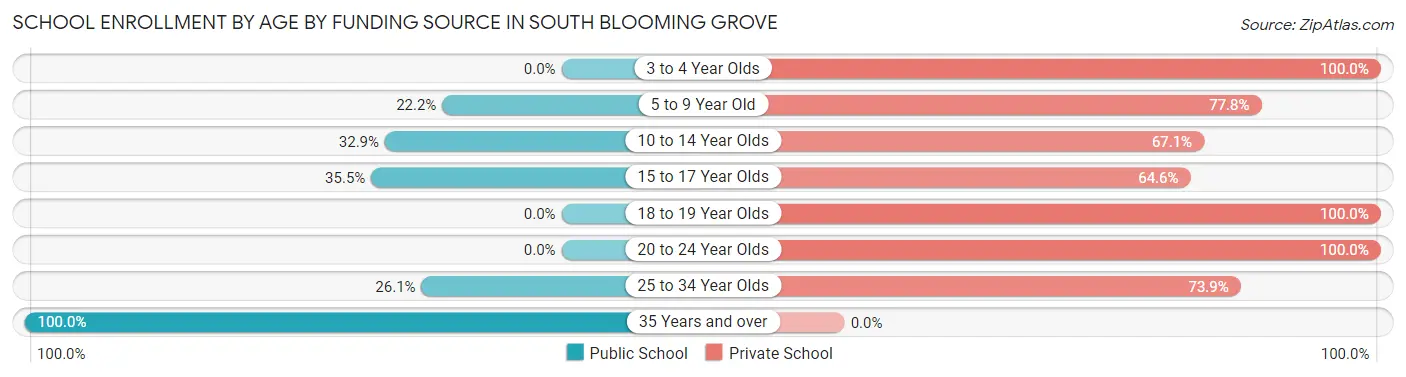
| Age Bracket | Public School | Private School |
| 3 to 4 Year Olds | 0 (0.0%) | 142 (100.0%) |
| 5 to 9 Year Old | 116 (22.2%) | 406 (77.8%) |
| 10 to 14 Year Olds | 179 (32.9%) | 365 (67.1%) |
| 15 to 17 Year Olds | 78 (35.4%) | 142 (64.5%) |
| 18 to 19 Year Olds | 0 (0.0%) | 130 (100.0%) |
| 20 to 24 Year Olds | 0 (0.0%) | 28 (100.0%) |
| 25 to 34 Year Olds | 12 (26.1%) | 34 (73.9%) |
| 35 Years and over | 17 (100.0%) | 0 (0.0%) |
| Total | 402 (24.4%) | 1,247 (75.6%) |
Educational Attainment by Field of Study in South Blooming Grove
Business (125 | 18.6%), science & technology (101 | 15.0%), social sciences (89 | 13.2%), education (71 | 10.5%), and psychology (67 | 10.0%) are the most common fields of study among 673 individuals in South Blooming Grove who have obtained a bachelor's degree or higher.
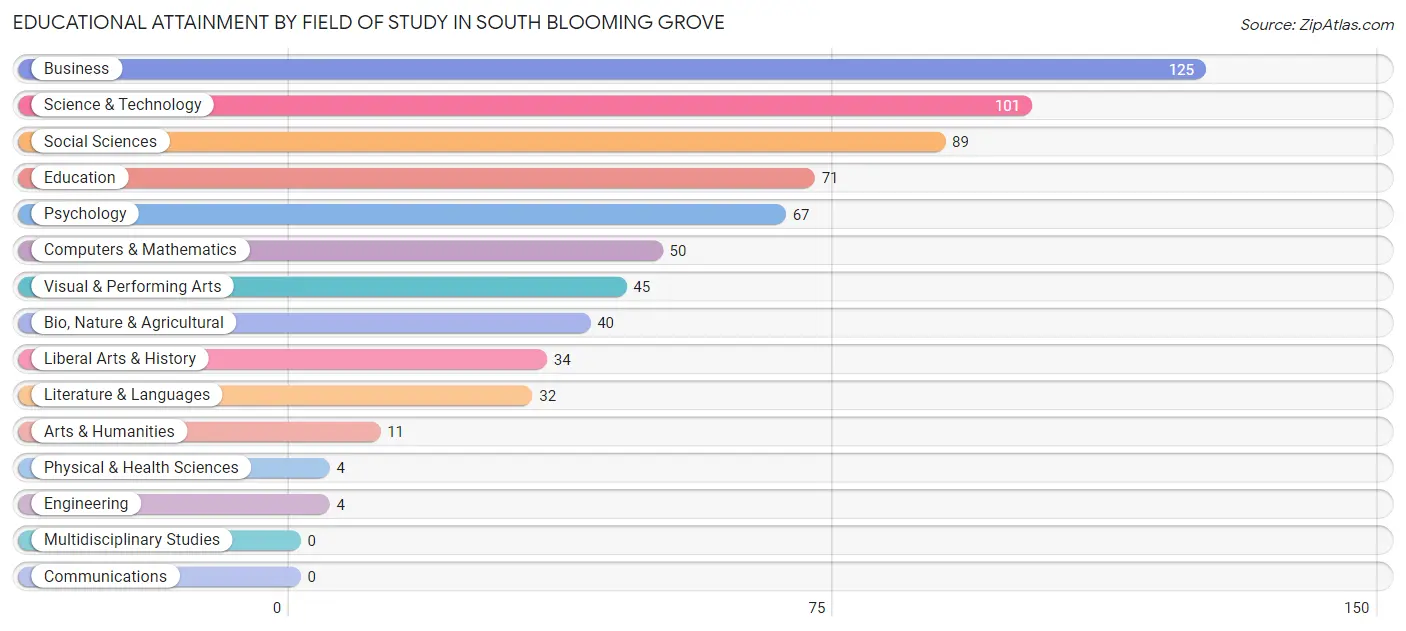
| Field of Study | # Graduates | % Graduates |
| Computers & Mathematics | 50 | 7.4% |
| Bio, Nature & Agricultural | 40 | 5.9% |
| Physical & Health Sciences | 4 | 0.6% |
| Psychology | 67 | 10.0% |
| Social Sciences | 89 | 13.2% |
| Engineering | 4 | 0.6% |
| Multidisciplinary Studies | 0 | 0.0% |
| Science & Technology | 101 | 15.0% |
| Business | 125 | 18.6% |
| Education | 71 | 10.5% |
| Literature & Languages | 32 | 4.8% |
| Liberal Arts & History | 34 | 5.1% |
| Visual & Performing Arts | 45 | 6.7% |
| Communications | 0 | 0.0% |
| Arts & Humanities | 11 | 1.6% |
| Total | 673 | 100.0% |
Transportation & Commute in South Blooming Grove
Vehicle Availability by Sex in South Blooming Grove
The most prevalent vehicle ownership categories in South Blooming Grove are males with 1 vehicle (352, accounting for 50.7%) and females with 1 vehicle (195, making up 63.1%).
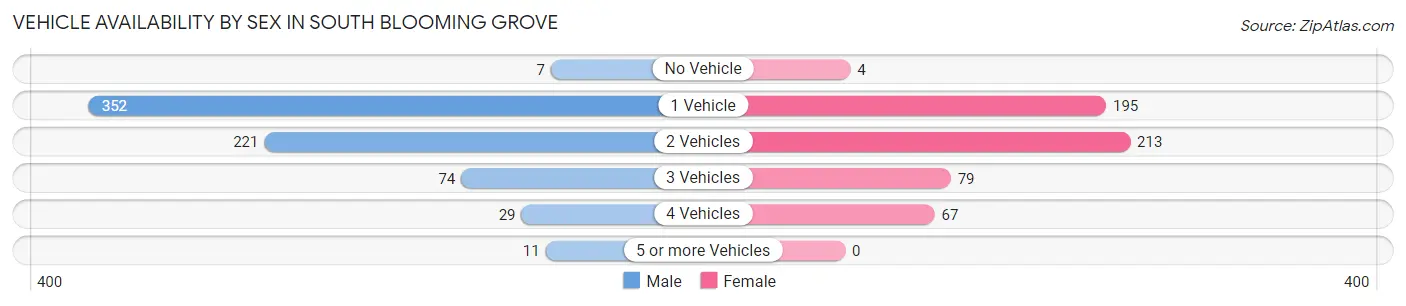
| Vehicles Available | Male | Female |
| No Vehicle | 7 (1.0%) | 4 (0.7%) |
| 1 Vehicle | 352 (50.7%) | 195 (34.9%) |
| 2 Vehicles | 221 (31.8%) | 213 (38.2%) |
| 3 Vehicles | 74 (10.7%) | 79 (14.2%) |
| 4 Vehicles | 29 (4.2%) | 67 (12.0%) |
| 5 or more Vehicles | 11 (1.6%) | 0 (0.0%) |
| Total | 694 (100.0%) | 558 (100.0%) |
Commute Time in South Blooming Grove
The most frequently occuring commute durations in South Blooming Grove are 90 or more minutes (242 commuters, 22.8%), 10 to 14 minutes (150 commuters, 14.1%), and 30 to 34 minutes (132 commuters, 12.4%).
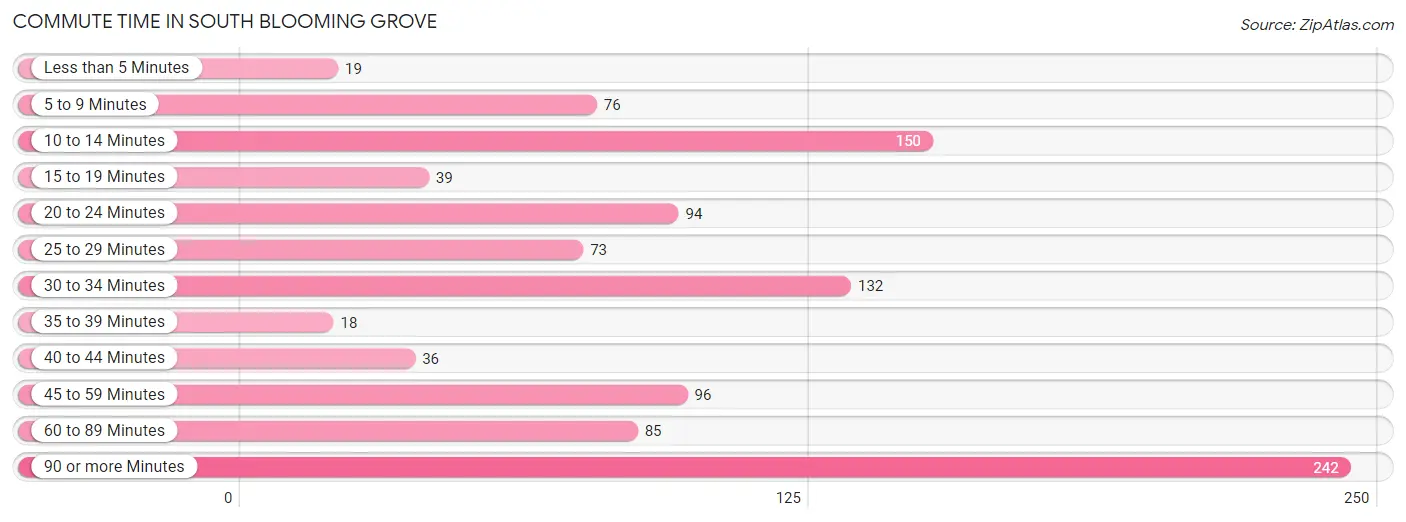
| Commute Time | # Commuters | % Commuters |
| Less than 5 Minutes | 19 | 1.8% |
| 5 to 9 Minutes | 76 | 7.2% |
| 10 to 14 Minutes | 150 | 14.1% |
| 15 to 19 Minutes | 39 | 3.7% |
| 20 to 24 Minutes | 94 | 8.9% |
| 25 to 29 Minutes | 73 | 6.9% |
| 30 to 34 Minutes | 132 | 12.4% |
| 35 to 39 Minutes | 18 | 1.7% |
| 40 to 44 Minutes | 36 | 3.4% |
| 45 to 59 Minutes | 96 | 9.1% |
| 60 to 89 Minutes | 85 | 8.0% |
| 90 or more Minutes | 242 | 22.8% |
Commute Time by Sex in South Blooming Grove
The most common commute times in South Blooming Grove are 90 or more minutes (190 commuters, 33.0%) for males and 10 to 14 minutes (88 commuters, 18.1%) for females.
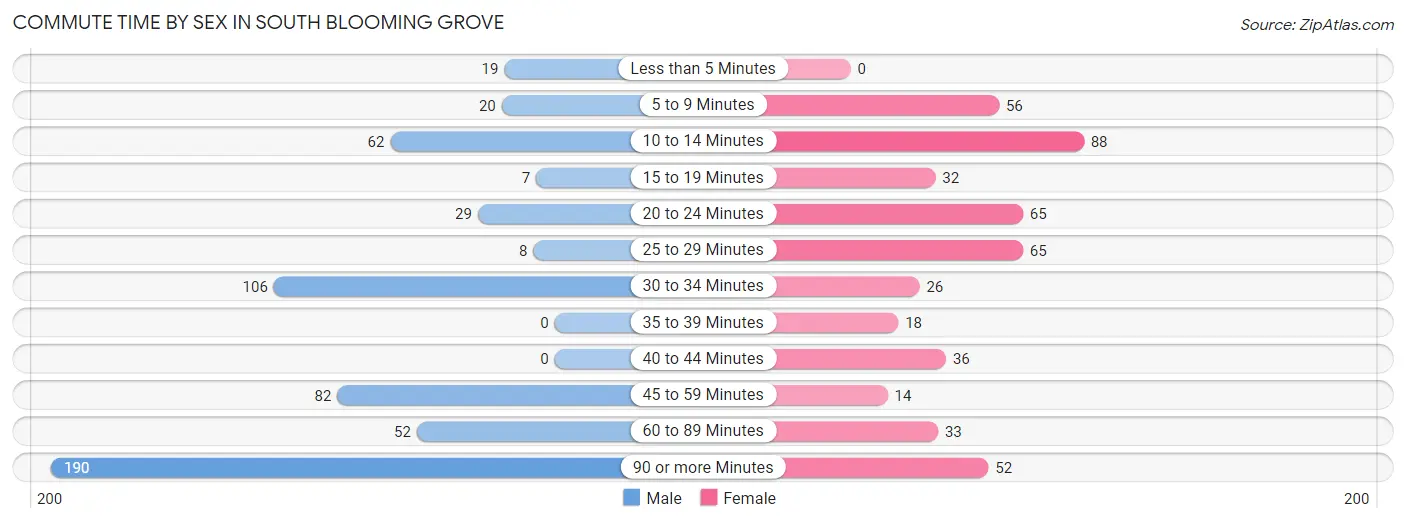
| Commute Time | Male | Female |
| Less than 5 Minutes | 19 (3.3%) | 0 (0.0%) |
| 5 to 9 Minutes | 20 (3.5%) | 56 (11.6%) |
| 10 to 14 Minutes | 62 (10.8%) | 88 (18.1%) |
| 15 to 19 Minutes | 7 (1.2%) | 32 (6.6%) |
| 20 to 24 Minutes | 29 (5.0%) | 65 (13.4%) |
| 25 to 29 Minutes | 8 (1.4%) | 65 (13.4%) |
| 30 to 34 Minutes | 106 (18.4%) | 26 (5.4%) |
| 35 to 39 Minutes | 0 (0.0%) | 18 (3.7%) |
| 40 to 44 Minutes | 0 (0.0%) | 36 (7.4%) |
| 45 to 59 Minutes | 82 (14.3%) | 14 (2.9%) |
| 60 to 89 Minutes | 52 (9.0%) | 33 (6.8%) |
| 90 or more Minutes | 190 (33.0%) | 52 (10.7%) |
Time of Departure to Work by Sex in South Blooming Grove
The most frequent times of departure to work in South Blooming Grove are 9:00 AM to 9:59 AM (130, 22.6%) for males and 8:00 AM to 8:29 AM (137, 28.2%) for females.
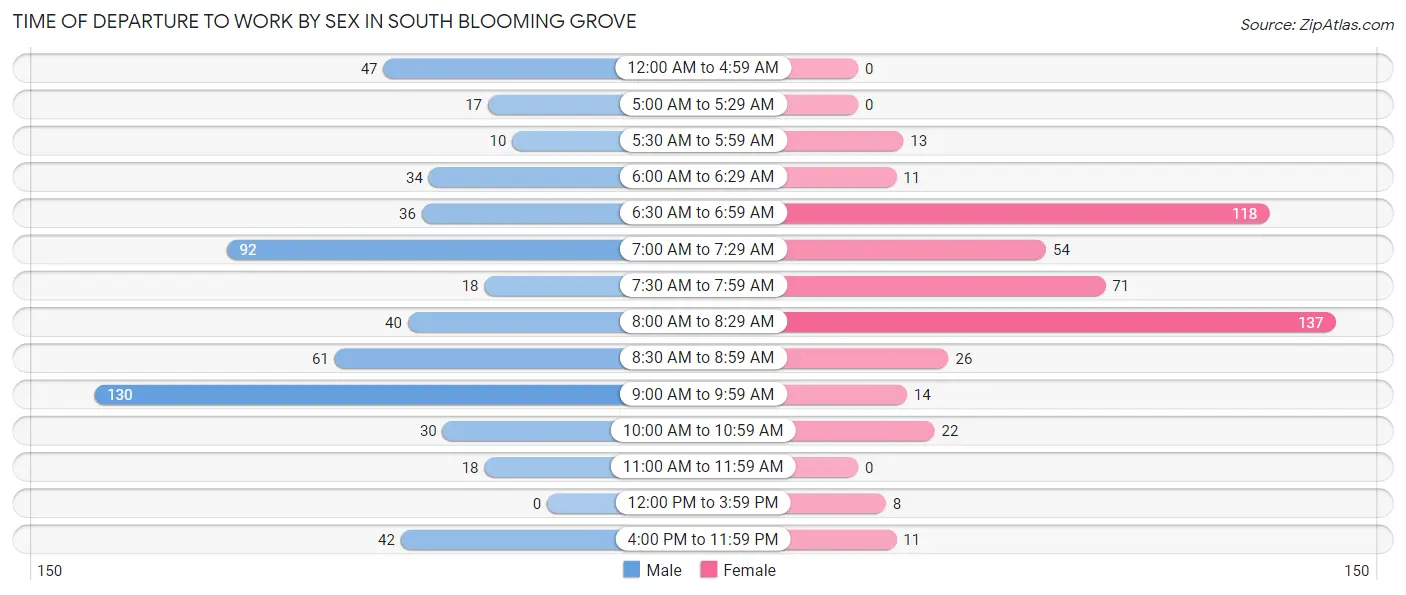
| Time of Departure | Male | Female |
| 12:00 AM to 4:59 AM | 47 (8.2%) | 0 (0.0%) |
| 5:00 AM to 5:29 AM | 17 (3.0%) | 0 (0.0%) |
| 5:30 AM to 5:59 AM | 10 (1.7%) | 13 (2.7%) |
| 6:00 AM to 6:29 AM | 34 (5.9%) | 11 (2.3%) |
| 6:30 AM to 6:59 AM | 36 (6.3%) | 118 (24.3%) |
| 7:00 AM to 7:29 AM | 92 (16.0%) | 54 (11.1%) |
| 7:30 AM to 7:59 AM | 18 (3.1%) | 71 (14.6%) |
| 8:00 AM to 8:29 AM | 40 (7.0%) | 137 (28.2%) |
| 8:30 AM to 8:59 AM | 61 (10.6%) | 26 (5.4%) |
| 9:00 AM to 9:59 AM | 130 (22.6%) | 14 (2.9%) |
| 10:00 AM to 10:59 AM | 30 (5.2%) | 22 (4.5%) |
| 11:00 AM to 11:59 AM | 18 (3.1%) | 0 (0.0%) |
| 12:00 PM to 3:59 PM | 0 (0.0%) | 8 (1.7%) |
| 4:00 PM to 11:59 PM | 42 (7.3%) | 11 (2.3%) |
| Total | 575 (100.0%) | 485 (100.0%) |
Housing Occupancy in South Blooming Grove
Occupancy by Ownership in South Blooming Grove
Of the total 1,177 dwellings in South Blooming Grove, owner-occupied units account for 786 (66.8%), while renter-occupied units make up 391 (33.2%).
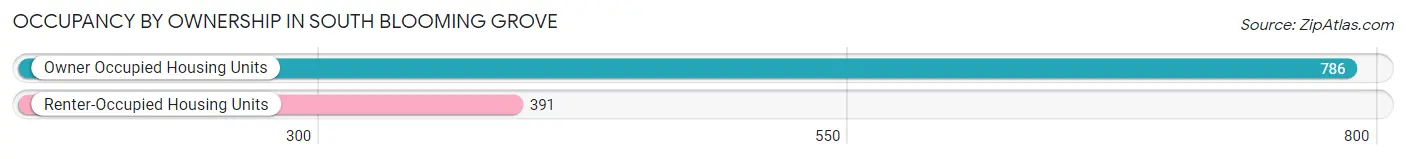
| Occupancy | # Housing Units | % Housing Units |
| Owner Occupied Housing Units | 786 | 66.8% |
| Renter-Occupied Housing Units | 391 | 33.2% |
| Total Occupied Housing Units | 1,177 | 100.0% |
Occupancy by Household Size in South Blooming Grove
| Household Size | # Housing Units | % Housing Units |
| 1-Person Household | 407 | 34.6% |
| 2-Person Household | 316 | 26.9% |
| 3-Person Household | 98 | 8.3% |
| 4+ Person Household | 356 | 30.2% |
| Total Housing Units | 1,177 | 100.0% |
Occupancy by Ownership by Household Size in South Blooming Grove
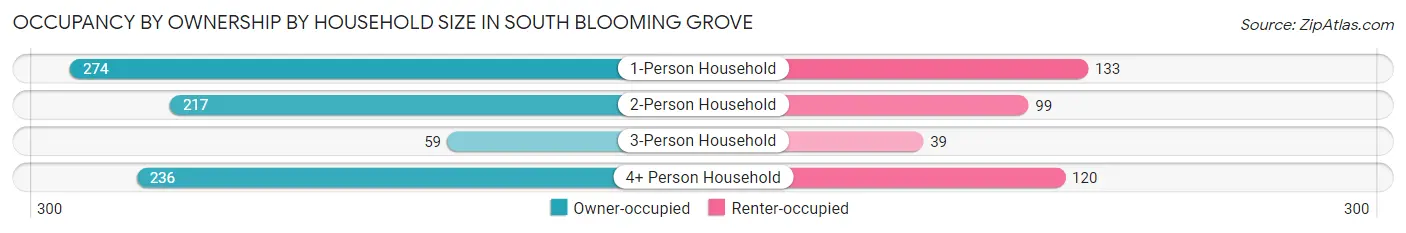
| Household Size | Owner-occupied | Renter-occupied |
| 1-Person Household | 274 (67.3%) | 133 (32.7%) |
| 2-Person Household | 217 (68.7%) | 99 (31.3%) |
| 3-Person Household | 59 (60.2%) | 39 (39.8%) |
| 4+ Person Household | 236 (66.3%) | 120 (33.7%) |
| Total Housing Units | 786 (66.8%) | 391 (33.2%) |
Occupancy by Educational Attainment in South Blooming Grove
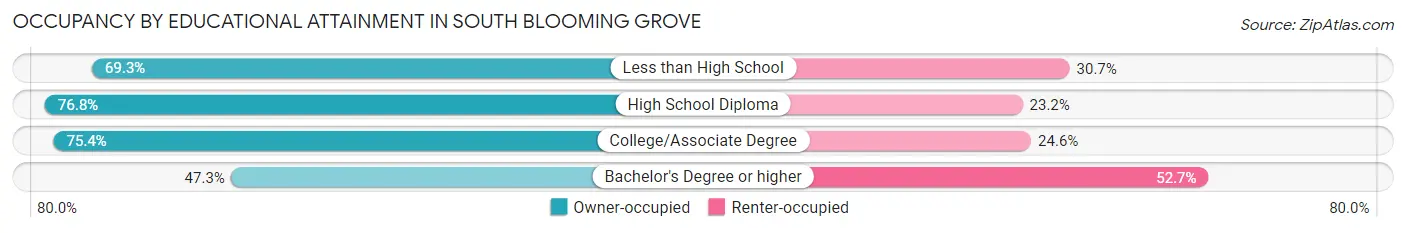
| Household Size | Owner-occupied | Renter-occupied |
| Less than High School | 61 (69.3%) | 27 (30.7%) |
| High School Diploma | 195 (76.8%) | 59 (23.2%) |
| College/Associate Degree | 362 (75.4%) | 118 (24.6%) |
| Bachelor's Degree or higher | 168 (47.3%) | 187 (52.7%) |
Occupancy by Age of Householder in South Blooming Grove
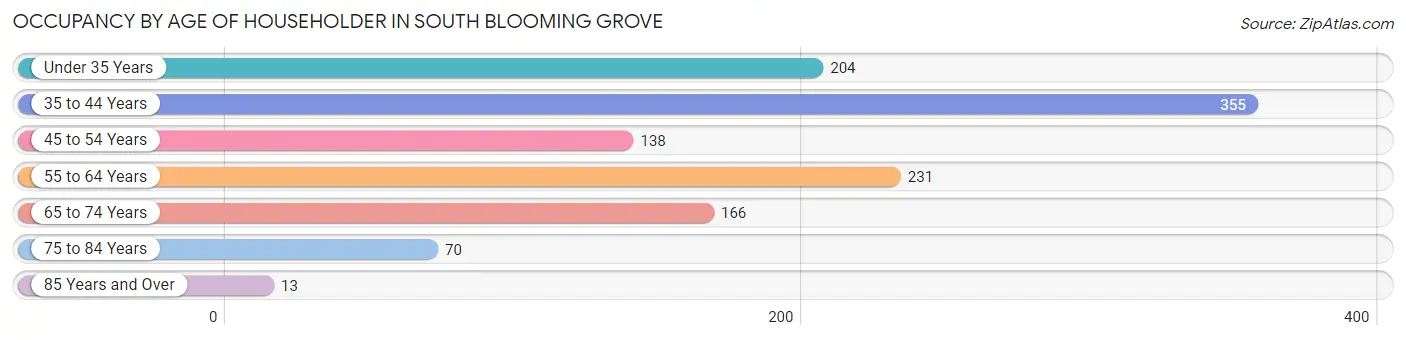
| Age Bracket | # Households | % Households |
| Under 35 Years | 204 | 17.3% |
| 35 to 44 Years | 355 | 30.2% |
| 45 to 54 Years | 138 | 11.7% |
| 55 to 64 Years | 231 | 19.6% |
| 65 to 74 Years | 166 | 14.1% |
| 75 to 84 Years | 70 | 5.9% |
| 85 Years and Over | 13 | 1.1% |
| Total | 1,177 | 100.0% |
Housing Finances in South Blooming Grove
Median Income by Occupancy in South Blooming Grove
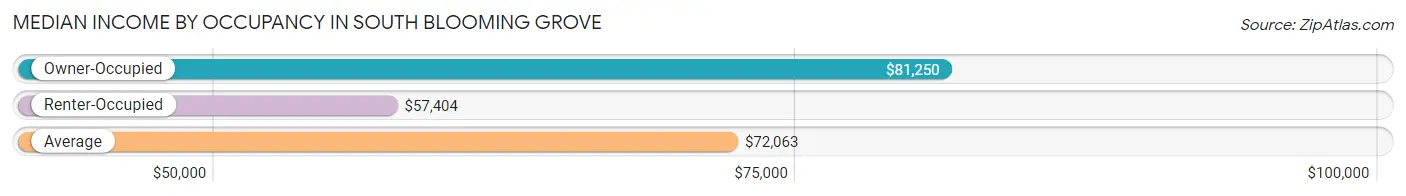
| Occupancy Type | # Households | Median Income |
| Owner-Occupied | 786 (66.8%) | $81,250 |
| Renter-Occupied | 391 (33.2%) | $57,404 |
| Average | 1,177 (100.0%) | $72,063 |
Occupancy by Householder Income Bracket in South Blooming Grove
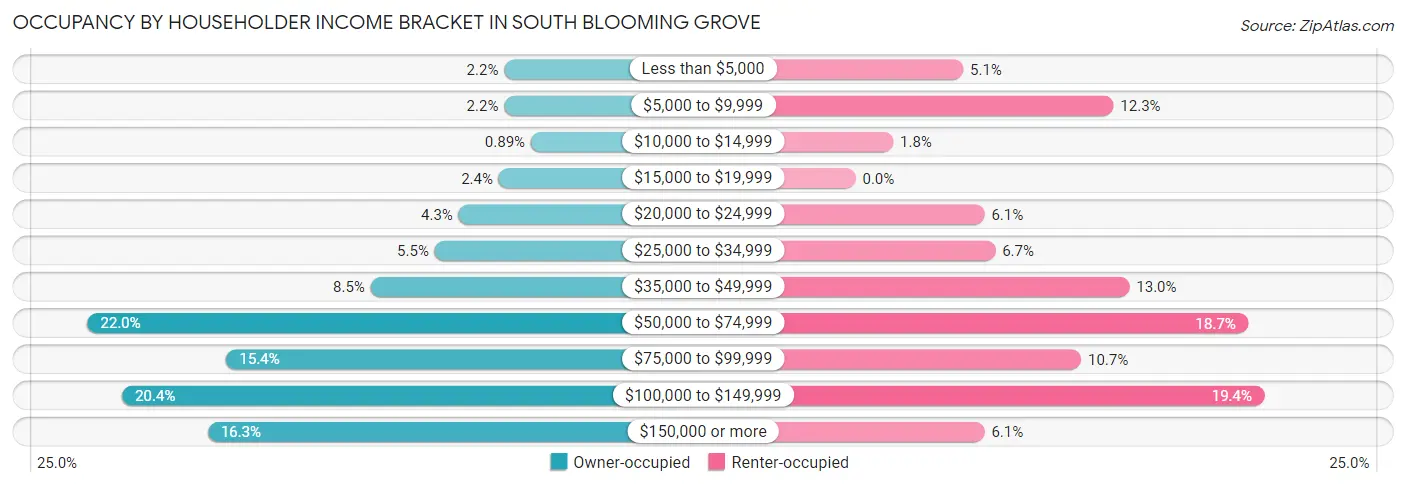
| Income Bracket | Owner-occupied | Renter-occupied |
| Less than $5,000 | 17 (2.2%) | 20 (5.1%) |
| $5,000 to $9,999 | 17 (2.2%) | 48 (12.3%) |
| $10,000 to $14,999 | 7 (0.9%) | 7 (1.8%) |
| $15,000 to $19,999 | 19 (2.4%) | 0 (0.0%) |
| $20,000 to $24,999 | 34 (4.3%) | 24 (6.1%) |
| $25,000 to $34,999 | 43 (5.5%) | 26 (6.7%) |
| $35,000 to $49,999 | 67 (8.5%) | 51 (13.0%) |
| $50,000 to $74,999 | 173 (22.0%) | 73 (18.7%) |
| $75,000 to $99,999 | 121 (15.4%) | 42 (10.7%) |
| $100,000 to $149,999 | 160 (20.4%) | 76 (19.4%) |
| $150,000 or more | 128 (16.3%) | 24 (6.1%) |
| Total | 786 (100.0%) | 391 (100.0%) |
Monthly Housing Cost Tiers in South Blooming Grove
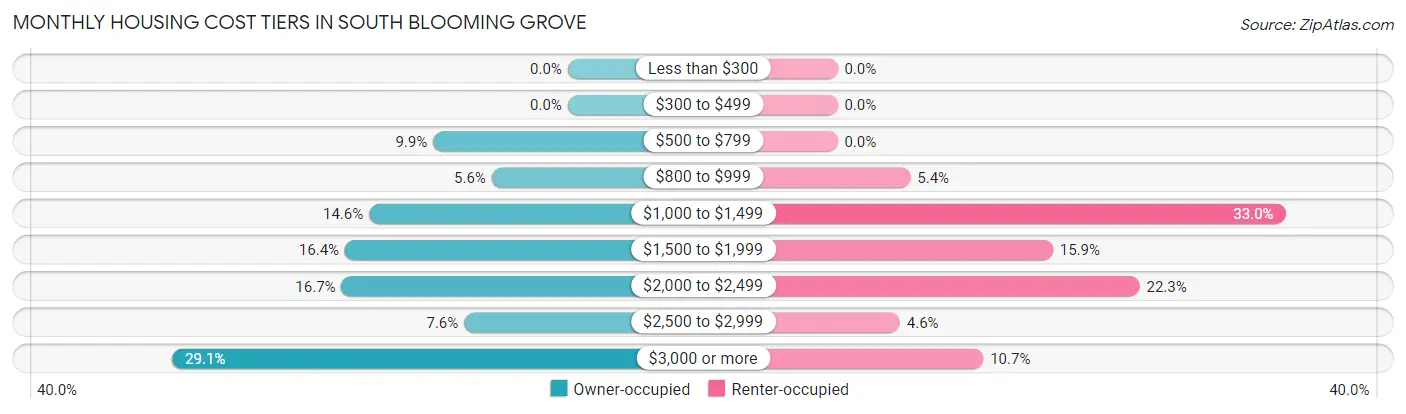
| Monthly Cost | Owner-occupied | Renter-occupied |
| Less than $300 | 0 (0.0%) | 0 (0.0%) |
| $300 to $499 | 0 (0.0%) | 0 (0.0%) |
| $500 to $799 | 78 (9.9%) | 0 (0.0%) |
| $800 to $999 | 44 (5.6%) | 21 (5.4%) |
| $1,000 to $1,499 | 115 (14.6%) | 129 (33.0%) |
| $1,500 to $1,999 | 129 (16.4%) | 62 (15.9%) |
| $2,000 to $2,499 | 131 (16.7%) | 87 (22.3%) |
| $2,500 to $2,999 | 60 (7.6%) | 18 (4.6%) |
| $3,000 or more | 229 (29.1%) | 42 (10.7%) |
| Total | 786 (100.0%) | 391 (100.0%) |
Physical Housing Characteristics in South Blooming Grove
Housing Structures in South Blooming Grove
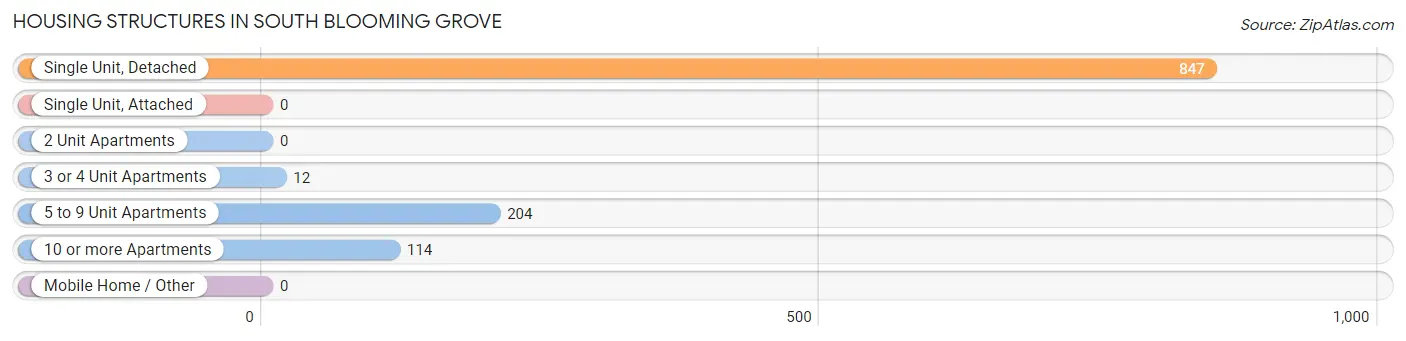
| Structure Type | # Housing Units | % Housing Units |
| Single Unit, Detached | 847 | 72.0% |
| Single Unit, Attached | 0 | 0.0% |
| 2 Unit Apartments | 0 | 0.0% |
| 3 or 4 Unit Apartments | 12 | 1.0% |
| 5 to 9 Unit Apartments | 204 | 17.3% |
| 10 or more Apartments | 114 | 9.7% |
| Mobile Home / Other | 0 | 0.0% |
| Total | 1,177 | 100.0% |
Housing Structures by Occupancy in South Blooming Grove
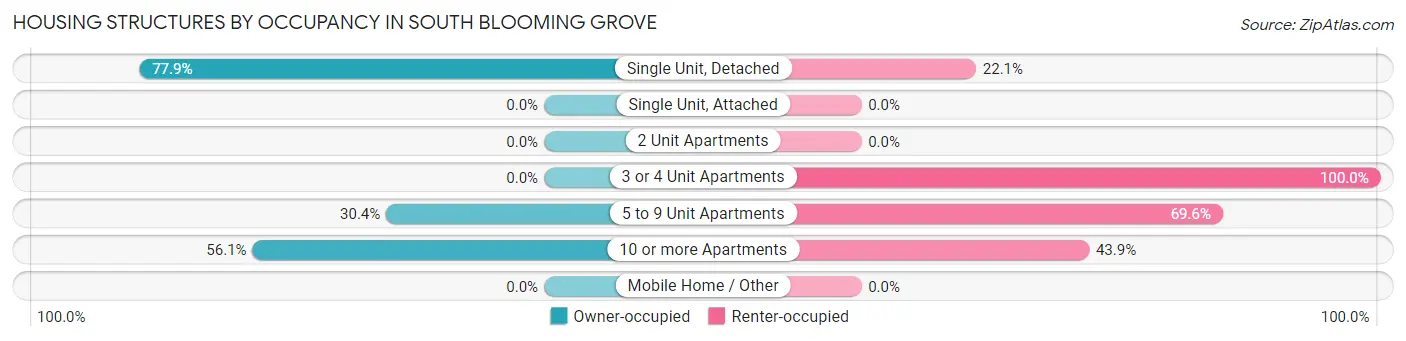
| Structure Type | Owner-occupied | Renter-occupied |
| Single Unit, Detached | 660 (77.9%) | 187 (22.1%) |
| Single Unit, Attached | 0 (0.0%) | 0 (0.0%) |
| 2 Unit Apartments | 0 (0.0%) | 0 (0.0%) |
| 3 or 4 Unit Apartments | 0 (0.0%) | 12 (100.0%) |
| 5 to 9 Unit Apartments | 62 (30.4%) | 142 (69.6%) |
| 10 or more Apartments | 64 (56.1%) | 50 (43.9%) |
| Mobile Home / Other | 0 (0.0%) | 0 (0.0%) |
| Total | 786 (66.8%) | 391 (33.2%) |
Housing Structures by Number of Rooms in South Blooming Grove
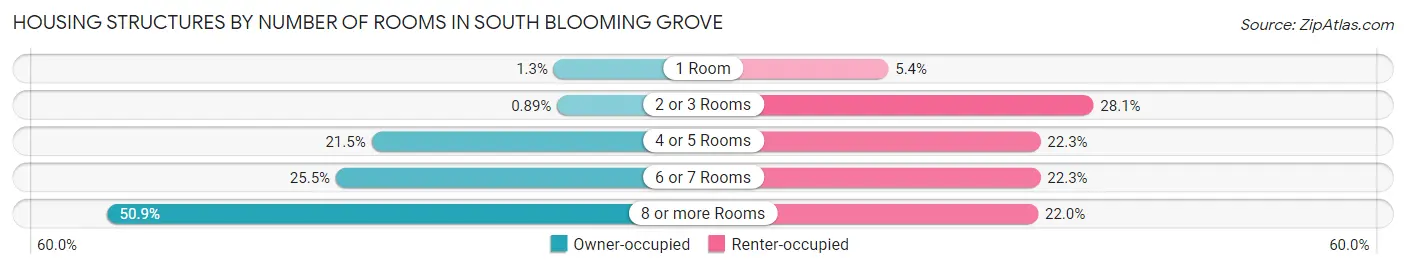
| Number of Rooms | Owner-occupied | Renter-occupied |
| 1 Room | 10 (1.3%) | 21 (5.4%) |
| 2 or 3 Rooms | 7 (0.9%) | 110 (28.1%) |
| 4 or 5 Rooms | 169 (21.5%) | 87 (22.3%) |
| 6 or 7 Rooms | 200 (25.5%) | 87 (22.3%) |
| 8 or more Rooms | 400 (50.9%) | 86 (22.0%) |
| Total | 786 (100.0%) | 391 (100.0%) |
Housing Structure by Heating Type in South Blooming Grove
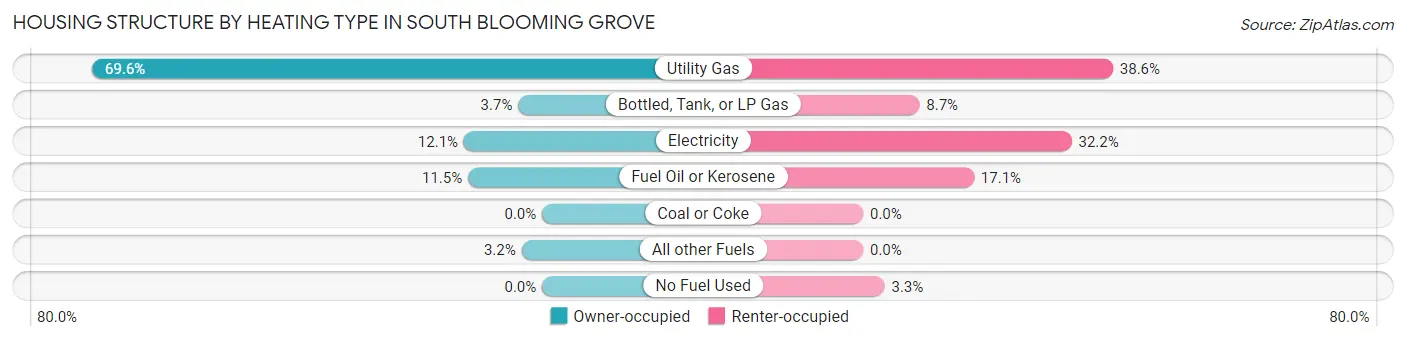
| Heating Type | Owner-occupied | Renter-occupied |
| Utility Gas | 547 (69.6%) | 151 (38.6%) |
| Bottled, Tank, or LP Gas | 29 (3.7%) | 34 (8.7%) |
| Electricity | 95 (12.1%) | 126 (32.2%) |
| Fuel Oil or Kerosene | 90 (11.5%) | 67 (17.1%) |
| Coal or Coke | 0 (0.0%) | 0 (0.0%) |
| All other Fuels | 25 (3.2%) | 0 (0.0%) |
| No Fuel Used | 0 (0.0%) | 13 (3.3%) |
| Total | 786 (100.0%) | 391 (100.0%) |
Household Vehicle Usage in South Blooming Grove
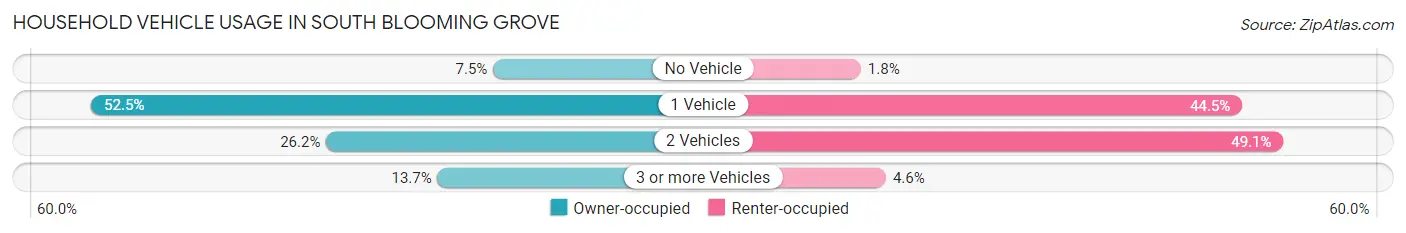
| Vehicles per Household | Owner-occupied | Renter-occupied |
| No Vehicle | 59 (7.5%) | 7 (1.8%) |
| 1 Vehicle | 413 (52.5%) | 174 (44.5%) |
| 2 Vehicles | 206 (26.2%) | 192 (49.1%) |
| 3 or more Vehicles | 108 (13.7%) | 18 (4.6%) |
| Total | 786 (100.0%) | 391 (100.0%) |
Real Estate & Mortgages in South Blooming Grove
Real Estate and Mortgage Overview in South Blooming Grove
| Characteristic | Without Mortgage | With Mortgage |
| Housing Units | 248 | 538 |
| Median Property Value | $426,900 | $441,000 |
| Median Household Income | $95,000 | $89 |
| Monthly Housing Costs | $1,031 | $229 |
| Real Estate Taxes | $10,001 | $15 |
Property Value by Mortgage Status in South Blooming Grove
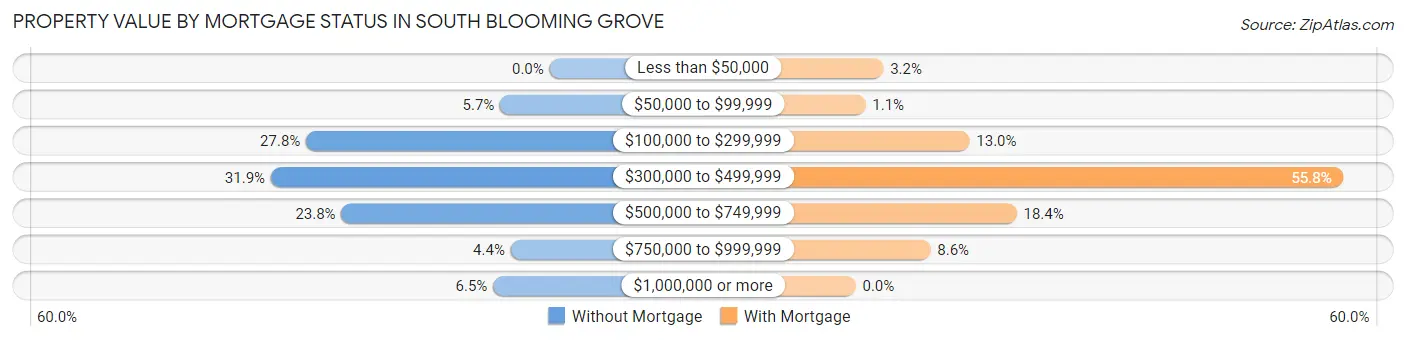
| Property Value | Without Mortgage | With Mortgage |
| Less than $50,000 | 0 (0.0%) | 17 (3.2%) |
| $50,000 to $99,999 | 14 (5.7%) | 6 (1.1%) |
| $100,000 to $299,999 | 69 (27.8%) | 70 (13.0%) |
| $300,000 to $499,999 | 79 (31.9%) | 300 (55.8%) |
| $500,000 to $749,999 | 59 (23.8%) | 99 (18.4%) |
| $750,000 to $999,999 | 11 (4.4%) | 46 (8.6%) |
| $1,000,000 or more | 16 (6.5%) | 0 (0.0%) |
| Total | 248 (100.0%) | 538 (100.0%) |
Household Income by Mortgage Status in South Blooming Grove
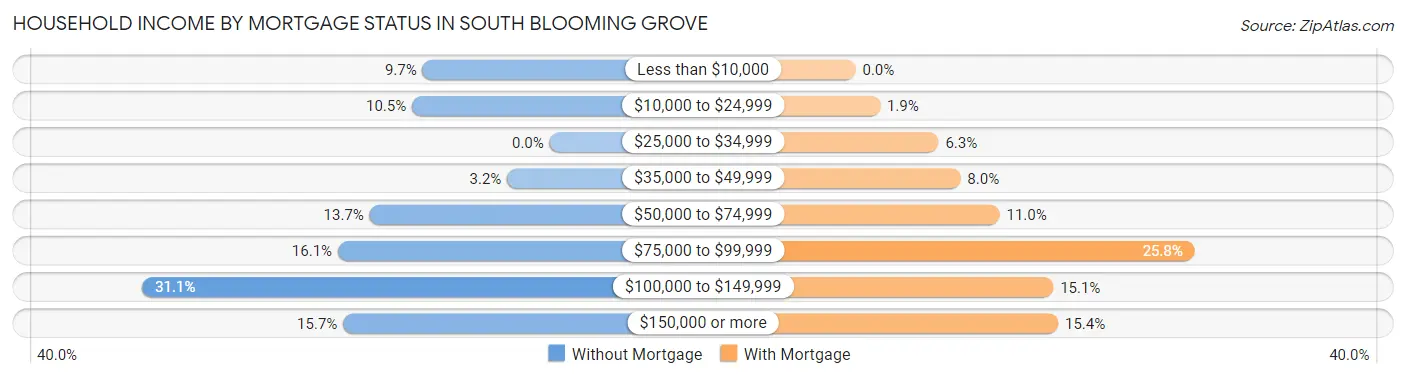
| Household Income | Without Mortgage | With Mortgage |
| Less than $10,000 | 24 (9.7%) | 0 (0.0%) |
| $10,000 to $24,999 | 26 (10.5%) | 10 (1.9%) |
| $25,000 to $34,999 | 0 (0.0%) | 34 (6.3%) |
| $35,000 to $49,999 | 8 (3.2%) | 43 (8.0%) |
| $50,000 to $74,999 | 34 (13.7%) | 59 (11.0%) |
| $75,000 to $99,999 | 40 (16.1%) | 139 (25.8%) |
| $100,000 to $149,999 | 77 (31.0%) | 81 (15.1%) |
| $150,000 or more | 39 (15.7%) | 83 (15.4%) |
| Total | 248 (100.0%) | 538 (100.0%) |
Property Value to Household Income Ratio in South Blooming Grove
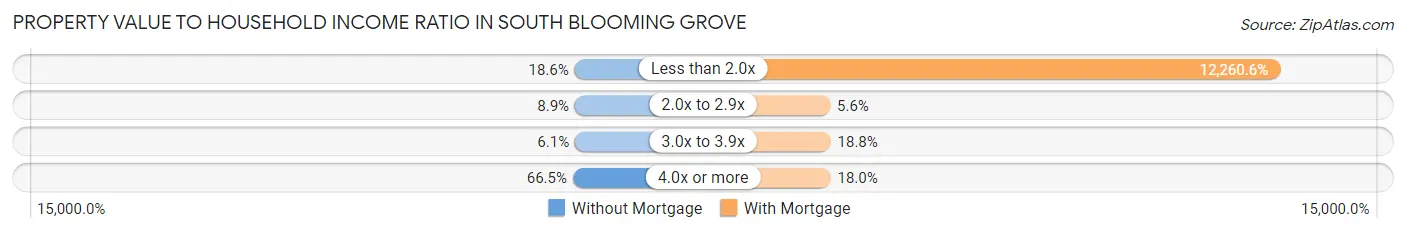
| Value-to-Income Ratio | Without Mortgage | With Mortgage |
| Less than 2.0x | 46 (18.5%) | 65,962 (12,260.6%) |
| 2.0x to 2.9x | 22 (8.9%) | 30 (5.6%) |
| 3.0x to 3.9x | 15 (6.0%) | 101 (18.8%) |
| 4.0x or more | 165 (66.5%) | 97 (18.0%) |
| Total | 248 (100.0%) | 538 (100.0%) |
Real Estate Taxes by Mortgage Status in South Blooming Grove
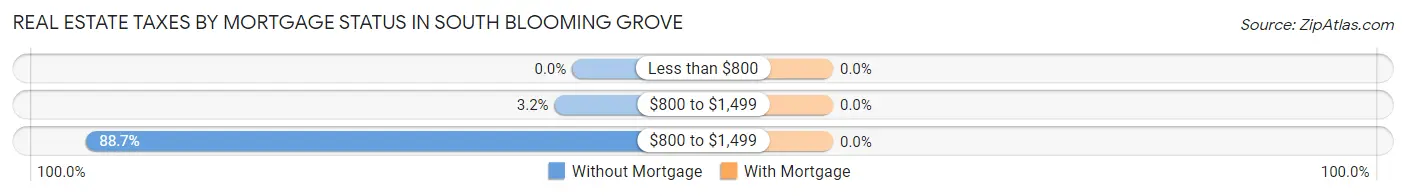
| Property Taxes | Without Mortgage | With Mortgage |
| Less than $800 | 0 (0.0%) | 0 (0.0%) |
| $800 to $1,499 | 8 (3.2%) | 0 (0.0%) |
| $800 to $1,499 | 220 (88.7%) | 0 (0.0%) |
| Total | 248 (100.0%) | 538 (100.0%) |
Health & Disability in South Blooming Grove
Health Insurance Coverage by Age in South Blooming Grove
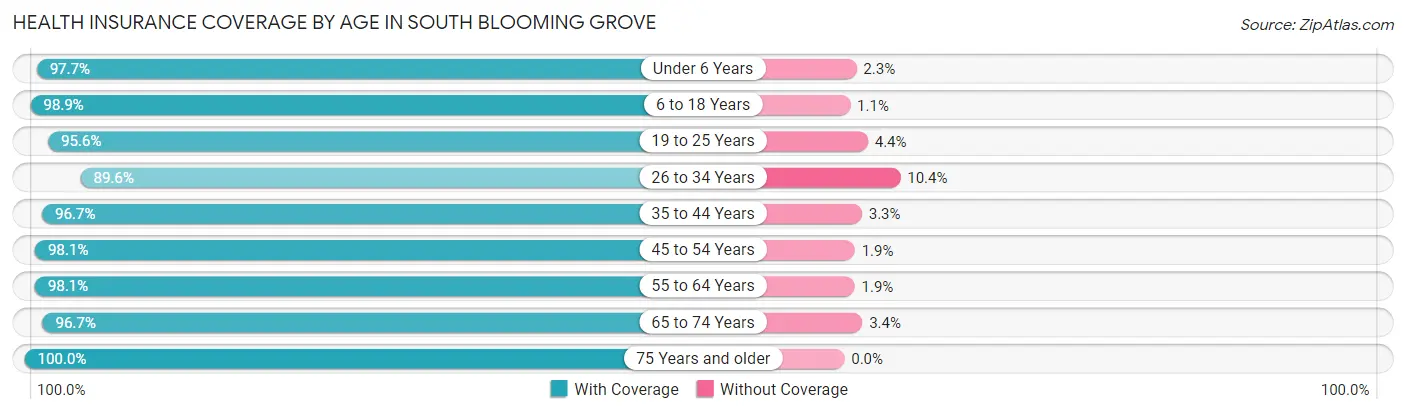
| Age Bracket | With Coverage | Without Coverage |
| Under 6 Years | 475 (97.7%) | 11 (2.3%) |
| 6 to 18 Years | 1,176 (98.9%) | 13 (1.1%) |
| 19 to 25 Years | 240 (95.6%) | 11 (4.4%) |
| 26 to 34 Years | 326 (89.6%) | 38 (10.4%) |
| 35 to 44 Years | 593 (96.7%) | 20 (3.3%) |
| 45 to 54 Years | 202 (98.1%) | 4 (1.9%) |
| 55 to 64 Years | 358 (98.1%) | 7 (1.9%) |
| 65 to 74 Years | 202 (96.7%) | 7 (3.4%) |
| 75 Years and older | 166 (100.0%) | 0 (0.0%) |
| Total | 3,738 (97.1%) | 111 (2.9%) |
Health Insurance Coverage by Citizenship Status in South Blooming Grove
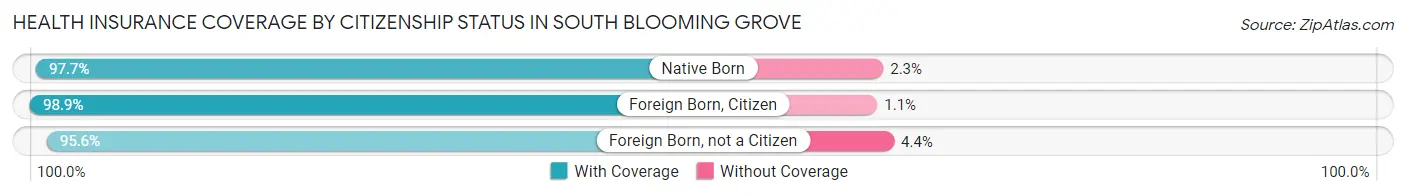
| Citizenship Status | With Coverage | Without Coverage |
| Native Born | 475 (97.7%) | 11 (2.3%) |
| Foreign Born, Citizen | 1,176 (98.9%) | 13 (1.1%) |
| Foreign Born, not a Citizen | 240 (95.6%) | 11 (4.4%) |
Health Insurance Coverage by Household Income in South Blooming Grove
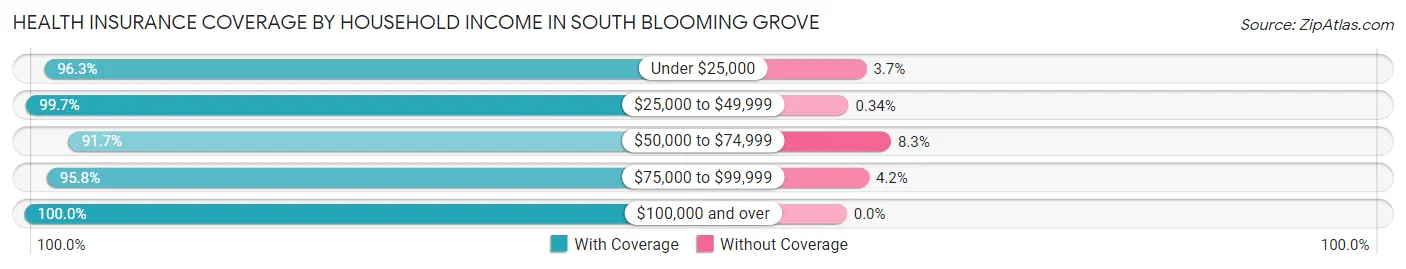
| Household Income | With Coverage | Without Coverage |
| Under $25,000 | 524 (96.3%) | 20 (3.7%) |
| $25,000 to $49,999 | 1,180 (99.7%) | 4 (0.3%) |
| $50,000 to $74,999 | 787 (91.7%) | 71 (8.3%) |
| $75,000 to $99,999 | 368 (95.8%) | 16 (4.2%) |
| $100,000 and over | 872 (100.0%) | 0 (0.0%) |
Public vs Private Health Insurance Coverage by Age in South Blooming Grove

| Age Bracket | Public Insurance | Private Insurance |
| Under 6 | 465 (95.7%) | 10 (2.1%) |
| 6 to 18 Years | 1,025 (86.2%) | 151 (12.7%) |
| 19 to 25 Years | 125 (49.8%) | 115 (45.8%) |
| 25 to 34 Years | 96 (26.4%) | 247 (67.9%) |
| 35 to 44 Years | 475 (77.5%) | 141 (23.0%) |
| 45 to 54 Years | 20 (9.7%) | 182 (88.3%) |
| 55 to 64 Years | 129 (35.3%) | 229 (62.7%) |
| 65 to 74 Years | 181 (86.6%) | 132 (63.2%) |
| 75 Years and over | 166 (100.0%) | 132 (79.5%) |
| Total | 2,682 (69.7%) | 1,339 (34.8%) |
Disability Status by Sex by Age in South Blooming Grove
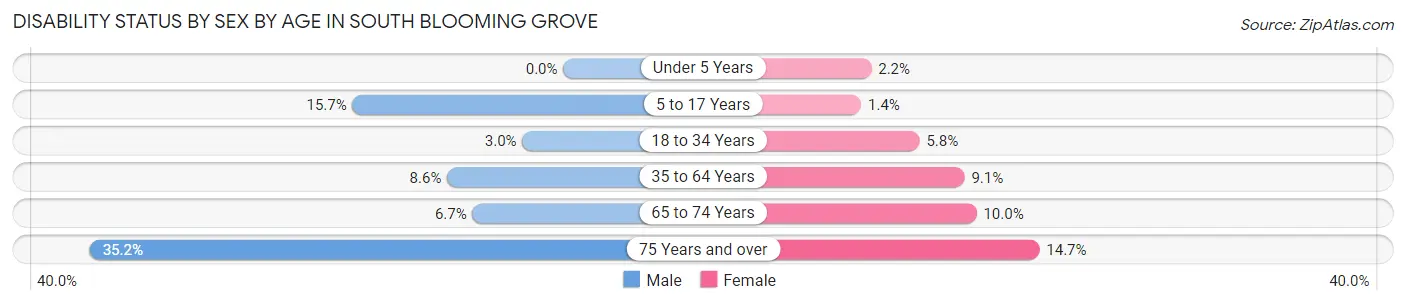
| Age Bracket | Male | Female |
| Under 5 Years | 0 (0.0%) | 4 (2.2%) |
| 5 to 17 Years | 92 (15.7%) | 10 (1.4%) |
| 18 to 34 Years | 11 (3.0%) | 18 (5.8%) |
| 35 to 64 Years | 50 (8.6%) | 55 (9.1%) |
| 65 to 74 Years | 6 (6.7%) | 12 (10.0%) |
| 75 Years and over | 32 (35.2%) | 11 (14.7%) |
Disability Class by Sex by Age in South Blooming Grove
Disability Class: Hearing Difficulty
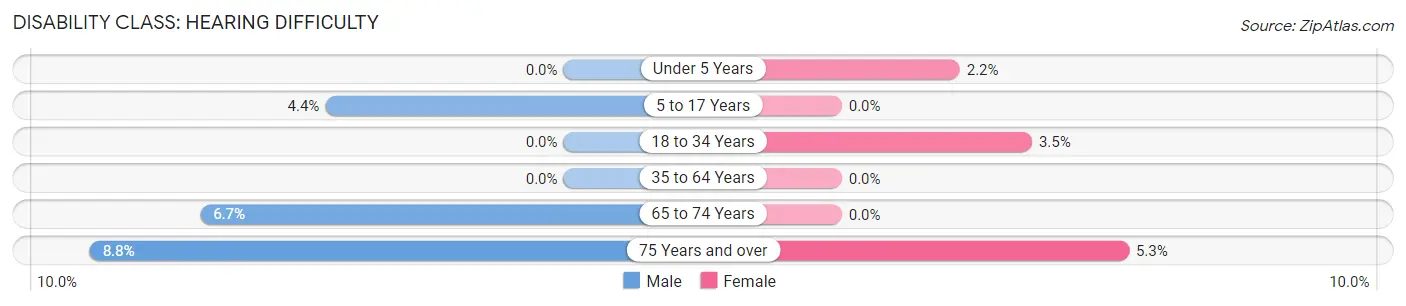
| Age Bracket | Male | Female |
| Under 5 Years | 0 (0.0%) | 4 (2.2%) |
| 5 to 17 Years | 26 (4.4%) | 0 (0.0%) |
| 18 to 34 Years | 0 (0.0%) | 11 (3.5%) |
| 35 to 64 Years | 0 (0.0%) | 0 (0.0%) |
| 65 to 74 Years | 6 (6.7%) | 0 (0.0%) |
| 75 Years and over | 8 (8.8%) | 4 (5.3%) |
Disability Class: Vision Difficulty
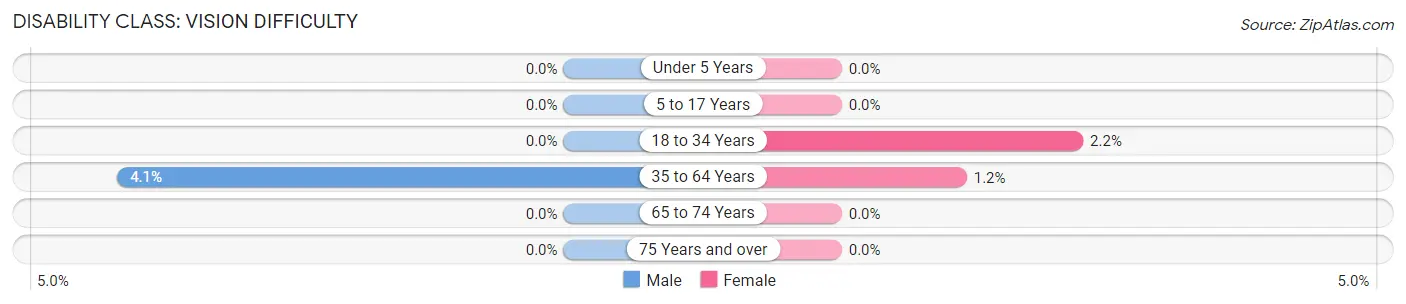
| Age Bracket | Male | Female |
| Under 5 Years | 0 (0.0%) | 0 (0.0%) |
| 5 to 17 Years | 0 (0.0%) | 0 (0.0%) |
| 18 to 34 Years | 0 (0.0%) | 7 (2.2%) |
| 35 to 64 Years | 24 (4.1%) | 7 (1.2%) |
| 65 to 74 Years | 0 (0.0%) | 0 (0.0%) |
| 75 Years and over | 0 (0.0%) | 0 (0.0%) |
Disability Class: Cognitive Difficulty
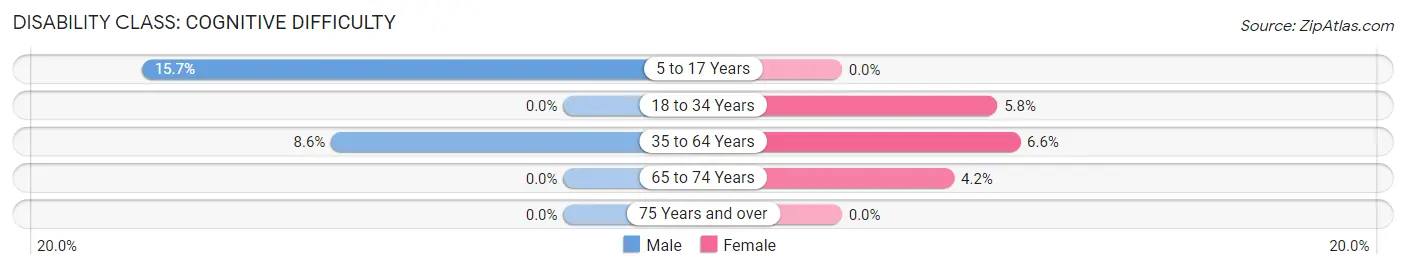
| Age Bracket | Male | Female |
| 5 to 17 Years | 92 (15.7%) | 0 (0.0%) |
| 18 to 34 Years | 0 (0.0%) | 18 (5.8%) |
| 35 to 64 Years | 50 (8.6%) | 40 (6.6%) |
| 65 to 74 Years | 0 (0.0%) | 5 (4.2%) |
| 75 Years and over | 0 (0.0%) | 0 (0.0%) |
Disability Class: Ambulatory Difficulty
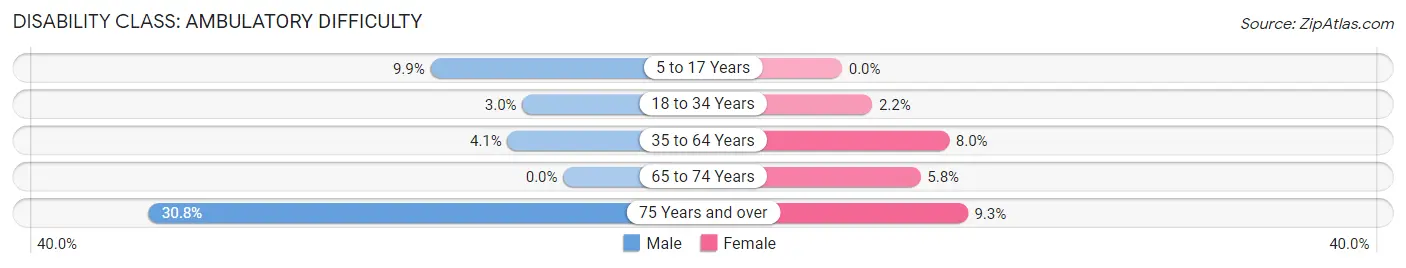
| Age Bracket | Male | Female |
| 5 to 17 Years | 58 (9.9%) | 0 (0.0%) |
| 18 to 34 Years | 11 (3.0%) | 7 (2.2%) |
| 35 to 64 Years | 24 (4.1%) | 48 (8.0%) |
| 65 to 74 Years | 0 (0.0%) | 7 (5.8%) |
| 75 Years and over | 28 (30.8%) | 7 (9.3%) |
Disability Class: Self-Care Difficulty
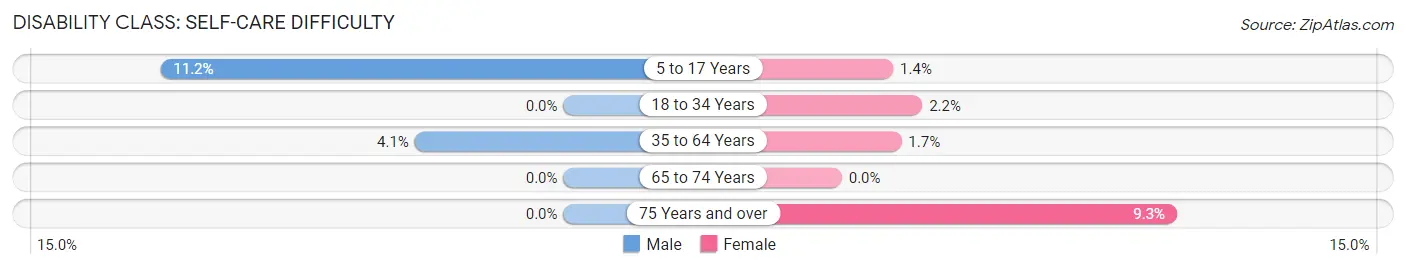
| Age Bracket | Male | Female |
| 5 to 17 Years | 66 (11.2%) | 10 (1.4%) |
| 18 to 34 Years | 0 (0.0%) | 7 (2.2%) |
| 35 to 64 Years | 24 (4.1%) | 10 (1.7%) |
| 65 to 74 Years | 0 (0.0%) | 0 (0.0%) |
| 75 Years and over | 0 (0.0%) | 7 (9.3%) |
Technology Access in South Blooming Grove
Computing Device Access in South Blooming Grove
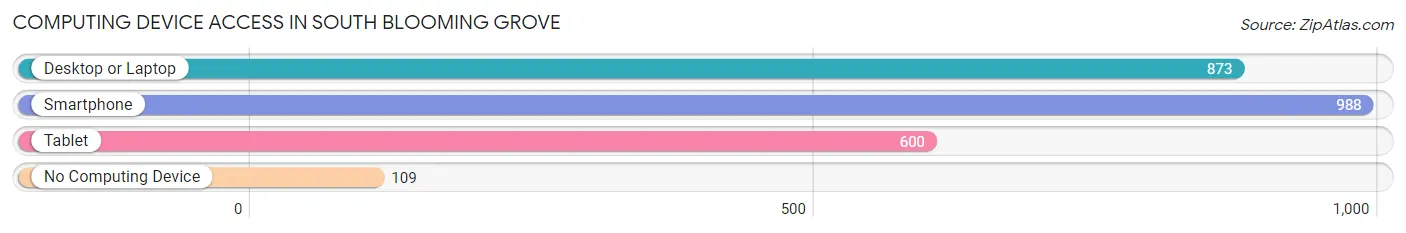
| Device Type | # Households | % Households |
| Desktop or Laptop | 873 | 74.2% |
| Smartphone | 988 | 83.9% |
| Tablet | 600 | 51.0% |
| No Computing Device | 109 | 9.3% |
| Total | 1,177 | 100.0% |
Internet Access in South Blooming Grove
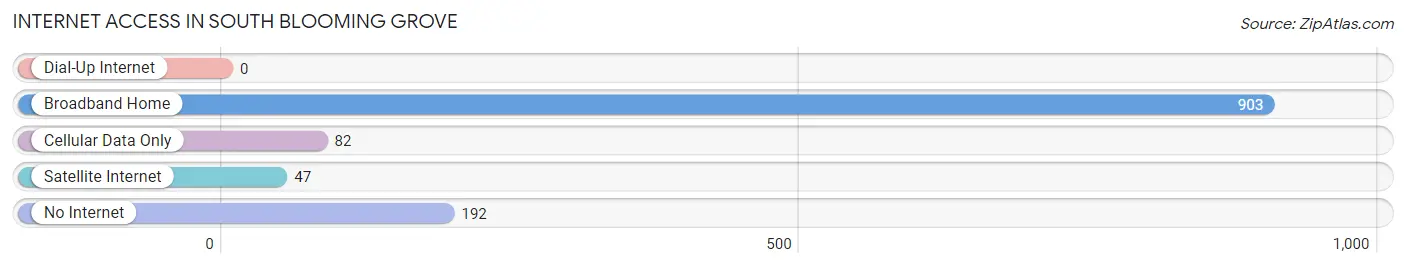
| Internet Type | # Households | % Households |
| Dial-Up Internet | 0 | 0.0% |
| Broadband Home | 903 | 76.7% |
| Cellular Data Only | 82 | 7.0% |
| Satellite Internet | 47 | 4.0% |
| No Internet | 192 | 16.3% |
| Total | 1,177 | 100.0% |
South Blooming Grove Summary
History
South Blooming Grove is a hamlet located in the Town of Blooming Grove in Orange County, New York. The hamlet was first settled in 1750 by a group of Dutch settlers. The hamlet was originally known as “Southfield” and was part of the larger Town of Blooming Grove. In 1845, the hamlet was officially incorporated as the Village of South Blooming Grove.
The hamlet was a rural farming community for much of its history. In the late 19th century, the hamlet began to experience a period of growth and development. The hamlet was home to several small businesses, including a general store, a blacksmith shop, and a grist mill. The hamlet also had a post office, a school, and a church.
In the early 20th century, the hamlet experienced a period of decline. Many of the businesses closed and the population began to decline. In the 1950s, the hamlet began to experience a period of growth and development. The hamlet was home to several new businesses, including a gas station, a grocery store, and a hardware store.
Geography
South Blooming Grove is located in the Town of Blooming Grove in Orange County, New York. The hamlet is situated on the east side of the Hudson River, approximately 25 miles north of New York City. The hamlet is bordered by the hamlets of Washingtonville to the north, Salisbury Mills to the east, and Central Valley to the south.
The hamlet has a total area of 1.2 square miles, all of which is land. The terrain of the hamlet is mostly flat, with some rolling hills. The hamlet is located in the Hudson Valley region of New York and is part of the larger New York metropolitan area.
Economy
South Blooming Grove is a primarily residential community. The hamlet is home to several small businesses, including a gas station, a grocery store, and a hardware store. The hamlet is also home to several restaurants and bars.
The hamlet is served by the Port Jervis Line of the Metro-North Railroad. The hamlet is also served by several bus routes operated by the Orange County Transit Authority.
Demographics
As of the 2010 census, the population of South Blooming Grove was 4,845. The racial makeup of the hamlet was 87.3% White, 5.2% African American, 0.5% Native American, 1.7% Asian, and 4.3% from other races. Hispanic or Latino of any race were 8.3% of the population.
The median household income in South Blooming Grove was $63,958, and the median family income was $76,944. The per capita income in the hamlet was $30,945. About 4.3% of families and 6.2% of the population were below the poverty line.
Common Questions
What is Per Capita Income in South Blooming Grove?
Per Capita income in South Blooming Grove is $26,721.
What is the Median Family Income in South Blooming Grove?
Median Family Income in South Blooming Grove is $82,679.
What is the Median Household income in South Blooming Grove?
Median Household Income in South Blooming Grove is $72,063.
What is Income or Wage Gap in South Blooming Grove?
Income or Wage Gap in South Blooming Grove is 37.6%.
Women in South Blooming Grove earn 62.4 cents for every dollar earned by a man.
What is Inequality or Gini Index in South Blooming Grove?
Inequality or Gini Index in South Blooming Grove is 0.41.
What is the Total Population of South Blooming Grove?
Total Population of South Blooming Grove is 3,858.
What is the Total Male Population of South Blooming Grove?
Total Male Population of South Blooming Grove is 1,866.
What is the Total Female Population of South Blooming Grove?
Total Female Population of South Blooming Grove is 1,992.
What is the Ratio of Males per 100 Females in South Blooming Grove?
There are 93.67 Males per 100 Females in South Blooming Grove.
What is the Ratio of Females per 100 Males in South Blooming Grove?
There are 106.75 Females per 100 Males in South Blooming Grove.
What is the Median Population Age in South Blooming Grove?
Median Population Age in South Blooming Grove is 25.9 Years.
What is the Average Family Size in South Blooming Grove
Average Family Size in South Blooming Grove is 4.6 People.
What is the Average Household Size in South Blooming Grove
Average Household Size in South Blooming Grove is 3.3 People.
How Large is the Labor Force in South Blooming Grove?
There are 1,438 People in the Labor Forcein in South Blooming Grove.
What is the Percentage of People in the Labor Force in South Blooming Grove?
61.0% of People are in the Labor Force in South Blooming Grove.
What is the Unemployment Rate in South Blooming Grove?
Unemployment Rate in South Blooming Grove is 13.0%.