Lyncourt, NY Map & Demographics
Lyncourt Map
Lyncourt Overview
$28,487
PER CAPITA INCOME
$66,607
AVG FAMILY INCOME
$57,845
AVG HOUSEHOLD INCOME
24.0%
WAGE / INCOME GAP [ % ]
76.0¢/ $1
WAGE / INCOME GAP [ $ ]
0.35
INEQUALITY / GINI INDEX
3,917
TOTAL POPULATION
1,914
MALE POPULATION
2,003
FEMALE POPULATION
95.56
MALES / 100 FEMALES
104.65
FEMALES / 100 MALES
39.1
MEDIAN AGE
3.3
AVG FAMILY SIZE
2.3
AVG HOUSEHOLD SIZE
2,052
LABOR FORCE [ PEOPLE ]
67.1%
PERCENT IN LABOR FORCE
1.6%
UNEMPLOYMENT RATE
Income in Lyncourt
Income Overview in Lyncourt
Per Capita Income in Lyncourt is $28,487, while median incomes of families and households are $66,607 and $57,845 respectively.
| Characteristic | Number | Measure |
| Per Capita Income | 3,917 | $28,487 |
| Median Family Income | 868 | $66,607 |
| Mean Family Income | 868 | $73,524 |
| Median Household Income | 1,677 | $57,845 |
| Mean Household Income | 1,677 | $66,434 |
| Income Deficit | 868 | $0 |
| Wage / Income Gap (%) | 3,917 | 24.00% |
| Wage / Income Gap ($) | 3,917 | 76.00¢ per $1 |
| Gini / Inequality Index | 3,917 | 0.35 |
Earnings by Sex in Lyncourt
Average Earnings in Lyncourt are $37,340, $31,484 for men and $41,426 for women, a difference of 24.0%.
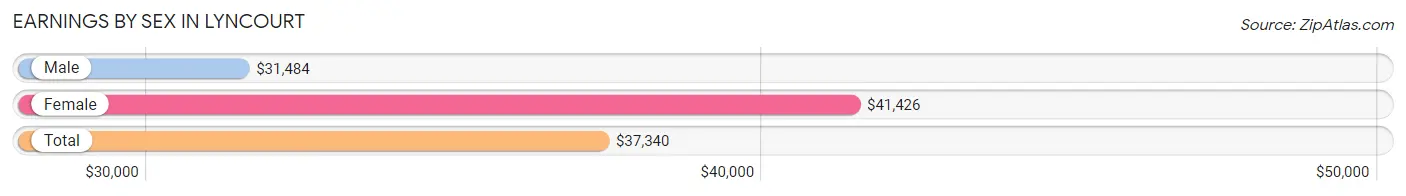
| Sex | Number | Average Earnings |
| Male | 1,025 (48.3%) | $31,484 |
| Female | 1,095 (51.6%) | $41,426 |
| Total | 2,120 (100.0%) | $37,340 |
Earnings by Sex by Income Bracket in Lyncourt
The most common earnings brackets in Lyncourt are $50,000 to $54,999 for men (100 | 9.8%) and $55,000 to $64,999 for women (166 | 15.2%).
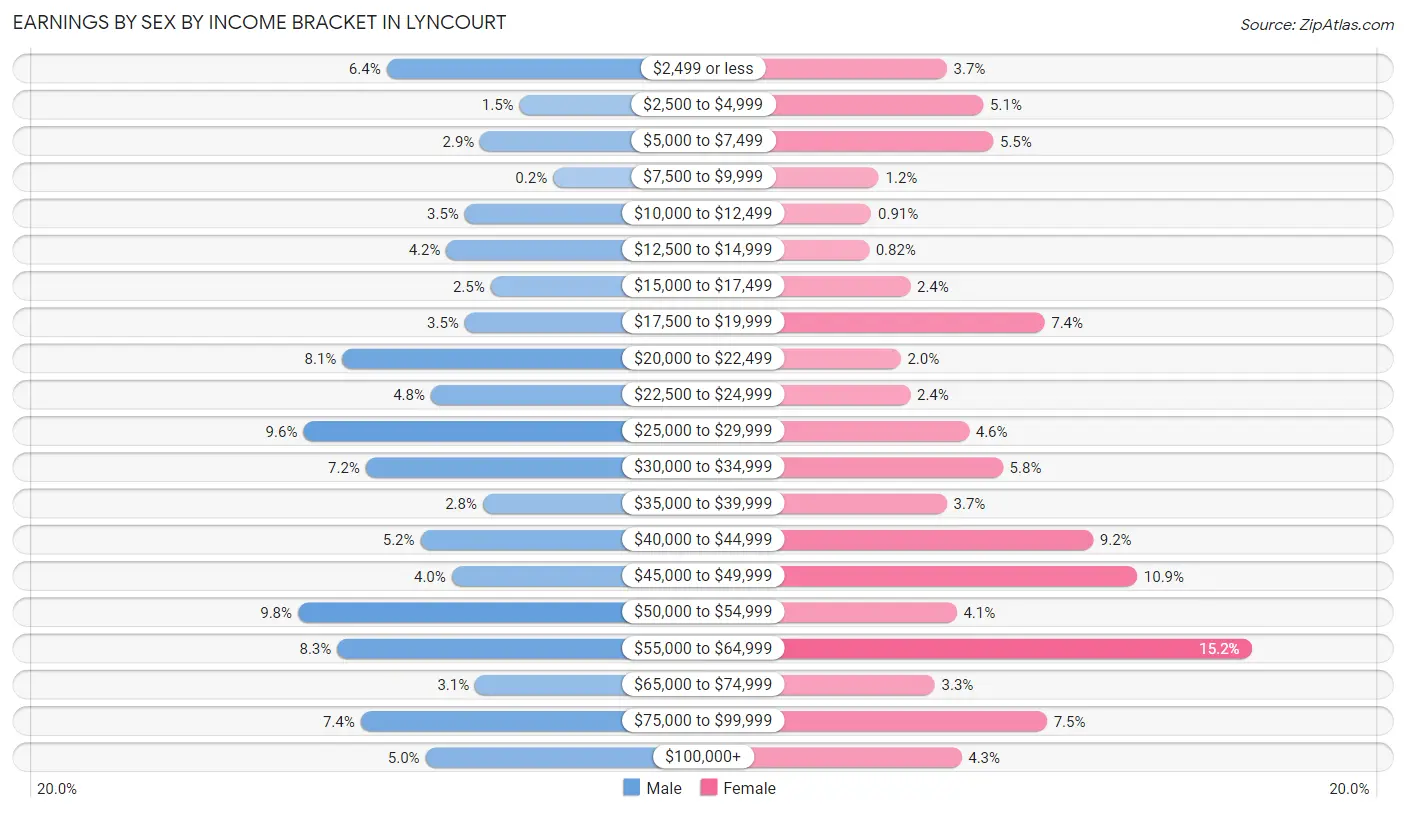
| Income | Male | Female |
| $2,499 or less | 66 (6.4%) | 41 (3.7%) |
| $2,500 to $4,999 | 15 (1.5%) | 56 (5.1%) |
| $5,000 to $7,499 | 30 (2.9%) | 60 (5.5%) |
| $7,500 to $9,999 | 2 (0.2%) | 13 (1.2%) |
| $10,000 to $12,499 | 36 (3.5%) | 10 (0.9%) |
| $12,500 to $14,999 | 43 (4.2%) | 9 (0.8%) |
| $15,000 to $17,499 | 26 (2.5%) | 26 (2.4%) |
| $17,500 to $19,999 | 36 (3.5%) | 81 (7.4%) |
| $20,000 to $22,499 | 83 (8.1%) | 22 (2.0%) |
| $22,500 to $24,999 | 49 (4.8%) | 26 (2.4%) |
| $25,000 to $29,999 | 98 (9.6%) | 50 (4.6%) |
| $30,000 to $34,999 | 74 (7.2%) | 64 (5.8%) |
| $35,000 to $39,999 | 29 (2.8%) | 41 (3.7%) |
| $40,000 to $44,999 | 53 (5.2%) | 101 (9.2%) |
| $45,000 to $49,999 | 41 (4.0%) | 119 (10.9%) |
| $50,000 to $54,999 | 100 (9.8%) | 45 (4.1%) |
| $55,000 to $64,999 | 85 (8.3%) | 166 (15.2%) |
| $65,000 to $74,999 | 32 (3.1%) | 36 (3.3%) |
| $75,000 to $99,999 | 76 (7.4%) | 82 (7.5%) |
| $100,000+ | 51 (5.0%) | 47 (4.3%) |
| Total | 1,025 (100.0%) | 1,095 (100.0%) |
Earnings by Sex by Educational Attainment in Lyncourt
Average earnings in Lyncourt are $41,976 for men and $46,296 for women, a difference of 9.3%. Men with an educational attainment of high school diploma enjoy the highest average annual earnings of $43,750, while those with college or associate's degree education earn the least with $41,250. Women with an educational attainment of graduate degree earn the most with the average annual earnings of $67,361, while those with high school diploma education have the smallest earnings of $34,926.
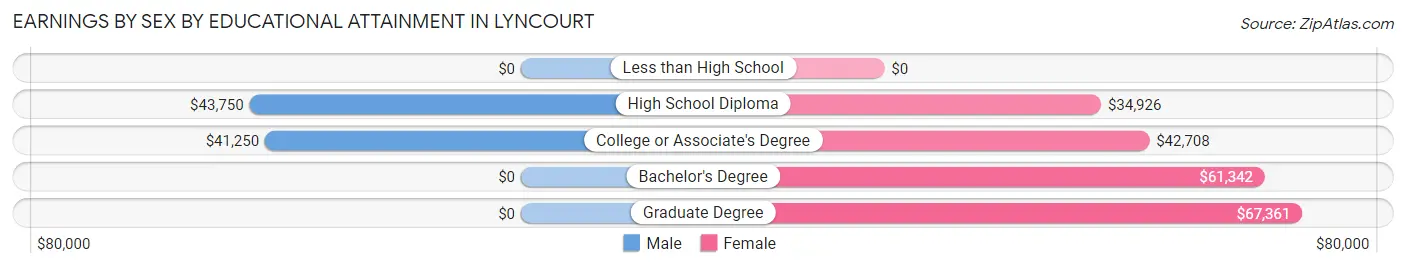
| Educational Attainment | Male Income | Female Income |
| Less than High School | - | - |
| High School Diploma | $43,750 | $34,926 |
| College or Associate's Degree | $41,250 | $42,708 |
| Bachelor's Degree | - | - |
| Graduate Degree | - | - |
| Total | $41,976 | $46,296 |
Family Income in Lyncourt
Family Income Brackets in Lyncourt
According to the Lyncourt family income data, there are 235 families falling into the $50,000 to $74,999 income range, which is the most common income bracket and makes up 27.1% of all families. Conversely, the less than $10,000 income bracket is the least frequent group with only 7 families (0.8%) belonging to this category.
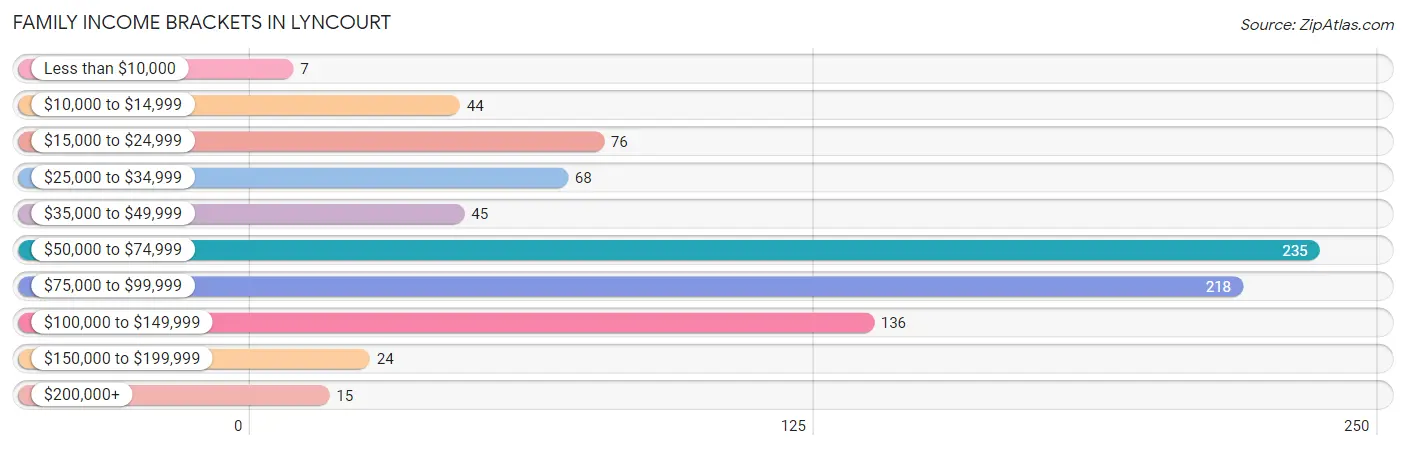
| Income Bracket | # Families | % Families |
| Less than $10,000 | 7 | 0.8% |
| $10,000 to $14,999 | 44 | 5.1% |
| $15,000 to $24,999 | 76 | 8.8% |
| $25,000 to $34,999 | 68 | 7.8% |
| $35,000 to $49,999 | 45 | 5.2% |
| $50,000 to $74,999 | 235 | 27.1% |
| $75,000 to $99,999 | 218 | 25.1% |
| $100,000 to $149,999 | 136 | 15.7% |
| $150,000 to $199,999 | 24 | 2.8% |
| $200,000+ | 15 | 1.7% |
Family Income by Famaliy Size in Lyncourt
3-person families (136 | 15.7%) account for the highest median family income in Lyncourt with $100,250 per family, while 3-person families (136 | 15.7%) have the highest median income of $33,417 per family member.
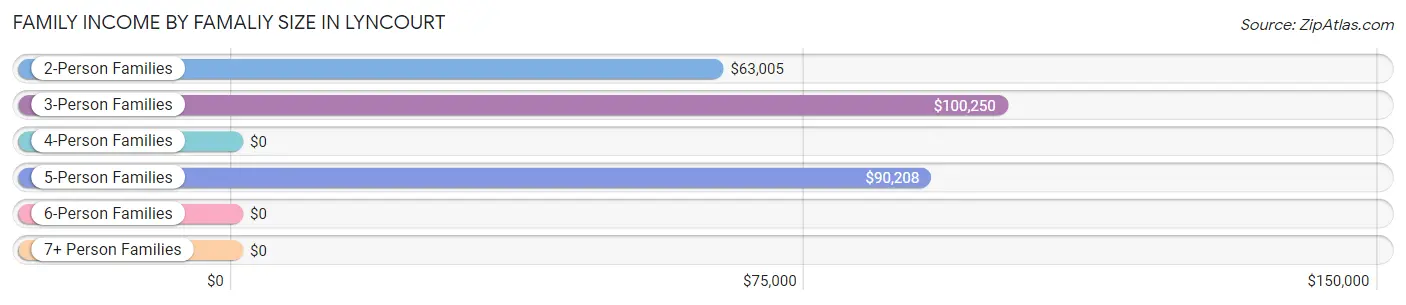
| Income Bracket | # Families | Median Income |
| 2-Person Families | 457 (52.6%) | $63,005 |
| 3-Person Families | 136 (15.7%) | $100,250 |
| 4-Person Families | 117 (13.5%) | $0 |
| 5-Person Families | 105 (12.1%) | $90,208 |
| 6-Person Families | 36 (4.2%) | $0 |
| 7+ Person Families | 17 (2.0%) | $0 |
| Total | 868 (100.0%) | $66,607 |
Family Income by Number of Earners in Lyncourt
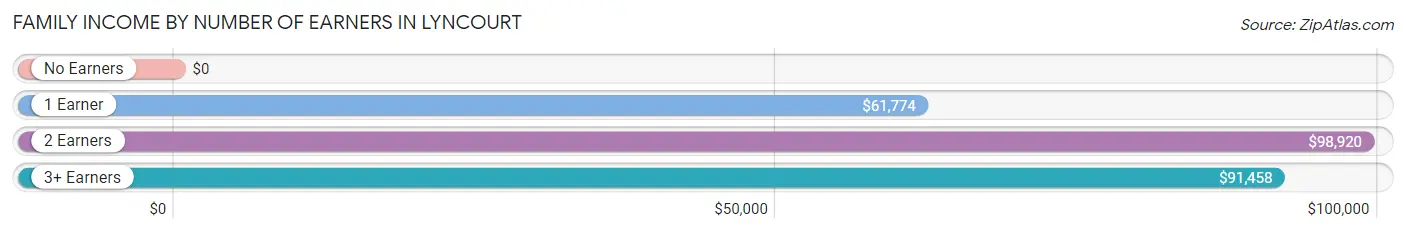
| Number of Earners | # Families | Median Income |
| No Earners | 121 (13.9%) | $0 |
| 1 Earner | 363 (41.8%) | $61,774 |
| 2 Earners | 275 (31.7%) | $98,920 |
| 3+ Earners | 109 (12.6%) | $91,458 |
| Total | 868 (100.0%) | $66,607 |
Household Income in Lyncourt
Household Income Brackets in Lyncourt
With 428 households falling in the category, the $50,000 to $74,999 income range is the most frequent in Lyncourt, accounting for 25.5% of all households. In contrast, only 15 households (0.9%) fall into the $200,000+ income bracket, making it the least populous group.
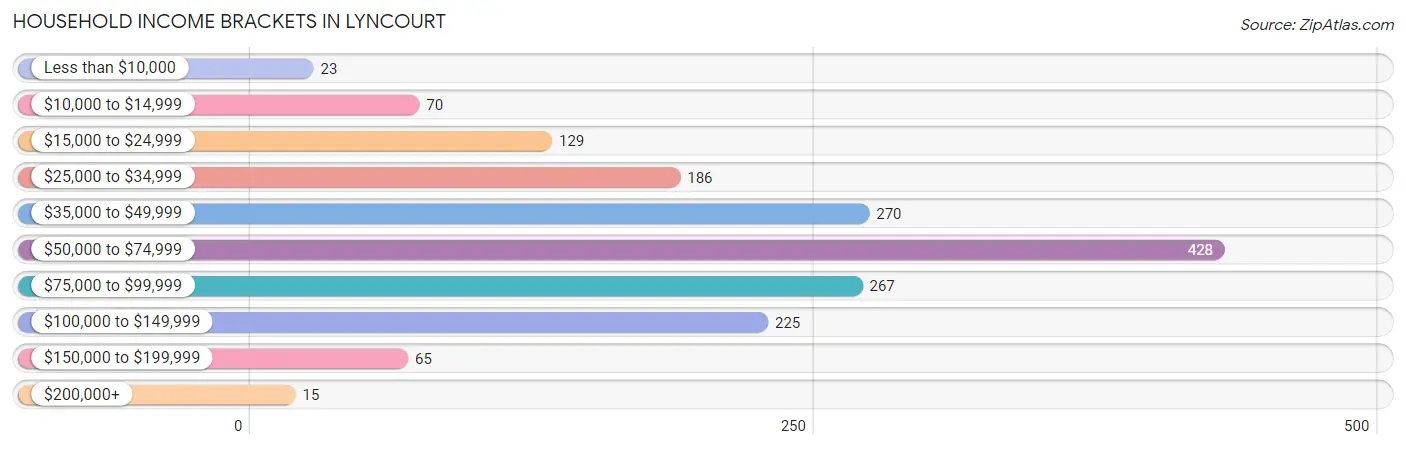
| Income Bracket | # Households | % Households |
| Less than $10,000 | 23 | 1.4% |
| $10,000 to $14,999 | 70 | 4.2% |
| $15,000 to $24,999 | 129 | 7.7% |
| $25,000 to $34,999 | 186 | 11.1% |
| $35,000 to $49,999 | 270 | 16.1% |
| $50,000 to $74,999 | 428 | 25.5% |
| $75,000 to $99,999 | 267 | 15.9% |
| $100,000 to $149,999 | 225 | 13.4% |
| $150,000 to $199,999 | 65 | 3.9% |
| $200,000+ | 15 | 0.9% |
Household Income by Householder Age in Lyncourt
The median household income in Lyncourt is $57,845, with the highest median household income of $64,048 found in the 45 to 64 years age bracket for the primary householder. A total of 696 households (41.5%) fall into this category. Meanwhile, the 65+ years age bracket for the primary householder has the lowest median household income of $46,019, with 410 households (24.4%) in this group.
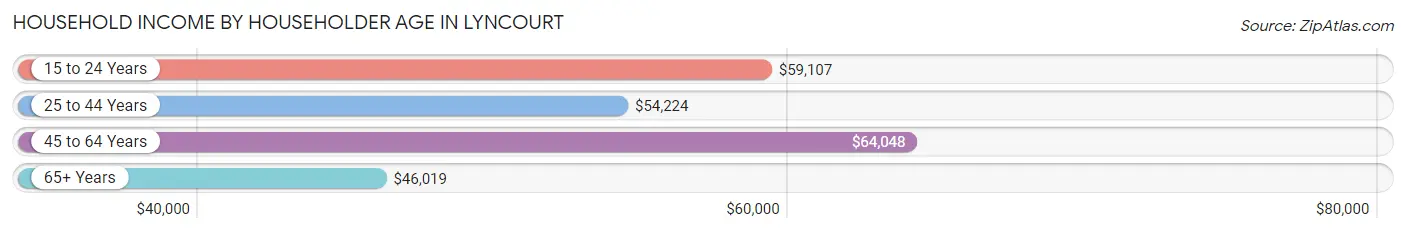
| Income Bracket | # Households | Median Income |
| 15 to 24 Years | 75 (4.5%) | $59,107 |
| 25 to 44 Years | 496 (29.6%) | $54,224 |
| 45 to 64 Years | 696 (41.5%) | $64,048 |
| 65+ Years | 410 (24.4%) | $46,019 |
| Total | 1,677 (100.0%) | $57,845 |
Poverty in Lyncourt
Income Below Poverty by Sex and Age in Lyncourt
With 20.6% poverty level for males and 18.8% for females among the residents of Lyncourt, 15 year old males and 15 year old females are the most vulnerable to poverty, with 17 males (100.0%) and 19 females (100.0%) in their respective age groups living below the poverty level.
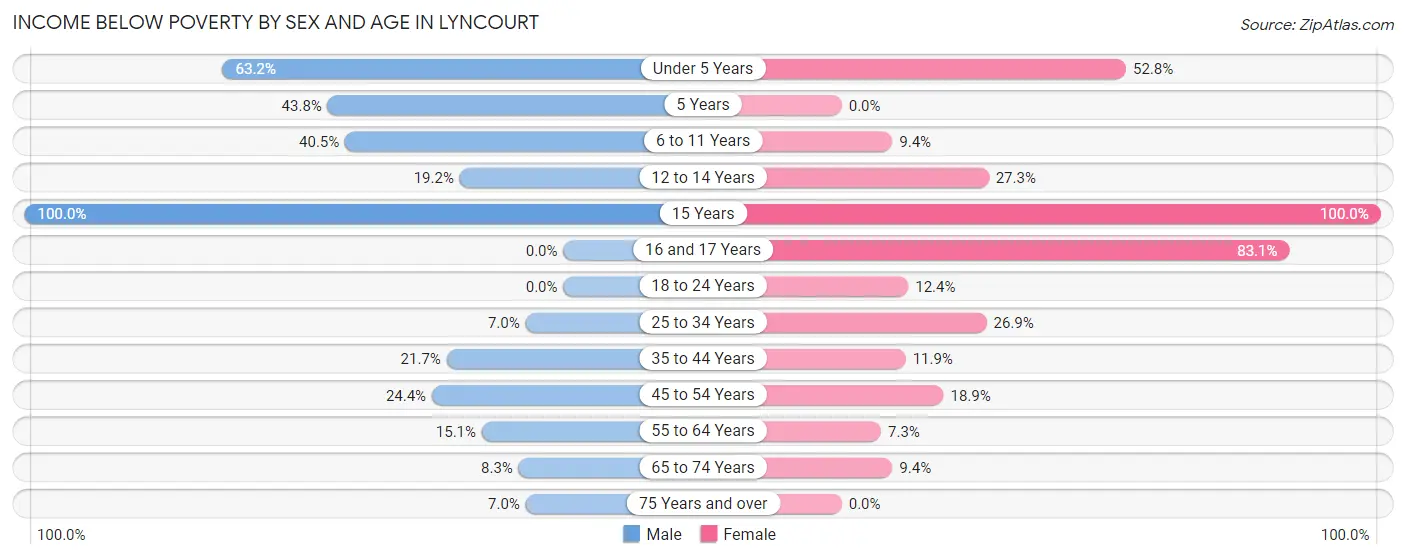
| Age Bracket | Male | Female |
| Under 5 Years | 117 (63.2%) | 67 (52.8%) |
| 5 Years | 14 (43.8%) | 0 (0.0%) |
| 6 to 11 Years | 64 (40.5%) | 15 (9.4%) |
| 12 to 14 Years | 15 (19.2%) | 15 (27.3%) |
| 15 Years | 17 (100.0%) | 19 (100.0%) |
| 16 and 17 Years | 0 (0.0%) | 49 (83.1%) |
| 18 to 24 Years | 0 (0.0%) | 20 (12.3%) |
| 25 to 34 Years | 20 (7.0%) | 61 (26.9%) |
| 35 to 44 Years | 34 (21.7%) | 23 (11.9%) |
| 45 to 54 Years | 50 (24.4%) | 61 (18.9%) |
| 55 to 64 Years | 41 (15.1%) | 26 (7.3%) |
| 65 to 74 Years | 15 (8.3%) | 20 (9.4%) |
| 75 Years and over | 7 (7.0%) | 0 (0.0%) |
| Total | 394 (20.6%) | 376 (18.8%) |
Income Above Poverty by Sex and Age in Lyncourt
According to the poverty statistics in Lyncourt, males aged 16 and 17 years and females aged 5 years are the age groups that are most secure financially, with 100.0% of males and 100.0% of females in these age groups living above the poverty line.
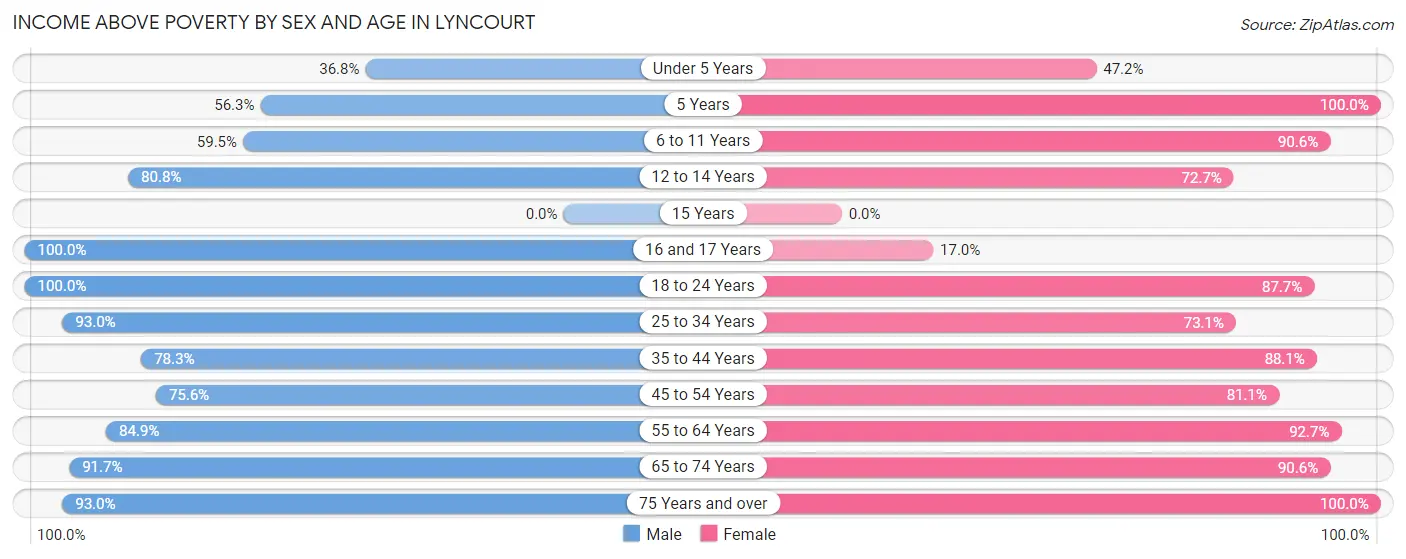
| Age Bracket | Male | Female |
| Under 5 Years | 68 (36.8%) | 60 (47.2%) |
| 5 Years | 18 (56.2%) | 25 (100.0%) |
| 6 to 11 Years | 94 (59.5%) | 145 (90.6%) |
| 12 to 14 Years | 63 (80.8%) | 40 (72.7%) |
| 15 Years | 0 (0.0%) | 0 (0.0%) |
| 16 and 17 Years | 46 (100.0%) | 10 (17.0%) |
| 18 to 24 Years | 199 (100.0%) | 142 (87.6%) |
| 25 to 34 Years | 265 (93.0%) | 166 (73.1%) |
| 35 to 44 Years | 123 (78.3%) | 171 (88.1%) |
| 45 to 54 Years | 155 (75.6%) | 262 (81.1%) |
| 55 to 64 Years | 230 (84.9%) | 330 (92.7%) |
| 65 to 74 Years | 166 (91.7%) | 193 (90.6%) |
| 75 Years and over | 93 (93.0%) | 80 (100.0%) |
| Total | 1,520 (79.4%) | 1,624 (81.2%) |
Income Below Poverty Among Married-Couple Families in Lyncourt
The poverty statistics for married-couple families in Lyncourt show that 12.7% or 65 of the total 512 families live below the poverty line. Families with 5 or more children have the highest poverty rate of 100.0%, comprising of 17 families. On the other hand, families with 3 or 4 children have the lowest poverty rate of 0.0%, which includes 0 families.
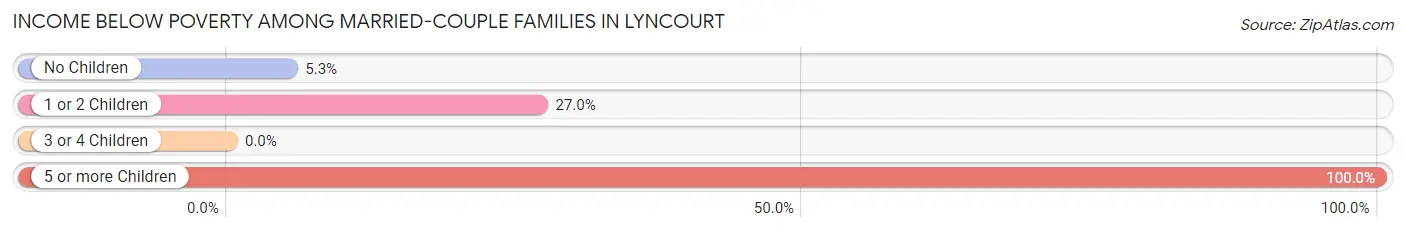
| Children | Above Poverty | Below Poverty |
| No Children | 325 (94.8%) | 18 (5.2%) |
| 1 or 2 Children | 81 (73.0%) | 30 (27.0%) |
| 3 or 4 Children | 41 (100.0%) | 0 (0.0%) |
| 5 or more Children | 0 (0.0%) | 17 (100.0%) |
| Total | 447 (87.3%) | 65 (12.7%) |
Income Below Poverty Among Single-Parent Households in Lyncourt
According to the poverty data in Lyncourt, 29.0% or 20 single-father households and 25.1% or 72 single-mother households are living below the poverty line. Among single-father households, those with 1 or 2 children have the highest poverty rate, with 20 households (32.3%) experiencing poverty. Likewise, among single-mother households, those with 3 or 4 children have the highest poverty rate, with 54 households (60.0%) falling below the poverty line.
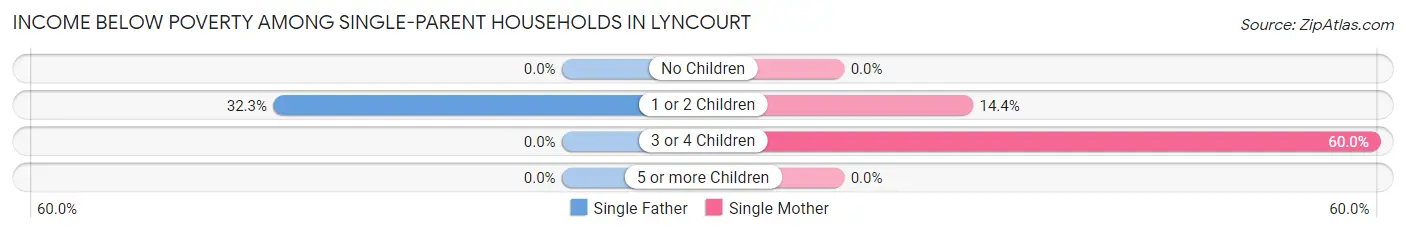
| Children | Single Father | Single Mother |
| No Children | 0 (0.0%) | 0 (0.0%) |
| 1 or 2 Children | 20 (32.3%) | 18 (14.4%) |
| 3 or 4 Children | 0 (0.0%) | 54 (60.0%) |
| 5 or more Children | 0 (0.0%) | 0 (0.0%) |
| Total | 20 (29.0%) | 72 (25.1%) |
Income Below Poverty Among Married-Couple vs Single-Parent Households in Lyncourt
The poverty data for Lyncourt shows that 65 of the married-couple family households (12.7%) and 92 of the single-parent households (25.8%) are living below the poverty level. Within the married-couple family households, those with 5 or more children have the highest poverty rate, with 17 households (100.0%) falling below the poverty line. Among the single-parent households, those with 3 or 4 children have the highest poverty rate, with 54 household (60.0%) living below poverty.
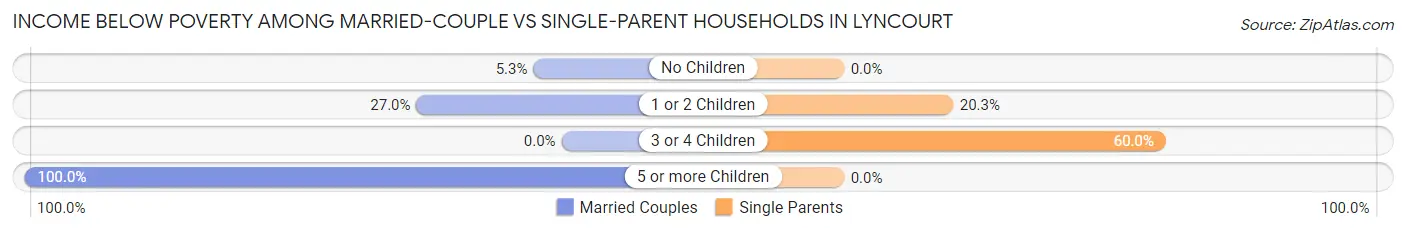
| Children | Married-Couple Families | Single-Parent Households |
| No Children | 18 (5.2%) | 0 (0.0%) |
| 1 or 2 Children | 30 (27.0%) | 38 (20.3%) |
| 3 or 4 Children | 0 (0.0%) | 54 (60.0%) |
| 5 or more Children | 17 (100.0%) | 0 (0.0%) |
| Total | 65 (12.7%) | 92 (25.8%) |
Race in Lyncourt
The most populous races in Lyncourt are White / Caucasian (2,845 | 72.6%), Black / African American (483 | 12.3%), and Two or more Races (357 | 9.1%).
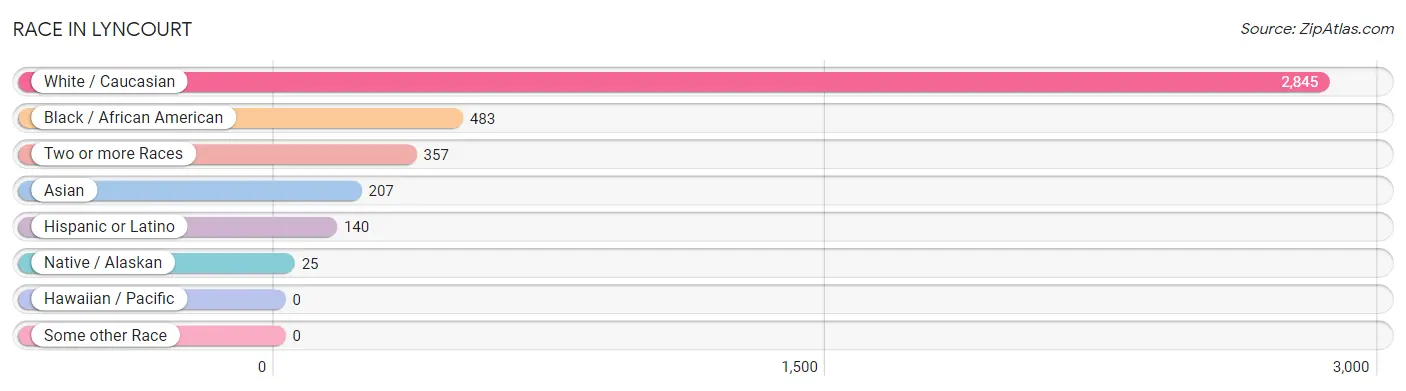
| Race | # Population | % Population |
| Asian | 207 | 5.3% |
| Black / African American | 483 | 12.3% |
| Hawaiian / Pacific | 0 | 0.0% |
| Hispanic or Latino | 140 | 3.6% |
| Native / Alaskan | 25 | 0.6% |
| White / Caucasian | 2,845 | 72.6% |
| Two or more Races | 357 | 9.1% |
| Some other Race | 0 | 0.0% |
| Total | 3,917 | 100.0% |
Ancestry in Lyncourt
The most populous ancestries reported in Lyncourt are Irish (984 | 25.1%), Italian (968 | 24.7%), German (772 | 19.7%), Polish (248 | 6.3%), and French (209 | 5.3%), together accounting for 81.2% of all Lyncourt residents.
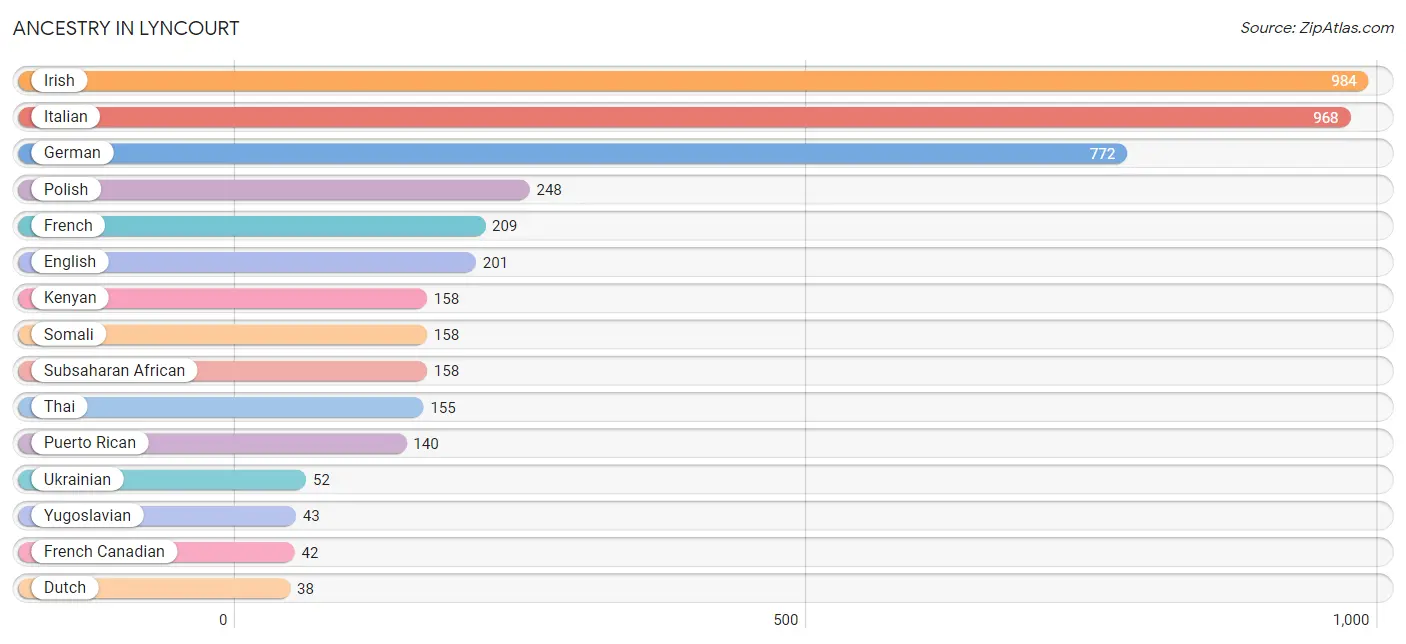
| Ancestry | # Population | % Population |
| American | 12 | 0.3% |
| Bhutanese | 6 | 0.2% |
| British | 36 | 0.9% |
| Dutch | 38 | 1.0% |
| English | 201 | 5.1% |
| European | 10 | 0.3% |
| French | 209 | 5.3% |
| French Canadian | 42 | 1.1% |
| German | 772 | 19.7% |
| Hungarian | 25 | 0.6% |
| Indian (Asian) | 1 | 0.0% |
| Indonesian | 4 | 0.1% |
| Irish | 984 | 25.1% |
| Iroquois | 22 | 0.6% |
| Italian | 968 | 24.7% |
| Kenyan | 158 | 4.0% |
| Northern European | 8 | 0.2% |
| Polish | 248 | 6.3% |
| Portuguese | 36 | 0.9% |
| Puerto Rican | 140 | 3.6% |
| Russian | 34 | 0.9% |
| Scotch-Irish | 32 | 0.8% |
| Scottish | 8 | 0.2% |
| Somali | 158 | 4.0% |
| Sri Lankan | 37 | 0.9% |
| Subsaharan African | 158 | 4.0% |
| Swedish | 9 | 0.2% |
| Swiss | 20 | 0.5% |
| Thai | 155 | 4.0% |
| Ukrainian | 52 | 1.3% |
| Welsh | 36 | 0.9% |
| Yugoslavian | 43 | 1.1% | View All 32 Rows |
Immigrants in Lyncourt
The most numerous immigrant groups reported in Lyncourt came from Asia (207 | 5.3%), South Central Asia (165 | 4.2%), Bangladesh (155 | 4.0%), Europe (70 | 1.8%), and Africa (44 | 1.1%), together accounting for 16.4% of all Lyncourt residents.
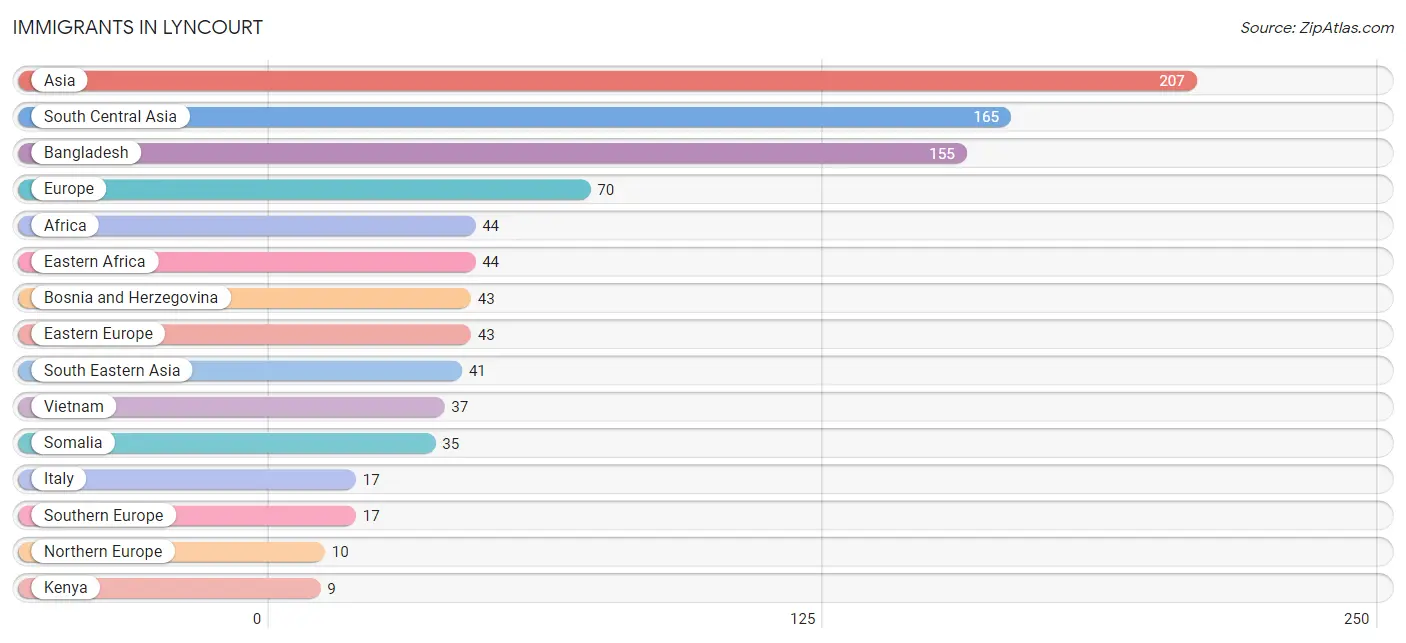
| Immigration Origin | # Population | % Population |
| Africa | 44 | 1.1% |
| Asia | 207 | 5.3% |
| Bangladesh | 155 | 4.0% |
| Bosnia and Herzegovina | 43 | 1.1% |
| China | 1 | 0.0% |
| Eastern Africa | 44 | 1.1% |
| Eastern Asia | 1 | 0.0% |
| Eastern Europe | 43 | 1.1% |
| Europe | 70 | 1.8% |
| Hong Kong | 1 | 0.0% |
| Italy | 17 | 0.4% |
| Kenya | 9 | 0.2% |
| Nepal | 2 | 0.1% |
| Northern Europe | 10 | 0.3% |
| Somalia | 35 | 0.9% |
| South Central Asia | 165 | 4.2% |
| South Eastern Asia | 41 | 1.1% |
| Southern Europe | 17 | 0.4% |
| Thailand | 4 | 0.1% |
| Vietnam | 37 | 0.9% | View All 20 Rows |
Sex and Age in Lyncourt
Sex and Age in Lyncourt
The most populous age groups in Lyncourt are 60 to 64 Years (209 | 10.9%) for men and 45 to 49 Years (232 | 11.6%) for women.
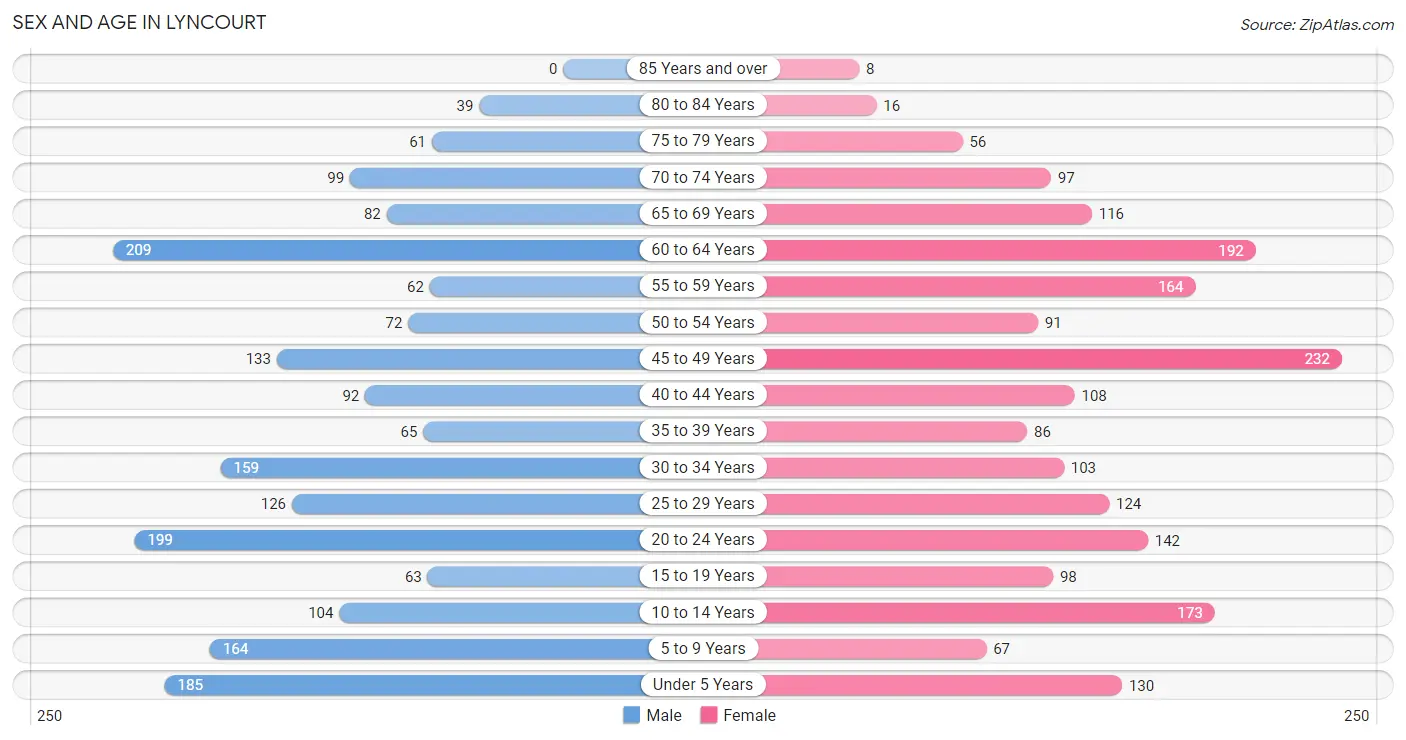
| Age Bracket | Male | Female |
| Under 5 Years | 185 (9.7%) | 130 (6.5%) |
| 5 to 9 Years | 164 (8.6%) | 67 (3.3%) |
| 10 to 14 Years | 104 (5.4%) | 173 (8.6%) |
| 15 to 19 Years | 63 (3.3%) | 98 (4.9%) |
| 20 to 24 Years | 199 (10.4%) | 142 (7.1%) |
| 25 to 29 Years | 126 (6.6%) | 124 (6.2%) |
| 30 to 34 Years | 159 (8.3%) | 103 (5.1%) |
| 35 to 39 Years | 65 (3.4%) | 86 (4.3%) |
| 40 to 44 Years | 92 (4.8%) | 108 (5.4%) |
| 45 to 49 Years | 133 (7.0%) | 232 (11.6%) |
| 50 to 54 Years | 72 (3.8%) | 91 (4.5%) |
| 55 to 59 Years | 62 (3.2%) | 164 (8.2%) |
| 60 to 64 Years | 209 (10.9%) | 192 (9.6%) |
| 65 to 69 Years | 82 (4.3%) | 116 (5.8%) |
| 70 to 74 Years | 99 (5.2%) | 97 (4.8%) |
| 75 to 79 Years | 61 (3.2%) | 56 (2.8%) |
| 80 to 84 Years | 39 (2.0%) | 16 (0.8%) |
| 85 Years and over | 0 (0.0%) | 8 (0.4%) |
| Total | 1,914 (100.0%) | 2,003 (100.0%) |
Families and Households in Lyncourt
Median Family Size in Lyncourt
The median family size in Lyncourt is 3.26 persons per family, with single male/father families (69 | 8.0%) accounting for the largest median family size of 4 persons per family. On the other hand, single female/mother families (287 | 33.1%) represent the smallest median family size with 3.00 persons per family.
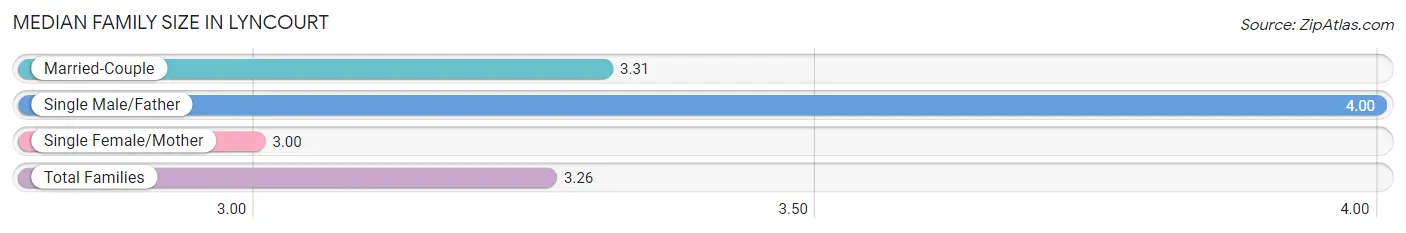
| Family Type | # Families | Family Size |
| Married-Couple | 512 (59.0%) | 3.31 |
| Single Male/Father | 69 (8.0%) | 4.00 |
| Single Female/Mother | 287 (33.1%) | 3.00 |
| Total Families | 868 (100.0%) | 3.26 |
Median Household Size in Lyncourt
The median household size in Lyncourt is 2.33 persons per household, with single male/father households (69 | 4.1%) accounting for the largest median household size of 4 persons per household. non-family households (809 | 48.2%) represent the smallest median household size with 1.28 persons per household.
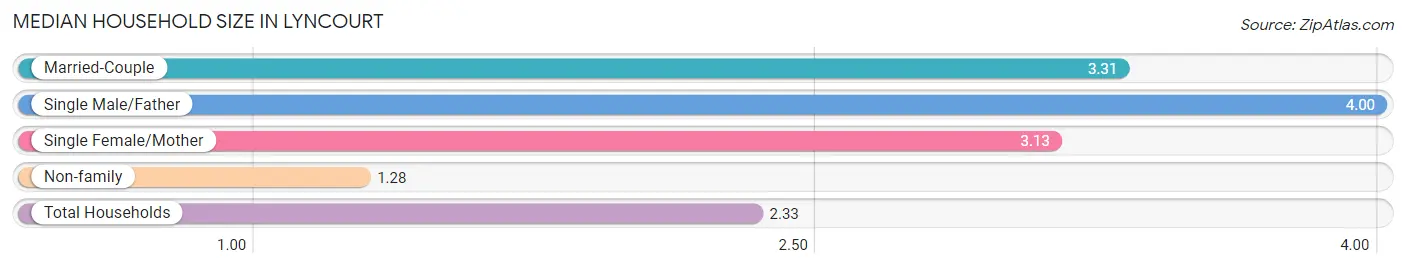
| Household Type | # Households | Household Size |
| Married-Couple | 512 (30.5%) | 3.31 |
| Single Male/Father | 69 (4.1%) | 4.00 |
| Single Female/Mother | 287 (17.1%) | 3.13 |
| Non-family | 809 (48.2%) | 1.28 |
| Total Households | 1,677 (100.0%) | 2.33 |
Household Size by Marriage Status in Lyncourt
Out of a total of 1,677 households in Lyncourt, 868 (51.8%) are family households, while 809 (48.2%) are nonfamily households. The most numerous type of family households are 2-person households, comprising 383, and the most common type of nonfamily households are 1-person households, comprising 596.
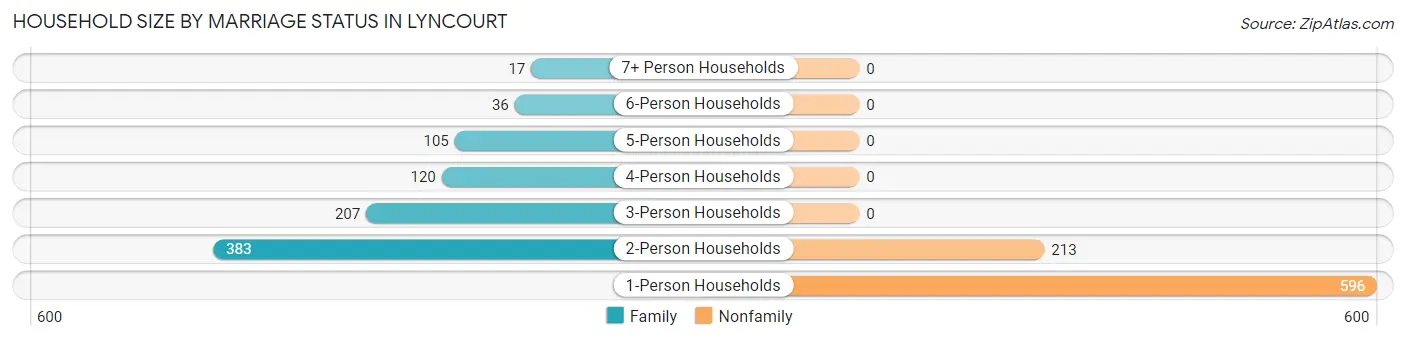
| Household Size | Family Households | Nonfamily Households |
| 1-Person Households | - | 596 (35.5%) |
| 2-Person Households | 383 (22.8%) | 213 (12.7%) |
| 3-Person Households | 207 (12.3%) | 0 (0.0%) |
| 4-Person Households | 120 (7.2%) | 0 (0.0%) |
| 5-Person Households | 105 (6.3%) | 0 (0.0%) |
| 6-Person Households | 36 (2.1%) | 0 (0.0%) |
| 7+ Person Households | 17 (1.0%) | 0 (0.0%) |
| Total | 868 (51.8%) | 809 (48.2%) |
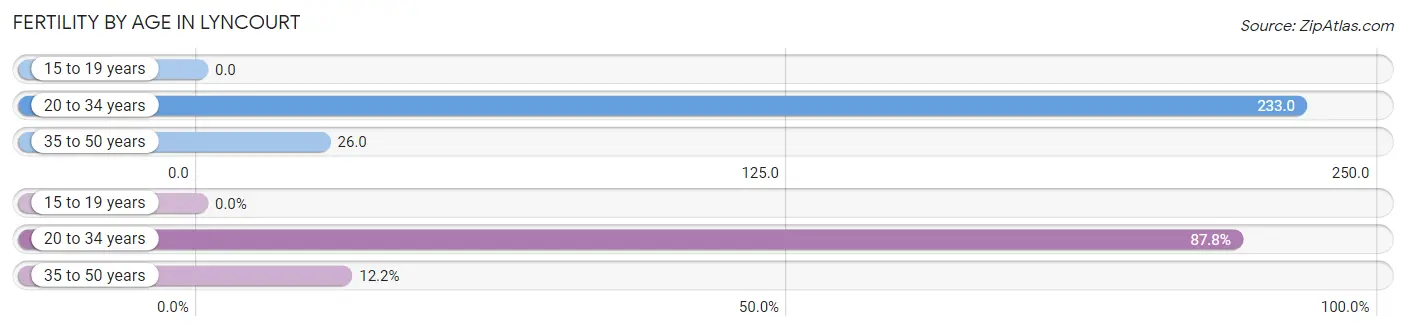
Female Fertility in Lyncourt
Fertility by Age in Lyncourt
Average fertility rate in Lyncourt is 106.0 births per 1,000 women. Women in the age bracket of 20 to 34 years have the highest fertility rate with 233.0 births per 1,000 women. Women in the age bracket of 20 to 34 years acount for 87.8% of all women with births.
| Age Bracket | Women with Births | Births / 1,000 Women |
| 15 to 19 years | 0 (0.0%) | 0.0 |
| 20 to 34 years | 86 (87.8%) | 233.0 |
| 35 to 50 years | 12 (12.2%) | 26.0 |
| Total | 98 (100.0%) | 106.0 |
Fertility by Age by Marriage Status in Lyncourt
10.2% of women with births (98) in Lyncourt are married. The highest percentage of unmarried women with births falls into 35 to 50 years age bracket with 100.0% of them unmarried at the time of birth, while the lowest percentage of unmarried women with births belong to 20 to 34 years age bracket with 88.4% of them unmarried.
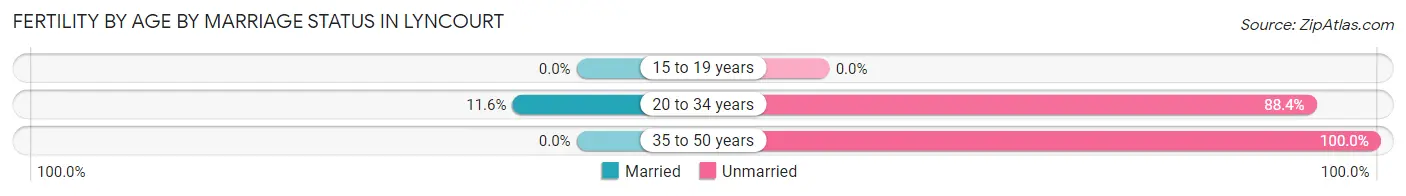
| Age Bracket | Married | Unmarried |
| 15 to 19 years | 0 (0.0%) | 0 (0.0%) |
| 20 to 34 years | 10 (11.6%) | 76 (88.4%) |
| 35 to 50 years | 0 (0.0%) | 12 (100.0%) |
| Total | 10 (10.2%) | 88 (89.8%) |
Fertility by Education in Lyncourt
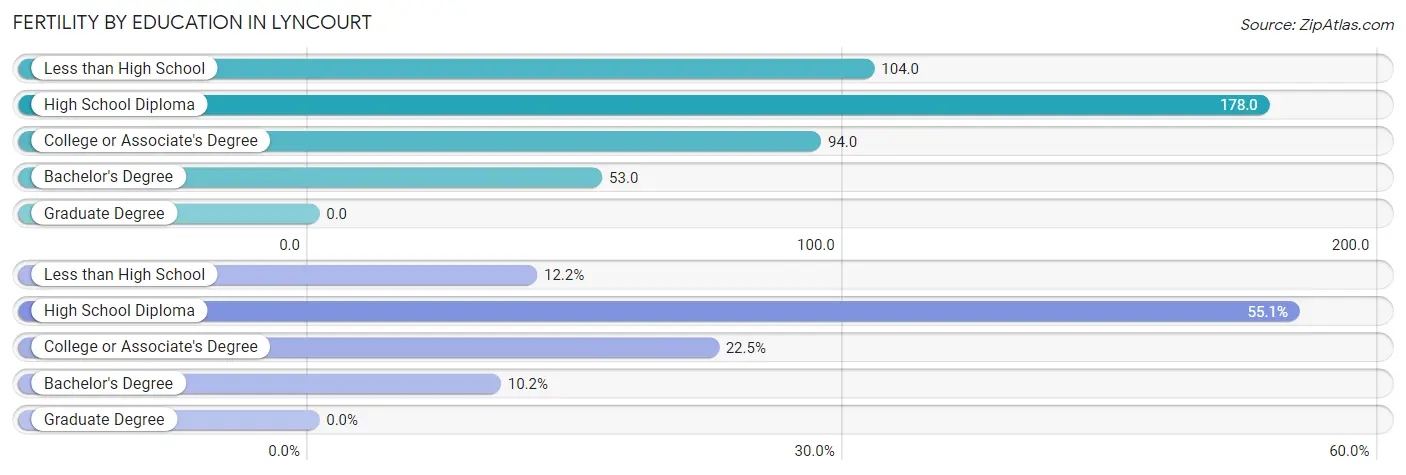
| Educational Attainment | Women with Births | Births / 1,000 Women |
| Less than High School | 12 (12.2%) | 104.0 |
| High School Diploma | 54 (55.1%) | 178.0 |
| College or Associate's Degree | 22 (22.5%) | 94.0 |
| Bachelor's Degree | 10 (10.2%) | 53.0 |
| Graduate Degree | 0 (0.0%) | 0.0 |
| Total | 98 (100.0%) | 106.0 |
Fertility by Education by Marriage Status in Lyncourt
89.8% of women with births in Lyncourt are unmarried. Women with the educational attainment of bachelor's degree are most likely to be married with 100.0% of them married at childbirth, while women with the educational attainment of less than high school are least likely to be married with 100.0% of them unmarried at childbirth.
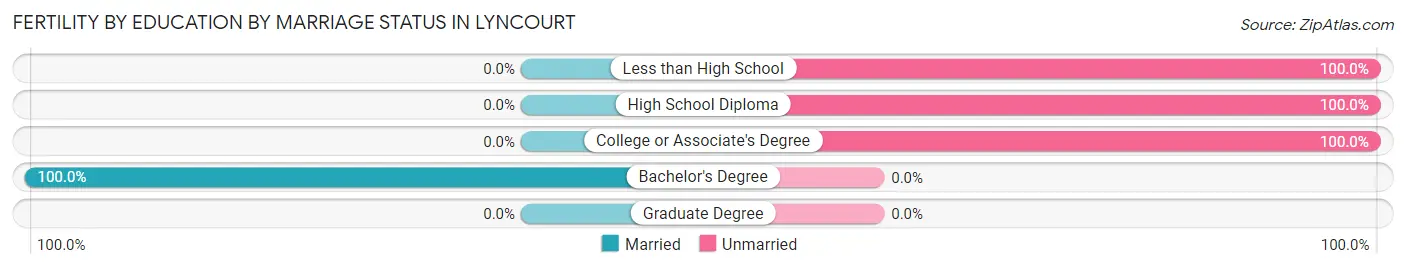
| Educational Attainment | Married | Unmarried |
| Less than High School | 0 (0.0%) | 12 (100.0%) |
| High School Diploma | 0 (0.0%) | 54 (100.0%) |
| College or Associate's Degree | 0 (0.0%) | 22 (100.0%) |
| Bachelor's Degree | 10 (100.0%) | 0 (0.0%) |
| Graduate Degree | 0 (0.0%) | 0 (0.0%) |
| Total | 10 (10.2%) | 88 (89.8%) |
Employment Characteristics in Lyncourt
Employment by Class of Employer in Lyncourt
Among the 2,021 employed individuals in Lyncourt, private company employees (1,533 | 75.8%), local government employees (182 | 9.0%), and self-employed (not incorporated) (143 | 7.1%) make up the most common classes of employment.
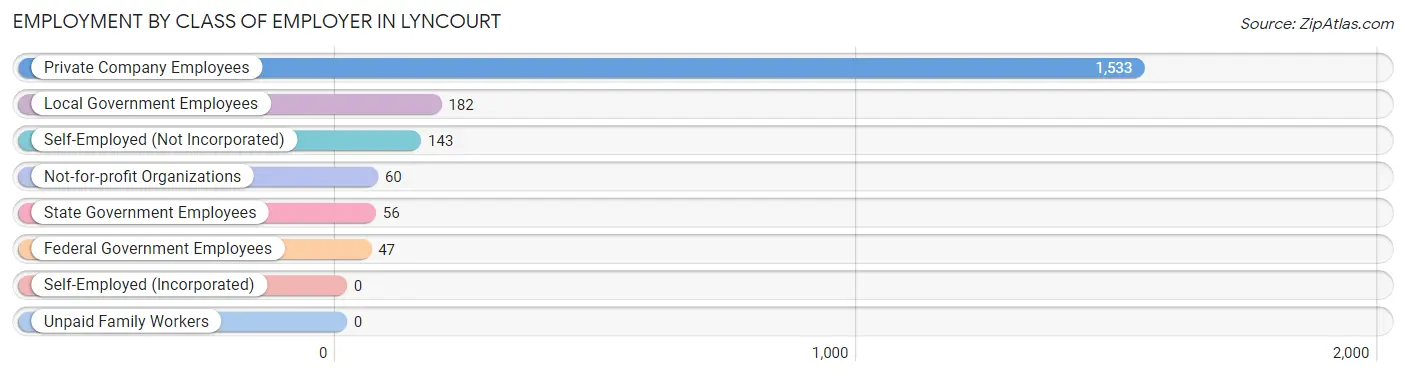
| Employer Class | # Employees | % Employees |
| Private Company Employees | 1,533 | 75.8% |
| Self-Employed (Incorporated) | 0 | 0.0% |
| Self-Employed (Not Incorporated) | 143 | 7.1% |
| Not-for-profit Organizations | 60 | 3.0% |
| Local Government Employees | 182 | 9.0% |
| State Government Employees | 56 | 2.8% |
| Federal Government Employees | 47 | 2.3% |
| Unpaid Family Workers | 0 | 0.0% |
| Total | 2,021 | 100.0% |
Employment Status by Age in Lyncourt
According to the labor force statistics for Lyncourt, out of the total population over 16 years of age (3,058), 67.1% or 2,052 individuals are in the labor force, with 1.6% or 33 of them unemployed. The age group with the highest labor force participation rate is 30 to 34 years, with 100.0% or 262 individuals in the labor force. Within the labor force, the 35 to 44 years age range has the highest percentage of unemployed individuals, with 6.5% or 18 of them being unemployed.
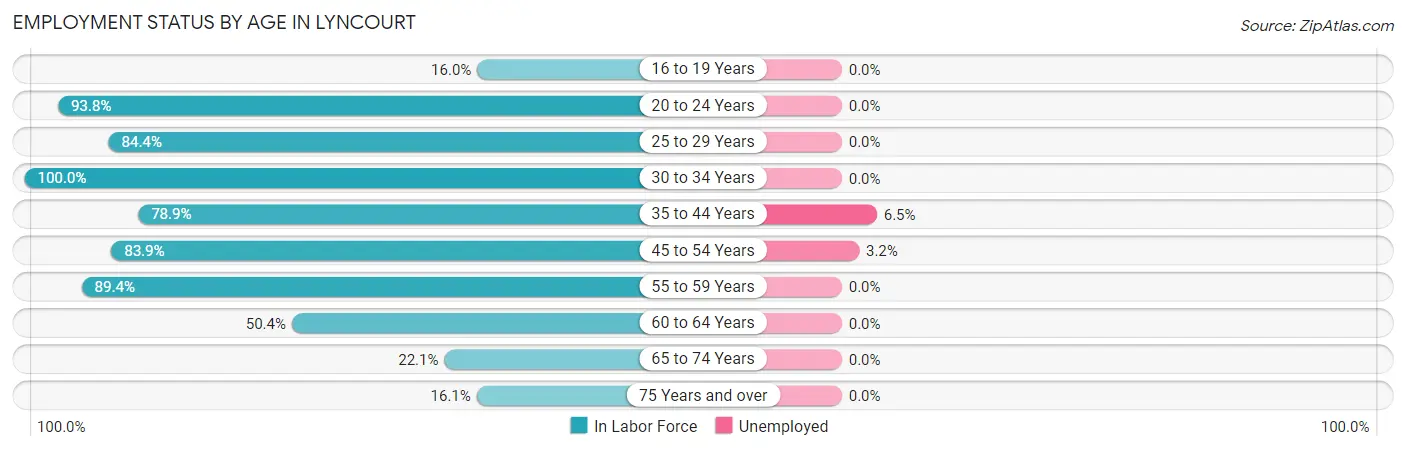
| Age Bracket | In Labor Force | Unemployed |
| 16 to 19 Years | 20 (16.0%) | 0 (0.0%) |
| 20 to 24 Years | 320 (93.8%) | 0 (0.0%) |
| 25 to 29 Years | 211 (84.4%) | 0 (0.0%) |
| 30 to 34 Years | 262 (100.0%) | 0 (0.0%) |
| 35 to 44 Years | 277 (78.9%) | 18 (6.5%) |
| 45 to 54 Years | 443 (83.9%) | 14 (3.2%) |
| 55 to 59 Years | 202 (89.4%) | 0 (0.0%) |
| 60 to 64 Years | 202 (50.4%) | 0 (0.0%) |
| 65 to 74 Years | 87 (22.1%) | 0 (0.0%) |
| 75 Years and over | 29 (16.1%) | 0 (0.0%) |
| Total | 2,052 (67.1%) | 33 (1.6%) |
Employment Status by Educational Attainment in Lyncourt
According to labor force statistics for Lyncourt, 79.1% of individuals (1,596) out of the total population between 25 and 64 years of age (2,018) are in the labor force, with 2.0% or 32 of them being unemployed. The group with the highest labor force participation rate are those with the educational attainment of bachelor's degree or higher, with 94.6% or 491 individuals in the labor force. Within the labor force, individuals with less than high school education have the highest percentage of unemployment, with 4.3% or 4 of them being unemployed.
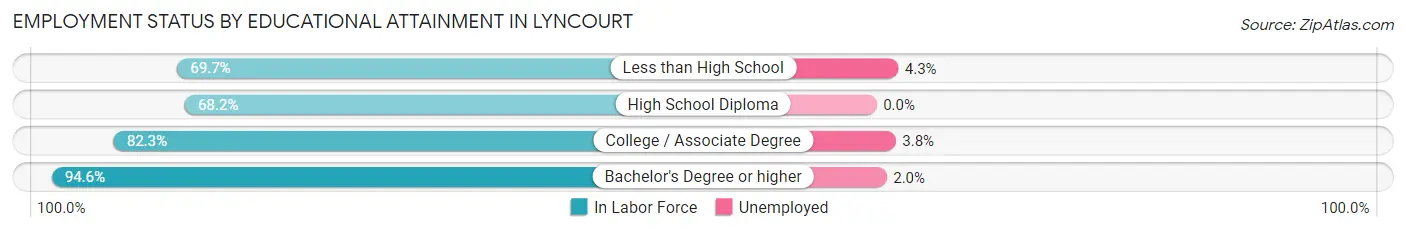
| Educational Attainment | In Labor Force | Unemployed |
| Less than High School | 92 (69.7%) | 6 (4.3%) |
| High School Diploma | 539 (68.2%) | 0 (0.0%) |
| College / Associate Degree | 475 (82.3%) | 22 (3.8%) |
| Bachelor's Degree or higher | 491 (94.6%) | 10 (2.0%) |
| Total | 1,596 (79.1%) | 40 (2.0%) |
Employment Occupations by Sex in Lyncourt
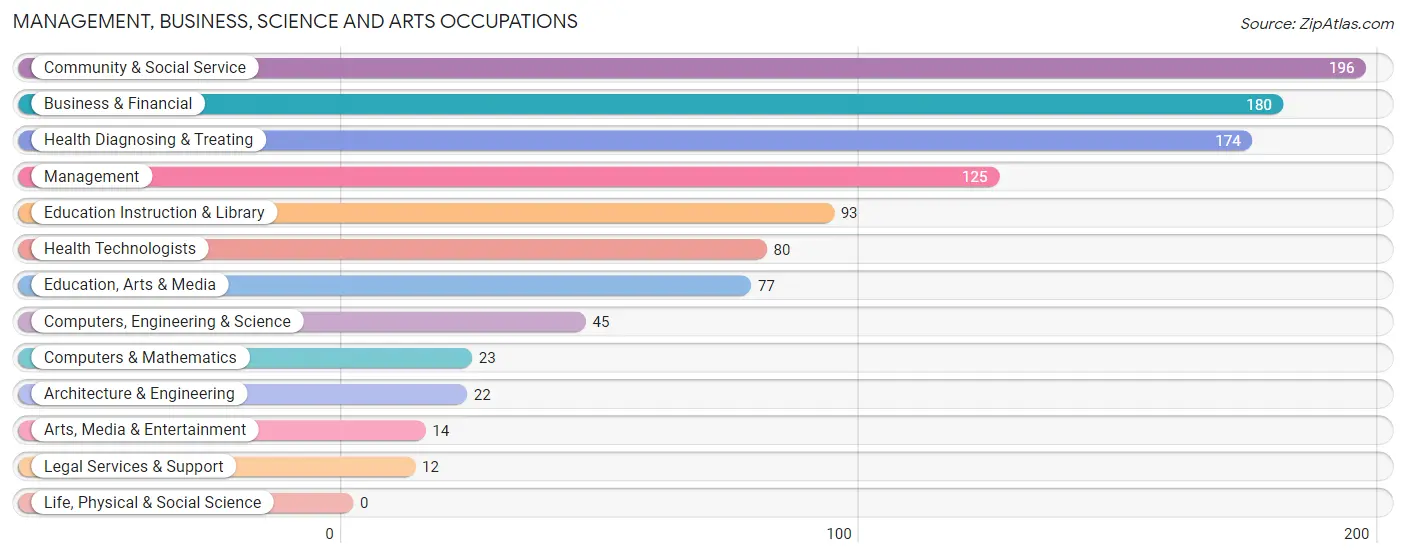
Management, Business, Science and Arts Occupations
The most common Management, Business, Science and Arts occupations in Lyncourt are Community & Social Service (196 | 9.7%), Business & Financial (180 | 8.9%), Health Diagnosing & Treating (174 | 8.6%), Management (125 | 6.2%), and Education Instruction & Library (93 | 4.6%).
Management, Business, Science and Arts Occupations by Sex
Within the Management, Business, Science and Arts occupations in Lyncourt, the most male-oriented occupations are Architecture & Engineering (100.0%), Computers, Engineering & Science (75.6%), and Business & Financial (65.6%), while the most female-oriented occupations are Legal Services & Support (100.0%), Arts, Media & Entertainment (100.0%), and Health Technologists (100.0%).
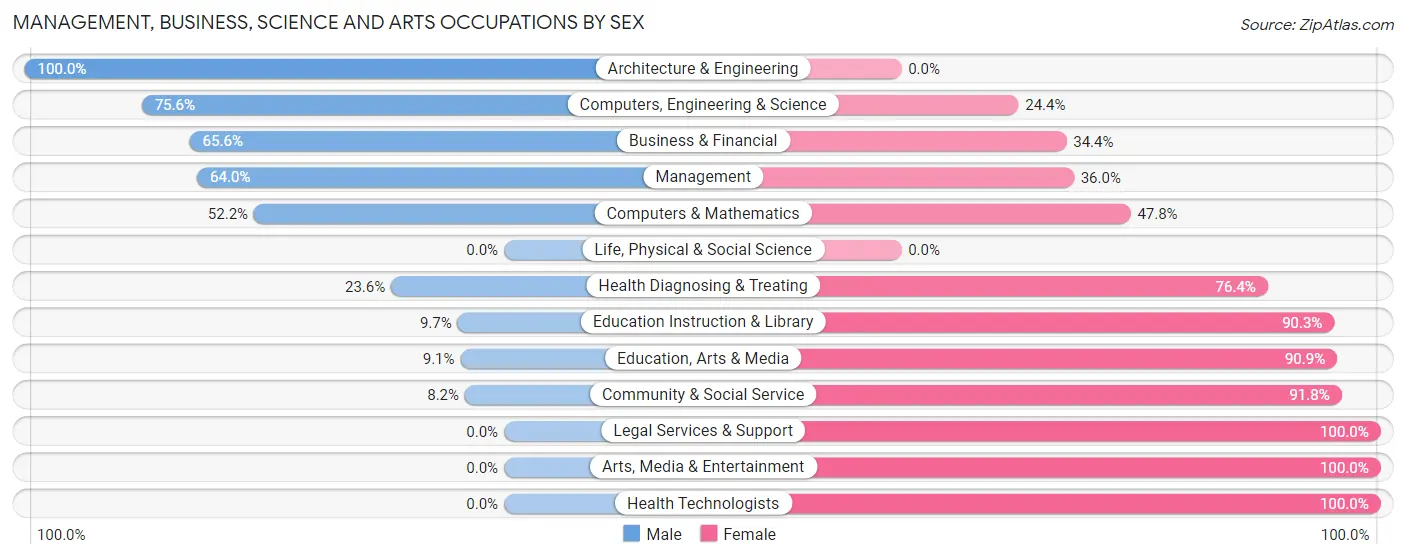
| Occupation | Male | Female |
| Management | 80 (64.0%) | 45 (36.0%) |
| Business & Financial | 118 (65.6%) | 62 (34.4%) |
| Computers, Engineering & Science | 34 (75.6%) | 11 (24.4%) |
| Computers & Mathematics | 12 (52.2%) | 11 (47.8%) |
| Architecture & Engineering | 22 (100.0%) | 0 (0.0%) |
| Life, Physical & Social Science | 0 (0.0%) | 0 (0.0%) |
| Community & Social Service | 16 (8.2%) | 180 (91.8%) |
| Education, Arts & Media | 7 (9.1%) | 70 (90.9%) |
| Legal Services & Support | 0 (0.0%) | 12 (100.0%) |
| Education Instruction & Library | 9 (9.7%) | 84 (90.3%) |
| Arts, Media & Entertainment | 0 (0.0%) | 14 (100.0%) |
| Health Diagnosing & Treating | 41 (23.6%) | 133 (76.4%) |
| Health Technologists | 0 (0.0%) | 80 (100.0%) |
| Total (Category) | 289 (40.1%) | 431 (59.9%) |
| Total (Overall) | 973 (48.1%) | 1,048 (51.9%) |
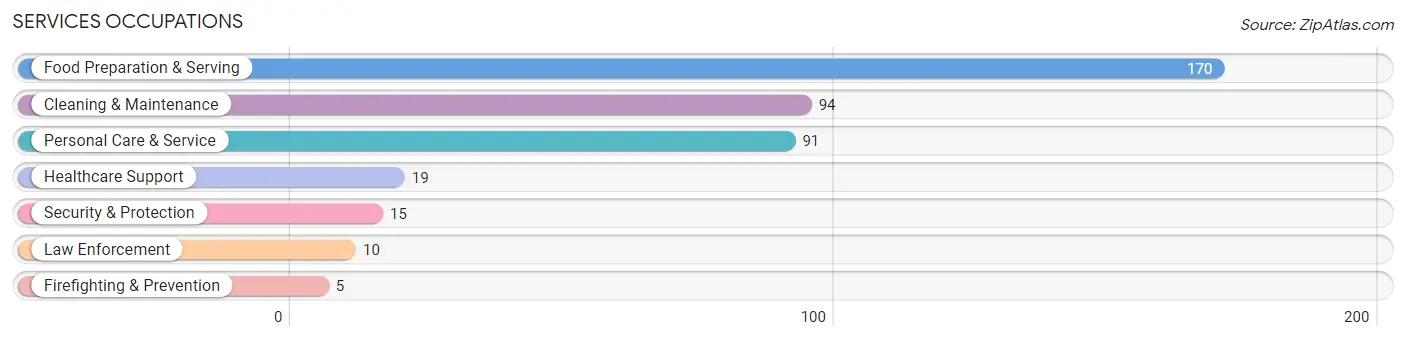
Services Occupations
The most common Services occupations in Lyncourt are Food Preparation & Serving (170 | 8.4%), Cleaning & Maintenance (94 | 4.6%), Personal Care & Service (91 | 4.5%), Healthcare Support (19 | 0.9%), and Security & Protection (15 | 0.7%).
Services Occupations by Sex
Within the Services occupations in Lyncourt, the most male-oriented occupations are Healthcare Support (100.0%), Firefighting & Prevention (100.0%), and Cleaning & Maintenance (38.3%), while the most female-oriented occupations are Law Enforcement (100.0%), Personal Care & Service (100.0%), and Food Preparation & Serving (68.2%).
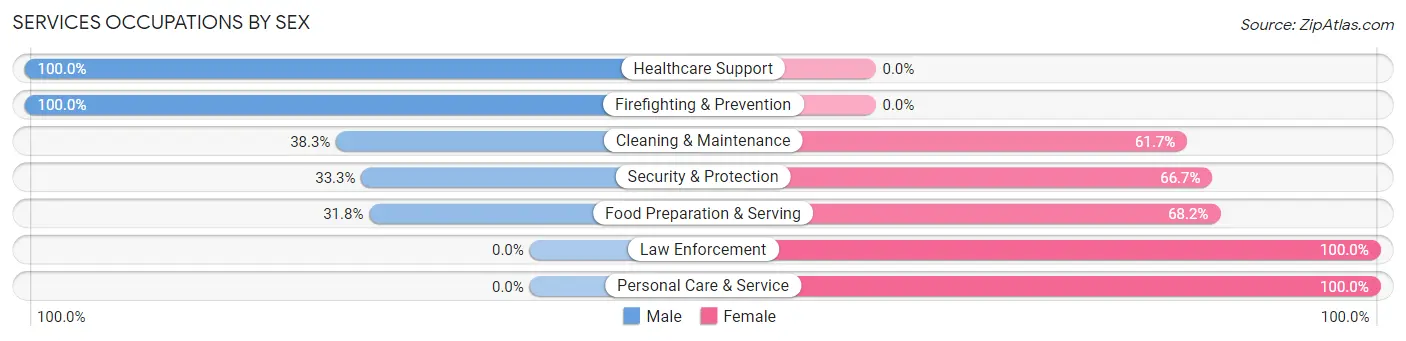
| Occupation | Male | Female |
| Healthcare Support | 19 (100.0%) | 0 (0.0%) |
| Security & Protection | 5 (33.3%) | 10 (66.7%) |
| Firefighting & Prevention | 5 (100.0%) | 0 (0.0%) |
| Law Enforcement | 0 (0.0%) | 10 (100.0%) |
| Food Preparation & Serving | 54 (31.8%) | 116 (68.2%) |
| Cleaning & Maintenance | 36 (38.3%) | 58 (61.7%) |
| Personal Care & Service | 0 (0.0%) | 91 (100.0%) |
| Total (Category) | 114 (29.3%) | 275 (70.7%) |
| Total (Overall) | 973 (48.1%) | 1,048 (51.9%) |
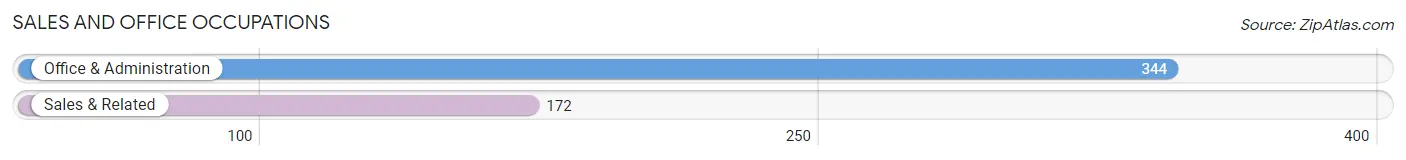
Sales and Office Occupations
The most common Sales and Office occupations in Lyncourt are Office & Administration (344 | 17.0%), and Sales & Related (172 | 8.5%).
Sales and Office Occupations by Sex
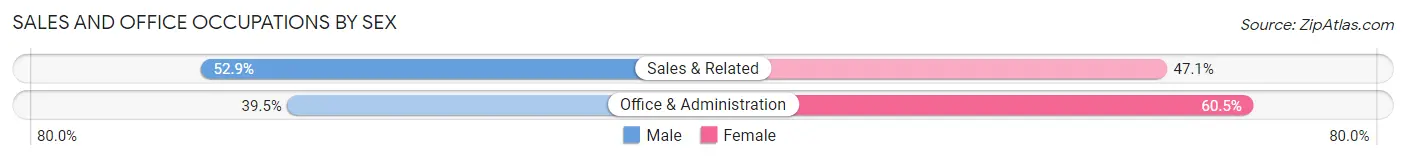
| Occupation | Male | Female |
| Sales & Related | 91 (52.9%) | 81 (47.1%) |
| Office & Administration | 136 (39.5%) | 208 (60.5%) |
| Total (Category) | 227 (44.0%) | 289 (56.0%) |
| Total (Overall) | 973 (48.1%) | 1,048 (51.9%) |
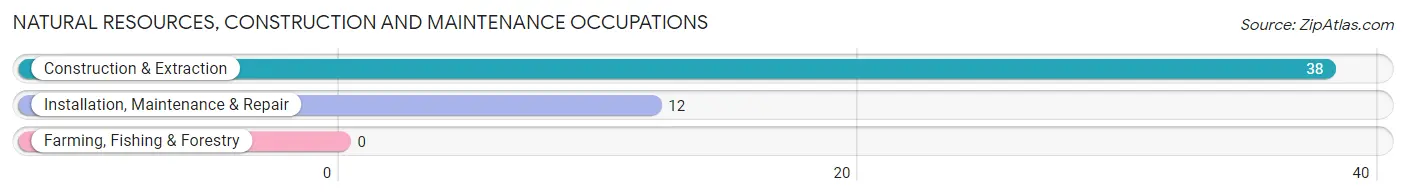
Natural Resources, Construction and Maintenance Occupations
The most common Natural Resources, Construction and Maintenance occupations in Lyncourt are Construction & Extraction (38 | 1.9%), and Installation, Maintenance & Repair (12 | 0.6%).
Natural Resources, Construction and Maintenance Occupations by Sex
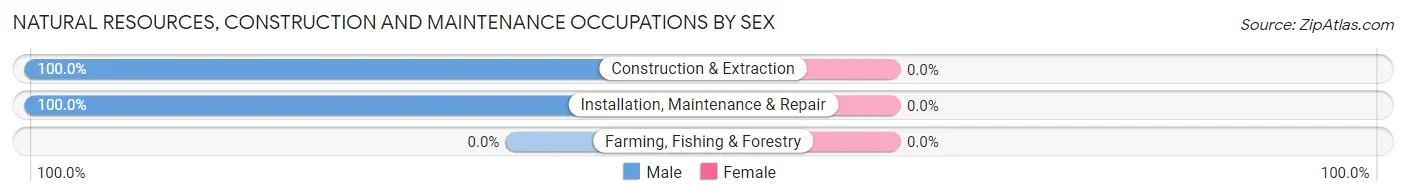
| Occupation | Male | Female |
| Farming, Fishing & Forestry | 0 (0.0%) | 0 (0.0%) |
| Construction & Extraction | 38 (100.0%) | 0 (0.0%) |
| Installation, Maintenance & Repair | 12 (100.0%) | 0 (0.0%) |
| Total (Category) | 50 (100.0%) | 0 (0.0%) |
| Total (Overall) | 973 (48.1%) | 1,048 (51.9%) |
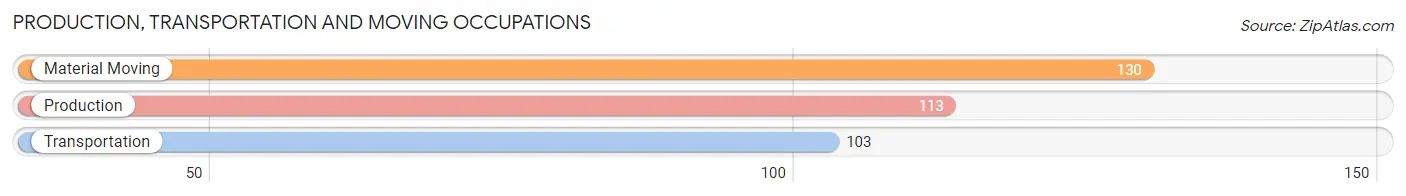
Production, Transportation and Moving Occupations
The most common Production, Transportation and Moving occupations in Lyncourt are Material Moving (130 | 6.4%), Production (113 | 5.6%), and Transportation (103 | 5.1%).
Production, Transportation and Moving Occupations by Sex
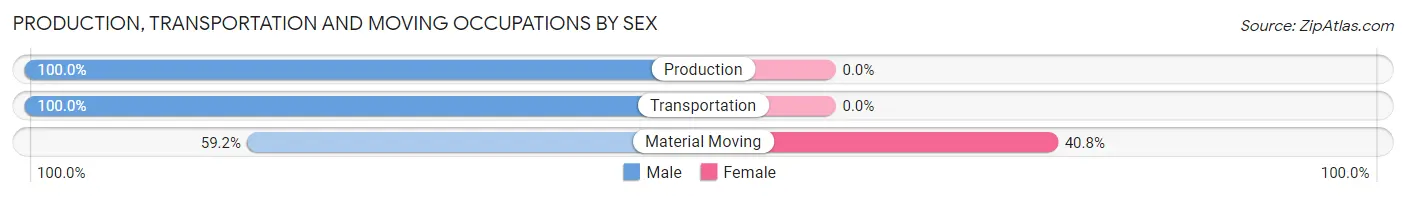
| Occupation | Male | Female |
| Production | 113 (100.0%) | 0 (0.0%) |
| Transportation | 103 (100.0%) | 0 (0.0%) |
| Material Moving | 77 (59.2%) | 53 (40.8%) |
| Total (Category) | 293 (84.7%) | 53 (15.3%) |
| Total (Overall) | 973 (48.1%) | 1,048 (51.9%) |
Employment Industries by Sex in Lyncourt
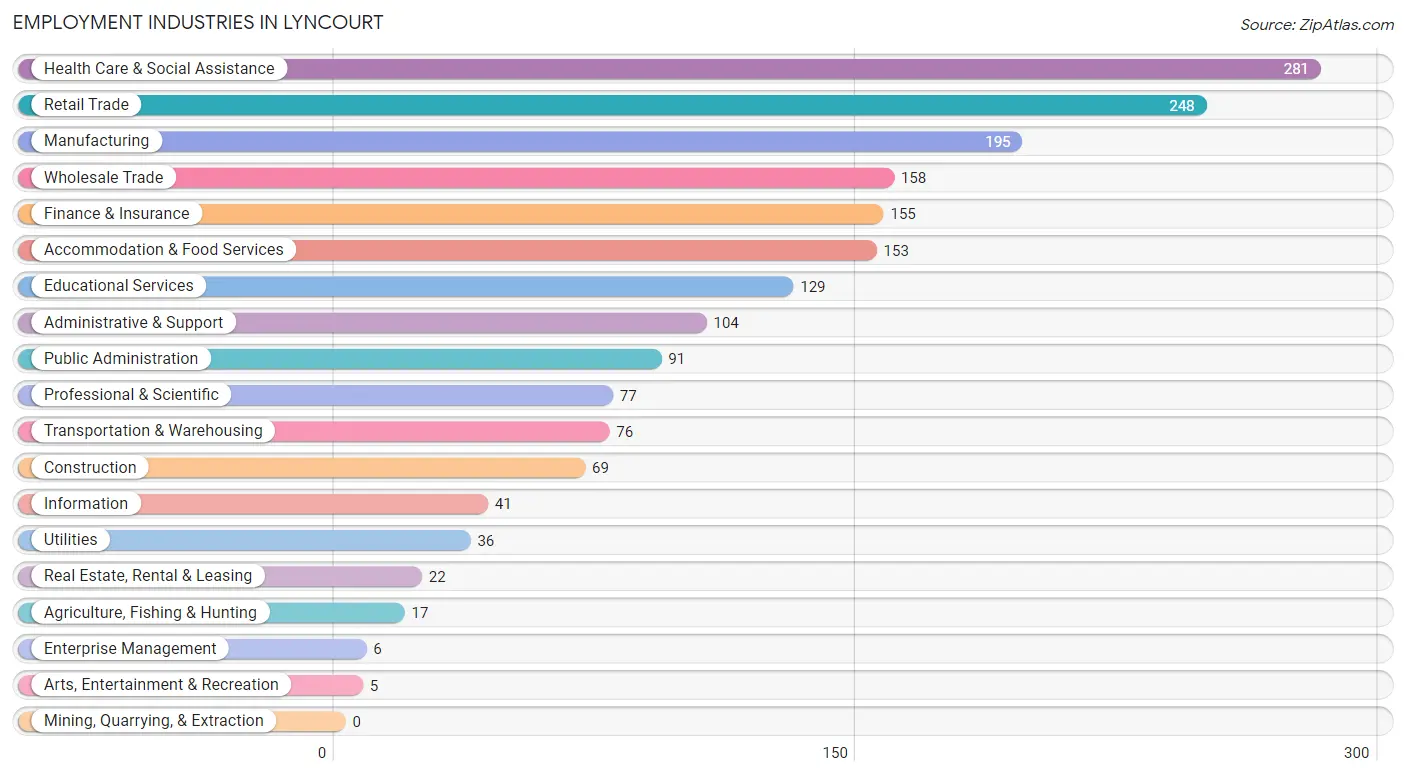
Employment Industries in Lyncourt
The major employment industries in Lyncourt include Health Care & Social Assistance (281 | 13.9%), Retail Trade (248 | 12.3%), Manufacturing (195 | 9.7%), Wholesale Trade (158 | 7.8%), and Finance & Insurance (155 | 7.7%).
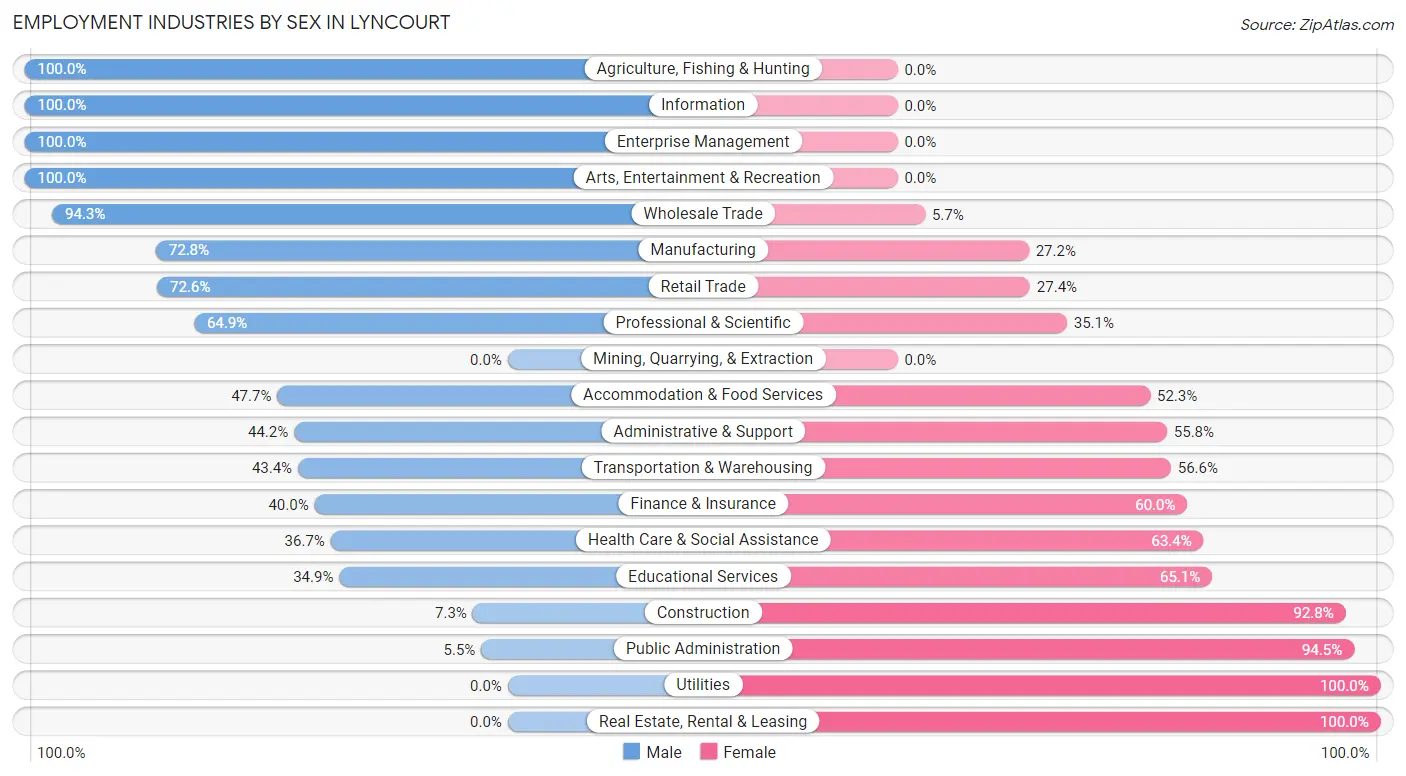
Employment Industries by Sex in Lyncourt
The Lyncourt industries that see more men than women are Agriculture, Fishing & Hunting (100.0%), Information (100.0%), and Enterprise Management (100.0%), whereas the industries that tend to have a higher number of women are Utilities (100.0%), Real Estate, Rental & Leasing (100.0%), and Public Administration (94.5%).
| Industry | Male | Female |
| Agriculture, Fishing & Hunting | 17 (100.0%) | 0 (0.0%) |
| Mining, Quarrying, & Extraction | 0 (0.0%) | 0 (0.0%) |
| Construction | 5 (7.2%) | 64 (92.7%) |
| Manufacturing | 142 (72.8%) | 53 (27.2%) |
| Wholesale Trade | 149 (94.3%) | 9 (5.7%) |
| Retail Trade | 180 (72.6%) | 68 (27.4%) |
| Transportation & Warehousing | 33 (43.4%) | 43 (56.6%) |
| Utilities | 0 (0.0%) | 36 (100.0%) |
| Information | 41 (100.0%) | 0 (0.0%) |
| Finance & Insurance | 62 (40.0%) | 93 (60.0%) |
| Real Estate, Rental & Leasing | 0 (0.0%) | 22 (100.0%) |
| Professional & Scientific | 50 (64.9%) | 27 (35.1%) |
| Enterprise Management | 6 (100.0%) | 0 (0.0%) |
| Administrative & Support | 46 (44.2%) | 58 (55.8%) |
| Educational Services | 45 (34.9%) | 84 (65.1%) |
| Health Care & Social Assistance | 103 (36.6%) | 178 (63.3%) |
| Arts, Entertainment & Recreation | 5 (100.0%) | 0 (0.0%) |
| Accommodation & Food Services | 73 (47.7%) | 80 (52.3%) |
| Public Administration | 5 (5.5%) | 86 (94.5%) |
| Total | 973 (48.1%) | 1,048 (51.9%) |
Education in Lyncourt
School Enrollment in Lyncourt
The most common levels of schooling among the 804 students in Lyncourt are middle school (217 | 27.0%), high school (206 | 25.6%), and elementary school (189 | 23.5%).
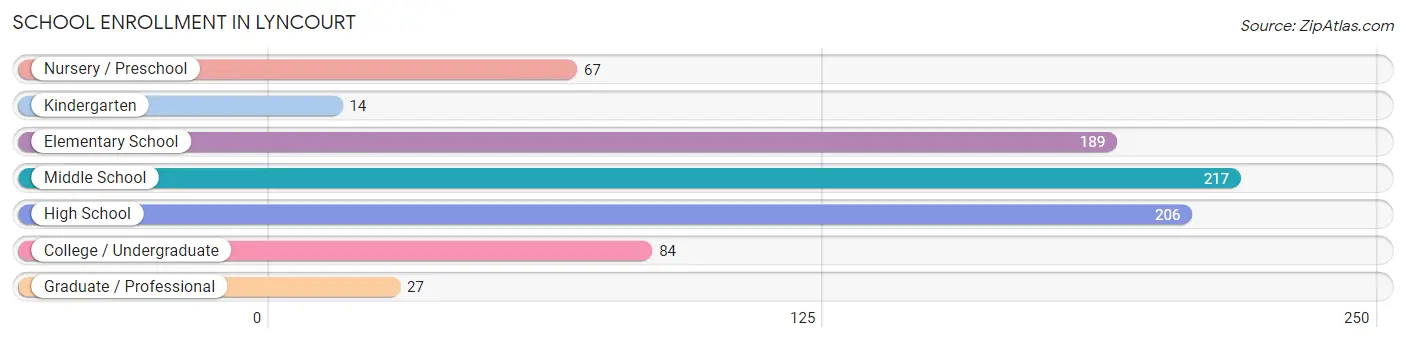
| School Level | # Students | % Students |
| Nursery / Preschool | 67 | 8.3% |
| Kindergarten | 14 | 1.7% |
| Elementary School | 189 | 23.5% |
| Middle School | 217 | 27.0% |
| High School | 206 | 25.6% |
| College / Undergraduate | 84 | 10.4% |
| Graduate / Professional | 27 | 3.4% |
| Total | 804 | 100.0% |
School Enrollment by Age by Funding Source in Lyncourt
Out of a total of 804 students who are enrolled in schools in Lyncourt, 84 (10.4%) attend a private institution, while the remaining 720 (89.6%) are enrolled in public schools. The age group of 25 to 34 year olds has the highest likelihood of being enrolled in private schools, with 9 (100.0% in the age bracket) enrolled. Conversely, the age group of 15 to 17 year olds has the lowest likelihood of being enrolled in a private school, with 141 (100.0% in the age bracket) attending a public institution.
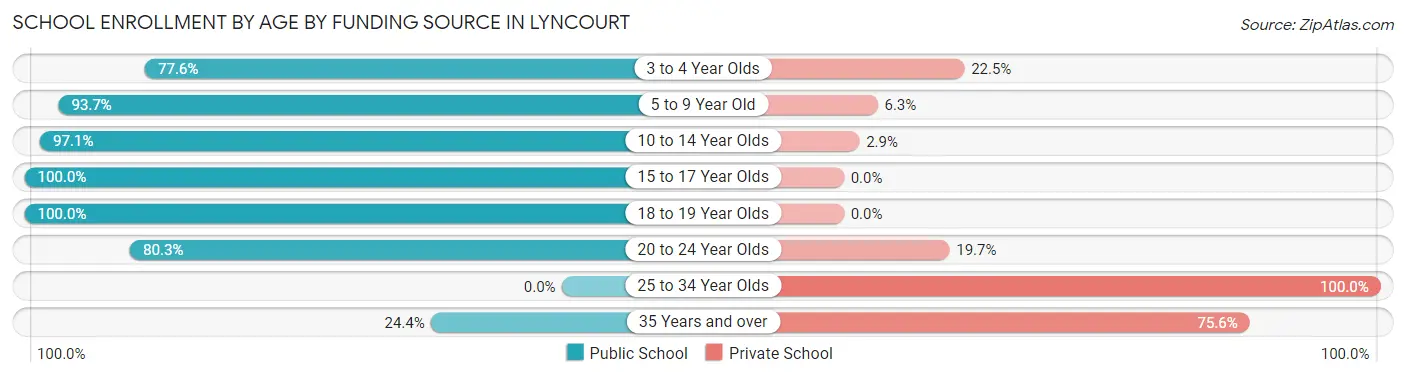
| Age Bracket | Public School | Private School |
| 3 to 4 Year Olds | 38 (77.5%) | 11 (22.5%) |
| 5 to 9 Year Old | 193 (93.7%) | 13 (6.3%) |
| 10 to 14 Year Olds | 269 (97.1%) | 8 (2.9%) |
| 15 to 17 Year Olds | 141 (100.0%) | 0 (0.0%) |
| 18 to 19 Year Olds | 20 (100.0%) | 0 (0.0%) |
| 20 to 24 Year Olds | 49 (80.3%) | 12 (19.7%) |
| 25 to 34 Year Olds | 0 (0.0%) | 9 (100.0%) |
| 35 Years and over | 10 (24.4%) | 31 (75.6%) |
| Total | 720 (89.6%) | 84 (10.4%) |
Educational Attainment by Field of Study in Lyncourt
Science & technology (105 | 18.2%), bio, nature & agricultural (81 | 14.1%), business (81 | 14.1%), education (73 | 12.7%), and communications (53 | 9.2%) are the most common fields of study among 576 individuals in Lyncourt who have obtained a bachelor's degree or higher.
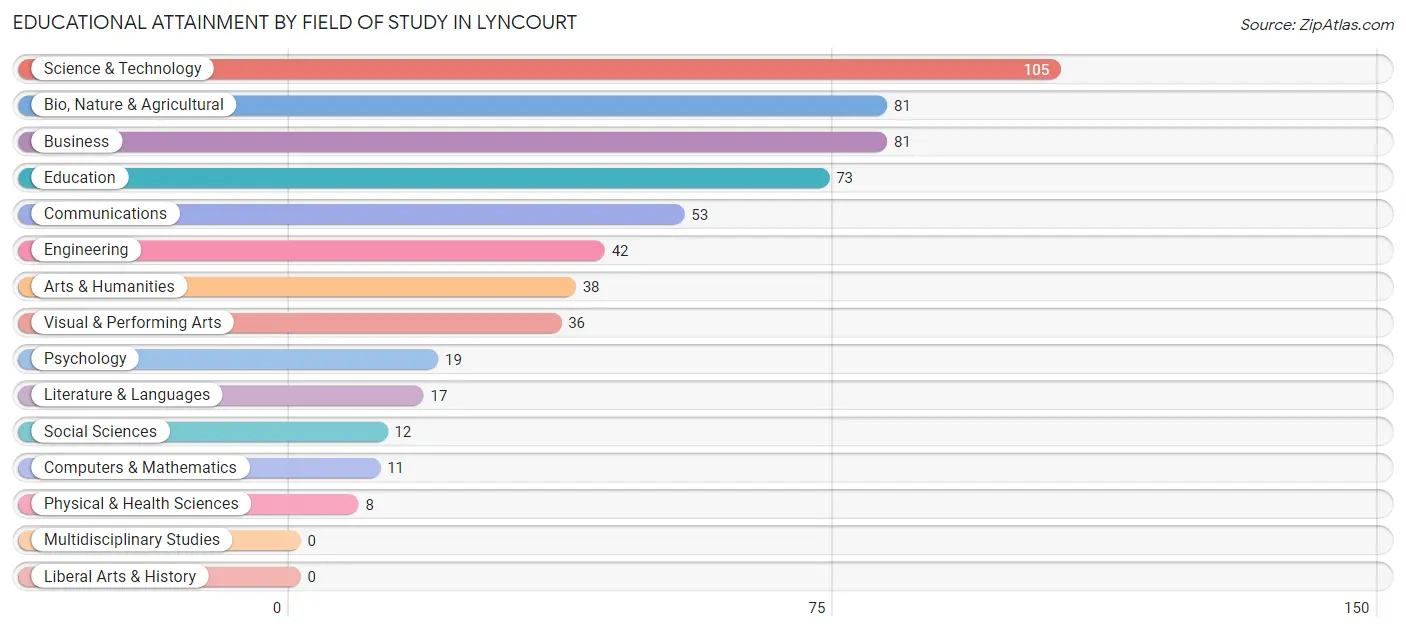
| Field of Study | # Graduates | % Graduates |
| Computers & Mathematics | 11 | 1.9% |
| Bio, Nature & Agricultural | 81 | 14.1% |
| Physical & Health Sciences | 8 | 1.4% |
| Psychology | 19 | 3.3% |
| Social Sciences | 12 | 2.1% |
| Engineering | 42 | 7.3% |
| Multidisciplinary Studies | 0 | 0.0% |
| Science & Technology | 105 | 18.2% |
| Business | 81 | 14.1% |
| Education | 73 | 12.7% |
| Literature & Languages | 17 | 2.9% |
| Liberal Arts & History | 0 | 0.0% |
| Visual & Performing Arts | 36 | 6.2% |
| Communications | 53 | 9.2% |
| Arts & Humanities | 38 | 6.6% |
| Total | 576 | 100.0% |
Transportation & Commute in Lyncourt
Vehicle Availability by Sex in Lyncourt
The most prevalent vehicle ownership categories in Lyncourt are males with 2 vehicles (489, accounting for 50.3%) and females with 2 vehicles (600, making up 46.7%).
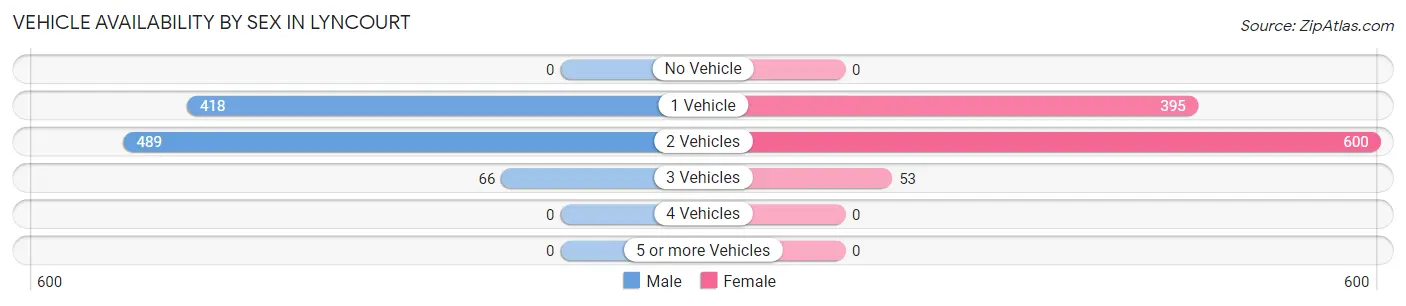
| Vehicles Available | Male | Female |
| No Vehicle | 0 (0.0%) | 0 (0.0%) |
| 1 Vehicle | 418 (43.0%) | 395 (37.7%) |
| 2 Vehicles | 489 (50.3%) | 600 (57.3%) |
| 3 Vehicles | 66 (6.8%) | 53 (5.1%) |
| 4 Vehicles | 0 (0.0%) | 0 (0.0%) |
| 5 or more Vehicles | 0 (0.0%) | 0 (0.0%) |
| Total | 973 (100.0%) | 1,048 (100.0%) |
Commute Time in Lyncourt
The most frequently occuring commute durations in Lyncourt are 15 to 19 minutes (598 commuters, 32.4%), 10 to 14 minutes (537 commuters, 29.1%), and 20 to 24 minutes (332 commuters, 18.0%).
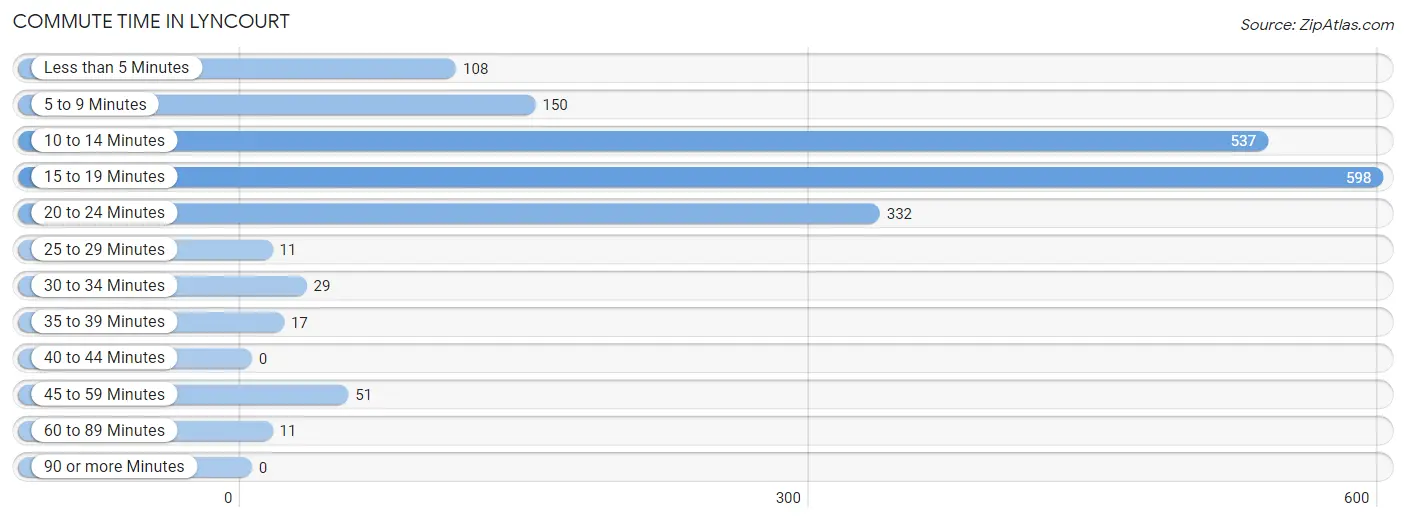
| Commute Time | # Commuters | % Commuters |
| Less than 5 Minutes | 108 | 5.9% |
| 5 to 9 Minutes | 150 | 8.1% |
| 10 to 14 Minutes | 537 | 29.1% |
| 15 to 19 Minutes | 598 | 32.4% |
| 20 to 24 Minutes | 332 | 18.0% |
| 25 to 29 Minutes | 11 | 0.6% |
| 30 to 34 Minutes | 29 | 1.6% |
| 35 to 39 Minutes | 17 | 0.9% |
| 40 to 44 Minutes | 0 | 0.0% |
| 45 to 59 Minutes | 51 | 2.8% |
| 60 to 89 Minutes | 11 | 0.6% |
| 90 or more Minutes | 0 | 0.0% |
Commute Time by Sex in Lyncourt
The most common commute times in Lyncourt are 15 to 19 minutes (352 commuters, 39.0%) for males and 10 to 14 minutes (318 commuters, 33.8%) for females.
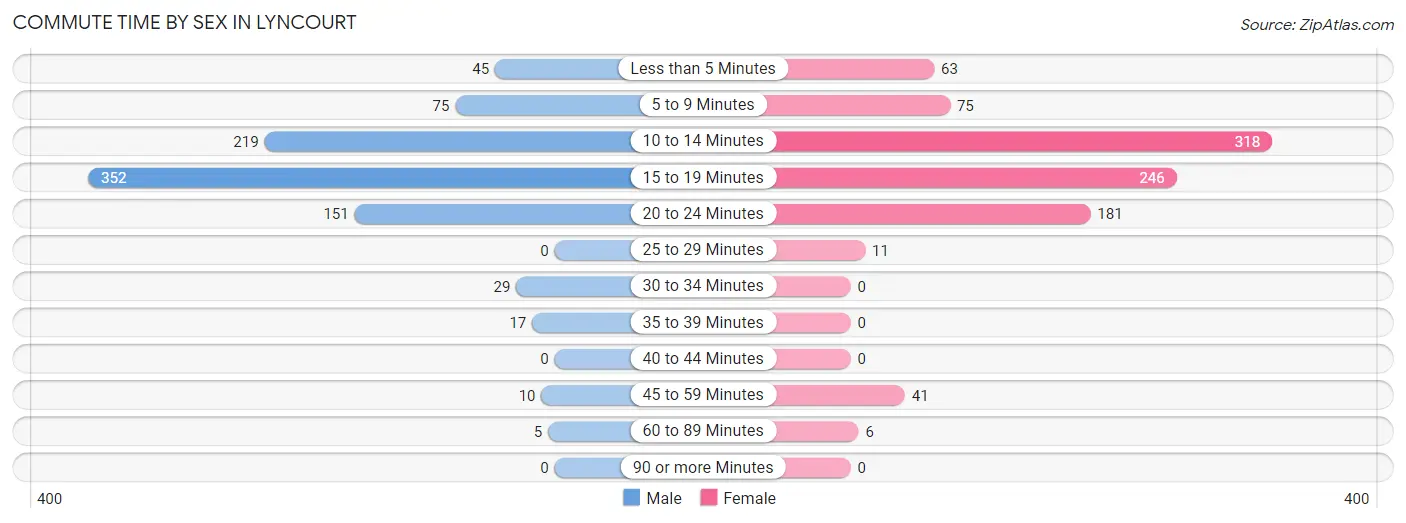
| Commute Time | Male | Female |
| Less than 5 Minutes | 45 (5.0%) | 63 (6.7%) |
| 5 to 9 Minutes | 75 (8.3%) | 75 (8.0%) |
| 10 to 14 Minutes | 219 (24.2%) | 318 (33.8%) |
| 15 to 19 Minutes | 352 (39.0%) | 246 (26.1%) |
| 20 to 24 Minutes | 151 (16.7%) | 181 (19.2%) |
| 25 to 29 Minutes | 0 (0.0%) | 11 (1.2%) |
| 30 to 34 Minutes | 29 (3.2%) | 0 (0.0%) |
| 35 to 39 Minutes | 17 (1.9%) | 0 (0.0%) |
| 40 to 44 Minutes | 0 (0.0%) | 0 (0.0%) |
| 45 to 59 Minutes | 10 (1.1%) | 41 (4.4%) |
| 60 to 89 Minutes | 5 (0.5%) | 6 (0.6%) |
| 90 or more Minutes | 0 (0.0%) | 0 (0.0%) |
Time of Departure to Work by Sex in Lyncourt
The most frequent times of departure to work in Lyncourt are 5:30 AM to 5:59 AM (178, 19.7%) for males and 7:00 AM to 7:29 AM (152, 16.2%) for females.
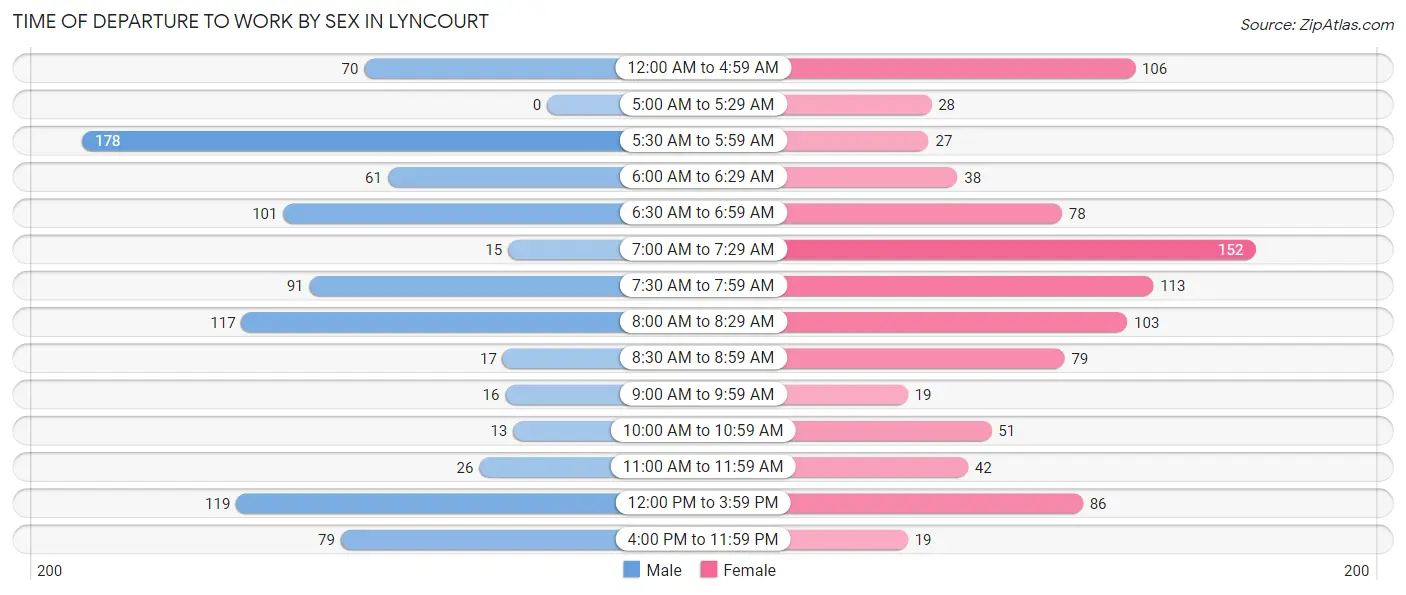
| Time of Departure | Male | Female |
| 12:00 AM to 4:59 AM | 70 (7.7%) | 106 (11.3%) |
| 5:00 AM to 5:29 AM | 0 (0.0%) | 28 (3.0%) |
| 5:30 AM to 5:59 AM | 178 (19.7%) | 27 (2.9%) |
| 6:00 AM to 6:29 AM | 61 (6.8%) | 38 (4.0%) |
| 6:30 AM to 6:59 AM | 101 (11.2%) | 78 (8.3%) |
| 7:00 AM to 7:29 AM | 15 (1.7%) | 152 (16.2%) |
| 7:30 AM to 7:59 AM | 91 (10.1%) | 113 (12.0%) |
| 8:00 AM to 8:29 AM | 117 (13.0%) | 103 (11.0%) |
| 8:30 AM to 8:59 AM | 17 (1.9%) | 79 (8.4%) |
| 9:00 AM to 9:59 AM | 16 (1.8%) | 19 (2.0%) |
| 10:00 AM to 10:59 AM | 13 (1.4%) | 51 (5.4%) |
| 11:00 AM to 11:59 AM | 26 (2.9%) | 42 (4.5%) |
| 12:00 PM to 3:59 PM | 119 (13.2%) | 86 (9.1%) |
| 4:00 PM to 11:59 PM | 79 (8.7%) | 19 (2.0%) |
| Total | 903 (100.0%) | 941 (100.0%) |
Housing Occupancy in Lyncourt
Occupancy by Ownership in Lyncourt
Of the total 1,677 dwellings in Lyncourt, owner-occupied units account for 1,069 (63.7%), while renter-occupied units make up 608 (36.3%).
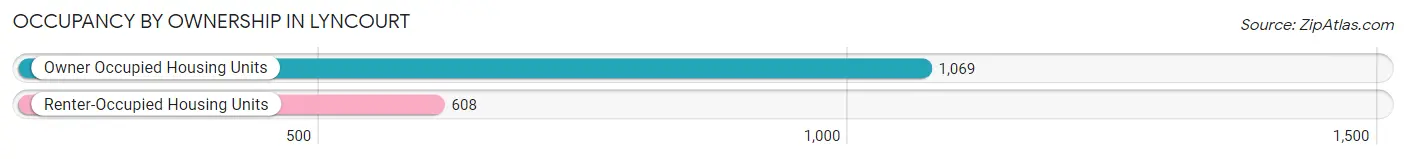
| Occupancy | # Housing Units | % Housing Units |
| Owner Occupied Housing Units | 1,069 | 63.7% |
| Renter-Occupied Housing Units | 608 | 36.3% |
| Total Occupied Housing Units | 1,677 | 100.0% |
Occupancy by Household Size in Lyncourt
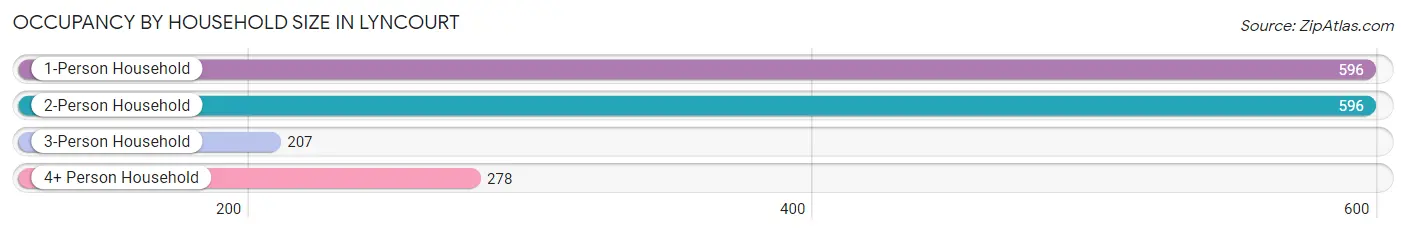
| Household Size | # Housing Units | % Housing Units |
| 1-Person Household | 596 | 35.5% |
| 2-Person Household | 596 | 35.5% |
| 3-Person Household | 207 | 12.3% |
| 4+ Person Household | 278 | 16.6% |
| Total Housing Units | 1,677 | 100.0% |
Occupancy by Ownership by Household Size in Lyncourt
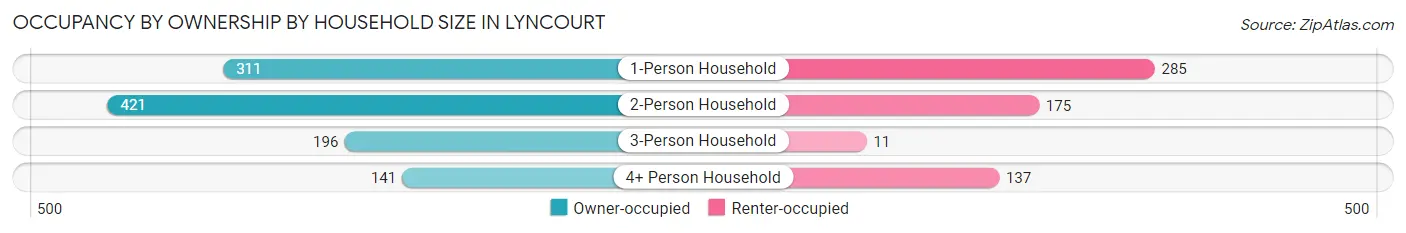
| Household Size | Owner-occupied | Renter-occupied |
| 1-Person Household | 311 (52.2%) | 285 (47.8%) |
| 2-Person Household | 421 (70.6%) | 175 (29.4%) |
| 3-Person Household | 196 (94.7%) | 11 (5.3%) |
| 4+ Person Household | 141 (50.7%) | 137 (49.3%) |
| Total Housing Units | 1,069 (63.7%) | 608 (36.3%) |
Occupancy by Educational Attainment in Lyncourt
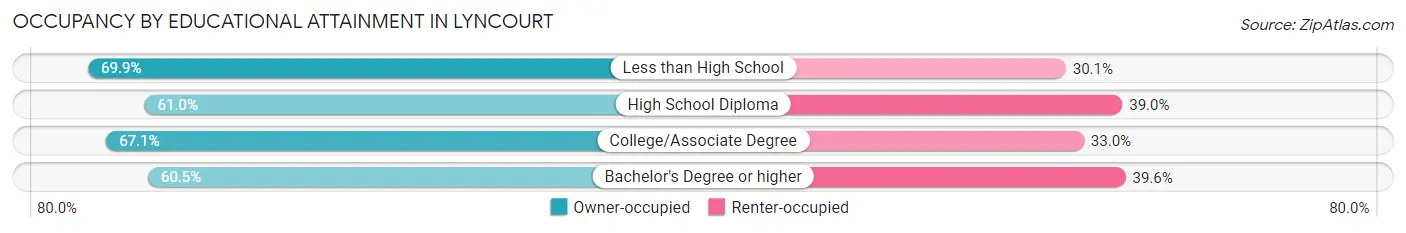
| Household Size | Owner-occupied | Renter-occupied |
| Less than High School | 93 (69.9%) | 40 (30.1%) |
| High School Diploma | 331 (61.0%) | 212 (39.0%) |
| College/Associate Degree | 405 (67.0%) | 199 (33.0%) |
| Bachelor's Degree or higher | 240 (60.5%) | 157 (39.6%) |
Occupancy by Age of Householder in Lyncourt
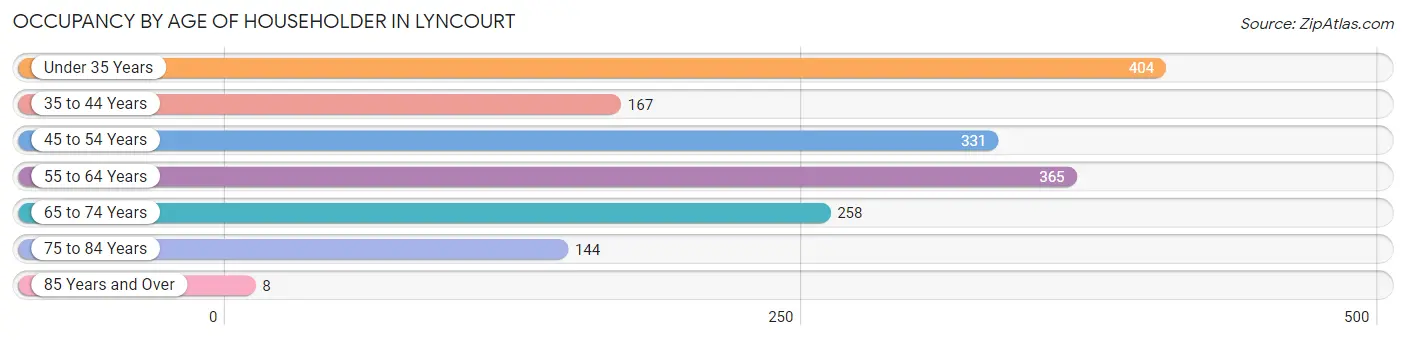
| Age Bracket | # Households | % Households |
| Under 35 Years | 404 | 24.1% |
| 35 to 44 Years | 167 | 10.0% |
| 45 to 54 Years | 331 | 19.7% |
| 55 to 64 Years | 365 | 21.8% |
| 65 to 74 Years | 258 | 15.4% |
| 75 to 84 Years | 144 | 8.6% |
| 85 Years and Over | 8 | 0.5% |
| Total | 1,677 | 100.0% |
Housing Finances in Lyncourt
Median Income by Occupancy in Lyncourt
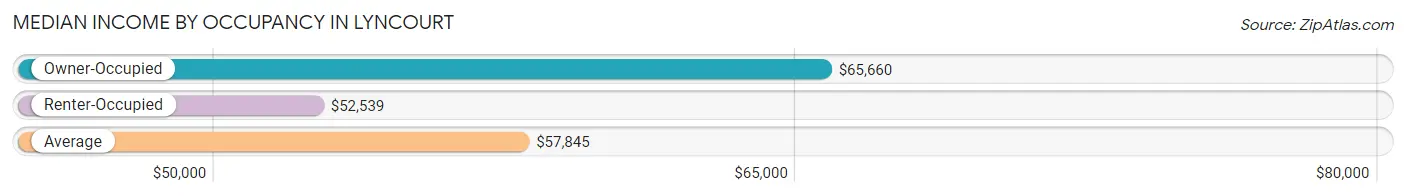
| Occupancy Type | # Households | Median Income |
| Owner-Occupied | 1,069 (63.7%) | $65,660 |
| Renter-Occupied | 608 (36.3%) | $52,539 |
| Average | 1,677 (100.0%) | $57,845 |
Occupancy by Householder Income Bracket in Lyncourt
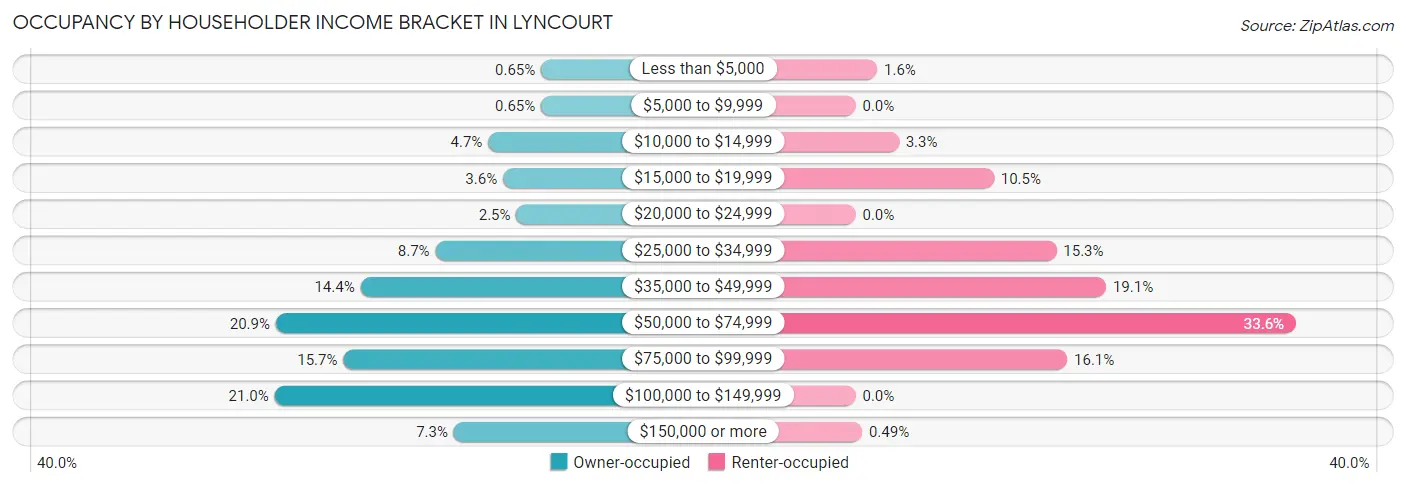
| Income Bracket | Owner-occupied | Renter-occupied |
| Less than $5,000 | 7 (0.6%) | 10 (1.6%) |
| $5,000 to $9,999 | 7 (0.6%) | 0 (0.0%) |
| $10,000 to $14,999 | 50 (4.7%) | 20 (3.3%) |
| $15,000 to $19,999 | 38 (3.5%) | 64 (10.5%) |
| $20,000 to $24,999 | 27 (2.5%) | 0 (0.0%) |
| $25,000 to $34,999 | 93 (8.7%) | 93 (15.3%) |
| $35,000 to $49,999 | 154 (14.4%) | 116 (19.1%) |
| $50,000 to $74,999 | 223 (20.9%) | 204 (33.6%) |
| $75,000 to $99,999 | 168 (15.7%) | 98 (16.1%) |
| $100,000 to $149,999 | 224 (20.9%) | 0 (0.0%) |
| $150,000 or more | 78 (7.3%) | 3 (0.5%) |
| Total | 1,069 (100.0%) | 608 (100.0%) |
Monthly Housing Cost Tiers in Lyncourt
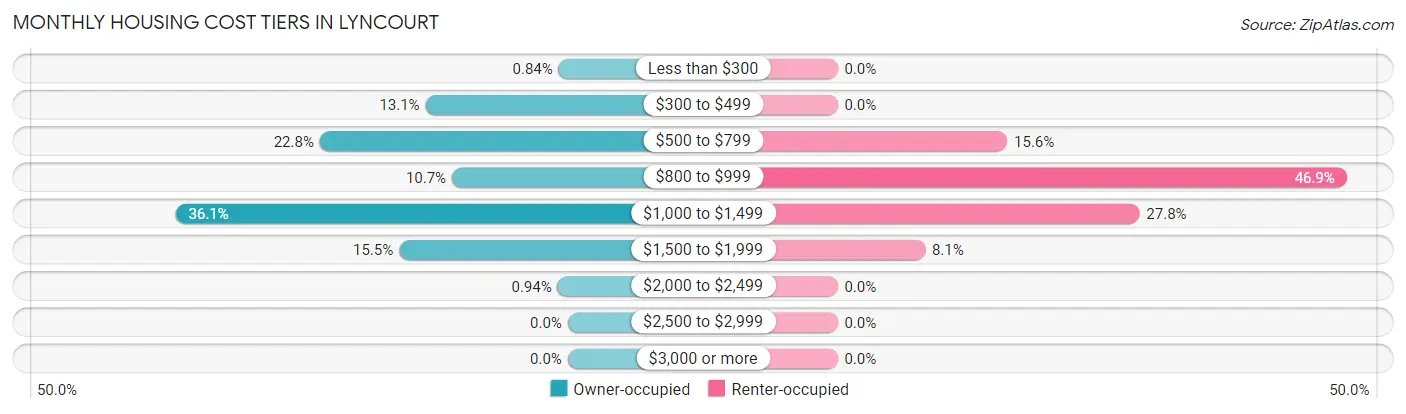
| Monthly Cost | Owner-occupied | Renter-occupied |
| Less than $300 | 9 (0.8%) | 0 (0.0%) |
| $300 to $499 | 140 (13.1%) | 0 (0.0%) |
| $500 to $799 | 244 (22.8%) | 95 (15.6%) |
| $800 to $999 | 114 (10.7%) | 285 (46.9%) |
| $1,000 to $1,499 | 386 (36.1%) | 169 (27.8%) |
| $1,500 to $1,999 | 166 (15.5%) | 49 (8.1%) |
| $2,000 to $2,499 | 10 (0.9%) | 0 (0.0%) |
| $2,500 to $2,999 | 0 (0.0%) | 0 (0.0%) |
| $3,000 or more | 0 (0.0%) | 0 (0.0%) |
| Total | 1,069 (100.0%) | 608 (100.0%) |
Physical Housing Characteristics in Lyncourt
Housing Structures in Lyncourt
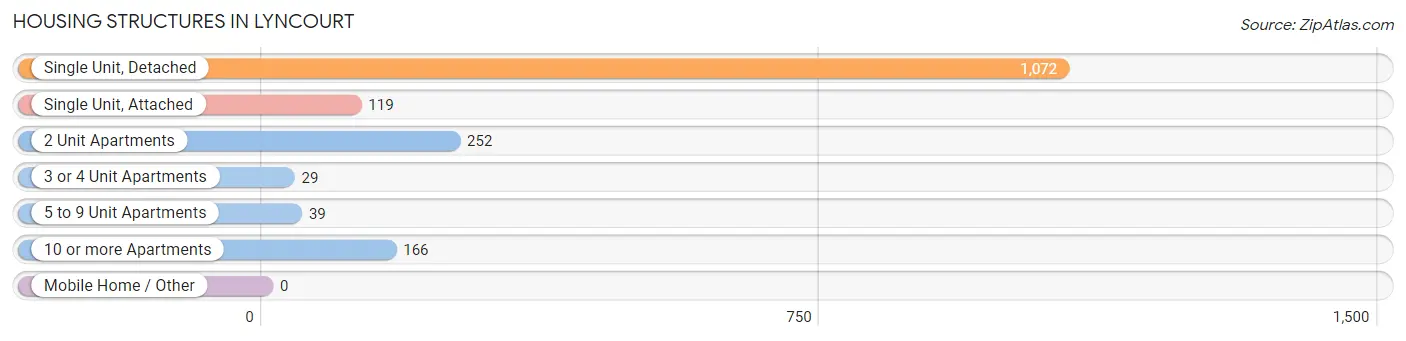
| Structure Type | # Housing Units | % Housing Units |
| Single Unit, Detached | 1,072 | 63.9% |
| Single Unit, Attached | 119 | 7.1% |
| 2 Unit Apartments | 252 | 15.0% |
| 3 or 4 Unit Apartments | 29 | 1.7% |
| 5 to 9 Unit Apartments | 39 | 2.3% |
| 10 or more Apartments | 166 | 9.9% |
| Mobile Home / Other | 0 | 0.0% |
| Total | 1,677 | 100.0% |
Housing Structures by Occupancy in Lyncourt
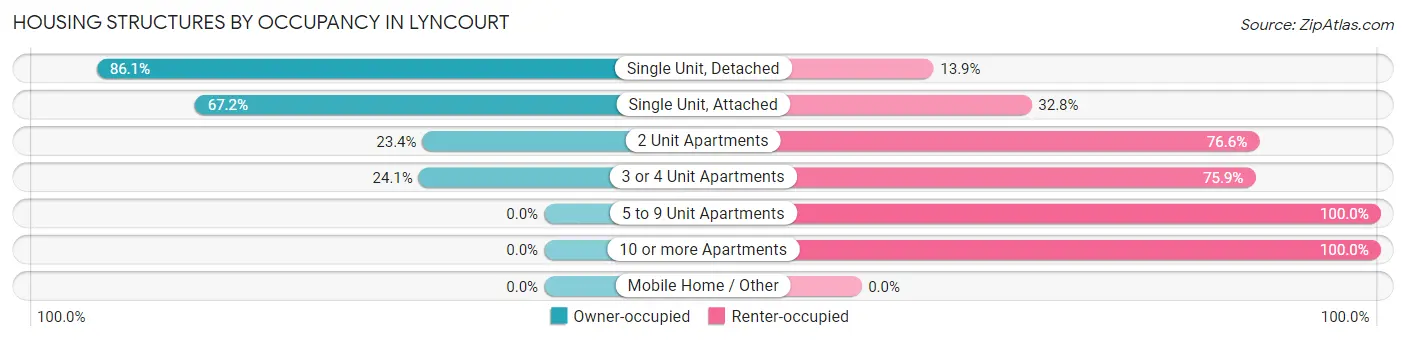
| Structure Type | Owner-occupied | Renter-occupied |
| Single Unit, Detached | 923 (86.1%) | 149 (13.9%) |
| Single Unit, Attached | 80 (67.2%) | 39 (32.8%) |
| 2 Unit Apartments | 59 (23.4%) | 193 (76.6%) |
| 3 or 4 Unit Apartments | 7 (24.1%) | 22 (75.9%) |
| 5 to 9 Unit Apartments | 0 (0.0%) | 39 (100.0%) |
| 10 or more Apartments | 0 (0.0%) | 166 (100.0%) |
| Mobile Home / Other | 0 (0.0%) | 0 (0.0%) |
| Total | 1,069 (63.7%) | 608 (36.3%) |
Housing Structures by Number of Rooms in Lyncourt
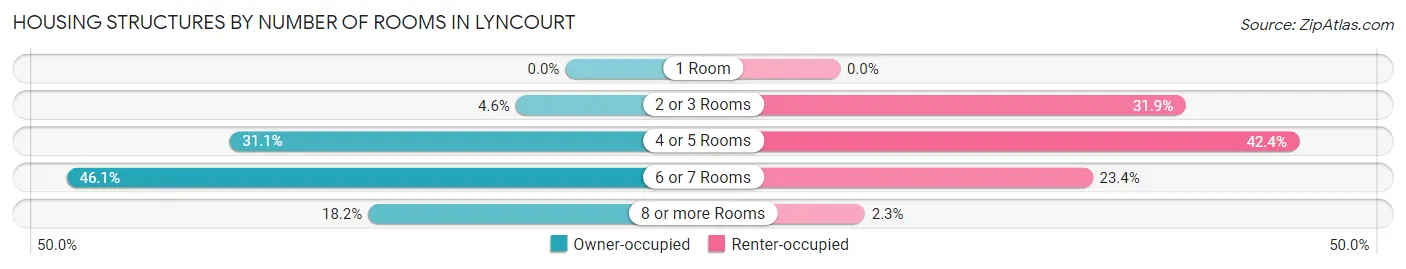
| Number of Rooms | Owner-occupied | Renter-occupied |
| 1 Room | 0 (0.0%) | 0 (0.0%) |
| 2 or 3 Rooms | 49 (4.6%) | 194 (31.9%) |
| 4 or 5 Rooms | 332 (31.1%) | 258 (42.4%) |
| 6 or 7 Rooms | 493 (46.1%) | 142 (23.4%) |
| 8 or more Rooms | 195 (18.2%) | 14 (2.3%) |
| Total | 1,069 (100.0%) | 608 (100.0%) |
Housing Structure by Heating Type in Lyncourt
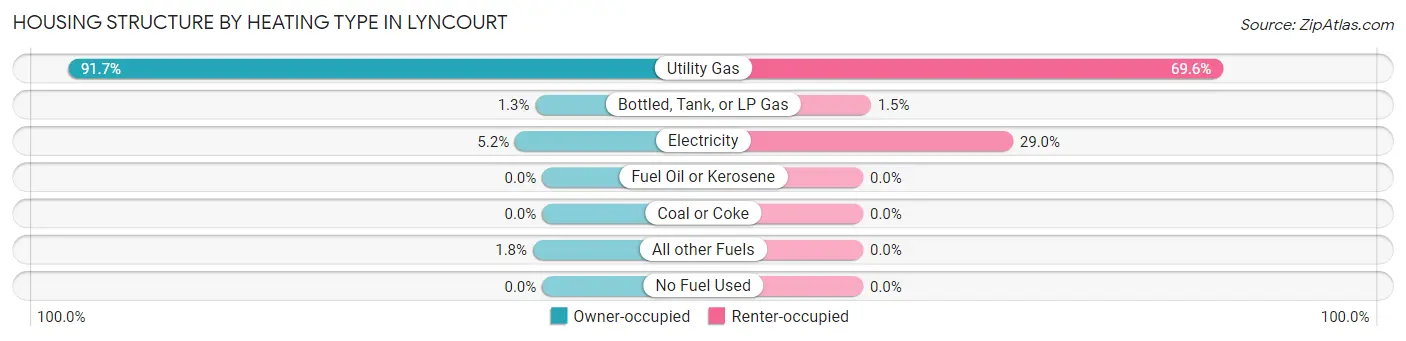
| Heating Type | Owner-occupied | Renter-occupied |
| Utility Gas | 980 (91.7%) | 423 (69.6%) |
| Bottled, Tank, or LP Gas | 14 (1.3%) | 9 (1.5%) |
| Electricity | 56 (5.2%) | 176 (28.9%) |
| Fuel Oil or Kerosene | 0 (0.0%) | 0 (0.0%) |
| Coal or Coke | 0 (0.0%) | 0 (0.0%) |
| All other Fuels | 19 (1.8%) | 0 (0.0%) |
| No Fuel Used | 0 (0.0%) | 0 (0.0%) |
| Total | 1,069 (100.0%) | 608 (100.0%) |
Household Vehicle Usage in Lyncourt
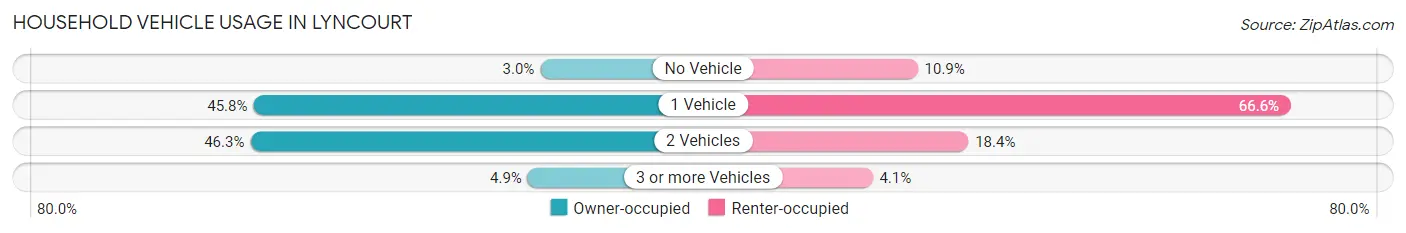
| Vehicles per Household | Owner-occupied | Renter-occupied |
| No Vehicle | 32 (3.0%) | 66 (10.9%) |
| 1 Vehicle | 490 (45.8%) | 405 (66.6%) |
| 2 Vehicles | 495 (46.3%) | 112 (18.4%) |
| 3 or more Vehicles | 52 (4.9%) | 25 (4.1%) |
| Total | 1,069 (100.0%) | 608 (100.0%) |
Real Estate & Mortgages in Lyncourt
Real Estate and Mortgage Overview in Lyncourt
| Characteristic | Without Mortgage | With Mortgage |
| Housing Units | 361 | 708 |
| Median Property Value | $97,900 | $112,600 |
| Median Household Income | $56,205 | $68 |
| Monthly Housing Costs | $534 | $0 |
| Real Estate Taxes | $3,213 | $7 |
Property Value by Mortgage Status in Lyncourt
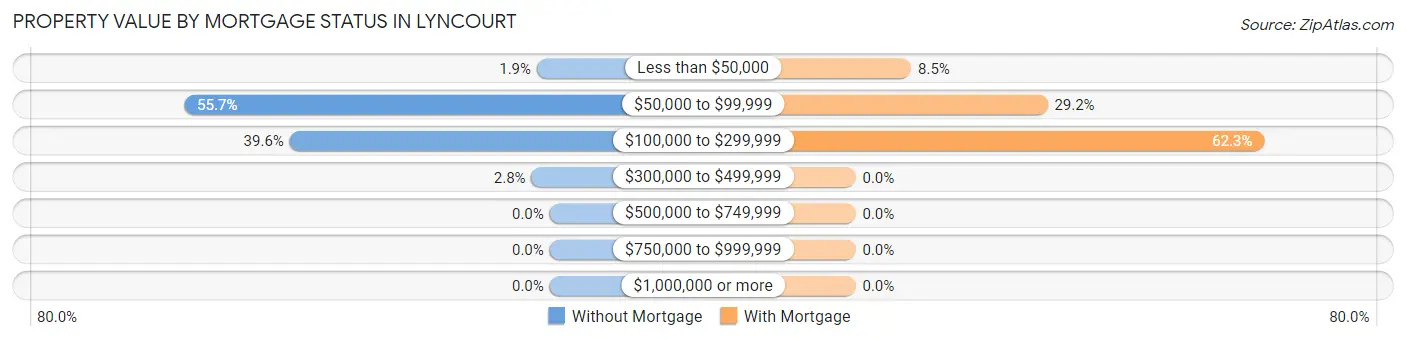
| Property Value | Without Mortgage | With Mortgage |
| Less than $50,000 | 7 (1.9%) | 60 (8.5%) |
| $50,000 to $99,999 | 201 (55.7%) | 207 (29.2%) |
| $100,000 to $299,999 | 143 (39.6%) | 441 (62.3%) |
| $300,000 to $499,999 | 10 (2.8%) | 0 (0.0%) |
| $500,000 to $749,999 | 0 (0.0%) | 0 (0.0%) |
| $750,000 to $999,999 | 0 (0.0%) | 0 (0.0%) |
| $1,000,000 or more | 0 (0.0%) | 0 (0.0%) |
| Total | 361 (100.0%) | 708 (100.0%) |
Household Income by Mortgage Status in Lyncourt
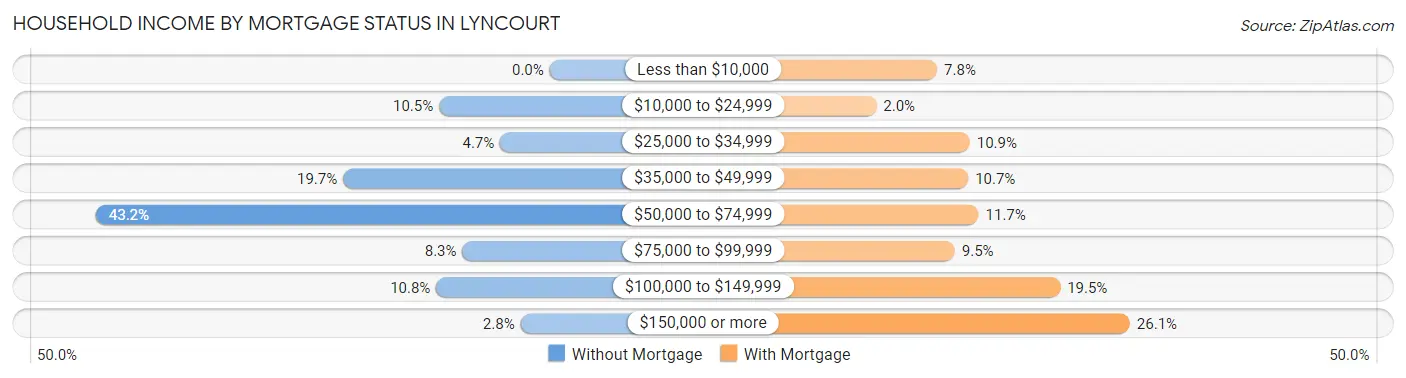
| Household Income | Without Mortgage | With Mortgage |
| Less than $10,000 | 0 (0.0%) | 55 (7.8%) |
| $10,000 to $24,999 | 38 (10.5%) | 14 (2.0%) |
| $25,000 to $34,999 | 17 (4.7%) | 77 (10.9%) |
| $35,000 to $49,999 | 71 (19.7%) | 76 (10.7%) |
| $50,000 to $74,999 | 156 (43.2%) | 83 (11.7%) |
| $75,000 to $99,999 | 30 (8.3%) | 67 (9.5%) |
| $100,000 to $149,999 | 39 (10.8%) | 138 (19.5%) |
| $150,000 or more | 10 (2.8%) | 185 (26.1%) |
| Total | 361 (100.0%) | 708 (100.0%) |
Property Value to Household Income Ratio in Lyncourt
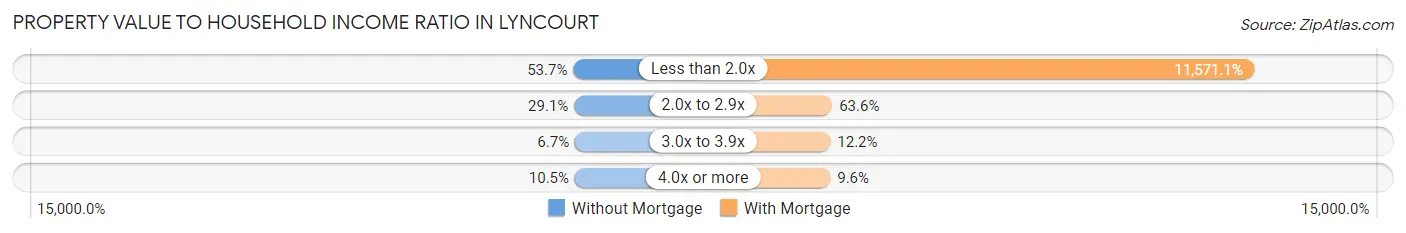
| Value-to-Income Ratio | Without Mortgage | With Mortgage |
| Less than 2.0x | 194 (53.7%) | 81,923 (11,571.0%) |
| 2.0x to 2.9x | 105 (29.1%) | 450 (63.6%) |
| 3.0x to 3.9x | 24 (6.7%) | 86 (12.1%) |
| 4.0x or more | 38 (10.5%) | 68 (9.6%) |
| Total | 361 (100.0%) | 708 (100.0%) |
Real Estate Taxes by Mortgage Status in Lyncourt
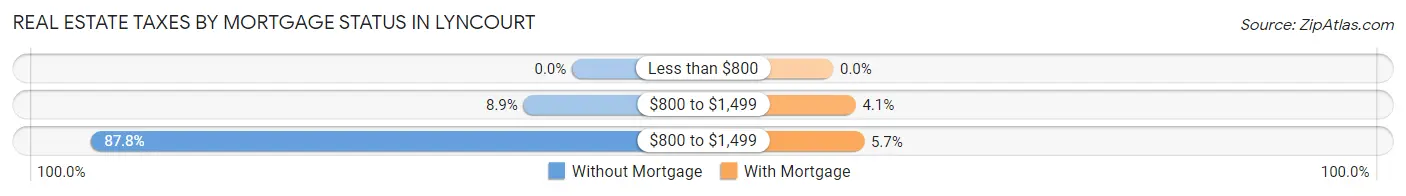
| Property Taxes | Without Mortgage | With Mortgage |
| Less than $800 | 0 (0.0%) | 0 (0.0%) |
| $800 to $1,499 | 32 (8.9%) | 29 (4.1%) |
| $800 to $1,499 | 317 (87.8%) | 40 (5.7%) |
| Total | 361 (100.0%) | 708 (100.0%) |
Health & Disability in Lyncourt
Health Insurance Coverage by Age in Lyncourt
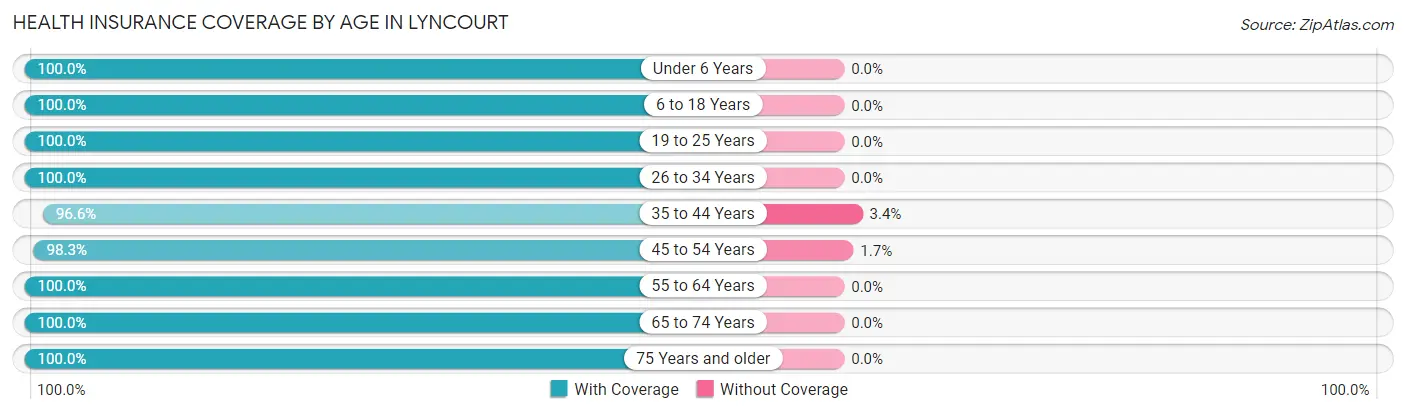
| Age Bracket | With Coverage | Without Coverage |
| Under 6 Years | 372 (100.0%) | 0 (0.0%) |
| 6 to 18 Years | 612 (100.0%) | 0 (0.0%) |
| 19 to 25 Years | 364 (100.0%) | 0 (0.0%) |
| 26 to 34 Years | 489 (100.0%) | 0 (0.0%) |
| 35 to 44 Years | 339 (96.6%) | 12 (3.4%) |
| 45 to 54 Years | 519 (98.3%) | 9 (1.7%) |
| 55 to 64 Years | 627 (100.0%) | 0 (0.0%) |
| 65 to 74 Years | 394 (100.0%) | 0 (0.0%) |
| 75 Years and older | 180 (100.0%) | 0 (0.0%) |
| Total | 3,896 (99.5%) | 21 (0.5%) |
Health Insurance Coverage by Citizenship Status in Lyncourt
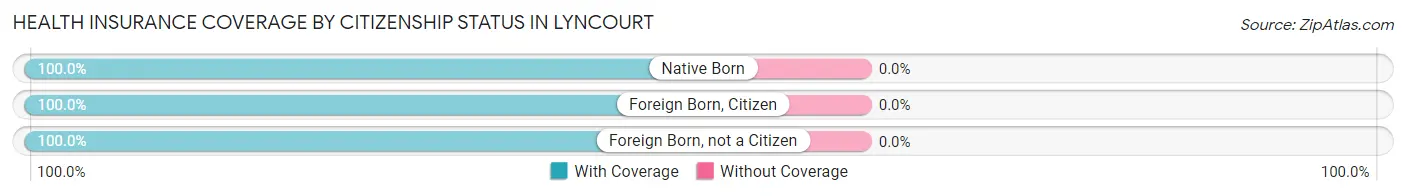
| Citizenship Status | With Coverage | Without Coverage |
| Native Born | 372 (100.0%) | 0 (0.0%) |
| Foreign Born, Citizen | 612 (100.0%) | 0 (0.0%) |
| Foreign Born, not a Citizen | 364 (100.0%) | 0 (0.0%) |
Health Insurance Coverage by Household Income in Lyncourt
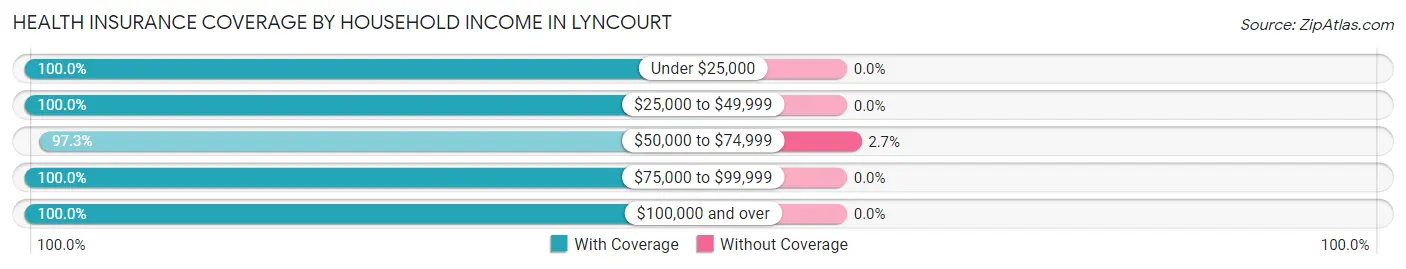
| Household Income | With Coverage | Without Coverage |
| Under $25,000 | 620 (100.0%) | 0 (0.0%) |
| $25,000 to $49,999 | 786 (100.0%) | 0 (0.0%) |
| $50,000 to $74,999 | 753 (97.3%) | 21 (2.7%) |
| $75,000 to $99,999 | 908 (100.0%) | 0 (0.0%) |
| $100,000 and over | 818 (100.0%) | 0 (0.0%) |
Public vs Private Health Insurance Coverage by Age in Lyncourt
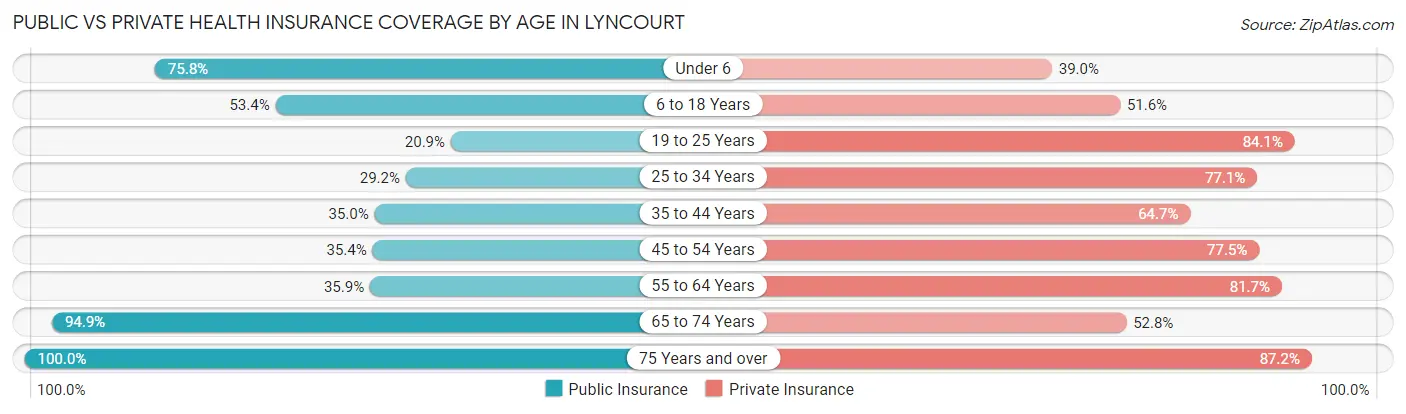
| Age Bracket | Public Insurance | Private Insurance |
| Under 6 | 282 (75.8%) | 145 (39.0%) |
| 6 to 18 Years | 327 (53.4%) | 316 (51.6%) |
| 19 to 25 Years | 76 (20.9%) | 306 (84.1%) |
| 25 to 34 Years | 143 (29.2%) | 377 (77.1%) |
| 35 to 44 Years | 123 (35.0%) | 227 (64.7%) |
| 45 to 54 Years | 187 (35.4%) | 409 (77.5%) |
| 55 to 64 Years | 225 (35.9%) | 512 (81.7%) |
| 65 to 74 Years | 374 (94.9%) | 208 (52.8%) |
| 75 Years and over | 180 (100.0%) | 157 (87.2%) |
| Total | 1,917 (48.9%) | 2,657 (67.8%) |
Disability Status by Sex by Age in Lyncourt
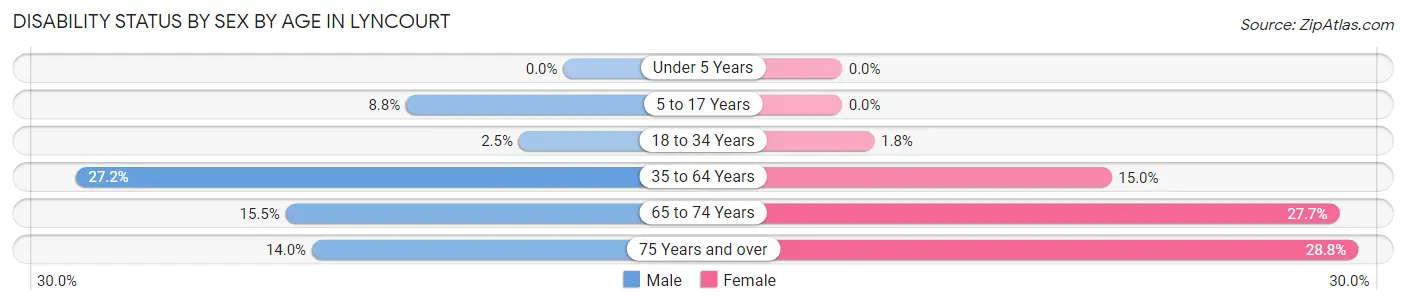
| Age Bracket | Male | Female |
| Under 5 Years | 0 (0.0%) | 0 (0.0%) |
| 5 to 17 Years | 29 (8.8%) | 0 (0.0%) |
| 18 to 34 Years | 12 (2.5%) | 7 (1.8%) |
| 35 to 64 Years | 172 (27.2%) | 131 (15.0%) |
| 65 to 74 Years | 28 (15.5%) | 59 (27.7%) |
| 75 Years and over | 14 (14.0%) | 23 (28.7%) |
Disability Class by Sex by Age in Lyncourt
Disability Class: Hearing Difficulty
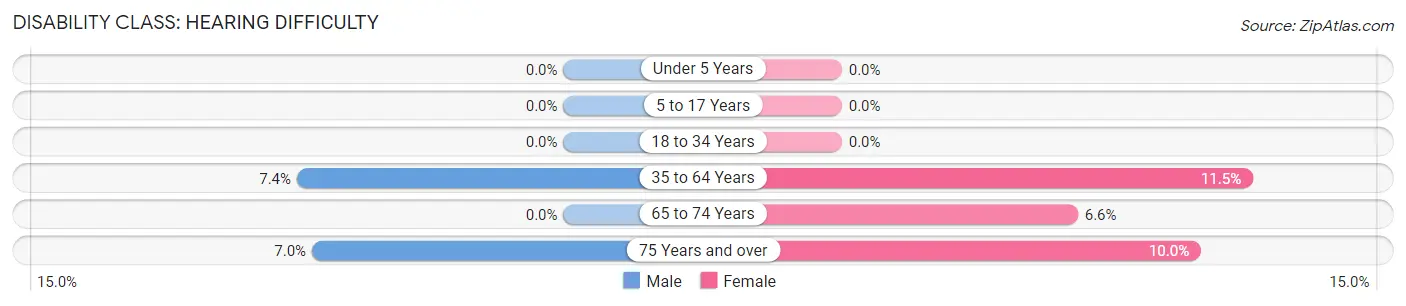
| Age Bracket | Male | Female |
| Under 5 Years | 0 (0.0%) | 0 (0.0%) |
| 5 to 17 Years | 0 (0.0%) | 0 (0.0%) |
| 18 to 34 Years | 0 (0.0%) | 0 (0.0%) |
| 35 to 64 Years | 47 (7.4%) | 100 (11.5%) |
| 65 to 74 Years | 0 (0.0%) | 14 (6.6%) |
| 75 Years and over | 7 (7.0%) | 8 (10.0%) |
Disability Class: Vision Difficulty
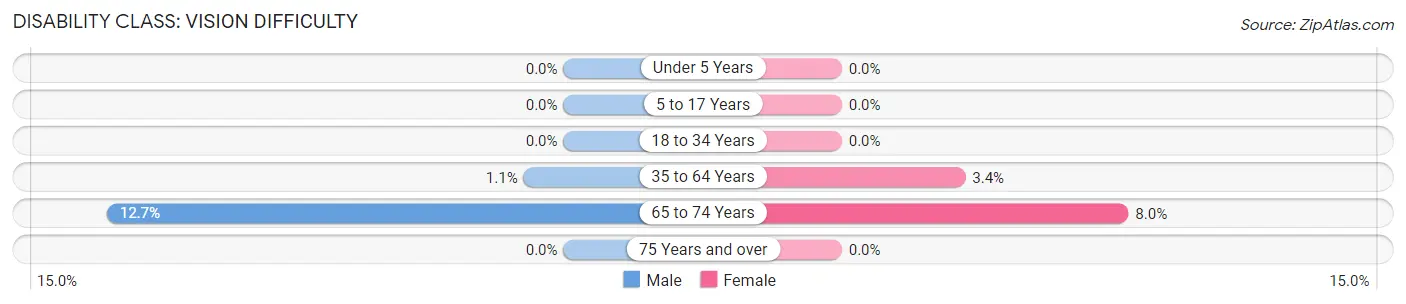
| Age Bracket | Male | Female |
| Under 5 Years | 0 (0.0%) | 0 (0.0%) |
| 5 to 17 Years | 0 (0.0%) | 0 (0.0%) |
| 18 to 34 Years | 0 (0.0%) | 0 (0.0%) |
| 35 to 64 Years | 7 (1.1%) | 30 (3.4%) |
| 65 to 74 Years | 23 (12.7%) | 17 (8.0%) |
| 75 Years and over | 0 (0.0%) | 0 (0.0%) |
Disability Class: Cognitive Difficulty
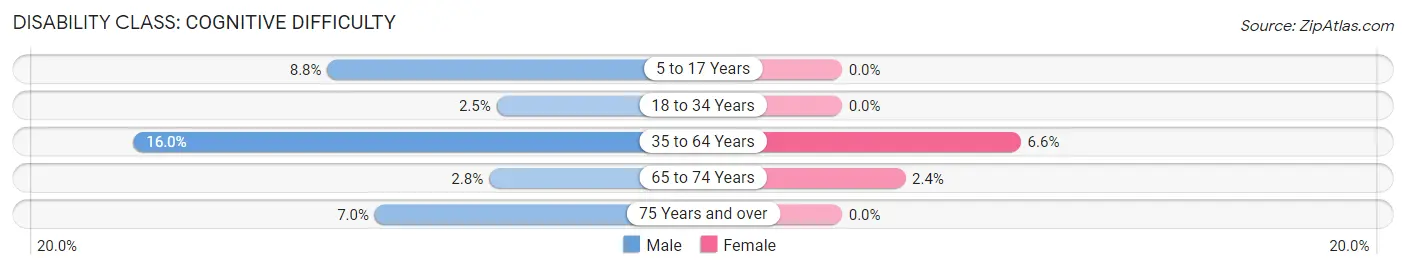
| Age Bracket | Male | Female |
| 5 to 17 Years | 29 (8.8%) | 0 (0.0%) |
| 18 to 34 Years | 12 (2.5%) | 0 (0.0%) |
| 35 to 64 Years | 101 (16.0%) | 58 (6.6%) |
| 65 to 74 Years | 5 (2.8%) | 5 (2.4%) |
| 75 Years and over | 7 (7.0%) | 0 (0.0%) |
Disability Class: Ambulatory Difficulty
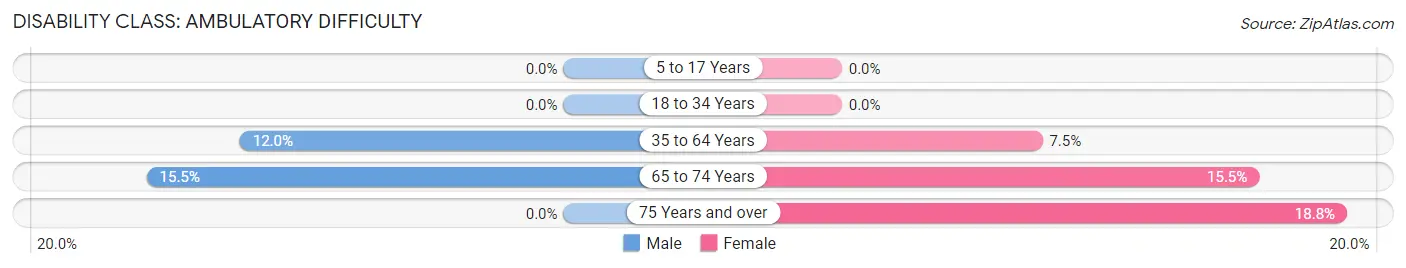
| Age Bracket | Male | Female |
| 5 to 17 Years | 0 (0.0%) | 0 (0.0%) |
| 18 to 34 Years | 0 (0.0%) | 0 (0.0%) |
| 35 to 64 Years | 76 (12.0%) | 65 (7.4%) |
| 65 to 74 Years | 28 (15.5%) | 33 (15.5%) |
| 75 Years and over | 0 (0.0%) | 15 (18.8%) |
Disability Class: Self-Care Difficulty
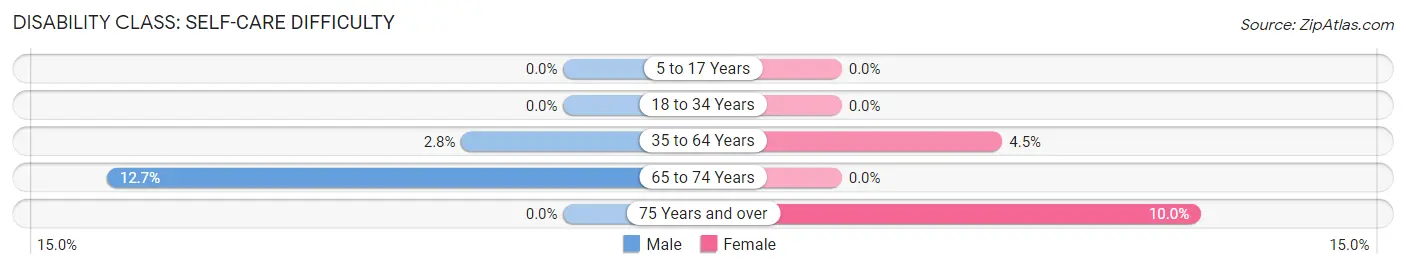
| Age Bracket | Male | Female |
| 5 to 17 Years | 0 (0.0%) | 0 (0.0%) |
| 18 to 34 Years | 0 (0.0%) | 0 (0.0%) |
| 35 to 64 Years | 18 (2.8%) | 39 (4.5%) |
| 65 to 74 Years | 23 (12.7%) | 0 (0.0%) |
| 75 Years and over | 0 (0.0%) | 8 (10.0%) |
Technology Access in Lyncourt
Computing Device Access in Lyncourt
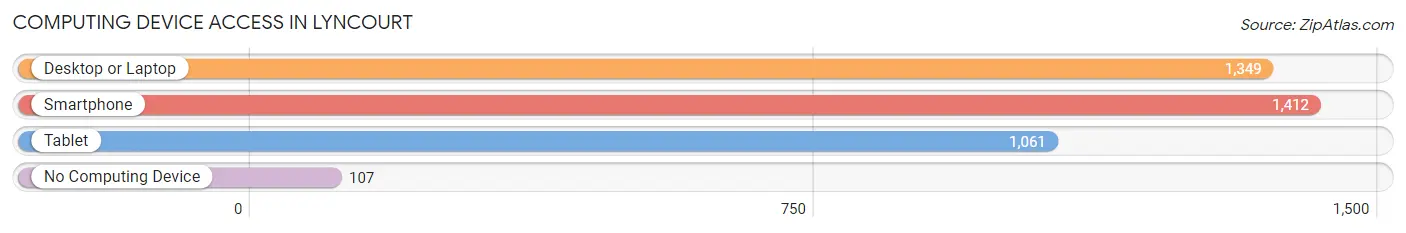
| Device Type | # Households | % Households |
| Desktop or Laptop | 1,349 | 80.4% |
| Smartphone | 1,412 | 84.2% |
| Tablet | 1,061 | 63.3% |
| No Computing Device | 107 | 6.4% |
| Total | 1,677 | 100.0% |
Internet Access in Lyncourt
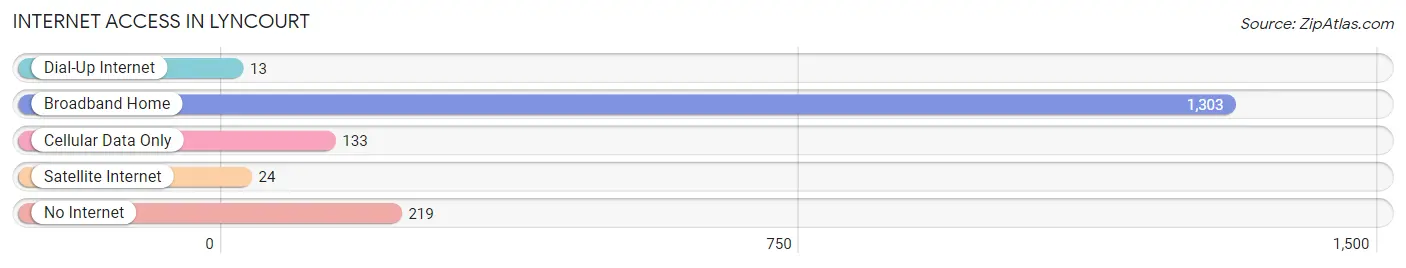
| Internet Type | # Households | % Households |
| Dial-Up Internet | 13 | 0.8% |
| Broadband Home | 1,303 | 77.7% |
| Cellular Data Only | 133 | 7.9% |
| Satellite Internet | 24 | 1.4% |
| No Internet | 219 | 13.1% |
| Total | 1,677 | 100.0% |
Lyncourt Summary
Lyncourt is a small village located in Onondaga County, New York. It is a suburb of Syracuse and is part of the Syracuse Metropolitan Statistical Area. The village is located on the east side of the city and is bordered by the towns of Salina, Geddes, and Onondaga. The population of Lyncourt was 2,845 at the 2010 census.
History
Lyncourt was originally part of the Onondaga Nation, a member of the Iroquois Confederacy. The area was settled by Europeans in the late 18th century and was known as the “Lyncourt Settlement”. The village was incorporated in 1848 and was named after the Lyncourt family, who were early settlers in the area.
In the late 19th century, Lyncourt was a thriving industrial center. The village was home to several factories, including the Lyncourt Iron Works, which produced stoves, and the Lyncourt Foundry, which produced cast iron products. The village also had several stores, a post office, and a school.
In the early 20th century, the village began to decline as industry moved away. The Lyncourt Iron Works closed in the 1920s and the Lyncourt Foundry closed in the 1940s. The village was also affected by the Great Depression and World War II.
Geography
Lyncourt is located at 43°3'25" North, 76°7'45" West (43.056944, -76.129028). The village is situated on the east side of Syracuse, near the Onondaga Creek. The total area of the village is 0.7 square miles, all of which is land.
Economy
Lyncourt’s economy is largely based on services and retail. The village is home to several small businesses, including restaurants, convenience stores, and auto repair shops. The village also has a few manufacturing companies, including a plastics factory and a metal fabrication plant.
Demographics
As of the 2010 census, the population of Lyncourt was 2,845. The racial makeup of the village was 94.3% White, 2.2% African American, 0.7% Native American, 0.7% Asian, 0.2% Pacific Islander, and 1.9% from other races. Hispanic or Latino of any race were 3.2% of the population.
The median household income in Lyncourt was $41,944 in 2010. The per capita income was $20,945. About 11.2% of the population was below the poverty line.
The village is served by the Lyncourt Union Free School District. The district has one elementary school and one middle school. The village is also home to several churches, including the Lyncourt United Methodist Church and the Lyncourt Presbyterian Church.
Common Questions
What is Per Capita Income in Lyncourt?
Per Capita income in Lyncourt is $28,487.
What is the Median Family Income in Lyncourt?
Median Family Income in Lyncourt is $66,607.
What is the Median Household income in Lyncourt?
Median Household Income in Lyncourt is $57,845.
What is Income or Wage Gap in Lyncourt?
Income or Wage Gap in Lyncourt is 24.0%.
Women in Lyncourt earn 76.0 cents for every dollar earned by a man.
What is Inequality or Gini Index in Lyncourt?
Inequality or Gini Index in Lyncourt is 0.35.
What is the Total Population of Lyncourt?
Total Population of Lyncourt is 3,917.
What is the Total Male Population of Lyncourt?
Total Male Population of Lyncourt is 1,914.
What is the Total Female Population of Lyncourt?
Total Female Population of Lyncourt is 2,003.
What is the Ratio of Males per 100 Females in Lyncourt?
There are 95.56 Males per 100 Females in Lyncourt.
What is the Ratio of Females per 100 Males in Lyncourt?
There are 104.65 Females per 100 Males in Lyncourt.
What is the Median Population Age in Lyncourt?
Median Population Age in Lyncourt is 39.1 Years.
What is the Average Family Size in Lyncourt
Average Family Size in Lyncourt is 3.3 People.
What is the Average Household Size in Lyncourt
Average Household Size in Lyncourt is 2.3 People.
How Large is the Labor Force in Lyncourt?
There are 2,052 People in the Labor Forcein in Lyncourt.
What is the Percentage of People in the Labor Force in Lyncourt?
67.1% of People are in the Labor Force in Lyncourt.
What is the Unemployment Rate in Lyncourt?
Unemployment Rate in Lyncourt is 1.6%.