East Kingston, NY Map & Demographics
East Kingston Map
East Kingston Overview
$22,388
PER CAPITA INCOME
$37,244
AVG FAMILY INCOME
$46,250
AVG HOUSEHOLD INCOME
93.1%
WAGE / INCOME GAP [ % ]
6.9¢/ $1
WAGE / INCOME GAP [ $ ]
0.36
INEQUALITY / GINI INDEX
326
TOTAL POPULATION
160
MALE POPULATION
166
FEMALE POPULATION
96.39
MALES / 100 FEMALES
103.75
FEMALES / 100 MALES
47.0
MEDIAN AGE
2.4
AVG FAMILY SIZE
2.6
AVG HOUSEHOLD SIZE
233
LABOR FORCE [ PEOPLE ]
87.9%
PERCENT IN LABOR FORCE
22.7%
UNEMPLOYMENT RATE
Income in East Kingston
Income Overview in East Kingston
Per Capita Income in East Kingston is $22,388, while median incomes of families and households are $37,244 and $46,250 respectively.
| Characteristic | Number | Measure |
| Per Capita Income | 326 | $22,388 |
| Median Family Income | 98 | $37,244 |
| Mean Family Income | 98 | $51,846 |
| Median Household Income | 124 | $46,250 |
| Mean Household Income | 124 | $59,006 |
| Income Deficit | 98 | $0 |
| Wage / Income Gap (%) | 326 | 93.05% |
| Wage / Income Gap ($) | 326 | 6.95¢ per $1 |
| Gini / Inequality Index | 326 | 0.36 |
Earnings by Sex in East Kingston
Average Earnings in East Kingston are $35,256, $2,499 for men and $35,962 for women, a difference of 93.0%.
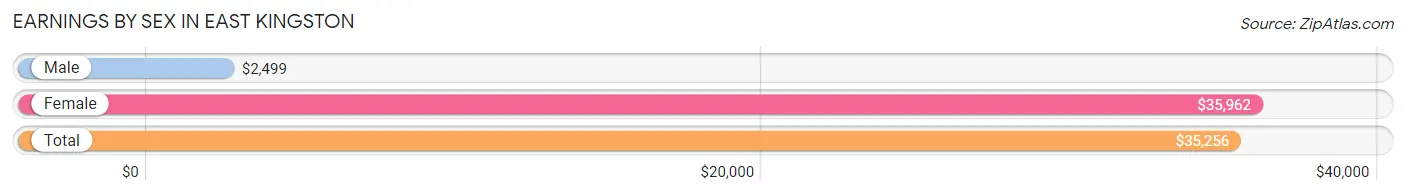
| Sex | Number | Average Earnings |
| Male | 38 (21.1%) | $2,499 |
| Female | 142 (78.9%) | $35,962 |
| Total | 180 (100.0%) | $35,256 |
Earnings by Sex by Income Bracket in East Kingston
The most common earnings brackets in East Kingston are $2,499 or less for men (24 | 63.2%) and $35,000 to $39,999 for women (39 | 27.5%).
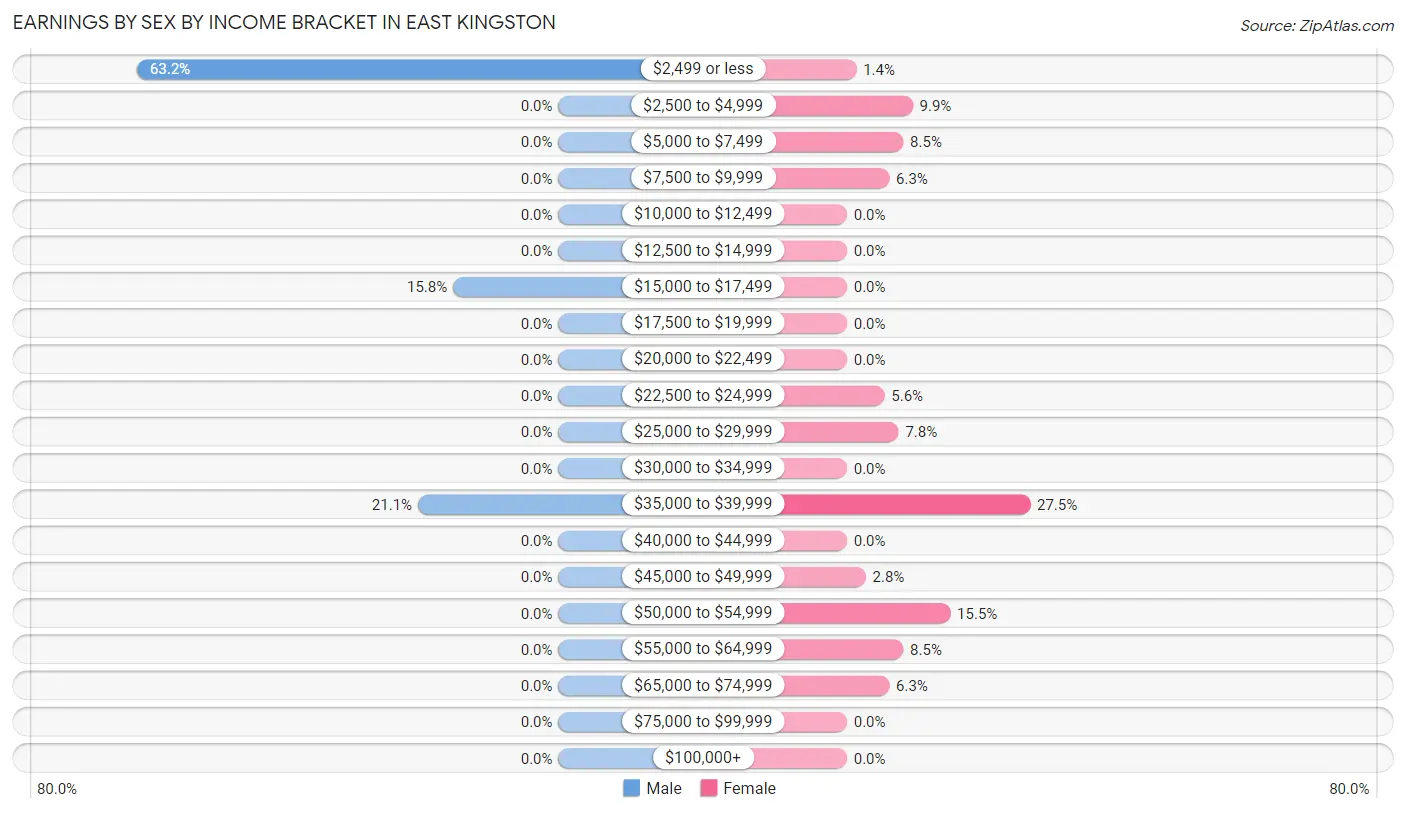
| Income | Male | Female |
| $2,499 or less | 24 (63.2%) | 2 (1.4%) |
| $2,500 to $4,999 | 0 (0.0%) | 14 (9.9%) |
| $5,000 to $7,499 | 0 (0.0%) | 12 (8.5%) |
| $7,500 to $9,999 | 0 (0.0%) | 9 (6.3%) |
| $10,000 to $12,499 | 0 (0.0%) | 0 (0.0%) |
| $12,500 to $14,999 | 0 (0.0%) | 0 (0.0%) |
| $15,000 to $17,499 | 6 (15.8%) | 0 (0.0%) |
| $17,500 to $19,999 | 0 (0.0%) | 0 (0.0%) |
| $20,000 to $22,499 | 0 (0.0%) | 0 (0.0%) |
| $22,500 to $24,999 | 0 (0.0%) | 8 (5.6%) |
| $25,000 to $29,999 | 0 (0.0%) | 11 (7.7%) |
| $30,000 to $34,999 | 0 (0.0%) | 0 (0.0%) |
| $35,000 to $39,999 | 8 (21.0%) | 39 (27.5%) |
| $40,000 to $44,999 | 0 (0.0%) | 0 (0.0%) |
| $45,000 to $49,999 | 0 (0.0%) | 4 (2.8%) |
| $50,000 to $54,999 | 0 (0.0%) | 22 (15.5%) |
| $55,000 to $64,999 | 0 (0.0%) | 12 (8.5%) |
| $65,000 to $74,999 | 0 (0.0%) | 9 (6.3%) |
| $75,000 to $99,999 | 0 (0.0%) | 0 (0.0%) |
| $100,000+ | 0 (0.0%) | 0 (0.0%) |
| Total | 38 (100.0%) | 142 (100.0%) |
Earnings by Sex by Educational Attainment in East Kingston
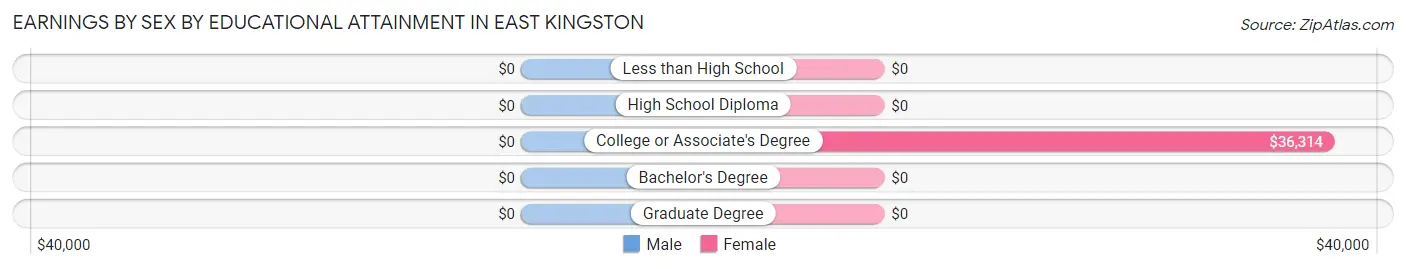
| Educational Attainment | Male Income | Female Income |
| Less than High School | - | - |
| High School Diploma | - | - |
| College or Associate's Degree | - | - |
| Bachelor's Degree | - | - |
| Graduate Degree | - | - |
| Total | $2,499 | $36,346 |
Family Income in East Kingston
Family Income Brackets in East Kingston
According to the East Kingston family income data, there are 41 families falling into the $35,000 to $49,999 income range, which is the most common income bracket and makes up 41.8% of all families.
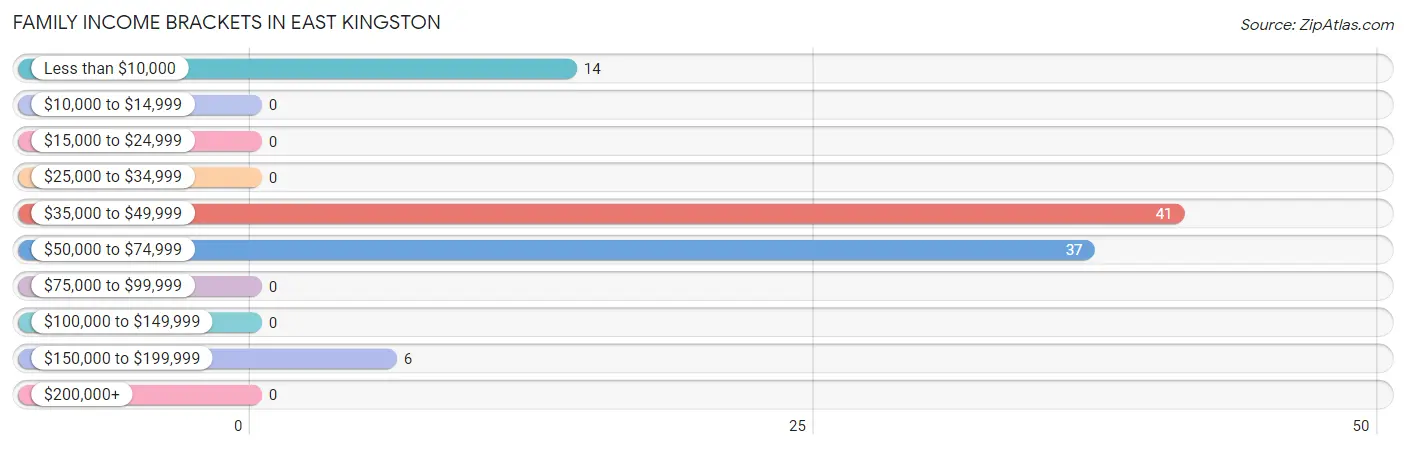
| Income Bracket | # Families | % Families |
| Less than $10,000 | 14 | 14.3% |
| $10,000 to $14,999 | 0 | 0.0% |
| $15,000 to $24,999 | 0 | 0.0% |
| $25,000 to $34,999 | 0 | 0.0% |
| $35,000 to $49,999 | 41 | 41.8% |
| $50,000 to $74,999 | 37 | 37.8% |
| $75,000 to $99,999 | 0 | 0.0% |
| $100,000 to $149,999 | 0 | 0.0% |
| $150,000 to $199,999 | 6 | 6.1% |
| $200,000+ | 0 | 0.0% |
Family Income by Famaliy Size in East Kingston
2-person families (40 | 40.8%) account for the highest median family income in East Kingston with $62,083 per family, while 2-person families (40 | 40.8%) have the highest median income of $31,042 per family member.
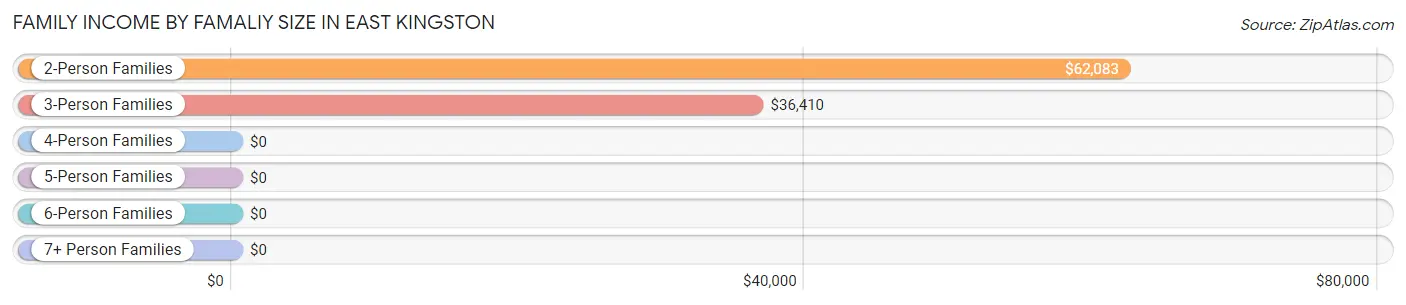
| Income Bracket | # Families | Median Income |
| 2-Person Families | 40 (40.8%) | $62,083 |
| 3-Person Families | 44 (44.9%) | $36,410 |
| 4-Person Families | 14 (14.3%) | $0 |
| 5-Person Families | 0 (0.0%) | $0 |
| 6-Person Families | 0 (0.0%) | $0 |
| 7+ Person Families | 0 (0.0%) | $0 |
| Total | 98 (100.0%) | $37,244 |
Family Income by Number of Earners in East Kingston

| Number of Earners | # Families | Median Income |
| No Earners | 0 (0.0%) | $0 |
| 1 Earner | 29 (29.6%) | $0 |
| 2 Earners | 69 (70.4%) | $0 |
| 3+ Earners | 0 (0.0%) | $0 |
| Total | 98 (100.0%) | $37,244 |
Household Income in East Kingston
Household Income Brackets in East Kingston
With 41 households falling in the category, the $35,000 to $49,999 income range is the most frequent in East Kingston, accounting for 33.1% of all households.
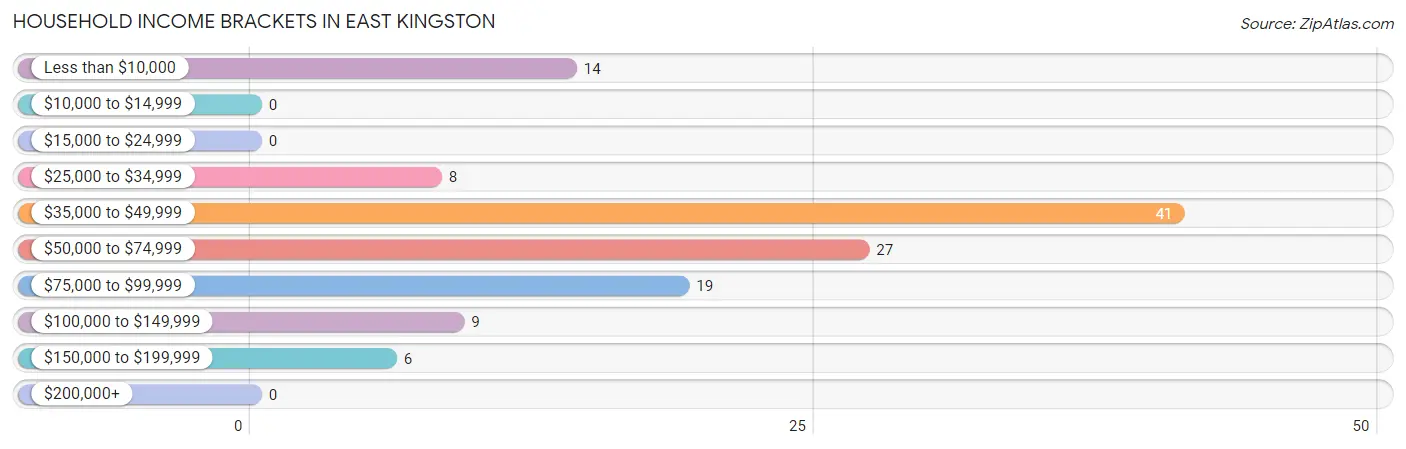
| Income Bracket | # Households | % Households |
| Less than $10,000 | 14 | 11.3% |
| $10,000 to $14,999 | 0 | 0.0% |
| $15,000 to $24,999 | 0 | 0.0% |
| $25,000 to $34,999 | 8 | 6.5% |
| $35,000 to $49,999 | 41 | 33.1% |
| $50,000 to $74,999 | 27 | 21.8% |
| $75,000 to $99,999 | 19 | 15.3% |
| $100,000 to $149,999 | 9 | 7.3% |
| $150,000 to $199,999 | 6 | 4.8% |
| $200,000+ | 0 | 0.0% |
Household Income by Householder Age in East Kingston
The median household income in East Kingston is $46,250, with the highest median household income of $91,111 found in the 65+ years age bracket for the primary householder. A total of 28 households (22.6%) fall into this category.
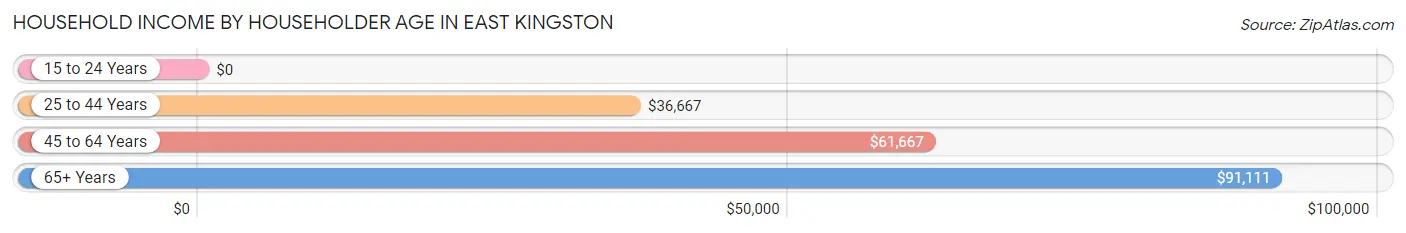
| Income Bracket | # Households | Median Income |
| 15 to 24 Years | 0 (0.0%) | $0 |
| 25 to 44 Years | 52 (41.9%) | $36,667 |
| 45 to 64 Years | 44 (35.5%) | $61,667 |
| 65+ Years | 28 (22.6%) | $91,111 |
| Total | 124 (100.0%) | $46,250 |
Poverty in East Kingston
Income Below Poverty by Sex and Age in East Kingston
With 49.4% poverty level for males and 16.9% for females among the residents of East Kingston, 55 to 64 year old males and under 5 year old females are the most vulnerable to poverty, with 14 males (100.0%) and 14 females (100.0%) in their respective age groups living below the poverty level.
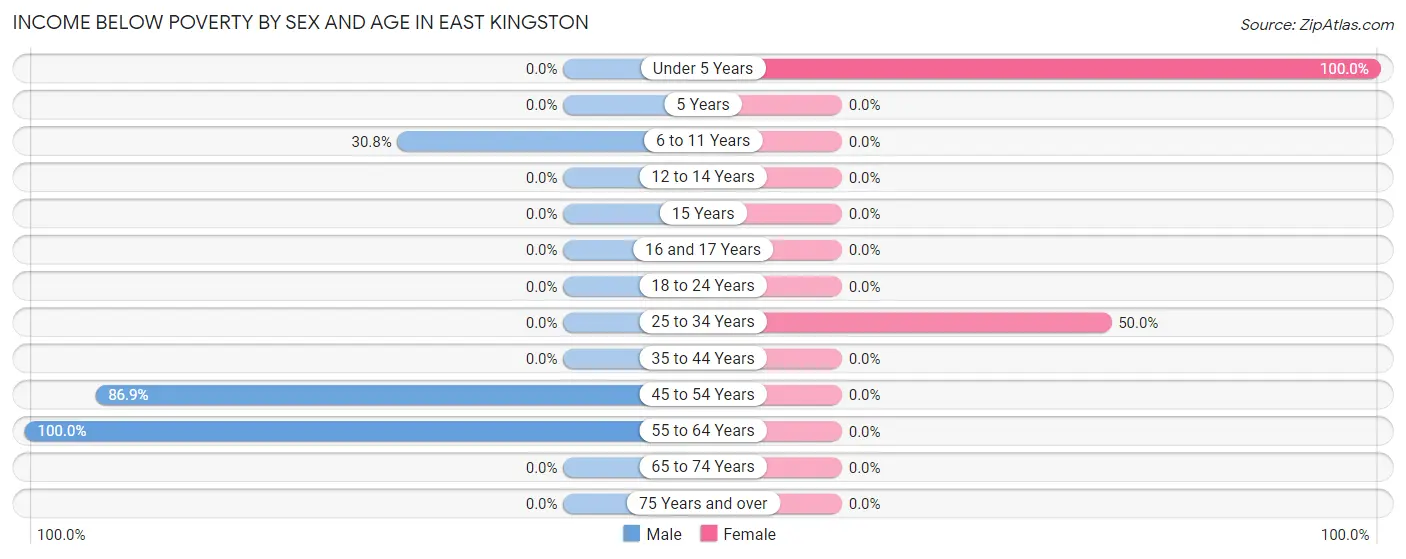
| Age Bracket | Male | Female |
| Under 5 Years | 0 (0.0%) | 14 (100.0%) |
| 5 Years | 0 (0.0%) | 0 (0.0%) |
| 6 to 11 Years | 12 (30.8%) | 0 (0.0%) |
| 12 to 14 Years | 0 (0.0%) | 0 (0.0%) |
| 15 Years | 0 (0.0%) | 0 (0.0%) |
| 16 and 17 Years | 0 (0.0%) | 0 (0.0%) |
| 18 to 24 Years | 0 (0.0%) | 0 (0.0%) |
| 25 to 34 Years | 0 (0.0%) | 14 (50.0%) |
| 35 to 44 Years | 0 (0.0%) | 0 (0.0%) |
| 45 to 54 Years | 53 (86.9%) | 0 (0.0%) |
| 55 to 64 Years | 14 (100.0%) | 0 (0.0%) |
| 65 to 74 Years | 0 (0.0%) | 0 (0.0%) |
| 75 Years and over | 0 (0.0%) | 0 (0.0%) |
| Total | 79 (49.4%) | 28 (16.9%) |
Income Above Poverty by Sex and Age in East Kingston
According to the poverty statistics in East Kingston, males aged 12 to 14 years and females aged 18 to 24 years are the age groups that are most secure financially, with 100.0% of males and 100.0% of females in these age groups living above the poverty line.
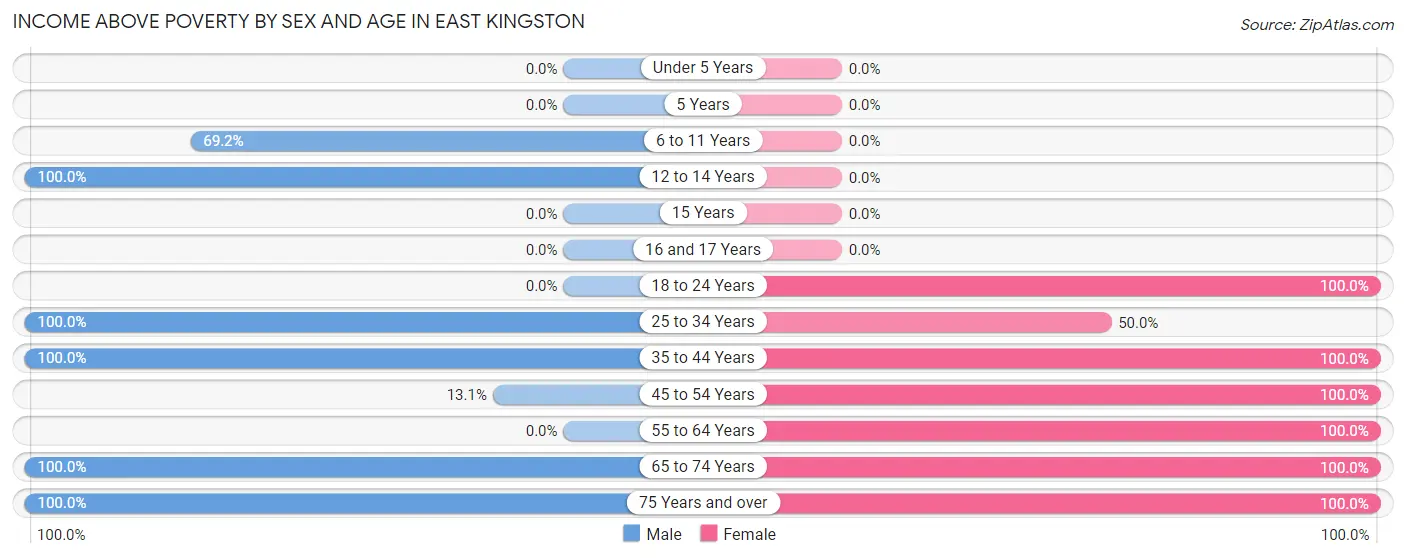
| Age Bracket | Male | Female |
| Under 5 Years | 0 (0.0%) | 0 (0.0%) |
| 5 Years | 0 (0.0%) | 0 (0.0%) |
| 6 to 11 Years | 27 (69.2%) | 0 (0.0%) |
| 12 to 14 Years | 8 (100.0%) | 0 (0.0%) |
| 15 Years | 0 (0.0%) | 0 (0.0%) |
| 16 and 17 Years | 0 (0.0%) | 0 (0.0%) |
| 18 to 24 Years | 0 (0.0%) | 12 (100.0%) |
| 25 to 34 Years | 6 (100.0%) | 14 (50.0%) |
| 35 to 44 Years | 3 (100.0%) | 52 (100.0%) |
| 45 to 54 Years | 8 (13.1%) | 20 (100.0%) |
| 55 to 64 Years | 0 (0.0%) | 12 (100.0%) |
| 65 to 74 Years | 24 (100.0%) | 26 (100.0%) |
| 75 Years and over | 5 (100.0%) | 2 (100.0%) |
| Total | 81 (50.6%) | 138 (83.1%) |
Income Below Poverty Among Married-Couple Families in East Kingston
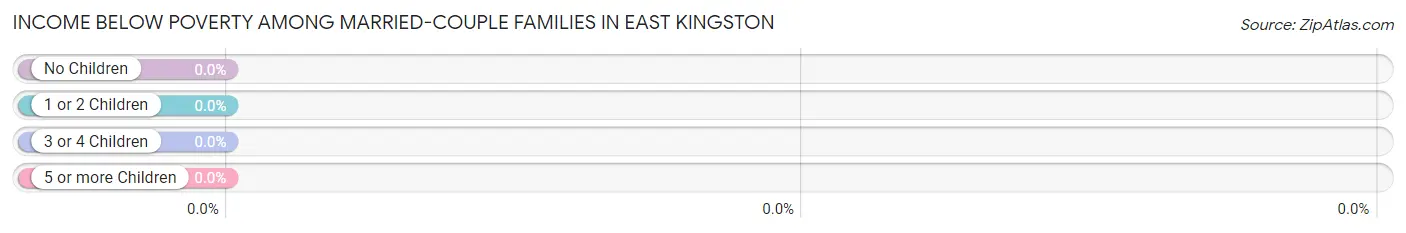
| Children | Above Poverty | Below Poverty |
| No Children | 13 (100.0%) | 0 (0.0%) |
| 1 or 2 Children | 0 (0.0%) | 0 (0.0%) |
| 3 or 4 Children | 0 (0.0%) | 0 (0.0%) |
| 5 or more Children | 0 (0.0%) | 0 (0.0%) |
| Total | 13 (100.0%) | 0 (0.0%) |
Income Below Poverty Among Single-Parent Households in East Kingston
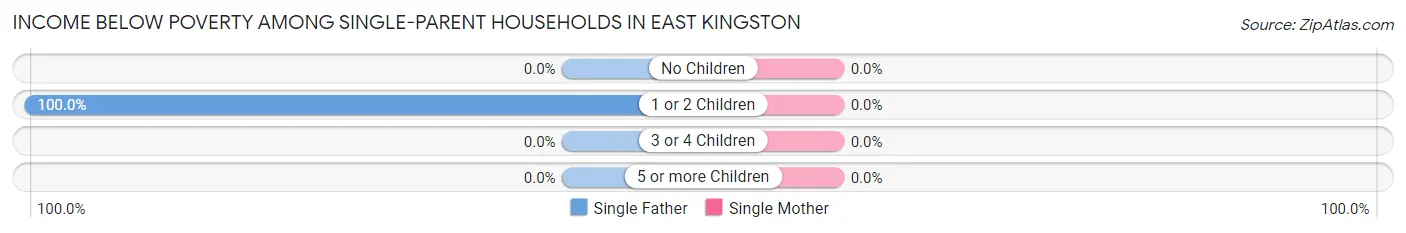
| Children | Single Father | Single Mother |
| No Children | 0 (0.0%) | 0 (0.0%) |
| 1 or 2 Children | 14 (100.0%) | 0 (0.0%) |
| 3 or 4 Children | 0 (0.0%) | 0 (0.0%) |
| 5 or more Children | 0 (0.0%) | 0 (0.0%) |
| Total | 14 (100.0%) | 0 (0.0%) |
Income Below Poverty Among Married-Couple vs Single-Parent Households in East Kingston
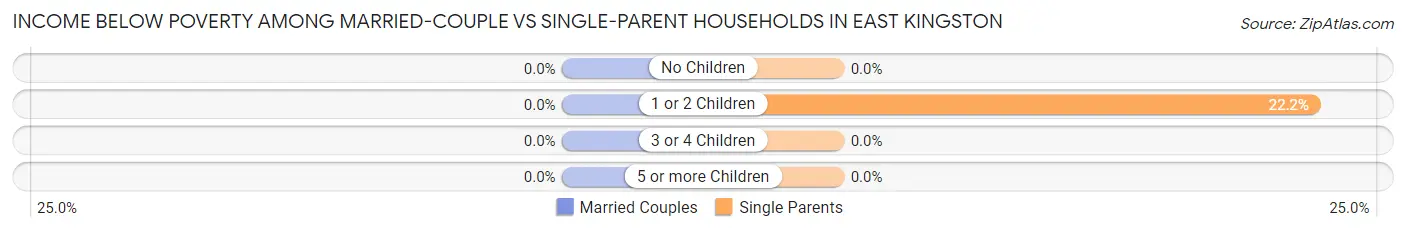
| Children | Married-Couple Families | Single-Parent Households |
| No Children | 0 (0.0%) | 0 (0.0%) |
| 1 or 2 Children | 0 (0.0%) | 14 (22.2%) |
| 3 or 4 Children | 0 (0.0%) | 0 (0.0%) |
| 5 or more Children | 0 (0.0%) | 0 (0.0%) |
| Total | 0 (0.0%) | 14 (16.5%) |
Race in East Kingston
The most populous races in East Kingston are White / Caucasian (145 | 44.5%), Two or more Races (78 | 23.9%), and Black / African American (77 | 23.6%).
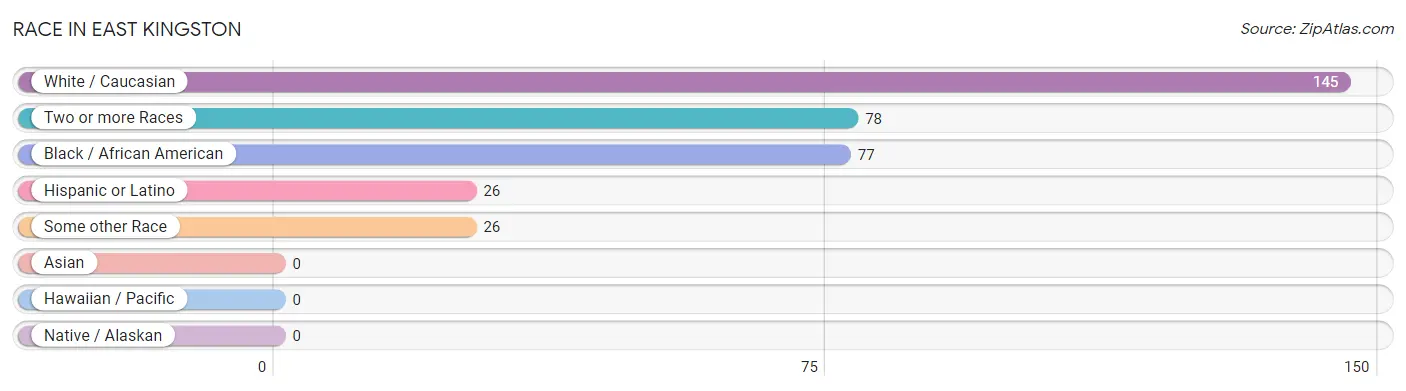
| Race | # Population | % Population |
| Asian | 0 | 0.0% |
| Black / African American | 77 | 23.6% |
| Hawaiian / Pacific | 0 | 0.0% |
| Hispanic or Latino | 26 | 8.0% |
| Native / Alaskan | 0 | 0.0% |
| White / Caucasian | 145 | 44.5% |
| Two or more Races | 78 | 23.9% |
| Some other Race | 26 | 8.0% |
| Total | 326 | 100.0% |
Ancestry in East Kingston
The most populous ancestries reported in East Kingston are Jamaican (90 | 27.6%), Haitian (66 | 20.3%), German (61 | 18.7%), West Indian (53 | 16.3%), and Italian (46 | 14.1%), together accounting for 96.9% of all East Kingston residents.
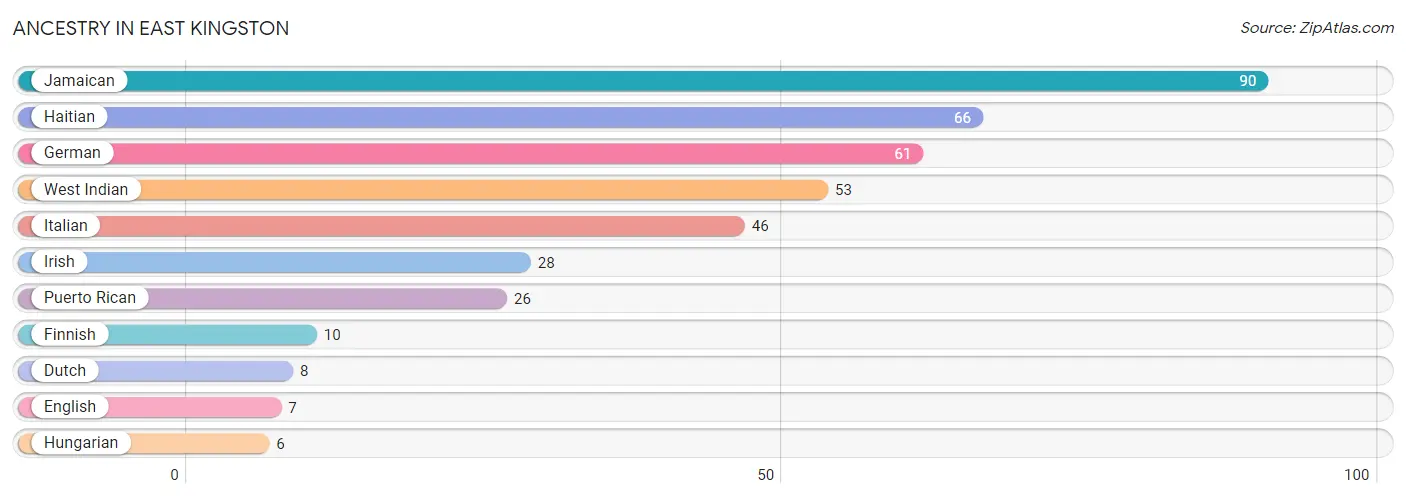
| Ancestry | # Population | % Population |
| Dutch | 8 | 2.5% |
| English | 7 | 2.1% |
| Finnish | 10 | 3.1% |
| German | 61 | 18.7% |
| Haitian | 66 | 20.3% |
| Hungarian | 6 | 1.8% |
| Irish | 28 | 8.6% |
| Italian | 46 | 14.1% |
| Jamaican | 90 | 27.6% |
| Puerto Rican | 26 | 8.0% |
| West Indian | 53 | 16.3% | View All 11 Rows |
Immigrants in East Kingston
The most numerous immigrant groups reported in East Kingston came from Caribbean (24 | 7.4%), Jamaica (24 | 7.4%), Latin America (24 | 7.4%), Europe (9 | 2.8%), and Germany (9 | 2.8%), together accounting for 27.6% of all East Kingston residents.
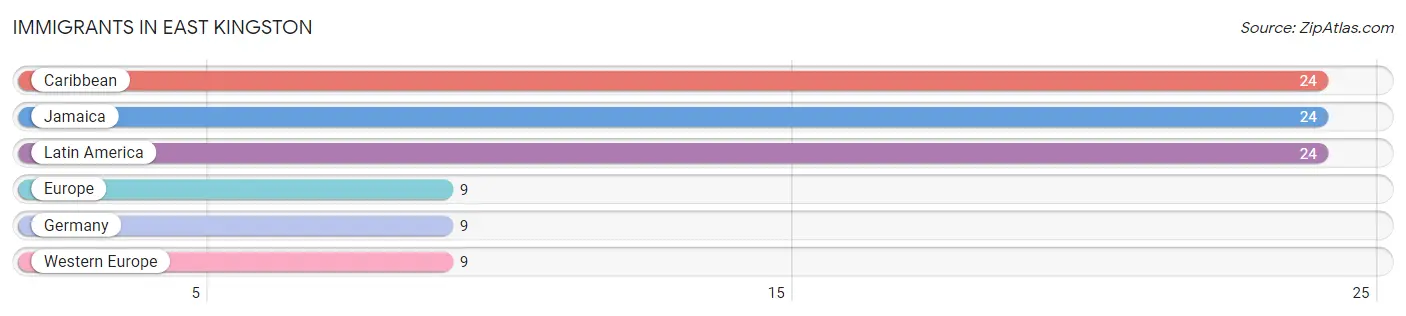
| Immigration Origin | # Population | % Population |
| Caribbean | 24 | 7.4% |
| Europe | 9 | 2.8% |
| Germany | 9 | 2.8% |
| Jamaica | 24 | 7.4% |
| Latin America | 24 | 7.4% |
| Western Europe | 9 | 2.8% | View All 6 Rows |
Sex and Age in East Kingston
Sex and Age in East Kingston
The most populous age groups in East Kingston are 45 to 49 Years (61 | 38.1%) for men and 35 to 39 Years (39 | 23.5%) for women.
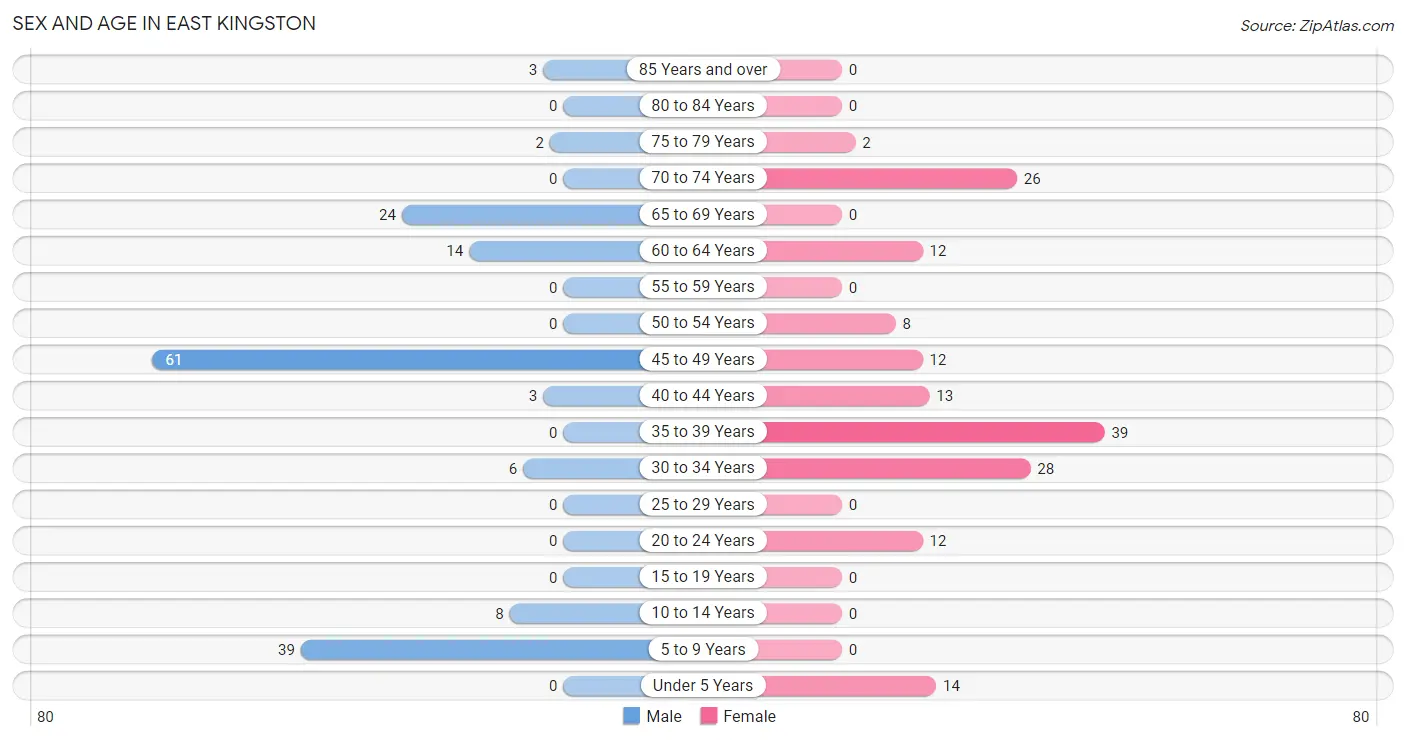
| Age Bracket | Male | Female |
| Under 5 Years | 0 (0.0%) | 14 (8.4%) |
| 5 to 9 Years | 39 (24.4%) | 0 (0.0%) |
| 10 to 14 Years | 8 (5.0%) | 0 (0.0%) |
| 15 to 19 Years | 0 (0.0%) | 0 (0.0%) |
| 20 to 24 Years | 0 (0.0%) | 12 (7.2%) |
| 25 to 29 Years | 0 (0.0%) | 0 (0.0%) |
| 30 to 34 Years | 6 (3.7%) | 28 (16.9%) |
| 35 to 39 Years | 0 (0.0%) | 39 (23.5%) |
| 40 to 44 Years | 3 (1.9%) | 13 (7.8%) |
| 45 to 49 Years | 61 (38.1%) | 12 (7.2%) |
| 50 to 54 Years | 0 (0.0%) | 8 (4.8%) |
| 55 to 59 Years | 0 (0.0%) | 0 (0.0%) |
| 60 to 64 Years | 14 (8.7%) | 12 (7.2%) |
| 65 to 69 Years | 24 (15.0%) | 0 (0.0%) |
| 70 to 74 Years | 0 (0.0%) | 26 (15.7%) |
| 75 to 79 Years | 2 (1.3%) | 2 (1.2%) |
| 80 to 84 Years | 0 (0.0%) | 0 (0.0%) |
| 85 Years and over | 3 (1.9%) | 0 (0.0%) |
| Total | 160 (100.0%) | 166 (100.0%) |
Families and Households in East Kingston
Median Family Size in East Kingston
The median family size in East Kingston is 2.44 persons per family, with single male/father families (14 | 14.3%) accounting for the largest median family size of 3.86 persons per family. On the other hand, single female/mother families (71 | 72.5%) represent the smallest median family size with 2.17 persons per family.
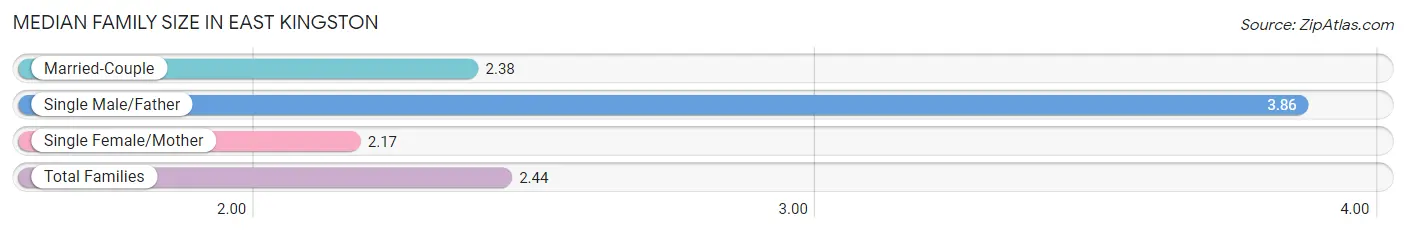
| Family Type | # Families | Family Size |
| Married-Couple | 13 (13.3%) | 2.38 |
| Single Male/Father | 14 (14.3%) | 3.86 |
| Single Female/Mother | 71 (72.5%) | 2.17 |
| Total Families | 98 (100.0%) | 2.44 |
Median Household Size in East Kingston
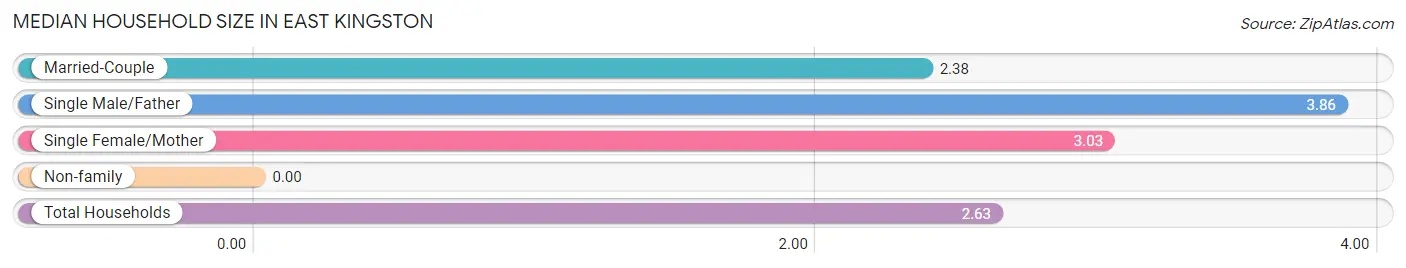
| Household Type | # Households | Household Size |
| Married-Couple | 13 (10.5%) | 2.38 |
| Single Male/Father | 14 (11.3%) | 3.86 |
| Single Female/Mother | 71 (57.3%) | 3.03 |
| Non-family | 26 (21.0%) | - |
| Total Households | 124 (100.0%) | 2.63 |
Household Size by Marriage Status in East Kingston
Out of a total of 124 households in East Kingston, 98 (79.0%) are family households, while 26 (21.0%) are nonfamily households. The most numerous type of family households are 4-person households, comprising 53, and the most common type of nonfamily households are 1-person households, comprising 26.
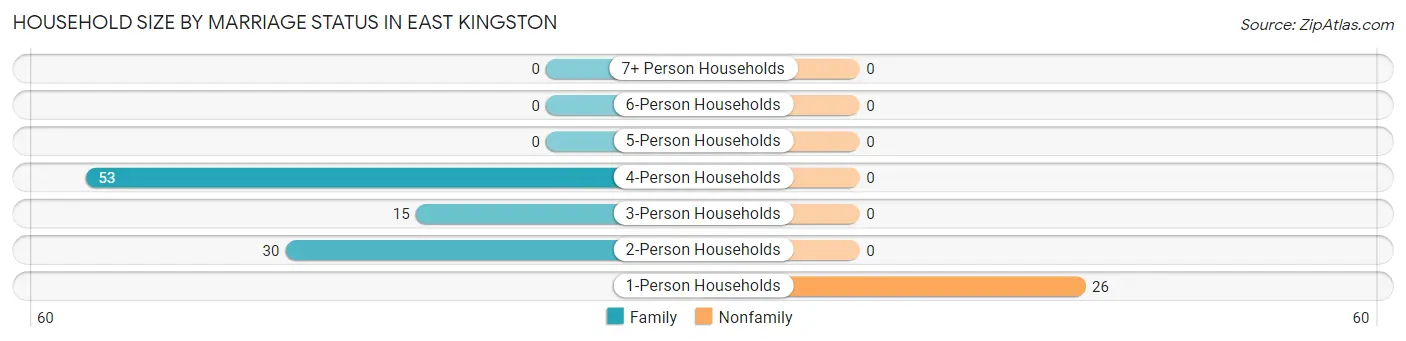
| Household Size | Family Households | Nonfamily Households |
| 1-Person Households | - | 26 (21.0%) |
| 2-Person Households | 30 (24.2%) | 0 (0.0%) |
| 3-Person Households | 15 (12.1%) | 0 (0.0%) |
| 4-Person Households | 53 (42.7%) | 0 (0.0%) |
| 5-Person Households | 0 (0.0%) | 0 (0.0%) |
| 6-Person Households | 0 (0.0%) | 0 (0.0%) |
| 7+ Person Households | 0 (0.0%) | 0 (0.0%) |
| Total | 98 (79.0%) | 26 (21.0%) |
Female Fertility in East Kingston
Fertility by Age in East Kingston
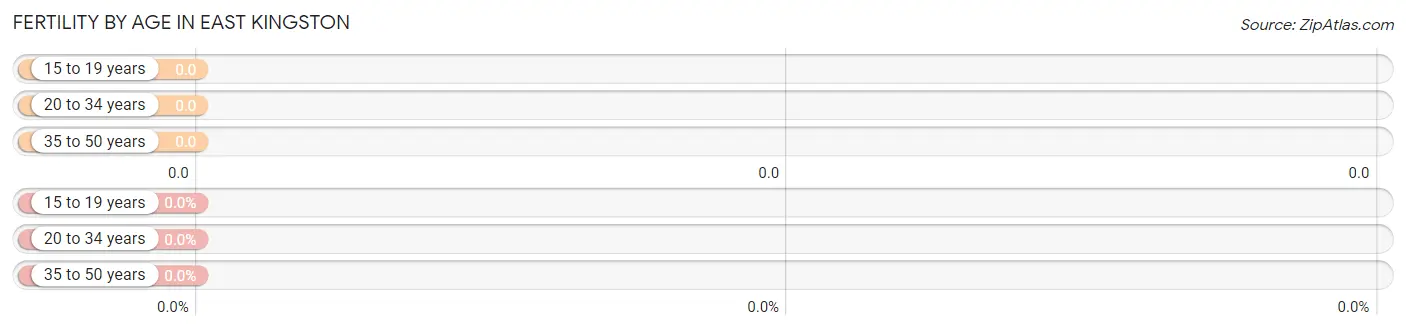
| Age Bracket | Women with Births | Births / 1,000 Women |
| 15 to 19 years | 0 (0.0%) | 0.0 |
| 20 to 34 years | 0 (0.0%) | 0.0 |
| 35 to 50 years | 0 (0.0%) | 0.0 |
| Total | 0 (0.0%) | 0.0 |
Fertility by Age by Marriage Status in East Kingston
| Age Bracket | Married | Unmarried |
| 15 to 19 years | 0 (0.0%) | 0 (0.0%) |
| 20 to 34 years | 0 (0.0%) | 0 (0.0%) |
| 35 to 50 years | 0 (0.0%) | 0 (0.0%) |
| Total | 0 (0.0%) | 0 (0.0%) |
Fertility by Education in East Kingston
| Educational Attainment | Women with Births | Births / 1,000 Women |
| Less than High School | 0 (0.0%) | 0.0 |
| High School Diploma | 0 (0.0%) | 0.0 |
| College or Associate's Degree | 0 (0.0%) | 0.0 |
| Bachelor's Degree | 0 (0.0%) | 0.0 |
| Graduate Degree | 0 (0.0%) | 0.0 |
| Total | 0 (0.0%) | 0.0 |
Fertility by Education by Marriage Status in East Kingston
| Educational Attainment | Married | Unmarried |
| Less than High School | 0 (0.0%) | 0 (0.0%) |
| High School Diploma | 0 (0.0%) | 0 (0.0%) |
| College or Associate's Degree | 0 (0.0%) | 0 (0.0%) |
| Bachelor's Degree | 0 (0.0%) | 0 (0.0%) |
| Graduate Degree | 0 (0.0%) | 0 (0.0%) |
| Total | 0 (0.0%) | 0 (0.0%) |
Employment Characteristics in East Kingston
Employment by Class of Employer in East Kingston
Among the 180 employed individuals in East Kingston, private company employees (99 | 55.0%), not-for-profit organizations (55 | 30.6%), and self-employed (not incorporated) (16 | 8.9%) make up the most common classes of employment.
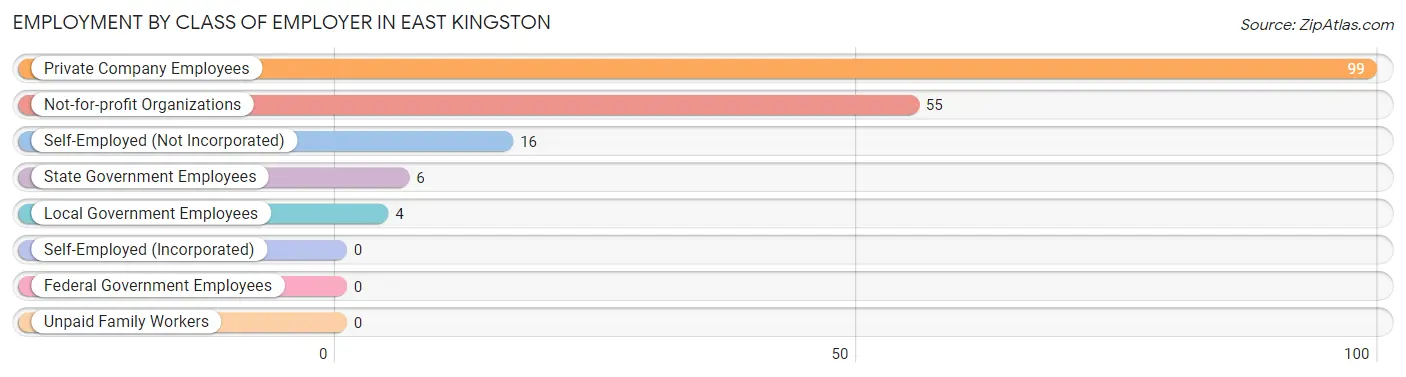
| Employer Class | # Employees | % Employees |
| Private Company Employees | 99 | 55.0% |
| Self-Employed (Incorporated) | 0 | 0.0% |
| Self-Employed (Not Incorporated) | 16 | 8.9% |
| Not-for-profit Organizations | 55 | 30.6% |
| Local Government Employees | 4 | 2.2% |
| State Government Employees | 6 | 3.3% |
| Federal Government Employees | 0 | 0.0% |
| Unpaid Family Workers | 0 | 0.0% |
| Total | 180 | 100.0% |
Employment Status by Age in East Kingston
According to the labor force statistics for East Kingston, out of the total population over 16 years of age (265), 87.9% or 233 individuals are in the labor force, with 22.7% or 53 of them unemployed. The age group with the highest labor force participation rate is 20 to 24 years, with 100.0% or 12 individuals in the labor force. Within the labor force, the 45 to 54 years age range has the highest percentage of unemployed individuals, with 65.4% or 53 of them being unemployed.
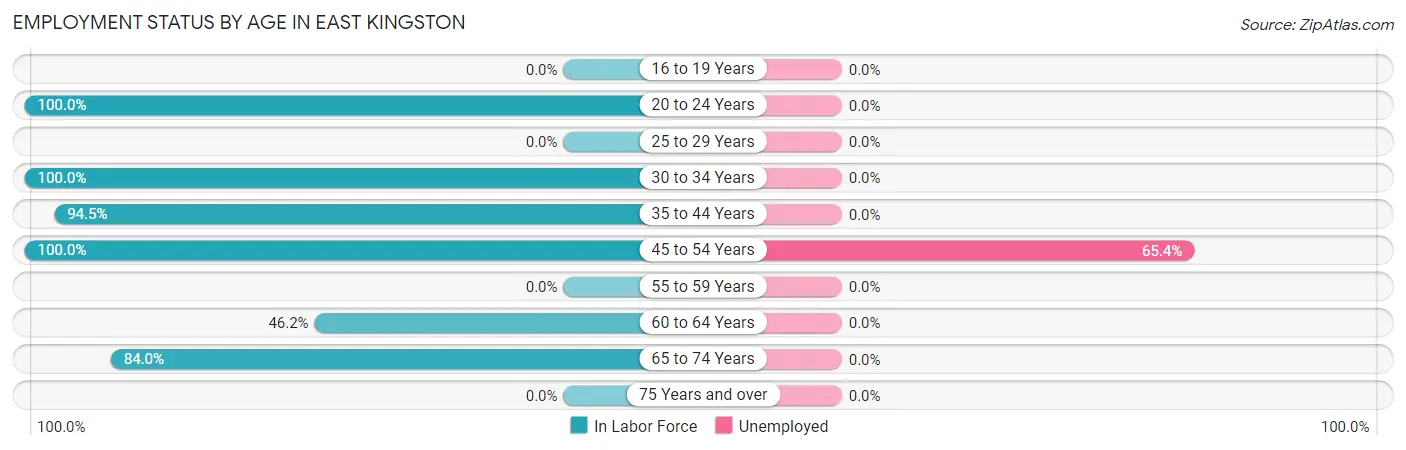
| Age Bracket | In Labor Force | Unemployed |
| 16 to 19 Years | 0 (0.0%) | 0 (0.0%) |
| 20 to 24 Years | 12 (100.0%) | 0 (0.0%) |
| 25 to 29 Years | 0 (0.0%) | 0 (0.0%) |
| 30 to 34 Years | 34 (100.0%) | 0 (0.0%) |
| 35 to 44 Years | 52 (94.5%) | 0 (0.0%) |
| 45 to 54 Years | 81 (100.0%) | 53 (65.4%) |
| 55 to 59 Years | 0 (0.0%) | 0 (0.0%) |
| 60 to 64 Years | 12 (46.2%) | 0 (0.0%) |
| 65 to 74 Years | 42 (84.0%) | 0 (0.0%) |
| 75 Years and over | 0 (0.0%) | 0 (0.0%) |
| Total | 233 (87.9%) | 53 (22.7%) |
Employment Status by Educational Attainment in East Kingston
According to labor force statistics for East Kingston, 91.3% of individuals (179) out of the total population between 25 and 64 years of age (196) are in the labor force, with 29.6% or 53 of them being unemployed. The group with the highest labor force participation rate are those with the educational attainment of less than high school, with 100.0% or 14 individuals in the labor force. Within the labor force, individuals with high school diploma education have the highest percentage of unemployment, with 66.3% or 53 of them being unemployed.
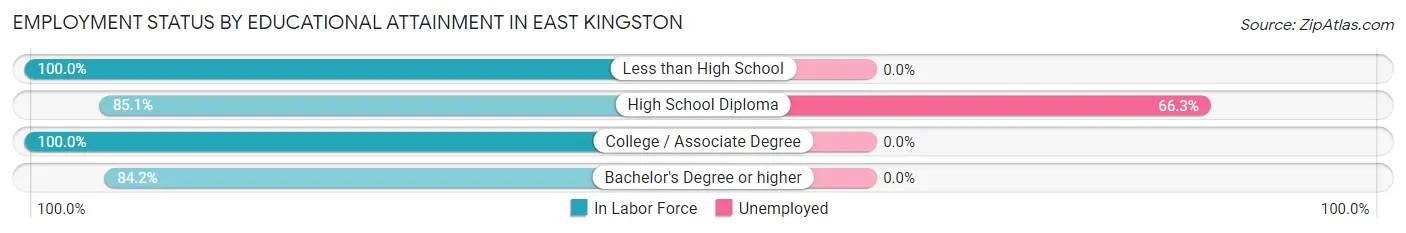
| Educational Attainment | In Labor Force | Unemployed |
| Less than High School | 14 (100.0%) | 0 (0.0%) |
| High School Diploma | 80 (85.1%) | 62 (66.3%) |
| College / Associate Degree | 69 (100.0%) | 0 (0.0%) |
| Bachelor's Degree or higher | 16 (84.2%) | 0 (0.0%) |
| Total | 179 (91.3%) | 58 (29.6%) |
Employment Occupations by Sex in East Kingston
Management, Business, Science and Arts Occupations
The most common Management, Business, Science and Arts occupations in East Kingston are , and Management (12 | 6.7%).
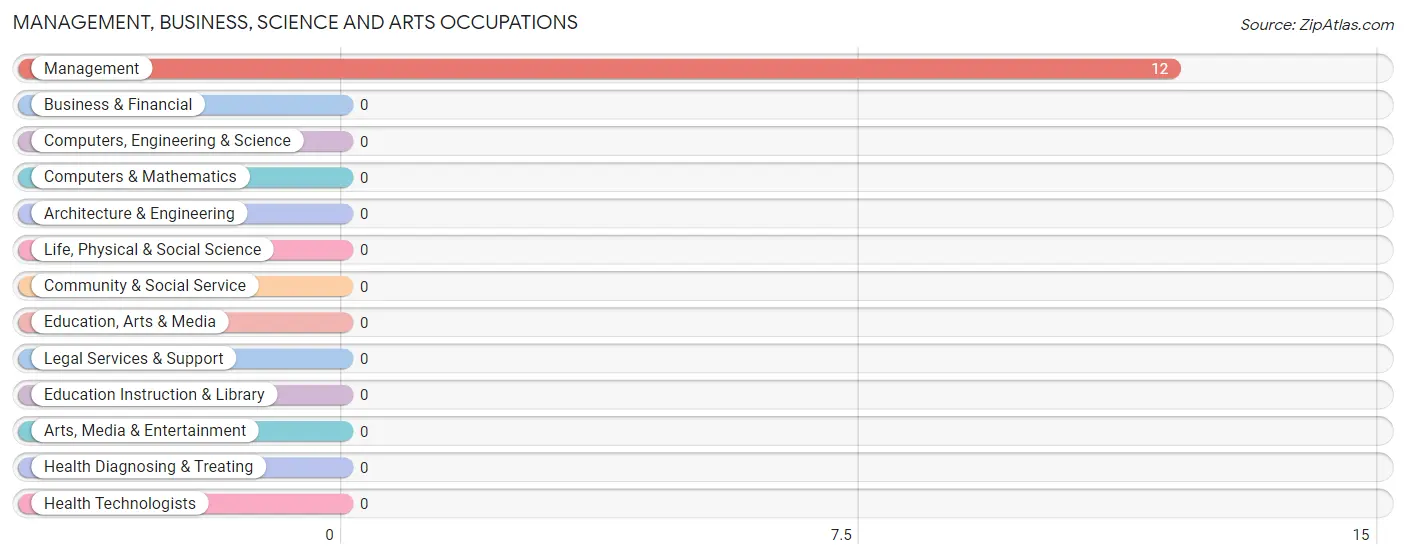
Management, Business, Science and Arts Occupations by Sex
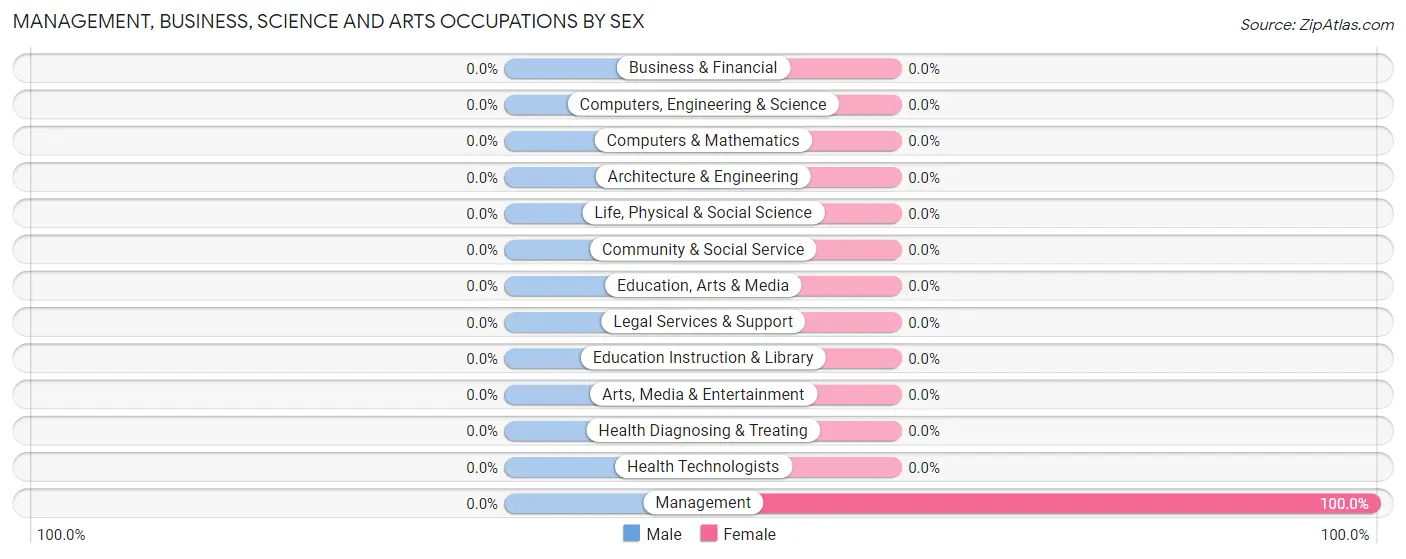
| Occupation | Male | Female |
| Management | 0 (0.0%) | 12 (100.0%) |
| Business & Financial | 0 (0.0%) | 0 (0.0%) |
| Computers, Engineering & Science | 0 (0.0%) | 0 (0.0%) |
| Computers & Mathematics | 0 (0.0%) | 0 (0.0%) |
| Architecture & Engineering | 0 (0.0%) | 0 (0.0%) |
| Life, Physical & Social Science | 0 (0.0%) | 0 (0.0%) |
| Community & Social Service | 0 (0.0%) | 0 (0.0%) |
| Education, Arts & Media | 0 (0.0%) | 0 (0.0%) |
| Legal Services & Support | 0 (0.0%) | 0 (0.0%) |
| Education Instruction & Library | 0 (0.0%) | 0 (0.0%) |
| Arts, Media & Entertainment | 0 (0.0%) | 0 (0.0%) |
| Health Diagnosing & Treating | 0 (0.0%) | 0 (0.0%) |
| Health Technologists | 0 (0.0%) | 0 (0.0%) |
| Total (Category) | 0 (0.0%) | 12 (100.0%) |
| Total (Overall) | 38 (21.1%) | 142 (78.9%) |
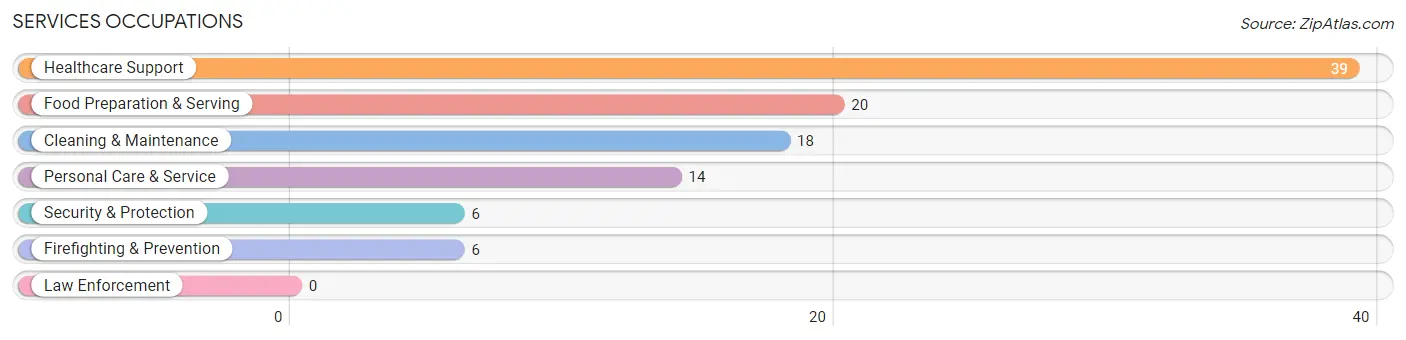
Services Occupations
The most common Services occupations in East Kingston are Healthcare Support (39 | 21.7%), Food Preparation & Serving (20 | 11.1%), Cleaning & Maintenance (18 | 10.0%), Personal Care & Service (14 | 7.8%), and Security & Protection (6 | 3.3%).
Services Occupations by Sex
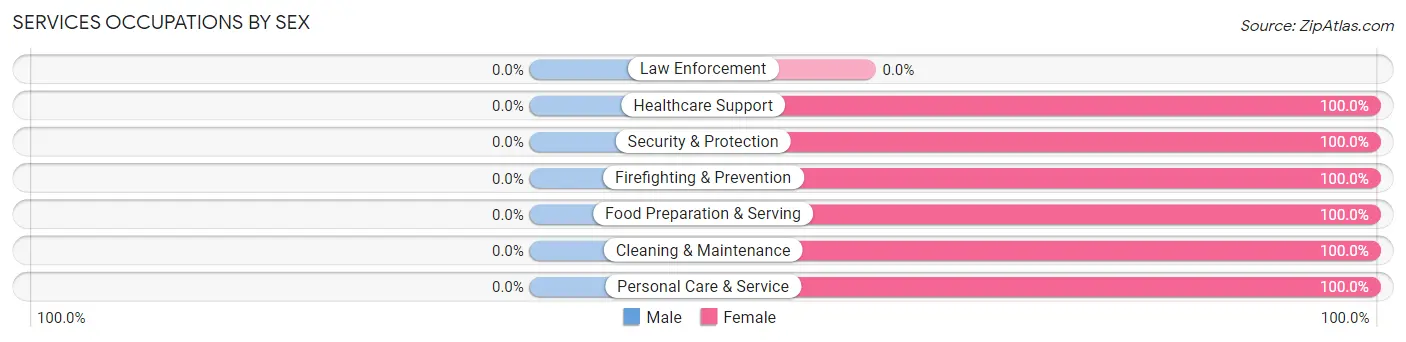
| Occupation | Male | Female |
| Healthcare Support | 0 (0.0%) | 39 (100.0%) |
| Security & Protection | 0 (0.0%) | 6 (100.0%) |
| Firefighting & Prevention | 0 (0.0%) | 6 (100.0%) |
| Law Enforcement | 0 (0.0%) | 0 (0.0%) |
| Food Preparation & Serving | 0 (0.0%) | 20 (100.0%) |
| Cleaning & Maintenance | 0 (0.0%) | 18 (100.0%) |
| Personal Care & Service | 0 (0.0%) | 14 (100.0%) |
| Total (Category) | 0 (0.0%) | 97 (100.0%) |
| Total (Overall) | 38 (21.1%) | 142 (78.9%) |
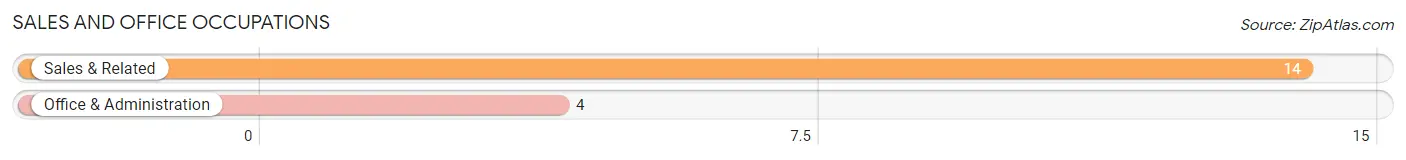
Sales and Office Occupations
The most common Sales and Office occupations in East Kingston are Sales & Related (14 | 7.8%), and Office & Administration (4 | 2.2%).
Sales and Office Occupations by Sex
| Occupation | Male | Female |
| Sales & Related | 6 (42.9%) | 8 (57.1%) |
| Office & Administration | 0 (0.0%) | 4 (100.0%) |
| Total (Category) | 6 (33.3%) | 12 (66.7%) |
| Total (Overall) | 38 (21.1%) | 142 (78.9%) |
Natural Resources, Construction and Maintenance Occupations
Natural Resources, Construction and Maintenance Occupations by Sex
| Occupation | Male | Female |
| Farming, Fishing & Forestry | 0 (0.0%) | 0 (0.0%) |
| Construction & Extraction | 0 (0.0%) | 0 (0.0%) |
| Installation, Maintenance & Repair | 0 (0.0%) | 0 (0.0%) |
| Total (Category) | 0 (0.0%) | 0 (0.0%) |
| Total (Overall) | 38 (21.1%) | 142 (78.9%) |
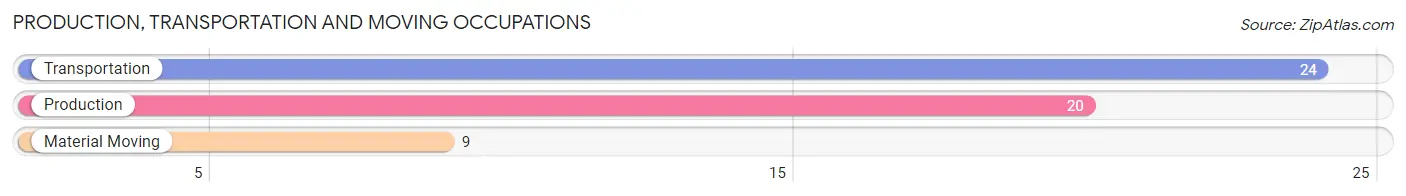
Production, Transportation and Moving Occupations
The most common Production, Transportation and Moving occupations in East Kingston are Transportation (24 | 13.3%), Production (20 | 11.1%), and Material Moving (9 | 5.0%).
Production, Transportation and Moving Occupations by Sex
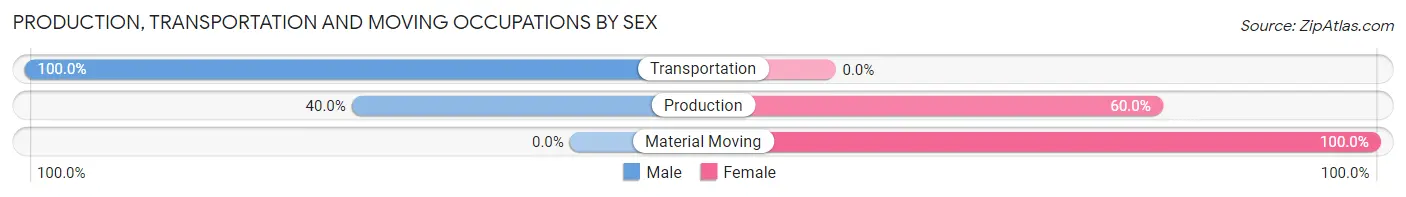
| Occupation | Male | Female |
| Production | 8 (40.0%) | 12 (60.0%) |
| Transportation | 24 (100.0%) | 0 (0.0%) |
| Material Moving | 0 (0.0%) | 9 (100.0%) |
| Total (Category) | 32 (60.4%) | 21 (39.6%) |
| Total (Overall) | 38 (21.1%) | 142 (78.9%) |
Employment Industries by Sex in East Kingston
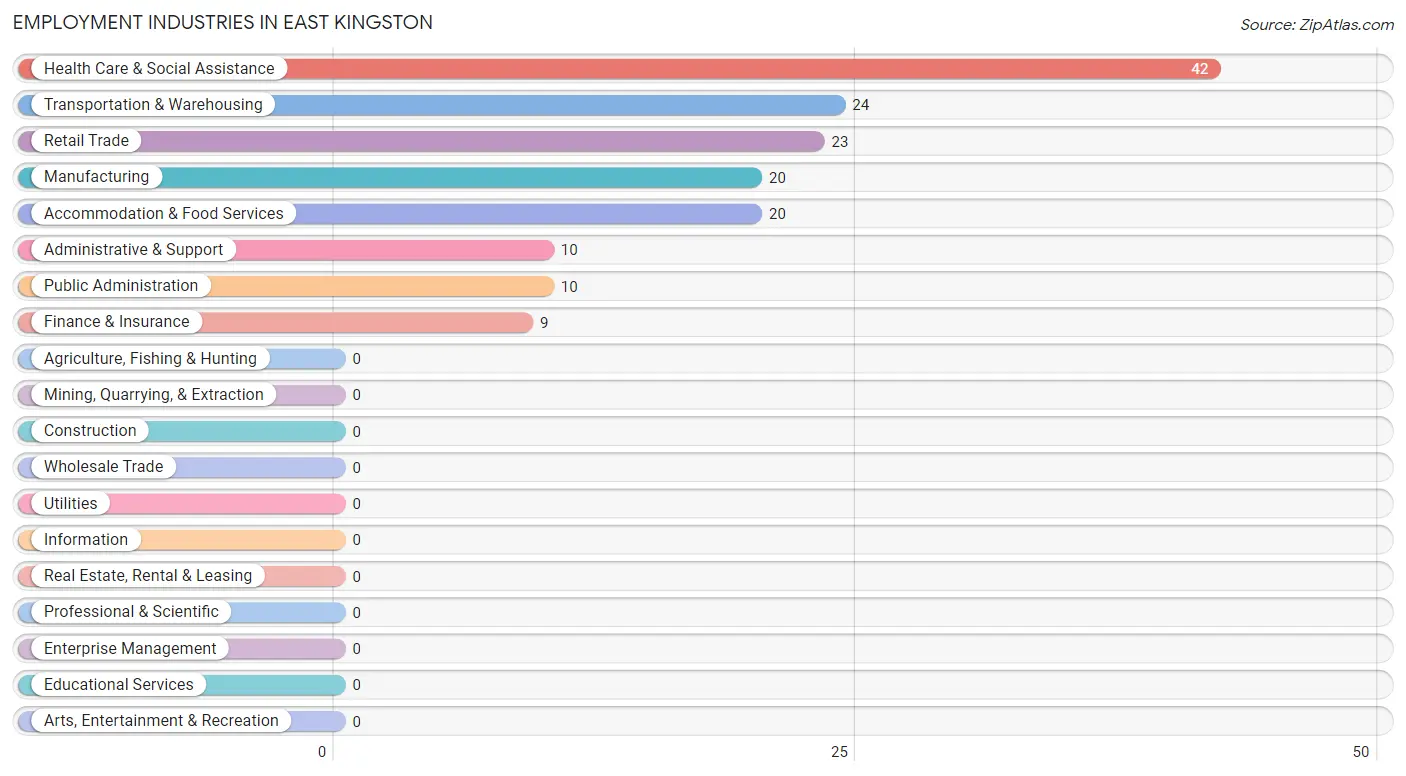
Employment Industries in East Kingston
The major employment industries in East Kingston include Health Care & Social Assistance (42 | 23.3%), Transportation & Warehousing (24 | 13.3%), Retail Trade (23 | 12.8%), Manufacturing (20 | 11.1%), and Accommodation & Food Services (20 | 11.1%).
Employment Industries by Sex in East Kingston
The East Kingston industries that see more men than women are Transportation & Warehousing (100.0%), Manufacturing (40.0%), and Retail Trade (26.1%), whereas the industries that tend to have a higher number of women are Finance & Insurance (100.0%), Administrative & Support (100.0%), and Health Care & Social Assistance (100.0%).
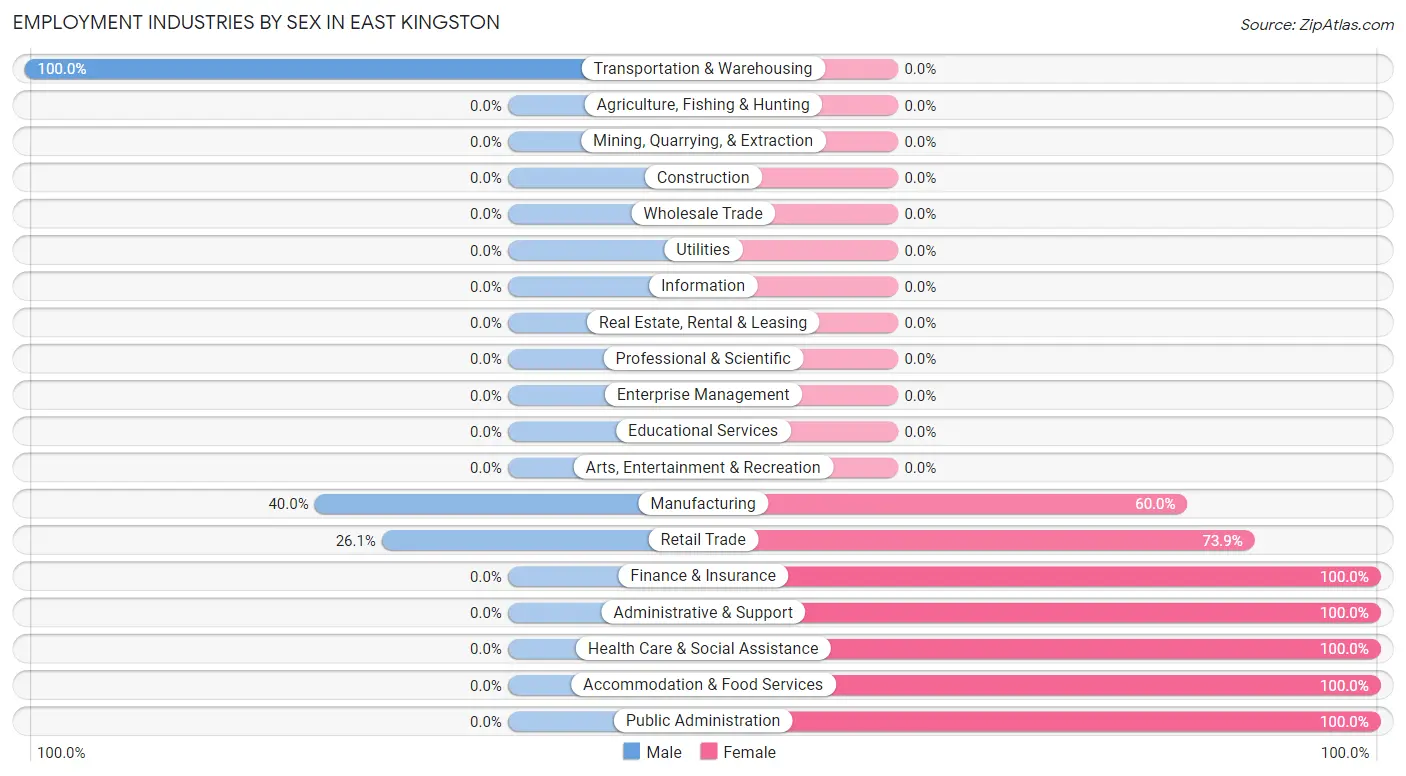
| Industry | Male | Female |
| Agriculture, Fishing & Hunting | 0 (0.0%) | 0 (0.0%) |
| Mining, Quarrying, & Extraction | 0 (0.0%) | 0 (0.0%) |
| Construction | 0 (0.0%) | 0 (0.0%) |
| Manufacturing | 8 (40.0%) | 12 (60.0%) |
| Wholesale Trade | 0 (0.0%) | 0 (0.0%) |
| Retail Trade | 6 (26.1%) | 17 (73.9%) |
| Transportation & Warehousing | 24 (100.0%) | 0 (0.0%) |
| Utilities | 0 (0.0%) | 0 (0.0%) |
| Information | 0 (0.0%) | 0 (0.0%) |
| Finance & Insurance | 0 (0.0%) | 9 (100.0%) |
| Real Estate, Rental & Leasing | 0 (0.0%) | 0 (0.0%) |
| Professional & Scientific | 0 (0.0%) | 0 (0.0%) |
| Enterprise Management | 0 (0.0%) | 0 (0.0%) |
| Administrative & Support | 0 (0.0%) | 10 (100.0%) |
| Educational Services | 0 (0.0%) | 0 (0.0%) |
| Health Care & Social Assistance | 0 (0.0%) | 42 (100.0%) |
| Arts, Entertainment & Recreation | 0 (0.0%) | 0 (0.0%) |
| Accommodation & Food Services | 0 (0.0%) | 20 (100.0%) |
| Public Administration | 0 (0.0%) | 10 (100.0%) |
| Total | 38 (21.1%) | 142 (78.9%) |
Education in East Kingston
School Enrollment in East Kingston
The most common levels of schooling among the 76 students in East Kingston are kindergarten (27 | 35.5%), nursery / preschool (14 | 18.4%), and elementary school (12 | 15.8%).
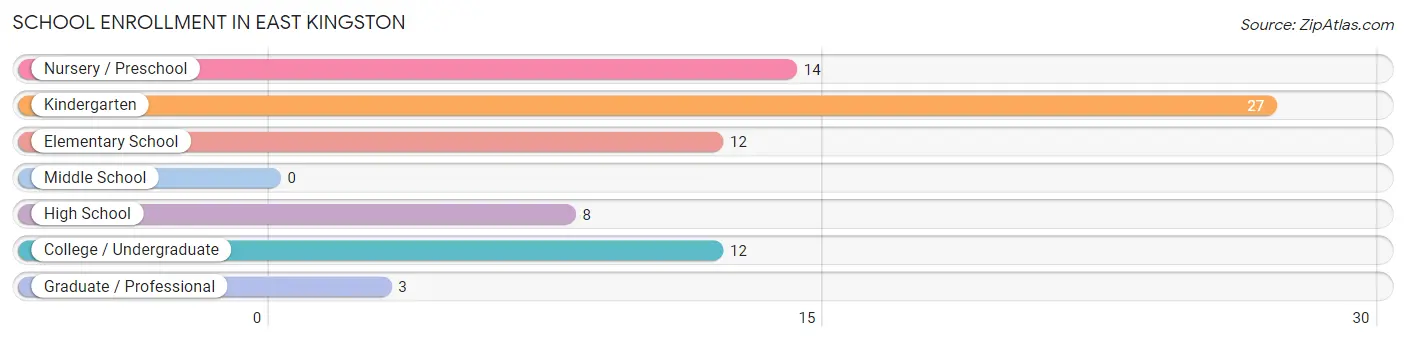
| School Level | # Students | % Students |
| Nursery / Preschool | 14 | 18.4% |
| Kindergarten | 27 | 35.5% |
| Elementary School | 12 | 15.8% |
| Middle School | 0 | 0.0% |
| High School | 8 | 10.5% |
| College / Undergraduate | 12 | 15.8% |
| Graduate / Professional | 3 | 4.0% |
| Total | 76 | 100.0% |
School Enrollment by Age by Funding Source in East Kingston
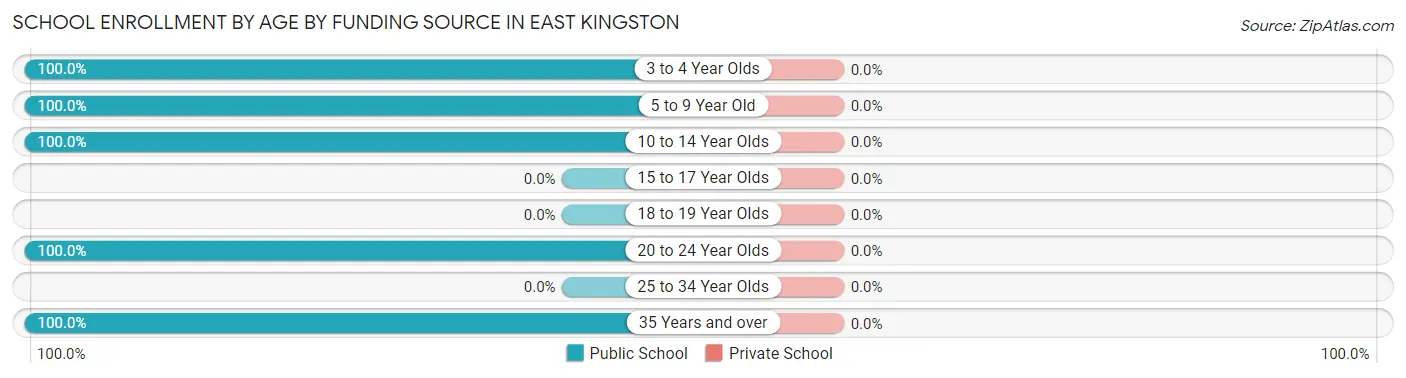
| Age Bracket | Public School | Private School |
| 3 to 4 Year Olds | 14 (100.0%) | 0 (0.0%) |
| 5 to 9 Year Old | 39 (100.0%) | 0 (0.0%) |
| 10 to 14 Year Olds | 8 (100.0%) | 0 (0.0%) |
| 15 to 17 Year Olds | 0 (0.0%) | 0 (0.0%) |
| 18 to 19 Year Olds | 0 (0.0%) | 0 (0.0%) |
| 20 to 24 Year Olds | 12 (100.0%) | 0 (0.0%) |
| 25 to 34 Year Olds | 0 (0.0%) | 0 (0.0%) |
| 35 Years and over | 3 (100.0%) | 0 (0.0%) |
| Total | 76 (100.0%) | 0 (0.0%) |
Educational Attainment by Field of Study in East Kingston
Social sciences (24 | 52.2%), arts & humanities (15 | 32.6%), literature & languages (4 | 8.7%), and business (3 | 6.5%) are the most common fields of study among 46 individuals in East Kingston who have obtained a bachelor's degree or higher.
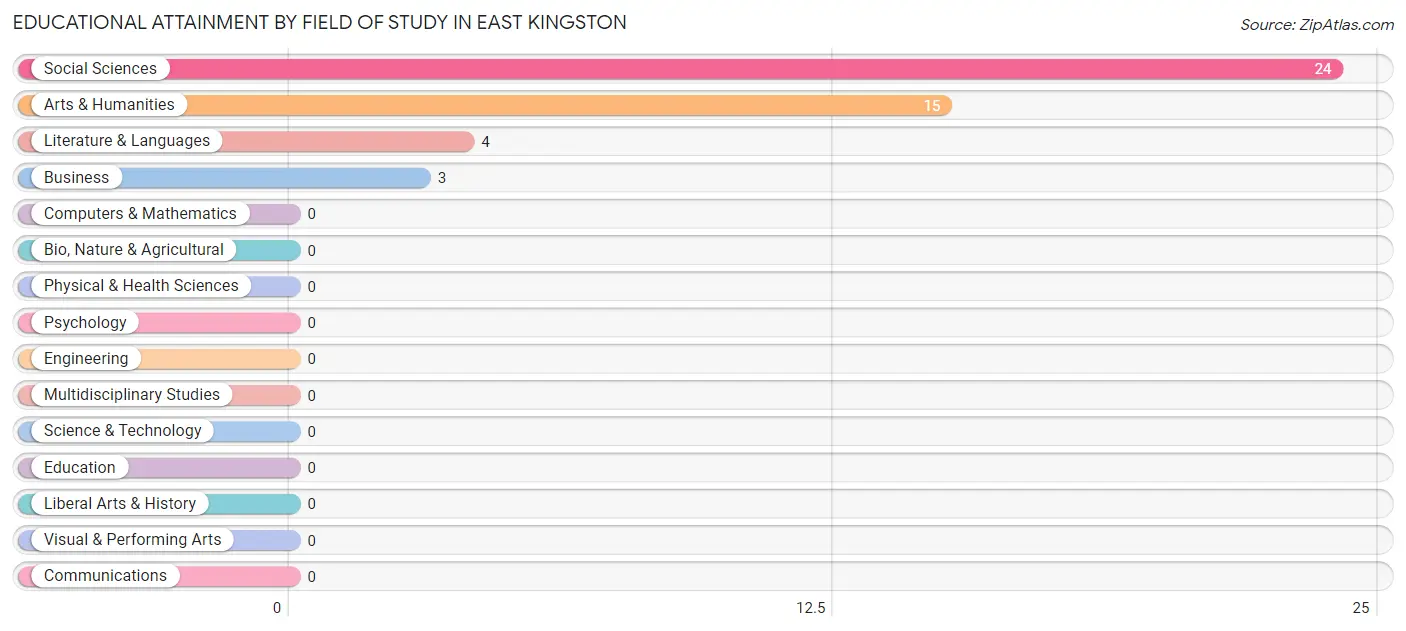
| Field of Study | # Graduates | % Graduates |
| Computers & Mathematics | 0 | 0.0% |
| Bio, Nature & Agricultural | 0 | 0.0% |
| Physical & Health Sciences | 0 | 0.0% |
| Psychology | 0 | 0.0% |
| Social Sciences | 24 | 52.2% |
| Engineering | 0 | 0.0% |
| Multidisciplinary Studies | 0 | 0.0% |
| Science & Technology | 0 | 0.0% |
| Business | 3 | 6.5% |
| Education | 0 | 0.0% |
| Literature & Languages | 4 | 8.7% |
| Liberal Arts & History | 0 | 0.0% |
| Visual & Performing Arts | 0 | 0.0% |
| Communications | 0 | 0.0% |
| Arts & Humanities | 15 | 32.6% |
| Total | 46 | 100.0% |
Transportation & Commute in East Kingston
Vehicle Availability by Sex in East Kingston
The most prevalent vehicle ownership categories in East Kingston are males with 1 vehicle (24, accounting for 63.2%) and females with 1 vehicle (50, making up 16.9%).
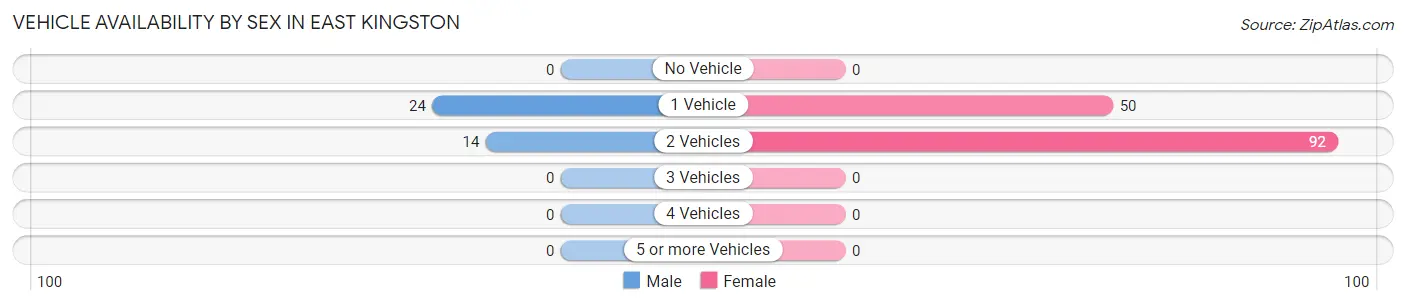
| Vehicles Available | Male | Female |
| No Vehicle | 0 (0.0%) | 0 (0.0%) |
| 1 Vehicle | 24 (63.2%) | 50 (35.2%) |
| 2 Vehicles | 14 (36.8%) | 92 (64.8%) |
| 3 Vehicles | 0 (0.0%) | 0 (0.0%) |
| 4 Vehicles | 0 (0.0%) | 0 (0.0%) |
| 5 or more Vehicles | 0 (0.0%) | 0 (0.0%) |
| Total | 38 (100.0%) | 142 (100.0%) |
Commute Time in East Kingston
The most frequently occuring commute durations in East Kingston are 15 to 19 minutes (47 commuters, 26.4%), 5 to 9 minutes (31 commuters, 17.4%), and 20 to 24 minutes (28 commuters, 15.7%).
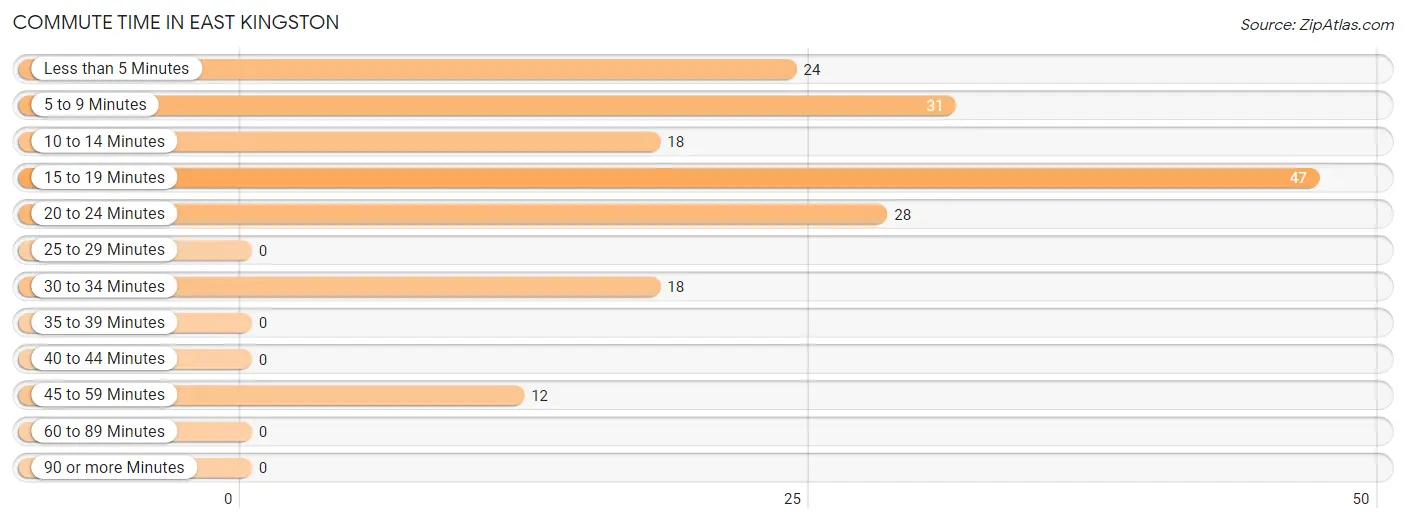
| Commute Time | # Commuters | % Commuters |
| Less than 5 Minutes | 24 | 13.5% |
| 5 to 9 Minutes | 31 | 17.4% |
| 10 to 14 Minutes | 18 | 10.1% |
| 15 to 19 Minutes | 47 | 26.4% |
| 20 to 24 Minutes | 28 | 15.7% |
| 25 to 29 Minutes | 0 | 0.0% |
| 30 to 34 Minutes | 18 | 10.1% |
| 35 to 39 Minutes | 0 | 0.0% |
| 40 to 44 Minutes | 0 | 0.0% |
| 45 to 59 Minutes | 12 | 6.7% |
| 60 to 89 Minutes | 0 | 0.0% |
| 90 or more Minutes | 0 | 0.0% |
Commute Time by Sex in East Kingston
The most common commute times in East Kingston are less than 5 minutes (24 commuters, 63.2%) for males and 15 to 19 minutes (47 commuters, 33.6%) for females.
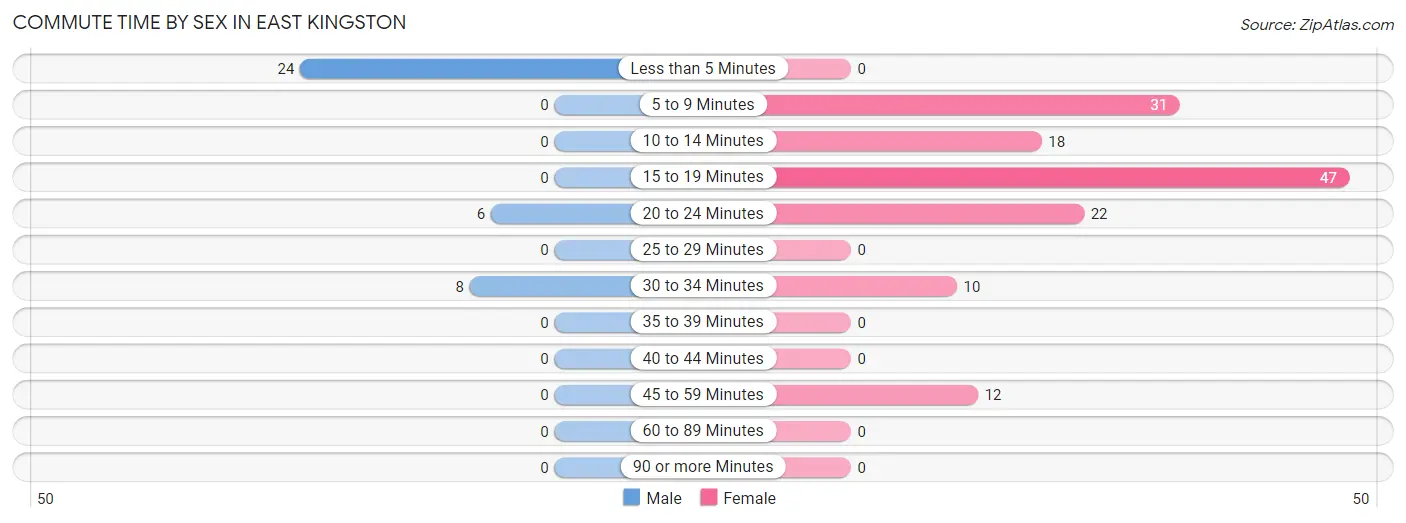
| Commute Time | Male | Female |
| Less than 5 Minutes | 24 (63.2%) | 0 (0.0%) |
| 5 to 9 Minutes | 0 (0.0%) | 31 (22.1%) |
| 10 to 14 Minutes | 0 (0.0%) | 18 (12.9%) |
| 15 to 19 Minutes | 0 (0.0%) | 47 (33.6%) |
| 20 to 24 Minutes | 6 (15.8%) | 22 (15.7%) |
| 25 to 29 Minutes | 0 (0.0%) | 0 (0.0%) |
| 30 to 34 Minutes | 8 (21.0%) | 10 (7.1%) |
| 35 to 39 Minutes | 0 (0.0%) | 0 (0.0%) |
| 40 to 44 Minutes | 0 (0.0%) | 0 (0.0%) |
| 45 to 59 Minutes | 0 (0.0%) | 12 (8.6%) |
| 60 to 89 Minutes | 0 (0.0%) | 0 (0.0%) |
| 90 or more Minutes | 0 (0.0%) | 0 (0.0%) |
Time of Departure to Work by Sex in East Kingston
The most frequent times of departure to work in East Kingston are 8:00 AM to 8:29 AM (24, 63.2%) for males and 5:00 AM to 5:29 AM (39, 27.9%) for females.
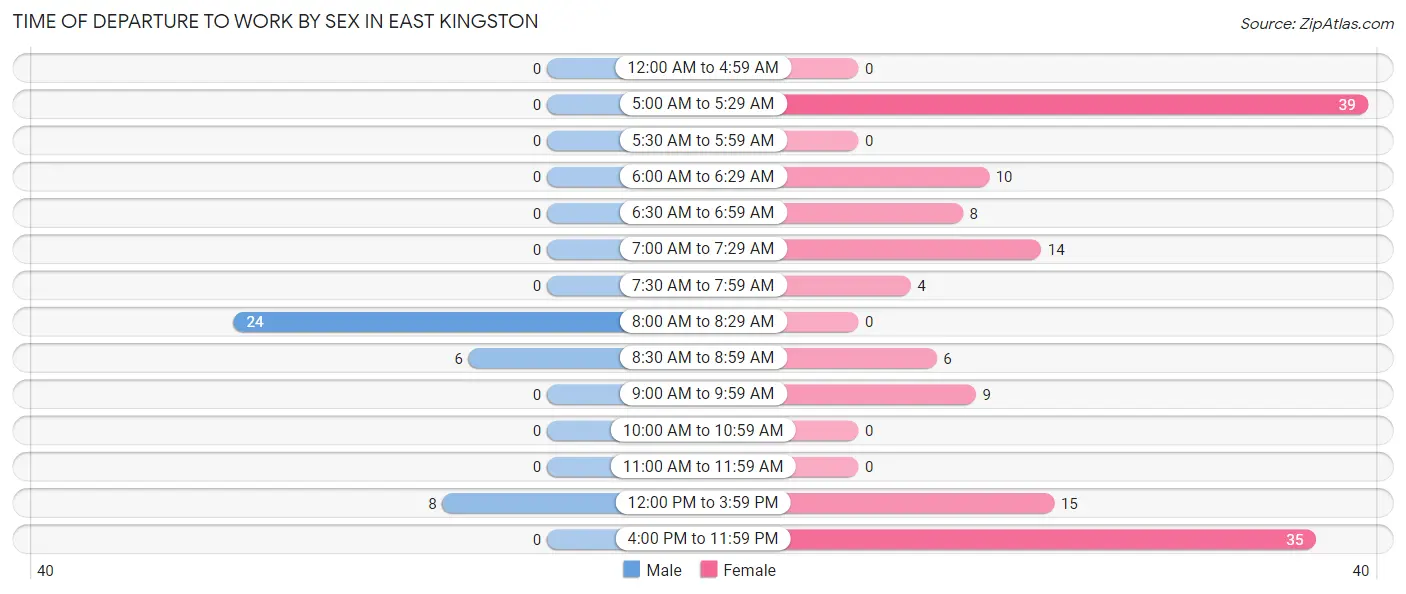
| Time of Departure | Male | Female |
| 12:00 AM to 4:59 AM | 0 (0.0%) | 0 (0.0%) |
| 5:00 AM to 5:29 AM | 0 (0.0%) | 39 (27.9%) |
| 5:30 AM to 5:59 AM | 0 (0.0%) | 0 (0.0%) |
| 6:00 AM to 6:29 AM | 0 (0.0%) | 10 (7.1%) |
| 6:30 AM to 6:59 AM | 0 (0.0%) | 8 (5.7%) |
| 7:00 AM to 7:29 AM | 0 (0.0%) | 14 (10.0%) |
| 7:30 AM to 7:59 AM | 0 (0.0%) | 4 (2.9%) |
| 8:00 AM to 8:29 AM | 24 (63.2%) | 0 (0.0%) |
| 8:30 AM to 8:59 AM | 6 (15.8%) | 6 (4.3%) |
| 9:00 AM to 9:59 AM | 0 (0.0%) | 9 (6.4%) |
| 10:00 AM to 10:59 AM | 0 (0.0%) | 0 (0.0%) |
| 11:00 AM to 11:59 AM | 0 (0.0%) | 0 (0.0%) |
| 12:00 PM to 3:59 PM | 8 (21.0%) | 15 (10.7%) |
| 4:00 PM to 11:59 PM | 0 (0.0%) | 35 (25.0%) |
| Total | 38 (100.0%) | 140 (100.0%) |
Housing Occupancy in East Kingston
Occupancy by Ownership in East Kingston
Of the total 124 dwellings in East Kingston, owner-occupied units account for 56 (45.2%), while renter-occupied units make up 68 (54.8%).
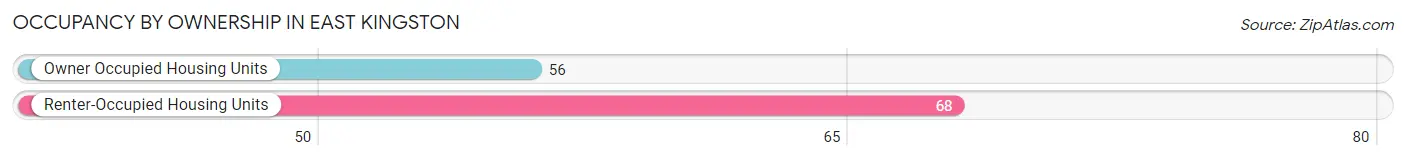
| Occupancy | # Housing Units | % Housing Units |
| Owner Occupied Housing Units | 56 | 45.2% |
| Renter-Occupied Housing Units | 68 | 54.8% |
| Total Occupied Housing Units | 124 | 100.0% |
Occupancy by Household Size in East Kingston
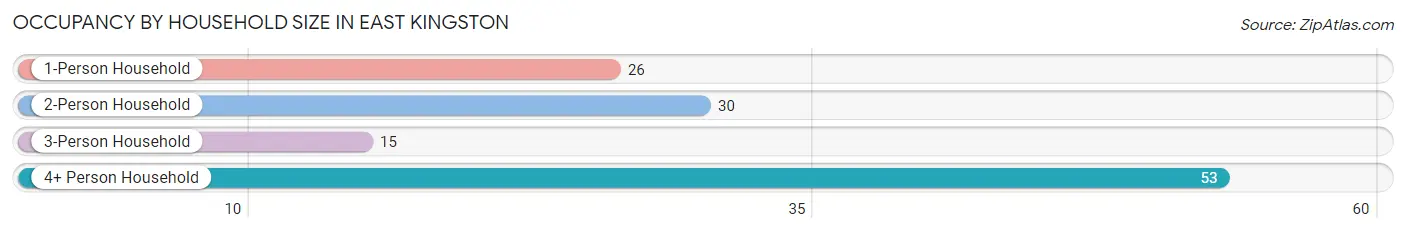
| Household Size | # Housing Units | % Housing Units |
| 1-Person Household | 26 | 21.0% |
| 2-Person Household | 30 | 24.2% |
| 3-Person Household | 15 | 12.1% |
| 4+ Person Household | 53 | 42.7% |
| Total Housing Units | 124 | 100.0% |
Occupancy by Ownership by Household Size in East Kingston
| Household Size | Owner-occupied | Renter-occupied |
| 1-Person Household | 17 (65.4%) | 9 (34.6%) |
| 2-Person Household | 10 (33.3%) | 20 (66.7%) |
| 3-Person Household | 15 (100.0%) | 0 (0.0%) |
| 4+ Person Household | 14 (26.4%) | 39 (73.6%) |
| Total Housing Units | 56 (45.2%) | 68 (54.8%) |
Occupancy by Educational Attainment in East Kingston
| Household Size | Owner-occupied | Renter-occupied |
| Less than High School | 0 (0.0%) | 0 (0.0%) |
| High School Diploma | 33 (80.5%) | 8 (19.5%) |
| College/Associate Degree | 19 (28.4%) | 48 (71.6%) |
| Bachelor's Degree or higher | 4 (25.0%) | 12 (75.0%) |
Occupancy by Age of Householder in East Kingston
| Age Bracket | # Households | % Households |
| Under 35 Years | 0 | 0.0% |
| 35 to 44 Years | 52 | 41.9% |
| 45 to 54 Years | 18 | 14.5% |
| 55 to 64 Years | 26 | 21.0% |
| 65 to 74 Years | 26 | 21.0% |
| 75 to 84 Years | 2 | 1.6% |
| 85 Years and Over | 0 | 0.0% |
| Total | 124 | 100.0% |
Housing Finances in East Kingston
Median Income by Occupancy in East Kingston
| Occupancy Type | # Households | Median Income |
| Owner-Occupied | 56 (45.2%) | $71,250 |
| Renter-Occupied | 68 (54.8%) | $0 |
| Average | 124 (100.0%) | $46,250 |
Occupancy by Householder Income Bracket in East Kingston
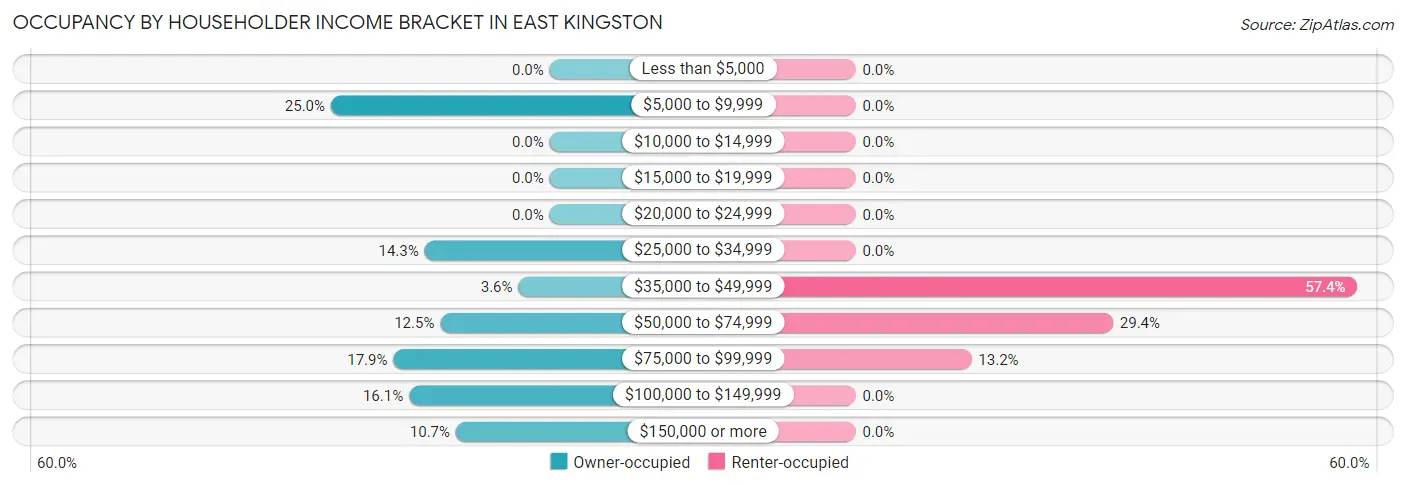
| Income Bracket | Owner-occupied | Renter-occupied |
| Less than $5,000 | 0 (0.0%) | 0 (0.0%) |
| $5,000 to $9,999 | 14 (25.0%) | 0 (0.0%) |
| $10,000 to $14,999 | 0 (0.0%) | 0 (0.0%) |
| $15,000 to $19,999 | 0 (0.0%) | 0 (0.0%) |
| $20,000 to $24,999 | 0 (0.0%) | 0 (0.0%) |
| $25,000 to $34,999 | 8 (14.3%) | 0 (0.0%) |
| $35,000 to $49,999 | 2 (3.6%) | 39 (57.4%) |
| $50,000 to $74,999 | 7 (12.5%) | 20 (29.4%) |
| $75,000 to $99,999 | 10 (17.9%) | 9 (13.2%) |
| $100,000 to $149,999 | 9 (16.1%) | 0 (0.0%) |
| $150,000 or more | 6 (10.7%) | 0 (0.0%) |
| Total | 56 (100.0%) | 68 (100.0%) |
Monthly Housing Cost Tiers in East Kingston
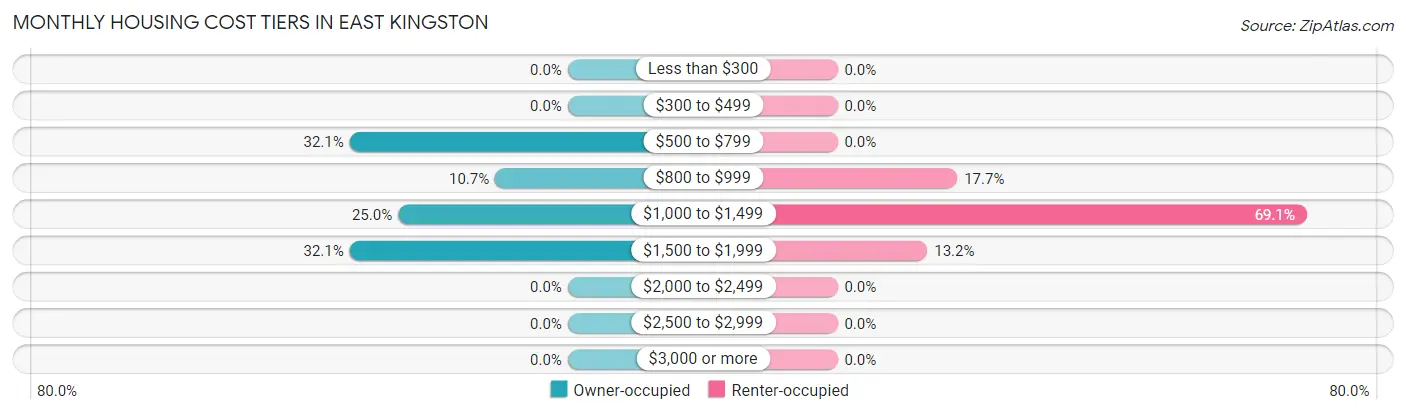
| Monthly Cost | Owner-occupied | Renter-occupied |
| Less than $300 | 0 (0.0%) | 0 (0.0%) |
| $300 to $499 | 0 (0.0%) | 0 (0.0%) |
| $500 to $799 | 18 (32.1%) | 0 (0.0%) |
| $800 to $999 | 6 (10.7%) | 12 (17.6%) |
| $1,000 to $1,499 | 14 (25.0%) | 47 (69.1%) |
| $1,500 to $1,999 | 18 (32.1%) | 9 (13.2%) |
| $2,000 to $2,499 | 0 (0.0%) | 0 (0.0%) |
| $2,500 to $2,999 | 0 (0.0%) | 0 (0.0%) |
| $3,000 or more | 0 (0.0%) | 0 (0.0%) |
| Total | 56 (100.0%) | 68 (100.0%) |
Physical Housing Characteristics in East Kingston
Housing Structures in East Kingston
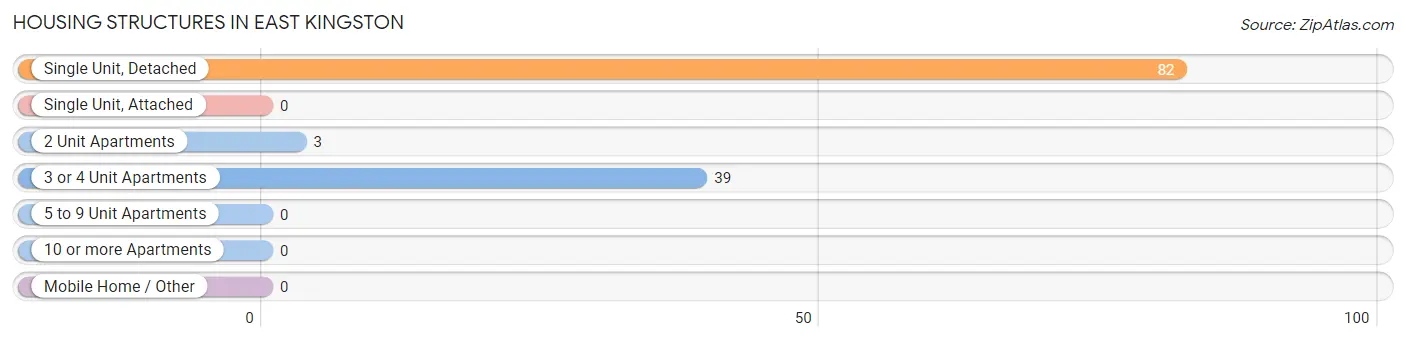
| Structure Type | # Housing Units | % Housing Units |
| Single Unit, Detached | 82 | 66.1% |
| Single Unit, Attached | 0 | 0.0% |
| 2 Unit Apartments | 3 | 2.4% |
| 3 or 4 Unit Apartments | 39 | 31.5% |
| 5 to 9 Unit Apartments | 0 | 0.0% |
| 10 or more Apartments | 0 | 0.0% |
| Mobile Home / Other | 0 | 0.0% |
| Total | 124 | 100.0% |
Housing Structures by Occupancy in East Kingston
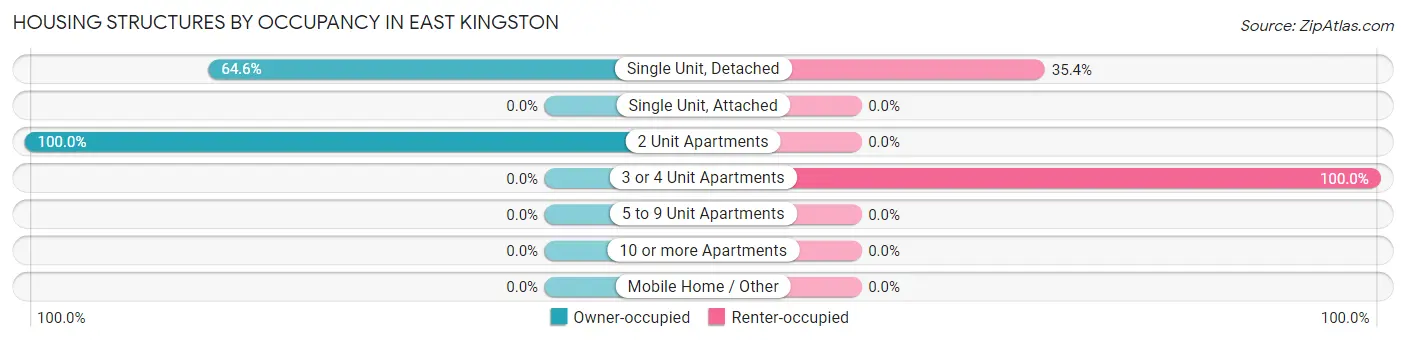
| Structure Type | Owner-occupied | Renter-occupied |
| Single Unit, Detached | 53 (64.6%) | 29 (35.4%) |
| Single Unit, Attached | 0 (0.0%) | 0 (0.0%) |
| 2 Unit Apartments | 3 (100.0%) | 0 (0.0%) |
| 3 or 4 Unit Apartments | 0 (0.0%) | 39 (100.0%) |
| 5 to 9 Unit Apartments | 0 (0.0%) | 0 (0.0%) |
| 10 or more Apartments | 0 (0.0%) | 0 (0.0%) |
| Mobile Home / Other | 0 (0.0%) | 0 (0.0%) |
| Total | 56 (45.2%) | 68 (54.8%) |
Housing Structures by Number of Rooms in East Kingston
| Number of Rooms | Owner-occupied | Renter-occupied |
| 1 Room | 0 (0.0%) | 0 (0.0%) |
| 2 or 3 Rooms | 0 (0.0%) | 0 (0.0%) |
| 4 or 5 Rooms | 20 (35.7%) | 56 (82.4%) |
| 6 or 7 Rooms | 20 (35.7%) | 12 (17.6%) |
| 8 or more Rooms | 16 (28.6%) | 0 (0.0%) |
| Total | 56 (100.0%) | 68 (100.0%) |
Housing Structure by Heating Type in East Kingston
| Heating Type | Owner-occupied | Renter-occupied |
| Utility Gas | 36 (64.3%) | 51 (75.0%) |
| Bottled, Tank, or LP Gas | 0 (0.0%) | 0 (0.0%) |
| Electricity | 0 (0.0%) | 0 (0.0%) |
| Fuel Oil or Kerosene | 20 (35.7%) | 17 (25.0%) |
| Coal or Coke | 0 (0.0%) | 0 (0.0%) |
| All other Fuels | 0 (0.0%) | 0 (0.0%) |
| No Fuel Used | 0 (0.0%) | 0 (0.0%) |
| Total | 56 (100.0%) | 68 (100.0%) |
Household Vehicle Usage in East Kingston
| Vehicles per Household | Owner-occupied | Renter-occupied |
| No Vehicle | 0 (0.0%) | 0 (0.0%) |
| 1 Vehicle | 11 (19.6%) | 39 (57.4%) |
| 2 Vehicles | 45 (80.4%) | 29 (42.6%) |
| 3 or more Vehicles | 0 (0.0%) | 0 (0.0%) |
| Total | 56 (100.0%) | 68 (100.0%) |
Real Estate & Mortgages in East Kingston
Real Estate and Mortgage Overview in East Kingston
| Characteristic | Without Mortgage | With Mortgage |
| Housing Units | 18 | 38 |
| Median Property Value | - | - |
| Median Household Income | - | - |
| Monthly Housing Costs | - | - |
| Real Estate Taxes | - | - |
Property Value by Mortgage Status in East Kingston
| Property Value | Without Mortgage | With Mortgage |
| Less than $50,000 | 0 (0.0%) | 3 (7.9%) |
| $50,000 to $99,999 | 0 (0.0%) | 0 (0.0%) |
| $100,000 to $299,999 | 18 (100.0%) | 35 (92.1%) |
| $300,000 to $499,999 | 0 (0.0%) | 0 (0.0%) |
| $500,000 to $749,999 | 0 (0.0%) | 0 (0.0%) |
| $750,000 to $999,999 | 0 (0.0%) | 0 (0.0%) |
| $1,000,000 or more | 0 (0.0%) | 0 (0.0%) |
| Total | 18 (100.0%) | 38 (100.0%) |
Household Income by Mortgage Status in East Kingston
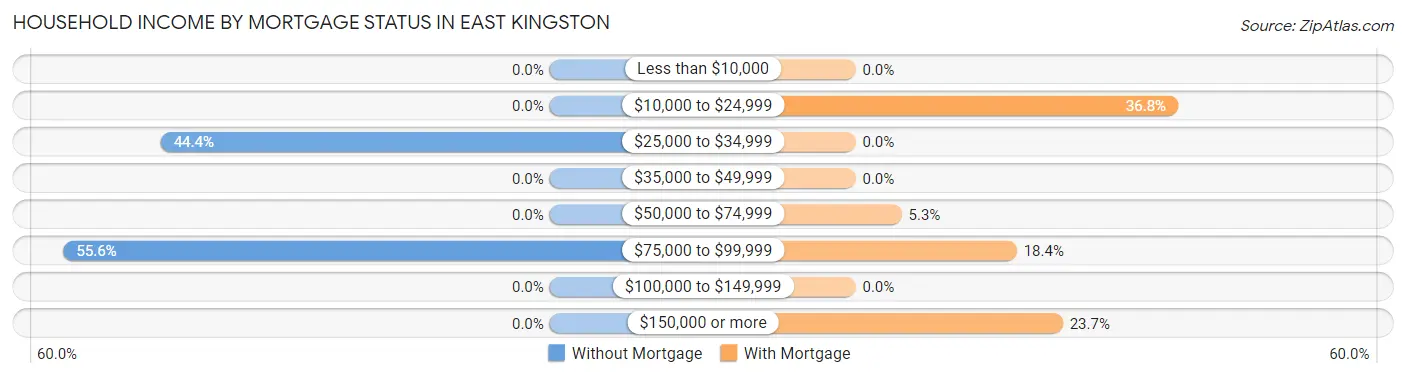
| Household Income | Without Mortgage | With Mortgage |
| Less than $10,000 | 0 (0.0%) | 0 (0.0%) |
| $10,000 to $24,999 | 0 (0.0%) | 14 (36.8%) |
| $25,000 to $34,999 | 8 (44.4%) | 0 (0.0%) |
| $35,000 to $49,999 | 0 (0.0%) | 0 (0.0%) |
| $50,000 to $74,999 | 0 (0.0%) | 2 (5.3%) |
| $75,000 to $99,999 | 10 (55.6%) | 7 (18.4%) |
| $100,000 to $149,999 | 0 (0.0%) | 0 (0.0%) |
| $150,000 or more | 0 (0.0%) | 9 (23.7%) |
| Total | 18 (100.0%) | 38 (100.0%) |
Property Value to Household Income Ratio in East Kingston

| Value-to-Income Ratio | Without Mortgage | With Mortgage |
| Less than 2.0x | 10 (55.6%) | 0 (0.0%) |
| 2.0x to 2.9x | 0 (0.0%) | 9 (23.7%) |
| 3.0x to 3.9x | 0 (0.0%) | 13 (34.2%) |
| 4.0x or more | 8 (44.4%) | 0 (0.0%) |
| Total | 18 (100.0%) | 38 (100.0%) |
Real Estate Taxes by Mortgage Status in East Kingston
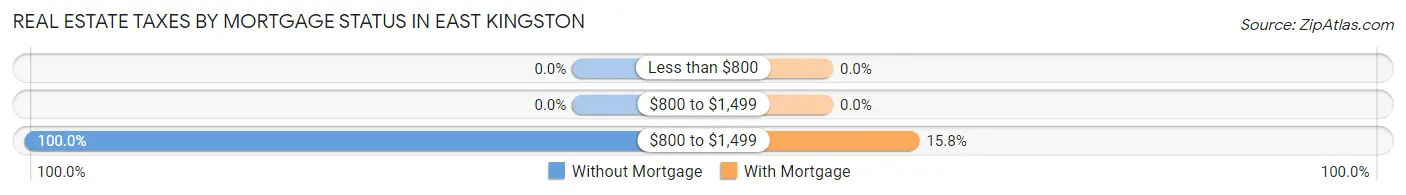
| Property Taxes | Without Mortgage | With Mortgage |
| Less than $800 | 0 (0.0%) | 0 (0.0%) |
| $800 to $1,499 | 0 (0.0%) | 0 (0.0%) |
| $800 to $1,499 | 18 (100.0%) | 6 (15.8%) |
| Total | 18 (100.0%) | 38 (100.0%) |
Health & Disability in East Kingston
Health Insurance Coverage by Age in East Kingston
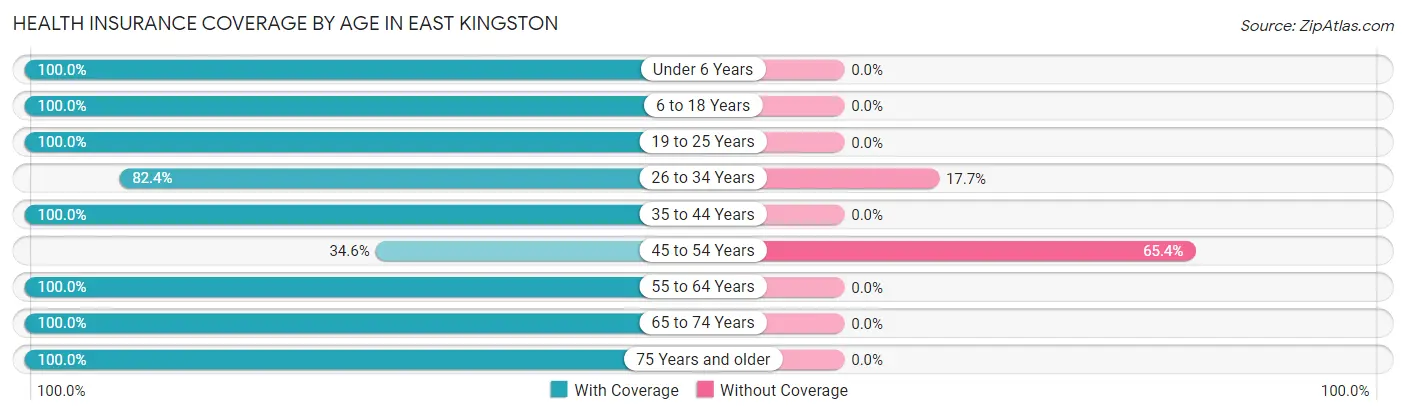
| Age Bracket | With Coverage | Without Coverage |
| Under 6 Years | 14 (100.0%) | 0 (0.0%) |
| 6 to 18 Years | 47 (100.0%) | 0 (0.0%) |
| 19 to 25 Years | 12 (100.0%) | 0 (0.0%) |
| 26 to 34 Years | 28 (82.4%) | 6 (17.6%) |
| 35 to 44 Years | 55 (100.0%) | 0 (0.0%) |
| 45 to 54 Years | 28 (34.6%) | 53 (65.4%) |
| 55 to 64 Years | 26 (100.0%) | 0 (0.0%) |
| 65 to 74 Years | 50 (100.0%) | 0 (0.0%) |
| 75 Years and older | 7 (100.0%) | 0 (0.0%) |
| Total | 267 (81.9%) | 59 (18.1%) |
Health Insurance Coverage by Citizenship Status in East Kingston
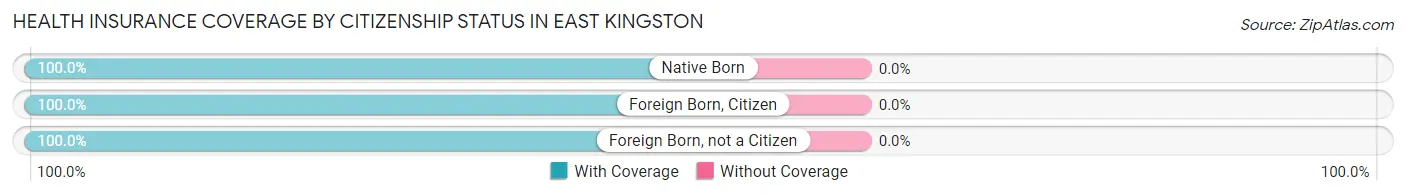
| Citizenship Status | With Coverage | Without Coverage |
| Native Born | 14 (100.0%) | 0 (0.0%) |
| Foreign Born, Citizen | 47 (100.0%) | 0 (0.0%) |
| Foreign Born, not a Citizen | 12 (100.0%) | 0 (0.0%) |
Health Insurance Coverage by Household Income in East Kingston
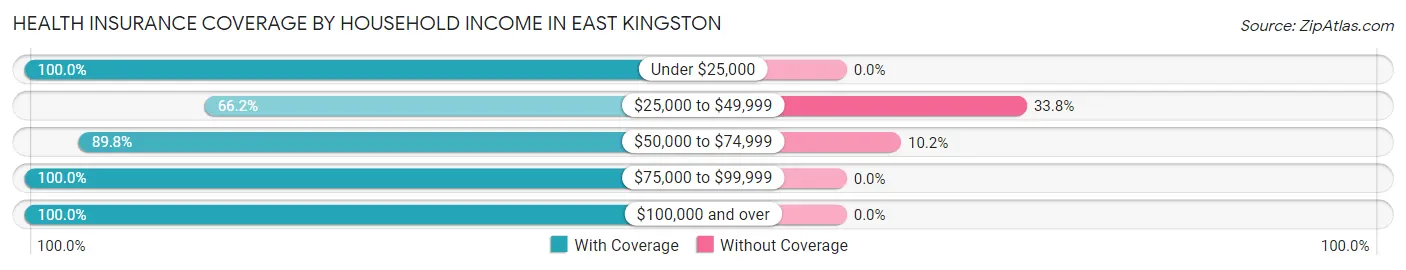
| Household Income | With Coverage | Without Coverage |
| Under $25,000 | 54 (100.0%) | 0 (0.0%) |
| $25,000 to $49,999 | 104 (66.2%) | 53 (33.8%) |
| $50,000 to $74,999 | 53 (89.8%) | 6 (10.2%) |
| $75,000 to $99,999 | 35 (100.0%) | 0 (0.0%) |
| $100,000 and over | 21 (100.0%) | 0 (0.0%) |
Public vs Private Health Insurance Coverage by Age in East Kingston
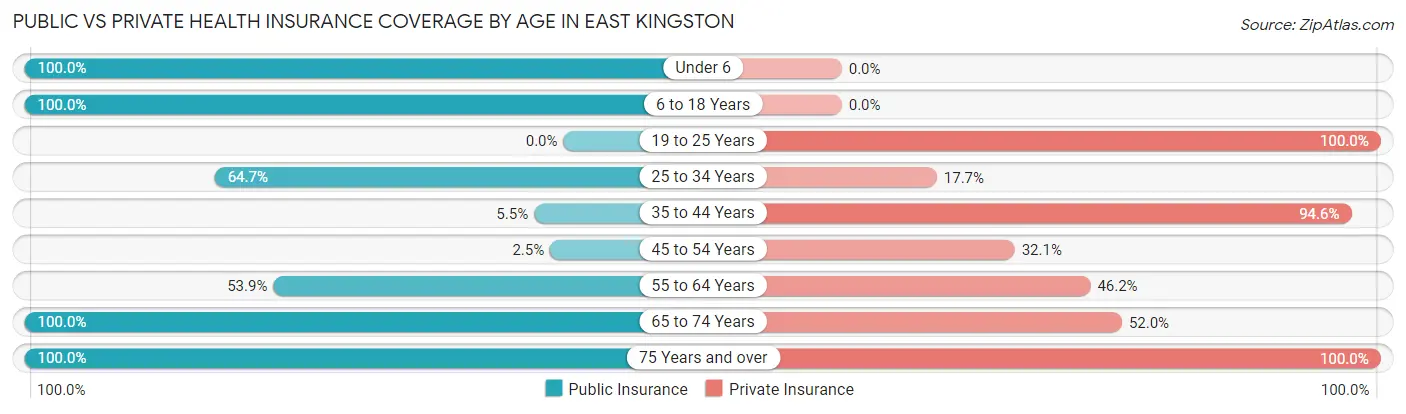
| Age Bracket | Public Insurance | Private Insurance |
| Under 6 | 14 (100.0%) | 0 (0.0%) |
| 6 to 18 Years | 47 (100.0%) | 0 (0.0%) |
| 19 to 25 Years | 0 (0.0%) | 12 (100.0%) |
| 25 to 34 Years | 22 (64.7%) | 6 (17.6%) |
| 35 to 44 Years | 3 (5.4%) | 52 (94.6%) |
| 45 to 54 Years | 2 (2.5%) | 26 (32.1%) |
| 55 to 64 Years | 14 (53.8%) | 12 (46.2%) |
| 65 to 74 Years | 50 (100.0%) | 26 (52.0%) |
| 75 Years and over | 7 (100.0%) | 7 (100.0%) |
| Total | 159 (48.8%) | 141 (43.2%) |
Disability Status by Sex by Age in East Kingston
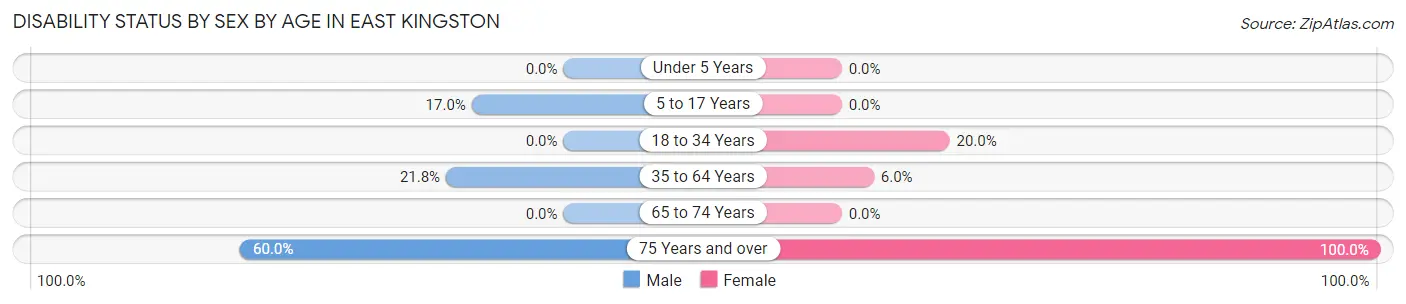
| Age Bracket | Male | Female |
| Under 5 Years | 0 (0.0%) | 0 (0.0%) |
| 5 to 17 Years | 8 (17.0%) | 0 (0.0%) |
| 18 to 34 Years | 0 (0.0%) | 8 (20.0%) |
| 35 to 64 Years | 17 (21.8%) | 5 (5.9%) |
| 65 to 74 Years | 0 (0.0%) | 0 (0.0%) |
| 75 Years and over | 3 (60.0%) | 2 (100.0%) |
Disability Class by Sex by Age in East Kingston
Disability Class: Hearing Difficulty
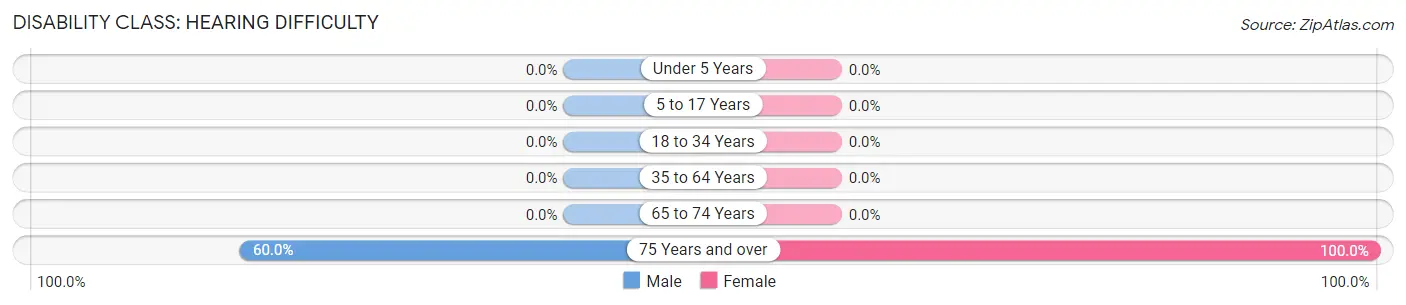
| Age Bracket | Male | Female |
| Under 5 Years | 0 (0.0%) | 0 (0.0%) |
| 5 to 17 Years | 0 (0.0%) | 0 (0.0%) |
| 18 to 34 Years | 0 (0.0%) | 0 (0.0%) |
| 35 to 64 Years | 0 (0.0%) | 0 (0.0%) |
| 65 to 74 Years | 0 (0.0%) | 0 (0.0%) |
| 75 Years and over | 3 (60.0%) | 2 (100.0%) |
Disability Class: Vision Difficulty
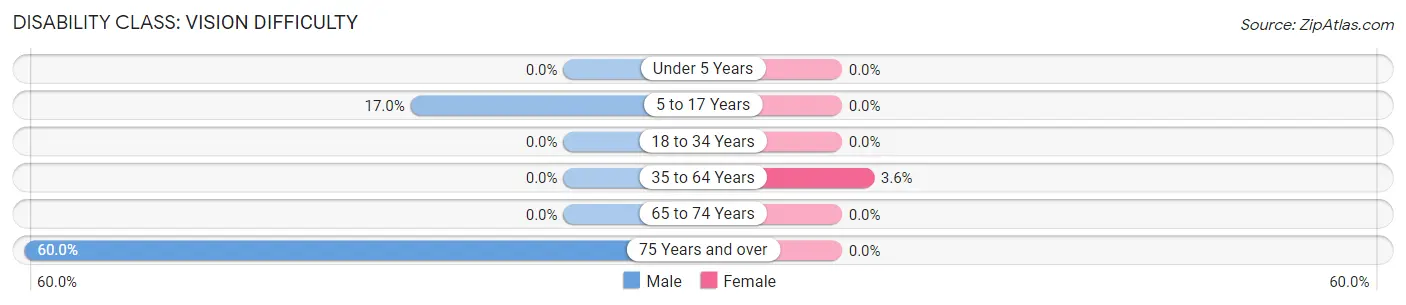
| Age Bracket | Male | Female |
| Under 5 Years | 0 (0.0%) | 0 (0.0%) |
| 5 to 17 Years | 8 (17.0%) | 0 (0.0%) |
| 18 to 34 Years | 0 (0.0%) | 0 (0.0%) |
| 35 to 64 Years | 0 (0.0%) | 3 (3.6%) |
| 65 to 74 Years | 0 (0.0%) | 0 (0.0%) |
| 75 Years and over | 3 (60.0%) | 0 (0.0%) |
Disability Class: Cognitive Difficulty
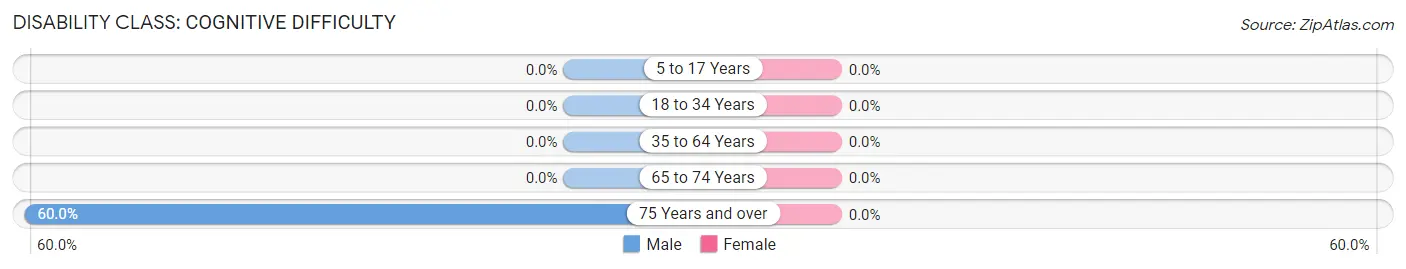
| Age Bracket | Male | Female |
| 5 to 17 Years | 0 (0.0%) | 0 (0.0%) |
| 18 to 34 Years | 0 (0.0%) | 0 (0.0%) |
| 35 to 64 Years | 0 (0.0%) | 0 (0.0%) |
| 65 to 74 Years | 0 (0.0%) | 0 (0.0%) |
| 75 Years and over | 3 (60.0%) | 0 (0.0%) |
Disability Class: Ambulatory Difficulty
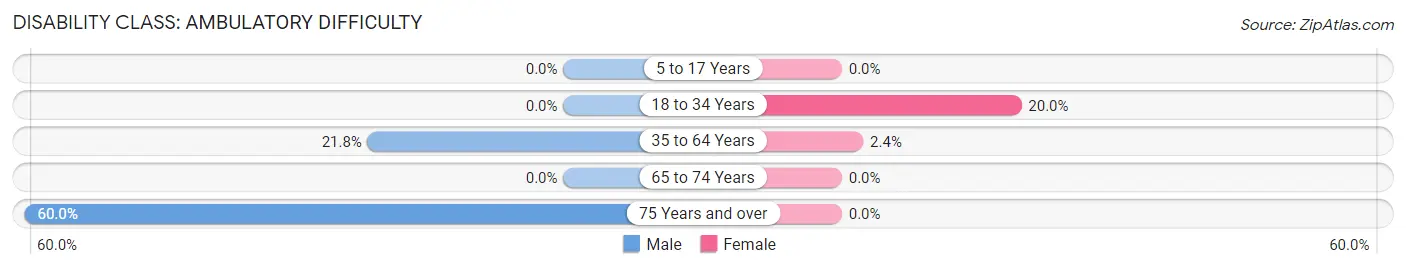
| Age Bracket | Male | Female |
| 5 to 17 Years | 0 (0.0%) | 0 (0.0%) |
| 18 to 34 Years | 0 (0.0%) | 8 (20.0%) |
| 35 to 64 Years | 17 (21.8%) | 2 (2.4%) |
| 65 to 74 Years | 0 (0.0%) | 0 (0.0%) |
| 75 Years and over | 3 (60.0%) | 0 (0.0%) |
Disability Class: Self-Care Difficulty
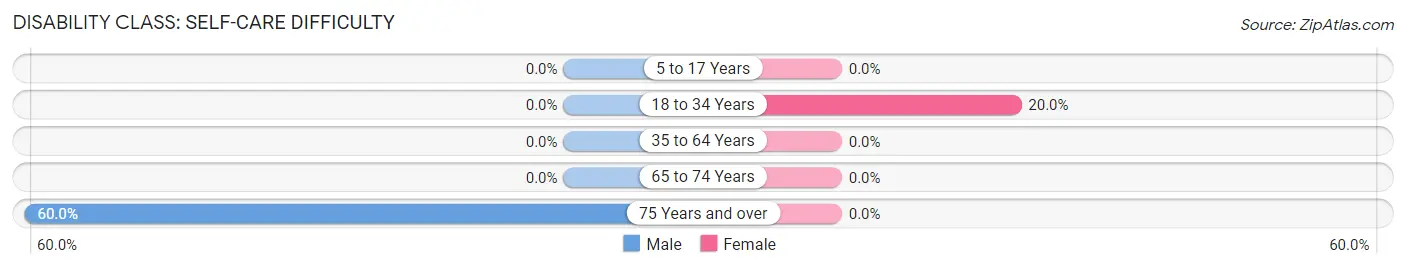
| Age Bracket | Male | Female |
| 5 to 17 Years | 0 (0.0%) | 0 (0.0%) |
| 18 to 34 Years | 0 (0.0%) | 8 (20.0%) |
| 35 to 64 Years | 0 (0.0%) | 0 (0.0%) |
| 65 to 74 Years | 0 (0.0%) | 0 (0.0%) |
| 75 Years and over | 3 (60.0%) | 0 (0.0%) |
Technology Access in East Kingston
Computing Device Access in East Kingston
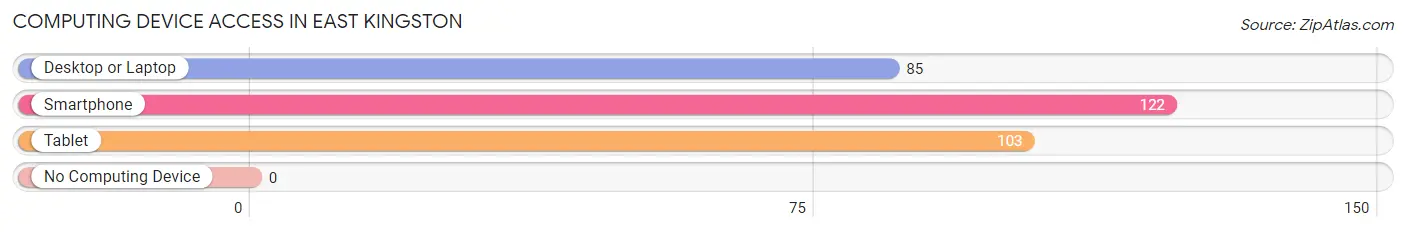
| Device Type | # Households | % Households |
| Desktop or Laptop | 85 | 68.5% |
| Smartphone | 122 | 98.4% |
| Tablet | 103 | 83.1% |
| No Computing Device | 0 | 0.0% |
| Total | 124 | 100.0% |
Internet Access in East Kingston
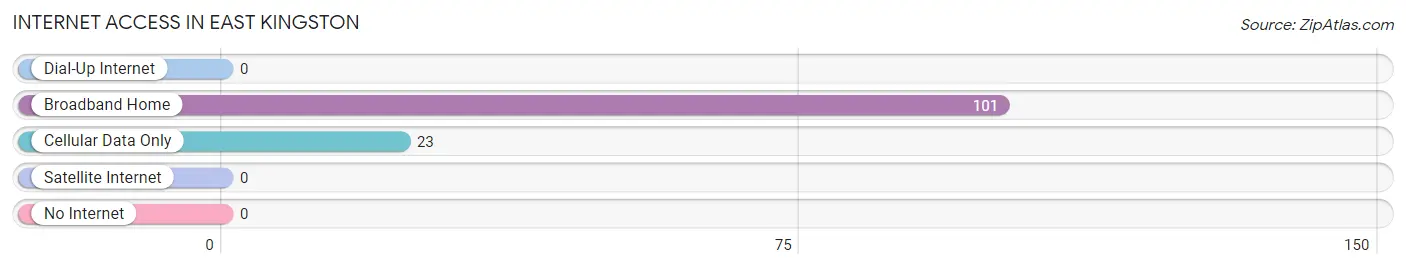
| Internet Type | # Households | % Households |
| Dial-Up Internet | 0 | 0.0% |
| Broadband Home | 101 | 81.5% |
| Cellular Data Only | 23 | 18.5% |
| Satellite Internet | 0 | 0.0% |
| No Internet | 0 | 0.0% |
| Total | 124 | 100.0% |
East Kingston Summary
Kingston, New York is a city located in Ulster County, New York, United States. It is the county seat of Ulster County and is located on the Hudson River, about halfway between New York City and Albany. The city is part of the larger Kingston-Newburgh-Middletown metropolitan area. The population of Kingston was 23,893 at the 2010 census.
History
Kingston was founded in 1652 by Dutch settlers as the first permanent European settlement in what is now New York State. It was named after the Dutch city of Kingston, which is now part of the Netherlands. The settlement was part of the New Netherland colony, which was established by the Dutch West India Company in 1624.
The settlement was originally located on the east side of the Hudson River, but was moved to the west side in 1658 due to flooding. The settlement was destroyed by the British during the Revolutionary War in 1777, but was rebuilt after the war.
In the 19th century, Kingston became an important industrial center, with several factories and mills located along the Rondout Creek. The city was also a major transportation hub, with the Delaware and Hudson Canal and the Ulster and Delaware Railroad connecting it to other parts of the state.
Geography
Kingston is located in the Hudson Valley region of New York State, about halfway between New York City and Albany. It is situated on the west bank of the Hudson River, at the mouth of the Rondout Creek. The city has a total area of 8.2 square miles, of which 7.9 square miles is land and 0.3 square miles is water.
The city is located in the Catskill Mountains, and is surrounded by several parks and nature preserves, including the Catskill Park, the Shawangunk Ridge, and the Hudson Highlands.
Economy
The economy of Kingston is largely based on tourism, manufacturing, and government services. The city is home to several large employers, including the State University of New York at New Paltz, the Ulster County government, and the Kingston City School District.
The city is also home to several large manufacturing companies, including the Kingston-based IBM plant, which produces computer chips and other electronic components. Other major employers in the city include the Kingston Hospital, the Ulster County government, and the Ulster County Community College.
Demographics
As of the 2010 census, the population of Kingston was 23,893. The racial makeup of the city was 79.2% White, 11.3% African American, 0.4% Native American, 2.2% Asian, 0.1% Pacific Islander, 4.2% from other races, and 2.7% from two or more races. Hispanic or Latino of any race were 11.3% of the population.
The median income for a household in the city was $41,945, and the median income for a family was $50,945. The per capita income for the city was $22,945. About 17.2% of families and 20.7% of the population were below the poverty line, including 28.3% of those under age 18 and 11.2% of those age 65 or over.
Common Questions
What is Per Capita Income in East Kingston?
Per Capita income in East Kingston is $22,388.
What is the Median Family Income in East Kingston?
Median Family Income in East Kingston is $37,244.
What is the Median Household income in East Kingston?
Median Household Income in East Kingston is $46,250.
What is Income or Wage Gap in East Kingston?
Income or Wage Gap in East Kingston is 93.1%.
Women in East Kingston earn 6.9 cents for every dollar earned by a man.
What is Inequality or Gini Index in East Kingston?
Inequality or Gini Index in East Kingston is 0.36.
What is the Total Population of East Kingston?
Total Population of East Kingston is 326.
What is the Total Male Population of East Kingston?
Total Male Population of East Kingston is 160.
What is the Total Female Population of East Kingston?
Total Female Population of East Kingston is 166.
What is the Ratio of Males per 100 Females in East Kingston?
There are 96.39 Males per 100 Females in East Kingston.
What is the Ratio of Females per 100 Males in East Kingston?
There are 103.75 Females per 100 Males in East Kingston.
What is the Median Population Age in East Kingston?
Median Population Age in East Kingston is 47.0 Years.
What is the Average Family Size in East Kingston
Average Family Size in East Kingston is 2.4 People.
What is the Average Household Size in East Kingston
Average Household Size in East Kingston is 2.6 People.
How Large is the Labor Force in East Kingston?
There are 233 People in the Labor Forcein in East Kingston.
What is the Percentage of People in the Labor Force in East Kingston?
87.9% of People are in the Labor Force in East Kingston.
What is the Unemployment Rate in East Kingston?
Unemployment Rate in East Kingston is 22.7%.