Green Island, NY Map & Demographics
Green Island Map
Green Island Overview
$34,742
PER CAPITA INCOME
$72,250
AVG FAMILY INCOME
$64,018
AVG HOUSEHOLD INCOME
16.8%
WAGE / INCOME GAP [ % ]
83.2¢/ $1
WAGE / INCOME GAP [ $ ]
0.41
INEQUALITY / GINI INDEX
2,968
TOTAL POPULATION
1,422
MALE POPULATION
1,546
FEMALE POPULATION
91.98
MALES / 100 FEMALES
108.72
FEMALES / 100 MALES
37.9
MEDIAN AGE
3.0
AVG FAMILY SIZE
2.2
AVG HOUSEHOLD SIZE
1,495
LABOR FORCE [ PEOPLE ]
60.2%
PERCENT IN LABOR FORCE
13.0%
UNEMPLOYMENT RATE
Green Island Area Codes
Income in Green Island
Income Overview in Green Island
Per Capita Income in Green Island is $34,742, while median incomes of families and households are $72,250 and $64,018 respectively.
| Characteristic | Number | Measure |
| Per Capita Income | 2,968 | $34,742 |
| Median Family Income | 574 | $72,250 |
| Mean Family Income | 574 | $90,413 |
| Median Household Income | 1,344 | $64,018 |
| Mean Household Income | 1,344 | $73,669 |
| Income Deficit | 574 | $0 |
| Wage / Income Gap (%) | 2,968 | 16.82% |
| Wage / Income Gap ($) | 2,968 | 83.18¢ per $1 |
| Gini / Inequality Index | 2,968 | 0.41 |
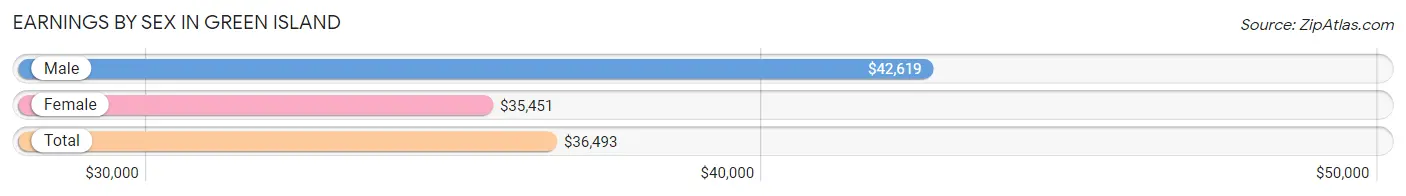
Earnings by Sex in Green Island
Average Earnings in Green Island are $36,493, $42,619 for men and $35,451 for women, a difference of 16.8%.
| Sex | Number | Average Earnings |
| Male | 934 (58.7%) | $42,619 |
| Female | 656 (41.3%) | $35,451 |
| Total | 1,590 (100.0%) | $36,493 |
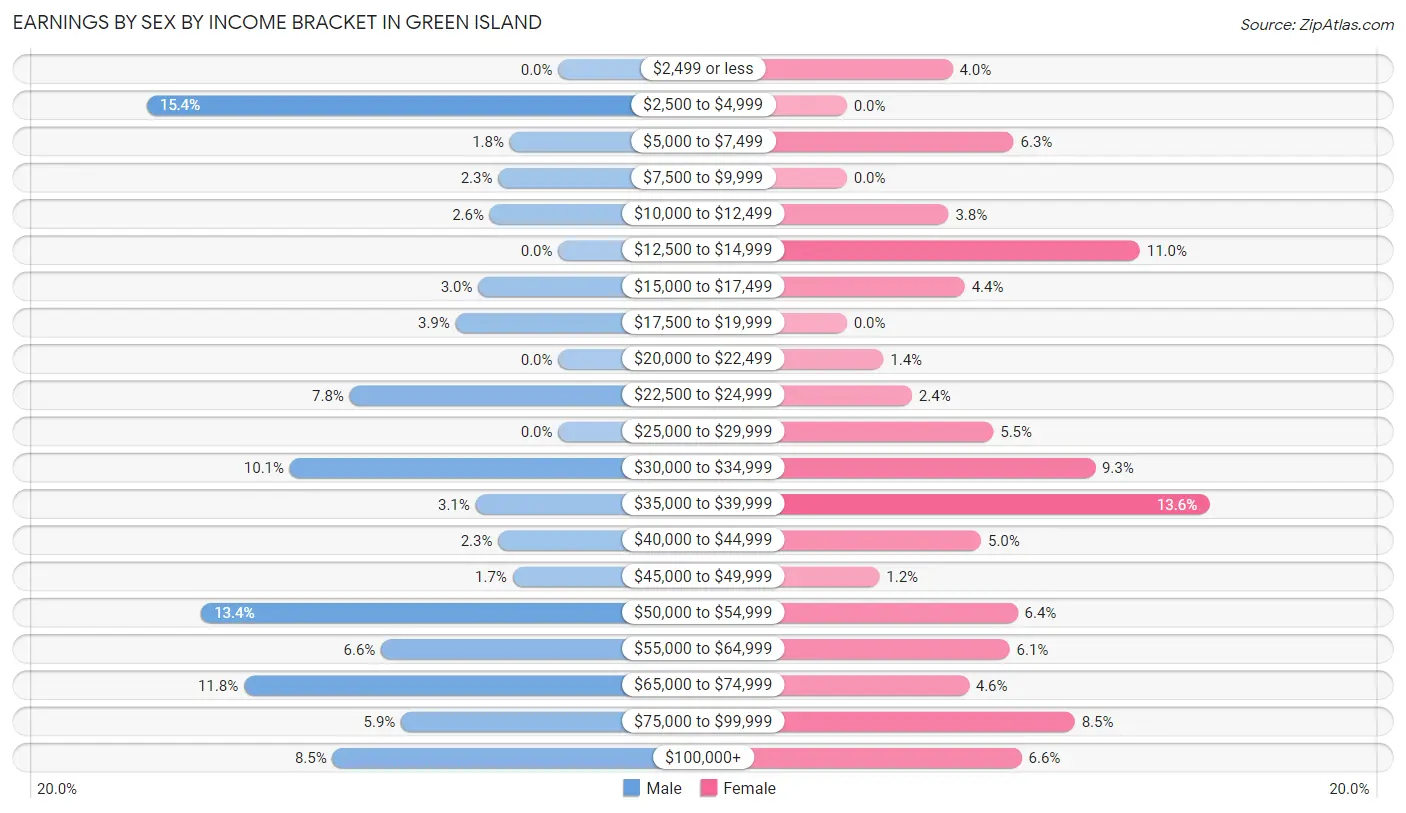
Earnings by Sex by Income Bracket in Green Island
The most common earnings brackets in Green Island are $2,500 to $4,999 for men (144 | 15.4%) and $35,000 to $39,999 for women (89 | 13.6%).
| Income | Male | Female |
| $2,499 or less | 0 (0.0%) | 26 (4.0%) |
| $2,500 to $4,999 | 144 (15.4%) | 0 (0.0%) |
| $5,000 to $7,499 | 17 (1.8%) | 41 (6.2%) |
| $7,500 to $9,999 | 21 (2.2%) | 0 (0.0%) |
| $10,000 to $12,499 | 24 (2.6%) | 25 (3.8%) |
| $12,500 to $14,999 | 0 (0.0%) | 72 (11.0%) |
| $15,000 to $17,499 | 28 (3.0%) | 29 (4.4%) |
| $17,500 to $19,999 | 36 (3.8%) | 0 (0.0%) |
| $20,000 to $22,499 | 0 (0.0%) | 9 (1.4%) |
| $22,500 to $24,999 | 73 (7.8%) | 16 (2.4%) |
| $25,000 to $29,999 | 0 (0.0%) | 36 (5.5%) |
| $30,000 to $34,999 | 94 (10.1%) | 61 (9.3%) |
| $35,000 to $39,999 | 29 (3.1%) | 89 (13.6%) |
| $40,000 to $44,999 | 21 (2.2%) | 33 (5.0%) |
| $45,000 to $49,999 | 16 (1.7%) | 8 (1.2%) |
| $50,000 to $54,999 | 125 (13.4%) | 42 (6.4%) |
| $55,000 to $64,999 | 62 (6.6%) | 40 (6.1%) |
| $65,000 to $74,999 | 110 (11.8%) | 30 (4.6%) |
| $75,000 to $99,999 | 55 (5.9%) | 56 (8.5%) |
| $100,000+ | 79 (8.5%) | 43 (6.6%) |
| Total | 934 (100.0%) | 656 (100.0%) |
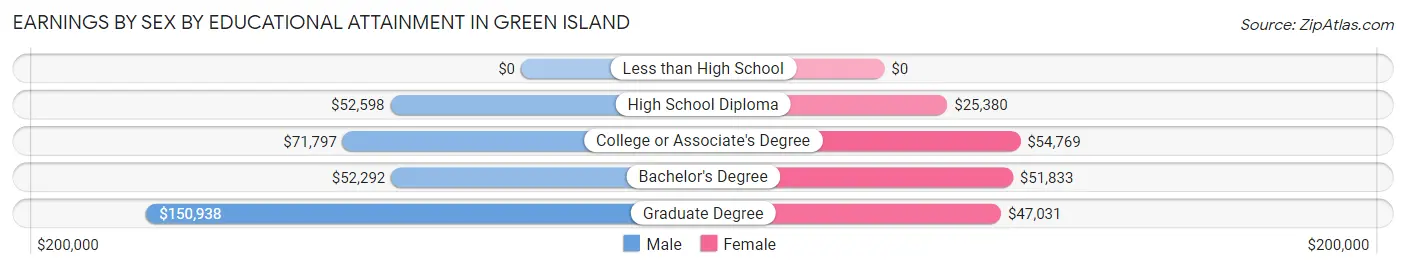
Earnings by Sex by Educational Attainment in Green Island
Average earnings in Green Island are $54,077 for men and $44,250 for women, a difference of 18.2%. Men with an educational attainment of graduate degree enjoy the highest average annual earnings of $150,938, while those with bachelor's degree education earn the least with $52,292. Women with an educational attainment of college or associate's degree earn the most with the average annual earnings of $54,769, while those with high school diploma education have the smallest earnings of $25,380.
| Educational Attainment | Male Income | Female Income |
| Less than High School | - | - |
| High School Diploma | $52,598 | $25,380 |
| College or Associate's Degree | $71,797 | $54,769 |
| Bachelor's Degree | $52,292 | $51,833 |
| Graduate Degree | $150,938 | $47,031 |
| Total | $54,077 | $44,250 |
Family Income in Green Island
Family Income Brackets in Green Island
According to the Green Island family income data, there are 105 families falling into the $100,000 to $149,999 income range, which is the most common income bracket and makes up 18.3% of all families.
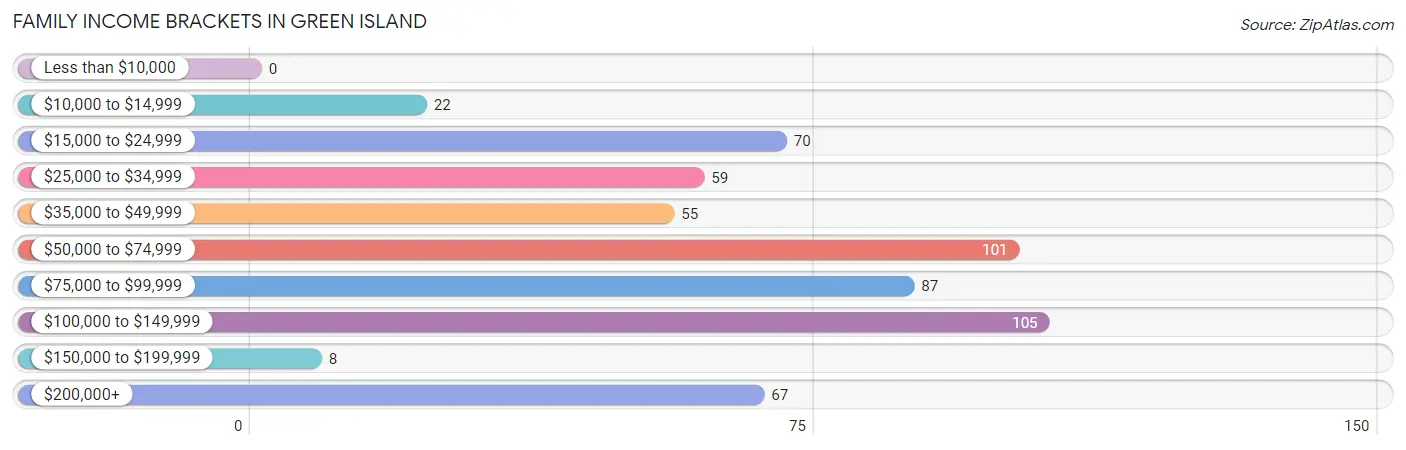
| Income Bracket | # Families | % Families |
| Less than $10,000 | 0 | 0.0% |
| $10,000 to $14,999 | 22 | 3.8% |
| $15,000 to $24,999 | 70 | 12.2% |
| $25,000 to $34,999 | 59 | 10.3% |
| $35,000 to $49,999 | 55 | 9.6% |
| $50,000 to $74,999 | 101 | 17.6% |
| $75,000 to $99,999 | 87 | 15.2% |
| $100,000 to $149,999 | 105 | 18.3% |
| $150,000 to $199,999 | 8 | 1.4% |
| $200,000+ | 67 | 11.7% |
Family Income by Famaliy Size in Green Island
2-person families (386 | 67.2%) account for the highest median family income in Green Island with $83,750 per family, while 2-person families (386 | 67.2%) have the highest median income of $41,875 per family member.
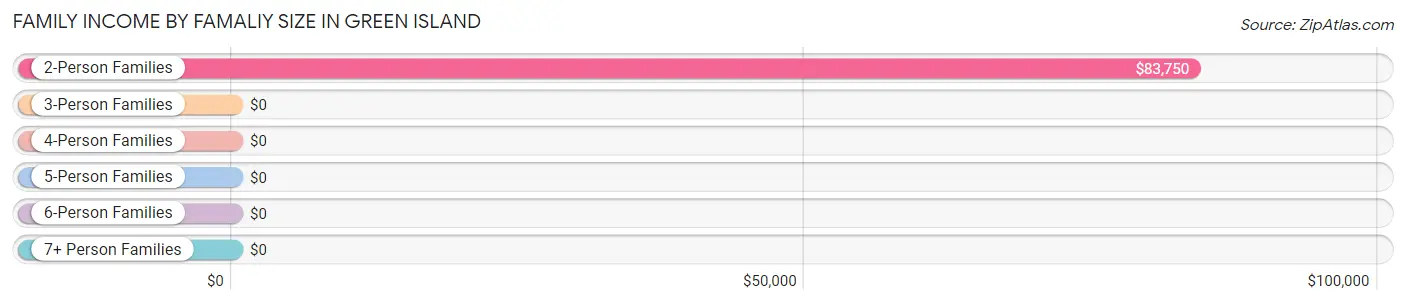
| Income Bracket | # Families | Median Income |
| 2-Person Families | 386 (67.2%) | $83,750 |
| 3-Person Families | 145 (25.3%) | $0 |
| 4-Person Families | 24 (4.2%) | $0 |
| 5-Person Families | 0 (0.0%) | $0 |
| 6-Person Families | 19 (3.3%) | $0 |
| 7+ Person Families | 0 (0.0%) | $0 |
| Total | 574 (100.0%) | $72,250 |
Family Income by Number of Earners in Green Island
The median family income in Green Island is $72,250, with families comprising 3+ earners (36) having the highest median family income of $215,556, while families with no earners (156) have the lowest median family income of $64,605, accounting for 6.3% and 27.2% of families, respectively.
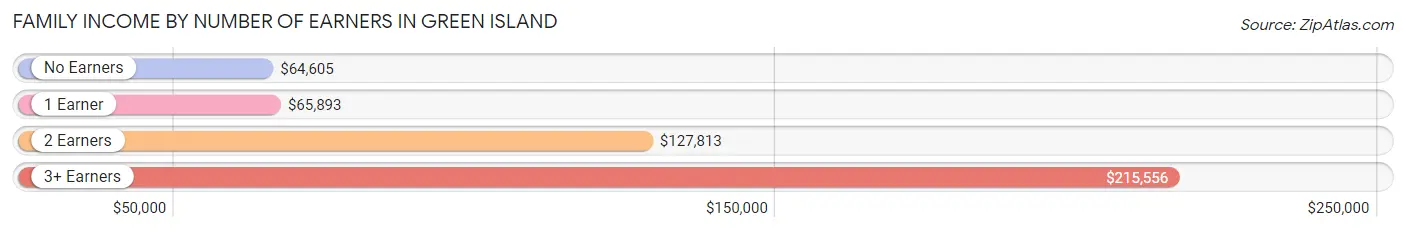
| Number of Earners | # Families | Median Income |
| No Earners | 156 (27.2%) | $64,605 |
| 1 Earner | 270 (47.0%) | $65,893 |
| 2 Earners | 112 (19.5%) | $127,813 |
| 3+ Earners | 36 (6.3%) | $215,556 |
| Total | 574 (100.0%) | $72,250 |
Household Income in Green Island
Household Income Brackets in Green Island
With 251 households falling in the category, the $75,000 to $99,999 income range is the most frequent in Green Island, accounting for 18.7% of all households. In contrast, only 9 households (0.7%) fall into the less than $10,000 income bracket, making it the least populous group.
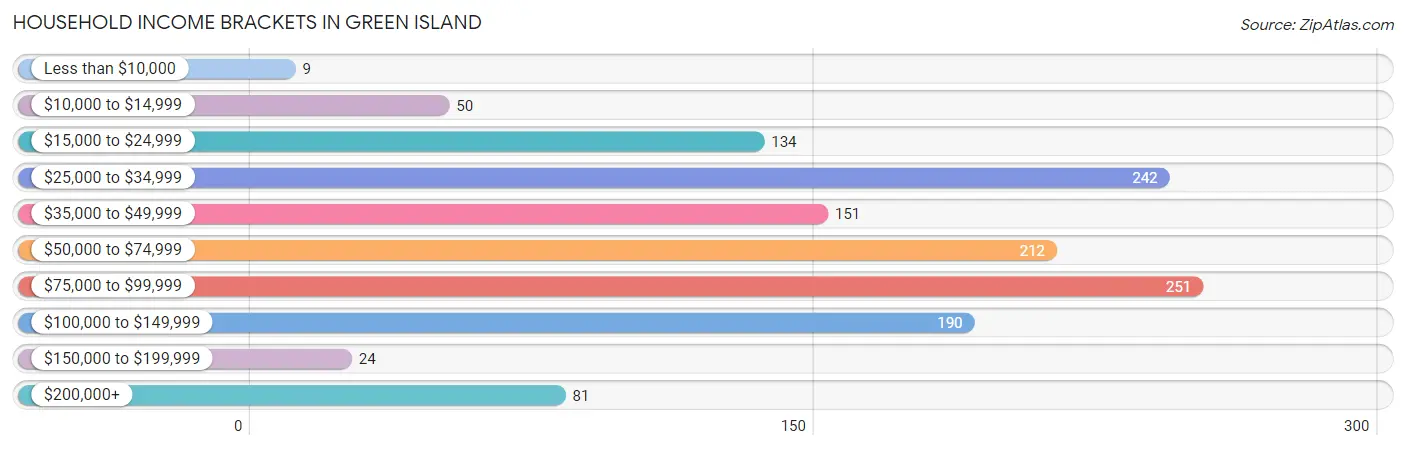
| Income Bracket | # Households | % Households |
| Less than $10,000 | 9 | 0.7% |
| $10,000 to $14,999 | 50 | 3.7% |
| $15,000 to $24,999 | 134 | 10.0% |
| $25,000 to $34,999 | 242 | 18.0% |
| $35,000 to $49,999 | 151 | 11.2% |
| $50,000 to $74,999 | 212 | 15.8% |
| $75,000 to $99,999 | 251 | 18.7% |
| $100,000 to $149,999 | 190 | 14.1% |
| $150,000 to $199,999 | 24 | 1.8% |
| $200,000+ | 81 | 6.0% |
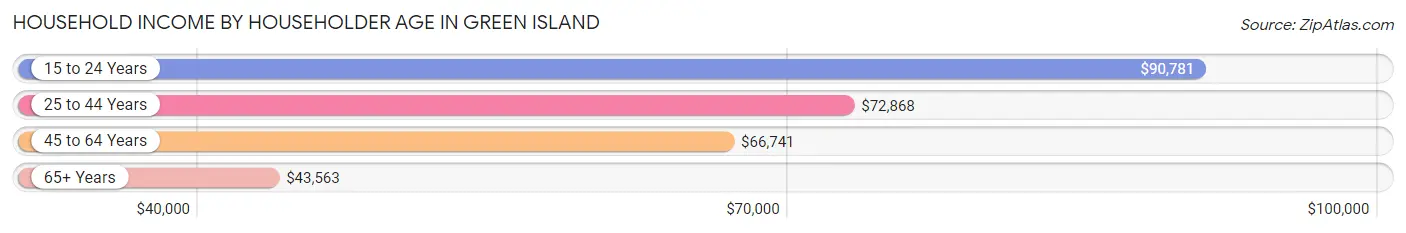
Household Income by Householder Age in Green Island
The median household income in Green Island is $64,018, with the highest median household income of $90,781 found in the 15 to 24 years age bracket for the primary householder. A total of 99 households (7.4%) fall into this category. Meanwhile, the 65+ years age bracket for the primary householder has the lowest median household income of $43,563, with 309 households (23.0%) in this group.
| Income Bracket | # Households | Median Income |
| 15 to 24 Years | 99 (7.4%) | $90,781 |
| 25 to 44 Years | 301 (22.4%) | $72,868 |
| 45 to 64 Years | 635 (47.2%) | $66,741 |
| 65+ Years | 309 (23.0%) | $43,563 |
| Total | 1,344 (100.0%) | $64,018 |
Poverty in Green Island
Income Below Poverty by Sex and Age in Green Island
With 18.3% poverty level for males and 33.1% for females among the residents of Green Island, under 5 year old males and 12 to 14 year old females are the most vulnerable to poverty, with 88 males (82.2%) and 61 females (100.0%) in their respective age groups living below the poverty level.
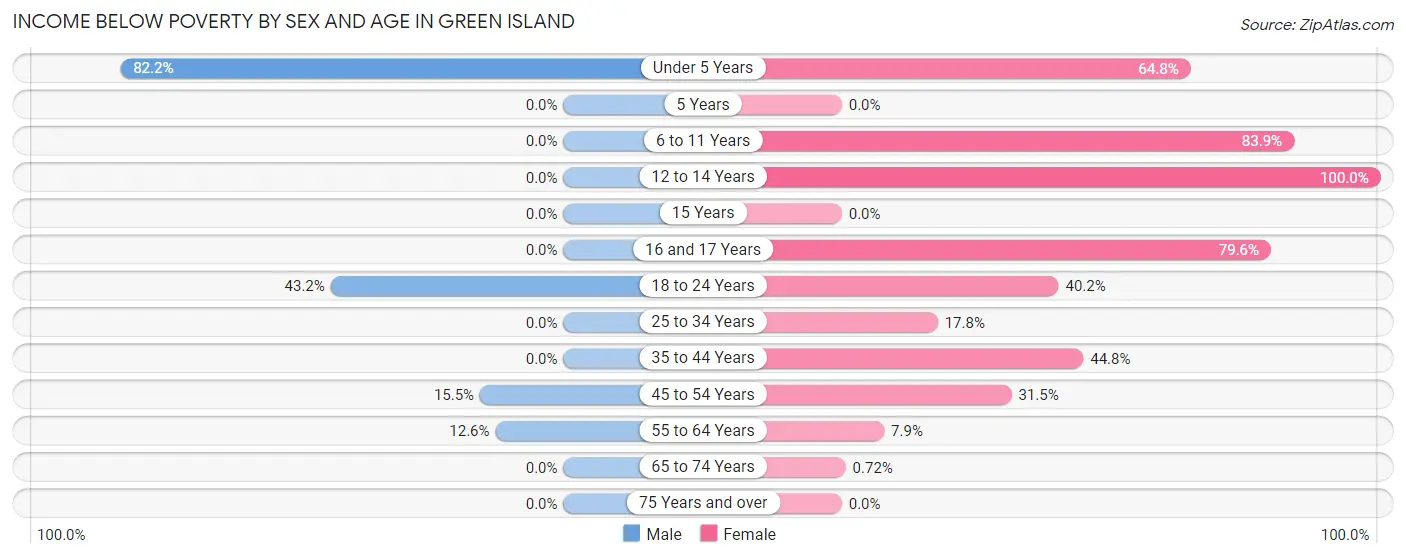
| Age Bracket | Male | Female |
| Under 5 Years | 88 (82.2%) | 90 (64.7%) |
| 5 Years | 0 (0.0%) | 0 (0.0%) |
| 6 to 11 Years | 0 (0.0%) | 73 (83.9%) |
| 12 to 14 Years | 0 (0.0%) | 61 (100.0%) |
| 15 Years | 0 (0.0%) | 0 (0.0%) |
| 16 and 17 Years | 0 (0.0%) | 43 (79.6%) |
| 18 to 24 Years | 108 (43.2%) | 68 (40.2%) |
| 25 to 34 Years | 0 (0.0%) | 26 (17.8%) |
| 35 to 44 Years | 0 (0.0%) | 39 (44.8%) |
| 45 to 54 Years | 37 (15.5%) | 92 (31.5%) |
| 55 to 64 Years | 26 (12.6%) | 18 (7.9%) |
| 65 to 74 Years | 0 (0.0%) | 1 (0.7%) |
| 75 Years and over | 0 (0.0%) | 0 (0.0%) |
| Total | 259 (18.3%) | 511 (33.1%) |
Income Above Poverty by Sex and Age in Green Island
According to the poverty statistics in Green Island, males aged 12 to 14 years and females aged 15 years are the age groups that are most secure financially, with 100.0% of males and 100.0% of females in these age groups living above the poverty line.
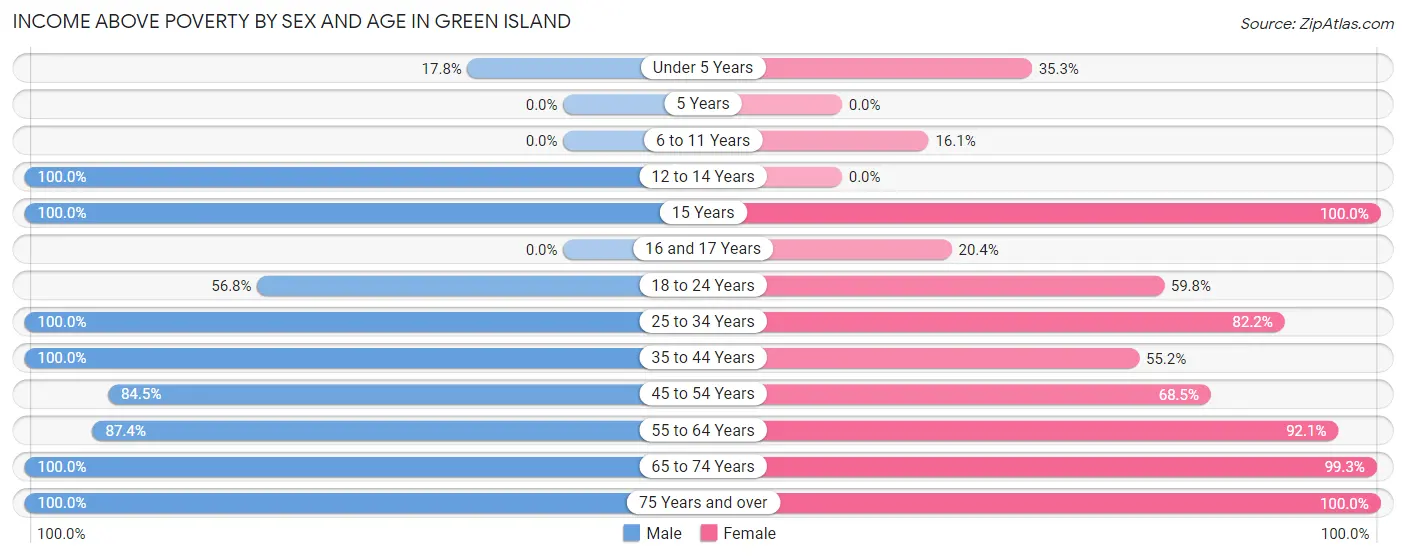
| Age Bracket | Male | Female |
| Under 5 Years | 19 (17.8%) | 49 (35.2%) |
| 5 Years | 0 (0.0%) | 0 (0.0%) |
| 6 to 11 Years | 0 (0.0%) | 14 (16.1%) |
| 12 to 14 Years | 41 (100.0%) | 0 (0.0%) |
| 15 Years | 33 (100.0%) | 8 (100.0%) |
| 16 and 17 Years | 0 (0.0%) | 11 (20.4%) |
| 18 to 24 Years | 142 (56.8%) | 101 (59.8%) |
| 25 to 34 Years | 324 (100.0%) | 120 (82.2%) |
| 35 to 44 Years | 43 (100.0%) | 48 (55.2%) |
| 45 to 54 Years | 202 (84.5%) | 200 (68.5%) |
| 55 to 64 Years | 180 (87.4%) | 211 (92.1%) |
| 65 to 74 Years | 99 (100.0%) | 138 (99.3%) |
| 75 Years and over | 71 (100.0%) | 135 (100.0%) |
| Total | 1,154 (81.7%) | 1,035 (66.9%) |
Income Below Poverty Among Married-Couple Families in Green Island
The poverty statistics for married-couple families in Green Island show that 6.7% or 25 of the total 374 families live below the poverty line. Families with no children have the highest poverty rate of 7.5%, comprising of 25 families. On the other hand, families with 1 or 2 children have the lowest poverty rate of 0.0%, which includes 0 families.
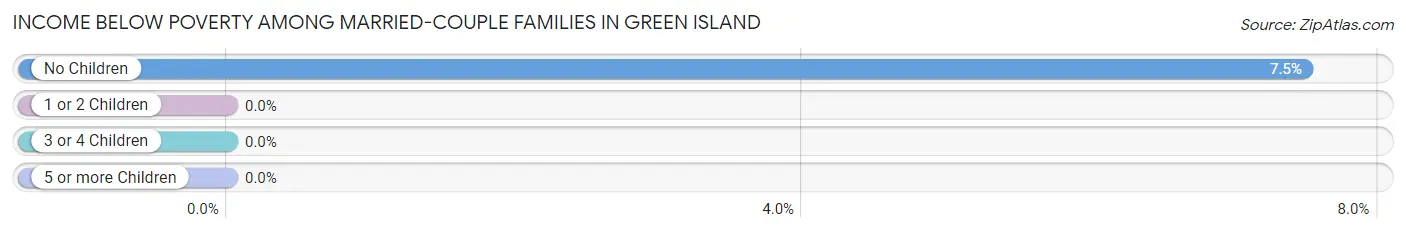
| Children | Above Poverty | Below Poverty |
| No Children | 309 (92.5%) | 25 (7.5%) |
| 1 or 2 Children | 40 (100.0%) | 0 (0.0%) |
| 3 or 4 Children | 0 (0.0%) | 0 (0.0%) |
| 5 or more Children | 0 (0.0%) | 0 (0.0%) |
| Total | 349 (93.3%) | 25 (6.7%) |
Income Below Poverty Among Single-Parent Households in Green Island
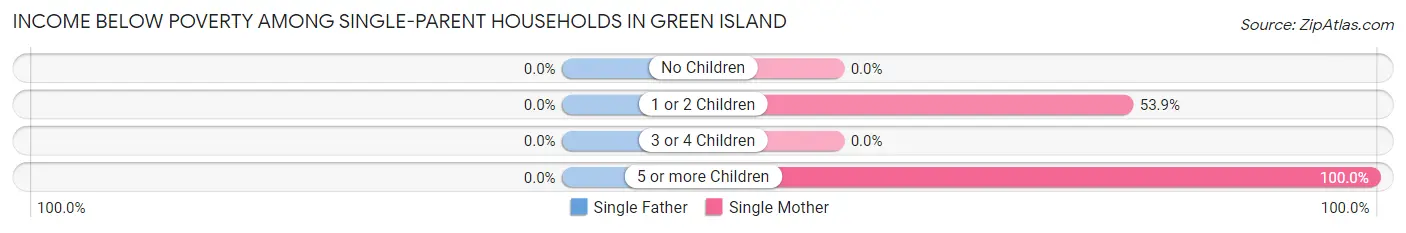
| Children | Single Father | Single Mother |
| No Children | 0 (0.0%) | 0 (0.0%) |
| 1 or 2 Children | 0 (0.0%) | 42 (53.8%) |
| 3 or 4 Children | 0 (0.0%) | 0 (0.0%) |
| 5 or more Children | 0 (0.0%) | 19 (100.0%) |
| Total | 0 (0.0%) | 61 (62.9%) |
Income Below Poverty Among Married-Couple vs Single-Parent Households in Green Island
The poverty data for Green Island shows that 25 of the married-couple family households (6.7%) and 61 of the single-parent households (30.5%) are living below the poverty level. Within the married-couple family households, those with no children have the highest poverty rate, with 25 households (7.5%) falling below the poverty line. Among the single-parent households, those with 5 or more children have the highest poverty rate, with 19 household (100.0%) living below poverty.
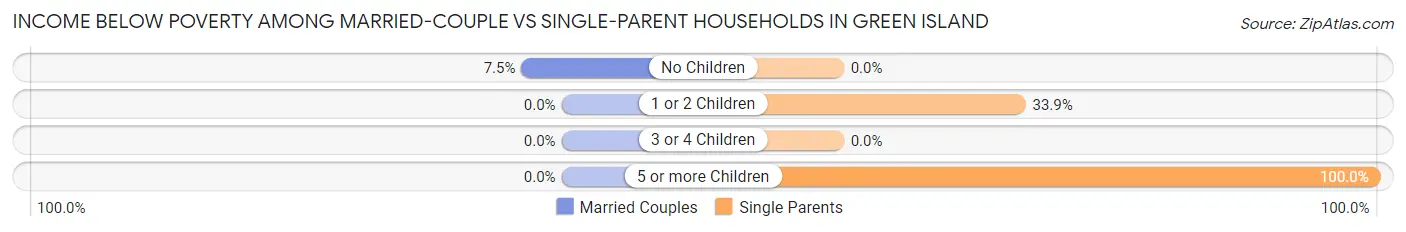
| Children | Married-Couple Families | Single-Parent Households |
| No Children | 25 (7.5%) | 0 (0.0%) |
| 1 or 2 Children | 0 (0.0%) | 42 (33.9%) |
| 3 or 4 Children | 0 (0.0%) | 0 (0.0%) |
| 5 or more Children | 0 (0.0%) | 19 (100.0%) |
| Total | 25 (6.7%) | 61 (30.5%) |
Race in Green Island
The most populous races in Green Island are White / Caucasian (2,260 | 76.1%), Hispanic or Latino (404 | 13.6%), and Two or more Races (280 | 9.4%).
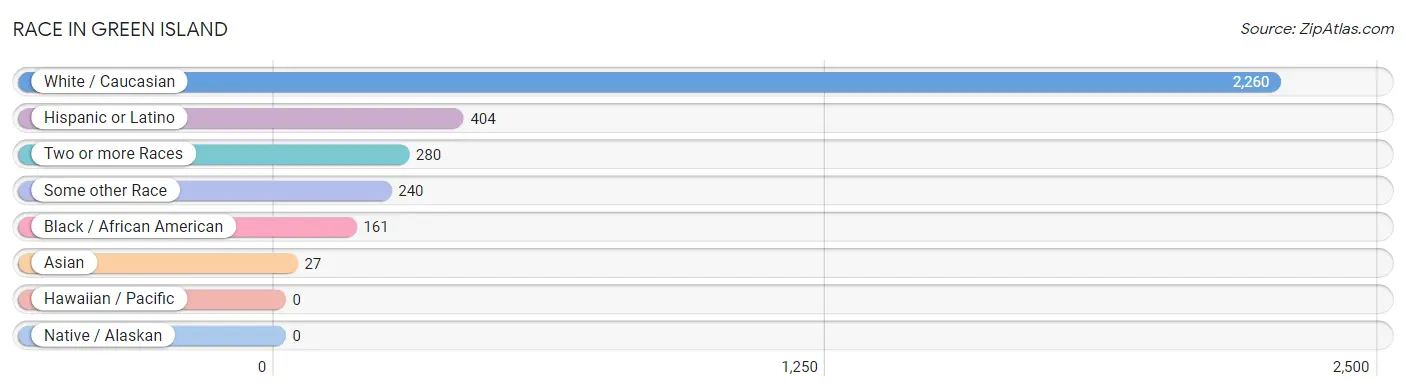
| Race | # Population | % Population |
| Asian | 27 | 0.9% |
| Black / African American | 161 | 5.4% |
| Hawaiian / Pacific | 0 | 0.0% |
| Hispanic or Latino | 404 | 13.6% |
| Native / Alaskan | 0 | 0.0% |
| White / Caucasian | 2,260 | 76.1% |
| Two or more Races | 280 | 9.4% |
| Some other Race | 240 | 8.1% |
| Total | 2,968 | 100.0% |
Ancestry in Green Island
The most populous ancestries reported in Green Island are Irish (842 | 28.4%), Italian (586 | 19.7%), German (427 | 14.4%), Puerto Rican (386 | 13.0%), and English (219 | 7.4%), together accounting for 82.9% of all Green Island residents.
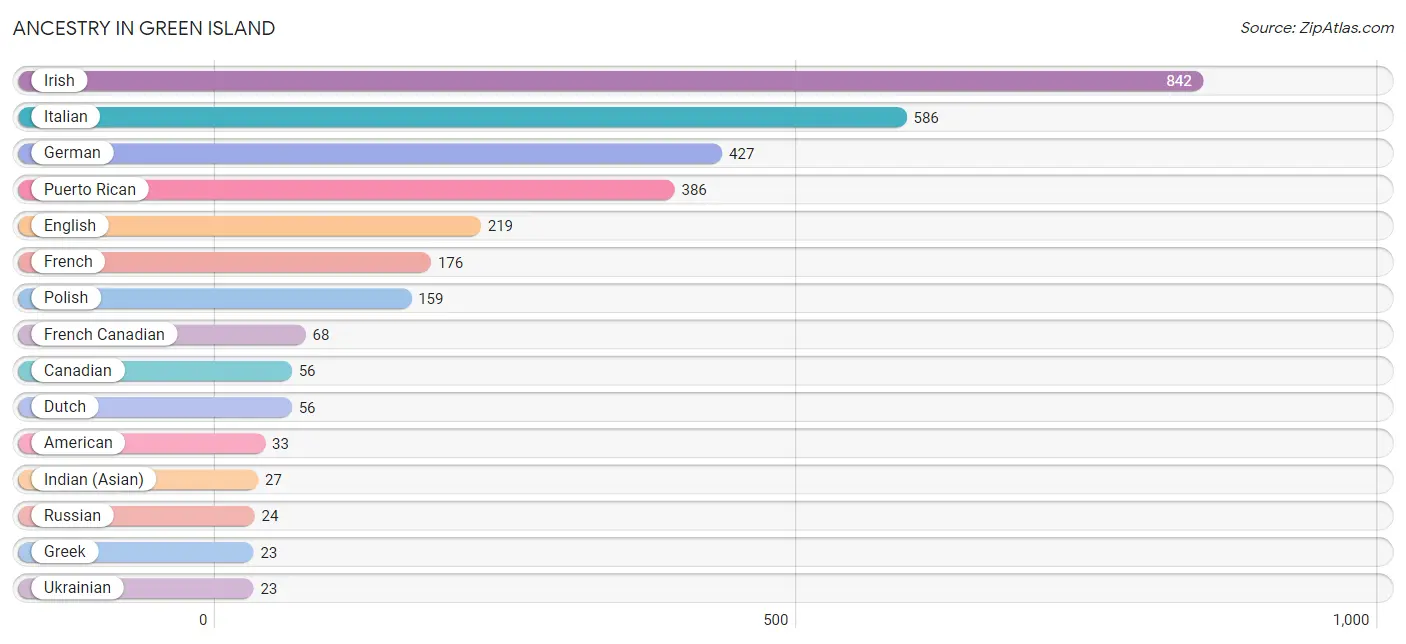
| Ancestry | # Population | % Population |
| American | 33 | 1.1% |
| Canadian | 56 | 1.9% |
| Dutch | 56 | 1.9% |
| English | 219 | 7.4% |
| French | 176 | 5.9% |
| French American Indian | 9 | 0.3% |
| French Canadian | 68 | 2.3% |
| German | 427 | 14.4% |
| Greek | 23 | 0.8% |
| Hungarian | 4 | 0.1% |
| Indian (Asian) | 27 | 0.9% |
| Irish | 842 | 28.4% |
| Italian | 586 | 19.7% |
| Jamaican | 10 | 0.3% |
| Polish | 159 | 5.4% |
| Puerto Rican | 386 | 13.0% |
| Russian | 24 | 0.8% |
| Scottish | 19 | 0.6% |
| Slavic | 11 | 0.4% |
| Spanish | 18 | 0.6% |
| Ukrainian | 23 | 0.8% |
| Welsh | 7 | 0.2% | View All 22 Rows |
Immigrants in Green Island
The most numerous immigrant groups reported in Green Island came from Europe (72 | 2.4%), Italy (48 | 1.6%), Southern Europe (48 | 1.6%), Germany (24 | 0.8%), and Western Europe (24 | 0.8%), together accounting for 7.3% of all Green Island residents.
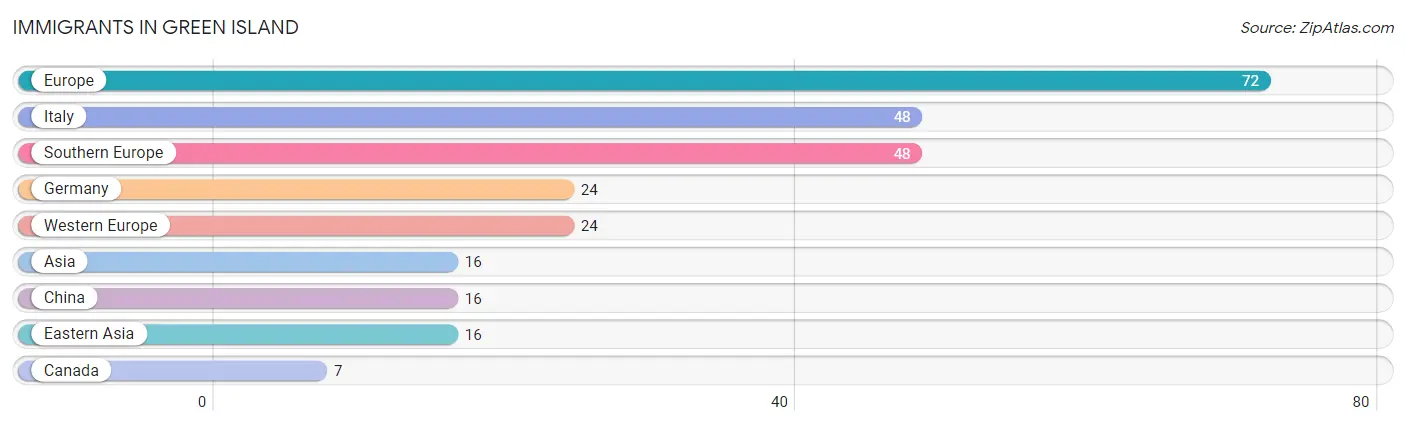
| Immigration Origin | # Population | % Population |
| Asia | 16 | 0.5% |
| Canada | 7 | 0.2% |
| China | 16 | 0.5% |
| Eastern Asia | 16 | 0.5% |
| Europe | 72 | 2.4% |
| Germany | 24 | 0.8% |
| Italy | 48 | 1.6% |
| Southern Europe | 48 | 1.6% |
| Western Europe | 24 | 0.8% | View All 9 Rows |
Sex and Age in Green Island
Sex and Age in Green Island
The most populous age groups in Green Island are 25 to 29 Years (221 | 15.5%) for men and 20 to 24 Years (169 | 10.9%) for women.
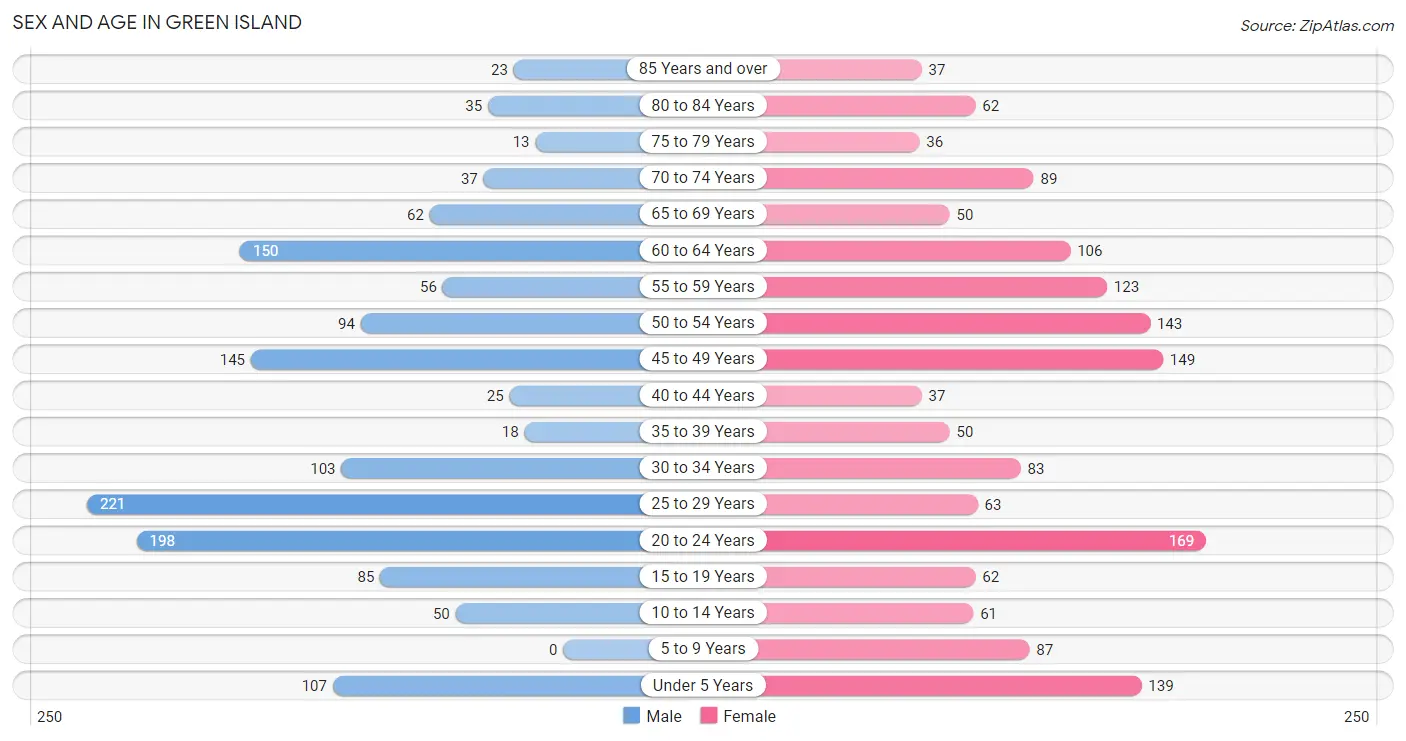
| Age Bracket | Male | Female |
| Under 5 Years | 107 (7.5%) | 139 (9.0%) |
| 5 to 9 Years | 0 (0.0%) | 87 (5.6%) |
| 10 to 14 Years | 50 (3.5%) | 61 (4.0%) |
| 15 to 19 Years | 85 (6.0%) | 62 (4.0%) |
| 20 to 24 Years | 198 (13.9%) | 169 (10.9%) |
| 25 to 29 Years | 221 (15.5%) | 63 (4.1%) |
| 30 to 34 Years | 103 (7.2%) | 83 (5.4%) |
| 35 to 39 Years | 18 (1.3%) | 50 (3.2%) |
| 40 to 44 Years | 25 (1.8%) | 37 (2.4%) |
| 45 to 49 Years | 145 (10.2%) | 149 (9.6%) |
| 50 to 54 Years | 94 (6.6%) | 143 (9.2%) |
| 55 to 59 Years | 56 (3.9%) | 123 (8.0%) |
| 60 to 64 Years | 150 (10.5%) | 106 (6.9%) |
| 65 to 69 Years | 62 (4.4%) | 50 (3.2%) |
| 70 to 74 Years | 37 (2.6%) | 89 (5.8%) |
| 75 to 79 Years | 13 (0.9%) | 36 (2.3%) |
| 80 to 84 Years | 35 (2.5%) | 62 (4.0%) |
| 85 Years and over | 23 (1.6%) | 37 (2.4%) |
| Total | 1,422 (100.0%) | 1,546 (100.0%) |
Families and Households in Green Island
Median Family Size in Green Island
The median family size in Green Island is 2.97 persons per family, with single female/mother families (97 | 16.9%) accounting for the largest median family size of 5.11 persons per family. On the other hand, married-couple families (374 | 65.2%) represent the smallest median family size with 2.49 persons per family.
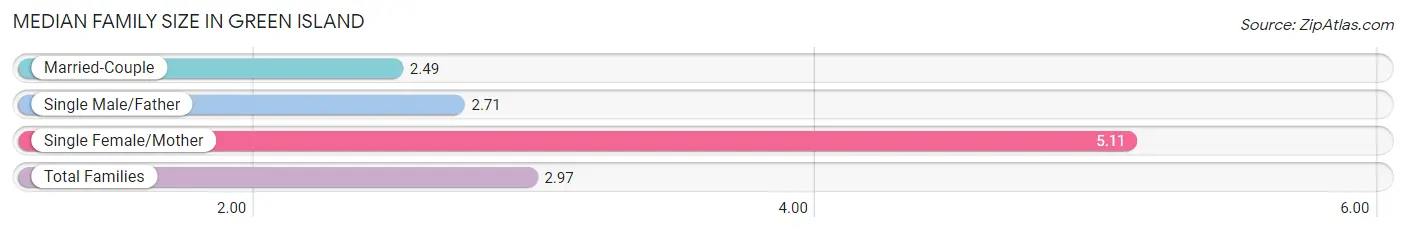
| Family Type | # Families | Family Size |
| Married-Couple | 374 (65.2%) | 2.49 |
| Single Male/Father | 103 (17.9%) | 2.71 |
| Single Female/Mother | 97 (16.9%) | 5.11 |
| Total Families | 574 (100.0%) | 2.97 |
Median Household Size in Green Island
The median household size in Green Island is 2.21 persons per household, with single female/mother households (97 | 7.2%) accounting for the largest median household size of 5.49 persons per household. non-family households (770 | 57.3%) represent the smallest median household size with 1.45 persons per household.
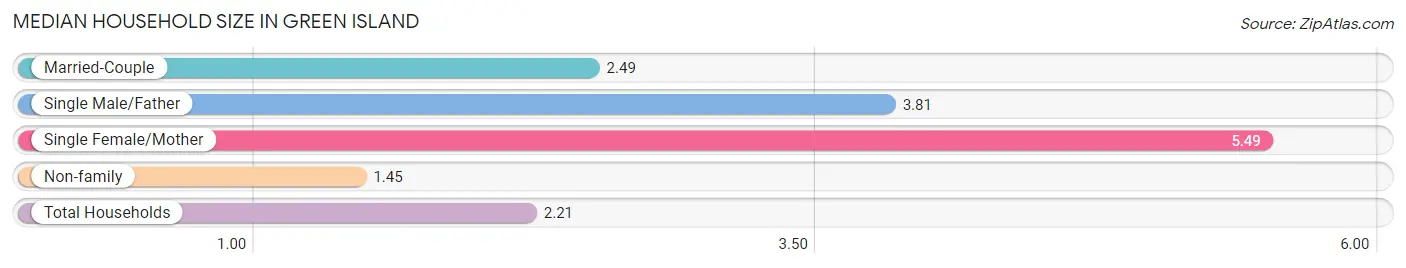
| Household Type | # Households | Household Size |
| Married-Couple | 374 (27.8%) | 2.49 |
| Single Male/Father | 103 (7.7%) | 3.81 |
| Single Female/Mother | 97 (7.2%) | 5.49 |
| Non-family | 770 (57.3%) | 1.45 |
| Total Households | 1,344 (100.0%) | 2.21 |
Household Size by Marriage Status in Green Island
Out of a total of 1,344 households in Green Island, 574 (42.7%) are family households, while 770 (57.3%) are nonfamily households. The most numerous type of family households are 2-person households, comprising 331, and the most common type of nonfamily households are 1-person households, comprising 555.
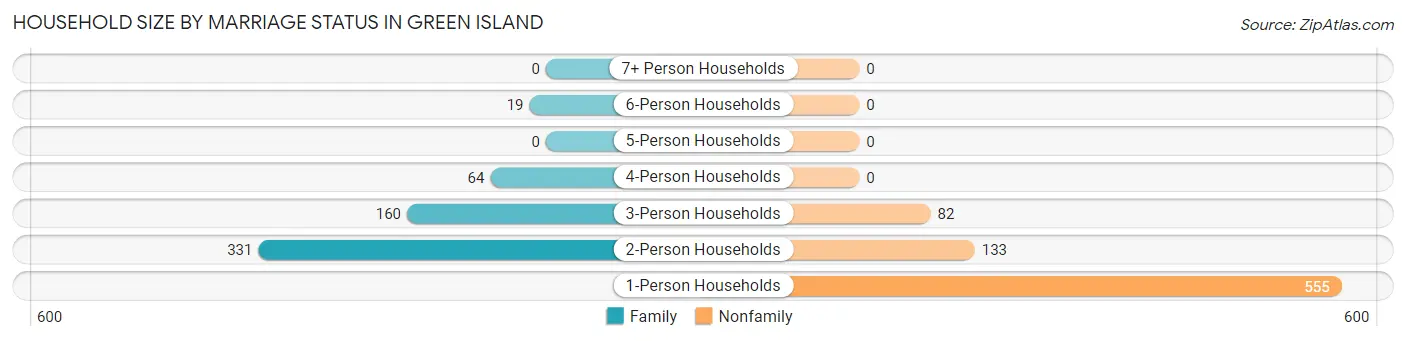
| Household Size | Family Households | Nonfamily Households |
| 1-Person Households | - | 555 (41.3%) |
| 2-Person Households | 331 (24.6%) | 133 (9.9%) |
| 3-Person Households | 160 (11.9%) | 82 (6.1%) |
| 4-Person Households | 64 (4.8%) | 0 (0.0%) |
| 5-Person Households | 0 (0.0%) | 0 (0.0%) |
| 6-Person Households | 19 (1.4%) | 0 (0.0%) |
| 7+ Person Households | 0 (0.0%) | 0 (0.0%) |
| Total | 574 (42.7%) | 770 (57.3%) |
Female Fertility in Green Island
Fertility by Age in Green Island
Average fertility rate in Green Island is 159.0 births per 1,000 women. Women in the age bracket of 15 to 19 years have the highest fertility rate with 694.0 births per 1,000 women. Women in the age bracket of 20 to 34 years acount for 59.4% of all women with births.
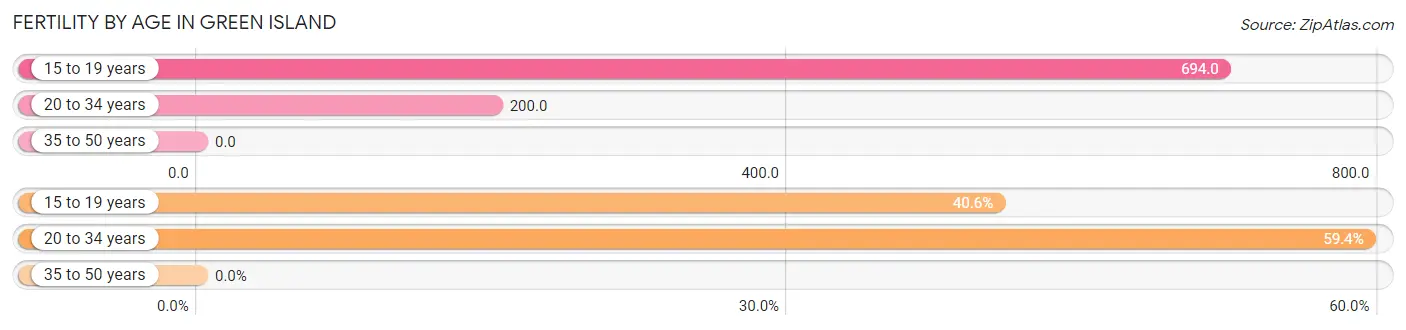
| Age Bracket | Women with Births | Births / 1,000 Women |
| 15 to 19 years | 43 (40.6%) | 694.0 |
| 20 to 34 years | 63 (59.4%) | 200.0 |
| 35 to 50 years | 0 (0.0%) | 0.0 |
| Total | 106 (100.0%) | 159.0 |
Fertility by Age by Marriage Status in Green Island
21.7% of women with births (106) in Green Island are married. The highest percentage of unmarried women with births falls into 15 to 19 years age bracket with 100.0% of them unmarried at the time of birth, while the lowest percentage of unmarried women with births belong to 20 to 34 years age bracket with 63.5% of them unmarried.
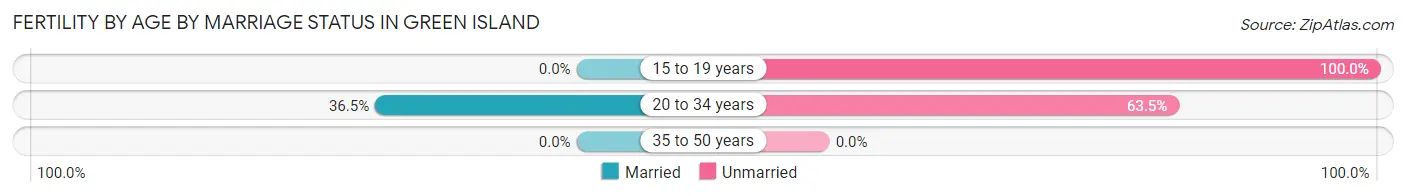
| Age Bracket | Married | Unmarried |
| 15 to 19 years | 0 (0.0%) | 43 (100.0%) |
| 20 to 34 years | 23 (36.5%) | 40 (63.5%) |
| 35 to 50 years | 0 (0.0%) | 0 (0.0%) |
| Total | 23 (21.7%) | 83 (78.3%) |
Fertility by Education in Green Island
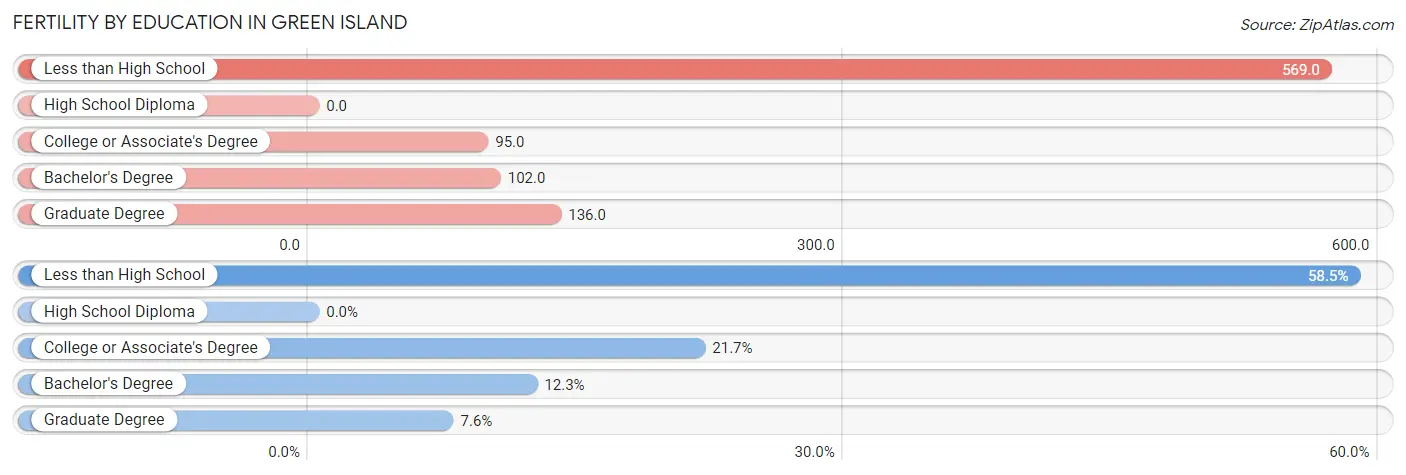
| Educational Attainment | Women with Births | Births / 1,000 Women |
| Less than High School | 62 (58.5%) | 569.0 |
| High School Diploma | 0 (0.0%) | 0.0 |
| College or Associate's Degree | 23 (21.7%) | 95.0 |
| Bachelor's Degree | 13 (12.3%) | 102.0 |
| Graduate Degree | 8 (7.5%) | 136.0 |
| Total | 106 (100.0%) | 159.0 |
Fertility by Education by Marriage Status in Green Island
78.3% of women with births in Green Island are unmarried. Women with the educational attainment of college or associate's degree are most likely to be married with 100.0% of them married at childbirth, while women with the educational attainment of less than high school are least likely to be married with 100.0% of them unmarried at childbirth.
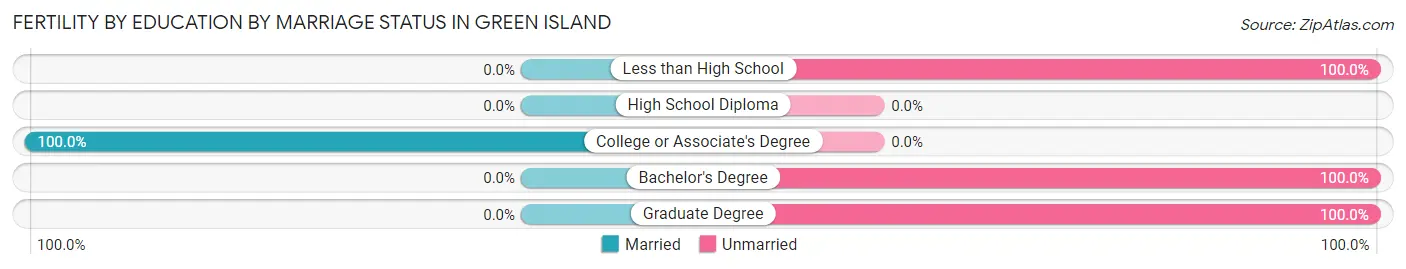
| Educational Attainment | Married | Unmarried |
| Less than High School | 0 (0.0%) | 62 (100.0%) |
| High School Diploma | 0 (0.0%) | 0 (0.0%) |
| College or Associate's Degree | 23 (100.0%) | 0 (0.0%) |
| Bachelor's Degree | 0 (0.0%) | 13 (100.0%) |
| Graduate Degree | 0 (0.0%) | 8 (100.0%) |
| Total | 23 (21.7%) | 83 (78.3%) |
Employment Characteristics in Green Island
Employment by Class of Employer in Green Island
Among the 1,287 employed individuals in Green Island, private company employees (724 | 56.2%), self-employed (incorporated) (182 | 14.1%), and not-for-profit organizations (155 | 12.0%) make up the most common classes of employment.
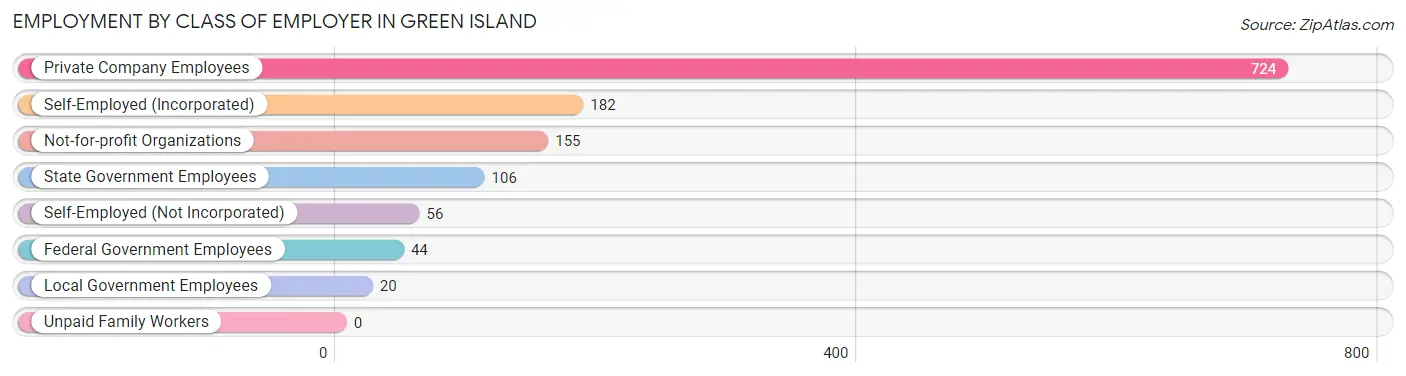
| Employer Class | # Employees | % Employees |
| Private Company Employees | 724 | 56.2% |
| Self-Employed (Incorporated) | 182 | 14.1% |
| Self-Employed (Not Incorporated) | 56 | 4.3% |
| Not-for-profit Organizations | 155 | 12.0% |
| Local Government Employees | 20 | 1.5% |
| State Government Employees | 106 | 8.2% |
| Federal Government Employees | 44 | 3.4% |
| Unpaid Family Workers | 0 | 0.0% |
| Total | 1,287 | 100.0% |
Employment Status by Age in Green Island
According to the labor force statistics for Green Island, out of the total population over 16 years of age (2,483), 60.2% or 1,495 individuals are in the labor force, with 13.0% or 194 of them unemployed. The age group with the highest labor force participation rate is 20 to 24 years, with 97.3% or 357 individuals in the labor force. Within the labor force, the 20 to 24 years age range has the highest percentage of unemployed individuals, with 32.2% or 115 of them being unemployed.
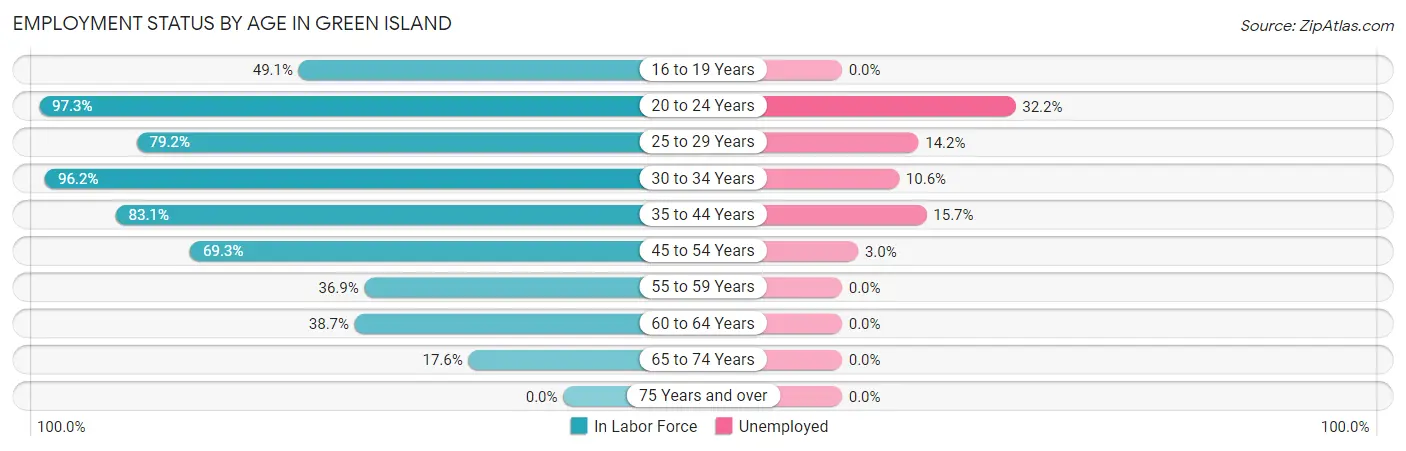
| Age Bracket | In Labor Force | Unemployed |
| 16 to 19 Years | 52 (49.1%) | 0 (0.0%) |
| 20 to 24 Years | 357 (97.3%) | 115 (32.2%) |
| 25 to 29 Years | 225 (79.2%) | 32 (14.2%) |
| 30 to 34 Years | 179 (96.2%) | 19 (10.6%) |
| 35 to 44 Years | 108 (83.1%) | 17 (15.7%) |
| 45 to 54 Years | 368 (69.3%) | 11 (3.0%) |
| 55 to 59 Years | 66 (36.9%) | 0 (0.0%) |
| 60 to 64 Years | 99 (38.7%) | 0 (0.0%) |
| 65 to 74 Years | 42 (17.6%) | 0 (0.0%) |
| 75 Years and over | 0 (0.0%) | 0 (0.0%) |
| Total | 1,495 (60.2%) | 194 (13.0%) |
Employment Status by Educational Attainment in Green Island
According to labor force statistics for Green Island, 66.7% of individuals (1,045) out of the total population between 25 and 64 years of age (1,566) are in the labor force, with 7.6% or 79 of them being unemployed. The group with the highest labor force participation rate are those with the educational attainment of bachelor's degree or higher, with 92.2% or 236 individuals in the labor force. Within the labor force, individuals with less than high school education have the highest percentage of unemployment, with 43.3% or 26 of them being unemployed.
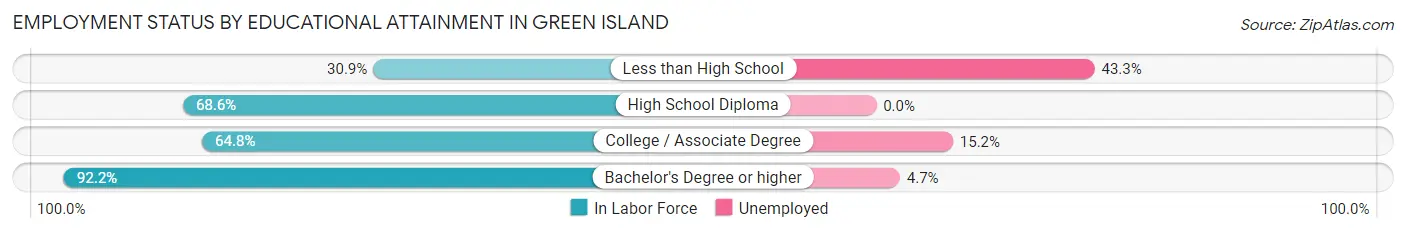
| Educational Attainment | In Labor Force | Unemployed |
| Less than High School | 60 (30.9%) | 84 (43.3%) |
| High School Diploma | 473 (68.6%) | 0 (0.0%) |
| College / Associate Degree | 276 (64.8%) | 65 (15.2%) |
| Bachelor's Degree or higher | 236 (92.2%) | 12 (4.7%) |
| Total | 1,045 (66.7%) | 119 (7.6%) |
Employment Occupations by Sex in Green Island
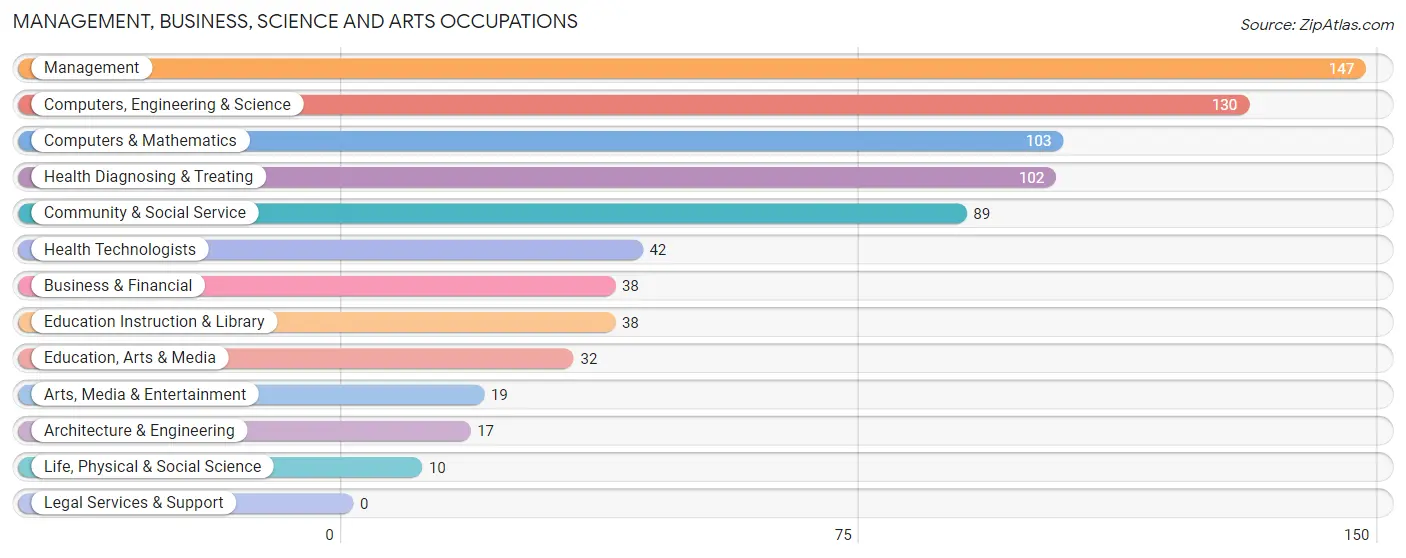
Management, Business, Science and Arts Occupations
The most common Management, Business, Science and Arts occupations in Green Island are Management (147 | 11.3%), Computers, Engineering & Science (130 | 10.0%), Computers & Mathematics (103 | 7.9%), Health Diagnosing & Treating (102 | 7.8%), and Community & Social Service (89 | 6.8%).
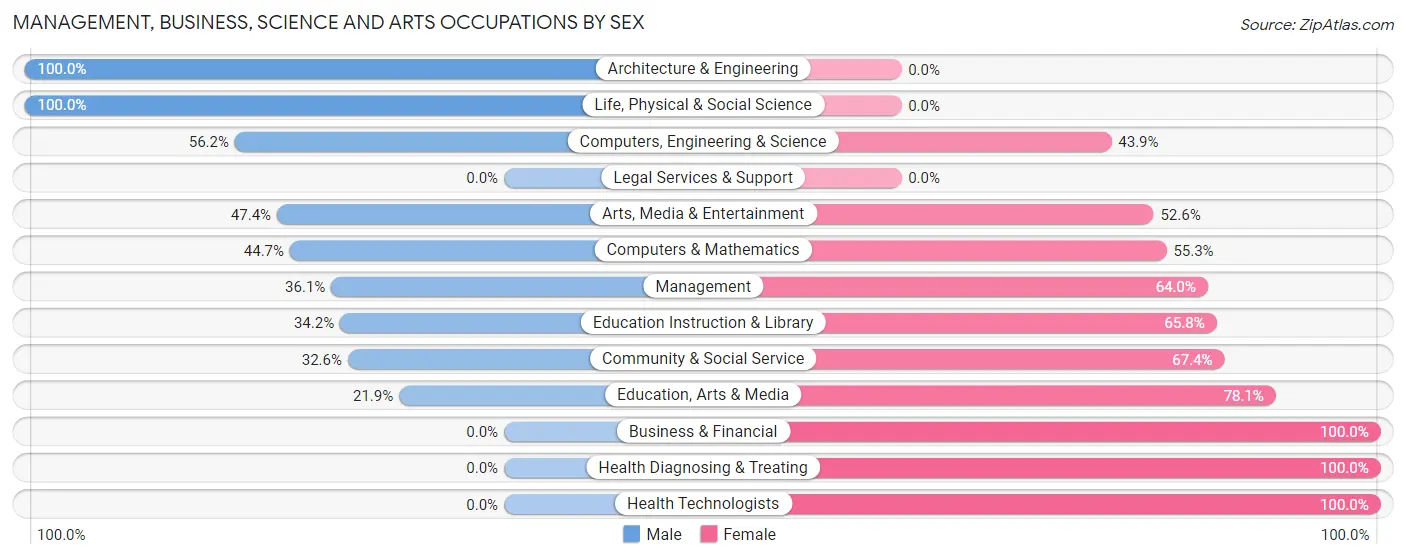
Management, Business, Science and Arts Occupations by Sex
Within the Management, Business, Science and Arts occupations in Green Island, the most male-oriented occupations are Architecture & Engineering (100.0%), Life, Physical & Social Science (100.0%), and Computers, Engineering & Science (56.1%), while the most female-oriented occupations are Business & Financial (100.0%), Health Diagnosing & Treating (100.0%), and Health Technologists (100.0%).
| Occupation | Male | Female |
| Management | 53 (36.0%) | 94 (63.9%) |
| Business & Financial | 0 (0.0%) | 38 (100.0%) |
| Computers, Engineering & Science | 73 (56.1%) | 57 (43.9%) |
| Computers & Mathematics | 46 (44.7%) | 57 (55.3%) |
| Architecture & Engineering | 17 (100.0%) | 0 (0.0%) |
| Life, Physical & Social Science | 10 (100.0%) | 0 (0.0%) |
| Community & Social Service | 29 (32.6%) | 60 (67.4%) |
| Education, Arts & Media | 7 (21.9%) | 25 (78.1%) |
| Legal Services & Support | 0 (0.0%) | 0 (0.0%) |
| Education Instruction & Library | 13 (34.2%) | 25 (65.8%) |
| Arts, Media & Entertainment | 9 (47.4%) | 10 (52.6%) |
| Health Diagnosing & Treating | 0 (0.0%) | 102 (100.0%) |
| Health Technologists | 0 (0.0%) | 42 (100.0%) |
| Total (Category) | 155 (30.6%) | 351 (69.4%) |
| Total (Overall) | 717 (55.1%) | 585 (44.9%) |
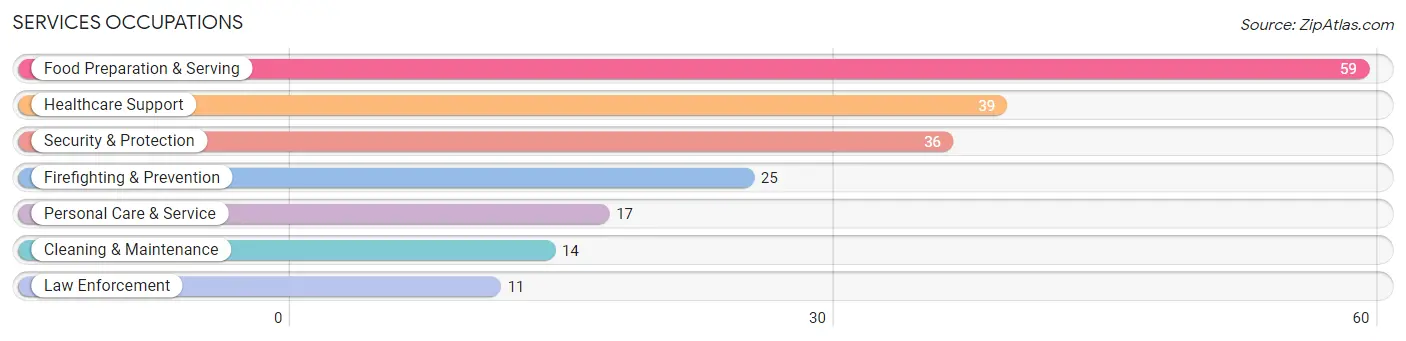
Services Occupations
The most common Services occupations in Green Island are Food Preparation & Serving (59 | 4.5%), Healthcare Support (39 | 3.0%), Security & Protection (36 | 2.8%), Firefighting & Prevention (25 | 1.9%), and Personal Care & Service (17 | 1.3%).
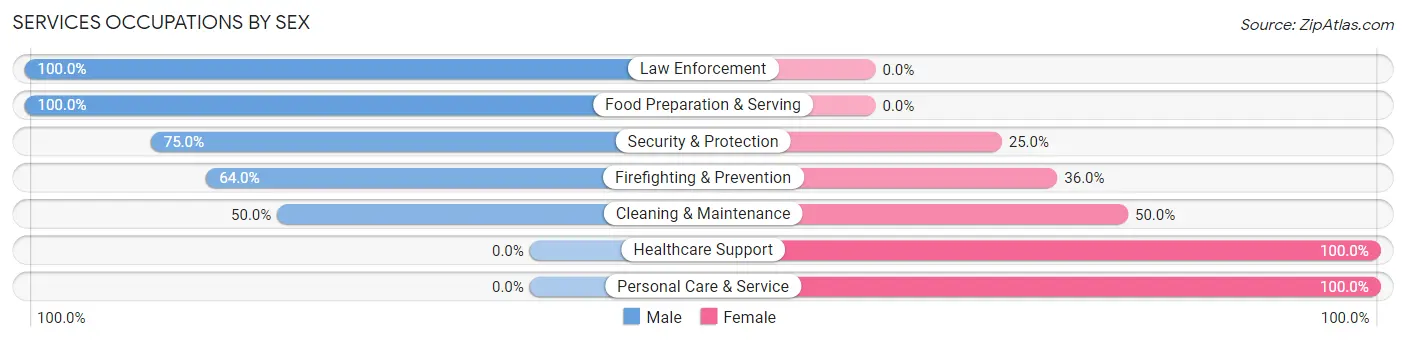
Services Occupations by Sex
Within the Services occupations in Green Island, the most male-oriented occupations are Law Enforcement (100.0%), Food Preparation & Serving (100.0%), and Security & Protection (75.0%), while the most female-oriented occupations are Healthcare Support (100.0%), Personal Care & Service (100.0%), and Cleaning & Maintenance (50.0%).
| Occupation | Male | Female |
| Healthcare Support | 0 (0.0%) | 39 (100.0%) |
| Security & Protection | 27 (75.0%) | 9 (25.0%) |
| Firefighting & Prevention | 16 (64.0%) | 9 (36.0%) |
| Law Enforcement | 11 (100.0%) | 0 (0.0%) |
| Food Preparation & Serving | 59 (100.0%) | 0 (0.0%) |
| Cleaning & Maintenance | 7 (50.0%) | 7 (50.0%) |
| Personal Care & Service | 0 (0.0%) | 17 (100.0%) |
| Total (Category) | 93 (56.4%) | 72 (43.6%) |
| Total (Overall) | 717 (55.1%) | 585 (44.9%) |
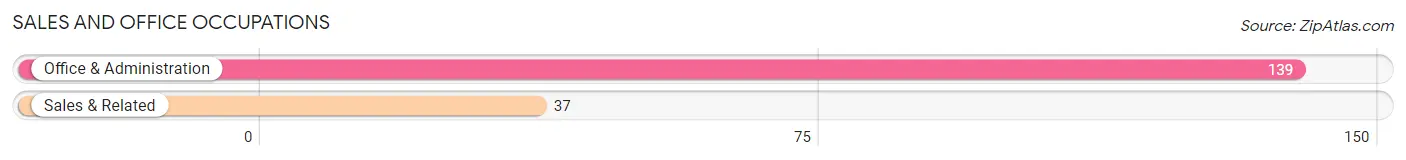
Sales and Office Occupations
The most common Sales and Office occupations in Green Island are Office & Administration (139 | 10.7%), and Sales & Related (37 | 2.8%).
Sales and Office Occupations by Sex
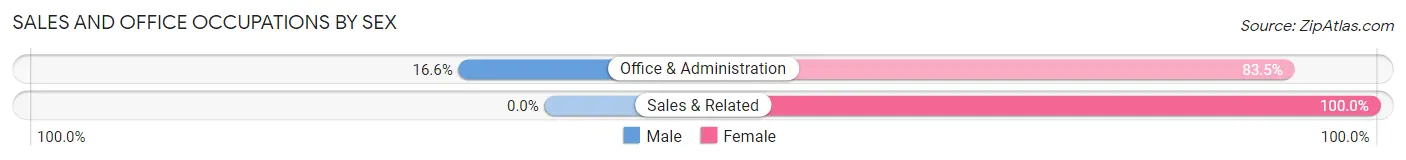
| Occupation | Male | Female |
| Sales & Related | 0 (0.0%) | 37 (100.0%) |
| Office & Administration | 23 (16.6%) | 116 (83.5%) |
| Total (Category) | 23 (13.1%) | 153 (86.9%) |
| Total (Overall) | 717 (55.1%) | 585 (44.9%) |
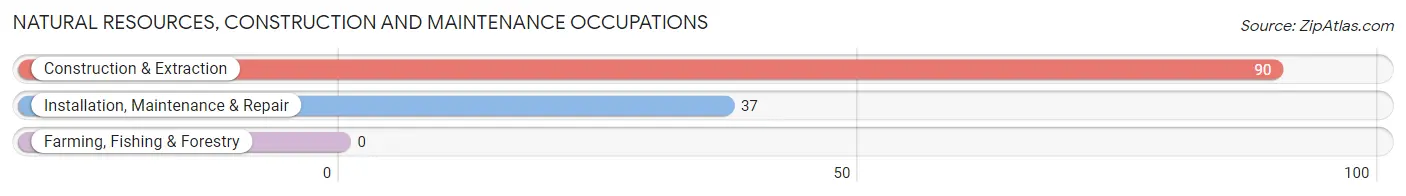
Natural Resources, Construction and Maintenance Occupations
The most common Natural Resources, Construction and Maintenance occupations in Green Island are Construction & Extraction (90 | 6.9%), and Installation, Maintenance & Repair (37 | 2.8%).
Natural Resources, Construction and Maintenance Occupations by Sex
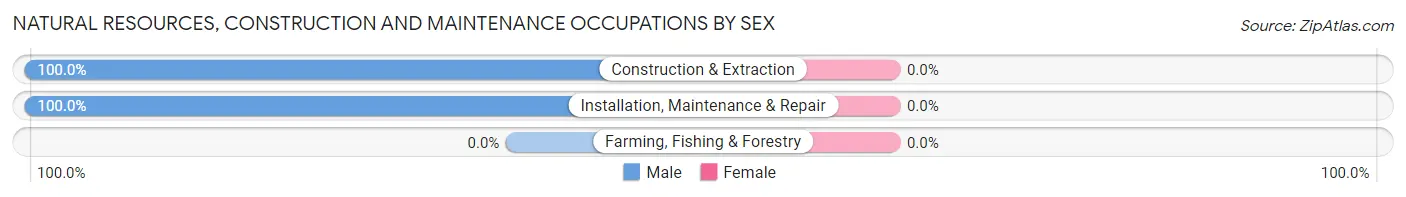
| Occupation | Male | Female |
| Farming, Fishing & Forestry | 0 (0.0%) | 0 (0.0%) |
| Construction & Extraction | 90 (100.0%) | 0 (0.0%) |
| Installation, Maintenance & Repair | 37 (100.0%) | 0 (0.0%) |
| Total (Category) | 127 (100.0%) | 0 (0.0%) |
| Total (Overall) | 717 (55.1%) | 585 (44.9%) |
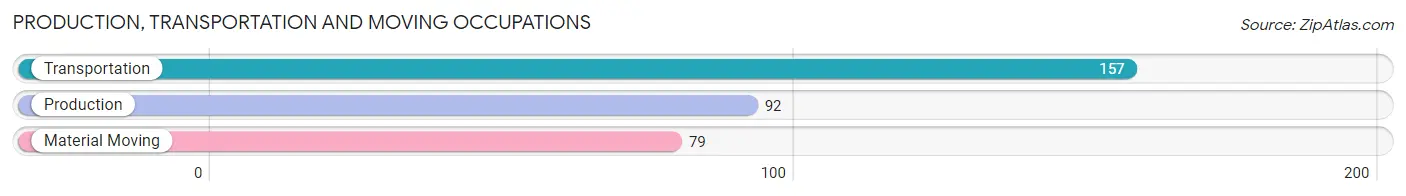
Production, Transportation and Moving Occupations
The most common Production, Transportation and Moving occupations in Green Island are Transportation (157 | 12.1%), Production (92 | 7.1%), and Material Moving (79 | 6.1%).
Production, Transportation and Moving Occupations by Sex
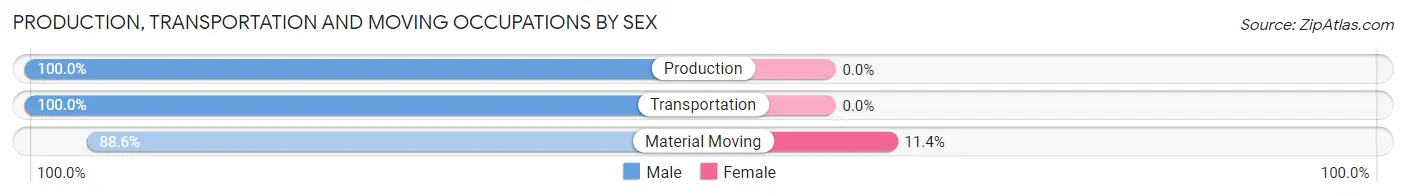
| Occupation | Male | Female |
| Production | 92 (100.0%) | 0 (0.0%) |
| Transportation | 157 (100.0%) | 0 (0.0%) |
| Material Moving | 70 (88.6%) | 9 (11.4%) |
| Total (Category) | 319 (97.3%) | 9 (2.7%) |
| Total (Overall) | 717 (55.1%) | 585 (44.9%) |
Employment Industries by Sex in Green Island
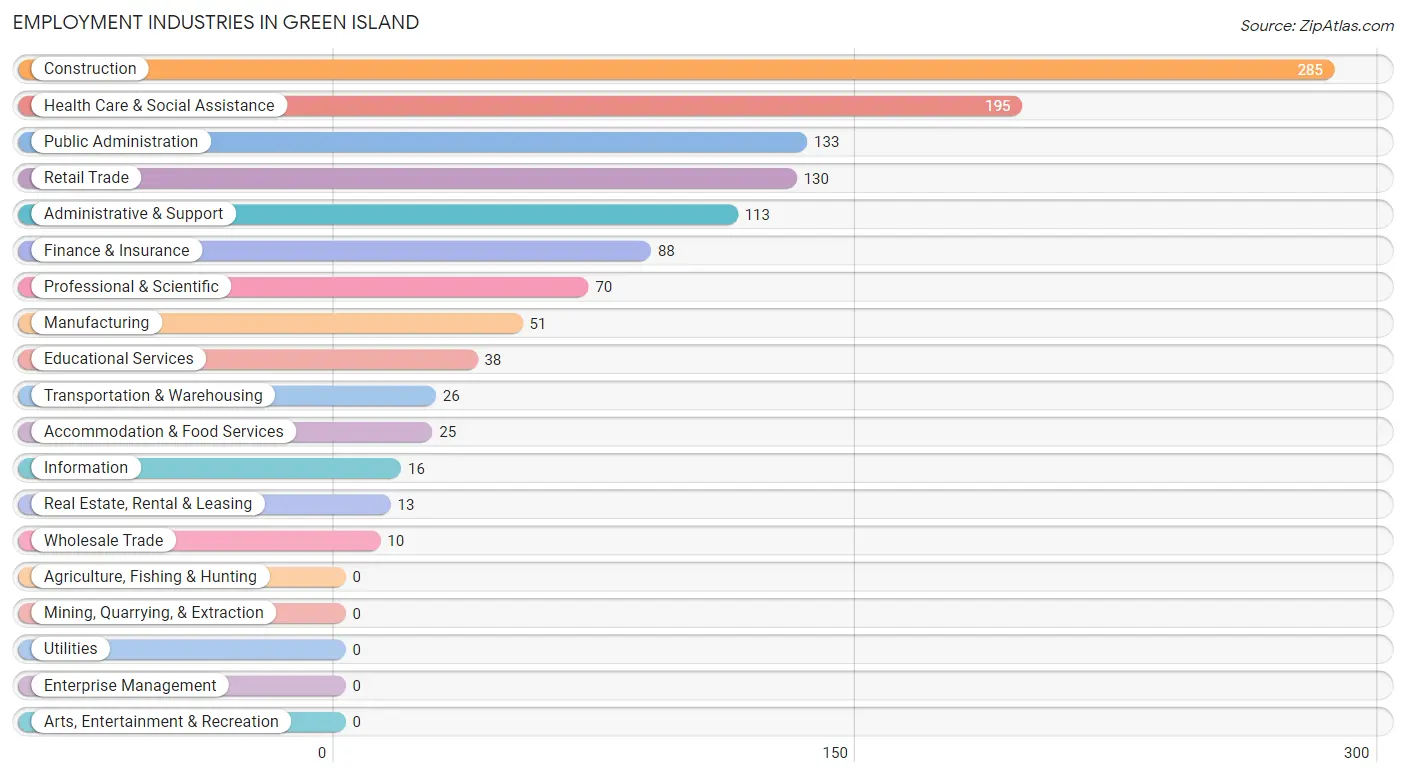
Employment Industries in Green Island
The major employment industries in Green Island include Construction (285 | 21.9%), Health Care & Social Assistance (195 | 15.0%), Public Administration (133 | 10.2%), Retail Trade (130 | 10.0%), and Administrative & Support (113 | 8.7%).
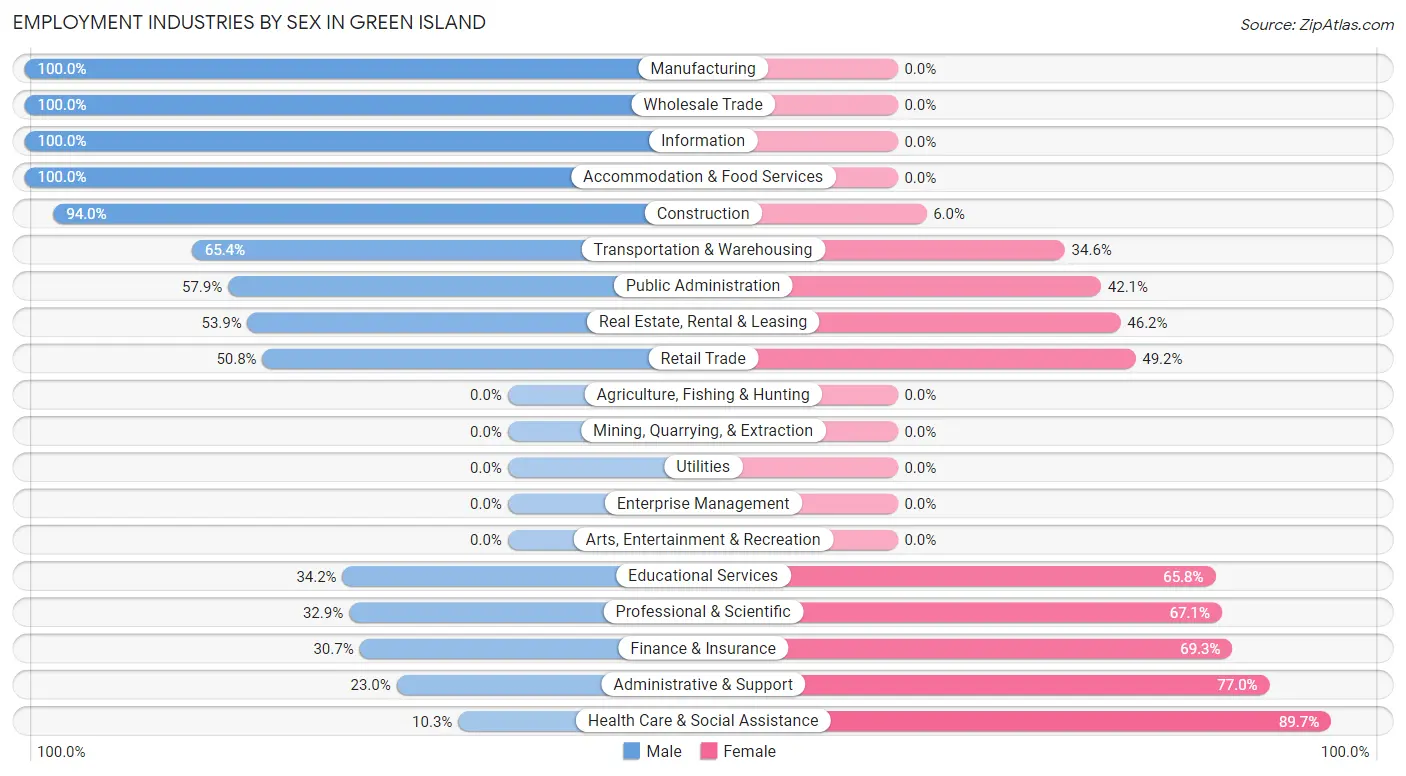
Employment Industries by Sex in Green Island
The Green Island industries that see more men than women are Manufacturing (100.0%), Wholesale Trade (100.0%), and Information (100.0%), whereas the industries that tend to have a higher number of women are Health Care & Social Assistance (89.7%), Administrative & Support (77.0%), and Finance & Insurance (69.3%).
| Industry | Male | Female |
| Agriculture, Fishing & Hunting | 0 (0.0%) | 0 (0.0%) |
| Mining, Quarrying, & Extraction | 0 (0.0%) | 0 (0.0%) |
| Construction | 268 (94.0%) | 17 (6.0%) |
| Manufacturing | 51 (100.0%) | 0 (0.0%) |
| Wholesale Trade | 10 (100.0%) | 0 (0.0%) |
| Retail Trade | 66 (50.8%) | 64 (49.2%) |
| Transportation & Warehousing | 17 (65.4%) | 9 (34.6%) |
| Utilities | 0 (0.0%) | 0 (0.0%) |
| Information | 16 (100.0%) | 0 (0.0%) |
| Finance & Insurance | 27 (30.7%) | 61 (69.3%) |
| Real Estate, Rental & Leasing | 7 (53.8%) | 6 (46.2%) |
| Professional & Scientific | 23 (32.9%) | 47 (67.1%) |
| Enterprise Management | 0 (0.0%) | 0 (0.0%) |
| Administrative & Support | 26 (23.0%) | 87 (77.0%) |
| Educational Services | 13 (34.2%) | 25 (65.8%) |
| Health Care & Social Assistance | 20 (10.3%) | 175 (89.7%) |
| Arts, Entertainment & Recreation | 0 (0.0%) | 0 (0.0%) |
| Accommodation & Food Services | 25 (100.0%) | 0 (0.0%) |
| Public Administration | 77 (57.9%) | 56 (42.1%) |
| Total | 717 (55.1%) | 585 (44.9%) |
Education in Green Island
School Enrollment in Green Island
The most common levels of schooling among the 410 students in Green Island are high school (179 | 43.7%), elementary school (87 | 21.2%), and college / undergraduate (66 | 16.1%).
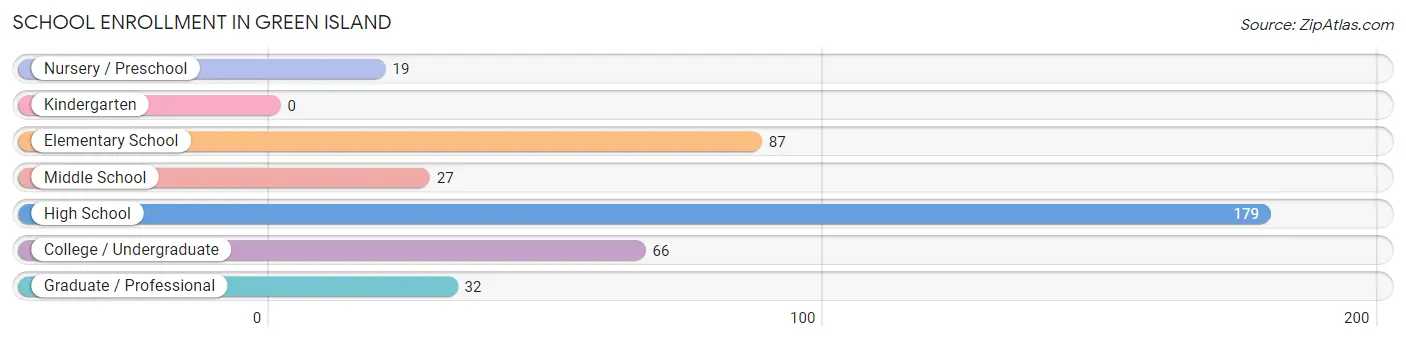
| School Level | # Students | % Students |
| Nursery / Preschool | 19 | 4.6% |
| Kindergarten | 0 | 0.0% |
| Elementary School | 87 | 21.2% |
| Middle School | 27 | 6.6% |
| High School | 179 | 43.7% |
| College / Undergraduate | 66 | 16.1% |
| Graduate / Professional | 32 | 7.8% |
| Total | 410 | 100.0% |
School Enrollment by Age by Funding Source in Green Island
Out of a total of 410 students who are enrolled in schools in Green Island, 81 (19.8%) attend a private institution, while the remaining 329 (80.2%) are enrolled in public schools. The age group of 3 to 4 year olds has the highest likelihood of being enrolled in private schools, with 19 (100.0% in the age bracket) enrolled. Conversely, the age group of 5 to 9 year old has the lowest likelihood of being enrolled in a private school, with 87 (100.0% in the age bracket) attending a public institution.
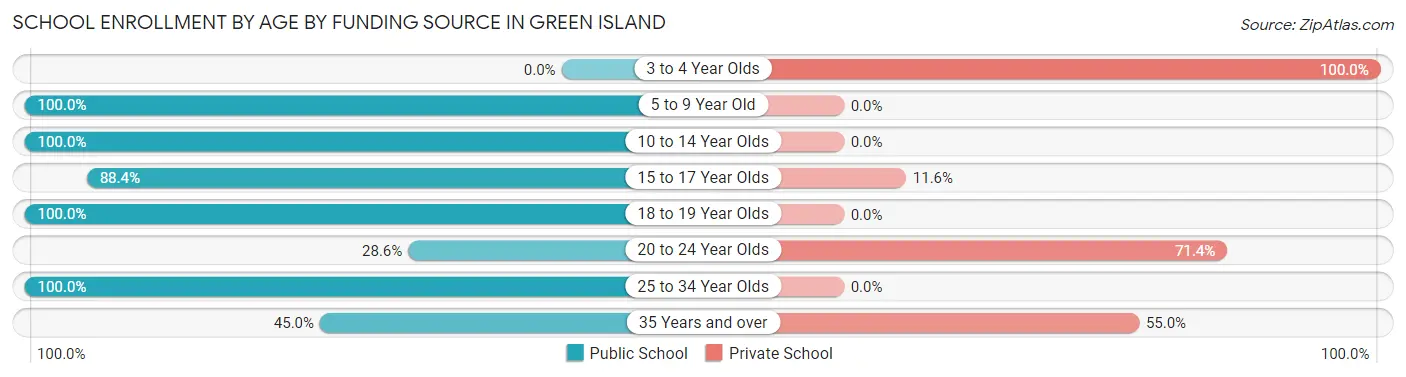
| Age Bracket | Public School | Private School |
| 3 to 4 Year Olds | 0 (0.0%) | 19 (100.0%) |
| 5 to 9 Year Old | 87 (100.0%) | 0 (0.0%) |
| 10 to 14 Year Olds | 111 (100.0%) | 0 (0.0%) |
| 15 to 17 Year Olds | 84 (88.4%) | 11 (11.6%) |
| 18 to 19 Year Olds | 14 (100.0%) | 0 (0.0%) |
| 20 to 24 Year Olds | 16 (28.6%) | 40 (71.4%) |
| 25 to 34 Year Olds | 8 (100.0%) | 0 (0.0%) |
| 35 Years and over | 9 (45.0%) | 11 (55.0%) |
| Total | 329 (80.2%) | 81 (19.8%) |
Educational Attainment by Field of Study in Green Island
Social sciences (84 | 22.3%), business (80 | 21.2%), education (39 | 10.3%), bio, nature & agricultural (36 | 9.6%), and science & technology (30 | 8.0%) are the most common fields of study among 377 individuals in Green Island who have obtained a bachelor's degree or higher.
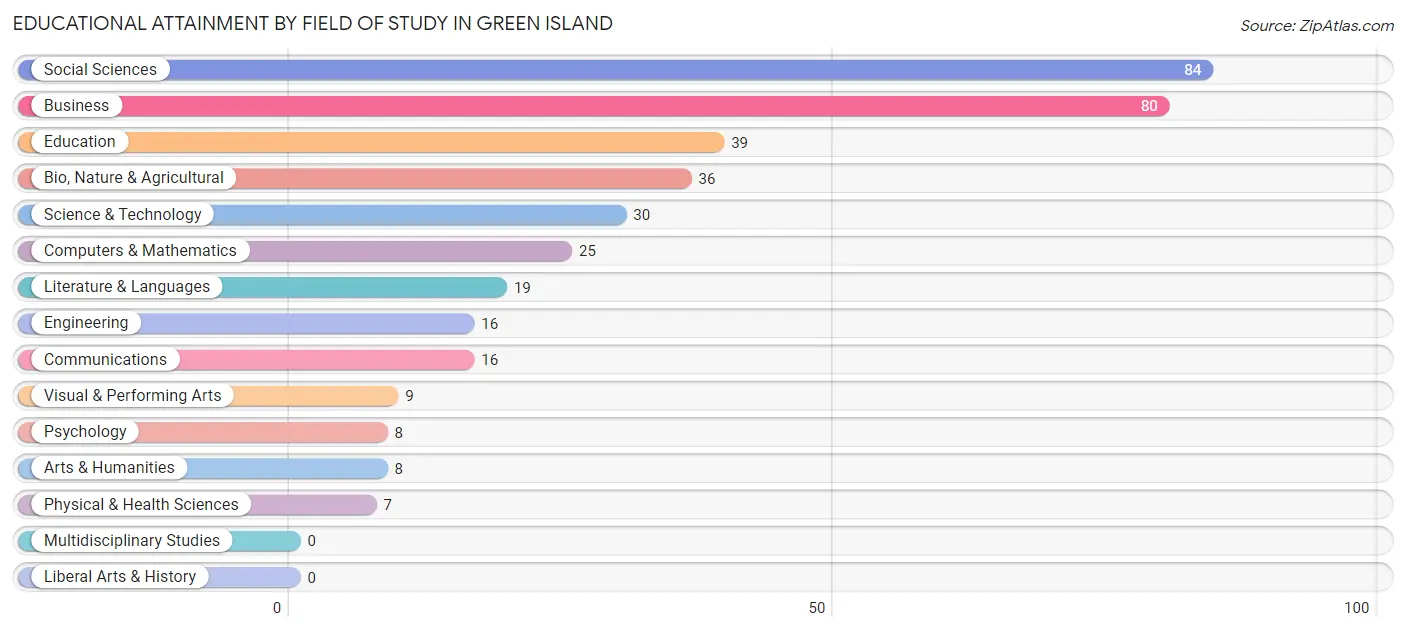
| Field of Study | # Graduates | % Graduates |
| Computers & Mathematics | 25 | 6.6% |
| Bio, Nature & Agricultural | 36 | 9.6% |
| Physical & Health Sciences | 7 | 1.9% |
| Psychology | 8 | 2.1% |
| Social Sciences | 84 | 22.3% |
| Engineering | 16 | 4.2% |
| Multidisciplinary Studies | 0 | 0.0% |
| Science & Technology | 30 | 8.0% |
| Business | 80 | 21.2% |
| Education | 39 | 10.3% |
| Literature & Languages | 19 | 5.0% |
| Liberal Arts & History | 0 | 0.0% |
| Visual & Performing Arts | 9 | 2.4% |
| Communications | 16 | 4.2% |
| Arts & Humanities | 8 | 2.1% |
| Total | 377 | 100.0% |
Transportation & Commute in Green Island
Vehicle Availability by Sex in Green Island
The most prevalent vehicle ownership categories in Green Island are males with 2 vehicles (371, accounting for 52.4%) and females with 2 vehicles (193, making up 64.1%).
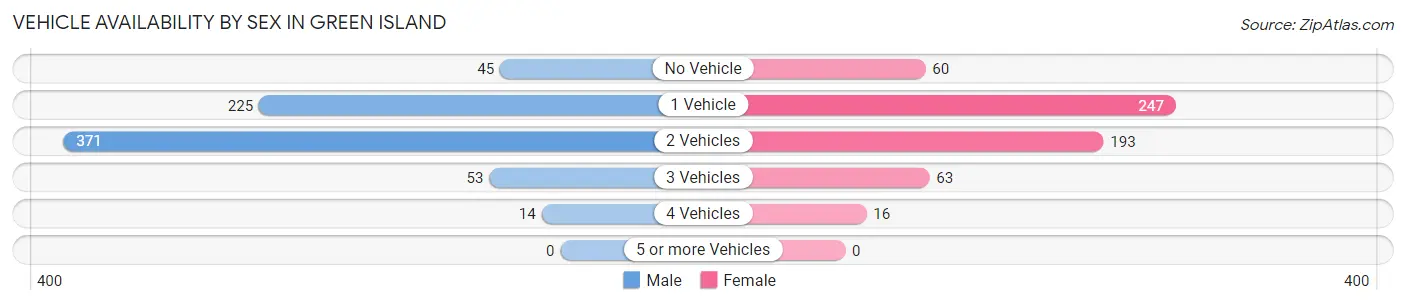
| Vehicles Available | Male | Female |
| No Vehicle | 45 (6.4%) | 60 (10.4%) |
| 1 Vehicle | 225 (31.8%) | 247 (42.7%) |
| 2 Vehicles | 371 (52.4%) | 193 (33.3%) |
| 3 Vehicles | 53 (7.5%) | 63 (10.9%) |
| 4 Vehicles | 14 (2.0%) | 16 (2.8%) |
| 5 or more Vehicles | 0 (0.0%) | 0 (0.0%) |
| Total | 708 (100.0%) | 579 (100.0%) |
Commute Time in Green Island
The most frequently occuring commute durations in Green Island are 15 to 19 minutes (273 commuters, 24.0%), 10 to 14 minutes (206 commuters, 18.1%), and 20 to 24 minutes (178 commuters, 15.7%).
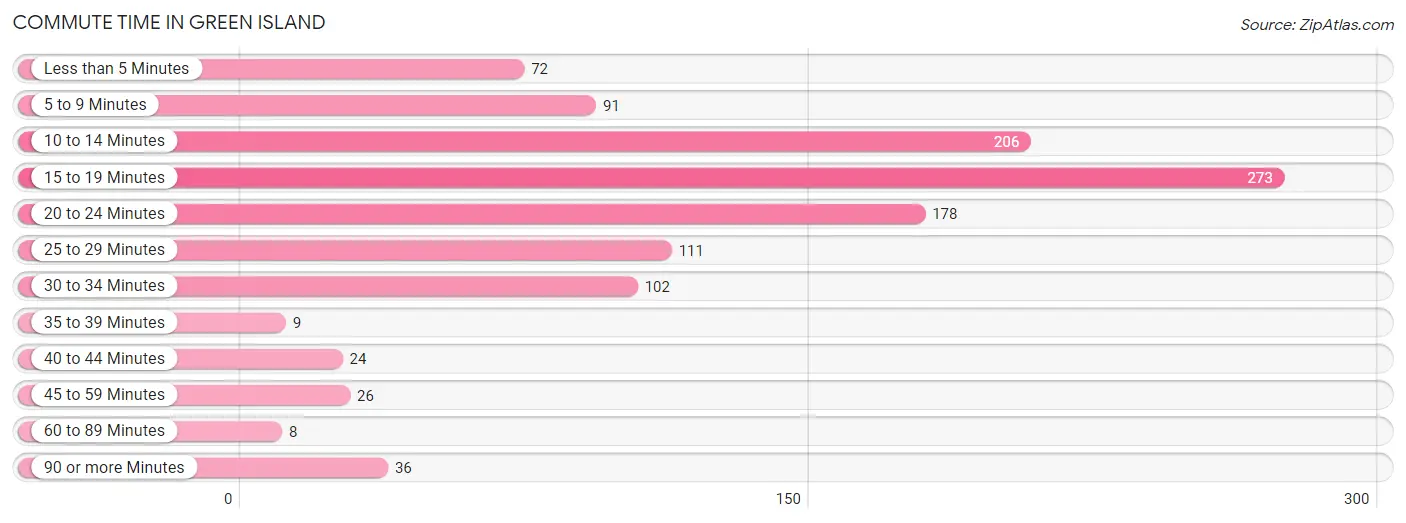
| Commute Time | # Commuters | % Commuters |
| Less than 5 Minutes | 72 | 6.3% |
| 5 to 9 Minutes | 91 | 8.0% |
| 10 to 14 Minutes | 206 | 18.1% |
| 15 to 19 Minutes | 273 | 24.0% |
| 20 to 24 Minutes | 178 | 15.7% |
| 25 to 29 Minutes | 111 | 9.8% |
| 30 to 34 Minutes | 102 | 9.0% |
| 35 to 39 Minutes | 9 | 0.8% |
| 40 to 44 Minutes | 24 | 2.1% |
| 45 to 59 Minutes | 26 | 2.3% |
| 60 to 89 Minutes | 8 | 0.7% |
| 90 or more Minutes | 36 | 3.2% |
Commute Time by Sex in Green Island
The most common commute times in Green Island are 15 to 19 minutes (170 commuters, 26.2%) for males and 15 to 19 minutes (103 commuters, 21.1%) for females.
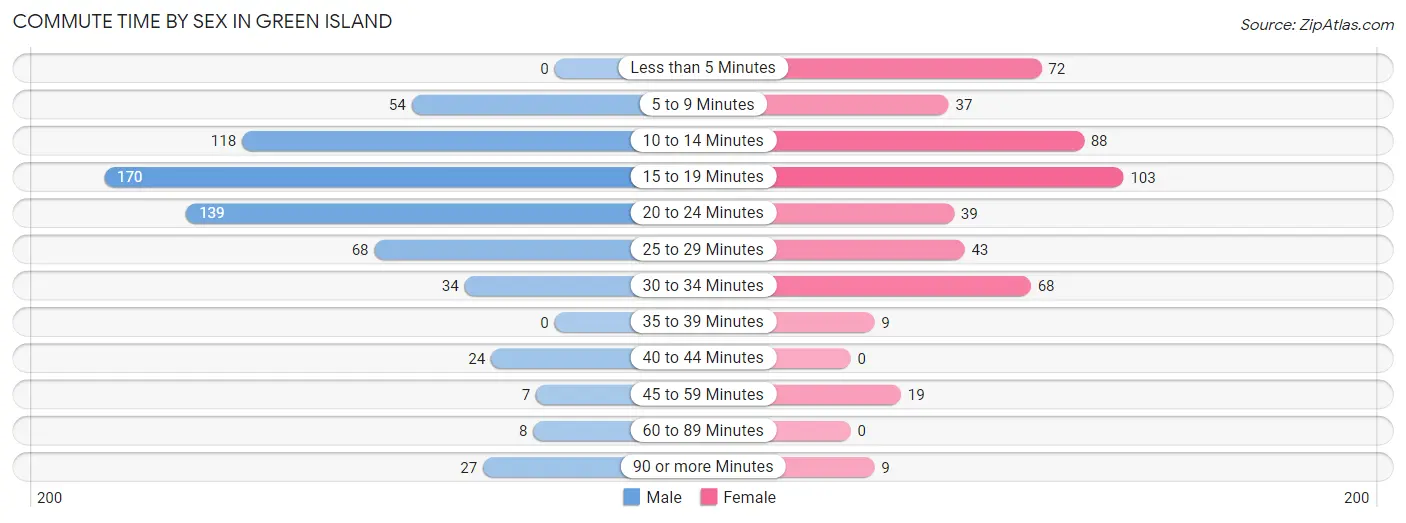
| Commute Time | Male | Female |
| Less than 5 Minutes | 0 (0.0%) | 72 (14.8%) |
| 5 to 9 Minutes | 54 (8.3%) | 37 (7.6%) |
| 10 to 14 Minutes | 118 (18.2%) | 88 (18.1%) |
| 15 to 19 Minutes | 170 (26.2%) | 103 (21.1%) |
| 20 to 24 Minutes | 139 (21.4%) | 39 (8.0%) |
| 25 to 29 Minutes | 68 (10.5%) | 43 (8.8%) |
| 30 to 34 Minutes | 34 (5.2%) | 68 (14.0%) |
| 35 to 39 Minutes | 0 (0.0%) | 9 (1.8%) |
| 40 to 44 Minutes | 24 (3.7%) | 0 (0.0%) |
| 45 to 59 Minutes | 7 (1.1%) | 19 (3.9%) |
| 60 to 89 Minutes | 8 (1.2%) | 0 (0.0%) |
| 90 or more Minutes | 27 (4.2%) | 9 (1.8%) |
Time of Departure to Work by Sex in Green Island
The most frequent times of departure to work in Green Island are 7:00 AM to 7:29 AM (145, 22.3%) for males and 7:30 AM to 7:59 AM (123, 25.3%) for females.
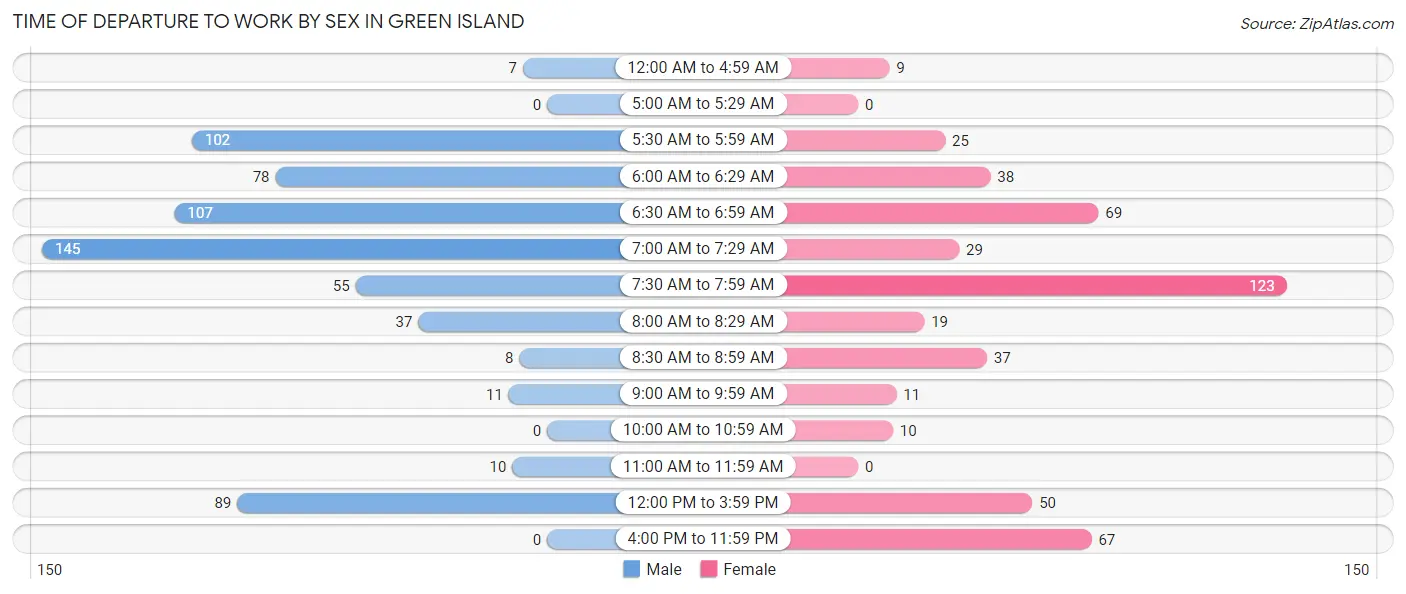
| Time of Departure | Male | Female |
| 12:00 AM to 4:59 AM | 7 (1.1%) | 9 (1.8%) |
| 5:00 AM to 5:29 AM | 0 (0.0%) | 0 (0.0%) |
| 5:30 AM to 5:59 AM | 102 (15.7%) | 25 (5.1%) |
| 6:00 AM to 6:29 AM | 78 (12.0%) | 38 (7.8%) |
| 6:30 AM to 6:59 AM | 107 (16.5%) | 69 (14.2%) |
| 7:00 AM to 7:29 AM | 145 (22.3%) | 29 (5.9%) |
| 7:30 AM to 7:59 AM | 55 (8.5%) | 123 (25.3%) |
| 8:00 AM to 8:29 AM | 37 (5.7%) | 19 (3.9%) |
| 8:30 AM to 8:59 AM | 8 (1.2%) | 37 (7.6%) |
| 9:00 AM to 9:59 AM | 11 (1.7%) | 11 (2.3%) |
| 10:00 AM to 10:59 AM | 0 (0.0%) | 10 (2.1%) |
| 11:00 AM to 11:59 AM | 10 (1.5%) | 0 (0.0%) |
| 12:00 PM to 3:59 PM | 89 (13.7%) | 50 (10.3%) |
| 4:00 PM to 11:59 PM | 0 (0.0%) | 67 (13.8%) |
| Total | 649 (100.0%) | 487 (100.0%) |
Housing Occupancy in Green Island
Occupancy by Ownership in Green Island
Of the total 1,344 dwellings in Green Island, owner-occupied units account for 369 (27.5%), while renter-occupied units make up 975 (72.5%).
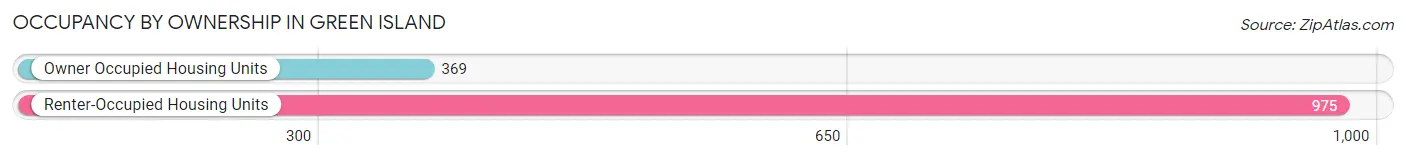
| Occupancy | # Housing Units | % Housing Units |
| Owner Occupied Housing Units | 369 | 27.5% |
| Renter-Occupied Housing Units | 975 | 72.5% |
| Total Occupied Housing Units | 1,344 | 100.0% |
Occupancy by Household Size in Green Island
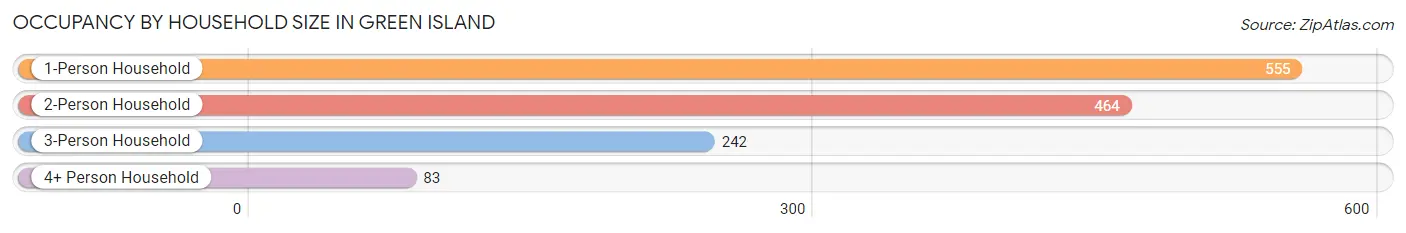
| Household Size | # Housing Units | % Housing Units |
| 1-Person Household | 555 | 41.3% |
| 2-Person Household | 464 | 34.5% |
| 3-Person Household | 242 | 18.0% |
| 4+ Person Household | 83 | 6.2% |
| Total Housing Units | 1,344 | 100.0% |
Occupancy by Ownership by Household Size in Green Island
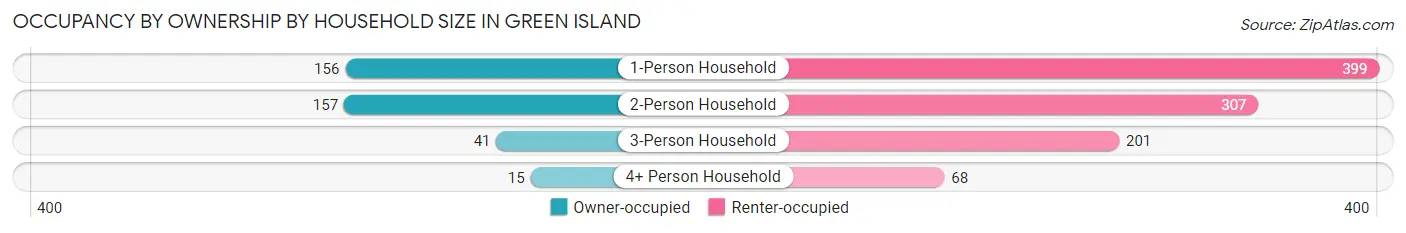
| Household Size | Owner-occupied | Renter-occupied |
| 1-Person Household | 156 (28.1%) | 399 (71.9%) |
| 2-Person Household | 157 (33.8%) | 307 (66.2%) |
| 3-Person Household | 41 (16.9%) | 201 (83.1%) |
| 4+ Person Household | 15 (18.1%) | 68 (81.9%) |
| Total Housing Units | 369 (27.5%) | 975 (72.5%) |
Occupancy by Educational Attainment in Green Island
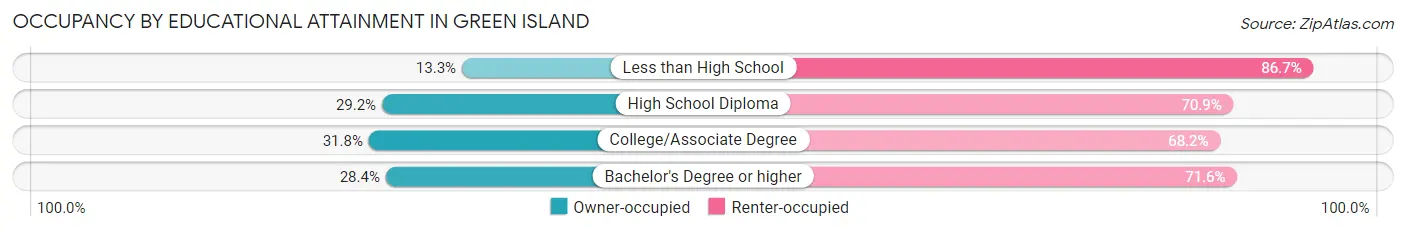
| Household Size | Owner-occupied | Renter-occupied |
| Less than High School | 25 (13.3%) | 163 (86.7%) |
| High School Diploma | 137 (29.1%) | 333 (70.9%) |
| College/Associate Degree | 115 (31.8%) | 247 (68.2%) |
| Bachelor's Degree or higher | 92 (28.4%) | 232 (71.6%) |
Occupancy by Age of Householder in Green Island
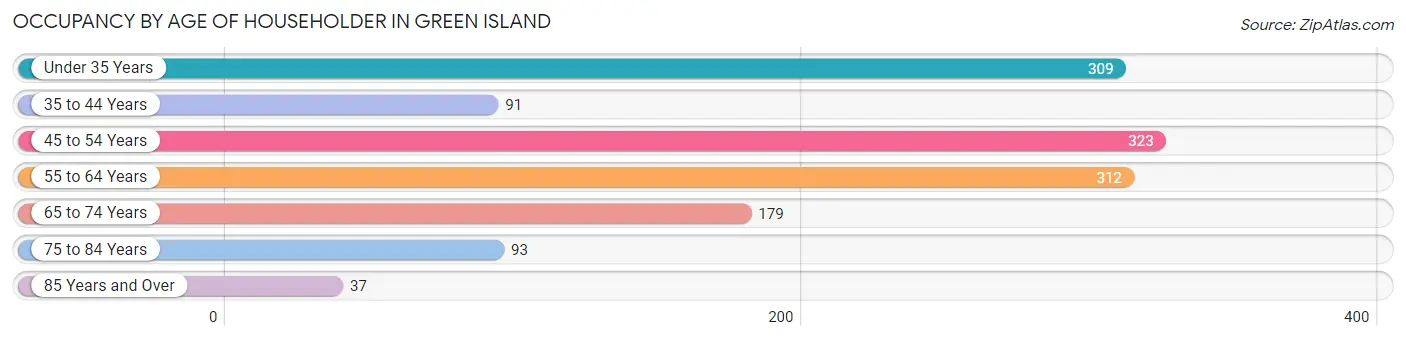
| Age Bracket | # Households | % Households |
| Under 35 Years | 309 | 23.0% |
| 35 to 44 Years | 91 | 6.8% |
| 45 to 54 Years | 323 | 24.0% |
| 55 to 64 Years | 312 | 23.2% |
| 65 to 74 Years | 179 | 13.3% |
| 75 to 84 Years | 93 | 6.9% |
| 85 Years and Over | 37 | 2.8% |
| Total | 1,344 | 100.0% |
Housing Finances in Green Island
Median Income by Occupancy in Green Island
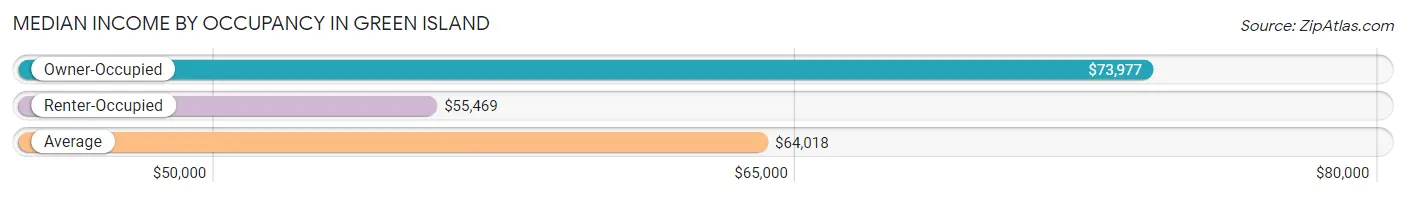
| Occupancy Type | # Households | Median Income |
| Owner-Occupied | 369 (27.5%) | $73,977 |
| Renter-Occupied | 975 (72.5%) | $55,469 |
| Average | 1,344 (100.0%) | $64,018 |
Occupancy by Householder Income Bracket in Green Island
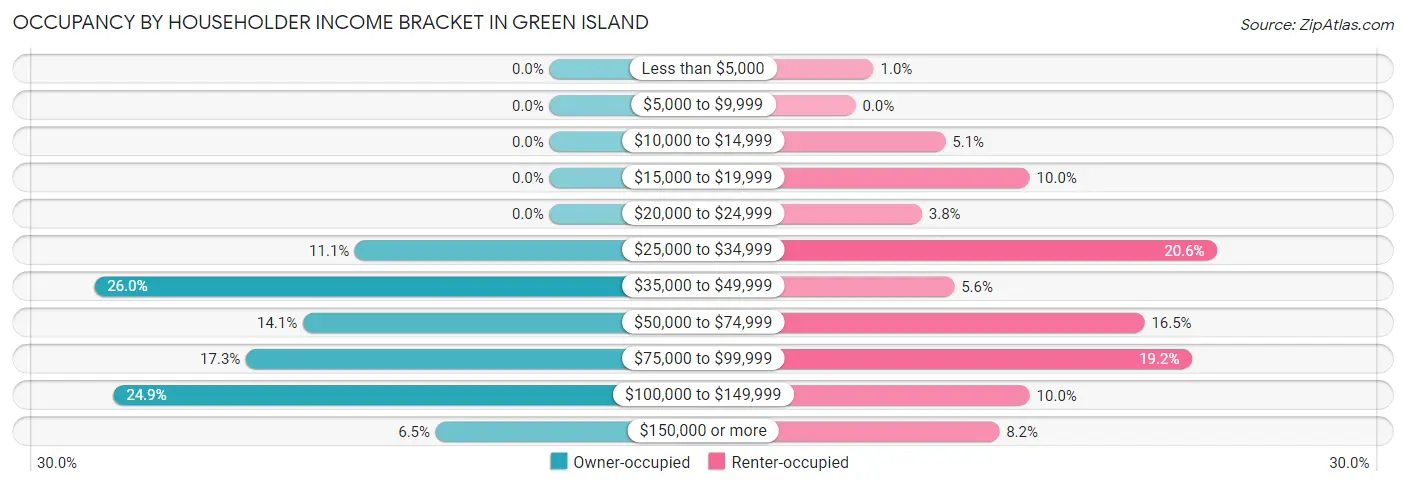
| Income Bracket | Owner-occupied | Renter-occupied |
| Less than $5,000 | 0 (0.0%) | 10 (1.0%) |
| $5,000 to $9,999 | 0 (0.0%) | 0 (0.0%) |
| $10,000 to $14,999 | 0 (0.0%) | 50 (5.1%) |
| $15,000 to $19,999 | 0 (0.0%) | 97 (10.0%) |
| $20,000 to $24,999 | 0 (0.0%) | 37 (3.8%) |
| $25,000 to $34,999 | 41 (11.1%) | 201 (20.6%) |
| $35,000 to $49,999 | 96 (26.0%) | 55 (5.6%) |
| $50,000 to $74,999 | 52 (14.1%) | 161 (16.5%) |
| $75,000 to $99,999 | 64 (17.3%) | 187 (19.2%) |
| $100,000 to $149,999 | 92 (24.9%) | 97 (10.0%) |
| $150,000 or more | 24 (6.5%) | 80 (8.2%) |
| Total | 369 (100.0%) | 975 (100.0%) |
Monthly Housing Cost Tiers in Green Island
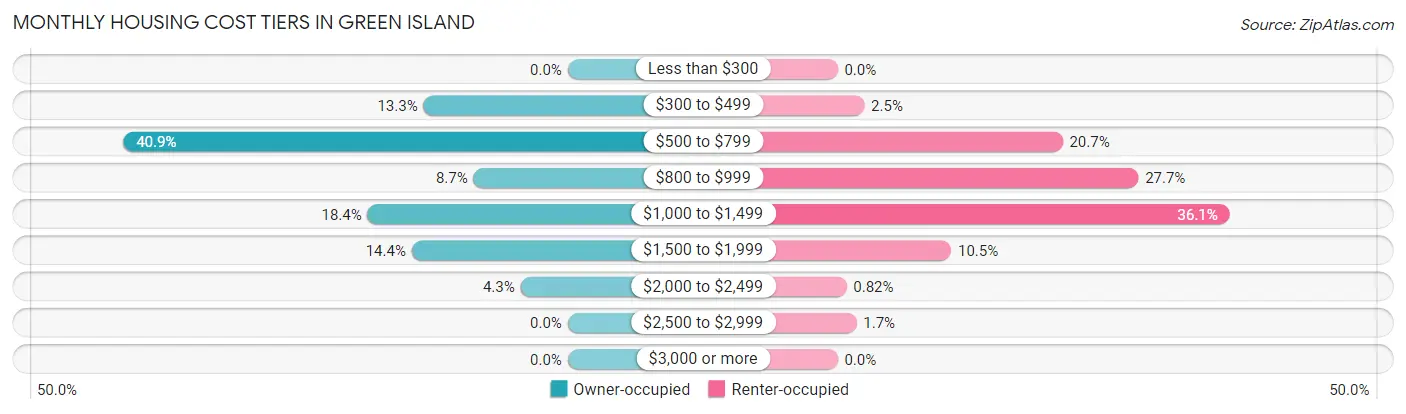
| Monthly Cost | Owner-occupied | Renter-occupied |
| Less than $300 | 0 (0.0%) | 0 (0.0%) |
| $300 to $499 | 49 (13.3%) | 24 (2.5%) |
| $500 to $799 | 151 (40.9%) | 202 (20.7%) |
| $800 to $999 | 32 (8.7%) | 270 (27.7%) |
| $1,000 to $1,499 | 68 (18.4%) | 352 (36.1%) |
| $1,500 to $1,999 | 53 (14.4%) | 102 (10.5%) |
| $2,000 to $2,499 | 16 (4.3%) | 8 (0.8%) |
| $2,500 to $2,999 | 0 (0.0%) | 17 (1.7%) |
| $3,000 or more | 0 (0.0%) | 0 (0.0%) |
| Total | 369 (100.0%) | 975 (100.0%) |
Physical Housing Characteristics in Green Island
Housing Structures in Green Island
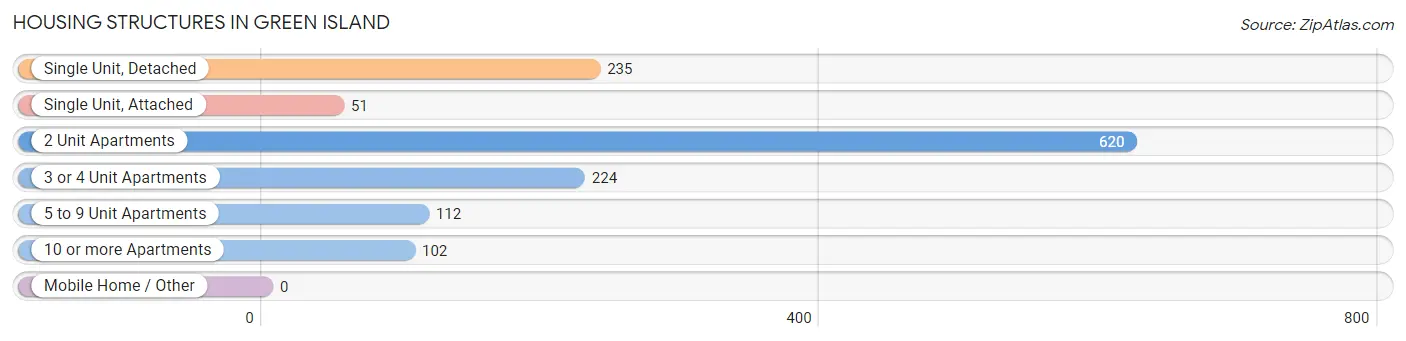
| Structure Type | # Housing Units | % Housing Units |
| Single Unit, Detached | 235 | 17.5% |
| Single Unit, Attached | 51 | 3.8% |
| 2 Unit Apartments | 620 | 46.1% |
| 3 or 4 Unit Apartments | 224 | 16.7% |
| 5 to 9 Unit Apartments | 112 | 8.3% |
| 10 or more Apartments | 102 | 7.6% |
| Mobile Home / Other | 0 | 0.0% |
| Total | 1,344 | 100.0% |
Housing Structures by Occupancy in Green Island
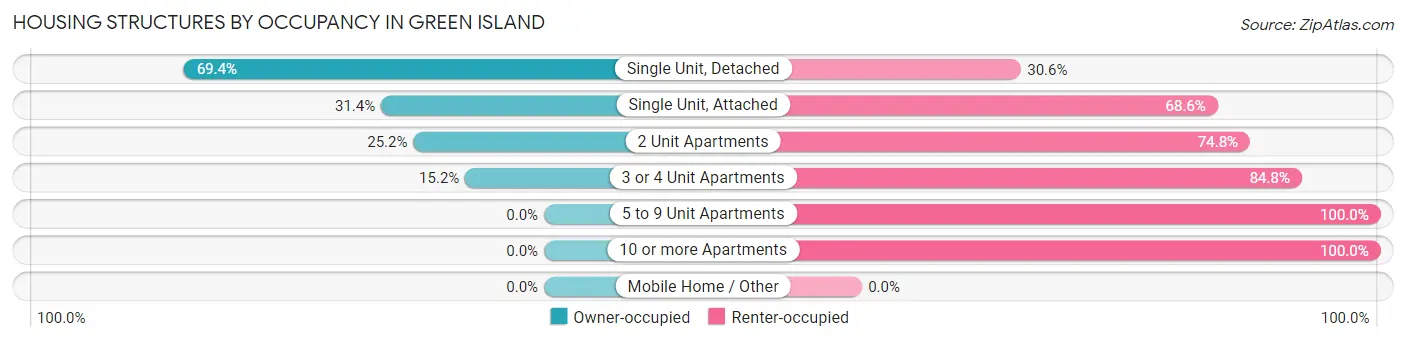
| Structure Type | Owner-occupied | Renter-occupied |
| Single Unit, Detached | 163 (69.4%) | 72 (30.6%) |
| Single Unit, Attached | 16 (31.4%) | 35 (68.6%) |
| 2 Unit Apartments | 156 (25.2%) | 464 (74.8%) |
| 3 or 4 Unit Apartments | 34 (15.2%) | 190 (84.8%) |
| 5 to 9 Unit Apartments | 0 (0.0%) | 112 (100.0%) |
| 10 or more Apartments | 0 (0.0%) | 102 (100.0%) |
| Mobile Home / Other | 0 (0.0%) | 0 (0.0%) |
| Total | 369 (27.5%) | 975 (72.5%) |
Housing Structures by Number of Rooms in Green Island
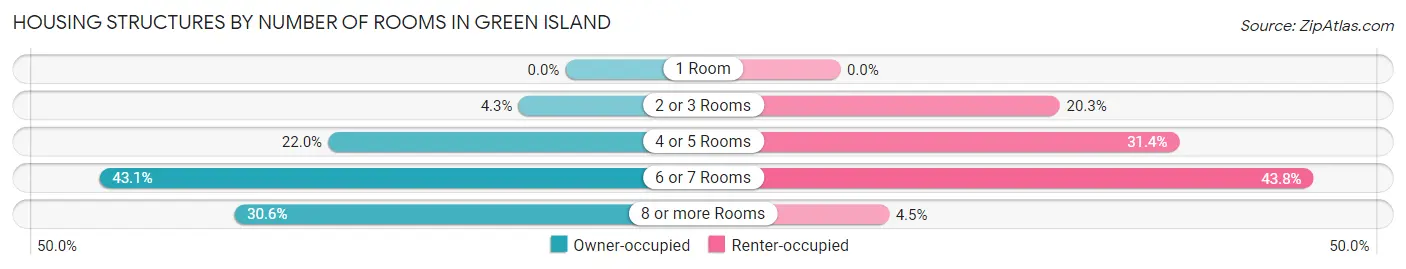
| Number of Rooms | Owner-occupied | Renter-occupied |
| 1 Room | 0 (0.0%) | 0 (0.0%) |
| 2 or 3 Rooms | 16 (4.3%) | 198 (20.3%) |
| 4 or 5 Rooms | 81 (22.0%) | 306 (31.4%) |
| 6 or 7 Rooms | 159 (43.1%) | 427 (43.8%) |
| 8 or more Rooms | 113 (30.6%) | 44 (4.5%) |
| Total | 369 (100.0%) | 975 (100.0%) |
Housing Structure by Heating Type in Green Island
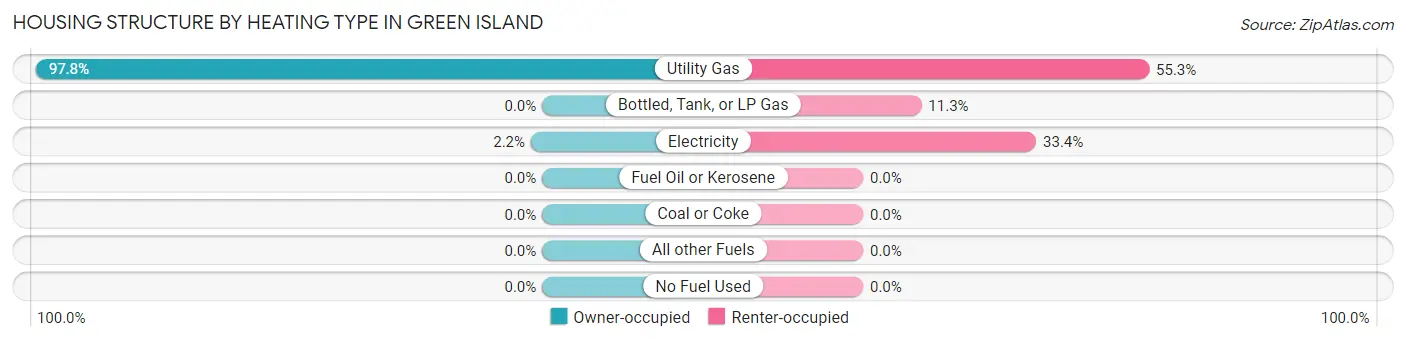
| Heating Type | Owner-occupied | Renter-occupied |
| Utility Gas | 361 (97.8%) | 539 (55.3%) |
| Bottled, Tank, or LP Gas | 0 (0.0%) | 110 (11.3%) |
| Electricity | 8 (2.2%) | 326 (33.4%) |
| Fuel Oil or Kerosene | 0 (0.0%) | 0 (0.0%) |
| Coal or Coke | 0 (0.0%) | 0 (0.0%) |
| All other Fuels | 0 (0.0%) | 0 (0.0%) |
| No Fuel Used | 0 (0.0%) | 0 (0.0%) |
| Total | 369 (100.0%) | 975 (100.0%) |
Household Vehicle Usage in Green Island
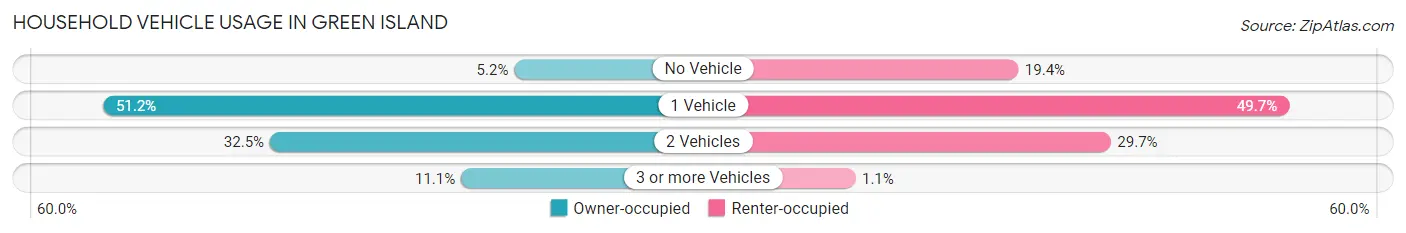
| Vehicles per Household | Owner-occupied | Renter-occupied |
| No Vehicle | 19 (5.1%) | 189 (19.4%) |
| 1 Vehicle | 189 (51.2%) | 485 (49.7%) |
| 2 Vehicles | 120 (32.5%) | 290 (29.7%) |
| 3 or more Vehicles | 41 (11.1%) | 11 (1.1%) |
| Total | 369 (100.0%) | 975 (100.0%) |
Real Estate & Mortgages in Green Island
Real Estate and Mortgage Overview in Green Island
| Characteristic | Without Mortgage | With Mortgage |
| Housing Units | 232 | 137 |
| Median Property Value | $145,500 | $166,100 |
| Median Household Income | $69,643 | $7 |
| Monthly Housing Costs | $641 | $0 |
| Real Estate Taxes | $3,400 | $8 |
Property Value by Mortgage Status in Green Island
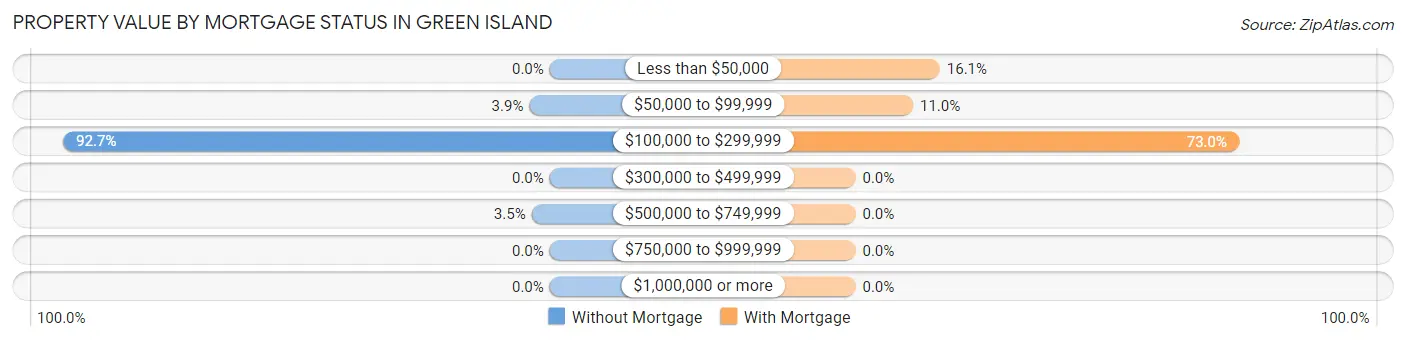
| Property Value | Without Mortgage | With Mortgage |
| Less than $50,000 | 0 (0.0%) | 22 (16.1%) |
| $50,000 to $99,999 | 9 (3.9%) | 15 (11.0%) |
| $100,000 to $299,999 | 215 (92.7%) | 100 (73.0%) |
| $300,000 to $499,999 | 0 (0.0%) | 0 (0.0%) |
| $500,000 to $749,999 | 8 (3.5%) | 0 (0.0%) |
| $750,000 to $999,999 | 0 (0.0%) | 0 (0.0%) |
| $1,000,000 or more | 0 (0.0%) | 0 (0.0%) |
| Total | 232 (100.0%) | 137 (100.0%) |
Household Income by Mortgage Status in Green Island
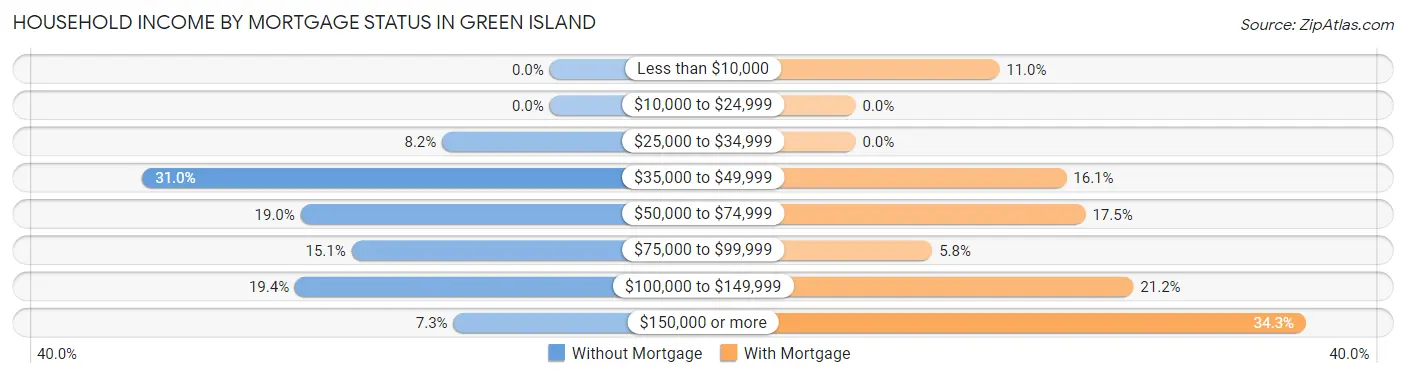
| Household Income | Without Mortgage | With Mortgage |
| Less than $10,000 | 0 (0.0%) | 15 (11.0%) |
| $10,000 to $24,999 | 0 (0.0%) | 0 (0.0%) |
| $25,000 to $34,999 | 19 (8.2%) | 0 (0.0%) |
| $35,000 to $49,999 | 72 (31.0%) | 22 (16.1%) |
| $50,000 to $74,999 | 44 (19.0%) | 24 (17.5%) |
| $75,000 to $99,999 | 35 (15.1%) | 8 (5.8%) |
| $100,000 to $149,999 | 45 (19.4%) | 29 (21.2%) |
| $150,000 or more | 17 (7.3%) | 47 (34.3%) |
| Total | 232 (100.0%) | 137 (100.0%) |
Property Value to Household Income Ratio in Green Island
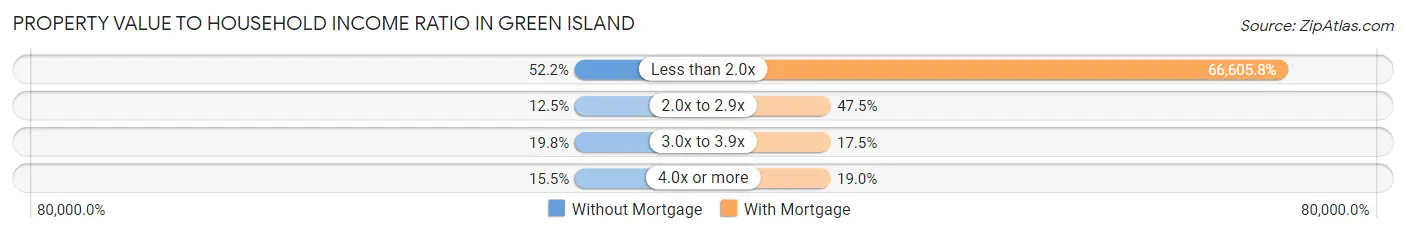
| Value-to-Income Ratio | Without Mortgage | With Mortgage |
| Less than 2.0x | 121 (52.2%) | 91,250 (66,605.8%) |
| 2.0x to 2.9x | 29 (12.5%) | 65 (47.4%) |
| 3.0x to 3.9x | 46 (19.8%) | 24 (17.5%) |
| 4.0x or more | 36 (15.5%) | 26 (19.0%) |
| Total | 232 (100.0%) | 137 (100.0%) |
Real Estate Taxes by Mortgage Status in Green Island
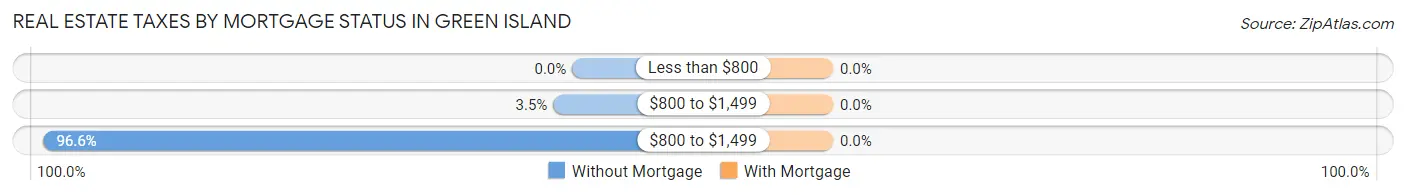
| Property Taxes | Without Mortgage | With Mortgage |
| Less than $800 | 0 (0.0%) | 0 (0.0%) |
| $800 to $1,499 | 8 (3.5%) | 0 (0.0%) |
| $800 to $1,499 | 224 (96.6%) | 0 (0.0%) |
| Total | 232 (100.0%) | 137 (100.0%) |
Health & Disability in Green Island
Health Insurance Coverage by Age in Green Island
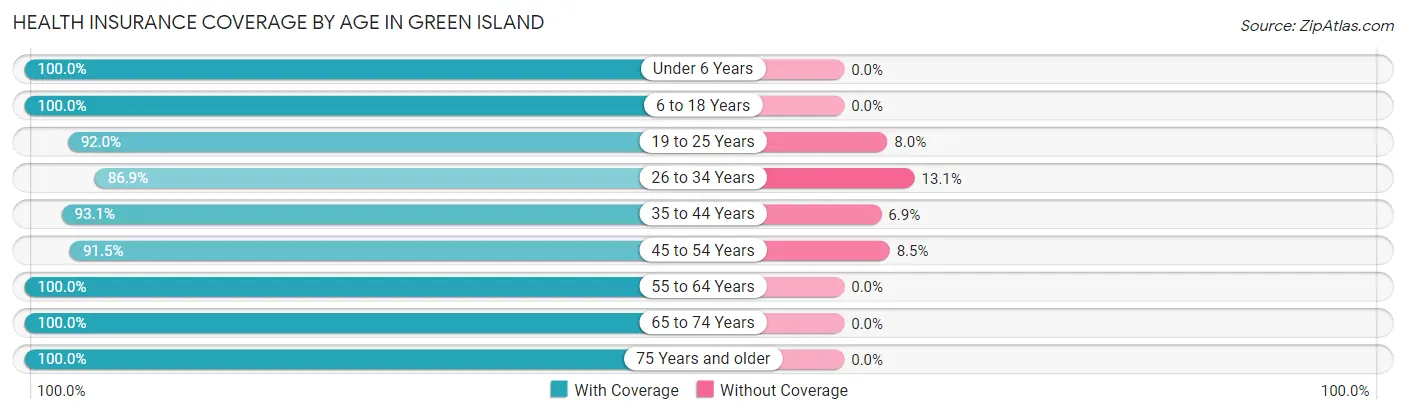
| Age Bracket | With Coverage | Without Coverage |
| Under 6 Years | 246 (100.0%) | 0 (0.0%) |
| 6 to 18 Years | 307 (100.0%) | 0 (0.0%) |
| 19 to 25 Years | 412 (92.0%) | 36 (8.0%) |
| 26 to 34 Years | 371 (86.9%) | 56 (13.1%) |
| 35 to 44 Years | 121 (93.1%) | 9 (6.9%) |
| 45 to 54 Years | 486 (91.5%) | 45 (8.5%) |
| 55 to 64 Years | 435 (100.0%) | 0 (0.0%) |
| 65 to 74 Years | 238 (100.0%) | 0 (0.0%) |
| 75 Years and older | 206 (100.0%) | 0 (0.0%) |
| Total | 2,822 (95.1%) | 146 (4.9%) |
Health Insurance Coverage by Citizenship Status in Green Island
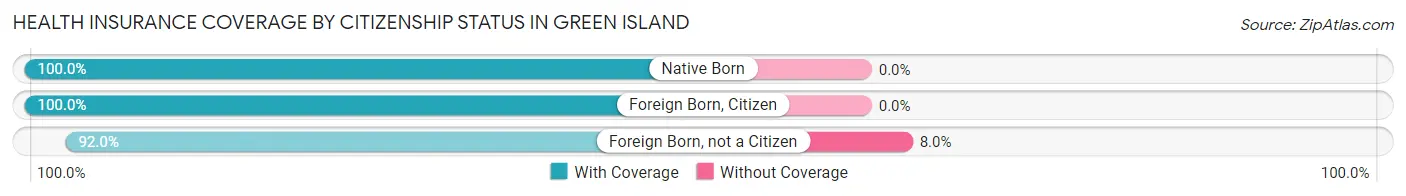
| Citizenship Status | With Coverage | Without Coverage |
| Native Born | 246 (100.0%) | 0 (0.0%) |
| Foreign Born, Citizen | 307 (100.0%) | 0 (0.0%) |
| Foreign Born, not a Citizen | 412 (92.0%) | 36 (8.0%) |
Health Insurance Coverage by Household Income in Green Island
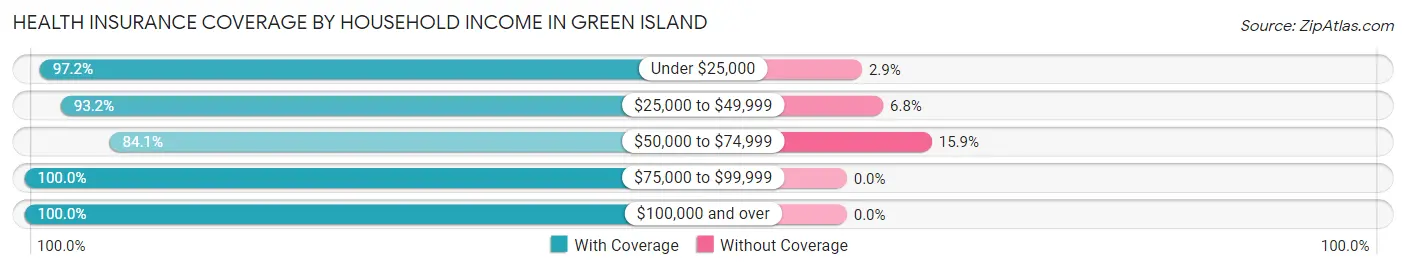
| Household Income | With Coverage | Without Coverage |
| Under $25,000 | 307 (97.2%) | 9 (2.9%) |
| $25,000 to $49,999 | 945 (93.2%) | 69 (6.8%) |
| $50,000 to $74,999 | 359 (84.1%) | 68 (15.9%) |
| $75,000 to $99,999 | 589 (100.0%) | 0 (0.0%) |
| $100,000 and over | 622 (100.0%) | 0 (0.0%) |
Public vs Private Health Insurance Coverage by Age in Green Island
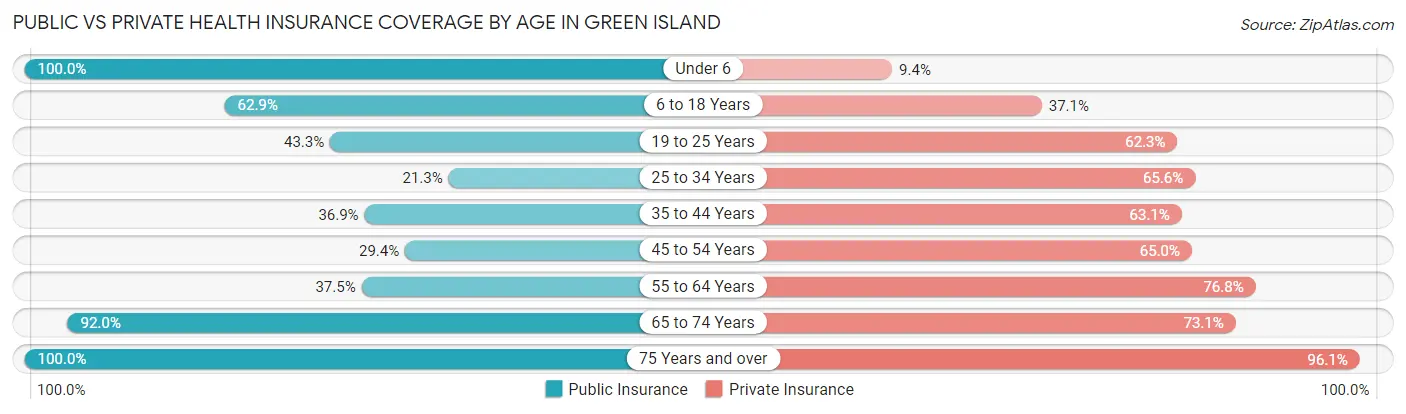
| Age Bracket | Public Insurance | Private Insurance |
| Under 6 | 246 (100.0%) | 23 (9.3%) |
| 6 to 18 Years | 193 (62.9%) | 114 (37.1%) |
| 19 to 25 Years | 194 (43.3%) | 279 (62.3%) |
| 25 to 34 Years | 91 (21.3%) | 280 (65.6%) |
| 35 to 44 Years | 48 (36.9%) | 82 (63.1%) |
| 45 to 54 Years | 156 (29.4%) | 345 (65.0%) |
| 55 to 64 Years | 163 (37.5%) | 334 (76.8%) |
| 65 to 74 Years | 219 (92.0%) | 174 (73.1%) |
| 75 Years and over | 206 (100.0%) | 198 (96.1%) |
| Total | 1,516 (51.1%) | 1,829 (61.6%) |
Disability Status by Sex by Age in Green Island
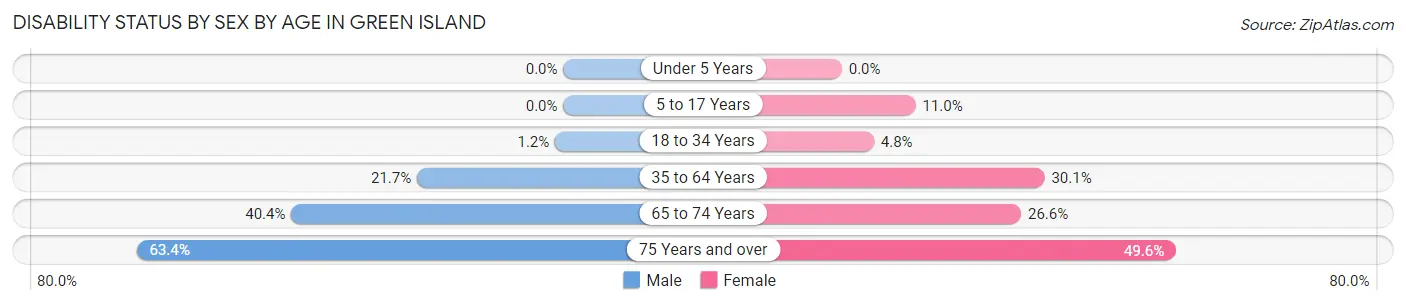
| Age Bracket | Male | Female |
| Under 5 Years | 0 (0.0%) | 0 (0.0%) |
| 5 to 17 Years | 0 (0.0%) | 23 (11.0%) |
| 18 to 34 Years | 7 (1.2%) | 15 (4.8%) |
| 35 to 64 Years | 106 (21.7%) | 183 (30.1%) |
| 65 to 74 Years | 40 (40.4%) | 37 (26.6%) |
| 75 Years and over | 45 (63.4%) | 67 (49.6%) |
Disability Class by Sex by Age in Green Island
Disability Class: Hearing Difficulty
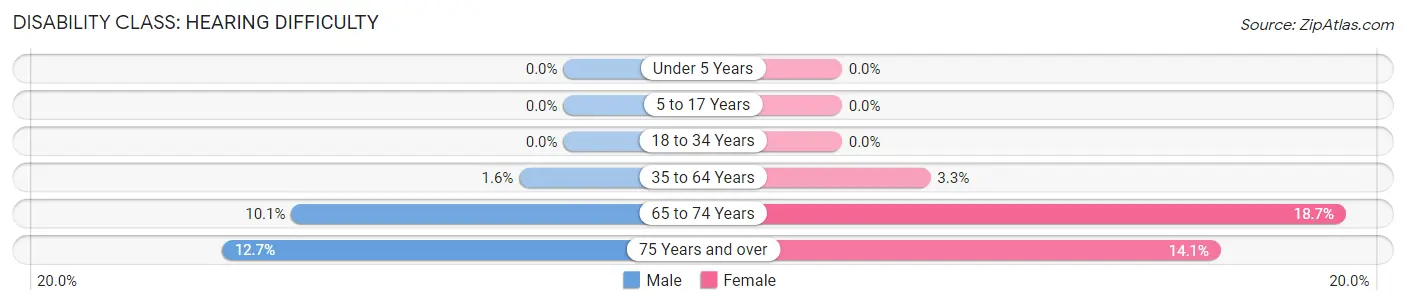
| Age Bracket | Male | Female |
| Under 5 Years | 0 (0.0%) | 0 (0.0%) |
| 5 to 17 Years | 0 (0.0%) | 0 (0.0%) |
| 18 to 34 Years | 0 (0.0%) | 0 (0.0%) |
| 35 to 64 Years | 8 (1.6%) | 20 (3.3%) |
| 65 to 74 Years | 10 (10.1%) | 26 (18.7%) |
| 75 Years and over | 9 (12.7%) | 19 (14.1%) |
Disability Class: Vision Difficulty
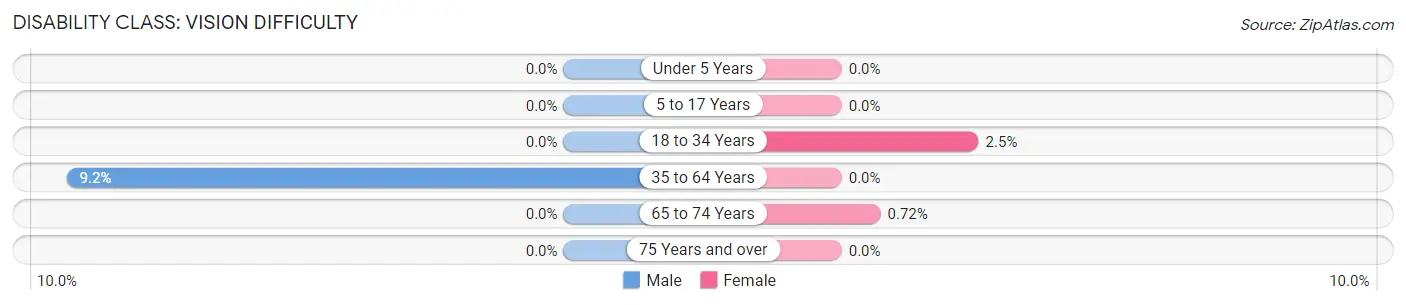
| Age Bracket | Male | Female |
| Under 5 Years | 0 (0.0%) | 0 (0.0%) |
| 5 to 17 Years | 0 (0.0%) | 0 (0.0%) |
| 18 to 34 Years | 0 (0.0%) | 8 (2.5%) |
| 35 to 64 Years | 45 (9.2%) | 0 (0.0%) |
| 65 to 74 Years | 0 (0.0%) | 1 (0.7%) |
| 75 Years and over | 0 (0.0%) | 0 (0.0%) |
Disability Class: Cognitive Difficulty
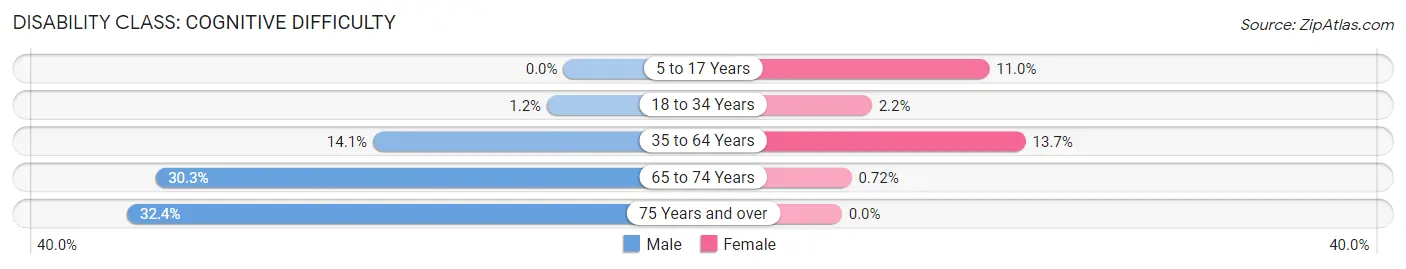
| Age Bracket | Male | Female |
| 5 to 17 Years | 0 (0.0%) | 23 (11.0%) |
| 18 to 34 Years | 7 (1.2%) | 7 (2.2%) |
| 35 to 64 Years | 69 (14.1%) | 83 (13.7%) |
| 65 to 74 Years | 30 (30.3%) | 1 (0.7%) |
| 75 Years and over | 23 (32.4%) | 0 (0.0%) |
Disability Class: Ambulatory Difficulty
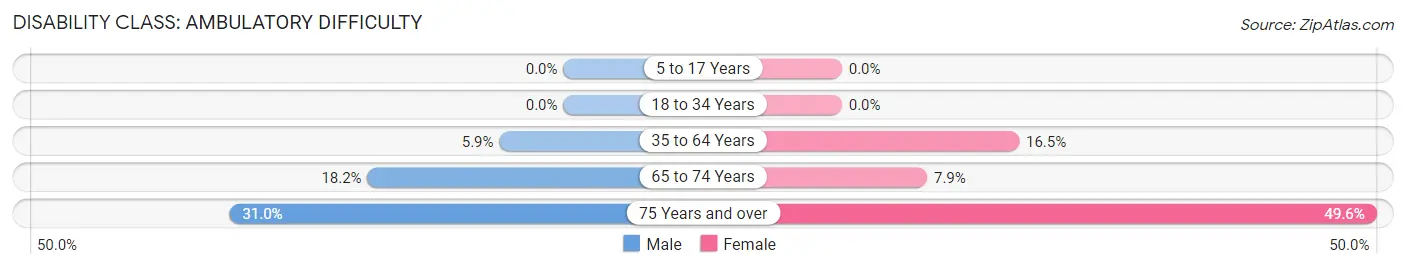
| Age Bracket | Male | Female |
| 5 to 17 Years | 0 (0.0%) | 0 (0.0%) |
| 18 to 34 Years | 0 (0.0%) | 0 (0.0%) |
| 35 to 64 Years | 29 (5.9%) | 100 (16.5%) |
| 65 to 74 Years | 18 (18.2%) | 11 (7.9%) |
| 75 Years and over | 22 (31.0%) | 67 (49.6%) |
Disability Class: Self-Care Difficulty
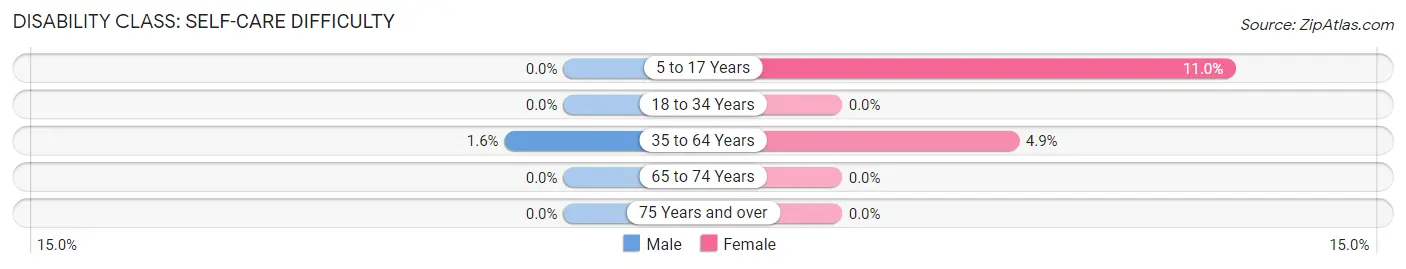
| Age Bracket | Male | Female |
| 5 to 17 Years | 0 (0.0%) | 23 (11.0%) |
| 18 to 34 Years | 0 (0.0%) | 0 (0.0%) |
| 35 to 64 Years | 8 (1.6%) | 30 (4.9%) |
| 65 to 74 Years | 0 (0.0%) | 0 (0.0%) |
| 75 Years and over | 0 (0.0%) | 0 (0.0%) |
Technology Access in Green Island
Computing Device Access in Green Island
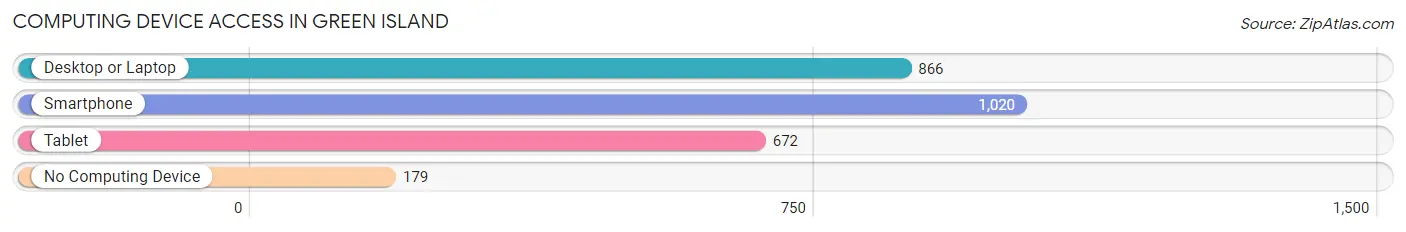
| Device Type | # Households | % Households |
| Desktop or Laptop | 866 | 64.4% |
| Smartphone | 1,020 | 75.9% |
| Tablet | 672 | 50.0% |
| No Computing Device | 179 | 13.3% |
| Total | 1,344 | 100.0% |
Internet Access in Green Island
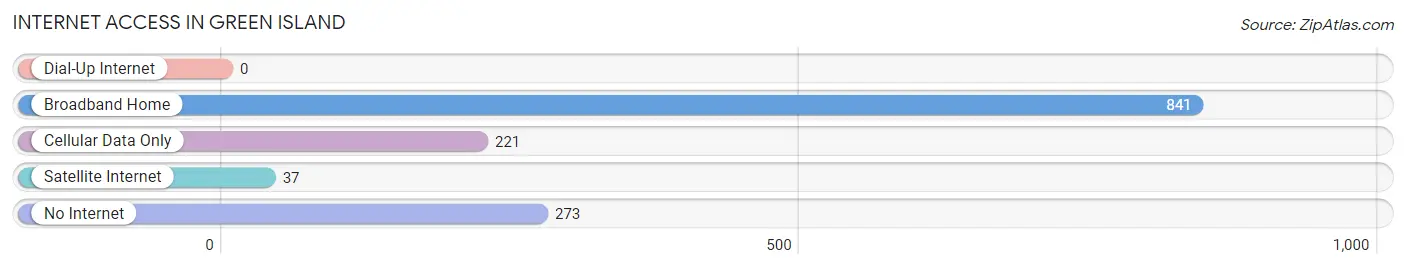
| Internet Type | # Households | % Households |
| Dial-Up Internet | 0 | 0.0% |
| Broadband Home | 841 | 62.6% |
| Cellular Data Only | 221 | 16.4% |
| Satellite Internet | 37 | 2.8% |
| No Internet | 273 | 20.3% |
| Total | 1,344 | 100.0% |
Green Island Summary
Green Island is a small town located in Albany County, New York. It is situated on the Hudson River, just south of the city of Albany. The town has a population of 2,620 people, according to the 2010 census.
History
Green Island was originally inhabited by the Mohican Indians, who called the area “Pawling”. The first European settlers arrived in the area in 1630, and the town was officially established in 1793. The town was named after the greenish hue of the river, which was caused by the presence of copper ore in the water.
In the 19th century, Green Island was a major industrial center, with several factories producing textiles, paper, and other goods. The town was also home to a large number of immigrants, who worked in the factories and helped to shape the town’s culture.
In the early 20th century, the town’s economy shifted away from manufacturing and towards tourism. The town was home to several amusement parks, including the famous Luna Park, which was open from 1906 to 1911.
Geography
Green Island is located in the Hudson Valley region of New York. The town is situated on the east bank of the Hudson River, just south of the city of Albany. The town is bordered by the towns of Colonie to the north, Watervliet to the east, and Cohoes to the south.
The town has a total area of 1.2 square miles, all of which is land. The terrain is mostly flat, with some hills in the northern part of the town. The town is located in a humid continental climate zone, with cold winters and hot, humid summers.
Economy
Green Island’s economy is largely based on tourism and services. The town is home to several restaurants, bars, and other businesses that cater to tourists. The town is also home to several small manufacturing companies, which produce a variety of products, including textiles, paper, and other goods.
The town is also home to several government offices, including the Green Island Town Hall and the Green Island Police Department. The town is also home to a branch of the Albany County Public Library.
Demographics
According to the 2010 census, Green Island has a population of 2,620 people. The town has a median household income of $45,945, and a median family income of $54,813. The town has a poverty rate of 11.3%, which is slightly higher than the national average.
The town is predominantly white, with a population that is 94.3% white, 2.2% Hispanic, 1.2% African American, and 1.2% Asian. The town is also home to a large number of immigrants, with a foreign-born population of 11.3%.
Conclusion
Green Island is a small town located in Albany County, New York. It is situated on the east bank of the Hudson River, just south of the city of Albany. The town has a population of 2,620 people, according to the 2010 census. The town’s economy is largely based on tourism and services, and the town is home to several government offices, restaurants, bars, and other businesses. The town is predominantly white, with a population that is 94.3% white, 2.2% Hispanic, 1.2% African American, and 1.2% Asian. The town is also home to a large number of immigrants, with a foreign-born population of 11.3%.
Common Questions
What is Per Capita Income in Green Island?
Per Capita income in Green Island is $34,742.
What is the Median Family Income in Green Island?
Median Family Income in Green Island is $72,250.
What is the Median Household income in Green Island?
Median Household Income in Green Island is $64,018.
What is Income or Wage Gap in Green Island?
Income or Wage Gap in Green Island is 16.8%.
Women in Green Island earn 83.2 cents for every dollar earned by a man.
What is Inequality or Gini Index in Green Island?
Inequality or Gini Index in Green Island is 0.41.
What is the Total Population of Green Island?
Total Population of Green Island is 2,968.
What is the Total Male Population of Green Island?
Total Male Population of Green Island is 1,422.
What is the Total Female Population of Green Island?
Total Female Population of Green Island is 1,546.
What is the Ratio of Males per 100 Females in Green Island?
There are 91.98 Males per 100 Females in Green Island.
What is the Ratio of Females per 100 Males in Green Island?
There are 108.72 Females per 100 Males in Green Island.
What is the Median Population Age in Green Island?
Median Population Age in Green Island is 37.9 Years.
What is the Average Family Size in Green Island
Average Family Size in Green Island is 3.0 People.
What is the Average Household Size in Green Island
Average Household Size in Green Island is 2.2 People.
How Large is the Labor Force in Green Island?
There are 1,495 People in the Labor Forcein in Green Island.
What is the Percentage of People in the Labor Force in Green Island?
60.2% of People are in the Labor Force in Green Island.
What is the Unemployment Rate in Green Island?
Unemployment Rate in Green Island is 13.0%.