Kaser, NY Map & Demographics
Kaser Map
Kaser Overview
$9,471
PER CAPITA INCOME
$29,835
AVG FAMILY INCOME
$30,320
AVG HOUSEHOLD INCOME
35.8%
WAGE / INCOME GAP [ % ]
64.2¢/ $1
WAGE / INCOME GAP [ $ ]
$15,171
FAMILY INCOME DEFICIT
0.43
INEQUALITY / GINI INDEX
5,501
TOTAL POPULATION
2,762
MALE POPULATION
2,739
FEMALE POPULATION
100.84
MALES / 100 FEMALES
99.17
FEMALES / 100 MALES
15.6
MEDIAN AGE
4.9
AVG FAMILY SIZE
4.8
AVG HOUSEHOLD SIZE
1,506
LABOR FORCE [ PEOPLE ]
56.3%
PERCENT IN LABOR FORCE
7.2%
UNEMPLOYMENT RATE
Kaser Area Codes
Income in Kaser
Income Overview in Kaser
Per Capita Income in Kaser is $9,471, while median incomes of families and households are $29,835 and $30,320 respectively.
| Characteristic | Number | Measure |
| Per Capita Income | 5,501 | $9,471 |
| Median Family Income | 1,115 | $29,835 |
| Mean Family Income | 1,115 | $44,189 |
| Median Household Income | 1,135 | $30,320 |
| Mean Household Income | 1,135 | $44,794 |
| Income Deficit | 1,115 | $15,171 |
| Wage / Income Gap (%) | 5,501 | 35.80% |
| Wage / Income Gap ($) | 5,501 | 64.20¢ per $1 |
| Gini / Inequality Index | 5,501 | 0.43 |
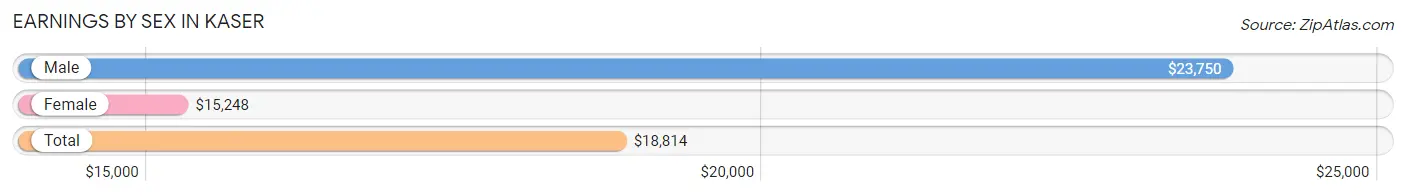
Earnings by Sex in Kaser
Average Earnings in Kaser are $18,814, $23,750 for men and $15,248 for women, a difference of 35.8%.
| Sex | Number | Average Earnings |
| Male | 845 (52.2%) | $23,750 |
| Female | 775 (47.8%) | $15,248 |
| Total | 1,620 (100.0%) | $18,814 |
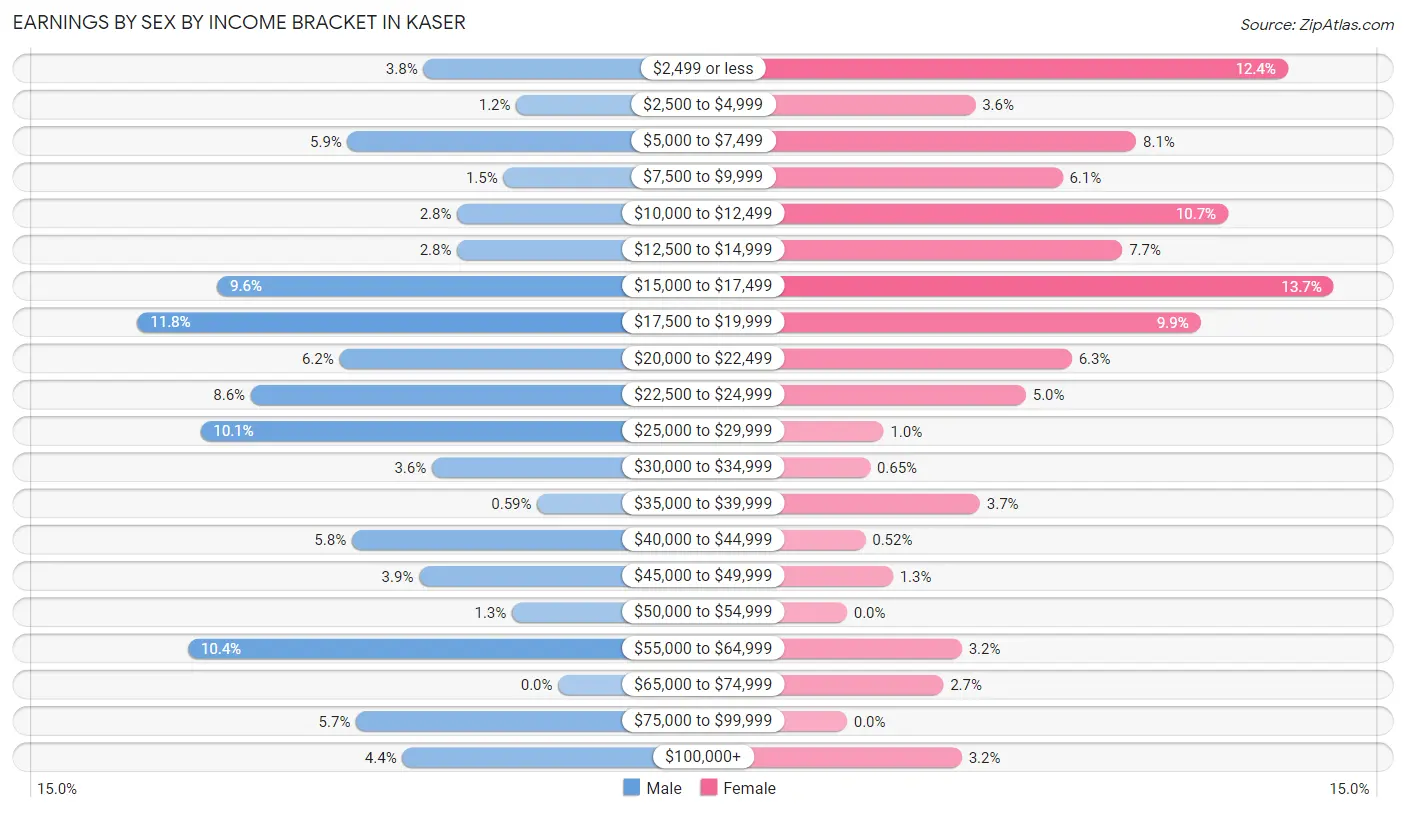
Earnings by Sex by Income Bracket in Kaser
The most common earnings brackets in Kaser are $17,500 to $19,999 for men (100 | 11.8%) and $15,000 to $17,499 for women (106 | 13.7%).
| Income | Male | Female |
| $2,499 or less | 32 (3.8%) | 96 (12.4%) |
| $2,500 to $4,999 | 10 (1.2%) | 28 (3.6%) |
| $5,000 to $7,499 | 50 (5.9%) | 63 (8.1%) |
| $7,500 to $9,999 | 13 (1.5%) | 47 (6.1%) |
| $10,000 to $12,499 | 24 (2.8%) | 83 (10.7%) |
| $12,500 to $14,999 | 24 (2.8%) | 60 (7.7%) |
| $15,000 to $17,499 | 81 (9.6%) | 106 (13.7%) |
| $17,500 to $19,999 | 100 (11.8%) | 77 (9.9%) |
| $20,000 to $22,499 | 52 (6.1%) | 49 (6.3%) |
| $22,500 to $24,999 | 73 (8.6%) | 39 (5.0%) |
| $25,000 to $29,999 | 85 (10.1%) | 8 (1.0%) |
| $30,000 to $34,999 | 30 (3.5%) | 5 (0.6%) |
| $35,000 to $39,999 | 5 (0.6%) | 29 (3.7%) |
| $40,000 to $44,999 | 49 (5.8%) | 4 (0.5%) |
| $45,000 to $49,999 | 33 (3.9%) | 10 (1.3%) |
| $50,000 to $54,999 | 11 (1.3%) | 0 (0.0%) |
| $55,000 to $64,999 | 88 (10.4%) | 25 (3.2%) |
| $65,000 to $74,999 | 0 (0.0%) | 21 (2.7%) |
| $75,000 to $99,999 | 48 (5.7%) | 0 (0.0%) |
| $100,000+ | 37 (4.4%) | 25 (3.2%) |
| Total | 845 (100.0%) | 775 (100.0%) |
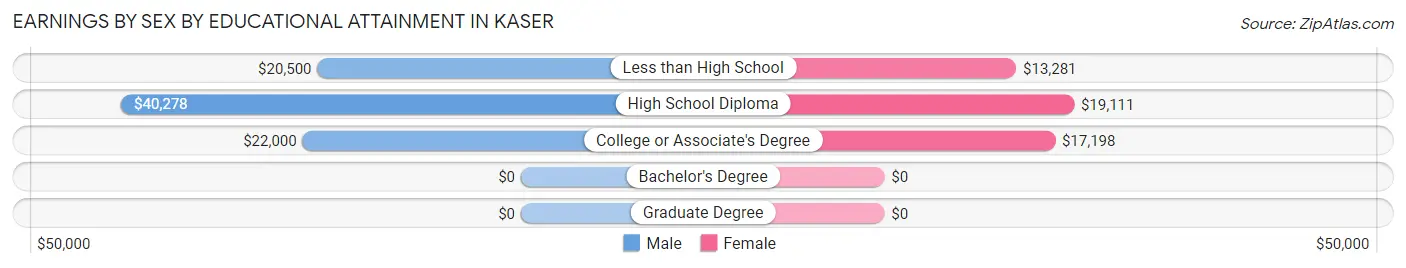
Earnings by Sex by Educational Attainment in Kaser
Average earnings in Kaser are $22,212 for men and $17,861 for women, a difference of 19.6%. Men with an educational attainment of high school diploma enjoy the highest average annual earnings of $40,278, while those with less than high school education earn the least with $20,500. Women with an educational attainment of high school diploma earn the most with the average annual earnings of $19,111, while those with less than high school education have the smallest earnings of $13,281.
| Educational Attainment | Male Income | Female Income |
| Less than High School | $20,500 | $13,281 |
| High School Diploma | $40,278 | $19,111 |
| College or Associate's Degree | $22,000 | $17,198 |
| Bachelor's Degree | - | - |
| Graduate Degree | - | - |
| Total | $22,212 | $17,861 |
Family Income in Kaser
Family Income Brackets in Kaser
According to the Kaser family income data, there are 353 families falling into the $15,000 to $24,999 income range, which is the most common income bracket and makes up 31.7% of all families. Conversely, the $200,000+ income bracket is the least frequent group with only 13 families (1.2%) belonging to this category.
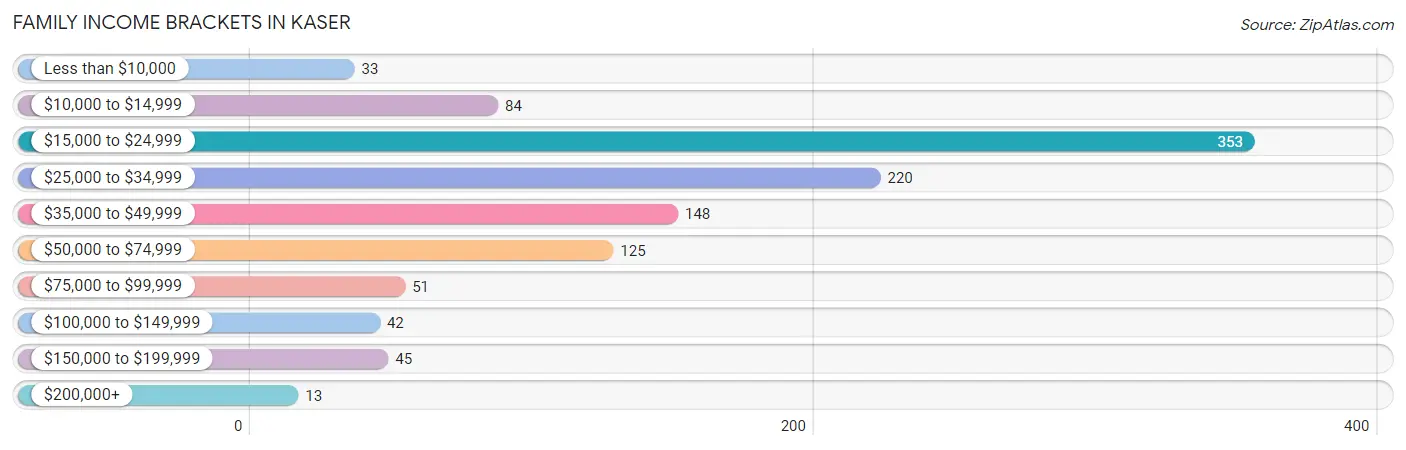
| Income Bracket | # Families | % Families |
| Less than $10,000 | 33 | 3.0% |
| $10,000 to $14,999 | 84 | 7.5% |
| $15,000 to $24,999 | 353 | 31.7% |
| $25,000 to $34,999 | 220 | 19.7% |
| $35,000 to $49,999 | 148 | 13.3% |
| $50,000 to $74,999 | 125 | 11.2% |
| $75,000 to $99,999 | 51 | 4.6% |
| $100,000 to $149,999 | 42 | 3.8% |
| $150,000 to $199,999 | 45 | 4.0% |
| $200,000+ | 13 | 1.2% |
Family Income by Famaliy Size in Kaser
6-person families (138 | 12.4%) account for the highest median family income in Kaser with $33,438 per family, while 5-person families (175 | 15.7%) have the highest median income of $6,354 per family member.
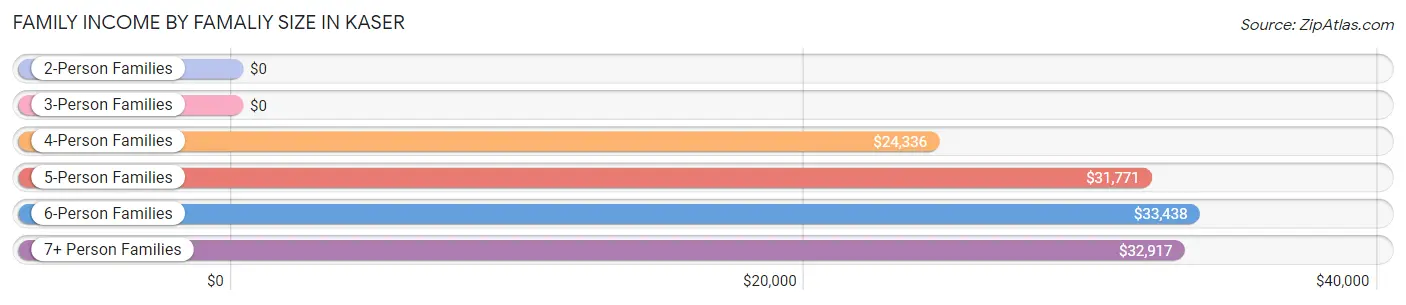
| Income Bracket | # Families | Median Income |
| 2-Person Families | 266 (23.9%) | $0 |
| 3-Person Families | 58 (5.2%) | $0 |
| 4-Person Families | 184 (16.5%) | $24,336 |
| 5-Person Families | 175 (15.7%) | $31,771 |
| 6-Person Families | 138 (12.4%) | $33,438 |
| 7+ Person Families | 294 (26.4%) | $32,917 |
| Total | 1,115 (100.0%) | $29,835 |
Family Income by Number of Earners in Kaser
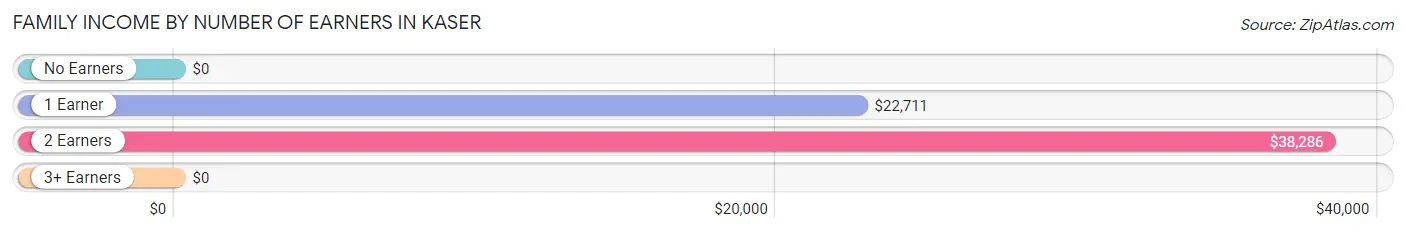
| Number of Earners | # Families | Median Income |
| No Earners | 39 (3.5%) | $0 |
| 1 Earner | 618 (55.4%) | $22,711 |
| 2 Earners | 438 (39.3%) | $38,286 |
| 3+ Earners | 20 (1.8%) | $0 |
| Total | 1,115 (100.0%) | $29,835 |
Household Income in Kaser
Household Income Brackets in Kaser
With 353 households falling in the category, the $15,000 to $24,999 income range is the most frequent in Kaser, accounting for 31.1% of all households. In contrast, only 12 households (1.1%) fall into the $200,000+ income bracket, making it the least populous group.
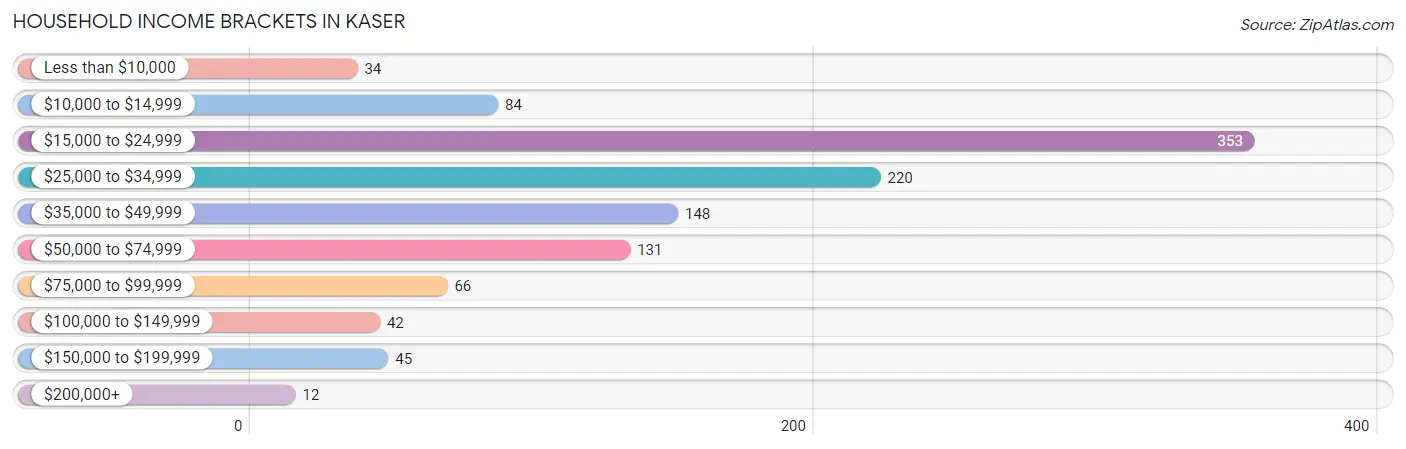
| Income Bracket | # Households | % Households |
| Less than $10,000 | 34 | 3.0% |
| $10,000 to $14,999 | 84 | 7.4% |
| $15,000 to $24,999 | 353 | 31.1% |
| $25,000 to $34,999 | 220 | 19.4% |
| $35,000 to $49,999 | 148 | 13.0% |
| $50,000 to $74,999 | 131 | 11.5% |
| $75,000 to $99,999 | 66 | 5.8% |
| $100,000 to $149,999 | 42 | 3.7% |
| $150,000 to $199,999 | 45 | 4.0% |
| $200,000+ | 12 | 1.1% |
Household Income by Householder Age in Kaser
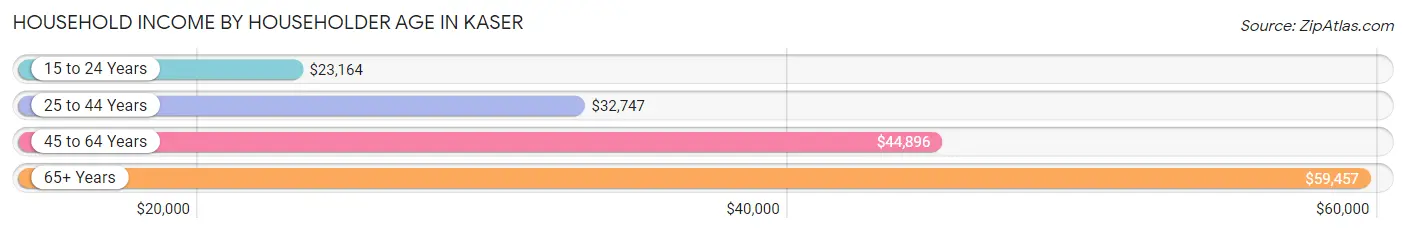
The median household income in Kaser is $30,320, with the highest median household income of $59,457 found in the 65+ years age bracket for the primary householder. A total of 86 households (7.6%) fall into this category. Meanwhile, the 15 to 24 years age bracket for the primary householder has the lowest median household income of $23,164, with 388 households (34.2%) in this group.
| Income Bracket | # Households | Median Income |
| 15 to 24 Years | 388 (34.2%) | $23,164 |
| 25 to 44 Years | 468 (41.2%) | $32,747 |
| 45 to 64 Years | 193 (17.0%) | $44,896 |
| 65+ Years | 86 (7.6%) | $59,457 |
| Total | 1,135 (100.0%) | $30,320 |
Poverty in Kaser
Income Below Poverty by Sex and Age in Kaser
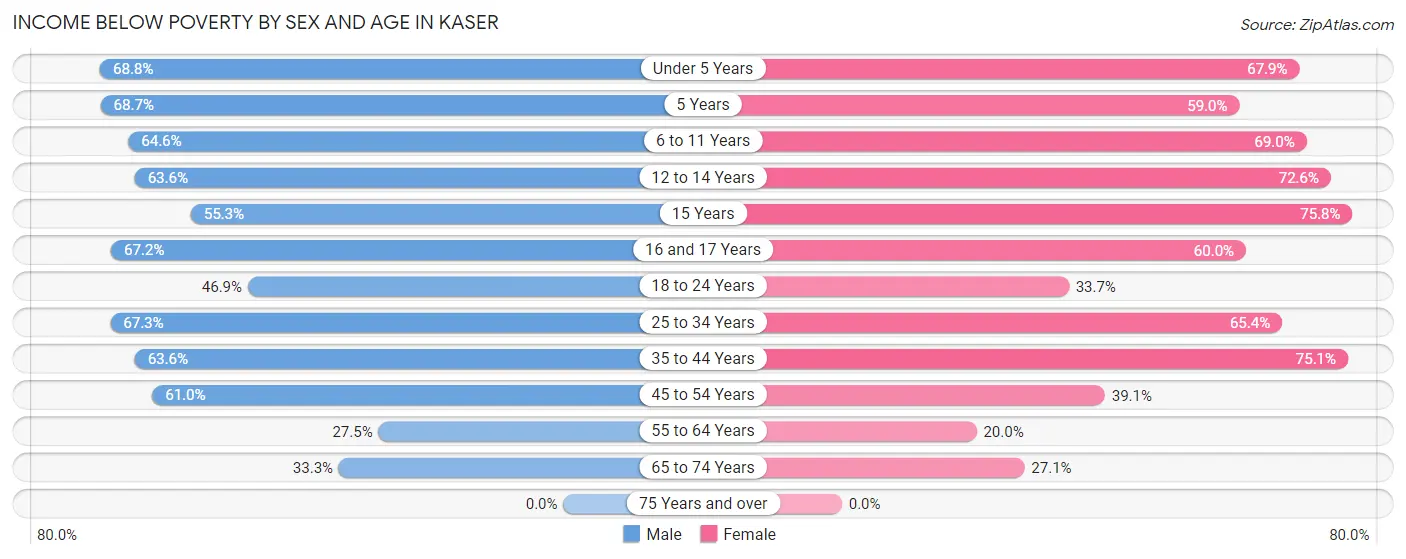
With 61.3% poverty level for males and 59.5% for females among the residents of Kaser, under 5 year old males and 15 year old females are the most vulnerable to poverty, with 445 males (68.8%) and 94 females (75.8%) in their respective age groups living below the poverty level.
| Age Bracket | Male | Female |
| Under 5 Years | 445 (68.8%) | 430 (67.9%) |
| 5 Years | 79 (68.7%) | 72 (59.0%) |
| 6 to 11 Years | 290 (64.6%) | 276 (69.0%) |
| 12 to 14 Years | 84 (63.6%) | 114 (72.6%) |
| 15 Years | 26 (55.3%) | 94 (75.8%) |
| 16 and 17 Years | 90 (67.2%) | 42 (60.0%) |
| 18 to 24 Years | 216 (46.9%) | 156 (33.7%) |
| 25 to 34 Years | 228 (67.3%) | 234 (65.4%) |
| 35 to 44 Years | 119 (63.6%) | 139 (75.1%) |
| 45 to 54 Years | 83 (61.0%) | 50 (39.1%) |
| 55 to 64 Years | 14 (27.5%) | 6 (20.0%) |
| 65 to 74 Years | 20 (33.3%) | 16 (27.1%) |
| 75 Years and over | 0 (0.0%) | 0 (0.0%) |
| Total | 1,694 (61.3%) | 1,629 (59.5%) |
Income Above Poverty by Sex and Age in Kaser
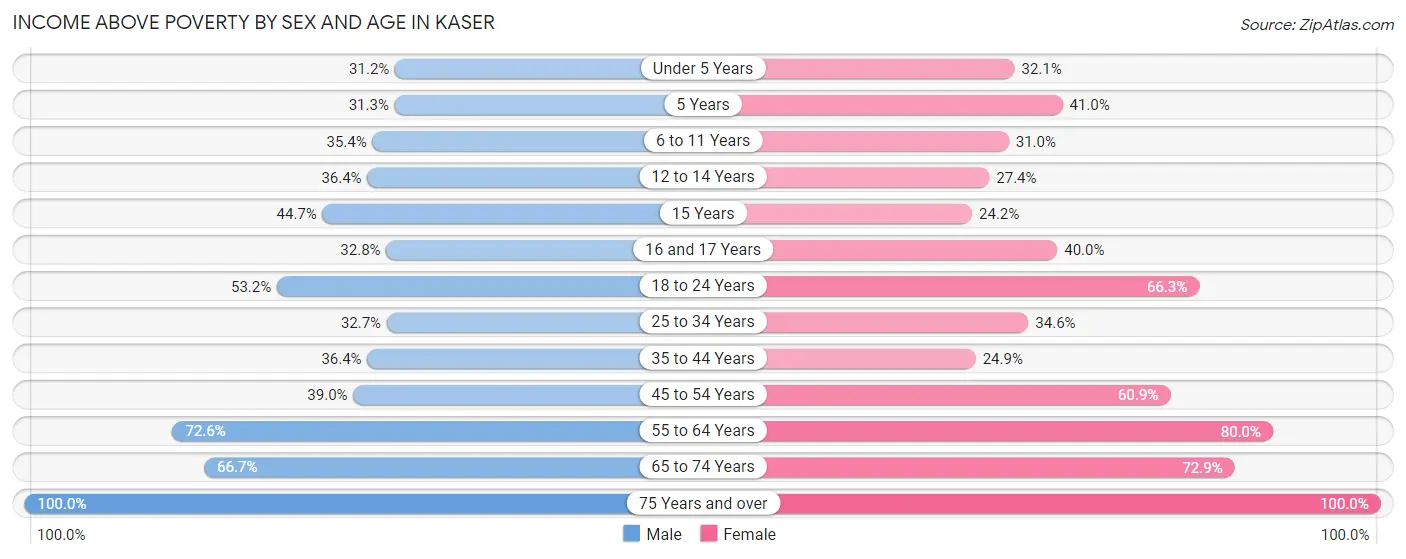
According to the poverty statistics in Kaser, males aged 75 years and over and females aged 75 years and over are the age groups that are most secure financially, with 100.0% of males and 100.0% of females in these age groups living above the poverty line.
| Age Bracket | Male | Female |
| Under 5 Years | 202 (31.2%) | 203 (32.1%) |
| 5 Years | 36 (31.3%) | 50 (41.0%) |
| 6 to 11 Years | 159 (35.4%) | 124 (31.0%) |
| 12 to 14 Years | 48 (36.4%) | 43 (27.4%) |
| 15 Years | 21 (44.7%) | 30 (24.2%) |
| 16 and 17 Years | 44 (32.8%) | 28 (40.0%) |
| 18 to 24 Years | 245 (53.1%) | 307 (66.3%) |
| 25 to 34 Years | 111 (32.7%) | 124 (34.6%) |
| 35 to 44 Years | 68 (36.4%) | 46 (24.9%) |
| 45 to 54 Years | 53 (39.0%) | 78 (60.9%) |
| 55 to 64 Years | 37 (72.6%) | 24 (80.0%) |
| 65 to 74 Years | 40 (66.7%) | 43 (72.9%) |
| 75 Years and over | 4 (100.0%) | 10 (100.0%) |
| Total | 1,068 (38.7%) | 1,110 (40.5%) |
Income Below Poverty Among Married-Couple Families in Kaser
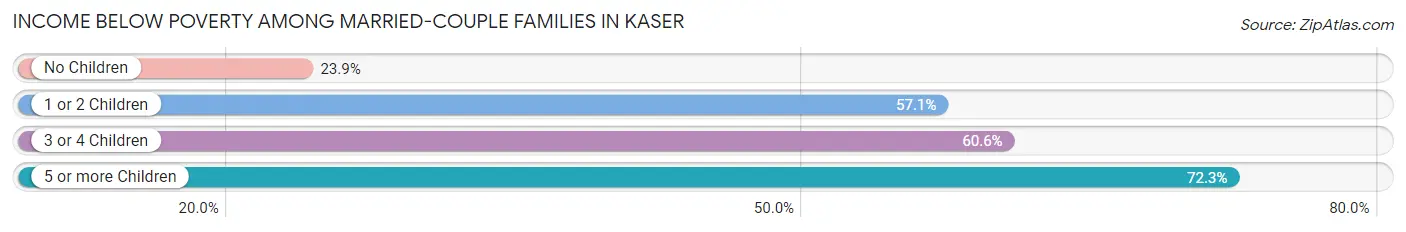
The poverty statistics for married-couple families in Kaser show that 53.2% or 580 of the total 1,090 families live below the poverty line. Families with 5 or more children have the highest poverty rate of 72.3%, comprising of 193 families. On the other hand, families with no children have the lowest poverty rate of 23.9%, which includes 68 families.
| Children | Above Poverty | Below Poverty |
| No Children | 216 (76.1%) | 68 (23.9%) |
| 1 or 2 Children | 91 (42.9%) | 121 (57.1%) |
| 3 or 4 Children | 129 (39.5%) | 198 (60.6%) |
| 5 or more Children | 74 (27.7%) | 193 (72.3%) |
| Total | 510 (46.8%) | 580 (53.2%) |
Income Below Poverty Among Single-Parent Households in Kaser
| Children | Single Father | Single Mother |
| No Children | 0 (0.0%) | 0 (0.0%) |
| 1 or 2 Children | 0 (0.0%) | 0 (0.0%) |
| 3 or 4 Children | 0 (0.0%) | 0 (0.0%) |
| 5 or more Children | 0 (0.0%) | 0 (0.0%) |
| Total | 0 (0.0%) | 0 (0.0%) |
Income Below Poverty Among Married-Couple vs Single-Parent Households in Kaser
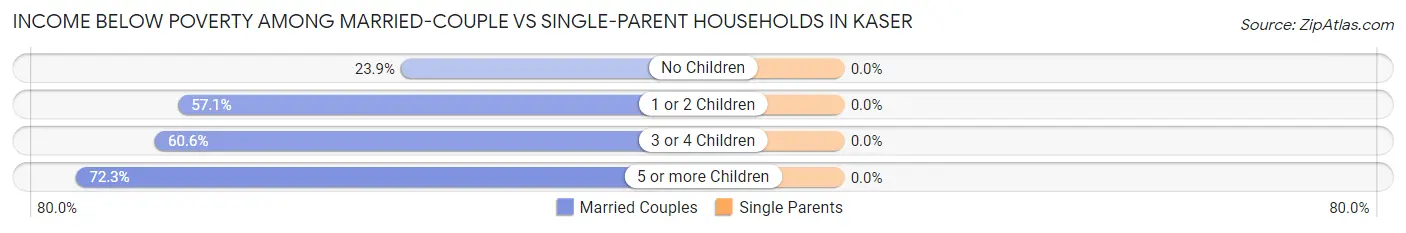
| Children | Married-Couple Families | Single-Parent Households |
| No Children | 68 (23.9%) | 0 (0.0%) |
| 1 or 2 Children | 121 (57.1%) | 0 (0.0%) |
| 3 or 4 Children | 198 (60.6%) | 0 (0.0%) |
| 5 or more Children | 193 (72.3%) | 0 (0.0%) |
| Total | 580 (53.2%) | 0 (0.0%) |
Race in Kaser
The most populous races in Kaser are White / Caucasian (5,319 | 96.7%), Two or more Races (135 | 2.5%), and Hispanic or Latino (60 | 1.1%).
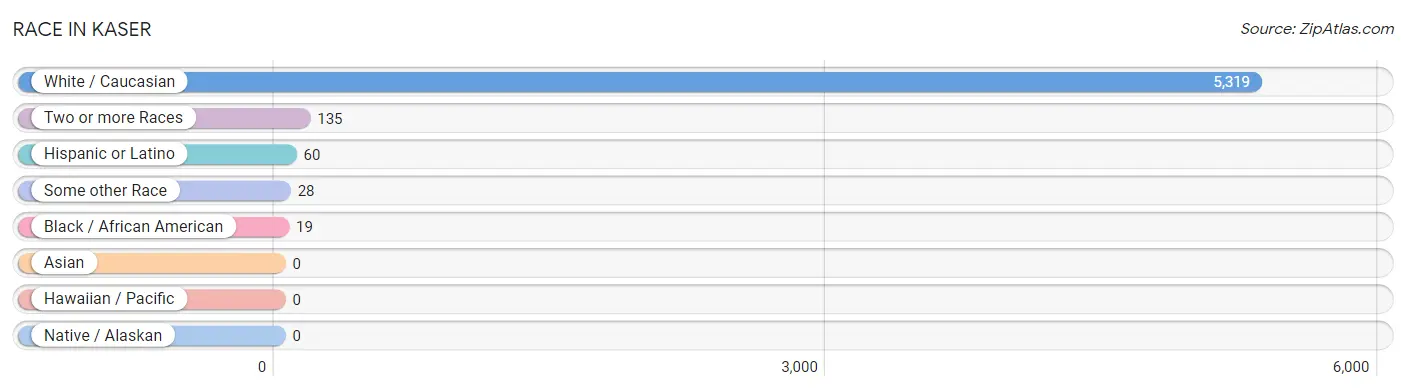
| Race | # Population | % Population |
| Asian | 0 | 0.0% |
| Black / African American | 19 | 0.4% |
| Hawaiian / Pacific | 0 | 0.0% |
| Hispanic or Latino | 60 | 1.1% |
| Native / Alaskan | 0 | 0.0% |
| White / Caucasian | 5,319 | 96.7% |
| Two or more Races | 135 | 2.5% |
| Some other Race | 28 | 0.5% |
| Total | 5,501 | 100.0% |
Ancestry in Kaser
The most populous ancestries reported in Kaser are American (1,762 | 32.0%), Hungarian (1,392 | 25.3%), Romanian (636 | 11.6%), European (359 | 6.5%), and Polish (280 | 5.1%), together accounting for 80.5% of all Kaser residents.
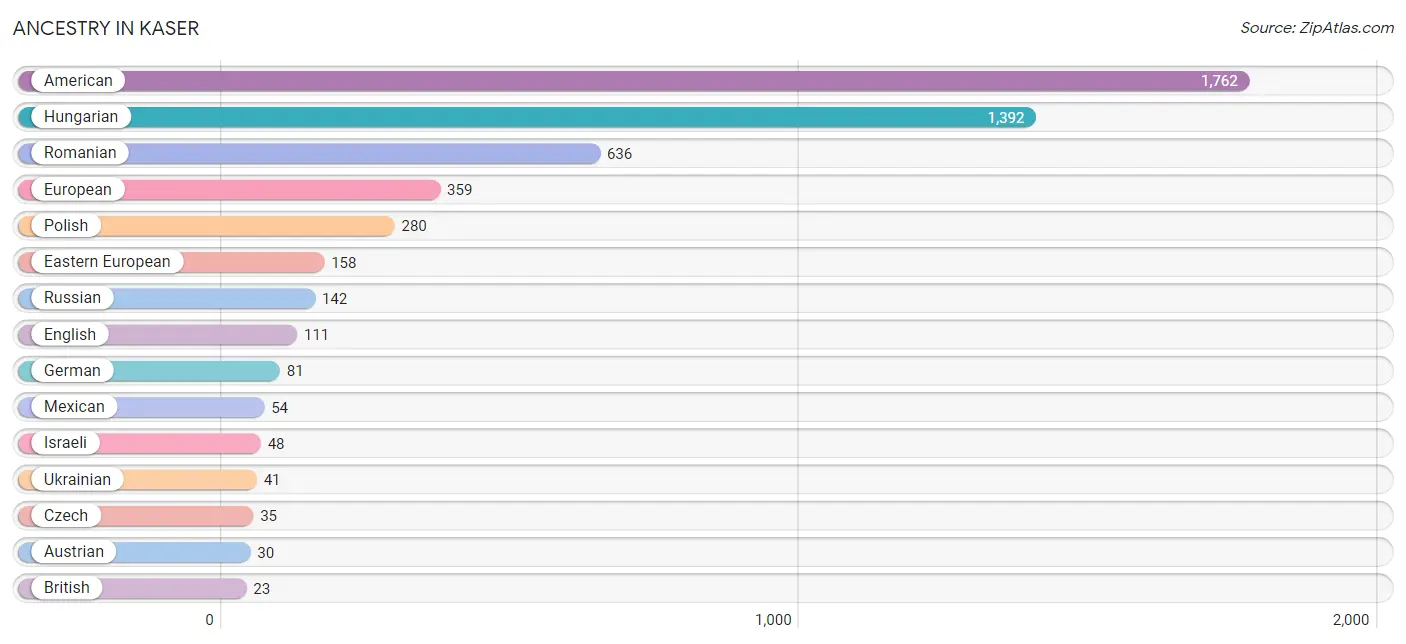
| Ancestry | # Population | % Population |
| American | 1,762 | 32.0% |
| Austrian | 30 | 0.5% |
| British | 23 | 0.4% |
| Czech | 35 | 0.6% |
| Czechoslovakian | 8 | 0.2% |
| Eastern European | 158 | 2.9% |
| English | 111 | 2.0% |
| European | 359 | 6.5% |
| German | 81 | 1.5% |
| Hungarian | 1,392 | 25.3% |
| Israeli | 48 | 0.9% |
| Mexican | 54 | 1.0% |
| Polish | 280 | 5.1% |
| Puerto Rican | 6 | 0.1% |
| Romanian | 636 | 11.6% |
| Russian | 142 | 2.6% |
| Ukrainian | 41 | 0.7% | View All 17 Rows |
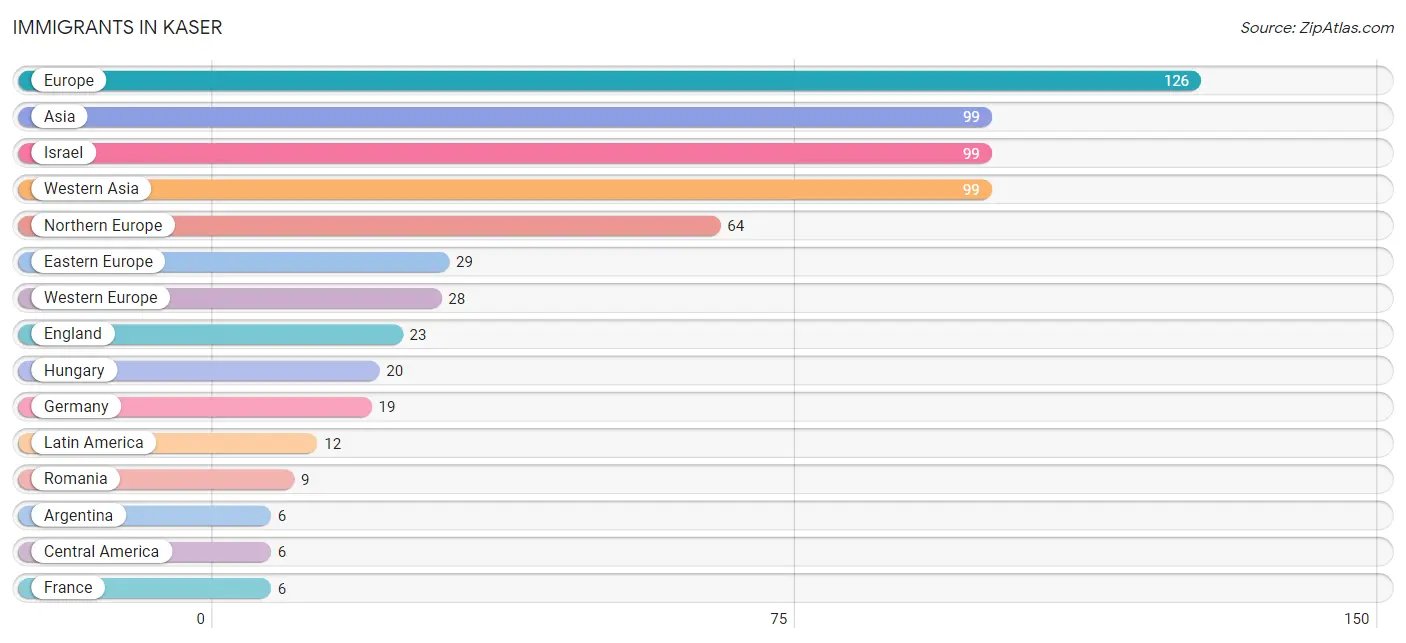
Immigrants in Kaser
The most numerous immigrant groups reported in Kaser came from Europe (126 | 2.3%), Asia (99 | 1.8%), Israel (99 | 1.8%), Western Asia (99 | 1.8%), and Northern Europe (64 | 1.2%), together accounting for 8.8% of all Kaser residents.
| Immigration Origin | # Population | % Population |
| Argentina | 6 | 0.1% |
| Asia | 99 | 1.8% |
| Belgium | 3 | 0.1% |
| Canada | 5 | 0.1% |
| Central America | 6 | 0.1% |
| Eastern Europe | 29 | 0.5% |
| England | 23 | 0.4% |
| Europe | 126 | 2.3% |
| France | 6 | 0.1% |
| Germany | 19 | 0.4% |
| Hungary | 20 | 0.4% |
| Israel | 99 | 1.8% |
| Italy | 5 | 0.1% |
| Latin America | 12 | 0.2% |
| Mexico | 6 | 0.1% |
| Northern Europe | 64 | 1.2% |
| Romania | 9 | 0.2% |
| South America | 6 | 0.1% |
| Southern Europe | 5 | 0.1% |
| Western Asia | 99 | 1.8% |
| Western Europe | 28 | 0.5% | View All 21 Rows |
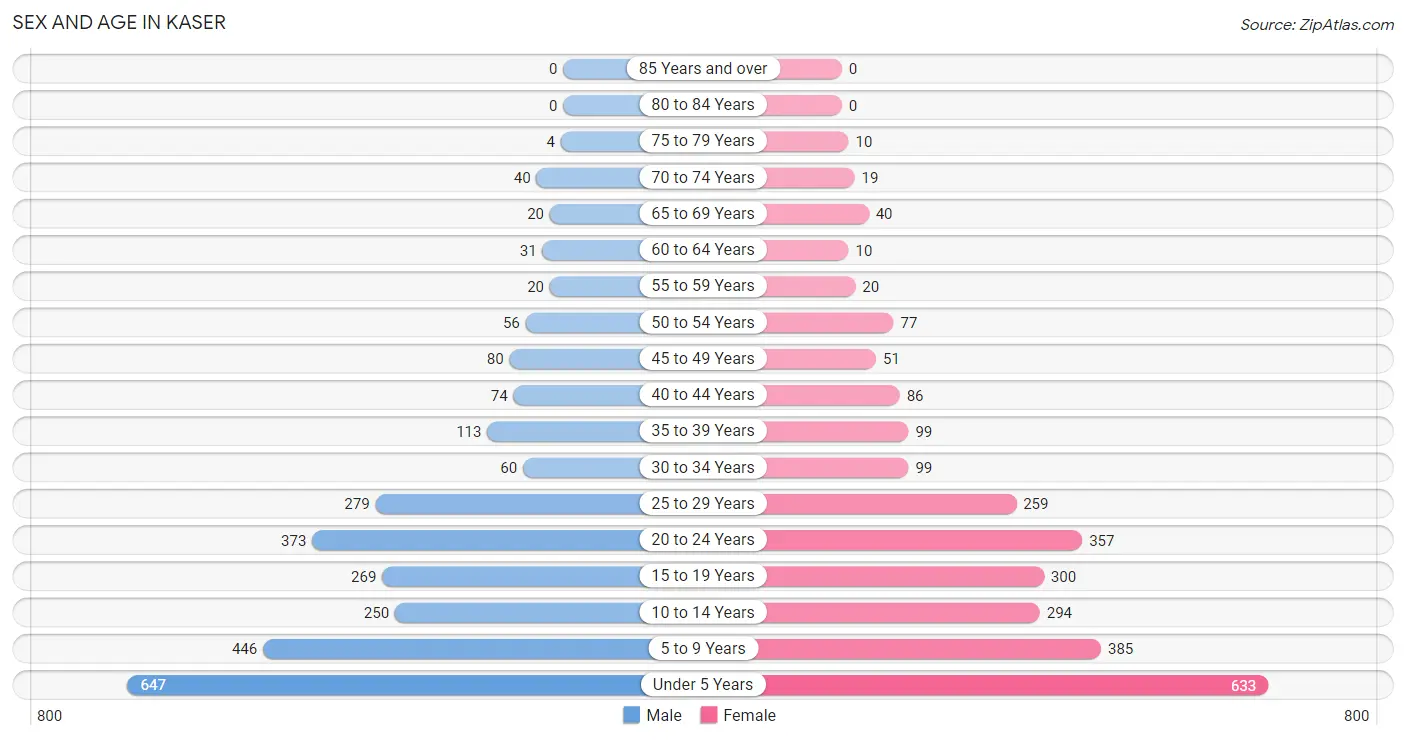
Sex and Age in Kaser
Sex and Age in Kaser
The most populous age groups in Kaser are Under 5 Years (647 | 23.4%) for men and Under 5 Years (633 | 23.1%) for women.
| Age Bracket | Male | Female |
| Under 5 Years | 647 (23.4%) | 633 (23.1%) |
| 5 to 9 Years | 446 (16.2%) | 385 (14.1%) |
| 10 to 14 Years | 250 (9.0%) | 294 (10.7%) |
| 15 to 19 Years | 269 (9.7%) | 300 (11.0%) |
| 20 to 24 Years | 373 (13.5%) | 357 (13.0%) |
| 25 to 29 Years | 279 (10.1%) | 259 (9.5%) |
| 30 to 34 Years | 60 (2.2%) | 99 (3.6%) |
| 35 to 39 Years | 113 (4.1%) | 99 (3.6%) |
| 40 to 44 Years | 74 (2.7%) | 86 (3.1%) |
| 45 to 49 Years | 80 (2.9%) | 51 (1.9%) |
| 50 to 54 Years | 56 (2.0%) | 77 (2.8%) |
| 55 to 59 Years | 20 (0.7%) | 20 (0.7%) |
| 60 to 64 Years | 31 (1.1%) | 10 (0.4%) |
| 65 to 69 Years | 20 (0.7%) | 40 (1.5%) |
| 70 to 74 Years | 40 (1.5%) | 19 (0.7%) |
| 75 to 79 Years | 4 (0.1%) | 10 (0.4%) |
| 80 to 84 Years | 0 (0.0%) | 0 (0.0%) |
| 85 Years and over | 0 (0.0%) | 0 (0.0%) |
| Total | 2,762 (100.0%) | 2,739 (100.0%) |
Families and Households in Kaser
Median Family Size in Kaser
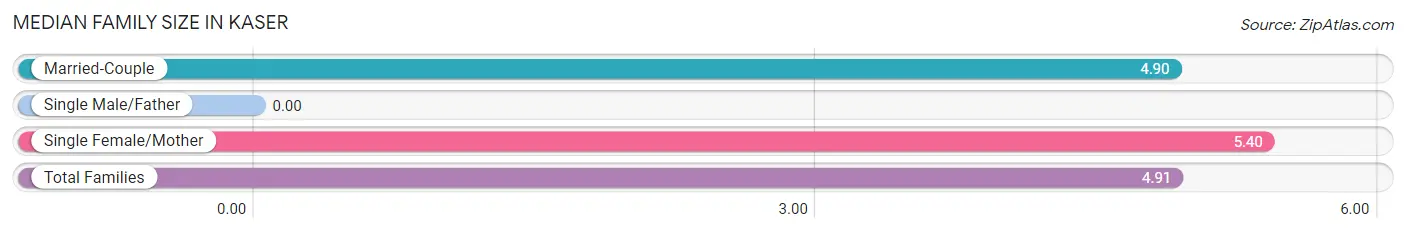
| Family Type | # Families | Family Size |
| Married-Couple | 1,090 (97.8%) | 4.90 |
| Single Male/Father | 0 (0.0%) | - |
| Single Female/Mother | 25 (2.2%) | 5.40 |
| Total Families | 1,115 (100.0%) | 4.91 |
Median Household Size in Kaser
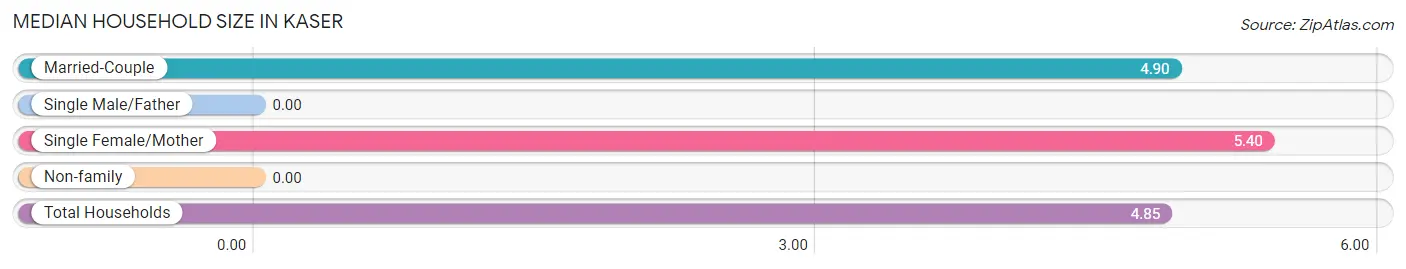
| Household Type | # Households | Household Size |
| Married-Couple | 1,090 (96.0%) | 4.90 |
| Single Male/Father | 0 (0.0%) | - |
| Single Female/Mother | 25 (2.2%) | 5.40 |
| Non-family | 20 (1.8%) | - |
| Total Households | 1,135 (100.0%) | 4.85 |
Household Size by Marriage Status in Kaser
Out of a total of 1,135 households in Kaser, 1,115 (98.2%) are family households, while 20 (1.8%) are nonfamily households. The most numerous type of family households are 7+ person households, comprising 294, and the most common type of nonfamily households are 1-person households, comprising 20.
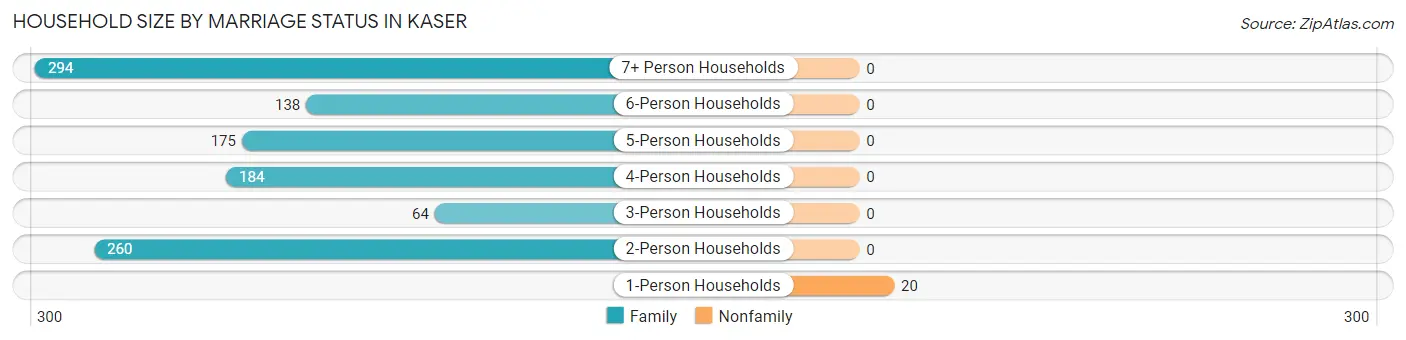
| Household Size | Family Households | Nonfamily Households |
| 1-Person Households | - | 20 (1.8%) |
| 2-Person Households | 260 (22.9%) | 0 (0.0%) |
| 3-Person Households | 64 (5.6%) | 0 (0.0%) |
| 4-Person Households | 184 (16.2%) | 0 (0.0%) |
| 5-Person Households | 175 (15.4%) | 0 (0.0%) |
| 6-Person Households | 138 (12.2%) | 0 (0.0%) |
| 7+ Person Households | 294 (25.9%) | 0 (0.0%) |
| Total | 1,115 (98.2%) | 20 (1.8%) |
Female Fertility in Kaser
Fertility by Age in Kaser
Average fertility rate in Kaser is 242.0 births per 1,000 women. Women in the age bracket of 20 to 34 years have the highest fertility rate with 385.0 births per 1,000 women. Women in the age bracket of 20 to 34 years acount for 88.4% of all women with births.
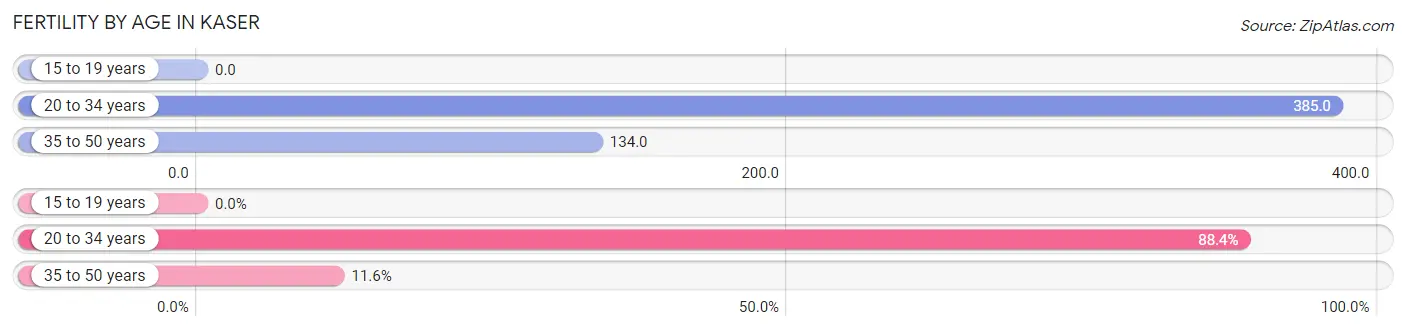
| Age Bracket | Women with Births | Births / 1,000 Women |
| 15 to 19 years | 0 (0.0%) | 0.0 |
| 20 to 34 years | 275 (88.4%) | 385.0 |
| 35 to 50 years | 36 (11.6%) | 134.0 |
| Total | 311 (100.0%) | 242.0 |
Fertility by Age by Marriage Status in Kaser
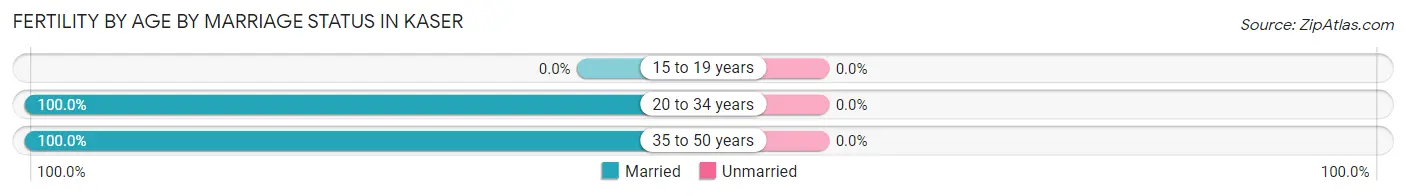
| Age Bracket | Married | Unmarried |
| 15 to 19 years | 0 (0.0%) | 0 (0.0%) |
| 20 to 34 years | 275 (100.0%) | 0 (0.0%) |
| 35 to 50 years | 36 (100.0%) | 0 (0.0%) |
| Total | 311 (100.0%) | 0 (0.0%) |
Fertility by Education in Kaser
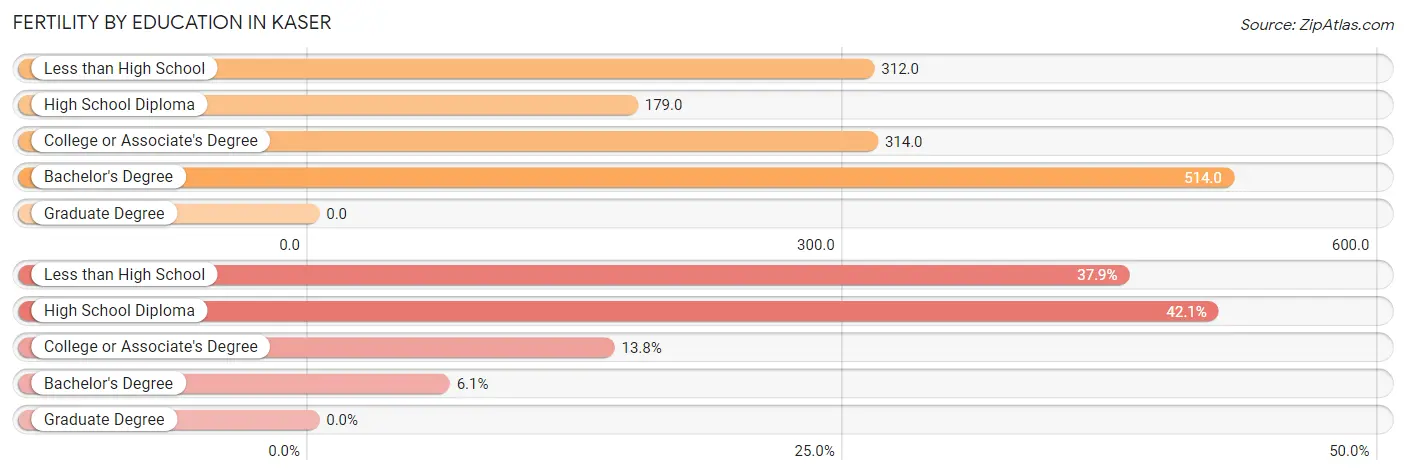
| Educational Attainment | Women with Births | Births / 1,000 Women |
| Less than High School | 118 (37.9%) | 312.0 |
| High School Diploma | 131 (42.1%) | 179.0 |
| College or Associate's Degree | 43 (13.8%) | 314.0 |
| Bachelor's Degree | 19 (6.1%) | 514.0 |
| Graduate Degree | 0 (0.0%) | 0.0 |
| Total | 311 (100.0%) | 242.0 |
Fertility by Education by Marriage Status in Kaser
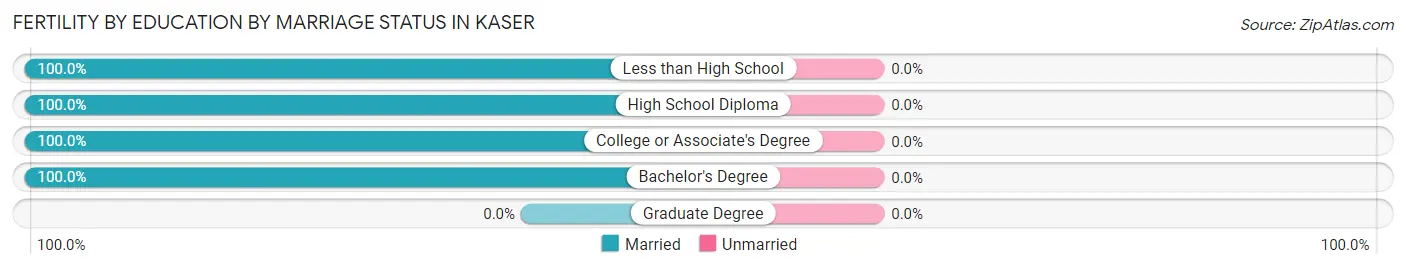
| Educational Attainment | Married | Unmarried |
| Less than High School | 118 (100.0%) | 0 (0.0%) |
| High School Diploma | 131 (100.0%) | 0 (0.0%) |
| College or Associate's Degree | 43 (100.0%) | 0 (0.0%) |
| Bachelor's Degree | 19 (100.0%) | 0 (0.0%) |
| Graduate Degree | 0 (0.0%) | 0 (0.0%) |
| Total | 311 (100.0%) | 0 (0.0%) |
Employment Characteristics in Kaser
Employment by Class of Employer in Kaser
Among the 1,357 employed individuals in Kaser, not-for-profit organizations (906 | 66.8%), private company employees (353 | 26.0%), and local government employees (43 | 3.2%) make up the most common classes of employment.
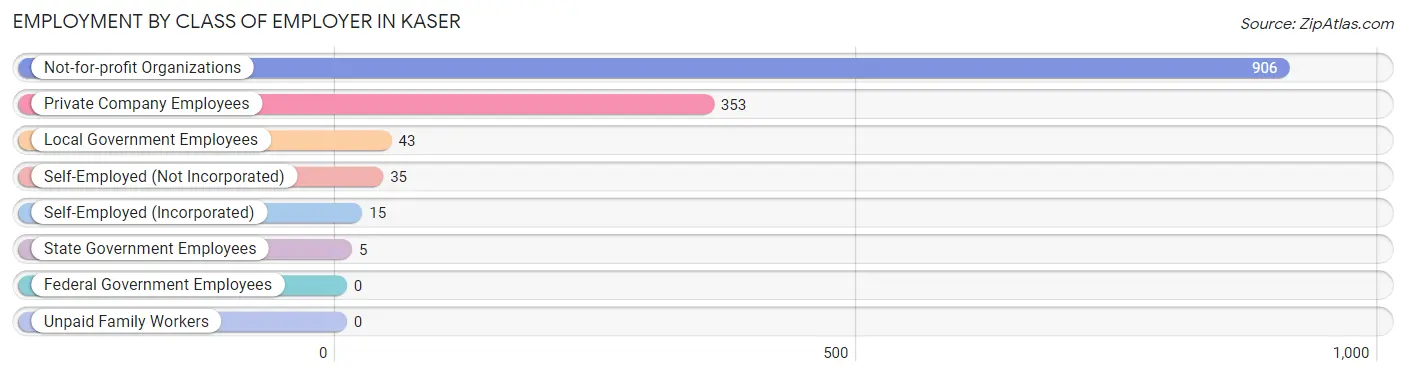
| Employer Class | # Employees | % Employees |
| Private Company Employees | 353 | 26.0% |
| Self-Employed (Incorporated) | 15 | 1.1% |
| Self-Employed (Not Incorporated) | 35 | 2.6% |
| Not-for-profit Organizations | 906 | 66.8% |
| Local Government Employees | 43 | 3.2% |
| State Government Employees | 5 | 0.4% |
| Federal Government Employees | 0 | 0.0% |
| Unpaid Family Workers | 0 | 0.0% |
| Total | 1,357 | 100.0% |
Employment Status by Age in Kaser
According to the labor force statistics for Kaser, out of the total population over 16 years of age (2,675), 56.3% or 1,506 individuals are in the labor force, with 7.2% or 108 of them unemployed. The age group with the highest labor force participation rate is 60 to 64 years, with 85.4% or 35 individuals in the labor force. Within the labor force, the 20 to 24 years age range has the highest percentage of unemployed individuals, with 16.8% or 63 of them being unemployed.
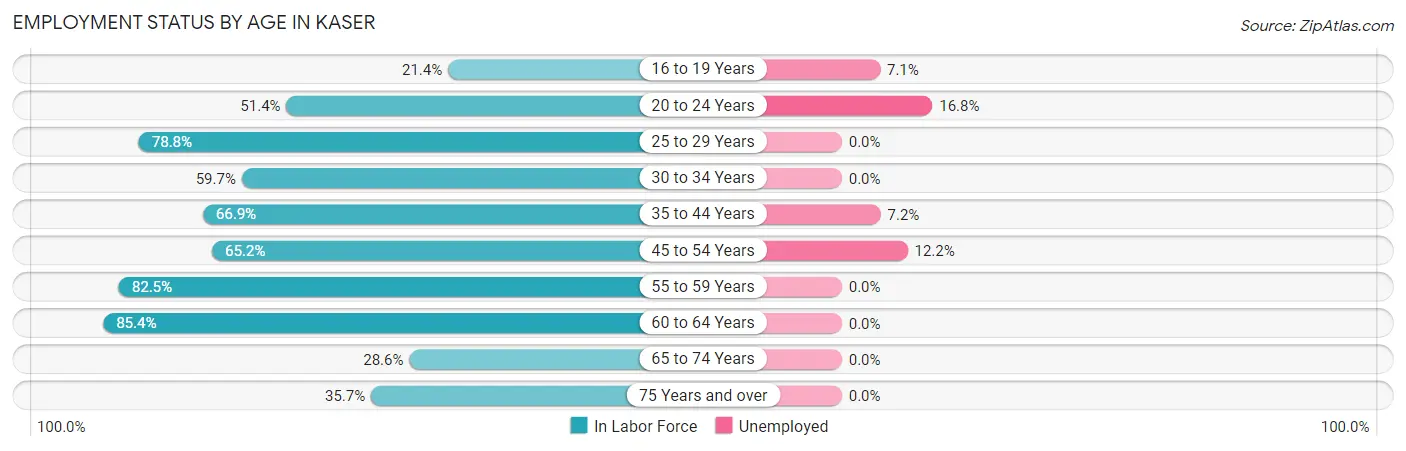
| Age Bracket | In Labor Force | Unemployed |
| 16 to 19 Years | 85 (21.4%) | 6 (7.1%) |
| 20 to 24 Years | 375 (51.4%) | 63 (16.8%) |
| 25 to 29 Years | 424 (78.8%) | 0 (0.0%) |
| 30 to 34 Years | 95 (59.7%) | 0 (0.0%) |
| 35 to 44 Years | 249 (66.9%) | 18 (7.2%) |
| 45 to 54 Years | 172 (65.2%) | 21 (12.2%) |
| 55 to 59 Years | 33 (82.5%) | 0 (0.0%) |
| 60 to 64 Years | 35 (85.4%) | 0 (0.0%) |
| 65 to 74 Years | 34 (28.6%) | 0 (0.0%) |
| 75 Years and over | 5 (35.7%) | 0 (0.0%) |
| Total | 1,506 (56.3%) | 108 (7.2%) |
Employment Status by Educational Attainment in Kaser
According to labor force statistics for Kaser, 71.3% of individuals (1,008) out of the total population between 25 and 64 years of age (1,414) are in the labor force, with 3.9% or 39 of them being unemployed. The group with the highest labor force participation rate are those with the educational attainment of college / associate degree, with 86.7% or 487 individuals in the labor force. Within the labor force, individuals with less than high school education have the highest percentage of unemployment, with 15.1% or 18 of them being unemployed.
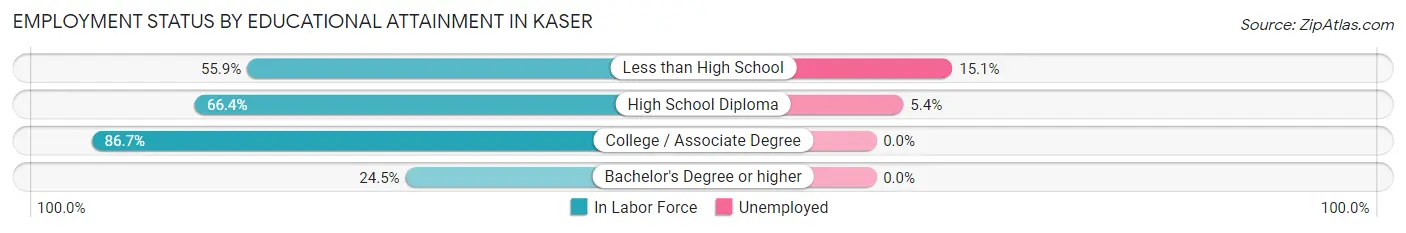
| Educational Attainment | In Labor Force | Unemployed |
| Less than High School | 119 (55.9%) | 32 (15.1%) |
| High School Diploma | 389 (66.4%) | 32 (5.4%) |
| College / Associate Degree | 487 (86.7%) | 0 (0.0%) |
| Bachelor's Degree or higher | 13 (24.5%) | 0 (0.0%) |
| Total | 1,008 (71.3%) | 55 (3.9%) |
Employment Occupations by Sex in Kaser
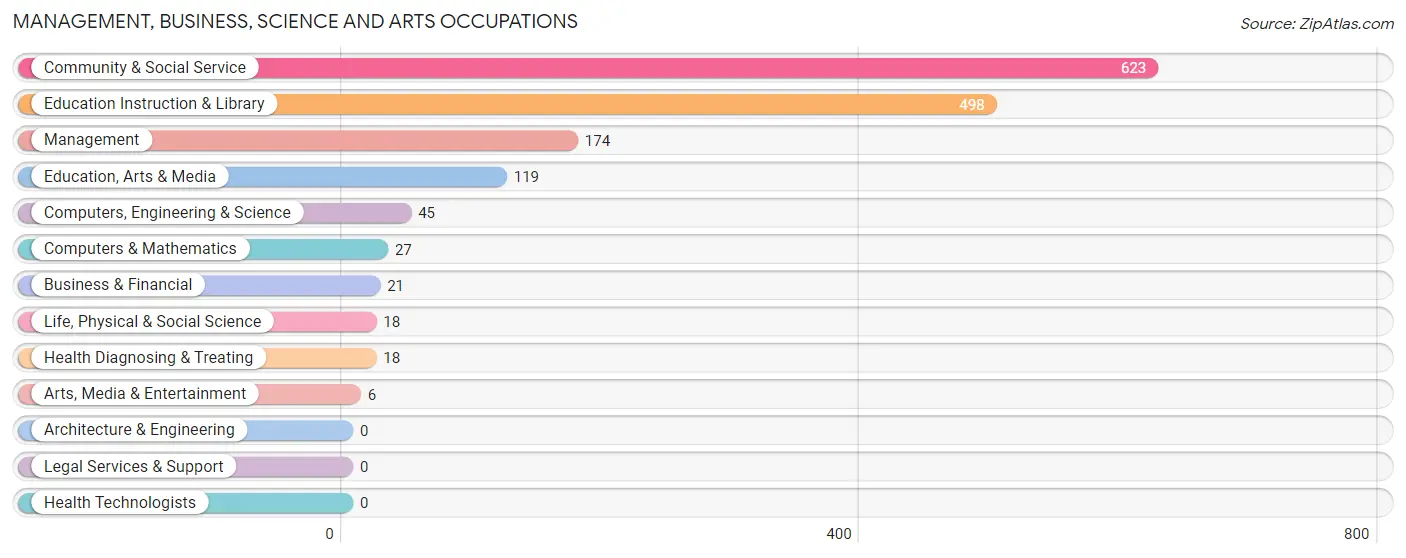
Management, Business, Science and Arts Occupations
The most common Management, Business, Science and Arts occupations in Kaser are Community & Social Service (623 | 44.5%), Education Instruction & Library (498 | 35.6%), Management (174 | 12.4%), Education, Arts & Media (119 | 8.5%), and Computers, Engineering & Science (45 | 3.2%).
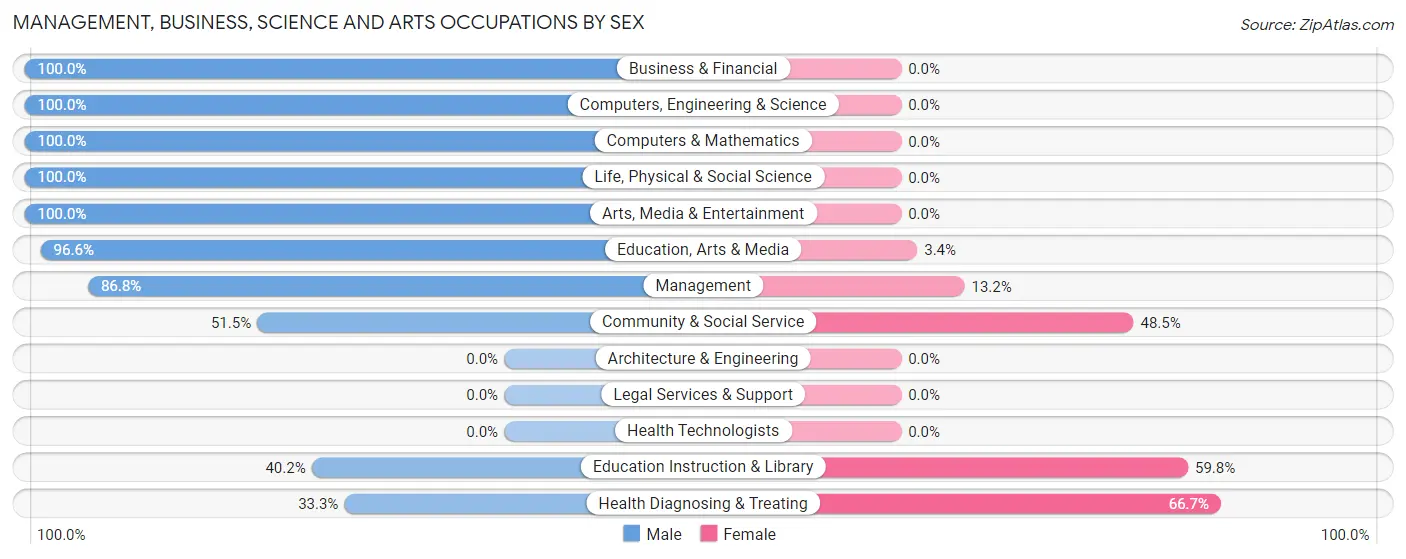
Management, Business, Science and Arts Occupations by Sex
Within the Management, Business, Science and Arts occupations in Kaser, the most male-oriented occupations are Business & Financial (100.0%), Computers, Engineering & Science (100.0%), and Computers & Mathematics (100.0%), while the most female-oriented occupations are Health Diagnosing & Treating (66.7%), Education Instruction & Library (59.8%), and Community & Social Service (48.5%).
| Occupation | Male | Female |
| Management | 151 (86.8%) | 23 (13.2%) |
| Business & Financial | 21 (100.0%) | 0 (0.0%) |
| Computers, Engineering & Science | 45 (100.0%) | 0 (0.0%) |
| Computers & Mathematics | 27 (100.0%) | 0 (0.0%) |
| Architecture & Engineering | 0 (0.0%) | 0 (0.0%) |
| Life, Physical & Social Science | 18 (100.0%) | 0 (0.0%) |
| Community & Social Service | 321 (51.5%) | 302 (48.5%) |
| Education, Arts & Media | 115 (96.6%) | 4 (3.4%) |
| Legal Services & Support | 0 (0.0%) | 0 (0.0%) |
| Education Instruction & Library | 200 (40.2%) | 298 (59.8%) |
| Arts, Media & Entertainment | 6 (100.0%) | 0 (0.0%) |
| Health Diagnosing & Treating | 6 (33.3%) | 12 (66.7%) |
| Health Technologists | 0 (0.0%) | 0 (0.0%) |
| Total (Category) | 544 (61.8%) | 337 (38.3%) |
| Total (Overall) | 763 (54.5%) | 636 (45.5%) |
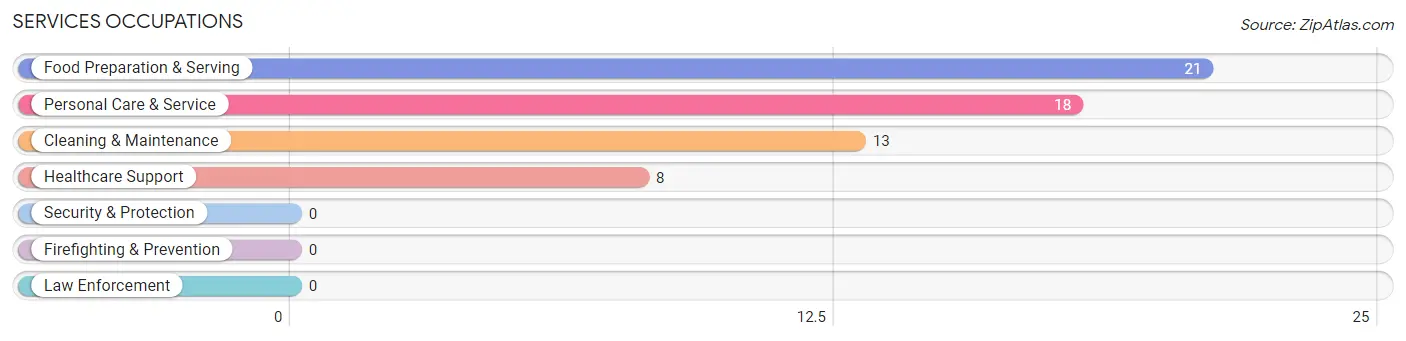
Services Occupations
The most common Services occupations in Kaser are Food Preparation & Serving (21 | 1.5%), Personal Care & Service (18 | 1.3%), Cleaning & Maintenance (13 | 0.9%), and Healthcare Support (8 | 0.6%).
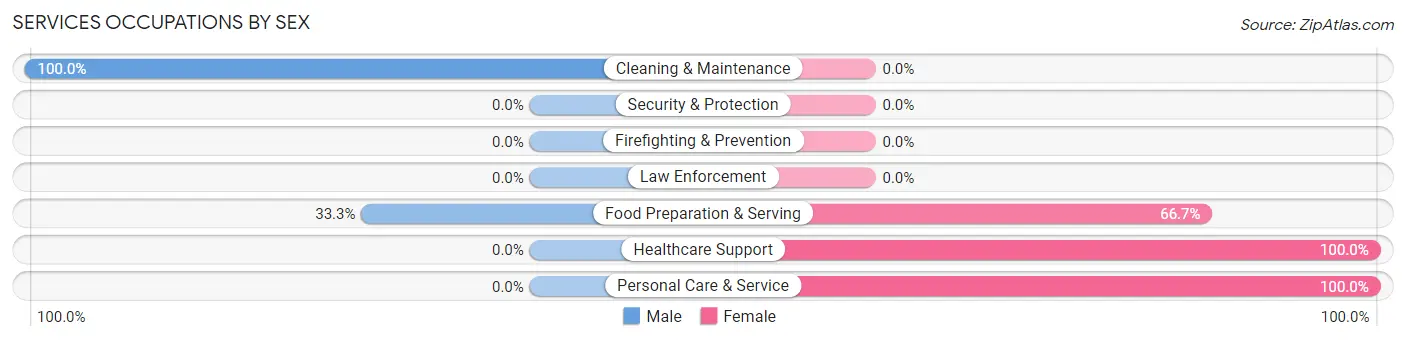
Services Occupations by Sex
Within the Services occupations in Kaser, the most male-oriented occupations are Cleaning & Maintenance (100.0%), and Food Preparation & Serving (33.3%), while the most female-oriented occupations are Healthcare Support (100.0%), Personal Care & Service (100.0%), and Food Preparation & Serving (66.7%).
| Occupation | Male | Female |
| Healthcare Support | 0 (0.0%) | 8 (100.0%) |
| Security & Protection | 0 (0.0%) | 0 (0.0%) |
| Firefighting & Prevention | 0 (0.0%) | 0 (0.0%) |
| Law Enforcement | 0 (0.0%) | 0 (0.0%) |
| Food Preparation & Serving | 7 (33.3%) | 14 (66.7%) |
| Cleaning & Maintenance | 13 (100.0%) | 0 (0.0%) |
| Personal Care & Service | 0 (0.0%) | 18 (100.0%) |
| Total (Category) | 20 (33.3%) | 40 (66.7%) |
| Total (Overall) | 763 (54.5%) | 636 (45.5%) |
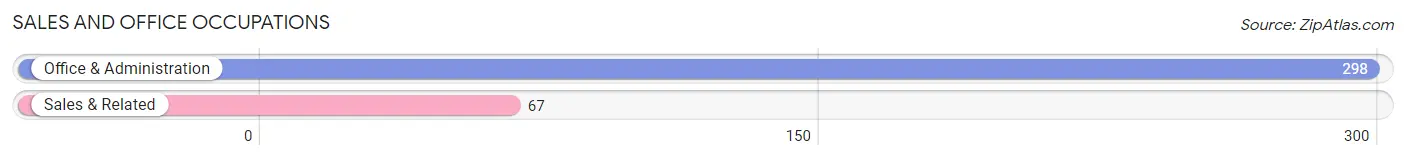
Sales and Office Occupations
The most common Sales and Office occupations in Kaser are Office & Administration (298 | 21.3%), and Sales & Related (67 | 4.8%).
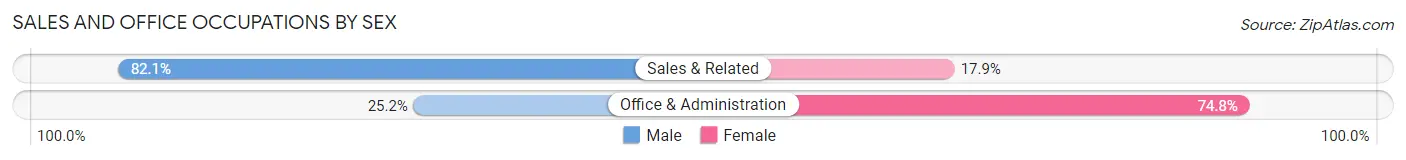
Sales and Office Occupations by Sex
| Occupation | Male | Female |
| Sales & Related | 55 (82.1%) | 12 (17.9%) |
| Office & Administration | 75 (25.2%) | 223 (74.8%) |
| Total (Category) | 130 (35.6%) | 235 (64.4%) |
| Total (Overall) | 763 (54.5%) | 636 (45.5%) |
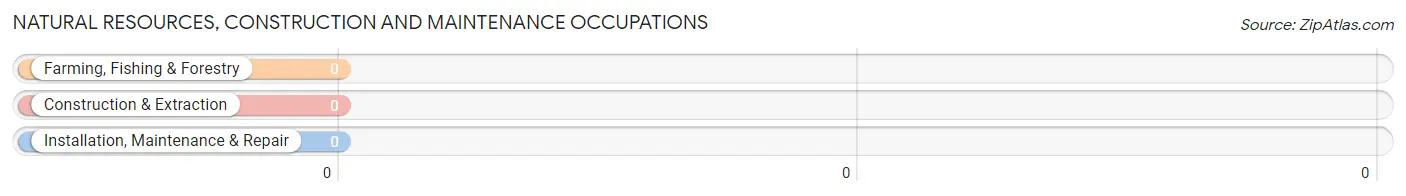
Natural Resources, Construction and Maintenance Occupations
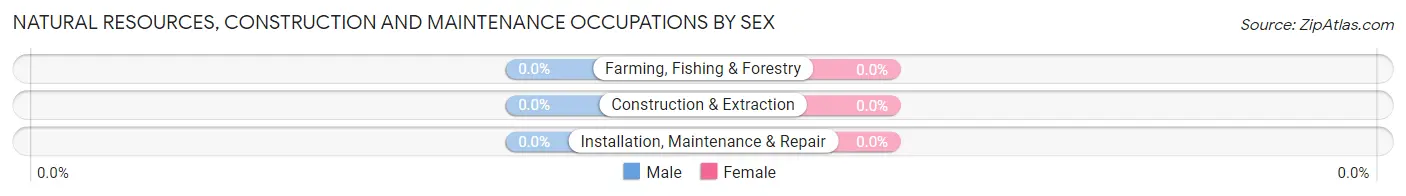
Natural Resources, Construction and Maintenance Occupations by Sex
| Occupation | Male | Female |
| Farming, Fishing & Forestry | 0 (0.0%) | 0 (0.0%) |
| Construction & Extraction | 0 (0.0%) | 0 (0.0%) |
| Installation, Maintenance & Repair | 0 (0.0%) | 0 (0.0%) |
| Total (Category) | 0 (0.0%) | 0 (0.0%) |
| Total (Overall) | 763 (54.5%) | 636 (45.5%) |
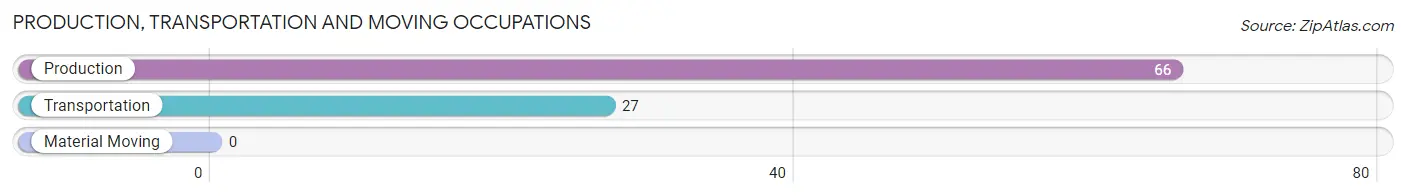
Production, Transportation and Moving Occupations
The most common Production, Transportation and Moving occupations in Kaser are Production (66 | 4.7%), and Transportation (27 | 1.9%).
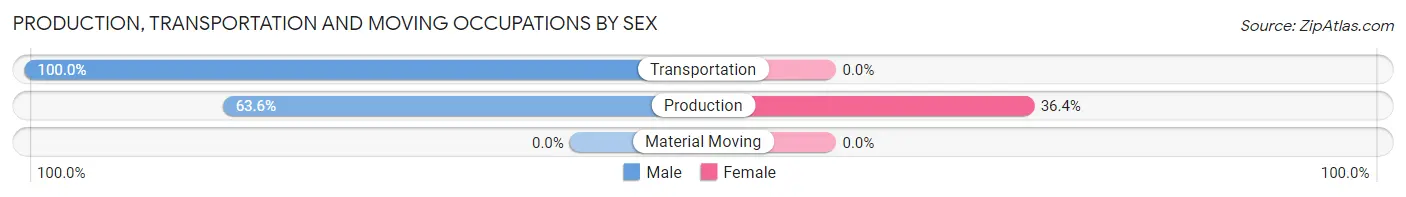
Production, Transportation and Moving Occupations by Sex
| Occupation | Male | Female |
| Production | 42 (63.6%) | 24 (36.4%) |
| Transportation | 27 (100.0%) | 0 (0.0%) |
| Material Moving | 0 (0.0%) | 0 (0.0%) |
| Total (Category) | 69 (74.2%) | 24 (25.8%) |
| Total (Overall) | 763 (54.5%) | 636 (45.5%) |
Employment Industries by Sex in Kaser
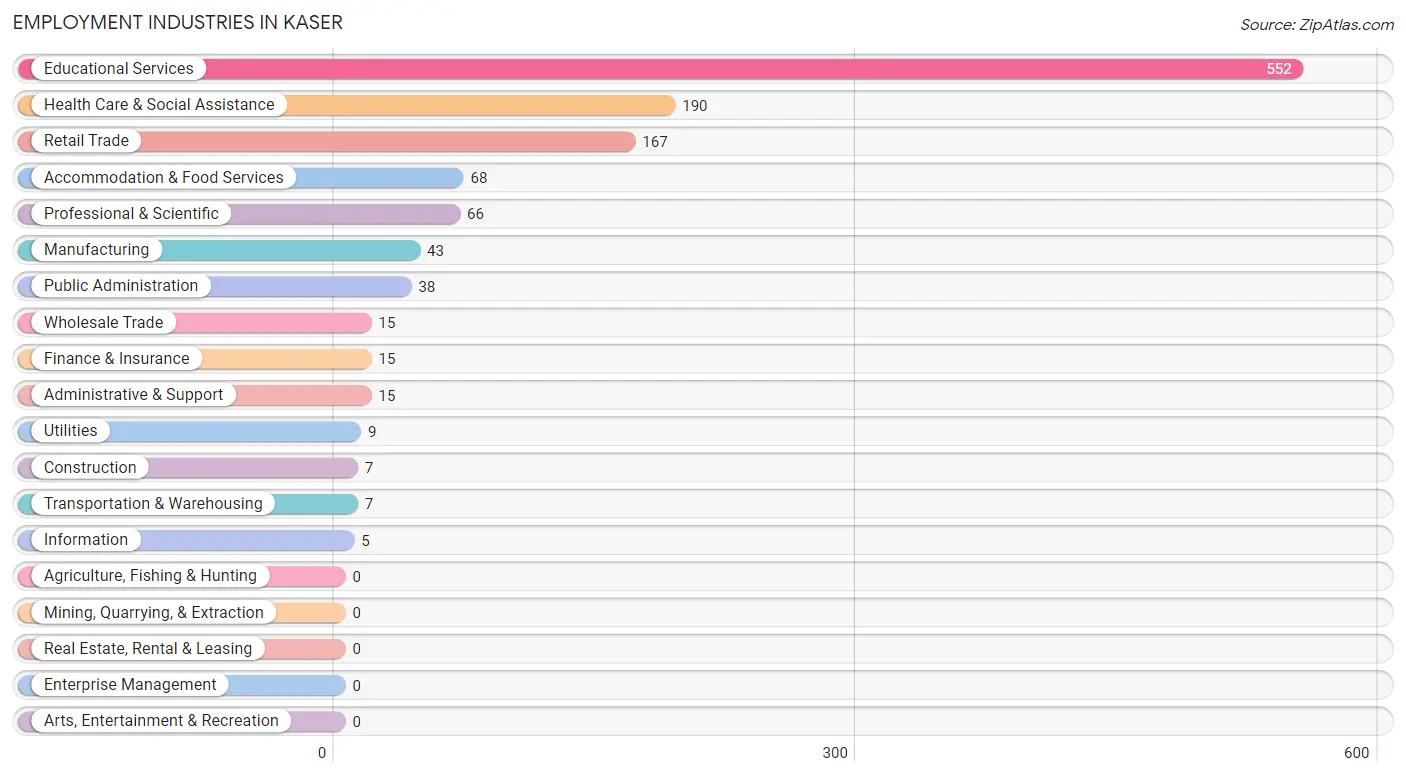
Employment Industries in Kaser
The major employment industries in Kaser include Educational Services (552 | 39.5%), Health Care & Social Assistance (190 | 13.6%), Retail Trade (167 | 11.9%), Accommodation & Food Services (68 | 4.9%), and Professional & Scientific (66 | 4.7%).
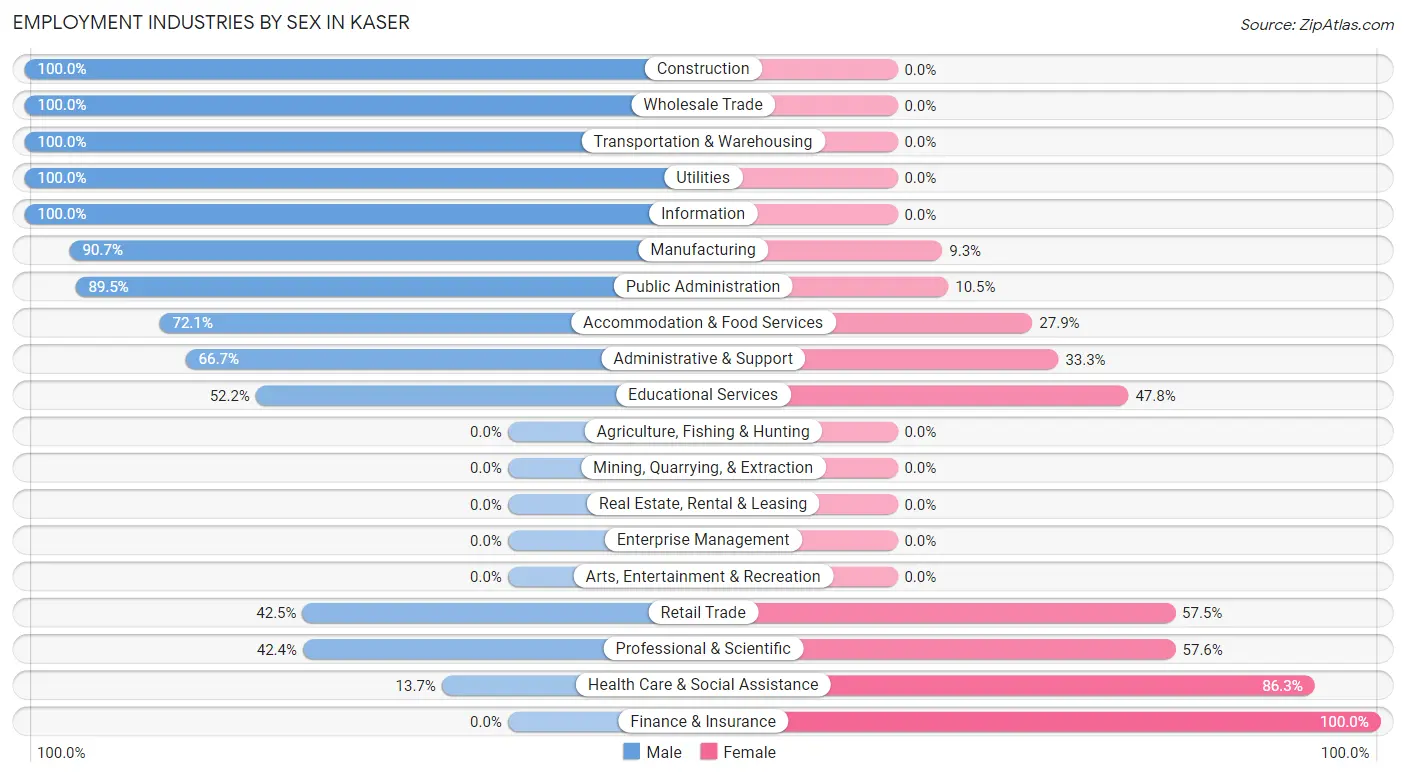
Employment Industries by Sex in Kaser
The Kaser industries that see more men than women are Construction (100.0%), Wholesale Trade (100.0%), and Transportation & Warehousing (100.0%), whereas the industries that tend to have a higher number of women are Finance & Insurance (100.0%), Health Care & Social Assistance (86.3%), and Professional & Scientific (57.6%).
| Industry | Male | Female |
| Agriculture, Fishing & Hunting | 0 (0.0%) | 0 (0.0%) |
| Mining, Quarrying, & Extraction | 0 (0.0%) | 0 (0.0%) |
| Construction | 7 (100.0%) | 0 (0.0%) |
| Manufacturing | 39 (90.7%) | 4 (9.3%) |
| Wholesale Trade | 15 (100.0%) | 0 (0.0%) |
| Retail Trade | 71 (42.5%) | 96 (57.5%) |
| Transportation & Warehousing | 7 (100.0%) | 0 (0.0%) |
| Utilities | 9 (100.0%) | 0 (0.0%) |
| Information | 5 (100.0%) | 0 (0.0%) |
| Finance & Insurance | 0 (0.0%) | 15 (100.0%) |
| Real Estate, Rental & Leasing | 0 (0.0%) | 0 (0.0%) |
| Professional & Scientific | 28 (42.4%) | 38 (57.6%) |
| Enterprise Management | 0 (0.0%) | 0 (0.0%) |
| Administrative & Support | 10 (66.7%) | 5 (33.3%) |
| Educational Services | 288 (52.2%) | 264 (47.8%) |
| Health Care & Social Assistance | 26 (13.7%) | 164 (86.3%) |
| Arts, Entertainment & Recreation | 0 (0.0%) | 0 (0.0%) |
| Accommodation & Food Services | 49 (72.1%) | 19 (27.9%) |
| Public Administration | 34 (89.5%) | 4 (10.5%) |
| Total | 763 (54.5%) | 636 (45.5%) |
Education in Kaser
School Enrollment in Kaser
The most common levels of schooling among the 2,316 students in Kaser are elementary school (645 | 27.9%), middle school (507 | 21.9%), and high school (434 | 18.7%).
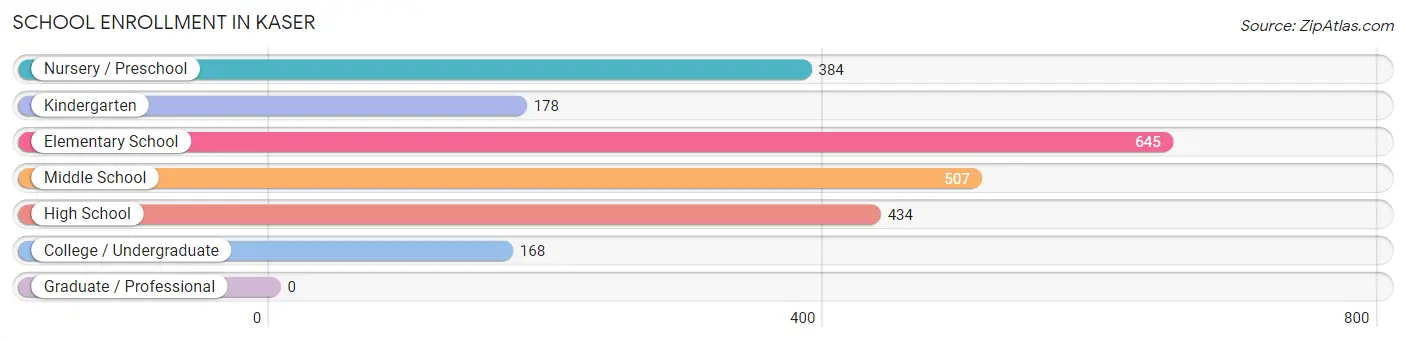
| School Level | # Students | % Students |
| Nursery / Preschool | 384 | 16.6% |
| Kindergarten | 178 | 7.7% |
| Elementary School | 645 | 27.9% |
| Middle School | 507 | 21.9% |
| High School | 434 | 18.7% |
| College / Undergraduate | 168 | 7.2% |
| Graduate / Professional | 0 | 0.0% |
| Total | 2,316 | 100.0% |
School Enrollment by Age by Funding Source in Kaser
Out of a total of 2,316 students who are enrolled in schools in Kaser, 2,253 (97.3%) attend a private institution, while the remaining 63 (2.7%) are enrolled in public schools. The age group of 5 to 9 year old has the highest likelihood of being enrolled in private schools, with 820 (100.0% in the age bracket) enrolled. Conversely, the age group of 10 to 14 year olds has the lowest likelihood of being enrolled in a private school, with 45 (8.3% in the age bracket) attending a public institution.
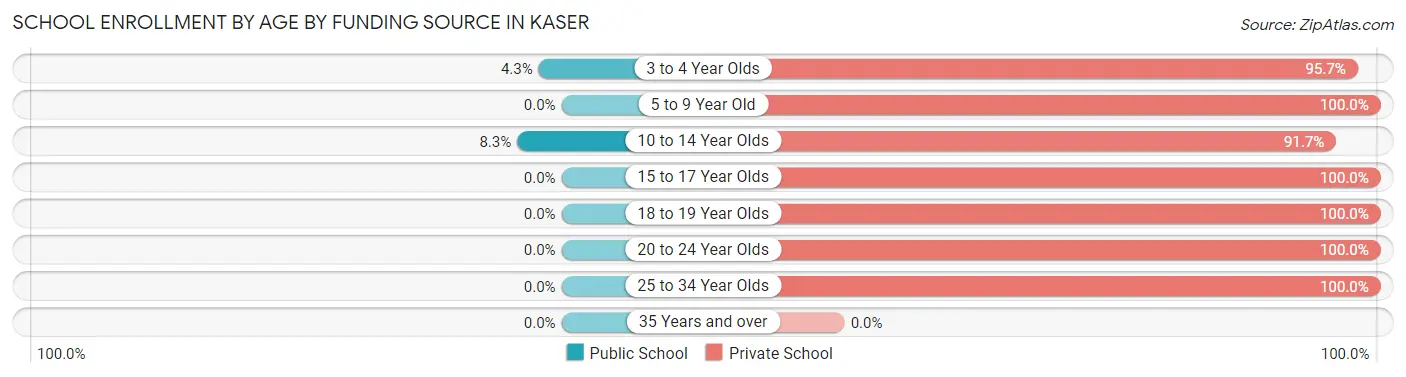
| Age Bracket | Public School | Private School |
| 3 to 4 Year Olds | 18 (4.3%) | 404 (95.7%) |
| 5 to 9 Year Old | 0 (0.0%) | 820 (100.0%) |
| 10 to 14 Year Olds | 45 (8.3%) | 499 (91.7%) |
| 15 to 17 Year Olds | 0 (0.0%) | 375 (100.0%) |
| 18 to 19 Year Olds | 0 (0.0%) | 80 (100.0%) |
| 20 to 24 Year Olds | 0 (0.0%) | 62 (100.0%) |
| 25 to 34 Year Olds | 0 (0.0%) | 13 (100.0%) |
| 35 Years and over | 0 (0.0%) | 0 (0.0%) |
| Total | 63 (2.7%) | 2,253 (97.3%) |
Educational Attainment by Field of Study in Kaser
Liberal arts & history (35 | 38.9%), science & technology (23 | 25.6%), social sciences (8 | 8.9%), business (8 | 8.9%), and education (6 | 6.7%) are the most common fields of study among 90 individuals in Kaser who have obtained a bachelor's degree or higher.
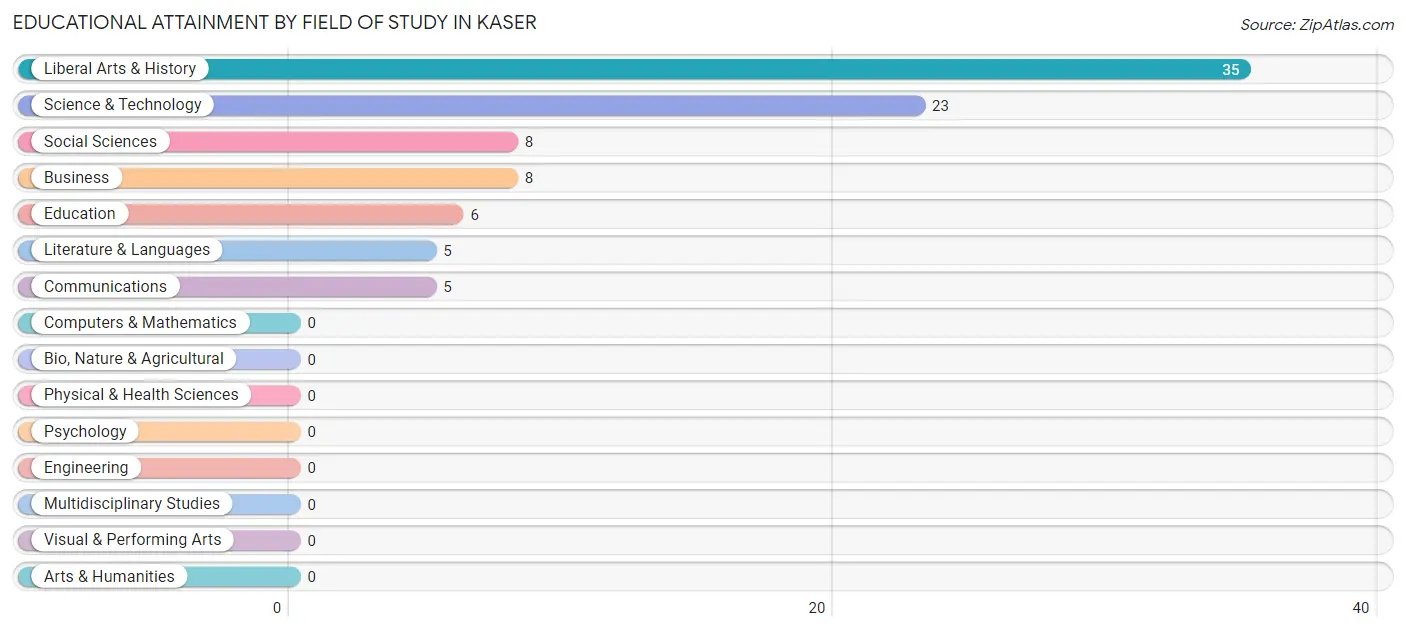
| Field of Study | # Graduates | % Graduates |
| Computers & Mathematics | 0 | 0.0% |
| Bio, Nature & Agricultural | 0 | 0.0% |
| Physical & Health Sciences | 0 | 0.0% |
| Psychology | 0 | 0.0% |
| Social Sciences | 8 | 8.9% |
| Engineering | 0 | 0.0% |
| Multidisciplinary Studies | 0 | 0.0% |
| Science & Technology | 23 | 25.6% |
| Business | 8 | 8.9% |
| Education | 6 | 6.7% |
| Literature & Languages | 5 | 5.6% |
| Liberal Arts & History | 35 | 38.9% |
| Visual & Performing Arts | 0 | 0.0% |
| Communications | 5 | 5.6% |
| Arts & Humanities | 0 | 0.0% |
| Total | 90 | 100.0% |
Transportation & Commute in Kaser
Vehicle Availability by Sex in Kaser
The most prevalent vehicle ownership categories in Kaser are males with no vehicle (389, accounting for 51.0%) and females with no vehicle (439, making up 65.5%).
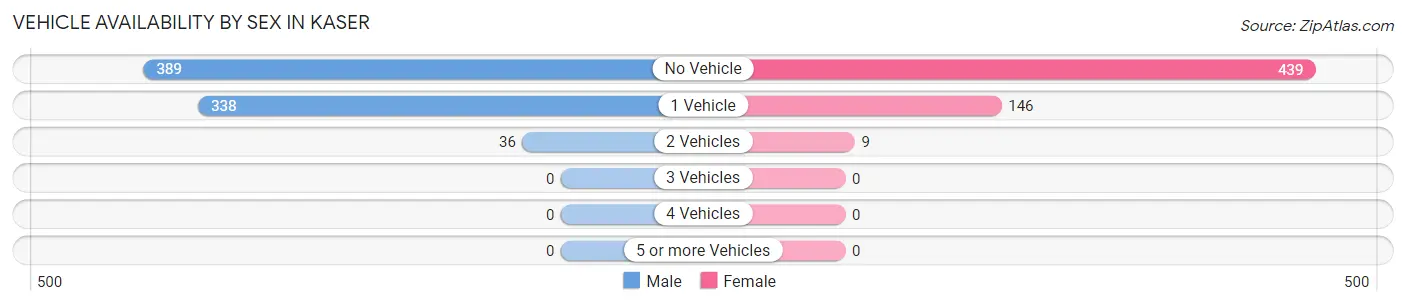
| Vehicles Available | Male | Female |
| No Vehicle | 389 (51.0%) | 439 (73.9%) |
| 1 Vehicle | 338 (44.3%) | 146 (24.6%) |
| 2 Vehicles | 36 (4.7%) | 9 (1.5%) |
| 3 Vehicles | 0 (0.0%) | 0 (0.0%) |
| 4 Vehicles | 0 (0.0%) | 0 (0.0%) |
| 5 or more Vehicles | 0 (0.0%) | 0 (0.0%) |
| Total | 763 (100.0%) | 594 (100.0%) |
Commute Time in Kaser
The most frequently occuring commute durations in Kaser are 5 to 9 minutes (488 commuters, 37.4%), 10 to 14 minutes (286 commuters, 22.0%), and 15 to 19 minutes (145 commuters, 11.1%).
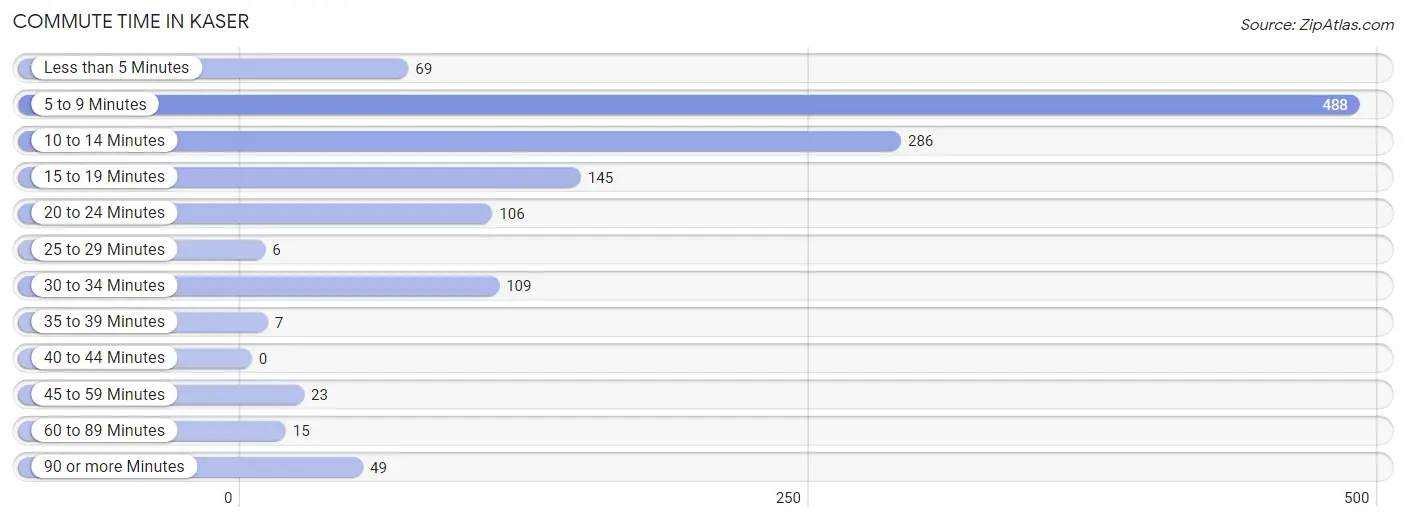
| Commute Time | # Commuters | % Commuters |
| Less than 5 Minutes | 69 | 5.3% |
| 5 to 9 Minutes | 488 | 37.4% |
| 10 to 14 Minutes | 286 | 22.0% |
| 15 to 19 Minutes | 145 | 11.1% |
| 20 to 24 Minutes | 106 | 8.1% |
| 25 to 29 Minutes | 6 | 0.5% |
| 30 to 34 Minutes | 109 | 8.4% |
| 35 to 39 Minutes | 7 | 0.5% |
| 40 to 44 Minutes | 0 | 0.0% |
| 45 to 59 Minutes | 23 | 1.8% |
| 60 to 89 Minutes | 15 | 1.1% |
| 90 or more Minutes | 49 | 3.8% |
Commute Time by Sex in Kaser
The most common commute times in Kaser are 5 to 9 minutes (308 commuters, 42.7%) for males and 5 to 9 minutes (180 commuters, 31.0%) for females.
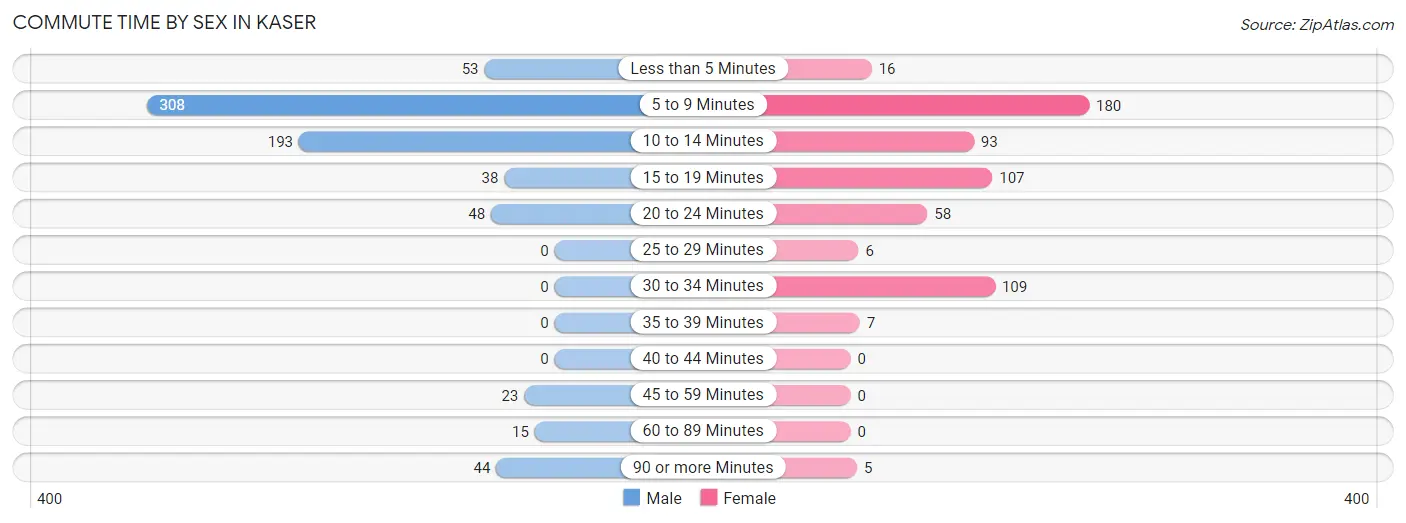
| Commute Time | Male | Female |
| Less than 5 Minutes | 53 (7.3%) | 16 (2.8%) |
| 5 to 9 Minutes | 308 (42.7%) | 180 (31.0%) |
| 10 to 14 Minutes | 193 (26.7%) | 93 (16.0%) |
| 15 to 19 Minutes | 38 (5.3%) | 107 (18.4%) |
| 20 to 24 Minutes | 48 (6.7%) | 58 (10.0%) |
| 25 to 29 Minutes | 0 (0.0%) | 6 (1.0%) |
| 30 to 34 Minutes | 0 (0.0%) | 109 (18.8%) |
| 35 to 39 Minutes | 0 (0.0%) | 7 (1.2%) |
| 40 to 44 Minutes | 0 (0.0%) | 0 (0.0%) |
| 45 to 59 Minutes | 23 (3.2%) | 0 (0.0%) |
| 60 to 89 Minutes | 15 (2.1%) | 0 (0.0%) |
| 90 or more Minutes | 44 (6.1%) | 5 (0.9%) |
Time of Departure to Work by Sex in Kaser
The most frequent times of departure to work in Kaser are 9:00 AM to 9:59 AM (177, 24.5%) for males and 9:00 AM to 9:59 AM (216, 37.2%) for females.
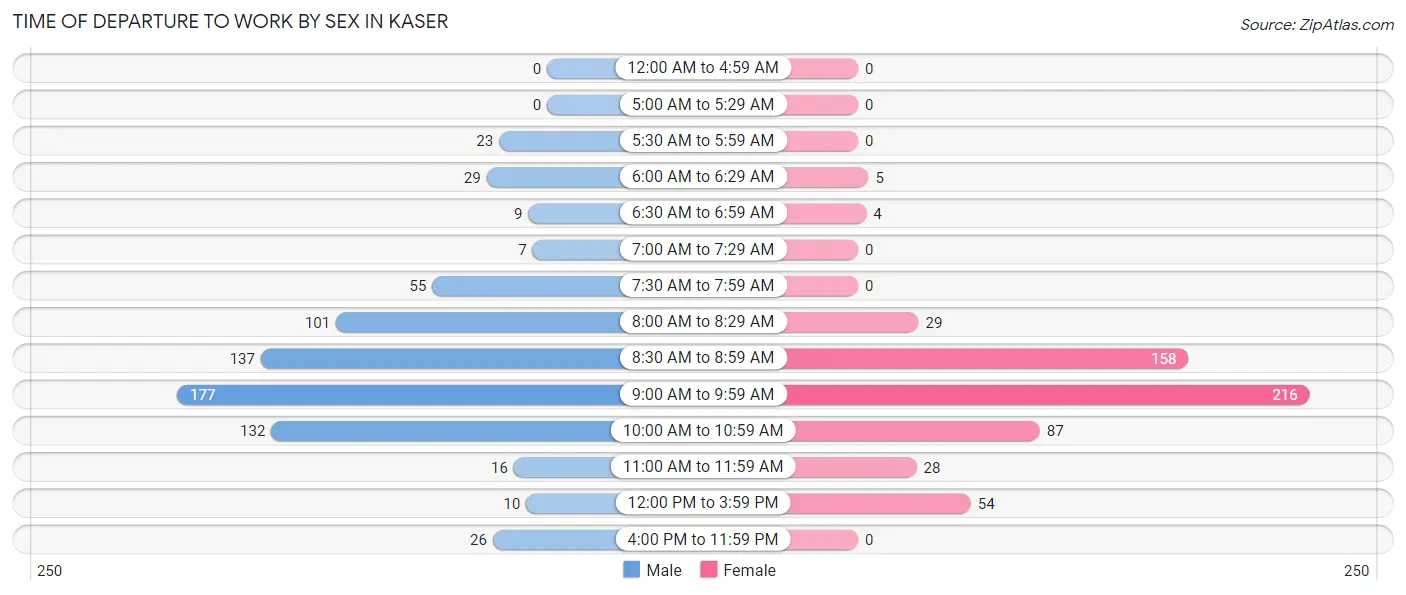
| Time of Departure | Male | Female |
| 12:00 AM to 4:59 AM | 0 (0.0%) | 0 (0.0%) |
| 5:00 AM to 5:29 AM | 0 (0.0%) | 0 (0.0%) |
| 5:30 AM to 5:59 AM | 23 (3.2%) | 0 (0.0%) |
| 6:00 AM to 6:29 AM | 29 (4.0%) | 5 (0.9%) |
| 6:30 AM to 6:59 AM | 9 (1.3%) | 4 (0.7%) |
| 7:00 AM to 7:29 AM | 7 (1.0%) | 0 (0.0%) |
| 7:30 AM to 7:59 AM | 55 (7.6%) | 0 (0.0%) |
| 8:00 AM to 8:29 AM | 101 (14.0%) | 29 (5.0%) |
| 8:30 AM to 8:59 AM | 137 (19.0%) | 158 (27.2%) |
| 9:00 AM to 9:59 AM | 177 (24.5%) | 216 (37.2%) |
| 10:00 AM to 10:59 AM | 132 (18.3%) | 87 (15.0%) |
| 11:00 AM to 11:59 AM | 16 (2.2%) | 28 (4.8%) |
| 12:00 PM to 3:59 PM | 10 (1.4%) | 54 (9.3%) |
| 4:00 PM to 11:59 PM | 26 (3.6%) | 0 (0.0%) |
| Total | 722 (100.0%) | 581 (100.0%) |
Housing Occupancy in Kaser
Occupancy by Ownership in Kaser
Of the total 1,135 dwellings in Kaser, owner-occupied units account for 51 (4.5%), while renter-occupied units make up 1,084 (95.5%).
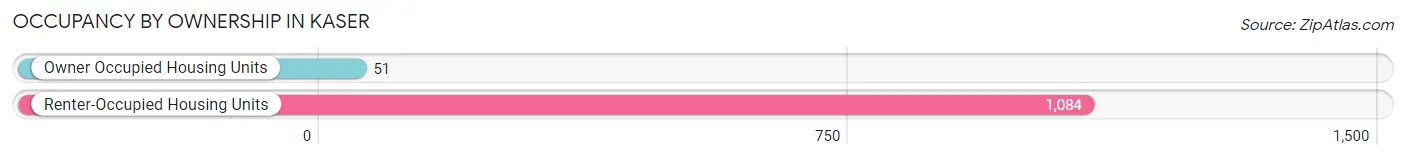
| Occupancy | # Housing Units | % Housing Units |
| Owner Occupied Housing Units | 51 | 4.5% |
| Renter-Occupied Housing Units | 1,084 | 95.5% |
| Total Occupied Housing Units | 1,135 | 100.0% |
Occupancy by Household Size in Kaser
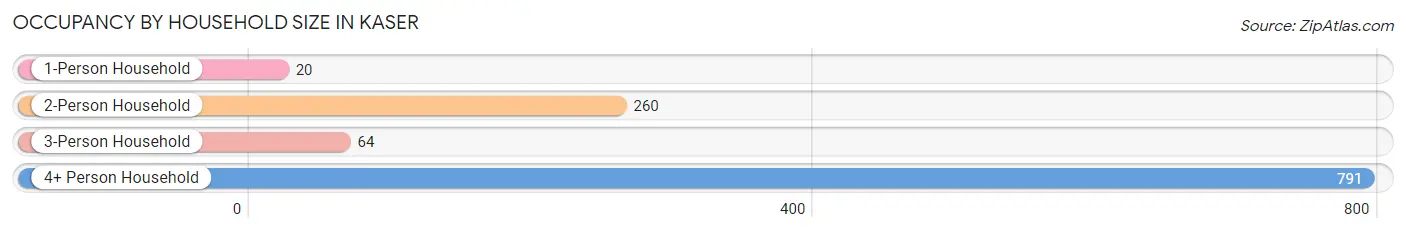
| Household Size | # Housing Units | % Housing Units |
| 1-Person Household | 20 | 1.8% |
| 2-Person Household | 260 | 22.9% |
| 3-Person Household | 64 | 5.6% |
| 4+ Person Household | 791 | 69.7% |
| Total Housing Units | 1,135 | 100.0% |
Occupancy by Ownership by Household Size in Kaser
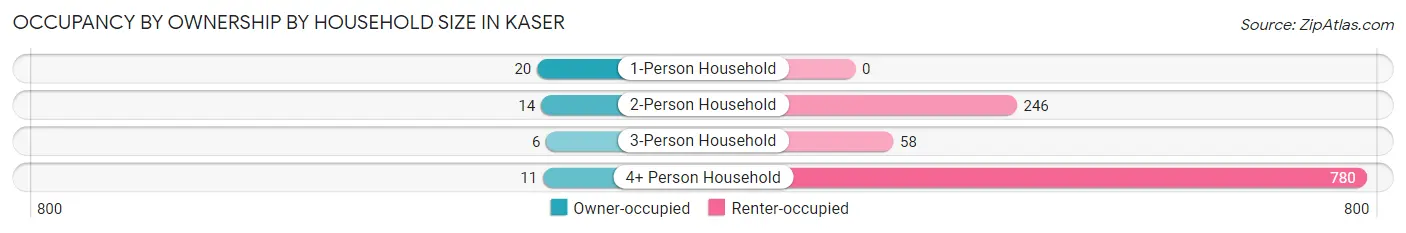
| Household Size | Owner-occupied | Renter-occupied |
| 1-Person Household | 20 (100.0%) | 0 (0.0%) |
| 2-Person Household | 14 (5.4%) | 246 (94.6%) |
| 3-Person Household | 6 (9.4%) | 58 (90.6%) |
| 4+ Person Household | 11 (1.4%) | 780 (98.6%) |
| Total Housing Units | 51 (4.5%) | 1,084 (95.5%) |
Occupancy by Educational Attainment in Kaser
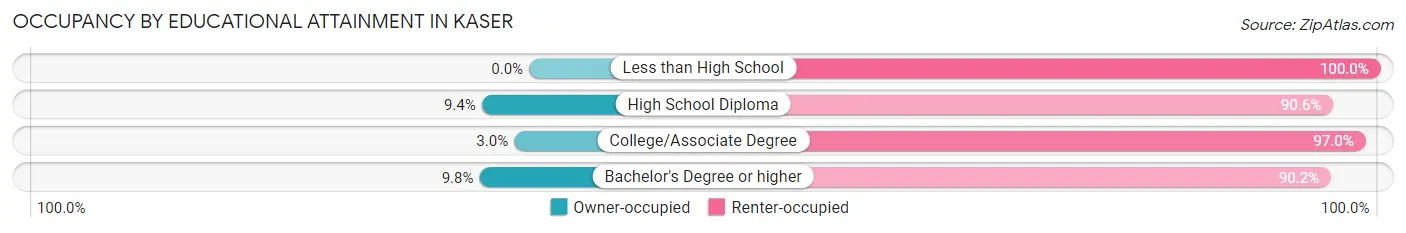
| Household Size | Owner-occupied | Renter-occupied |
| Less than High School | 0 (0.0%) | 134 (100.0%) |
| High School Diploma | 25 (9.4%) | 241 (90.6%) |
| College/Associate Degree | 20 (3.0%) | 654 (97.0%) |
| Bachelor's Degree or higher | 6 (9.8%) | 55 (90.2%) |
Occupancy by Age of Householder in Kaser
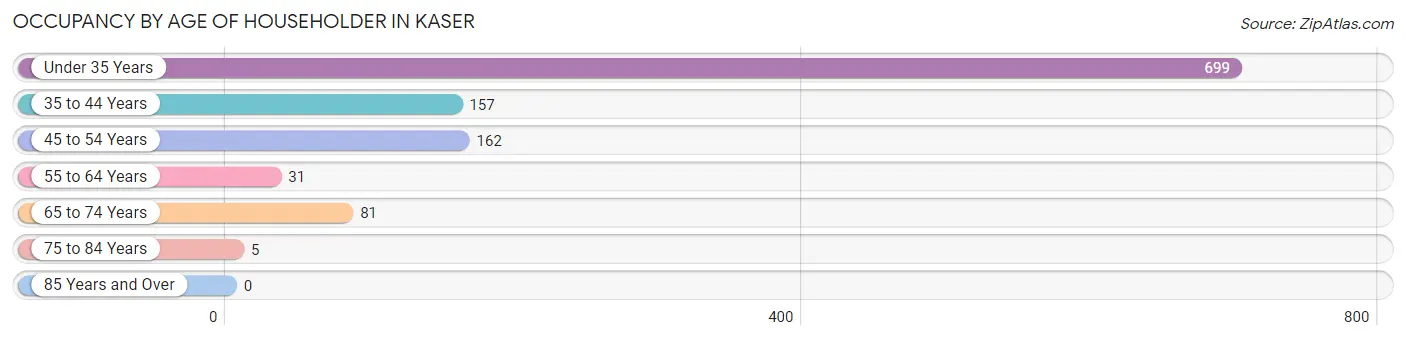
| Age Bracket | # Households | % Households |
| Under 35 Years | 699 | 61.6% |
| 35 to 44 Years | 157 | 13.8% |
| 45 to 54 Years | 162 | 14.3% |
| 55 to 64 Years | 31 | 2.7% |
| 65 to 74 Years | 81 | 7.1% |
| 75 to 84 Years | 5 | 0.4% |
| 85 Years and Over | 0 | 0.0% |
| Total | 1,135 | 100.0% |
Housing Finances in Kaser
Median Income by Occupancy in Kaser
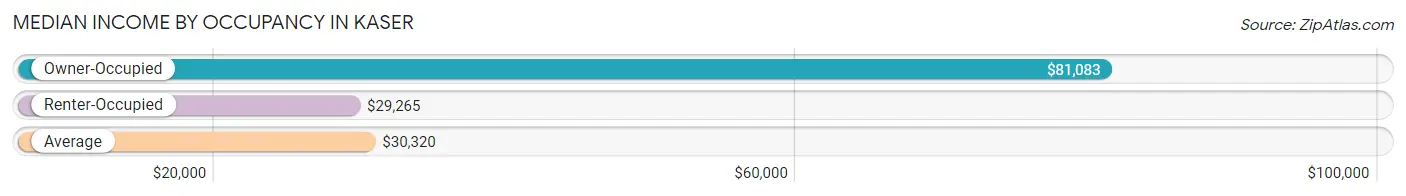
| Occupancy Type | # Households | Median Income |
| Owner-Occupied | 51 (4.5%) | $81,083 |
| Renter-Occupied | 1,084 (95.5%) | $29,265 |
| Average | 1,135 (100.0%) | $30,320 |
Occupancy by Householder Income Bracket in Kaser
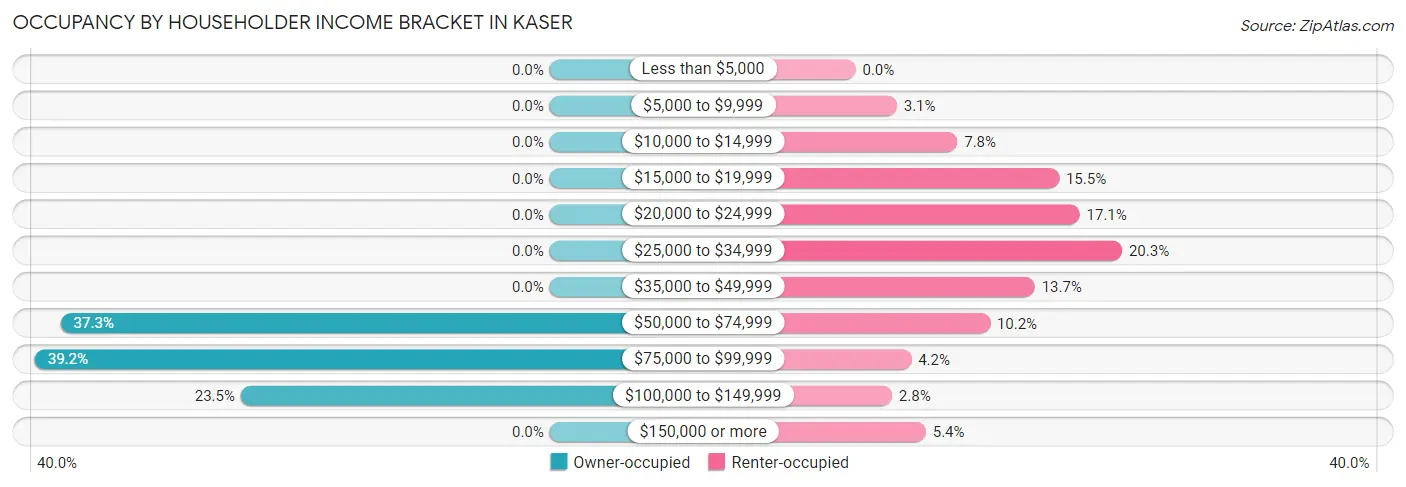
| Income Bracket | Owner-occupied | Renter-occupied |
| Less than $5,000 | 0 (0.0%) | 0 (0.0%) |
| $5,000 to $9,999 | 0 (0.0%) | 34 (3.1%) |
| $10,000 to $14,999 | 0 (0.0%) | 84 (7.7%) |
| $15,000 to $19,999 | 0 (0.0%) | 168 (15.5%) |
| $20,000 to $24,999 | 0 (0.0%) | 185 (17.1%) |
| $25,000 to $34,999 | 0 (0.0%) | 220 (20.3%) |
| $35,000 to $49,999 | 0 (0.0%) | 148 (13.7%) |
| $50,000 to $74,999 | 19 (37.2%) | 111 (10.2%) |
| $75,000 to $99,999 | 20 (39.2%) | 46 (4.2%) |
| $100,000 to $149,999 | 12 (23.5%) | 30 (2.8%) |
| $150,000 or more | 0 (0.0%) | 58 (5.3%) |
| Total | 51 (100.0%) | 1,084 (100.0%) |
Monthly Housing Cost Tiers in Kaser
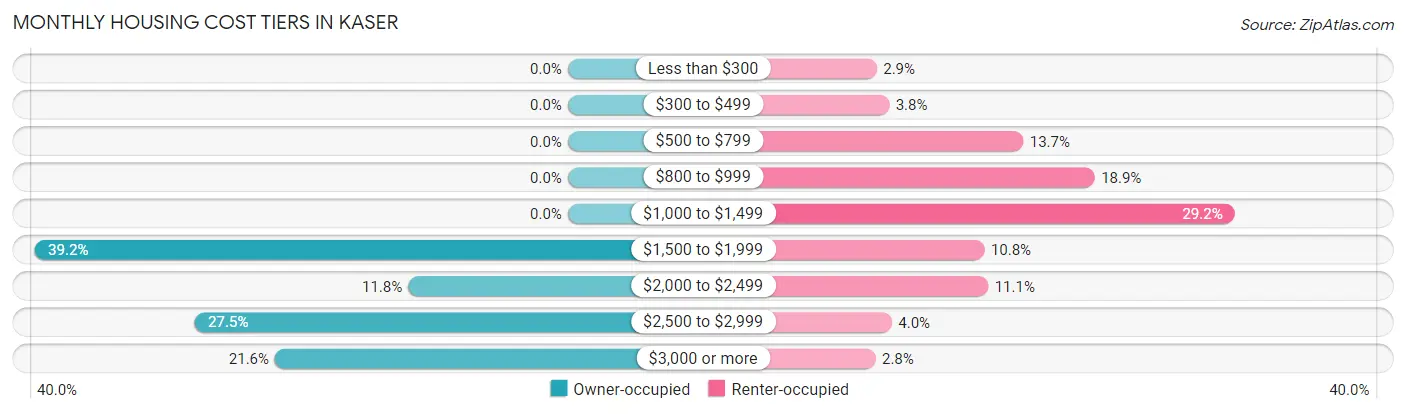
| Monthly Cost | Owner-occupied | Renter-occupied |
| Less than $300 | 0 (0.0%) | 31 (2.9%) |
| $300 to $499 | 0 (0.0%) | 41 (3.8%) |
| $500 to $799 | 0 (0.0%) | 148 (13.7%) |
| $800 to $999 | 0 (0.0%) | 205 (18.9%) |
| $1,000 to $1,499 | 0 (0.0%) | 317 (29.2%) |
| $1,500 to $1,999 | 20 (39.2%) | 117 (10.8%) |
| $2,000 to $2,499 | 6 (11.8%) | 120 (11.1%) |
| $2,500 to $2,999 | 14 (27.5%) | 43 (4.0%) |
| $3,000 or more | 11 (21.6%) | 30 (2.8%) |
| Total | 51 (100.0%) | 1,084 (100.0%) |
Physical Housing Characteristics in Kaser
Housing Structures in Kaser
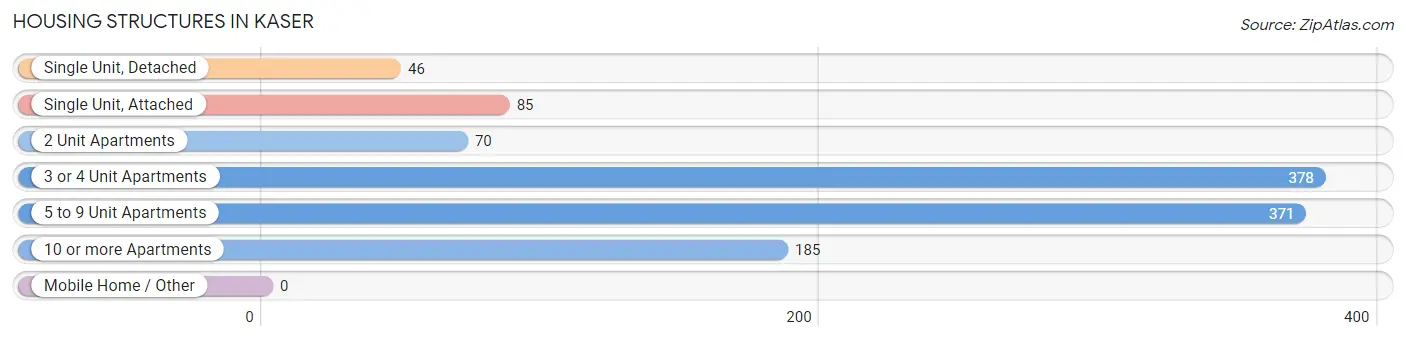
| Structure Type | # Housing Units | % Housing Units |
| Single Unit, Detached | 46 | 4.1% |
| Single Unit, Attached | 85 | 7.5% |
| 2 Unit Apartments | 70 | 6.2% |
| 3 or 4 Unit Apartments | 378 | 33.3% |
| 5 to 9 Unit Apartments | 371 | 32.7% |
| 10 or more Apartments | 185 | 16.3% |
| Mobile Home / Other | 0 | 0.0% |
| Total | 1,135 | 100.0% |
Housing Structures by Occupancy in Kaser
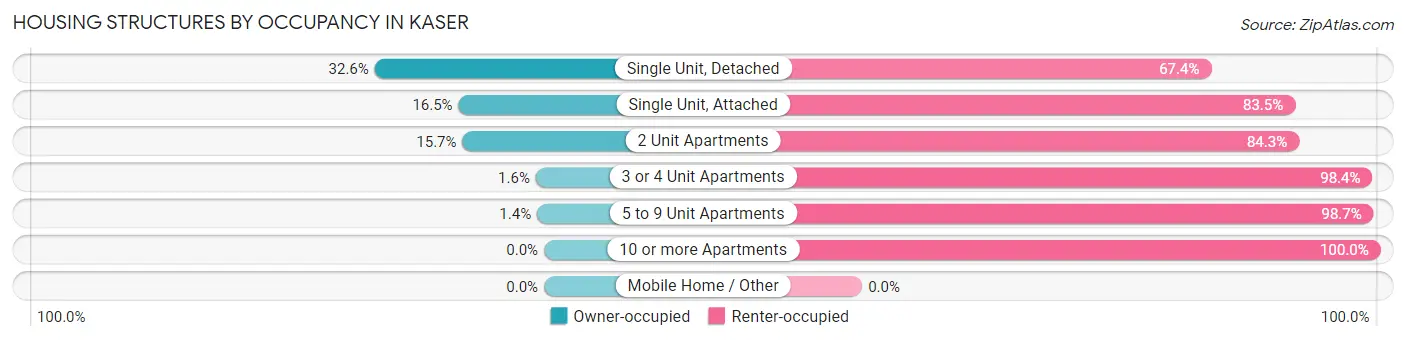
| Structure Type | Owner-occupied | Renter-occupied |
| Single Unit, Detached | 15 (32.6%) | 31 (67.4%) |
| Single Unit, Attached | 14 (16.5%) | 71 (83.5%) |
| 2 Unit Apartments | 11 (15.7%) | 59 (84.3%) |
| 3 or 4 Unit Apartments | 6 (1.6%) | 372 (98.4%) |
| 5 to 9 Unit Apartments | 5 (1.3%) | 366 (98.7%) |
| 10 or more Apartments | 0 (0.0%) | 185 (100.0%) |
| Mobile Home / Other | 0 (0.0%) | 0 (0.0%) |
| Total | 51 (4.5%) | 1,084 (95.5%) |
Housing Structures by Number of Rooms in Kaser
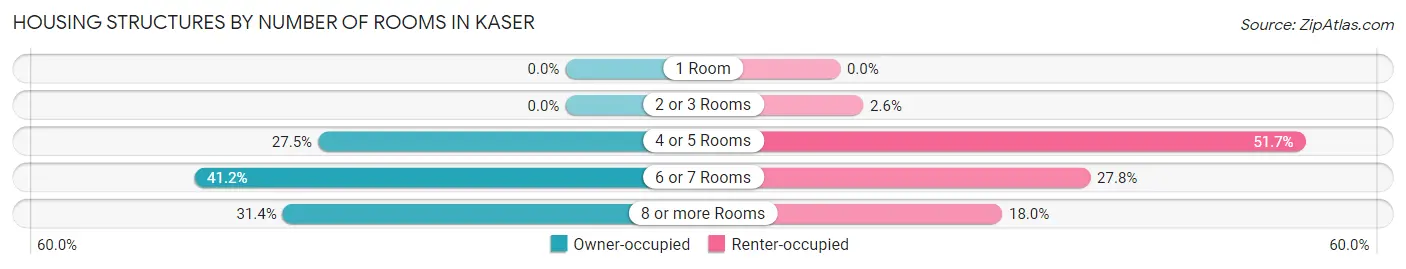
| Number of Rooms | Owner-occupied | Renter-occupied |
| 1 Room | 0 (0.0%) | 0 (0.0%) |
| 2 or 3 Rooms | 0 (0.0%) | 28 (2.6%) |
| 4 or 5 Rooms | 14 (27.5%) | 560 (51.7%) |
| 6 or 7 Rooms | 21 (41.2%) | 301 (27.8%) |
| 8 or more Rooms | 16 (31.4%) | 195 (18.0%) |
| Total | 51 (100.0%) | 1,084 (100.0%) |
Housing Structure by Heating Type in Kaser
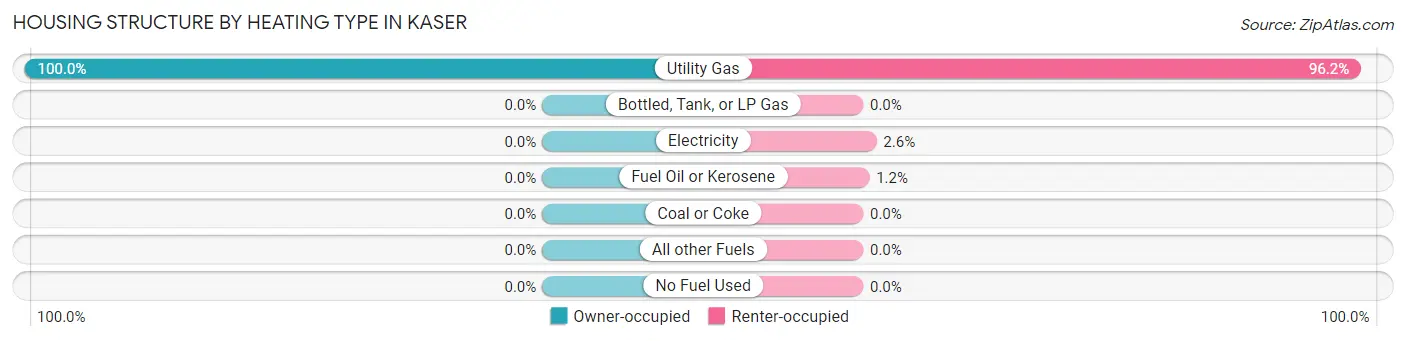
| Heating Type | Owner-occupied | Renter-occupied |
| Utility Gas | 51 (100.0%) | 1,043 (96.2%) |
| Bottled, Tank, or LP Gas | 0 (0.0%) | 0 (0.0%) |
| Electricity | 0 (0.0%) | 28 (2.6%) |
| Fuel Oil or Kerosene | 0 (0.0%) | 13 (1.2%) |
| Coal or Coke | 0 (0.0%) | 0 (0.0%) |
| All other Fuels | 0 (0.0%) | 0 (0.0%) |
| No Fuel Used | 0 (0.0%) | 0 (0.0%) |
| Total | 51 (100.0%) | 1,084 (100.0%) |
Household Vehicle Usage in Kaser
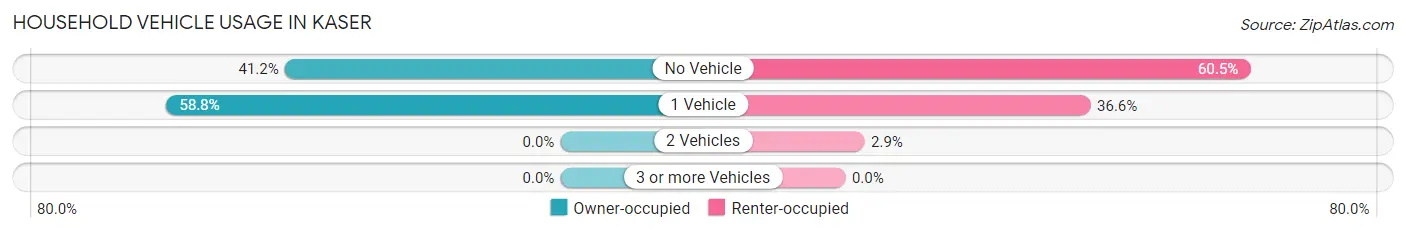
| Vehicles per Household | Owner-occupied | Renter-occupied |
| No Vehicle | 21 (41.2%) | 656 (60.5%) |
| 1 Vehicle | 30 (58.8%) | 397 (36.6%) |
| 2 Vehicles | 0 (0.0%) | 31 (2.9%) |
| 3 or more Vehicles | 0 (0.0%) | 0 (0.0%) |
| Total | 51 (100.0%) | 1,084 (100.0%) |
Real Estate & Mortgages in Kaser
Real Estate and Mortgage Overview in Kaser
| Characteristic | Without Mortgage | With Mortgage |
| Housing Units | 25 | 26 |
| Median Property Value | $1,526,800 | $0 |
| Median Household Income | - | - |
| Monthly Housing Costs | $1,501 | $11 |
| Real Estate Taxes | $10,001 | $0 |
Property Value by Mortgage Status in Kaser
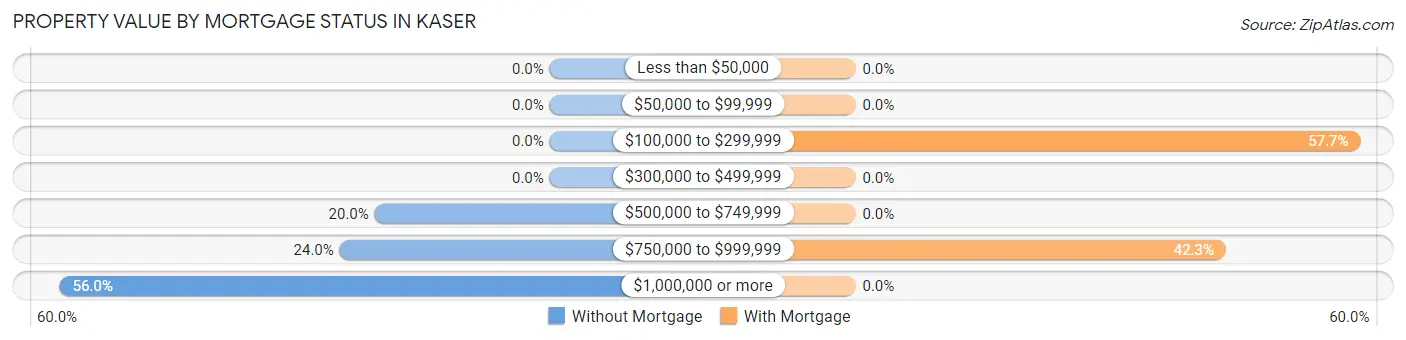
| Property Value | Without Mortgage | With Mortgage |
| Less than $50,000 | 0 (0.0%) | 0 (0.0%) |
| $50,000 to $99,999 | 0 (0.0%) | 0 (0.0%) |
| $100,000 to $299,999 | 0 (0.0%) | 15 (57.7%) |
| $300,000 to $499,999 | 0 (0.0%) | 0 (0.0%) |
| $500,000 to $749,999 | 5 (20.0%) | 0 (0.0%) |
| $750,000 to $999,999 | 6 (24.0%) | 11 (42.3%) |
| $1,000,000 or more | 14 (56.0%) | 0 (0.0%) |
| Total | 25 (100.0%) | 26 (100.0%) |
Household Income by Mortgage Status in Kaser
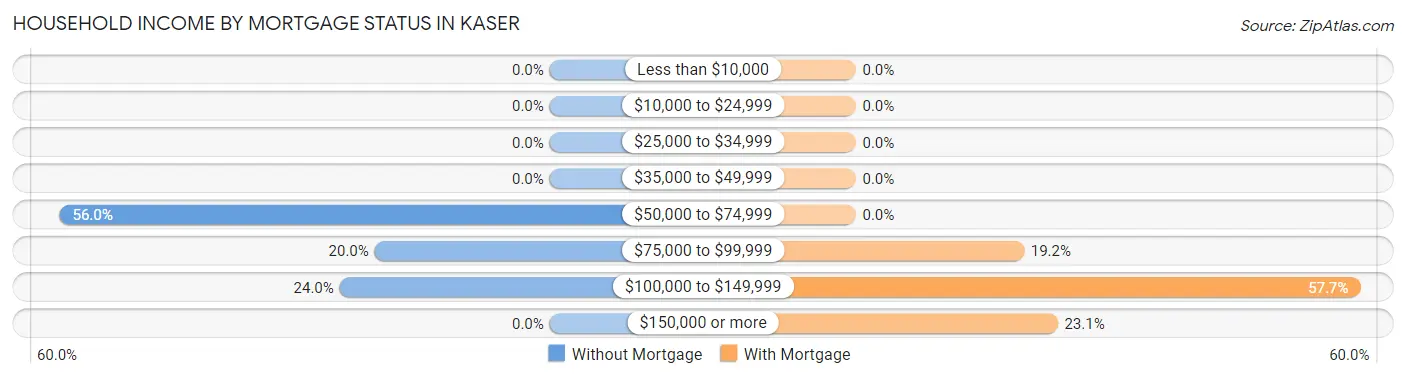
| Household Income | Without Mortgage | With Mortgage |
| Less than $10,000 | 0 (0.0%) | 0 (0.0%) |
| $10,000 to $24,999 | 0 (0.0%) | 0 (0.0%) |
| $25,000 to $34,999 | 0 (0.0%) | 0 (0.0%) |
| $35,000 to $49,999 | 0 (0.0%) | 0 (0.0%) |
| $50,000 to $74,999 | 14 (56.0%) | 0 (0.0%) |
| $75,000 to $99,999 | 5 (20.0%) | 5 (19.2%) |
| $100,000 to $149,999 | 6 (24.0%) | 15 (57.7%) |
| $150,000 or more | 0 (0.0%) | 6 (23.1%) |
| Total | 25 (100.0%) | 26 (100.0%) |
Property Value to Household Income Ratio in Kaser
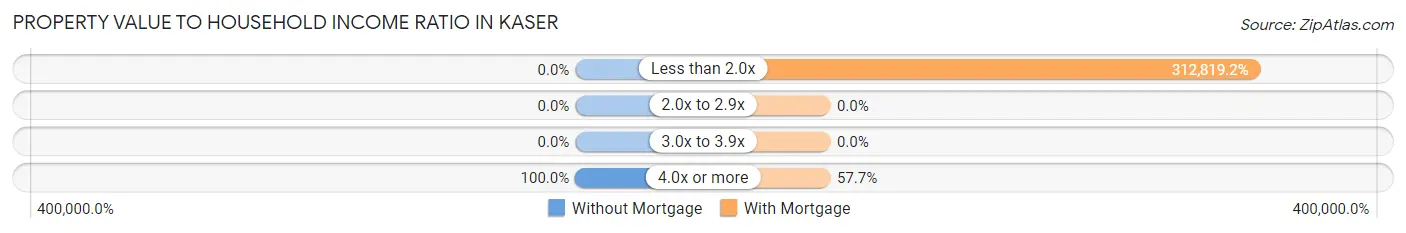
| Value-to-Income Ratio | Without Mortgage | With Mortgage |
| Less than 2.0x | 0 (0.0%) | 81,333 (312,819.2%) |
| 2.0x to 2.9x | 0 (0.0%) | 0 (0.0%) |
| 3.0x to 3.9x | 0 (0.0%) | 0 (0.0%) |
| 4.0x or more | 25 (100.0%) | 15 (57.7%) |
| Total | 25 (100.0%) | 26 (100.0%) |
Real Estate Taxes by Mortgage Status in Kaser
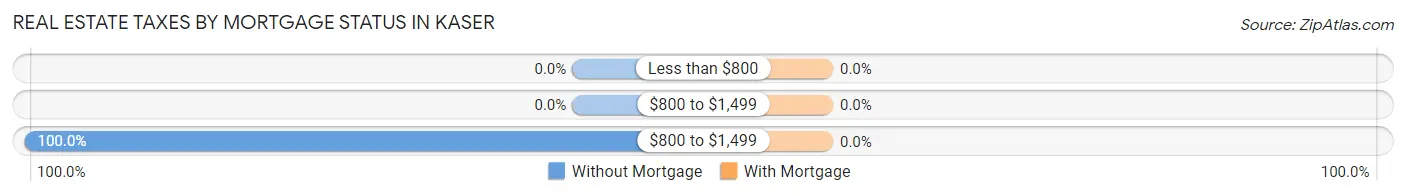
| Property Taxes | Without Mortgage | With Mortgage |
| Less than $800 | 0 (0.0%) | 0 (0.0%) |
| $800 to $1,499 | 0 (0.0%) | 0 (0.0%) |
| $800 to $1,499 | 25 (100.0%) | 0 (0.0%) |
| Total | 25 (100.0%) | 26 (100.0%) |
Health & Disability in Kaser
Health Insurance Coverage by Age in Kaser
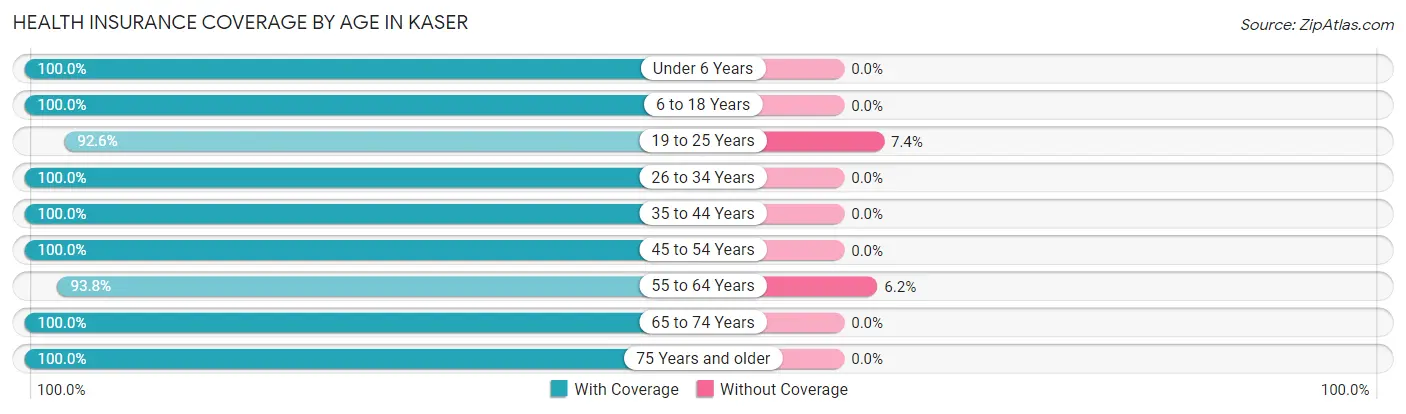
| Age Bracket | With Coverage | Without Coverage |
| Under 6 Years | 1,517 (100.0%) | 0 (0.0%) |
| 6 to 18 Years | 1,555 (100.0%) | 0 (0.0%) |
| 19 to 25 Years | 925 (92.6%) | 74 (7.4%) |
| 26 to 34 Years | 580 (100.0%) | 0 (0.0%) |
| 35 to 44 Years | 372 (100.0%) | 0 (0.0%) |
| 45 to 54 Years | 264 (100.0%) | 0 (0.0%) |
| 55 to 64 Years | 76 (93.8%) | 5 (6.2%) |
| 65 to 74 Years | 119 (100.0%) | 0 (0.0%) |
| 75 Years and older | 14 (100.0%) | 0 (0.0%) |
| Total | 5,422 (98.6%) | 79 (1.4%) |
Health Insurance Coverage by Citizenship Status in Kaser
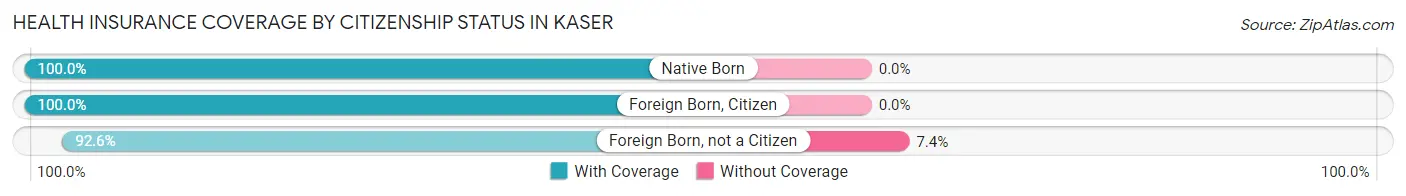
| Citizenship Status | With Coverage | Without Coverage |
| Native Born | 1,517 (100.0%) | 0 (0.0%) |
| Foreign Born, Citizen | 1,555 (100.0%) | 0 (0.0%) |
| Foreign Born, not a Citizen | 925 (92.6%) | 74 (7.4%) |
Health Insurance Coverage by Household Income in Kaser
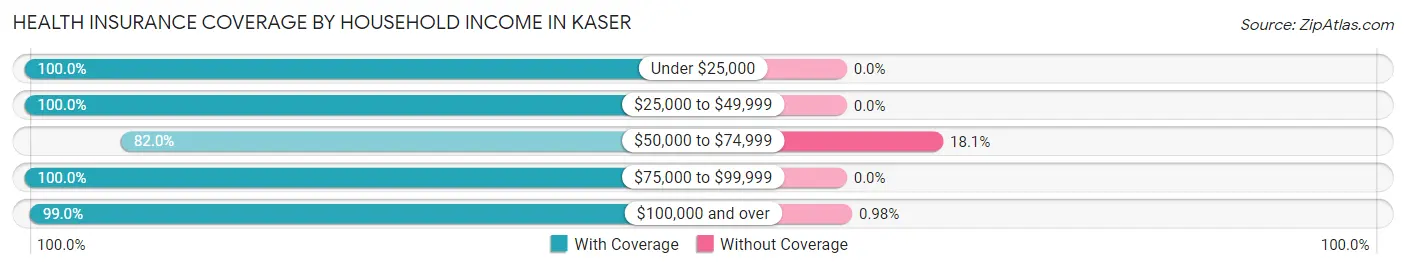
| Household Income | With Coverage | Without Coverage |
| Under $25,000 | 2,046 (100.0%) | 0 (0.0%) |
| $25,000 to $49,999 | 2,205 (100.0%) | 0 (0.0%) |
| $50,000 to $74,999 | 336 (82.0%) | 74 (18.0%) |
| $75,000 to $99,999 | 328 (100.0%) | 0 (0.0%) |
| $100,000 and over | 506 (99.0%) | 5 (1.0%) |
Public vs Private Health Insurance Coverage by Age in Kaser
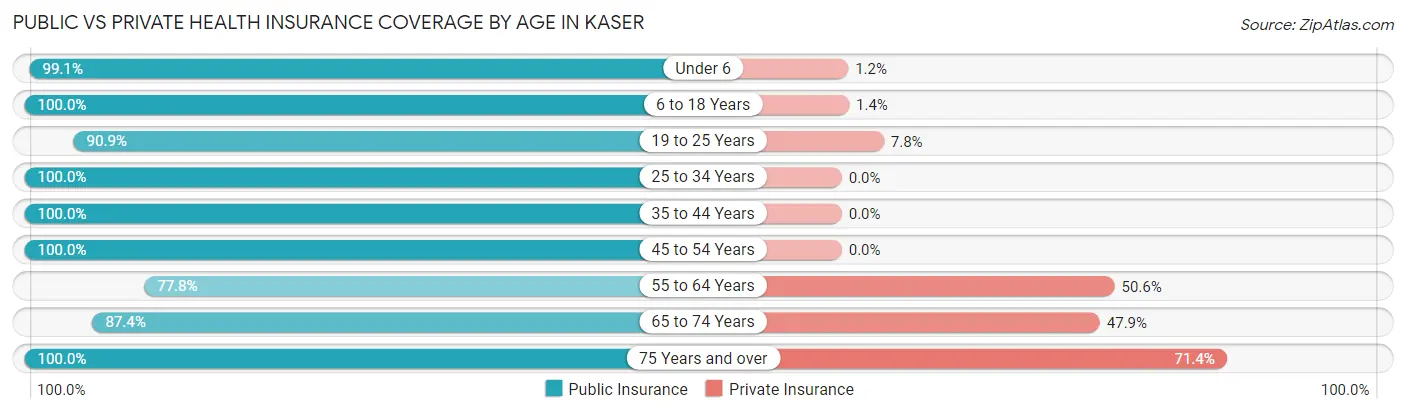
| Age Bracket | Public Insurance | Private Insurance |
| Under 6 | 1,503 (99.1%) | 18 (1.2%) |
| 6 to 18 Years | 1,555 (100.0%) | 21 (1.3%) |
| 19 to 25 Years | 908 (90.9%) | 78 (7.8%) |
| 25 to 34 Years | 580 (100.0%) | 0 (0.0%) |
| 35 to 44 Years | 372 (100.0%) | 0 (0.0%) |
| 45 to 54 Years | 264 (100.0%) | 0 (0.0%) |
| 55 to 64 Years | 63 (77.8%) | 41 (50.6%) |
| 65 to 74 Years | 104 (87.4%) | 57 (47.9%) |
| 75 Years and over | 14 (100.0%) | 10 (71.4%) |
| Total | 5,363 (97.5%) | 225 (4.1%) |
Disability Status by Sex by Age in Kaser
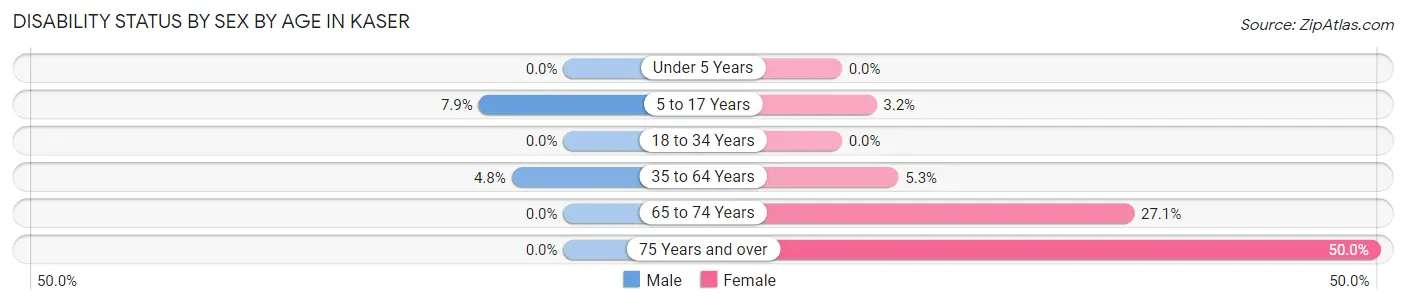
| Age Bracket | Male | Female |
| Under 5 Years | 0 (0.0%) | 0 (0.0%) |
| 5 to 17 Years | 69 (7.9%) | 28 (3.2%) |
| 18 to 34 Years | 0 (0.0%) | 0 (0.0%) |
| 35 to 64 Years | 18 (4.8%) | 18 (5.2%) |
| 65 to 74 Years | 0 (0.0%) | 16 (27.1%) |
| 75 Years and over | 0 (0.0%) | 5 (50.0%) |
Disability Class by Sex by Age in Kaser
Disability Class: Hearing Difficulty
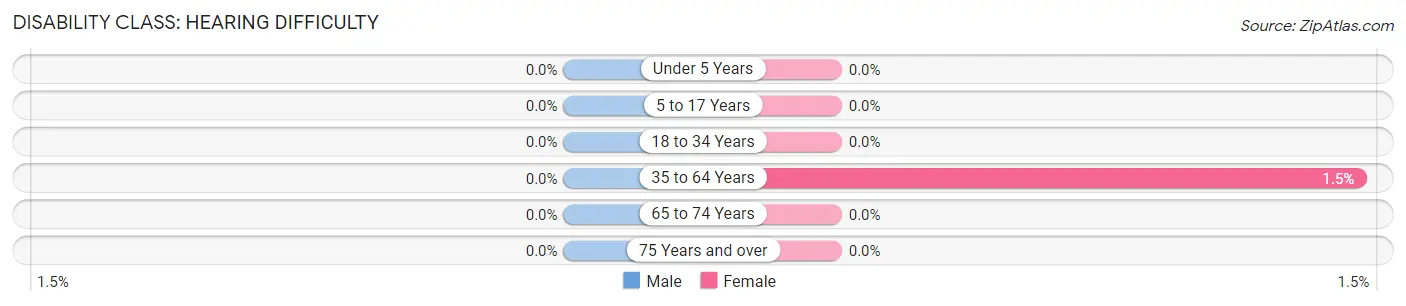
| Age Bracket | Male | Female |
| Under 5 Years | 0 (0.0%) | 0 (0.0%) |
| 5 to 17 Years | 0 (0.0%) | 0 (0.0%) |
| 18 to 34 Years | 0 (0.0%) | 0 (0.0%) |
| 35 to 64 Years | 0 (0.0%) | 5 (1.5%) |
| 65 to 74 Years | 0 (0.0%) | 0 (0.0%) |
| 75 Years and over | 0 (0.0%) | 0 (0.0%) |
Disability Class: Vision Difficulty
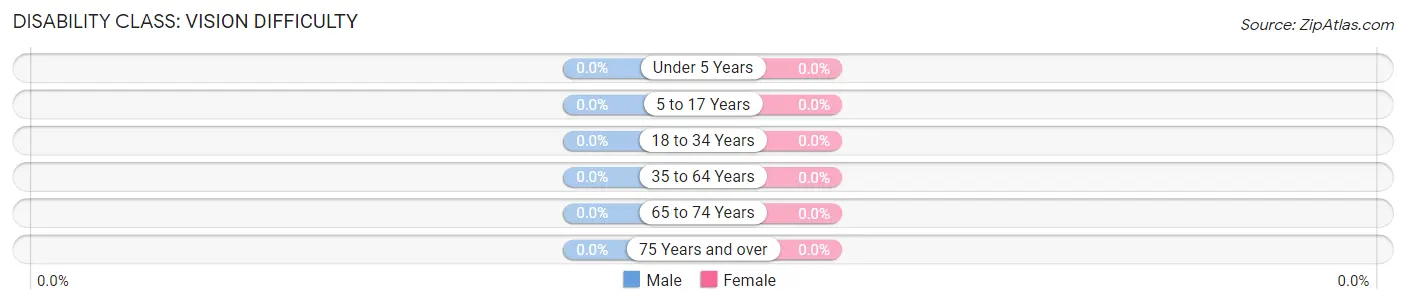
| Age Bracket | Male | Female |
| Under 5 Years | 0 (0.0%) | 0 (0.0%) |
| 5 to 17 Years | 0 (0.0%) | 0 (0.0%) |
| 18 to 34 Years | 0 (0.0%) | 0 (0.0%) |
| 35 to 64 Years | 0 (0.0%) | 0 (0.0%) |
| 65 to 74 Years | 0 (0.0%) | 0 (0.0%) |
| 75 Years and over | 0 (0.0%) | 0 (0.0%) |
Disability Class: Cognitive Difficulty
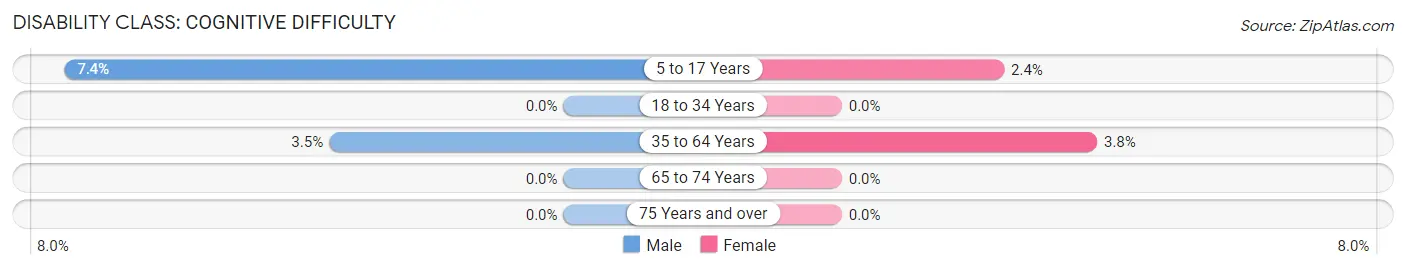
| Age Bracket | Male | Female |
| 5 to 17 Years | 65 (7.4%) | 21 (2.4%) |
| 18 to 34 Years | 0 (0.0%) | 0 (0.0%) |
| 35 to 64 Years | 13 (3.5%) | 13 (3.8%) |
| 65 to 74 Years | 0 (0.0%) | 0 (0.0%) |
| 75 Years and over | 0 (0.0%) | 0 (0.0%) |
Disability Class: Ambulatory Difficulty
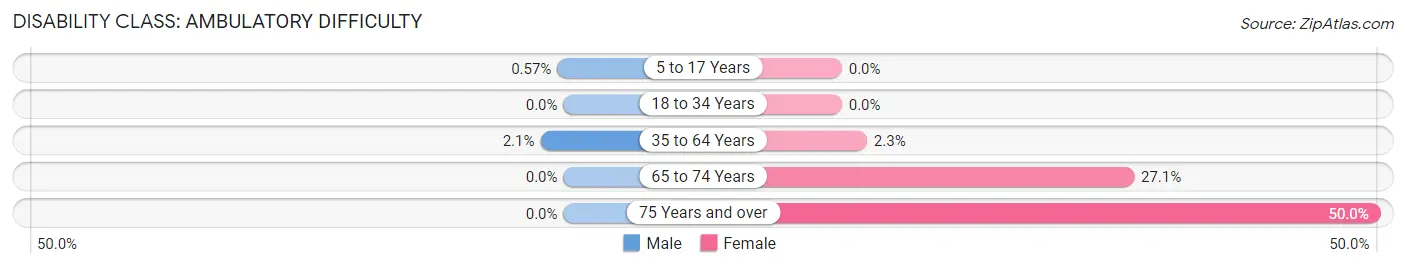
| Age Bracket | Male | Female |
| 5 to 17 Years | 5 (0.6%) | 0 (0.0%) |
| 18 to 34 Years | 0 (0.0%) | 0 (0.0%) |
| 35 to 64 Years | 8 (2.1%) | 8 (2.3%) |
| 65 to 74 Years | 0 (0.0%) | 16 (27.1%) |
| 75 Years and over | 0 (0.0%) | 5 (50.0%) |
Disability Class: Self-Care Difficulty
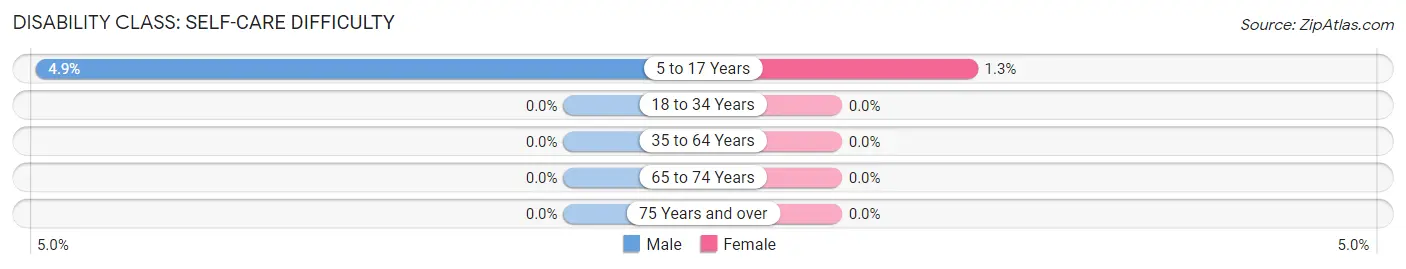
| Age Bracket | Male | Female |
| 5 to 17 Years | 43 (4.9%) | 11 (1.3%) |
| 18 to 34 Years | 0 (0.0%) | 0 (0.0%) |
| 35 to 64 Years | 0 (0.0%) | 0 (0.0%) |
| 65 to 74 Years | 0 (0.0%) | 0 (0.0%) |
| 75 Years and over | 0 (0.0%) | 0 (0.0%) |
Technology Access in Kaser
Computing Device Access in Kaser
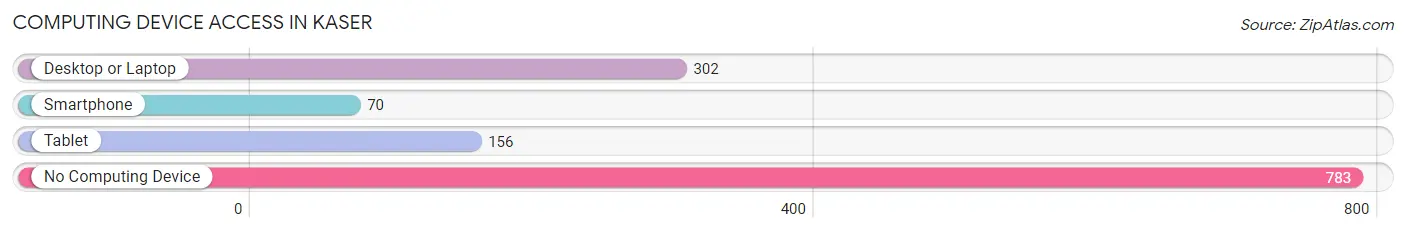
| Device Type | # Households | % Households |
| Desktop or Laptop | 302 | 26.6% |
| Smartphone | 70 | 6.2% |
| Tablet | 156 | 13.7% |
| No Computing Device | 783 | 69.0% |
| Total | 1,135 | 100.0% |
Internet Access in Kaser
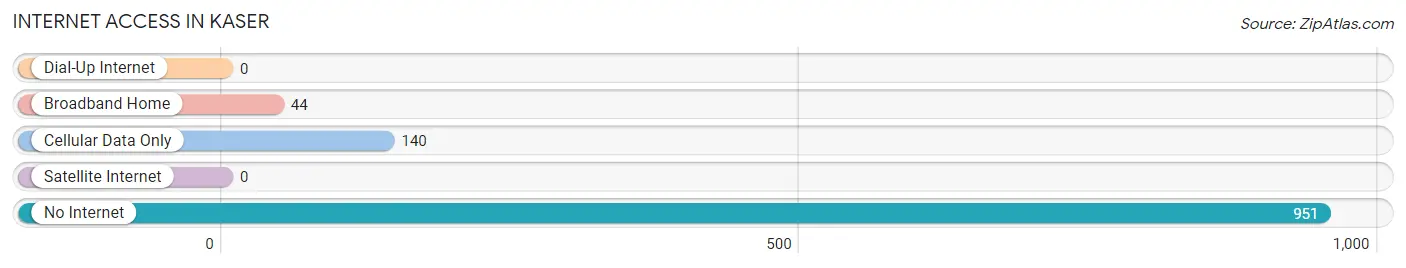
| Internet Type | # Households | % Households |
| Dial-Up Internet | 0 | 0.0% |
| Broadband Home | 44 | 3.9% |
| Cellular Data Only | 140 | 12.3% |
| Satellite Internet | 0 | 0.0% |
| No Internet | 951 | 83.8% |
| Total | 1,135 | 100.0% |
Kaser Summary
Kaser is a hamlet located in the town of Ramapo in Rockland County, New York. It is situated in the foothills of the Ramapo Mountains, approximately 25 miles northwest of New York City. The hamlet is bordered by the hamlets of Airmont, Hillburn, and Viola to the north, and the hamlets of Monsey and Spring Valley to the south.
History
Kaser was first settled in the late 1700s by Dutch and German immigrants. The hamlet was originally known as “Kassel”, after the German city of Kassel. The name was later changed to Kaser, which is derived from the Dutch word for “castle”.
In the early 1800s, Kaser was a small farming community. The hamlet was home to several small farms, as well as a grist mill, a saw mill, and a blacksmith shop.
In the late 1800s, Kaser began to grow and develop. The hamlet was home to several stores, a post office, a school, and a church. The hamlet also had a train station, which was part of the New York and Erie Railroad.
In the early 1900s, Kaser continued to grow and develop. The hamlet was home to several stores, a post office, a school, and a church. The hamlet also had a train station, which was part of the New York and Erie Railroad.
In the late 1900s, Kaser began to experience rapid growth due to an influx of Orthodox Jewish immigrants. The hamlet is now home to a large Orthodox Jewish community, and is home to several synagogues, schools, and other religious institutions.
Geography
Kaser is located in the foothills of the Ramapo Mountains, approximately 25 miles northwest of New York City. The hamlet is bordered by the hamlets of Airmont, Hillburn, and Viola to the north, and the hamlets of Monsey and Spring Valley to the south.
The hamlet is located in the Ramapo Valley, which is a large valley that stretches from the Hudson River to the Ramapo Mountains. The valley is home to several rivers, including the Ramapo River, the Saddle River, and the Mahwah River.
Economy
Kaser’s economy is largely based on the service industry. The hamlet is home to several stores, restaurants, and other businesses that cater to the local Orthodox Jewish community.
Kaser is also home to several light industrial businesses, including a printing company and a plastics manufacturer.
Demographics
As of the 2010 census, Kaser had a population of 4,845. The population is largely composed of Orthodox Jews, who make up approximately 90% of the population. The remaining 10% of the population is composed of other ethnic and religious groups, including African Americans, Hispanics, and Asians.
Kaser is a predominantly English-speaking community. The hamlet is also home to several Yiddish-speaking Orthodox Jews.
Kaser is a safe and friendly community. The hamlet has a low crime rate, and is home to several religious institutions, including several synagogues, schools, and other religious organizations.
Common Questions
What is Per Capita Income in Kaser?
Per Capita income in Kaser is $9,471.
What is the Median Family Income in Kaser?
Median Family Income in Kaser is $29,835.
What is the Median Household income in Kaser?
Median Household Income in Kaser is $30,320.
What is Income or Wage Gap in Kaser?
Income or Wage Gap in Kaser is 35.8%.
Women in Kaser earn 64.2 cents for every dollar earned by a man.
What is Family Income Deficit in Kaser?
Family Income Deficit in Kaser is $15,171.
Families that are below poverty line in Kaser earn $15,171 less on average than the poverty threshold level.
What is Inequality or Gini Index in Kaser?
Inequality or Gini Index in Kaser is 0.43.
What is the Total Population of Kaser?
Total Population of Kaser is 5,501.
What is the Total Male Population of Kaser?
Total Male Population of Kaser is 2,762.
What is the Total Female Population of Kaser?
Total Female Population of Kaser is 2,739.
What is the Ratio of Males per 100 Females in Kaser?
There are 100.84 Males per 100 Females in Kaser.
What is the Ratio of Females per 100 Males in Kaser?
There are 99.17 Females per 100 Males in Kaser.
What is the Median Population Age in Kaser?
Median Population Age in Kaser is 15.6 Years.
What is the Average Family Size in Kaser
Average Family Size in Kaser is 4.9 People.
What is the Average Household Size in Kaser
Average Household Size in Kaser is 4.8 People.
How Large is the Labor Force in Kaser?
There are 1,506 People in the Labor Forcein in Kaser.
What is the Percentage of People in the Labor Force in Kaser?
56.3% of People are in the Labor Force in Kaser.
What is the Unemployment Rate in Kaser?
Unemployment Rate in Kaser is 7.2%.