Zip Codes with the Highest Poverty Level Among Children Under the Age of 5 in Brooklyn, NY

RELATED REPORTS & OPTIONS

Highest Poverty | Child 0-5
Population
Families and Households
Female Fertility
Female Fertility (Unmarried)
Race (Community Size)
Race (Percentage)
Ancestry (Community Size)
AfghanAfricanAlbanianAlsatianAmericanApacheArabArgentineanArmenianAssyrian / Chaldean / SyriacAustralianAustrianBahamianBangladeshiBarbadianBasqueBelgianBelizeanBermudanBhutaneseBlackfeetBolivianBrazilianBritishBritish West IndianBulgarianBurmeseCajunCambodianCanadianCape VerdeanCarpatho RusynCelticCentral AmericanCentral American IndianCherokeeChickasawChileanChippewaChoctawColombianCosta RicanCreekCroatianCrowCubanCypriotCzechCzechoslovakianDanishDominicanDutchDutch West IndianEastern EuropeanEcuadorianEgyptianEnglishEstonianEthiopianEuropeanFilipinoFinnishFrenchFrench American IndianFrench CanadianGermanGerman RussianGhanaianGreekGuamanian / ChamorroGuatemalanGuyaneseHaitianHonduranHungarianIcelanderIndian (Asian)IndonesianIranianIraqiIrishIroquoisIsraeliItalianJamaicanJapaneseJordanianKenyanKoreanLaotianLatvianLebaneseLiberianLithuanianLumbeeLuxembourgerMacedonianMalaysianMalteseMexicanMexican American IndianMongolianMoroccanNative HawaiianNavajoNew ZealanderNicaraguanNigerianNorthern EuropeanNorwegianOkinawanPakistaniPalestinianPanamanianParaguayanPennsylvania GermanPeruvianPolishPortuguesePuebloPuerto RicanRomanianRussianSalvadoranSamoanScandinavianScotch-IrishScottishSeminoleSenegaleseSerbianSierra LeoneanSiouxSlavicSlovakSloveneSomaliSouth AfricanSouth AmericanSouth American IndianSoviet UnionSpaniardSpanishSpanish AmericanSpanish American IndianSri LankanSubsaharan AfricanSudaneseSwedishSwissSyrianThaiTrinidadian and TobagonianTurkishU.S. Virgin IslanderUgandanUkrainianUruguayanVenezuelanVietnameseWelshWest IndianYugoslavian
Ancestry (Percentage)
AfghanAfricanAlbanianAlsatianAmericanApacheArabArgentineanArmenianAssyrian / Chaldean / SyriacAustralianAustrianBahamianBangladeshiBarbadianBasqueBelgianBelizeanBermudanBhutaneseBlackfeetBolivianBrazilianBritishBritish West IndianBulgarianBurmeseCajunCambodianCanadianCape VerdeanCarpatho RusynCelticCentral AmericanCentral American IndianCherokeeChickasawChileanChippewaChoctawColombianCosta RicanCreekCroatianCrowCubanCypriotCzechCzechoslovakianDanishDominicanDutchDutch West IndianEastern EuropeanEcuadorianEgyptianEnglishEstonianEthiopianEuropeanFilipinoFinnishFrenchFrench American IndianFrench CanadianGermanGerman RussianGhanaianGreekGuamanian / ChamorroGuatemalanGuyaneseHaitianHonduranHungarianIcelanderIndian (Asian)IndonesianIranianIraqiIrishIroquoisIsraeliItalianJamaicanJapaneseJordanianKenyanKoreanLaotianLatvianLebaneseLiberianLithuanianLumbeeLuxembourgerMacedonianMalaysianMalteseMexicanMexican American IndianMongolianMoroccanNative HawaiianNavajoNew ZealanderNicaraguanNigerianNorthern EuropeanNorwegianOkinawanPakistaniPalestinianPanamanianParaguayanPennsylvania GermanPeruvianPolishPortuguesePuebloPuerto RicanRomanianRussianSalvadoranSamoanScandinavianScotch-IrishScottishSeminoleSenegaleseSerbianSierra LeoneanSiouxSlavicSlovakSloveneSomaliSouth AfricanSouth AmericanSouth American IndianSoviet UnionSpaniardSpanishSpanish AmericanSpanish American IndianSri LankanSubsaharan AfricanSudaneseSwedishSwissSyrianThaiTrinidadian and TobagonianTurkishU.S. Virgin IslanderUgandanUkrainianUruguayanVenezuelanVietnameseWelshWest IndianYugoslavian
Immigrant Origin (Total)
AfghanistanAfricaAlbaniaArgentinaArmeniaAsiaAustraliaAustriaBahamasBangladeshBarbadosBelarusBelgiumBelizeBoliviaBosnia and HerzegovinaBrazilBulgariaBurma / MyanmarCambodiaCameroonCanadaCaribbeanCentral AmericaChileChinaColombiaCongoCosta RicaCroatiaCubaCzechoslovakiaDenmarkDominicaDominican RepublicEastern AfricaEastern AsiaEastern EuropeEcuadorEgyptEl SalvadorEnglandEritreaEthiopiaEuropeFranceGermanyGhanaGreeceGrenadaGuatemalaGuyanaHaitiHondurasHong KongHungaryIndiaIndonesiaIranIraqIrelandIsraelItalyJamaicaJapanJordanKazakhstanKenyaKoreaKuwaitLaosLatin AmericaLatviaLebanonLiberiaLithuaniaMalaysiaMexicoMicronesiaMiddle AfricaMoldovaMoroccoNepalNetherlandsNicaraguaNigeriaNorth MacedoniaNorthern AfricaNorthern EuropeNorwayOceaniaPakistanPanamaPeruPhilippinesPolandPortugalRomaniaRussiaSaudi ArabiaScotlandSenegalSerbiaSierra LeoneSingaporeSomaliaSouth AfricaSouth AmericaSouth Central AsiaSouth Eastern AsiaSouthern EuropeSpainSri LankaSt. Vincent and the GrenadinesSudanSwedenSwitzerlandSyriaTaiwanThailandTrinidad and TobagoTurkeyUgandaUkraineUruguayUzbekistanVenezuelaVietnamWest IndiesWestern AfricaWestern AsiaWestern EuropeYemenZaireZimbabwe
Immigrant Origin (Percentage)
AfghanistanAfricaAlbaniaArgentinaArmeniaAsiaAustraliaAustriaBahamasBangladeshBarbadosBelarusBelgiumBelizeBoliviaBosnia and HerzegovinaBrazilBulgariaBurma / MyanmarCambodiaCameroonCanadaCaribbeanCentral AmericaChileChinaColombiaCongoCosta RicaCroatiaCubaCzechoslovakiaDenmarkDominicaDominican RepublicEastern AfricaEastern AsiaEastern EuropeEcuadorEgyptEl SalvadorEnglandEritreaEthiopiaEuropeFranceGermanyGhanaGreeceGrenadaGuatemalaGuyanaHaitiHondurasHong KongHungaryIndiaIndonesiaIranIraqIrelandIsraelItalyJamaicaJapanJordanKazakhstanKenyaKoreaKuwaitLaosLatin AmericaLatviaLebanonLiberiaLithuaniaMalaysiaMexicoMicronesiaMiddle AfricaMoldovaMoroccoNepalNetherlandsNicaraguaNigeriaNorth MacedoniaNorthern AfricaNorthern EuropeNorwayOceaniaPakistanPanamaPeruPhilippinesPolandPortugalRomaniaRussiaSaudi ArabiaScotlandSenegalSerbiaSierra LeoneSingaporeSomaliaSouth AfricaSouth AmericaSouth Central AsiaSouth Eastern AsiaSouthern EuropeSpainSri LankaSt. Vincent and the GrenadinesSudanSwedenSwitzerlandSyriaTaiwanThailandTrinidad and TobagoTurkeyUgandaUkraineUruguayUzbekistanVenezuelaVietnamWest IndiesWestern AfricaWestern AsiaWestern EuropeYemenZaireZimbabwe
Income
Income (Families)
Income (Households)
Poverty
Poverty (Families)
Unemployment
Employment Occupations
Employment Industries
Employer Class
Commute Time
Commute Means
School Enrollment
Education by Degree Field
Occupancy
Finances
Physical Characteristics
Brooklyn
Compare Zip Codes
Comparison Subject

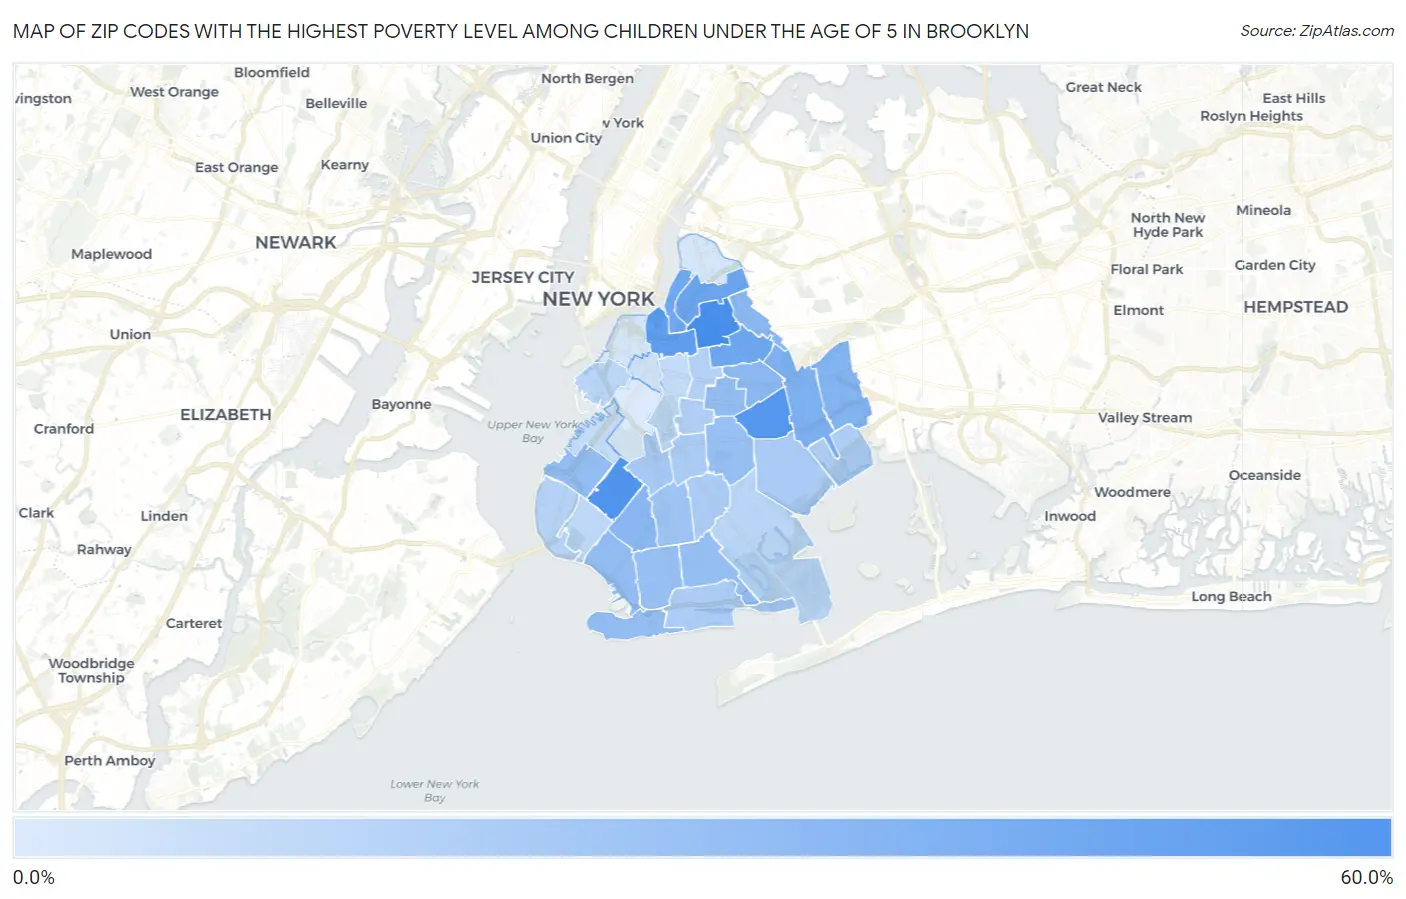
Map of Zip Codes with the Highest Poverty Level Among Children Under the Age of 5 in Brooklyn

0.0%
60.0%
Zip Codes with the Highest Poverty Level Among Children Under the Age of 5 in Brooklyn Map

Zip Codes with the Highest Poverty Level Among Children Under the Age of 5 in Brooklyn, NY

Zip Code Child Poverty vs State vs National
1.1120652.6%18.7%(+33.8)#8518.1%(+34.5)#2,291
2.1121948.3%18.7%(+29.6)#10718.1%(+30.3)#2,775
3.1121246.4%18.7%(+27.7)#11618.1%(+28.4)#2,985
4.1120542.5%18.7%(+23.8)#14518.1%(+24.5)#3,565
5.1121138.1%18.7%(+19.4)#17918.1%(+20.1)#4,379
6.1122136.9%18.7%(+18.2)#19018.1%(+18.9)#4,612
7.1124935.2%18.7%(+16.4)#21118.1%(+17.1)#5,026
8.1120730.9%18.7%(+12.2)#26118.1%(+12.8)#6,123
9.1120829.0%18.7%(+10.2)#27518.1%(+10.9)#6,660
10.1120426.9%18.7%(+8.20)#30818.1%(+8.88)#7,317
11.1123726.5%18.7%(+7.71)#31518.1%(+8.39)#7,494
12.1123326.2%18.7%(+7.43)#31818.1%(+8.12)#7,589
13.1121423.9%18.7%(+5.16)#34518.1%(+5.85)#8,390
14.1122423.8%18.7%(+5.07)#34718.1%(+5.75)#8,423
15.1121323.6%18.7%(+4.82)#35518.1%(+5.50)#8,544
16.1122023.2%18.7%(+4.43)#36418.1%(+5.12)#8,696
17.1122922.7%18.7%(+3.93)#37318.1%(+4.62)#8,887
18.1122322.3%18.7%(+3.52)#38518.1%(+4.21)#9,060
19.1120322.2%18.7%(+3.45)#39018.1%(+4.14)#9,114
20.1123019.8%18.7%(+1.06)#43918.1%(+1.74)#10,133
21.1121817.1%18.7%(-1.66)#49818.1%(-0.970)#11,386
22.1123615.7%18.7%(-3.03)#53018.1%(-2.35)#12,067
23.1122615.6%18.7%(-3.19)#53418.1%(-2.50)#12,147
24.1121015.3%18.7%(-3.42)#53918.1%(-2.74)#12,282
25.1123514.8%18.7%(-3.93)#56218.1%(-3.24)#12,565
26.1122514.2%18.7%(-4.53)#57418.1%(-3.85)#12,923
27.1123914.2%18.7%(-4.58)#57718.1%(-3.89)#12,946
28.1121613.0%18.7%(-5.70)#61618.1%(-5.02)#13,593
29.1120912.1%18.7%(-6.64)#63318.1%(-5.95)#14,143
30.1123411.1%18.7%(-7.68)#66518.1%(-7.00)#14,799
31.1123110.6%18.7%(-8.11)#67718.1%(-7.42)#15,028
32.112289.6%18.7%(-9.16)#71018.1%(-8.47)#15,648
33.112388.1%18.7%(-10.6)#77018.1%(-9.92)#16,672
34.112327.6%18.7%(-11.2)#79118.1%(-10.5)#17,023
35.112174.5%18.7%(-14.2)#92118.1%(-13.5)#19,073
36.112222.9%18.7%(-15.9)#97718.1%(-15.2)#20,232
37.112012.7%18.7%(-16.1)#98818.1%(-15.4)#20,399
38.112150.71%18.7%(-18.0)#1,05818.1%(-17.4)#21,539

Common Questions

What are the Top 10 Zip Codes with the Highest Poverty Level Among Children Under the Age of 5 in Brooklyn, NY?
Top 10 Zip Codes with the Highest Poverty Level Among Children Under the Age of 5 in Brooklyn, NY are:
#1
52.6%
#2
48.3%
#3
46.4%
#4
42.5%
#5
38.1%
#6
36.9%
#7
35.2%
#8
30.9%
#9
29.0%
#10
26.9%
What zip code has the Highest Poverty Level Among Children Under the Age of 5 in Brooklyn, NY?
11206 has the Highest Poverty Level Among Children Under the Age of 5 in Brooklyn, NY with 52.6%.
What is the Poverty Level Among Children Under the Age of 5 in New York?
Poverty Level Among Children Under the Age of 5 in New York is 18.7%.
What is the Poverty Level Among Children Under the Age of 5 in the United States?
Poverty Level Among Children Under the Age of 5 in the United States is 18.1%.