St Johnsville, NY Map & Demographics
St Johnsville Map
St Johnsville Overview
$23,400
PER CAPITA INCOME
$58,403
AVG FAMILY INCOME
$43,523
AVG HOUSEHOLD INCOME
15.7%
WAGE / INCOME GAP [ % ]
84.3¢/ $1
WAGE / INCOME GAP [ $ ]
$13,166
FAMILY INCOME DEFICIT
0.44
INEQUALITY / GINI INDEX
1,771
TOTAL POPULATION
901
MALE POPULATION
870
FEMALE POPULATION
103.56
MALES / 100 FEMALES
96.56
FEMALES / 100 MALES
36.0
MEDIAN AGE
3.6
AVG FAMILY SIZE
2.6
AVG HOUSEHOLD SIZE
692
LABOR FORCE [ PEOPLE ]
50.7%
PERCENT IN LABOR FORCE
4.5%
UNEMPLOYMENT RATE
St Johnsville Area Codes
Income in St Johnsville
Income Overview in St Johnsville
Per Capita Income in St Johnsville is $23,400, while median incomes of families and households are $58,403 and $43,523 respectively.
| Characteristic | Number | Measure |
| Per Capita Income | 1,771 | $23,400 |
| Median Family Income | 333 | $58,403 |
| Mean Family Income | 333 | $68,854 |
| Median Household Income | 637 | $43,523 |
| Mean Household Income | 637 | $57,436 |
| Income Deficit | 333 | $13,166 |
| Wage / Income Gap (%) | 1,771 | 15.72% |
| Wage / Income Gap ($) | 1,771 | 84.28¢ per $1 |
| Gini / Inequality Index | 1,771 | 0.44 |
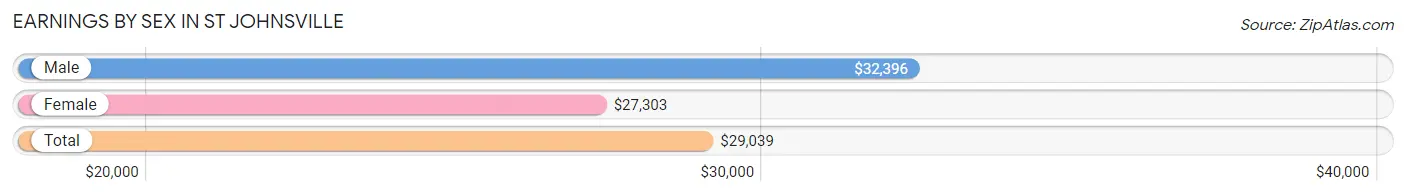
Earnings by Sex in St Johnsville
Average Earnings in St Johnsville are $29,039, $32,396 for men and $27,303 for women, a difference of 15.7%.
| Sex | Number | Average Earnings |
| Male | 404 (56.4%) | $32,396 |
| Female | 313 (43.6%) | $27,303 |
| Total | 717 (100.0%) | $29,039 |
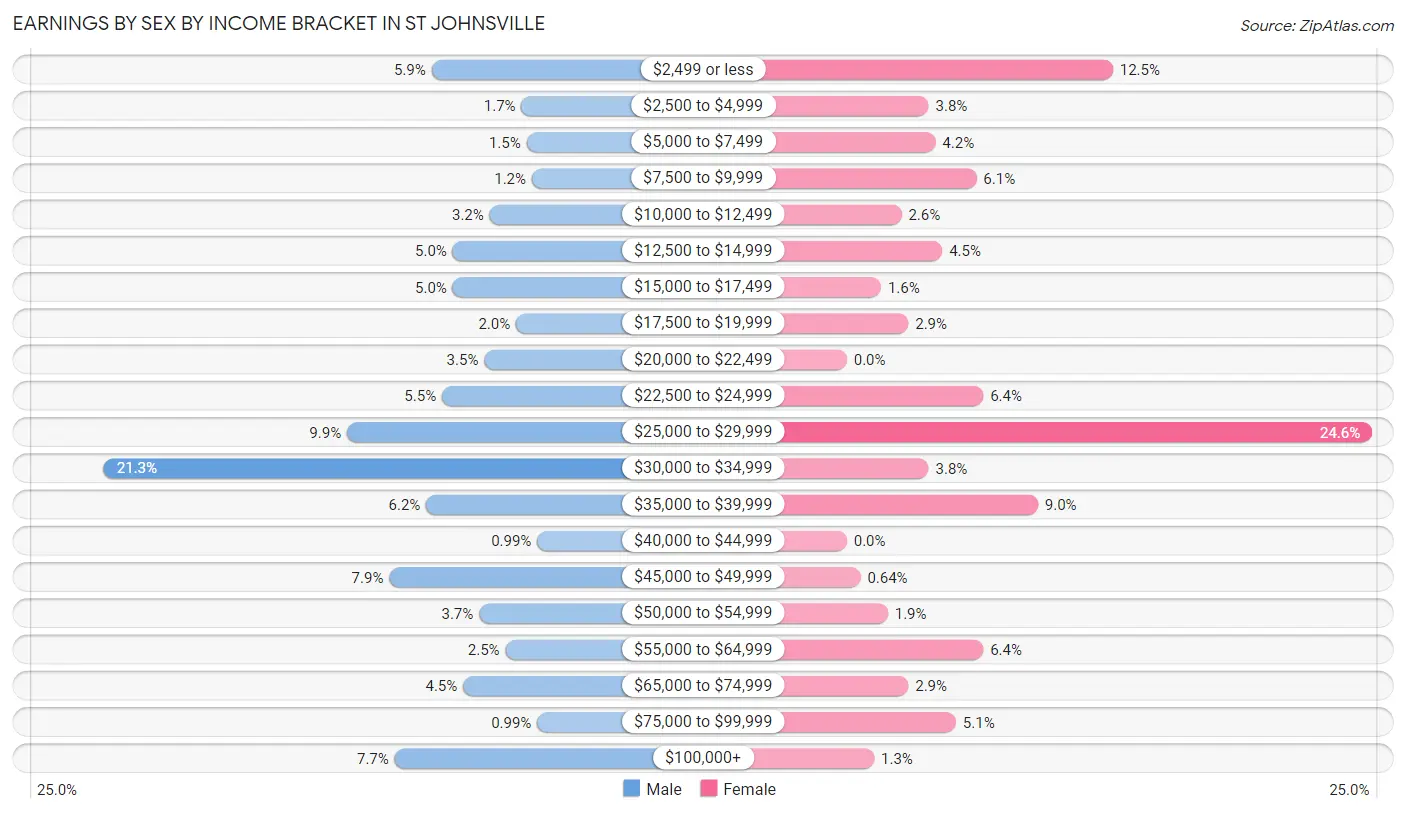
Earnings by Sex by Income Bracket in St Johnsville
The most common earnings brackets in St Johnsville are $30,000 to $34,999 for men (86 | 21.3%) and $25,000 to $29,999 for women (77 | 24.6%).
| Income | Male | Female |
| $2,499 or less | 24 (5.9%) | 39 (12.5%) |
| $2,500 to $4,999 | 7 (1.7%) | 12 (3.8%) |
| $5,000 to $7,499 | 6 (1.5%) | 13 (4.2%) |
| $7,500 to $9,999 | 5 (1.2%) | 19 (6.1%) |
| $10,000 to $12,499 | 13 (3.2%) | 8 (2.6%) |
| $12,500 to $14,999 | 20 (5.0%) | 14 (4.5%) |
| $15,000 to $17,499 | 20 (5.0%) | 5 (1.6%) |
| $17,500 to $19,999 | 8 (2.0%) | 9 (2.9%) |
| $20,000 to $22,499 | 14 (3.5%) | 0 (0.0%) |
| $22,500 to $24,999 | 22 (5.4%) | 20 (6.4%) |
| $25,000 to $29,999 | 40 (9.9%) | 77 (24.6%) |
| $30,000 to $34,999 | 86 (21.3%) | 12 (3.8%) |
| $35,000 to $39,999 | 25 (6.2%) | 28 (8.9%) |
| $40,000 to $44,999 | 4 (1.0%) | 0 (0.0%) |
| $45,000 to $49,999 | 32 (7.9%) | 2 (0.6%) |
| $50,000 to $54,999 | 15 (3.7%) | 6 (1.9%) |
| $55,000 to $64,999 | 10 (2.5%) | 20 (6.4%) |
| $65,000 to $74,999 | 18 (4.5%) | 9 (2.9%) |
| $75,000 to $99,999 | 4 (1.0%) | 16 (5.1%) |
| $100,000+ | 31 (7.7%) | 4 (1.3%) |
| Total | 404 (100.0%) | 313 (100.0%) |
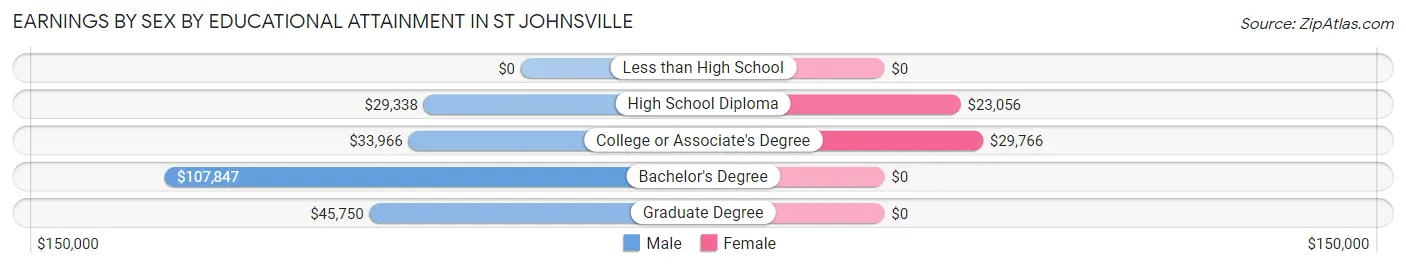
Earnings by Sex by Educational Attainment in St Johnsville
Average earnings in St Johnsville are $33,690 for men and $27,368 for women, a difference of 18.8%. Men with an educational attainment of bachelor's degree enjoy the highest average annual earnings of $107,847, while those with high school diploma education earn the least with $29,338. Women with an educational attainment of college or associate's degree earn the most with the average annual earnings of $29,766, while those with high school diploma education have the smallest earnings of $23,056.
| Educational Attainment | Male Income | Female Income |
| Less than High School | - | - |
| High School Diploma | $29,338 | $23,056 |
| College or Associate's Degree | $33,966 | $29,766 |
| Bachelor's Degree | $107,847 | $0 |
| Graduate Degree | $45,750 | $0 |
| Total | $33,690 | $27,368 |
Family Income in St Johnsville
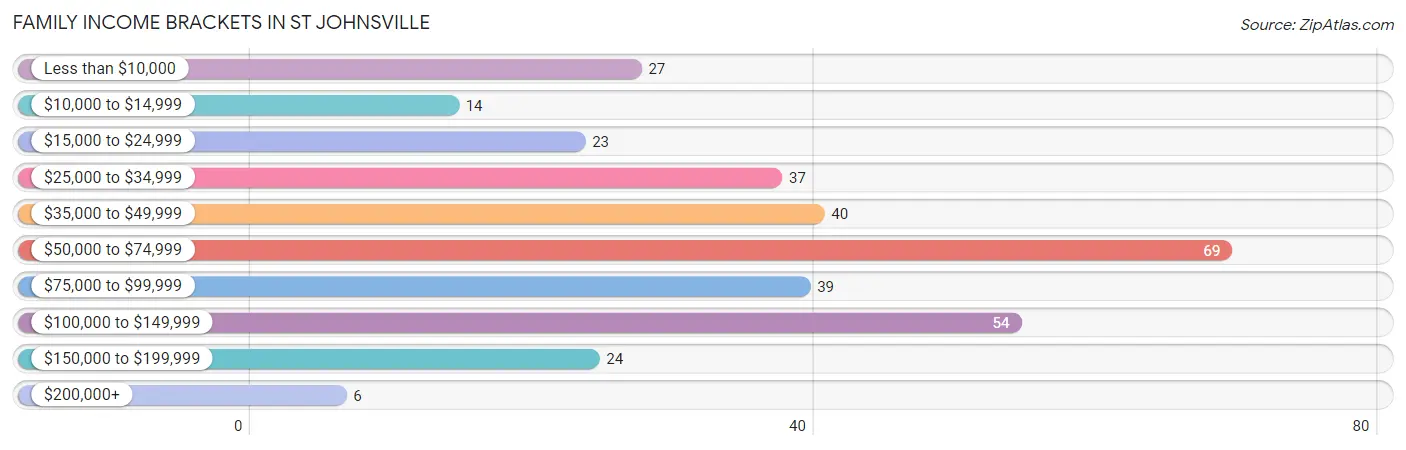
Family Income Brackets in St Johnsville
According to the St Johnsville family income data, there are 69 families falling into the $50,000 to $74,999 income range, which is the most common income bracket and makes up 20.7% of all families. Conversely, the $200,000+ income bracket is the least frequent group with only 6 families (1.8%) belonging to this category.
| Income Bracket | # Families | % Families |
| Less than $10,000 | 27 | 8.1% |
| $10,000 to $14,999 | 14 | 4.2% |
| $15,000 to $24,999 | 23 | 6.9% |
| $25,000 to $34,999 | 37 | 11.1% |
| $35,000 to $49,999 | 40 | 12.0% |
| $50,000 to $74,999 | 69 | 20.7% |
| $75,000 to $99,999 | 39 | 11.7% |
| $100,000 to $149,999 | 54 | 16.2% |
| $150,000 to $199,999 | 24 | 7.2% |
| $200,000+ | 6 | 1.8% |
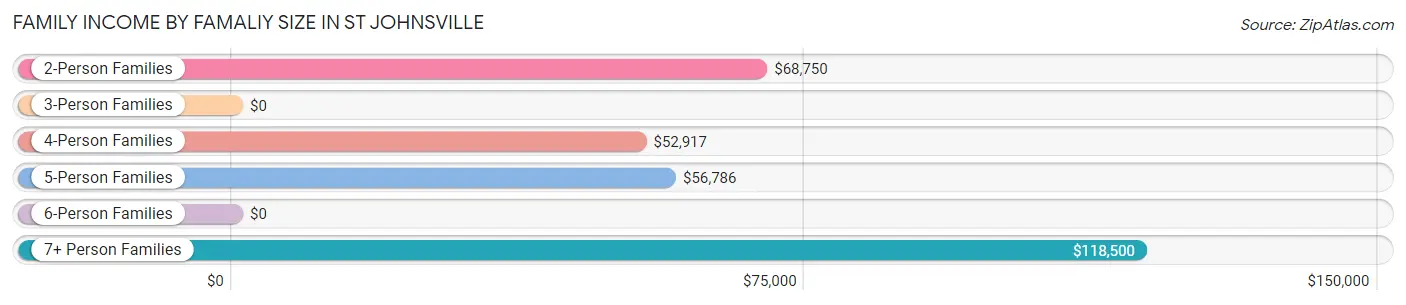
Family Income by Famaliy Size in St Johnsville
7+ person families (12 | 3.6%) account for the highest median family income in St Johnsville with $118,500 per family, while 2-person families (152 | 45.7%) have the highest median income of $34,375 per family member.
| Income Bracket | # Families | Median Income |
| 2-Person Families | 152 (45.7%) | $68,750 |
| 3-Person Families | 69 (20.7%) | $0 |
| 4-Person Families | 75 (22.5%) | $52,917 |
| 5-Person Families | 22 (6.6%) | $56,786 |
| 6-Person Families | 3 (0.9%) | $0 |
| 7+ Person Families | 12 (3.6%) | $118,500 |
| Total | 333 (100.0%) | $58,403 |
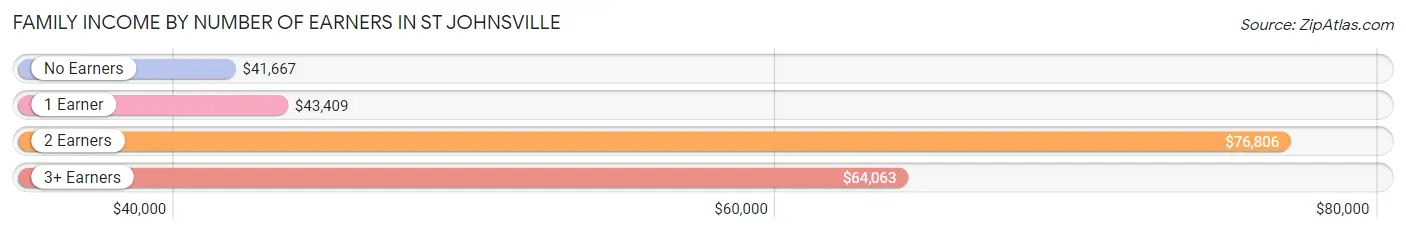
Family Income by Number of Earners in St Johnsville
The median family income in St Johnsville is $58,403, with families comprising 2 earners (92) having the highest median family income of $76,806, while families with no earners (64) have the lowest median family income of $41,667, accounting for 27.6% and 19.2% of families, respectively.
| Number of Earners | # Families | Median Income |
| No Earners | 64 (19.2%) | $41,667 |
| 1 Earner | 144 (43.2%) | $43,409 |
| 2 Earners | 92 (27.6%) | $76,806 |
| 3+ Earners | 33 (9.9%) | $64,063 |
| Total | 333 (100.0%) | $58,403 |
Household Income in St Johnsville
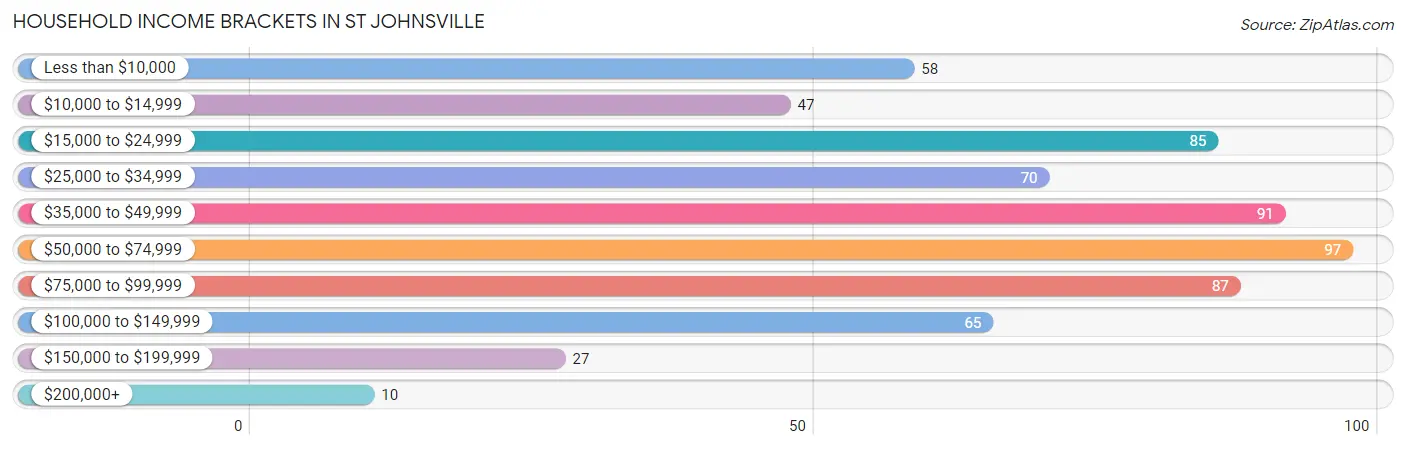
Household Income Brackets in St Johnsville
With 97 households falling in the category, the $50,000 to $74,999 income range is the most frequent in St Johnsville, accounting for 15.2% of all households. In contrast, only 10 households (1.6%) fall into the $200,000+ income bracket, making it the least populous group.
| Income Bracket | # Households | % Households |
| Less than $10,000 | 58 | 9.1% |
| $10,000 to $14,999 | 47 | 7.4% |
| $15,000 to $24,999 | 85 | 13.3% |
| $25,000 to $34,999 | 70 | 11.0% |
| $35,000 to $49,999 | 91 | 14.3% |
| $50,000 to $74,999 | 97 | 15.2% |
| $75,000 to $99,999 | 87 | 13.7% |
| $100,000 to $149,999 | 65 | 10.2% |
| $150,000 to $199,999 | 27 | 4.2% |
| $200,000+ | 10 | 1.6% |
Household Income by Householder Age in St Johnsville
The median household income in St Johnsville is $43,523, with the highest median household income of $56,250 found in the 45 to 64 years age bracket for the primary householder. A total of 208 households (32.7%) fall into this category. Meanwhile, the 15 to 24 years age bracket for the primary householder has the lowest median household income of $34,583, with 29 households (4.5%) in this group.
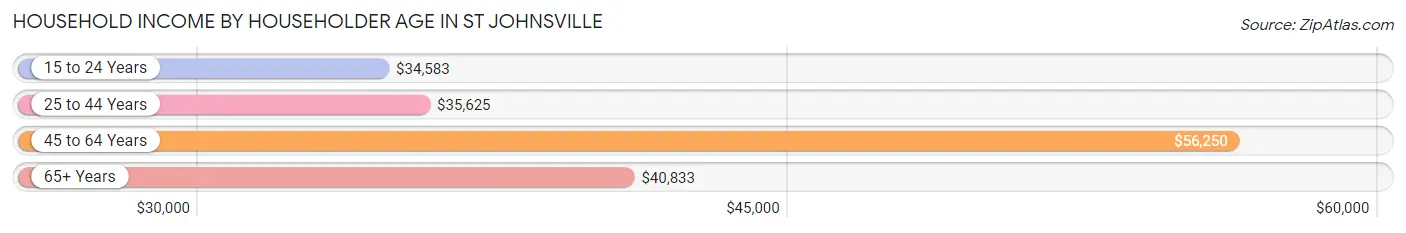
| Income Bracket | # Households | Median Income |
| 15 to 24 Years | 29 (4.5%) | $34,583 |
| 25 to 44 Years | 144 (22.6%) | $35,625 |
| 45 to 64 Years | 208 (32.7%) | $56,250 |
| 65+ Years | 256 (40.2%) | $40,833 |
| Total | 637 (100.0%) | $43,523 |
Poverty in St Johnsville
Income Below Poverty by Sex and Age in St Johnsville
With 24.9% poverty level for males and 29.2% for females among the residents of St Johnsville, 12 to 14 year old males and 5 year old females are the most vulnerable to poverty, with 41 males (75.9%) and 16 females (100.0%) in their respective age groups living below the poverty level.
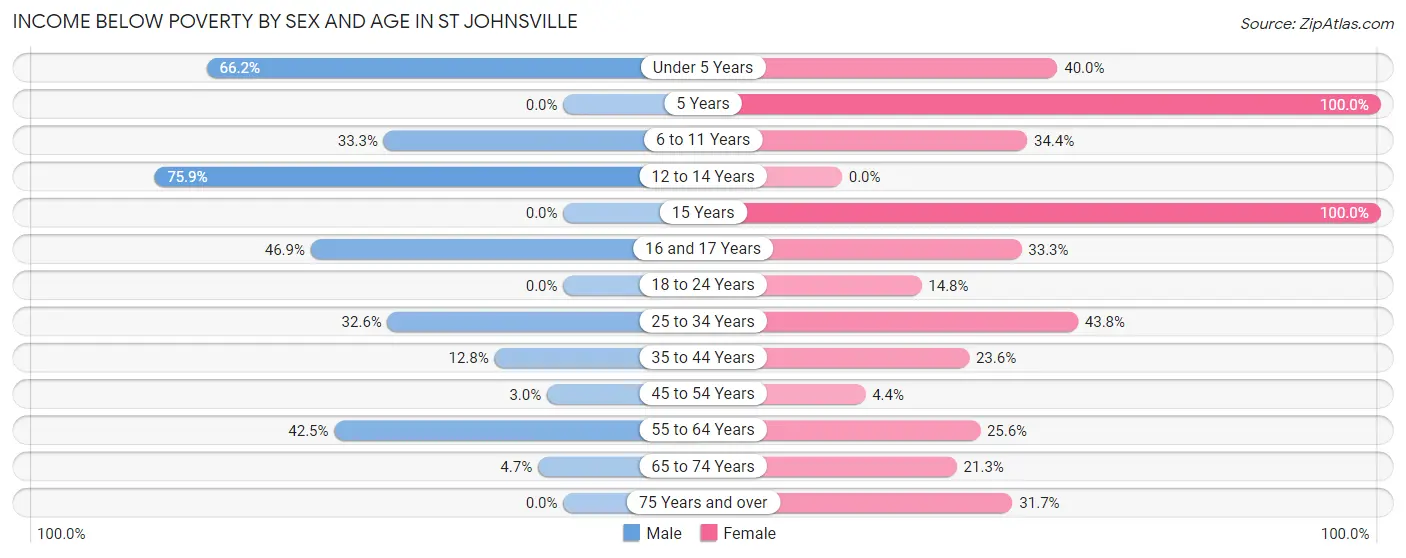
| Age Bracket | Male | Female |
| Under 5 Years | 47 (66.2%) | 40 (40.0%) |
| 5 Years | 0 (0.0%) | 16 (100.0%) |
| 6 to 11 Years | 18 (33.3%) | 22 (34.4%) |
| 12 to 14 Years | 41 (75.9%) | 0 (0.0%) |
| 15 Years | 0 (0.0%) | 18 (100.0%) |
| 16 and 17 Years | 15 (46.9%) | 4 (33.3%) |
| 18 to 24 Years | 0 (0.0%) | 13 (14.8%) |
| 25 to 34 Years | 30 (32.6%) | 39 (43.8%) |
| 35 to 44 Years | 18 (12.8%) | 17 (23.6%) |
| 45 to 54 Years | 3 (3.0%) | 3 (4.3%) |
| 55 to 64 Years | 34 (42.5%) | 20 (25.6%) |
| 65 to 74 Years | 4 (4.7%) | 29 (21.3%) |
| 75 Years and over | 0 (0.0%) | 19 (31.7%) |
| Total | 210 (24.9%) | 240 (29.2%) |
Income Above Poverty by Sex and Age in St Johnsville
According to the poverty statistics in St Johnsville, males aged 5 years and females aged 12 to 14 years are the age groups that are most secure financially, with 100.0% of males and 100.0% of females in these age groups living above the poverty line.
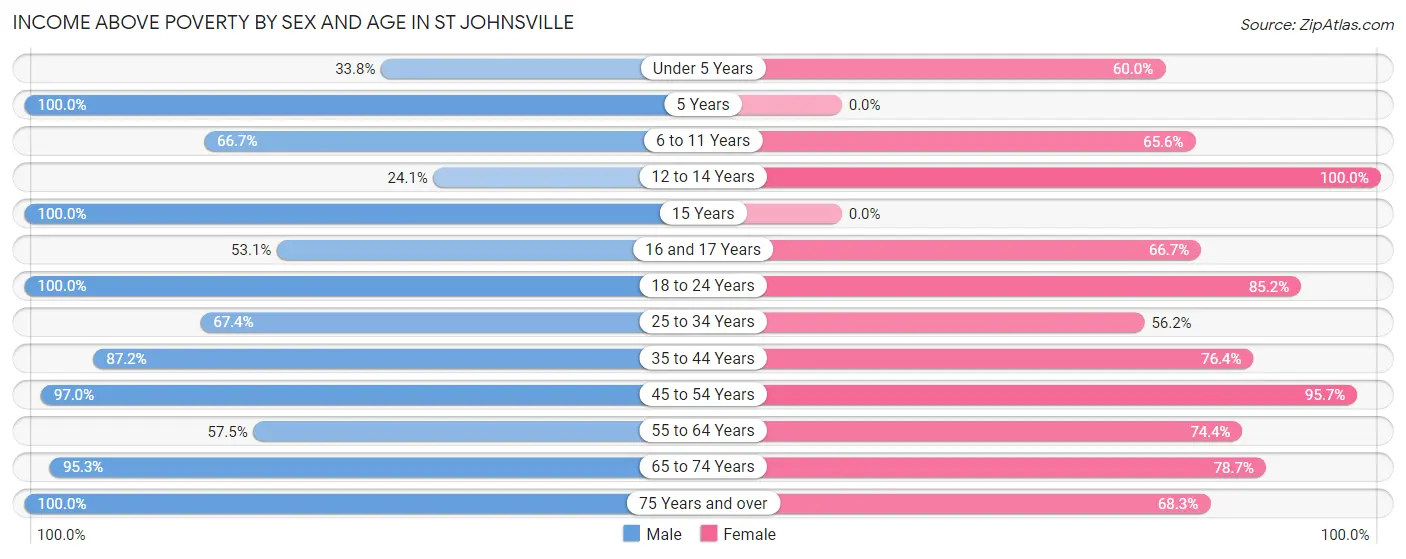
| Age Bracket | Male | Female |
| Under 5 Years | 24 (33.8%) | 60 (60.0%) |
| 5 Years | 8 (100.0%) | 0 (0.0%) |
| 6 to 11 Years | 36 (66.7%) | 42 (65.6%) |
| 12 to 14 Years | 13 (24.1%) | 19 (100.0%) |
| 15 Years | 2 (100.0%) | 0 (0.0%) |
| 16 and 17 Years | 17 (53.1%) | 8 (66.7%) |
| 18 to 24 Years | 82 (100.0%) | 75 (85.2%) |
| 25 to 34 Years | 62 (67.4%) | 50 (56.2%) |
| 35 to 44 Years | 123 (87.2%) | 55 (76.4%) |
| 45 to 54 Years | 96 (97.0%) | 66 (95.7%) |
| 55 to 64 Years | 46 (57.5%) | 58 (74.4%) |
| 65 to 74 Years | 81 (95.3%) | 107 (78.7%) |
| 75 Years and over | 43 (100.0%) | 41 (68.3%) |
| Total | 633 (75.1%) | 581 (70.8%) |
Income Below Poverty Among Married-Couple Families in St Johnsville
The poverty statistics for married-couple families in St Johnsville show that 9.8% or 19 of the total 193 families live below the poverty line. Families with 3 or 4 children have the highest poverty rate of 30.0%, comprising of 3 families. On the other hand, families with 1 or 2 children have the lowest poverty rate of 4.7%, which includes 3 families.
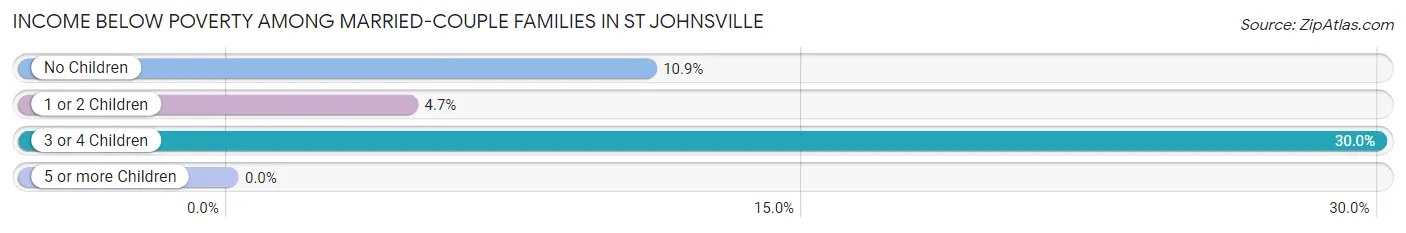
| Children | Above Poverty | Below Poverty |
| No Children | 106 (89.1%) | 13 (10.9%) |
| 1 or 2 Children | 61 (95.3%) | 3 (4.7%) |
| 3 or 4 Children | 7 (70.0%) | 3 (30.0%) |
| 5 or more Children | 0 (0.0%) | 0 (0.0%) |
| Total | 174 (90.2%) | 19 (9.8%) |
Income Below Poverty Among Single-Parent Households in St Johnsville
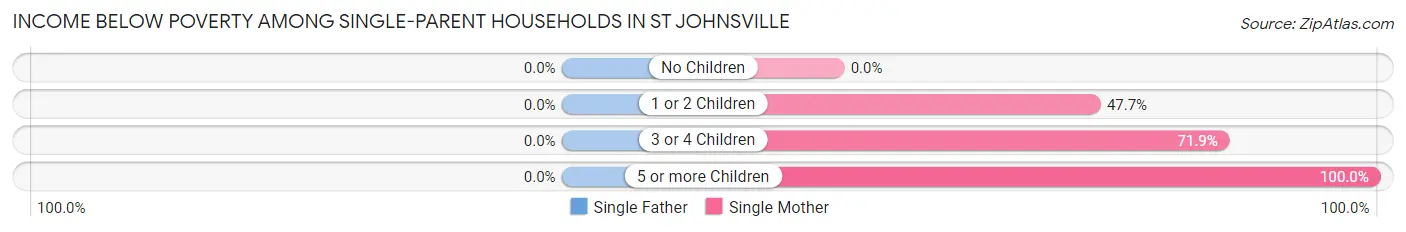
| Children | Single Father | Single Mother |
| No Children | 0 (0.0%) | 0 (0.0%) |
| 1 or 2 Children | 0 (0.0%) | 21 (47.7%) |
| 3 or 4 Children | 0 (0.0%) | 23 (71.9%) |
| 5 or more Children | 0 (0.0%) | 4 (100.0%) |
| Total | 0 (0.0%) | 48 (43.6%) |
Income Below Poverty Among Married-Couple vs Single-Parent Households in St Johnsville
The poverty data for St Johnsville shows that 19 of the married-couple family households (9.8%) and 48 of the single-parent households (34.3%) are living below the poverty level. Within the married-couple family households, those with 3 or 4 children have the highest poverty rate, with 3 households (30.0%) falling below the poverty line. Among the single-parent households, those with 5 or more children have the highest poverty rate, with 4 household (100.0%) living below poverty.
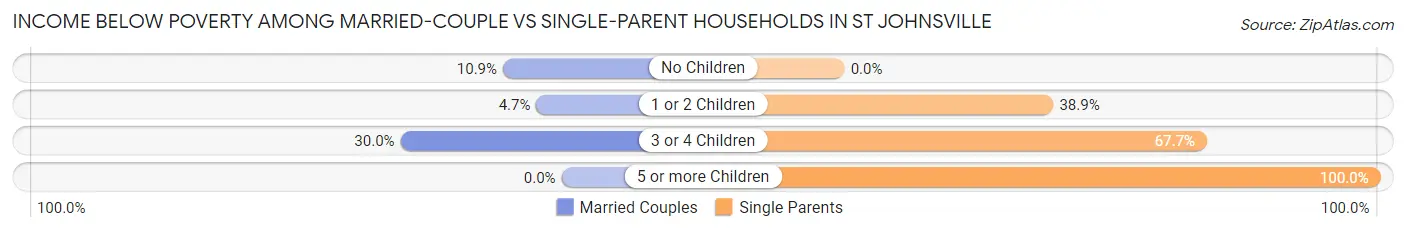
| Children | Married-Couple Families | Single-Parent Households |
| No Children | 13 (10.9%) | 0 (0.0%) |
| 1 or 2 Children | 3 (4.7%) | 21 (38.9%) |
| 3 or 4 Children | 3 (30.0%) | 23 (67.6%) |
| 5 or more Children | 0 (0.0%) | 4 (100.0%) |
| Total | 19 (9.8%) | 48 (34.3%) |
Race in St Johnsville
The most populous races in St Johnsville are White / Caucasian (1,627 | 91.9%), Hispanic or Latino (103 | 5.8%), and Two or more Races (101 | 5.7%).
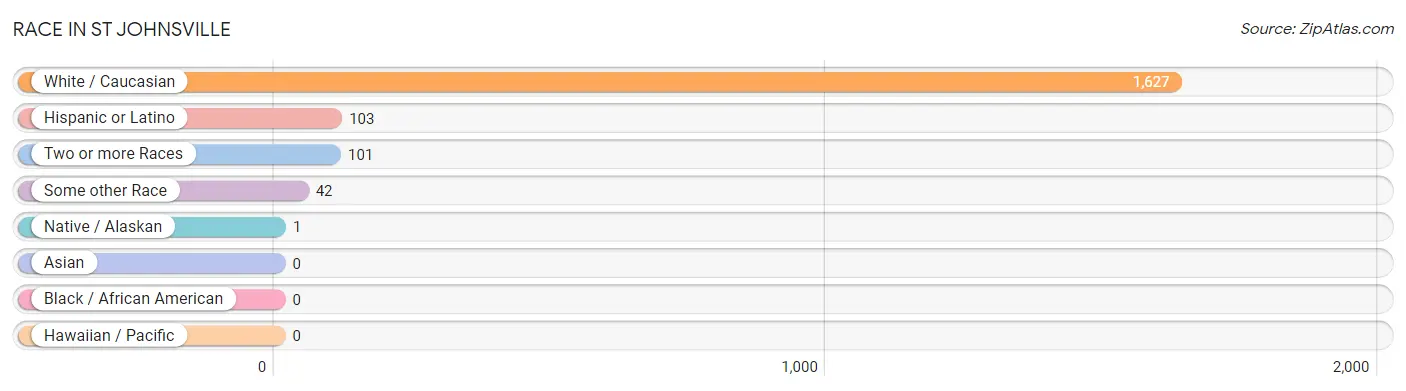
| Race | # Population | % Population |
| Asian | 0 | 0.0% |
| Black / African American | 0 | 0.0% |
| Hawaiian / Pacific | 0 | 0.0% |
| Hispanic or Latino | 103 | 5.8% |
| Native / Alaskan | 1 | 0.1% |
| White / Caucasian | 1,627 | 91.9% |
| Two or more Races | 101 | 5.7% |
| Some other Race | 42 | 2.4% |
| Total | 1,771 | 100.0% |
Ancestry in St Johnsville
The most populous ancestries reported in St Johnsville are German (475 | 26.8%), Irish (255 | 14.4%), Italian (250 | 14.1%), American (185 | 10.4%), and English (167 | 9.4%), together accounting for 75.2% of all St Johnsville residents.
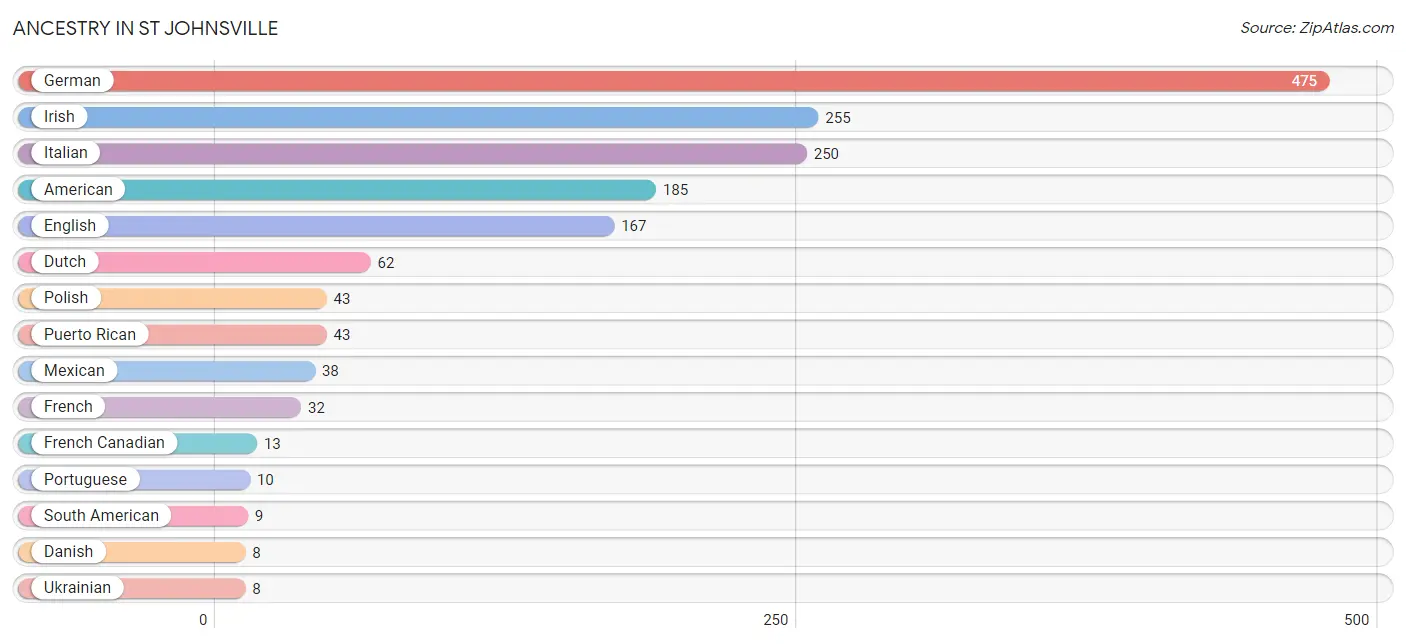
| Ancestry | # Population | % Population |
| American | 185 | 10.4% |
| Argentinean | 4 | 0.2% |
| Bhutanese | 5 | 0.3% |
| British | 4 | 0.2% |
| Colombian | 5 | 0.3% |
| Czech | 3 | 0.2% |
| Danish | 8 | 0.4% |
| Dutch | 62 | 3.5% |
| English | 167 | 9.4% |
| French | 32 | 1.8% |
| French Canadian | 13 | 0.7% |
| German | 475 | 26.8% |
| Hungarian | 5 | 0.3% |
| Irish | 255 | 14.4% |
| Iroquois | 1 | 0.1% |
| Italian | 250 | 14.1% |
| Mexican | 38 | 2.1% |
| Northern European | 4 | 0.2% |
| Polish | 43 | 2.4% |
| Portuguese | 10 | 0.6% |
| Puerto Rican | 43 | 2.4% |
| Russian | 4 | 0.2% |
| Scandinavian | 2 | 0.1% |
| Scotch-Irish | 3 | 0.2% |
| Slovak | 3 | 0.2% |
| South American | 9 | 0.5% |
| Spaniard | 1 | 0.1% |
| Swedish | 7 | 0.4% |
| Ukrainian | 8 | 0.4% |
| Welsh | 3 | 0.2% | View All 30 Rows |
Immigrants in St Johnsville
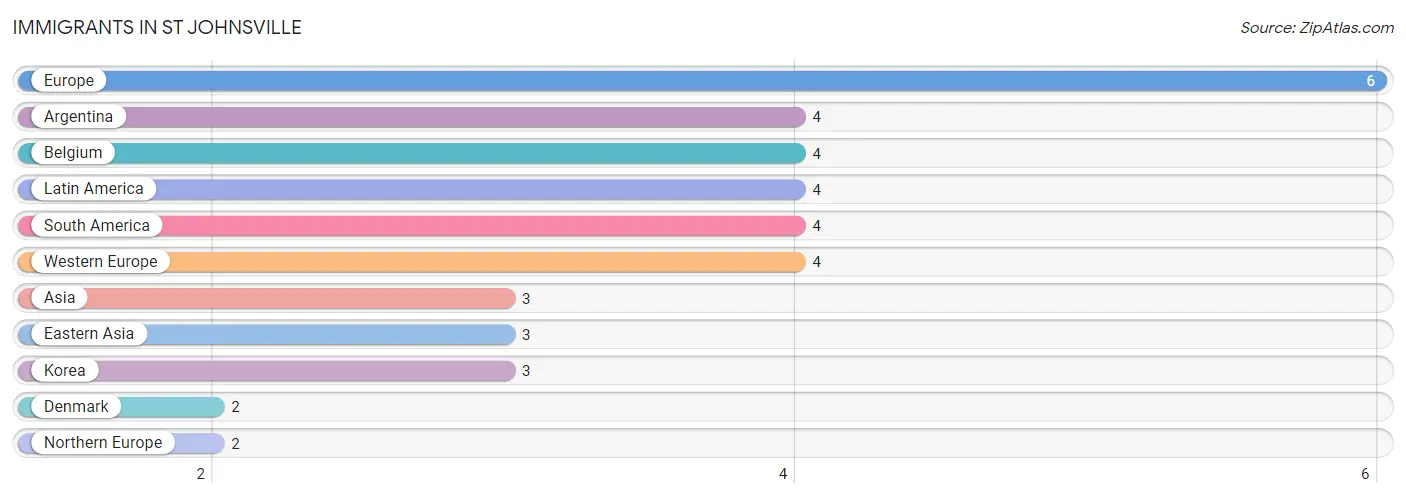
The most numerous immigrant groups reported in St Johnsville came from Europe (6 | 0.3%), Argentina (4 | 0.2%), Belgium (4 | 0.2%), Latin America (4 | 0.2%), and South America (4 | 0.2%), together accounting for 1.3% of all St Johnsville residents.
| Immigration Origin | # Population | % Population |
| Argentina | 4 | 0.2% |
| Asia | 3 | 0.2% |
| Belgium | 4 | 0.2% |
| Denmark | 2 | 0.1% |
| Eastern Asia | 3 | 0.2% |
| Europe | 6 | 0.3% |
| Korea | 3 | 0.2% |
| Latin America | 4 | 0.2% |
| Northern Europe | 2 | 0.1% |
| South America | 4 | 0.2% |
| Western Europe | 4 | 0.2% | View All 11 Rows |
Sex and Age in St Johnsville
Sex and Age in St Johnsville
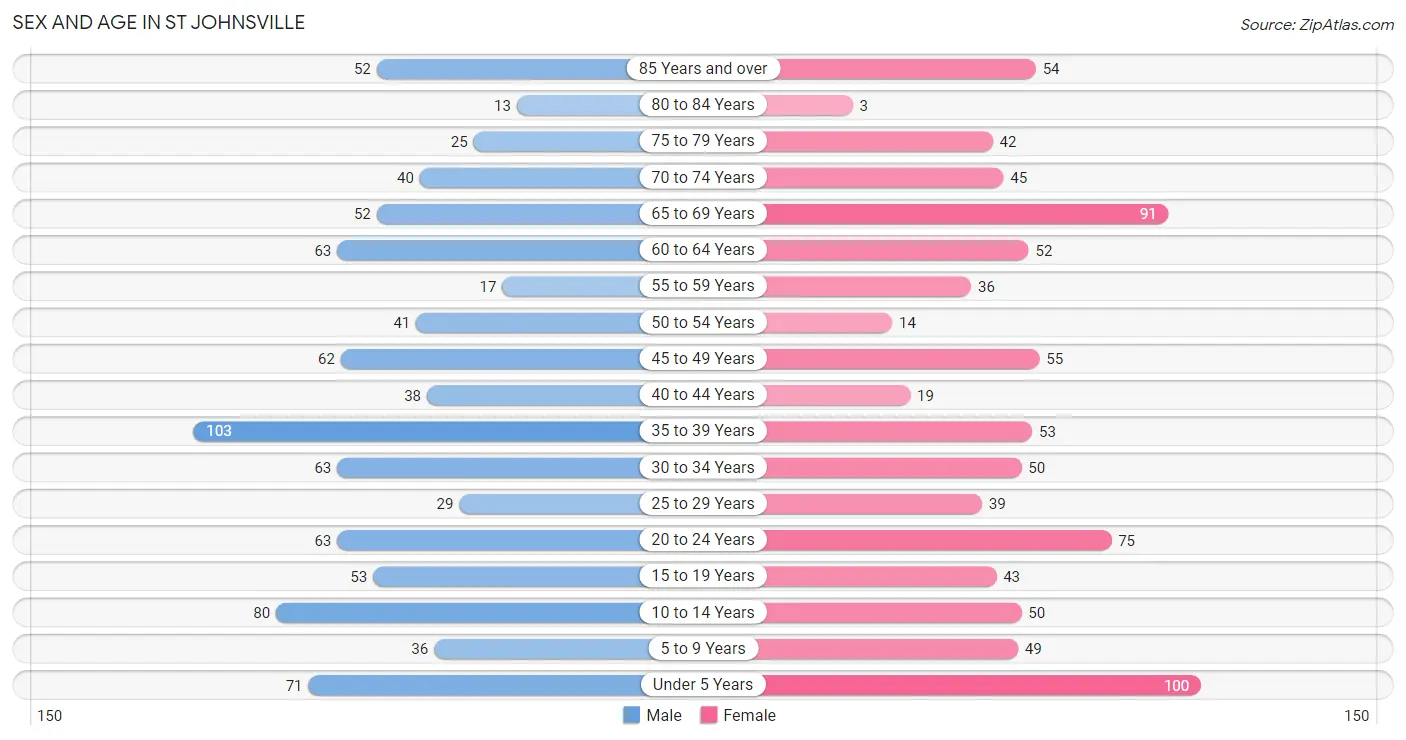
The most populous age groups in St Johnsville are 35 to 39 Years (103 | 11.4%) for men and Under 5 Years (100 | 11.5%) for women.
| Age Bracket | Male | Female |
| Under 5 Years | 71 (7.9%) | 100 (11.5%) |
| 5 to 9 Years | 36 (4.0%) | 49 (5.6%) |
| 10 to 14 Years | 80 (8.9%) | 50 (5.8%) |
| 15 to 19 Years | 53 (5.9%) | 43 (4.9%) |
| 20 to 24 Years | 63 (7.0%) | 75 (8.6%) |
| 25 to 29 Years | 29 (3.2%) | 39 (4.5%) |
| 30 to 34 Years | 63 (7.0%) | 50 (5.8%) |
| 35 to 39 Years | 103 (11.4%) | 53 (6.1%) |
| 40 to 44 Years | 38 (4.2%) | 19 (2.2%) |
| 45 to 49 Years | 62 (6.9%) | 55 (6.3%) |
| 50 to 54 Years | 41 (4.5%) | 14 (1.6%) |
| 55 to 59 Years | 17 (1.9%) | 36 (4.1%) |
| 60 to 64 Years | 63 (7.0%) | 52 (6.0%) |
| 65 to 69 Years | 52 (5.8%) | 91 (10.5%) |
| 70 to 74 Years | 40 (4.4%) | 45 (5.2%) |
| 75 to 79 Years | 25 (2.8%) | 42 (4.8%) |
| 80 to 84 Years | 13 (1.4%) | 3 (0.3%) |
| 85 Years and over | 52 (5.8%) | 54 (6.2%) |
| Total | 901 (100.0%) | 870 (100.0%) |
Families and Households in St Johnsville
Median Family Size in St Johnsville
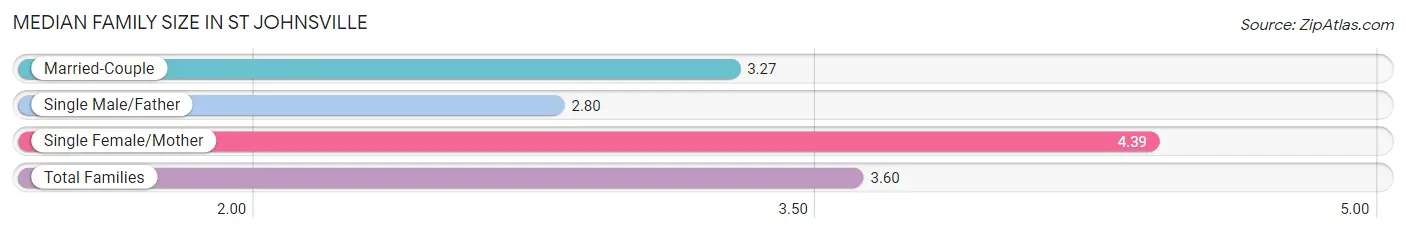
The median family size in St Johnsville is 3.60 persons per family, with single female/mother families (110 | 33.0%) accounting for the largest median family size of 4.39 persons per family. On the other hand, single male/father families (30 | 9.0%) represent the smallest median family size with 2.80 persons per family.
| Family Type | # Families | Family Size |
| Married-Couple | 193 (58.0%) | 3.27 |
| Single Male/Father | 30 (9.0%) | 2.80 |
| Single Female/Mother | 110 (33.0%) | 4.39 |
| Total Families | 333 (100.0%) | 3.60 |
Median Household Size in St Johnsville
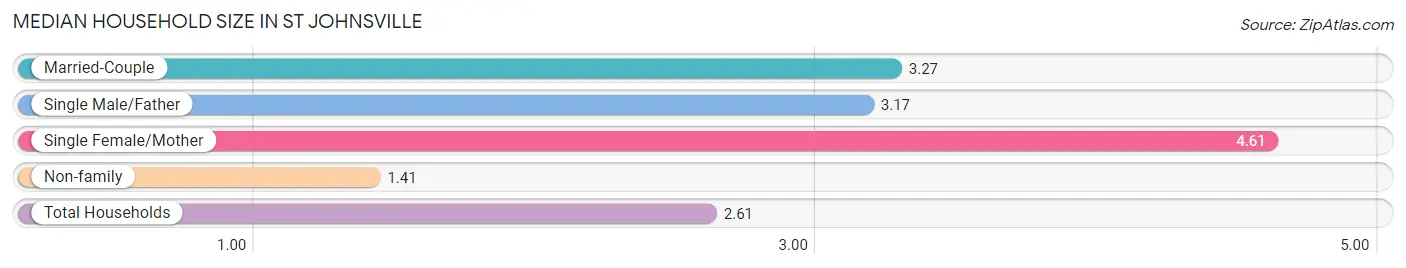
The median household size in St Johnsville is 2.61 persons per household, with single female/mother households (110 | 17.3%) accounting for the largest median household size of 4.61 persons per household. non-family households (304 | 47.7%) represent the smallest median household size with 1.41 persons per household.
| Household Type | # Households | Household Size |
| Married-Couple | 193 (30.3%) | 3.27 |
| Single Male/Father | 30 (4.7%) | 3.17 |
| Single Female/Mother | 110 (17.3%) | 4.61 |
| Non-family | 304 (47.7%) | 1.41 |
| Total Households | 637 (100.0%) | 2.61 |
Household Size by Marriage Status in St Johnsville
Out of a total of 637 households in St Johnsville, 333 (52.3%) are family households, while 304 (47.7%) are nonfamily households. The most numerous type of family households are 2-person households, comprising 148, and the most common type of nonfamily households are 1-person households, comprising 226.
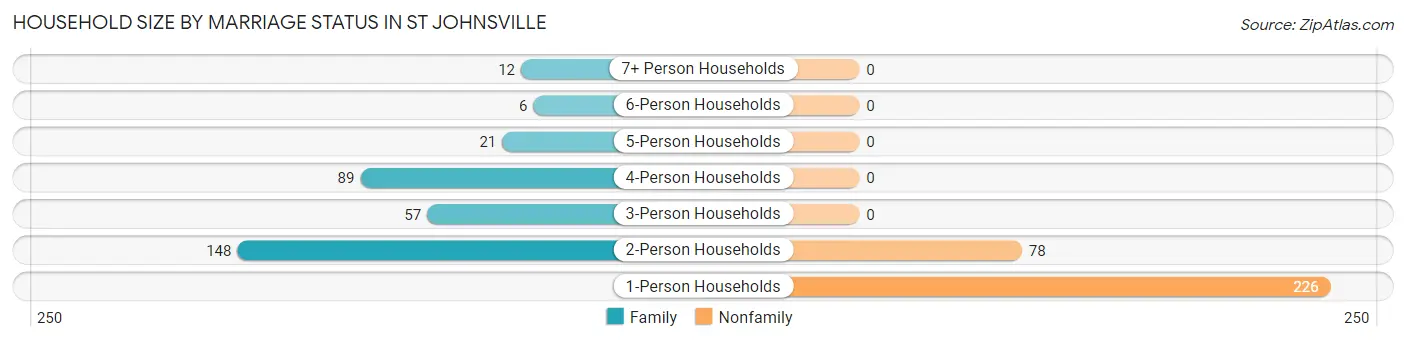
| Household Size | Family Households | Nonfamily Households |
| 1-Person Households | - | 226 (35.5%) |
| 2-Person Households | 148 (23.2%) | 78 (12.2%) |
| 3-Person Households | 57 (8.9%) | 0 (0.0%) |
| 4-Person Households | 89 (14.0%) | 0 (0.0%) |
| 5-Person Households | 21 (3.3%) | 0 (0.0%) |
| 6-Person Households | 6 (0.9%) | 0 (0.0%) |
| 7+ Person Households | 12 (1.9%) | 0 (0.0%) |
| Total | 333 (52.3%) | 304 (47.7%) |
Female Fertility in St Johnsville
Fertility by Age in St Johnsville
Average fertility rate in St Johnsville is 68.0 births per 1,000 women. Women in the age bracket of 20 to 34 years have the highest fertility rate with 79.0 births per 1,000 women. Women in the age bracket of 20 to 34 years acount for 56.5% of all women with births.
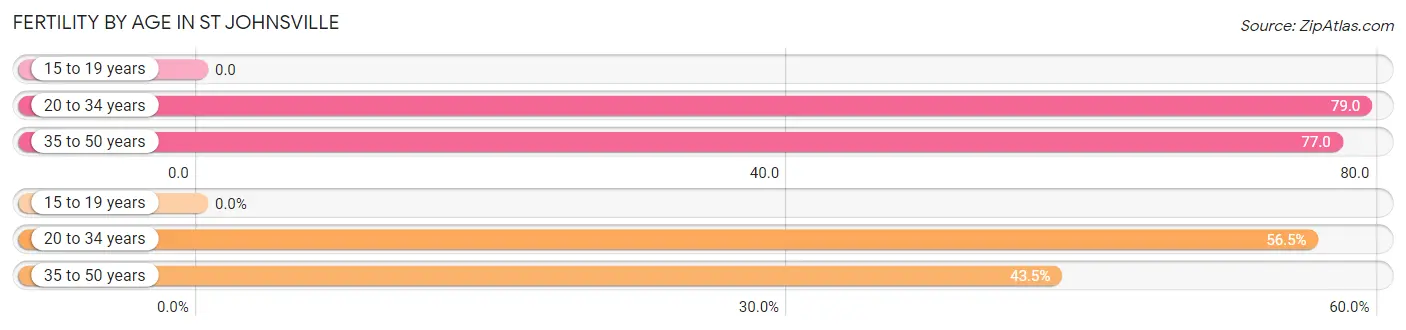
| Age Bracket | Women with Births | Births / 1,000 Women |
| 15 to 19 years | 0 (0.0%) | 0.0 |
| 20 to 34 years | 13 (56.5%) | 79.0 |
| 35 to 50 years | 10 (43.5%) | 77.0 |
| Total | 23 (100.0%) | 68.0 |
Fertility by Age by Marriage Status in St Johnsville
21.7% of women with births (23) in St Johnsville are married. The highest percentage of unmarried women with births falls into 35 to 50 years age bracket with 100.0% of them unmarried at the time of birth, while the lowest percentage of unmarried women with births belong to 20 to 34 years age bracket with 61.5% of them unmarried.
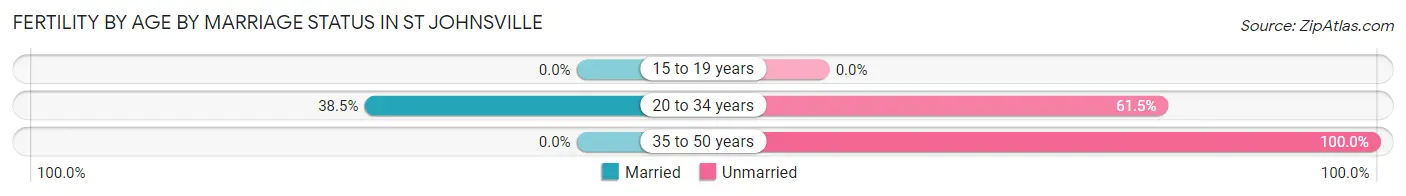
| Age Bracket | Married | Unmarried |
| 15 to 19 years | 0 (0.0%) | 0 (0.0%) |
| 20 to 34 years | 5 (38.5%) | 8 (61.5%) |
| 35 to 50 years | 0 (0.0%) | 10 (100.0%) |
| Total | 5 (21.7%) | 18 (78.3%) |
Fertility by Education in St Johnsville
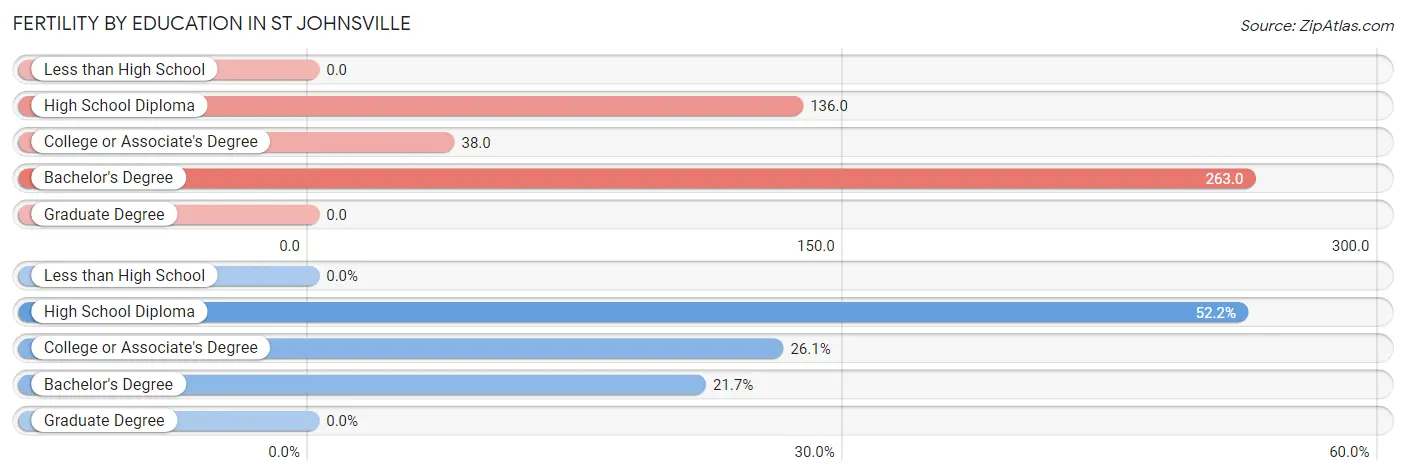
| Educational Attainment | Women with Births | Births / 1,000 Women |
| Less than High School | 0 (0.0%) | 0.0 |
| High School Diploma | 12 (52.2%) | 136.0 |
| College or Associate's Degree | 6 (26.1%) | 38.0 |
| Bachelor's Degree | 5 (21.7%) | 263.0 |
| Graduate Degree | 0 (0.0%) | 0.0 |
| Total | 23 (100.0%) | 68.0 |
Fertility by Education by Marriage Status in St Johnsville
78.3% of women with births in St Johnsville are unmarried. Women with the educational attainment of bachelor's degree are most likely to be married with 100.0% of them married at childbirth, while women with the educational attainment of high school diploma are least likely to be married with 100.0% of them unmarried at childbirth.
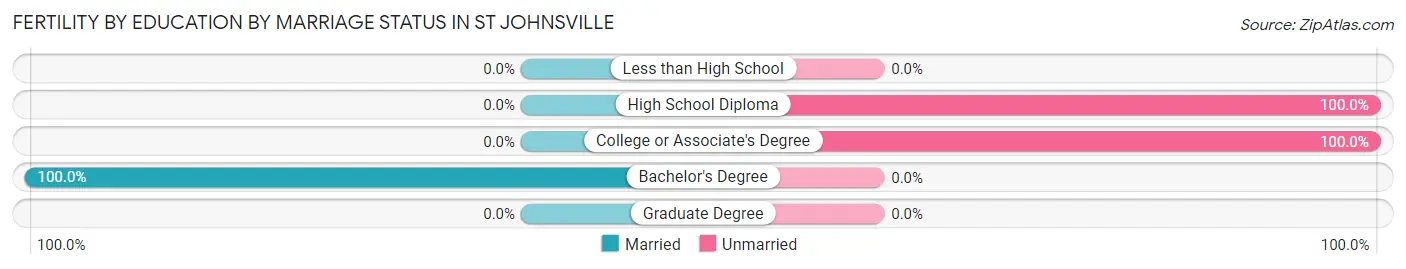
| Educational Attainment | Married | Unmarried |
| Less than High School | 0 (0.0%) | 0 (0.0%) |
| High School Diploma | 0 (0.0%) | 12 (100.0%) |
| College or Associate's Degree | 0 (0.0%) | 6 (100.0%) |
| Bachelor's Degree | 5 (100.0%) | 0 (0.0%) |
| Graduate Degree | 0 (0.0%) | 0 (0.0%) |
| Total | 5 (21.7%) | 18 (78.3%) |
Employment Characteristics in St Johnsville
Employment by Class of Employer in St Johnsville
Among the 646 employed individuals in St Johnsville, private company employees (360 | 55.7%), not-for-profit organizations (87 | 13.5%), and local government employees (69 | 10.7%) make up the most common classes of employment.
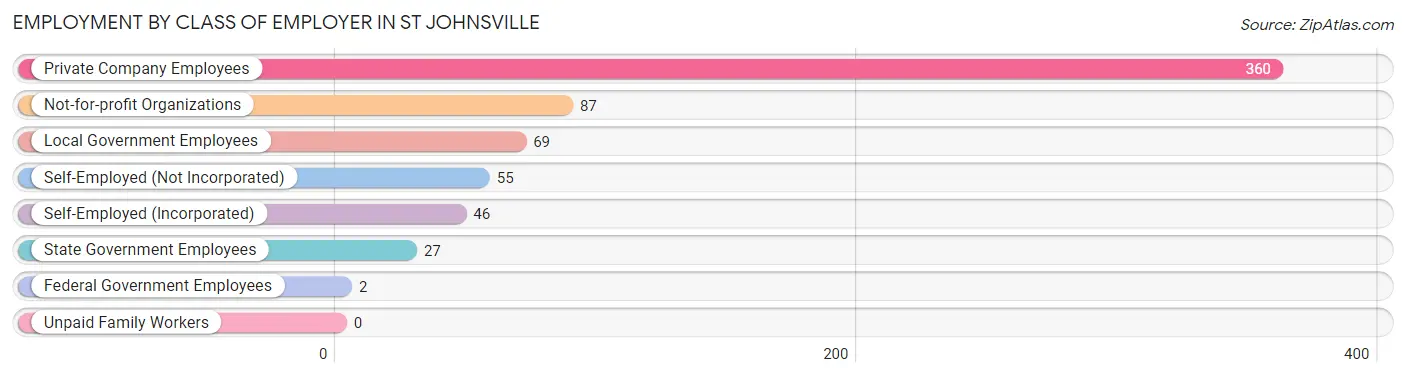
| Employer Class | # Employees | % Employees |
| Private Company Employees | 360 | 55.7% |
| Self-Employed (Incorporated) | 46 | 7.1% |
| Self-Employed (Not Incorporated) | 55 | 8.5% |
| Not-for-profit Organizations | 87 | 13.5% |
| Local Government Employees | 69 | 10.7% |
| State Government Employees | 27 | 4.2% |
| Federal Government Employees | 2 | 0.3% |
| Unpaid Family Workers | 0 | 0.0% |
| Total | 646 | 100.0% |
Employment Status by Age in St Johnsville
According to the labor force statistics for St Johnsville, out of the total population over 16 years of age (1,365), 50.7% or 692 individuals are in the labor force, with 4.5% or 31 of them unemployed. The age group with the highest labor force participation rate is 55 to 59 years, with 84.9% or 45 individuals in the labor force. Within the labor force, the 16 to 19 years age range has the highest percentage of unemployed individuals, with 28.9% or 11 of them being unemployed.
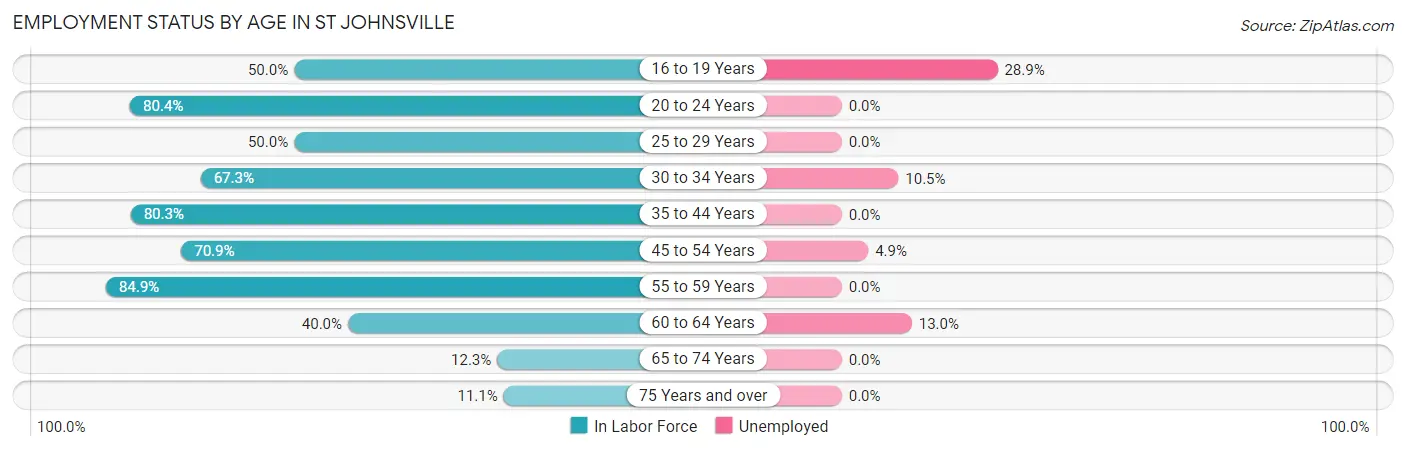
| Age Bracket | In Labor Force | Unemployed |
| 16 to 19 Years | 38 (50.0%) | 11 (28.9%) |
| 20 to 24 Years | 111 (80.4%) | 0 (0.0%) |
| 25 to 29 Years | 34 (50.0%) | 0 (0.0%) |
| 30 to 34 Years | 76 (67.3%) | 8 (10.5%) |
| 35 to 44 Years | 171 (80.3%) | 0 (0.0%) |
| 45 to 54 Years | 122 (70.9%) | 6 (4.9%) |
| 55 to 59 Years | 45 (84.9%) | 0 (0.0%) |
| 60 to 64 Years | 46 (40.0%) | 6 (13.0%) |
| 65 to 74 Years | 28 (12.3%) | 0 (0.0%) |
| 75 Years and over | 21 (11.1%) | 0 (0.0%) |
| Total | 692 (50.7%) | 31 (4.5%) |
Employment Status by Educational Attainment in St Johnsville
According to labor force statistics for St Johnsville, 67.3% of individuals (494) out of the total population between 25 and 64 years of age (734) are in the labor force, with 4.0% or 20 of them being unemployed. The group with the highest labor force participation rate are those with the educational attainment of bachelor's degree or higher, with 82.9% or 63 individuals in the labor force. Within the labor force, individuals with less than high school education have the highest percentage of unemployment, with 36.4% or 8 of them being unemployed.
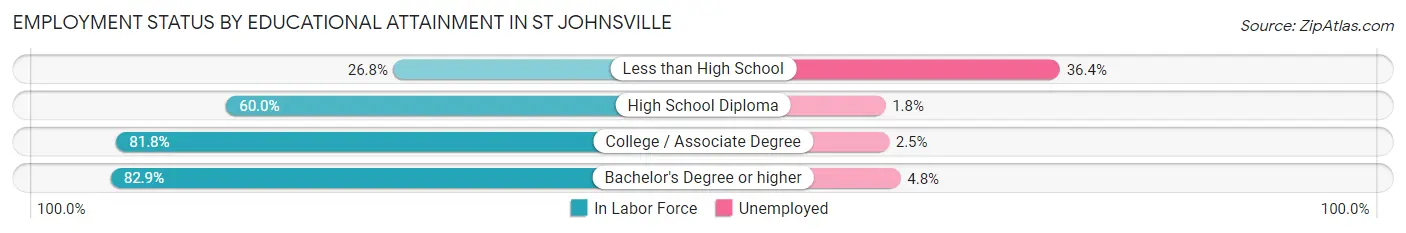
| Educational Attainment | In Labor Force | Unemployed |
| Less than High School | 22 (26.8%) | 30 (36.4%) |
| High School Diploma | 171 (60.0%) | 5 (1.8%) |
| College / Associate Degree | 238 (81.8%) | 7 (2.5%) |
| Bachelor's Degree or higher | 63 (82.9%) | 4 (4.8%) |
| Total | 494 (67.3%) | 29 (4.0%) |
Employment Occupations by Sex in St Johnsville
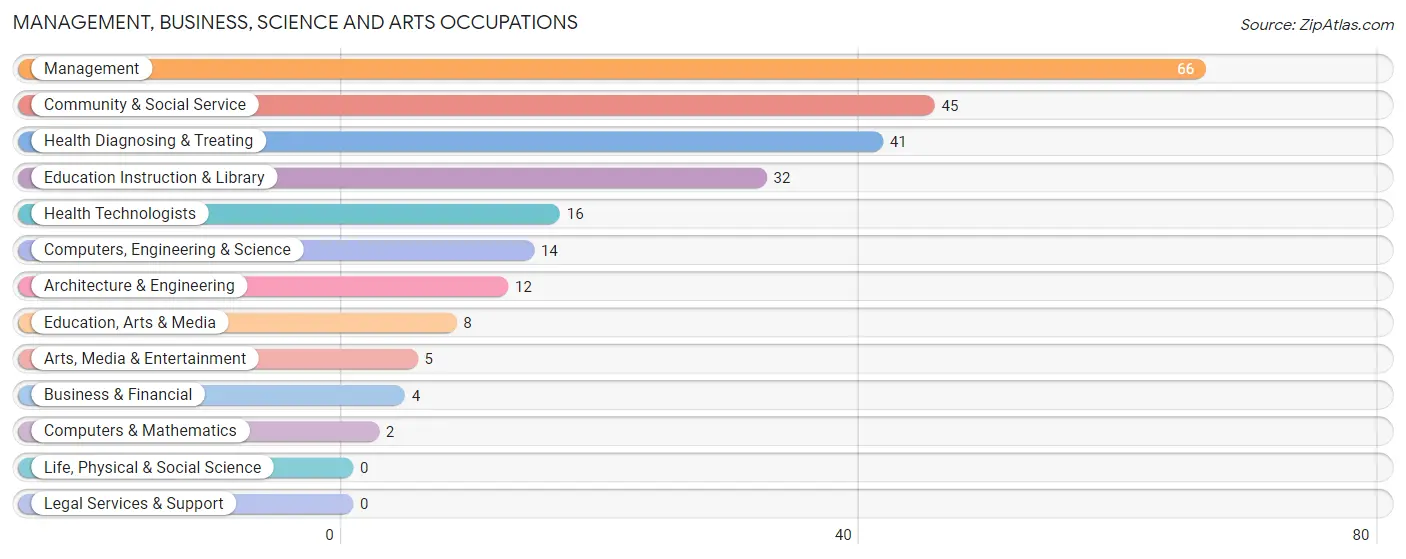
Management, Business, Science and Arts Occupations
The most common Management, Business, Science and Arts occupations in St Johnsville are Management (66 | 10.0%), Community & Social Service (45 | 6.8%), Health Diagnosing & Treating (41 | 6.2%), Education Instruction & Library (32 | 4.8%), and Health Technologists (16 | 2.4%).
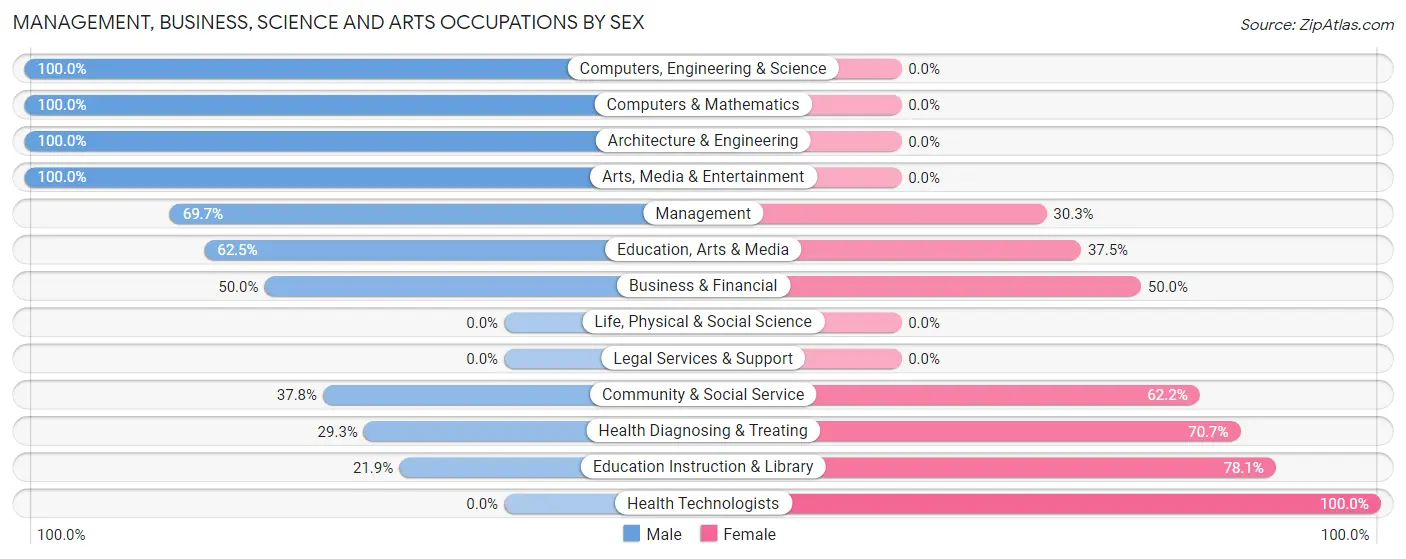
Management, Business, Science and Arts Occupations by Sex
Within the Management, Business, Science and Arts occupations in St Johnsville, the most male-oriented occupations are Computers, Engineering & Science (100.0%), Computers & Mathematics (100.0%), and Architecture & Engineering (100.0%), while the most female-oriented occupations are Health Technologists (100.0%), Education Instruction & Library (78.1%), and Health Diagnosing & Treating (70.7%).
| Occupation | Male | Female |
| Management | 46 (69.7%) | 20 (30.3%) |
| Business & Financial | 2 (50.0%) | 2 (50.0%) |
| Computers, Engineering & Science | 14 (100.0%) | 0 (0.0%) |
| Computers & Mathematics | 2 (100.0%) | 0 (0.0%) |
| Architecture & Engineering | 12 (100.0%) | 0 (0.0%) |
| Life, Physical & Social Science | 0 (0.0%) | 0 (0.0%) |
| Community & Social Service | 17 (37.8%) | 28 (62.2%) |
| Education, Arts & Media | 5 (62.5%) | 3 (37.5%) |
| Legal Services & Support | 0 (0.0%) | 0 (0.0%) |
| Education Instruction & Library | 7 (21.9%) | 25 (78.1%) |
| Arts, Media & Entertainment | 5 (100.0%) | 0 (0.0%) |
| Health Diagnosing & Treating | 12 (29.3%) | 29 (70.7%) |
| Health Technologists | 0 (0.0%) | 16 (100.0%) |
| Total (Category) | 91 (53.5%) | 79 (46.5%) |
| Total (Overall) | 380 (57.5%) | 281 (42.5%) |
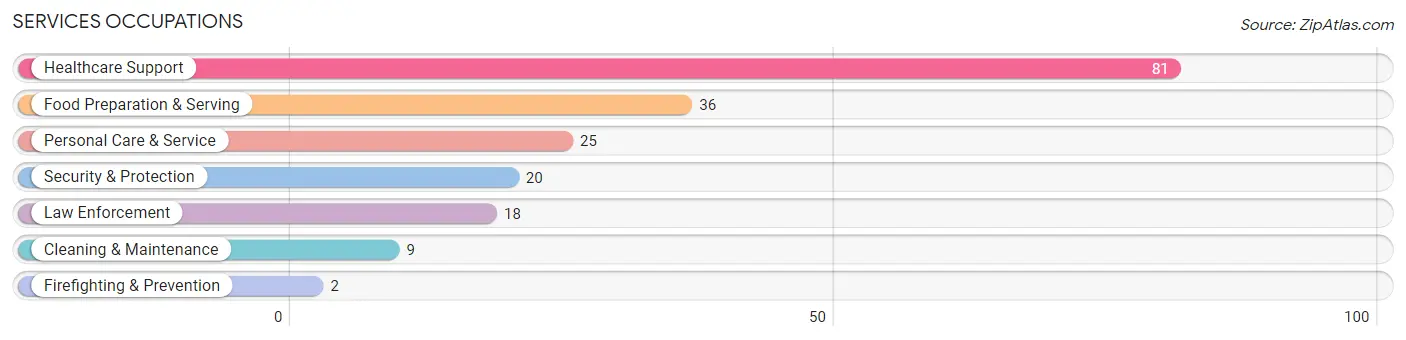
Services Occupations
The most common Services occupations in St Johnsville are Healthcare Support (81 | 12.2%), Food Preparation & Serving (36 | 5.4%), Personal Care & Service (25 | 3.8%), Security & Protection (20 | 3.0%), and Law Enforcement (18 | 2.7%).
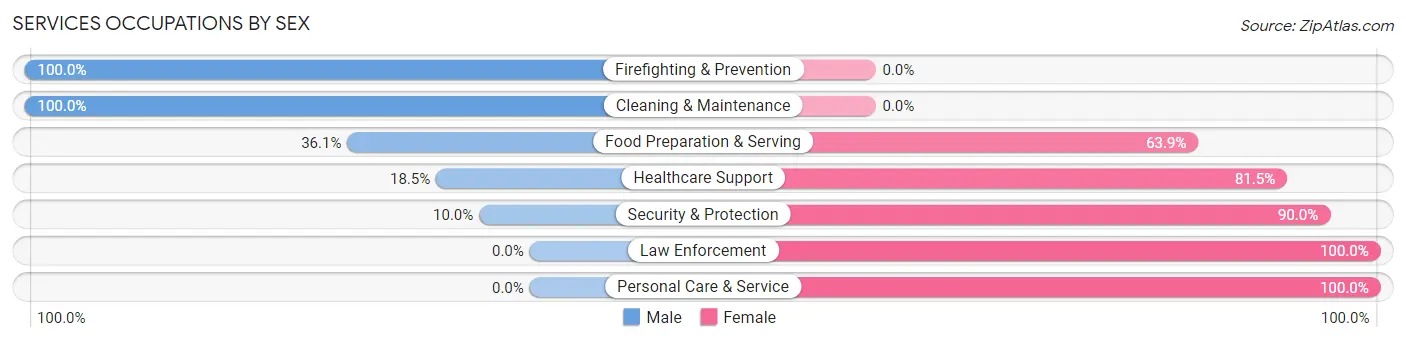
Services Occupations by Sex
Within the Services occupations in St Johnsville, the most male-oriented occupations are Firefighting & Prevention (100.0%), Cleaning & Maintenance (100.0%), and Food Preparation & Serving (36.1%), while the most female-oriented occupations are Law Enforcement (100.0%), Personal Care & Service (100.0%), and Security & Protection (90.0%).
| Occupation | Male | Female |
| Healthcare Support | 15 (18.5%) | 66 (81.5%) |
| Security & Protection | 2 (10.0%) | 18 (90.0%) |
| Firefighting & Prevention | 2 (100.0%) | 0 (0.0%) |
| Law Enforcement | 0 (0.0%) | 18 (100.0%) |
| Food Preparation & Serving | 13 (36.1%) | 23 (63.9%) |
| Cleaning & Maintenance | 9 (100.0%) | 0 (0.0%) |
| Personal Care & Service | 0 (0.0%) | 25 (100.0%) |
| Total (Category) | 39 (22.8%) | 132 (77.2%) |
| Total (Overall) | 380 (57.5%) | 281 (42.5%) |
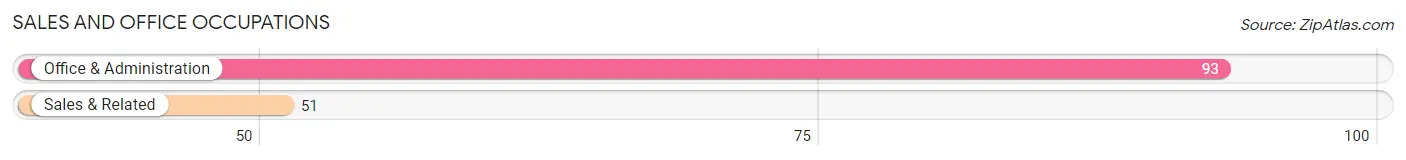
Sales and Office Occupations
The most common Sales and Office occupations in St Johnsville are Office & Administration (93 | 14.1%), and Sales & Related (51 | 7.7%).
Sales and Office Occupations by Sex
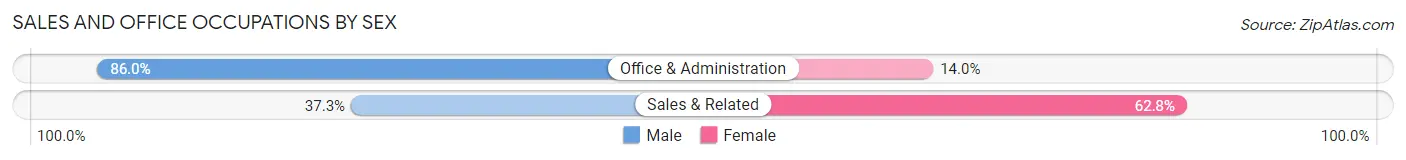
| Occupation | Male | Female |
| Sales & Related | 19 (37.2%) | 32 (62.7%) |
| Office & Administration | 80 (86.0%) | 13 (14.0%) |
| Total (Category) | 99 (68.8%) | 45 (31.2%) |
| Total (Overall) | 380 (57.5%) | 281 (42.5%) |
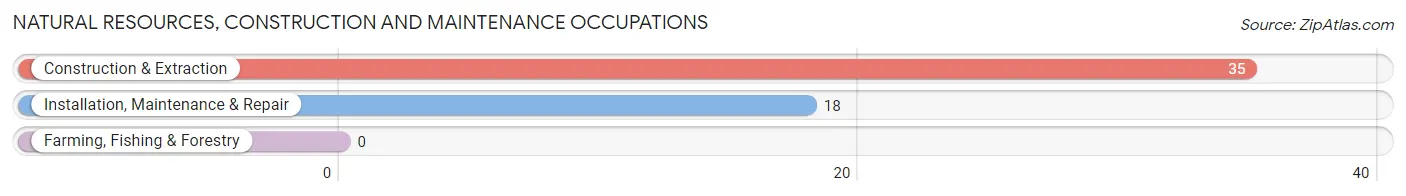
Natural Resources, Construction and Maintenance Occupations
The most common Natural Resources, Construction and Maintenance occupations in St Johnsville are Construction & Extraction (35 | 5.3%), and Installation, Maintenance & Repair (18 | 2.7%).
Natural Resources, Construction and Maintenance Occupations by Sex
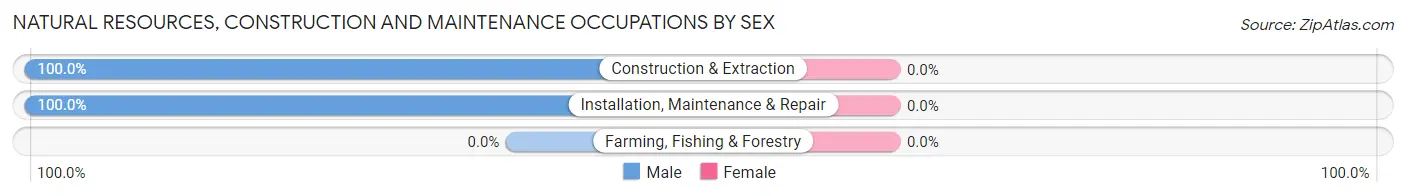
| Occupation | Male | Female |
| Farming, Fishing & Forestry | 0 (0.0%) | 0 (0.0%) |
| Construction & Extraction | 35 (100.0%) | 0 (0.0%) |
| Installation, Maintenance & Repair | 18 (100.0%) | 0 (0.0%) |
| Total (Category) | 53 (100.0%) | 0 (0.0%) |
| Total (Overall) | 380 (57.5%) | 281 (42.5%) |
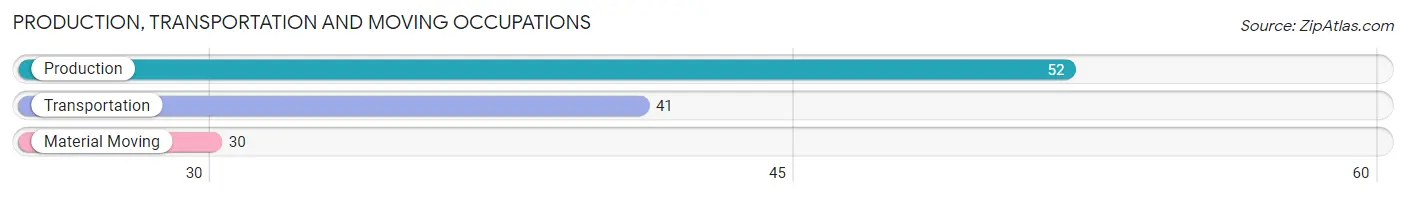
Production, Transportation and Moving Occupations
The most common Production, Transportation and Moving occupations in St Johnsville are Production (52 | 7.9%), Transportation (41 | 6.2%), and Material Moving (30 | 4.5%).
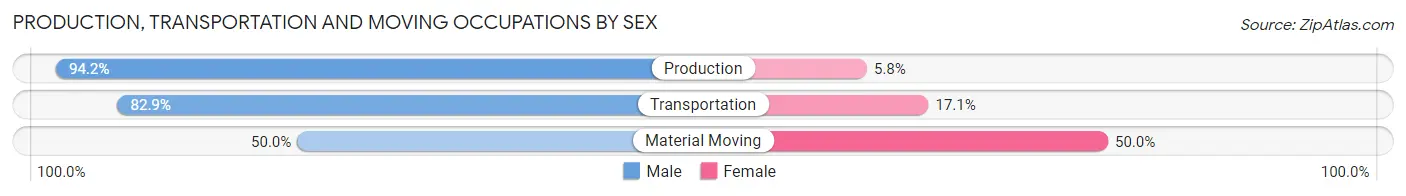
Production, Transportation and Moving Occupations by Sex
| Occupation | Male | Female |
| Production | 49 (94.2%) | 3 (5.8%) |
| Transportation | 34 (82.9%) | 7 (17.1%) |
| Material Moving | 15 (50.0%) | 15 (50.0%) |
| Total (Category) | 98 (79.7%) | 25 (20.3%) |
| Total (Overall) | 380 (57.5%) | 281 (42.5%) |
Employment Industries by Sex in St Johnsville
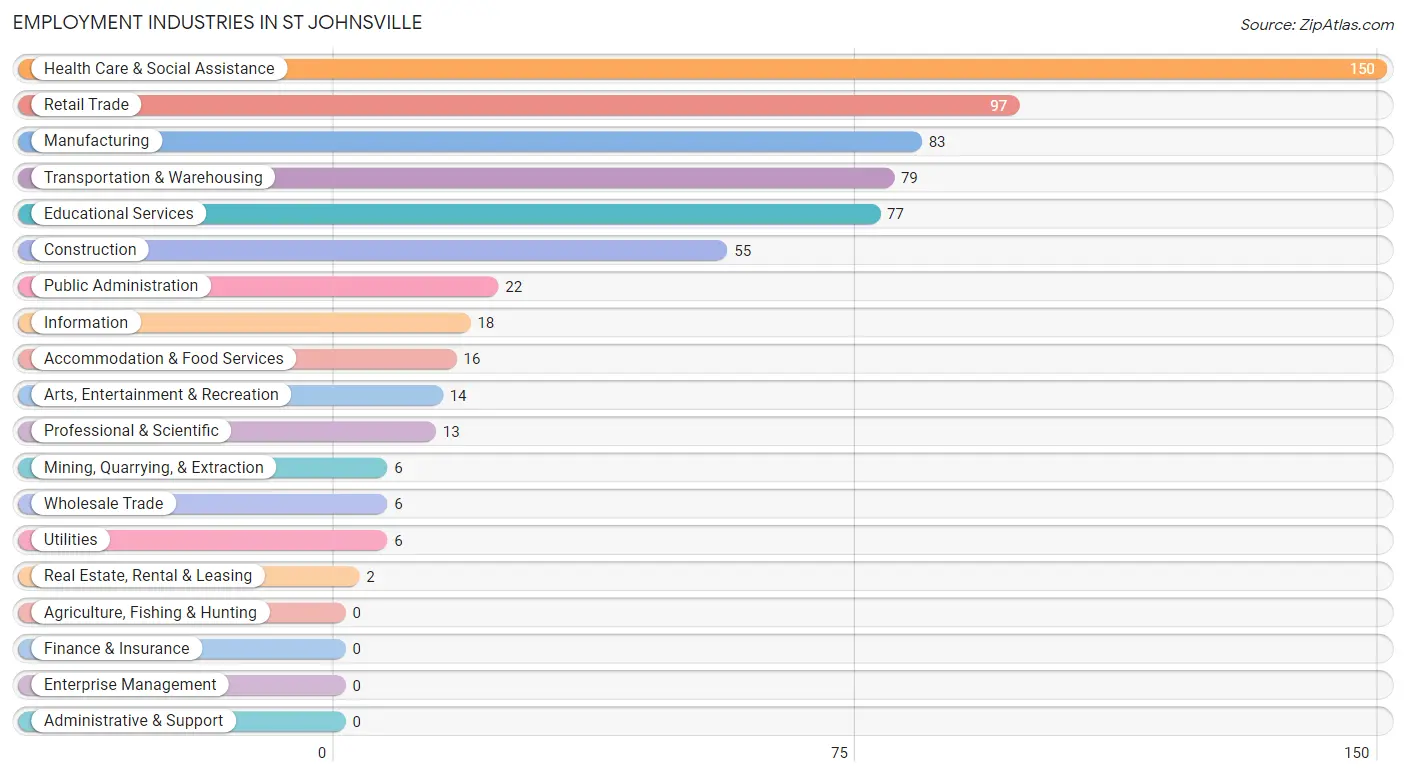
Employment Industries in St Johnsville
The major employment industries in St Johnsville include Health Care & Social Assistance (150 | 22.7%), Retail Trade (97 | 14.7%), Manufacturing (83 | 12.6%), Transportation & Warehousing (79 | 11.9%), and Educational Services (77 | 11.7%).
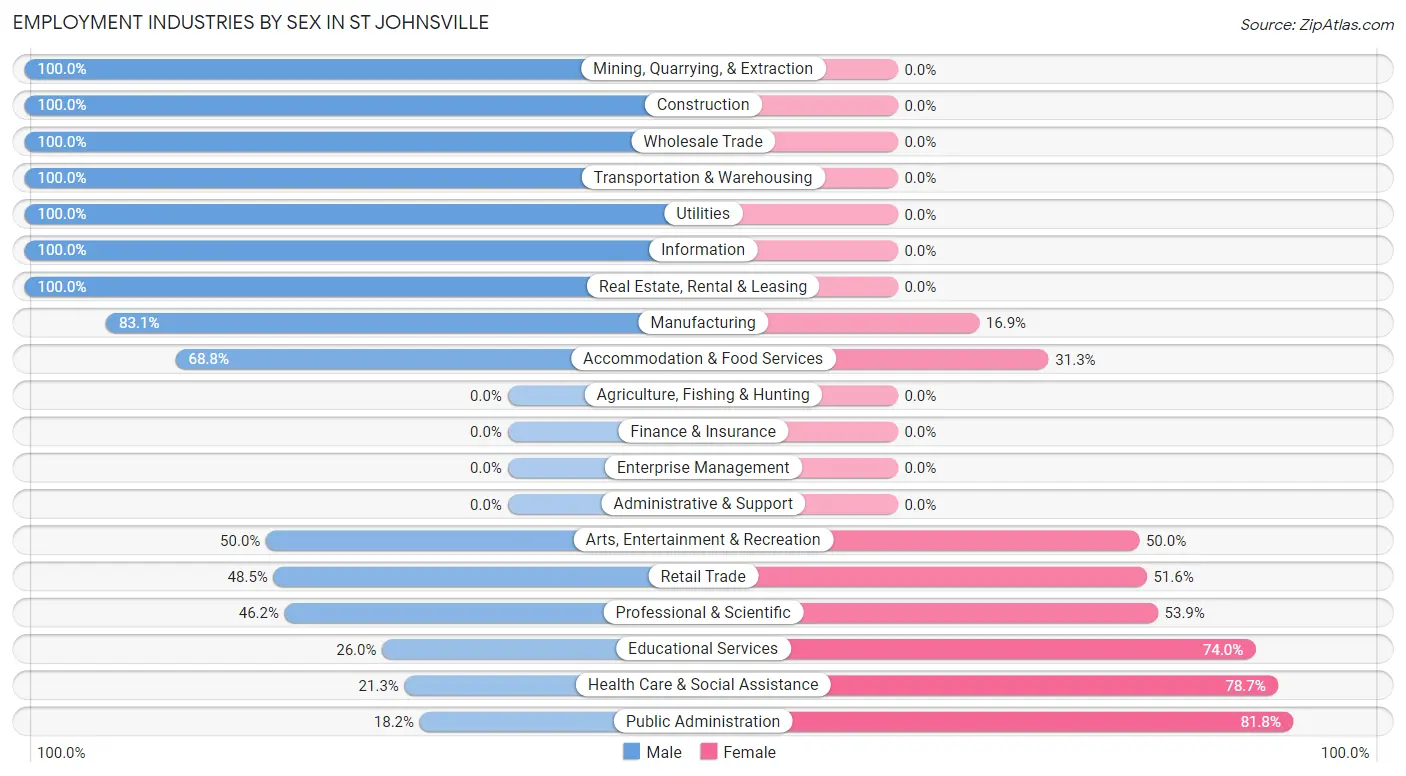
Employment Industries by Sex in St Johnsville
The St Johnsville industries that see more men than women are Mining, Quarrying, & Extraction (100.0%), Construction (100.0%), and Wholesale Trade (100.0%), whereas the industries that tend to have a higher number of women are Public Administration (81.8%), Health Care & Social Assistance (78.7%), and Educational Services (74.0%).
| Industry | Male | Female |
| Agriculture, Fishing & Hunting | 0 (0.0%) | 0 (0.0%) |
| Mining, Quarrying, & Extraction | 6 (100.0%) | 0 (0.0%) |
| Construction | 55 (100.0%) | 0 (0.0%) |
| Manufacturing | 69 (83.1%) | 14 (16.9%) |
| Wholesale Trade | 6 (100.0%) | 0 (0.0%) |
| Retail Trade | 47 (48.4%) | 50 (51.5%) |
| Transportation & Warehousing | 79 (100.0%) | 0 (0.0%) |
| Utilities | 6 (100.0%) | 0 (0.0%) |
| Information | 18 (100.0%) | 0 (0.0%) |
| Finance & Insurance | 0 (0.0%) | 0 (0.0%) |
| Real Estate, Rental & Leasing | 2 (100.0%) | 0 (0.0%) |
| Professional & Scientific | 6 (46.2%) | 7 (53.8%) |
| Enterprise Management | 0 (0.0%) | 0 (0.0%) |
| Administrative & Support | 0 (0.0%) | 0 (0.0%) |
| Educational Services | 20 (26.0%) | 57 (74.0%) |
| Health Care & Social Assistance | 32 (21.3%) | 118 (78.7%) |
| Arts, Entertainment & Recreation | 7 (50.0%) | 7 (50.0%) |
| Accommodation & Food Services | 11 (68.8%) | 5 (31.2%) |
| Public Administration | 4 (18.2%) | 18 (81.8%) |
| Total | 380 (57.5%) | 281 (42.5%) |
Education in St Johnsville
School Enrollment in St Johnsville
The most common levels of schooling among the 334 students in St Johnsville are high school (98 | 29.3%), middle school (93 | 27.8%), and elementary school (81 | 24.2%).
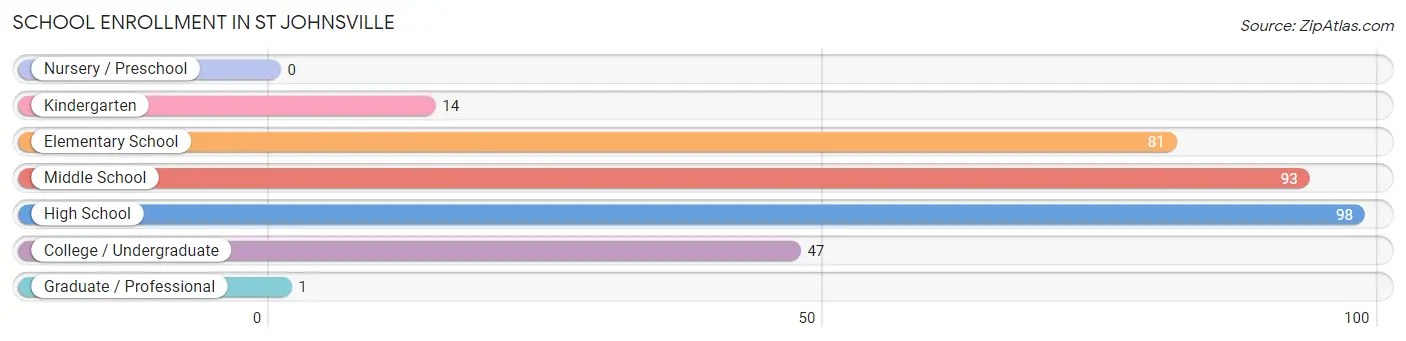
| School Level | # Students | % Students |
| Nursery / Preschool | 0 | 0.0% |
| Kindergarten | 14 | 4.2% |
| Elementary School | 81 | 24.2% |
| Middle School | 93 | 27.8% |
| High School | 98 | 29.3% |
| College / Undergraduate | 47 | 14.1% |
| Graduate / Professional | 1 | 0.3% |
| Total | 334 | 100.0% |
School Enrollment by Age by Funding Source in St Johnsville
Out of a total of 334 students who are enrolled in schools in St Johnsville, 12 (3.6%) attend a private institution, while the remaining 322 (96.4%) are enrolled in public schools. The age group of 20 to 24 year olds has the highest likelihood of being enrolled in private schools, with 4 (30.8% in the age bracket) enrolled. Conversely, the age group of 15 to 17 year olds has the lowest likelihood of being enrolled in a private school, with 64 (100.0% in the age bracket) attending a public institution.
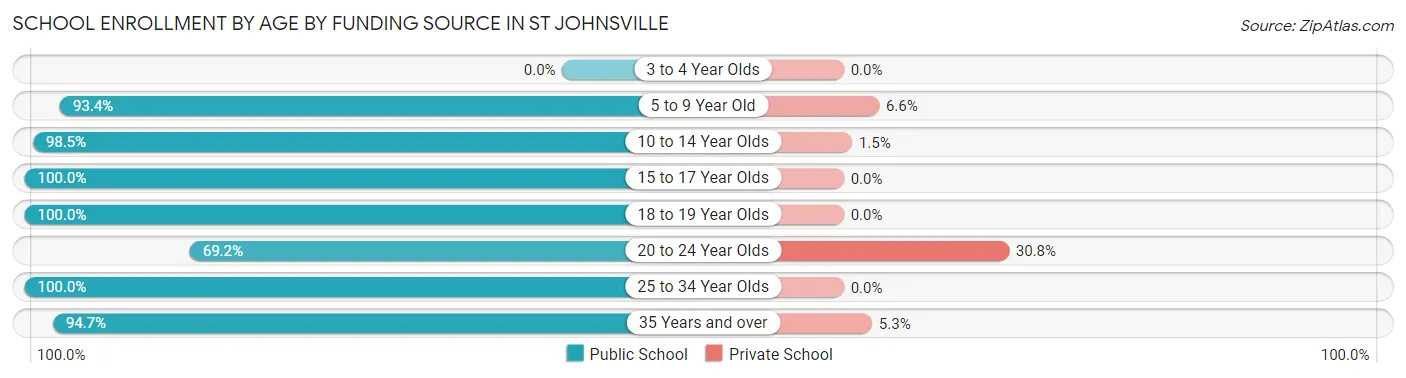
| Age Bracket | Public School | Private School |
| 3 to 4 Year Olds | 0 (0.0%) | 0 (0.0%) |
| 5 to 9 Year Old | 71 (93.4%) | 5 (6.6%) |
| 10 to 14 Year Olds | 128 (98.5%) | 2 (1.5%) |
| 15 to 17 Year Olds | 64 (100.0%) | 0 (0.0%) |
| 18 to 19 Year Olds | 20 (100.0%) | 0 (0.0%) |
| 20 to 24 Year Olds | 9 (69.2%) | 4 (30.8%) |
| 25 to 34 Year Olds | 12 (100.0%) | 0 (0.0%) |
| 35 Years and over | 18 (94.7%) | 1 (5.3%) |
| Total | 322 (96.4%) | 12 (3.6%) |
Educational Attainment by Field of Study in St Johnsville
Education (52 | 30.9%), business (24 | 14.3%), science & technology (19 | 11.3%), arts & humanities (15 | 8.9%), and liberal arts & history (12 | 7.1%) are the most common fields of study among 168 individuals in St Johnsville who have obtained a bachelor's degree or higher.
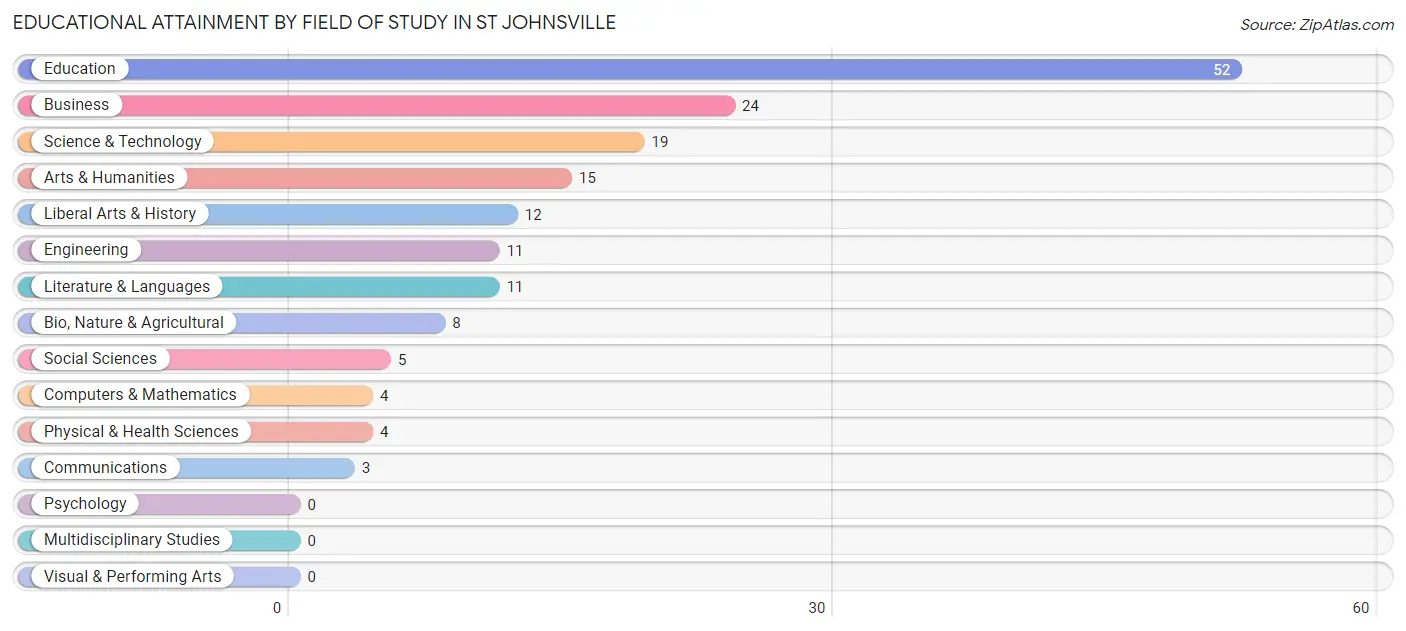
| Field of Study | # Graduates | % Graduates |
| Computers & Mathematics | 4 | 2.4% |
| Bio, Nature & Agricultural | 8 | 4.8% |
| Physical & Health Sciences | 4 | 2.4% |
| Psychology | 0 | 0.0% |
| Social Sciences | 5 | 3.0% |
| Engineering | 11 | 6.6% |
| Multidisciplinary Studies | 0 | 0.0% |
| Science & Technology | 19 | 11.3% |
| Business | 24 | 14.3% |
| Education | 52 | 30.9% |
| Literature & Languages | 11 | 6.6% |
| Liberal Arts & History | 12 | 7.1% |
| Visual & Performing Arts | 0 | 0.0% |
| Communications | 3 | 1.8% |
| Arts & Humanities | 15 | 8.9% |
| Total | 168 | 100.0% |
Transportation & Commute in St Johnsville
Vehicle Availability by Sex in St Johnsville
The most prevalent vehicle ownership categories in St Johnsville are males with 2 vehicles (100, accounting for 27.4%) and females with 2 vehicles (107, making up 35.6%).
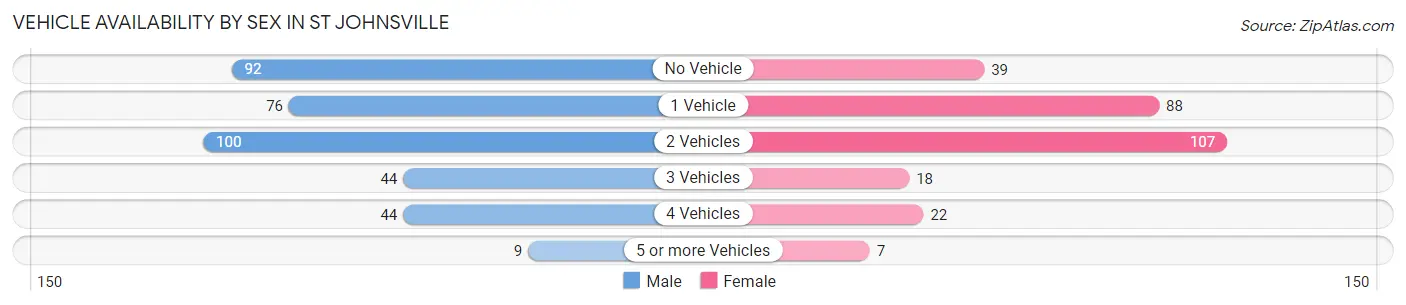
| Vehicles Available | Male | Female |
| No Vehicle | 92 (25.2%) | 39 (13.9%) |
| 1 Vehicle | 76 (20.8%) | 88 (31.3%) |
| 2 Vehicles | 100 (27.4%) | 107 (38.1%) |
| 3 Vehicles | 44 (12.0%) | 18 (6.4%) |
| 4 Vehicles | 44 (12.0%) | 22 (7.8%) |
| 5 or more Vehicles | 9 (2.5%) | 7 (2.5%) |
| Total | 365 (100.0%) | 281 (100.0%) |
Commute Time in St Johnsville
The most frequently occuring commute durations in St Johnsville are 5 to 9 minutes (120 commuters, 19.3%), 30 to 34 minutes (90 commuters, 14.4%), and 15 to 19 minutes (87 commuters, 14.0%).
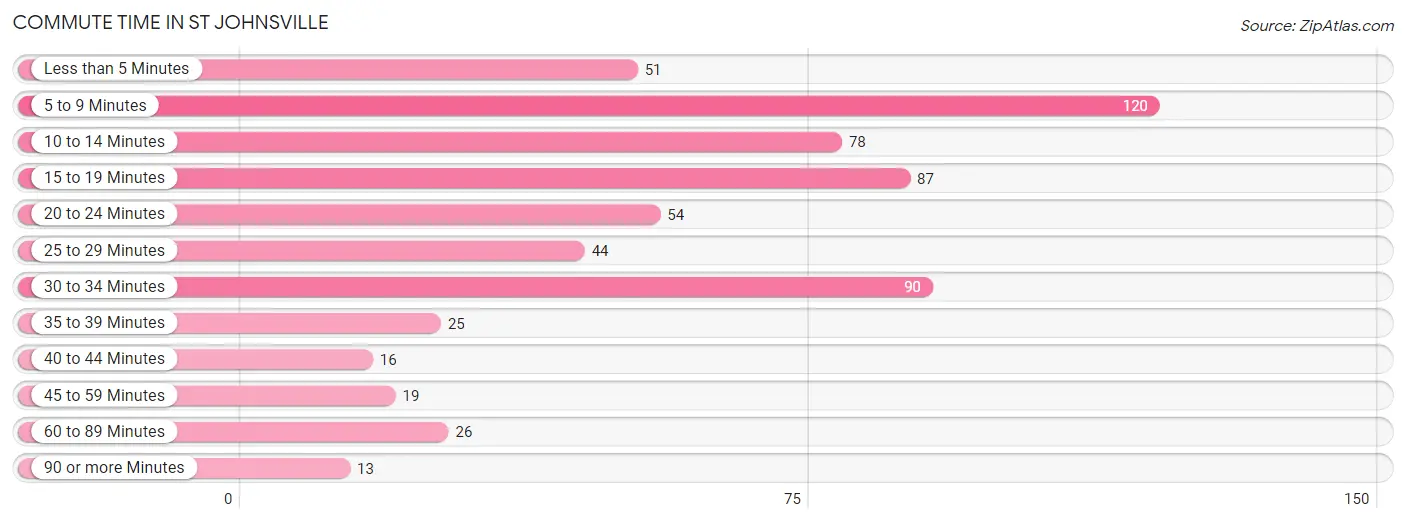
| Commute Time | # Commuters | % Commuters |
| Less than 5 Minutes | 51 | 8.2% |
| 5 to 9 Minutes | 120 | 19.3% |
| 10 to 14 Minutes | 78 | 12.5% |
| 15 to 19 Minutes | 87 | 14.0% |
| 20 to 24 Minutes | 54 | 8.7% |
| 25 to 29 Minutes | 44 | 7.1% |
| 30 to 34 Minutes | 90 | 14.4% |
| 35 to 39 Minutes | 25 | 4.0% |
| 40 to 44 Minutes | 16 | 2.6% |
| 45 to 59 Minutes | 19 | 3.0% |
| 60 to 89 Minutes | 26 | 4.2% |
| 90 or more Minutes | 13 | 2.1% |
Commute Time by Sex in St Johnsville
The most common commute times in St Johnsville are 5 to 9 minutes (90 commuters, 25.8%) for males and 15 to 19 minutes (62 commuters, 22.6%) for females.
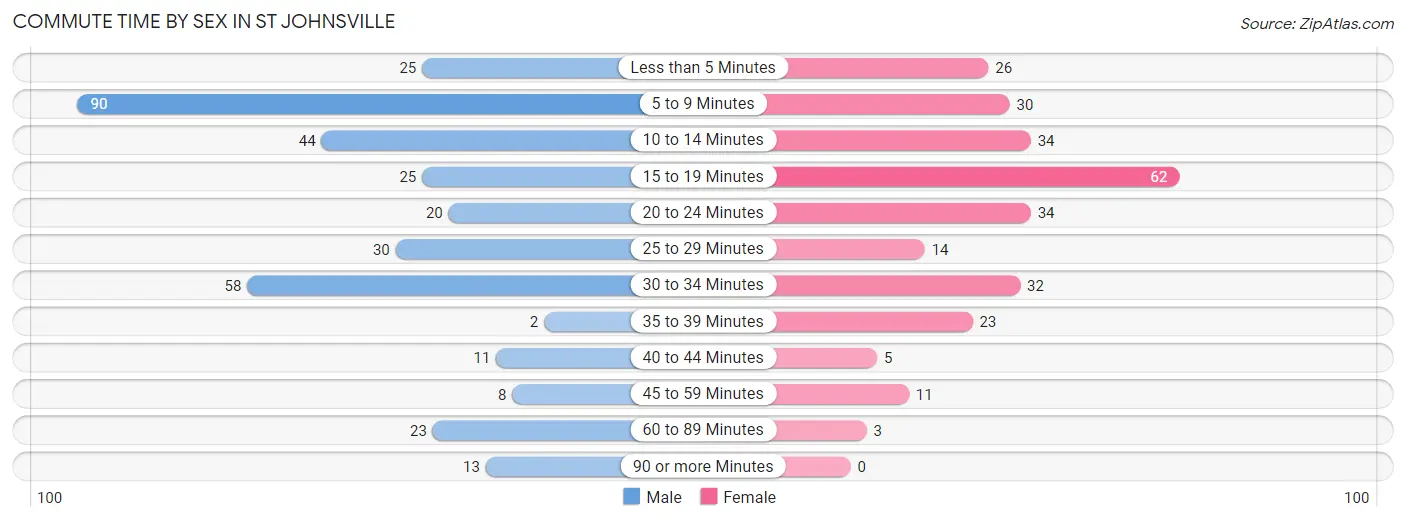
| Commute Time | Male | Female |
| Less than 5 Minutes | 25 (7.2%) | 26 (9.5%) |
| 5 to 9 Minutes | 90 (25.8%) | 30 (11.0%) |
| 10 to 14 Minutes | 44 (12.6%) | 34 (12.4%) |
| 15 to 19 Minutes | 25 (7.2%) | 62 (22.6%) |
| 20 to 24 Minutes | 20 (5.7%) | 34 (12.4%) |
| 25 to 29 Minutes | 30 (8.6%) | 14 (5.1%) |
| 30 to 34 Minutes | 58 (16.6%) | 32 (11.7%) |
| 35 to 39 Minutes | 2 (0.6%) | 23 (8.4%) |
| 40 to 44 Minutes | 11 (3.2%) | 5 (1.8%) |
| 45 to 59 Minutes | 8 (2.3%) | 11 (4.0%) |
| 60 to 89 Minutes | 23 (6.6%) | 3 (1.1%) |
| 90 or more Minutes | 13 (3.7%) | 0 (0.0%) |
Time of Departure to Work by Sex in St Johnsville
The most frequent times of departure to work in St Johnsville are 12:00 AM to 4:59 AM (76, 21.8%) for males and 12:00 PM to 3:59 PM (64, 23.4%) for females.
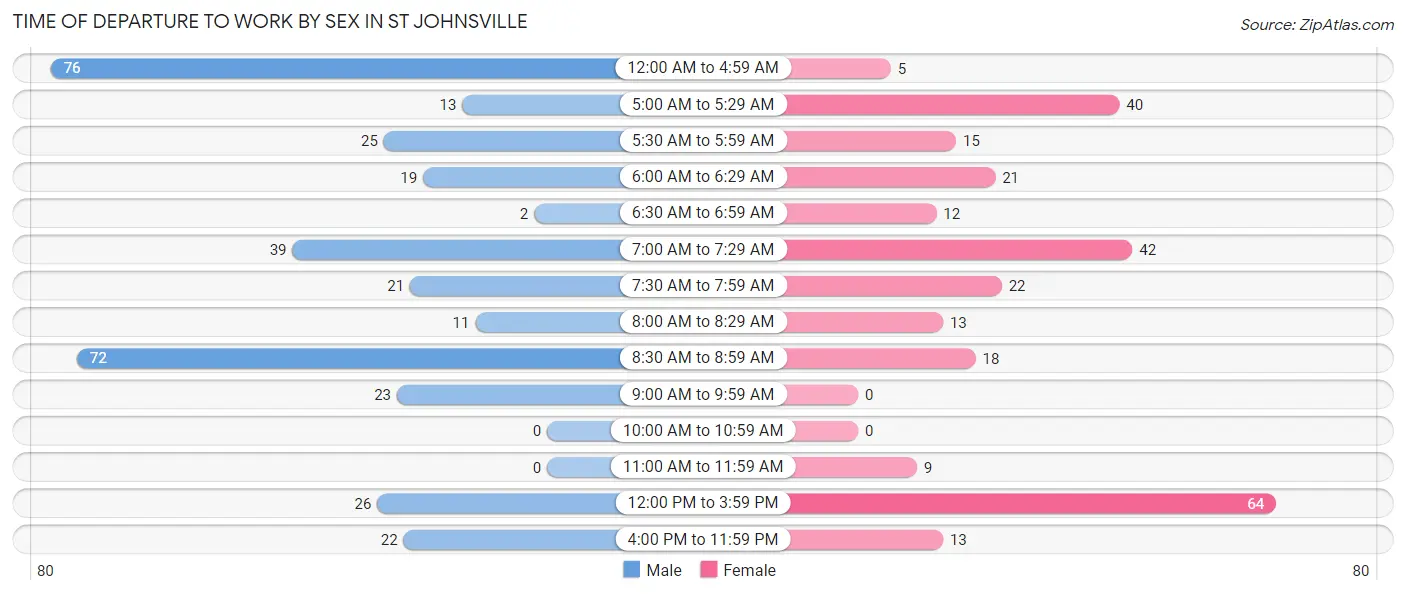
| Time of Departure | Male | Female |
| 12:00 AM to 4:59 AM | 76 (21.8%) | 5 (1.8%) |
| 5:00 AM to 5:29 AM | 13 (3.7%) | 40 (14.6%) |
| 5:30 AM to 5:59 AM | 25 (7.2%) | 15 (5.5%) |
| 6:00 AM to 6:29 AM | 19 (5.4%) | 21 (7.7%) |
| 6:30 AM to 6:59 AM | 2 (0.6%) | 12 (4.4%) |
| 7:00 AM to 7:29 AM | 39 (11.2%) | 42 (15.3%) |
| 7:30 AM to 7:59 AM | 21 (6.0%) | 22 (8.0%) |
| 8:00 AM to 8:29 AM | 11 (3.2%) | 13 (4.7%) |
| 8:30 AM to 8:59 AM | 72 (20.6%) | 18 (6.6%) |
| 9:00 AM to 9:59 AM | 23 (6.6%) | 0 (0.0%) |
| 10:00 AM to 10:59 AM | 0 (0.0%) | 0 (0.0%) |
| 11:00 AM to 11:59 AM | 0 (0.0%) | 9 (3.3%) |
| 12:00 PM to 3:59 PM | 26 (7.4%) | 64 (23.4%) |
| 4:00 PM to 11:59 PM | 22 (6.3%) | 13 (4.7%) |
| Total | 349 (100.0%) | 274 (100.0%) |
Housing Occupancy in St Johnsville
Occupancy by Ownership in St Johnsville
Of the total 637 dwellings in St Johnsville, owner-occupied units account for 383 (60.1%), while renter-occupied units make up 254 (39.9%).
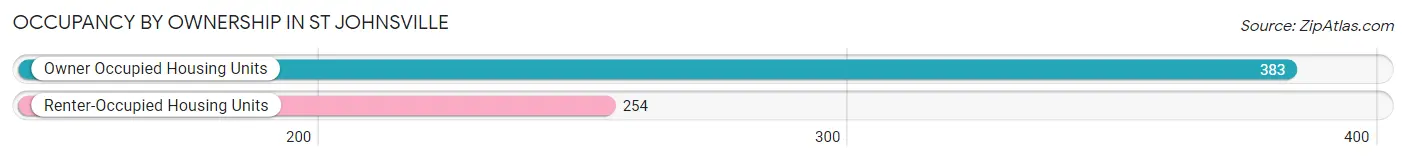
| Occupancy | # Housing Units | % Housing Units |
| Owner Occupied Housing Units | 383 | 60.1% |
| Renter-Occupied Housing Units | 254 | 39.9% |
| Total Occupied Housing Units | 637 | 100.0% |
Occupancy by Household Size in St Johnsville
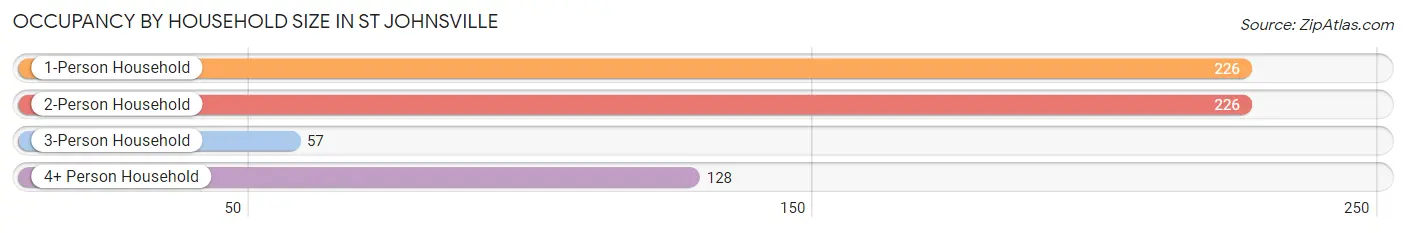
| Household Size | # Housing Units | % Housing Units |
| 1-Person Household | 226 | 35.5% |
| 2-Person Household | 226 | 35.5% |
| 3-Person Household | 57 | 8.9% |
| 4+ Person Household | 128 | 20.1% |
| Total Housing Units | 637 | 100.0% |
Occupancy by Ownership by Household Size in St Johnsville
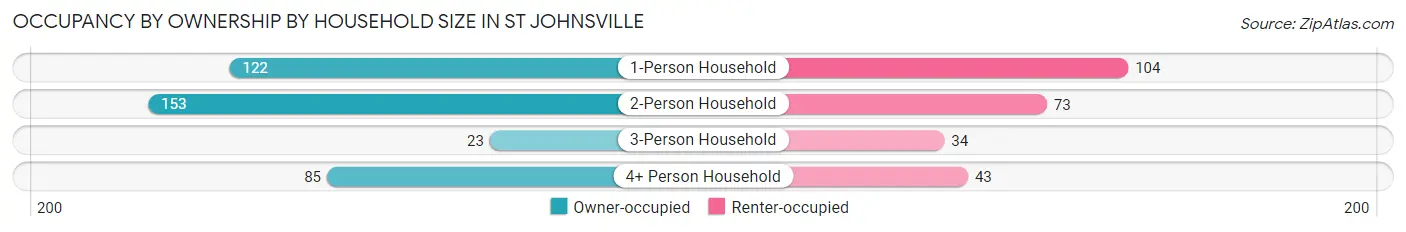
| Household Size | Owner-occupied | Renter-occupied |
| 1-Person Household | 122 (54.0%) | 104 (46.0%) |
| 2-Person Household | 153 (67.7%) | 73 (32.3%) |
| 3-Person Household | 23 (40.4%) | 34 (59.7%) |
| 4+ Person Household | 85 (66.4%) | 43 (33.6%) |
| Total Housing Units | 383 (60.1%) | 254 (39.9%) |
Occupancy by Educational Attainment in St Johnsville
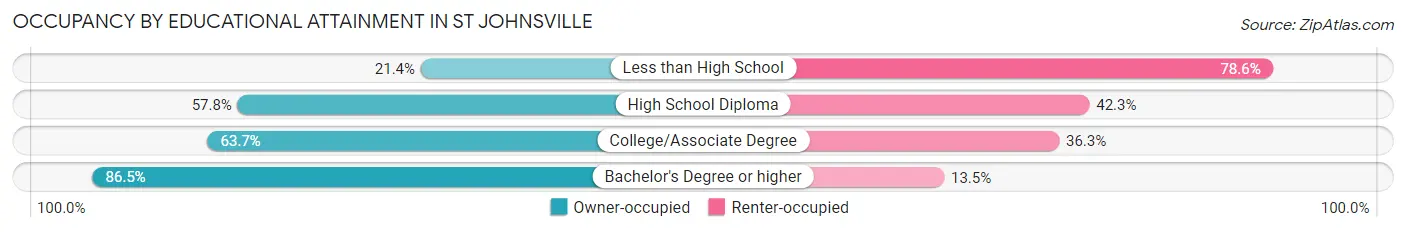
| Household Size | Owner-occupied | Renter-occupied |
| Less than High School | 18 (21.4%) | 66 (78.6%) |
| High School Diploma | 108 (57.8%) | 79 (42.2%) |
| College/Associate Degree | 167 (63.7%) | 95 (36.3%) |
| Bachelor's Degree or higher | 90 (86.5%) | 14 (13.5%) |
Occupancy by Age of Householder in St Johnsville
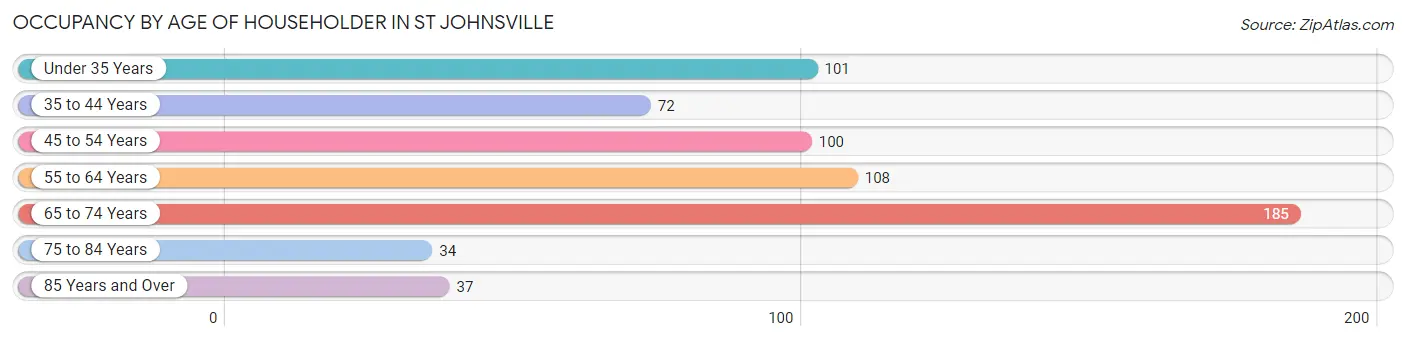
| Age Bracket | # Households | % Households |
| Under 35 Years | 101 | 15.9% |
| 35 to 44 Years | 72 | 11.3% |
| 45 to 54 Years | 100 | 15.7% |
| 55 to 64 Years | 108 | 17.0% |
| 65 to 74 Years | 185 | 29.0% |
| 75 to 84 Years | 34 | 5.3% |
| 85 Years and Over | 37 | 5.8% |
| Total | 637 | 100.0% |
Housing Finances in St Johnsville
Median Income by Occupancy in St Johnsville
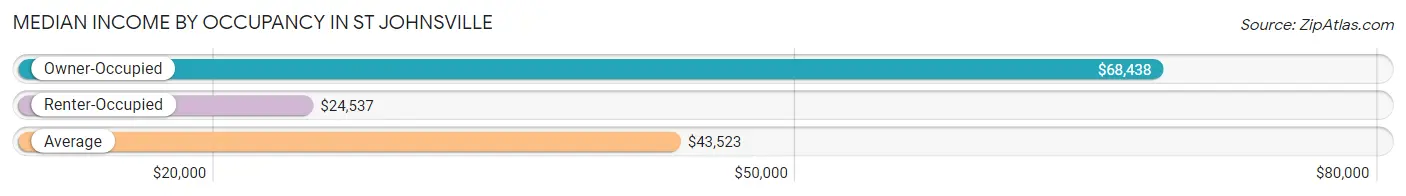
| Occupancy Type | # Households | Median Income |
| Owner-Occupied | 383 (60.1%) | $68,438 |
| Renter-Occupied | 254 (39.9%) | $24,537 |
| Average | 637 (100.0%) | $43,523 |
Occupancy by Householder Income Bracket in St Johnsville
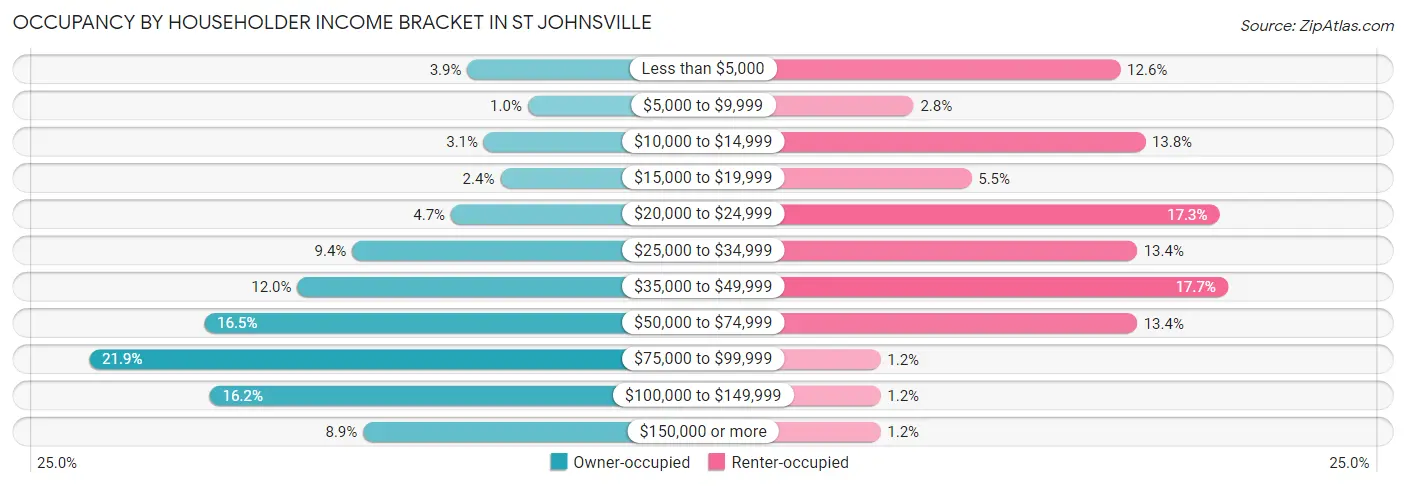
| Income Bracket | Owner-occupied | Renter-occupied |
| Less than $5,000 | 15 (3.9%) | 32 (12.6%) |
| $5,000 to $9,999 | 4 (1.0%) | 7 (2.8%) |
| $10,000 to $14,999 | 12 (3.1%) | 35 (13.8%) |
| $15,000 to $19,999 | 9 (2.4%) | 14 (5.5%) |
| $20,000 to $24,999 | 18 (4.7%) | 44 (17.3%) |
| $25,000 to $34,999 | 36 (9.4%) | 34 (13.4%) |
| $35,000 to $49,999 | 46 (12.0%) | 45 (17.7%) |
| $50,000 to $74,999 | 63 (16.5%) | 34 (13.4%) |
| $75,000 to $99,999 | 84 (21.9%) | 3 (1.2%) |
| $100,000 to $149,999 | 62 (16.2%) | 3 (1.2%) |
| $150,000 or more | 34 (8.9%) | 3 (1.2%) |
| Total | 383 (100.0%) | 254 (100.0%) |
Monthly Housing Cost Tiers in St Johnsville
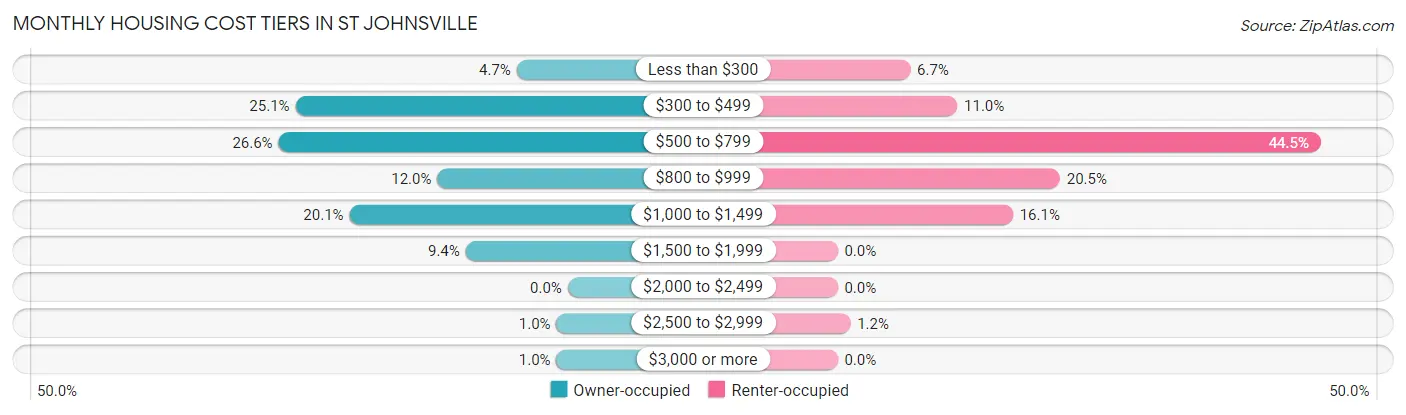
| Monthly Cost | Owner-occupied | Renter-occupied |
| Less than $300 | 18 (4.7%) | 17 (6.7%) |
| $300 to $499 | 96 (25.1%) | 28 (11.0%) |
| $500 to $799 | 102 (26.6%) | 113 (44.5%) |
| $800 to $999 | 46 (12.0%) | 52 (20.5%) |
| $1,000 to $1,499 | 77 (20.1%) | 41 (16.1%) |
| $1,500 to $1,999 | 36 (9.4%) | 0 (0.0%) |
| $2,000 to $2,499 | 0 (0.0%) | 0 (0.0%) |
| $2,500 to $2,999 | 4 (1.0%) | 3 (1.2%) |
| $3,000 or more | 4 (1.0%) | 0 (0.0%) |
| Total | 383 (100.0%) | 254 (100.0%) |
Physical Housing Characteristics in St Johnsville
Housing Structures in St Johnsville
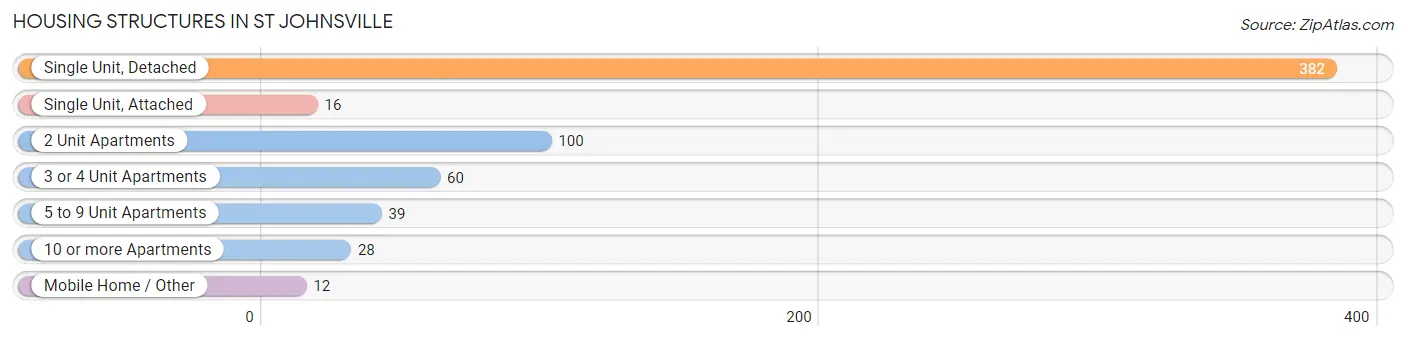
| Structure Type | # Housing Units | % Housing Units |
| Single Unit, Detached | 382 | 60.0% |
| Single Unit, Attached | 16 | 2.5% |
| 2 Unit Apartments | 100 | 15.7% |
| 3 or 4 Unit Apartments | 60 | 9.4% |
| 5 to 9 Unit Apartments | 39 | 6.1% |
| 10 or more Apartments | 28 | 4.4% |
| Mobile Home / Other | 12 | 1.9% |
| Total | 637 | 100.0% |
Housing Structures by Occupancy in St Johnsville
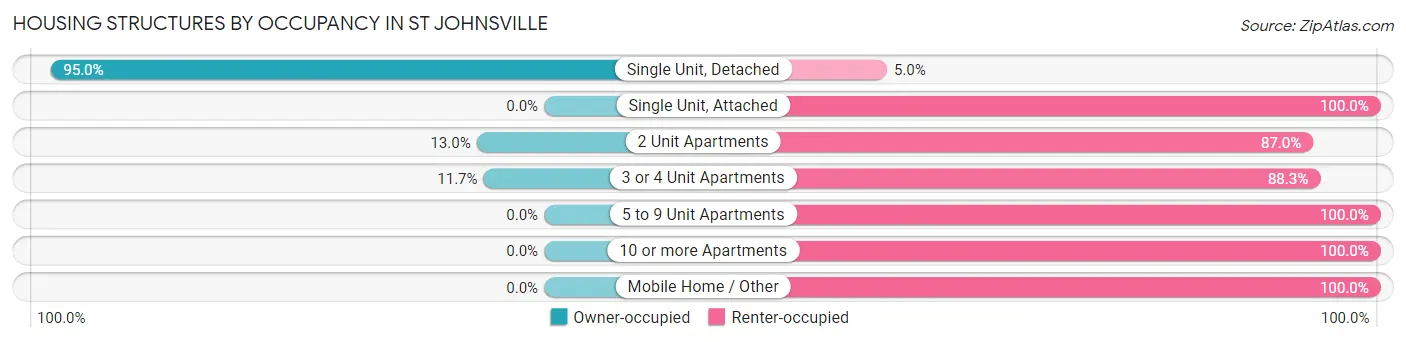
| Structure Type | Owner-occupied | Renter-occupied |
| Single Unit, Detached | 363 (95.0%) | 19 (5.0%) |
| Single Unit, Attached | 0 (0.0%) | 16 (100.0%) |
| 2 Unit Apartments | 13 (13.0%) | 87 (87.0%) |
| 3 or 4 Unit Apartments | 7 (11.7%) | 53 (88.3%) |
| 5 to 9 Unit Apartments | 0 (0.0%) | 39 (100.0%) |
| 10 or more Apartments | 0 (0.0%) | 28 (100.0%) |
| Mobile Home / Other | 0 (0.0%) | 12 (100.0%) |
| Total | 383 (60.1%) | 254 (39.9%) |
Housing Structures by Number of Rooms in St Johnsville
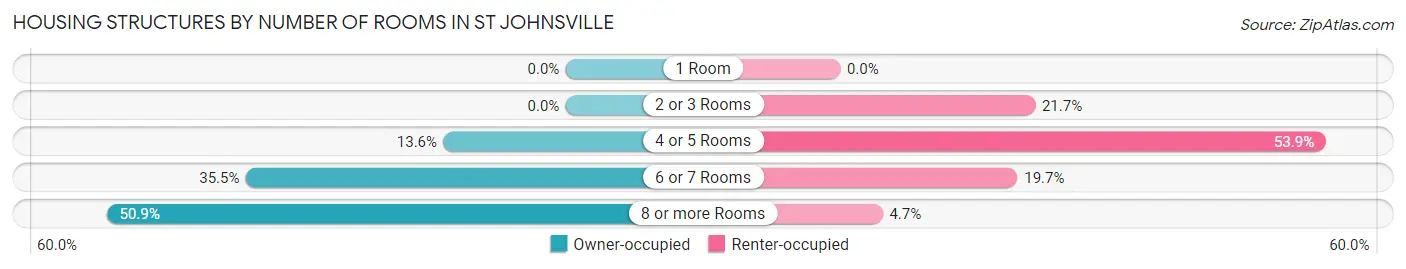
| Number of Rooms | Owner-occupied | Renter-occupied |
| 1 Room | 0 (0.0%) | 0 (0.0%) |
| 2 or 3 Rooms | 0 (0.0%) | 55 (21.6%) |
| 4 or 5 Rooms | 52 (13.6%) | 137 (53.9%) |
| 6 or 7 Rooms | 136 (35.5%) | 50 (19.7%) |
| 8 or more Rooms | 195 (50.9%) | 12 (4.7%) |
| Total | 383 (100.0%) | 254 (100.0%) |
Housing Structure by Heating Type in St Johnsville
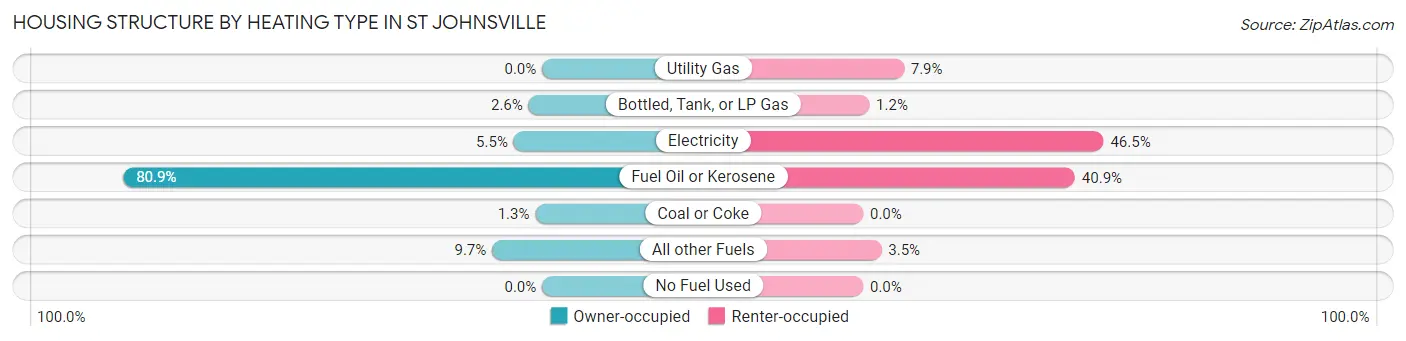
| Heating Type | Owner-occupied | Renter-occupied |
| Utility Gas | 0 (0.0%) | 20 (7.9%) |
| Bottled, Tank, or LP Gas | 10 (2.6%) | 3 (1.2%) |
| Electricity | 21 (5.5%) | 118 (46.5%) |
| Fuel Oil or Kerosene | 310 (80.9%) | 104 (40.9%) |
| Coal or Coke | 5 (1.3%) | 0 (0.0%) |
| All other Fuels | 37 (9.7%) | 9 (3.5%) |
| No Fuel Used | 0 (0.0%) | 0 (0.0%) |
| Total | 383 (100.0%) | 254 (100.0%) |
Household Vehicle Usage in St Johnsville
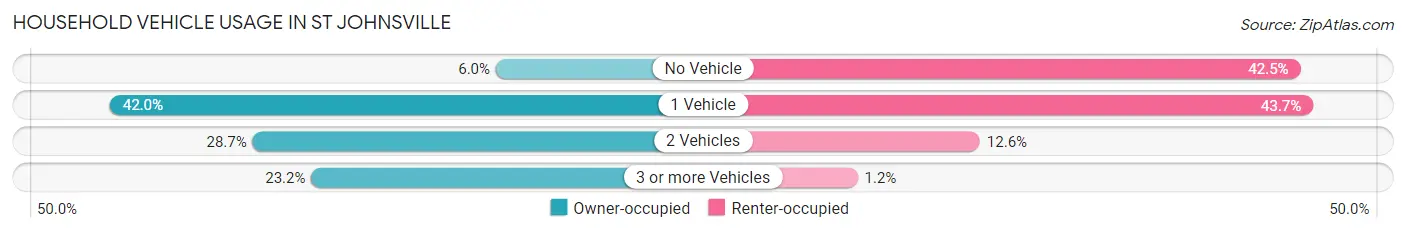
| Vehicles per Household | Owner-occupied | Renter-occupied |
| No Vehicle | 23 (6.0%) | 108 (42.5%) |
| 1 Vehicle | 161 (42.0%) | 111 (43.7%) |
| 2 Vehicles | 110 (28.7%) | 32 (12.6%) |
| 3 or more Vehicles | 89 (23.2%) | 3 (1.2%) |
| Total | 383 (100.0%) | 254 (100.0%) |
Real Estate & Mortgages in St Johnsville
Real Estate and Mortgage Overview in St Johnsville
| Characteristic | Without Mortgage | With Mortgage |
| Housing Units | 245 | 138 |
| Median Property Value | $77,500 | $93,500 |
| Median Household Income | $64,205 | $12 |
| Monthly Housing Costs | $545 | $4 |
| Real Estate Taxes | $2,360 | $3 |
Property Value by Mortgage Status in St Johnsville
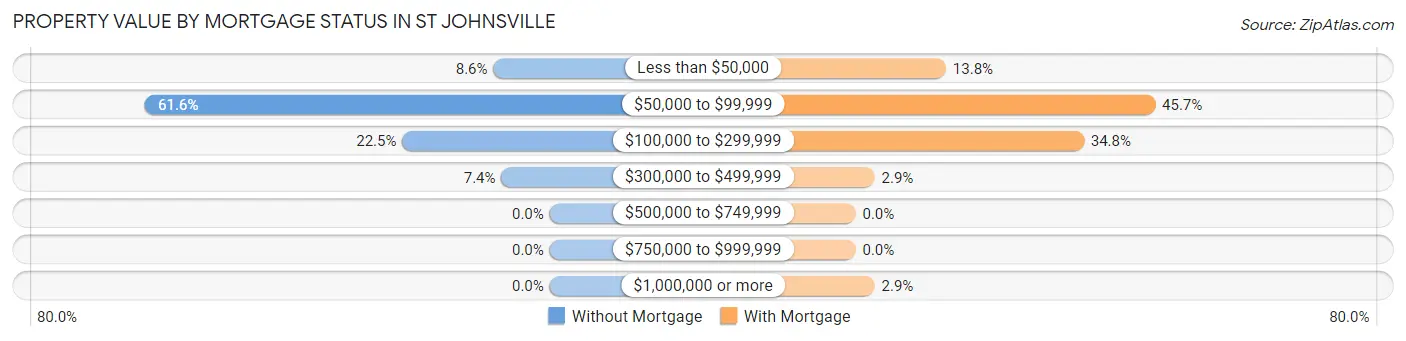
| Property Value | Without Mortgage | With Mortgage |
| Less than $50,000 | 21 (8.6%) | 19 (13.8%) |
| $50,000 to $99,999 | 151 (61.6%) | 63 (45.7%) |
| $100,000 to $299,999 | 55 (22.5%) | 48 (34.8%) |
| $300,000 to $499,999 | 18 (7.3%) | 4 (2.9%) |
| $500,000 to $749,999 | 0 (0.0%) | 0 (0.0%) |
| $750,000 to $999,999 | 0 (0.0%) | 0 (0.0%) |
| $1,000,000 or more | 0 (0.0%) | 4 (2.9%) |
| Total | 245 (100.0%) | 138 (100.0%) |
Household Income by Mortgage Status in St Johnsville
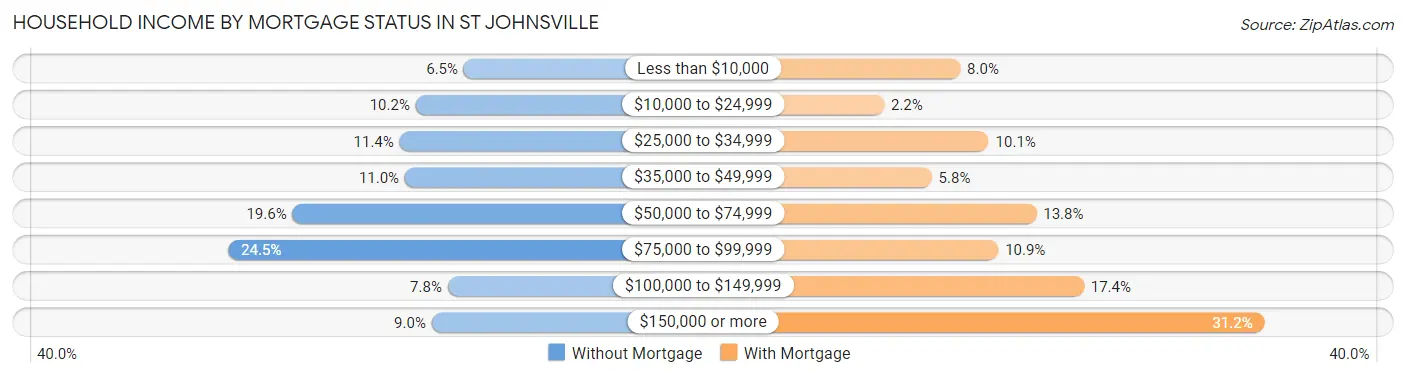
| Household Income | Without Mortgage | With Mortgage |
| Less than $10,000 | 16 (6.5%) | 11 (8.0%) |
| $10,000 to $24,999 | 25 (10.2%) | 3 (2.2%) |
| $25,000 to $34,999 | 28 (11.4%) | 14 (10.1%) |
| $35,000 to $49,999 | 27 (11.0%) | 8 (5.8%) |
| $50,000 to $74,999 | 48 (19.6%) | 19 (13.8%) |
| $75,000 to $99,999 | 60 (24.5%) | 15 (10.9%) |
| $100,000 to $149,999 | 19 (7.8%) | 24 (17.4%) |
| $150,000 or more | 22 (9.0%) | 43 (31.2%) |
| Total | 245 (100.0%) | 138 (100.0%) |
Property Value to Household Income Ratio in St Johnsville
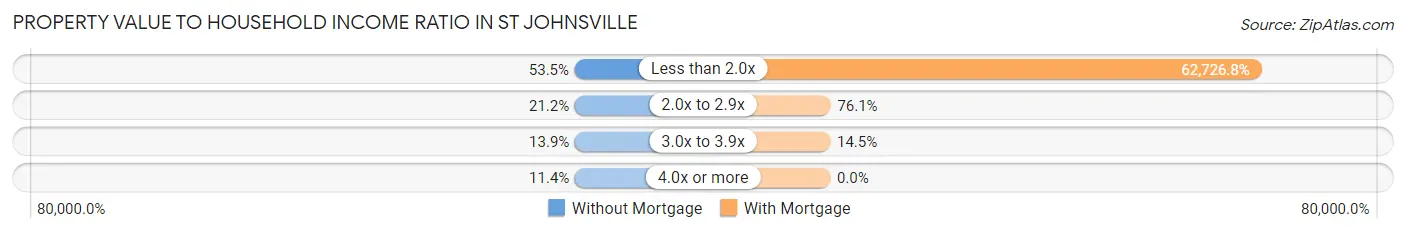
| Value-to-Income Ratio | Without Mortgage | With Mortgage |
| Less than 2.0x | 131 (53.5%) | 86,563 (62,726.8%) |
| 2.0x to 2.9x | 52 (21.2%) | 105 (76.1%) |
| 3.0x to 3.9x | 34 (13.9%) | 20 (14.5%) |
| 4.0x or more | 28 (11.4%) | 0 (0.0%) |
| Total | 245 (100.0%) | 138 (100.0%) |
Real Estate Taxes by Mortgage Status in St Johnsville
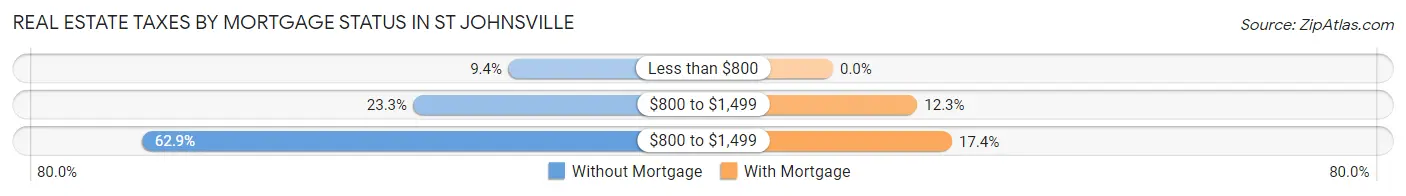
| Property Taxes | Without Mortgage | With Mortgage |
| Less than $800 | 23 (9.4%) | 0 (0.0%) |
| $800 to $1,499 | 57 (23.3%) | 17 (12.3%) |
| $800 to $1,499 | 154 (62.9%) | 24 (17.4%) |
| Total | 245 (100.0%) | 138 (100.0%) |
Health & Disability in St Johnsville
Health Insurance Coverage by Age in St Johnsville
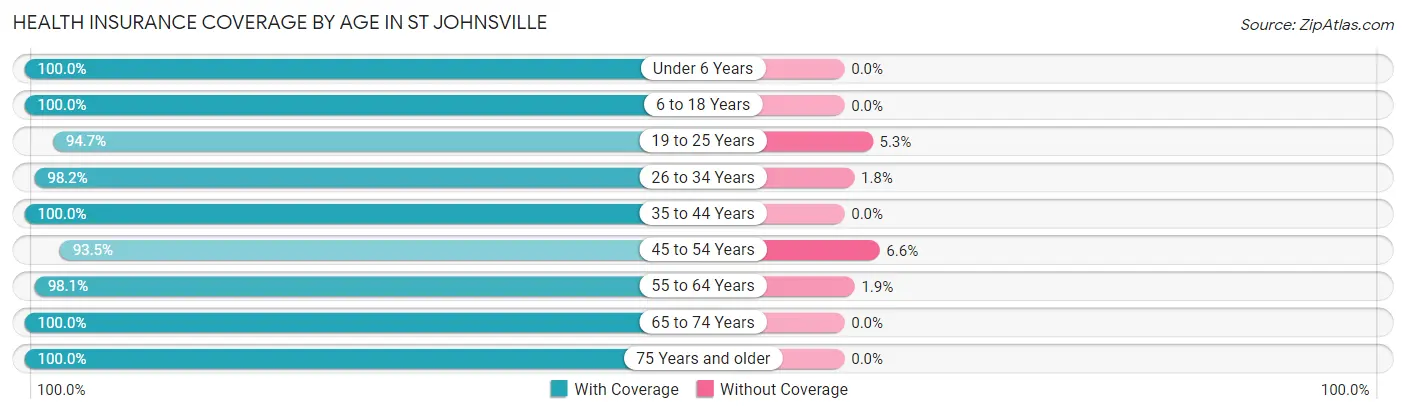
| Age Bracket | With Coverage | Without Coverage |
| Under 6 Years | 195 (100.0%) | 0 (0.0%) |
| 6 to 18 Years | 270 (100.0%) | 0 (0.0%) |
| 19 to 25 Years | 162 (94.7%) | 9 (5.3%) |
| 26 to 34 Years | 162 (98.2%) | 3 (1.8%) |
| 35 to 44 Years | 213 (100.0%) | 0 (0.0%) |
| 45 to 54 Years | 157 (93.4%) | 11 (6.6%) |
| 55 to 64 Years | 155 (98.1%) | 3 (1.9%) |
| 65 to 74 Years | 221 (100.0%) | 0 (0.0%) |
| 75 Years and older | 103 (100.0%) | 0 (0.0%) |
| Total | 1,638 (98.4%) | 26 (1.6%) |
Health Insurance Coverage by Citizenship Status in St Johnsville
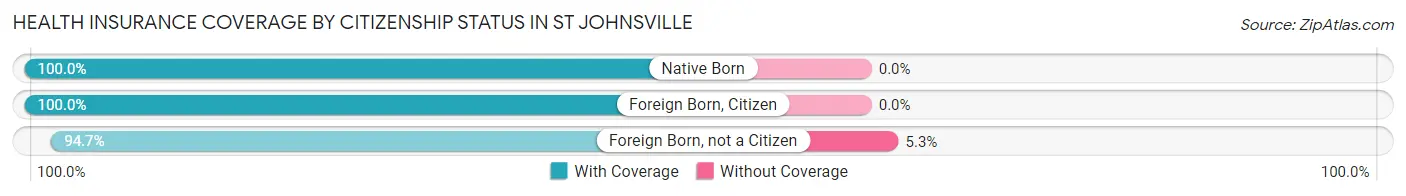
| Citizenship Status | With Coverage | Without Coverage |
| Native Born | 195 (100.0%) | 0 (0.0%) |
| Foreign Born, Citizen | 270 (100.0%) | 0 (0.0%) |
| Foreign Born, not a Citizen | 162 (94.7%) | 9 (5.3%) |
Health Insurance Coverage by Household Income in St Johnsville
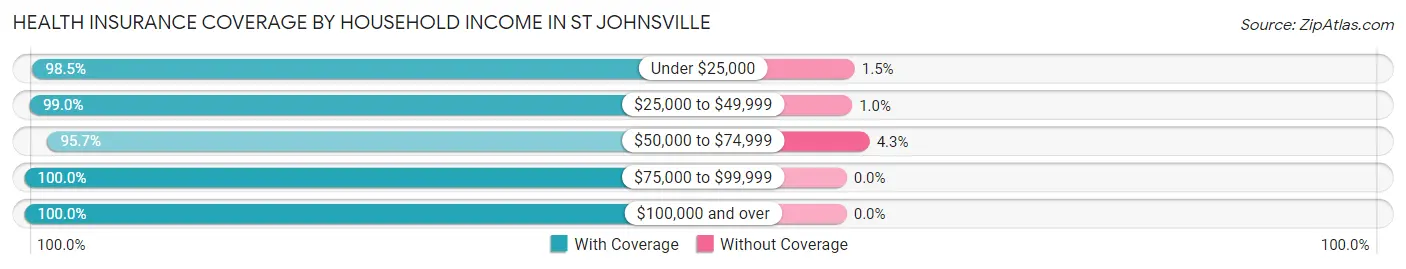
| Household Income | With Coverage | Without Coverage |
| Under $25,000 | 392 (98.5%) | 6 (1.5%) |
| $25,000 to $49,999 | 393 (99.0%) | 4 (1.0%) |
| $50,000 to $74,999 | 357 (95.7%) | 16 (4.3%) |
| $75,000 to $99,999 | 204 (100.0%) | 0 (0.0%) |
| $100,000 and over | 292 (100.0%) | 0 (0.0%) |
Public vs Private Health Insurance Coverage by Age in St Johnsville
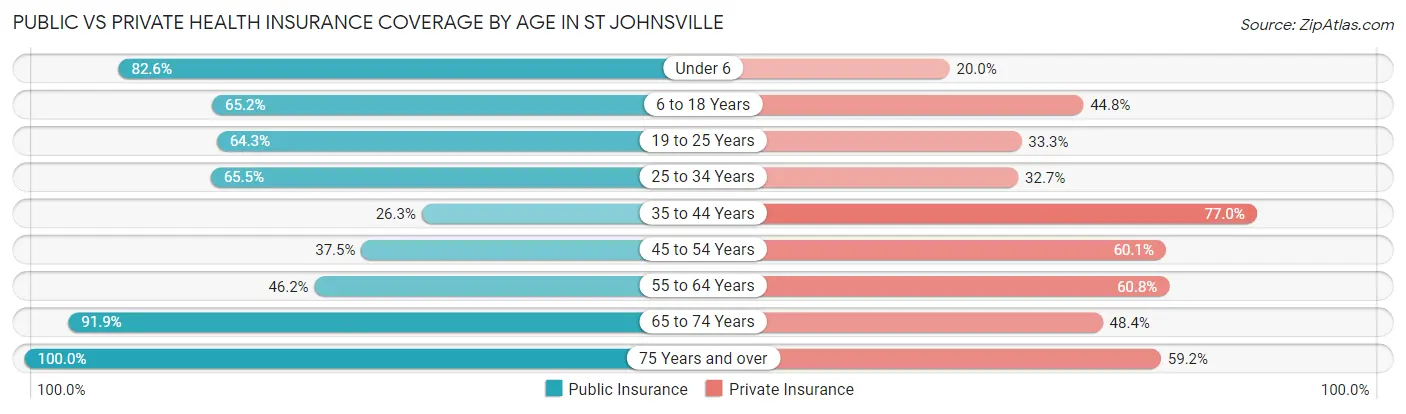
| Age Bracket | Public Insurance | Private Insurance |
| Under 6 | 161 (82.6%) | 39 (20.0%) |
| 6 to 18 Years | 176 (65.2%) | 121 (44.8%) |
| 19 to 25 Years | 110 (64.3%) | 57 (33.3%) |
| 25 to 34 Years | 108 (65.4%) | 54 (32.7%) |
| 35 to 44 Years | 56 (26.3%) | 164 (77.0%) |
| 45 to 54 Years | 63 (37.5%) | 101 (60.1%) |
| 55 to 64 Years | 73 (46.2%) | 96 (60.8%) |
| 65 to 74 Years | 203 (91.9%) | 107 (48.4%) |
| 75 Years and over | 103 (100.0%) | 61 (59.2%) |
| Total | 1,053 (63.3%) | 800 (48.1%) |
Disability Status by Sex by Age in St Johnsville
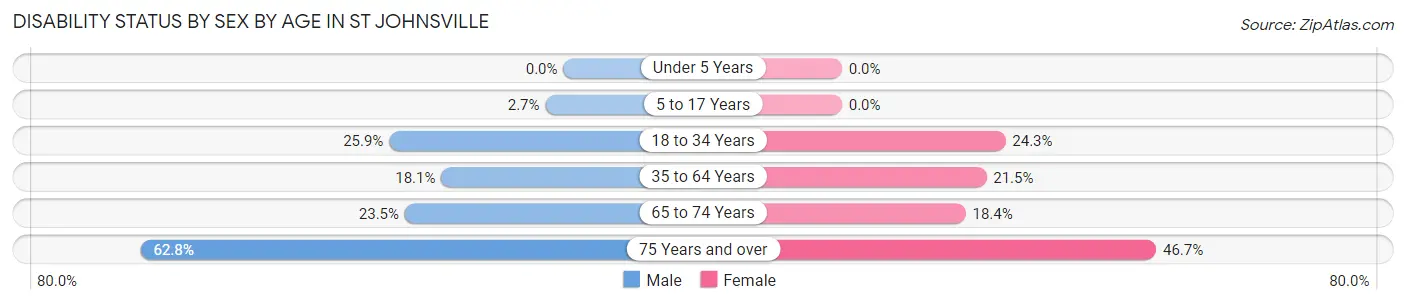
| Age Bracket | Male | Female |
| Under 5 Years | 0 (0.0%) | 0 (0.0%) |
| 5 to 17 Years | 4 (2.7%) | 0 (0.0%) |
| 18 to 34 Years | 45 (25.9%) | 43 (24.3%) |
| 35 to 64 Years | 58 (18.1%) | 47 (21.5%) |
| 65 to 74 Years | 20 (23.5%) | 25 (18.4%) |
| 75 Years and over | 27 (62.8%) | 28 (46.7%) |
Disability Class by Sex by Age in St Johnsville
Disability Class: Hearing Difficulty
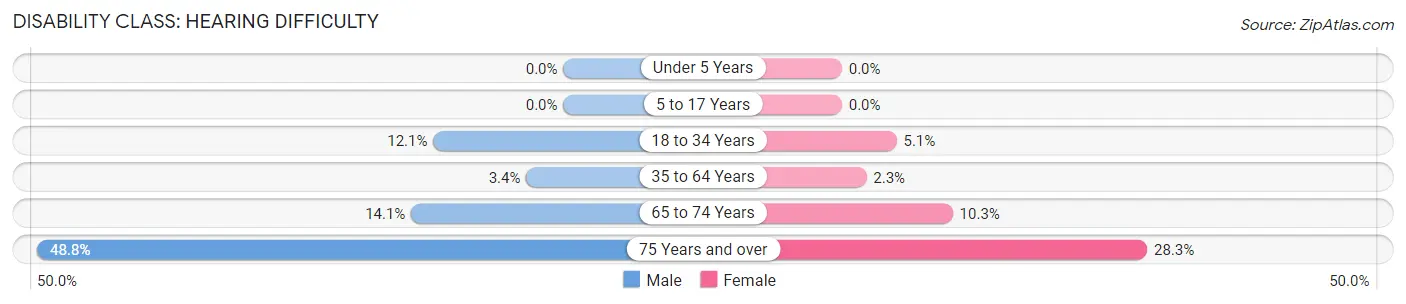
| Age Bracket | Male | Female |
| Under 5 Years | 0 (0.0%) | 0 (0.0%) |
| 5 to 17 Years | 0 (0.0%) | 0 (0.0%) |
| 18 to 34 Years | 21 (12.1%) | 9 (5.1%) |
| 35 to 64 Years | 11 (3.4%) | 5 (2.3%) |
| 65 to 74 Years | 12 (14.1%) | 14 (10.3%) |
| 75 Years and over | 21 (48.8%) | 17 (28.3%) |
Disability Class: Vision Difficulty
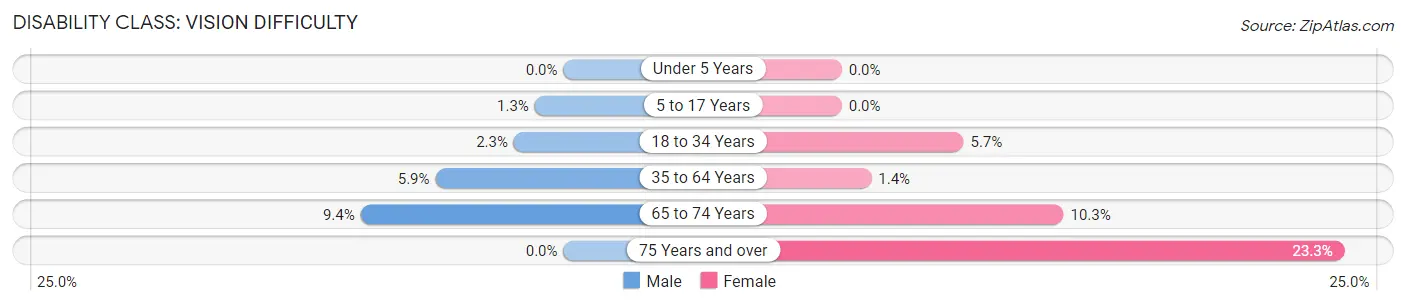
| Age Bracket | Male | Female |
| Under 5 Years | 0 (0.0%) | 0 (0.0%) |
| 5 to 17 Years | 2 (1.3%) | 0 (0.0%) |
| 18 to 34 Years | 4 (2.3%) | 10 (5.7%) |
| 35 to 64 Years | 19 (5.9%) | 3 (1.4%) |
| 65 to 74 Years | 8 (9.4%) | 14 (10.3%) |
| 75 Years and over | 0 (0.0%) | 14 (23.3%) |
Disability Class: Cognitive Difficulty
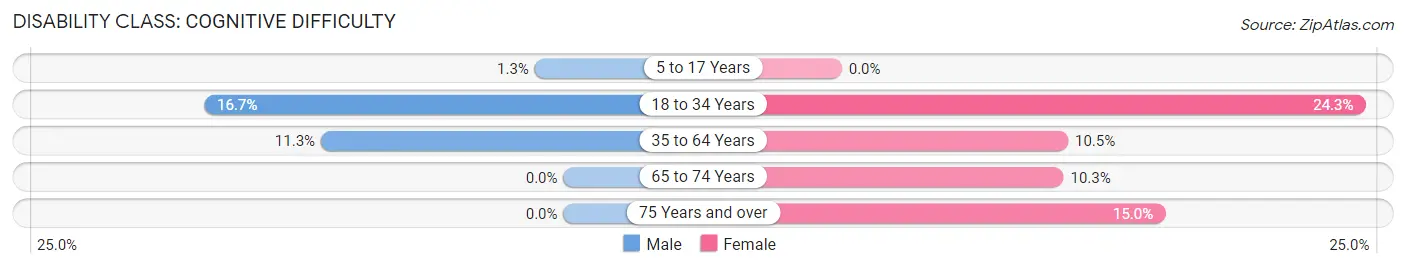
| Age Bracket | Male | Female |
| 5 to 17 Years | 2 (1.3%) | 0 (0.0%) |
| 18 to 34 Years | 29 (16.7%) | 43 (24.3%) |
| 35 to 64 Years | 36 (11.3%) | 23 (10.5%) |
| 65 to 74 Years | 0 (0.0%) | 14 (10.3%) |
| 75 Years and over | 0 (0.0%) | 9 (15.0%) |
Disability Class: Ambulatory Difficulty
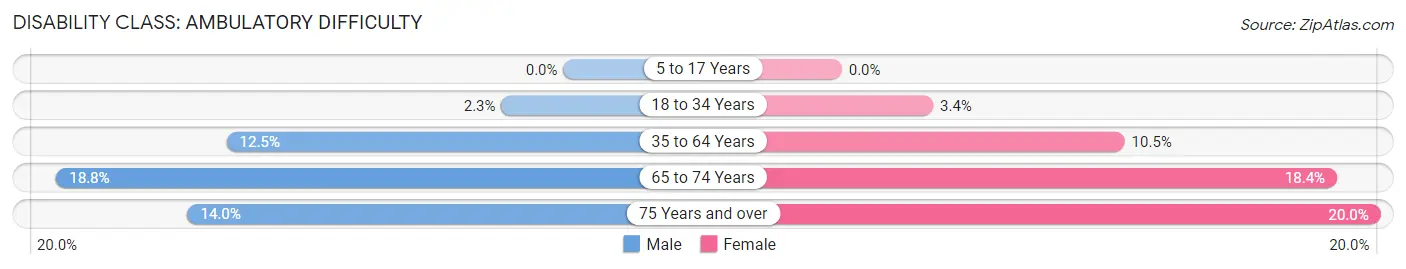
| Age Bracket | Male | Female |
| 5 to 17 Years | 0 (0.0%) | 0 (0.0%) |
| 18 to 34 Years | 4 (2.3%) | 6 (3.4%) |
| 35 to 64 Years | 40 (12.5%) | 23 (10.5%) |
| 65 to 74 Years | 16 (18.8%) | 25 (18.4%) |
| 75 Years and over | 6 (14.0%) | 12 (20.0%) |
Disability Class: Self-Care Difficulty
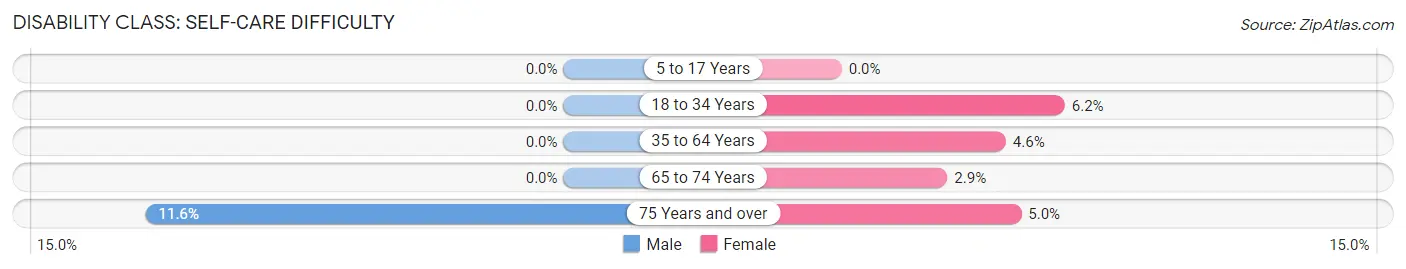
| Age Bracket | Male | Female |
| 5 to 17 Years | 0 (0.0%) | 0 (0.0%) |
| 18 to 34 Years | 0 (0.0%) | 11 (6.2%) |
| 35 to 64 Years | 0 (0.0%) | 10 (4.6%) |
| 65 to 74 Years | 0 (0.0%) | 4 (2.9%) |
| 75 Years and over | 5 (11.6%) | 3 (5.0%) |
Technology Access in St Johnsville
Computing Device Access in St Johnsville
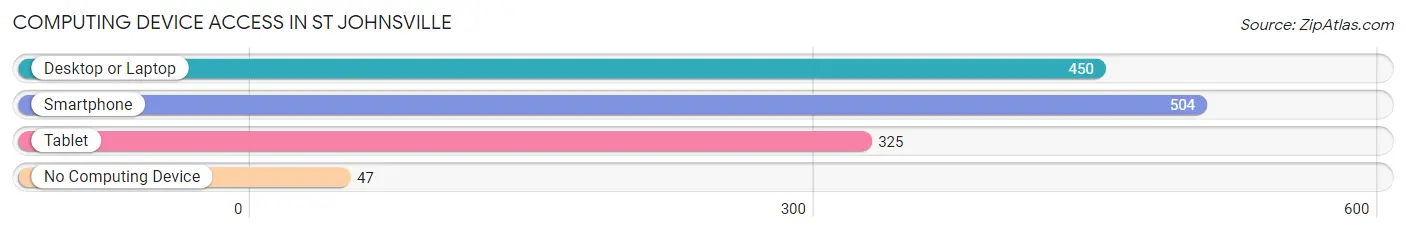
| Device Type | # Households | % Households |
| Desktop or Laptop | 450 | 70.6% |
| Smartphone | 504 | 79.1% |
| Tablet | 325 | 51.0% |
| No Computing Device | 47 | 7.4% |
| Total | 637 | 100.0% |
Internet Access in St Johnsville
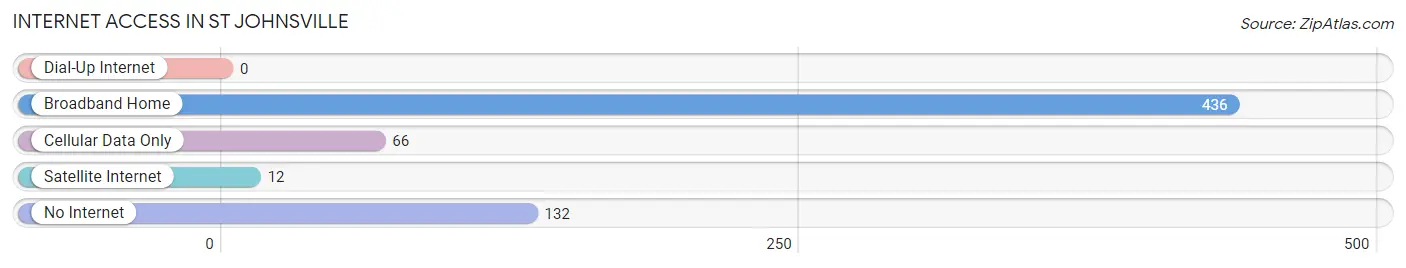
| Internet Type | # Households | % Households |
| Dial-Up Internet | 0 | 0.0% |
| Broadband Home | 436 | 68.4% |
| Cellular Data Only | 66 | 10.4% |
| Satellite Internet | 12 | 1.9% |
| No Internet | 132 | 20.7% |
| Total | 637 | 100.0% |
St Johnsville Summary
Johnsville is a village located in Montgomery County, New York, United States. The population was 1,093 at the 2010 census. The village is named after John Frey, an early settler.
History
Johnsville was first settled in 1725 by John Frey, a German immigrant. Frey built a log cabin on the banks of the Mohawk River and began farming the land. The village was originally known as Frey's Bush, but was later renamed Johnsville in Frey's honor.
In 1790, the village was incorporated as a village within the Town of Minden. The village was an important stop on the Mohawk Turnpike, which connected Albany to Buffalo. The turnpike was a major transportation route for goods and people, and helped to spur the growth of the village.
In 1845, the village was connected to the Erie Canal, which further increased its importance as a transportation hub. The canal brought increased trade and commerce to the village, and helped to make it a prosperous community.
In the late 19th century, Johnsville was a popular summer resort destination. The village was home to several hotels and resorts, and attracted visitors from all over the country.
Geography
Johnsville is located at 42 59 45 North 74 37 45 West 42 995833 74 629167
According to the United States Census Bureau, the village has a total area of 0.7 square miles (1.8 km2), all of it land.
The village is located on the banks of the Mohawk River, and is bordered by the Town of Minden to the north, the Town of Palatine to the east, the Town of Canajoharie to the south, and the Town of Root to the west.
Economy
Johnsville's economy is largely based on agriculture and tourism. The village is home to several farms, which produce a variety of crops, including corn, soybeans, hay, and vegetables.
The village is also home to several small businesses, including restaurants, shops, and a hardware store.
Demographics
As of the census of 2000, there were 1,093 people, 441 households, and 287 families residing in the village. The population density was 1,541.2 people per square mile (595.2/km2). There were 471 housing units at an average density of 663.2 per square mile (256.2/km2). The racial makeup of the village was 97.90% White, 0.37% African American, 0.09% Native American, 0.09% Asian, 0.09% Pacific Islander, 0.37% from other races, and 1.09% from two or more races. Hispanic or Latino of any race were 0.64% of the population.
There were 441 households, out of which 32.2% had children under the age of 18 living with them, 50.3% were married couples living together, 11.3% had a female householder with no husband present, and 33.7% were non-families. 29.2% of all households were made up of individuals, and 14.3% had someone living alone who was 65 years of age or older. The average household size was 2.47 and the average family size was 3.04.
In the village, the population was spread out, with 26.2% under the age of 18, 7.2% from 18 to 24, 28.2% from 25 to 44, 22.2% from 45 to 64, and 16.2% who were 65 years of age or older. The median age was 38 years. For every 100 females, there were 91.2 males. For every 100 females age 18 and over, there were 87.2 males.
The median income for a household in the village was $35,000, and the median income for a family was $41,250. Males had a median income of $31,250 versus $21,250 for females. The per capita income for the village was $17,845. About 8.2% of families and 10.2% of the population were below the poverty line, including 14.3% of those under age 18 and 8.2% of those age 65 or over.
Common Questions
What is Per Capita Income in St Johnsville?
Per Capita income in St Johnsville is $23,400.
What is the Median Family Income in St Johnsville?
Median Family Income in St Johnsville is $58,403.
What is the Median Household income in St Johnsville?
Median Household Income in St Johnsville is $43,523.
What is Income or Wage Gap in St Johnsville?
Income or Wage Gap in St Johnsville is 15.7%.
Women in St Johnsville earn 84.3 cents for every dollar earned by a man.
What is Family Income Deficit in St Johnsville?
Family Income Deficit in St Johnsville is $13,166.
Families that are below poverty line in St Johnsville earn $13,166 less on average than the poverty threshold level.
What is Inequality or Gini Index in St Johnsville?
Inequality or Gini Index in St Johnsville is 0.44.
What is the Total Population of St Johnsville?
Total Population of St Johnsville is 1,771.
What is the Total Male Population of St Johnsville?
Total Male Population of St Johnsville is 901.
What is the Total Female Population of St Johnsville?
Total Female Population of St Johnsville is 870.
What is the Ratio of Males per 100 Females in St Johnsville?
There are 103.56 Males per 100 Females in St Johnsville.
What is the Ratio of Females per 100 Males in St Johnsville?
There are 96.56 Females per 100 Males in St Johnsville.
What is the Median Population Age in St Johnsville?
Median Population Age in St Johnsville is 36.0 Years.
What is the Average Family Size in St Johnsville
Average Family Size in St Johnsville is 3.6 People.
What is the Average Household Size in St Johnsville
Average Household Size in St Johnsville is 2.6 People.
How Large is the Labor Force in St Johnsville?
There are 692 People in the Labor Forcein in St Johnsville.
What is the Percentage of People in the Labor Force in St Johnsville?
50.7% of People are in the Labor Force in St Johnsville.
What is the Unemployment Rate in St Johnsville?
Unemployment Rate in St Johnsville is 4.5%.