Mayfield, NY Map & Demographics
Mayfield Map
Mayfield Overview
$34,222
PER CAPITA INCOME
$93,250
AVG FAMILY INCOME
$64,531
AVG HOUSEHOLD INCOME
18.3%
WAGE / INCOME GAP [ % ]
81.7¢/ $1
WAGE / INCOME GAP [ $ ]
0.45
INEQUALITY / GINI INDEX
938
TOTAL POPULATION
471
MALE POPULATION
467
FEMALE POPULATION
100.86
MALES / 100 FEMALES
99.15
FEMALES / 100 MALES
31.8
MEDIAN AGE
3.2
AVG FAMILY SIZE
2.6
AVG HOUSEHOLD SIZE
463
LABOR FORCE [ PEOPLE ]
64.1%
PERCENT IN LABOR FORCE
3.9%
UNEMPLOYMENT RATE
Mayfield Zip Codes
Mayfield Area Codes
Income in Mayfield
Income Overview in Mayfield
Per Capita Income in Mayfield is $34,222, while median incomes of families and households are $93,250 and $64,531 respectively.
| Characteristic | Number | Measure |
| Per Capita Income | 938 | $34,222 |
| Median Family Income | 245 | $93,250 |
| Mean Family Income | 245 | $93,522 |
| Median Household Income | 359 | $64,531 |
| Mean Household Income | 359 | $87,482 |
| Income Deficit | 245 | $0 |
| Wage / Income Gap (%) | 938 | 18.32% |
| Wage / Income Gap ($) | 938 | 81.68¢ per $1 |
| Gini / Inequality Index | 938 | 0.45 |
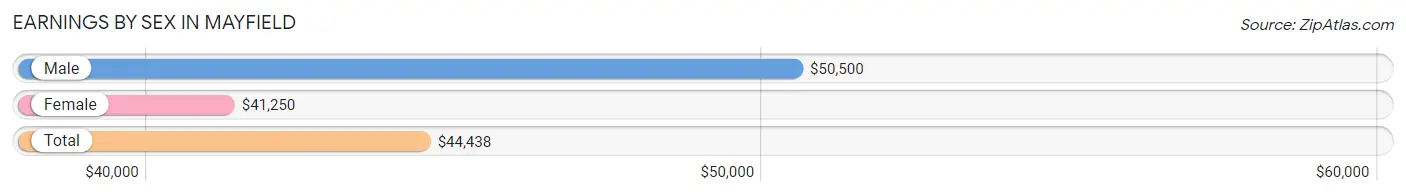
Earnings by Sex in Mayfield
Average Earnings in Mayfield are $44,438, $50,500 for men and $41,250 for women, a difference of 18.3%.
| Sex | Number | Average Earnings |
| Male | 278 (55.7%) | $50,500 |
| Female | 221 (44.3%) | $41,250 |
| Total | 499 (100.0%) | $44,438 |
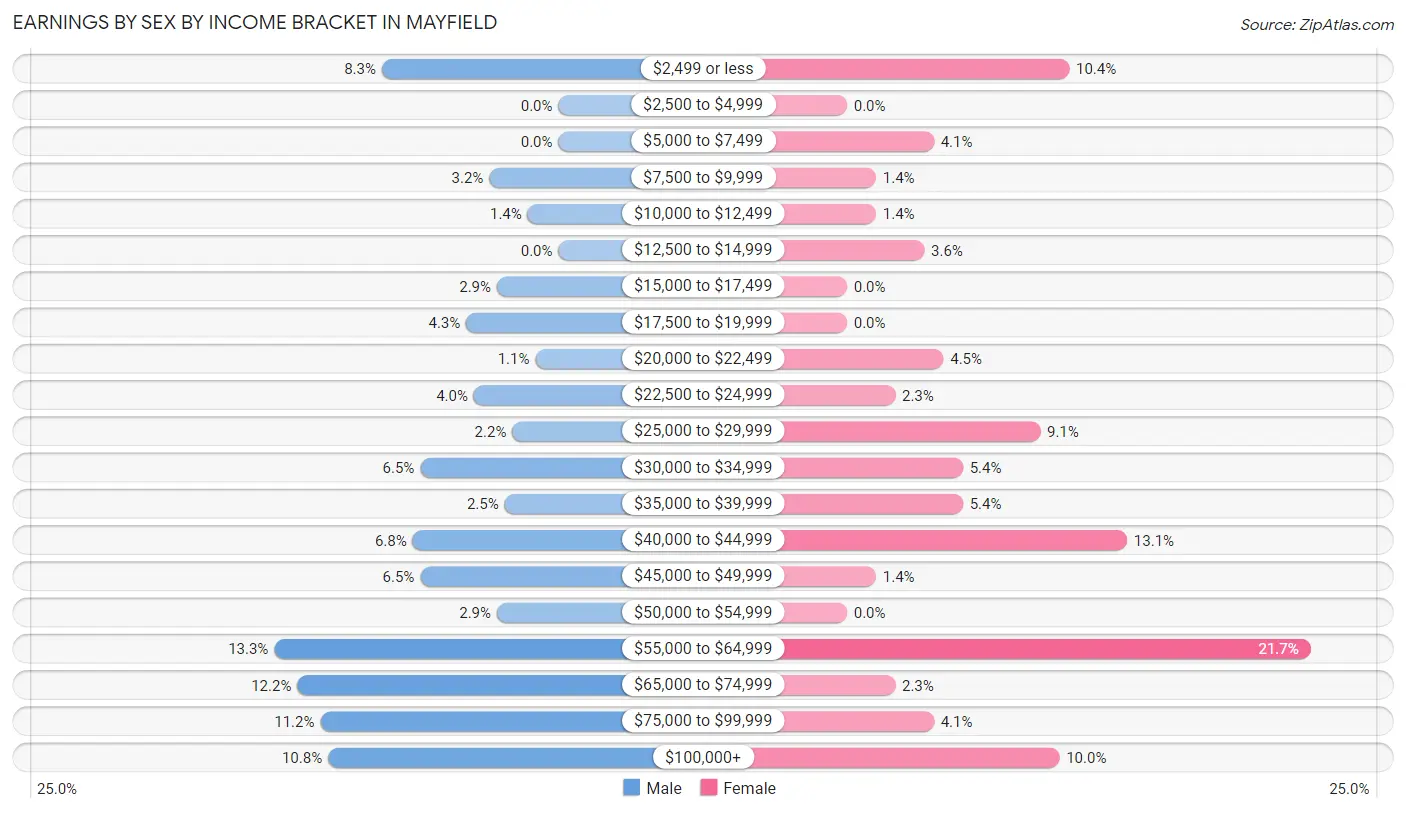
Earnings by Sex by Income Bracket in Mayfield
The most common earnings brackets in Mayfield are $55,000 to $64,999 for men (37 | 13.3%) and $55,000 to $64,999 for women (48 | 21.7%).
| Income | Male | Female |
| $2,499 or less | 23 (8.3%) | 23 (10.4%) |
| $2,500 to $4,999 | 0 (0.0%) | 0 (0.0%) |
| $5,000 to $7,499 | 0 (0.0%) | 9 (4.1%) |
| $7,500 to $9,999 | 9 (3.2%) | 3 (1.4%) |
| $10,000 to $12,499 | 4 (1.4%) | 3 (1.4%) |
| $12,500 to $14,999 | 0 (0.0%) | 8 (3.6%) |
| $15,000 to $17,499 | 8 (2.9%) | 0 (0.0%) |
| $17,500 to $19,999 | 12 (4.3%) | 0 (0.0%) |
| $20,000 to $22,499 | 3 (1.1%) | 10 (4.5%) |
| $22,500 to $24,999 | 11 (4.0%) | 5 (2.3%) |
| $25,000 to $29,999 | 6 (2.2%) | 20 (9.0%) |
| $30,000 to $34,999 | 18 (6.5%) | 12 (5.4%) |
| $35,000 to $39,999 | 7 (2.5%) | 12 (5.4%) |
| $40,000 to $44,999 | 19 (6.8%) | 29 (13.1%) |
| $45,000 to $49,999 | 18 (6.5%) | 3 (1.4%) |
| $50,000 to $54,999 | 8 (2.9%) | 0 (0.0%) |
| $55,000 to $64,999 | 37 (13.3%) | 48 (21.7%) |
| $65,000 to $74,999 | 34 (12.2%) | 5 (2.3%) |
| $75,000 to $99,999 | 31 (11.2%) | 9 (4.1%) |
| $100,000+ | 30 (10.8%) | 22 (10.0%) |
| Total | 278 (100.0%) | 221 (100.0%) |
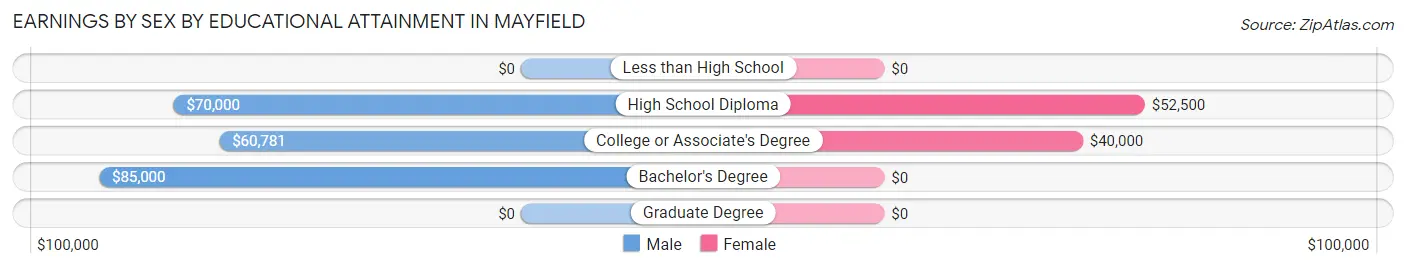
Earnings by Sex by Educational Attainment in Mayfield
Average earnings in Mayfield are $61,902 for men and $43,403 for women, a difference of 29.9%. Men with an educational attainment of bachelor's degree enjoy the highest average annual earnings of $85,000, while those with college or associate's degree education earn the least with $60,781. Women with an educational attainment of high school diploma earn the most with the average annual earnings of $52,500, while those with college or associate's degree education have the smallest earnings of $40,000.
| Educational Attainment | Male Income | Female Income |
| Less than High School | - | - |
| High School Diploma | $70,000 | $52,500 |
| College or Associate's Degree | $60,781 | $40,000 |
| Bachelor's Degree | $85,000 | $0 |
| Graduate Degree | - | - |
| Total | $61,902 | $43,403 |
Family Income in Mayfield
Family Income Brackets in Mayfield
According to the Mayfield family income data, there are 82 families falling into the $100,000 to $149,999 income range, which is the most common income bracket and makes up 33.5% of all families.
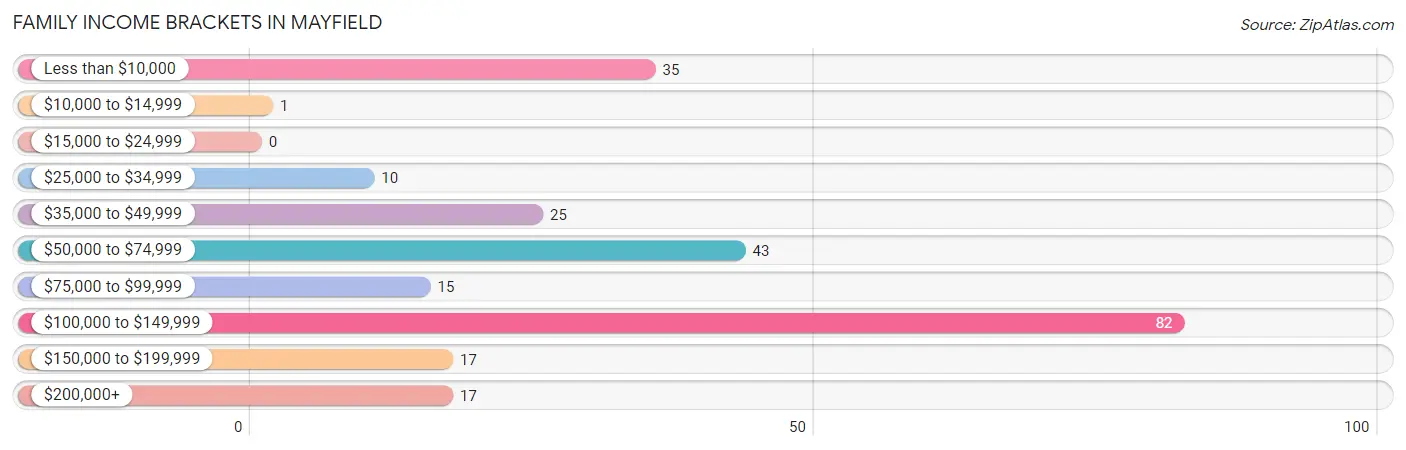
| Income Bracket | # Families | % Families |
| Less than $10,000 | 35 | 14.3% |
| $10,000 to $14,999 | 1 | 0.4% |
| $15,000 to $24,999 | 0 | 0.0% |
| $25,000 to $34,999 | 10 | 4.1% |
| $35,000 to $49,999 | 25 | 10.2% |
| $50,000 to $74,999 | 43 | 17.6% |
| $75,000 to $99,999 | 15 | 6.1% |
| $100,000 to $149,999 | 82 | 33.5% |
| $150,000 to $199,999 | 17 | 6.9% |
| $200,000+ | 17 | 6.9% |
Family Income by Famaliy Size in Mayfield
5-person families (21 | 8.6%) account for the highest median family income in Mayfield with $121,563 per family, while 2-person families (94 | 38.4%) have the highest median income of $29,375 per family member.
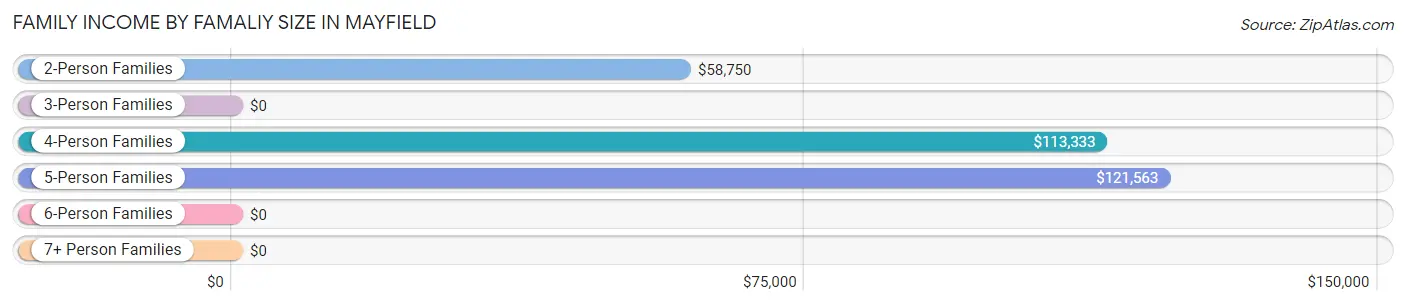
| Income Bracket | # Families | Median Income |
| 2-Person Families | 94 (38.4%) | $58,750 |
| 3-Person Families | 97 (39.6%) | $0 |
| 4-Person Families | 26 (10.6%) | $113,333 |
| 5-Person Families | 21 (8.6%) | $121,563 |
| 6-Person Families | 7 (2.9%) | $0 |
| 7+ Person Families | 0 (0.0%) | $0 |
| Total | 245 (100.0%) | $93,250 |
Family Income by Number of Earners in Mayfield
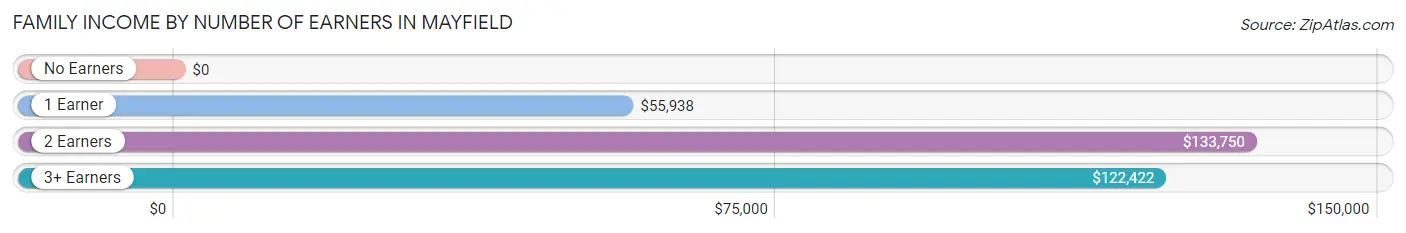
| Number of Earners | # Families | Median Income |
| No Earners | 59 (24.1%) | $0 |
| 1 Earner | 49 (20.0%) | $55,938 |
| 2 Earners | 92 (37.6%) | $133,750 |
| 3+ Earners | 45 (18.4%) | $122,422 |
| Total | 245 (100.0%) | $93,250 |
Household Income in Mayfield
Household Income Brackets in Mayfield
With 96 households falling in the category, the $100,000 to $149,999 income range is the most frequent in Mayfield, accounting for 26.7% of all households. In contrast, only 6 households (1.7%) fall into the $10,000 to $14,999 income bracket, making it the least populous group.
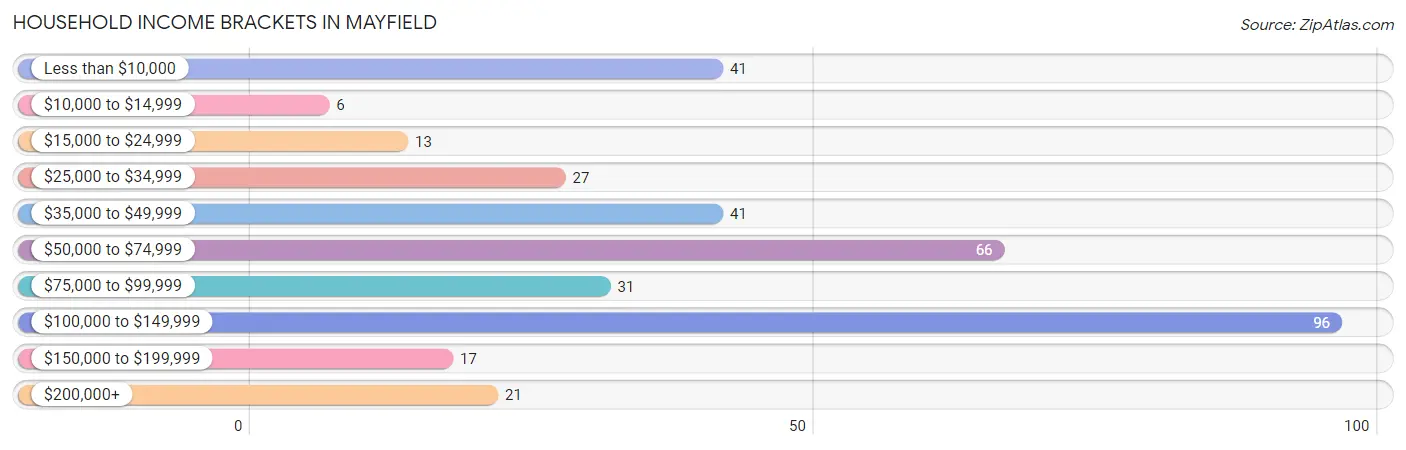
| Income Bracket | # Households | % Households |
| Less than $10,000 | 41 | 11.4% |
| $10,000 to $14,999 | 6 | 1.7% |
| $15,000 to $24,999 | 13 | 3.6% |
| $25,000 to $34,999 | 27 | 7.5% |
| $35,000 to $49,999 | 41 | 11.4% |
| $50,000 to $74,999 | 66 | 18.4% |
| $75,000 to $99,999 | 31 | 8.6% |
| $100,000 to $149,999 | 96 | 26.7% |
| $150,000 to $199,999 | 17 | 4.7% |
| $200,000+ | 21 | 5.8% |
Household Income by Householder Age in Mayfield
The median household income in Mayfield is $64,531, with the highest median household income of $120,417 found in the 45 to 64 years age bracket for the primary householder. A total of 122 households (34.0%) fall into this category. Meanwhile, the 15 to 24 years age bracket for the primary householder has the lowest median household income of $0, with 8 households (2.2%) in this group.
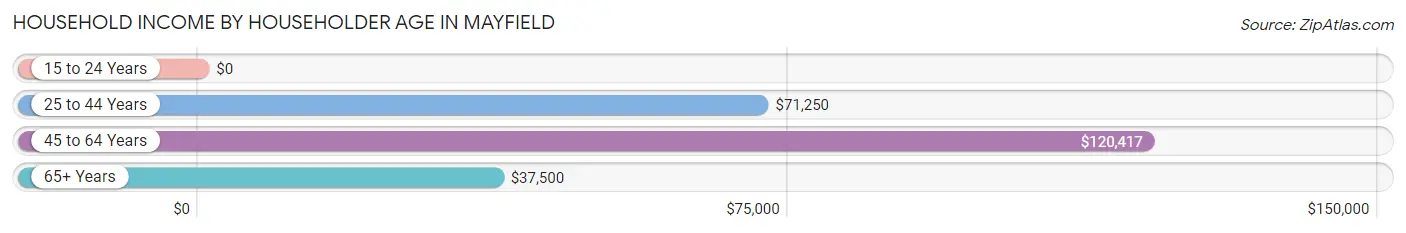
| Income Bracket | # Households | Median Income |
| 15 to 24 Years | 8 (2.2%) | $0 |
| 25 to 44 Years | 155 (43.2%) | $71,250 |
| 45 to 64 Years | 122 (34.0%) | $120,417 |
| 65+ Years | 74 (20.6%) | $37,500 |
| Total | 359 (100.0%) | $64,531 |
Poverty in Mayfield
Income Below Poverty by Sex and Age in Mayfield
With 18.9% poverty level for males and 13.5% for females among the residents of Mayfield, under 5 year old males and 5 year old females are the most vulnerable to poverty, with 53 males (70.7%) and 5 females (71.4%) in their respective age groups living below the poverty level.
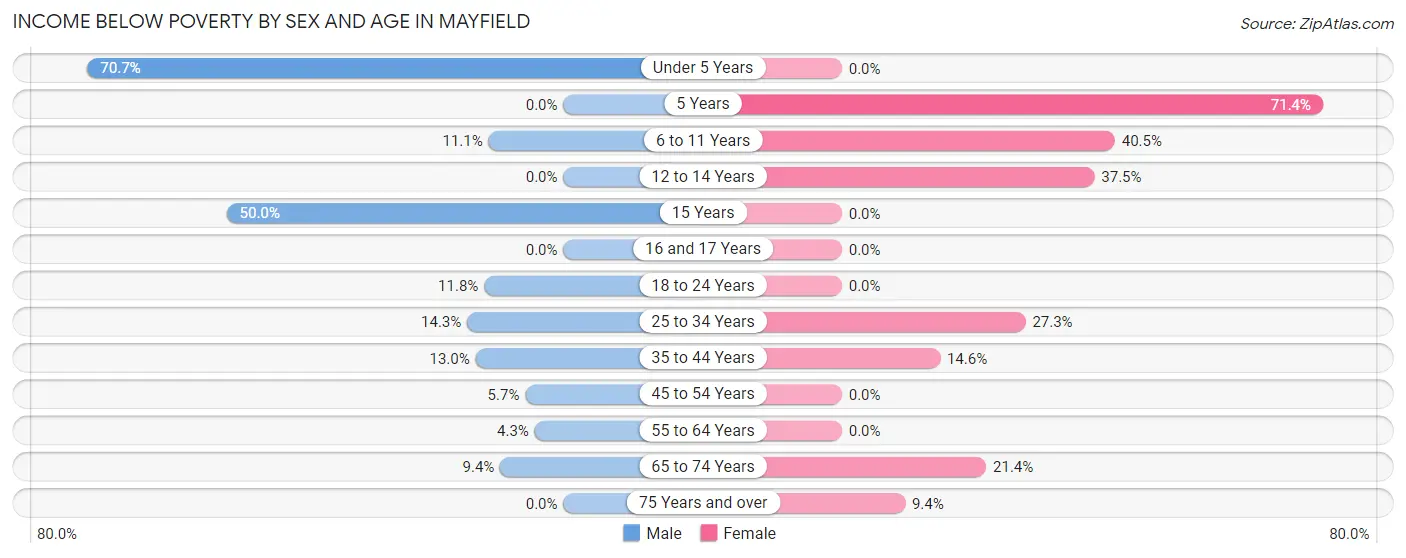
| Age Bracket | Male | Female |
| Under 5 Years | 53 (70.7%) | 0 (0.0%) |
| 5 Years | 0 (0.0%) | 5 (71.4%) |
| 6 to 11 Years | 3 (11.1%) | 15 (40.5%) |
| 12 to 14 Years | 0 (0.0%) | 3 (37.5%) |
| 15 Years | 2 (50.0%) | 0 (0.0%) |
| 16 and 17 Years | 0 (0.0%) | 0 (0.0%) |
| 18 to 24 Years | 4 (11.8%) | 0 (0.0%) |
| 25 to 34 Years | 13 (14.3%) | 24 (27.3%) |
| 35 to 44 Years | 6 (13.0%) | 7 (14.6%) |
| 45 to 54 Years | 3 (5.7%) | 0 (0.0%) |
| 55 to 64 Years | 2 (4.3%) | 0 (0.0%) |
| 65 to 74 Years | 3 (9.4%) | 6 (21.4%) |
| 75 Years and over | 0 (0.0%) | 3 (9.4%) |
| Total | 89 (18.9%) | 63 (13.5%) |
Income Above Poverty by Sex and Age in Mayfield
According to the poverty statistics in Mayfield, males aged 5 years and females aged under 5 years are the age groups that are most secure financially, with 100.0% of males and 100.0% of females in these age groups living above the poverty line.
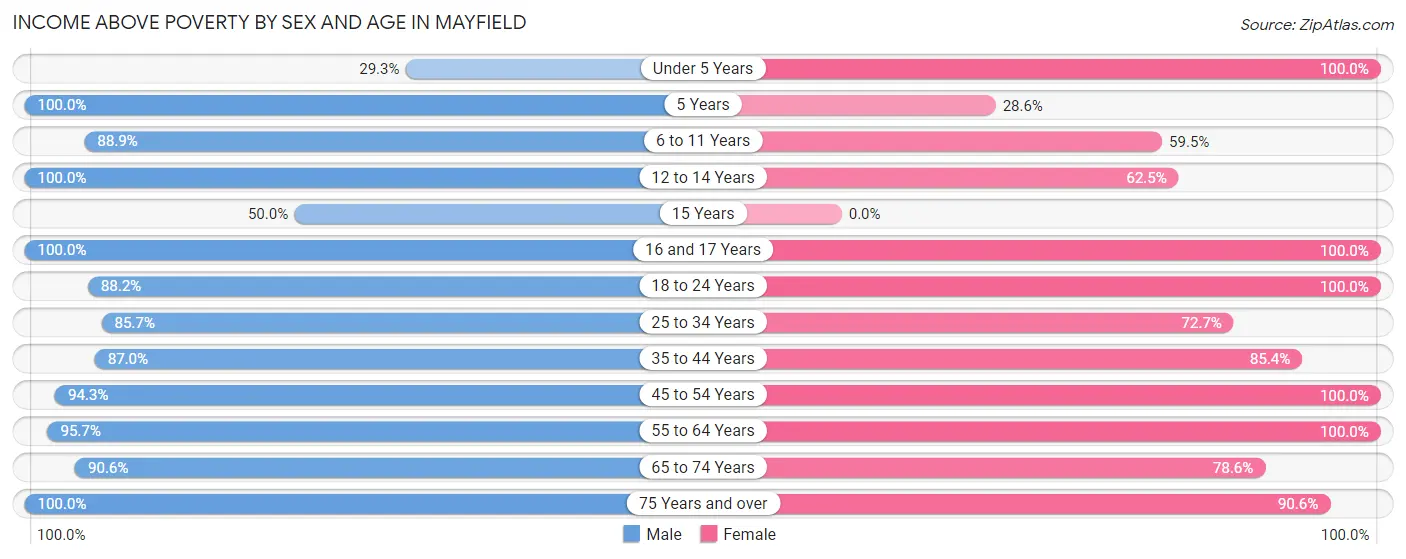
| Age Bracket | Male | Female |
| Under 5 Years | 22 (29.3%) | 35 (100.0%) |
| 5 Years | 6 (100.0%) | 2 (28.6%) |
| 6 to 11 Years | 24 (88.9%) | 22 (59.5%) |
| 12 to 14 Years | 16 (100.0%) | 5 (62.5%) |
| 15 Years | 2 (50.0%) | 0 (0.0%) |
| 16 and 17 Years | 19 (100.0%) | 6 (100.0%) |
| 18 to 24 Years | 30 (88.2%) | 55 (100.0%) |
| 25 to 34 Years | 78 (85.7%) | 64 (72.7%) |
| 35 to 44 Years | 40 (87.0%) | 41 (85.4%) |
| 45 to 54 Years | 50 (94.3%) | 62 (100.0%) |
| 55 to 64 Years | 45 (95.7%) | 61 (100.0%) |
| 65 to 74 Years | 29 (90.6%) | 22 (78.6%) |
| 75 Years and over | 20 (100.0%) | 29 (90.6%) |
| Total | 381 (81.1%) | 404 (86.5%) |
Income Below Poverty Among Married-Couple Families in Mayfield
The poverty statistics for married-couple families in Mayfield show that 3.3% or 6 of the total 181 families live below the poverty line. Families with 3 or 4 children have the highest poverty rate of 13.3%, comprising of 2 families. On the other hand, families with no children have the lowest poverty rate of 0.0%, which includes 0 families.
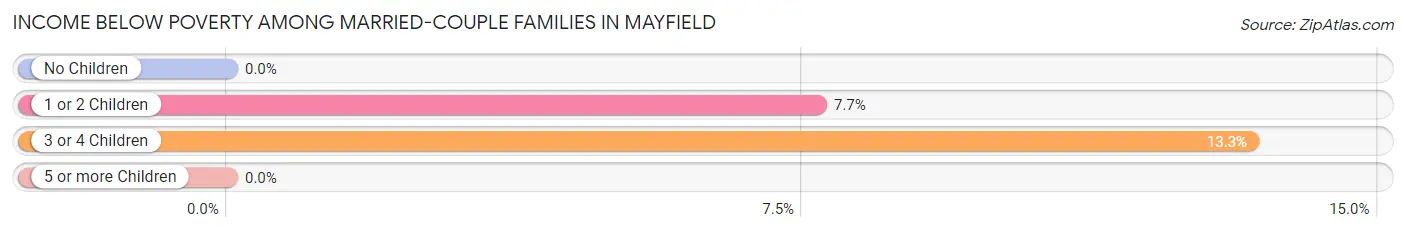
| Children | Above Poverty | Below Poverty |
| No Children | 114 (100.0%) | 0 (0.0%) |
| 1 or 2 Children | 48 (92.3%) | 4 (7.7%) |
| 3 or 4 Children | 13 (86.7%) | 2 (13.3%) |
| 5 or more Children | 0 (0.0%) | 0 (0.0%) |
| Total | 175 (96.7%) | 6 (3.3%) |
Income Below Poverty Among Single-Parent Households in Mayfield
According to the poverty data in Mayfield, 85.7% or 6 single-father households and 42.1% or 24 single-mother households are living below the poverty line. Among single-father households, those with 1 or 2 children have the highest poverty rate, with 6 households (85.7%) experiencing poverty. Likewise, among single-mother households, those with 1 or 2 children have the highest poverty rate, with 24 households (48.0%) falling below the poverty line.
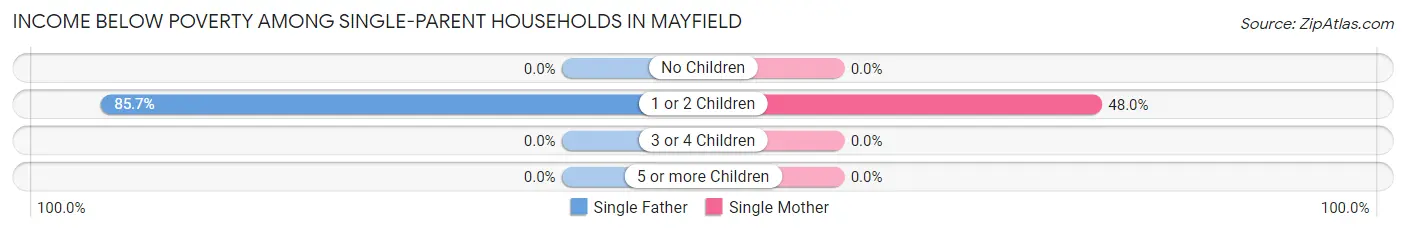
| Children | Single Father | Single Mother |
| No Children | 0 (0.0%) | 0 (0.0%) |
| 1 or 2 Children | 6 (85.7%) | 24 (48.0%) |
| 3 or 4 Children | 0 (0.0%) | 0 (0.0%) |
| 5 or more Children | 0 (0.0%) | 0 (0.0%) |
| Total | 6 (85.7%) | 24 (42.1%) |
Income Below Poverty Among Married-Couple vs Single-Parent Households in Mayfield
The poverty data for Mayfield shows that 6 of the married-couple family households (3.3%) and 30 of the single-parent households (46.9%) are living below the poverty level. Within the married-couple family households, those with 3 or 4 children have the highest poverty rate, with 2 households (13.3%) falling below the poverty line. Among the single-parent households, those with 1 or 2 children have the highest poverty rate, with 30 household (52.6%) living below poverty.
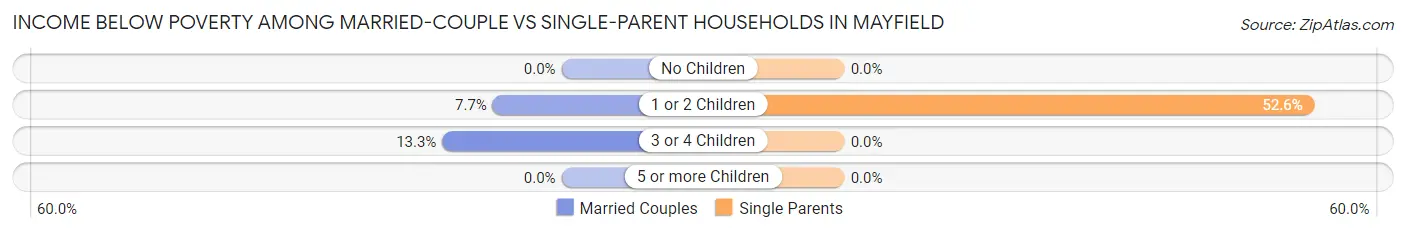
| Children | Married-Couple Families | Single-Parent Households |
| No Children | 0 (0.0%) | 0 (0.0%) |
| 1 or 2 Children | 4 (7.7%) | 30 (52.6%) |
| 3 or 4 Children | 2 (13.3%) | 0 (0.0%) |
| 5 or more Children | 0 (0.0%) | 0 (0.0%) |
| Total | 6 (3.3%) | 30 (46.9%) |
Race in Mayfield
The most populous races in Mayfield are White / Caucasian (895 | 95.4%), Hispanic or Latino (48 | 5.1%), and Two or more Races (41 | 4.4%).
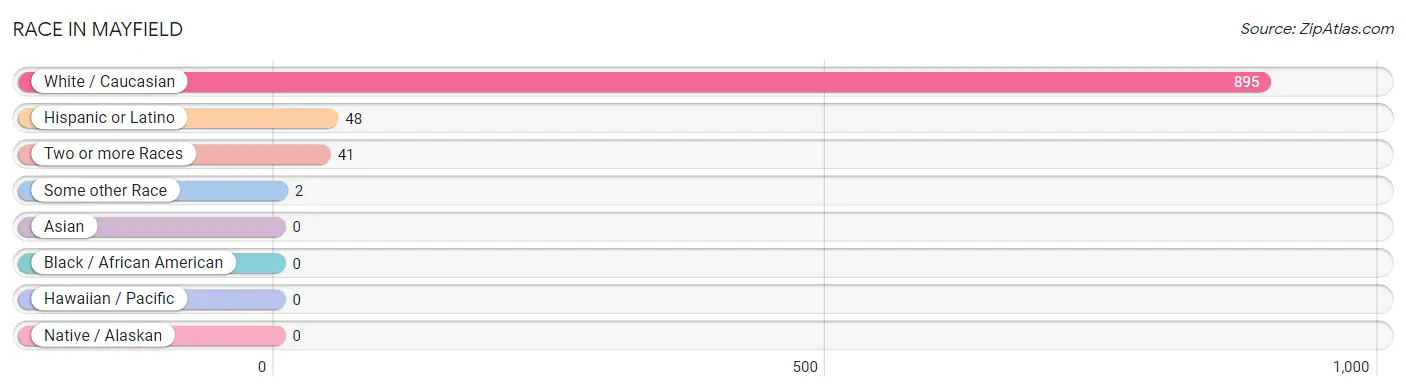
| Race | # Population | % Population |
| Asian | 0 | 0.0% |
| Black / African American | 0 | 0.0% |
| Hawaiian / Pacific | 0 | 0.0% |
| Hispanic or Latino | 48 | 5.1% |
| Native / Alaskan | 0 | 0.0% |
| White / Caucasian | 895 | 95.4% |
| Two or more Races | 41 | 4.4% |
| Some other Race | 2 | 0.2% |
| Total | 938 | 100.0% |
Ancestry in Mayfield
The most populous ancestries reported in Mayfield are Irish (245 | 26.1%), German (237 | 25.3%), American (130 | 13.9%), English (94 | 10.0%), and French (91 | 9.7%), together accounting for 85.0% of all Mayfield residents.
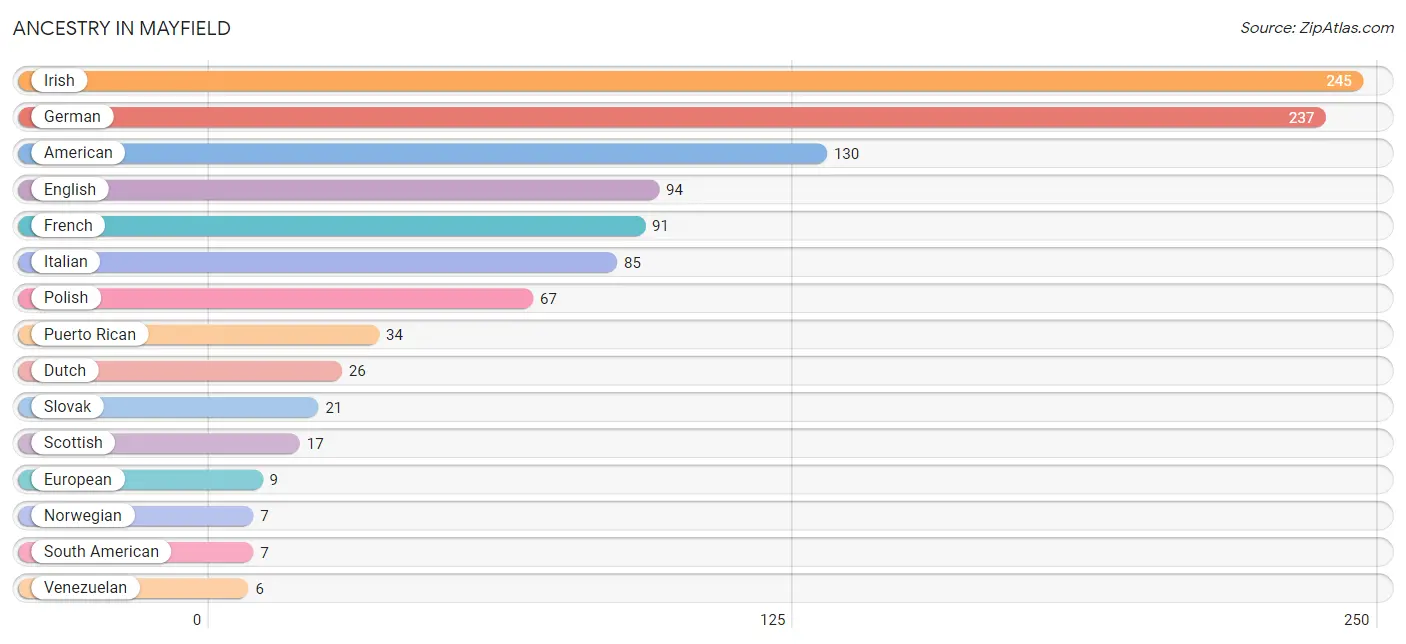
| Ancestry | # Population | % Population |
| American | 130 | 13.9% |
| Austrian | 3 | 0.3% |
| Colombian | 1 | 0.1% |
| Dominican | 5 | 0.5% |
| Dutch | 26 | 2.8% |
| English | 94 | 10.0% |
| European | 9 | 1.0% |
| Finnish | 4 | 0.4% |
| French | 91 | 9.7% |
| French Canadian | 5 | 0.5% |
| German | 237 | 25.3% |
| Irish | 245 | 26.1% |
| Italian | 85 | 9.1% |
| Mexican | 2 | 0.2% |
| Norwegian | 7 | 0.7% |
| Polish | 67 | 7.1% |
| Puerto Rican | 34 | 3.6% |
| Romanian | 4 | 0.4% |
| Scandinavian | 3 | 0.3% |
| Scottish | 17 | 1.8% |
| Slavic | 2 | 0.2% |
| Slovak | 21 | 2.2% |
| South American | 7 | 0.7% |
| Swiss | 1 | 0.1% |
| Ukrainian | 3 | 0.3% |
| Venezuelan | 6 | 0.6% |
| Yugoslavian | 4 | 0.4% | View All 27 Rows |
Immigrants in Mayfield
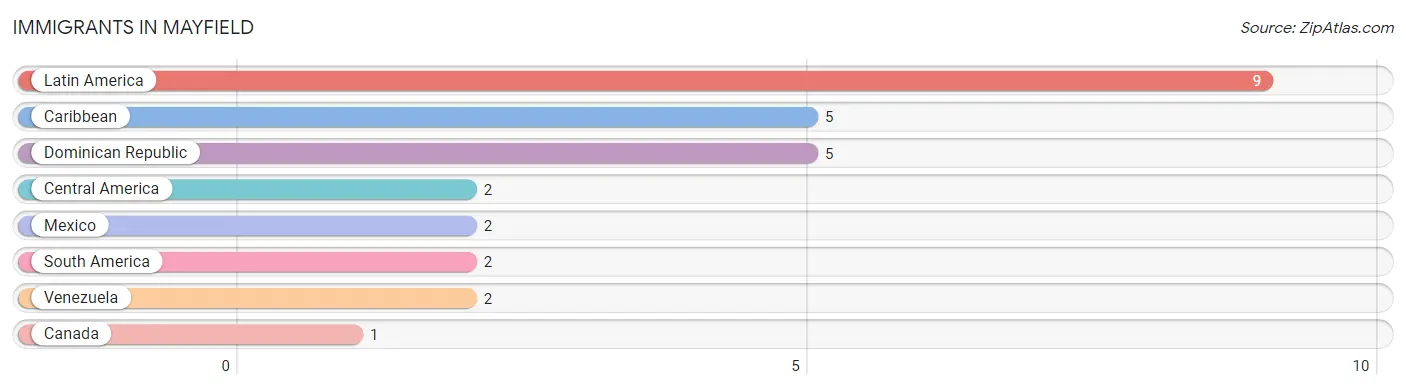
The most numerous immigrant groups reported in Mayfield came from Latin America (9 | 1.0%), Caribbean (5 | 0.5%), Dominican Republic (5 | 0.5%), Central America (2 | 0.2%), and Mexico (2 | 0.2%), together accounting for 2.4% of all Mayfield residents.
| Immigration Origin | # Population | % Population |
| Canada | 1 | 0.1% |
| Caribbean | 5 | 0.5% |
| Central America | 2 | 0.2% |
| Dominican Republic | 5 | 0.5% |
| Latin America | 9 | 1.0% |
| Mexico | 2 | 0.2% |
| South America | 2 | 0.2% |
| Venezuela | 2 | 0.2% | View All 8 Rows |
Sex and Age in Mayfield
Sex and Age in Mayfield
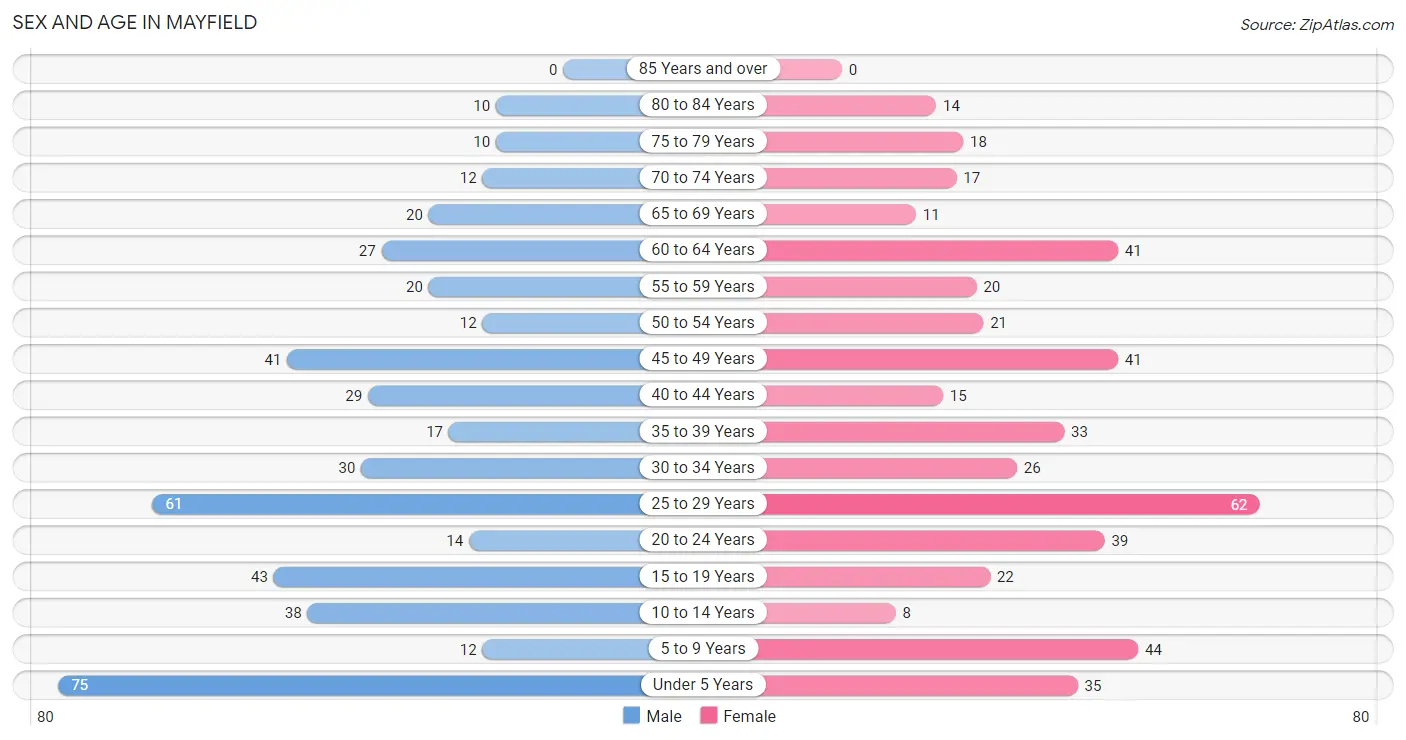
The most populous age groups in Mayfield are Under 5 Years (75 | 15.9%) for men and 25 to 29 Years (62 | 13.3%) for women.
| Age Bracket | Male | Female |
| Under 5 Years | 75 (15.9%) | 35 (7.5%) |
| 5 to 9 Years | 12 (2.5%) | 44 (9.4%) |
| 10 to 14 Years | 38 (8.1%) | 8 (1.7%) |
| 15 to 19 Years | 43 (9.1%) | 22 (4.7%) |
| 20 to 24 Years | 14 (3.0%) | 39 (8.4%) |
| 25 to 29 Years | 61 (13.0%) | 62 (13.3%) |
| 30 to 34 Years | 30 (6.4%) | 26 (5.6%) |
| 35 to 39 Years | 17 (3.6%) | 33 (7.1%) |
| 40 to 44 Years | 29 (6.2%) | 15 (3.2%) |
| 45 to 49 Years | 41 (8.7%) | 41 (8.8%) |
| 50 to 54 Years | 12 (2.5%) | 21 (4.5%) |
| 55 to 59 Years | 20 (4.3%) | 20 (4.3%) |
| 60 to 64 Years | 27 (5.7%) | 41 (8.8%) |
| 65 to 69 Years | 20 (4.3%) | 11 (2.4%) |
| 70 to 74 Years | 12 (2.5%) | 17 (3.6%) |
| 75 to 79 Years | 10 (2.1%) | 18 (3.8%) |
| 80 to 84 Years | 10 (2.1%) | 14 (3.0%) |
| 85 Years and over | 0 (0.0%) | 0 (0.0%) |
| Total | 471 (100.0%) | 467 (100.0%) |
Families and Households in Mayfield
Median Family Size in Mayfield
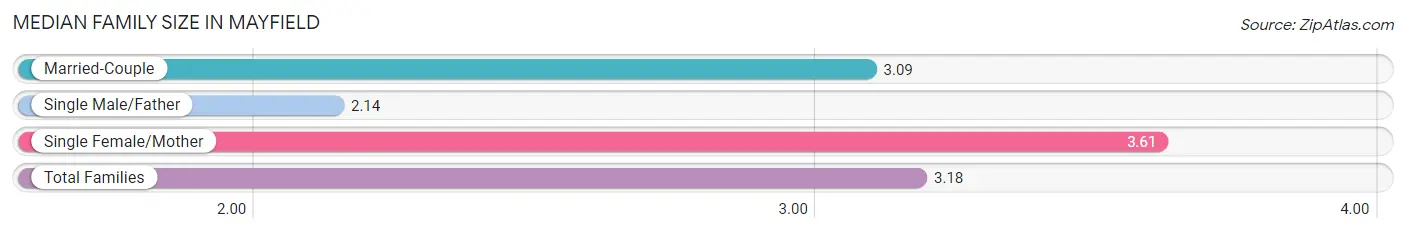
The median family size in Mayfield is 3.18 persons per family, with single female/mother families (57 | 23.3%) accounting for the largest median family size of 3.61 persons per family. On the other hand, single male/father families (7 | 2.9%) represent the smallest median family size with 2.14 persons per family.
| Family Type | # Families | Family Size |
| Married-Couple | 181 (73.9%) | 3.09 |
| Single Male/Father | 7 (2.9%) | 2.14 |
| Single Female/Mother | 57 (23.3%) | 3.61 |
| Total Families | 245 (100.0%) | 3.18 |
Median Household Size in Mayfield
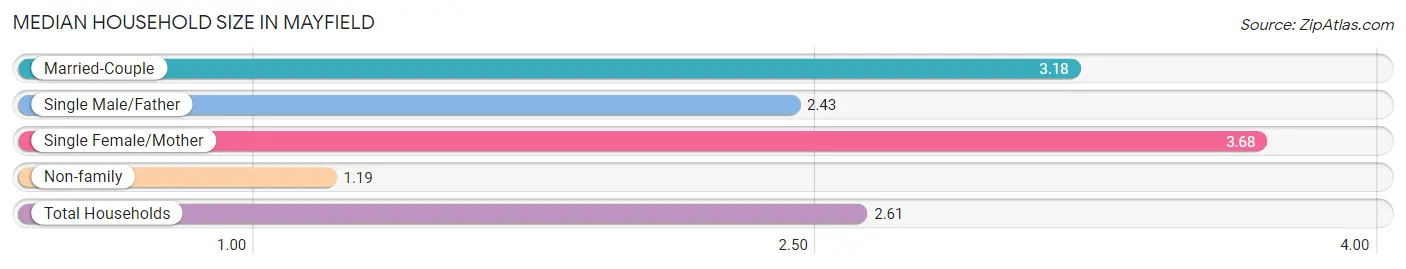
The median household size in Mayfield is 2.61 persons per household, with single female/mother households (57 | 15.9%) accounting for the largest median household size of 3.68 persons per household. non-family households (114 | 31.8%) represent the smallest median household size with 1.19 persons per household.
| Household Type | # Households | Household Size |
| Married-Couple | 181 (50.4%) | 3.18 |
| Single Male/Father | 7 (1.9%) | 2.43 |
| Single Female/Mother | 57 (15.9%) | 3.68 |
| Non-family | 114 (31.8%) | 1.19 |
| Total Households | 359 (100.0%) | 2.61 |
Household Size by Marriage Status in Mayfield
Out of a total of 359 households in Mayfield, 245 (68.2%) are family households, while 114 (31.8%) are nonfamily households. The most numerous type of family households are 2-person households, comprising 94, and the most common type of nonfamily households are 1-person households, comprising 91.
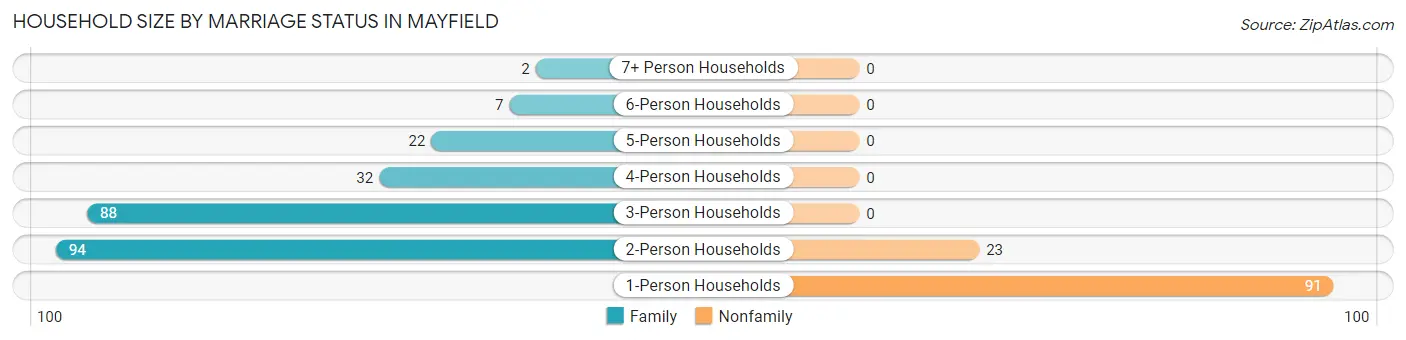
| Household Size | Family Households | Nonfamily Households |
| 1-Person Households | - | 91 (25.4%) |
| 2-Person Households | 94 (26.2%) | 23 (6.4%) |
| 3-Person Households | 88 (24.5%) | 0 (0.0%) |
| 4-Person Households | 32 (8.9%) | 0 (0.0%) |
| 5-Person Households | 22 (6.1%) | 0 (0.0%) |
| 6-Person Households | 7 (1.9%) | 0 (0.0%) |
| 7+ Person Households | 2 (0.6%) | 0 (0.0%) |
| Total | 245 (68.2%) | 114 (31.8%) |
Female Fertility in Mayfield
Fertility by Age in Mayfield
Average fertility rate in Mayfield is 25.0 births per 1,000 women. Women in the age bracket of 35 to 50 years have the highest fertility rate with 45.0 births per 1,000 women. Women in the age bracket of 35 to 50 years acount for 66.7% of all women with births.
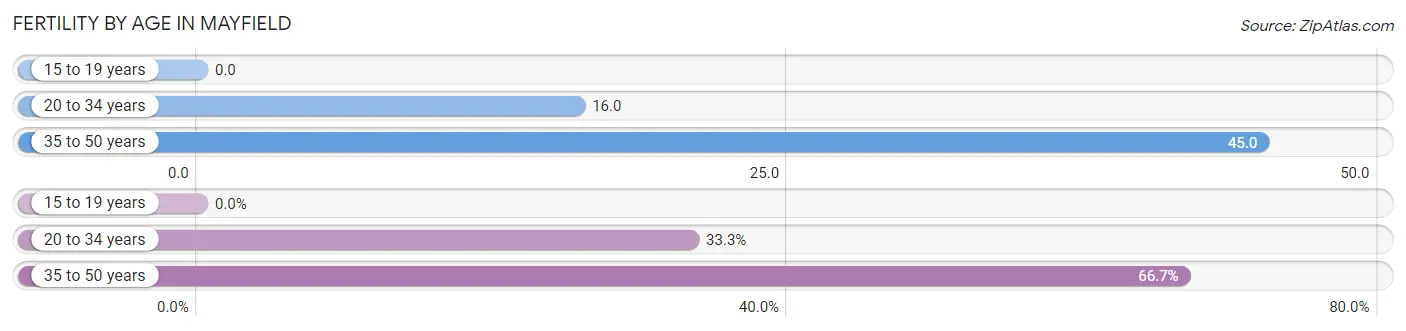
| Age Bracket | Women with Births | Births / 1,000 Women |
| 15 to 19 years | 0 (0.0%) | 0.0 |
| 20 to 34 years | 2 (33.3%) | 16.0 |
| 35 to 50 years | 4 (66.7%) | 45.0 |
| Total | 6 (100.0%) | 25.0 |
Fertility by Age by Marriage Status in Mayfield
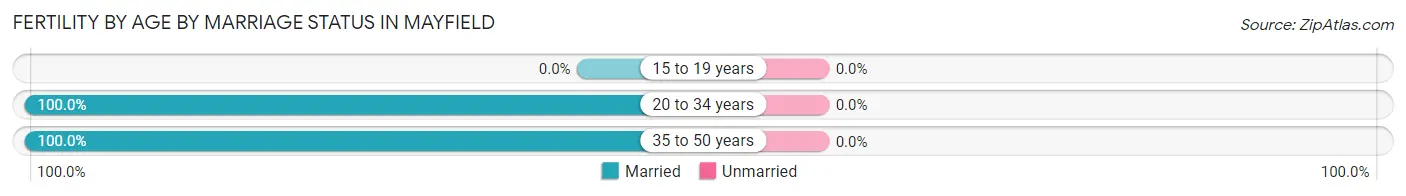
| Age Bracket | Married | Unmarried |
| 15 to 19 years | 0 (0.0%) | 0 (0.0%) |
| 20 to 34 years | 2 (100.0%) | 0 (0.0%) |
| 35 to 50 years | 4 (100.0%) | 0 (0.0%) |
| Total | 6 (100.0%) | 0 (0.0%) |
Fertility by Education in Mayfield
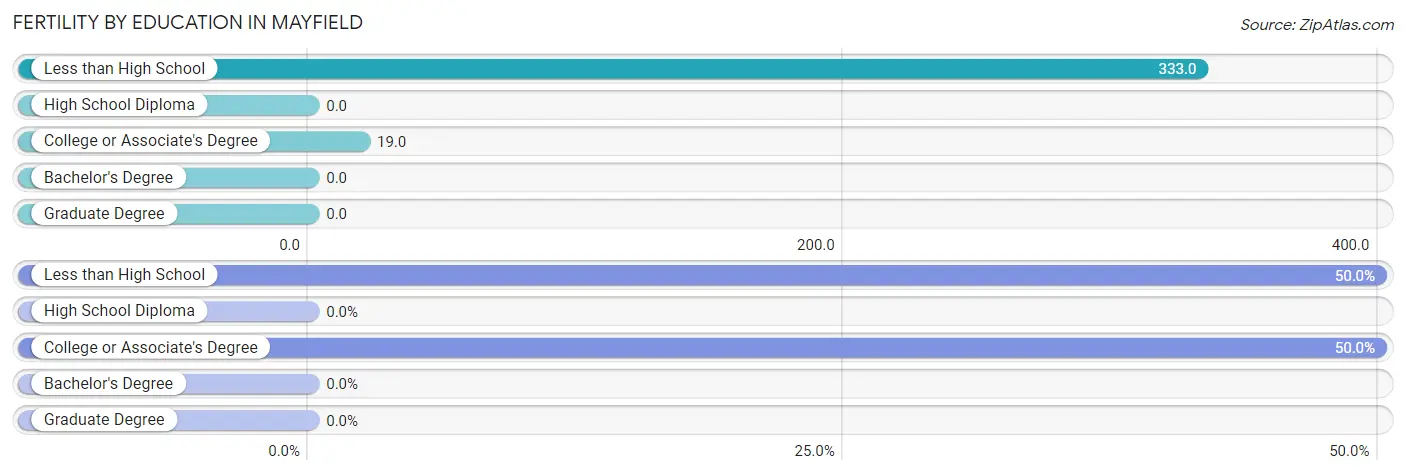
| Educational Attainment | Women with Births | Births / 1,000 Women |
| Less than High School | 3 (50.0%) | 333.0 |
| High School Diploma | 0 (0.0%) | 0.0 |
| College or Associate's Degree | 3 (50.0%) | 19.0 |
| Bachelor's Degree | 0 (0.0%) | 0.0 |
| Graduate Degree | 0 (0.0%) | 0.0 |
| Total | 6 (100.0%) | 25.0 |
Fertility by Education by Marriage Status in Mayfield
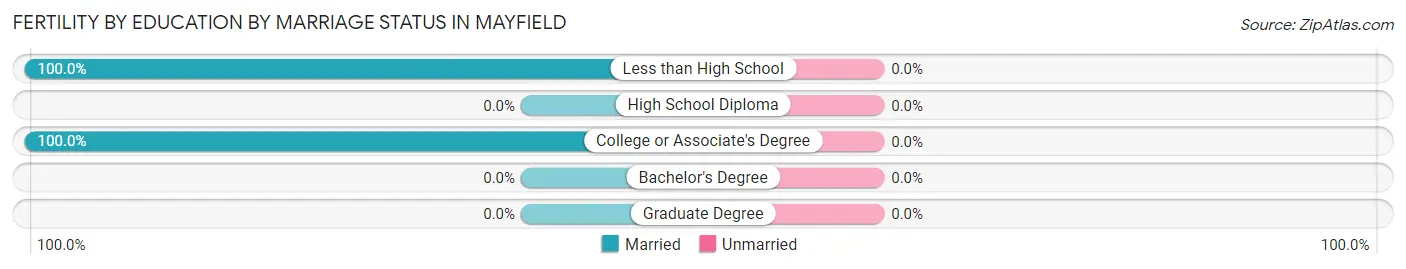
| Educational Attainment | Married | Unmarried |
| Less than High School | 3 (100.0%) | 0 (0.0%) |
| High School Diploma | 0 (0.0%) | 0 (0.0%) |
| College or Associate's Degree | 3 (100.0%) | 0 (0.0%) |
| Bachelor's Degree | 0 (0.0%) | 0 (0.0%) |
| Graduate Degree | 0 (0.0%) | 0 (0.0%) |
| Total | 6 (100.0%) | 0 (0.0%) |
Employment Characteristics in Mayfield
Employment by Class of Employer in Mayfield
Among the 437 employed individuals in Mayfield, private company employees (269 | 61.6%), not-for-profit organizations (51 | 11.7%), and self-employed (not incorporated) (48 | 11.0%) make up the most common classes of employment.
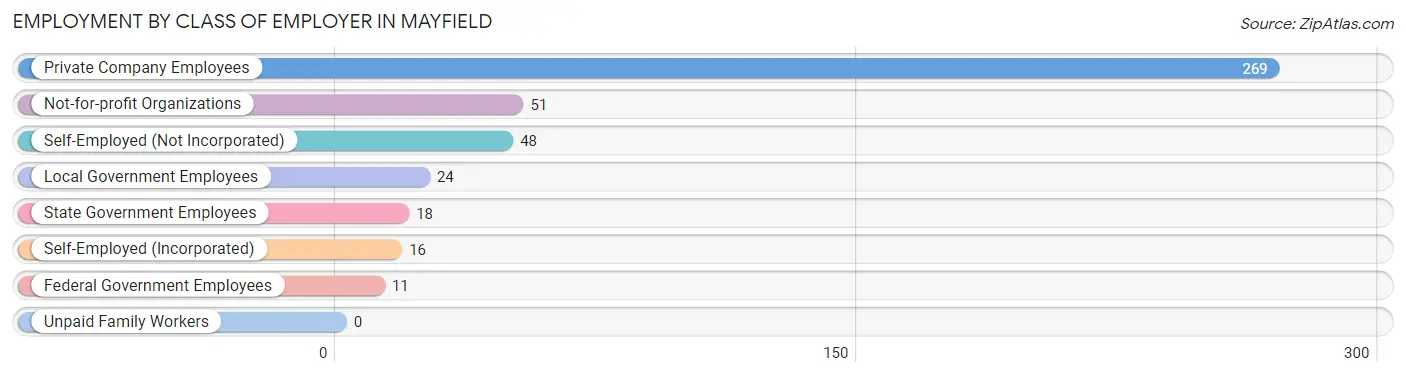
| Employer Class | # Employees | % Employees |
| Private Company Employees | 269 | 61.6% |
| Self-Employed (Incorporated) | 16 | 3.7% |
| Self-Employed (Not Incorporated) | 48 | 11.0% |
| Not-for-profit Organizations | 51 | 11.7% |
| Local Government Employees | 24 | 5.5% |
| State Government Employees | 18 | 4.1% |
| Federal Government Employees | 11 | 2.5% |
| Unpaid Family Workers | 0 | 0.0% |
| Total | 437 | 100.0% |
Employment Status by Age in Mayfield
According to the labor force statistics for Mayfield, out of the total population over 16 years of age (722), 64.1% or 463 individuals are in the labor force, with 3.9% or 18 of them unemployed. The age group with the highest labor force participation rate is 30 to 34 years, with 96.4% or 54 individuals in the labor force. Within the labor force, the 25 to 29 years age range has the highest percentage of unemployed individuals, with 17.1% or 14 of them being unemployed.
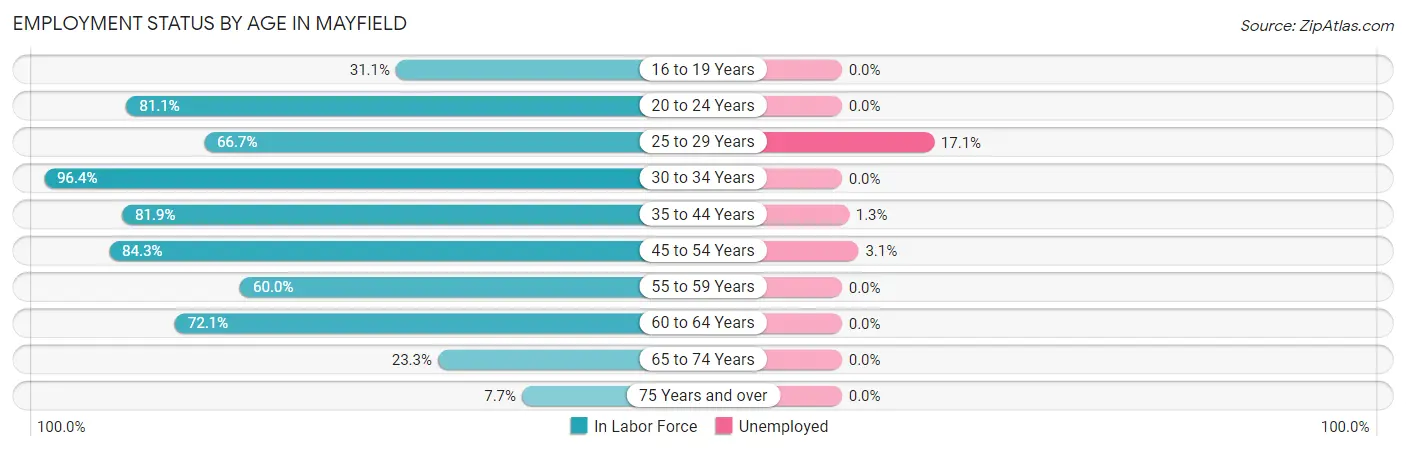
| Age Bracket | In Labor Force | Unemployed |
| 16 to 19 Years | 19 (31.1%) | 0 (0.0%) |
| 20 to 24 Years | 43 (81.1%) | 0 (0.0%) |
| 25 to 29 Years | 82 (66.7%) | 14 (17.1%) |
| 30 to 34 Years | 54 (96.4%) | 0 (0.0%) |
| 35 to 44 Years | 77 (81.9%) | 1 (1.3%) |
| 45 to 54 Years | 97 (84.3%) | 3 (3.1%) |
| 55 to 59 Years | 24 (60.0%) | 0 (0.0%) |
| 60 to 64 Years | 49 (72.1%) | 0 (0.0%) |
| 65 to 74 Years | 14 (23.3%) | 0 (0.0%) |
| 75 Years and over | 4 (7.7%) | 0 (0.0%) |
| Total | 463 (64.1%) | 18 (3.9%) |
Employment Status by Educational Attainment in Mayfield
According to labor force statistics for Mayfield, 77.2% of individuals (383) out of the total population between 25 and 64 years of age (496) are in the labor force, with 4.7% or 18 of them being unemployed. The group with the highest labor force participation rate are those with the educational attainment of bachelor's degree or higher, with 92.8% or 90 individuals in the labor force. Within the labor force, individuals with high school diploma education have the highest percentage of unemployment, with 15.5% or 15 of them being unemployed.
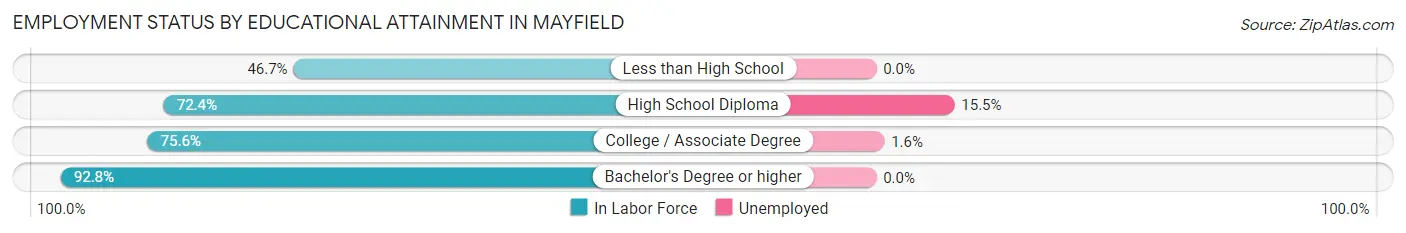
| Educational Attainment | In Labor Force | Unemployed |
| Less than High School | 7 (46.7%) | 0 (0.0%) |
| High School Diploma | 97 (72.4%) | 21 (15.5%) |
| College / Associate Degree | 189 (75.6%) | 4 (1.6%) |
| Bachelor's Degree or higher | 90 (92.8%) | 0 (0.0%) |
| Total | 383 (77.2%) | 23 (4.7%) |
Employment Occupations by Sex in Mayfield
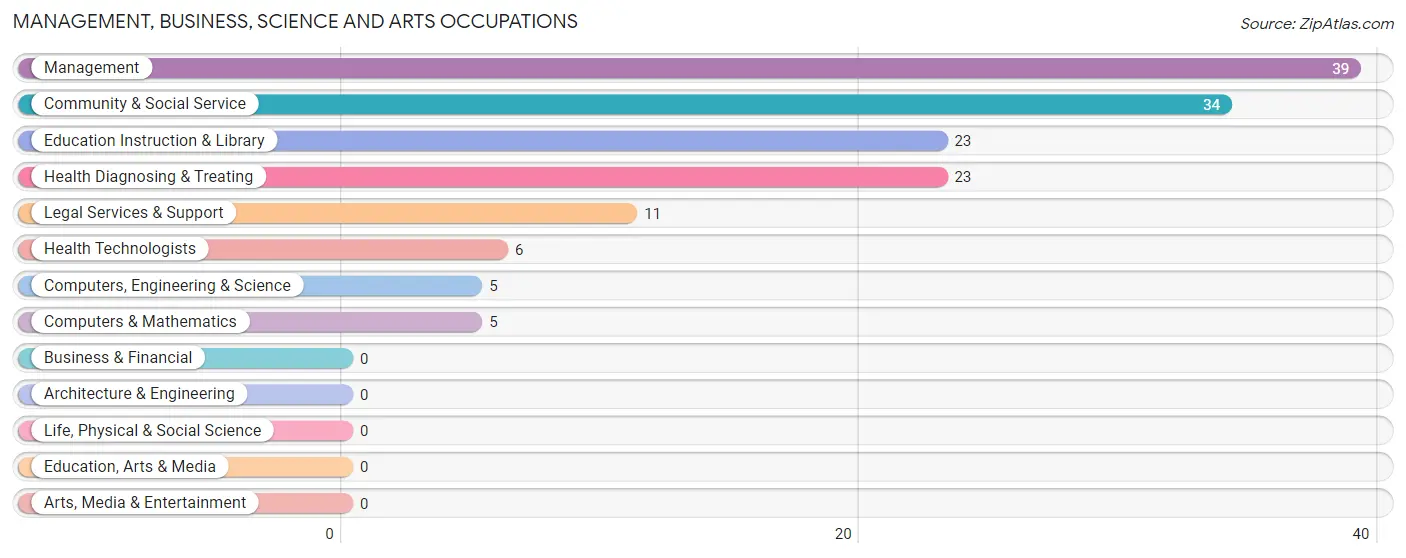
Management, Business, Science and Arts Occupations
The most common Management, Business, Science and Arts occupations in Mayfield are Management (39 | 8.8%), Community & Social Service (34 | 7.6%), Education Instruction & Library (23 | 5.2%), Health Diagnosing & Treating (23 | 5.2%), and Legal Services & Support (11 | 2.5%).
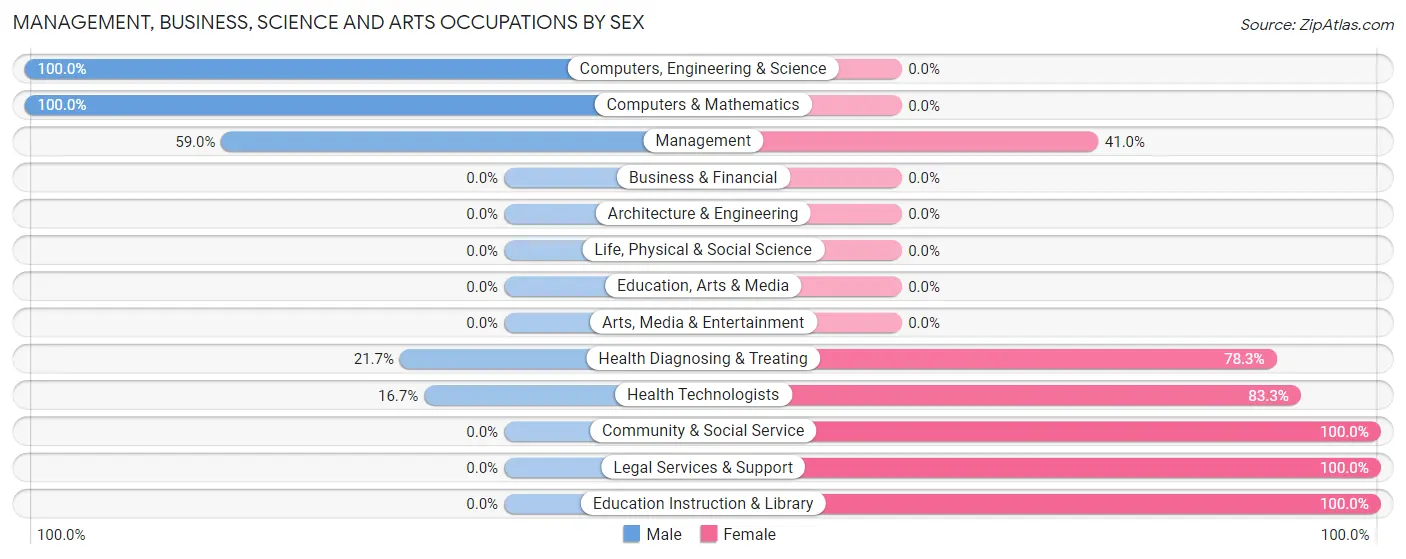
Management, Business, Science and Arts Occupations by Sex
Within the Management, Business, Science and Arts occupations in Mayfield, the most male-oriented occupations are Computers, Engineering & Science (100.0%), Computers & Mathematics (100.0%), and Management (59.0%), while the most female-oriented occupations are Community & Social Service (100.0%), Legal Services & Support (100.0%), and Education Instruction & Library (100.0%).
| Occupation | Male | Female |
| Management | 23 (59.0%) | 16 (41.0%) |
| Business & Financial | 0 (0.0%) | 0 (0.0%) |
| Computers, Engineering & Science | 5 (100.0%) | 0 (0.0%) |
| Computers & Mathematics | 5 (100.0%) | 0 (0.0%) |
| Architecture & Engineering | 0 (0.0%) | 0 (0.0%) |
| Life, Physical & Social Science | 0 (0.0%) | 0 (0.0%) |
| Community & Social Service | 0 (0.0%) | 34 (100.0%) |
| Education, Arts & Media | 0 (0.0%) | 0 (0.0%) |
| Legal Services & Support | 0 (0.0%) | 11 (100.0%) |
| Education Instruction & Library | 0 (0.0%) | 23 (100.0%) |
| Arts, Media & Entertainment | 0 (0.0%) | 0 (0.0%) |
| Health Diagnosing & Treating | 5 (21.7%) | 18 (78.3%) |
| Health Technologists | 1 (16.7%) | 5 (83.3%) |
| Total (Category) | 33 (32.7%) | 68 (67.3%) |
| Total (Overall) | 234 (52.6%) | 211 (47.4%) |
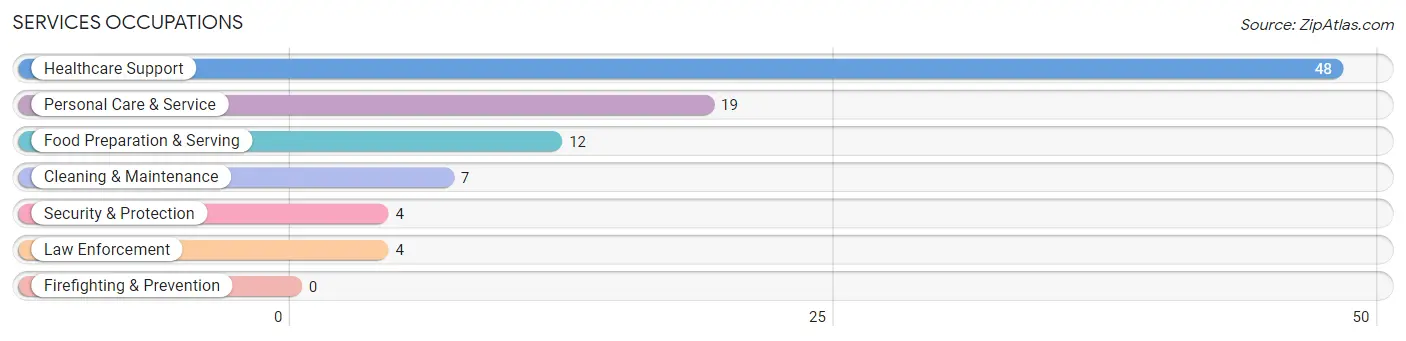
Services Occupations
The most common Services occupations in Mayfield are Healthcare Support (48 | 10.8%), Personal Care & Service (19 | 4.3%), Food Preparation & Serving (12 | 2.7%), Cleaning & Maintenance (7 | 1.6%), and Security & Protection (4 | 0.9%).
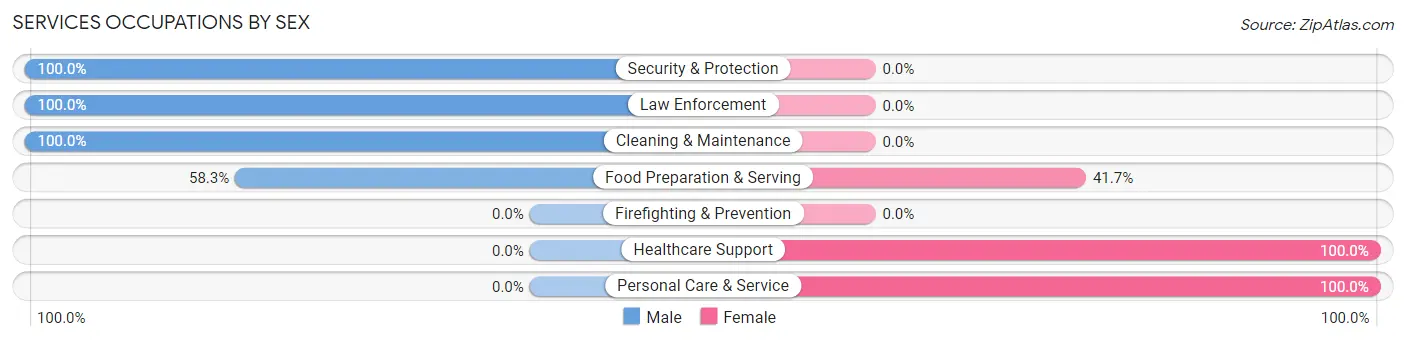
Services Occupations by Sex
Within the Services occupations in Mayfield, the most male-oriented occupations are Security & Protection (100.0%), Law Enforcement (100.0%), and Cleaning & Maintenance (100.0%), while the most female-oriented occupations are Healthcare Support (100.0%), Personal Care & Service (100.0%), and Food Preparation & Serving (41.7%).
| Occupation | Male | Female |
| Healthcare Support | 0 (0.0%) | 48 (100.0%) |
| Security & Protection | 4 (100.0%) | 0 (0.0%) |
| Firefighting & Prevention | 0 (0.0%) | 0 (0.0%) |
| Law Enforcement | 4 (100.0%) | 0 (0.0%) |
| Food Preparation & Serving | 7 (58.3%) | 5 (41.7%) |
| Cleaning & Maintenance | 7 (100.0%) | 0 (0.0%) |
| Personal Care & Service | 0 (0.0%) | 19 (100.0%) |
| Total (Category) | 18 (20.0%) | 72 (80.0%) |
| Total (Overall) | 234 (52.6%) | 211 (47.4%) |
Sales and Office Occupations
The most common Sales and Office occupations in Mayfield are Office & Administration (61 | 13.7%), and Sales & Related (19 | 4.3%).
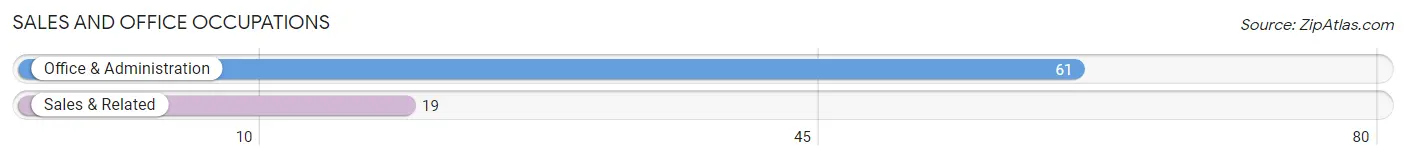
Sales and Office Occupations by Sex

| Occupation | Male | Female |
| Sales & Related | 4 (21.0%) | 15 (78.9%) |
| Office & Administration | 11 (18.0%) | 50 (82.0%) |
| Total (Category) | 15 (18.8%) | 65 (81.2%) |
| Total (Overall) | 234 (52.6%) | 211 (47.4%) |
Natural Resources, Construction and Maintenance Occupations
The most common Natural Resources, Construction and Maintenance occupations in Mayfield are Installation, Maintenance & Repair (51 | 11.5%), and Construction & Extraction (28 | 6.3%).
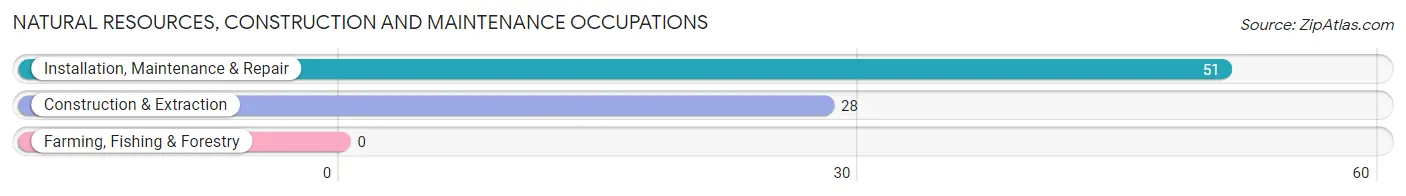
Natural Resources, Construction and Maintenance Occupations by Sex
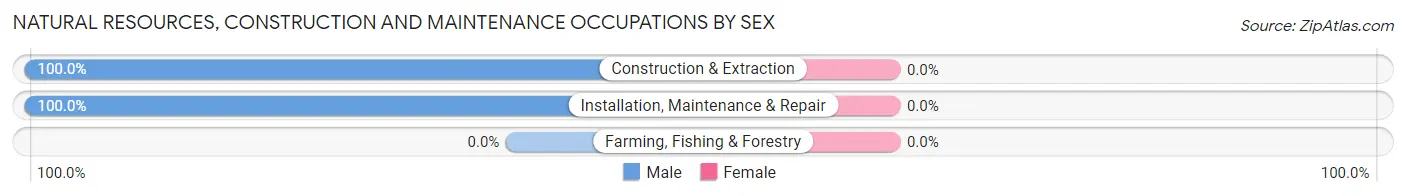
| Occupation | Male | Female |
| Farming, Fishing & Forestry | 0 (0.0%) | 0 (0.0%) |
| Construction & Extraction | 28 (100.0%) | 0 (0.0%) |
| Installation, Maintenance & Repair | 51 (100.0%) | 0 (0.0%) |
| Total (Category) | 79 (100.0%) | 0 (0.0%) |
| Total (Overall) | 234 (52.6%) | 211 (47.4%) |
Production, Transportation and Moving Occupations
The most common Production, Transportation and Moving occupations in Mayfield are Transportation (38 | 8.5%), Production (34 | 7.6%), and Material Moving (23 | 5.2%).
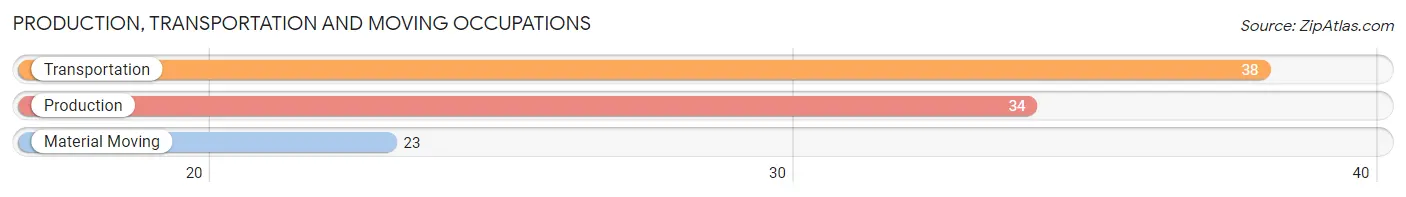
Production, Transportation and Moving Occupations by Sex
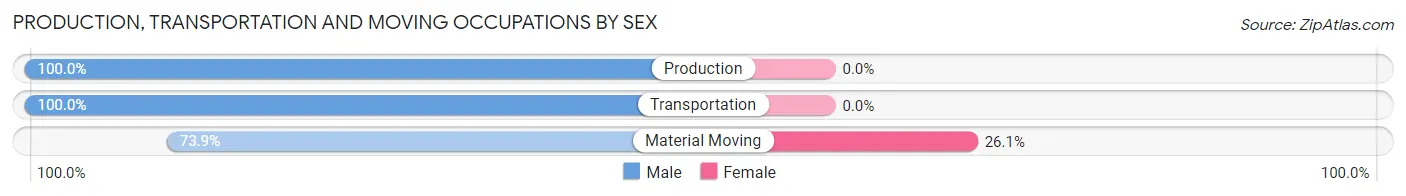
| Occupation | Male | Female |
| Production | 34 (100.0%) | 0 (0.0%) |
| Transportation | 38 (100.0%) | 0 (0.0%) |
| Material Moving | 17 (73.9%) | 6 (26.1%) |
| Total (Category) | 89 (93.7%) | 6 (6.3%) |
| Total (Overall) | 234 (52.6%) | 211 (47.4%) |
Employment Industries by Sex in Mayfield
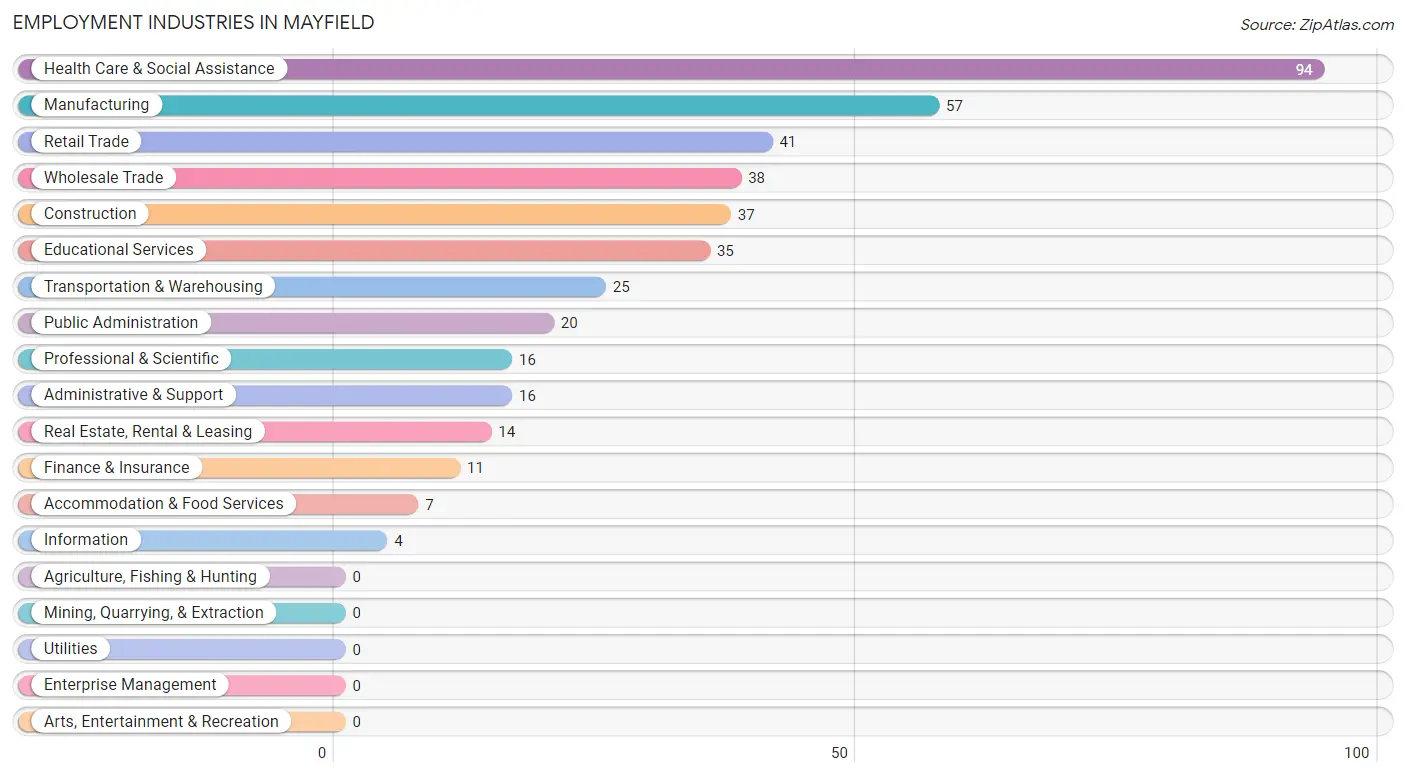
Employment Industries in Mayfield
The major employment industries in Mayfield include Health Care & Social Assistance (94 | 21.1%), Manufacturing (57 | 12.8%), Retail Trade (41 | 9.2%), Wholesale Trade (38 | 8.5%), and Construction (37 | 8.3%).
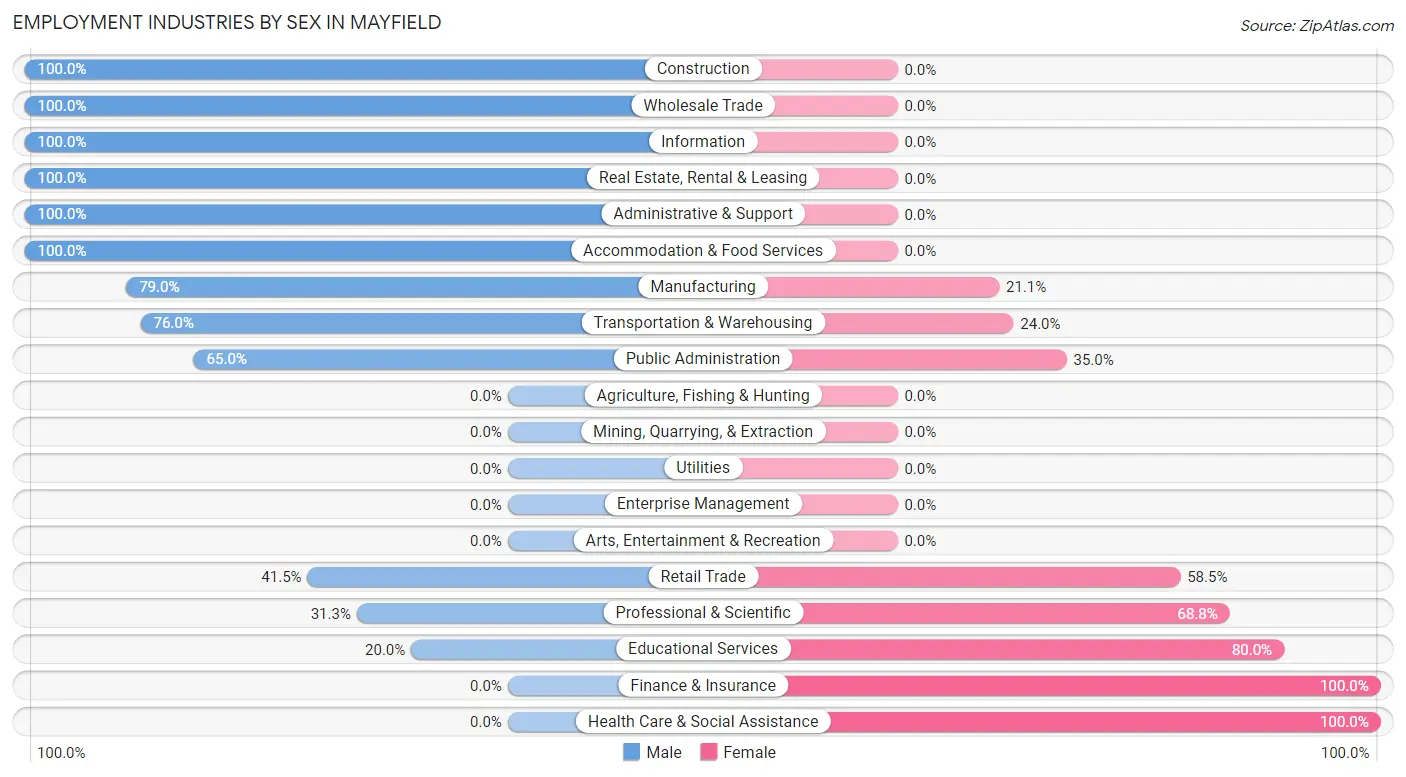
Employment Industries by Sex in Mayfield
The Mayfield industries that see more men than women are Construction (100.0%), Wholesale Trade (100.0%), and Information (100.0%), whereas the industries that tend to have a higher number of women are Finance & Insurance (100.0%), Health Care & Social Assistance (100.0%), and Educational Services (80.0%).
| Industry | Male | Female |
| Agriculture, Fishing & Hunting | 0 (0.0%) | 0 (0.0%) |
| Mining, Quarrying, & Extraction | 0 (0.0%) | 0 (0.0%) |
| Construction | 37 (100.0%) | 0 (0.0%) |
| Manufacturing | 45 (78.9%) | 12 (21.0%) |
| Wholesale Trade | 38 (100.0%) | 0 (0.0%) |
| Retail Trade | 17 (41.5%) | 24 (58.5%) |
| Transportation & Warehousing | 19 (76.0%) | 6 (24.0%) |
| Utilities | 0 (0.0%) | 0 (0.0%) |
| Information | 4 (100.0%) | 0 (0.0%) |
| Finance & Insurance | 0 (0.0%) | 11 (100.0%) |
| Real Estate, Rental & Leasing | 14 (100.0%) | 0 (0.0%) |
| Professional & Scientific | 5 (31.2%) | 11 (68.8%) |
| Enterprise Management | 0 (0.0%) | 0 (0.0%) |
| Administrative & Support | 16 (100.0%) | 0 (0.0%) |
| Educational Services | 7 (20.0%) | 28 (80.0%) |
| Health Care & Social Assistance | 0 (0.0%) | 94 (100.0%) |
| Arts, Entertainment & Recreation | 0 (0.0%) | 0 (0.0%) |
| Accommodation & Food Services | 7 (100.0%) | 0 (0.0%) |
| Public Administration | 13 (65.0%) | 7 (35.0%) |
| Total | 234 (52.6%) | 211 (47.4%) |
Education in Mayfield
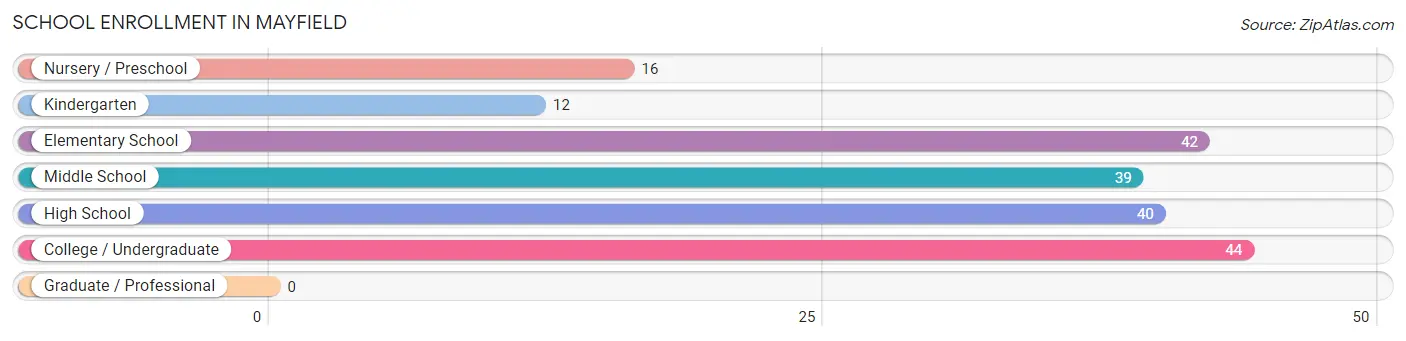
School Enrollment in Mayfield
The most common levels of schooling among the 193 students in Mayfield are college / undergraduate (44 | 22.8%), elementary school (42 | 21.8%), and high school (40 | 20.7%).
| School Level | # Students | % Students |
| Nursery / Preschool | 16 | 8.3% |
| Kindergarten | 12 | 6.2% |
| Elementary School | 42 | 21.8% |
| Middle School | 39 | 20.2% |
| High School | 40 | 20.7% |
| College / Undergraduate | 44 | 22.8% |
| Graduate / Professional | 0 | 0.0% |
| Total | 193 | 100.0% |
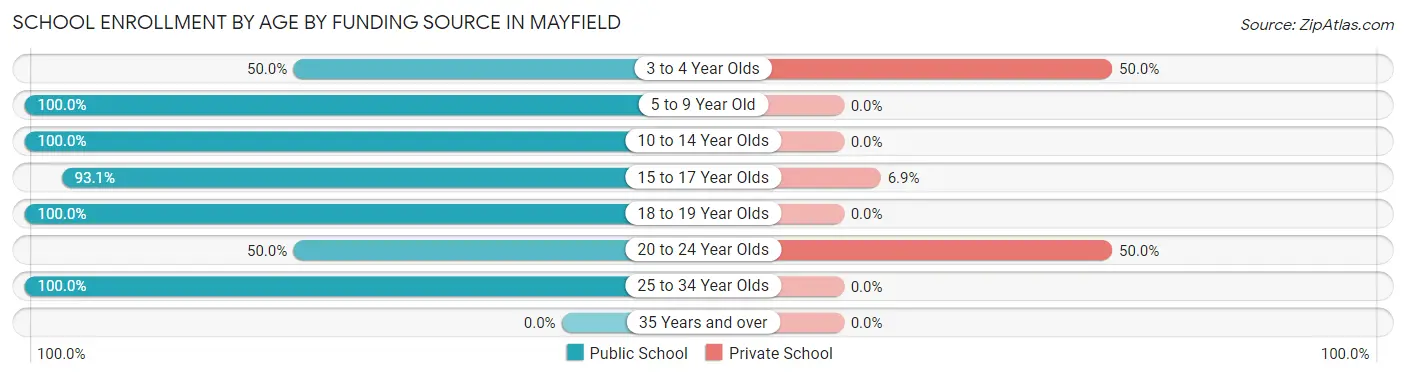
School Enrollment by Age by Funding Source in Mayfield
Out of a total of 193 students who are enrolled in schools in Mayfield, 16 (8.3%) attend a private institution, while the remaining 177 (91.7%) are enrolled in public schools. The age group of 3 to 4 year olds has the highest likelihood of being enrolled in private schools, with 8 (50.0% in the age bracket) enrolled. Conversely, the age group of 5 to 9 year old has the lowest likelihood of being enrolled in a private school, with 54 (100.0% in the age bracket) attending a public institution.
| Age Bracket | Public School | Private School |
| 3 to 4 Year Olds | 8 (50.0%) | 8 (50.0%) |
| 5 to 9 Year Old | 54 (100.0%) | 0 (0.0%) |
| 10 to 14 Year Olds | 46 (100.0%) | 0 (0.0%) |
| 15 to 17 Year Olds | 27 (93.1%) | 2 (6.9%) |
| 18 to 19 Year Olds | 23 (100.0%) | 0 (0.0%) |
| 20 to 24 Year Olds | 6 (50.0%) | 6 (50.0%) |
| 25 to 34 Year Olds | 13 (100.0%) | 0 (0.0%) |
| 35 Years and over | 0 (0.0%) | 0 (0.0%) |
| Total | 177 (91.7%) | 16 (8.3%) |
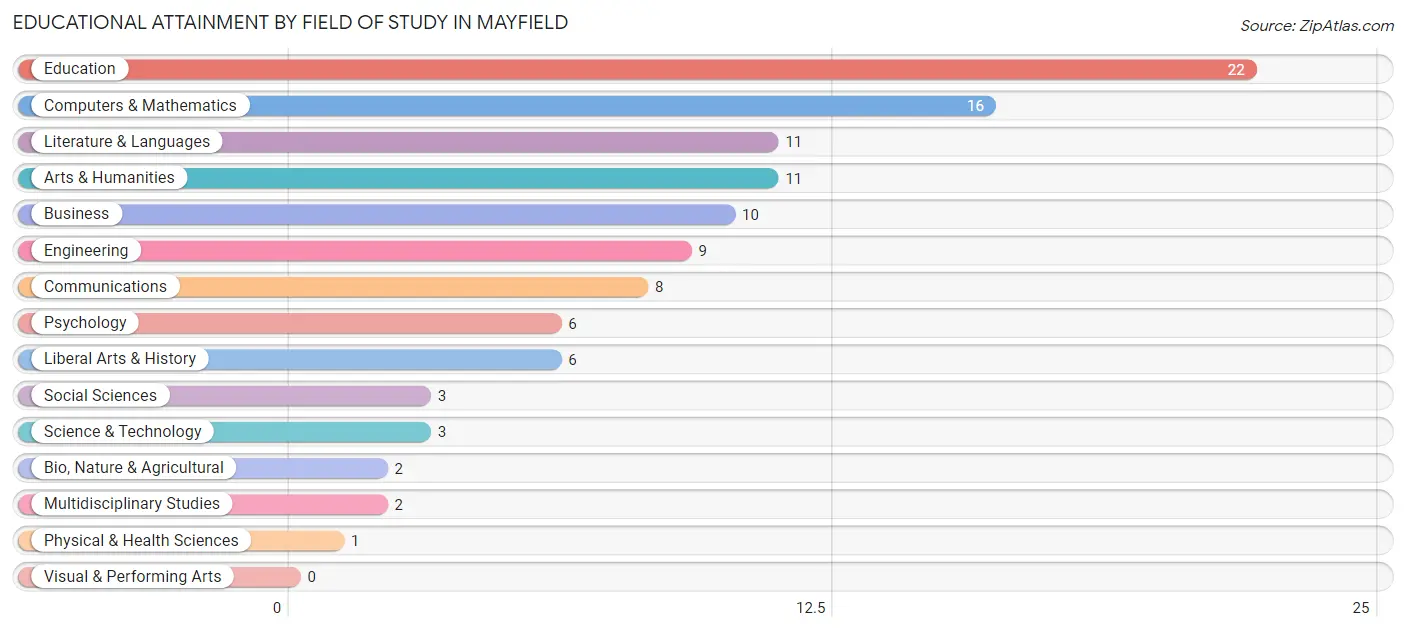
Educational Attainment by Field of Study in Mayfield
Education (22 | 20.0%), computers & mathematics (16 | 14.5%), literature & languages (11 | 10.0%), arts & humanities (11 | 10.0%), and business (10 | 9.1%) are the most common fields of study among 110 individuals in Mayfield who have obtained a bachelor's degree or higher.
| Field of Study | # Graduates | % Graduates |
| Computers & Mathematics | 16 | 14.5% |
| Bio, Nature & Agricultural | 2 | 1.8% |
| Physical & Health Sciences | 1 | 0.9% |
| Psychology | 6 | 5.4% |
| Social Sciences | 3 | 2.7% |
| Engineering | 9 | 8.2% |
| Multidisciplinary Studies | 2 | 1.8% |
| Science & Technology | 3 | 2.7% |
| Business | 10 | 9.1% |
| Education | 22 | 20.0% |
| Literature & Languages | 11 | 10.0% |
| Liberal Arts & History | 6 | 5.4% |
| Visual & Performing Arts | 0 | 0.0% |
| Communications | 8 | 7.3% |
| Arts & Humanities | 11 | 10.0% |
| Total | 110 | 100.0% |
Transportation & Commute in Mayfield
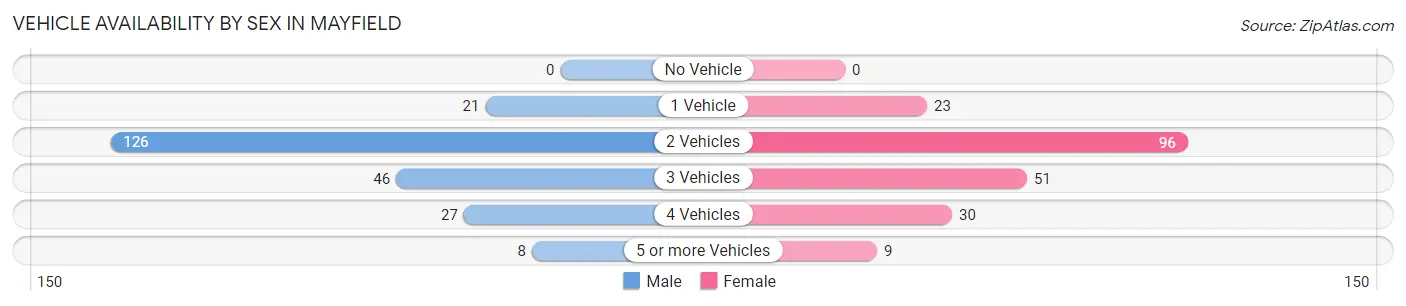
Vehicle Availability by Sex in Mayfield
The most prevalent vehicle ownership categories in Mayfield are males with 2 vehicles (126, accounting for 55.3%) and females with 2 vehicles (96, making up 60.3%).
| Vehicles Available | Male | Female |
| No Vehicle | 0 (0.0%) | 0 (0.0%) |
| 1 Vehicle | 21 (9.2%) | 23 (11.0%) |
| 2 Vehicles | 126 (55.3%) | 96 (45.9%) |
| 3 Vehicles | 46 (20.2%) | 51 (24.4%) |
| 4 Vehicles | 27 (11.8%) | 30 (14.3%) |
| 5 or more Vehicles | 8 (3.5%) | 9 (4.3%) |
| Total | 228 (100.0%) | 209 (100.0%) |
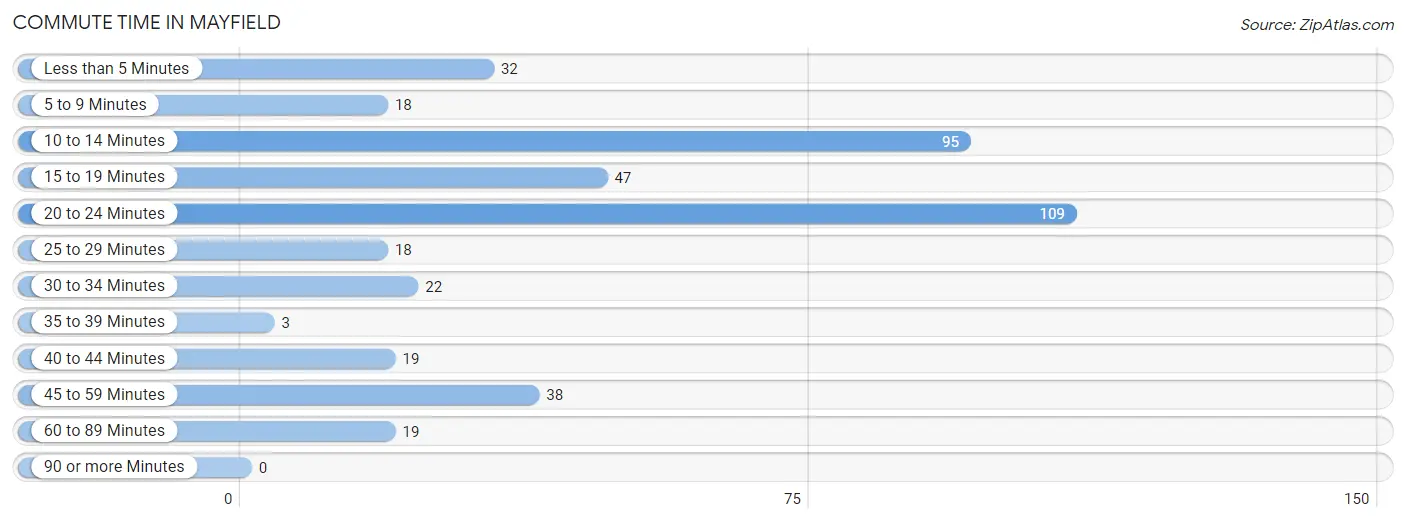
Commute Time in Mayfield
The most frequently occuring commute durations in Mayfield are 20 to 24 minutes (109 commuters, 26.0%), 10 to 14 minutes (95 commuters, 22.6%), and 15 to 19 minutes (47 commuters, 11.2%).
| Commute Time | # Commuters | % Commuters |
| Less than 5 Minutes | 32 | 7.6% |
| 5 to 9 Minutes | 18 | 4.3% |
| 10 to 14 Minutes | 95 | 22.6% |
| 15 to 19 Minutes | 47 | 11.2% |
| 20 to 24 Minutes | 109 | 26.0% |
| 25 to 29 Minutes | 18 | 4.3% |
| 30 to 34 Minutes | 22 | 5.2% |
| 35 to 39 Minutes | 3 | 0.7% |
| 40 to 44 Minutes | 19 | 4.5% |
| 45 to 59 Minutes | 38 | 9.0% |
| 60 to 89 Minutes | 19 | 4.5% |
| 90 or more Minutes | 0 | 0.0% |
Commute Time by Sex in Mayfield
The most common commute times in Mayfield are 10 to 14 minutes (59 commuters, 27.3%) for males and 20 to 24 minutes (61 commuters, 29.9%) for females.
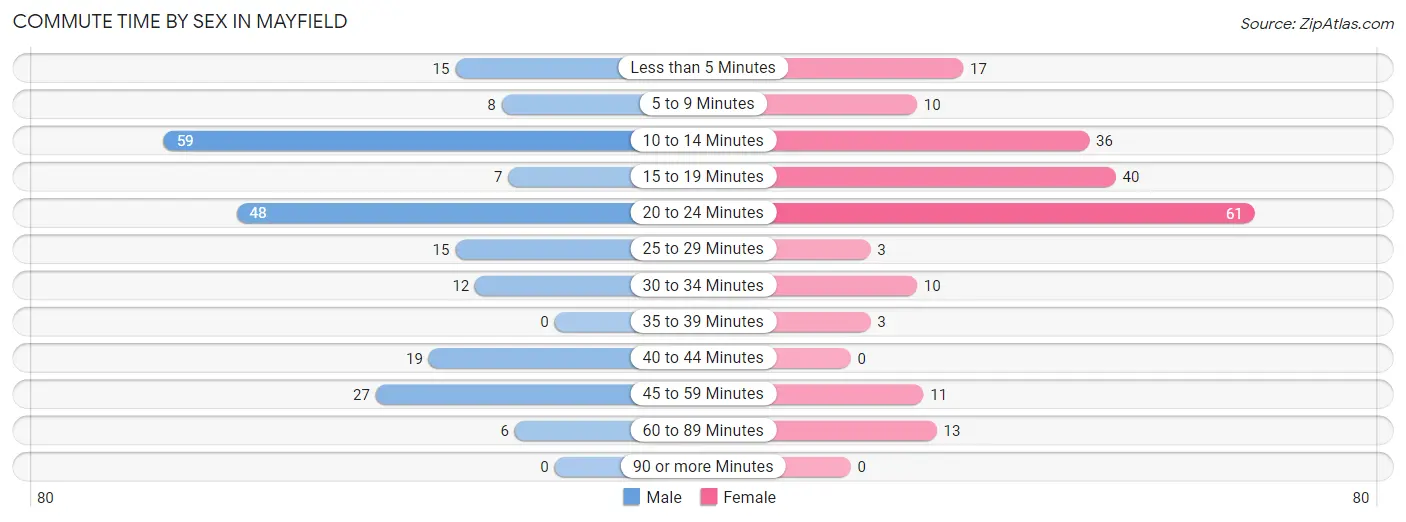
| Commute Time | Male | Female |
| Less than 5 Minutes | 15 (6.9%) | 17 (8.3%) |
| 5 to 9 Minutes | 8 (3.7%) | 10 (4.9%) |
| 10 to 14 Minutes | 59 (27.3%) | 36 (17.6%) |
| 15 to 19 Minutes | 7 (3.2%) | 40 (19.6%) |
| 20 to 24 Minutes | 48 (22.2%) | 61 (29.9%) |
| 25 to 29 Minutes | 15 (6.9%) | 3 (1.5%) |
| 30 to 34 Minutes | 12 (5.6%) | 10 (4.9%) |
| 35 to 39 Minutes | 0 (0.0%) | 3 (1.5%) |
| 40 to 44 Minutes | 19 (8.8%) | 0 (0.0%) |
| 45 to 59 Minutes | 27 (12.5%) | 11 (5.4%) |
| 60 to 89 Minutes | 6 (2.8%) | 13 (6.4%) |
| 90 or more Minutes | 0 (0.0%) | 0 (0.0%) |
Time of Departure to Work by Sex in Mayfield
The most frequent times of departure to work in Mayfield are 7:00 AM to 7:29 AM (43, 19.9%) for males and 7:00 AM to 7:29 AM (46, 22.6%) for females.
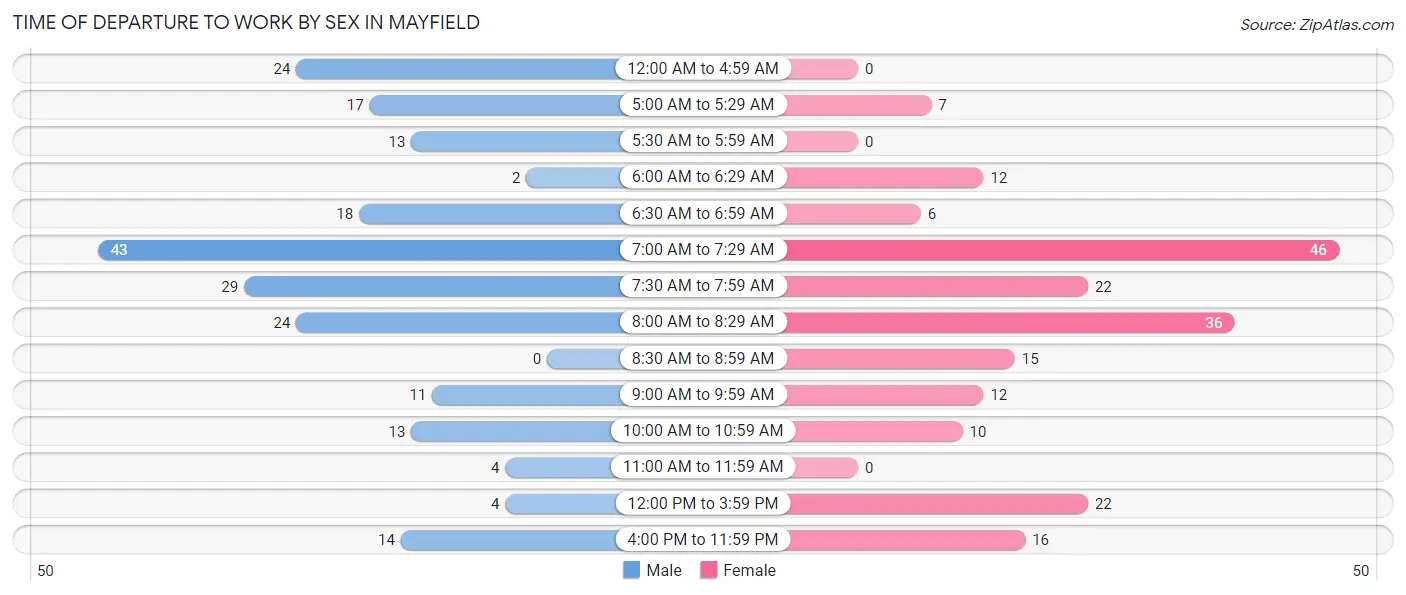
| Time of Departure | Male | Female |
| 12:00 AM to 4:59 AM | 24 (11.1%) | 0 (0.0%) |
| 5:00 AM to 5:29 AM | 17 (7.9%) | 7 (3.4%) |
| 5:30 AM to 5:59 AM | 13 (6.0%) | 0 (0.0%) |
| 6:00 AM to 6:29 AM | 2 (0.9%) | 12 (5.9%) |
| 6:30 AM to 6:59 AM | 18 (8.3%) | 6 (2.9%) |
| 7:00 AM to 7:29 AM | 43 (19.9%) | 46 (22.6%) |
| 7:30 AM to 7:59 AM | 29 (13.4%) | 22 (10.8%) |
| 8:00 AM to 8:29 AM | 24 (11.1%) | 36 (17.6%) |
| 8:30 AM to 8:59 AM | 0 (0.0%) | 15 (7.3%) |
| 9:00 AM to 9:59 AM | 11 (5.1%) | 12 (5.9%) |
| 10:00 AM to 10:59 AM | 13 (6.0%) | 10 (4.9%) |
| 11:00 AM to 11:59 AM | 4 (1.8%) | 0 (0.0%) |
| 12:00 PM to 3:59 PM | 4 (1.8%) | 22 (10.8%) |
| 4:00 PM to 11:59 PM | 14 (6.5%) | 16 (7.8%) |
| Total | 216 (100.0%) | 204 (100.0%) |
Housing Occupancy in Mayfield
Occupancy by Ownership in Mayfield
Of the total 359 dwellings in Mayfield, owner-occupied units account for 270 (75.2%), while renter-occupied units make up 89 (24.8%).
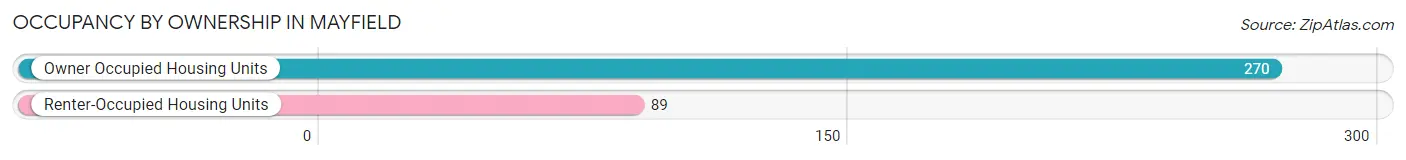
| Occupancy | # Housing Units | % Housing Units |
| Owner Occupied Housing Units | 270 | 75.2% |
| Renter-Occupied Housing Units | 89 | 24.8% |
| Total Occupied Housing Units | 359 | 100.0% |
Occupancy by Household Size in Mayfield
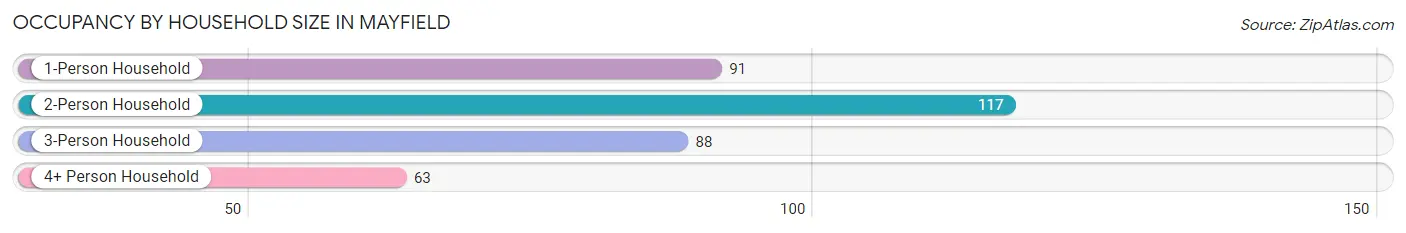
| Household Size | # Housing Units | % Housing Units |
| 1-Person Household | 91 | 25.4% |
| 2-Person Household | 117 | 32.6% |
| 3-Person Household | 88 | 24.5% |
| 4+ Person Household | 63 | 17.5% |
| Total Housing Units | 359 | 100.0% |
Occupancy by Ownership by Household Size in Mayfield
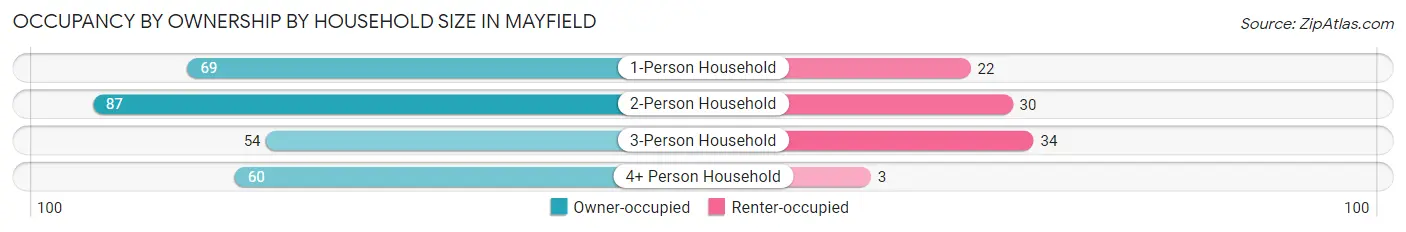
| Household Size | Owner-occupied | Renter-occupied |
| 1-Person Household | 69 (75.8%) | 22 (24.2%) |
| 2-Person Household | 87 (74.4%) | 30 (25.6%) |
| 3-Person Household | 54 (61.4%) | 34 (38.6%) |
| 4+ Person Household | 60 (95.2%) | 3 (4.8%) |
| Total Housing Units | 270 (75.2%) | 89 (24.8%) |
Occupancy by Educational Attainment in Mayfield
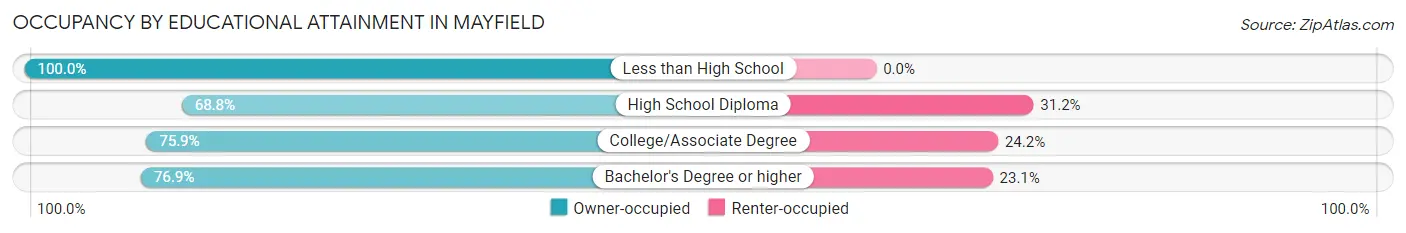
| Household Size | Owner-occupied | Renter-occupied |
| Less than High School | 10 (100.0%) | 0 (0.0%) |
| High School Diploma | 53 (68.8%) | 24 (31.2%) |
| College/Associate Degree | 157 (75.8%) | 50 (24.1%) |
| Bachelor's Degree or higher | 50 (76.9%) | 15 (23.1%) |
Occupancy by Age of Householder in Mayfield
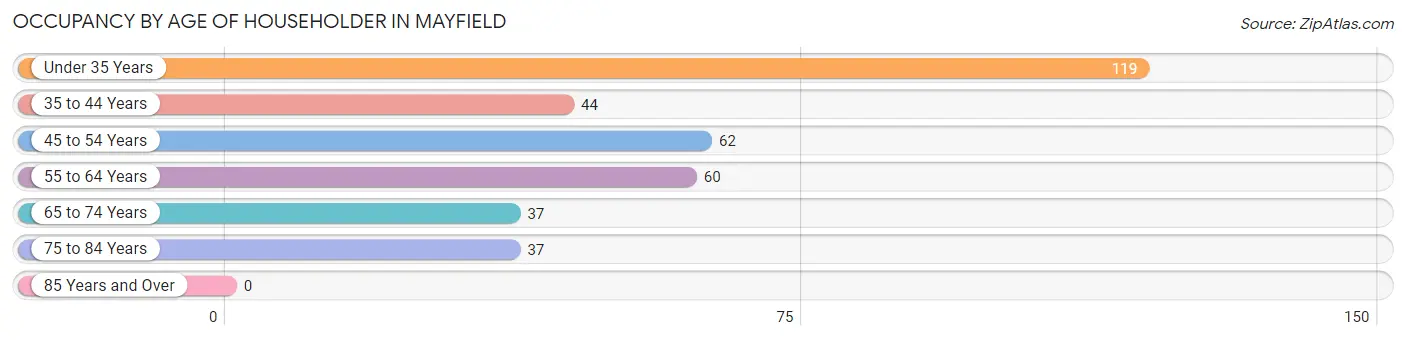
| Age Bracket | # Households | % Households |
| Under 35 Years | 119 | 33.2% |
| 35 to 44 Years | 44 | 12.3% |
| 45 to 54 Years | 62 | 17.3% |
| 55 to 64 Years | 60 | 16.7% |
| 65 to 74 Years | 37 | 10.3% |
| 75 to 84 Years | 37 | 10.3% |
| 85 Years and Over | 0 | 0.0% |
| Total | 359 | 100.0% |
Housing Finances in Mayfield
Median Income by Occupancy in Mayfield
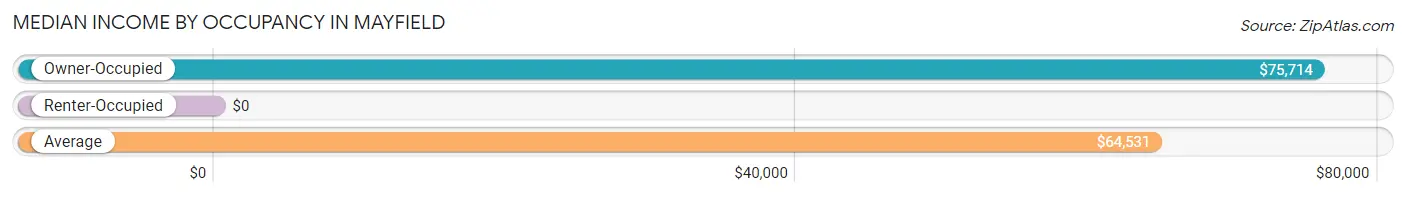
| Occupancy Type | # Households | Median Income |
| Owner-Occupied | 270 (75.2%) | $75,714 |
| Renter-Occupied | 89 (24.8%) | $0 |
| Average | 359 (100.0%) | $64,531 |
Occupancy by Householder Income Bracket in Mayfield
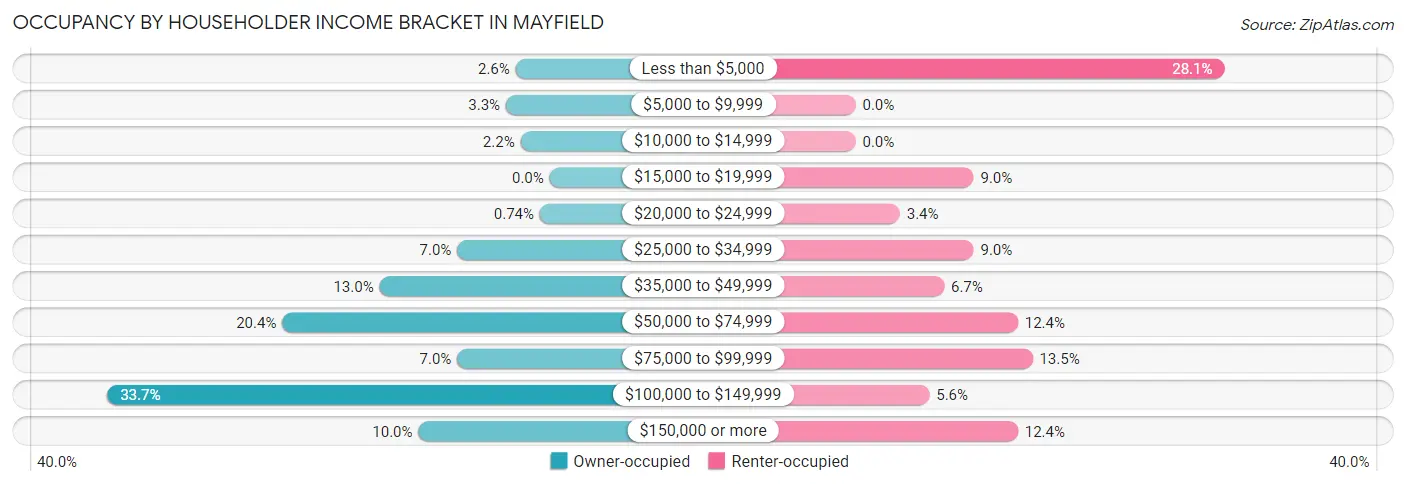
| Income Bracket | Owner-occupied | Renter-occupied |
| Less than $5,000 | 7 (2.6%) | 25 (28.1%) |
| $5,000 to $9,999 | 9 (3.3%) | 0 (0.0%) |
| $10,000 to $14,999 | 6 (2.2%) | 0 (0.0%) |
| $15,000 to $19,999 | 0 (0.0%) | 8 (9.0%) |
| $20,000 to $24,999 | 2 (0.7%) | 3 (3.4%) |
| $25,000 to $34,999 | 19 (7.0%) | 8 (9.0%) |
| $35,000 to $49,999 | 35 (13.0%) | 6 (6.7%) |
| $50,000 to $74,999 | 55 (20.4%) | 11 (12.4%) |
| $75,000 to $99,999 | 19 (7.0%) | 12 (13.5%) |
| $100,000 to $149,999 | 91 (33.7%) | 5 (5.6%) |
| $150,000 or more | 27 (10.0%) | 11 (12.4%) |
| Total | 270 (100.0%) | 89 (100.0%) |
Monthly Housing Cost Tiers in Mayfield
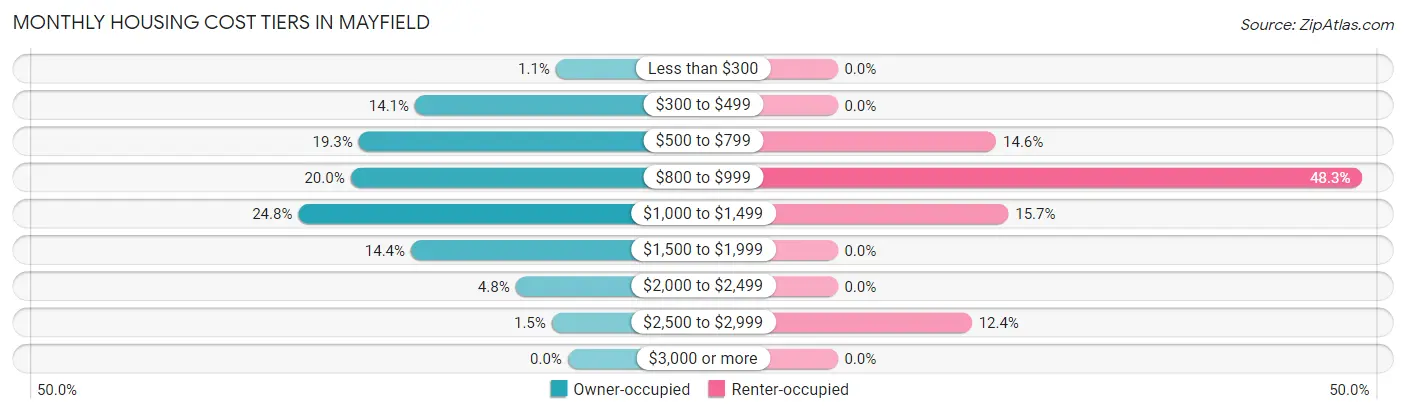
| Monthly Cost | Owner-occupied | Renter-occupied |
| Less than $300 | 3 (1.1%) | 0 (0.0%) |
| $300 to $499 | 38 (14.1%) | 0 (0.0%) |
| $500 to $799 | 52 (19.3%) | 13 (14.6%) |
| $800 to $999 | 54 (20.0%) | 43 (48.3%) |
| $1,000 to $1,499 | 67 (24.8%) | 14 (15.7%) |
| $1,500 to $1,999 | 39 (14.4%) | 0 (0.0%) |
| $2,000 to $2,499 | 13 (4.8%) | 0 (0.0%) |
| $2,500 to $2,999 | 4 (1.5%) | 11 (12.4%) |
| $3,000 or more | 0 (0.0%) | 0 (0.0%) |
| Total | 270 (100.0%) | 89 (100.0%) |
Physical Housing Characteristics in Mayfield
Housing Structures in Mayfield
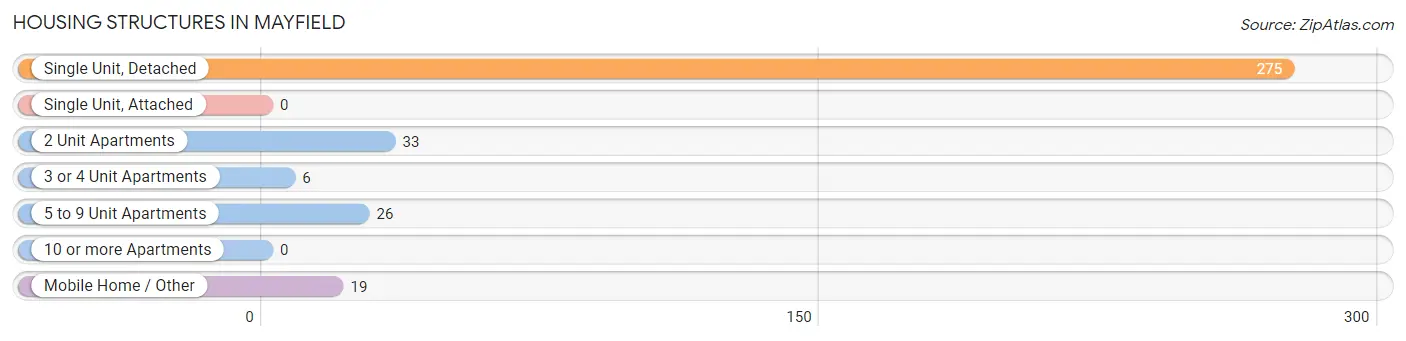
| Structure Type | # Housing Units | % Housing Units |
| Single Unit, Detached | 275 | 76.6% |
| Single Unit, Attached | 0 | 0.0% |
| 2 Unit Apartments | 33 | 9.2% |
| 3 or 4 Unit Apartments | 6 | 1.7% |
| 5 to 9 Unit Apartments | 26 | 7.2% |
| 10 or more Apartments | 0 | 0.0% |
| Mobile Home / Other | 19 | 5.3% |
| Total | 359 | 100.0% |
Housing Structures by Occupancy in Mayfield
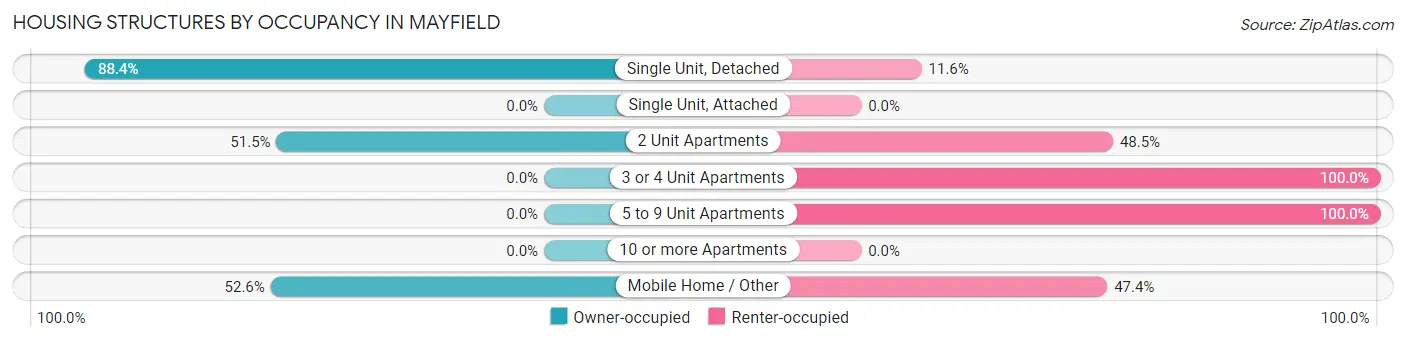
| Structure Type | Owner-occupied | Renter-occupied |
| Single Unit, Detached | 243 (88.4%) | 32 (11.6%) |
| Single Unit, Attached | 0 (0.0%) | 0 (0.0%) |
| 2 Unit Apartments | 17 (51.5%) | 16 (48.5%) |
| 3 or 4 Unit Apartments | 0 (0.0%) | 6 (100.0%) |
| 5 to 9 Unit Apartments | 0 (0.0%) | 26 (100.0%) |
| 10 or more Apartments | 0 (0.0%) | 0 (0.0%) |
| Mobile Home / Other | 10 (52.6%) | 9 (47.4%) |
| Total | 270 (75.2%) | 89 (24.8%) |
Housing Structures by Number of Rooms in Mayfield
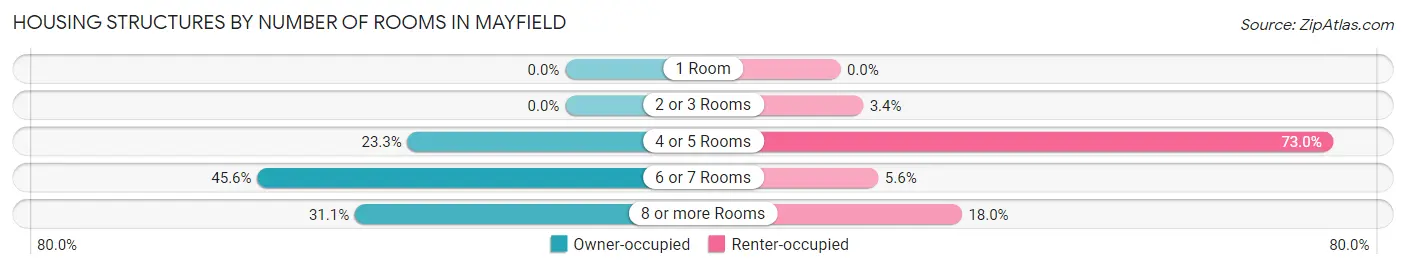
| Number of Rooms | Owner-occupied | Renter-occupied |
| 1 Room | 0 (0.0%) | 0 (0.0%) |
| 2 or 3 Rooms | 0 (0.0%) | 3 (3.4%) |
| 4 or 5 Rooms | 63 (23.3%) | 65 (73.0%) |
| 6 or 7 Rooms | 123 (45.6%) | 5 (5.6%) |
| 8 or more Rooms | 84 (31.1%) | 16 (18.0%) |
| Total | 270 (100.0%) | 89 (100.0%) |
Housing Structure by Heating Type in Mayfield
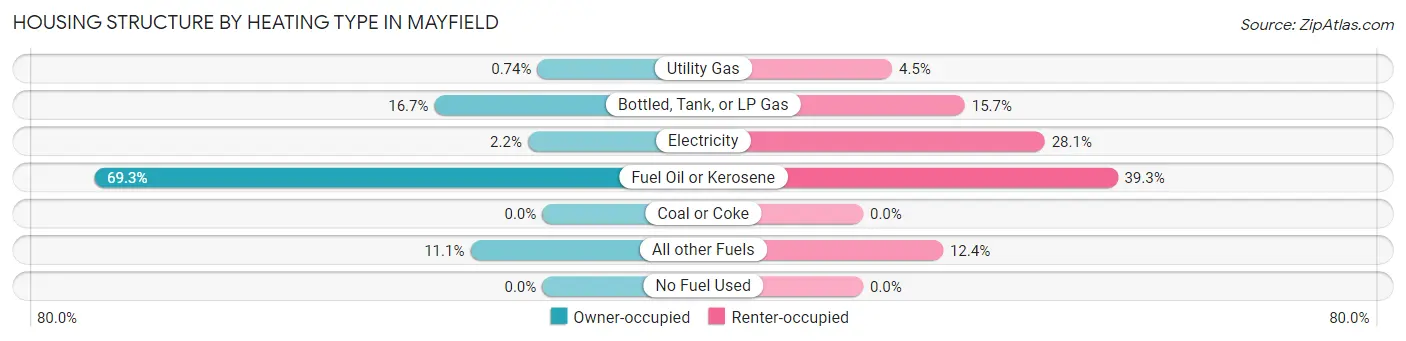
| Heating Type | Owner-occupied | Renter-occupied |
| Utility Gas | 2 (0.7%) | 4 (4.5%) |
| Bottled, Tank, or LP Gas | 45 (16.7%) | 14 (15.7%) |
| Electricity | 6 (2.2%) | 25 (28.1%) |
| Fuel Oil or Kerosene | 187 (69.3%) | 35 (39.3%) |
| Coal or Coke | 0 (0.0%) | 0 (0.0%) |
| All other Fuels | 30 (11.1%) | 11 (12.4%) |
| No Fuel Used | 0 (0.0%) | 0 (0.0%) |
| Total | 270 (100.0%) | 89 (100.0%) |
Household Vehicle Usage in Mayfield
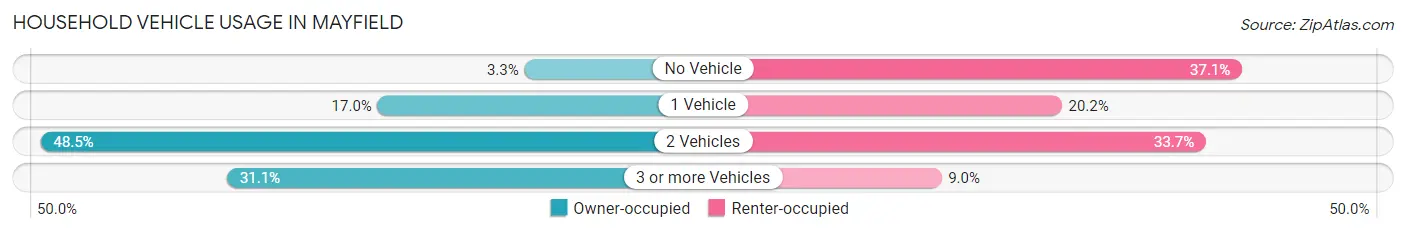
| Vehicles per Household | Owner-occupied | Renter-occupied |
| No Vehicle | 9 (3.3%) | 33 (37.1%) |
| 1 Vehicle | 46 (17.0%) | 18 (20.2%) |
| 2 Vehicles | 131 (48.5%) | 30 (33.7%) |
| 3 or more Vehicles | 84 (31.1%) | 8 (9.0%) |
| Total | 270 (100.0%) | 89 (100.0%) |
Real Estate & Mortgages in Mayfield
Real Estate and Mortgage Overview in Mayfield
| Characteristic | Without Mortgage | With Mortgage |
| Housing Units | 106 | 164 |
| Median Property Value | $187,500 | $131,400 |
| Median Household Income | $56,250 | $24 |
| Monthly Housing Costs | $610 | $0 |
| Real Estate Taxes | $2,943 | $6 |
Property Value by Mortgage Status in Mayfield
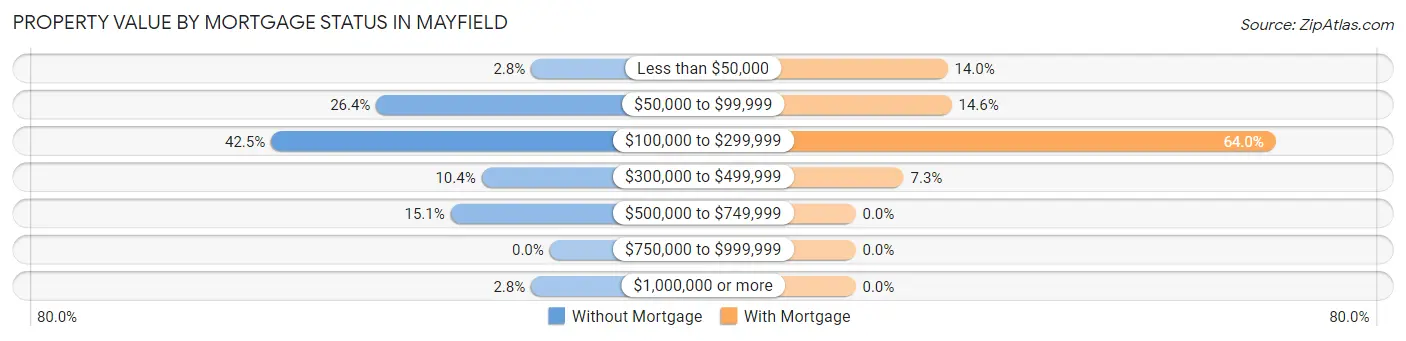
| Property Value | Without Mortgage | With Mortgage |
| Less than $50,000 | 3 (2.8%) | 23 (14.0%) |
| $50,000 to $99,999 | 28 (26.4%) | 24 (14.6%) |
| $100,000 to $299,999 | 45 (42.4%) | 105 (64.0%) |
| $300,000 to $499,999 | 11 (10.4%) | 12 (7.3%) |
| $500,000 to $749,999 | 16 (15.1%) | 0 (0.0%) |
| $750,000 to $999,999 | 0 (0.0%) | 0 (0.0%) |
| $1,000,000 or more | 3 (2.8%) | 0 (0.0%) |
| Total | 106 (100.0%) | 164 (100.0%) |
Household Income by Mortgage Status in Mayfield
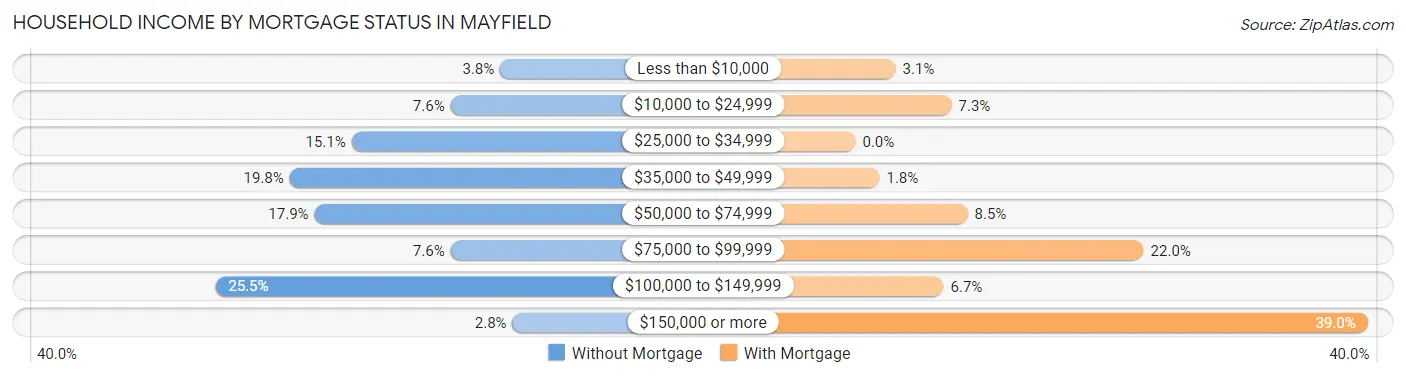
| Household Income | Without Mortgage | With Mortgage |
| Less than $10,000 | 4 (3.8%) | 5 (3.0%) |
| $10,000 to $24,999 | 8 (7.5%) | 12 (7.3%) |
| $25,000 to $34,999 | 16 (15.1%) | 0 (0.0%) |
| $35,000 to $49,999 | 21 (19.8%) | 3 (1.8%) |
| $50,000 to $74,999 | 19 (17.9%) | 14 (8.5%) |
| $75,000 to $99,999 | 8 (7.5%) | 36 (22.0%) |
| $100,000 to $149,999 | 27 (25.5%) | 11 (6.7%) |
| $150,000 or more | 3 (2.8%) | 64 (39.0%) |
| Total | 106 (100.0%) | 164 (100.0%) |
Property Value to Household Income Ratio in Mayfield
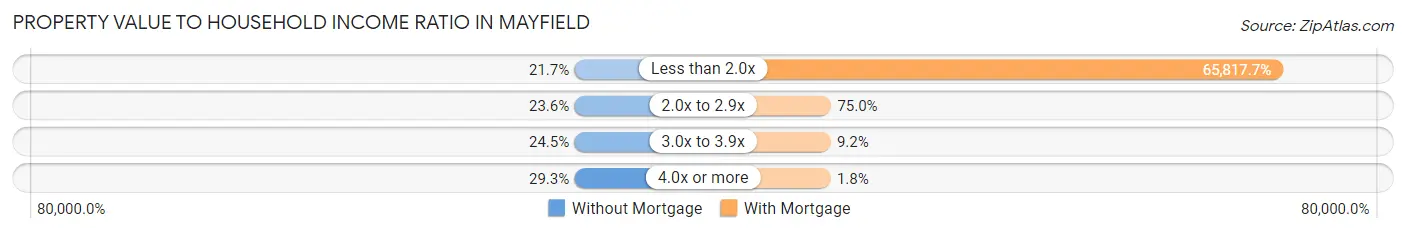
| Value-to-Income Ratio | Without Mortgage | With Mortgage |
| Less than 2.0x | 23 (21.7%) | 107,941 (65,817.7%) |
| 2.0x to 2.9x | 25 (23.6%) | 123 (75.0%) |
| 3.0x to 3.9x | 26 (24.5%) | 15 (9.1%) |
| 4.0x or more | 31 (29.2%) | 3 (1.8%) |
| Total | 106 (100.0%) | 164 (100.0%) |
Real Estate Taxes by Mortgage Status in Mayfield
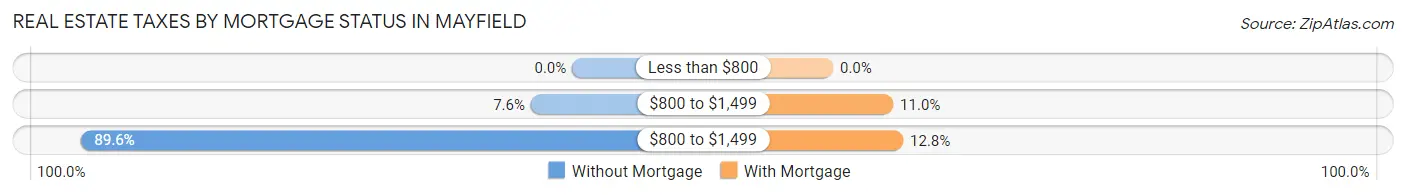
| Property Taxes | Without Mortgage | With Mortgage |
| Less than $800 | 0 (0.0%) | 0 (0.0%) |
| $800 to $1,499 | 8 (7.5%) | 18 (11.0%) |
| $800 to $1,499 | 95 (89.6%) | 21 (12.8%) |
| Total | 106 (100.0%) | 164 (100.0%) |
Health & Disability in Mayfield
Health Insurance Coverage by Age in Mayfield
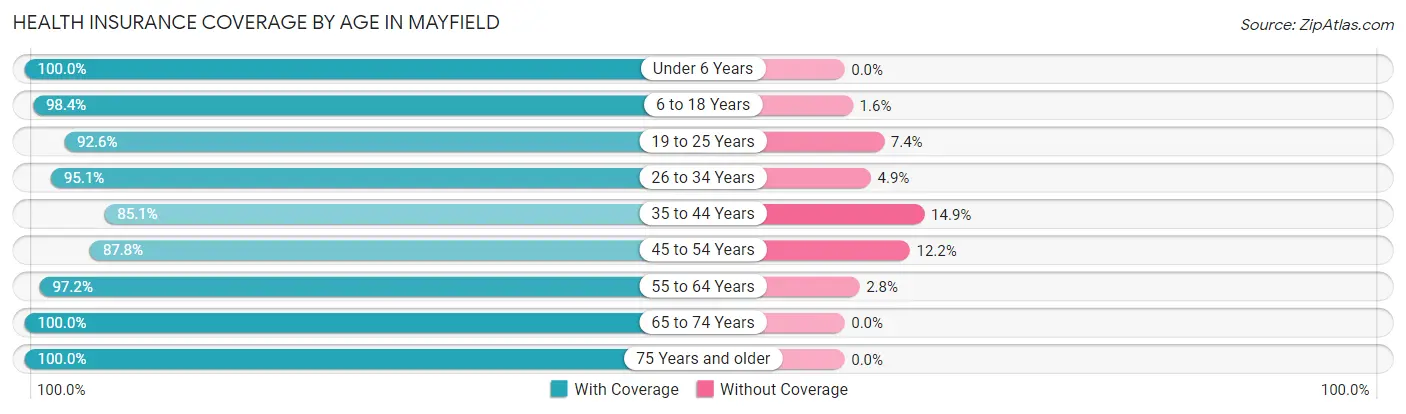
| Age Bracket | With Coverage | Without Coverage |
| Under 6 Years | 123 (100.0%) | 0 (0.0%) |
| 6 to 18 Years | 126 (98.4%) | 2 (1.6%) |
| 19 to 25 Years | 88 (92.6%) | 7 (7.4%) |
| 26 to 34 Years | 155 (95.1%) | 8 (4.9%) |
| 35 to 44 Years | 80 (85.1%) | 14 (14.9%) |
| 45 to 54 Years | 101 (87.8%) | 14 (12.2%) |
| 55 to 64 Years | 105 (97.2%) | 3 (2.8%) |
| 65 to 74 Years | 60 (100.0%) | 0 (0.0%) |
| 75 Years and older | 52 (100.0%) | 0 (0.0%) |
| Total | 890 (94.9%) | 48 (5.1%) |
Health Insurance Coverage by Citizenship Status in Mayfield
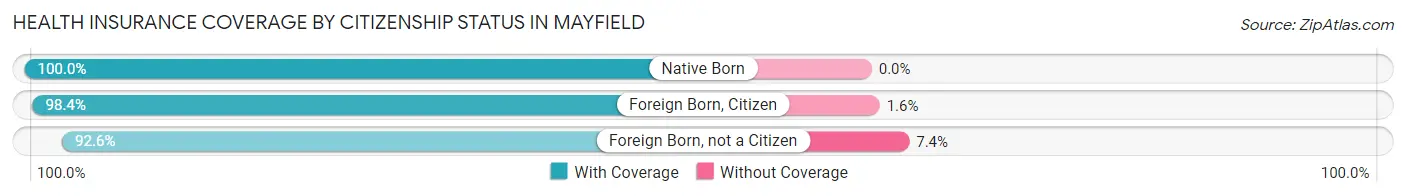
| Citizenship Status | With Coverage | Without Coverage |
| Native Born | 123 (100.0%) | 0 (0.0%) |
| Foreign Born, Citizen | 126 (98.4%) | 2 (1.6%) |
| Foreign Born, not a Citizen | 88 (92.6%) | 7 (7.4%) |
Health Insurance Coverage by Household Income in Mayfield
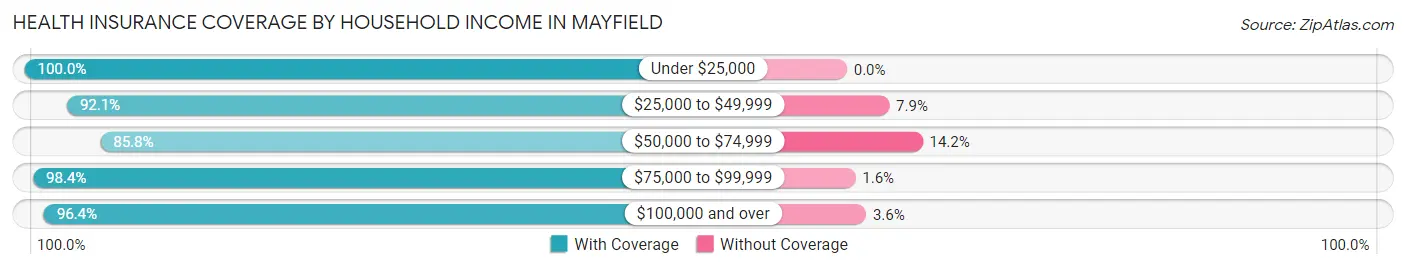
| Household Income | With Coverage | Without Coverage |
| Under $25,000 | 157 (100.0%) | 0 (0.0%) |
| $25,000 to $49,999 | 116 (92.1%) | 10 (7.9%) |
| $50,000 to $74,999 | 127 (85.8%) | 21 (14.2%) |
| $75,000 to $99,999 | 61 (98.4%) | 1 (1.6%) |
| $100,000 and over | 429 (96.4%) | 16 (3.6%) |
Public vs Private Health Insurance Coverage by Age in Mayfield
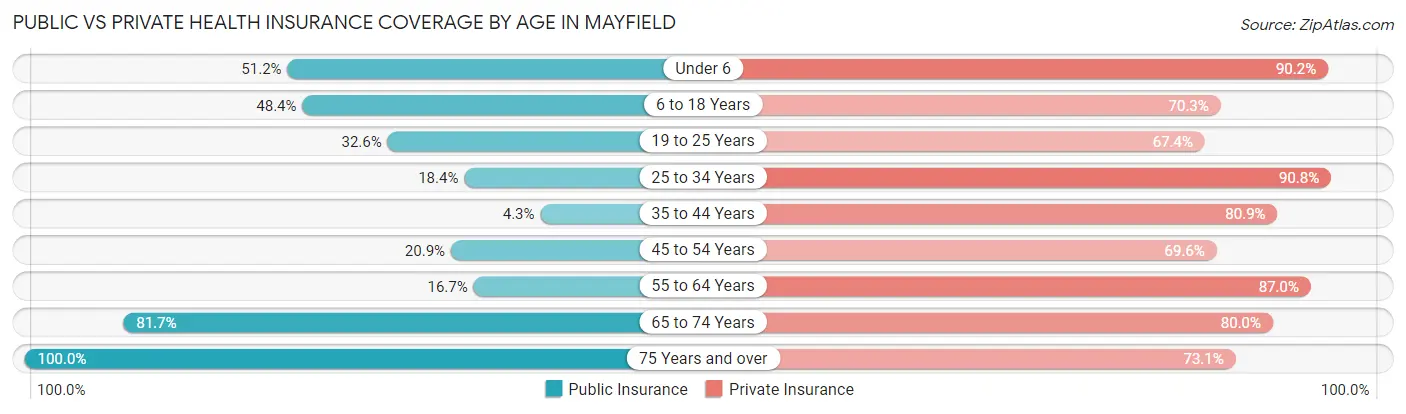
| Age Bracket | Public Insurance | Private Insurance |
| Under 6 | 63 (51.2%) | 111 (90.2%) |
| 6 to 18 Years | 62 (48.4%) | 90 (70.3%) |
| 19 to 25 Years | 31 (32.6%) | 64 (67.4%) |
| 25 to 34 Years | 30 (18.4%) | 148 (90.8%) |
| 35 to 44 Years | 4 (4.3%) | 76 (80.8%) |
| 45 to 54 Years | 24 (20.9%) | 80 (69.6%) |
| 55 to 64 Years | 18 (16.7%) | 94 (87.0%) |
| 65 to 74 Years | 49 (81.7%) | 48 (80.0%) |
| 75 Years and over | 52 (100.0%) | 38 (73.1%) |
| Total | 333 (35.5%) | 749 (79.8%) |
Disability Status by Sex by Age in Mayfield
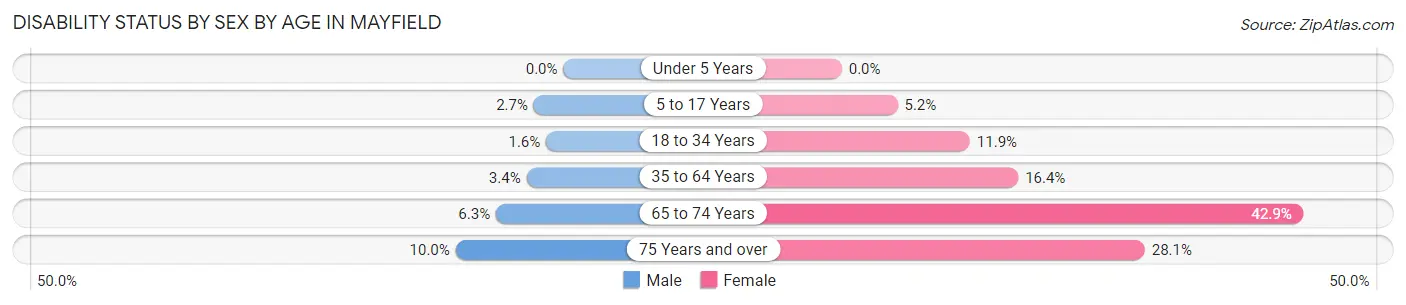
| Age Bracket | Male | Female |
| Under 5 Years | 0 (0.0%) | 0 (0.0%) |
| 5 to 17 Years | 2 (2.7%) | 3 (5.2%) |
| 18 to 34 Years | 2 (1.6%) | 17 (11.9%) |
| 35 to 64 Years | 5 (3.4%) | 28 (16.4%) |
| 65 to 74 Years | 2 (6.2%) | 12 (42.9%) |
| 75 Years and over | 2 (10.0%) | 9 (28.1%) |
Disability Class by Sex by Age in Mayfield
Disability Class: Hearing Difficulty
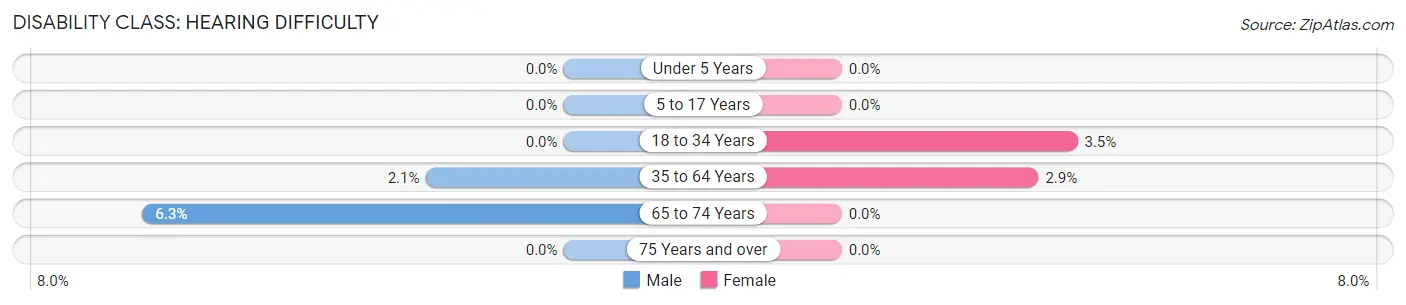
| Age Bracket | Male | Female |
| Under 5 Years | 0 (0.0%) | 0 (0.0%) |
| 5 to 17 Years | 0 (0.0%) | 0 (0.0%) |
| 18 to 34 Years | 0 (0.0%) | 5 (3.5%) |
| 35 to 64 Years | 3 (2.1%) | 5 (2.9%) |
| 65 to 74 Years | 2 (6.2%) | 0 (0.0%) |
| 75 Years and over | 0 (0.0%) | 0 (0.0%) |
Disability Class: Vision Difficulty
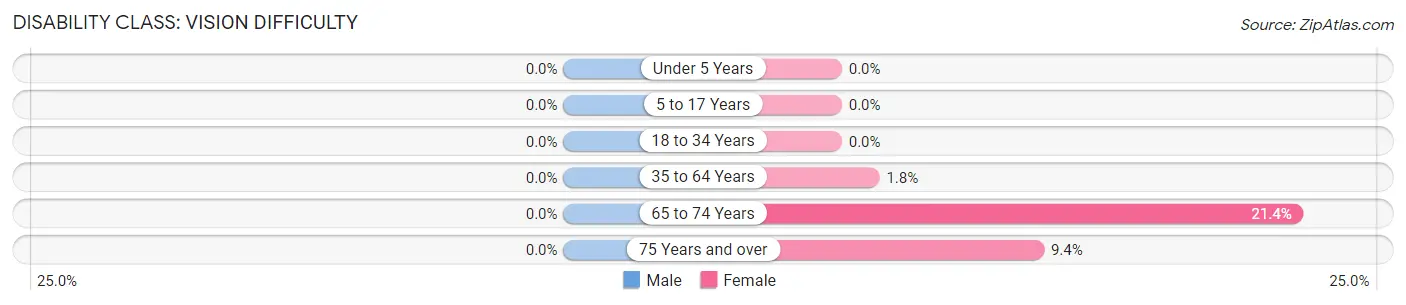
| Age Bracket | Male | Female |
| Under 5 Years | 0 (0.0%) | 0 (0.0%) |
| 5 to 17 Years | 0 (0.0%) | 0 (0.0%) |
| 18 to 34 Years | 0 (0.0%) | 0 (0.0%) |
| 35 to 64 Years | 0 (0.0%) | 3 (1.8%) |
| 65 to 74 Years | 0 (0.0%) | 6 (21.4%) |
| 75 Years and over | 0 (0.0%) | 3 (9.4%) |
Disability Class: Cognitive Difficulty
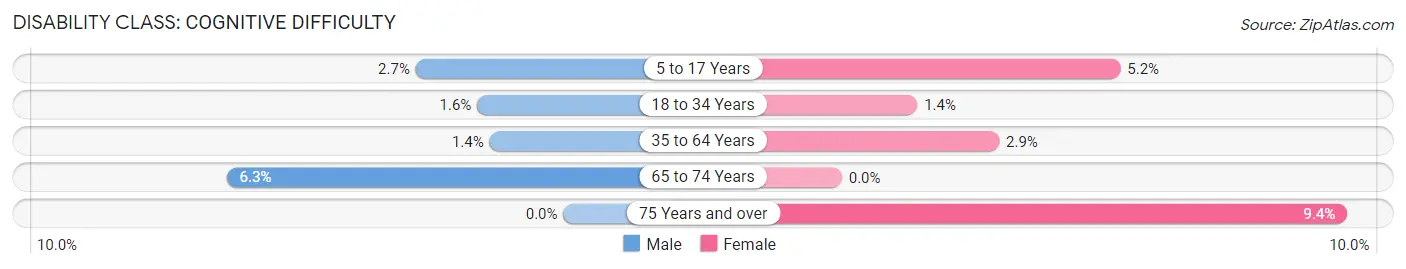
| Age Bracket | Male | Female |
| 5 to 17 Years | 2 (2.7%) | 3 (5.2%) |
| 18 to 34 Years | 2 (1.6%) | 2 (1.4%) |
| 35 to 64 Years | 2 (1.4%) | 5 (2.9%) |
| 65 to 74 Years | 2 (6.2%) | 0 (0.0%) |
| 75 Years and over | 0 (0.0%) | 3 (9.4%) |
Disability Class: Ambulatory Difficulty
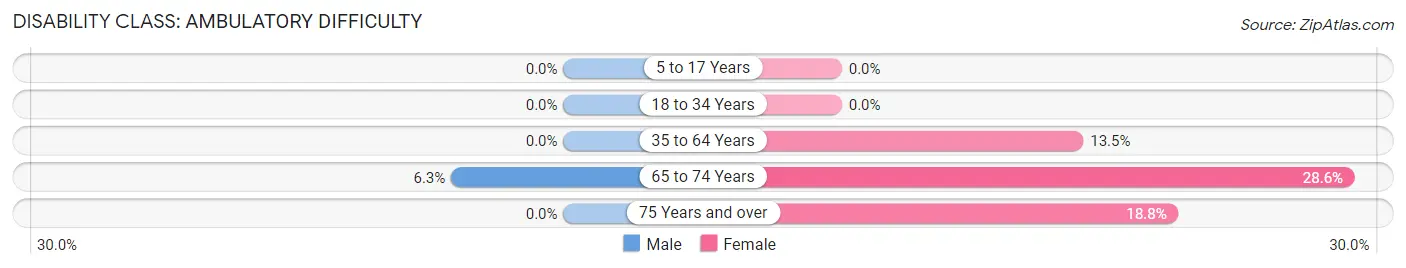
| Age Bracket | Male | Female |
| 5 to 17 Years | 0 (0.0%) | 0 (0.0%) |
| 18 to 34 Years | 0 (0.0%) | 0 (0.0%) |
| 35 to 64 Years | 0 (0.0%) | 23 (13.5%) |
| 65 to 74 Years | 2 (6.2%) | 8 (28.6%) |
| 75 Years and over | 0 (0.0%) | 6 (18.8%) |
Disability Class: Self-Care Difficulty
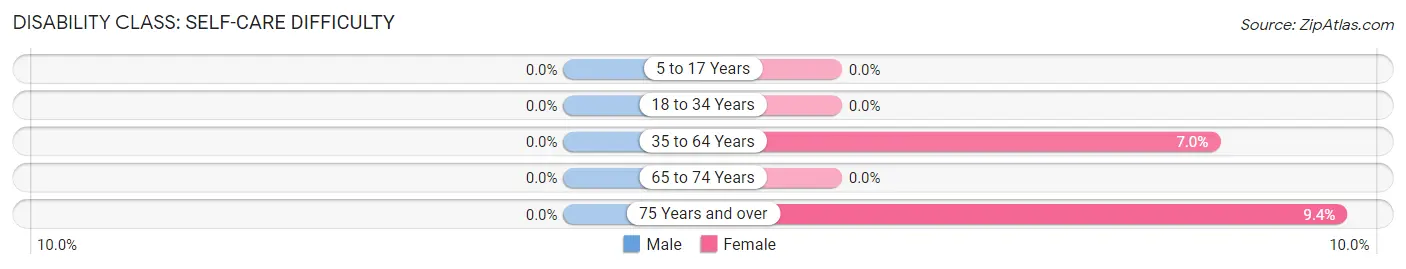
| Age Bracket | Male | Female |
| 5 to 17 Years | 0 (0.0%) | 0 (0.0%) |
| 18 to 34 Years | 0 (0.0%) | 0 (0.0%) |
| 35 to 64 Years | 0 (0.0%) | 12 (7.0%) |
| 65 to 74 Years | 0 (0.0%) | 0 (0.0%) |
| 75 Years and over | 0 (0.0%) | 3 (9.4%) |
Technology Access in Mayfield
Computing Device Access in Mayfield
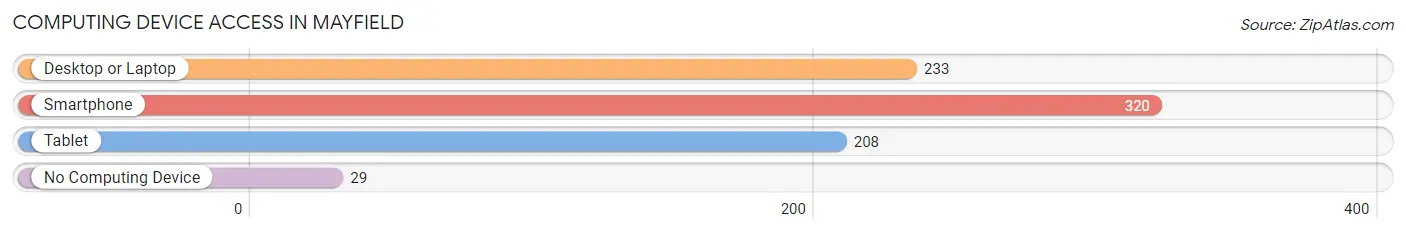
| Device Type | # Households | % Households |
| Desktop or Laptop | 233 | 64.9% |
| Smartphone | 320 | 89.1% |
| Tablet | 208 | 57.9% |
| No Computing Device | 29 | 8.1% |
| Total | 359 | 100.0% |
Internet Access in Mayfield
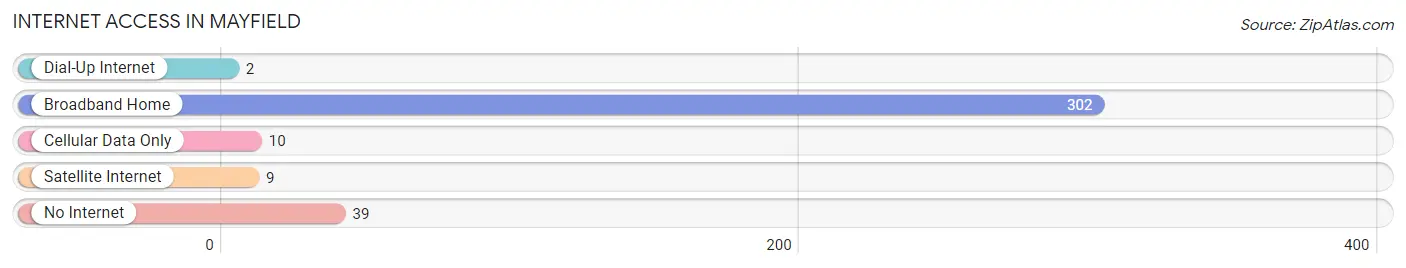
| Internet Type | # Households | % Households |
| Dial-Up Internet | 2 | 0.6% |
| Broadband Home | 302 | 84.1% |
| Cellular Data Only | 10 | 2.8% |
| Satellite Internet | 9 | 2.5% |
| No Internet | 39 | 10.9% |
| Total | 359 | 100.0% |
Mayfield Summary
Mayfield, New York is a small town located in the foothills of the Adirondack Mountains in Fulton County. It is situated on the banks of the Great Sacandaga Lake, which is the largest lake in the Adirondack Park. The town was founded in 1820 and has a population of approximately 2,000 people.
History
Mayfield was first settled in 1820 by a group of settlers from the nearby town of Johnstown. The settlers were attracted to the area by the abundance of natural resources, including timber, water, and fertile soil. The town was named after the Mayfield family, who were among the first settlers.
The town grew slowly over the years, and by the mid-1800s, it had become a thriving agricultural community. The town was also home to several small industries, including a sawmill, a gristmill, and a tannery.
In the late 1800s, the town began to experience a period of growth and prosperity. The Great Sacandaga Lake was created in 1930, and the town quickly became a popular destination for tourists and vacationers. The lake provided a source of recreation and relaxation for the townspeople, and it also helped to spur economic growth.
Geography
Mayfield is located in the foothills of the Adirondack Mountains in Fulton County. The town is situated on the banks of the Great Sacandaga Lake, which is the largest lake in the Adirondack Park. The town is surrounded by rolling hills and forests, and it is home to several small streams and creeks.
The town is located approximately 30 miles north of Albany, the state capital, and it is about an hour and a half drive from the city of Syracuse. The town is also close to several ski resorts, including Gore Mountain and Whiteface Mountain.
Economy
The economy of Mayfield is largely based on tourism and recreation. The town is home to several resorts and hotels, as well as a variety of restaurants and shops. The town is also home to several marinas, which provide access to the Great Sacandaga Lake.
The town is also home to several small businesses, including a sawmill, a gristmill, and a tannery. The town is also home to several farms, which produce a variety of crops, including corn, soybeans, and hay.
Demographics
As of the 2010 census, the population of Mayfield was 2,000 people. The town is predominantly white, with approximately 95% of the population being Caucasian. The town is also home to a small Hispanic population, as well as a small African American population.
The median household income in Mayfield is approximately $45,000, and the median home value is approximately $150,000. The town has a low unemployment rate, and the majority of the population is employed in the tourism and recreation industry.
Mayfield is a small town with a rich history and a vibrant economy. The town is home to a variety of businesses and attractions, and it is a popular destination for tourists and vacationers. The town is also home to a diverse population, and it is a great place to live and work.
Common Questions
What is Per Capita Income in Mayfield?
Per Capita income in Mayfield is $34,222.
What is the Median Family Income in Mayfield?
Median Family Income in Mayfield is $93,250.
What is the Median Household income in Mayfield?
Median Household Income in Mayfield is $64,531.
What is Income or Wage Gap in Mayfield?
Income or Wage Gap in Mayfield is 18.3%.
Women in Mayfield earn 81.7 cents for every dollar earned by a man.
What is Inequality or Gini Index in Mayfield?
Inequality or Gini Index in Mayfield is 0.45.
What is the Total Population of Mayfield?
Total Population of Mayfield is 938.
What is the Total Male Population of Mayfield?
Total Male Population of Mayfield is 471.
What is the Total Female Population of Mayfield?
Total Female Population of Mayfield is 467.
What is the Ratio of Males per 100 Females in Mayfield?
There are 100.86 Males per 100 Females in Mayfield.
What is the Ratio of Females per 100 Males in Mayfield?
There are 99.15 Females per 100 Males in Mayfield.
What is the Median Population Age in Mayfield?
Median Population Age in Mayfield is 31.8 Years.
What is the Average Family Size in Mayfield
Average Family Size in Mayfield is 3.2 People.
What is the Average Household Size in Mayfield
Average Household Size in Mayfield is 2.6 People.
How Large is the Labor Force in Mayfield?
There are 463 People in the Labor Forcein in Mayfield.
What is the Percentage of People in the Labor Force in Mayfield?
64.1% of People are in the Labor Force in Mayfield.
What is the Unemployment Rate in Mayfield?
Unemployment Rate in Mayfield is 3.9%.