Monsey, NY Map & Demographics
Monsey Map
Monsey Overview
$14,062
PER CAPITA INCOME
$50,931
AVG FAMILY INCOME
$49,630
AVG HOUSEHOLD INCOME
52.6%
WAGE / INCOME GAP [ % ]
47.4¢/ $1
WAGE / INCOME GAP [ $ ]
0.50
INEQUALITY / GINI INDEX
28,287
TOTAL POPULATION
14,423
MALE POPULATION
13,864
FEMALE POPULATION
104.03
MALES / 100 FEMALES
96.12
FEMALES / 100 MALES
15.0
MEDIAN AGE
5.9
AVG FAMILY SIZE
5.7
AVG HOUSEHOLD SIZE
7,216
LABOR FORCE [ PEOPLE ]
53.7%
PERCENT IN LABOR FORCE
8.2%
UNEMPLOYMENT RATE
Monsey Zip Codes
Monsey Area Codes
Income in Monsey
Income Overview in Monsey
Per Capita Income in Monsey is $14,062, while median incomes of families and households are $50,931 and $49,630 respectively.
| Characteristic | Number | Measure |
| Per Capita Income | 28,287 | $14,062 |
| Median Family Income | 4,655 | $50,931 |
| Mean Family Income | 4,655 | $80,407 |
| Median Household Income | 4,844 | $49,630 |
| Mean Household Income | 4,844 | $78,894 |
| Income Deficit | 4,655 | $0 |
| Wage / Income Gap (%) | 28,287 | 52.61% |
| Wage / Income Gap ($) | 28,287 | 47.39¢ per $1 |
| Gini / Inequality Index | 28,287 | 0.50 |
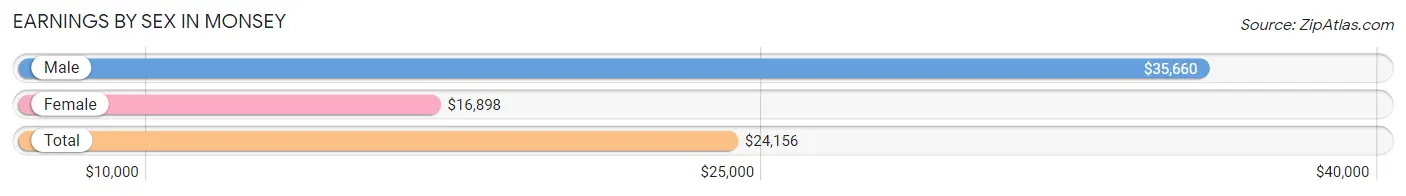
Earnings by Sex in Monsey
Average Earnings in Monsey are $24,156, $35,660 for men and $16,898 for women, a difference of 52.6%.
| Sex | Number | Average Earnings |
| Male | 4,172 (57.0%) | $35,660 |
| Female | 3,146 (43.0%) | $16,898 |
| Total | 7,318 (100.0%) | $24,156 |
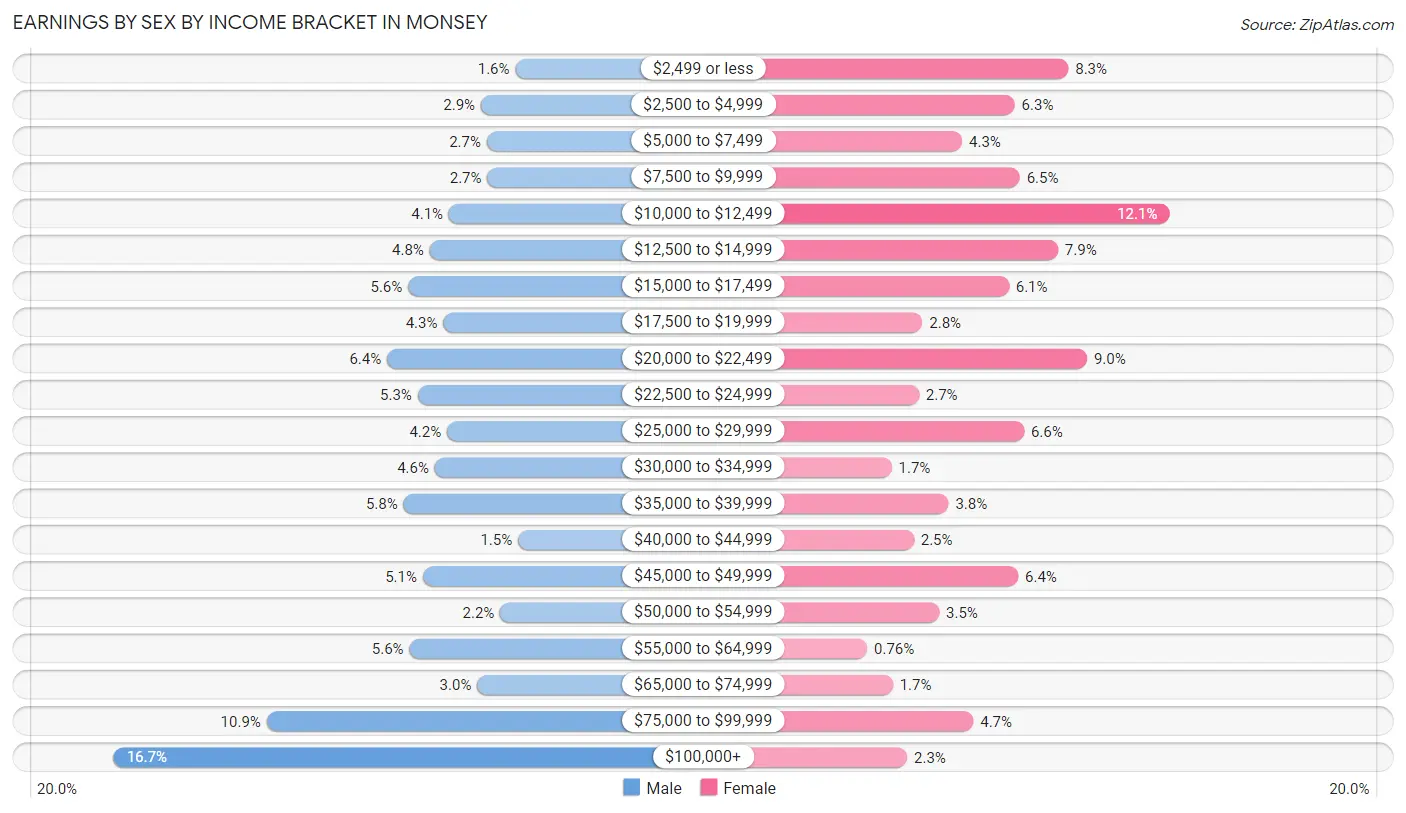
Earnings by Sex by Income Bracket in Monsey
The most common earnings brackets in Monsey are $100,000+ for men (695 | 16.7%) and $10,000 to $12,499 for women (380 | 12.1%).
| Income | Male | Female |
| $2,499 or less | 67 (1.6%) | 261 (8.3%) |
| $2,500 to $4,999 | 121 (2.9%) | 198 (6.3%) |
| $5,000 to $7,499 | 112 (2.7%) | 136 (4.3%) |
| $7,500 to $9,999 | 111 (2.7%) | 204 (6.5%) |
| $10,000 to $12,499 | 171 (4.1%) | 380 (12.1%) |
| $12,500 to $14,999 | 201 (4.8%) | 249 (7.9%) |
| $15,000 to $17,499 | 235 (5.6%) | 191 (6.1%) |
| $17,500 to $19,999 | 180 (4.3%) | 89 (2.8%) |
| $20,000 to $22,499 | 268 (6.4%) | 283 (9.0%) |
| $22,500 to $24,999 | 220 (5.3%) | 85 (2.7%) |
| $25,000 to $29,999 | 174 (4.2%) | 209 (6.6%) |
| $30,000 to $34,999 | 193 (4.6%) | 53 (1.7%) |
| $35,000 to $39,999 | 242 (5.8%) | 120 (3.8%) |
| $40,000 to $44,999 | 63 (1.5%) | 79 (2.5%) |
| $45,000 to $49,999 | 212 (5.1%) | 202 (6.4%) |
| $50,000 to $54,999 | 91 (2.2%) | 109 (3.5%) |
| $55,000 to $64,999 | 233 (5.6%) | 24 (0.8%) |
| $65,000 to $74,999 | 127 (3.0%) | 54 (1.7%) |
| $75,000 to $99,999 | 456 (10.9%) | 149 (4.7%) |
| $100,000+ | 695 (16.7%) | 71 (2.3%) |
| Total | 4,172 (100.0%) | 3,146 (100.0%) |
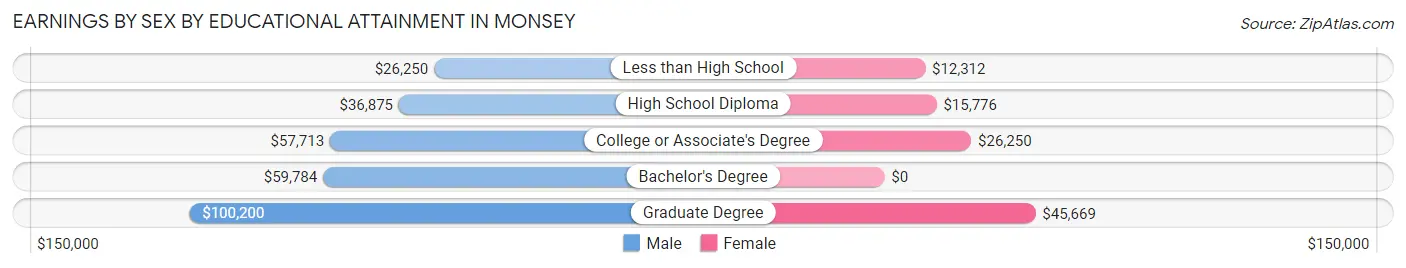
Earnings by Sex by Educational Attainment in Monsey
Average earnings in Monsey are $45,847 for men and $17,865 for women, a difference of 61.0%. Men with an educational attainment of graduate degree enjoy the highest average annual earnings of $100,200, while those with less than high school education earn the least with $26,250. Women with an educational attainment of graduate degree earn the most with the average annual earnings of $45,669, while those with less than high school education have the smallest earnings of $12,312.
| Educational Attainment | Male Income | Female Income |
| Less than High School | $26,250 | $12,312 |
| High School Diploma | $36,875 | $15,776 |
| College or Associate's Degree | $57,713 | $26,250 |
| Bachelor's Degree | $59,784 | $0 |
| Graduate Degree | $100,200 | $45,669 |
| Total | $45,847 | $17,865 |
Family Income in Monsey
Family Income Brackets in Monsey
According to the Monsey family income data, there are 773 families falling into the $50,000 to $74,999 income range, which is the most common income bracket and makes up 16.6% of all families. Conversely, the less than $10,000 income bracket is the least frequent group with only 186 families (4.0%) belonging to this category.
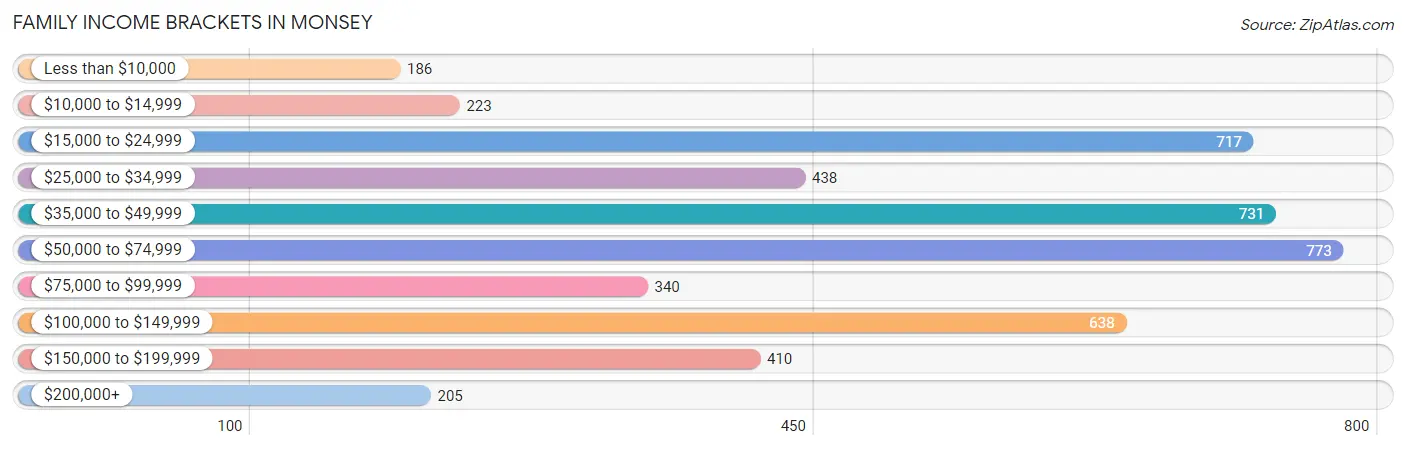
| Income Bracket | # Families | % Families |
| Less than $10,000 | 186 | 4.0% |
| $10,000 to $14,999 | 223 | 4.8% |
| $15,000 to $24,999 | 717 | 15.4% |
| $25,000 to $34,999 | 438 | 9.4% |
| $35,000 to $49,999 | 731 | 15.7% |
| $50,000 to $74,999 | 773 | 16.6% |
| $75,000 to $99,999 | 340 | 7.3% |
| $100,000 to $149,999 | 638 | 13.7% |
| $150,000 to $199,999 | 410 | 8.8% |
| $200,000+ | 205 | 4.4% |
Family Income by Famaliy Size in Monsey
2-person families (634 | 13.6%) account for the highest median family income in Monsey with $71,130 per family, while 2-person families (634 | 13.6%) have the highest median income of $35,565 per family member.
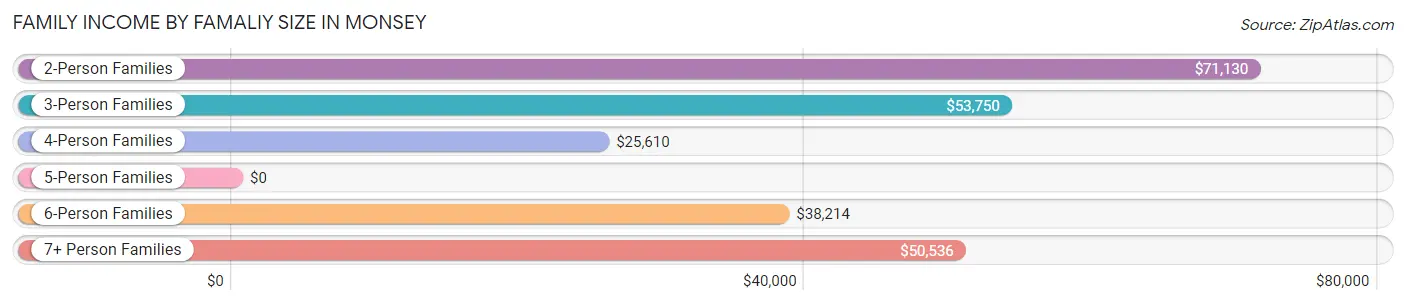
| Income Bracket | # Families | Median Income |
| 2-Person Families | 634 (13.6%) | $71,130 |
| 3-Person Families | 594 (12.8%) | $53,750 |
| 4-Person Families | 384 (8.3%) | $25,610 |
| 5-Person Families | 529 (11.4%) | $0 |
| 6-Person Families | 448 (9.6%) | $38,214 |
| 7+ Person Families | 2,066 (44.4%) | $50,536 |
| Total | 4,655 (100.0%) | $50,931 |
Family Income by Number of Earners in Monsey
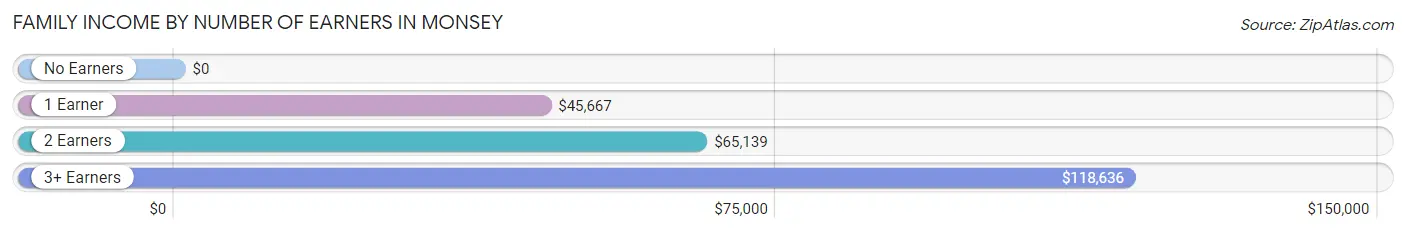
| Number of Earners | # Families | Median Income |
| No Earners | 313 (6.7%) | $0 |
| 1 Earner | 2,330 (50.0%) | $45,667 |
| 2 Earners | 1,704 (36.6%) | $65,139 |
| 3+ Earners | 308 (6.6%) | $118,636 |
| Total | 4,655 (100.0%) | $50,931 |
Household Income in Monsey
Household Income Brackets in Monsey
With 765 households falling in the category, the $50,000 to $74,999 income range is the most frequent in Monsey, accounting for 15.8% of all households. In contrast, only 203 households (4.2%) fall into the less than $10,000 income bracket, making it the least populous group.
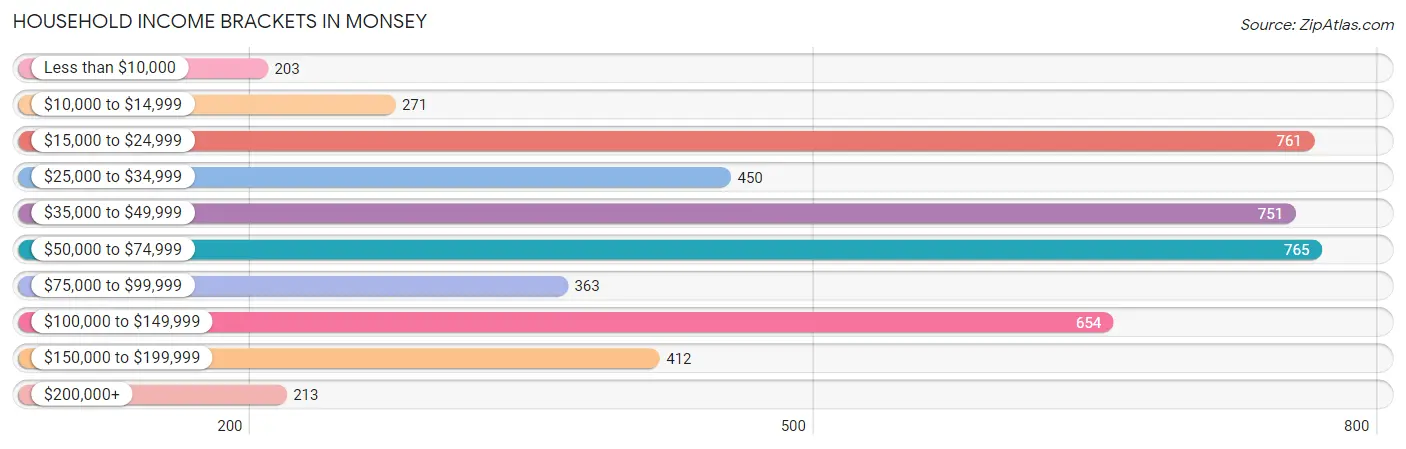
| Income Bracket | # Households | % Households |
| Less than $10,000 | 203 | 4.2% |
| $10,000 to $14,999 | 271 | 5.6% |
| $15,000 to $24,999 | 761 | 15.7% |
| $25,000 to $34,999 | 450 | 9.3% |
| $35,000 to $49,999 | 751 | 15.5% |
| $50,000 to $74,999 | 765 | 15.8% |
| $75,000 to $99,999 | 363 | 7.5% |
| $100,000 to $149,999 | 654 | 13.5% |
| $150,000 to $199,999 | 412 | 8.5% |
| $200,000+ | 213 | 4.4% |
Household Income by Householder Age in Monsey
The median household income in Monsey is $49,630, with the highest median household income of $86,842 found in the 45 to 64 years age bracket for the primary householder. A total of 988 households (20.4%) fall into this category. Meanwhile, the 15 to 24 years age bracket for the primary householder has the lowest median household income of $18,750, with 534 households (11.0%) in this group.
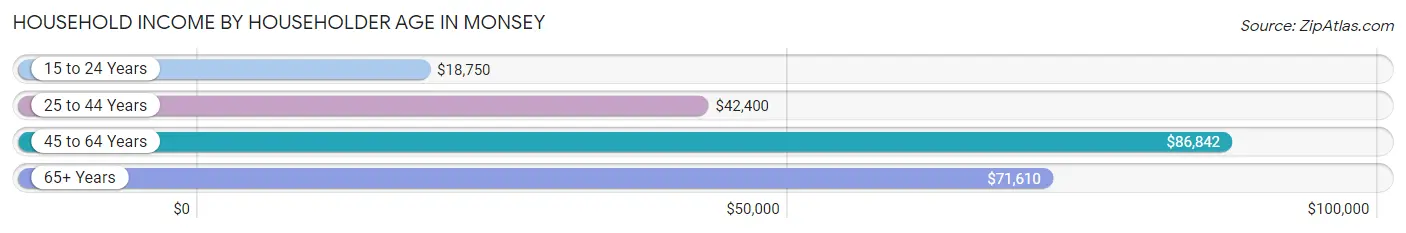
| Income Bracket | # Households | Median Income |
| 15 to 24 Years | 534 (11.0%) | $18,750 |
| 25 to 44 Years | 2,656 (54.8%) | $42,400 |
| 45 to 64 Years | 988 (20.4%) | $86,842 |
| 65+ Years | 666 (13.8%) | $71,610 |
| Total | 4,844 (100.0%) | $49,630 |
Poverty in Monsey
Income Below Poverty by Sex and Age in Monsey
With 47.4% poverty level for males and 44.2% for females among the residents of Monsey, 5 year old males and 5 year old females are the most vulnerable to poverty, with 235 males (68.3%) and 284 females (61.9%) in their respective age groups living below the poverty level.
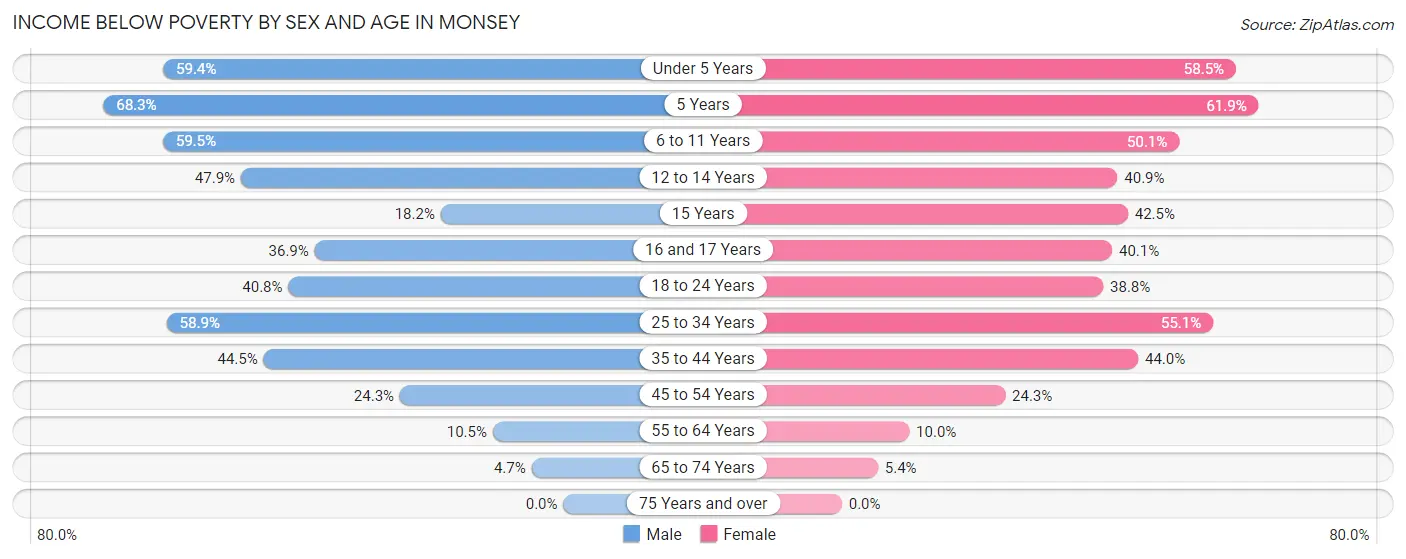
| Age Bracket | Male | Female |
| Under 5 Years | 1,731 (59.4%) | 1,459 (58.5%) |
| 5 Years | 235 (68.3%) | 284 (61.9%) |
| 6 to 11 Years | 1,764 (59.5%) | 1,312 (50.1%) |
| 12 to 14 Years | 541 (47.9%) | 509 (40.9%) |
| 15 Years | 63 (18.2%) | 141 (42.5%) |
| 16 and 17 Years | 256 (36.9%) | 256 (40.1%) |
| 18 to 24 Years | 619 (40.8%) | 483 (38.8%) |
| 25 to 34 Years | 705 (58.9%) | 732 (55.1%) |
| 35 to 44 Years | 698 (44.5%) | 692 (44.0%) |
| 45 to 54 Years | 116 (24.3%) | 145 (24.2%) |
| 55 to 64 Years | 51 (10.5%) | 47 (10.0%) |
| 65 to 74 Years | 21 (4.7%) | 28 (5.3%) |
| 75 Years and over | 0 (0.0%) | 0 (0.0%) |
| Total | 6,800 (47.4%) | 6,088 (44.2%) |
Income Above Poverty by Sex and Age in Monsey
According to the poverty statistics in Monsey, males aged 75 years and over and females aged 75 years and over are the age groups that are most secure financially, with 100.0% of males and 100.0% of females in these age groups living above the poverty line.
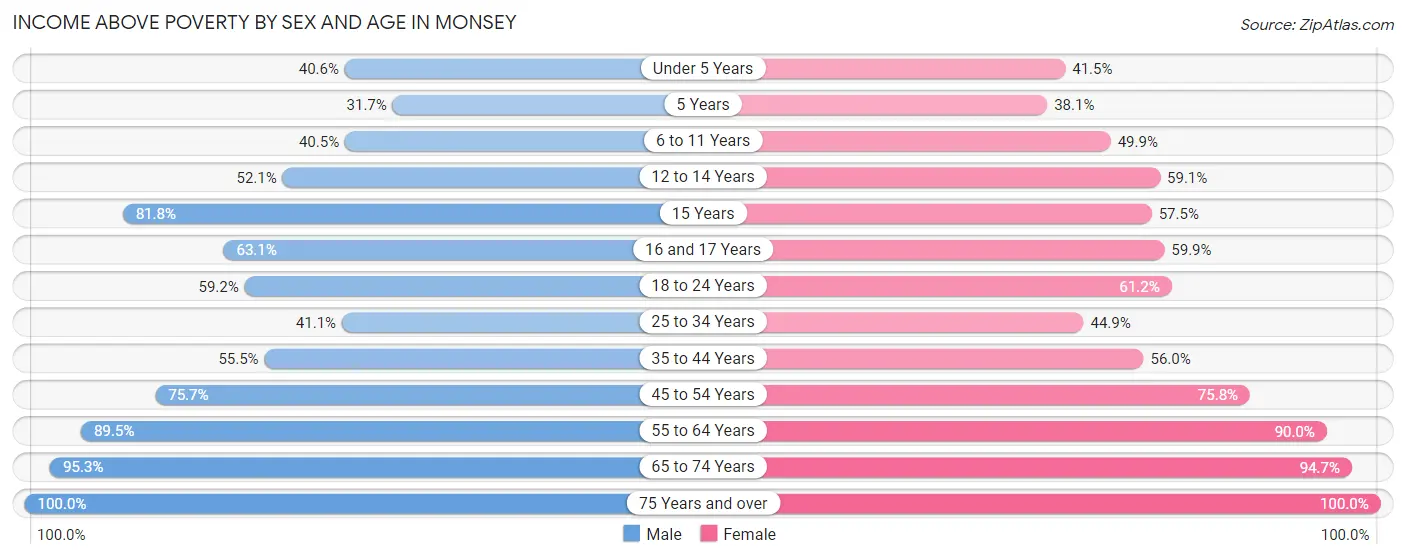
| Age Bracket | Male | Female |
| Under 5 Years | 1,181 (40.6%) | 1,034 (41.5%) |
| 5 Years | 109 (31.7%) | 175 (38.1%) |
| 6 to 11 Years | 1,202 (40.5%) | 1,308 (49.9%) |
| 12 to 14 Years | 589 (52.1%) | 735 (59.1%) |
| 15 Years | 283 (81.8%) | 191 (57.5%) |
| 16 and 17 Years | 437 (63.1%) | 382 (59.9%) |
| 18 to 24 Years | 897 (59.2%) | 762 (61.2%) |
| 25 to 34 Years | 492 (41.1%) | 596 (44.9%) |
| 35 to 44 Years | 870 (55.5%) | 881 (56.0%) |
| 45 to 54 Years | 362 (75.7%) | 453 (75.7%) |
| 55 to 64 Years | 436 (89.5%) | 423 (90.0%) |
| 65 to 74 Years | 424 (95.3%) | 495 (94.7%) |
| 75 Years and over | 255 (100.0%) | 264 (100.0%) |
| Total | 7,537 (52.6%) | 7,699 (55.8%) |
Income Below Poverty Among Married-Couple Families in Monsey
The poverty statistics for married-couple families in Monsey show that 41.8% or 1,859 of the total 4,446 families live below the poverty line. Families with 3 or 4 children have the highest poverty rate of 62.2%, comprising of 542 families. On the other hand, families with no children have the lowest poverty rate of 5.3%, which includes 47 families.
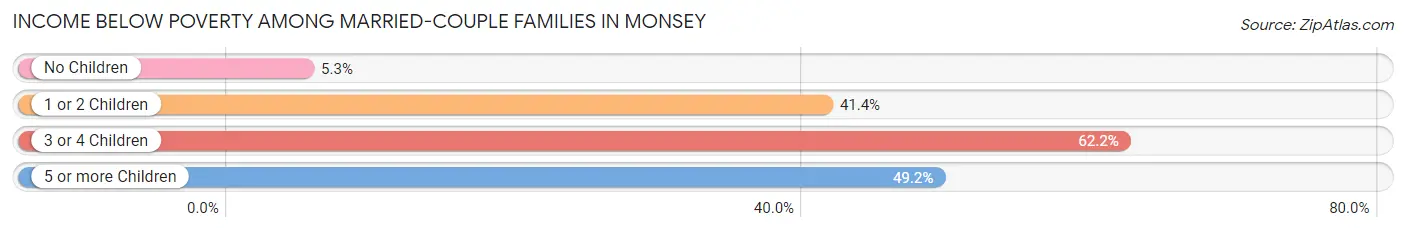
| Children | Above Poverty | Below Poverty |
| No Children | 839 (94.7%) | 47 (5.3%) |
| 1 or 2 Children | 400 (58.6%) | 283 (41.4%) |
| 3 or 4 Children | 330 (37.8%) | 542 (62.2%) |
| 5 or more Children | 1,018 (50.8%) | 987 (49.2%) |
| Total | 2,587 (58.2%) | 1,859 (41.8%) |
Income Below Poverty Among Single-Parent Households in Monsey
According to the poverty data in Monsey, 41.5% or 22 single-father households and 44.9% or 70 single-mother households are living below the poverty line. Among single-father households, those with 1 or 2 children have the highest poverty rate, with 22 households (68.8%) experiencing poverty. Likewise, among single-mother households, those with 3 or 4 children have the highest poverty rate, with 7 households (100.0%) falling below the poverty line.
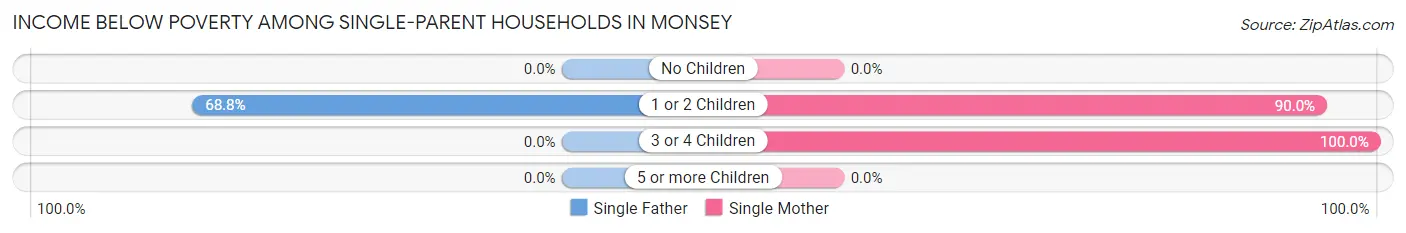
| Children | Single Father | Single Mother |
| No Children | 0 (0.0%) | 0 (0.0%) |
| 1 or 2 Children | 22 (68.8%) | 63 (90.0%) |
| 3 or 4 Children | 0 (0.0%) | 7 (100.0%) |
| 5 or more Children | 0 (0.0%) | 0 (0.0%) |
| Total | 22 (41.5%) | 70 (44.9%) |
Income Below Poverty Among Married-Couple vs Single-Parent Households in Monsey
The poverty data for Monsey shows that 1,859 of the married-couple family households (41.8%) and 92 of the single-parent households (44.0%) are living below the poverty level. Within the married-couple family households, those with 3 or 4 children have the highest poverty rate, with 542 households (62.2%) falling below the poverty line. Among the single-parent households, those with 3 or 4 children have the highest poverty rate, with 7 household (100.0%) living below poverty.
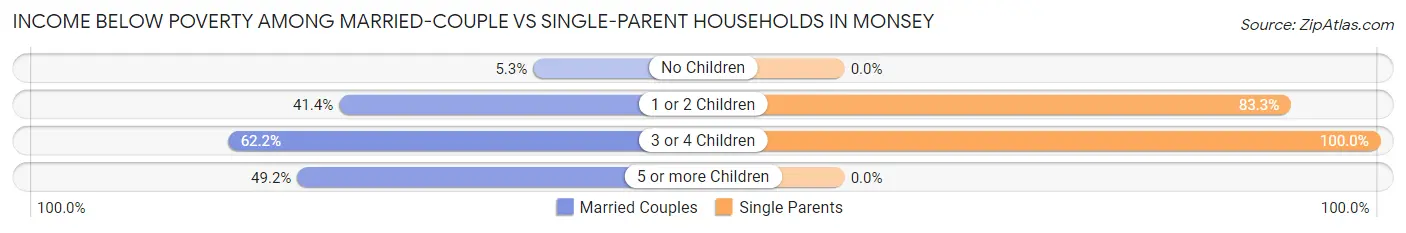
| Children | Married-Couple Families | Single-Parent Households |
| No Children | 47 (5.3%) | 0 (0.0%) |
| 1 or 2 Children | 283 (41.4%) | 85 (83.3%) |
| 3 or 4 Children | 542 (62.2%) | 7 (100.0%) |
| 5 or more Children | 987 (49.2%) | 0 (0.0%) |
| Total | 1,859 (41.8%) | 92 (44.0%) |
Race in Monsey
The most populous races in Monsey are White / Caucasian (27,118 | 95.9%), Black / African American (582 | 2.1%), and Two or more Races (417 | 1.5%).
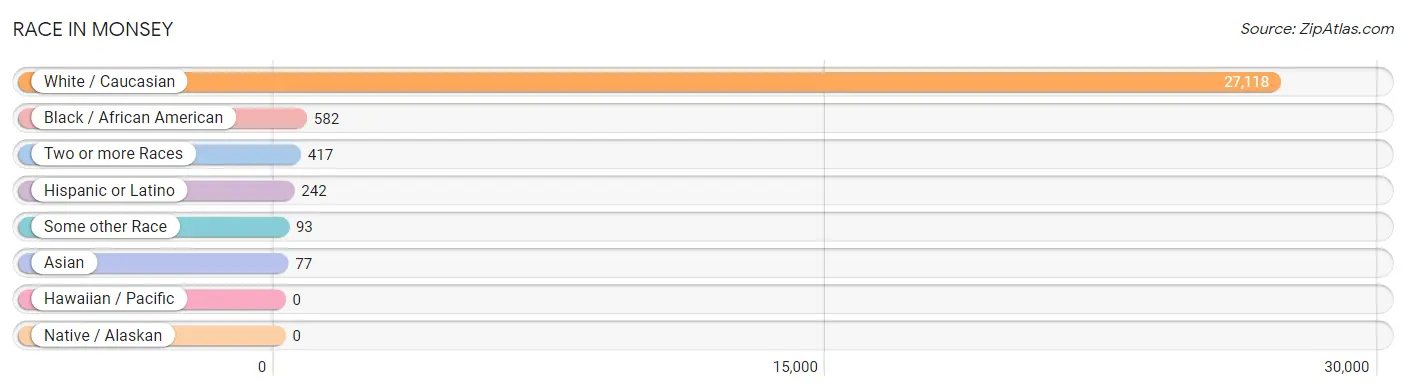
| Race | # Population | % Population |
| Asian | 77 | 0.3% |
| Black / African American | 582 | 2.1% |
| Hawaiian / Pacific | 0 | 0.0% |
| Hispanic or Latino | 242 | 0.9% |
| Native / Alaskan | 0 | 0.0% |
| White / Caucasian | 27,118 | 95.9% |
| Two or more Races | 417 | 1.5% |
| Some other Race | 93 | 0.3% |
| Total | 28,287 | 100.0% |
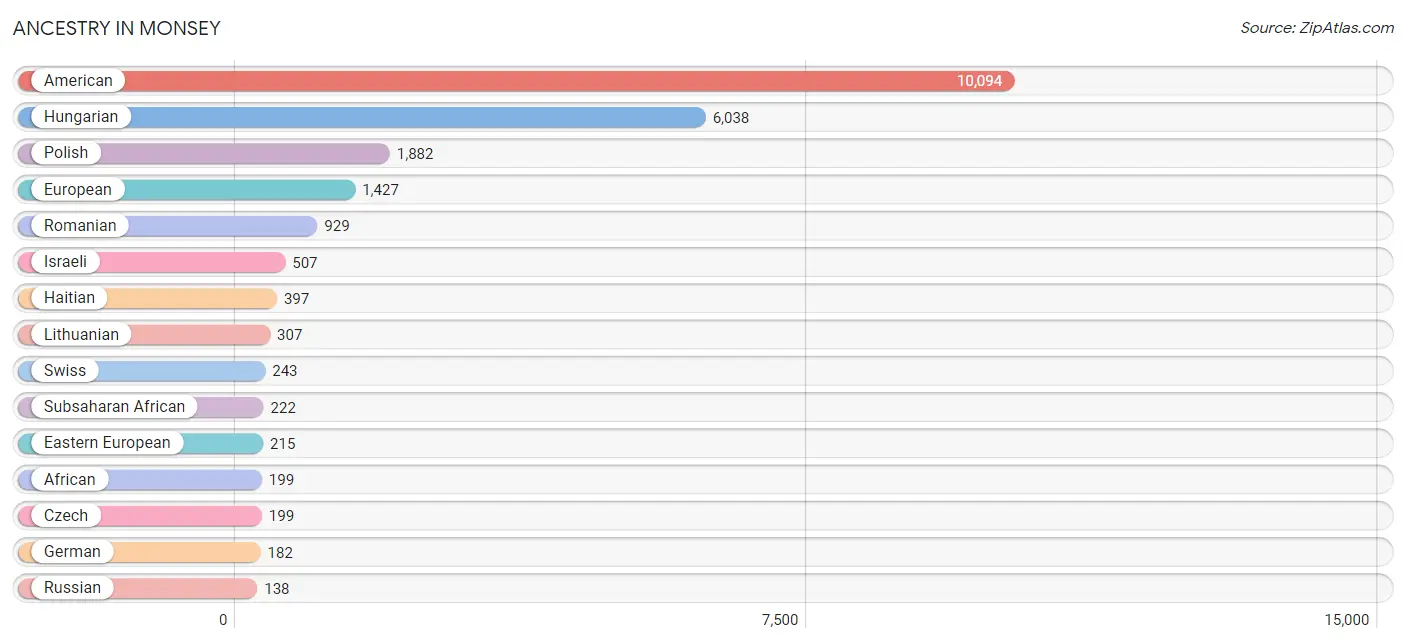
Ancestry in Monsey
The most populous ancestries reported in Monsey are American (10,094 | 35.7%), Hungarian (6,038 | 21.3%), Polish (1,882 | 6.7%), European (1,427 | 5.0%), and Romanian (929 | 3.3%), together accounting for 72.0% of all Monsey residents.
| Ancestry | # Population | % Population |
| African | 199 | 0.7% |
| American | 10,094 | 35.7% |
| Arab | 119 | 0.4% |
| Argentinean | 34 | 0.1% |
| Austrian | 113 | 0.4% |
| Belgian | 49 | 0.2% |
| Bhutanese | 9 | 0.0% |
| British | 94 | 0.3% |
| British West Indian | 18 | 0.1% |
| Canadian | 94 | 0.3% |
| Central American | 85 | 0.3% |
| Czech | 199 | 0.7% |
| Czechoslovakian | 121 | 0.4% |
| Dominican | 52 | 0.2% |
| Dutch | 67 | 0.2% |
| Eastern European | 215 | 0.8% |
| English | 109 | 0.4% |
| Estonian | 2 | 0.0% |
| Ethiopian | 9 | 0.0% |
| European | 1,427 | 5.0% |
| French | 47 | 0.2% |
| German | 182 | 0.6% |
| Guatemalan | 58 | 0.2% |
| Haitian | 397 | 1.4% |
| Honduran | 25 | 0.1% |
| Hungarian | 6,038 | 21.3% |
| Irish | 73 | 0.3% |
| Israeli | 507 | 1.8% |
| Italian | 23 | 0.1% |
| Korean | 16 | 0.1% |
| Lebanese | 64 | 0.2% |
| Lithuanian | 307 | 1.1% |
| Panamanian | 2 | 0.0% |
| Polish | 1,882 | 6.7% |
| Portuguese | 5 | 0.0% |
| Puerto Rican | 37 | 0.1% |
| Romanian | 929 | 3.3% |
| Russian | 138 | 0.5% |
| Scotch-Irish | 12 | 0.0% |
| Slovak | 36 | 0.1% |
| South African | 14 | 0.1% |
| South American | 34 | 0.1% |
| Subsaharan African | 222 | 0.8% |
| Swiss | 243 | 0.9% |
| Thai | 66 | 0.2% |
| Turkish | 5 | 0.0% |
| Ukrainian | 113 | 0.4% |
| West Indian | 9 | 0.0% | View All 48 Rows |
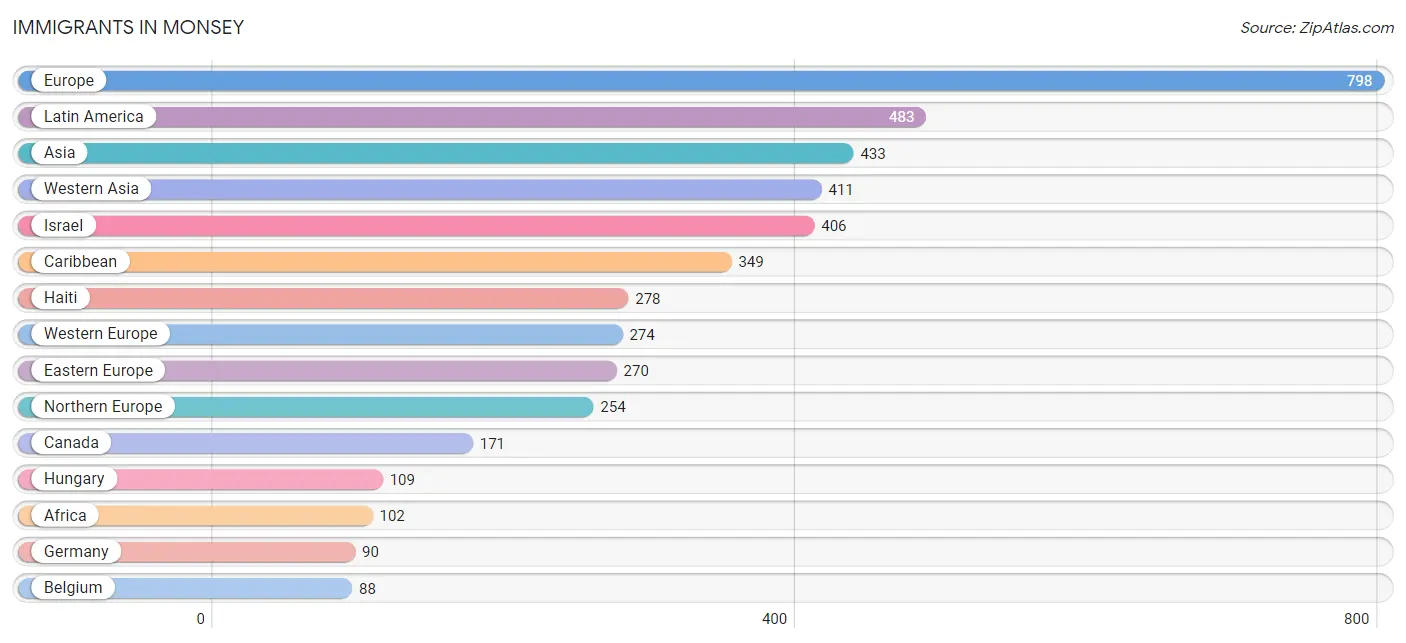
Immigrants in Monsey
The most numerous immigrant groups reported in Monsey came from Europe (798 | 2.8%), Latin America (483 | 1.7%), Asia (433 | 1.5%), Western Asia (411 | 1.5%), and Israel (406 | 1.4%), together accounting for 8.9% of all Monsey residents.
| Immigration Origin | # Population | % Population |
| Africa | 102 | 0.4% |
| Argentina | 30 | 0.1% |
| Asia | 433 | 1.5% |
| Australia | 14 | 0.1% |
| Austria | 38 | 0.1% |
| Barbados | 15 | 0.1% |
| Belarus | 4 | 0.0% |
| Belgium | 88 | 0.3% |
| Brazil | 6 | 0.0% |
| Canada | 171 | 0.6% |
| Caribbean | 349 | 1.2% |
| Central America | 83 | 0.3% |
| China | 8 | 0.0% |
| Czechoslovakia | 16 | 0.1% |
| Dominican Republic | 41 | 0.1% |
| Eastern Africa | 9 | 0.0% |
| Eastern Asia | 8 | 0.0% |
| Eastern Europe | 270 | 0.9% |
| England | 86 | 0.3% |
| Ethiopia | 9 | 0.0% |
| Europe | 798 | 2.8% |
| France | 42 | 0.2% |
| Germany | 90 | 0.3% |
| Grenada | 9 | 0.0% |
| Guatemala | 58 | 0.2% |
| Haiti | 278 | 1.0% |
| Honduras | 25 | 0.1% |
| Hungary | 109 | 0.4% |
| Israel | 406 | 1.4% |
| Jamaica | 6 | 0.0% |
| Latin America | 483 | 1.7% |
| Lithuania | 24 | 0.1% |
| Middle Africa | 9 | 0.0% |
| Northern Europe | 254 | 0.9% |
| Oceania | 14 | 0.1% |
| Pakistan | 8 | 0.0% |
| Philippines | 6 | 0.0% |
| Poland | 5 | 0.0% |
| Romania | 71 | 0.3% |
| Sierra Leone | 40 | 0.1% |
| South Africa | 44 | 0.2% |
| South America | 51 | 0.2% |
| South Central Asia | 8 | 0.0% |
| South Eastern Asia | 6 | 0.0% |
| Switzerland | 16 | 0.1% |
| Turkey | 5 | 0.0% |
| Ukraine | 41 | 0.1% |
| Uruguay | 15 | 0.1% |
| Western Africa | 40 | 0.1% |
| Western Asia | 411 | 1.5% |
| Western Europe | 274 | 1.0% |
| Zaire | 9 | 0.0% | View All 52 Rows |
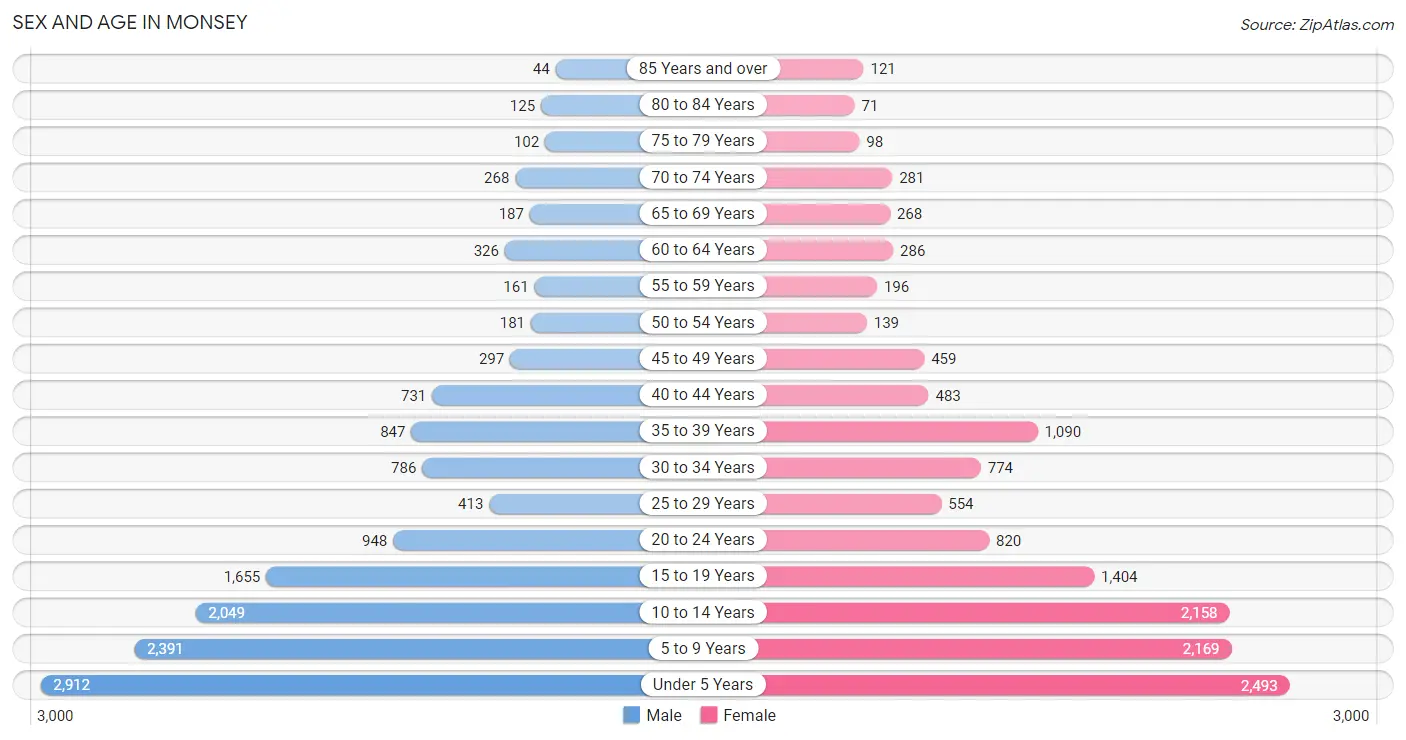
Sex and Age in Monsey
Sex and Age in Monsey
The most populous age groups in Monsey are Under 5 Years (2,912 | 20.2%) for men and Under 5 Years (2,493 | 18.0%) for women.
| Age Bracket | Male | Female |
| Under 5 Years | 2,912 (20.2%) | 2,493 (18.0%) |
| 5 to 9 Years | 2,391 (16.6%) | 2,169 (15.6%) |
| 10 to 14 Years | 2,049 (14.2%) | 2,158 (15.6%) |
| 15 to 19 Years | 1,655 (11.5%) | 1,404 (10.1%) |
| 20 to 24 Years | 948 (6.6%) | 820 (5.9%) |
| 25 to 29 Years | 413 (2.9%) | 554 (4.0%) |
| 30 to 34 Years | 786 (5.4%) | 774 (5.6%) |
| 35 to 39 Years | 847 (5.9%) | 1,090 (7.9%) |
| 40 to 44 Years | 731 (5.1%) | 483 (3.5%) |
| 45 to 49 Years | 297 (2.1%) | 459 (3.3%) |
| 50 to 54 Years | 181 (1.3%) | 139 (1.0%) |
| 55 to 59 Years | 161 (1.1%) | 196 (1.4%) |
| 60 to 64 Years | 326 (2.3%) | 286 (2.1%) |
| 65 to 69 Years | 187 (1.3%) | 268 (1.9%) |
| 70 to 74 Years | 268 (1.9%) | 281 (2.0%) |
| 75 to 79 Years | 102 (0.7%) | 98 (0.7%) |
| 80 to 84 Years | 125 (0.9%) | 71 (0.5%) |
| 85 Years and over | 44 (0.3%) | 121 (0.9%) |
| Total | 14,423 (100.0%) | 13,864 (100.0%) |
Families and Households in Monsey
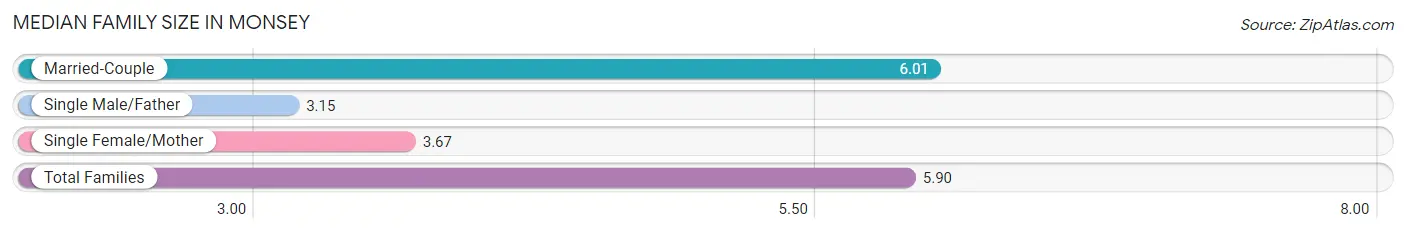
Median Family Size in Monsey
The median family size in Monsey is 5.90 persons per family, with married-couple families (4,446 | 95.5%) accounting for the largest median family size of 6.01 persons per family. On the other hand, single male/father families (53 | 1.1%) represent the smallest median family size with 3.15 persons per family.
| Family Type | # Families | Family Size |
| Married-Couple | 4,446 (95.5%) | 6.01 |
| Single Male/Father | 53 (1.1%) | 3.15 |
| Single Female/Mother | 156 (3.4%) | 3.67 |
| Total Families | 4,655 (100.0%) | 5.90 |
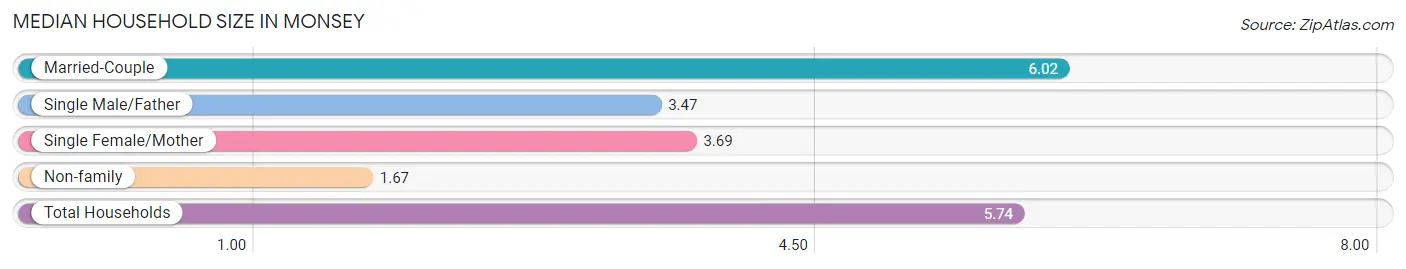
Median Household Size in Monsey
The median household size in Monsey is 5.74 persons per household, with married-couple households (4,446 | 91.8%) accounting for the largest median household size of 6.02 persons per household. non-family households (189 | 3.9%) represent the smallest median household size with 1.67 persons per household.
| Household Type | # Households | Household Size |
| Married-Couple | 4,446 (91.8%) | 6.02 |
| Single Male/Father | 53 (1.1%) | 3.47 |
| Single Female/Mother | 156 (3.2%) | 3.69 |
| Non-family | 189 (3.9%) | 1.67 |
| Total Households | 4,844 (100.0%) | 5.74 |
Household Size by Marriage Status in Monsey
Out of a total of 4,844 households in Monsey, 4,655 (96.1%) are family households, while 189 (3.9%) are nonfamily households. The most numerous type of family households are 7+ person households, comprising 2,066, and the most common type of nonfamily households are 1-person households, comprising 122.
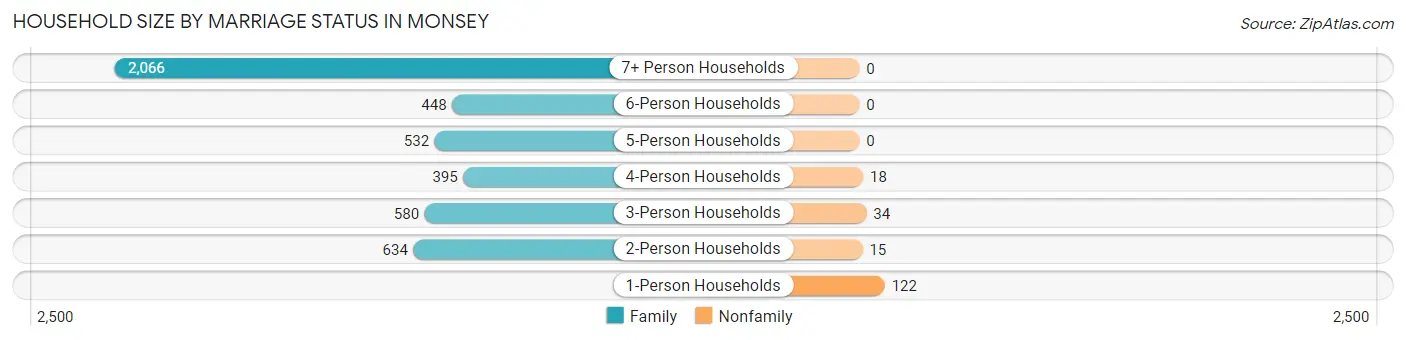
| Household Size | Family Households | Nonfamily Households |
| 1-Person Households | - | 122 (2.5%) |
| 2-Person Households | 634 (13.1%) | 15 (0.3%) |
| 3-Person Households | 580 (12.0%) | 34 (0.7%) |
| 4-Person Households | 395 (8.2%) | 18 (0.4%) |
| 5-Person Households | 532 (11.0%) | 0 (0.0%) |
| 6-Person Households | 448 (9.2%) | 0 (0.0%) |
| 7+ Person Households | 2,066 (42.6%) | 0 (0.0%) |
| Total | 4,655 (96.1%) | 189 (3.9%) |
Female Fertility in Monsey
Fertility by Age in Monsey
Average fertility rate in Monsey is 247.0 births per 1,000 women. Women in the age bracket of 20 to 34 years have the highest fertility rate with 431.0 births per 1,000 women. Women in the age bracket of 20 to 34 years acount for 66.7% of all women with births.
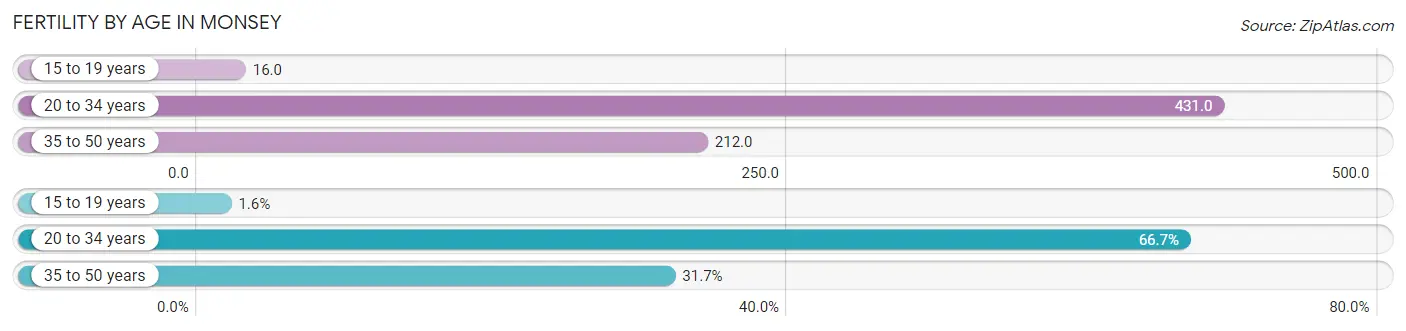
| Age Bracket | Women with Births | Births / 1,000 Women |
| 15 to 19 years | 22 (1.6%) | 16.0 |
| 20 to 34 years | 925 (66.7%) | 431.0 |
| 35 to 50 years | 440 (31.7%) | 212.0 |
| Total | 1,387 (100.0%) | 247.0 |
Fertility by Age by Marriage Status in Monsey
98.4% of women with births (1,387) in Monsey are married. The highest percentage of unmarried women with births falls into 15 to 19 years age bracket with 100.0% of them unmarried at the time of birth, while the lowest percentage of unmarried women with births belong to 20 to 34 years age bracket with 0.0% of them unmarried.
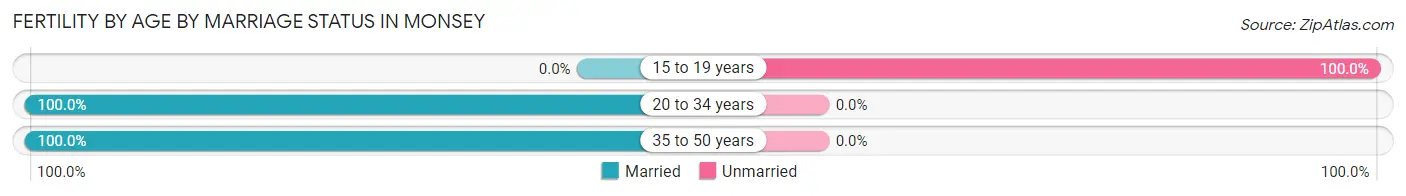
| Age Bracket | Married | Unmarried |
| 15 to 19 years | 0 (0.0%) | 22 (100.0%) |
| 20 to 34 years | 925 (100.0%) | 0 (0.0%) |
| 35 to 50 years | 440 (100.0%) | 0 (0.0%) |
| Total | 1,365 (98.4%) | 22 (1.6%) |
Fertility by Education in Monsey
Average fertility rate in Monsey is 247.0 births per 1,000 women. Women with the education attainment of bachelor's degree have the highest fertility rate of 406.0 births per 1,000 women, while women with the education attainment of graduate degree have the lowest fertility at 117.0 births per 1,000 women. Women with the education attainment of high school diploma represent 70.8% of all women with births.

| Educational Attainment | Women with Births | Births / 1,000 Women |
| Less than High School | 245 (17.7%) | 147.0 |
| High School Diploma | 982 (70.8%) | 316.0 |
| College or Associate's Degree | 85 (6.1%) | 185.0 |
| Bachelor's Degree | 41 (3.0%) | 406.0 |
| Graduate Degree | 34 (2.5%) | 117.0 |
| Total | 1,387 (100.0%) | 247.0 |
Fertility by Education by Marriage Status in Monsey
1.6% of women with births in Monsey are unmarried. Women with the educational attainment of high school diploma are most likely to be married with 100.0% of them married at childbirth, while women with the educational attainment of less than high school are least likely to be married with 9.0% of them unmarried at childbirth.
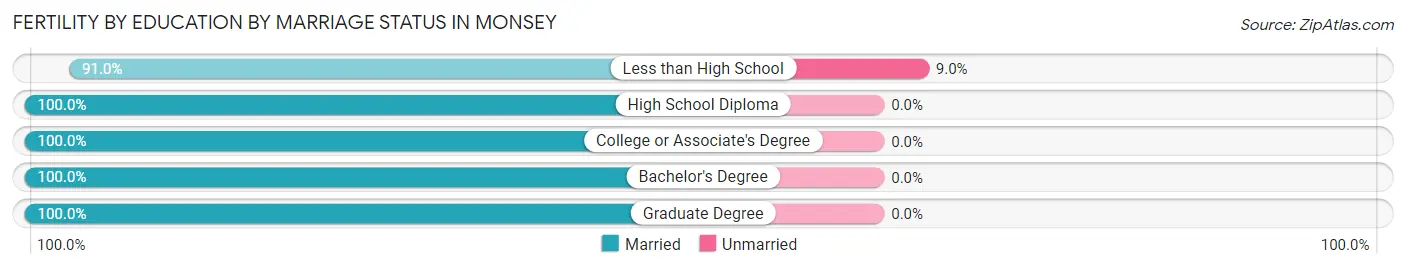
| Educational Attainment | Married | Unmarried |
| Less than High School | 223 (91.0%) | 22 (9.0%) |
| High School Diploma | 982 (100.0%) | 0 (0.0%) |
| College or Associate's Degree | 85 (100.0%) | 0 (0.0%) |
| Bachelor's Degree | 41 (100.0%) | 0 (0.0%) |
| Graduate Degree | 34 (100.0%) | 0 (0.0%) |
| Total | 1,365 (98.4%) | 22 (1.6%) |
Employment Characteristics in Monsey
Employment by Class of Employer in Monsey
Among the 6,517 employed individuals in Monsey, private company employees (2,953 | 45.3%), not-for-profit organizations (2,786 | 42.7%), and self-employed (incorporated) (287 | 4.4%) make up the most common classes of employment.
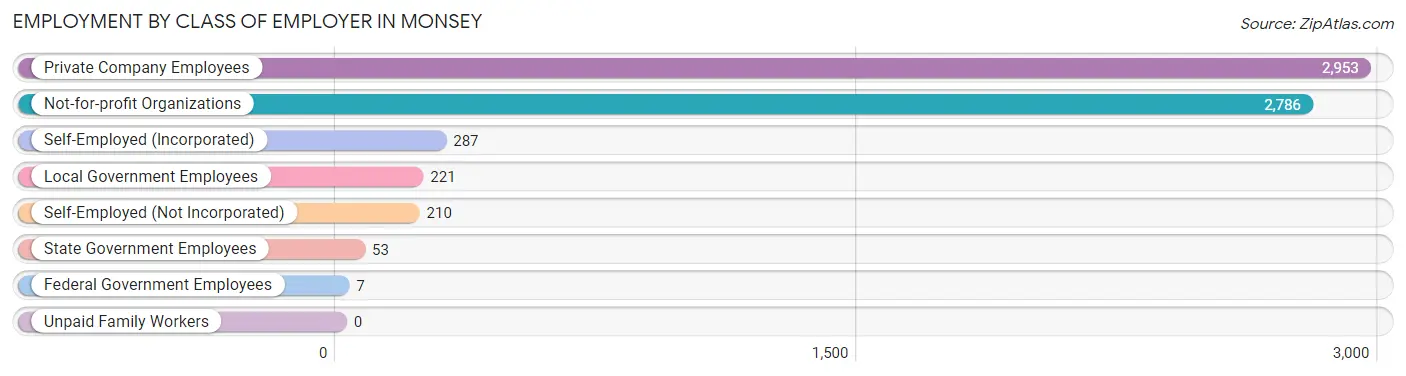
| Employer Class | # Employees | % Employees |
| Private Company Employees | 2,953 | 45.3% |
| Self-Employed (Incorporated) | 287 | 4.4% |
| Self-Employed (Not Incorporated) | 210 | 3.2% |
| Not-for-profit Organizations | 2,786 | 42.7% |
| Local Government Employees | 221 | 3.4% |
| State Government Employees | 53 | 0.8% |
| Federal Government Employees | 7 | 0.1% |
| Unpaid Family Workers | 0 | 0.0% |
| Total | 6,517 | 100.0% |
Employment Status by Age in Monsey
According to the labor force statistics for Monsey, out of the total population over 16 years of age (13,437), 53.7% or 7,216 individuals are in the labor force, with 8.2% or 592 of them unemployed. The age group with the highest labor force participation rate is 45 to 54 years, with 71.2% or 766 individuals in the labor force. Within the labor force, the 16 to 19 years age range has the highest percentage of unemployed individuals, with 36.1% or 164 of them being unemployed.
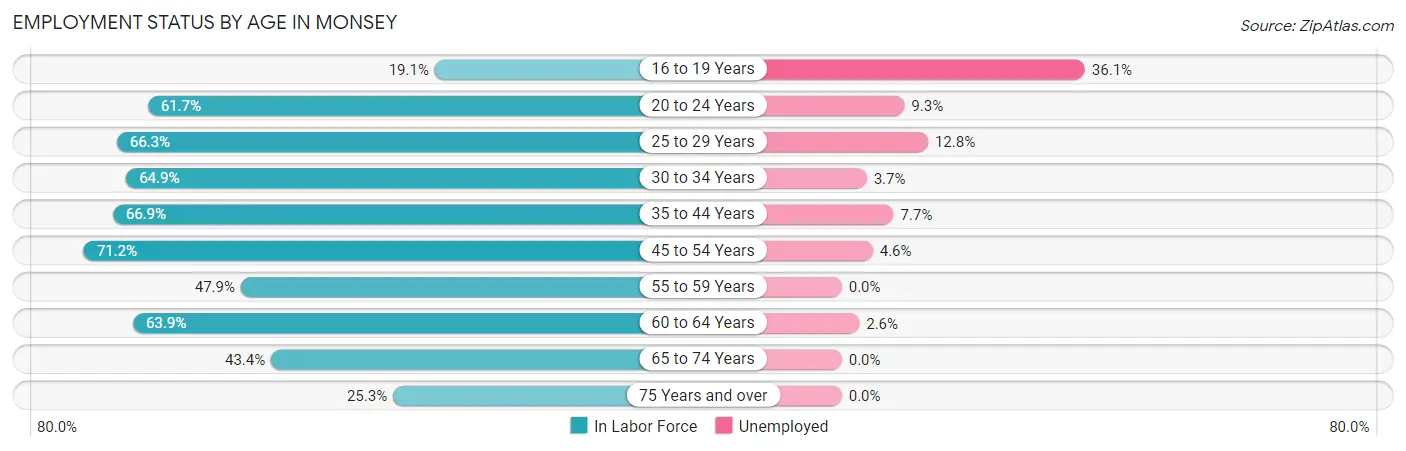
| Age Bracket | In Labor Force | Unemployed |
| 16 to 19 Years | 455 (19.1%) | 164 (36.1%) |
| 20 to 24 Years | 1,091 (61.7%) | 101 (9.3%) |
| 25 to 29 Years | 641 (66.3%) | 82 (12.8%) |
| 30 to 34 Years | 1,012 (64.9%) | 37 (3.7%) |
| 35 to 44 Years | 2,108 (66.9%) | 162 (7.7%) |
| 45 to 54 Years | 766 (71.2%) | 35 (4.6%) |
| 55 to 59 Years | 171 (47.9%) | 0 (0.0%) |
| 60 to 64 Years | 391 (63.9%) | 10 (2.6%) |
| 65 to 74 Years | 436 (43.4%) | 0 (0.0%) |
| 75 Years and over | 142 (25.3%) | 0 (0.0%) |
| Total | 7,216 (53.7%) | 592 (8.2%) |
Employment Status by Educational Attainment in Monsey
According to labor force statistics for Monsey, 65.9% of individuals (5,089) out of the total population between 25 and 64 years of age (7,723) are in the labor force, with 6.4% or 326 of them being unemployed. The group with the highest labor force participation rate are those with the educational attainment of bachelor's degree or higher, with 88.6% or 735 individuals in the labor force. Within the labor force, individuals with bachelor's degree or higher education have the highest percentage of unemployment, with 15.6% or 115 of them being unemployed.
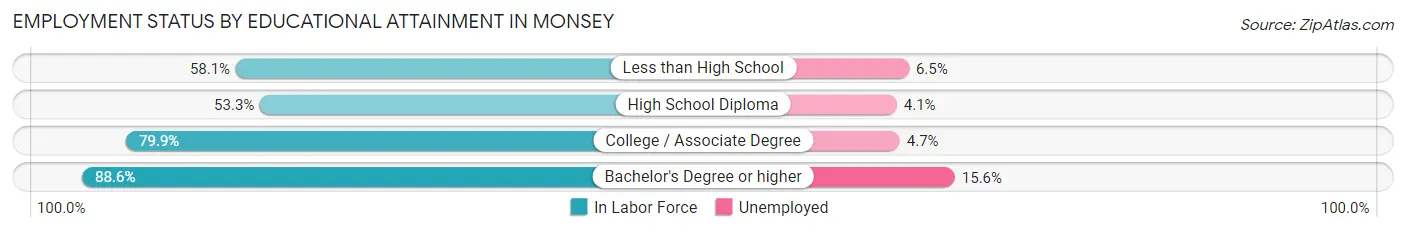
| Educational Attainment | In Labor Force | Unemployed |
| Less than High School | 909 (58.1%) | 102 (6.5%) |
| High School Diploma | 1,621 (53.3%) | 125 (4.1%) |
| College / Associate Degree | 1,827 (79.9%) | 107 (4.7%) |
| Bachelor's Degree or higher | 735 (88.6%) | 129 (15.6%) |
| Total | 5,089 (65.9%) | 494 (6.4%) |
Employment Occupations by Sex in Monsey
Management, Business, Science and Arts Occupations
The most common Management, Business, Science and Arts occupations in Monsey are Community & Social Service (2,167 | 32.7%), Education Instruction & Library (1,874 | 28.3%), Management (771 | 11.6%), Business & Financial (251 | 3.8%), and Education, Arts & Media (249 | 3.8%).
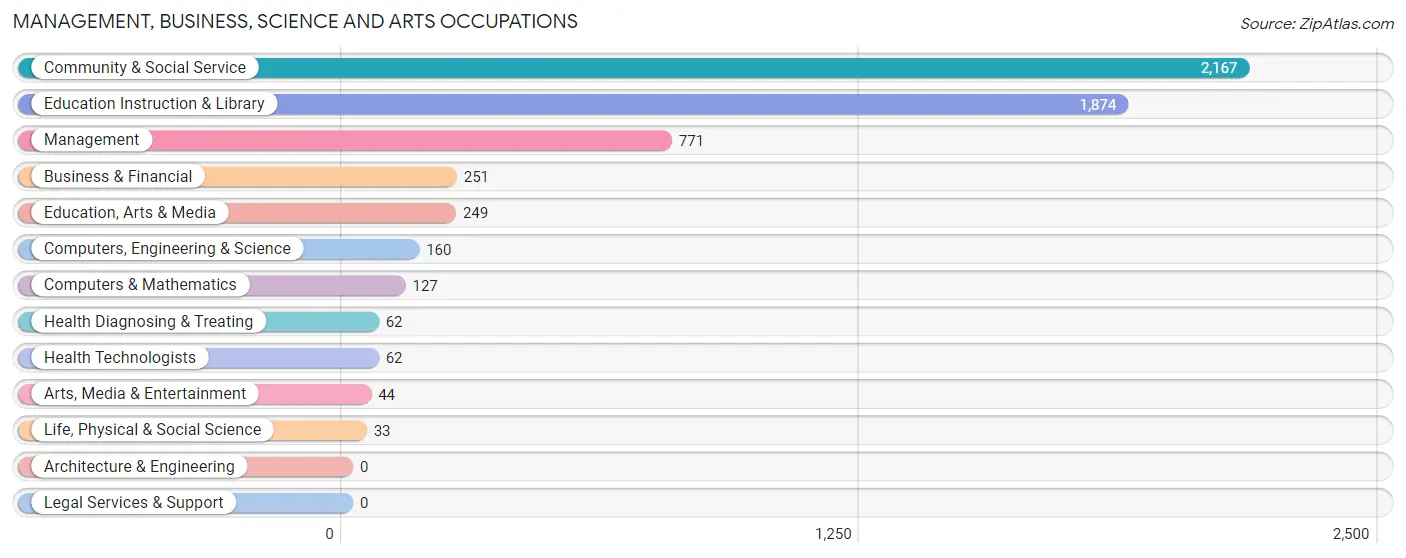
Management, Business, Science and Arts Occupations by Sex
Within the Management, Business, Science and Arts occupations in Monsey, the most male-oriented occupations are Life, Physical & Social Science (100.0%), Arts, Media & Entertainment (100.0%), and Computers, Engineering & Science (95.6%), while the most female-oriented occupations are Education, Arts & Media (53.0%), Community & Social Service (45.0%), and Education Instruction & Library (45.0%).
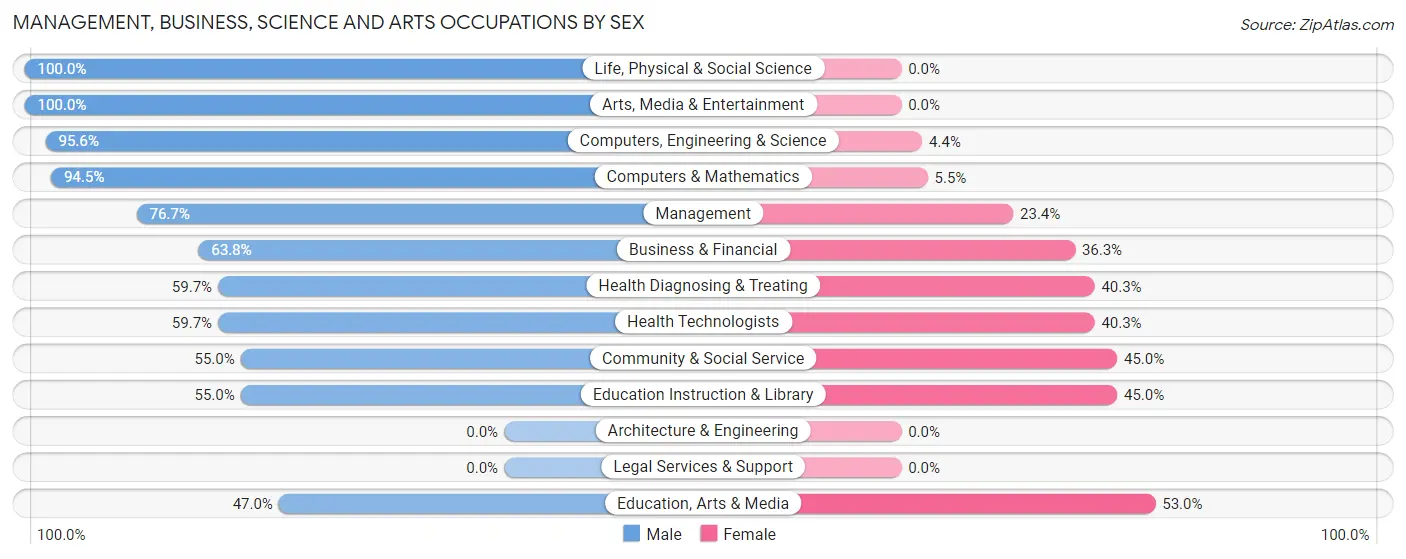
| Occupation | Male | Female |
| Management | 591 (76.6%) | 180 (23.4%) |
| Business & Financial | 160 (63.7%) | 91 (36.2%) |
| Computers, Engineering & Science | 153 (95.6%) | 7 (4.4%) |
| Computers & Mathematics | 120 (94.5%) | 7 (5.5%) |
| Architecture & Engineering | 0 (0.0%) | 0 (0.0%) |
| Life, Physical & Social Science | 33 (100.0%) | 0 (0.0%) |
| Community & Social Service | 1,191 (55.0%) | 976 (45.0%) |
| Education, Arts & Media | 117 (47.0%) | 132 (53.0%) |
| Legal Services & Support | 0 (0.0%) | 0 (0.0%) |
| Education Instruction & Library | 1,030 (55.0%) | 844 (45.0%) |
| Arts, Media & Entertainment | 44 (100.0%) | 0 (0.0%) |
| Health Diagnosing & Treating | 37 (59.7%) | 25 (40.3%) |
| Health Technologists | 37 (59.7%) | 25 (40.3%) |
| Total (Category) | 2,132 (62.5%) | 1,279 (37.5%) |
| Total (Overall) | 3,944 (59.6%) | 2,678 (40.4%) |
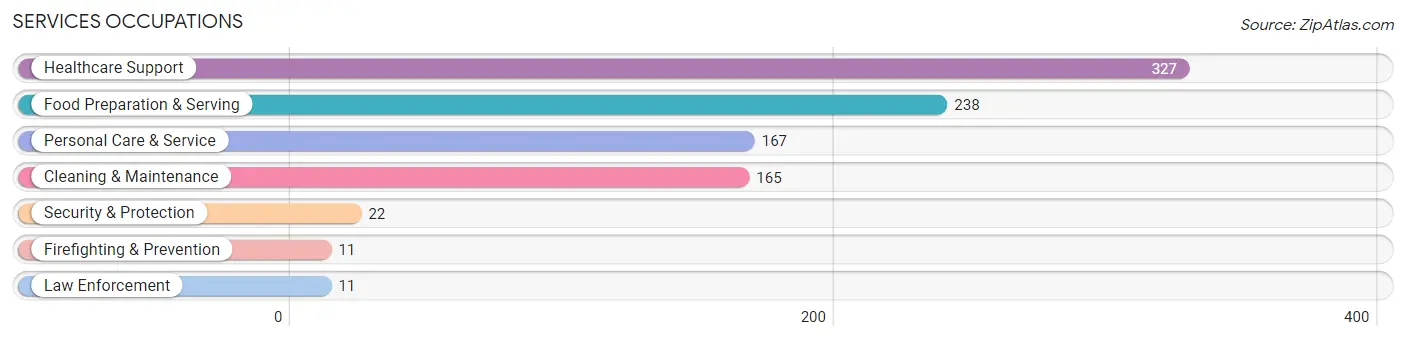
Services Occupations
The most common Services occupations in Monsey are Healthcare Support (327 | 4.9%), Food Preparation & Serving (238 | 3.6%), Personal Care & Service (167 | 2.5%), Cleaning & Maintenance (165 | 2.5%), and Security & Protection (22 | 0.3%).
Services Occupations by Sex
Within the Services occupations in Monsey, the most male-oriented occupations are Law Enforcement (100.0%), Cleaning & Maintenance (77.0%), and Food Preparation & Serving (68.9%), while the most female-oriented occupations are Firefighting & Prevention (100.0%), Healthcare Support (72.2%), and Personal Care & Service (67.7%).
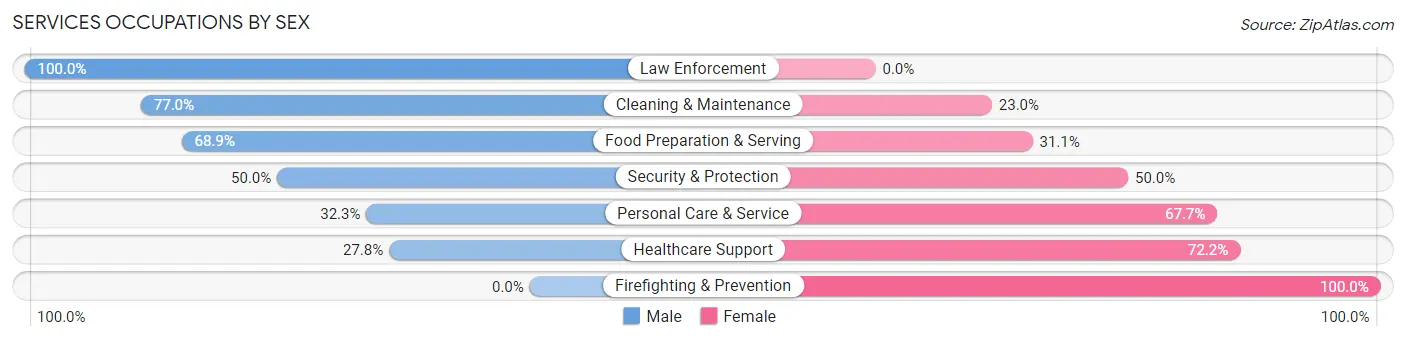
| Occupation | Male | Female |
| Healthcare Support | 91 (27.8%) | 236 (72.2%) |
| Security & Protection | 11 (50.0%) | 11 (50.0%) |
| Firefighting & Prevention | 0 (0.0%) | 11 (100.0%) |
| Law Enforcement | 11 (100.0%) | 0 (0.0%) |
| Food Preparation & Serving | 164 (68.9%) | 74 (31.1%) |
| Cleaning & Maintenance | 127 (77.0%) | 38 (23.0%) |
| Personal Care & Service | 54 (32.3%) | 113 (67.7%) |
| Total (Category) | 447 (48.6%) | 472 (51.4%) |
| Total (Overall) | 3,944 (59.6%) | 2,678 (40.4%) |
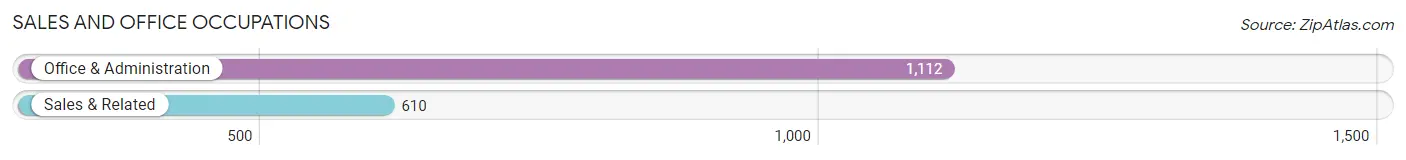
Sales and Office Occupations
The most common Sales and Office occupations in Monsey are Office & Administration (1,112 | 16.8%), and Sales & Related (610 | 9.2%).
Sales and Office Occupations by Sex
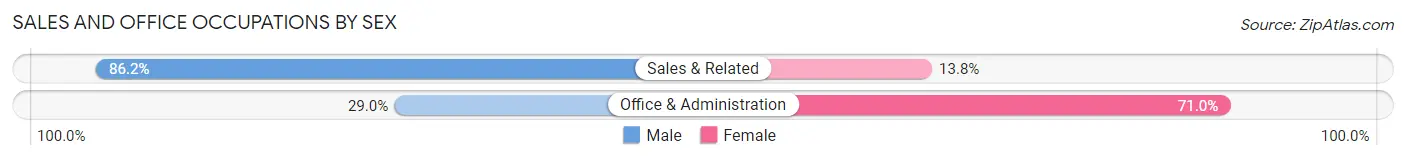
| Occupation | Male | Female |
| Sales & Related | 526 (86.2%) | 84 (13.8%) |
| Office & Administration | 322 (29.0%) | 790 (71.0%) |
| Total (Category) | 848 (49.2%) | 874 (50.7%) |
| Total (Overall) | 3,944 (59.6%) | 2,678 (40.4%) |
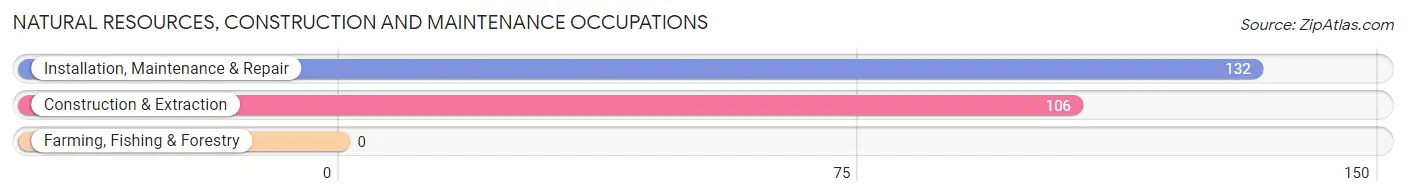
Natural Resources, Construction and Maintenance Occupations
The most common Natural Resources, Construction and Maintenance occupations in Monsey are Installation, Maintenance & Repair (132 | 2.0%), and Construction & Extraction (106 | 1.6%).
Natural Resources, Construction and Maintenance Occupations by Sex
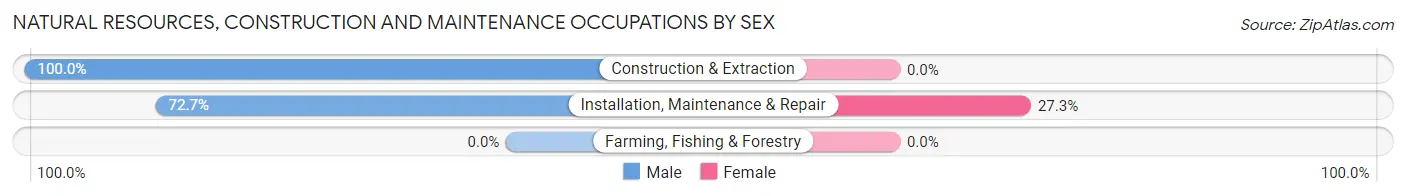
| Occupation | Male | Female |
| Farming, Fishing & Forestry | 0 (0.0%) | 0 (0.0%) |
| Construction & Extraction | 106 (100.0%) | 0 (0.0%) |
| Installation, Maintenance & Repair | 96 (72.7%) | 36 (27.3%) |
| Total (Category) | 202 (84.9%) | 36 (15.1%) |
| Total (Overall) | 3,944 (59.6%) | 2,678 (40.4%) |
Production, Transportation and Moving Occupations
The most common Production, Transportation and Moving occupations in Monsey are Transportation (285 | 4.3%), and Material Moving (47 | 0.7%).
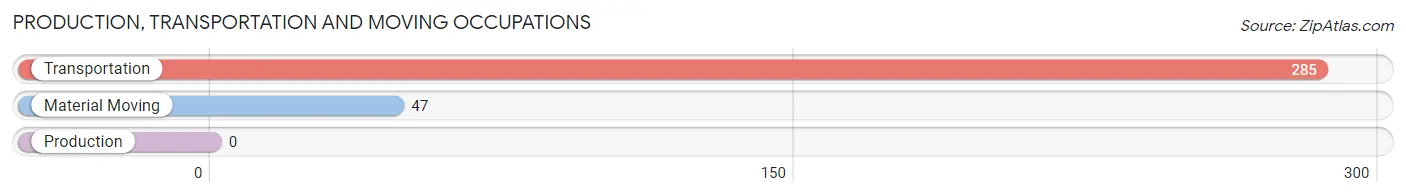
Production, Transportation and Moving Occupations by Sex
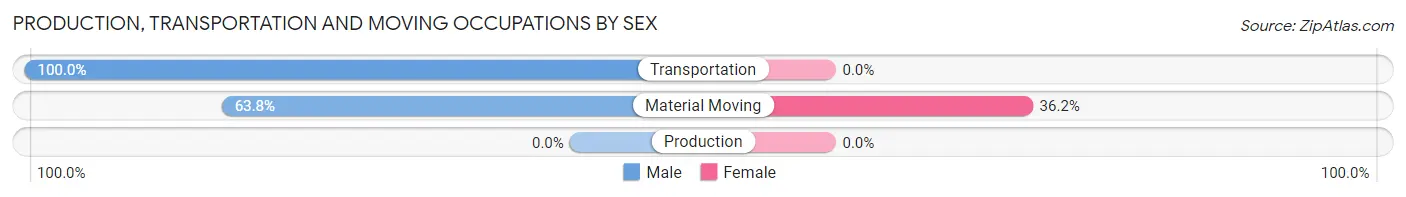
| Occupation | Male | Female |
| Production | 0 (0.0%) | 0 (0.0%) |
| Transportation | 285 (100.0%) | 0 (0.0%) |
| Material Moving | 30 (63.8%) | 17 (36.2%) |
| Total (Category) | 315 (94.9%) | 17 (5.1%) |
| Total (Overall) | 3,944 (59.6%) | 2,678 (40.4%) |
Employment Industries by Sex in Monsey
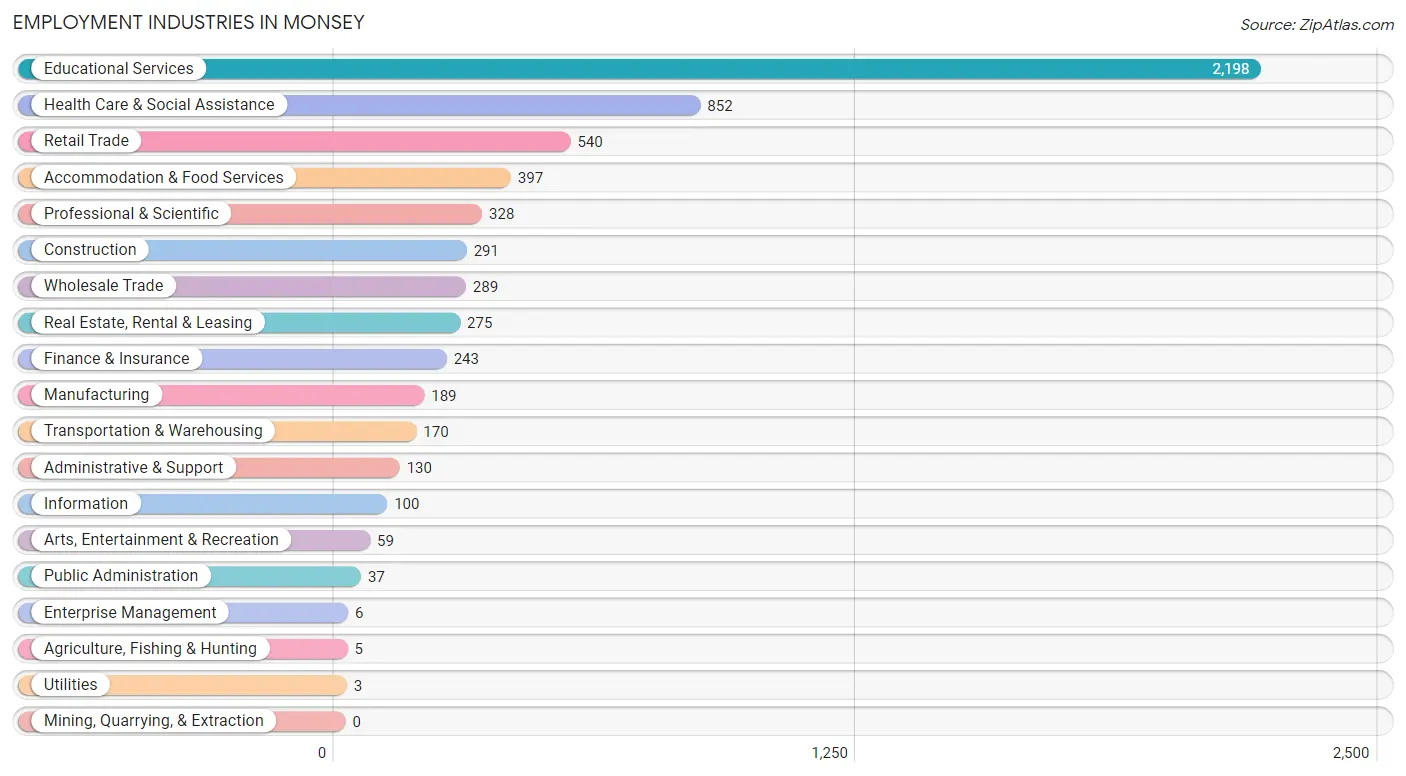
Employment Industries in Monsey
The major employment industries in Monsey include Educational Services (2,198 | 33.2%), Health Care & Social Assistance (852 | 12.9%), Retail Trade (540 | 8.2%), Accommodation & Food Services (397 | 6.0%), and Professional & Scientific (328 | 5.0%).
Employment Industries by Sex in Monsey
The Monsey industries that see more men than women are Agriculture, Fishing & Hunting (100.0%), Construction (100.0%), and Utilities (100.0%), whereas the industries that tend to have a higher number of women are Enterprise Management (100.0%), Finance & Insurance (71.2%), and Health Care & Social Assistance (71.0%).
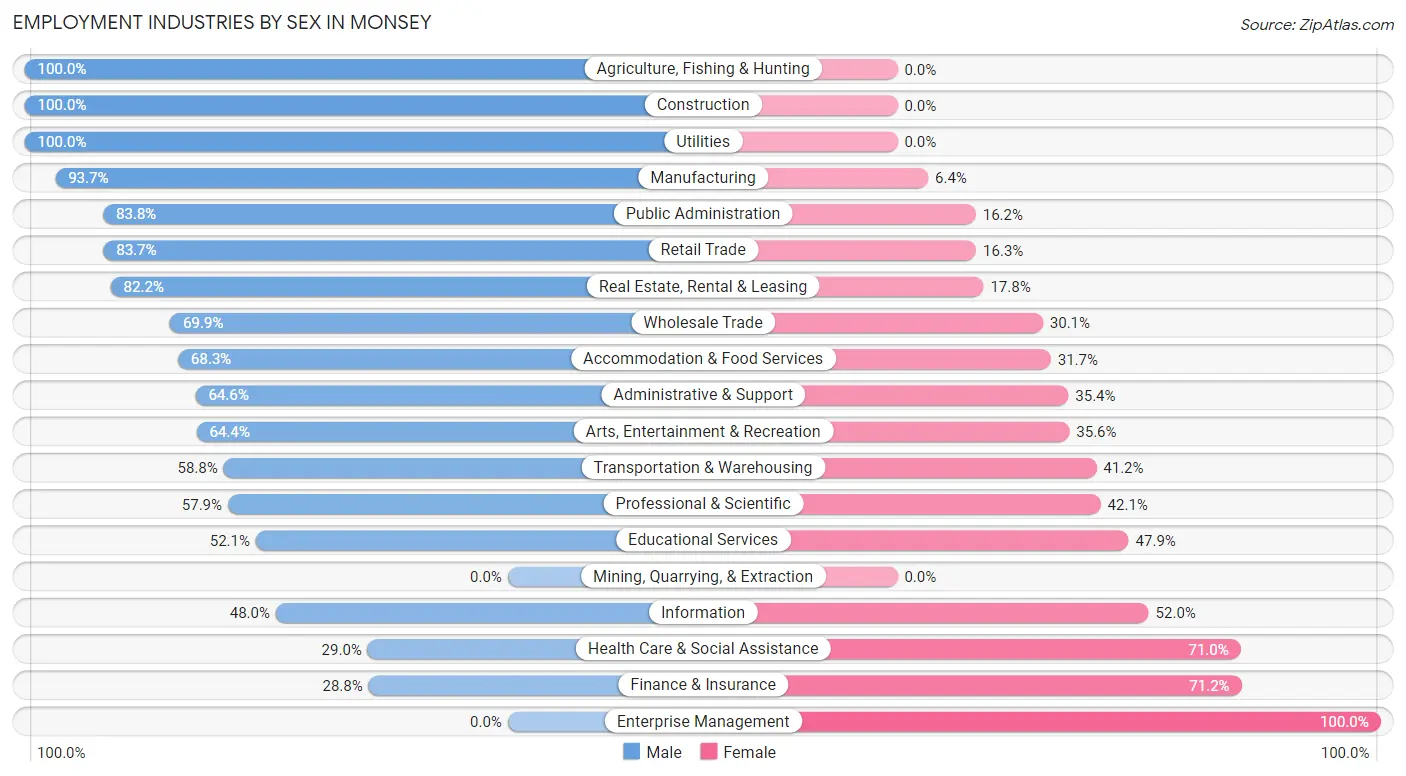
| Industry | Male | Female |
| Agriculture, Fishing & Hunting | 5 (100.0%) | 0 (0.0%) |
| Mining, Quarrying, & Extraction | 0 (0.0%) | 0 (0.0%) |
| Construction | 291 (100.0%) | 0 (0.0%) |
| Manufacturing | 177 (93.6%) | 12 (6.4%) |
| Wholesale Trade | 202 (69.9%) | 87 (30.1%) |
| Retail Trade | 452 (83.7%) | 88 (16.3%) |
| Transportation & Warehousing | 100 (58.8%) | 70 (41.2%) |
| Utilities | 3 (100.0%) | 0 (0.0%) |
| Information | 48 (48.0%) | 52 (52.0%) |
| Finance & Insurance | 70 (28.8%) | 173 (71.2%) |
| Real Estate, Rental & Leasing | 226 (82.2%) | 49 (17.8%) |
| Professional & Scientific | 190 (57.9%) | 138 (42.1%) |
| Enterprise Management | 0 (0.0%) | 6 (100.0%) |
| Administrative & Support | 84 (64.6%) | 46 (35.4%) |
| Educational Services | 1,146 (52.1%) | 1,052 (47.9%) |
| Health Care & Social Assistance | 247 (29.0%) | 605 (71.0%) |
| Arts, Entertainment & Recreation | 38 (64.4%) | 21 (35.6%) |
| Accommodation & Food Services | 271 (68.3%) | 126 (31.7%) |
| Public Administration | 31 (83.8%) | 6 (16.2%) |
| Total | 3,944 (59.6%) | 2,678 (40.4%) |
Education in Monsey
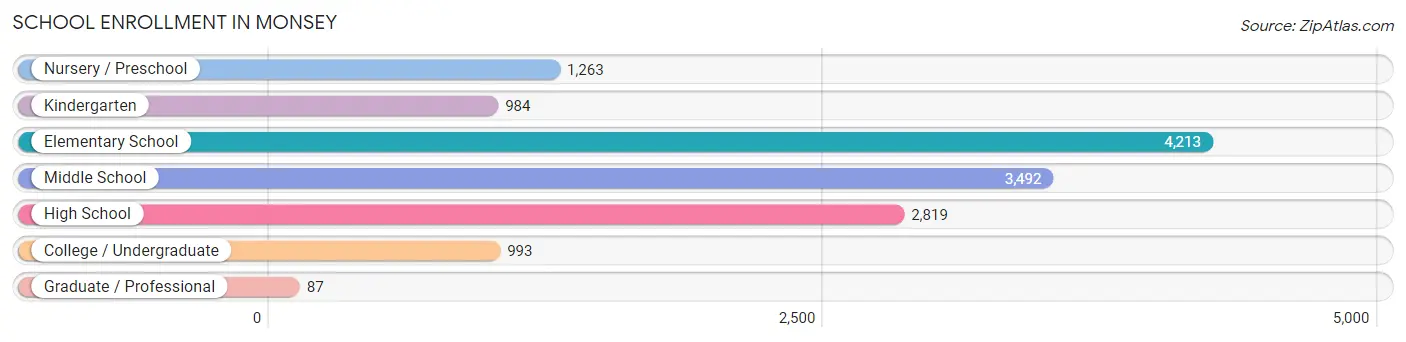
School Enrollment in Monsey
The most common levels of schooling among the 13,851 students in Monsey are elementary school (4,213 | 30.4%), middle school (3,492 | 25.2%), and high school (2,819 | 20.3%).
| School Level | # Students | % Students |
| Nursery / Preschool | 1,263 | 9.1% |
| Kindergarten | 984 | 7.1% |
| Elementary School | 4,213 | 30.4% |
| Middle School | 3,492 | 25.2% |
| High School | 2,819 | 20.3% |
| College / Undergraduate | 993 | 7.2% |
| Graduate / Professional | 87 | 0.6% |
| Total | 13,851 | 100.0% |
School Enrollment by Age by Funding Source in Monsey
Out of a total of 13,851 students who are enrolled in schools in Monsey, 13,380 (96.6%) attend a private institution, while the remaining 471 (3.4%) are enrolled in public schools. The age group of 3 to 4 year olds has the highest likelihood of being enrolled in private schools, with 1,793 (99.8% in the age bracket) enrolled. Conversely, the age group of 35 years and over has the lowest likelihood of being enrolled in a private school, with 22 (35.5% in the age bracket) attending a public institution.
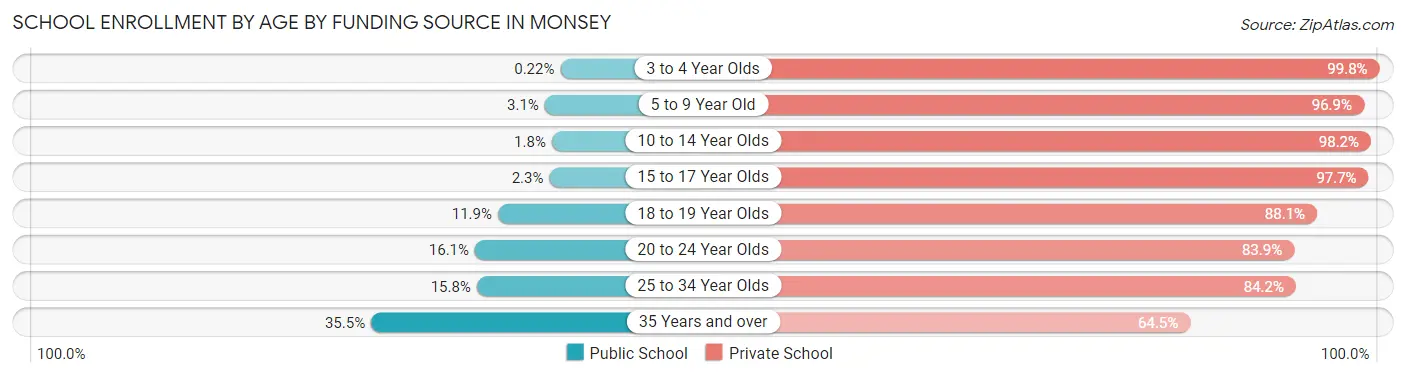
| Age Bracket | Public School | Private School |
| 3 to 4 Year Olds | 4 (0.2%) | 1,793 (99.8%) |
| 5 to 9 Year Old | 142 (3.1%) | 4,398 (96.9%) |
| 10 to 14 Year Olds | 76 (1.8%) | 4,119 (98.2%) |
| 15 to 17 Year Olds | 45 (2.3%) | 1,942 (97.7%) |
| 18 to 19 Year Olds | 74 (11.9%) | 550 (88.1%) |
| 20 to 24 Year Olds | 95 (16.1%) | 494 (83.9%) |
| 25 to 34 Year Olds | 9 (15.8%) | 48 (84.2%) |
| 35 Years and over | 22 (35.5%) | 40 (64.5%) |
| Total | 471 (3.4%) | 13,380 (96.6%) |
Educational Attainment by Field of Study in Monsey
Liberal arts & history (251 | 18.9%), bio, nature & agricultural (172 | 13.0%), social sciences (168 | 12.7%), education (148 | 11.1%), and arts & humanities (122 | 9.2%) are the most common fields of study among 1,328 individuals in Monsey who have obtained a bachelor's degree or higher.
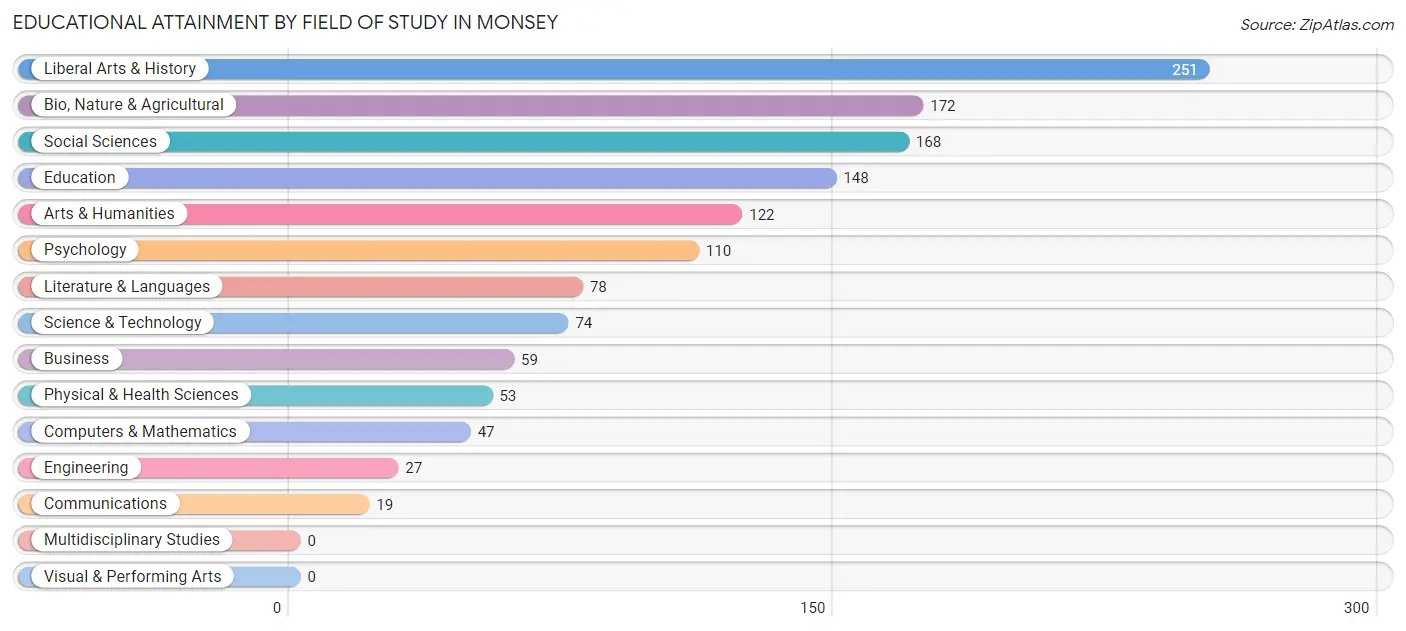
| Field of Study | # Graduates | % Graduates |
| Computers & Mathematics | 47 | 3.5% |
| Bio, Nature & Agricultural | 172 | 13.0% |
| Physical & Health Sciences | 53 | 4.0% |
| Psychology | 110 | 8.3% |
| Social Sciences | 168 | 12.7% |
| Engineering | 27 | 2.0% |
| Multidisciplinary Studies | 0 | 0.0% |
| Science & Technology | 74 | 5.6% |
| Business | 59 | 4.4% |
| Education | 148 | 11.1% |
| Literature & Languages | 78 | 5.9% |
| Liberal Arts & History | 251 | 18.9% |
| Visual & Performing Arts | 0 | 0.0% |
| Communications | 19 | 1.4% |
| Arts & Humanities | 122 | 9.2% |
| Total | 1,328 | 100.0% |
Transportation & Commute in Monsey
Vehicle Availability by Sex in Monsey
The most prevalent vehicle ownership categories in Monsey are males with 1 vehicle (1,980, accounting for 50.5%) and females with 1 vehicle (997, making up 76.6%).
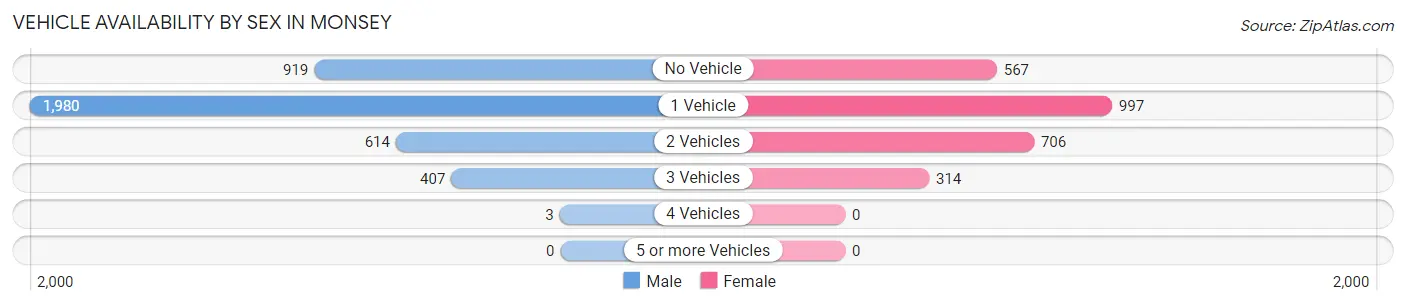
| Vehicles Available | Male | Female |
| No Vehicle | 919 (23.4%) | 567 (21.9%) |
| 1 Vehicle | 1,980 (50.5%) | 997 (38.6%) |
| 2 Vehicles | 614 (15.7%) | 706 (27.3%) |
| 3 Vehicles | 407 (10.4%) | 314 (12.1%) |
| 4 Vehicles | 3 (0.1%) | 0 (0.0%) |
| 5 or more Vehicles | 0 (0.0%) | 0 (0.0%) |
| Total | 3,923 (100.0%) | 2,584 (100.0%) |
Commute Time in Monsey
The most frequently occuring commute durations in Monsey are 5 to 9 minutes (1,383 commuters, 24.1%), 10 to 14 minutes (1,287 commuters, 22.5%), and 15 to 19 minutes (875 commuters, 15.3%).
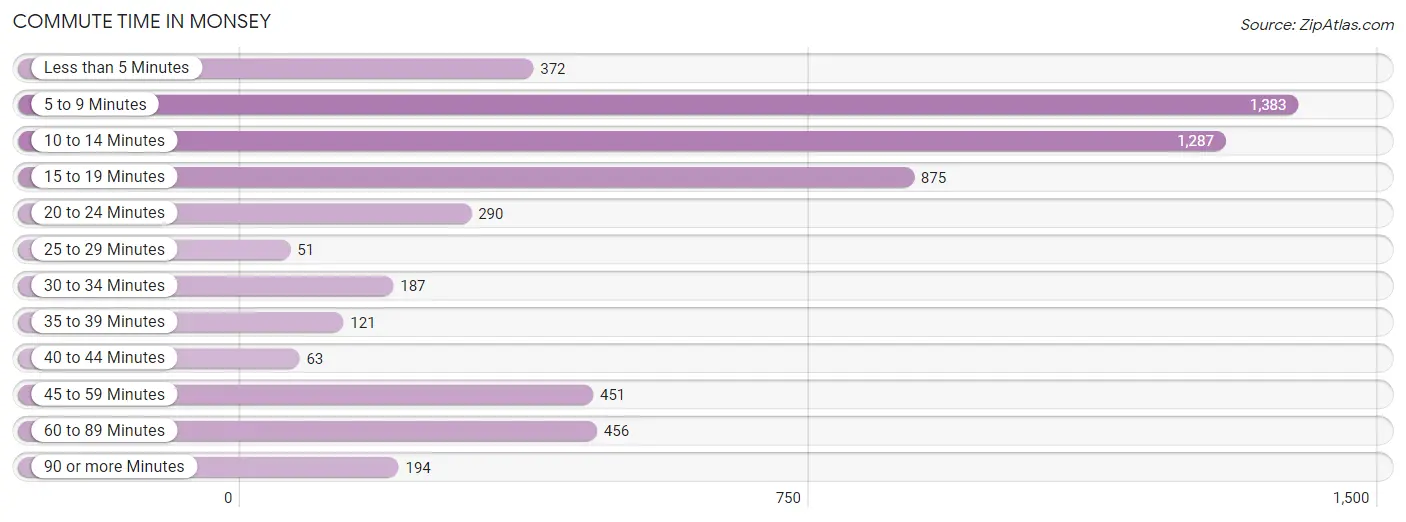
| Commute Time | # Commuters | % Commuters |
| Less than 5 Minutes | 372 | 6.5% |
| 5 to 9 Minutes | 1,383 | 24.1% |
| 10 to 14 Minutes | 1,287 | 22.5% |
| 15 to 19 Minutes | 875 | 15.3% |
| 20 to 24 Minutes | 290 | 5.1% |
| 25 to 29 Minutes | 51 | 0.9% |
| 30 to 34 Minutes | 187 | 3.3% |
| 35 to 39 Minutes | 121 | 2.1% |
| 40 to 44 Minutes | 63 | 1.1% |
| 45 to 59 Minutes | 451 | 7.9% |
| 60 to 89 Minutes | 456 | 8.0% |
| 90 or more Minutes | 194 | 3.4% |
Commute Time by Sex in Monsey
The most common commute times in Monsey are 5 to 9 minutes (890 commuters, 25.5%) for males and 10 to 14 minutes (527 commuters, 23.5%) for females.
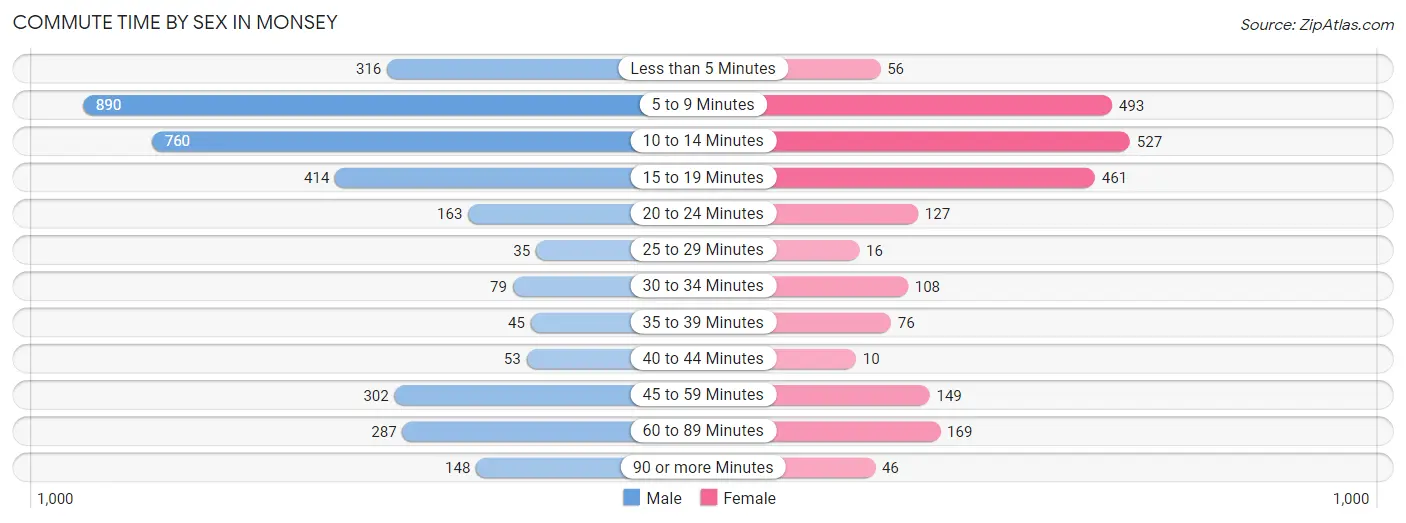
| Commute Time | Male | Female |
| Less than 5 Minutes | 316 (9.0%) | 56 (2.5%) |
| 5 to 9 Minutes | 890 (25.5%) | 493 (22.0%) |
| 10 to 14 Minutes | 760 (21.8%) | 527 (23.5%) |
| 15 to 19 Minutes | 414 (11.9%) | 461 (20.6%) |
| 20 to 24 Minutes | 163 (4.7%) | 127 (5.7%) |
| 25 to 29 Minutes | 35 (1.0%) | 16 (0.7%) |
| 30 to 34 Minutes | 79 (2.3%) | 108 (4.8%) |
| 35 to 39 Minutes | 45 (1.3%) | 76 (3.4%) |
| 40 to 44 Minutes | 53 (1.5%) | 10 (0.4%) |
| 45 to 59 Minutes | 302 (8.6%) | 149 (6.7%) |
| 60 to 89 Minutes | 287 (8.2%) | 169 (7.5%) |
| 90 or more Minutes | 148 (4.2%) | 46 (2.1%) |
Time of Departure to Work by Sex in Monsey
The most frequent times of departure to work in Monsey are 9:00 AM to 9:59 AM (1,105, 31.6%) for males and 9:00 AM to 9:59 AM (642, 28.7%) for females.
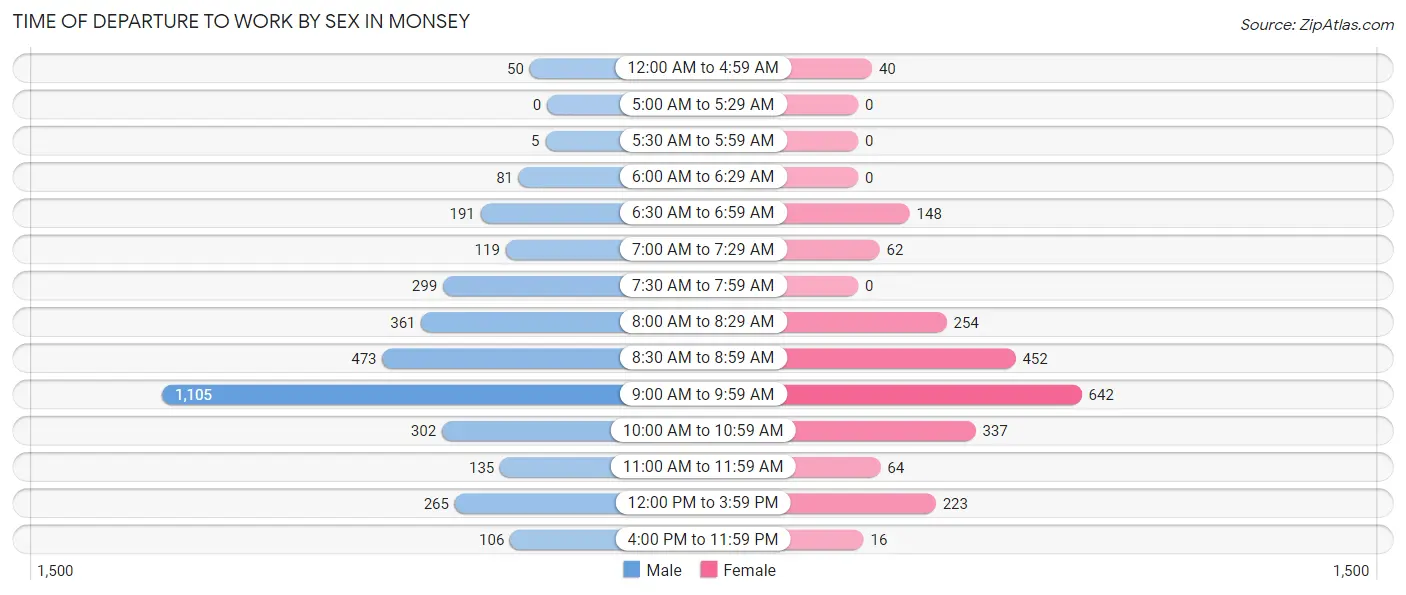
| Time of Departure | Male | Female |
| 12:00 AM to 4:59 AM | 50 (1.4%) | 40 (1.8%) |
| 5:00 AM to 5:29 AM | 0 (0.0%) | 0 (0.0%) |
| 5:30 AM to 5:59 AM | 5 (0.1%) | 0 (0.0%) |
| 6:00 AM to 6:29 AM | 81 (2.3%) | 0 (0.0%) |
| 6:30 AM to 6:59 AM | 191 (5.5%) | 148 (6.6%) |
| 7:00 AM to 7:29 AM | 119 (3.4%) | 62 (2.8%) |
| 7:30 AM to 7:59 AM | 299 (8.6%) | 0 (0.0%) |
| 8:00 AM to 8:29 AM | 361 (10.3%) | 254 (11.4%) |
| 8:30 AM to 8:59 AM | 473 (13.6%) | 452 (20.2%) |
| 9:00 AM to 9:59 AM | 1,105 (31.6%) | 642 (28.7%) |
| 10:00 AM to 10:59 AM | 302 (8.6%) | 337 (15.1%) |
| 11:00 AM to 11:59 AM | 135 (3.9%) | 64 (2.9%) |
| 12:00 PM to 3:59 PM | 265 (7.6%) | 223 (10.0%) |
| 4:00 PM to 11:59 PM | 106 (3.0%) | 16 (0.7%) |
| Total | 3,492 (100.0%) | 2,238 (100.0%) |
Housing Occupancy in Monsey
Occupancy by Ownership in Monsey
Of the total 4,844 dwellings in Monsey, owner-occupied units account for 1,756 (36.2%), while renter-occupied units make up 3,088 (63.7%).
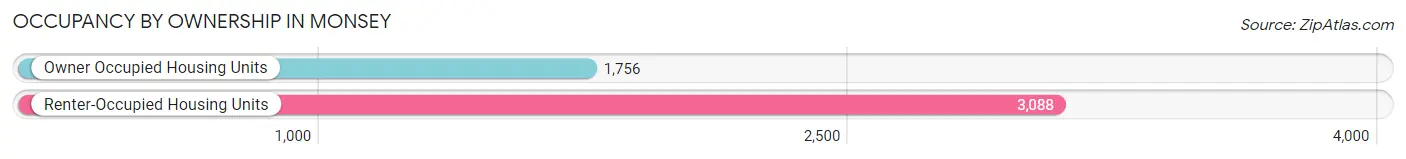
| Occupancy | # Housing Units | % Housing Units |
| Owner Occupied Housing Units | 1,756 | 36.2% |
| Renter-Occupied Housing Units | 3,088 | 63.7% |
| Total Occupied Housing Units | 4,844 | 100.0% |
Occupancy by Household Size in Monsey
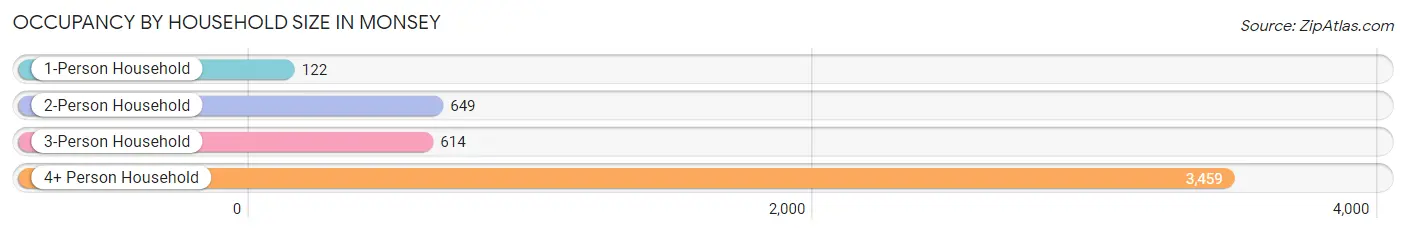
| Household Size | # Housing Units | % Housing Units |
| 1-Person Household | 122 | 2.5% |
| 2-Person Household | 649 | 13.4% |
| 3-Person Household | 614 | 12.7% |
| 4+ Person Household | 3,459 | 71.4% |
| Total Housing Units | 4,844 | 100.0% |
Occupancy by Ownership by Household Size in Monsey
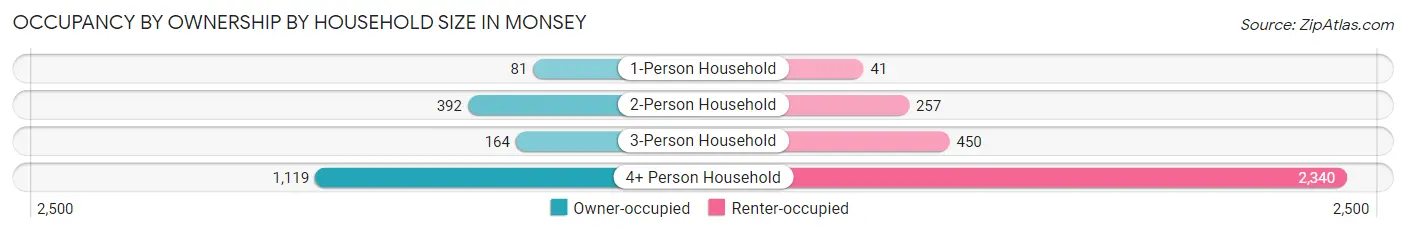
| Household Size | Owner-occupied | Renter-occupied |
| 1-Person Household | 81 (66.4%) | 41 (33.6%) |
| 2-Person Household | 392 (60.4%) | 257 (39.6%) |
| 3-Person Household | 164 (26.7%) | 450 (73.3%) |
| 4+ Person Household | 1,119 (32.4%) | 2,340 (67.6%) |
| Total Housing Units | 1,756 (36.2%) | 3,088 (63.7%) |
Occupancy by Educational Attainment in Monsey
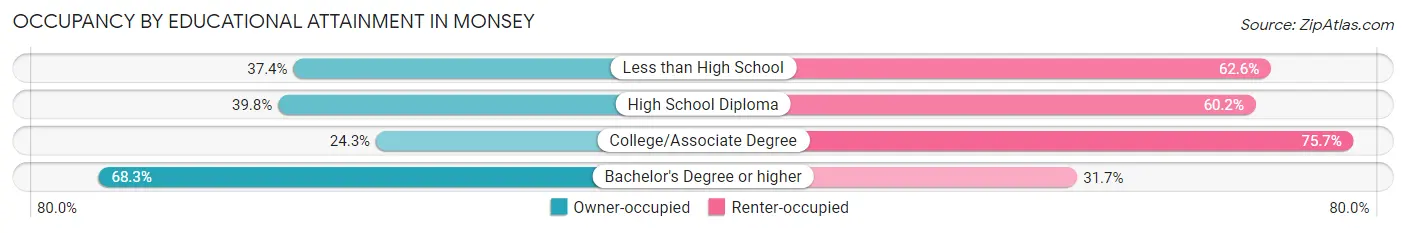
| Household Size | Owner-occupied | Renter-occupied |
| Less than High School | 296 (37.4%) | 496 (62.6%) |
| High School Diploma | 560 (39.8%) | 847 (60.2%) |
| College/Associate Degree | 500 (24.3%) | 1,559 (75.7%) |
| Bachelor's Degree or higher | 400 (68.3%) | 186 (31.7%) |
Occupancy by Age of Householder in Monsey
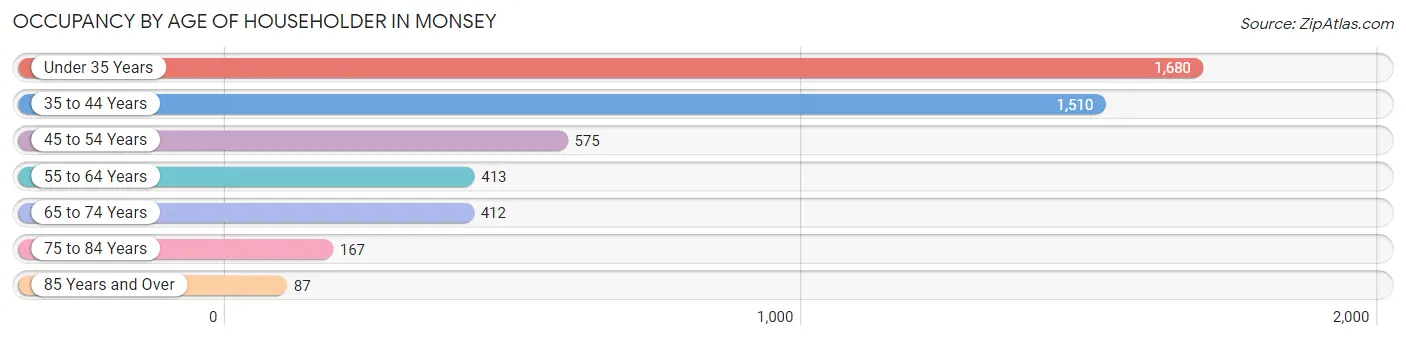
| Age Bracket | # Households | % Households |
| Under 35 Years | 1,680 | 34.7% |
| 35 to 44 Years | 1,510 | 31.2% |
| 45 to 54 Years | 575 | 11.9% |
| 55 to 64 Years | 413 | 8.5% |
| 65 to 74 Years | 412 | 8.5% |
| 75 to 84 Years | 167 | 3.5% |
| 85 Years and Over | 87 | 1.8% |
| Total | 4,844 | 100.0% |
Housing Finances in Monsey
Median Income by Occupancy in Monsey
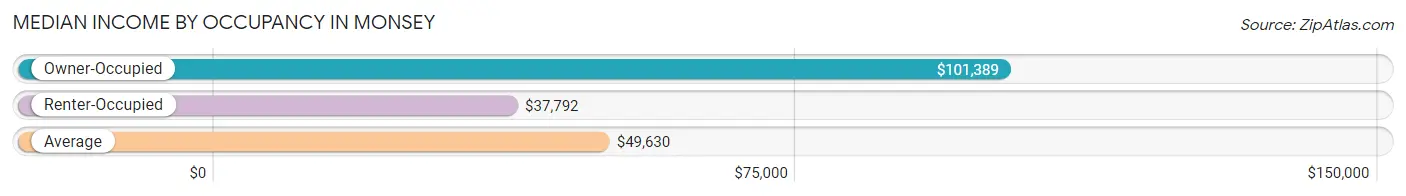
| Occupancy Type | # Households | Median Income |
| Owner-Occupied | 1,756 (36.2%) | $101,389 |
| Renter-Occupied | 3,088 (63.7%) | $37,792 |
| Average | 4,844 (100.0%) | $49,630 |
Occupancy by Householder Income Bracket in Monsey
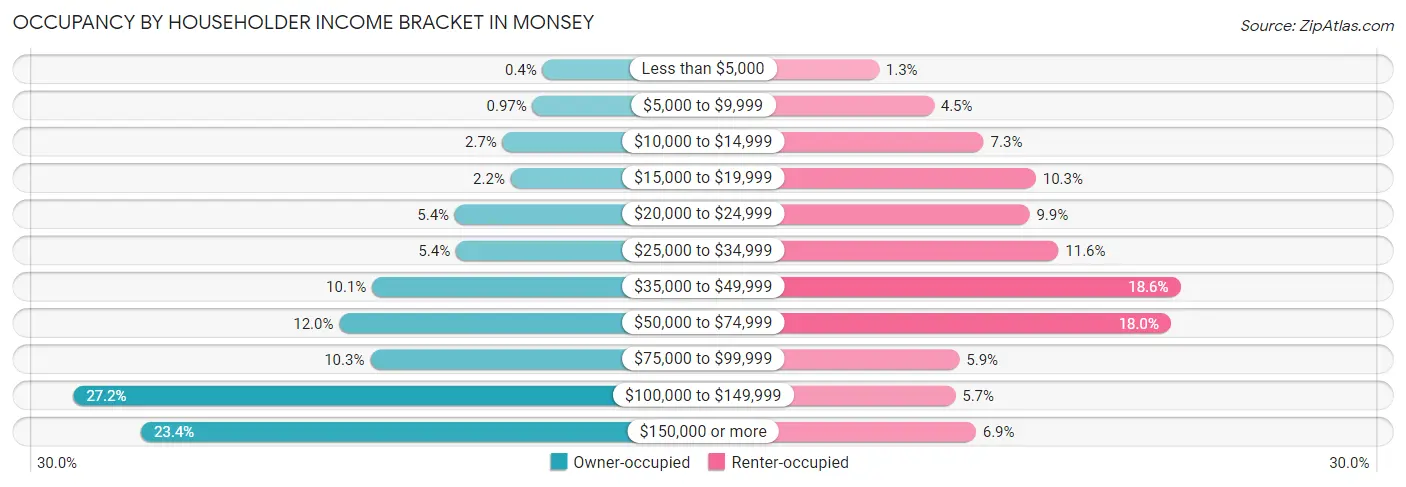
| Income Bracket | Owner-occupied | Renter-occupied |
| Less than $5,000 | 7 (0.4%) | 41 (1.3%) |
| $5,000 to $9,999 | 17 (1.0%) | 138 (4.5%) |
| $10,000 to $14,999 | 47 (2.7%) | 226 (7.3%) |
| $15,000 to $19,999 | 39 (2.2%) | 318 (10.3%) |
| $20,000 to $24,999 | 95 (5.4%) | 307 (9.9%) |
| $25,000 to $34,999 | 94 (5.3%) | 358 (11.6%) |
| $35,000 to $49,999 | 178 (10.1%) | 573 (18.6%) |
| $50,000 to $74,999 | 211 (12.0%) | 556 (18.0%) |
| $75,000 to $99,999 | 180 (10.2%) | 183 (5.9%) |
| $100,000 to $149,999 | 478 (27.2%) | 176 (5.7%) |
| $150,000 or more | 410 (23.4%) | 212 (6.9%) |
| Total | 1,756 (100.0%) | 3,088 (100.0%) |
Monthly Housing Cost Tiers in Monsey
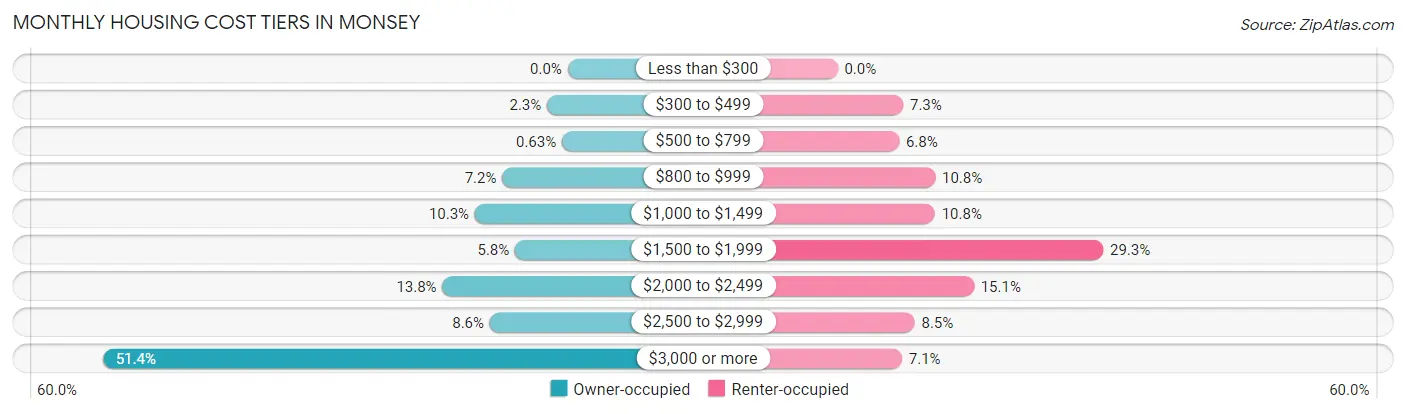
| Monthly Cost | Owner-occupied | Renter-occupied |
| Less than $300 | 0 (0.0%) | 0 (0.0%) |
| $300 to $499 | 40 (2.3%) | 224 (7.2%) |
| $500 to $799 | 11 (0.6%) | 210 (6.8%) |
| $800 to $999 | 127 (7.2%) | 333 (10.8%) |
| $1,000 to $1,499 | 180 (10.2%) | 332 (10.7%) |
| $1,500 to $1,999 | 102 (5.8%) | 906 (29.3%) |
| $2,000 to $2,499 | 243 (13.8%) | 465 (15.1%) |
| $2,500 to $2,999 | 151 (8.6%) | 263 (8.5%) |
| $3,000 or more | 902 (51.4%) | 220 (7.1%) |
| Total | 1,756 (100.0%) | 3,088 (100.0%) |
Physical Housing Characteristics in Monsey
Housing Structures in Monsey
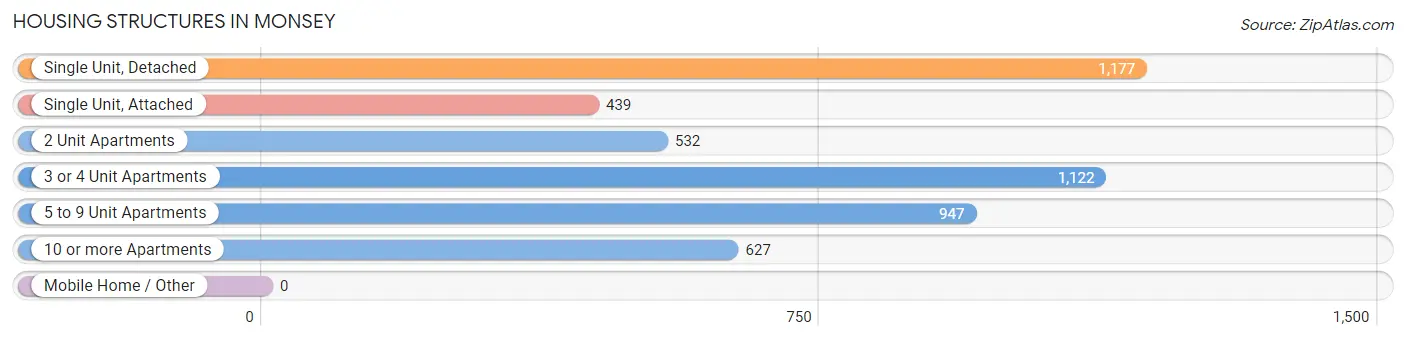
| Structure Type | # Housing Units | % Housing Units |
| Single Unit, Detached | 1,177 | 24.3% |
| Single Unit, Attached | 439 | 9.1% |
| 2 Unit Apartments | 532 | 11.0% |
| 3 or 4 Unit Apartments | 1,122 | 23.2% |
| 5 to 9 Unit Apartments | 947 | 19.6% |
| 10 or more Apartments | 627 | 12.9% |
| Mobile Home / Other | 0 | 0.0% |
| Total | 4,844 | 100.0% |
Housing Structures by Occupancy in Monsey
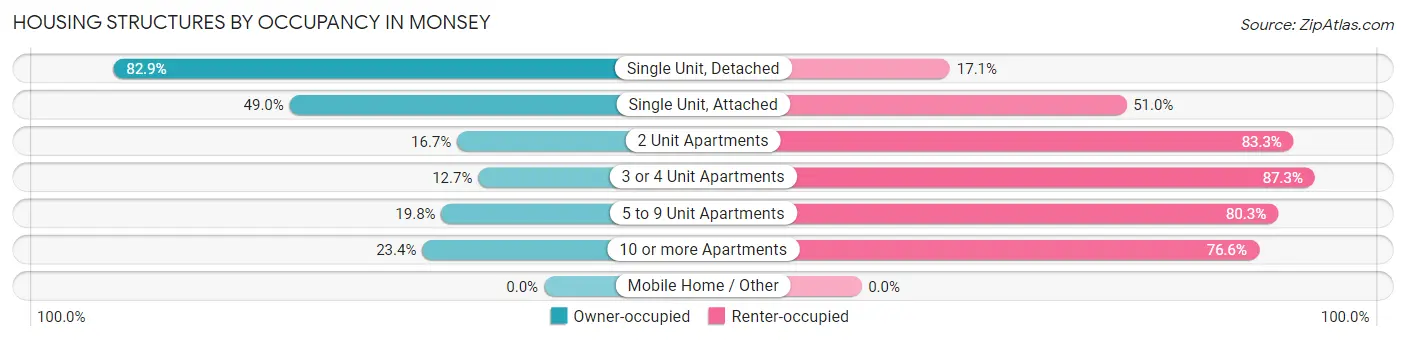
| Structure Type | Owner-occupied | Renter-occupied |
| Single Unit, Detached | 976 (82.9%) | 201 (17.1%) |
| Single Unit, Attached | 215 (49.0%) | 224 (51.0%) |
| 2 Unit Apartments | 89 (16.7%) | 443 (83.3%) |
| 3 or 4 Unit Apartments | 142 (12.7%) | 980 (87.3%) |
| 5 to 9 Unit Apartments | 187 (19.8%) | 760 (80.2%) |
| 10 or more Apartments | 147 (23.4%) | 480 (76.6%) |
| Mobile Home / Other | 0 (0.0%) | 0 (0.0%) |
| Total | 1,756 (36.2%) | 3,088 (63.7%) |
Housing Structures by Number of Rooms in Monsey
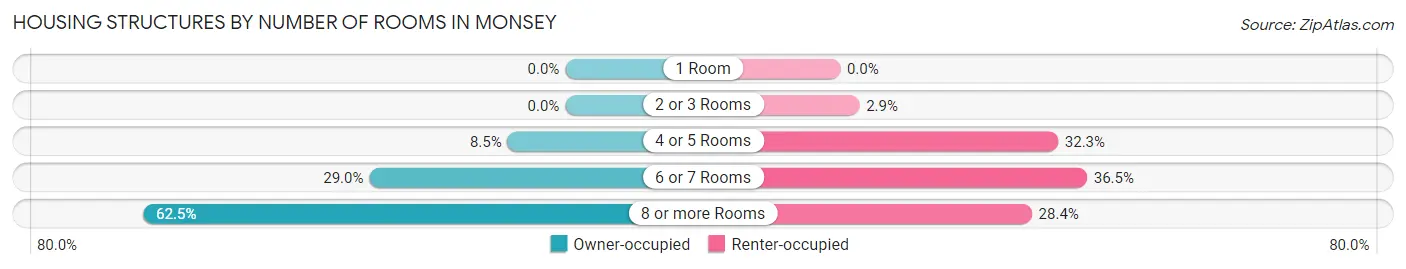
| Number of Rooms | Owner-occupied | Renter-occupied |
| 1 Room | 0 (0.0%) | 0 (0.0%) |
| 2 or 3 Rooms | 0 (0.0%) | 88 (2.9%) |
| 4 or 5 Rooms | 150 (8.5%) | 996 (32.3%) |
| 6 or 7 Rooms | 509 (29.0%) | 1,128 (36.5%) |
| 8 or more Rooms | 1,097 (62.5%) | 876 (28.4%) |
| Total | 1,756 (100.0%) | 3,088 (100.0%) |
Housing Structure by Heating Type in Monsey
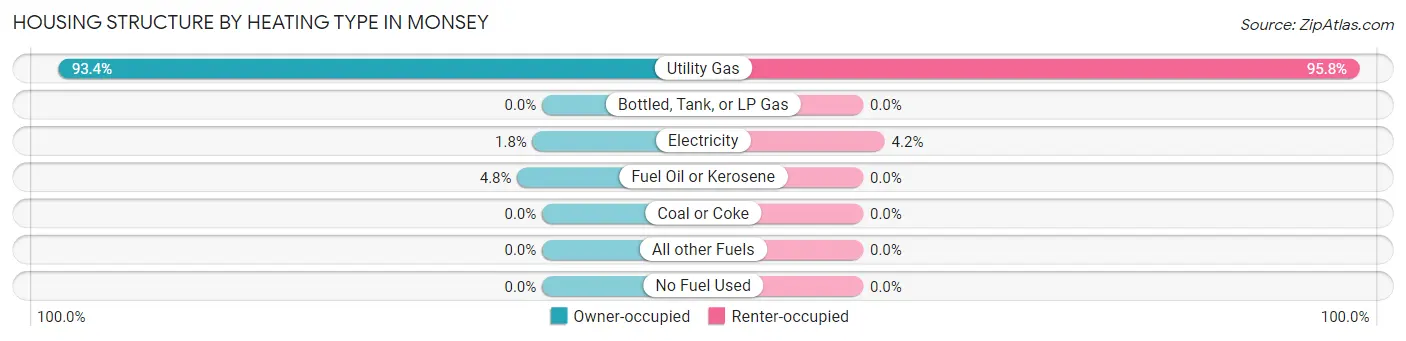
| Heating Type | Owner-occupied | Renter-occupied |
| Utility Gas | 1,640 (93.4%) | 2,959 (95.8%) |
| Bottled, Tank, or LP Gas | 0 (0.0%) | 0 (0.0%) |
| Electricity | 32 (1.8%) | 129 (4.2%) |
| Fuel Oil or Kerosene | 84 (4.8%) | 0 (0.0%) |
| Coal or Coke | 0 (0.0%) | 0 (0.0%) |
| All other Fuels | 0 (0.0%) | 0 (0.0%) |
| No Fuel Used | 0 (0.0%) | 0 (0.0%) |
| Total | 1,756 (100.0%) | 3,088 (100.0%) |
Household Vehicle Usage in Monsey
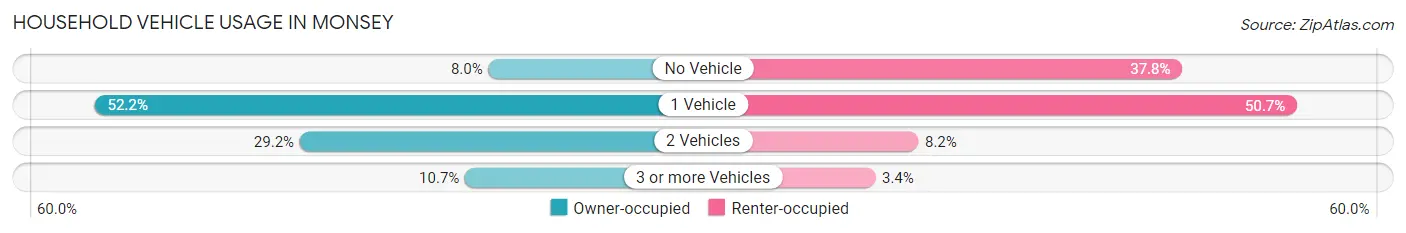
| Vehicles per Household | Owner-occupied | Renter-occupied |
| No Vehicle | 141 (8.0%) | 1,167 (37.8%) |
| 1 Vehicle | 916 (52.2%) | 1,564 (50.6%) |
| 2 Vehicles | 512 (29.2%) | 253 (8.2%) |
| 3 or more Vehicles | 187 (10.6%) | 104 (3.4%) |
| Total | 1,756 (100.0%) | 3,088 (100.0%) |
Real Estate & Mortgages in Monsey
Real Estate and Mortgage Overview in Monsey
| Characteristic | Without Mortgage | With Mortgage |
| Housing Units | 637 | 1,119 |
| Median Property Value | $826,100 | $835,100 |
| Median Household Income | $85,450 | $214 |
| Monthly Housing Costs | $1,501 | $818 |
| Real Estate Taxes | $10,001 | $11 |
Property Value by Mortgage Status in Monsey
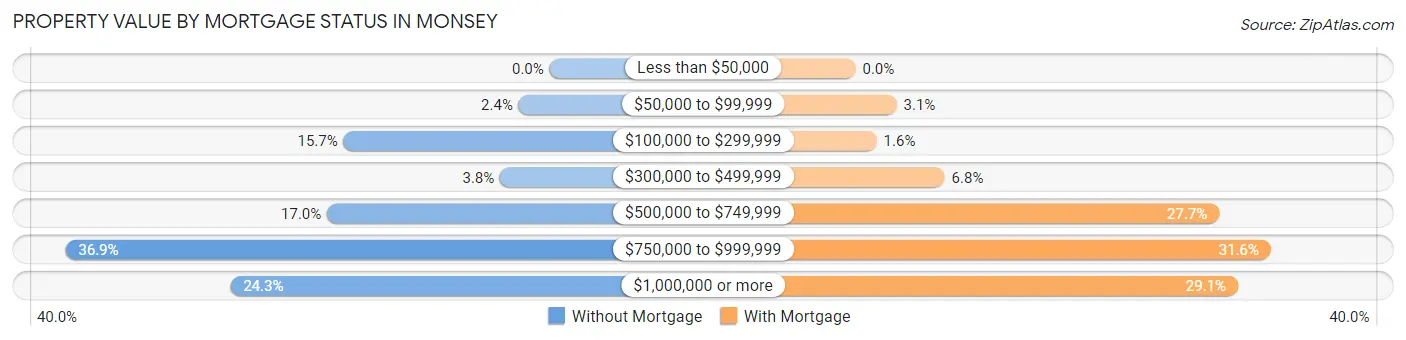
| Property Value | Without Mortgage | With Mortgage |
| Less than $50,000 | 0 (0.0%) | 0 (0.0%) |
| $50,000 to $99,999 | 15 (2.4%) | 35 (3.1%) |
| $100,000 to $299,999 | 100 (15.7%) | 18 (1.6%) |
| $300,000 to $499,999 | 24 (3.8%) | 76 (6.8%) |
| $500,000 to $749,999 | 108 (17.0%) | 310 (27.7%) |
| $750,000 to $999,999 | 235 (36.9%) | 354 (31.6%) |
| $1,000,000 or more | 155 (24.3%) | 326 (29.1%) |
| Total | 637 (100.0%) | 1,119 (100.0%) |
Household Income by Mortgage Status in Monsey
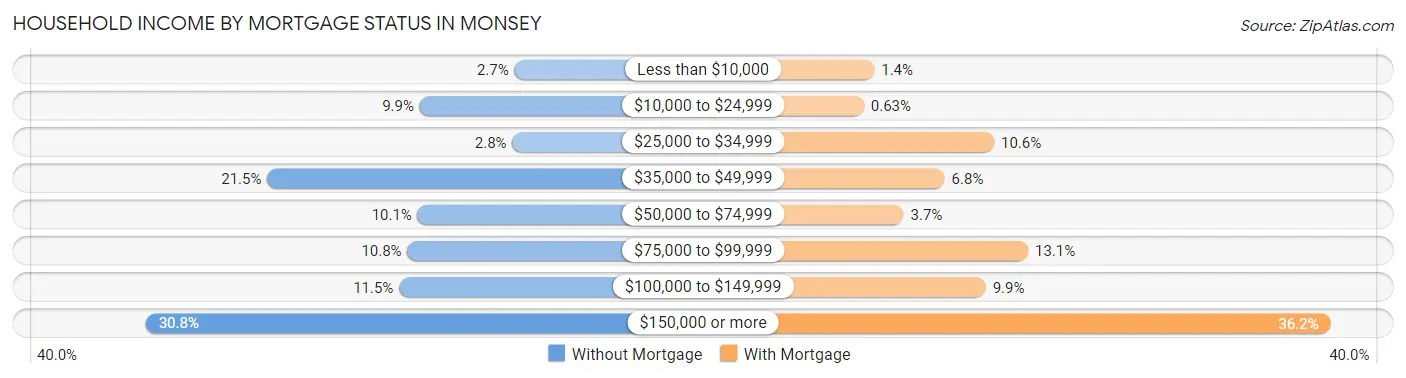
| Household Income | Without Mortgage | With Mortgage |
| Less than $10,000 | 17 (2.7%) | 16 (1.4%) |
| $10,000 to $24,999 | 63 (9.9%) | 7 (0.6%) |
| $25,000 to $34,999 | 18 (2.8%) | 118 (10.5%) |
| $35,000 to $49,999 | 137 (21.5%) | 76 (6.8%) |
| $50,000 to $74,999 | 64 (10.1%) | 41 (3.7%) |
| $75,000 to $99,999 | 69 (10.8%) | 147 (13.1%) |
| $100,000 to $149,999 | 73 (11.5%) | 111 (9.9%) |
| $150,000 or more | 196 (30.8%) | 405 (36.2%) |
| Total | 637 (100.0%) | 1,119 (100.0%) |
Property Value to Household Income Ratio in Monsey
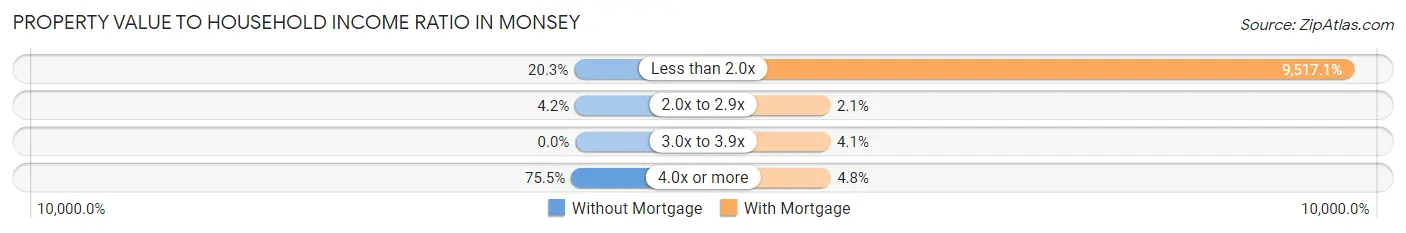
| Value-to-Income Ratio | Without Mortgage | With Mortgage |
| Less than 2.0x | 129 (20.3%) | 106,496 (9,517.1%) |
| 2.0x to 2.9x | 27 (4.2%) | 24 (2.1%) |
| 3.0x to 3.9x | 0 (0.0%) | 46 (4.1%) |
| 4.0x or more | 481 (75.5%) | 54 (4.8%) |
| Total | 637 (100.0%) | 1,119 (100.0%) |
Real Estate Taxes by Mortgage Status in Monsey
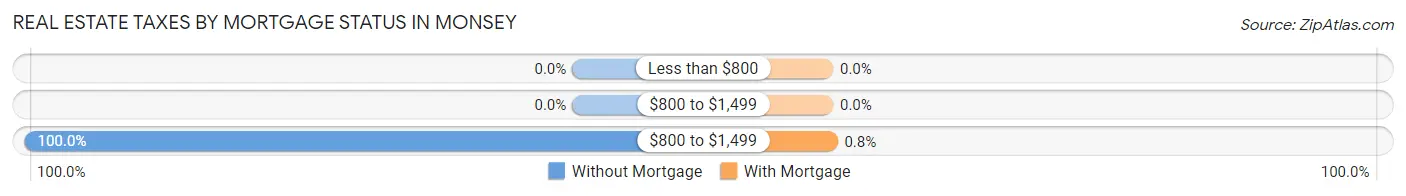
| Property Taxes | Without Mortgage | With Mortgage |
| Less than $800 | 0 (0.0%) | 0 (0.0%) |
| $800 to $1,499 | 0 (0.0%) | 0 (0.0%) |
| $800 to $1,499 | 637 (100.0%) | 9 (0.8%) |
| Total | 637 (100.0%) | 1,119 (100.0%) |
Health & Disability in Monsey
Health Insurance Coverage by Age in Monsey
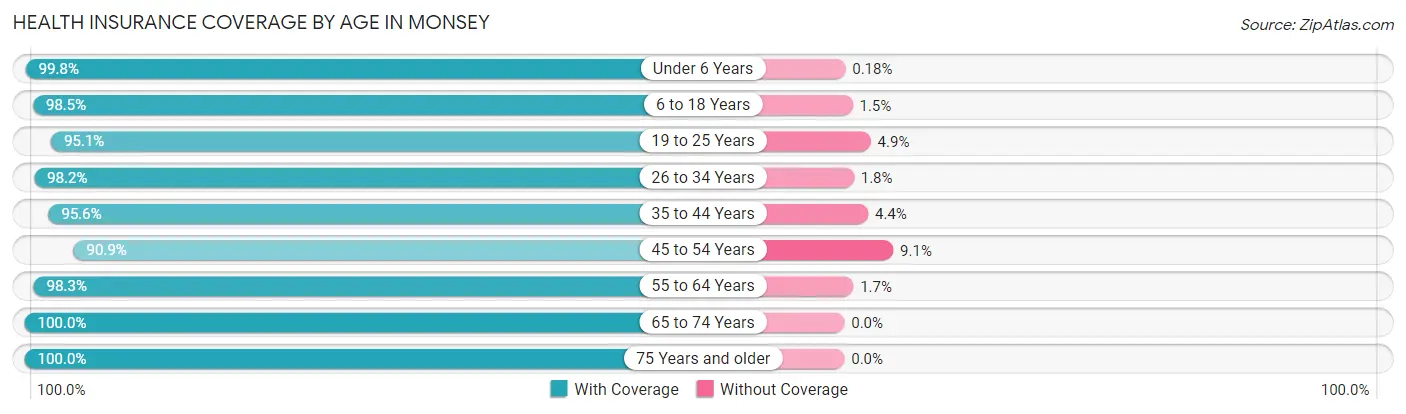
| Age Bracket | With Coverage | Without Coverage |
| Under 6 Years | 6,197 (99.8%) | 11 (0.2%) |
| 6 to 18 Years | 10,423 (98.5%) | 162 (1.5%) |
| 19 to 25 Years | 2,242 (95.1%) | 116 (4.9%) |
| 26 to 34 Years | 2,333 (98.2%) | 42 (1.8%) |
| 35 to 44 Years | 3,002 (95.6%) | 139 (4.4%) |
| 45 to 54 Years | 978 (90.9%) | 98 (9.1%) |
| 55 to 64 Years | 941 (98.3%) | 16 (1.7%) |
| 65 to 74 Years | 968 (100.0%) | 0 (0.0%) |
| 75 Years and older | 519 (100.0%) | 0 (0.0%) |
| Total | 27,603 (97.9%) | 584 (2.1%) |
Health Insurance Coverage by Citizenship Status in Monsey
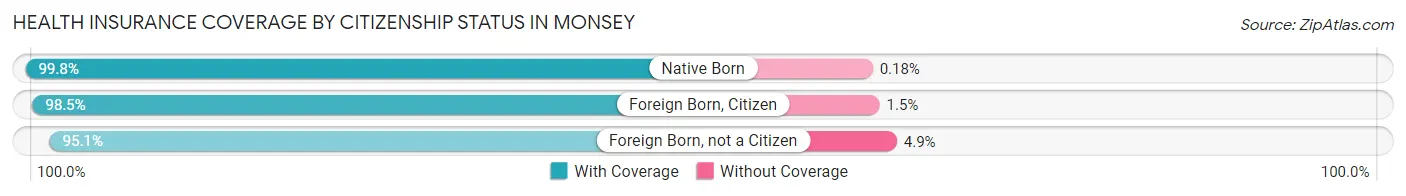
| Citizenship Status | With Coverage | Without Coverage |
| Native Born | 6,197 (99.8%) | 11 (0.2%) |
| Foreign Born, Citizen | 10,423 (98.5%) | 162 (1.5%) |
| Foreign Born, not a Citizen | 2,242 (95.1%) | 116 (4.9%) |
Health Insurance Coverage by Household Income in Monsey
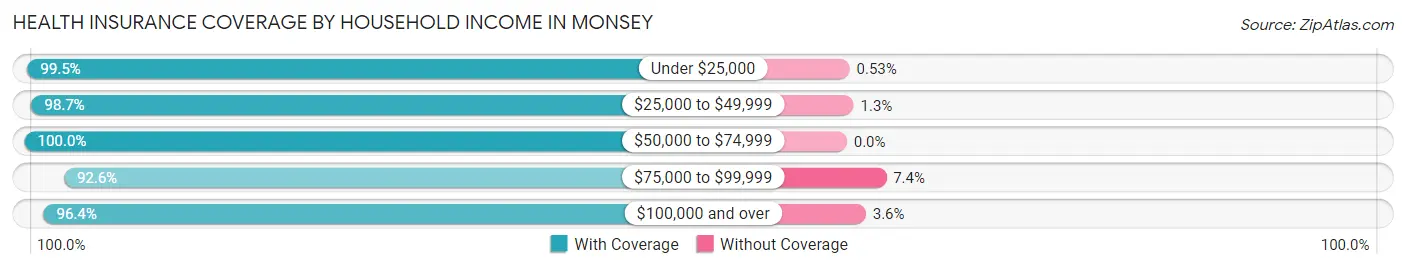
| Household Income | With Coverage | Without Coverage |
| Under $25,000 | 6,176 (99.5%) | 33 (0.5%) |
| $25,000 to $49,999 | 7,487 (98.7%) | 97 (1.3%) |
| $50,000 to $74,999 | 4,056 (100.0%) | 0 (0.0%) |
| $75,000 to $99,999 | 2,309 (92.6%) | 184 (7.4%) |
| $100,000 and over | 7,210 (96.4%) | 266 (3.6%) |
Public vs Private Health Insurance Coverage by Age in Monsey
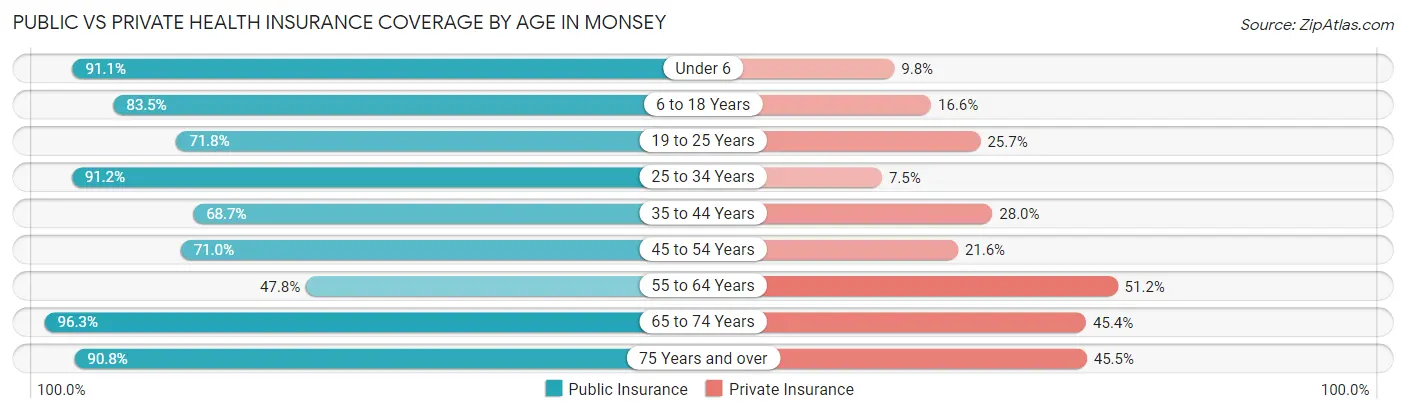
| Age Bracket | Public Insurance | Private Insurance |
| Under 6 | 5,655 (91.1%) | 606 (9.8%) |
| 6 to 18 Years | 8,841 (83.5%) | 1,755 (16.6%) |
| 19 to 25 Years | 1,694 (71.8%) | 607 (25.7%) |
| 25 to 34 Years | 2,167 (91.2%) | 177 (7.4%) |
| 35 to 44 Years | 2,158 (68.7%) | 878 (28.0%) |
| 45 to 54 Years | 764 (71.0%) | 232 (21.6%) |
| 55 to 64 Years | 457 (47.7%) | 490 (51.2%) |
| 65 to 74 Years | 932 (96.3%) | 439 (45.4%) |
| 75 Years and over | 471 (90.7%) | 236 (45.5%) |
| Total | 23,139 (82.1%) | 5,420 (19.2%) |
Disability Status by Sex by Age in Monsey
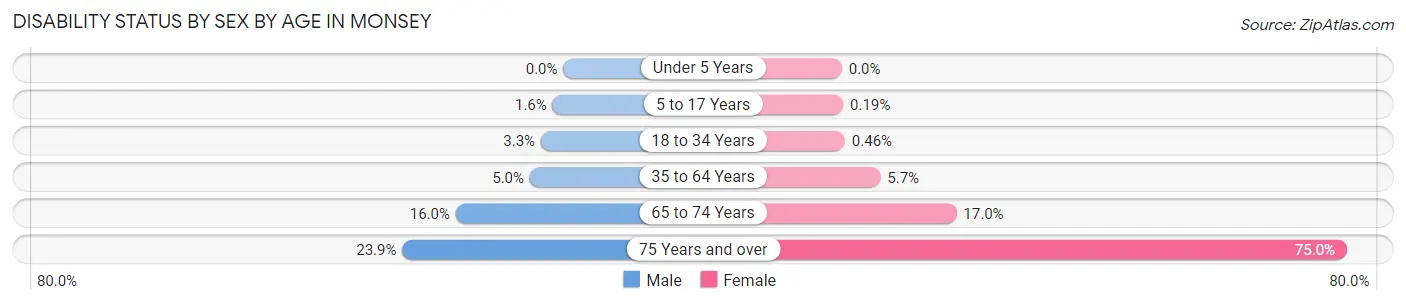
| Age Bracket | Male | Female |
| Under 5 Years | 0 (0.0%) | 0 (0.0%) |
| 5 to 17 Years | 87 (1.6%) | 10 (0.2%) |
| 18 to 34 Years | 92 (3.3%) | 12 (0.5%) |
| 35 to 64 Years | 126 (5.0%) | 151 (5.7%) |
| 65 to 74 Years | 71 (16.0%) | 89 (17.0%) |
| 75 Years and over | 61 (23.9%) | 198 (75.0%) |
Disability Class by Sex by Age in Monsey
Disability Class: Hearing Difficulty
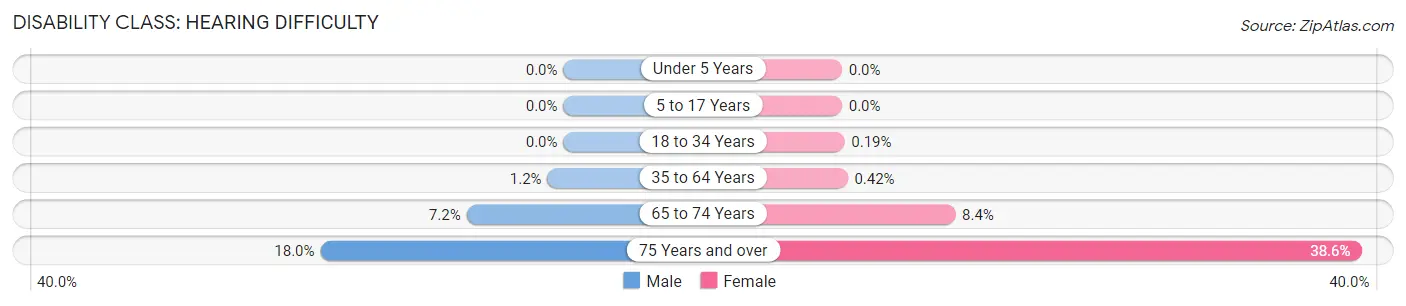
| Age Bracket | Male | Female |
| Under 5 Years | 0 (0.0%) | 0 (0.0%) |
| 5 to 17 Years | 0 (0.0%) | 0 (0.0%) |
| 18 to 34 Years | 0 (0.0%) | 5 (0.2%) |
| 35 to 64 Years | 30 (1.2%) | 11 (0.4%) |
| 65 to 74 Years | 32 (7.2%) | 44 (8.4%) |
| 75 Years and over | 46 (18.0%) | 102 (38.6%) |
Disability Class: Vision Difficulty
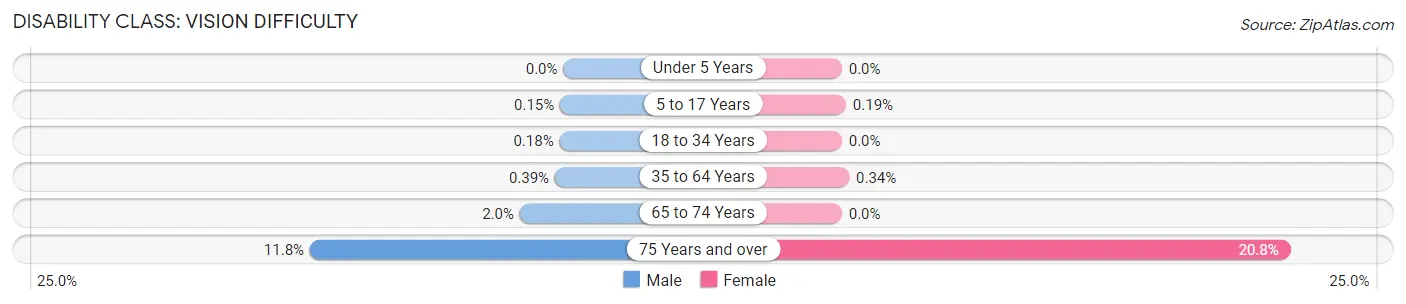
| Age Bracket | Male | Female |
| Under 5 Years | 0 (0.0%) | 0 (0.0%) |
| 5 to 17 Years | 8 (0.2%) | 10 (0.2%) |
| 18 to 34 Years | 5 (0.2%) | 0 (0.0%) |
| 35 to 64 Years | 10 (0.4%) | 9 (0.3%) |
| 65 to 74 Years | 9 (2.0%) | 0 (0.0%) |
| 75 Years and over | 30 (11.8%) | 55 (20.8%) |
Disability Class: Cognitive Difficulty
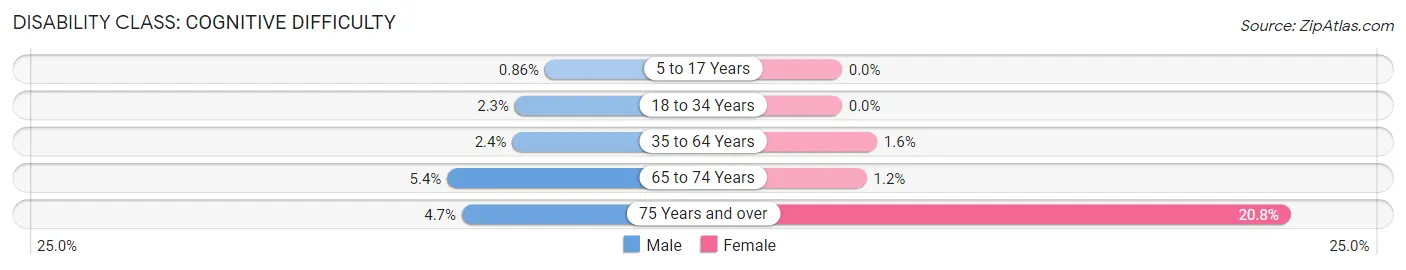
| Age Bracket | Male | Female |
| 5 to 17 Years | 47 (0.9%) | 0 (0.0%) |
| 18 to 34 Years | 62 (2.2%) | 0 (0.0%) |
| 35 to 64 Years | 60 (2.4%) | 43 (1.6%) |
| 65 to 74 Years | 24 (5.4%) | 6 (1.1%) |
| 75 Years and over | 12 (4.7%) | 55 (20.8%) |
Disability Class: Ambulatory Difficulty
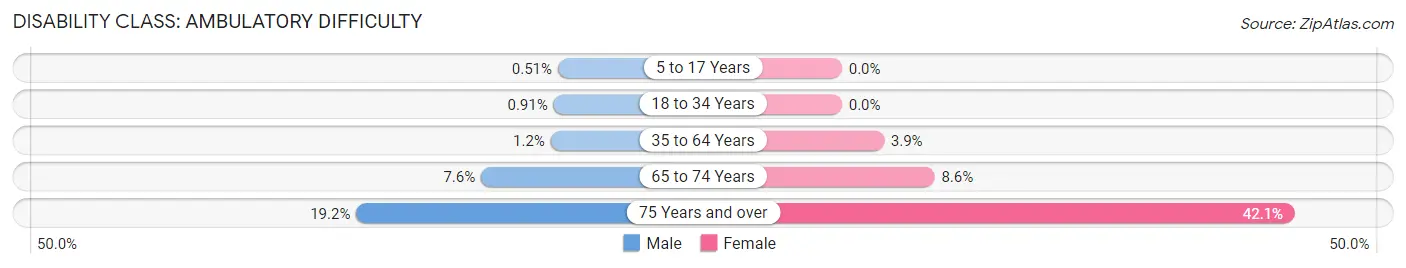
| Age Bracket | Male | Female |
| 5 to 17 Years | 28 (0.5%) | 0 (0.0%) |
| 18 to 34 Years | 25 (0.9%) | 0 (0.0%) |
| 35 to 64 Years | 30 (1.2%) | 103 (3.9%) |
| 65 to 74 Years | 34 (7.6%) | 45 (8.6%) |
| 75 Years and over | 49 (19.2%) | 111 (42.0%) |
Disability Class: Self-Care Difficulty
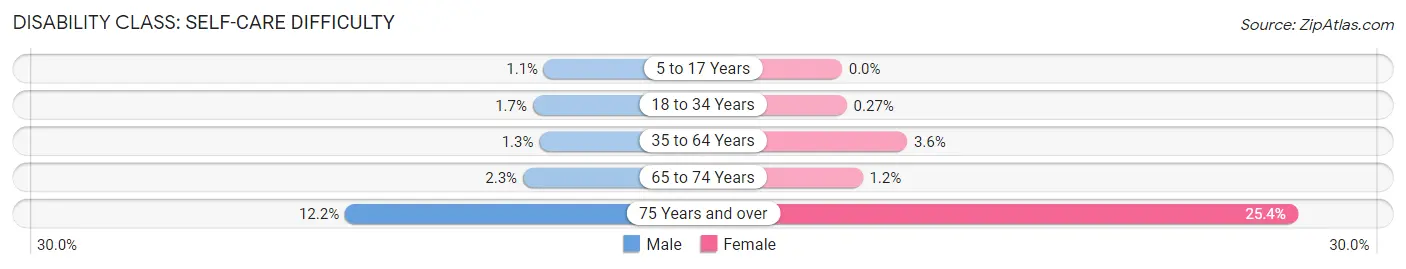
| Age Bracket | Male | Female |
| 5 to 17 Years | 59 (1.1%) | 0 (0.0%) |
| 18 to 34 Years | 47 (1.7%) | 7 (0.3%) |
| 35 to 64 Years | 34 (1.3%) | 96 (3.6%) |
| 65 to 74 Years | 10 (2.2%) | 6 (1.1%) |
| 75 Years and over | 31 (12.2%) | 67 (25.4%) |
Technology Access in Monsey
Computing Device Access in Monsey
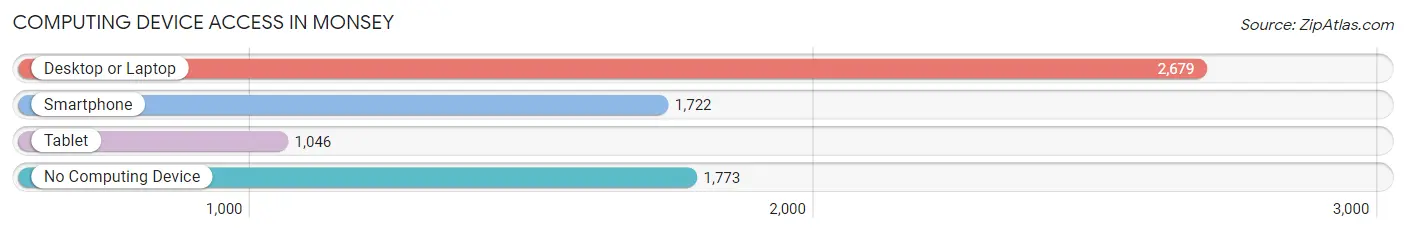
| Device Type | # Households | % Households |
| Desktop or Laptop | 2,679 | 55.3% |
| Smartphone | 1,722 | 35.5% |
| Tablet | 1,046 | 21.6% |
| No Computing Device | 1,773 | 36.6% |
| Total | 4,844 | 100.0% |
Internet Access in Monsey
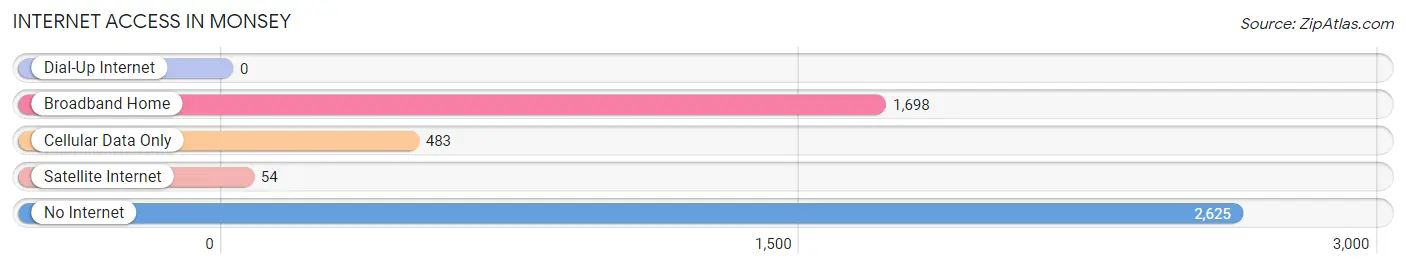
| Internet Type | # Households | % Households |
| Dial-Up Internet | 0 | 0.0% |
| Broadband Home | 1,698 | 35.0% |
| Cellular Data Only | 483 | 10.0% |
| Satellite Internet | 54 | 1.1% |
| No Internet | 2,625 | 54.2% |
| Total | 4,844 | 100.0% |
Monsey Summary
Monsey is a hamlet located in the town of Ramapo in Rockland County, New York. It is located approximately 30 miles northwest of New York City and is part of the larger New York metropolitan area. Monsey is a predominantly Jewish community and is home to a large Hasidic population.
History
Monsey was originally part of the town of Clarkstown, which was established in 1791. The area was first settled in the late 1700s by Dutch and English settlers. The hamlet was originally known as “Monsey’s Corners” and was named after the Monsey family, who were among the first settlers in the area. The hamlet was officially incorporated in 1855.
In the late 19th century, Monsey began to attract a large number of Jewish immigrants from Eastern Europe. The influx of Jewish immigrants led to the establishment of a number of synagogues and other Jewish institutions in the area. By the early 20th century, Monsey had become a predominantly Jewish community.
In the 1950s and 1960s, Monsey experienced a period of rapid growth as the Jewish population continued to expand. This growth was fueled by the influx of Hasidic Jews from Brooklyn and other parts of New York City. The population of Monsey continued to grow throughout the late 20th century and into the 21st century.
Geography
Monsey is located in the town of Ramapo in Rockland County, New York. It is located approximately 30 miles northwest of New York City and is part of the larger New York metropolitan area. The hamlet is situated in the Ramapo Mountains and is bordered by the towns of Clarkstown, Orangetown, and Haverstraw.
The terrain of Monsey is mostly hilly and wooded. The hamlet is home to a number of parks and nature preserves, including the Ramapo Valley County Park and the Harriman State Park.
Economy
Monsey’s economy is largely based on the service sector. The hamlet is home to a number of retail stores, restaurants, and other businesses. The area is also home to a number of religious institutions, including synagogues and yeshivas.
The hamlet is also home to a number of light manufacturing and industrial businesses. These businesses include a number of printing companies, food processing plants, and other industrial facilities.
Demographics
As of the 2010 census, the population of Monsey was 18,412. The racial makeup of the hamlet was 79.3% White, 0.3% African American, 0.1% Native American, 0.2% Asian, 0.1% Pacific Islander, and 19.9% from other races. The median household income in Monsey was $50,945.
Monsey is a predominantly Jewish community and is home to a large Hasidic population. The hamlet is also home to a number of other religious groups, including Christians, Muslims, and Hindus. The majority of the population speaks English, although Yiddish and Hebrew are also spoken in the area.
Common Questions
What is Per Capita Income in Monsey?
Per Capita income in Monsey is $14,062.
What is the Median Family Income in Monsey?
Median Family Income in Monsey is $50,931.
What is the Median Household income in Monsey?
Median Household Income in Monsey is $49,630.
What is Income or Wage Gap in Monsey?
Income or Wage Gap in Monsey is 52.6%.
Women in Monsey earn 47.4 cents for every dollar earned by a man.
What is Inequality or Gini Index in Monsey?
Inequality or Gini Index in Monsey is 0.50.
What is the Total Population of Monsey?
Total Population of Monsey is 28,287.
What is the Total Male Population of Monsey?
Total Male Population of Monsey is 14,423.
What is the Total Female Population of Monsey?
Total Female Population of Monsey is 13,864.
What is the Ratio of Males per 100 Females in Monsey?
There are 104.03 Males per 100 Females in Monsey.
What is the Ratio of Females per 100 Males in Monsey?
There are 96.12 Females per 100 Males in Monsey.
What is the Median Population Age in Monsey?
Median Population Age in Monsey is 15.0 Years.
What is the Average Family Size in Monsey
Average Family Size in Monsey is 5.9 People.
What is the Average Household Size in Monsey
Average Household Size in Monsey is 5.7 People.
How Large is the Labor Force in Monsey?
There are 7,216 People in the Labor Forcein in Monsey.
What is the Percentage of People in the Labor Force in Monsey?
53.7% of People are in the Labor Force in Monsey.
What is the Unemployment Rate in Monsey?
Unemployment Rate in Monsey is 8.2%.