Plattsburgh West, NY Map & Demographics
Plattsburgh West Map
Plattsburgh West Overview
$28,596
PER CAPITA INCOME
$70,227
AVG FAMILY INCOME
$51,196
AVG HOUSEHOLD INCOME
56.2%
WAGE / INCOME GAP [ % ]
43.8¢/ $1
WAGE / INCOME GAP [ $ ]
0.45
INEQUALITY / GINI INDEX
1,307
TOTAL POPULATION
561
MALE POPULATION
746
FEMALE POPULATION
75.20
MALES / 100 FEMALES
132.98
FEMALES / 100 MALES
43.5
MEDIAN AGE
2.5
AVG FAMILY SIZE
2.2
AVG HOUSEHOLD SIZE
619
LABOR FORCE [ PEOPLE ]
57.4%
PERCENT IN LABOR FORCE
13.2%
UNEMPLOYMENT RATE
Income in Plattsburgh West
Income Overview in Plattsburgh West
Per Capita Income in Plattsburgh West is $28,596, while median incomes of families and households are $70,227 and $51,196 respectively.
| Characteristic | Number | Measure |
| Per Capita Income | 1,307 | $28,596 |
| Median Family Income | 350 | $70,227 |
| Mean Family Income | 350 | $82,547 |
| Median Household Income | 596 | $51,196 |
| Mean Household Income | 596 | $66,823 |
| Income Deficit | 350 | $0 |
| Wage / Income Gap (%) | 1,307 | 56.20% |
| Wage / Income Gap ($) | 1,307 | 43.80¢ per $1 |
| Gini / Inequality Index | 1,307 | 0.45 |
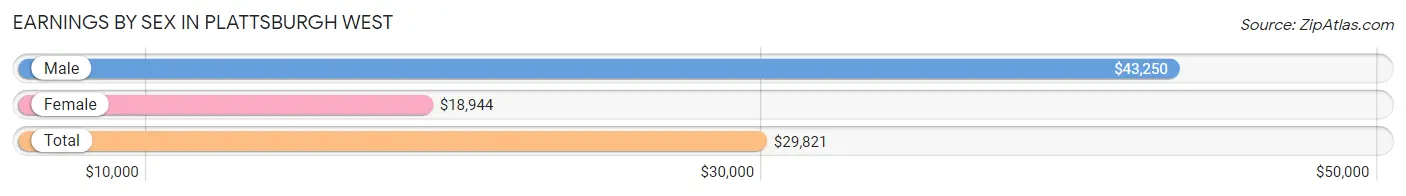
Earnings by Sex in Plattsburgh West
Average Earnings in Plattsburgh West are $29,821, $43,250 for men and $18,944 for women, a difference of 56.2%.
| Sex | Number | Average Earnings |
| Male | 321 (45.3%) | $43,250 |
| Female | 388 (54.7%) | $18,944 |
| Total | 709 (100.0%) | $29,821 |
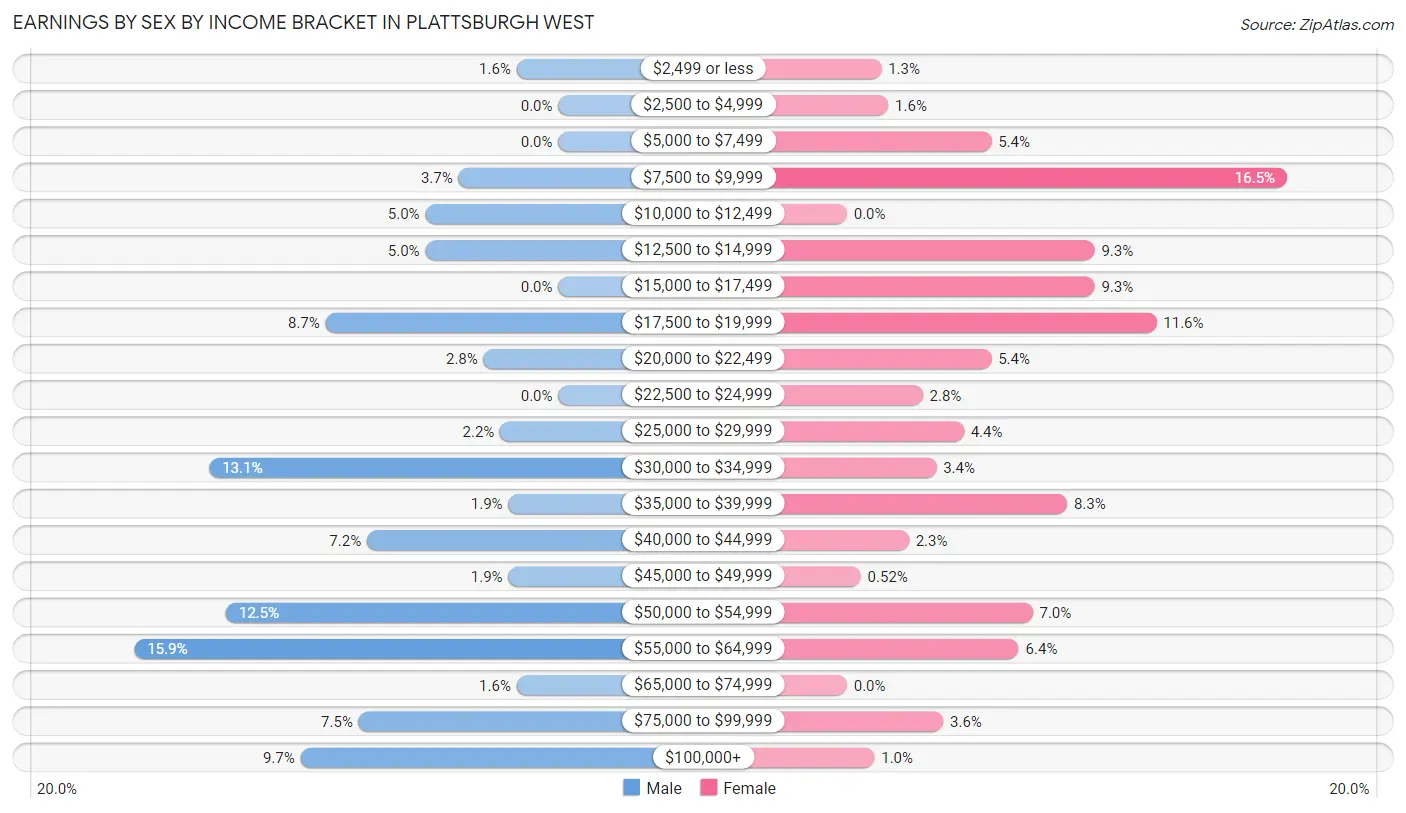
Earnings by Sex by Income Bracket in Plattsburgh West
The most common earnings brackets in Plattsburgh West are $55,000 to $64,999 for men (51 | 15.9%) and $7,500 to $9,999 for women (64 | 16.5%).
| Income | Male | Female |
| $2,499 or less | 5 (1.6%) | 5 (1.3%) |
| $2,500 to $4,999 | 0 (0.0%) | 6 (1.5%) |
| $5,000 to $7,499 | 0 (0.0%) | 21 (5.4%) |
| $7,500 to $9,999 | 12 (3.7%) | 64 (16.5%) |
| $10,000 to $12,499 | 16 (5.0%) | 0 (0.0%) |
| $12,500 to $14,999 | 16 (5.0%) | 36 (9.3%) |
| $15,000 to $17,499 | 0 (0.0%) | 36 (9.3%) |
| $17,500 to $19,999 | 28 (8.7%) | 45 (11.6%) |
| $20,000 to $22,499 | 9 (2.8%) | 21 (5.4%) |
| $22,500 to $24,999 | 0 (0.0%) | 11 (2.8%) |
| $25,000 to $29,999 | 7 (2.2%) | 17 (4.4%) |
| $30,000 to $34,999 | 42 (13.1%) | 13 (3.4%) |
| $35,000 to $39,999 | 6 (1.9%) | 32 (8.3%) |
| $40,000 to $44,999 | 23 (7.2%) | 9 (2.3%) |
| $45,000 to $49,999 | 6 (1.9%) | 2 (0.5%) |
| $50,000 to $54,999 | 40 (12.5%) | 27 (7.0%) |
| $55,000 to $64,999 | 51 (15.9%) | 25 (6.4%) |
| $65,000 to $74,999 | 5 (1.6%) | 0 (0.0%) |
| $75,000 to $99,999 | 24 (7.5%) | 14 (3.6%) |
| $100,000+ | 31 (9.7%) | 4 (1.0%) |
| Total | 321 (100.0%) | 388 (100.0%) |
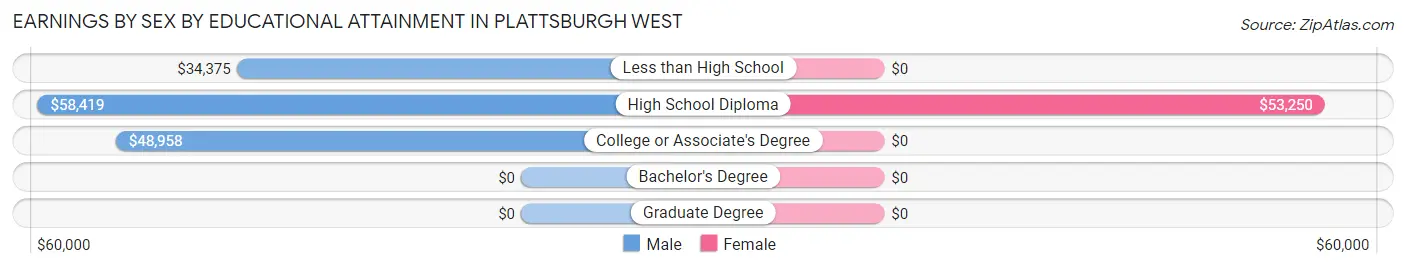
Earnings by Sex by Educational Attainment in Plattsburgh West
Average earnings in Plattsburgh West are $53,884 for men and $25,000 for women, a difference of 53.6%. Men with an educational attainment of high school diploma enjoy the highest average annual earnings of $58,419, while those with less than high school education earn the least with $34,375. Women with an educational attainment of high school diploma earn the most with the average annual earnings of $53,250, while those with high school diploma education have the smallest earnings of $53,250.
| Educational Attainment | Male Income | Female Income |
| Less than High School | $34,375 | $0 |
| High School Diploma | $58,419 | $53,250 |
| College or Associate's Degree | $48,958 | $0 |
| Bachelor's Degree | - | - |
| Graduate Degree | - | - |
| Total | $53,884 | $25,000 |
Family Income in Plattsburgh West
Family Income Brackets in Plattsburgh West
According to the Plattsburgh West family income data, there are 69 families falling into the $75,000 to $99,999 income range, which is the most common income bracket and makes up 19.7% of all families. Conversely, the less than $10,000 income bracket is the least frequent group with only 5 families (1.4%) belonging to this category.
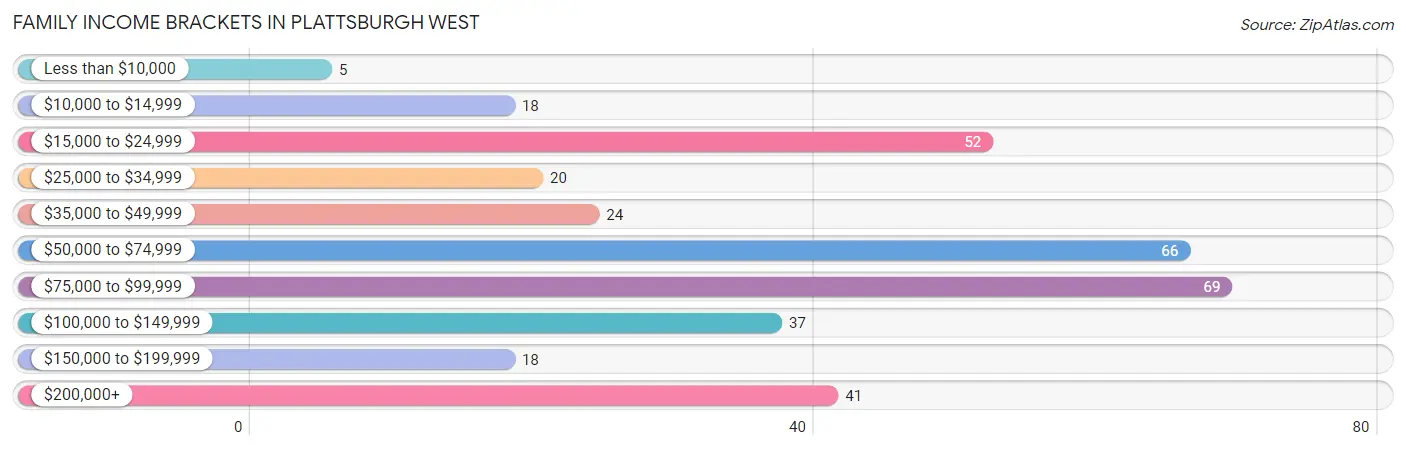
| Income Bracket | # Families | % Families |
| Less than $10,000 | 5 | 1.4% |
| $10,000 to $14,999 | 18 | 5.1% |
| $15,000 to $24,999 | 52 | 14.9% |
| $25,000 to $34,999 | 20 | 5.7% |
| $35,000 to $49,999 | 24 | 6.9% |
| $50,000 to $74,999 | 66 | 18.9% |
| $75,000 to $99,999 | 69 | 19.7% |
| $100,000 to $149,999 | 37 | 10.6% |
| $150,000 to $199,999 | 18 | 5.1% |
| $200,000+ | 41 | 11.7% |
Family Income by Famaliy Size in Plattsburgh West
2-person families (195 | 55.7%) account for the highest median family income in Plattsburgh West with $60,956 per family, while 2-person families (195 | 55.7%) have the highest median income of $30,478 per family member.
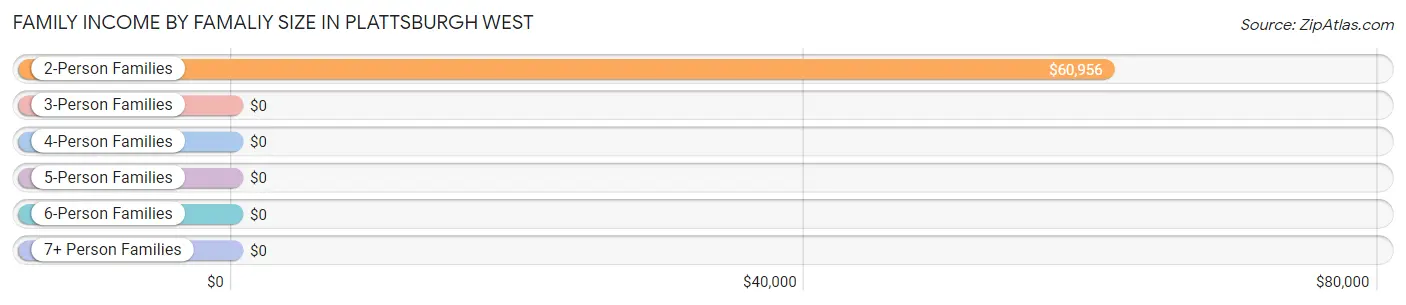
| Income Bracket | # Families | Median Income |
| 2-Person Families | 195 (55.7%) | $60,956 |
| 3-Person Families | 105 (30.0%) | $0 |
| 4-Person Families | 17 (4.9%) | $0 |
| 5-Person Families | 11 (3.1%) | $0 |
| 6-Person Families | 11 (3.1%) | $0 |
| 7+ Person Families | 11 (3.1%) | $0 |
| Total | 350 (100.0%) | $70,227 |
Family Income by Number of Earners in Plattsburgh West
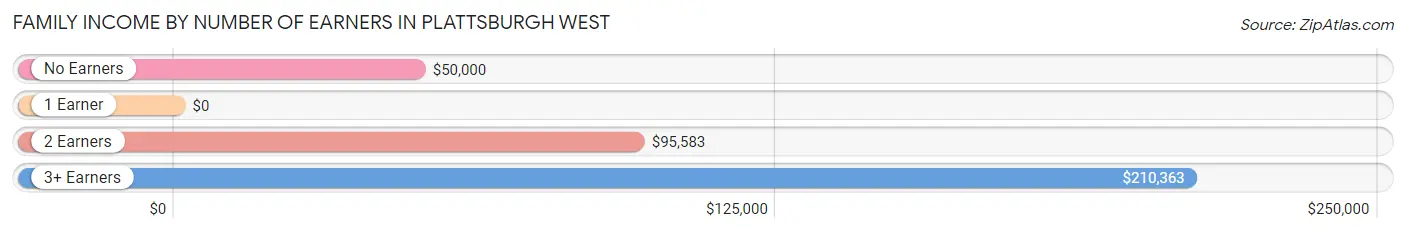
| Number of Earners | # Families | Median Income |
| No Earners | 66 (18.9%) | $50,000 |
| 1 Earner | 124 (35.4%) | $0 |
| 2 Earners | 107 (30.6%) | $95,583 |
| 3+ Earners | 53 (15.1%) | $210,363 |
| Total | 350 (100.0%) | $70,227 |
Household Income in Plattsburgh West
Household Income Brackets in Plattsburgh West
With 115 households falling in the category, the $75,000 to $99,999 income range is the most frequent in Plattsburgh West, accounting for 19.3% of all households. In contrast, only 24 households (4.0%) fall into the $150,000 to $199,999 income bracket, making it the least populous group.
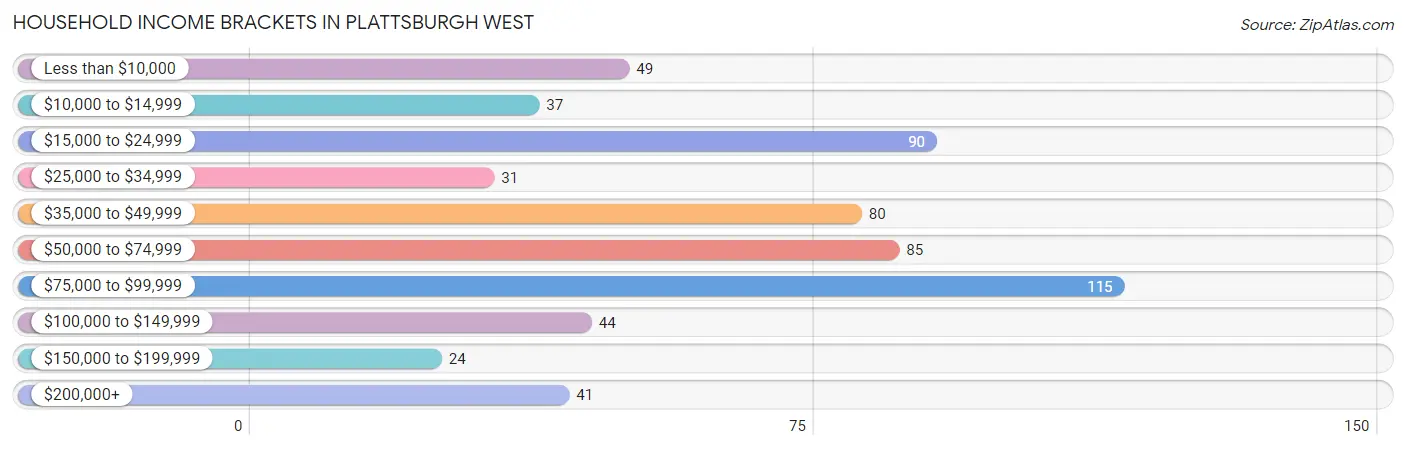
| Income Bracket | # Households | % Households |
| Less than $10,000 | 49 | 8.2% |
| $10,000 to $14,999 | 37 | 6.2% |
| $15,000 to $24,999 | 90 | 15.1% |
| $25,000 to $34,999 | 31 | 5.2% |
| $35,000 to $49,999 | 80 | 13.4% |
| $50,000 to $74,999 | 85 | 14.3% |
| $75,000 to $99,999 | 115 | 19.3% |
| $100,000 to $149,999 | 44 | 7.4% |
| $150,000 to $199,999 | 24 | 4.0% |
| $200,000+ | 41 | 6.9% |
Household Income by Householder Age in Plattsburgh West
The median household income in Plattsburgh West is $51,196, with the highest median household income of $95,250 found in the 25 to 44 years age bracket for the primary householder. A total of 133 households (22.3%) fall into this category. Meanwhile, the 15 to 24 years age bracket for the primary householder has the lowest median household income of $0, with 70 households (11.7%) in this group.
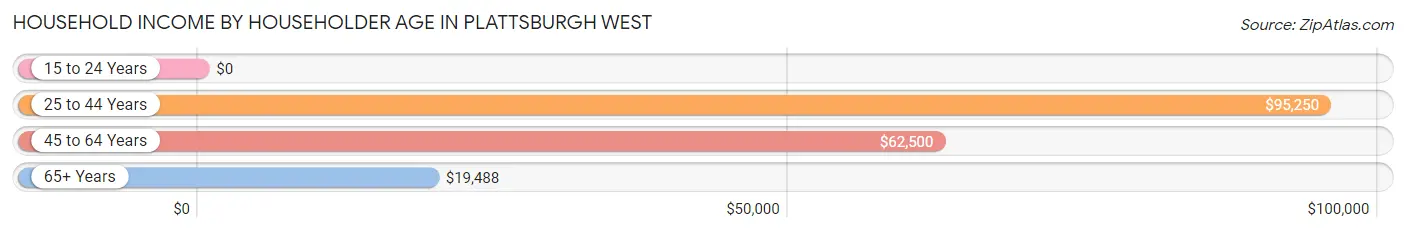
| Income Bracket | # Households | Median Income |
| 15 to 24 Years | 70 (11.7%) | $0 |
| 25 to 44 Years | 133 (22.3%) | $95,250 |
| 45 to 64 Years | 204 (34.2%) | $62,500 |
| 65+ Years | 189 (31.7%) | $19,488 |
| Total | 596 (100.0%) | $51,196 |
Poverty in Plattsburgh West
Income Below Poverty by Sex and Age in Plattsburgh West
With 13.0% poverty level for males and 25.5% for females among the residents of Plattsburgh West, 12 to 14 year old males and under 5 year old females are the most vulnerable to poverty, with 5 males (100.0%) and 21 females (63.6%) in their respective age groups living below the poverty level.
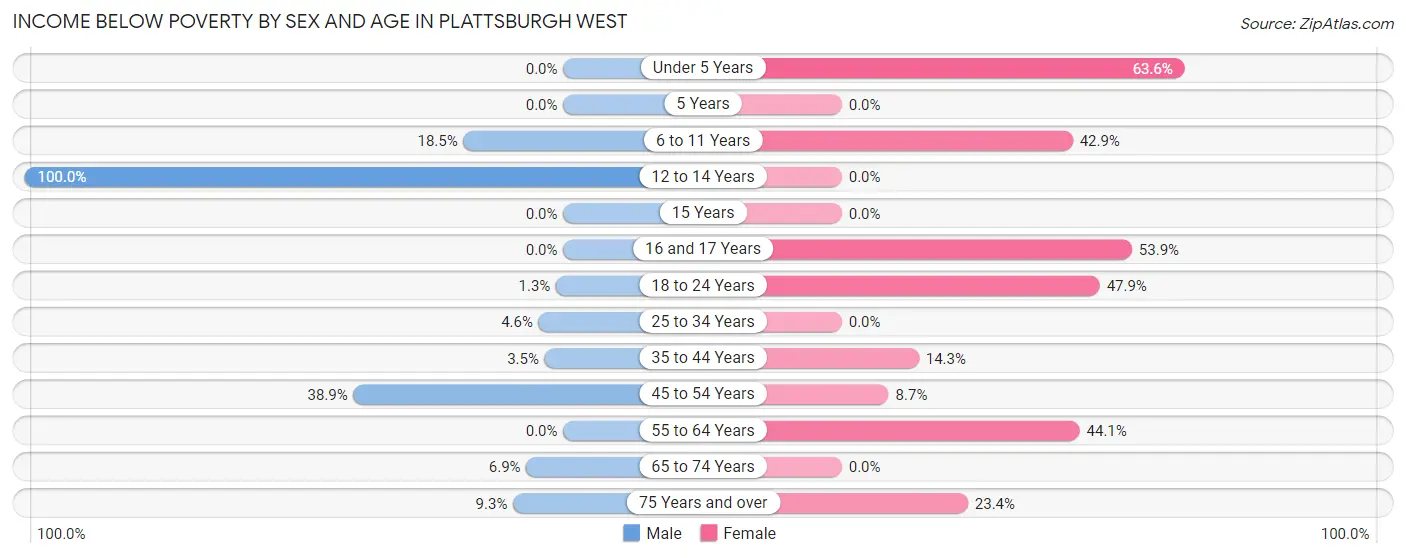
| Age Bracket | Male | Female |
| Under 5 Years | 0 (0.0%) | 21 (63.6%) |
| 5 Years | 0 (0.0%) | 0 (0.0%) |
| 6 to 11 Years | 10 (18.5%) | 21 (42.9%) |
| 12 to 14 Years | 5 (100.0%) | 0 (0.0%) |
| 15 Years | 0 (0.0%) | 0 (0.0%) |
| 16 and 17 Years | 0 (0.0%) | 14 (53.8%) |
| 18 to 24 Years | 1 (1.3%) | 45 (47.9%) |
| 25 to 34 Years | 2 (4.5%) | 0 (0.0%) |
| 35 to 44 Years | 2 (3.5%) | 12 (14.3%) |
| 45 to 54 Years | 44 (38.9%) | 6 (8.7%) |
| 55 to 64 Years | 0 (0.0%) | 49 (44.1%) |
| 65 to 74 Years | 5 (6.9%) | 0 (0.0%) |
| 75 Years and over | 4 (9.3%) | 11 (23.4%) |
| Total | 73 (13.0%) | 179 (25.5%) |
Income Above Poverty by Sex and Age in Plattsburgh West
According to the poverty statistics in Plattsburgh West, males aged 5 years and females aged 12 to 14 years are the age groups that are most secure financially, with 100.0% of males and 100.0% of females in these age groups living above the poverty line.
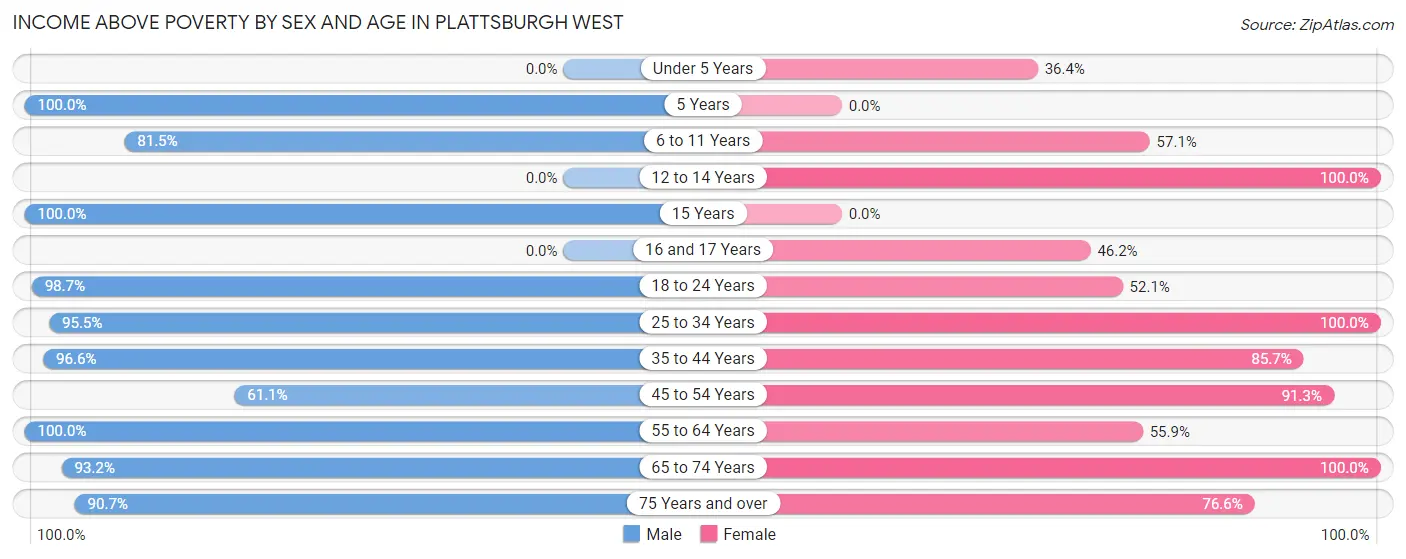
| Age Bracket | Male | Female |
| Under 5 Years | 0 (0.0%) | 12 (36.4%) |
| 5 Years | 20 (100.0%) | 0 (0.0%) |
| 6 to 11 Years | 44 (81.5%) | 28 (57.1%) |
| 12 to 14 Years | 0 (0.0%) | 19 (100.0%) |
| 15 Years | 6 (100.0%) | 0 (0.0%) |
| 16 and 17 Years | 0 (0.0%) | 12 (46.2%) |
| 18 to 24 Years | 74 (98.7%) | 49 (52.1%) |
| 25 to 34 Years | 42 (95.5%) | 52 (100.0%) |
| 35 to 44 Years | 56 (96.6%) | 72 (85.7%) |
| 45 to 54 Years | 69 (61.1%) | 63 (91.3%) |
| 55 to 64 Years | 70 (100.0%) | 62 (55.9%) |
| 65 to 74 Years | 68 (93.1%) | 119 (100.0%) |
| 75 Years and over | 39 (90.7%) | 36 (76.6%) |
| Total | 488 (87.0%) | 524 (74.5%) |
Income Below Poverty Among Married-Couple Families in Plattsburgh West
The poverty statistics for married-couple families in Plattsburgh West show that 2.2% or 5 of the total 224 families live below the poverty line. Families with no children have the highest poverty rate of 2.9%, comprising of 5 families. On the other hand, families with 1 or 2 children have the lowest poverty rate of 0.0%, which includes 0 families.
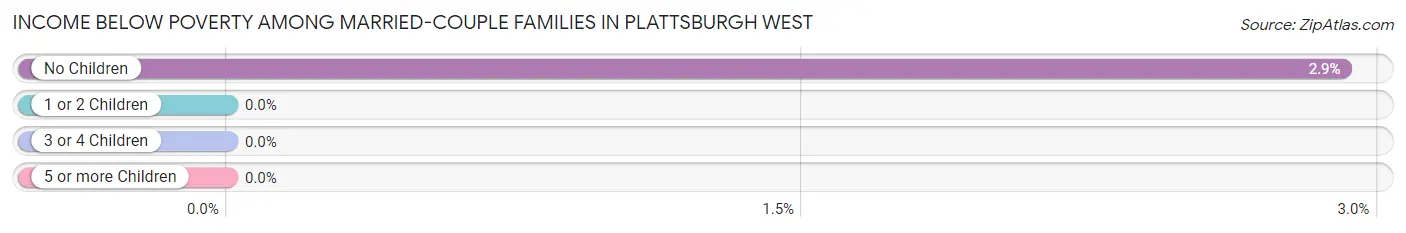
| Children | Above Poverty | Below Poverty |
| No Children | 167 (97.1%) | 5 (2.9%) |
| 1 or 2 Children | 41 (100.0%) | 0 (0.0%) |
| 3 or 4 Children | 0 (0.0%) | 0 (0.0%) |
| 5 or more Children | 11 (100.0%) | 0 (0.0%) |
| Total | 219 (97.8%) | 5 (2.2%) |
Income Below Poverty Among Single-Parent Households in Plattsburgh West
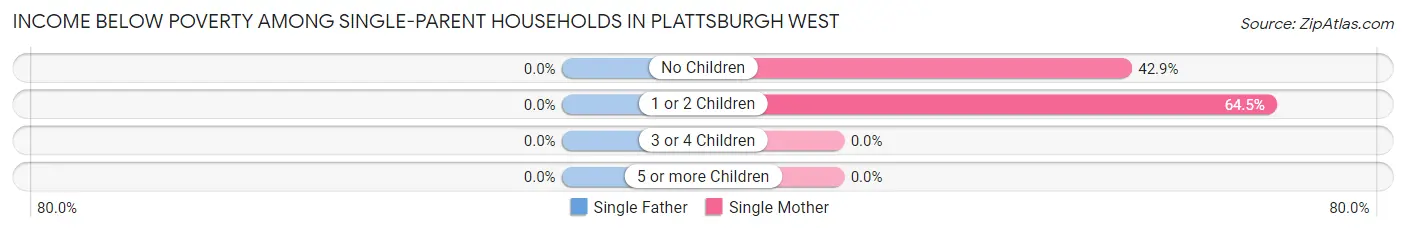
| Children | Single Father | Single Mother |
| No Children | 0 (0.0%) | 6 (42.9%) |
| 1 or 2 Children | 0 (0.0%) | 60 (64.5%) |
| 3 or 4 Children | 0 (0.0%) | 0 (0.0%) |
| 5 or more Children | 0 (0.0%) | 0 (0.0%) |
| Total | 0 (0.0%) | 66 (61.7%) |
Income Below Poverty Among Married-Couple vs Single-Parent Households in Plattsburgh West
The poverty data for Plattsburgh West shows that 5 of the married-couple family households (2.2%) and 66 of the single-parent households (52.4%) are living below the poverty level. Within the married-couple family households, those with no children have the highest poverty rate, with 5 households (2.9%) falling below the poverty line. Among the single-parent households, those with 1 or 2 children have the highest poverty rate, with 60 household (60.0%) living below poverty.
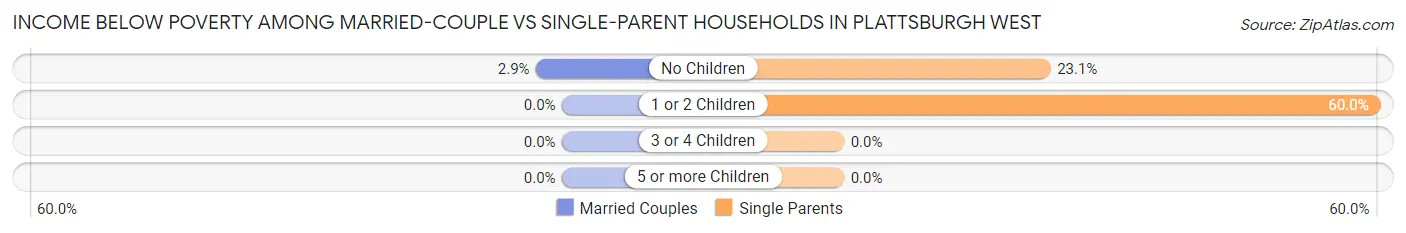
| Children | Married-Couple Families | Single-Parent Households |
| No Children | 5 (2.9%) | 6 (23.1%) |
| 1 or 2 Children | 0 (0.0%) | 60 (60.0%) |
| 3 or 4 Children | 0 (0.0%) | 0 (0.0%) |
| 5 or more Children | 0 (0.0%) | 0 (0.0%) |
| Total | 5 (2.2%) | 66 (52.4%) |
Race in Plattsburgh West
The most populous races in Plattsburgh West are White / Caucasian (1,257 | 96.2%), Two or more Races (43 | 3.3%), and Hispanic or Latino (5 | 0.4%).
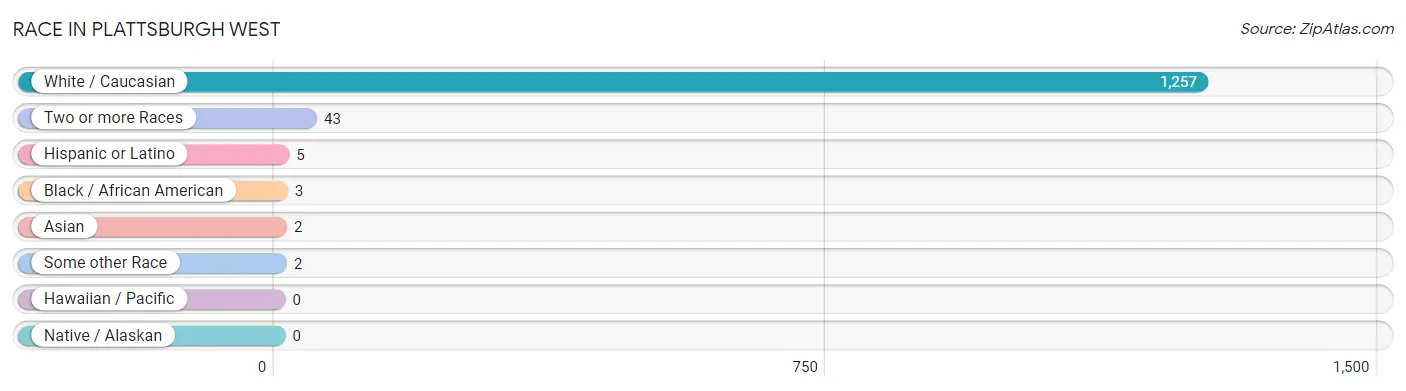
| Race | # Population | % Population |
| Asian | 2 | 0.2% |
| Black / African American | 3 | 0.2% |
| Hawaiian / Pacific | 0 | 0.0% |
| Hispanic or Latino | 5 | 0.4% |
| Native / Alaskan | 0 | 0.0% |
| White / Caucasian | 1,257 | 96.2% |
| Two or more Races | 43 | 3.3% |
| Some other Race | 2 | 0.2% |
| Total | 1,307 | 100.0% |
Ancestry in Plattsburgh West
The most populous ancestries reported in Plattsburgh West are French (297 | 22.7%), English (151 | 11.6%), Irish (132 | 10.1%), American (84 | 6.4%), and French Canadian (76 | 5.8%), together accounting for 56.6% of all Plattsburgh West residents.
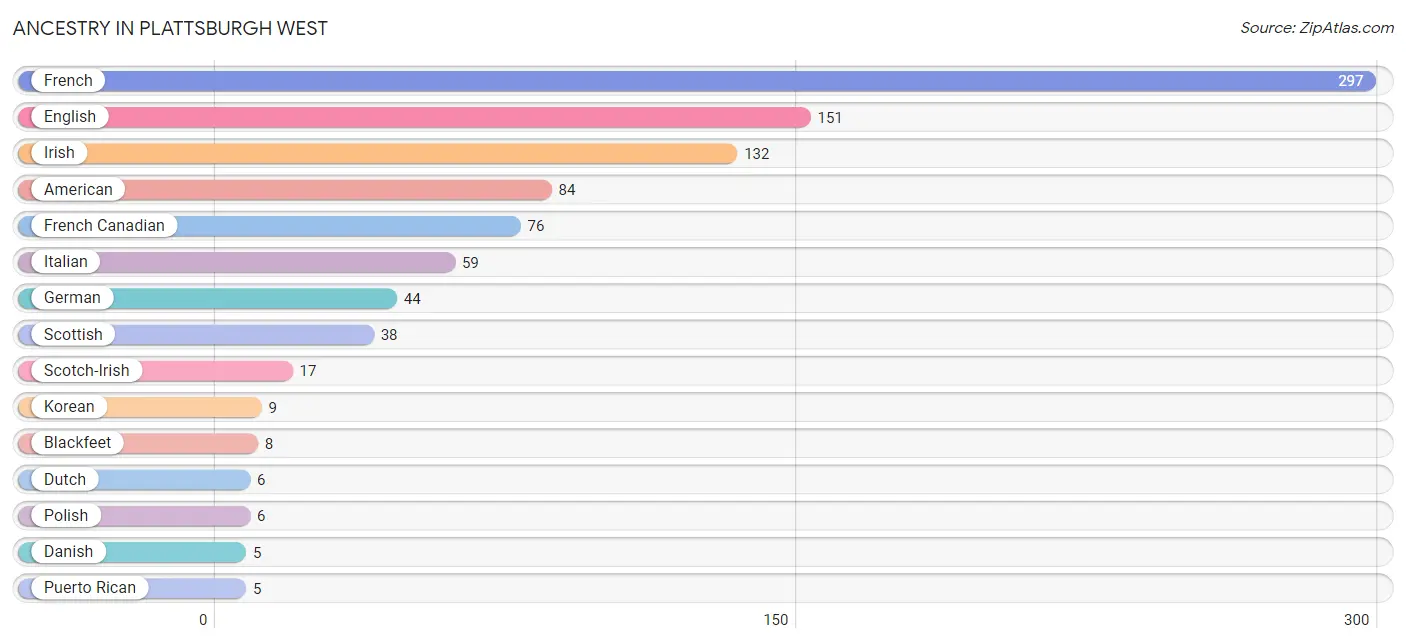
| Ancestry | # Population | % Population |
| American | 84 | 6.4% |
| Blackfeet | 8 | 0.6% |
| Danish | 5 | 0.4% |
| Dutch | 6 | 0.5% |
| English | 151 | 11.6% |
| French | 297 | 22.7% |
| French Canadian | 76 | 5.8% |
| German | 44 | 3.4% |
| Irish | 132 | 10.1% |
| Iroquois | 2 | 0.2% |
| Italian | 59 | 4.5% |
| Korean | 9 | 0.7% |
| Polish | 6 | 0.5% |
| Puerto Rican | 5 | 0.4% |
| Russian | 4 | 0.3% |
| Scotch-Irish | 17 | 1.3% |
| Scottish | 38 | 2.9% |
| Swedish | 3 | 0.2% |
| Turkish | 2 | 0.2% |
| Welsh | 4 | 0.3% | View All 20 Rows |
Immigrants in Plattsburgh West
The most numerous immigrant groups reported in Plattsburgh West came from Europe (8 | 0.6%), Belgium (4 | 0.3%), Eastern Europe (4 | 0.3%), Russia (4 | 0.3%), and Western Europe (4 | 0.3%), together accounting for 1.8% of all Plattsburgh West residents.
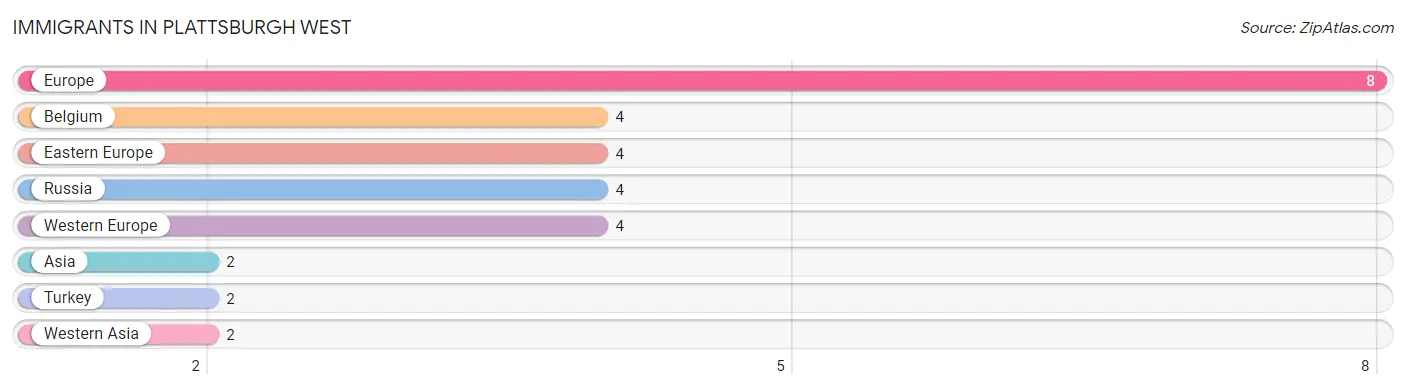
| Immigration Origin | # Population | % Population |
| Asia | 2 | 0.2% |
| Belgium | 4 | 0.3% |
| Eastern Europe | 4 | 0.3% |
| Europe | 8 | 0.6% |
| Russia | 4 | 0.3% |
| Turkey | 2 | 0.2% |
| Western Asia | 2 | 0.2% |
| Western Europe | 4 | 0.3% | View All 8 Rows |
Sex and Age in Plattsburgh West
Sex and Age in Plattsburgh West
The most populous age groups in Plattsburgh West are 20 to 24 Years (75 | 13.4%) for men and 65 to 69 Years (102 | 13.7%) for women.
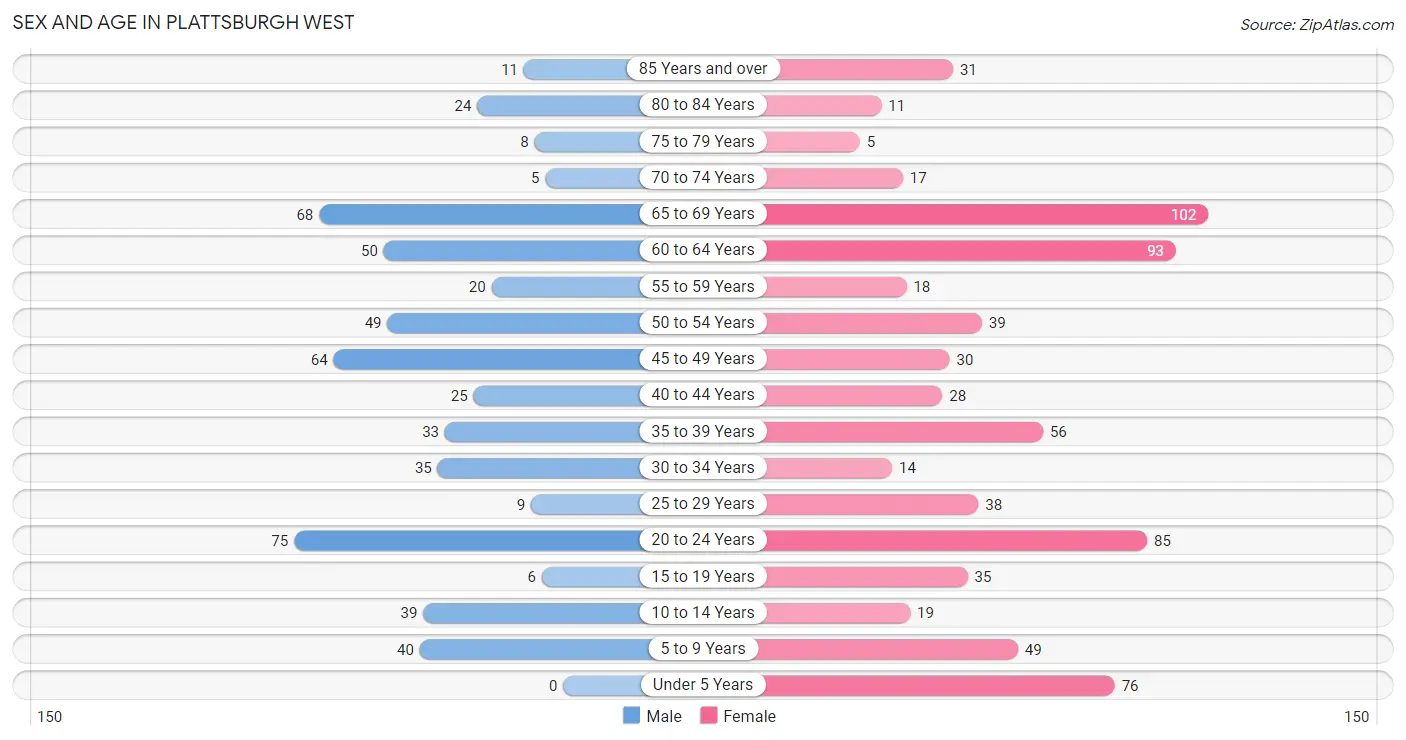
| Age Bracket | Male | Female |
| Under 5 Years | 0 (0.0%) | 76 (10.2%) |
| 5 to 9 Years | 40 (7.1%) | 49 (6.6%) |
| 10 to 14 Years | 39 (7.0%) | 19 (2.5%) |
| 15 to 19 Years | 6 (1.1%) | 35 (4.7%) |
| 20 to 24 Years | 75 (13.4%) | 85 (11.4%) |
| 25 to 29 Years | 9 (1.6%) | 38 (5.1%) |
| 30 to 34 Years | 35 (6.2%) | 14 (1.9%) |
| 35 to 39 Years | 33 (5.9%) | 56 (7.5%) |
| 40 to 44 Years | 25 (4.5%) | 28 (3.7%) |
| 45 to 49 Years | 64 (11.4%) | 30 (4.0%) |
| 50 to 54 Years | 49 (8.7%) | 39 (5.2%) |
| 55 to 59 Years | 20 (3.6%) | 18 (2.4%) |
| 60 to 64 Years | 50 (8.9%) | 93 (12.5%) |
| 65 to 69 Years | 68 (12.1%) | 102 (13.7%) |
| 70 to 74 Years | 5 (0.9%) | 17 (2.3%) |
| 75 to 79 Years | 8 (1.4%) | 5 (0.7%) |
| 80 to 84 Years | 24 (4.3%) | 11 (1.5%) |
| 85 Years and over | 11 (2.0%) | 31 (4.2%) |
| Total | 561 (100.0%) | 746 (100.0%) |
Families and Households in Plattsburgh West
Median Family Size in Plattsburgh West
The median family size in Plattsburgh West is 2.51 persons per family, with married-couple families (224 | 64.0%) accounting for the largest median family size of 2.72 persons per family. On the other hand, single male/father families (19 | 5.4%) represent the smallest median family size with 1.84 persons per family.
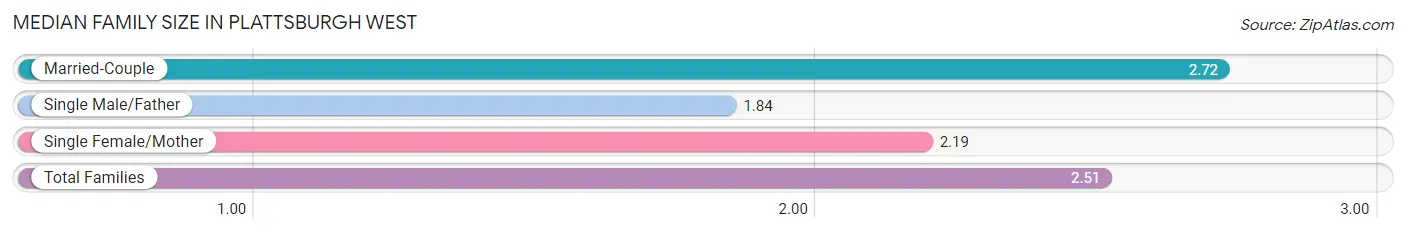
| Family Type | # Families | Family Size |
| Married-Couple | 224 (64.0%) | 2.72 |
| Single Male/Father | 19 (5.4%) | 1.84 |
| Single Female/Mother | 107 (30.6%) | 2.19 |
| Total Families | 350 (100.0%) | 2.51 |
Median Household Size in Plattsburgh West
The median household size in Plattsburgh West is 2.16 persons per household, with single female/mother households (107 | 17.9%) accounting for the largest median household size of 3.3 persons per household. non-family households (246 | 41.3%) represent the smallest median household size with 1.19 persons per household.
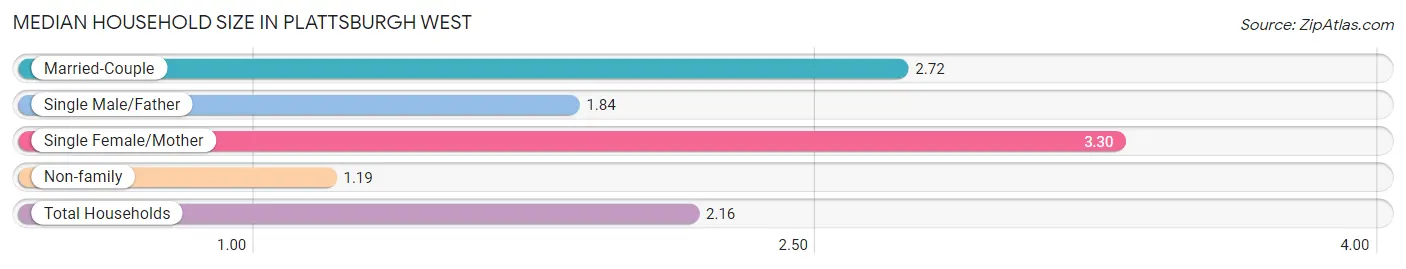
| Household Type | # Households | Household Size |
| Married-Couple | 224 (37.6%) | 2.72 |
| Single Male/Father | 19 (3.2%) | 1.84 |
| Single Female/Mother | 107 (17.9%) | 3.30 |
| Non-family | 246 (41.3%) | 1.19 |
| Total Households | 596 (100.0%) | 2.16 |
Household Size by Marriage Status in Plattsburgh West
Out of a total of 596 households in Plattsburgh West, 350 (58.7%) are family households, while 246 (41.3%) are nonfamily households. The most numerous type of family households are 2-person households, comprising 170, and the most common type of nonfamily households are 1-person households, comprising 217.
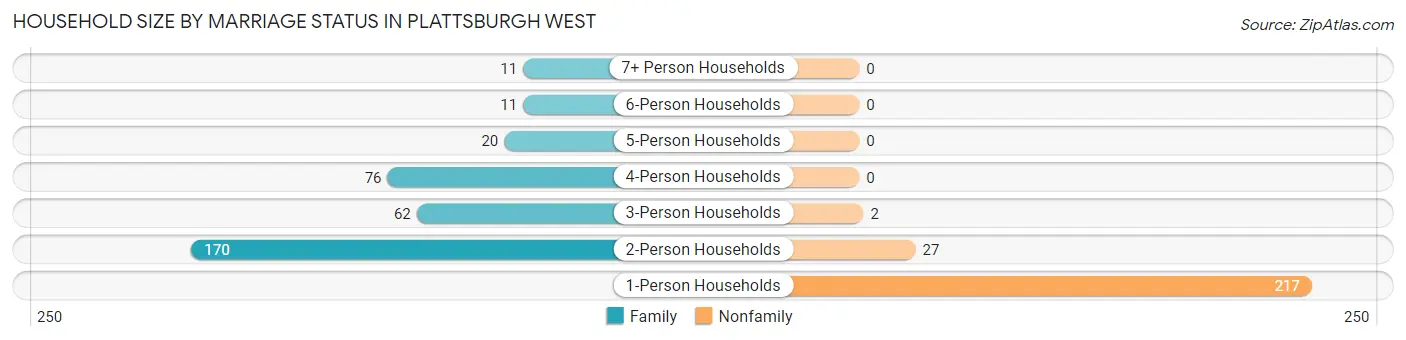
| Household Size | Family Households | Nonfamily Households |
| 1-Person Households | - | 217 (36.4%) |
| 2-Person Households | 170 (28.5%) | 27 (4.5%) |
| 3-Person Households | 62 (10.4%) | 2 (0.3%) |
| 4-Person Households | 76 (12.8%) | 0 (0.0%) |
| 5-Person Households | 20 (3.4%) | 0 (0.0%) |
| 6-Person Households | 11 (1.8%) | 0 (0.0%) |
| 7+ Person Households | 11 (1.8%) | 0 (0.0%) |
| Total | 350 (58.7%) | 246 (41.3%) |
Female Fertility in Plattsburgh West
Fertility by Age in Plattsburgh West
Average fertility rate in Plattsburgh West is 185.0 births per 1,000 women. Women in the age bracket of 20 to 34 years have the highest fertility rate with 328.0 births per 1,000 women. Women in the age bracket of 20 to 34 years acount for 83.3% of all women with births.
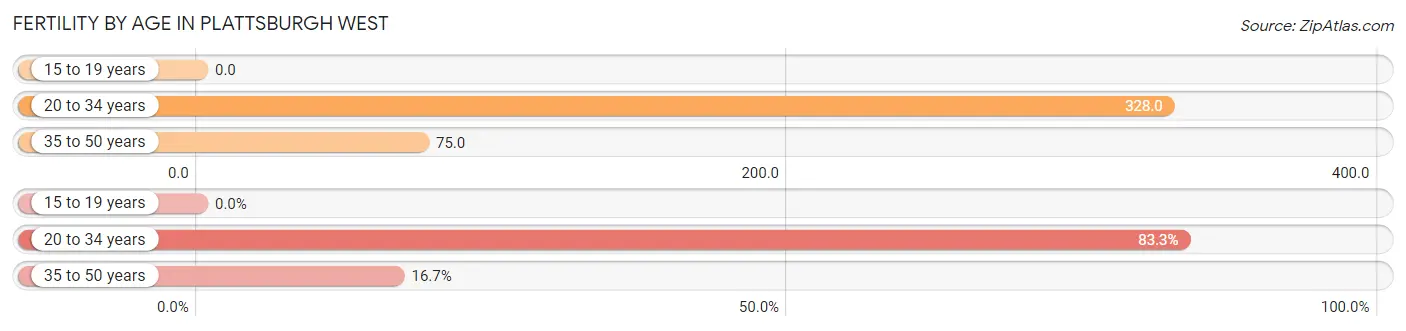
| Age Bracket | Women with Births | Births / 1,000 Women |
| 15 to 19 years | 0 (0.0%) | 0.0 |
| 20 to 34 years | 45 (83.3%) | 328.0 |
| 35 to 50 years | 9 (16.7%) | 75.0 |
| Total | 54 (100.0%) | 185.0 |
Fertility by Age by Marriage Status in Plattsburgh West
16.7% of women with births (54) in Plattsburgh West are married. The highest percentage of unmarried women with births falls into 20 to 34 years age bracket with 100.0% of them unmarried at the time of birth, while the lowest percentage of unmarried women with births belong to 35 to 50 years age bracket with 0.0% of them unmarried.
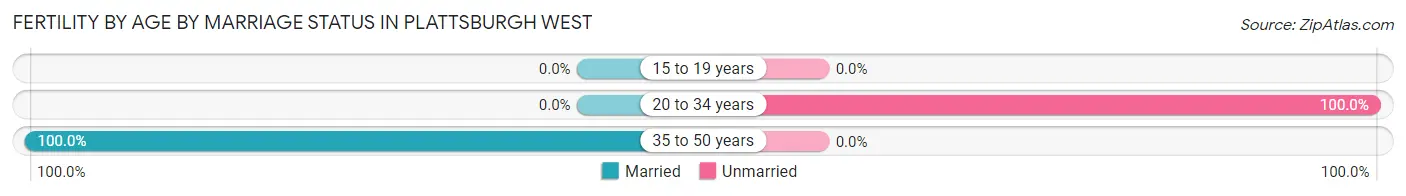
| Age Bracket | Married | Unmarried |
| 15 to 19 years | 0 (0.0%) | 0 (0.0%) |
| 20 to 34 years | 0 (0.0%) | 45 (100.0%) |
| 35 to 50 years | 9 (100.0%) | 0 (0.0%) |
| Total | 9 (16.7%) | 45 (83.3%) |
Fertility by Education in Plattsburgh West
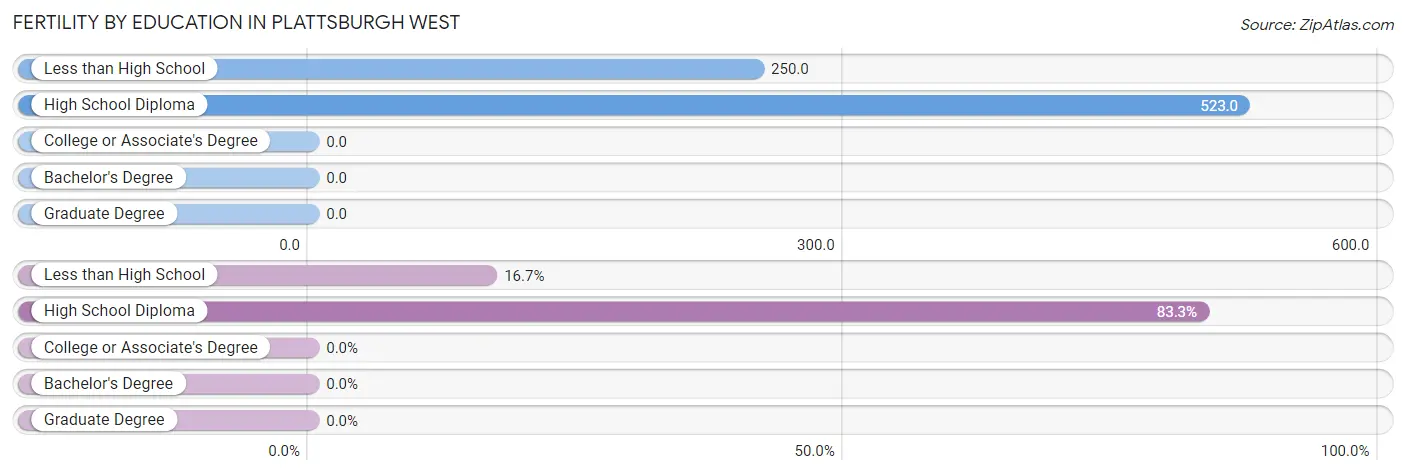
| Educational Attainment | Women with Births | Births / 1,000 Women |
| Less than High School | 9 (16.7%) | 250.0 |
| High School Diploma | 45 (83.3%) | 523.0 |
| College or Associate's Degree | 0 (0.0%) | 0.0 |
| Bachelor's Degree | 0 (0.0%) | 0.0 |
| Graduate Degree | 0 (0.0%) | 0.0 |
| Total | 54 (100.0%) | 185.0 |
Fertility by Education by Marriage Status in Plattsburgh West
83.3% of women with births in Plattsburgh West are unmarried. Women with the educational attainment of less than high school are most likely to be married with 100.0% of them married at childbirth, while women with the educational attainment of high school diploma are least likely to be married with 100.0% of them unmarried at childbirth.
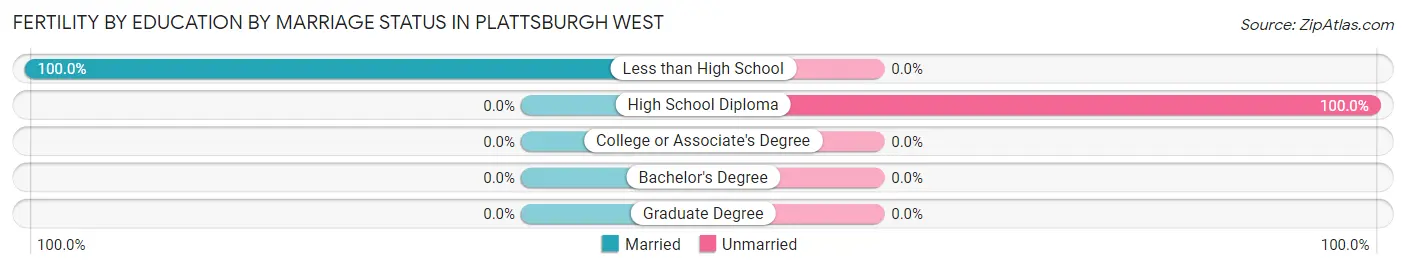
| Educational Attainment | Married | Unmarried |
| Less than High School | 9 (100.0%) | 0 (0.0%) |
| High School Diploma | 0 (0.0%) | 45 (100.0%) |
| College or Associate's Degree | 0 (0.0%) | 0 (0.0%) |
| Bachelor's Degree | 0 (0.0%) | 0 (0.0%) |
| Graduate Degree | 0 (0.0%) | 0 (0.0%) |
| Total | 9 (16.7%) | 45 (83.3%) |
Employment Characteristics in Plattsburgh West
Employment by Class of Employer in Plattsburgh West
Among the 537 employed individuals in Plattsburgh West, private company employees (448 | 83.4%), local government employees (33 | 6.1%), and not-for-profit organizations (25 | 4.7%) make up the most common classes of employment.
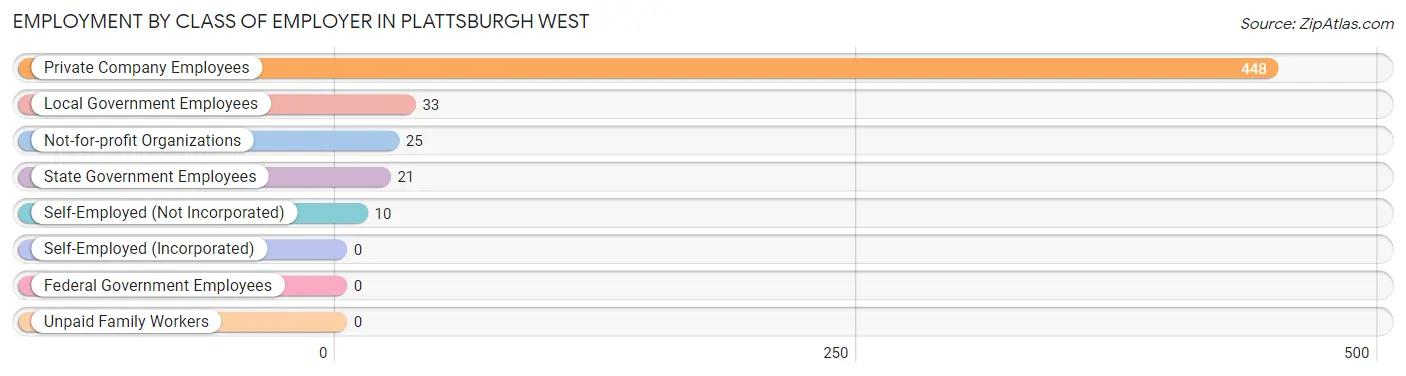
| Employer Class | # Employees | % Employees |
| Private Company Employees | 448 | 83.4% |
| Self-Employed (Incorporated) | 0 | 0.0% |
| Self-Employed (Not Incorporated) | 10 | 1.9% |
| Not-for-profit Organizations | 25 | 4.7% |
| Local Government Employees | 33 | 6.1% |
| State Government Employees | 21 | 3.9% |
| Federal Government Employees | 0 | 0.0% |
| Unpaid Family Workers | 0 | 0.0% |
| Total | 537 | 100.0% |
Employment Status by Age in Plattsburgh West
According to the labor force statistics for Plattsburgh West, out of the total population over 16 years of age (1,078), 57.4% or 619 individuals are in the labor force, with 13.2% or 82 of them unemployed. The age group with the highest labor force participation rate is 25 to 29 years, with 100.0% or 47 individuals in the labor force. Within the labor force, the 20 to 24 years age range has the highest percentage of unemployed individuals, with 30.0% or 45 of them being unemployed.
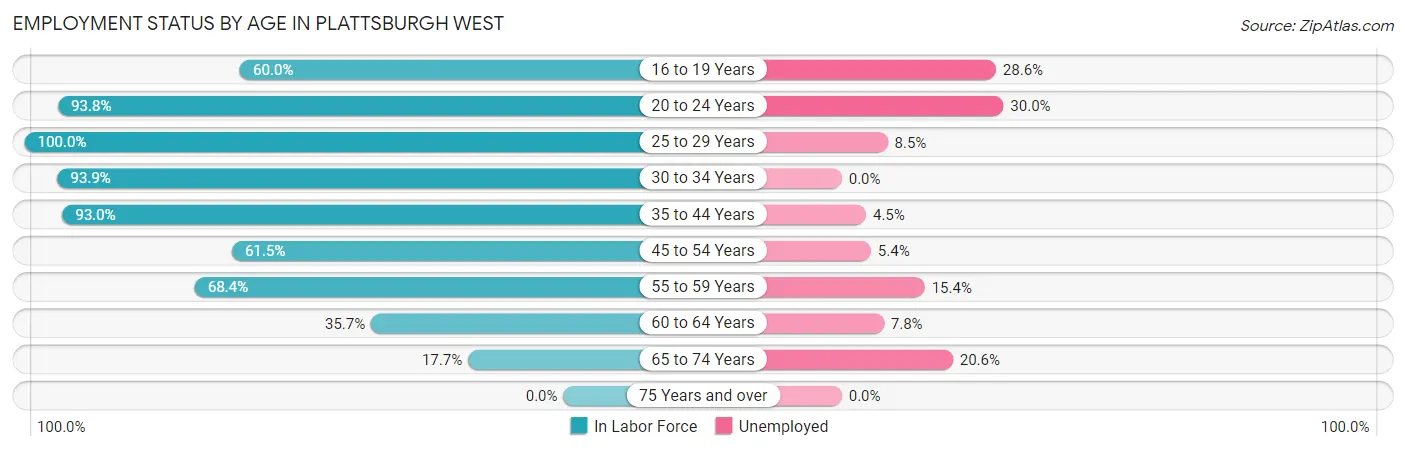
| Age Bracket | In Labor Force | Unemployed |
| 16 to 19 Years | 21 (60.0%) | 6 (28.6%) |
| 20 to 24 Years | 150 (93.8%) | 45 (30.0%) |
| 25 to 29 Years | 47 (100.0%) | 4 (8.5%) |
| 30 to 34 Years | 46 (93.9%) | 0 (0.0%) |
| 35 to 44 Years | 132 (93.0%) | 6 (4.5%) |
| 45 to 54 Years | 112 (61.5%) | 6 (5.4%) |
| 55 to 59 Years | 26 (68.4%) | 4 (15.4%) |
| 60 to 64 Years | 51 (35.7%) | 4 (7.8%) |
| 65 to 74 Years | 34 (17.7%) | 7 (20.6%) |
| 75 Years and over | 0 (0.0%) | 0 (0.0%) |
| Total | 619 (57.4%) | 82 (13.2%) |
Employment Status by Educational Attainment in Plattsburgh West
According to labor force statistics for Plattsburgh West, 68.9% of individuals (414) out of the total population between 25 and 64 years of age (601) are in the labor force, with 5.8% or 24 of them being unemployed. The group with the highest labor force participation rate are those with the educational attainment of college / associate degree, with 85.9% or 164 individuals in the labor force. Within the labor force, individuals with bachelor's degree or higher education have the highest percentage of unemployment, with 10.5% or 4 of them being unemployed.
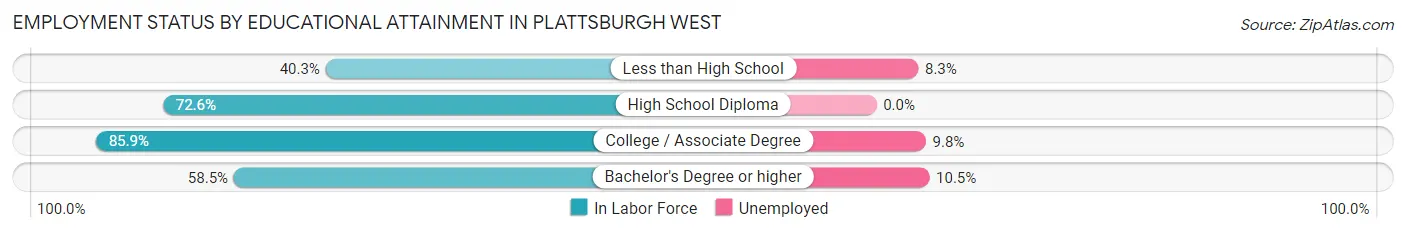
| Educational Attainment | In Labor Force | Unemployed |
| Less than High School | 48 (40.3%) | 10 (8.3%) |
| High School Diploma | 164 (72.6%) | 0 (0.0%) |
| College / Associate Degree | 164 (85.9%) | 19 (9.8%) |
| Bachelor's Degree or higher | 38 (58.5%) | 7 (10.5%) |
| Total | 414 (68.9%) | 35 (5.8%) |
Employment Occupations by Sex in Plattsburgh West
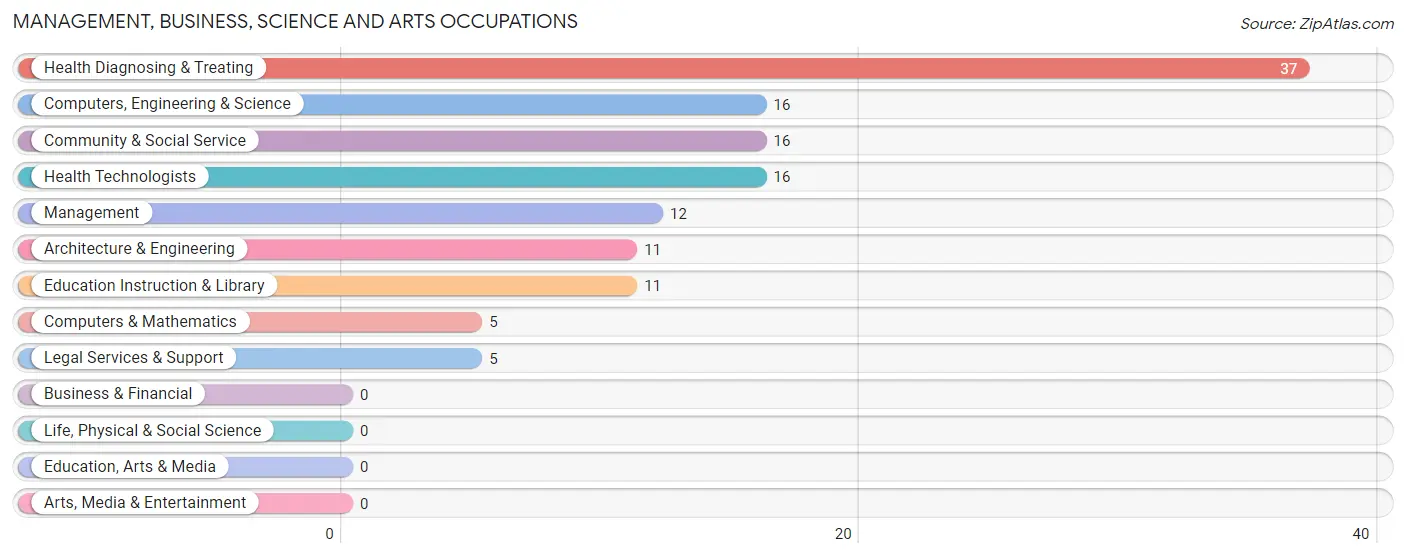
Management, Business, Science and Arts Occupations
The most common Management, Business, Science and Arts occupations in Plattsburgh West are Health Diagnosing & Treating (37 | 6.9%), Computers, Engineering & Science (16 | 3.0%), Community & Social Service (16 | 3.0%), Health Technologists (16 | 3.0%), and Management (12 | 2.2%).
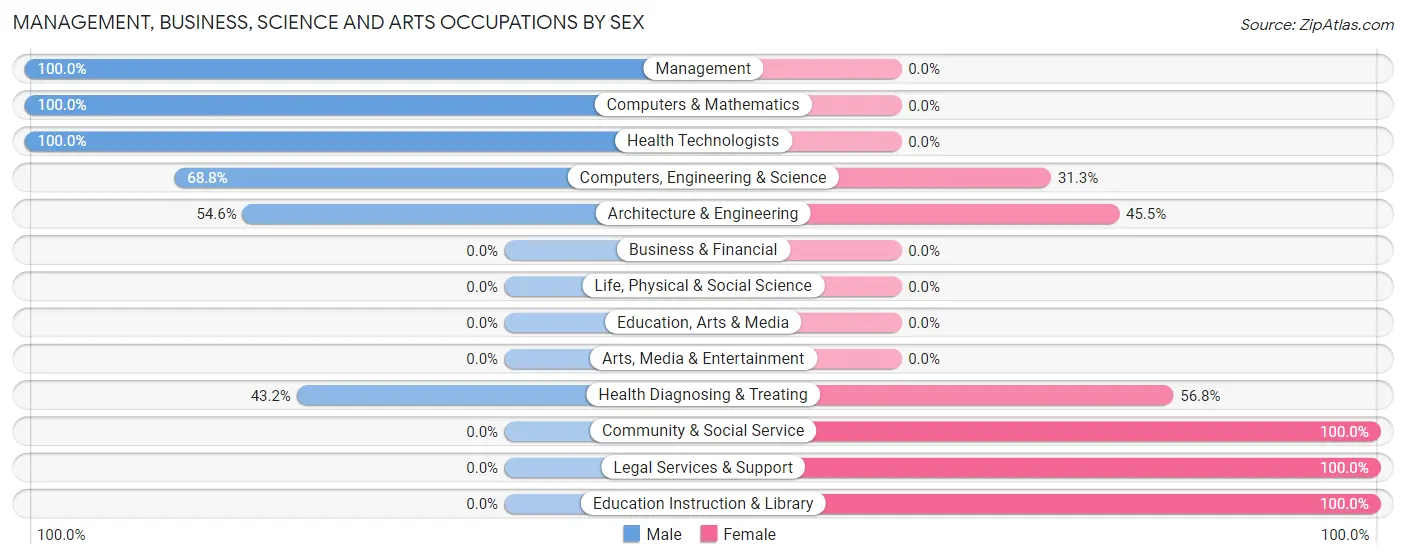
Management, Business, Science and Arts Occupations by Sex
Within the Management, Business, Science and Arts occupations in Plattsburgh West, the most male-oriented occupations are Management (100.0%), Computers & Mathematics (100.0%), and Health Technologists (100.0%), while the most female-oriented occupations are Community & Social Service (100.0%), Legal Services & Support (100.0%), and Education Instruction & Library (100.0%).
| Occupation | Male | Female |
| Management | 12 (100.0%) | 0 (0.0%) |
| Business & Financial | 0 (0.0%) | 0 (0.0%) |
| Computers, Engineering & Science | 11 (68.8%) | 5 (31.2%) |
| Computers & Mathematics | 5 (100.0%) | 0 (0.0%) |
| Architecture & Engineering | 6 (54.5%) | 5 (45.5%) |
| Life, Physical & Social Science | 0 (0.0%) | 0 (0.0%) |
| Community & Social Service | 0 (0.0%) | 16 (100.0%) |
| Education, Arts & Media | 0 (0.0%) | 0 (0.0%) |
| Legal Services & Support | 0 (0.0%) | 5 (100.0%) |
| Education Instruction & Library | 0 (0.0%) | 11 (100.0%) |
| Arts, Media & Entertainment | 0 (0.0%) | 0 (0.0%) |
| Health Diagnosing & Treating | 16 (43.2%) | 21 (56.8%) |
| Health Technologists | 16 (100.0%) | 0 (0.0%) |
| Total (Category) | 39 (48.1%) | 42 (51.8%) |
| Total (Overall) | 280 (52.1%) | 257 (47.9%) |
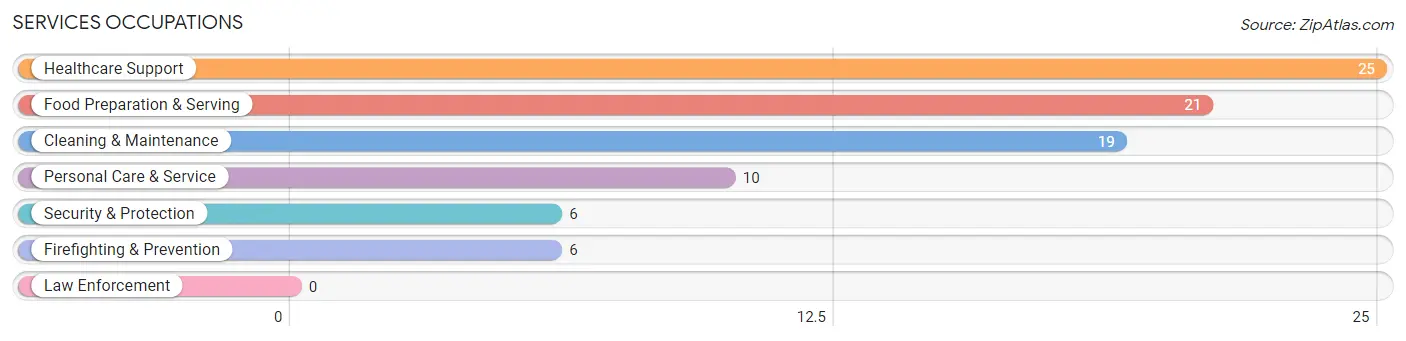
Services Occupations
The most common Services occupations in Plattsburgh West are Healthcare Support (25 | 4.7%), Food Preparation & Serving (21 | 3.9%), Cleaning & Maintenance (19 | 3.5%), Personal Care & Service (10 | 1.9%), and Security & Protection (6 | 1.1%).
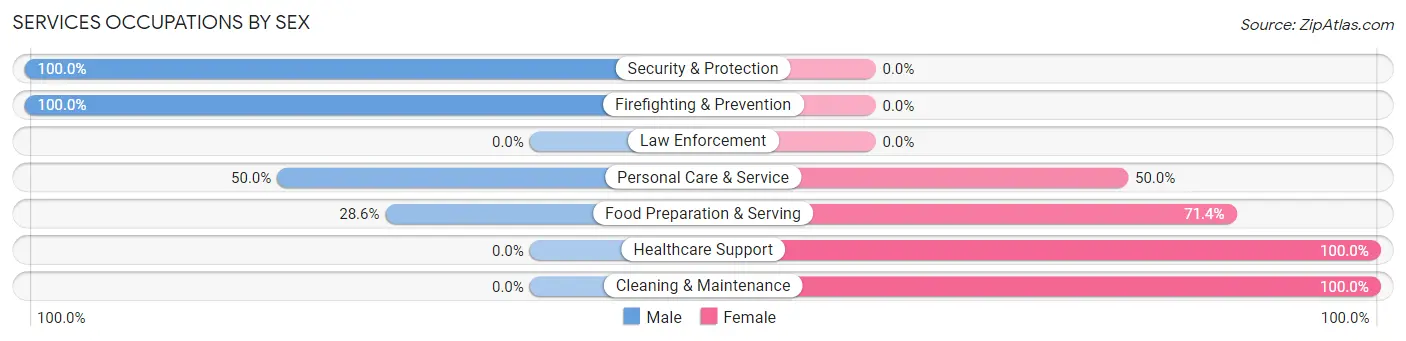
Services Occupations by Sex
Within the Services occupations in Plattsburgh West, the most male-oriented occupations are Security & Protection (100.0%), Firefighting & Prevention (100.0%), and Personal Care & Service (50.0%), while the most female-oriented occupations are Healthcare Support (100.0%), Cleaning & Maintenance (100.0%), and Food Preparation & Serving (71.4%).
| Occupation | Male | Female |
| Healthcare Support | 0 (0.0%) | 25 (100.0%) |
| Security & Protection | 6 (100.0%) | 0 (0.0%) |
| Firefighting & Prevention | 6 (100.0%) | 0 (0.0%) |
| Law Enforcement | 0 (0.0%) | 0 (0.0%) |
| Food Preparation & Serving | 6 (28.6%) | 15 (71.4%) |
| Cleaning & Maintenance | 0 (0.0%) | 19 (100.0%) |
| Personal Care & Service | 5 (50.0%) | 5 (50.0%) |
| Total (Category) | 17 (21.0%) | 64 (79.0%) |
| Total (Overall) | 280 (52.1%) | 257 (47.9%) |
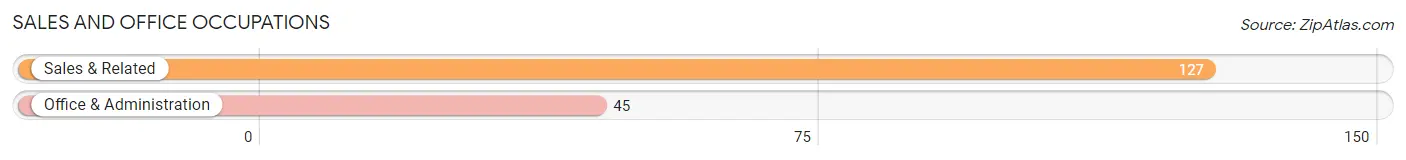
Sales and Office Occupations
The most common Sales and Office occupations in Plattsburgh West are Sales & Related (127 | 23.6%), and Office & Administration (45 | 8.4%).
Sales and Office Occupations by Sex
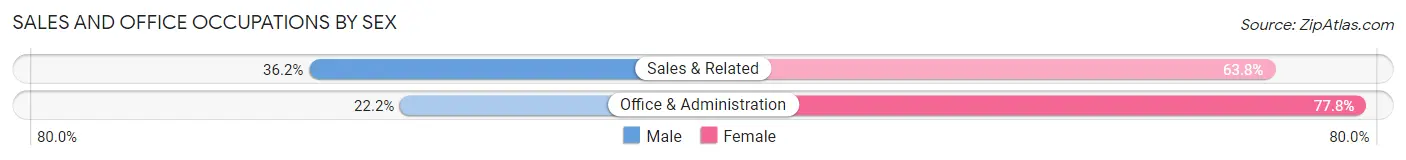
| Occupation | Male | Female |
| Sales & Related | 46 (36.2%) | 81 (63.8%) |
| Office & Administration | 10 (22.2%) | 35 (77.8%) |
| Total (Category) | 56 (32.6%) | 116 (67.4%) |
| Total (Overall) | 280 (52.1%) | 257 (47.9%) |
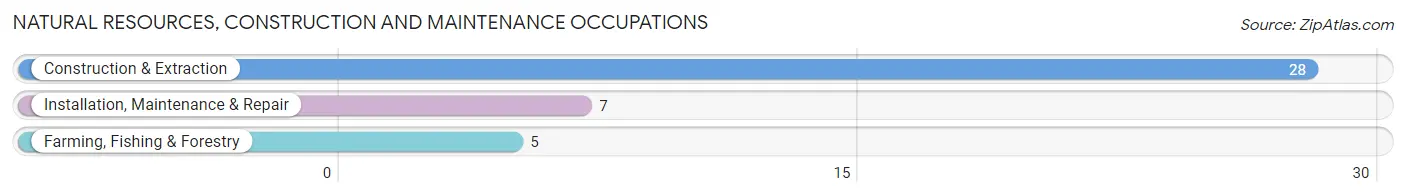
Natural Resources, Construction and Maintenance Occupations
The most common Natural Resources, Construction and Maintenance occupations in Plattsburgh West are Construction & Extraction (28 | 5.2%), Installation, Maintenance & Repair (7 | 1.3%), and Farming, Fishing & Forestry (5 | 0.9%).
Natural Resources, Construction and Maintenance Occupations by Sex
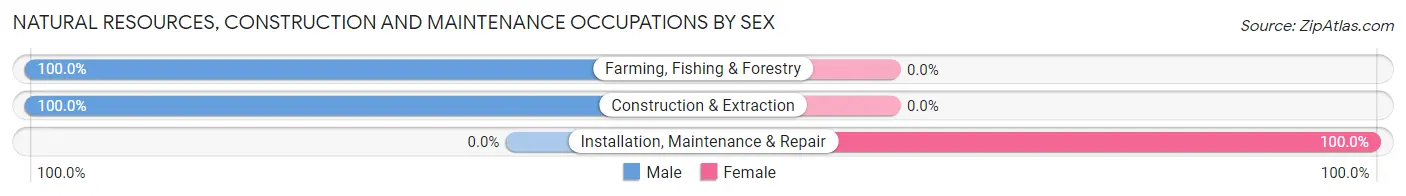
| Occupation | Male | Female |
| Farming, Fishing & Forestry | 5 (100.0%) | 0 (0.0%) |
| Construction & Extraction | 28 (100.0%) | 0 (0.0%) |
| Installation, Maintenance & Repair | 0 (0.0%) | 7 (100.0%) |
| Total (Category) | 33 (82.5%) | 7 (17.5%) |
| Total (Overall) | 280 (52.1%) | 257 (47.9%) |
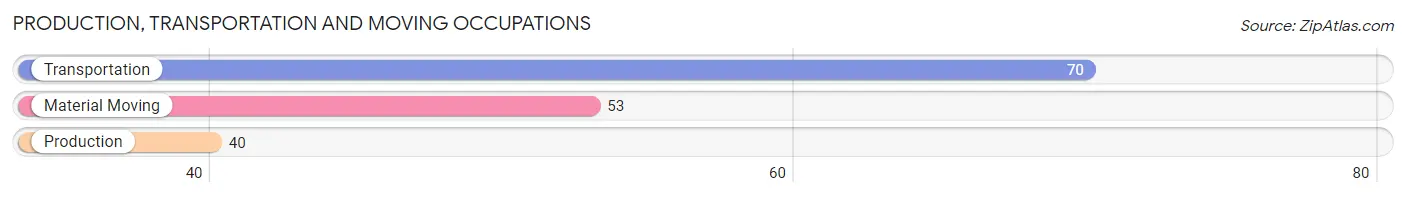
Production, Transportation and Moving Occupations
The most common Production, Transportation and Moving occupations in Plattsburgh West are Transportation (70 | 13.0%), Material Moving (53 | 9.9%), and Production (40 | 7.4%).
Production, Transportation and Moving Occupations by Sex
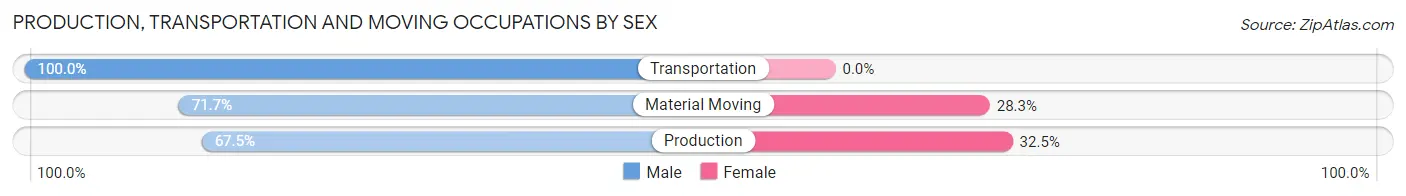
| Occupation | Male | Female |
| Production | 27 (67.5%) | 13 (32.5%) |
| Transportation | 70 (100.0%) | 0 (0.0%) |
| Material Moving | 38 (71.7%) | 15 (28.3%) |
| Total (Category) | 135 (82.8%) | 28 (17.2%) |
| Total (Overall) | 280 (52.1%) | 257 (47.9%) |
Employment Industries by Sex in Plattsburgh West
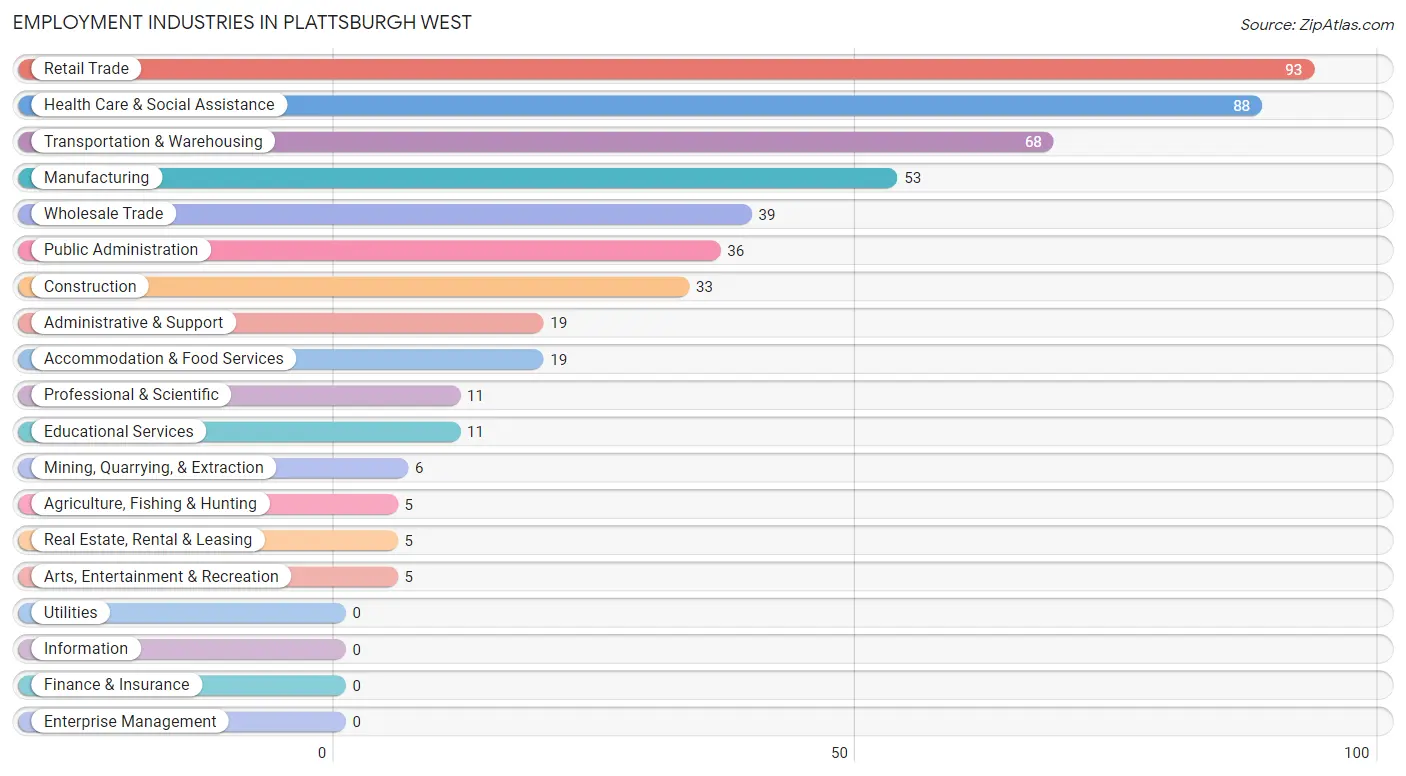
Employment Industries in Plattsburgh West
The major employment industries in Plattsburgh West include Retail Trade (93 | 17.3%), Health Care & Social Assistance (88 | 16.4%), Transportation & Warehousing (68 | 12.7%), Manufacturing (53 | 9.9%), and Wholesale Trade (39 | 7.3%).
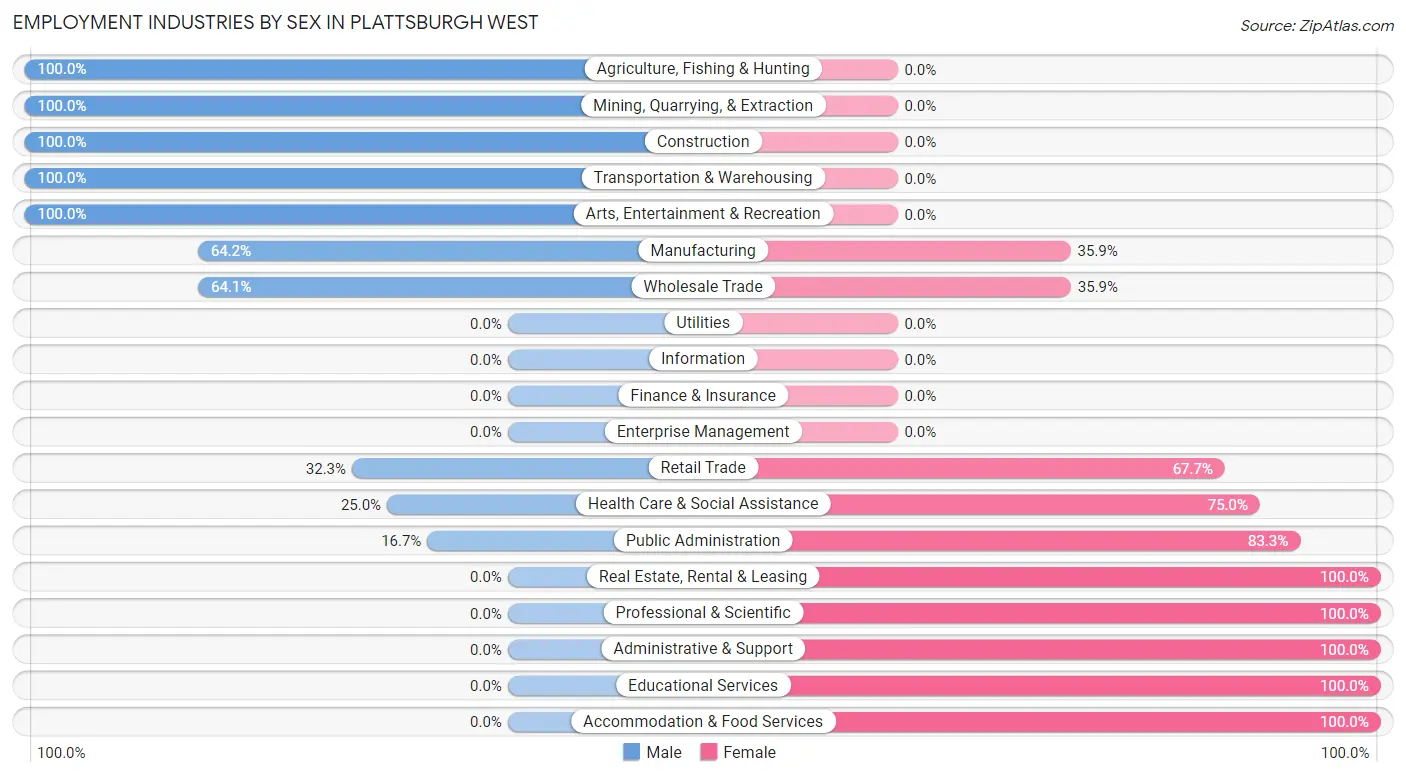
Employment Industries by Sex in Plattsburgh West
The Plattsburgh West industries that see more men than women are Agriculture, Fishing & Hunting (100.0%), Mining, Quarrying, & Extraction (100.0%), and Construction (100.0%), whereas the industries that tend to have a higher number of women are Real Estate, Rental & Leasing (100.0%), Professional & Scientific (100.0%), and Administrative & Support (100.0%).
| Industry | Male | Female |
| Agriculture, Fishing & Hunting | 5 (100.0%) | 0 (0.0%) |
| Mining, Quarrying, & Extraction | 6 (100.0%) | 0 (0.0%) |
| Construction | 33 (100.0%) | 0 (0.0%) |
| Manufacturing | 34 (64.1%) | 19 (35.8%) |
| Wholesale Trade | 25 (64.1%) | 14 (35.9%) |
| Retail Trade | 30 (32.3%) | 63 (67.7%) |
| Transportation & Warehousing | 68 (100.0%) | 0 (0.0%) |
| Utilities | 0 (0.0%) | 0 (0.0%) |
| Information | 0 (0.0%) | 0 (0.0%) |
| Finance & Insurance | 0 (0.0%) | 0 (0.0%) |
| Real Estate, Rental & Leasing | 0 (0.0%) | 5 (100.0%) |
| Professional & Scientific | 0 (0.0%) | 11 (100.0%) |
| Enterprise Management | 0 (0.0%) | 0 (0.0%) |
| Administrative & Support | 0 (0.0%) | 19 (100.0%) |
| Educational Services | 0 (0.0%) | 11 (100.0%) |
| Health Care & Social Assistance | 22 (25.0%) | 66 (75.0%) |
| Arts, Entertainment & Recreation | 5 (100.0%) | 0 (0.0%) |
| Accommodation & Food Services | 0 (0.0%) | 19 (100.0%) |
| Public Administration | 6 (16.7%) | 30 (83.3%) |
| Total | 280 (52.1%) | 257 (47.9%) |
Education in Plattsburgh West
School Enrollment in Plattsburgh West
The most common levels of schooling among the 248 students in Plattsburgh West are elementary school (69 | 27.8%), college / undergraduate (69 | 27.8%), and middle school (58 | 23.4%).
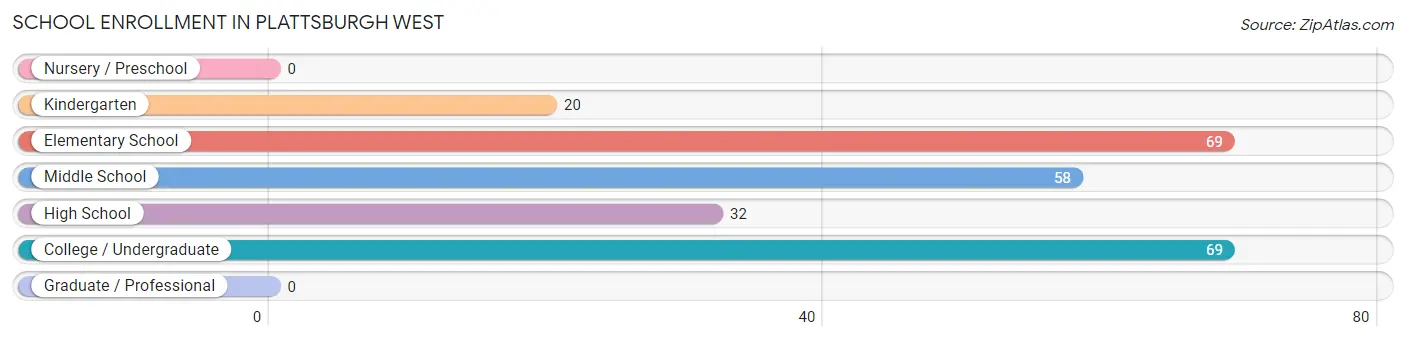
| School Level | # Students | % Students |
| Nursery / Preschool | 0 | 0.0% |
| Kindergarten | 20 | 8.1% |
| Elementary School | 69 | 27.8% |
| Middle School | 58 | 23.4% |
| High School | 32 | 12.9% |
| College / Undergraduate | 69 | 27.8% |
| Graduate / Professional | 0 | 0.0% |
| Total | 248 | 100.0% |
School Enrollment by Age by Funding Source in Plattsburgh West
Out of a total of 248 students who are enrolled in schools in Plattsburgh West, 5 (2.0%) attend a private institution, while the remaining 243 (98.0%) are enrolled in public schools. The age group of 35 years and over has the highest likelihood of being enrolled in private schools, with 5 (100.0% in the age bracket) enrolled. Conversely, the age group of 5 to 9 year old has the lowest likelihood of being enrolled in a private school, with 89 (100.0% in the age bracket) attending a public institution.
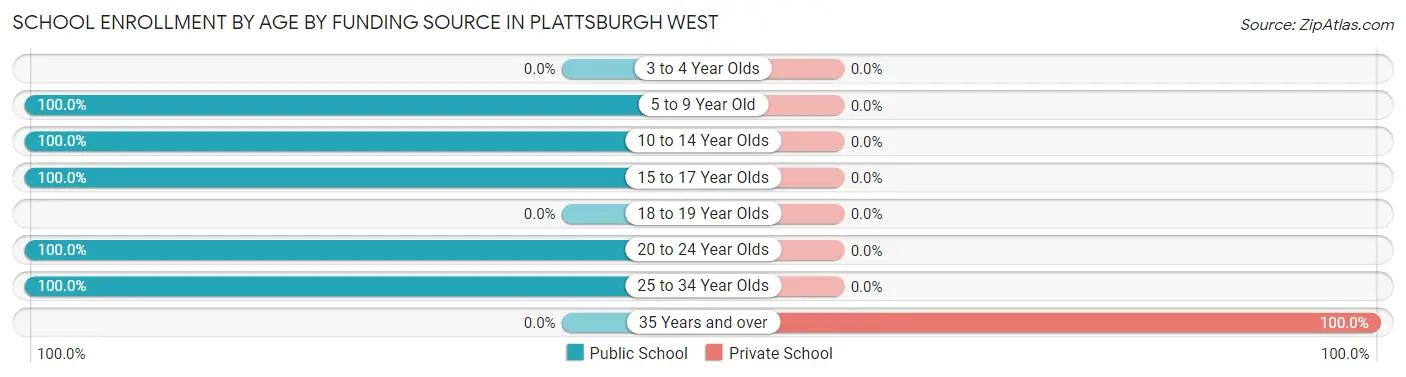
| Age Bracket | Public School | Private School |
| 3 to 4 Year Olds | 0 (0.0%) | 0 (0.0%) |
| 5 to 9 Year Old | 89 (100.0%) | 0 (0.0%) |
| 10 to 14 Year Olds | 58 (100.0%) | 0 (0.0%) |
| 15 to 17 Year Olds | 32 (100.0%) | 0 (0.0%) |
| 18 to 19 Year Olds | 0 (0.0%) | 0 (0.0%) |
| 20 to 24 Year Olds | 40 (100.0%) | 0 (0.0%) |
| 25 to 34 Year Olds | 24 (100.0%) | 0 (0.0%) |
| 35 Years and over | 0 (0.0%) | 5 (100.0%) |
| Total | 243 (98.0%) | 5 (2.0%) |
Educational Attainment by Field of Study in Plattsburgh West
Education (24 | 24.0%), liberal arts & history (17 | 17.0%), psychology (14 | 14.0%), social sciences (13 | 13.0%), and arts & humanities (11 | 11.0%) are the most common fields of study among 100 individuals in Plattsburgh West who have obtained a bachelor's degree or higher.
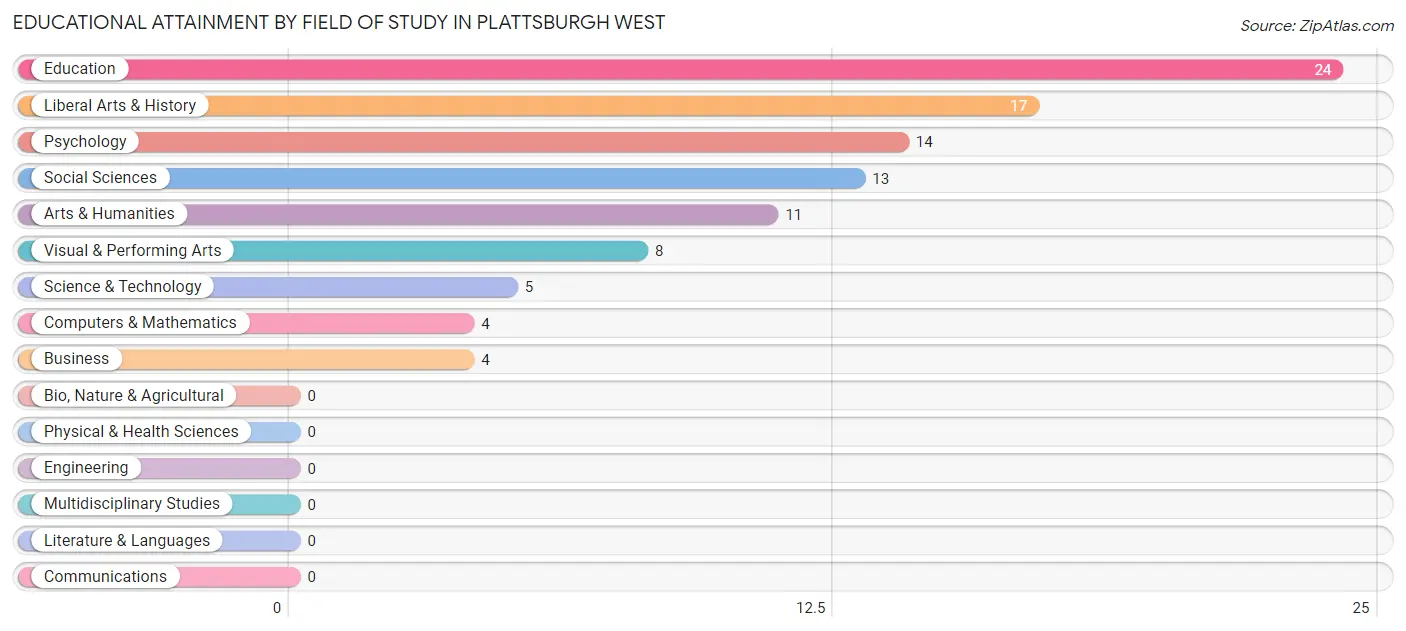
| Field of Study | # Graduates | % Graduates |
| Computers & Mathematics | 4 | 4.0% |
| Bio, Nature & Agricultural | 0 | 0.0% |
| Physical & Health Sciences | 0 | 0.0% |
| Psychology | 14 | 14.0% |
| Social Sciences | 13 | 13.0% |
| Engineering | 0 | 0.0% |
| Multidisciplinary Studies | 0 | 0.0% |
| Science & Technology | 5 | 5.0% |
| Business | 4 | 4.0% |
| Education | 24 | 24.0% |
| Literature & Languages | 0 | 0.0% |
| Liberal Arts & History | 17 | 17.0% |
| Visual & Performing Arts | 8 | 8.0% |
| Communications | 0 | 0.0% |
| Arts & Humanities | 11 | 11.0% |
| Total | 100 | 100.0% |
Transportation & Commute in Plattsburgh West
Vehicle Availability by Sex in Plattsburgh West
The most prevalent vehicle ownership categories in Plattsburgh West are males with 2 vehicles (121, accounting for 43.2%) and females with 2 vehicles (116, making up 47.1%).
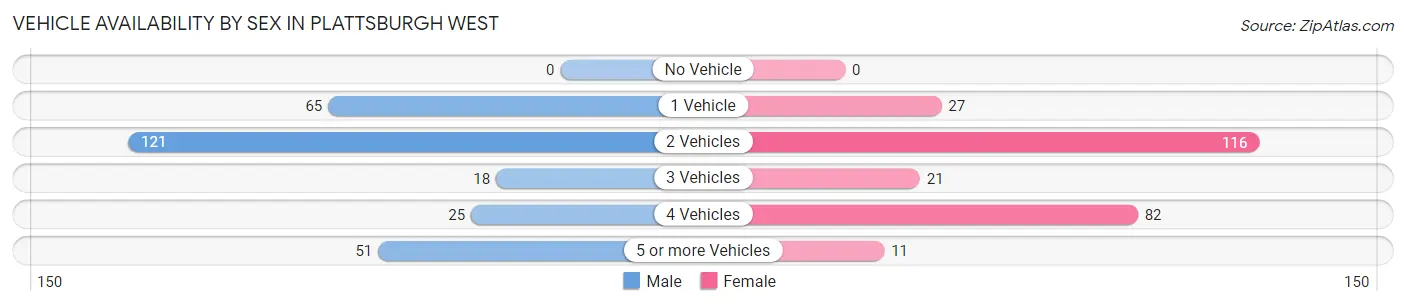
| Vehicles Available | Male | Female |
| No Vehicle | 0 (0.0%) | 0 (0.0%) |
| 1 Vehicle | 65 (23.2%) | 27 (10.5%) |
| 2 Vehicles | 121 (43.2%) | 116 (45.1%) |
| 3 Vehicles | 18 (6.4%) | 21 (8.2%) |
| 4 Vehicles | 25 (8.9%) | 82 (31.9%) |
| 5 or more Vehicles | 51 (18.2%) | 11 (4.3%) |
| Total | 280 (100.0%) | 257 (100.0%) |
Commute Time in Plattsburgh West
The most frequently occuring commute durations in Plattsburgh West are 5 to 9 minutes (204 commuters, 38.7%), 10 to 14 minutes (143 commuters, 27.1%), and 15 to 19 minutes (42 commuters, 8.0%).
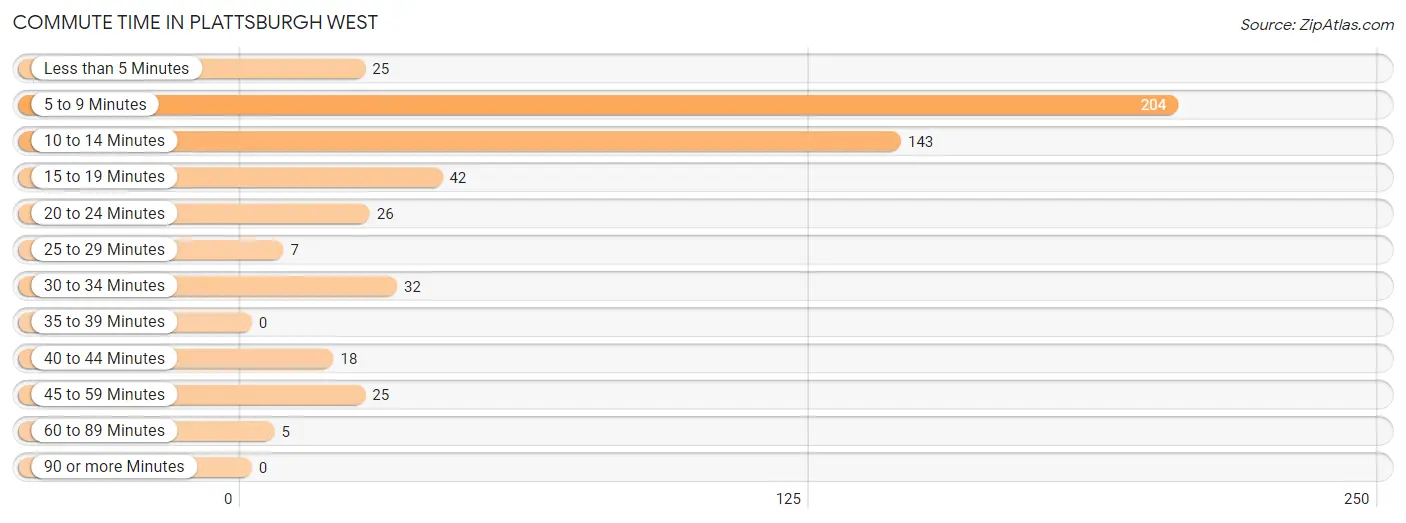
| Commute Time | # Commuters | % Commuters |
| Less than 5 Minutes | 25 | 4.7% |
| 5 to 9 Minutes | 204 | 38.7% |
| 10 to 14 Minutes | 143 | 27.1% |
| 15 to 19 Minutes | 42 | 8.0% |
| 20 to 24 Minutes | 26 | 4.9% |
| 25 to 29 Minutes | 7 | 1.3% |
| 30 to 34 Minutes | 32 | 6.1% |
| 35 to 39 Minutes | 0 | 0.0% |
| 40 to 44 Minutes | 18 | 3.4% |
| 45 to 59 Minutes | 25 | 4.7% |
| 60 to 89 Minutes | 5 | 0.9% |
| 90 or more Minutes | 0 | 0.0% |
Commute Time by Sex in Plattsburgh West
The most common commute times in Plattsburgh West are 5 to 9 minutes (77 commuters, 28.0%) for males and 5 to 9 minutes (127 commuters, 50.4%) for females.
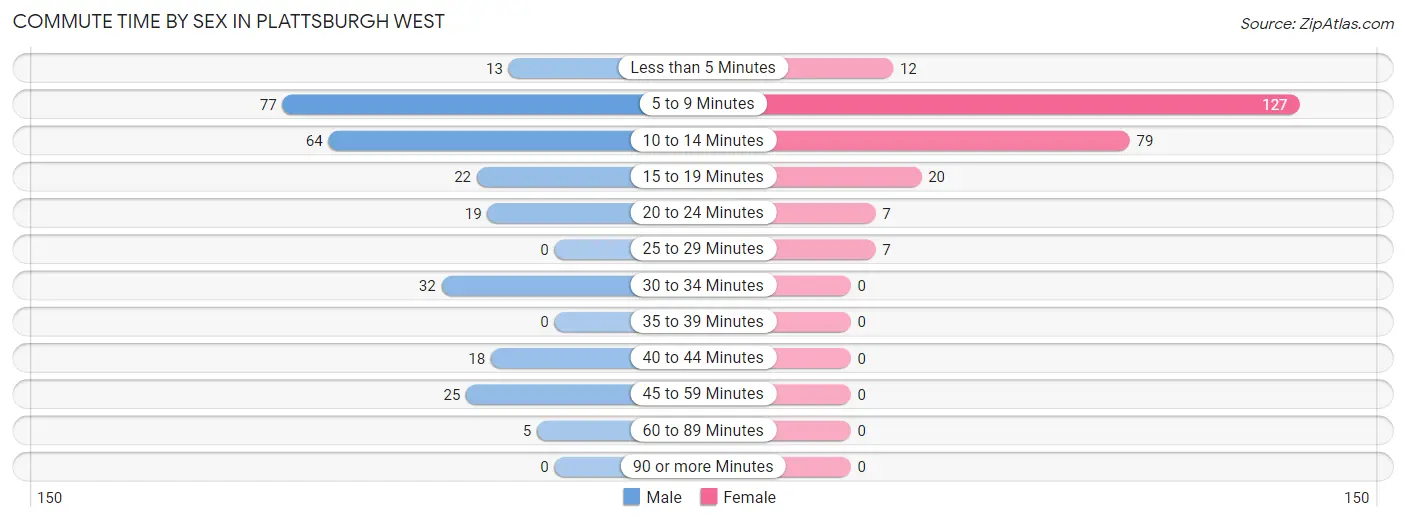
| Commute Time | Male | Female |
| Less than 5 Minutes | 13 (4.7%) | 12 (4.8%) |
| 5 to 9 Minutes | 77 (28.0%) | 127 (50.4%) |
| 10 to 14 Minutes | 64 (23.3%) | 79 (31.4%) |
| 15 to 19 Minutes | 22 (8.0%) | 20 (7.9%) |
| 20 to 24 Minutes | 19 (6.9%) | 7 (2.8%) |
| 25 to 29 Minutes | 0 (0.0%) | 7 (2.8%) |
| 30 to 34 Minutes | 32 (11.6%) | 0 (0.0%) |
| 35 to 39 Minutes | 0 (0.0%) | 0 (0.0%) |
| 40 to 44 Minutes | 18 (6.6%) | 0 (0.0%) |
| 45 to 59 Minutes | 25 (9.1%) | 0 (0.0%) |
| 60 to 89 Minutes | 5 (1.8%) | 0 (0.0%) |
| 90 or more Minutes | 0 (0.0%) | 0 (0.0%) |
Time of Departure to Work by Sex in Plattsburgh West
The most frequent times of departure to work in Plattsburgh West are 8:30 AM to 8:59 AM (42, 15.3%) for males and 12:00 PM to 3:59 PM (62, 24.6%) for females.
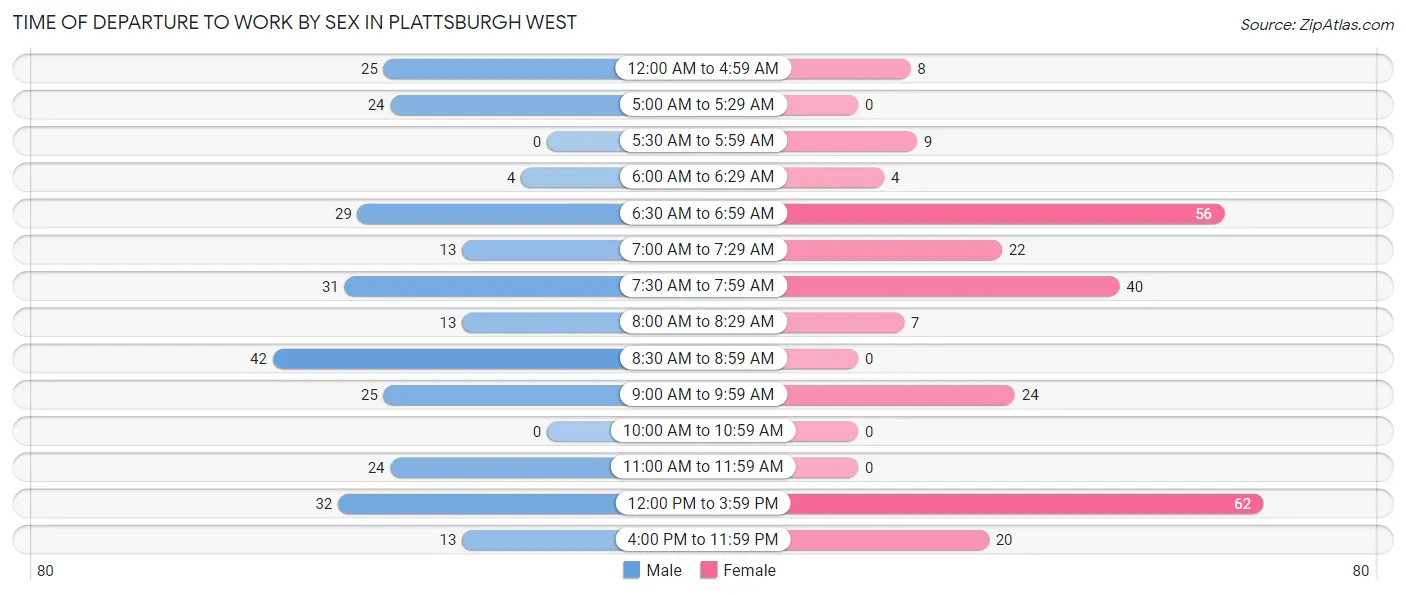
| Time of Departure | Male | Female |
| 12:00 AM to 4:59 AM | 25 (9.1%) | 8 (3.2%) |
| 5:00 AM to 5:29 AM | 24 (8.7%) | 0 (0.0%) |
| 5:30 AM to 5:59 AM | 0 (0.0%) | 9 (3.6%) |
| 6:00 AM to 6:29 AM | 4 (1.5%) | 4 (1.6%) |
| 6:30 AM to 6:59 AM | 29 (10.5%) | 56 (22.2%) |
| 7:00 AM to 7:29 AM | 13 (4.7%) | 22 (8.7%) |
| 7:30 AM to 7:59 AM | 31 (11.3%) | 40 (15.9%) |
| 8:00 AM to 8:29 AM | 13 (4.7%) | 7 (2.8%) |
| 8:30 AM to 8:59 AM | 42 (15.3%) | 0 (0.0%) |
| 9:00 AM to 9:59 AM | 25 (9.1%) | 24 (9.5%) |
| 10:00 AM to 10:59 AM | 0 (0.0%) | 0 (0.0%) |
| 11:00 AM to 11:59 AM | 24 (8.7%) | 0 (0.0%) |
| 12:00 PM to 3:59 PM | 32 (11.6%) | 62 (24.6%) |
| 4:00 PM to 11:59 PM | 13 (4.7%) | 20 (7.9%) |
| Total | 275 (100.0%) | 252 (100.0%) |
Housing Occupancy in Plattsburgh West
Occupancy by Ownership in Plattsburgh West
Of the total 596 dwellings in Plattsburgh West, owner-occupied units account for 357 (59.9%), while renter-occupied units make up 239 (40.1%).
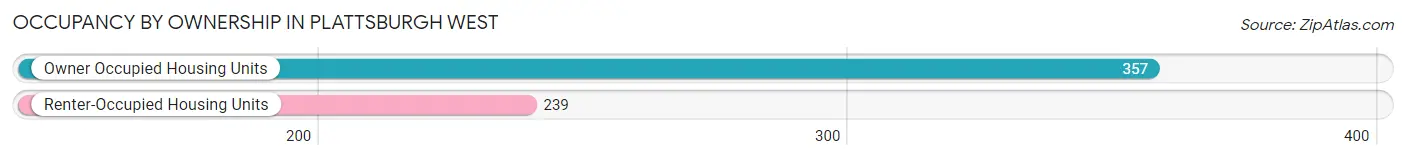
| Occupancy | # Housing Units | % Housing Units |
| Owner Occupied Housing Units | 357 | 59.9% |
| Renter-Occupied Housing Units | 239 | 40.1% |
| Total Occupied Housing Units | 596 | 100.0% |
Occupancy by Household Size in Plattsburgh West
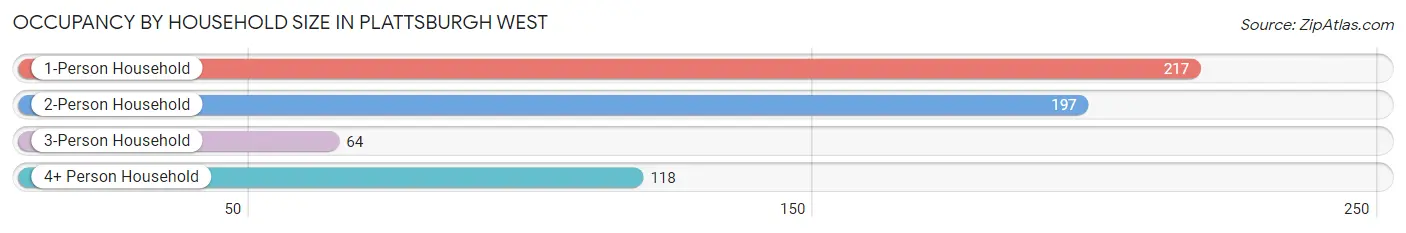
| Household Size | # Housing Units | % Housing Units |
| 1-Person Household | 217 | 36.4% |
| 2-Person Household | 197 | 33.1% |
| 3-Person Household | 64 | 10.7% |
| 4+ Person Household | 118 | 19.8% |
| Total Housing Units | 596 | 100.0% |
Occupancy by Ownership by Household Size in Plattsburgh West
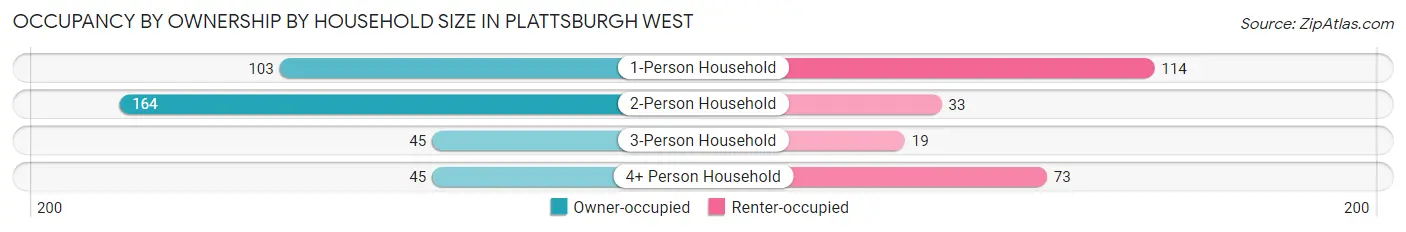
| Household Size | Owner-occupied | Renter-occupied |
| 1-Person Household | 103 (47.5%) | 114 (52.5%) |
| 2-Person Household | 164 (83.3%) | 33 (16.8%) |
| 3-Person Household | 45 (70.3%) | 19 (29.7%) |
| 4+ Person Household | 45 (38.1%) | 73 (61.9%) |
| Total Housing Units | 357 (59.9%) | 239 (40.1%) |
Occupancy by Educational Attainment in Plattsburgh West
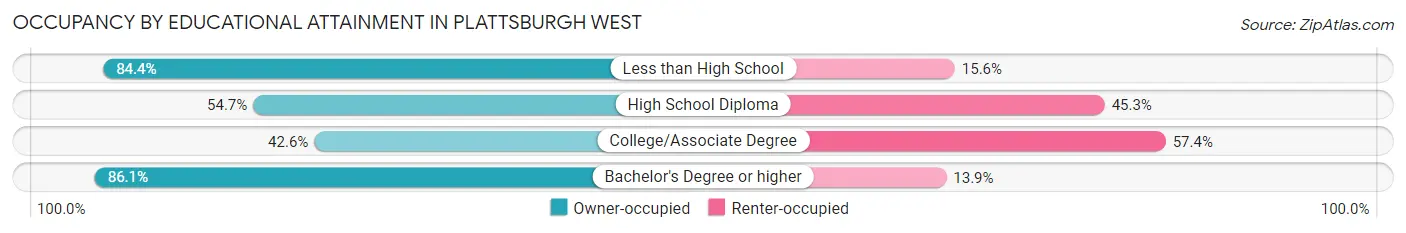
| Household Size | Owner-occupied | Renter-occupied |
| Less than High School | 92 (84.4%) | 17 (15.6%) |
| High School Diploma | 105 (54.7%) | 87 (45.3%) |
| College/Associate Degree | 92 (42.6%) | 124 (57.4%) |
| Bachelor's Degree or higher | 68 (86.1%) | 11 (13.9%) |
Occupancy by Age of Householder in Plattsburgh West
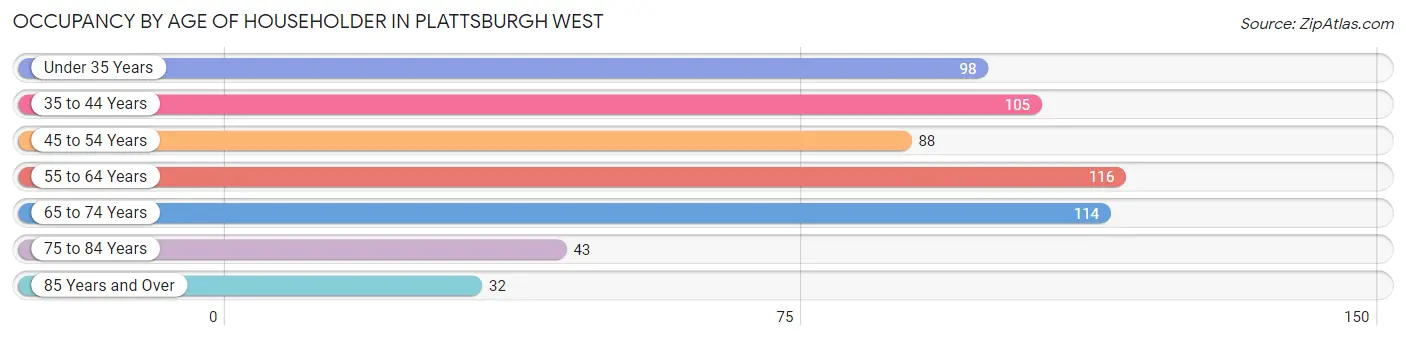
| Age Bracket | # Households | % Households |
| Under 35 Years | 98 | 16.4% |
| 35 to 44 Years | 105 | 17.6% |
| 45 to 54 Years | 88 | 14.8% |
| 55 to 64 Years | 116 | 19.5% |
| 65 to 74 Years | 114 | 19.1% |
| 75 to 84 Years | 43 | 7.2% |
| 85 Years and Over | 32 | 5.4% |
| Total | 596 | 100.0% |
Housing Finances in Plattsburgh West
Median Income by Occupancy in Plattsburgh West
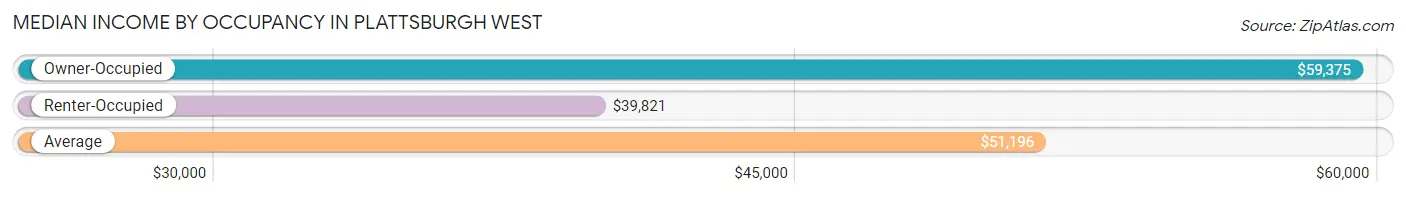
| Occupancy Type | # Households | Median Income |
| Owner-Occupied | 357 (59.9%) | $59,375 |
| Renter-Occupied | 239 (40.1%) | $39,821 |
| Average | 596 (100.0%) | $51,196 |
Occupancy by Householder Income Bracket in Plattsburgh West
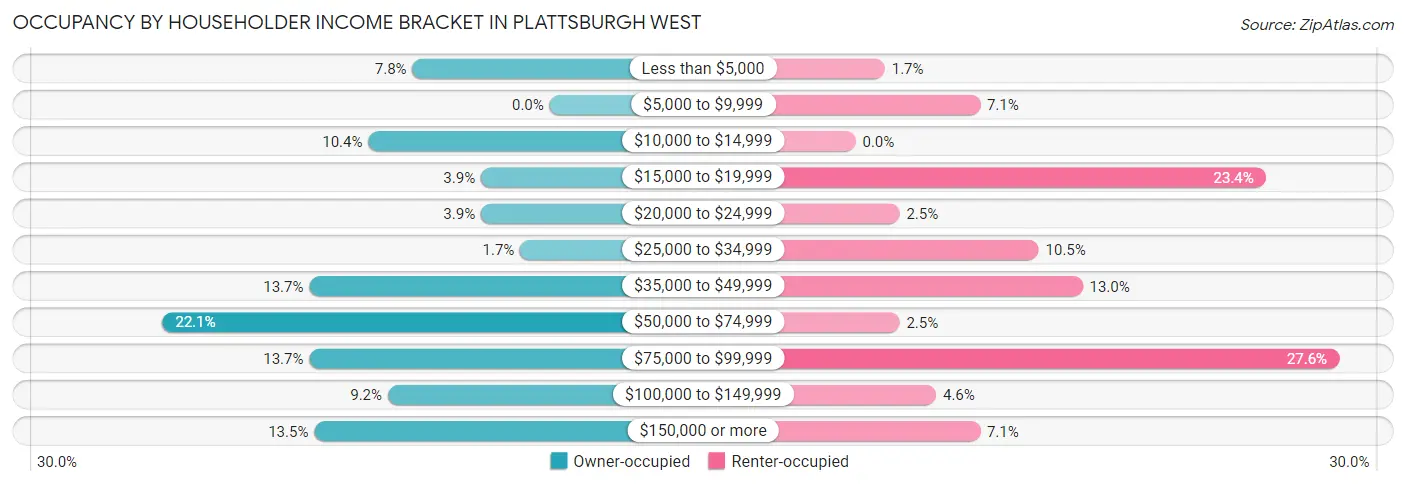
| Income Bracket | Owner-occupied | Renter-occupied |
| Less than $5,000 | 28 (7.8%) | 4 (1.7%) |
| $5,000 to $9,999 | 0 (0.0%) | 17 (7.1%) |
| $10,000 to $14,999 | 37 (10.4%) | 0 (0.0%) |
| $15,000 to $19,999 | 14 (3.9%) | 56 (23.4%) |
| $20,000 to $24,999 | 14 (3.9%) | 6 (2.5%) |
| $25,000 to $34,999 | 6 (1.7%) | 25 (10.5%) |
| $35,000 to $49,999 | 49 (13.7%) | 31 (13.0%) |
| $50,000 to $74,999 | 79 (22.1%) | 6 (2.5%) |
| $75,000 to $99,999 | 49 (13.7%) | 66 (27.6%) |
| $100,000 to $149,999 | 33 (9.2%) | 11 (4.6%) |
| $150,000 or more | 48 (13.5%) | 17 (7.1%) |
| Total | 357 (100.0%) | 239 (100.0%) |
Monthly Housing Cost Tiers in Plattsburgh West
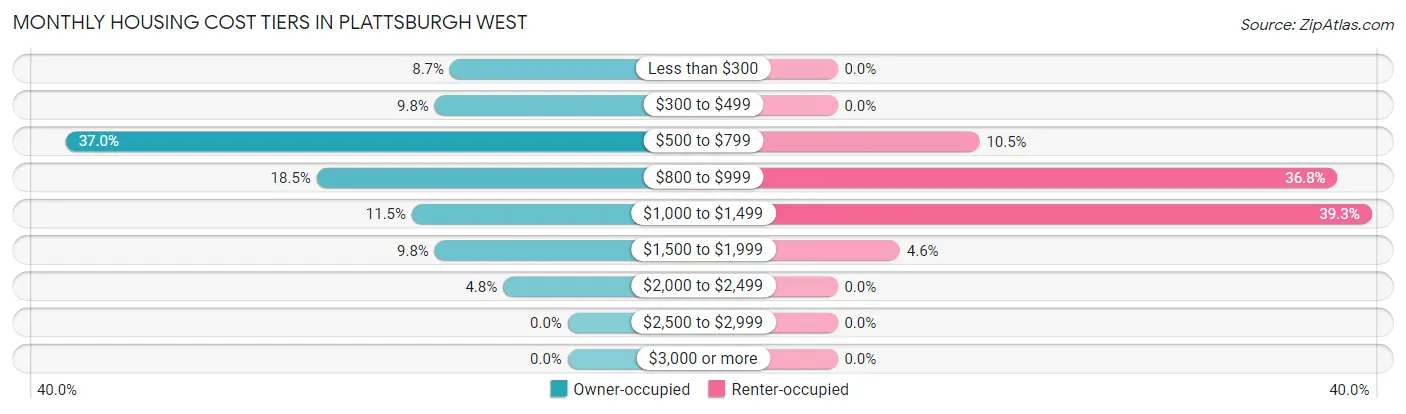
| Monthly Cost | Owner-occupied | Renter-occupied |
| Less than $300 | 31 (8.7%) | 0 (0.0%) |
| $300 to $499 | 35 (9.8%) | 0 (0.0%) |
| $500 to $799 | 132 (37.0%) | 25 (10.5%) |
| $800 to $999 | 66 (18.5%) | 88 (36.8%) |
| $1,000 to $1,499 | 41 (11.5%) | 94 (39.3%) |
| $1,500 to $1,999 | 35 (9.8%) | 11 (4.6%) |
| $2,000 to $2,499 | 17 (4.8%) | 0 (0.0%) |
| $2,500 to $2,999 | 0 (0.0%) | 0 (0.0%) |
| $3,000 or more | 0 (0.0%) | 0 (0.0%) |
| Total | 357 (100.0%) | 239 (100.0%) |
Physical Housing Characteristics in Plattsburgh West
Housing Structures in Plattsburgh West
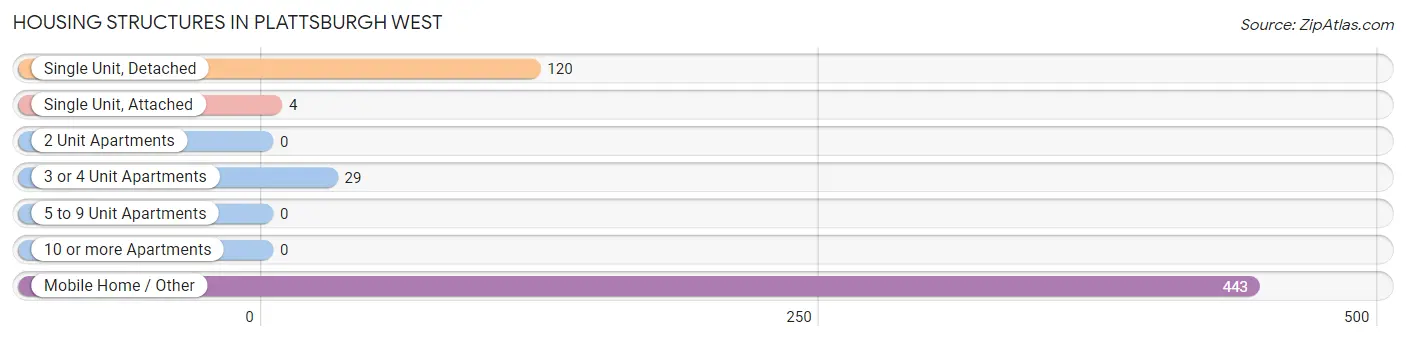
| Structure Type | # Housing Units | % Housing Units |
| Single Unit, Detached | 120 | 20.1% |
| Single Unit, Attached | 4 | 0.7% |
| 2 Unit Apartments | 0 | 0.0% |
| 3 or 4 Unit Apartments | 29 | 4.9% |
| 5 to 9 Unit Apartments | 0 | 0.0% |
| 10 or more Apartments | 0 | 0.0% |
| Mobile Home / Other | 443 | 74.3% |
| Total | 596 | 100.0% |
Housing Structures by Occupancy in Plattsburgh West
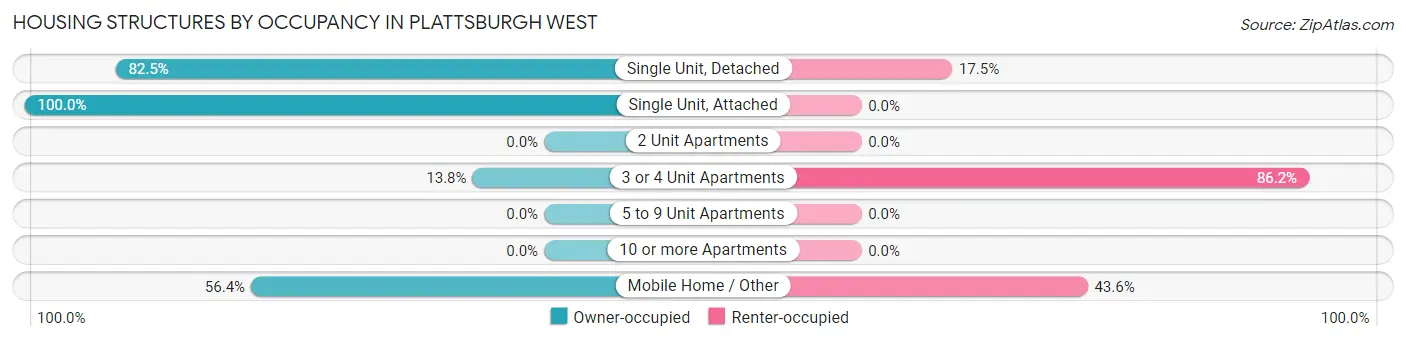
| Structure Type | Owner-occupied | Renter-occupied |
| Single Unit, Detached | 99 (82.5%) | 21 (17.5%) |
| Single Unit, Attached | 4 (100.0%) | 0 (0.0%) |
| 2 Unit Apartments | 0 (0.0%) | 0 (0.0%) |
| 3 or 4 Unit Apartments | 4 (13.8%) | 25 (86.2%) |
| 5 to 9 Unit Apartments | 0 (0.0%) | 0 (0.0%) |
| 10 or more Apartments | 0 (0.0%) | 0 (0.0%) |
| Mobile Home / Other | 250 (56.4%) | 193 (43.6%) |
| Total | 357 (59.9%) | 239 (40.1%) |
Housing Structures by Number of Rooms in Plattsburgh West
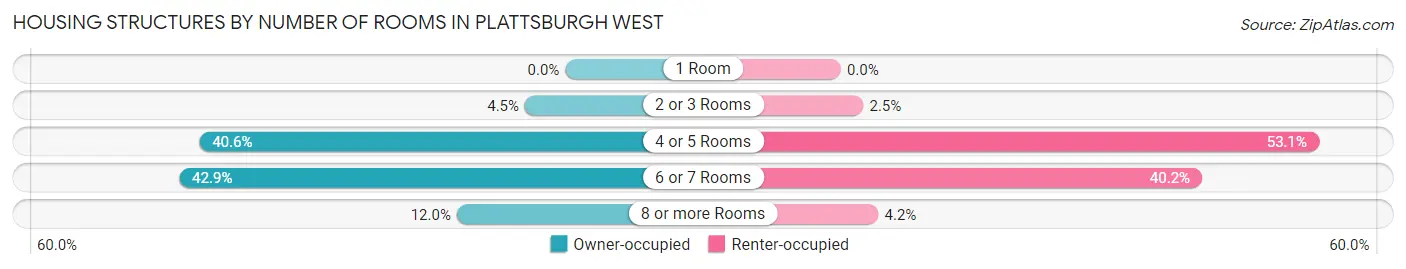
| Number of Rooms | Owner-occupied | Renter-occupied |
| 1 Room | 0 (0.0%) | 0 (0.0%) |
| 2 or 3 Rooms | 16 (4.5%) | 6 (2.5%) |
| 4 or 5 Rooms | 145 (40.6%) | 127 (53.1%) |
| 6 or 7 Rooms | 153 (42.9%) | 96 (40.2%) |
| 8 or more Rooms | 43 (12.0%) | 10 (4.2%) |
| Total | 357 (100.0%) | 239 (100.0%) |
Housing Structure by Heating Type in Plattsburgh West
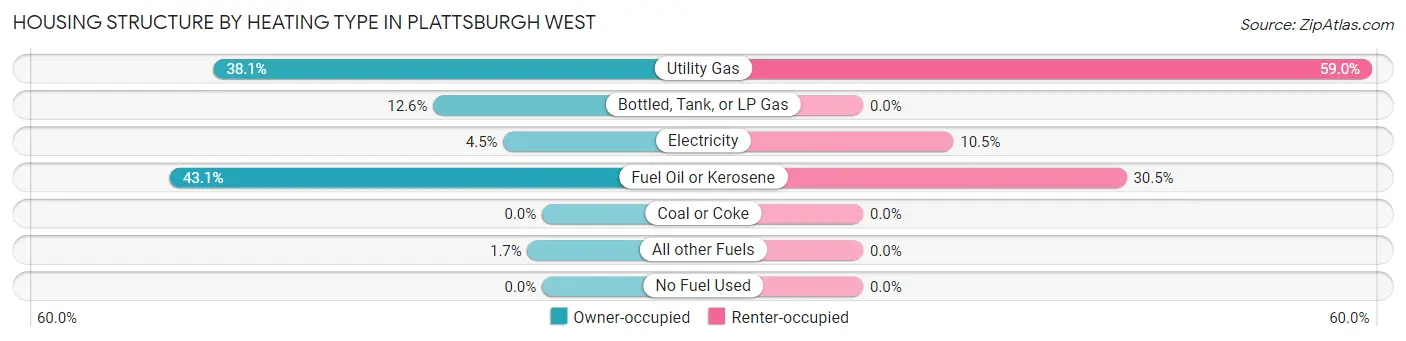
| Heating Type | Owner-occupied | Renter-occupied |
| Utility Gas | 136 (38.1%) | 141 (59.0%) |
| Bottled, Tank, or LP Gas | 45 (12.6%) | 0 (0.0%) |
| Electricity | 16 (4.5%) | 25 (10.5%) |
| Fuel Oil or Kerosene | 154 (43.1%) | 73 (30.5%) |
| Coal or Coke | 0 (0.0%) | 0 (0.0%) |
| All other Fuels | 6 (1.7%) | 0 (0.0%) |
| No Fuel Used | 0 (0.0%) | 0 (0.0%) |
| Total | 357 (100.0%) | 239 (100.0%) |
Household Vehicle Usage in Plattsburgh West
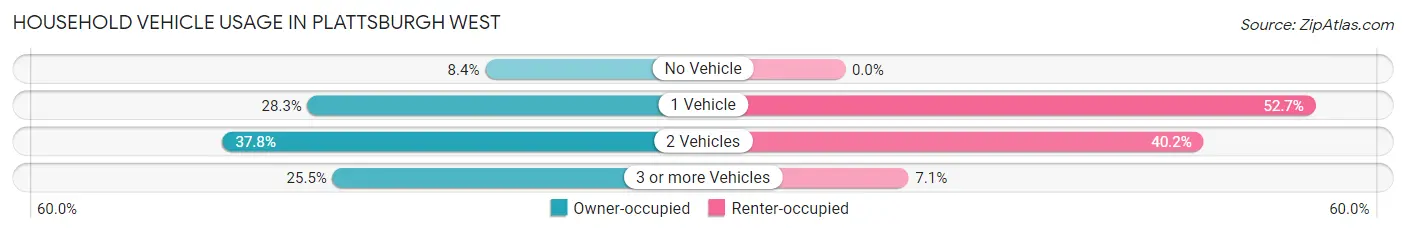
| Vehicles per Household | Owner-occupied | Renter-occupied |
| No Vehicle | 30 (8.4%) | 0 (0.0%) |
| 1 Vehicle | 101 (28.3%) | 126 (52.7%) |
| 2 Vehicles | 135 (37.8%) | 96 (40.2%) |
| 3 or more Vehicles | 91 (25.5%) | 17 (7.1%) |
| Total | 357 (100.0%) | 239 (100.0%) |
Real Estate & Mortgages in Plattsburgh West
Real Estate and Mortgage Overview in Plattsburgh West
| Characteristic | Without Mortgage | With Mortgage |
| Housing Units | 215 | 142 |
| Median Property Value | $49,800 | $98,000 |
| Median Household Income | $51,172 | $19 |
| Monthly Housing Costs | $605 | $0 |
| Real Estate Taxes | - | - |
Property Value by Mortgage Status in Plattsburgh West
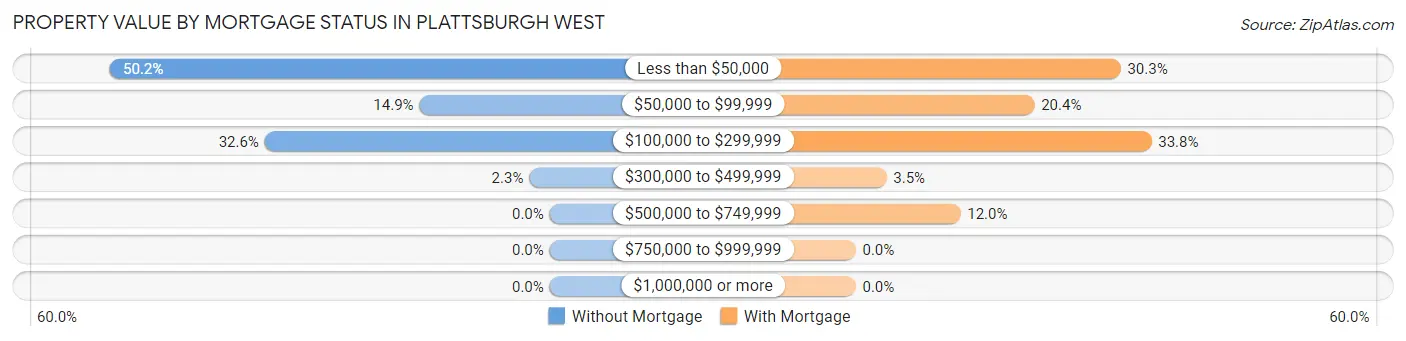
| Property Value | Without Mortgage | With Mortgage |
| Less than $50,000 | 108 (50.2%) | 43 (30.3%) |
| $50,000 to $99,999 | 32 (14.9%) | 29 (20.4%) |
| $100,000 to $299,999 | 70 (32.6%) | 48 (33.8%) |
| $300,000 to $499,999 | 5 (2.3%) | 5 (3.5%) |
| $500,000 to $749,999 | 0 (0.0%) | 17 (12.0%) |
| $750,000 to $999,999 | 0 (0.0%) | 0 (0.0%) |
| $1,000,000 or more | 0 (0.0%) | 0 (0.0%) |
| Total | 215 (100.0%) | 142 (100.0%) |
Household Income by Mortgage Status in Plattsburgh West
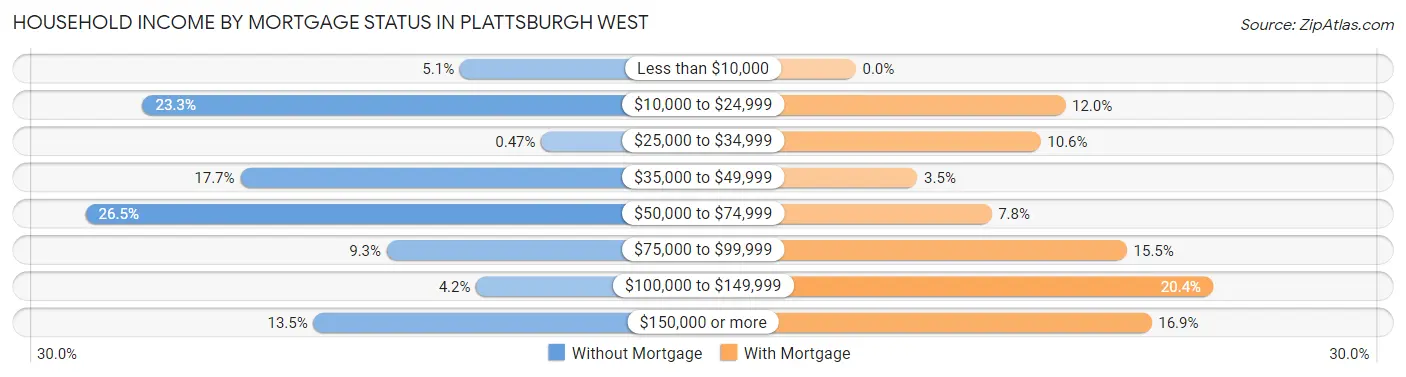
| Household Income | Without Mortgage | With Mortgage |
| Less than $10,000 | 11 (5.1%) | 0 (0.0%) |
| $10,000 to $24,999 | 50 (23.3%) | 17 (12.0%) |
| $25,000 to $34,999 | 1 (0.5%) | 15 (10.6%) |
| $35,000 to $49,999 | 38 (17.7%) | 5 (3.5%) |
| $50,000 to $74,999 | 57 (26.5%) | 11 (7.7%) |
| $75,000 to $99,999 | 20 (9.3%) | 22 (15.5%) |
| $100,000 to $149,999 | 9 (4.2%) | 29 (20.4%) |
| $150,000 or more | 29 (13.5%) | 24 (16.9%) |
| Total | 215 (100.0%) | 142 (100.0%) |
Property Value to Household Income Ratio in Plattsburgh West
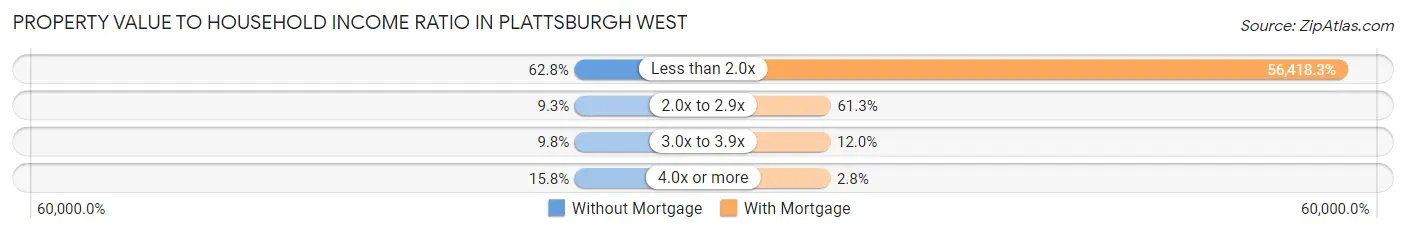
| Value-to-Income Ratio | Without Mortgage | With Mortgage |
| Less than 2.0x | 135 (62.8%) | 80,114 (56,418.3%) |
| 2.0x to 2.9x | 20 (9.3%) | 87 (61.3%) |
| 3.0x to 3.9x | 21 (9.8%) | 17 (12.0%) |
| 4.0x or more | 34 (15.8%) | 4 (2.8%) |
| Total | 215 (100.0%) | 142 (100.0%) |
Real Estate Taxes by Mortgage Status in Plattsburgh West
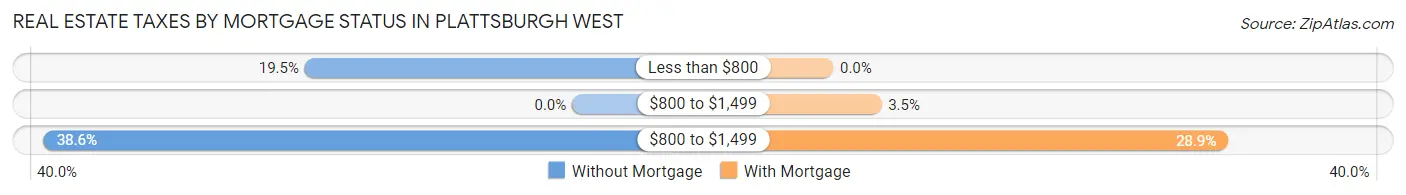
| Property Taxes | Without Mortgage | With Mortgage |
| Less than $800 | 42 (19.5%) | 0 (0.0%) |
| $800 to $1,499 | 0 (0.0%) | 5 (3.5%) |
| $800 to $1,499 | 83 (38.6%) | 41 (28.9%) |
| Total | 215 (100.0%) | 142 (100.0%) |
Health & Disability in Plattsburgh West
Health Insurance Coverage by Age in Plattsburgh West
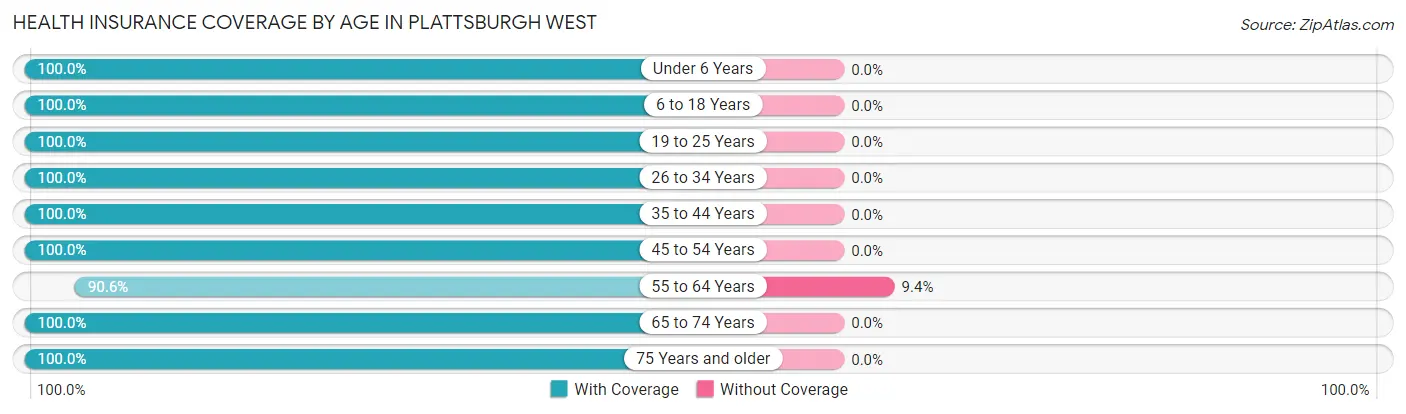
| Age Bracket | With Coverage | Without Coverage |
| Under 6 Years | 96 (100.0%) | 0 (0.0%) |
| 6 to 18 Years | 159 (100.0%) | 0 (0.0%) |
| 19 to 25 Years | 180 (100.0%) | 0 (0.0%) |
| 26 to 34 Years | 85 (100.0%) | 0 (0.0%) |
| 35 to 44 Years | 142 (100.0%) | 0 (0.0%) |
| 45 to 54 Years | 182 (100.0%) | 0 (0.0%) |
| 55 to 64 Years | 164 (90.6%) | 17 (9.4%) |
| 65 to 74 Years | 192 (100.0%) | 0 (0.0%) |
| 75 Years and older | 90 (100.0%) | 0 (0.0%) |
| Total | 1,290 (98.7%) | 17 (1.3%) |
Health Insurance Coverage by Citizenship Status in Plattsburgh West
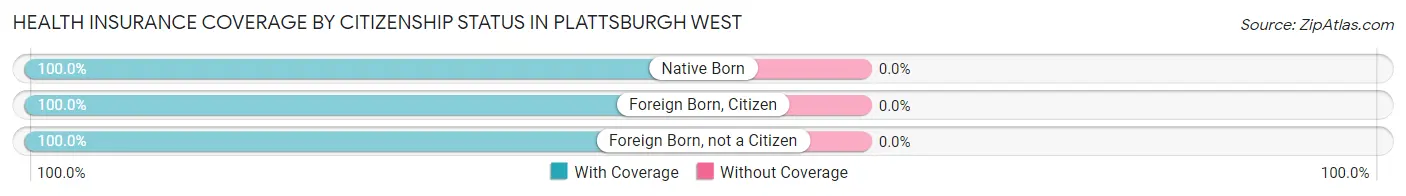
| Citizenship Status | With Coverage | Without Coverage |
| Native Born | 96 (100.0%) | 0 (0.0%) |
| Foreign Born, Citizen | 159 (100.0%) | 0 (0.0%) |
| Foreign Born, not a Citizen | 180 (100.0%) | 0 (0.0%) |
Health Insurance Coverage by Household Income in Plattsburgh West
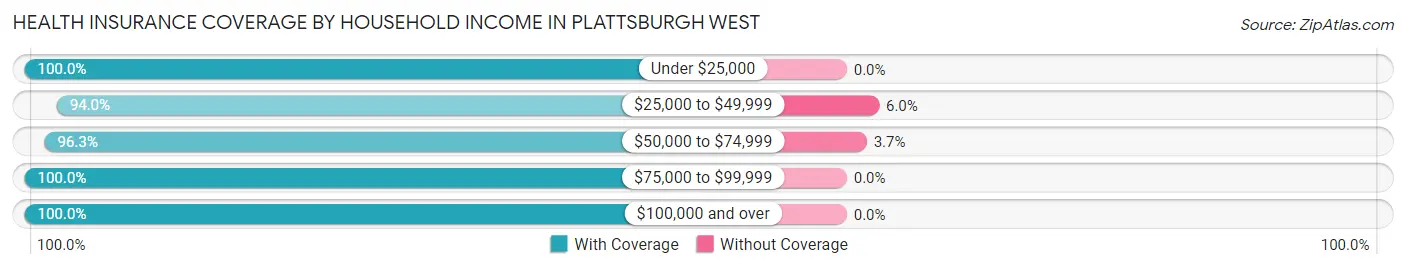
| Household Income | With Coverage | Without Coverage |
| Under $25,000 | 209 (100.0%) | 0 (0.0%) |
| $25,000 to $49,999 | 171 (94.0%) | 11 (6.0%) |
| $50,000 to $74,999 | 155 (96.3%) | 6 (3.7%) |
| $75,000 to $99,999 | 274 (100.0%) | 0 (0.0%) |
| $100,000 and over | 464 (100.0%) | 0 (0.0%) |
Public vs Private Health Insurance Coverage by Age in Plattsburgh West
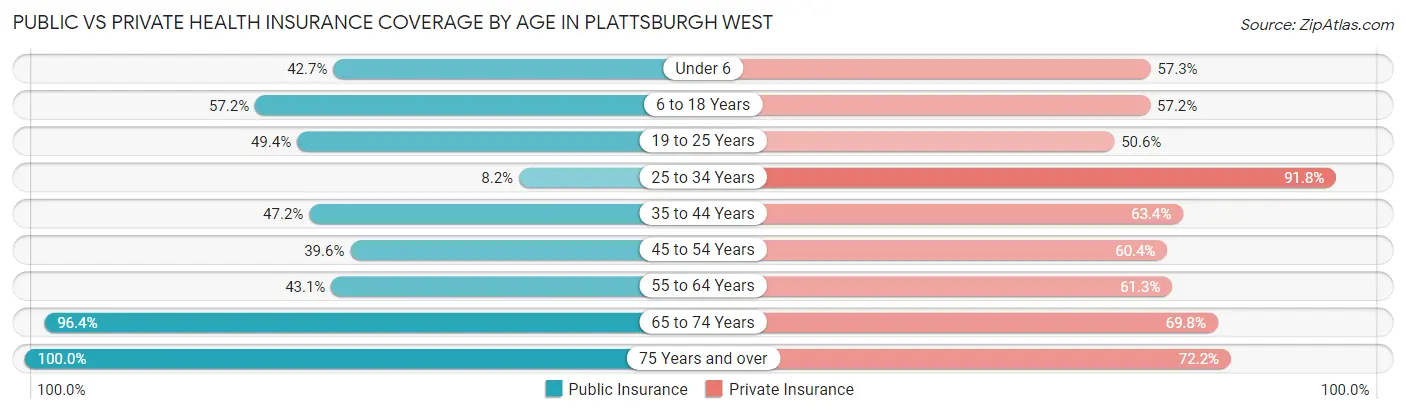
| Age Bracket | Public Insurance | Private Insurance |
| Under 6 | 41 (42.7%) | 55 (57.3%) |
| 6 to 18 Years | 91 (57.2%) | 91 (57.2%) |
| 19 to 25 Years | 89 (49.4%) | 91 (50.6%) |
| 25 to 34 Years | 7 (8.2%) | 78 (91.8%) |
| 35 to 44 Years | 67 (47.2%) | 90 (63.4%) |
| 45 to 54 Years | 72 (39.6%) | 110 (60.4%) |
| 55 to 64 Years | 78 (43.1%) | 111 (61.3%) |
| 65 to 74 Years | 185 (96.4%) | 134 (69.8%) |
| 75 Years and over | 90 (100.0%) | 65 (72.2%) |
| Total | 720 (55.1%) | 825 (63.1%) |
Disability Status by Sex by Age in Plattsburgh West
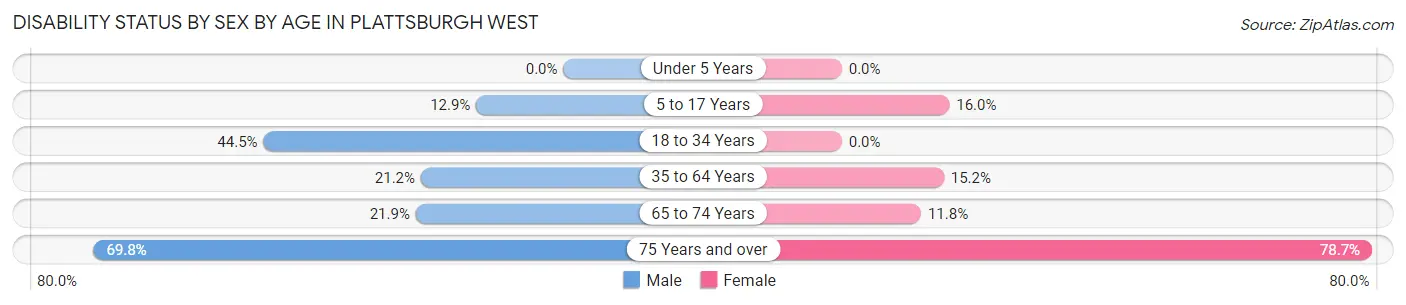
| Age Bracket | Male | Female |
| Under 5 Years | 0 (0.0%) | 0 (0.0%) |
| 5 to 17 Years | 11 (12.9%) | 15 (16.0%) |
| 18 to 34 Years | 53 (44.5%) | 0 (0.0%) |
| 35 to 64 Years | 51 (21.2%) | 40 (15.1%) |
| 65 to 74 Years | 16 (21.9%) | 14 (11.8%) |
| 75 Years and over | 30 (69.8%) | 37 (78.7%) |
Disability Class by Sex by Age in Plattsburgh West
Disability Class: Hearing Difficulty
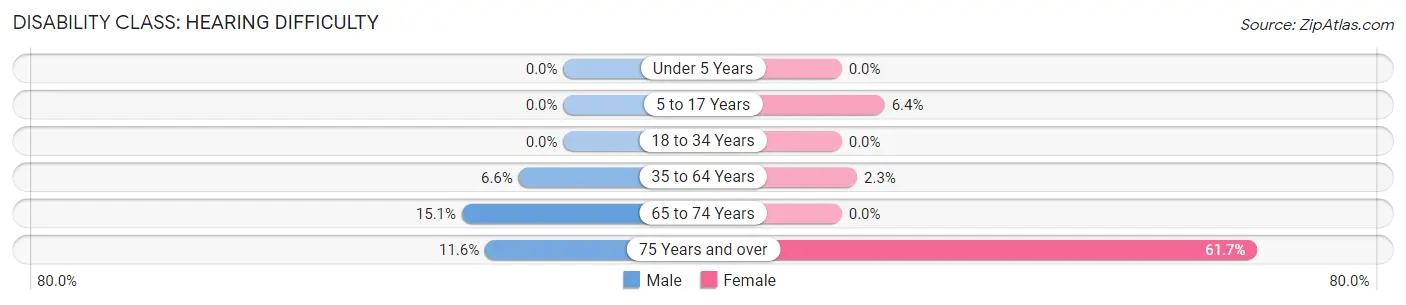
| Age Bracket | Male | Female |
| Under 5 Years | 0 (0.0%) | 0 (0.0%) |
| 5 to 17 Years | 0 (0.0%) | 6 (6.4%) |
| 18 to 34 Years | 0 (0.0%) | 0 (0.0%) |
| 35 to 64 Years | 16 (6.6%) | 6 (2.3%) |
| 65 to 74 Years | 11 (15.1%) | 0 (0.0%) |
| 75 Years and over | 5 (11.6%) | 29 (61.7%) |
Disability Class: Vision Difficulty
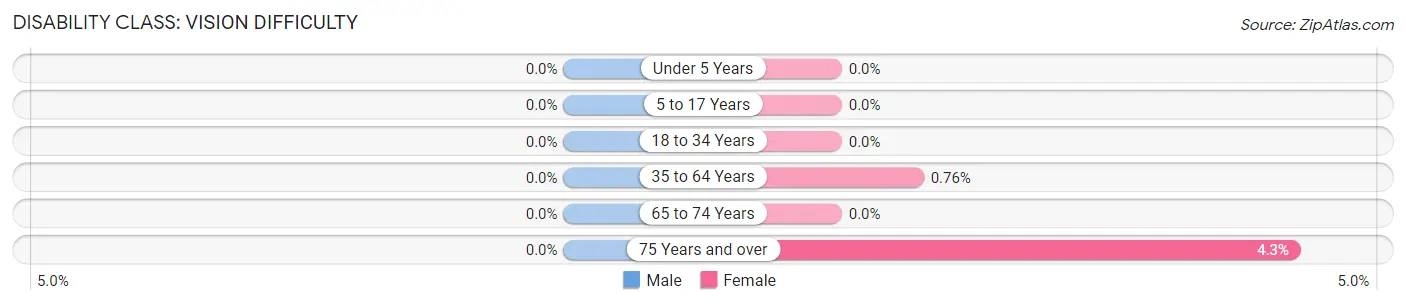
| Age Bracket | Male | Female |
| Under 5 Years | 0 (0.0%) | 0 (0.0%) |
| 5 to 17 Years | 0 (0.0%) | 0 (0.0%) |
| 18 to 34 Years | 0 (0.0%) | 0 (0.0%) |
| 35 to 64 Years | 0 (0.0%) | 2 (0.8%) |
| 65 to 74 Years | 0 (0.0%) | 0 (0.0%) |
| 75 Years and over | 0 (0.0%) | 2 (4.3%) |
Disability Class: Cognitive Difficulty
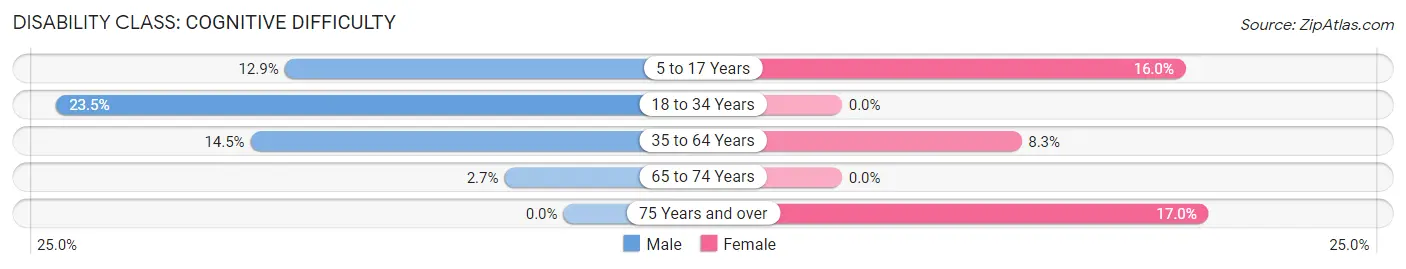
| Age Bracket | Male | Female |
| 5 to 17 Years | 11 (12.9%) | 15 (16.0%) |
| 18 to 34 Years | 28 (23.5%) | 0 (0.0%) |
| 35 to 64 Years | 35 (14.5%) | 22 (8.3%) |
| 65 to 74 Years | 2 (2.7%) | 0 (0.0%) |
| 75 Years and over | 0 (0.0%) | 8 (17.0%) |
Disability Class: Ambulatory Difficulty
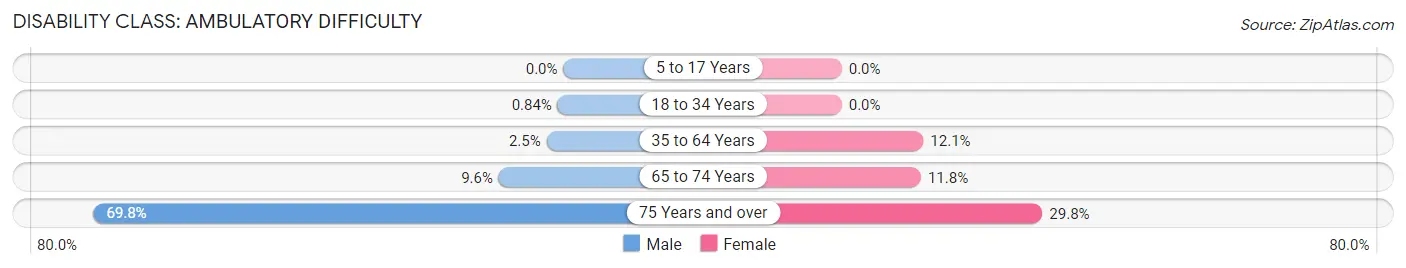
| Age Bracket | Male | Female |
| 5 to 17 Years | 0 (0.0%) | 0 (0.0%) |
| 18 to 34 Years | 1 (0.8%) | 0 (0.0%) |
| 35 to 64 Years | 6 (2.5%) | 32 (12.1%) |
| 65 to 74 Years | 7 (9.6%) | 14 (11.8%) |
| 75 Years and over | 30 (69.8%) | 14 (29.8%) |
Disability Class: Self-Care Difficulty
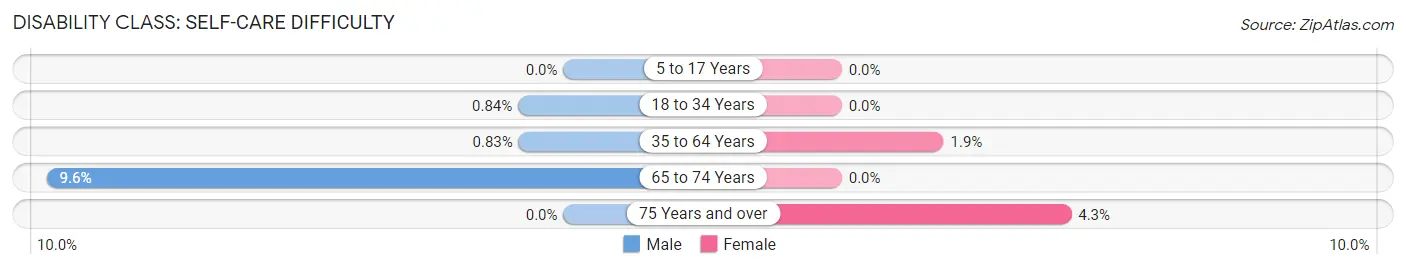
| Age Bracket | Male | Female |
| 5 to 17 Years | 0 (0.0%) | 0 (0.0%) |
| 18 to 34 Years | 1 (0.8%) | 0 (0.0%) |
| 35 to 64 Years | 2 (0.8%) | 5 (1.9%) |
| 65 to 74 Years | 7 (9.6%) | 0 (0.0%) |
| 75 Years and over | 0 (0.0%) | 2 (4.3%) |
Technology Access in Plattsburgh West
Computing Device Access in Plattsburgh West
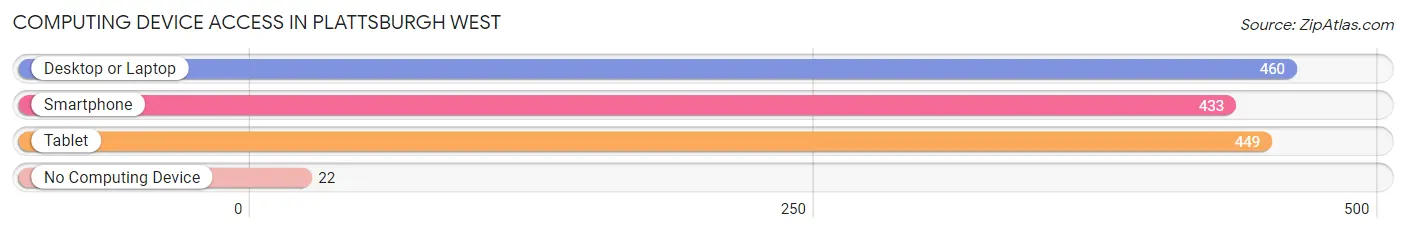
| Device Type | # Households | % Households |
| Desktop or Laptop | 460 | 77.2% |
| Smartphone | 433 | 72.7% |
| Tablet | 449 | 75.3% |
| No Computing Device | 22 | 3.7% |
| Total | 596 | 100.0% |
Internet Access in Plattsburgh West
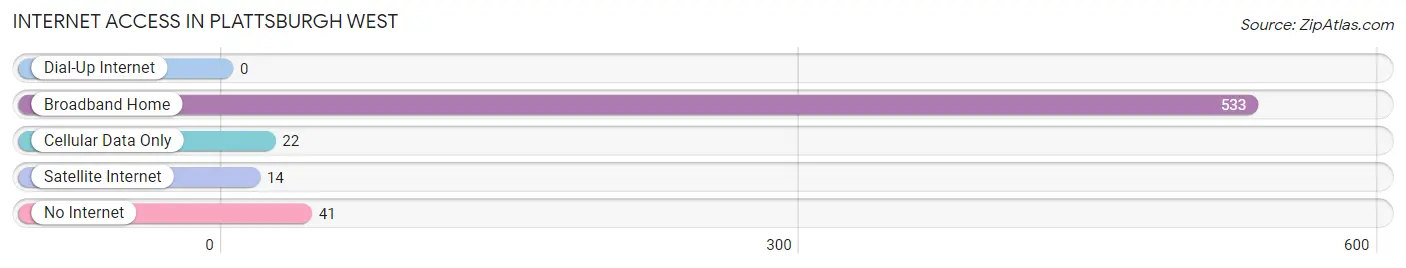
| Internet Type | # Households | % Households |
| Dial-Up Internet | 0 | 0.0% |
| Broadband Home | 533 | 89.4% |
| Cellular Data Only | 22 | 3.7% |
| Satellite Internet | 14 | 2.4% |
| No Internet | 41 | 6.9% |
| Total | 596 | 100.0% |
Plattsburgh West Summary
Plattsburgh West, NY is a small town located in Clinton County, New York. It is situated on the western shore of Lake Champlain, just south of the city of Plattsburgh. The town was established in 1817 and has a population of approximately 2,000 people.
Geography
Plattsburgh West is located in the Adirondack Mountains region of New York. The town is situated on the western shore of Lake Champlain, just south of the city of Plattsburgh. The town is bordered by the towns of Peru to the north, Beekmantown to the east, and Schuyler Falls to the south. The town is approximately 10 miles from the Canadian border.
The terrain of Plattsburgh West is mostly flat, with some rolling hills. The town is located in a temperate climate zone, with cold winters and warm summers. The average annual temperature is around 40 degrees Fahrenheit. The town receives an average of 40 inches of precipitation per year.
Economy
The economy of Plattsburgh West is largely based on tourism and agriculture. The town is home to several small businesses, including restaurants, retail stores, and a few small manufacturing companies. The town is also home to a number of farms, which produce a variety of crops, including corn, soybeans, and hay.
The town is also home to a number of recreational activities, including fishing, boating, and camping. The town is also home to a number of parks and trails, which are popular with hikers and bikers.
Demographics
As of the 2010 census, the population of Plattsburgh West was 2,000 people. The town is predominantly white, with a small minority population. The median household income is $45,000, and the median age is 43 years old.
The town is home to a number of churches, including the United Methodist Church, the Catholic Church, and the Presbyterian Church. The town is also home to a number of schools, including the Plattsburgh West Elementary School, the Plattsburgh West Middle School, and the Plattsburgh West High School.
History
Plattsburgh West was established in 1817, when the town was separated from the town of Plattsburgh. The town was named after the city of Plattsburgh, which was founded in 1785. The town was originally a farming community, and the town’s economy was largely based on agriculture.
In the late 19th century, the town began to develop into a tourist destination. The town was home to a number of resorts, which attracted visitors from all over the country. The town was also home to a number of summer camps, which were popular with children.
In the early 20th century, the town began to develop into a manufacturing center. The town was home to a number of factories, which produced a variety of products, including furniture, clothing, and paper products. The town was also home to a number of small businesses, which provided services to the local community.
Today, Plattsburgh West is a small town with a population of approximately 2,000 people. The town is still largely based on tourism and agriculture, and the town is home to a number of small businesses. The town is also home to a number of recreational activities, including fishing, boating, and camping.
Common Questions
What is Per Capita Income in Plattsburgh West?
Per Capita income in Plattsburgh West is $28,596.
What is the Median Family Income in Plattsburgh West?
Median Family Income in Plattsburgh West is $70,227.
What is the Median Household income in Plattsburgh West?
Median Household Income in Plattsburgh West is $51,196.
What is Income or Wage Gap in Plattsburgh West?
Income or Wage Gap in Plattsburgh West is 56.2%.
Women in Plattsburgh West earn 43.8 cents for every dollar earned by a man.
What is Inequality or Gini Index in Plattsburgh West?
Inequality or Gini Index in Plattsburgh West is 0.45.
What is the Total Population of Plattsburgh West?
Total Population of Plattsburgh West is 1,307.
What is the Total Male Population of Plattsburgh West?
Total Male Population of Plattsburgh West is 561.
What is the Total Female Population of Plattsburgh West?
Total Female Population of Plattsburgh West is 746.
What is the Ratio of Males per 100 Females in Plattsburgh West?
There are 75.20 Males per 100 Females in Plattsburgh West.
What is the Ratio of Females per 100 Males in Plattsburgh West?
There are 132.98 Females per 100 Males in Plattsburgh West.
What is the Median Population Age in Plattsburgh West?
Median Population Age in Plattsburgh West is 43.5 Years.
What is the Average Family Size in Plattsburgh West
Average Family Size in Plattsburgh West is 2.5 People.
What is the Average Household Size in Plattsburgh West
Average Household Size in Plattsburgh West is 2.2 People.
How Large is the Labor Force in Plattsburgh West?
There are 619 People in the Labor Forcein in Plattsburgh West.
What is the Percentage of People in the Labor Force in Plattsburgh West?
57.4% of People are in the Labor Force in Plattsburgh West.
What is the Unemployment Rate in Plattsburgh West?
Unemployment Rate in Plattsburgh West is 13.2%.