Kildeer, IL Map & Demographics
Kildeer Map
Kildeer Overview
$94,531
PER CAPITA INCOME
$250,001
AVG FAMILY INCOME
$250,001
AVG HOUSEHOLD INCOME
51.7%
WAGE / INCOME GAP [ % ]
48.3¢/ $1
WAGE / INCOME GAP [ $ ]
0.35
INEQUALITY / GINI INDEX
4,133
TOTAL POPULATION
2,119
MALE POPULATION
2,014
FEMALE POPULATION
105.21
MALES / 100 FEMALES
95.04
FEMALES / 100 MALES
43.5
MEDIAN AGE
3.2
AVG FAMILY SIZE
3.1
AVG HOUSEHOLD SIZE
2,167
LABOR FORCE [ PEOPLE ]
66.8%
PERCENT IN LABOR FORCE
3.1%
UNEMPLOYMENT RATE
Income in Kildeer
Income Overview in Kildeer
Per Capita Income in Kildeer is $94,531, while median incomes of families and households are $250,001 and $250,001 respectively.
| Characteristic | Number | Measure |
| Per Capita Income | 4,133 | $94,531 |
| Median Family Income | 1,252 | $250,001 |
| Mean Family Income | 1,252 | $303,348 |
| Median Household Income | 1,339 | $250,001 |
| Mean Household Income | 1,339 | $286,820 |
| Income Deficit | 1,252 | $0 |
| Wage / Income Gap (%) | 4,133 | 51.70% |
| Wage / Income Gap ($) | 4,133 | 48.30¢ per $1 |
| Gini / Inequality Index | 4,133 | 0.35 |
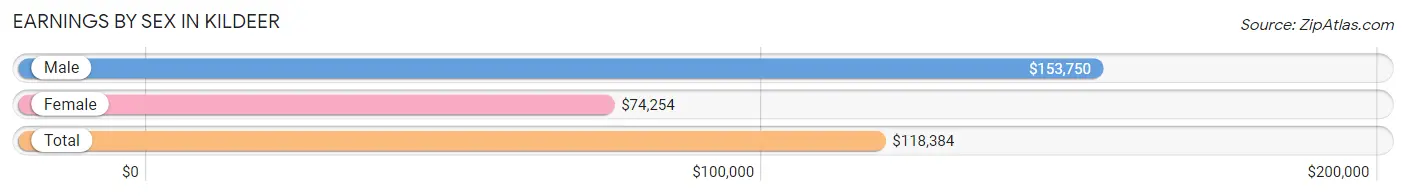
Earnings by Sex in Kildeer
Average Earnings in Kildeer are $118,384, $153,750 for men and $74,254 for women, a difference of 51.7%.
| Sex | Number | Average Earnings |
| Male | 1,225 (53.2%) | $153,750 |
| Female | 1,076 (46.8%) | $74,254 |
| Total | 2,301 (100.0%) | $118,384 |
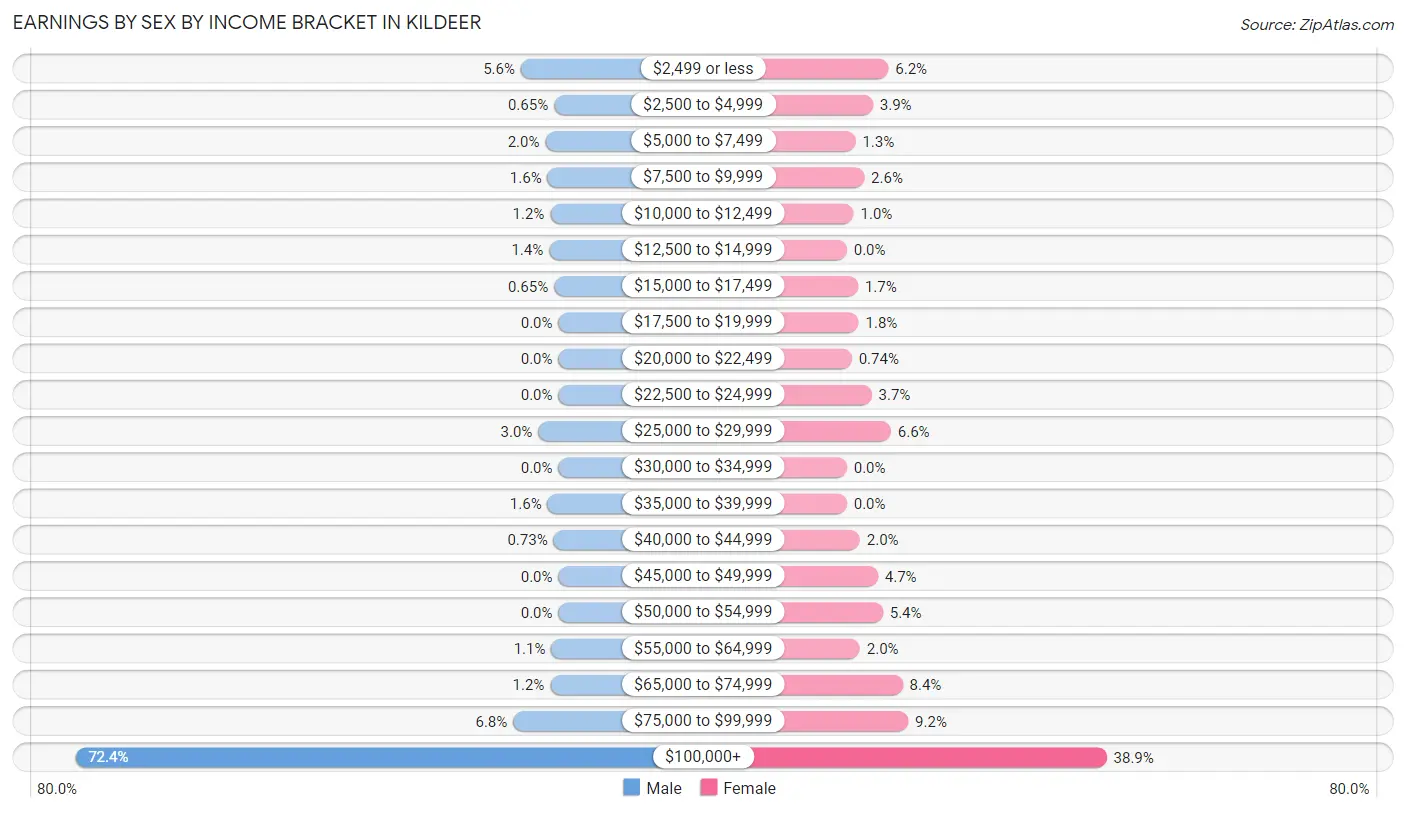
Earnings by Sex by Income Bracket in Kildeer
The most common earnings brackets in Kildeer are $100,000+ for men (887 | 72.4%) and $100,000+ for women (419 | 38.9%).
| Income | Male | Female |
| $2,499 or less | 69 (5.6%) | 67 (6.2%) |
| $2,500 to $4,999 | 8 (0.6%) | 42 (3.9%) |
| $5,000 to $7,499 | 24 (2.0%) | 14 (1.3%) |
| $7,500 to $9,999 | 20 (1.6%) | 28 (2.6%) |
| $10,000 to $12,499 | 15 (1.2%) | 11 (1.0%) |
| $12,500 to $14,999 | 17 (1.4%) | 0 (0.0%) |
| $15,000 to $17,499 | 8 (0.6%) | 18 (1.7%) |
| $17,500 to $19,999 | 0 (0.0%) | 19 (1.8%) |
| $20,000 to $22,499 | 0 (0.0%) | 8 (0.7%) |
| $22,500 to $24,999 | 0 (0.0%) | 40 (3.7%) |
| $25,000 to $29,999 | 37 (3.0%) | 71 (6.6%) |
| $30,000 to $34,999 | 0 (0.0%) | 0 (0.0%) |
| $35,000 to $39,999 | 20 (1.6%) | 0 (0.0%) |
| $40,000 to $44,999 | 9 (0.7%) | 21 (1.9%) |
| $45,000 to $49,999 | 0 (0.0%) | 50 (4.6%) |
| $50,000 to $54,999 | 0 (0.0%) | 58 (5.4%) |
| $55,000 to $64,999 | 13 (1.1%) | 21 (1.9%) |
| $65,000 to $74,999 | 15 (1.2%) | 90 (8.4%) |
| $75,000 to $99,999 | 83 (6.8%) | 99 (9.2%) |
| $100,000+ | 887 (72.4%) | 419 (38.9%) |
| Total | 1,225 (100.0%) | 1,076 (100.0%) |
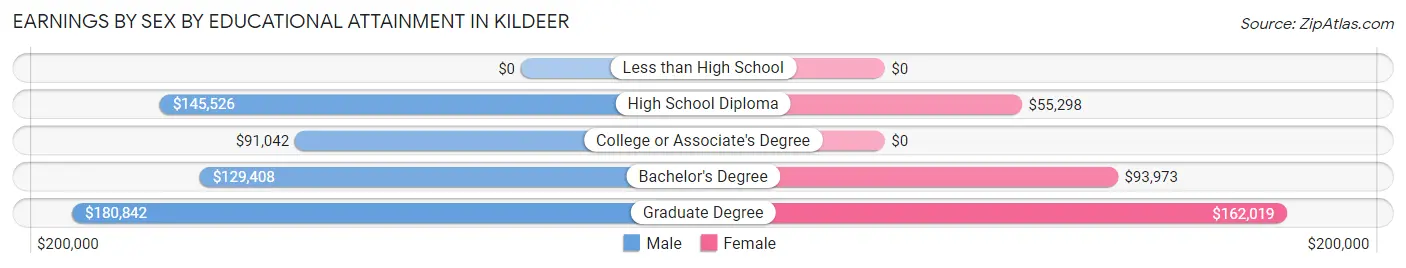
Earnings by Sex by Educational Attainment in Kildeer
Average earnings in Kildeer are $167,529 for men and $91,000 for women, a difference of 45.7%. Men with an educational attainment of graduate degree enjoy the highest average annual earnings of $180,842, while those with college or associate's degree education earn the least with $91,042. Women with an educational attainment of graduate degree earn the most with the average annual earnings of $162,019, while those with high school diploma education have the smallest earnings of $55,298.
| Educational Attainment | Male Income | Female Income |
| Less than High School | - | - |
| High School Diploma | $145,526 | $55,298 |
| College or Associate's Degree | $91,042 | $0 |
| Bachelor's Degree | $129,408 | $93,973 |
| Graduate Degree | $180,842 | $162,019 |
| Total | $167,529 | $91,000 |
Family Income in Kildeer
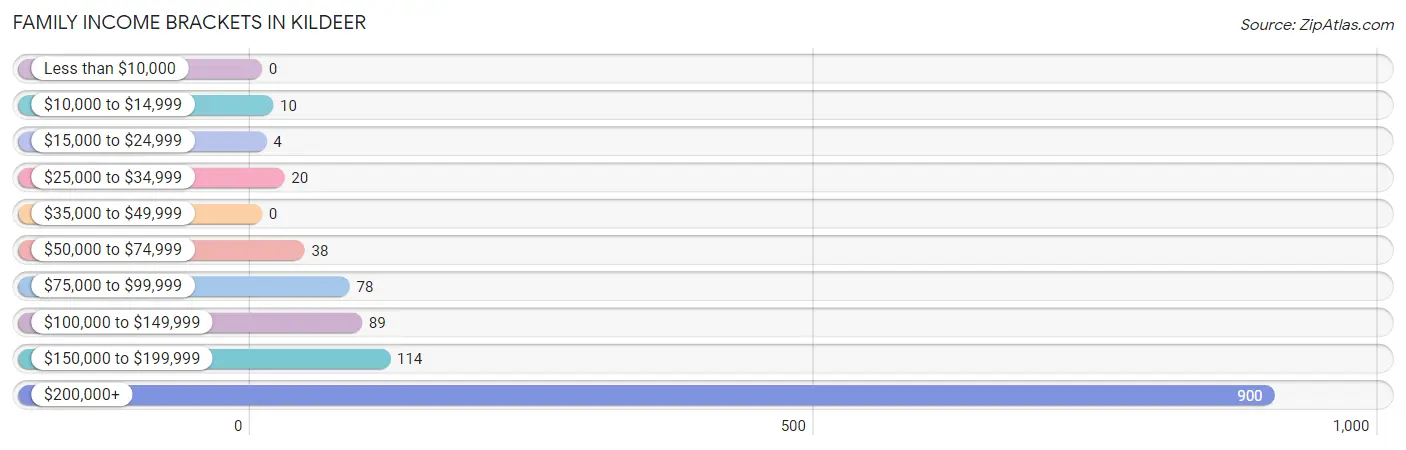
Family Income Brackets in Kildeer
According to the Kildeer family income data, there are 900 families falling into the $200,000+ income range, which is the most common income bracket and makes up 71.9% of all families.
| Income Bracket | # Families | % Families |
| Less than $10,000 | 0 | 0.0% |
| $10,000 to $14,999 | 10 | 0.8% |
| $15,000 to $24,999 | 4 | 0.3% |
| $25,000 to $34,999 | 20 | 1.6% |
| $35,000 to $49,999 | 0 | 0.0% |
| $50,000 to $74,999 | 38 | 3.0% |
| $75,000 to $99,999 | 78 | 6.2% |
| $100,000 to $149,999 | 89 | 7.1% |
| $150,000 to $199,999 | 114 | 9.1% |
| $200,000+ | 900 | 71.9% |
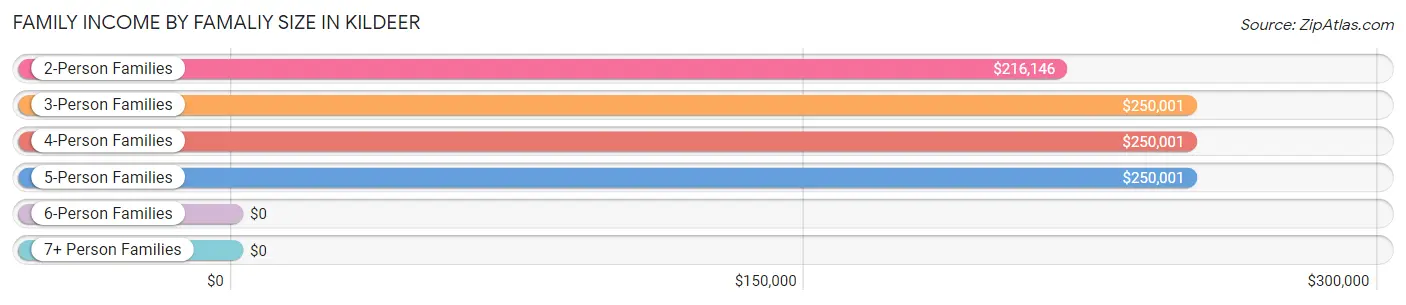
Family Income by Famaliy Size in Kildeer
3-person families (299 | 23.9%) account for the highest median family income in Kildeer with $250,001 per family, while 2-person families (441 | 35.2%) have the highest median income of $108,073 per family member.
| Income Bracket | # Families | Median Income |
| 2-Person Families | 441 (35.2%) | $216,146 |
| 3-Person Families | 299 (23.9%) | $250,001 |
| 4-Person Families | 396 (31.6%) | $250,001 |
| 5-Person Families | 110 (8.8%) | $250,001 |
| 6-Person Families | 6 (0.5%) | $0 |
| 7+ Person Families | 0 (0.0%) | $0 |
| Total | 1,252 (100.0%) | $250,001 |
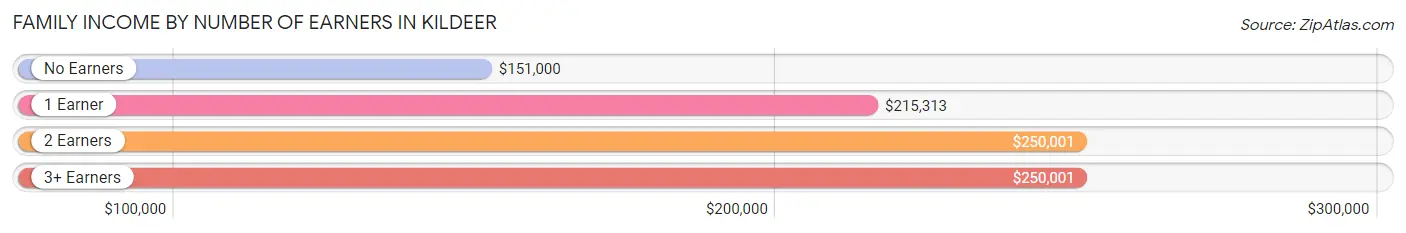
Family Income by Number of Earners in Kildeer
The median family income in Kildeer is $250,001, with families comprising 2 earners (622) having the highest median family income of $250,001, while families with no earners (122) have the lowest median family income of $151,000, accounting for 49.7% and 9.7% of families, respectively.
| Number of Earners | # Families | Median Income |
| No Earners | 122 (9.7%) | $151,000 |
| 1 Earner | 327 (26.1%) | $215,313 |
| 2 Earners | 622 (49.7%) | $250,001 |
| 3+ Earners | 181 (14.5%) | $250,001 |
| Total | 1,252 (100.0%) | $250,001 |
Household Income in Kildeer
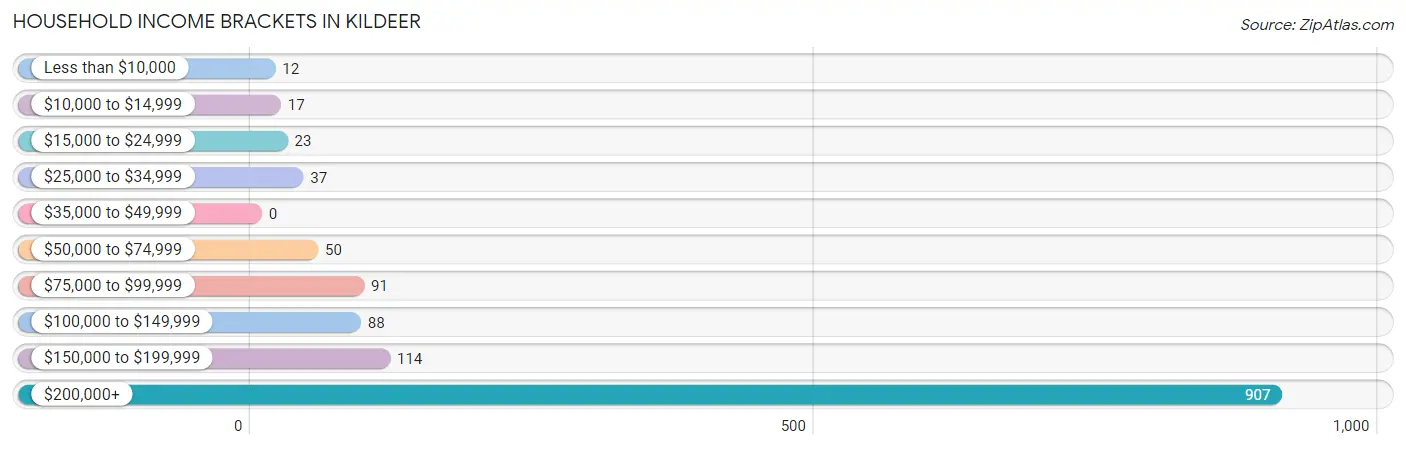
Household Income Brackets in Kildeer
With 907 households falling in the category, the $200,000+ income range is the most frequent in Kildeer, accounting for 67.7% of all households.
| Income Bracket | # Households | % Households |
| Less than $10,000 | 12 | 0.9% |
| $10,000 to $14,999 | 17 | 1.3% |
| $15,000 to $24,999 | 23 | 1.7% |
| $25,000 to $34,999 | 37 | 2.8% |
| $35,000 to $49,999 | 0 | 0.0% |
| $50,000 to $74,999 | 50 | 3.7% |
| $75,000 to $99,999 | 91 | 6.8% |
| $100,000 to $149,999 | 88 | 6.6% |
| $150,000 to $199,999 | 114 | 8.5% |
| $200,000+ | 907 | 67.7% |
Household Income by Householder Age in Kildeer
The median household income in Kildeer is $250,001, with the highest median household income of $250,001 found in the 25 to 44 years age bracket for the primary householder. A total of 290 households (21.7%) fall into this category.
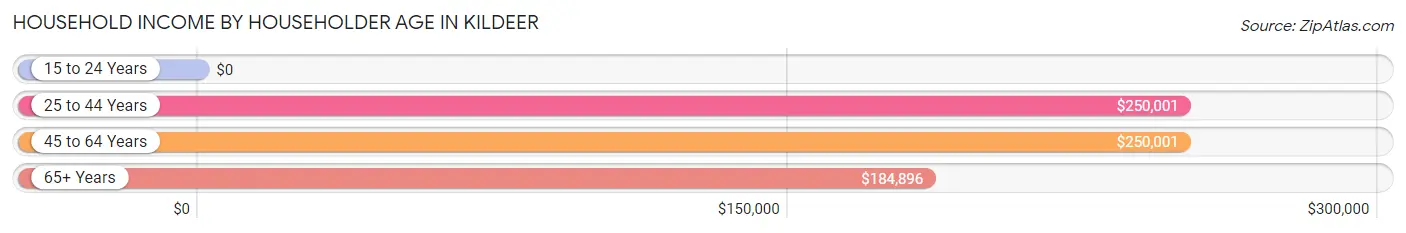
| Income Bracket | # Households | Median Income |
| 15 to 24 Years | 0 (0.0%) | $0 |
| 25 to 44 Years | 290 (21.7%) | $250,001 |
| 45 to 64 Years | 744 (55.6%) | $250,001 |
| 65+ Years | 305 (22.8%) | $184,896 |
| Total | 1,339 (100.0%) | $250,001 |
Poverty in Kildeer
Income Below Poverty by Sex and Age in Kildeer
With 3.0% poverty level for males and 2.1% for females among the residents of Kildeer, 18 to 24 year old males and 16 and 17 year old females are the most vulnerable to poverty, with 16 males (11.3%) and 7 females (8.2%) in their respective age groups living below the poverty level.
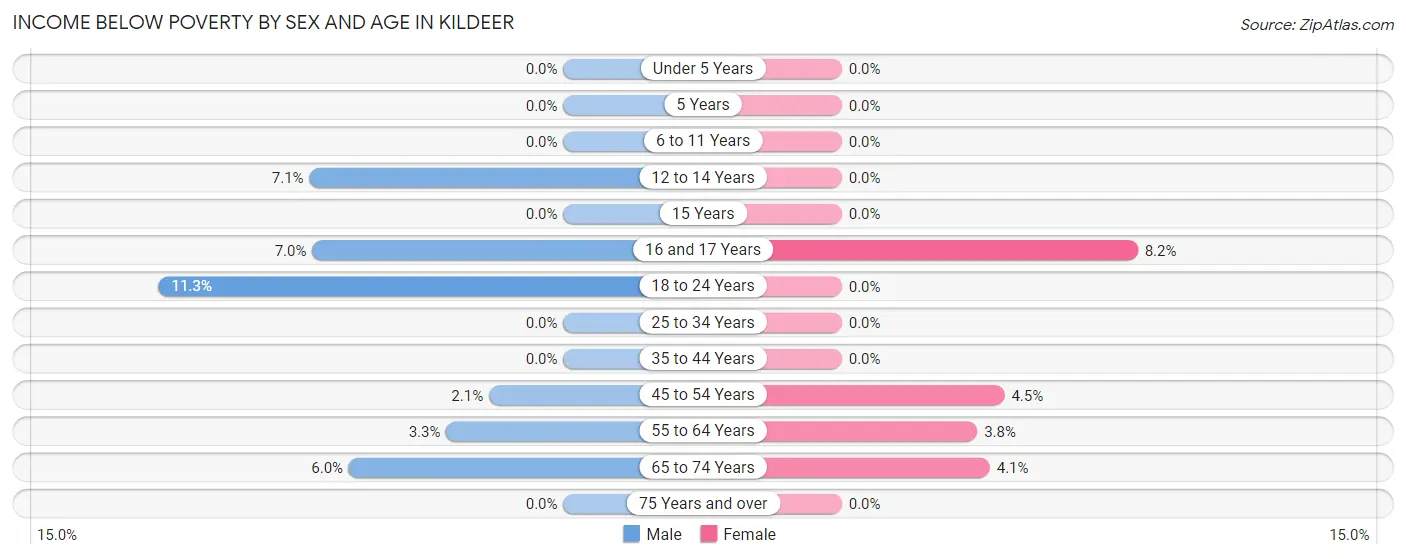
| Age Bracket | Male | Female |
| Under 5 Years | 0 (0.0%) | 0 (0.0%) |
| 5 Years | 0 (0.0%) | 0 (0.0%) |
| 6 to 11 Years | 0 (0.0%) | 0 (0.0%) |
| 12 to 14 Years | 7 (7.1%) | 0 (0.0%) |
| 15 Years | 0 (0.0%) | 0 (0.0%) |
| 16 and 17 Years | 10 (7.0%) | 7 (8.2%) |
| 18 to 24 Years | 16 (11.3%) | 0 (0.0%) |
| 25 to 34 Years | 0 (0.0%) | 0 (0.0%) |
| 35 to 44 Years | 0 (0.0%) | 0 (0.0%) |
| 45 to 54 Years | 8 (2.1%) | 17 (4.5%) |
| 55 to 64 Years | 10 (3.3%) | 12 (3.8%) |
| 65 to 74 Years | 12 (6.0%) | 7 (4.1%) |
| 75 Years and over | 0 (0.0%) | 0 (0.0%) |
| Total | 63 (3.0%) | 43 (2.1%) |
Income Above Poverty by Sex and Age in Kildeer
According to the poverty statistics in Kildeer, males aged under 5 years and females aged under 5 years are the age groups that are most secure financially, with 100.0% of males and 100.0% of females in these age groups living above the poverty line.
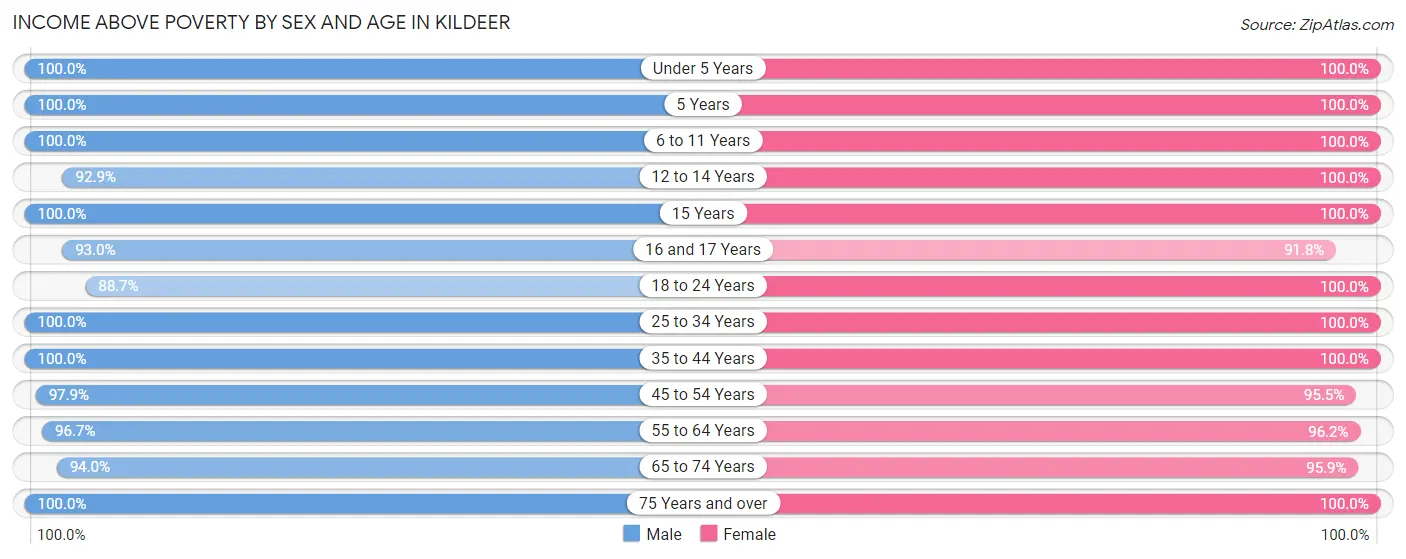
| Age Bracket | Male | Female |
| Under 5 Years | 100 (100.0%) | 101 (100.0%) |
| 5 Years | 38 (100.0%) | 12 (100.0%) |
| 6 to 11 Years | 117 (100.0%) | 257 (100.0%) |
| 12 to 14 Years | 92 (92.9%) | 66 (100.0%) |
| 15 Years | 63 (100.0%) | 36 (100.0%) |
| 16 and 17 Years | 133 (93.0%) | 78 (91.8%) |
| 18 to 24 Years | 126 (88.7%) | 152 (100.0%) |
| 25 to 34 Years | 103 (100.0%) | 77 (100.0%) |
| 35 to 44 Years | 273 (100.0%) | 297 (100.0%) |
| 45 to 54 Years | 378 (97.9%) | 358 (95.5%) |
| 55 to 64 Years | 297 (96.7%) | 306 (96.2%) |
| 65 to 74 Years | 189 (94.0%) | 163 (95.9%) |
| 75 Years and over | 147 (100.0%) | 68 (100.0%) |
| Total | 2,056 (97.0%) | 1,971 (97.9%) |
Income Below Poverty Among Married-Couple Families in Kildeer
The poverty statistics for married-couple families in Kildeer show that 1.5% or 18 of the total 1,217 families live below the poverty line. Families with 1 or 2 children have the highest poverty rate of 3.0%, comprising of 18 families. On the other hand, families with no children have the lowest poverty rate of 0.0%, which includes 0 families.
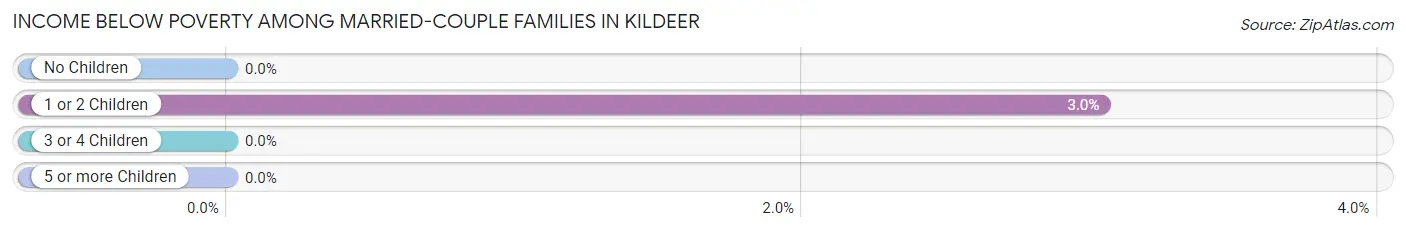
| Children | Above Poverty | Below Poverty |
| No Children | 551 (100.0%) | 0 (0.0%) |
| 1 or 2 Children | 574 (97.0%) | 18 (3.0%) |
| 3 or 4 Children | 74 (100.0%) | 0 (0.0%) |
| 5 or more Children | 0 (0.0%) | 0 (0.0%) |
| Total | 1,199 (98.5%) | 18 (1.5%) |
Income Below Poverty Among Single-Parent Households in Kildeer
| Children | Single Father | Single Mother |
| No Children | 0 (0.0%) | 0 (0.0%) |
| 1 or 2 Children | 0 (0.0%) | 0 (0.0%) |
| 3 or 4 Children | 0 (0.0%) | 0 (0.0%) |
| 5 or more Children | 0 (0.0%) | 0 (0.0%) |
| Total | 0 (0.0%) | 0 (0.0%) |
Income Below Poverty Among Married-Couple vs Single-Parent Households in Kildeer
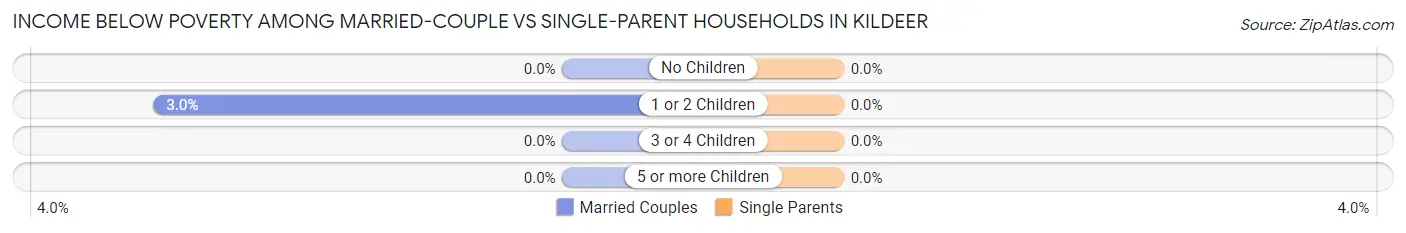
| Children | Married-Couple Families | Single-Parent Households |
| No Children | 0 (0.0%) | 0 (0.0%) |
| 1 or 2 Children | 18 (3.0%) | 0 (0.0%) |
| 3 or 4 Children | 0 (0.0%) | 0 (0.0%) |
| 5 or more Children | 0 (0.0%) | 0 (0.0%) |
| Total | 18 (1.5%) | 0 (0.0%) |
Race in Kildeer
The most populous races in Kildeer are White / Caucasian (3,153 | 76.3%), Asian (796 | 19.3%), and Two or more Races (176 | 4.3%).
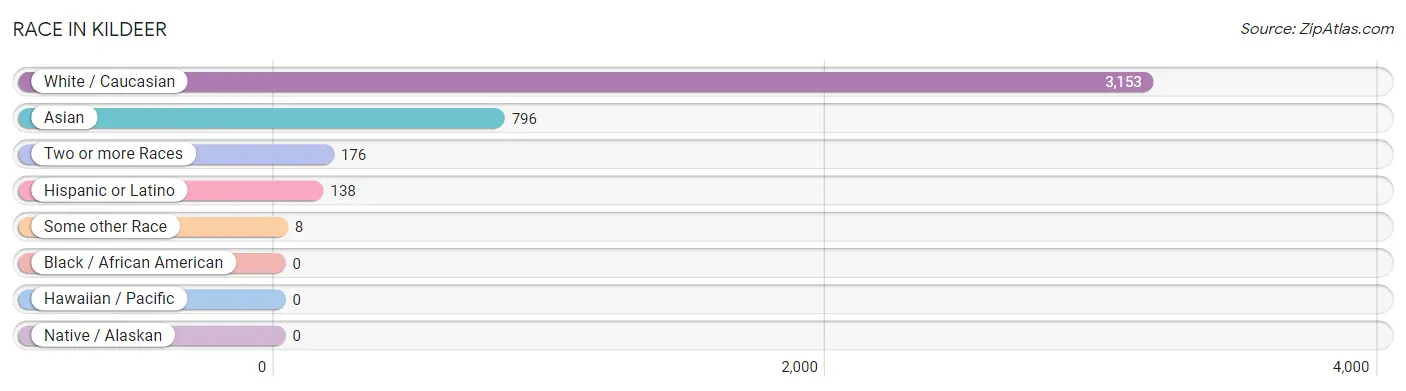
| Race | # Population | % Population |
| Asian | 796 | 19.3% |
| Black / African American | 0 | 0.0% |
| Hawaiian / Pacific | 0 | 0.0% |
| Hispanic or Latino | 138 | 3.3% |
| Native / Alaskan | 0 | 0.0% |
| White / Caucasian | 3,153 | 76.3% |
| Two or more Races | 176 | 4.3% |
| Some other Race | 8 | 0.2% |
| Total | 4,133 | 100.0% |
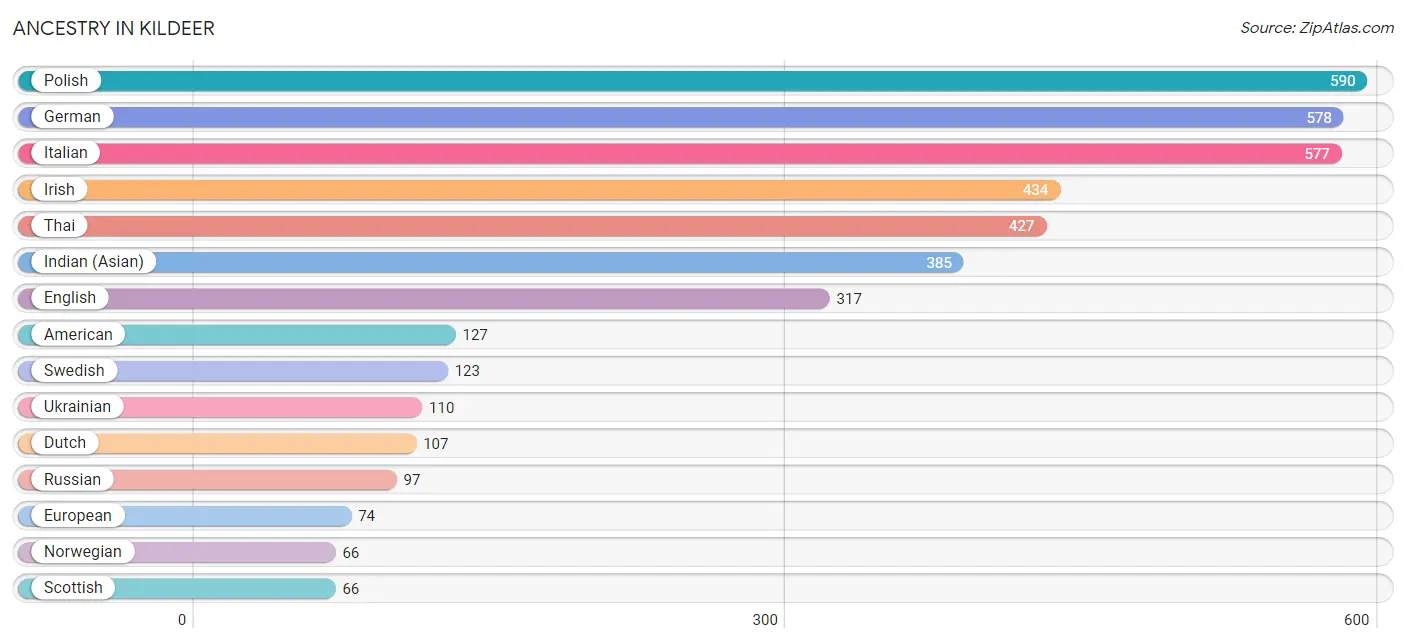
Ancestry in Kildeer
The most populous ancestries reported in Kildeer are Polish (590 | 14.3%), German (578 | 14.0%), Italian (577 | 14.0%), Irish (434 | 10.5%), and Thai (427 | 10.3%), together accounting for 63.1% of all Kildeer residents.
| Ancestry | # Population | % Population |
| Albanian | 15 | 0.4% |
| American | 127 | 3.1% |
| Austrian | 35 | 0.9% |
| Brazilian | 19 | 0.5% |
| British | 20 | 0.5% |
| Burmese | 41 | 1.0% |
| Cajun | 14 | 0.3% |
| Colombian | 29 | 0.7% |
| Croatian | 9 | 0.2% |
| Czech | 18 | 0.4% |
| Czechoslovakian | 22 | 0.5% |
| Dutch | 107 | 2.6% |
| Eastern European | 12 | 0.3% |
| English | 317 | 7.7% |
| European | 74 | 1.8% |
| Filipino | 21 | 0.5% |
| French | 59 | 1.4% |
| German | 578 | 14.0% |
| Greek | 21 | 0.5% |
| Haitian | 19 | 0.5% |
| Hungarian | 16 | 0.4% |
| Indian (Asian) | 385 | 9.3% |
| Irish | 434 | 10.5% |
| Israeli | 24 | 0.6% |
| Italian | 577 | 14.0% |
| Lithuanian | 28 | 0.7% |
| Mexican | 35 | 0.9% |
| Northern European | 7 | 0.2% |
| Norwegian | 66 | 1.6% |
| Polish | 590 | 14.3% |
| Puerto Rican | 45 | 1.1% |
| Romanian | 48 | 1.2% |
| Russian | 97 | 2.4% |
| Scottish | 66 | 1.6% |
| Serbian | 49 | 1.2% |
| Slovak | 25 | 0.6% |
| South American | 29 | 0.7% |
| Spaniard | 21 | 0.5% |
| Spanish | 8 | 0.2% |
| Swedish | 123 | 3.0% |
| Thai | 427 | 10.3% |
| Ukrainian | 110 | 2.7% | View All 42 Rows |
Immigrants in Kildeer
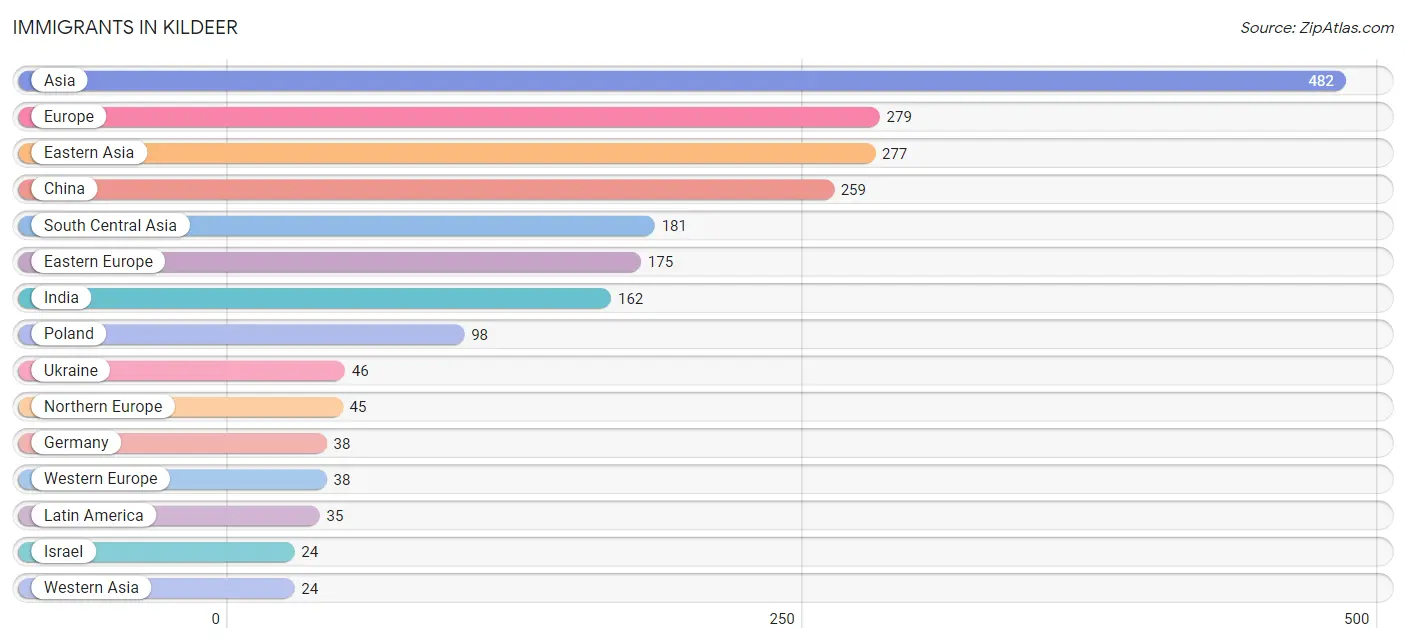
The most numerous immigrant groups reported in Kildeer came from Asia (482 | 11.7%), Europe (279 | 6.8%), Eastern Asia (277 | 6.7%), China (259 | 6.3%), and South Central Asia (181 | 4.4%), together accounting for 35.8% of all Kildeer residents.
| Immigration Origin | # Population | % Population |
| Asia | 482 | 11.7% |
| Belarus | 9 | 0.2% |
| Brazil | 14 | 0.3% |
| Central America | 14 | 0.3% |
| China | 259 | 6.3% |
| Colombia | 7 | 0.2% |
| Eastern Asia | 277 | 6.7% |
| Eastern Europe | 175 | 4.2% |
| England | 22 | 0.5% |
| Europe | 279 | 6.8% |
| Germany | 38 | 0.9% |
| India | 162 | 3.9% |
| Iran | 7 | 0.2% |
| Israel | 24 | 0.6% |
| Kazakhstan | 12 | 0.3% |
| Korea | 18 | 0.4% |
| Latin America | 35 | 0.9% |
| Mexico | 14 | 0.3% |
| Northern Europe | 45 | 1.1% |
| Poland | 98 | 2.4% |
| Romania | 12 | 0.3% |
| Russia | 10 | 0.2% |
| Scotland | 7 | 0.2% |
| South America | 21 | 0.5% |
| South Central Asia | 181 | 4.4% |
| Southern Europe | 21 | 0.5% |
| Spain | 21 | 0.5% |
| Taiwan | 23 | 0.6% |
| Ukraine | 46 | 1.1% |
| Western Asia | 24 | 0.6% |
| Western Europe | 38 | 0.9% | View All 31 Rows |
Sex and Age in Kildeer
Sex and Age in Kildeer
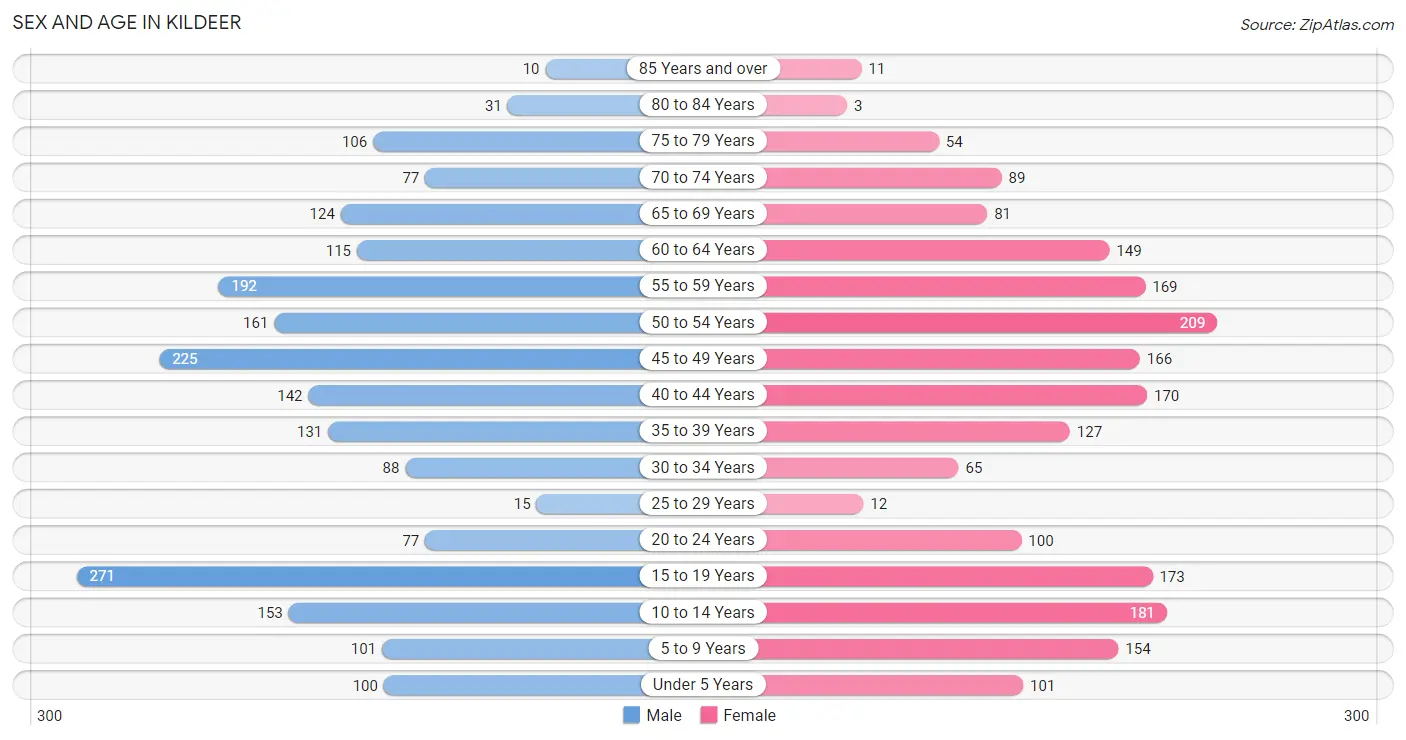
The most populous age groups in Kildeer are 15 to 19 Years (271 | 12.8%) for men and 50 to 54 Years (209 | 10.4%) for women.
| Age Bracket | Male | Female |
| Under 5 Years | 100 (4.7%) | 101 (5.0%) |
| 5 to 9 Years | 101 (4.8%) | 154 (7.6%) |
| 10 to 14 Years | 153 (7.2%) | 181 (9.0%) |
| 15 to 19 Years | 271 (12.8%) | 173 (8.6%) |
| 20 to 24 Years | 77 (3.6%) | 100 (5.0%) |
| 25 to 29 Years | 15 (0.7%) | 12 (0.6%) |
| 30 to 34 Years | 88 (4.2%) | 65 (3.2%) |
| 35 to 39 Years | 131 (6.2%) | 127 (6.3%) |
| 40 to 44 Years | 142 (6.7%) | 170 (8.4%) |
| 45 to 49 Years | 225 (10.6%) | 166 (8.2%) |
| 50 to 54 Years | 161 (7.6%) | 209 (10.4%) |
| 55 to 59 Years | 192 (9.1%) | 169 (8.4%) |
| 60 to 64 Years | 115 (5.4%) | 149 (7.4%) |
| 65 to 69 Years | 124 (5.9%) | 81 (4.0%) |
| 70 to 74 Years | 77 (3.6%) | 89 (4.4%) |
| 75 to 79 Years | 106 (5.0%) | 54 (2.7%) |
| 80 to 84 Years | 31 (1.5%) | 3 (0.2%) |
| 85 Years and over | 10 (0.5%) | 11 (0.5%) |
| Total | 2,119 (100.0%) | 2,014 (100.0%) |
Families and Households in Kildeer
Median Family Size in Kildeer
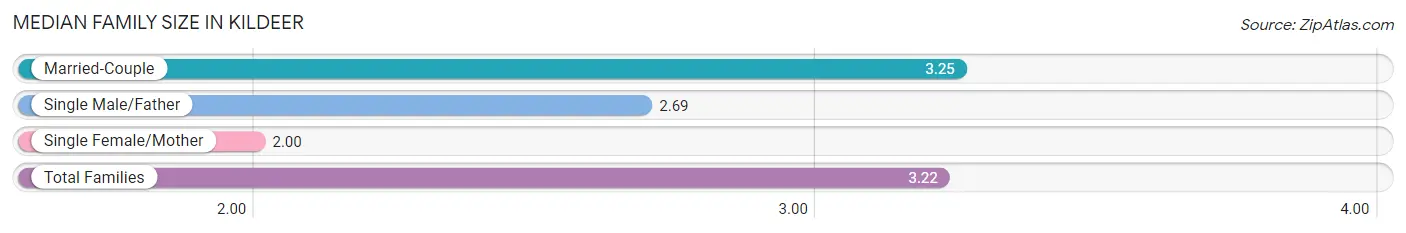
The median family size in Kildeer is 3.22 persons per family, with married-couple families (1,217 | 97.2%) accounting for the largest median family size of 3.25 persons per family. On the other hand, single female/mother families (22 | 1.8%) represent the smallest median family size with 2.00 persons per family.
| Family Type | # Families | Family Size |
| Married-Couple | 1,217 (97.2%) | 3.25 |
| Single Male/Father | 13 (1.0%) | 2.69 |
| Single Female/Mother | 22 (1.8%) | 2.00 |
| Total Families | 1,252 (100.0%) | 3.22 |
Median Household Size in Kildeer
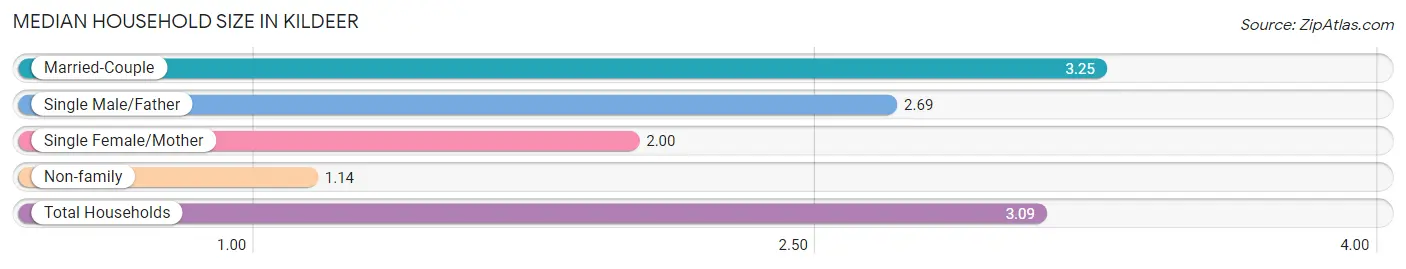
The median household size in Kildeer is 3.09 persons per household, with married-couple households (1,217 | 90.9%) accounting for the largest median household size of 3.25 persons per household. non-family households (87 | 6.5%) represent the smallest median household size with 1.14 persons per household.
| Household Type | # Households | Household Size |
| Married-Couple | 1,217 (90.9%) | 3.25 |
| Single Male/Father | 13 (1.0%) | 2.69 |
| Single Female/Mother | 22 (1.6%) | 2.00 |
| Non-family | 87 (6.5%) | 1.14 |
| Total Households | 1,339 (100.0%) | 3.09 |
Household Size by Marriage Status in Kildeer
Out of a total of 1,339 households in Kildeer, 1,252 (93.5%) are family households, while 87 (6.5%) are nonfamily households. The most numerous type of family households are 2-person households, comprising 441, and the most common type of nonfamily households are 1-person households, comprising 75.
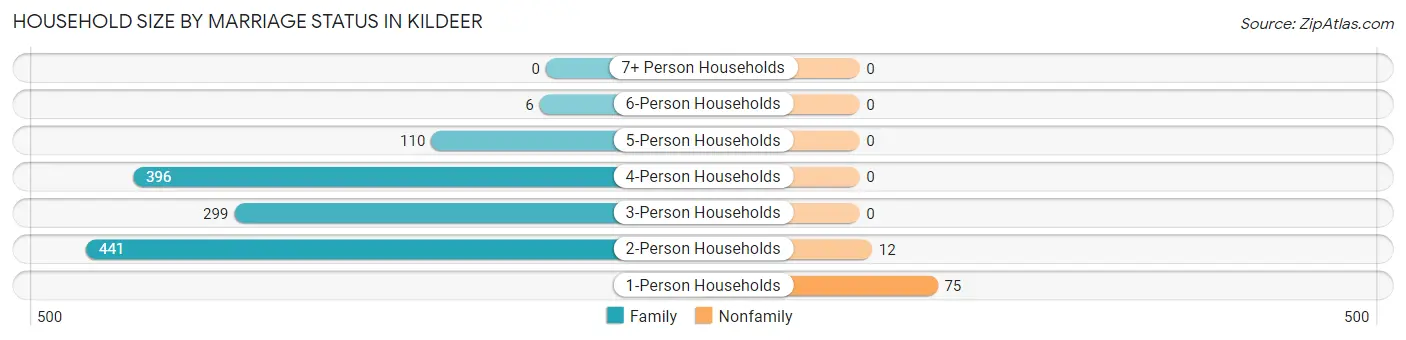
| Household Size | Family Households | Nonfamily Households |
| 1-Person Households | - | 75 (5.6%) |
| 2-Person Households | 441 (32.9%) | 12 (0.9%) |
| 3-Person Households | 299 (22.3%) | 0 (0.0%) |
| 4-Person Households | 396 (29.6%) | 0 (0.0%) |
| 5-Person Households | 110 (8.2%) | 0 (0.0%) |
| 6-Person Households | 6 (0.4%) | 0 (0.0%) |
| 7+ Person Households | 0 (0.0%) | 0 (0.0%) |
| Total | 1,252 (93.5%) | 87 (6.5%) |
Female Fertility in Kildeer
Fertility by Age in Kildeer
Average fertility rate in Kildeer is 58.0 births per 1,000 women. Women in the age bracket of 20 to 34 years have the highest fertility rate with 107.0 births per 1,000 women. Women in the age bracket of 35 to 50 years acount for 63.5% of all women with births.
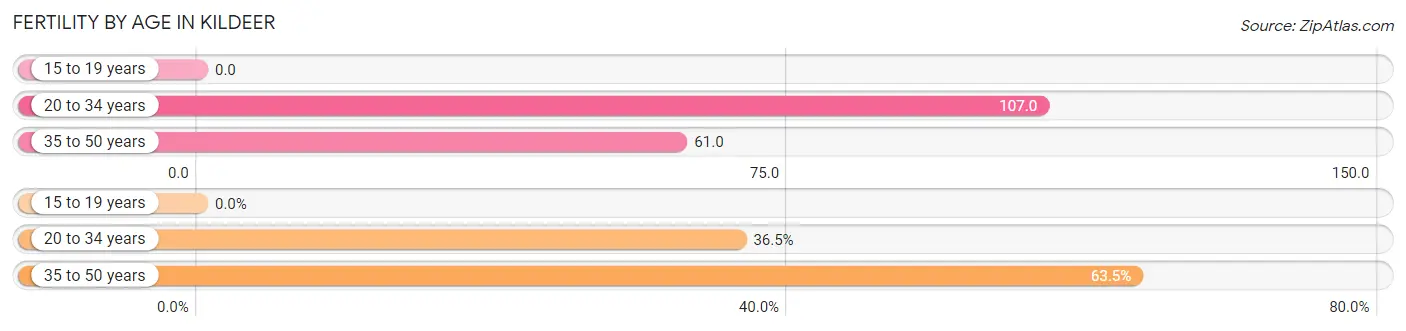
| Age Bracket | Women with Births | Births / 1,000 Women |
| 15 to 19 years | 0 (0.0%) | 0.0 |
| 20 to 34 years | 19 (36.5%) | 107.0 |
| 35 to 50 years | 33 (63.5%) | 61.0 |
| Total | 52 (100.0%) | 58.0 |
Fertility by Age by Marriage Status in Kildeer
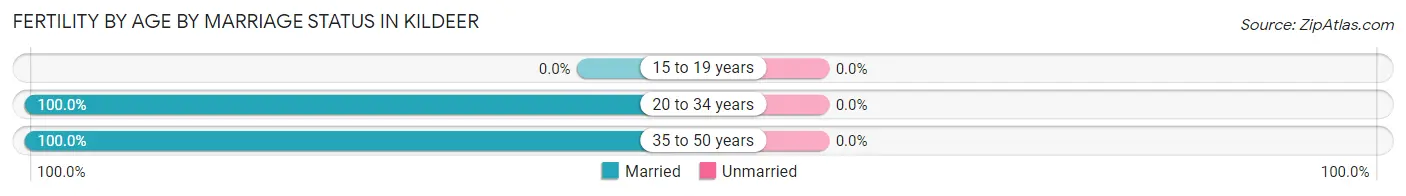
| Age Bracket | Married | Unmarried |
| 15 to 19 years | 0 (0.0%) | 0 (0.0%) |
| 20 to 34 years | 19 (100.0%) | 0 (0.0%) |
| 35 to 50 years | 33 (100.0%) | 0 (0.0%) |
| Total | 52 (100.0%) | 0 (0.0%) |
Fertility by Education in Kildeer
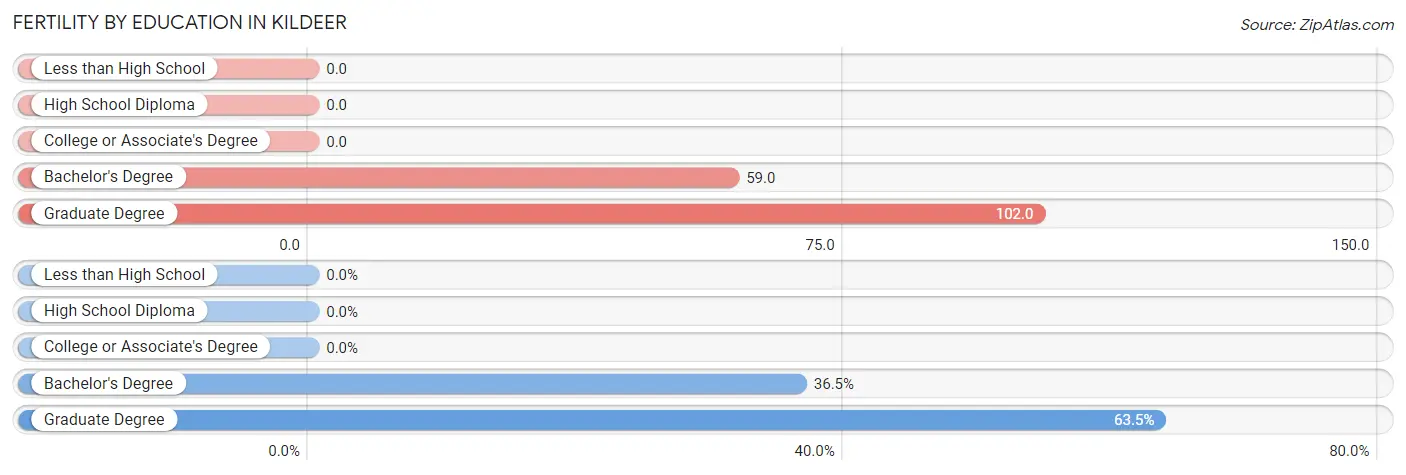
| Educational Attainment | Women with Births | Births / 1,000 Women |
| Less than High School | 0 (0.0%) | 0.0 |
| High School Diploma | 0 (0.0%) | 0.0 |
| College or Associate's Degree | 0 (0.0%) | 0.0 |
| Bachelor's Degree | 19 (36.5%) | 59.0 |
| Graduate Degree | 33 (63.5%) | 102.0 |
| Total | 52 (100.0%) | 58.0 |
Fertility by Education by Marriage Status in Kildeer
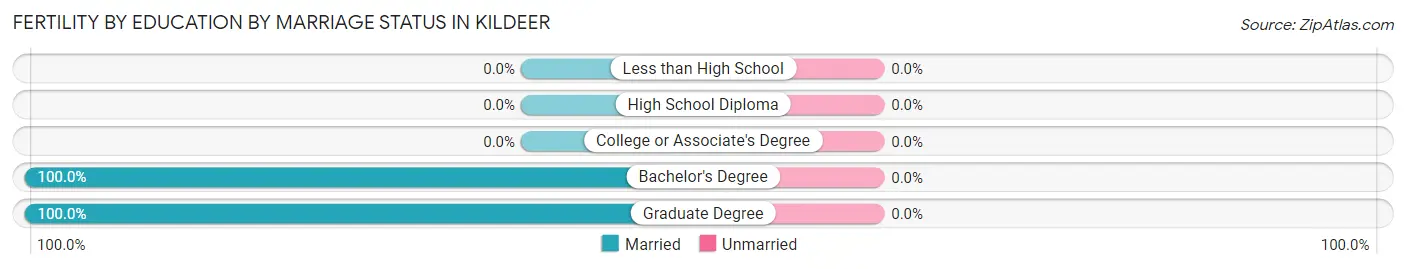
| Educational Attainment | Married | Unmarried |
| Less than High School | 0 (0.0%) | 0 (0.0%) |
| High School Diploma | 0 (0.0%) | 0 (0.0%) |
| College or Associate's Degree | 0 (0.0%) | 0 (0.0%) |
| Bachelor's Degree | 19 (100.0%) | 0 (0.0%) |
| Graduate Degree | 33 (100.0%) | 0 (0.0%) |
| Total | 52 (100.0%) | 0 (0.0%) |
Employment Characteristics in Kildeer
Employment by Class of Employer in Kildeer
Among the 2,089 employed individuals in Kildeer, private company employees (1,613 | 77.2%), self-employed (incorporated) (199 | 9.5%), and not-for-profit organizations (100 | 4.8%) make up the most common classes of employment.
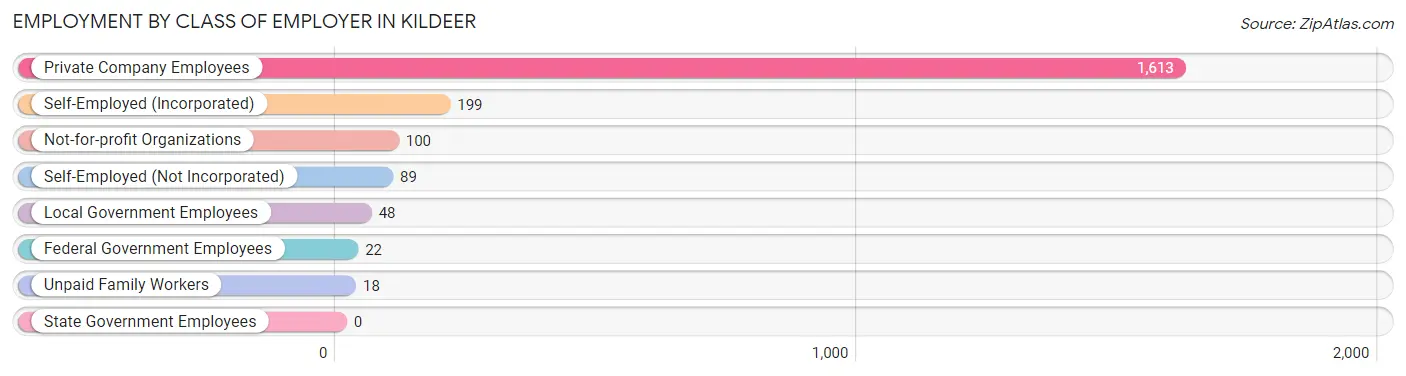
| Employer Class | # Employees | % Employees |
| Private Company Employees | 1,613 | 77.2% |
| Self-Employed (Incorporated) | 199 | 9.5% |
| Self-Employed (Not Incorporated) | 89 | 4.3% |
| Not-for-profit Organizations | 100 | 4.8% |
| Local Government Employees | 48 | 2.3% |
| State Government Employees | 0 | 0.0% |
| Federal Government Employees | 22 | 1.1% |
| Unpaid Family Workers | 18 | 0.9% |
| Total | 2,089 | 100.0% |
Employment Status by Age in Kildeer
According to the labor force statistics for Kildeer, out of the total population over 16 years of age (3,244), 66.8% or 2,167 individuals are in the labor force, with 3.1% or 67 of them unemployed. The age group with the highest labor force participation rate is 25 to 29 years, with 100.0% or 27 individuals in the labor force. Within the labor force, the 16 to 19 years age range has the highest percentage of unemployed individuals, with 37.9% or 22 of them being unemployed.
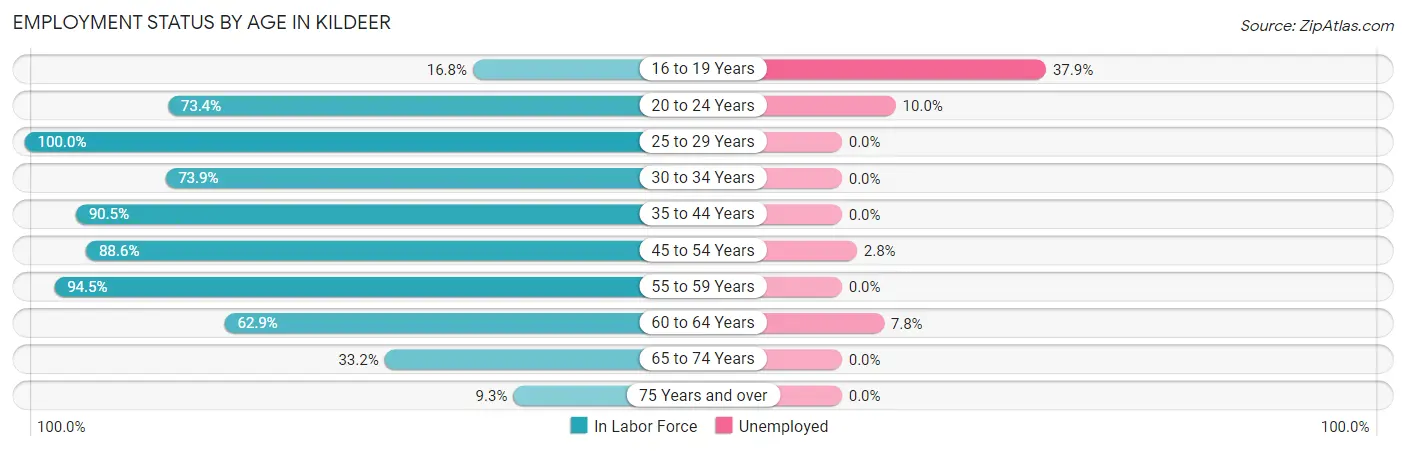
| Age Bracket | In Labor Force | Unemployed |
| 16 to 19 Years | 58 (16.8%) | 22 (37.9%) |
| 20 to 24 Years | 130 (73.4%) | 13 (10.0%) |
| 25 to 29 Years | 27 (100.0%) | 0 (0.0%) |
| 30 to 34 Years | 113 (73.9%) | 0 (0.0%) |
| 35 to 44 Years | 516 (90.5%) | 0 (0.0%) |
| 45 to 54 Years | 674 (88.6%) | 19 (2.8%) |
| 55 to 59 Years | 341 (94.5%) | 0 (0.0%) |
| 60 to 64 Years | 166 (62.9%) | 13 (7.8%) |
| 65 to 74 Years | 123 (33.2%) | 0 (0.0%) |
| 75 Years and over | 20 (9.3%) | 0 (0.0%) |
| Total | 2,167 (66.8%) | 67 (3.1%) |
Employment Status by Educational Attainment in Kildeer
According to labor force statistics for Kildeer, 86.0% of individuals (1,837) out of the total population between 25 and 64 years of age (2,136) are in the labor force, with 1.7% or 31 of them being unemployed. The group with the highest labor force participation rate are those with the educational attainment of high school diploma, with 92.9% or 91 individuals in the labor force. Within the labor force, individuals with college / associate degree education have the highest percentage of unemployment, with 10.5% or 19 of them being unemployed.
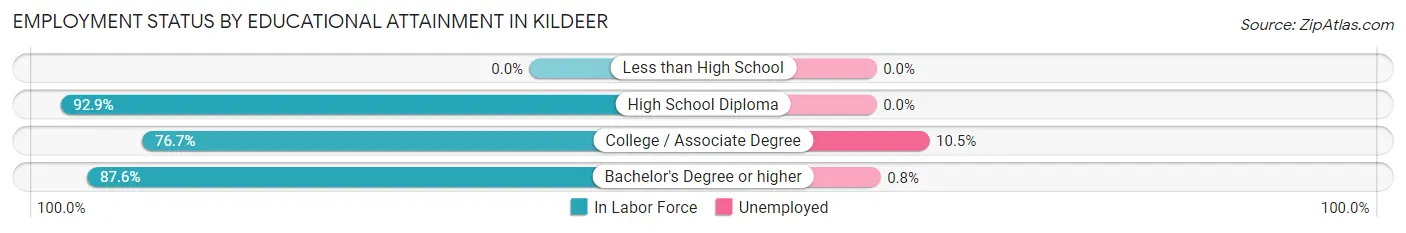
| Educational Attainment | In Labor Force | Unemployed |
| Less than High School | 0 (0.0%) | 0 (0.0%) |
| High School Diploma | 91 (92.9%) | 0 (0.0%) |
| College / Associate Degree | 181 (76.7%) | 25 (10.5%) |
| Bachelor's Degree or higher | 1,565 (87.6%) | 14 (0.8%) |
| Total | 1,837 (86.0%) | 36 (1.7%) |
Employment Occupations by Sex in Kildeer
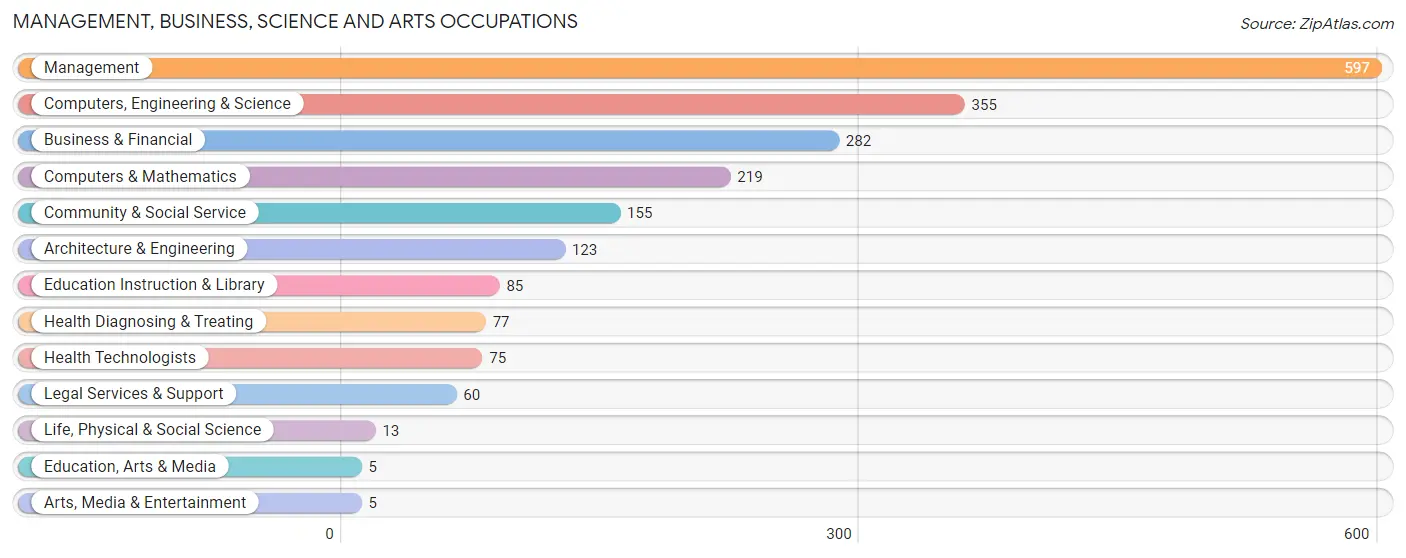
Management, Business, Science and Arts Occupations
The most common Management, Business, Science and Arts occupations in Kildeer are Management (597 | 28.4%), Computers, Engineering & Science (355 | 16.9%), Business & Financial (282 | 13.4%), Computers & Mathematics (219 | 10.4%), and Community & Social Service (155 | 7.4%).
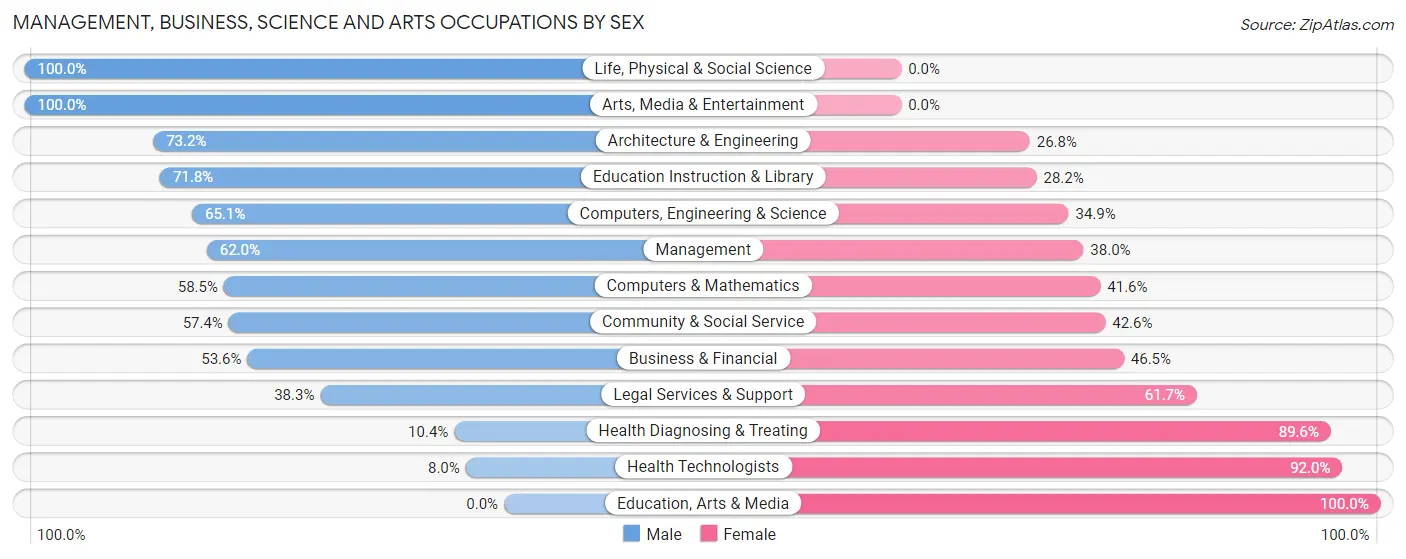
Management, Business, Science and Arts Occupations by Sex
Within the Management, Business, Science and Arts occupations in Kildeer, the most male-oriented occupations are Life, Physical & Social Science (100.0%), Arts, Media & Entertainment (100.0%), and Architecture & Engineering (73.2%), while the most female-oriented occupations are Education, Arts & Media (100.0%), Health Technologists (92.0%), and Health Diagnosing & Treating (89.6%).
| Occupation | Male | Female |
| Management | 370 (62.0%) | 227 (38.0%) |
| Business & Financial | 151 (53.5%) | 131 (46.5%) |
| Computers, Engineering & Science | 231 (65.1%) | 124 (34.9%) |
| Computers & Mathematics | 128 (58.5%) | 91 (41.5%) |
| Architecture & Engineering | 90 (73.2%) | 33 (26.8%) |
| Life, Physical & Social Science | 13 (100.0%) | 0 (0.0%) |
| Community & Social Service | 89 (57.4%) | 66 (42.6%) |
| Education, Arts & Media | 0 (0.0%) | 5 (100.0%) |
| Legal Services & Support | 23 (38.3%) | 37 (61.7%) |
| Education Instruction & Library | 61 (71.8%) | 24 (28.2%) |
| Arts, Media & Entertainment | 5 (100.0%) | 0 (0.0%) |
| Health Diagnosing & Treating | 8 (10.4%) | 69 (89.6%) |
| Health Technologists | 6 (8.0%) | 69 (92.0%) |
| Total (Category) | 849 (57.9%) | 617 (42.1%) |
| Total (Overall) | 1,157 (55.1%) | 944 (44.9%) |
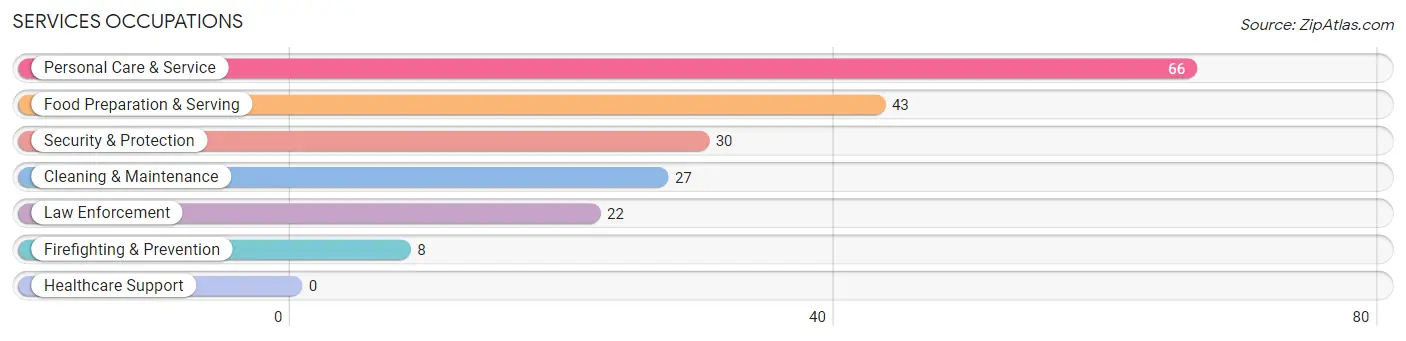
Services Occupations
The most common Services occupations in Kildeer are Personal Care & Service (66 | 3.1%), Food Preparation & Serving (43 | 2.1%), Security & Protection (30 | 1.4%), Cleaning & Maintenance (27 | 1.3%), and Law Enforcement (22 | 1.1%).
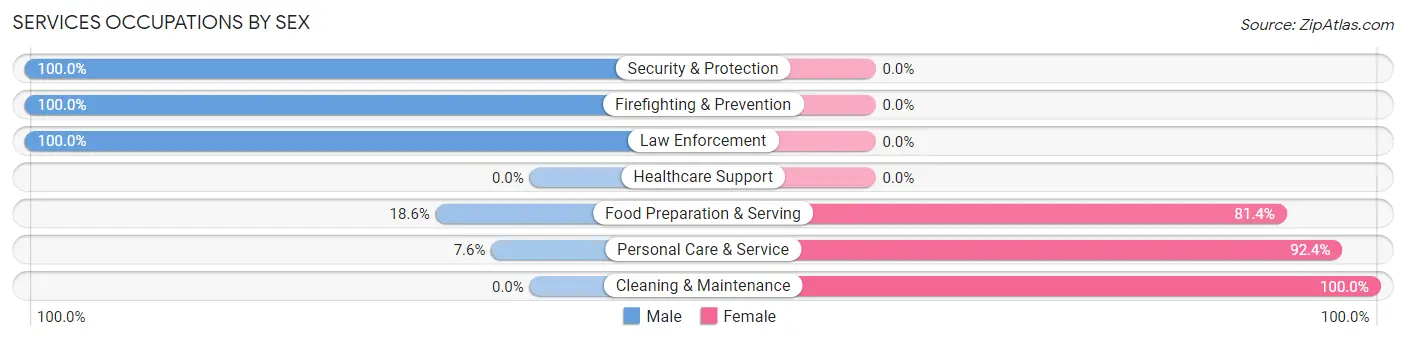
Services Occupations by Sex
Within the Services occupations in Kildeer, the most male-oriented occupations are Security & Protection (100.0%), Firefighting & Prevention (100.0%), and Law Enforcement (100.0%), while the most female-oriented occupations are Cleaning & Maintenance (100.0%), Personal Care & Service (92.4%), and Food Preparation & Serving (81.4%).
| Occupation | Male | Female |
| Healthcare Support | 0 (0.0%) | 0 (0.0%) |
| Security & Protection | 30 (100.0%) | 0 (0.0%) |
| Firefighting & Prevention | 8 (100.0%) | 0 (0.0%) |
| Law Enforcement | 22 (100.0%) | 0 (0.0%) |
| Food Preparation & Serving | 8 (18.6%) | 35 (81.4%) |
| Cleaning & Maintenance | 0 (0.0%) | 27 (100.0%) |
| Personal Care & Service | 5 (7.6%) | 61 (92.4%) |
| Total (Category) | 43 (25.9%) | 123 (74.1%) |
| Total (Overall) | 1,157 (55.1%) | 944 (44.9%) |
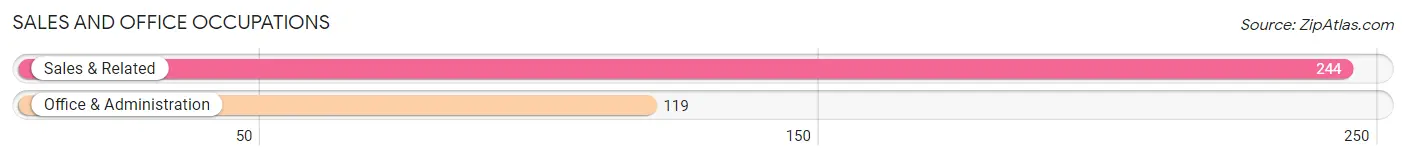
Sales and Office Occupations
The most common Sales and Office occupations in Kildeer are Sales & Related (244 | 11.6%), and Office & Administration (119 | 5.7%).
Sales and Office Occupations by Sex
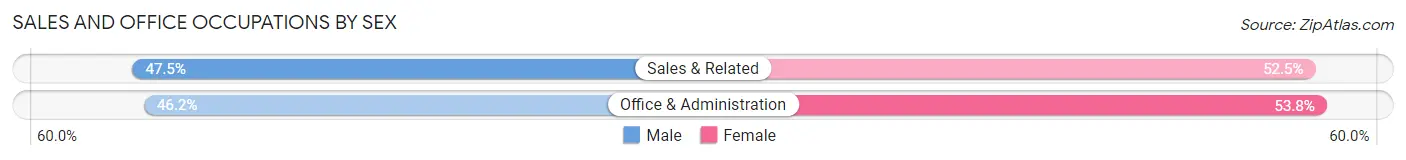
| Occupation | Male | Female |
| Sales & Related | 116 (47.5%) | 128 (52.5%) |
| Office & Administration | 55 (46.2%) | 64 (53.8%) |
| Total (Category) | 171 (47.1%) | 192 (52.9%) |
| Total (Overall) | 1,157 (55.1%) | 944 (44.9%) |
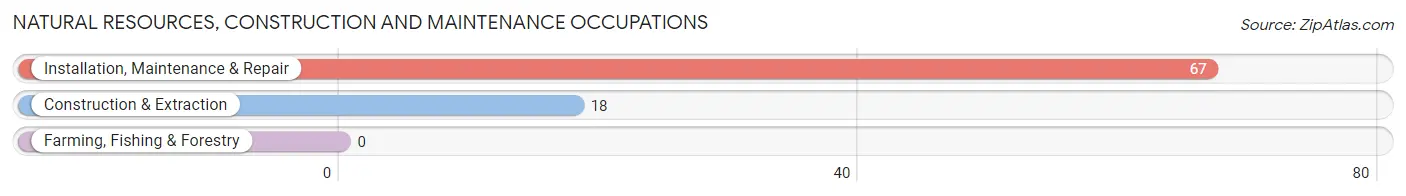
Natural Resources, Construction and Maintenance Occupations
The most common Natural Resources, Construction and Maintenance occupations in Kildeer are Installation, Maintenance & Repair (67 | 3.2%), and Construction & Extraction (18 | 0.9%).
Natural Resources, Construction and Maintenance Occupations by Sex
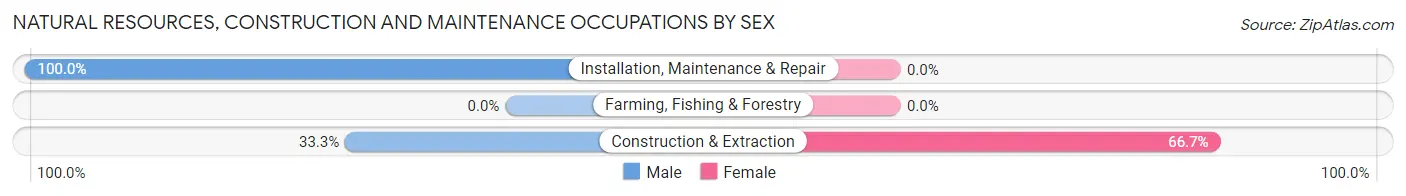
| Occupation | Male | Female |
| Farming, Fishing & Forestry | 0 (0.0%) | 0 (0.0%) |
| Construction & Extraction | 6 (33.3%) | 12 (66.7%) |
| Installation, Maintenance & Repair | 67 (100.0%) | 0 (0.0%) |
| Total (Category) | 73 (85.9%) | 12 (14.1%) |
| Total (Overall) | 1,157 (55.1%) | 944 (44.9%) |
Production, Transportation and Moving Occupations
The most common Production, Transportation and Moving occupations in Kildeer are , and Material Moving (21 | 1.0%).
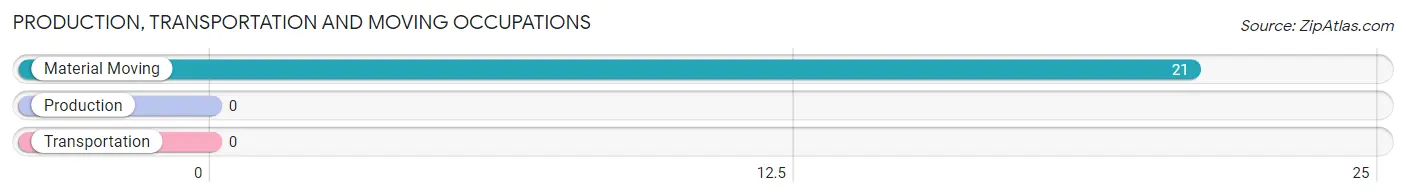
Production, Transportation and Moving Occupations by Sex
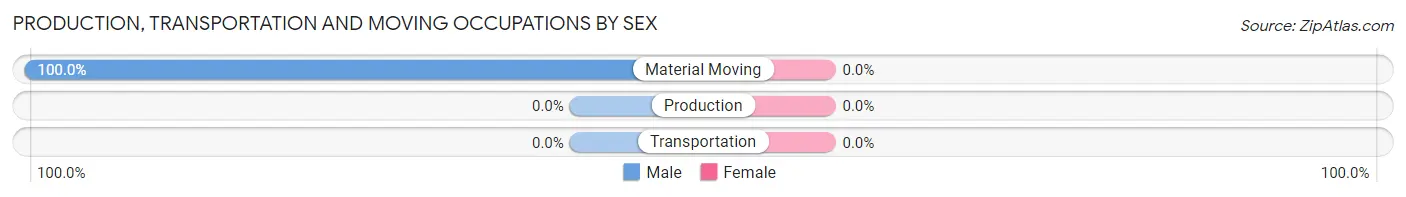
| Occupation | Male | Female |
| Production | 0 (0.0%) | 0 (0.0%) |
| Transportation | 0 (0.0%) | 0 (0.0%) |
| Material Moving | 21 (100.0%) | 0 (0.0%) |
| Total (Category) | 21 (100.0%) | 0 (0.0%) |
| Total (Overall) | 1,157 (55.1%) | 944 (44.9%) |
Employment Industries by Sex in Kildeer
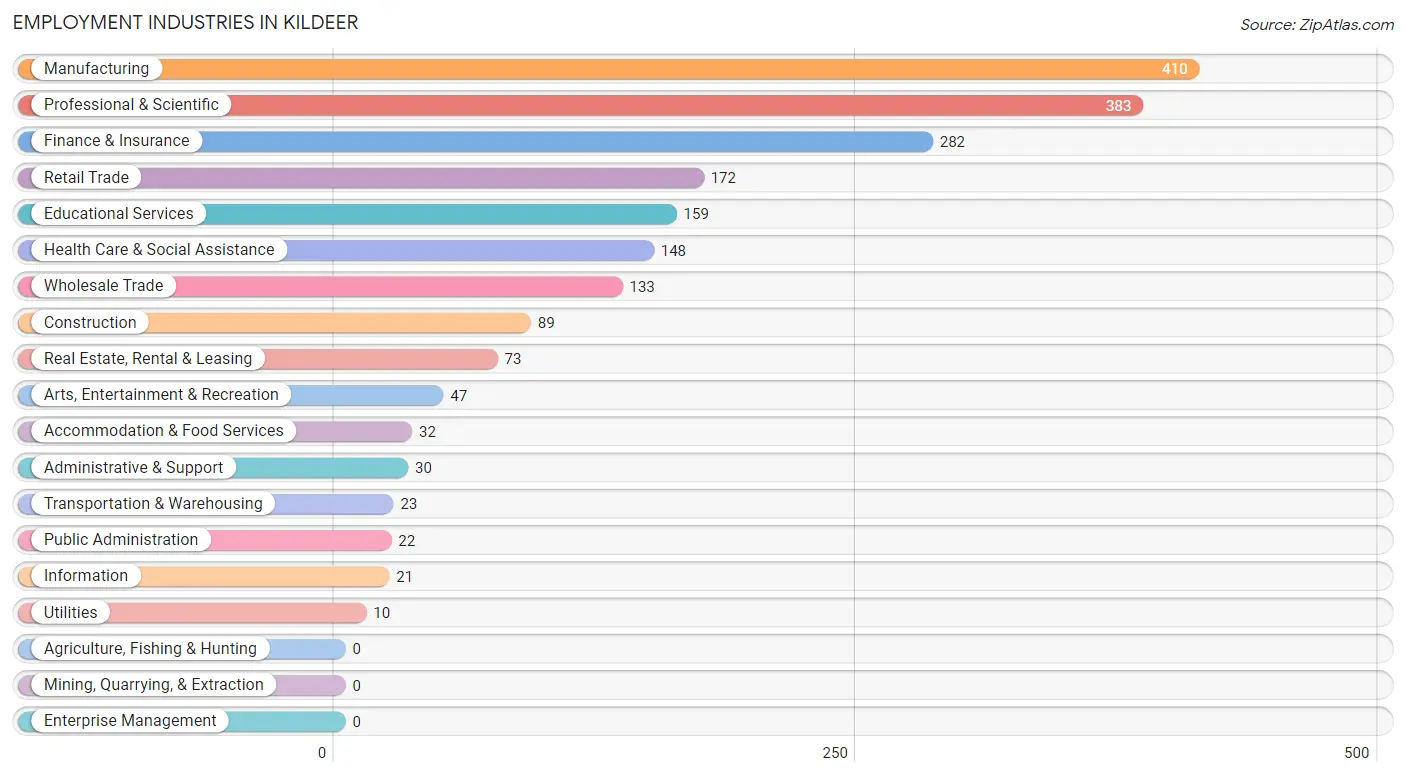
Employment Industries in Kildeer
The major employment industries in Kildeer include Manufacturing (410 | 19.5%), Professional & Scientific (383 | 18.2%), Finance & Insurance (282 | 13.4%), Retail Trade (172 | 8.2%), and Educational Services (159 | 7.6%).
Employment Industries by Sex in Kildeer
The Kildeer industries that see more men than women are Transportation & Warehousing (100.0%), Utilities (100.0%), and Public Administration (100.0%), whereas the industries that tend to have a higher number of women are Accommodation & Food Services (75.0%), Health Care & Social Assistance (69.6%), and Professional & Scientific (62.9%).
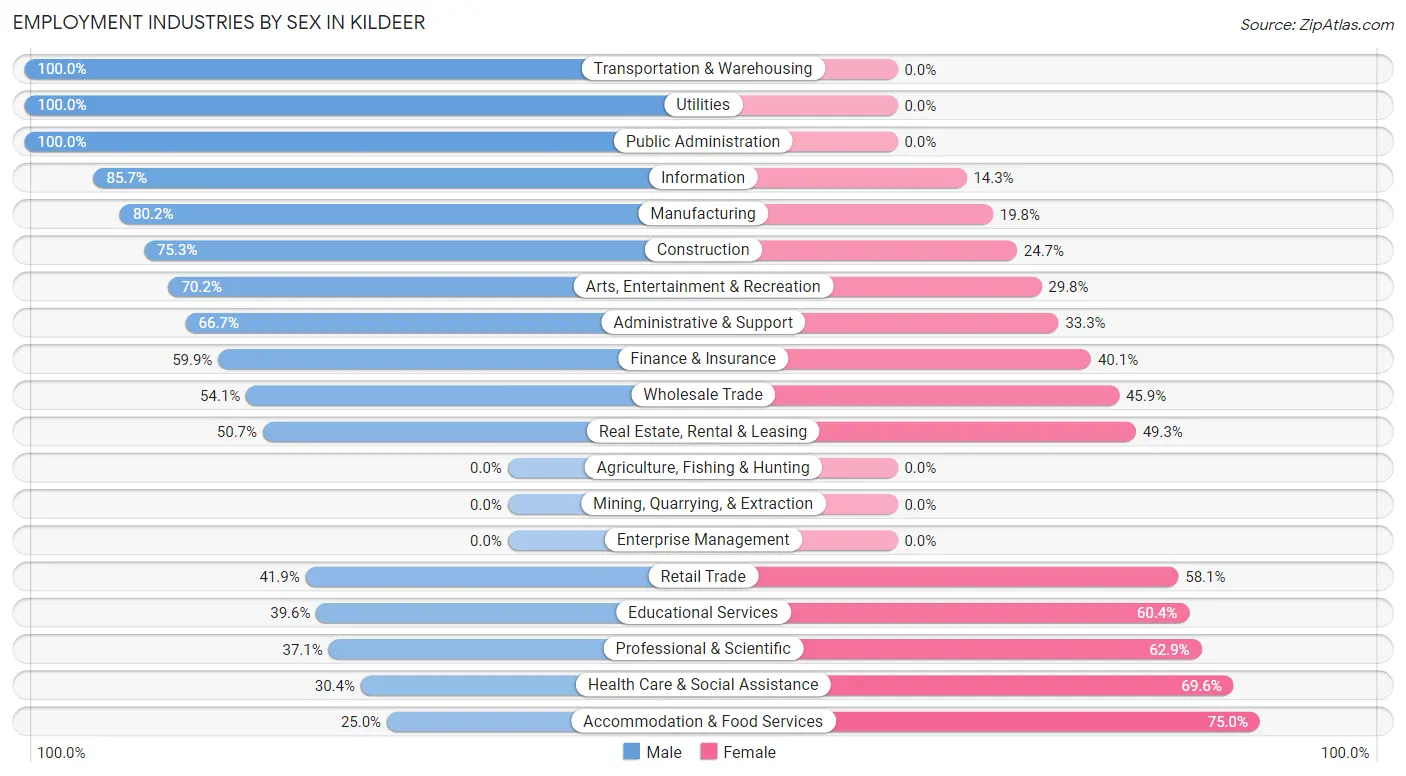
| Industry | Male | Female |
| Agriculture, Fishing & Hunting | 0 (0.0%) | 0 (0.0%) |
| Mining, Quarrying, & Extraction | 0 (0.0%) | 0 (0.0%) |
| Construction | 67 (75.3%) | 22 (24.7%) |
| Manufacturing | 329 (80.2%) | 81 (19.8%) |
| Wholesale Trade | 72 (54.1%) | 61 (45.9%) |
| Retail Trade | 72 (41.9%) | 100 (58.1%) |
| Transportation & Warehousing | 23 (100.0%) | 0 (0.0%) |
| Utilities | 10 (100.0%) | 0 (0.0%) |
| Information | 18 (85.7%) | 3 (14.3%) |
| Finance & Insurance | 169 (59.9%) | 113 (40.1%) |
| Real Estate, Rental & Leasing | 37 (50.7%) | 36 (49.3%) |
| Professional & Scientific | 142 (37.1%) | 241 (62.9%) |
| Enterprise Management | 0 (0.0%) | 0 (0.0%) |
| Administrative & Support | 20 (66.7%) | 10 (33.3%) |
| Educational Services | 63 (39.6%) | 96 (60.4%) |
| Health Care & Social Assistance | 45 (30.4%) | 103 (69.6%) |
| Arts, Entertainment & Recreation | 33 (70.2%) | 14 (29.8%) |
| Accommodation & Food Services | 8 (25.0%) | 24 (75.0%) |
| Public Administration | 22 (100.0%) | 0 (0.0%) |
| Total | 1,157 (55.1%) | 944 (44.9%) |
Education in Kildeer
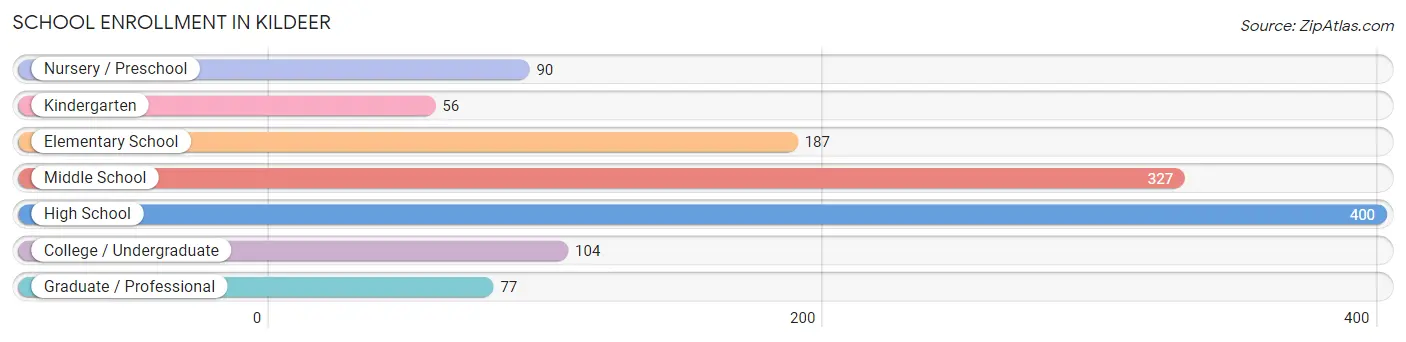
School Enrollment in Kildeer
The most common levels of schooling among the 1,241 students in Kildeer are high school (400 | 32.2%), middle school (327 | 26.4%), and elementary school (187 | 15.1%).
| School Level | # Students | % Students |
| Nursery / Preschool | 90 | 7.2% |
| Kindergarten | 56 | 4.5% |
| Elementary School | 187 | 15.1% |
| Middle School | 327 | 26.4% |
| High School | 400 | 32.2% |
| College / Undergraduate | 104 | 8.4% |
| Graduate / Professional | 77 | 6.2% |
| Total | 1,241 | 100.0% |
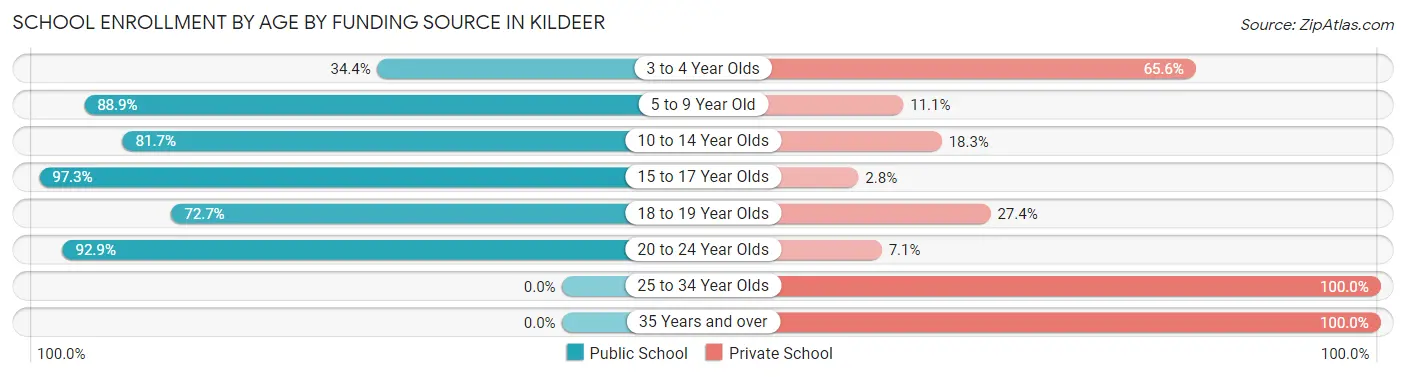
School Enrollment by Age by Funding Source in Kildeer
Out of a total of 1,241 students who are enrolled in schools in Kildeer, 213 (17.2%) attend a private institution, while the remaining 1,028 (82.8%) are enrolled in public schools. The age group of 25 to 34 year olds has the highest likelihood of being enrolled in private schools, with 2 (100.0% in the age bracket) enrolled. Conversely, the age group of 15 to 17 year olds has the lowest likelihood of being enrolled in a private school, with 318 (97.3% in the age bracket) attending a public institution.
| Age Bracket | Public School | Private School |
| 3 to 4 Year Olds | 31 (34.4%) | 59 (65.6%) |
| 5 to 9 Year Old | 216 (88.9%) | 27 (11.1%) |
| 10 to 14 Year Olds | 273 (81.7%) | 61 (18.3%) |
| 15 to 17 Year Olds | 318 (97.3%) | 9 (2.8%) |
| 18 to 19 Year Olds | 85 (72.7%) | 32 (27.4%) |
| 20 to 24 Year Olds | 105 (92.9%) | 8 (7.1%) |
| 25 to 34 Year Olds | 0 (0.0%) | 2 (100.0%) |
| 35 Years and over | 0 (0.0%) | 15 (100.0%) |
| Total | 1,028 (82.8%) | 213 (17.2%) |
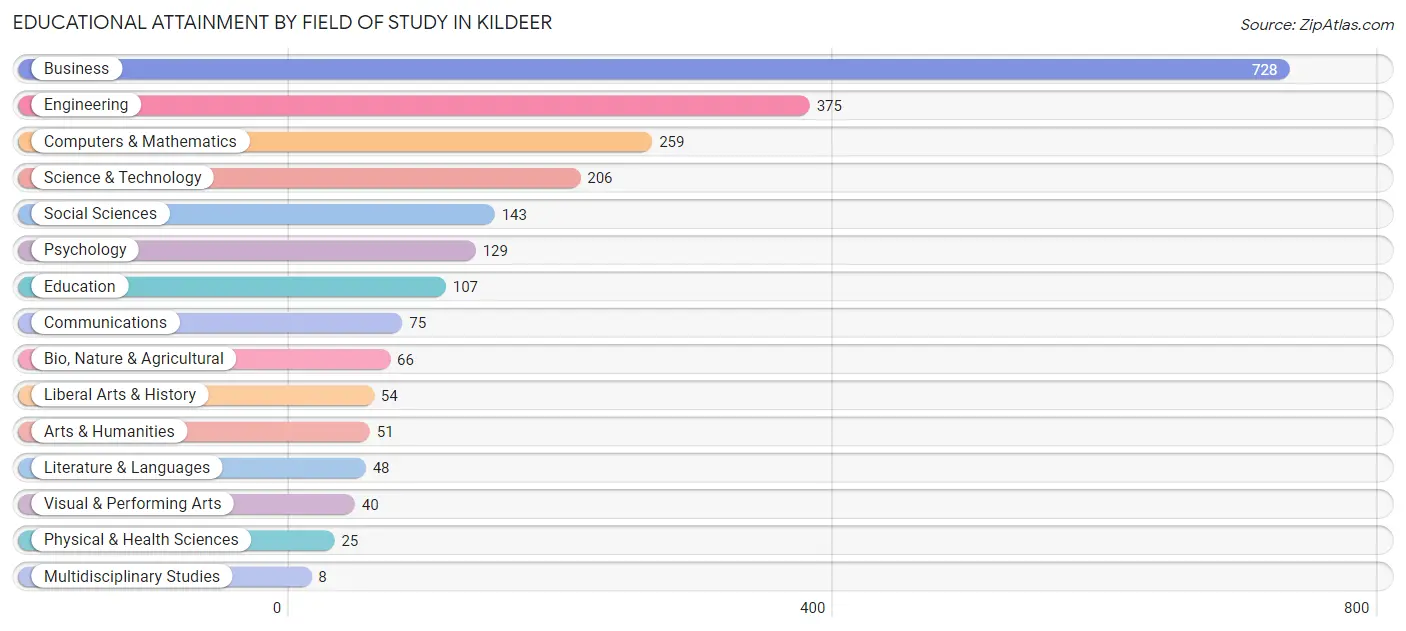
Educational Attainment by Field of Study in Kildeer
Business (728 | 31.5%), engineering (375 | 16.2%), computers & mathematics (259 | 11.2%), science & technology (206 | 8.9%), and social sciences (143 | 6.2%) are the most common fields of study among 2,314 individuals in Kildeer who have obtained a bachelor's degree or higher.
| Field of Study | # Graduates | % Graduates |
| Computers & Mathematics | 259 | 11.2% |
| Bio, Nature & Agricultural | 66 | 2.9% |
| Physical & Health Sciences | 25 | 1.1% |
| Psychology | 129 | 5.6% |
| Social Sciences | 143 | 6.2% |
| Engineering | 375 | 16.2% |
| Multidisciplinary Studies | 8 | 0.4% |
| Science & Technology | 206 | 8.9% |
| Business | 728 | 31.5% |
| Education | 107 | 4.6% |
| Literature & Languages | 48 | 2.1% |
| Liberal Arts & History | 54 | 2.3% |
| Visual & Performing Arts | 40 | 1.7% |
| Communications | 75 | 3.2% |
| Arts & Humanities | 51 | 2.2% |
| Total | 2,314 | 100.0% |
Transportation & Commute in Kildeer
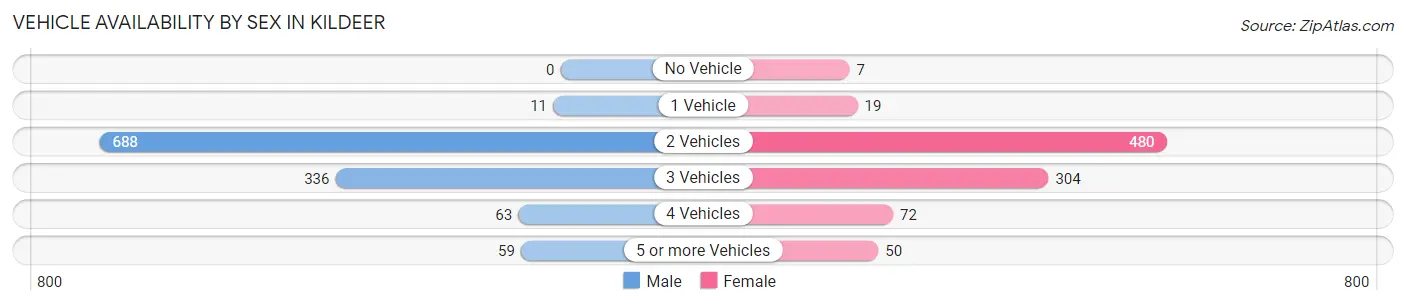
Vehicle Availability by Sex in Kildeer
The most prevalent vehicle ownership categories in Kildeer are males with 2 vehicles (688, accounting for 59.5%) and females with 2 vehicles (480, making up 73.8%).
| Vehicles Available | Male | Female |
| No Vehicle | 0 (0.0%) | 7 (0.7%) |
| 1 Vehicle | 11 (0.9%) | 19 (2.0%) |
| 2 Vehicles | 688 (59.5%) | 480 (51.5%) |
| 3 Vehicles | 336 (29.0%) | 304 (32.6%) |
| 4 Vehicles | 63 (5.4%) | 72 (7.7%) |
| 5 or more Vehicles | 59 (5.1%) | 50 (5.4%) |
| Total | 1,157 (100.0%) | 932 (100.0%) |
Commute Time in Kildeer
The most frequently occuring commute durations in Kildeer are 30 to 34 minutes (356 commuters, 23.6%), 45 to 59 minutes (183 commuters, 12.1%), and 20 to 24 minutes (162 commuters, 10.7%).
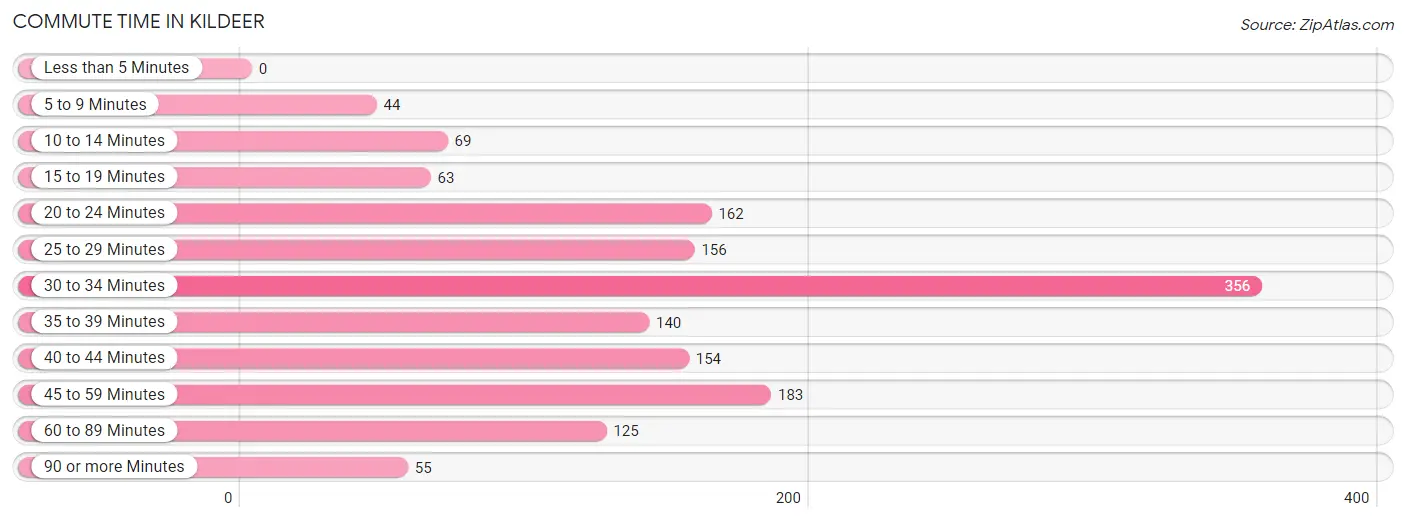
| Commute Time | # Commuters | % Commuters |
| Less than 5 Minutes | 0 | 0.0% |
| 5 to 9 Minutes | 44 | 2.9% |
| 10 to 14 Minutes | 69 | 4.6% |
| 15 to 19 Minutes | 63 | 4.2% |
| 20 to 24 Minutes | 162 | 10.7% |
| 25 to 29 Minutes | 156 | 10.3% |
| 30 to 34 Minutes | 356 | 23.6% |
| 35 to 39 Minutes | 140 | 9.3% |
| 40 to 44 Minutes | 154 | 10.2% |
| 45 to 59 Minutes | 183 | 12.1% |
| 60 to 89 Minutes | 125 | 8.3% |
| 90 or more Minutes | 55 | 3.6% |
Commute Time by Sex in Kildeer
The most common commute times in Kildeer are 30 to 34 minutes (173 commuters, 21.4%) for males and 30 to 34 minutes (183 commuters, 26.3%) for females.
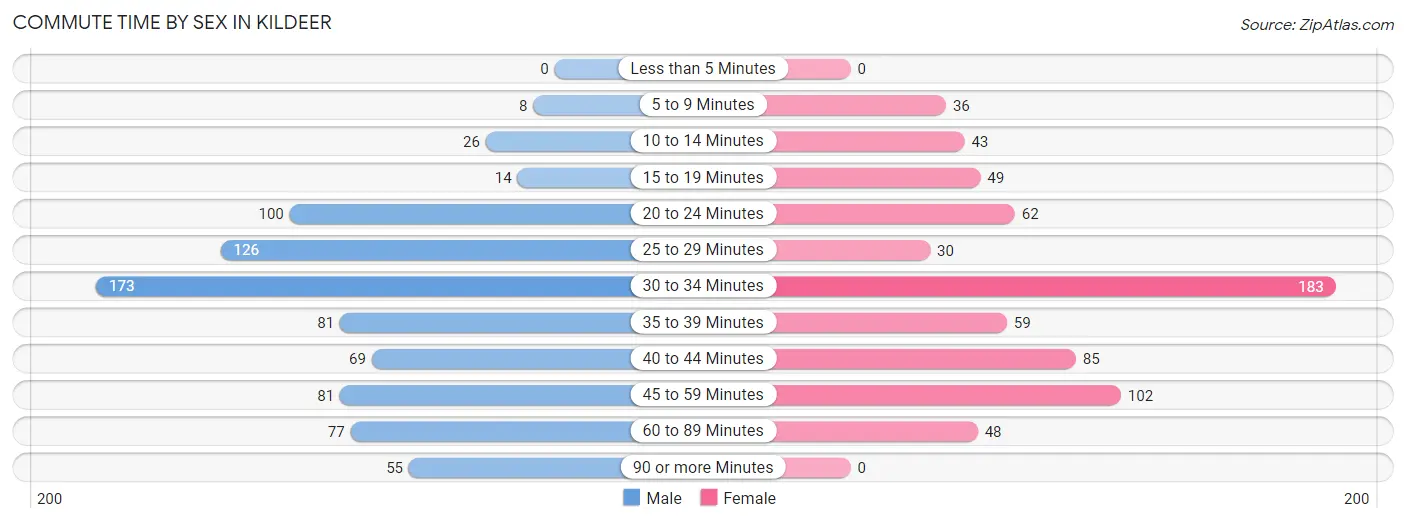
| Commute Time | Male | Female |
| Less than 5 Minutes | 0 (0.0%) | 0 (0.0%) |
| 5 to 9 Minutes | 8 (1.0%) | 36 (5.2%) |
| 10 to 14 Minutes | 26 (3.2%) | 43 (6.2%) |
| 15 to 19 Minutes | 14 (1.7%) | 49 (7.0%) |
| 20 to 24 Minutes | 100 (12.3%) | 62 (8.9%) |
| 25 to 29 Minutes | 126 (15.6%) | 30 (4.3%) |
| 30 to 34 Minutes | 173 (21.4%) | 183 (26.3%) |
| 35 to 39 Minutes | 81 (10.0%) | 59 (8.5%) |
| 40 to 44 Minutes | 69 (8.5%) | 85 (12.2%) |
| 45 to 59 Minutes | 81 (10.0%) | 102 (14.6%) |
| 60 to 89 Minutes | 77 (9.5%) | 48 (6.9%) |
| 90 or more Minutes | 55 (6.8%) | 0 (0.0%) |
Time of Departure to Work by Sex in Kildeer
The most frequent times of departure to work in Kildeer are 7:00 AM to 7:29 AM (217, 26.8%) for males and 7:00 AM to 7:29 AM (229, 32.9%) for females.
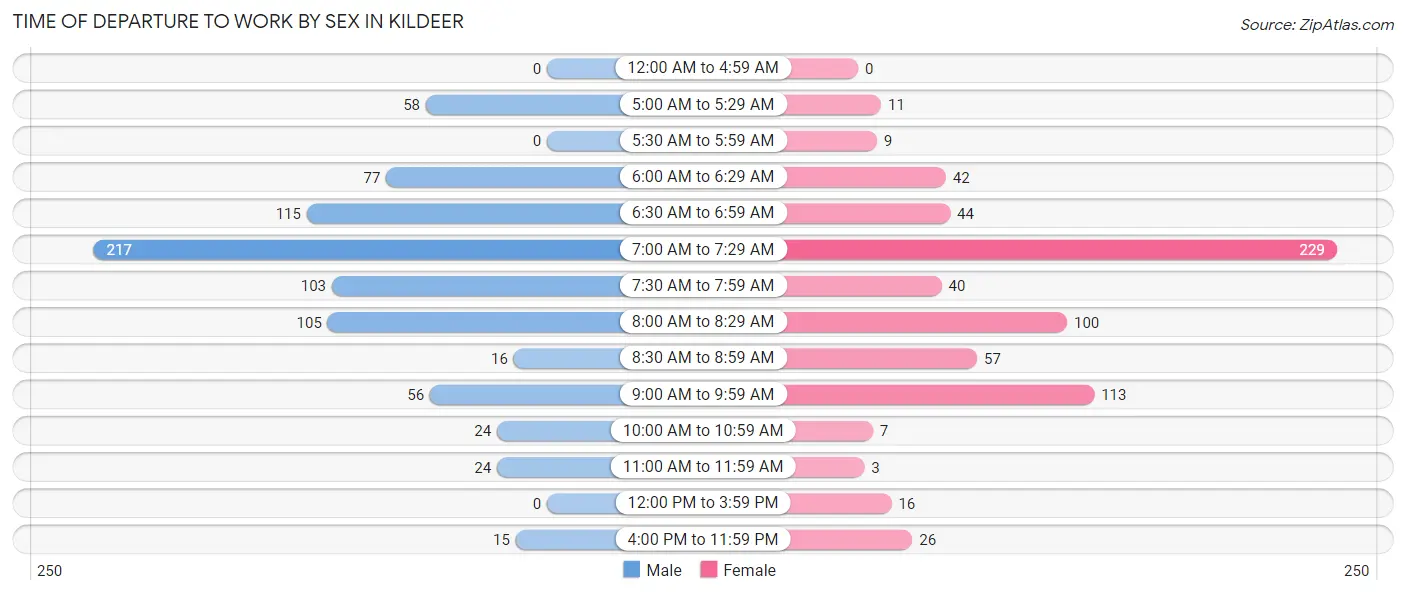
| Time of Departure | Male | Female |
| 12:00 AM to 4:59 AM | 0 (0.0%) | 0 (0.0%) |
| 5:00 AM to 5:29 AM | 58 (7.2%) | 11 (1.6%) |
| 5:30 AM to 5:59 AM | 0 (0.0%) | 9 (1.3%) |
| 6:00 AM to 6:29 AM | 77 (9.5%) | 42 (6.0%) |
| 6:30 AM to 6:59 AM | 115 (14.2%) | 44 (6.3%) |
| 7:00 AM to 7:29 AM | 217 (26.8%) | 229 (32.9%) |
| 7:30 AM to 7:59 AM | 103 (12.7%) | 40 (5.7%) |
| 8:00 AM to 8:29 AM | 105 (13.0%) | 100 (14.3%) |
| 8:30 AM to 8:59 AM | 16 (2.0%) | 57 (8.2%) |
| 9:00 AM to 9:59 AM | 56 (6.9%) | 113 (16.2%) |
| 10:00 AM to 10:59 AM | 24 (3.0%) | 7 (1.0%) |
| 11:00 AM to 11:59 AM | 24 (3.0%) | 3 (0.4%) |
| 12:00 PM to 3:59 PM | 0 (0.0%) | 16 (2.3%) |
| 4:00 PM to 11:59 PM | 15 (1.8%) | 26 (3.7%) |
| Total | 810 (100.0%) | 697 (100.0%) |
Housing Occupancy in Kildeer
Occupancy by Ownership in Kildeer
Of the total 1,339 dwellings in Kildeer, owner-occupied units account for 1,325 (99.0%), while renter-occupied units make up 14 (1.1%).
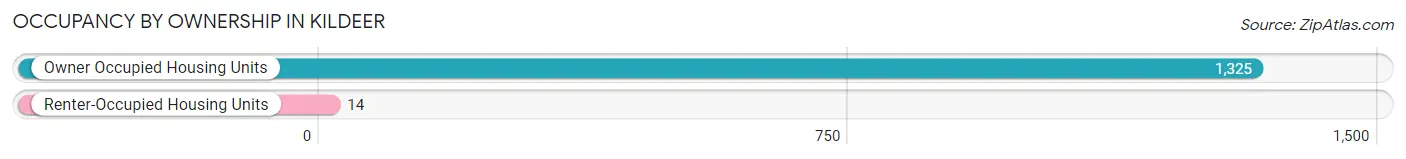
| Occupancy | # Housing Units | % Housing Units |
| Owner Occupied Housing Units | 1,325 | 99.0% |
| Renter-Occupied Housing Units | 14 | 1.1% |
| Total Occupied Housing Units | 1,339 | 100.0% |
Occupancy by Household Size in Kildeer
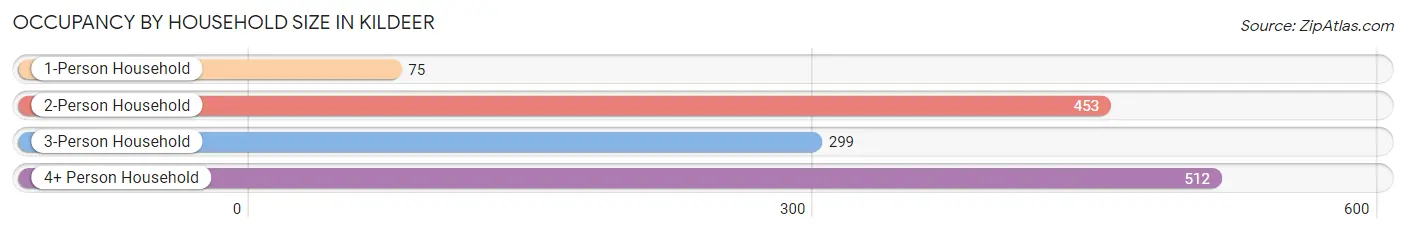
| Household Size | # Housing Units | % Housing Units |
| 1-Person Household | 75 | 5.6% |
| 2-Person Household | 453 | 33.8% |
| 3-Person Household | 299 | 22.3% |
| 4+ Person Household | 512 | 38.2% |
| Total Housing Units | 1,339 | 100.0% |
Occupancy by Ownership by Household Size in Kildeer
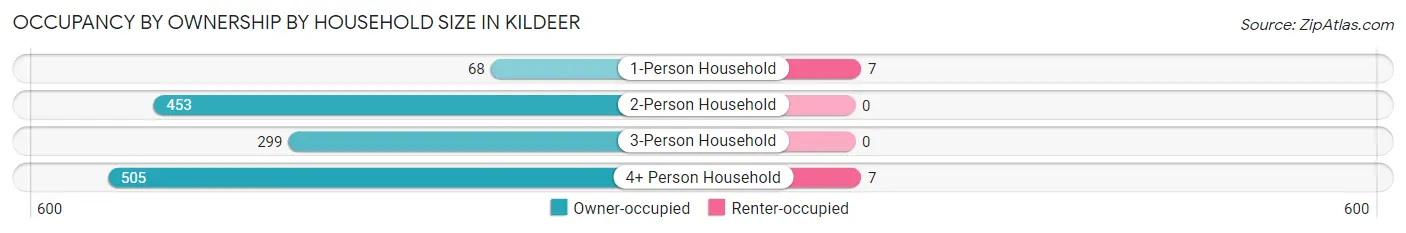
| Household Size | Owner-occupied | Renter-occupied |
| 1-Person Household | 68 (90.7%) | 7 (9.3%) |
| 2-Person Household | 453 (100.0%) | 0 (0.0%) |
| 3-Person Household | 299 (100.0%) | 0 (0.0%) |
| 4+ Person Household | 505 (98.6%) | 7 (1.4%) |
| Total Housing Units | 1,325 (99.0%) | 14 (1.1%) |
Occupancy by Educational Attainment in Kildeer
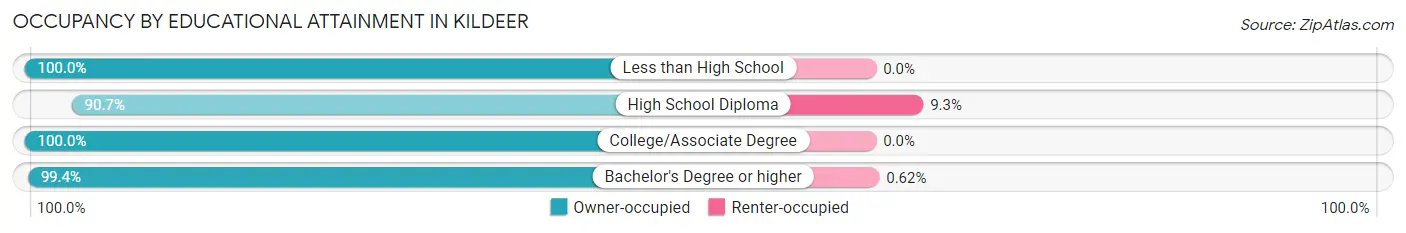
| Household Size | Owner-occupied | Renter-occupied |
| Less than High School | 15 (100.0%) | 0 (0.0%) |
| High School Diploma | 68 (90.7%) | 7 (9.3%) |
| College/Associate Degree | 111 (100.0%) | 0 (0.0%) |
| Bachelor's Degree or higher | 1,131 (99.4%) | 7 (0.6%) |
Occupancy by Age of Householder in Kildeer
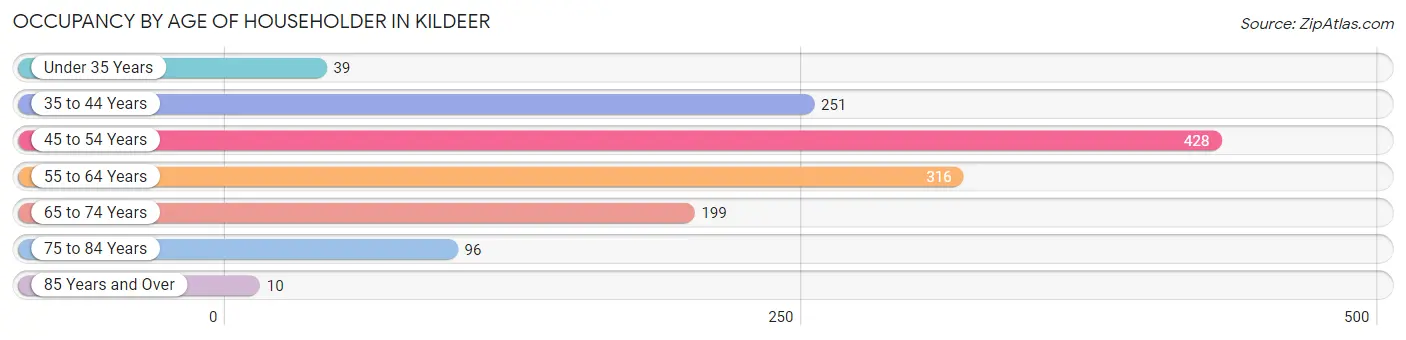
| Age Bracket | # Households | % Households |
| Under 35 Years | 39 | 2.9% |
| 35 to 44 Years | 251 | 18.8% |
| 45 to 54 Years | 428 | 32.0% |
| 55 to 64 Years | 316 | 23.6% |
| 65 to 74 Years | 199 | 14.9% |
| 75 to 84 Years | 96 | 7.2% |
| 85 Years and Over | 10 | 0.7% |
| Total | 1,339 | 100.0% |
Housing Finances in Kildeer
Median Income by Occupancy in Kildeer
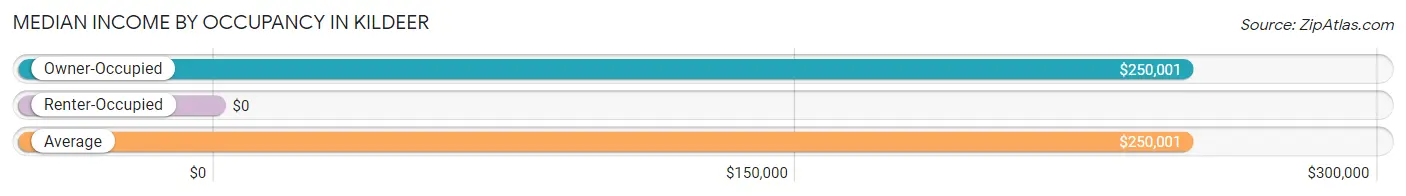
| Occupancy Type | # Households | Median Income |
| Owner-Occupied | 1,325 (99.0%) | $250,001 |
| Renter-Occupied | 14 (1.1%) | $0 |
| Average | 1,339 (100.0%) | $250,001 |
Occupancy by Householder Income Bracket in Kildeer
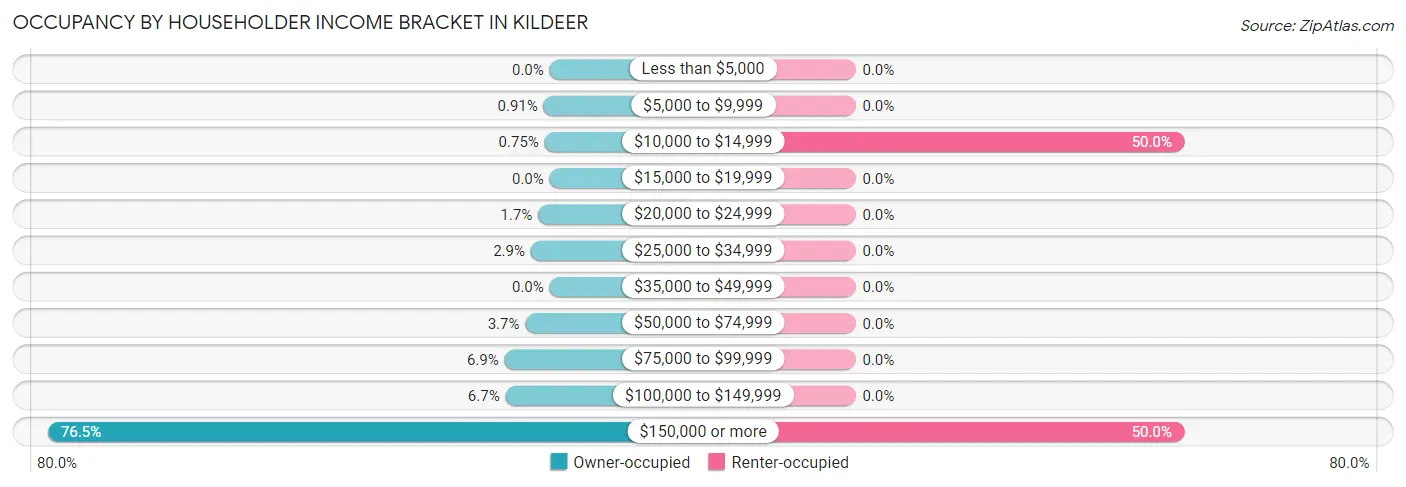
| Income Bracket | Owner-occupied | Renter-occupied |
| Less than $5,000 | 0 (0.0%) | 0 (0.0%) |
| $5,000 to $9,999 | 12 (0.9%) | 0 (0.0%) |
| $10,000 to $14,999 | 10 (0.7%) | 7 (50.0%) |
| $15,000 to $19,999 | 0 (0.0%) | 0 (0.0%) |
| $20,000 to $24,999 | 23 (1.7%) | 0 (0.0%) |
| $25,000 to $34,999 | 38 (2.9%) | 0 (0.0%) |
| $35,000 to $49,999 | 0 (0.0%) | 0 (0.0%) |
| $50,000 to $74,999 | 49 (3.7%) | 0 (0.0%) |
| $75,000 to $99,999 | 91 (6.9%) | 0 (0.0%) |
| $100,000 to $149,999 | 89 (6.7%) | 0 (0.0%) |
| $150,000 or more | 1,013 (76.4%) | 7 (50.0%) |
| Total | 1,325 (100.0%) | 14 (100.0%) |
Monthly Housing Cost Tiers in Kildeer
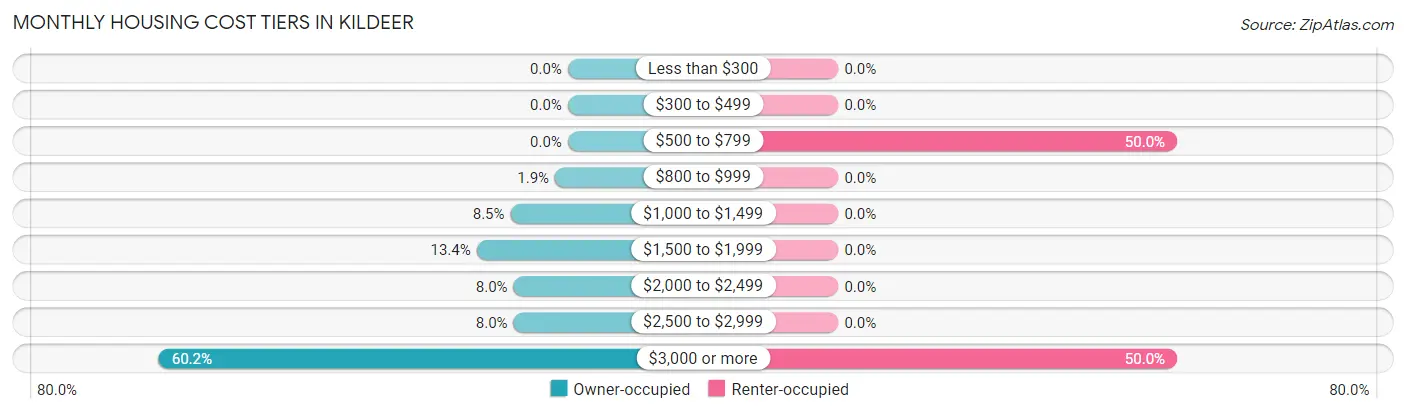
| Monthly Cost | Owner-occupied | Renter-occupied |
| Less than $300 | 0 (0.0%) | 0 (0.0%) |
| $300 to $499 | 0 (0.0%) | 0 (0.0%) |
| $500 to $799 | 0 (0.0%) | 7 (50.0%) |
| $800 to $999 | 25 (1.9%) | 0 (0.0%) |
| $1,000 to $1,499 | 112 (8.5%) | 0 (0.0%) |
| $1,500 to $1,999 | 178 (13.4%) | 0 (0.0%) |
| $2,000 to $2,499 | 106 (8.0%) | 0 (0.0%) |
| $2,500 to $2,999 | 106 (8.0%) | 0 (0.0%) |
| $3,000 or more | 798 (60.2%) | 7 (50.0%) |
| Total | 1,325 (100.0%) | 14 (100.0%) |
Physical Housing Characteristics in Kildeer
Housing Structures in Kildeer
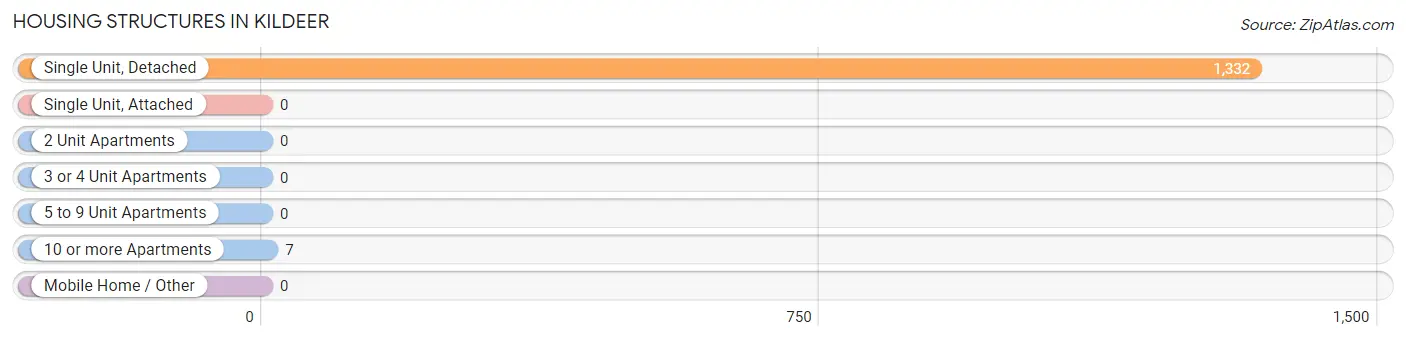
| Structure Type | # Housing Units | % Housing Units |
| Single Unit, Detached | 1,332 | 99.5% |
| Single Unit, Attached | 0 | 0.0% |
| 2 Unit Apartments | 0 | 0.0% |
| 3 or 4 Unit Apartments | 0 | 0.0% |
| 5 to 9 Unit Apartments | 0 | 0.0% |
| 10 or more Apartments | 7 | 0.5% |
| Mobile Home / Other | 0 | 0.0% |
| Total | 1,339 | 100.0% |
Housing Structures by Occupancy in Kildeer
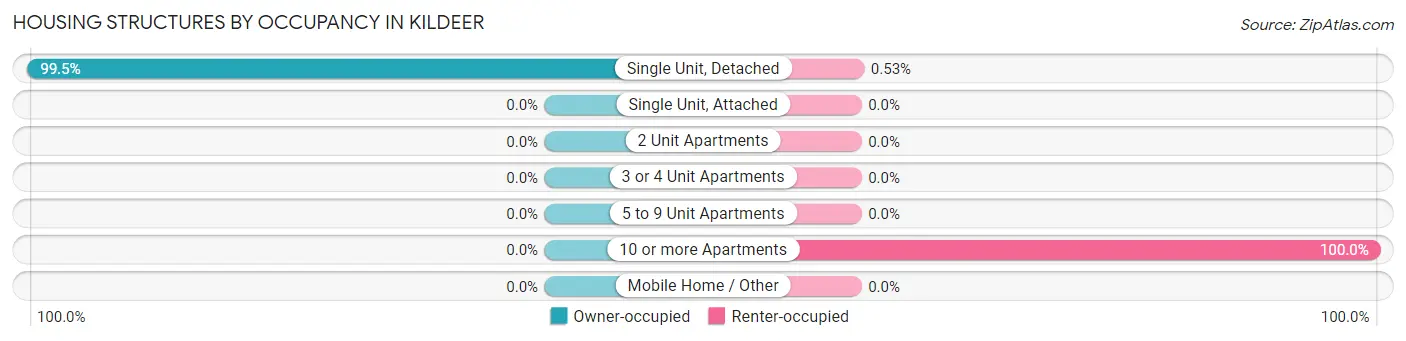
| Structure Type | Owner-occupied | Renter-occupied |
| Single Unit, Detached | 1,325 (99.5%) | 7 (0.5%) |
| Single Unit, Attached | 0 (0.0%) | 0 (0.0%) |
| 2 Unit Apartments | 0 (0.0%) | 0 (0.0%) |
| 3 or 4 Unit Apartments | 0 (0.0%) | 0 (0.0%) |
| 5 to 9 Unit Apartments | 0 (0.0%) | 0 (0.0%) |
| 10 or more Apartments | 0 (0.0%) | 7 (100.0%) |
| Mobile Home / Other | 0 (0.0%) | 0 (0.0%) |
| Total | 1,325 (99.0%) | 14 (1.1%) |
Housing Structures by Number of Rooms in Kildeer
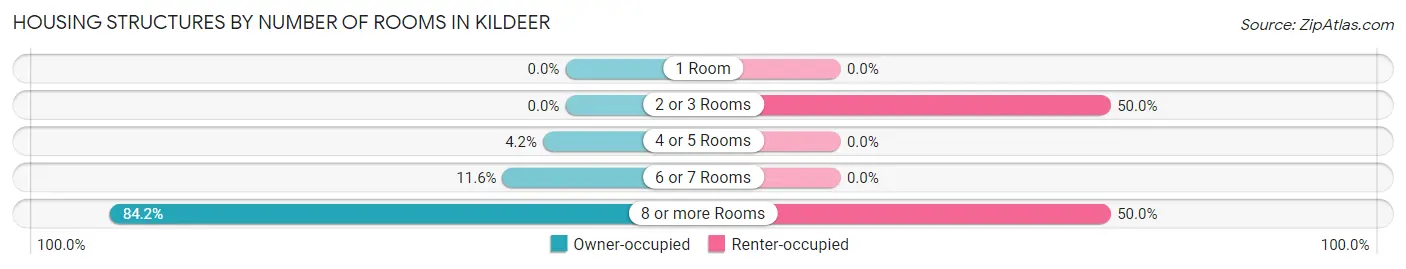
| Number of Rooms | Owner-occupied | Renter-occupied |
| 1 Room | 0 (0.0%) | 0 (0.0%) |
| 2 or 3 Rooms | 0 (0.0%) | 7 (50.0%) |
| 4 or 5 Rooms | 55 (4.2%) | 0 (0.0%) |
| 6 or 7 Rooms | 154 (11.6%) | 0 (0.0%) |
| 8 or more Rooms | 1,116 (84.2%) | 7 (50.0%) |
| Total | 1,325 (100.0%) | 14 (100.0%) |
Housing Structure by Heating Type in Kildeer
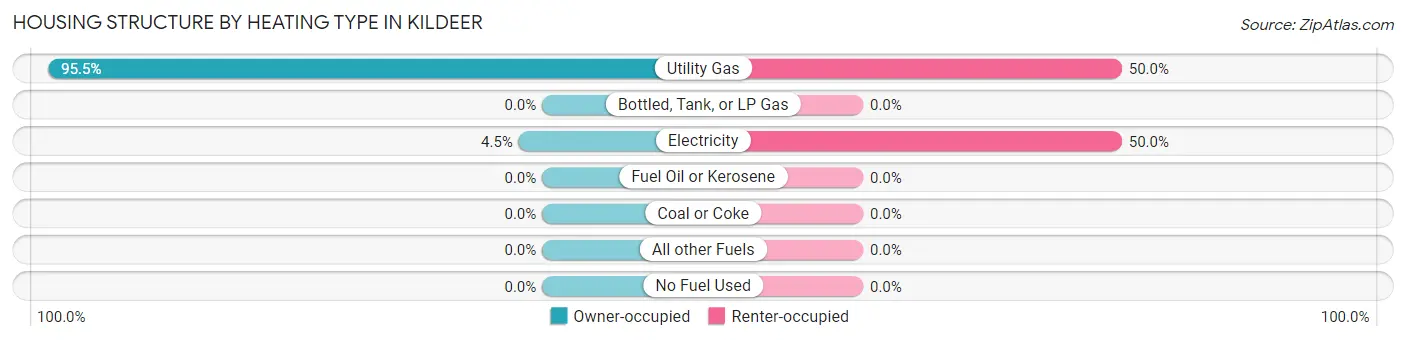
| Heating Type | Owner-occupied | Renter-occupied |
| Utility Gas | 1,265 (95.5%) | 7 (50.0%) |
| Bottled, Tank, or LP Gas | 0 (0.0%) | 0 (0.0%) |
| Electricity | 60 (4.5%) | 7 (50.0%) |
| Fuel Oil or Kerosene | 0 (0.0%) | 0 (0.0%) |
| Coal or Coke | 0 (0.0%) | 0 (0.0%) |
| All other Fuels | 0 (0.0%) | 0 (0.0%) |
| No Fuel Used | 0 (0.0%) | 0 (0.0%) |
| Total | 1,325 (100.0%) | 14 (100.0%) |
Household Vehicle Usage in Kildeer
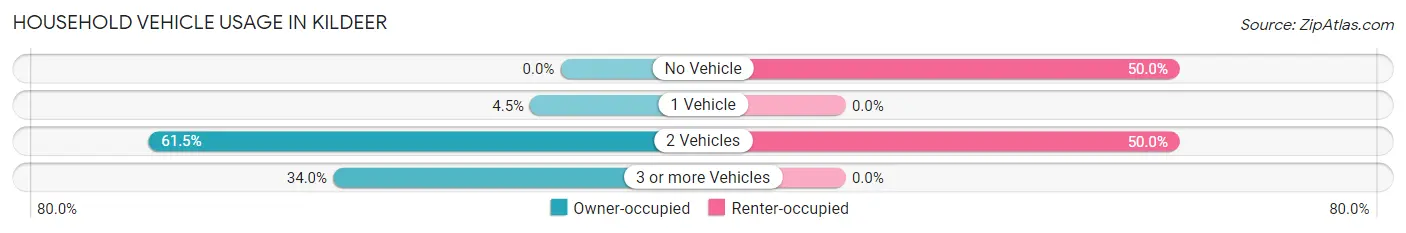
| Vehicles per Household | Owner-occupied | Renter-occupied |
| No Vehicle | 0 (0.0%) | 7 (50.0%) |
| 1 Vehicle | 60 (4.5%) | 0 (0.0%) |
| 2 Vehicles | 815 (61.5%) | 7 (50.0%) |
| 3 or more Vehicles | 450 (34.0%) | 0 (0.0%) |
| Total | 1,325 (100.0%) | 14 (100.0%) |
Real Estate & Mortgages in Kildeer
Real Estate and Mortgage Overview in Kildeer
| Characteristic | Without Mortgage | With Mortgage |
| Housing Units | 436 | 889 |
| Median Property Value | $648,700 | $701,700 |
| Median Household Income | $218,889 | $753 |
| Monthly Housing Costs | $1,501 | $771 |
| Real Estate Taxes | $10,001 | $0 |
Property Value by Mortgage Status in Kildeer
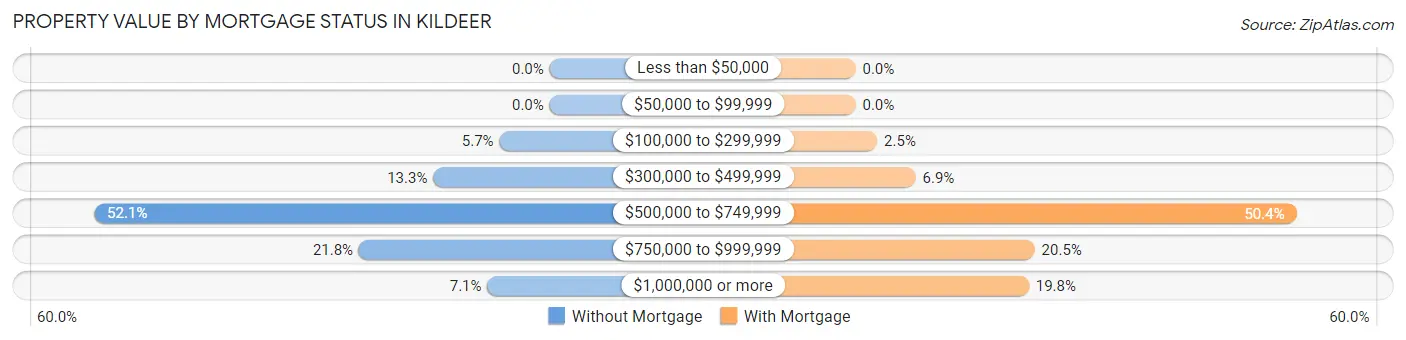
| Property Value | Without Mortgage | With Mortgage |
| Less than $50,000 | 0 (0.0%) | 0 (0.0%) |
| $50,000 to $99,999 | 0 (0.0%) | 0 (0.0%) |
| $100,000 to $299,999 | 25 (5.7%) | 22 (2.5%) |
| $300,000 to $499,999 | 58 (13.3%) | 61 (6.9%) |
| $500,000 to $749,999 | 227 (52.1%) | 448 (50.4%) |
| $750,000 to $999,999 | 95 (21.8%) | 182 (20.5%) |
| $1,000,000 or more | 31 (7.1%) | 176 (19.8%) |
| Total | 436 (100.0%) | 889 (100.0%) |
Household Income by Mortgage Status in Kildeer
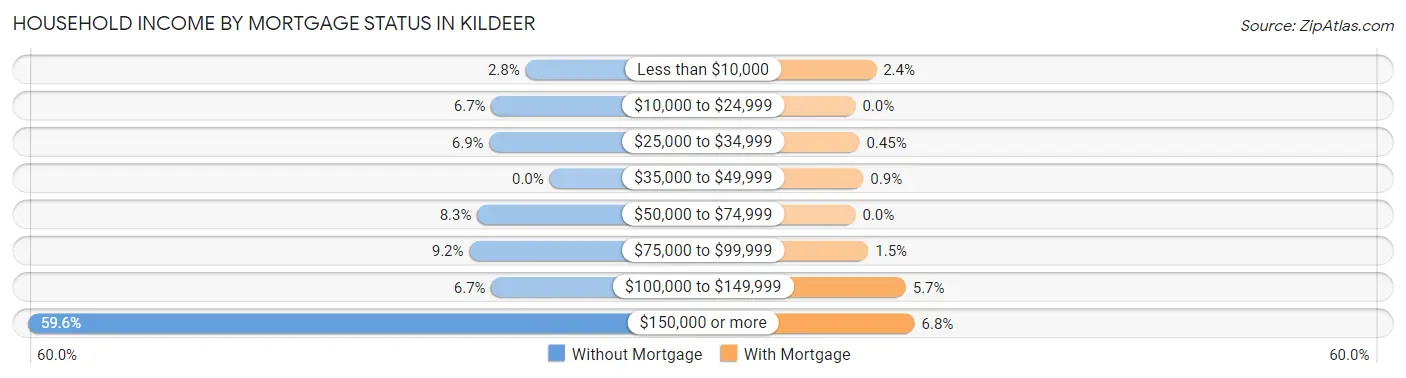
| Household Income | Without Mortgage | With Mortgage |
| Less than $10,000 | 12 (2.8%) | 21 (2.4%) |
| $10,000 to $24,999 | 29 (6.7%) | 0 (0.0%) |
| $25,000 to $34,999 | 30 (6.9%) | 4 (0.4%) |
| $35,000 to $49,999 | 0 (0.0%) | 8 (0.9%) |
| $50,000 to $74,999 | 36 (8.3%) | 0 (0.0%) |
| $75,000 to $99,999 | 40 (9.2%) | 13 (1.5%) |
| $100,000 to $149,999 | 29 (6.7%) | 51 (5.7%) |
| $150,000 or more | 260 (59.6%) | 60 (6.8%) |
| Total | 436 (100.0%) | 889 (100.0%) |
Property Value to Household Income Ratio in Kildeer
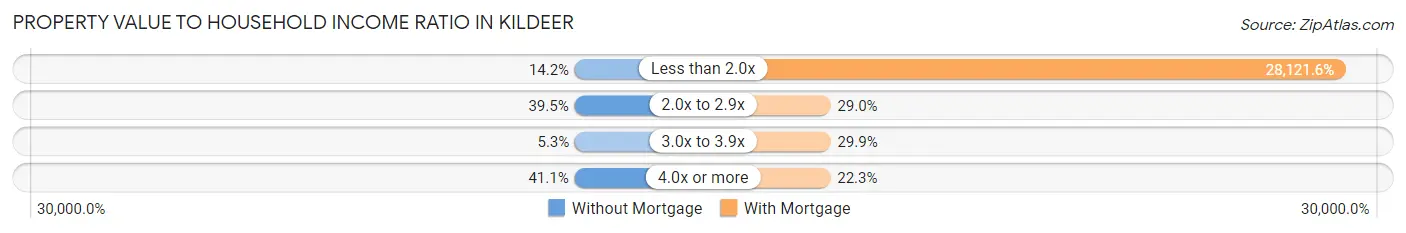
| Value-to-Income Ratio | Without Mortgage | With Mortgage |
| Less than 2.0x | 62 (14.2%) | 250,001 (28,121.6%) |
| 2.0x to 2.9x | 172 (39.5%) | 258 (29.0%) |
| 3.0x to 3.9x | 23 (5.3%) | 266 (29.9%) |
| 4.0x or more | 179 (41.1%) | 198 (22.3%) |
| Total | 436 (100.0%) | 889 (100.0%) |
Real Estate Taxes by Mortgage Status in Kildeer
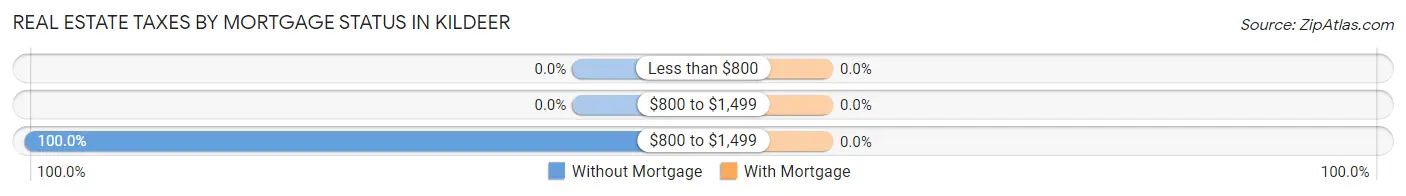
| Property Taxes | Without Mortgage | With Mortgage |
| Less than $800 | 0 (0.0%) | 0 (0.0%) |
| $800 to $1,499 | 0 (0.0%) | 0 (0.0%) |
| $800 to $1,499 | 436 (100.0%) | 0 (0.0%) |
| Total | 436 (100.0%) | 889 (100.0%) |
Health & Disability in Kildeer
Health Insurance Coverage by Age in Kildeer
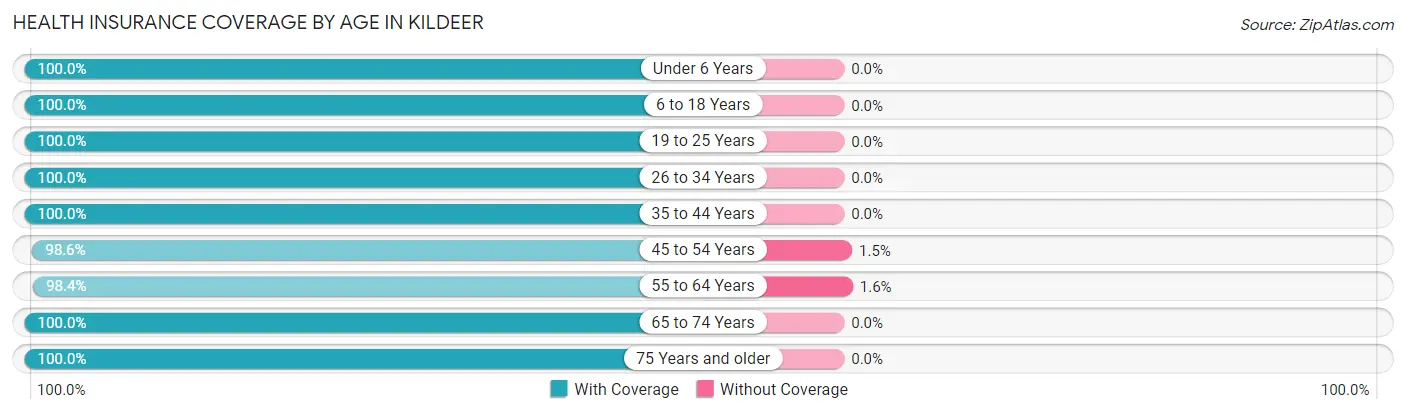
| Age Bracket | With Coverage | Without Coverage |
| Under 6 Years | 251 (100.0%) | 0 (0.0%) |
| 6 to 18 Years | 951 (100.0%) | 0 (0.0%) |
| 19 to 25 Years | 209 (100.0%) | 0 (0.0%) |
| 26 to 34 Years | 180 (100.0%) | 0 (0.0%) |
| 35 to 44 Years | 570 (100.0%) | 0 (0.0%) |
| 45 to 54 Years | 750 (98.6%) | 11 (1.5%) |
| 55 to 64 Years | 615 (98.4%) | 10 (1.6%) |
| 65 to 74 Years | 371 (100.0%) | 0 (0.0%) |
| 75 Years and older | 215 (100.0%) | 0 (0.0%) |
| Total | 4,112 (99.5%) | 21 (0.5%) |
Health Insurance Coverage by Citizenship Status in Kildeer
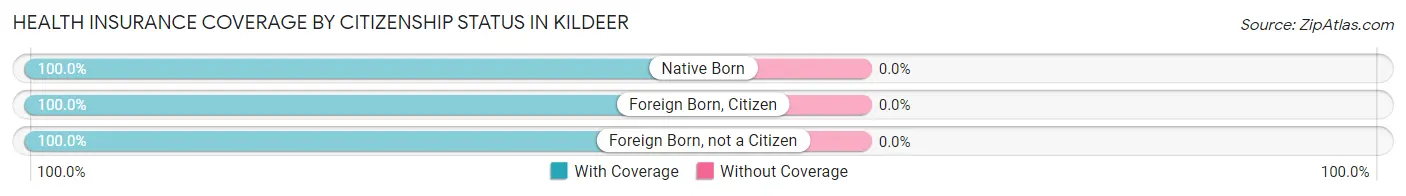
| Citizenship Status | With Coverage | Without Coverage |
| Native Born | 251 (100.0%) | 0 (0.0%) |
| Foreign Born, Citizen | 951 (100.0%) | 0 (0.0%) |
| Foreign Born, not a Citizen | 209 (100.0%) | 0 (0.0%) |
Health Insurance Coverage by Household Income in Kildeer
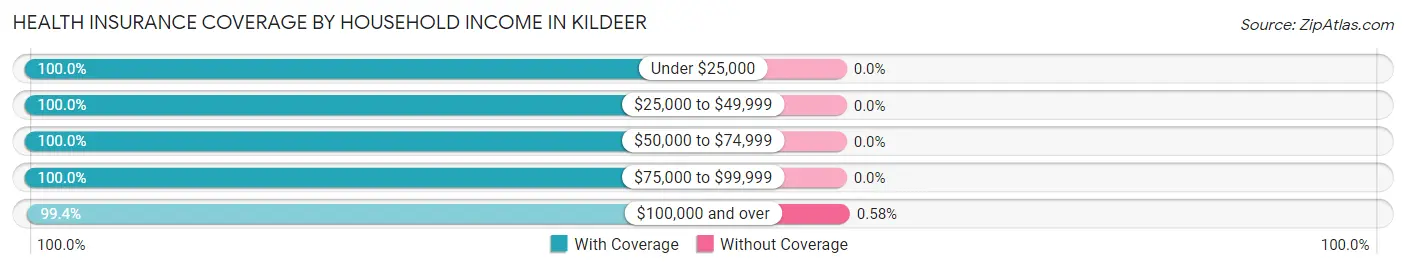
| Household Income | With Coverage | Without Coverage |
| Under $25,000 | 104 (100.0%) | 0 (0.0%) |
| $25,000 to $49,999 | 90 (100.0%) | 0 (0.0%) |
| $50,000 to $74,999 | 85 (100.0%) | 0 (0.0%) |
| $75,000 to $99,999 | 205 (100.0%) | 0 (0.0%) |
| $100,000 and over | 3,628 (99.4%) | 21 (0.6%) |
Public vs Private Health Insurance Coverage by Age in Kildeer
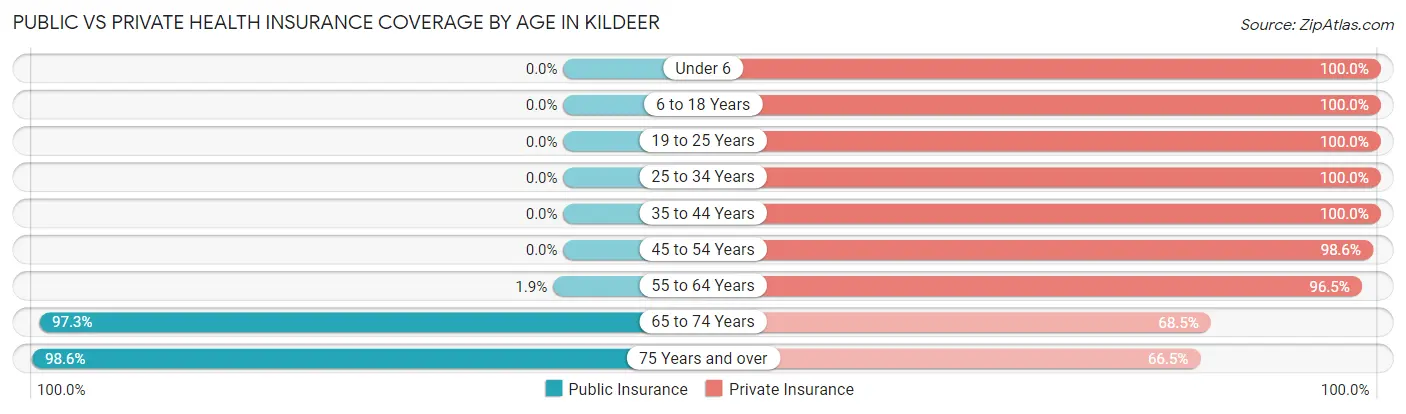
| Age Bracket | Public Insurance | Private Insurance |
| Under 6 | 0 (0.0%) | 251 (100.0%) |
| 6 to 18 Years | 0 (0.0%) | 951 (100.0%) |
| 19 to 25 Years | 0 (0.0%) | 209 (100.0%) |
| 25 to 34 Years | 0 (0.0%) | 180 (100.0%) |
| 35 to 44 Years | 0 (0.0%) | 570 (100.0%) |
| 45 to 54 Years | 0 (0.0%) | 750 (98.6%) |
| 55 to 64 Years | 12 (1.9%) | 603 (96.5%) |
| 65 to 74 Years | 361 (97.3%) | 254 (68.5%) |
| 75 Years and over | 212 (98.6%) | 143 (66.5%) |
| Total | 585 (14.1%) | 3,911 (94.6%) |
Disability Status by Sex by Age in Kildeer
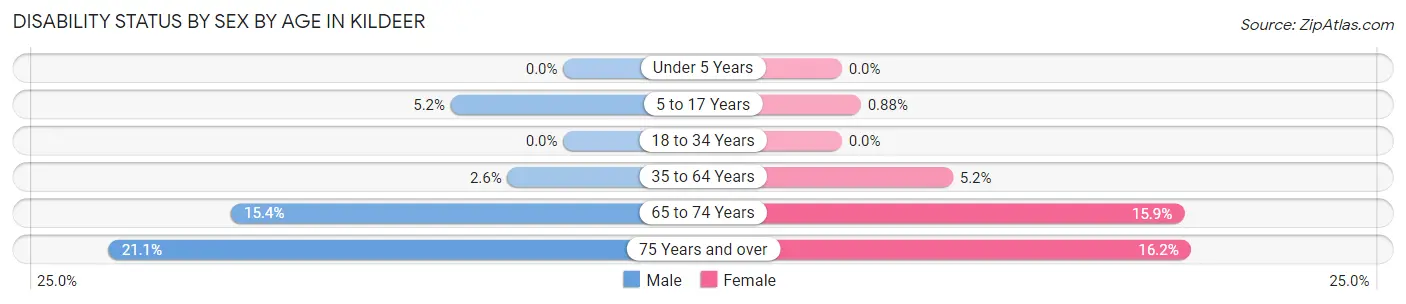
| Age Bracket | Male | Female |
| Under 5 Years | 0 (0.0%) | 0 (0.0%) |
| 5 to 17 Years | 24 (5.2%) | 4 (0.9%) |
| 18 to 34 Years | 0 (0.0%) | 0 (0.0%) |
| 35 to 64 Years | 25 (2.6%) | 51 (5.1%) |
| 65 to 74 Years | 31 (15.4%) | 27 (15.9%) |
| 75 Years and over | 31 (21.1%) | 11 (16.2%) |
Disability Class by Sex by Age in Kildeer
Disability Class: Hearing Difficulty
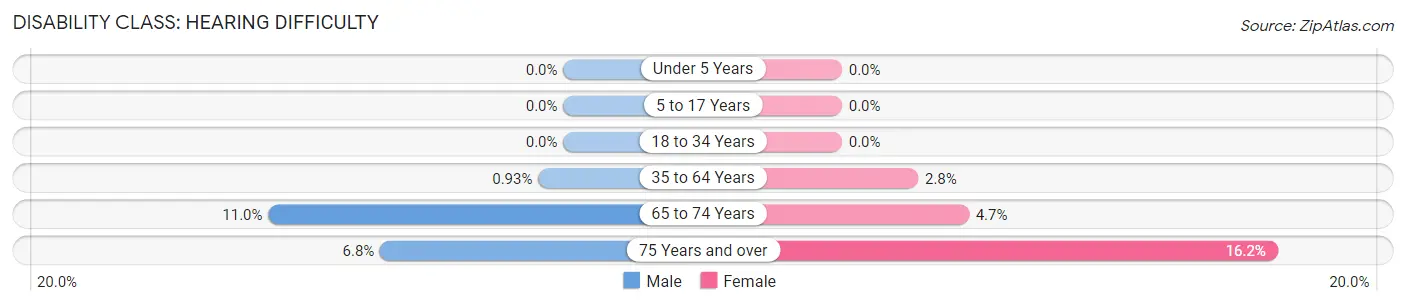
| Age Bracket | Male | Female |
| Under 5 Years | 0 (0.0%) | 0 (0.0%) |
| 5 to 17 Years | 0 (0.0%) | 0 (0.0%) |
| 18 to 34 Years | 0 (0.0%) | 0 (0.0%) |
| 35 to 64 Years | 9 (0.9%) | 28 (2.8%) |
| 65 to 74 Years | 22 (11.0%) | 8 (4.7%) |
| 75 Years and over | 10 (6.8%) | 11 (16.2%) |
Disability Class: Vision Difficulty
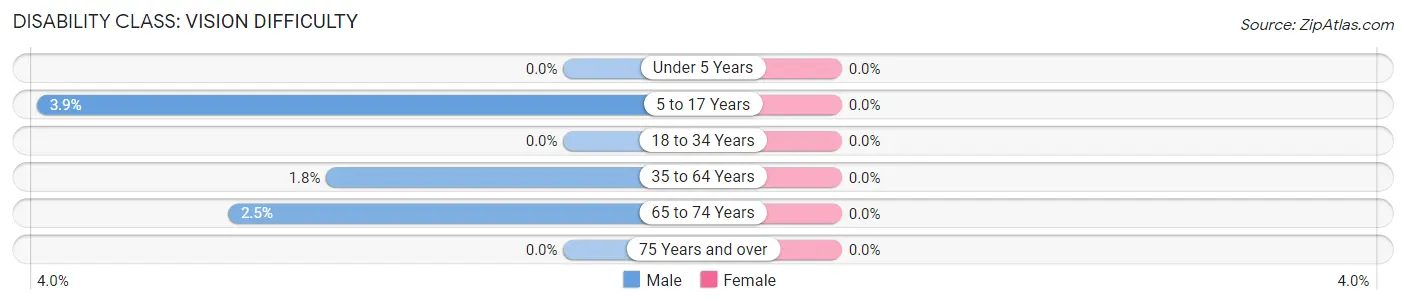
| Age Bracket | Male | Female |
| Under 5 Years | 0 (0.0%) | 0 (0.0%) |
| 5 to 17 Years | 18 (3.9%) | 0 (0.0%) |
| 18 to 34 Years | 0 (0.0%) | 0 (0.0%) |
| 35 to 64 Years | 17 (1.8%) | 0 (0.0%) |
| 65 to 74 Years | 5 (2.5%) | 0 (0.0%) |
| 75 Years and over | 0 (0.0%) | 0 (0.0%) |
Disability Class: Cognitive Difficulty
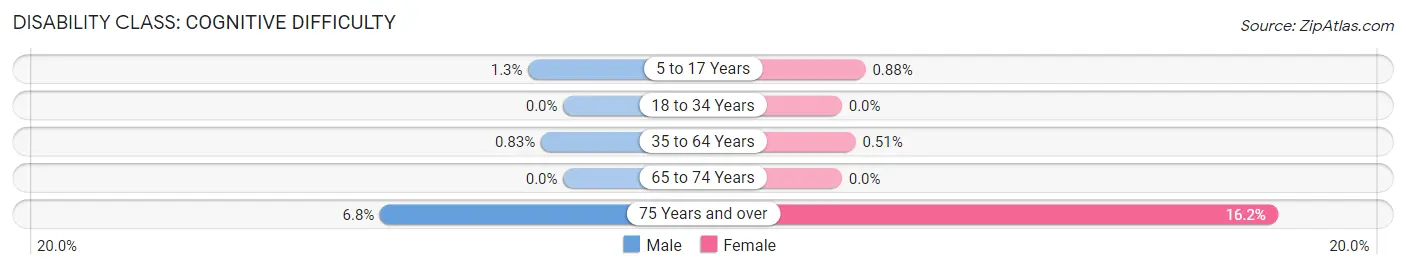
| Age Bracket | Male | Female |
| 5 to 17 Years | 6 (1.3%) | 4 (0.9%) |
| 18 to 34 Years | 0 (0.0%) | 0 (0.0%) |
| 35 to 64 Years | 8 (0.8%) | 5 (0.5%) |
| 65 to 74 Years | 0 (0.0%) | 0 (0.0%) |
| 75 Years and over | 10 (6.8%) | 11 (16.2%) |
Disability Class: Ambulatory Difficulty
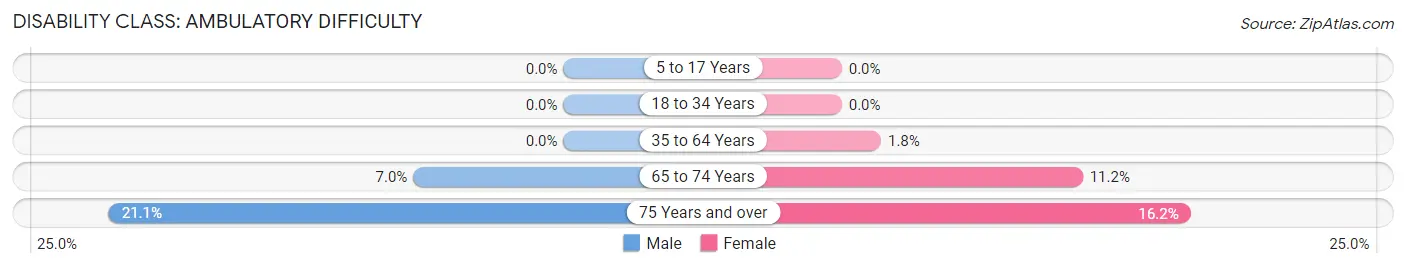
| Age Bracket | Male | Female |
| 5 to 17 Years | 0 (0.0%) | 0 (0.0%) |
| 18 to 34 Years | 0 (0.0%) | 0 (0.0%) |
| 35 to 64 Years | 0 (0.0%) | 18 (1.8%) |
| 65 to 74 Years | 14 (7.0%) | 19 (11.2%) |
| 75 Years and over | 31 (21.1%) | 11 (16.2%) |
Disability Class: Self-Care Difficulty
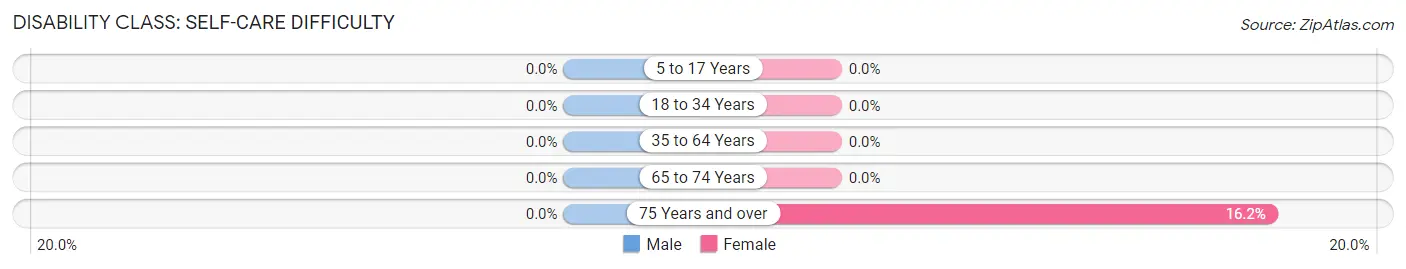
| Age Bracket | Male | Female |
| 5 to 17 Years | 0 (0.0%) | 0 (0.0%) |
| 18 to 34 Years | 0 (0.0%) | 0 (0.0%) |
| 35 to 64 Years | 0 (0.0%) | 0 (0.0%) |
| 65 to 74 Years | 0 (0.0%) | 0 (0.0%) |
| 75 Years and over | 0 (0.0%) | 11 (16.2%) |
Technology Access in Kildeer
Computing Device Access in Kildeer
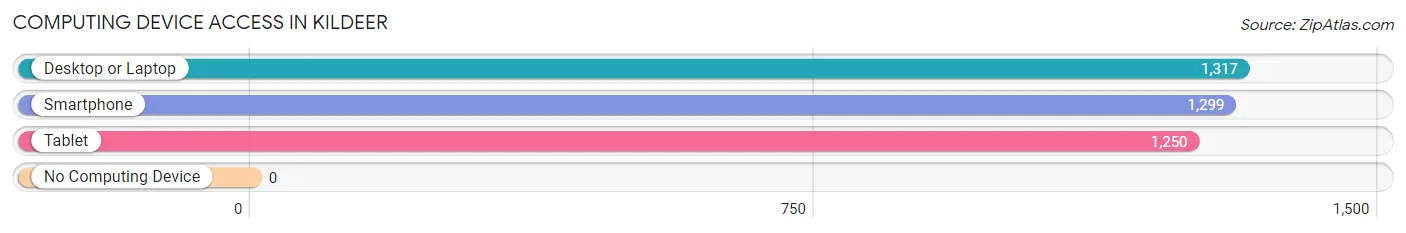
| Device Type | # Households | % Households |
| Desktop or Laptop | 1,317 | 98.4% |
| Smartphone | 1,299 | 97.0% |
| Tablet | 1,250 | 93.3% |
| No Computing Device | 0 | 0.0% |
| Total | 1,339 | 100.0% |
Internet Access in Kildeer
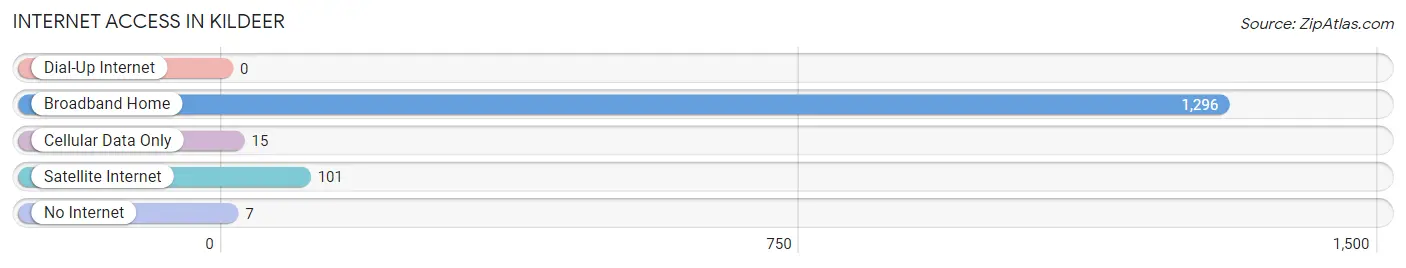
| Internet Type | # Households | % Households |
| Dial-Up Internet | 0 | 0.0% |
| Broadband Home | 1,296 | 96.8% |
| Cellular Data Only | 15 | 1.1% |
| Satellite Internet | 101 | 7.5% |
| No Internet | 7 | 0.5% |
| Total | 1,339 | 100.0% |
Kildeer Summary
Kildeer, Illinois is a small village located in Lake County, Illinois, United States. It is a part of the Chicago metropolitan area and is located about 25 miles northwest of downtown Chicago. The village was incorporated in 1958 and has a population of 4,941 as of the 2010 census.
History
Kildeer was first settled in the early 1800s by a group of German immigrants. The village was originally known as “Kildeer’s Grove” and was named after the Kildeer family who owned the land. The village was officially incorporated in 1958 and has since grown to become a popular residential community.
Geography
Kildeer is located in Lake County, Illinois, United States. It is situated about 25 miles northwest of downtown Chicago. The village is bordered by Long Grove to the north, Hawthorn Woods to the east, Deer Park to the south, and Lake Zurich to the west. The village covers an area of 4.2 square miles and has a population of 4,941 as of the 2010 census.
Climate
Kildeer has a humid continental climate with hot, humid summers and cold, snowy winters. The average temperature in the summer is around 75°F and the average temperature in the winter is around 25°F. The village receives an average of 36 inches of precipitation per year.
Economy
Kildeer’s economy is largely based on the service industry. The village is home to several restaurants, retail stores, and professional services. The village is also home to several corporate offices, including the headquarters of the American Academy of Pediatrics.
Demographics
As of the 2010 census, Kildeer had a population of 4,941. The racial makeup of the village was 87.3% White, 4.2% African American, 0.2% Native American, 4.7% Asian, and 3.6% from other races. The median household income was $107,917 and the median family income was $125,917.
Kildeer is a small village with a rich history and a vibrant economy. The village is home to a diverse population and offers a variety of services and amenities. Kildeer is a great place to live, work, and play.
Common Questions
What is Per Capita Income in Kildeer?
Per Capita income in Kildeer is $94,531.
What is the Median Family Income in Kildeer?
Median Family Income in Kildeer is $250,001.
What is the Median Household income in Kildeer?
Median Household Income in Kildeer is $250,001.
What is Income or Wage Gap in Kildeer?
Income or Wage Gap in Kildeer is 51.7%.
Women in Kildeer earn 48.3 cents for every dollar earned by a man.
What is Inequality or Gini Index in Kildeer?
Inequality or Gini Index in Kildeer is 0.35.
What is the Total Population of Kildeer?
Total Population of Kildeer is 4,133.
What is the Total Male Population of Kildeer?
Total Male Population of Kildeer is 2,119.
What is the Total Female Population of Kildeer?
Total Female Population of Kildeer is 2,014.
What is the Ratio of Males per 100 Females in Kildeer?
There are 105.21 Males per 100 Females in Kildeer.
What is the Ratio of Females per 100 Males in Kildeer?
There are 95.04 Females per 100 Males in Kildeer.
What is the Median Population Age in Kildeer?
Median Population Age in Kildeer is 43.5 Years.
What is the Average Family Size in Kildeer
Average Family Size in Kildeer is 3.2 People.
What is the Average Household Size in Kildeer
Average Household Size in Kildeer is 3.1 People.
How Large is the Labor Force in Kildeer?
There are 2,167 People in the Labor Forcein in Kildeer.
What is the Percentage of People in the Labor Force in Kildeer?
66.8% of People are in the Labor Force in Kildeer.
What is the Unemployment Rate in Kildeer?
Unemployment Rate in Kildeer is 3.1%.