Geneva, IL Map & Demographics
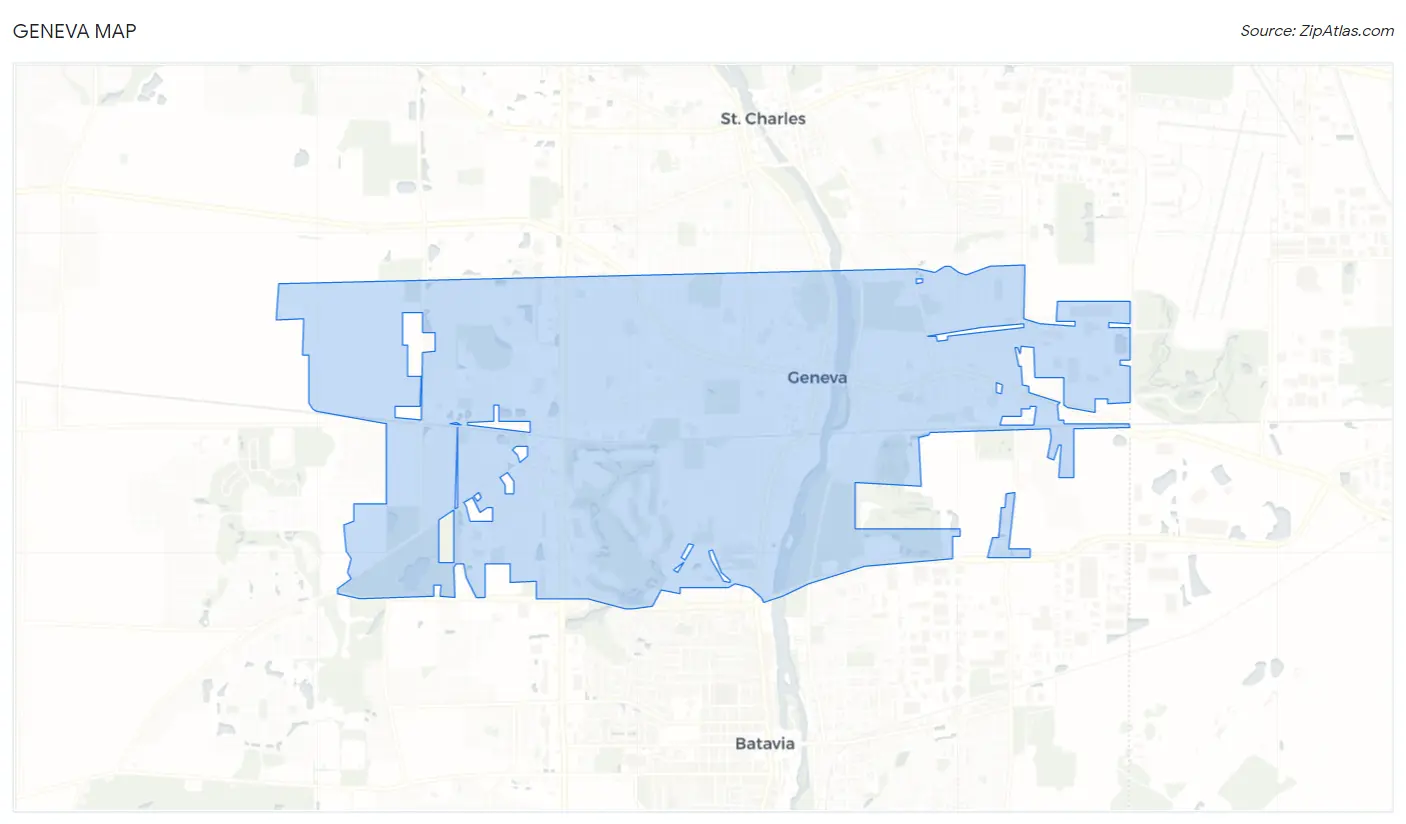
Geneva Map
Geneva Overview
$67,737
PER CAPITA INCOME
$161,033
AVG FAMILY INCOME
$132,799
AVG HOUSEHOLD INCOME
45.5%
WAGE / INCOME GAP [ % ]
54.5¢/ $1
WAGE / INCOME GAP [ $ ]
0.45
INEQUALITY / GINI INDEX
21,390
TOTAL POPULATION
10,024
MALE POPULATION
11,366
FEMALE POPULATION
88.19
MALES / 100 FEMALES
113.39
FEMALES / 100 MALES
41.7
MEDIAN AGE
3.1
AVG FAMILY SIZE
2.6
AVG HOUSEHOLD SIZE
11,915
LABOR FORCE [ PEOPLE ]
70.3%
PERCENT IN LABOR FORCE
2.0%
UNEMPLOYMENT RATE
Geneva Zip Codes
Income in Geneva
Income Overview in Geneva
Per Capita Income in Geneva is $67,737, while median incomes of families and households are $161,033 and $132,799 respectively.
| Characteristic | Number | Measure |
| Per Capita Income | 21,390 | $67,737 |
| Median Family Income | 5,974 | $161,033 |
| Mean Family Income | 5,974 | $193,284 |
| Median Household Income | 8,141 | $132,799 |
| Mean Household Income | 8,141 | $175,203 |
| Income Deficit | 5,974 | $0 |
| Wage / Income Gap (%) | 21,390 | 45.49% |
| Wage / Income Gap ($) | 21,390 | 54.51¢ per $1 |
| Gini / Inequality Index | 21,390 | 0.45 |
Earnings by Sex in Geneva
Average Earnings in Geneva are $57,877, $84,863 for men and $46,261 for women, a difference of 45.5%.
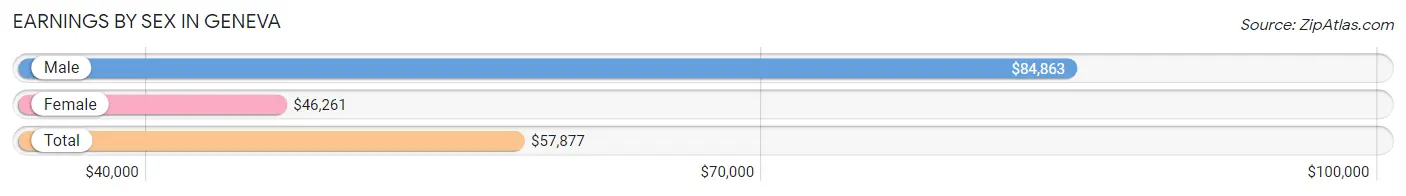
| Sex | Number | Average Earnings |
| Male | 6,404 (50.9%) | $84,863 |
| Female | 6,174 (49.1%) | $46,261 |
| Total | 12,578 (100.0%) | $57,877 |
Earnings by Sex by Income Bracket in Geneva
The most common earnings brackets in Geneva are $100,000+ for men (2,619 | 40.9%) and $100,000+ for women (1,025 | 16.6%).
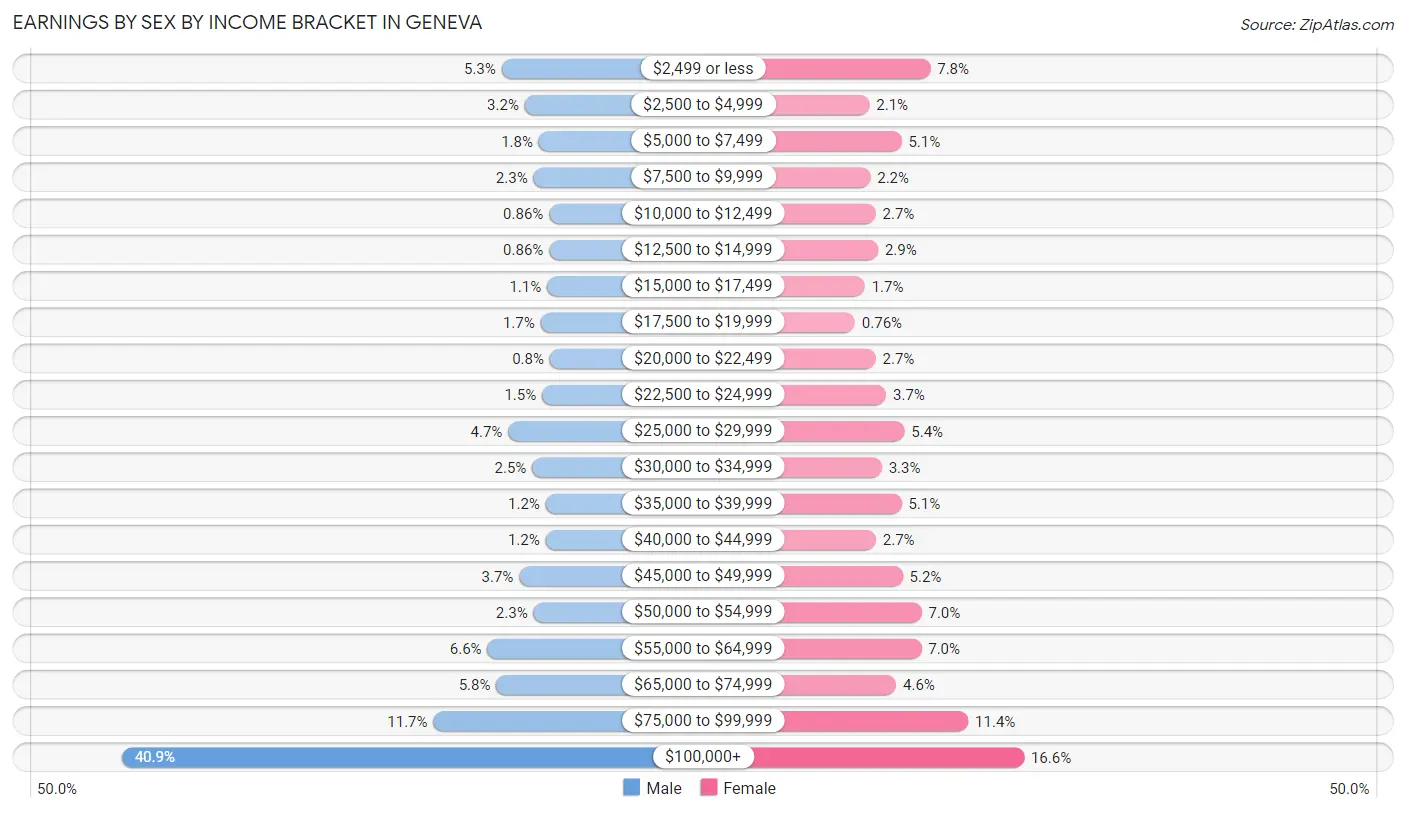
| Income | Male | Female |
| $2,499 or less | 341 (5.3%) | 483 (7.8%) |
| $2,500 to $4,999 | 202 (3.2%) | 130 (2.1%) |
| $5,000 to $7,499 | 117 (1.8%) | 316 (5.1%) |
| $7,500 to $9,999 | 149 (2.3%) | 136 (2.2%) |
| $10,000 to $12,499 | 55 (0.9%) | 167 (2.7%) |
| $12,500 to $14,999 | 55 (0.9%) | 180 (2.9%) |
| $15,000 to $17,499 | 68 (1.1%) | 104 (1.7%) |
| $17,500 to $19,999 | 107 (1.7%) | 47 (0.8%) |
| $20,000 to $22,499 | 51 (0.8%) | 167 (2.7%) |
| $22,500 to $24,999 | 98 (1.5%) | 227 (3.7%) |
| $25,000 to $29,999 | 301 (4.7%) | 333 (5.4%) |
| $30,000 to $34,999 | 157 (2.5%) | 202 (3.3%) |
| $35,000 to $39,999 | 76 (1.2%) | 316 (5.1%) |
| $40,000 to $44,999 | 77 (1.2%) | 168 (2.7%) |
| $45,000 to $49,999 | 235 (3.7%) | 323 (5.2%) |
| $50,000 to $54,999 | 149 (2.3%) | 432 (7.0%) |
| $55,000 to $64,999 | 425 (6.6%) | 431 (7.0%) |
| $65,000 to $74,999 | 372 (5.8%) | 285 (4.6%) |
| $75,000 to $99,999 | 750 (11.7%) | 702 (11.4%) |
| $100,000+ | 2,619 (40.9%) | 1,025 (16.6%) |
| Total | 6,404 (100.0%) | 6,174 (100.0%) |
Earnings by Sex by Educational Attainment in Geneva
Average earnings in Geneva are $93,884 for men and $52,689 for women, a difference of 43.9%. Men with an educational attainment of graduate degree enjoy the highest average annual earnings of $140,324, while those with less than high school education earn the least with $27,426. Women with an educational attainment of graduate degree earn the most with the average annual earnings of $72,277, while those with less than high school education have the smallest earnings of $23,848.
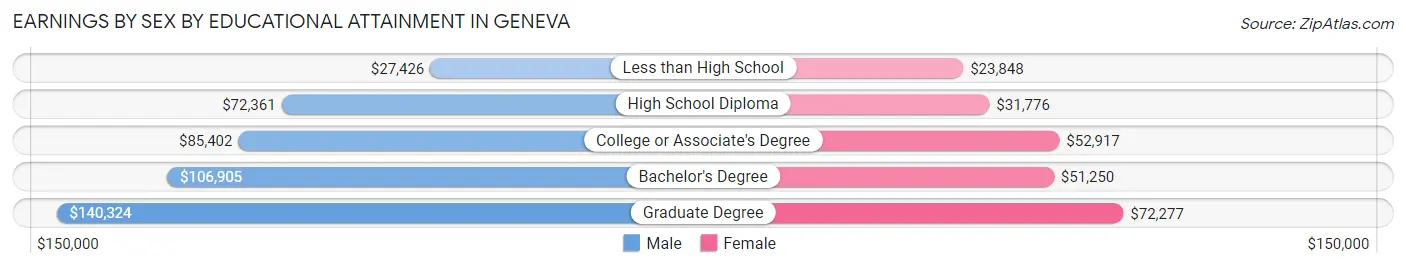
| Educational Attainment | Male Income | Female Income |
| Less than High School | $27,426 | $23,848 |
| High School Diploma | $72,361 | $31,776 |
| College or Associate's Degree | $85,402 | $52,917 |
| Bachelor's Degree | $106,905 | $51,250 |
| Graduate Degree | $140,324 | $72,277 |
| Total | $93,884 | $52,689 |
Family Income in Geneva
Family Income Brackets in Geneva
According to the Geneva family income data, there are 2,139 families falling into the $200,000+ income range, which is the most common income bracket and makes up 35.8% of all families. Conversely, the less than $10,000 income bracket is the least frequent group with only 18 families (0.3%) belonging to this category.
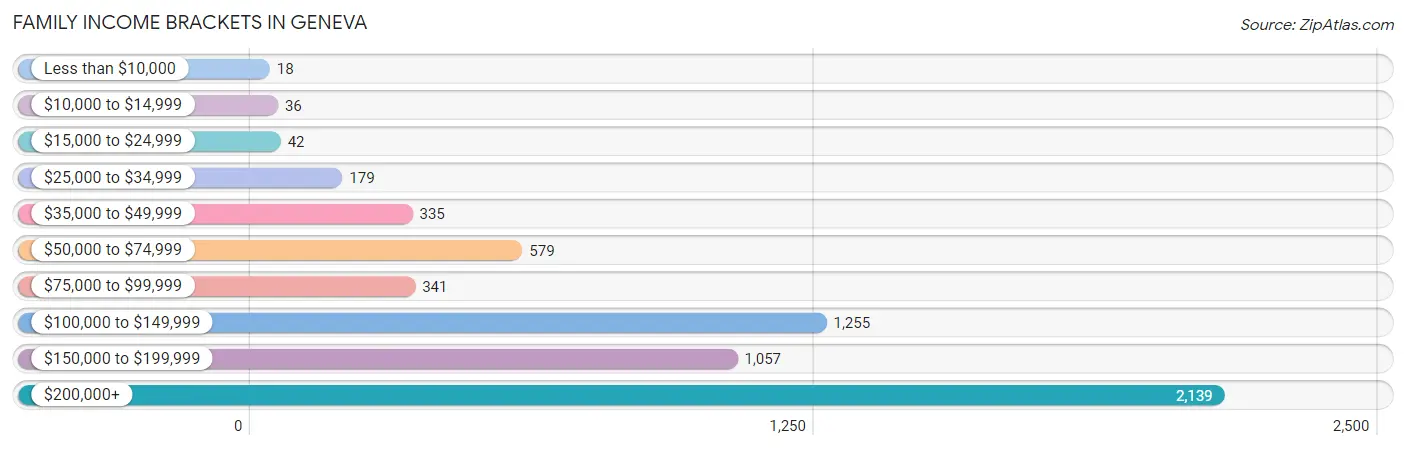
| Income Bracket | # Families | % Families |
| Less than $10,000 | 18 | 0.3% |
| $10,000 to $14,999 | 36 | 0.6% |
| $15,000 to $24,999 | 42 | 0.7% |
| $25,000 to $34,999 | 179 | 3.0% |
| $35,000 to $49,999 | 335 | 5.6% |
| $50,000 to $74,999 | 579 | 9.7% |
| $75,000 to $99,999 | 341 | 5.7% |
| $100,000 to $149,999 | 1,255 | 21.0% |
| $150,000 to $199,999 | 1,057 | 17.7% |
| $200,000+ | 2,139 | 35.8% |
Family Income by Famaliy Size in Geneva
5-person families (383 | 6.4%) account for the highest median family income in Geneva with $236,696 per family, while 2-person families (2,502 | 41.9%) have the highest median income of $65,733 per family member.
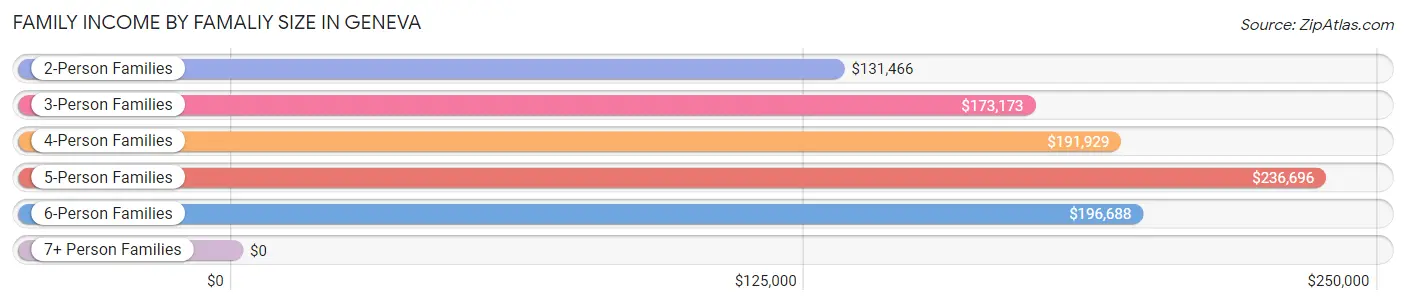
| Income Bracket | # Families | Median Income |
| 2-Person Families | 2,502 (41.9%) | $131,466 |
| 3-Person Families | 1,517 (25.4%) | $173,173 |
| 4-Person Families | 1,374 (23.0%) | $191,929 |
| 5-Person Families | 383 (6.4%) | $236,696 |
| 6-Person Families | 179 (3.0%) | $196,688 |
| 7+ Person Families | 19 (0.3%) | $0 |
| Total | 5,974 (100.0%) | $161,033 |
Family Income by Number of Earners in Geneva
The median family income in Geneva is $161,033, with families comprising 3+ earners (983) having the highest median family income of $192,257, while families with no earners (666) have the lowest median family income of $73,041, accounting for 16.5% and 11.2% of families, respectively.
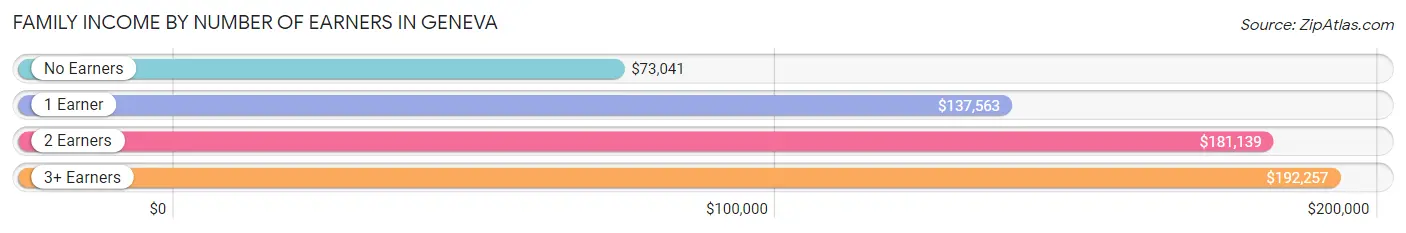
| Number of Earners | # Families | Median Income |
| No Earners | 666 (11.2%) | $73,041 |
| 1 Earner | 1,485 (24.9%) | $137,563 |
| 2 Earners | 2,840 (47.5%) | $181,139 |
| 3+ Earners | 983 (16.5%) | $192,257 |
| Total | 5,974 (100.0%) | $161,033 |
Household Income in Geneva
Household Income Brackets in Geneva
With 2,279 households falling in the category, the $200,000+ income range is the most frequent in Geneva, accounting for 28.0% of all households. In contrast, only 114 households (1.4%) fall into the $10,000 to $14,999 income bracket, making it the least populous group.
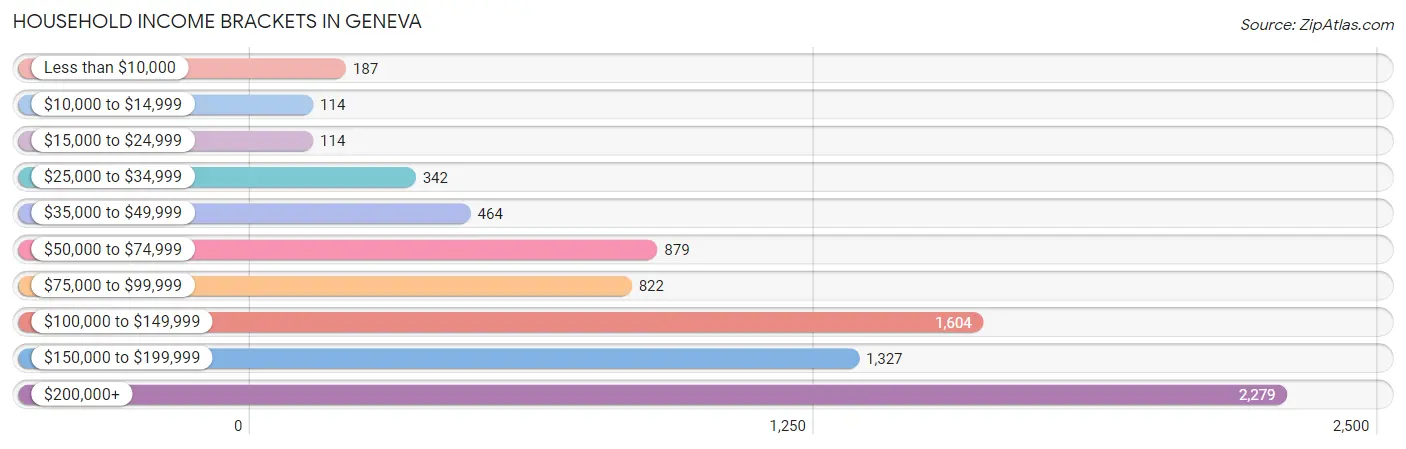
| Income Bracket | # Households | % Households |
| Less than $10,000 | 187 | 2.3% |
| $10,000 to $14,999 | 114 | 1.4% |
| $15,000 to $24,999 | 114 | 1.4% |
| $25,000 to $34,999 | 342 | 4.2% |
| $35,000 to $49,999 | 464 | 5.7% |
| $50,000 to $74,999 | 879 | 10.8% |
| $75,000 to $99,999 | 822 | 10.1% |
| $100,000 to $149,999 | 1,604 | 19.7% |
| $150,000 to $199,999 | 1,327 | 16.3% |
| $200,000+ | 2,279 | 28.0% |
Household Income by Householder Age in Geneva
The median household income in Geneva is $132,799, with the highest median household income of $175,016 found in the 45 to 64 years age bracket for the primary householder. A total of 3,350 households (41.1%) fall into this category. Meanwhile, the 65+ years age bracket for the primary householder has the lowest median household income of $83,947, with 2,336 households (28.7%) in this group.
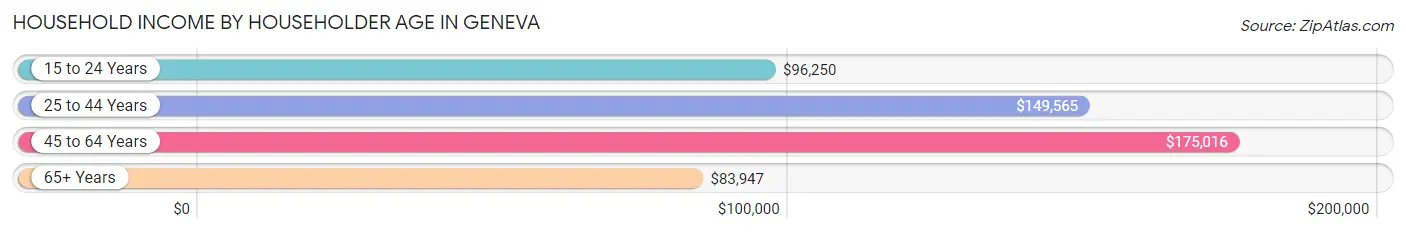
| Income Bracket | # Households | Median Income |
| 15 to 24 Years | 127 (1.6%) | $96,250 |
| 25 to 44 Years | 2,328 (28.6%) | $149,565 |
| 45 to 64 Years | 3,350 (41.1%) | $175,016 |
| 65+ Years | 2,336 (28.7%) | $83,947 |
| Total | 8,141 (100.0%) | $132,799 |
Poverty in Geneva
Income Below Poverty by Sex and Age in Geneva
With 2.4% poverty level for males and 2.7% for females among the residents of Geneva, 12 to 14 year old males and 25 to 34 year old females are the most vulnerable to poverty, with 39 males (7.7%) and 124 females (10.2%) in their respective age groups living below the poverty level.
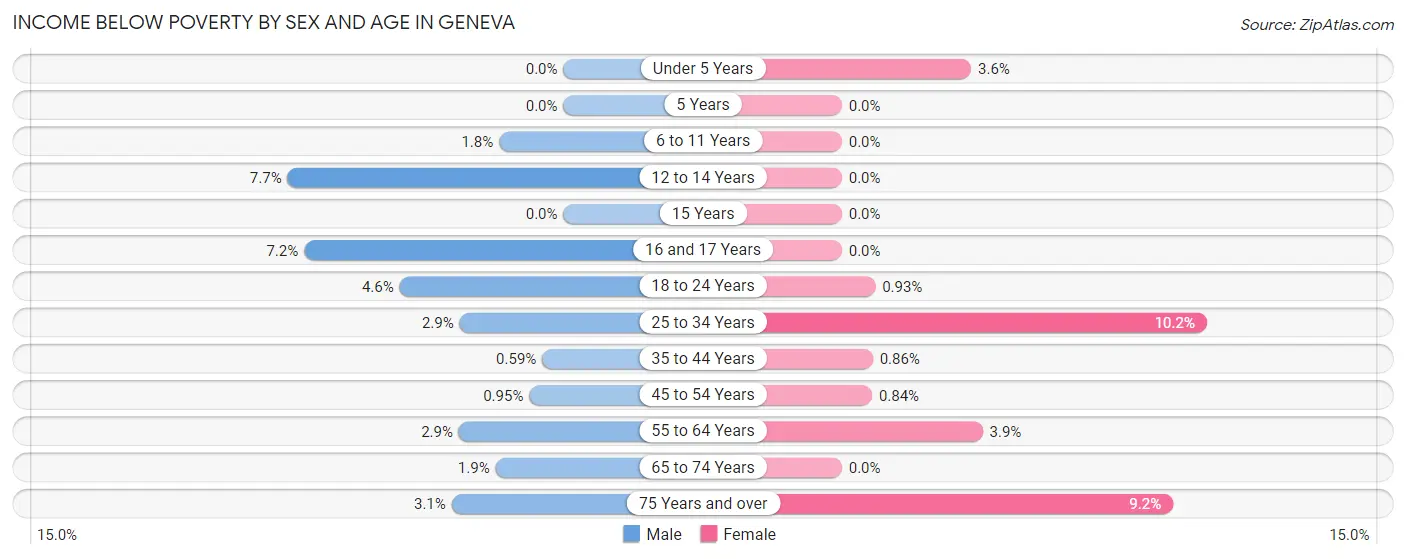
| Age Bracket | Male | Female |
| Under 5 Years | 0 (0.0%) | 13 (3.6%) |
| 5 Years | 0 (0.0%) | 0 (0.0%) |
| 6 to 11 Years | 14 (1.8%) | 0 (0.0%) |
| 12 to 14 Years | 39 (7.7%) | 0 (0.0%) |
| 15 Years | 0 (0.0%) | 0 (0.0%) |
| 16 and 17 Years | 26 (7.2%) | 0 (0.0%) |
| 18 to 24 Years | 36 (4.6%) | 7 (0.9%) |
| 25 to 34 Years | 26 (2.9%) | 124 (10.2%) |
| 35 to 44 Years | 8 (0.6%) | 13 (0.9%) |
| 45 to 54 Years | 14 (0.9%) | 11 (0.8%) |
| 55 to 64 Years | 45 (2.9%) | 69 (3.9%) |
| 65 to 74 Years | 22 (1.9%) | 0 (0.0%) |
| 75 Years and over | 12 (3.1%) | 67 (9.2%) |
| Total | 242 (2.4%) | 304 (2.7%) |
Income Above Poverty by Sex and Age in Geneva
According to the poverty statistics in Geneva, males aged under 5 years and females aged 5 years are the age groups that are most secure financially, with 100.0% of males and 100.0% of females in these age groups living above the poverty line.
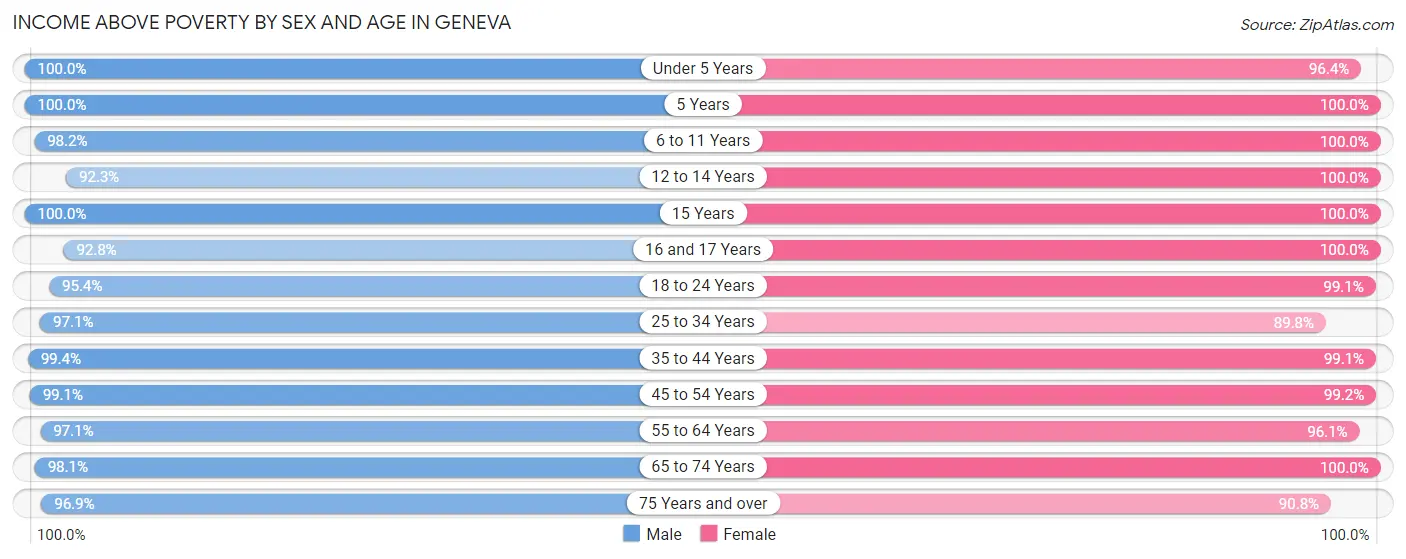
| Age Bracket | Male | Female |
| Under 5 Years | 419 (100.0%) | 348 (96.4%) |
| 5 Years | 164 (100.0%) | 287 (100.0%) |
| 6 to 11 Years | 768 (98.2%) | 859 (100.0%) |
| 12 to 14 Years | 469 (92.3%) | 741 (100.0%) |
| 15 Years | 114 (100.0%) | 183 (100.0%) |
| 16 and 17 Years | 334 (92.8%) | 314 (100.0%) |
| 18 to 24 Years | 753 (95.4%) | 748 (99.1%) |
| 25 to 34 Years | 873 (97.1%) | 1,097 (89.8%) |
| 35 to 44 Years | 1,356 (99.4%) | 1,498 (99.1%) |
| 45 to 54 Years | 1,459 (99.1%) | 1,306 (99.2%) |
| 55 to 64 Years | 1,499 (97.1%) | 1,691 (96.1%) |
| 65 to 74 Years | 1,145 (98.1%) | 1,285 (100.0%) |
| 75 Years and over | 374 (96.9%) | 660 (90.8%) |
| Total | 9,727 (97.6%) | 11,017 (97.3%) |
Income Below Poverty Among Married-Couple Families in Geneva
The poverty statistics for married-couple families in Geneva show that 0.4% or 22 of the total 5,019 families live below the poverty line. Families with 1 or 2 children have the highest poverty rate of 0.8%, comprising of 13 families. On the other hand, families with 3 or 4 children have the lowest poverty rate of 0.0%, which includes 0 families.
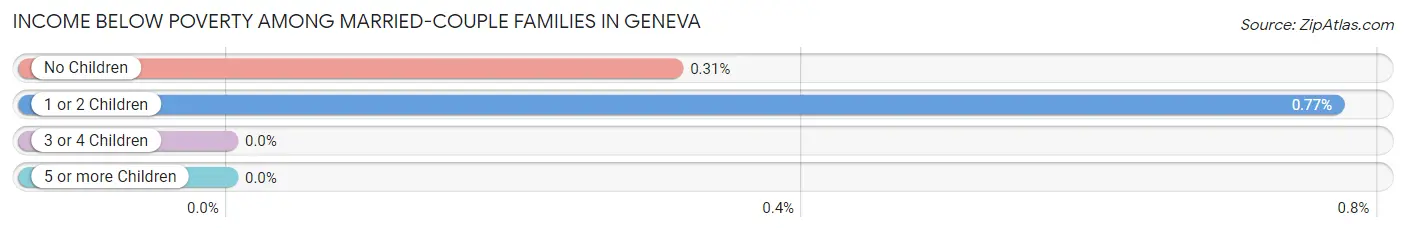
| Children | Above Poverty | Below Poverty |
| No Children | 2,875 (99.7%) | 9 (0.3%) |
| 1 or 2 Children | 1,684 (99.2%) | 13 (0.8%) |
| 3 or 4 Children | 430 (100.0%) | 0 (0.0%) |
| 5 or more Children | 8 (100.0%) | 0 (0.0%) |
| Total | 4,997 (99.6%) | 22 (0.4%) |
Income Below Poverty Among Single-Parent Households in Geneva
According to the poverty data in Geneva, 3.2% or 8 single-father households and 5.4% or 38 single-mother households are living below the poverty line. Among single-father households, those with no children have the highest poverty rate, with 8 households (7.5%) experiencing poverty. Likewise, among single-mother households, those with 1 or 2 children have the highest poverty rate, with 38 households (11.3%) falling below the poverty line.
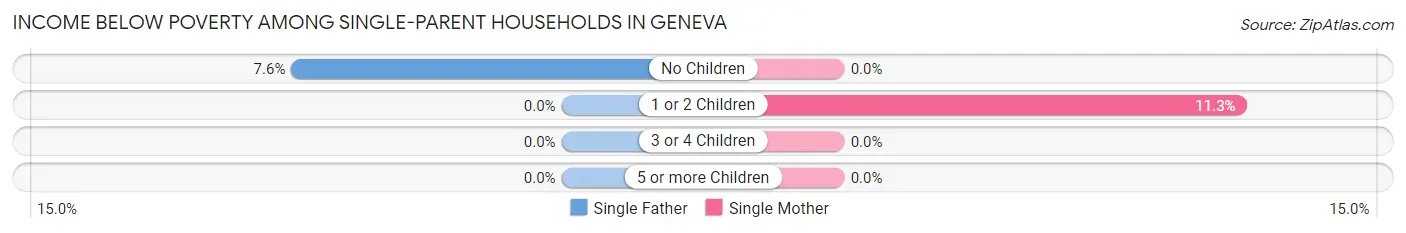
| Children | Single Father | Single Mother |
| No Children | 8 (7.5%) | 0 (0.0%) |
| 1 or 2 Children | 0 (0.0%) | 38 (11.3%) |
| 3 or 4 Children | 0 (0.0%) | 0 (0.0%) |
| 5 or more Children | 0 (0.0%) | 0 (0.0%) |
| Total | 8 (3.2%) | 38 (5.4%) |
Income Below Poverty Among Married-Couple vs Single-Parent Households in Geneva
The poverty data for Geneva shows that 22 of the married-couple family households (0.4%) and 46 of the single-parent households (4.8%) are living below the poverty level. Within the married-couple family households, those with 1 or 2 children have the highest poverty rate, with 13 households (0.8%) falling below the poverty line. Among the single-parent households, those with 1 or 2 children have the highest poverty rate, with 38 household (7.9%) living below poverty.
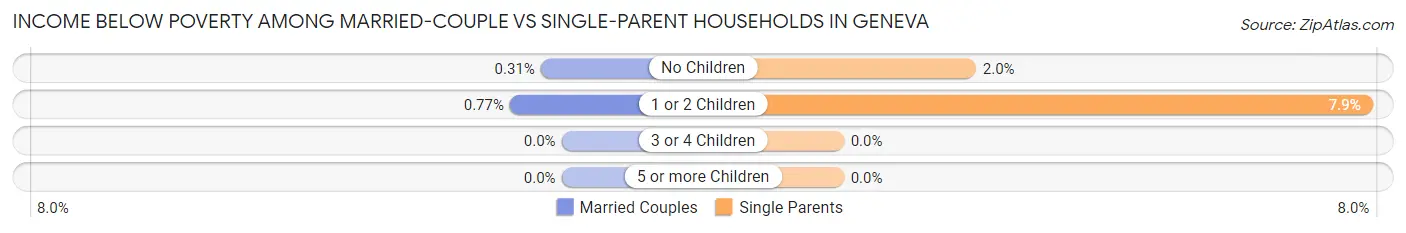
| Children | Married-Couple Families | Single-Parent Households |
| No Children | 9 (0.3%) | 8 (2.0%) |
| 1 or 2 Children | 13 (0.8%) | 38 (7.9%) |
| 3 or 4 Children | 0 (0.0%) | 0 (0.0%) |
| 5 or more Children | 0 (0.0%) | 0 (0.0%) |
| Total | 22 (0.4%) | 46 (4.8%) |
Race in Geneva
The most populous races in Geneva are White / Caucasian (18,708 | 87.5%), Hispanic or Latino (1,821 | 8.5%), and Two or more Races (1,161 | 5.4%).
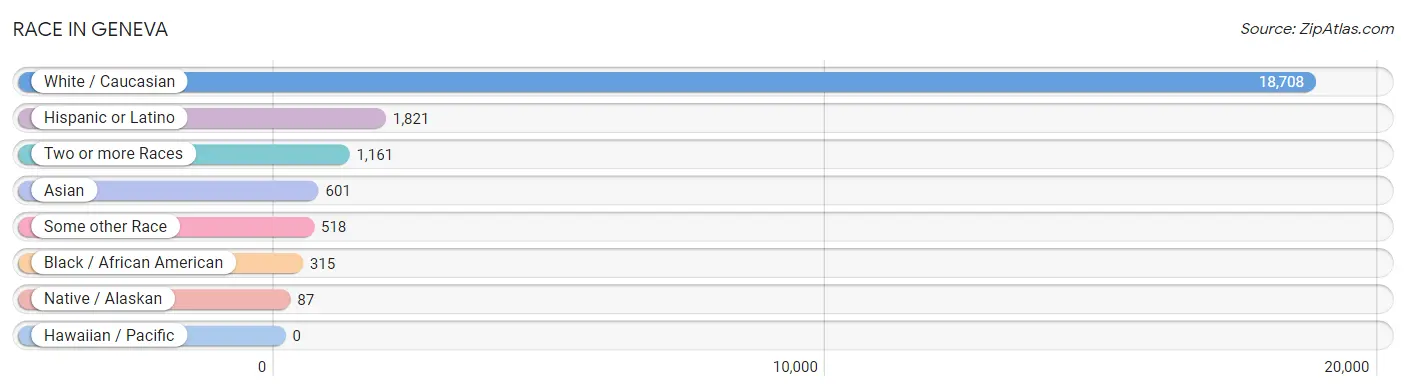
| Race | # Population | % Population |
| Asian | 601 | 2.8% |
| Black / African American | 315 | 1.5% |
| Hawaiian / Pacific | 0 | 0.0% |
| Hispanic or Latino | 1,821 | 8.5% |
| Native / Alaskan | 87 | 0.4% |
| White / Caucasian | 18,708 | 87.5% |
| Two or more Races | 1,161 | 5.4% |
| Some other Race | 518 | 2.4% |
| Total | 21,390 | 100.0% |
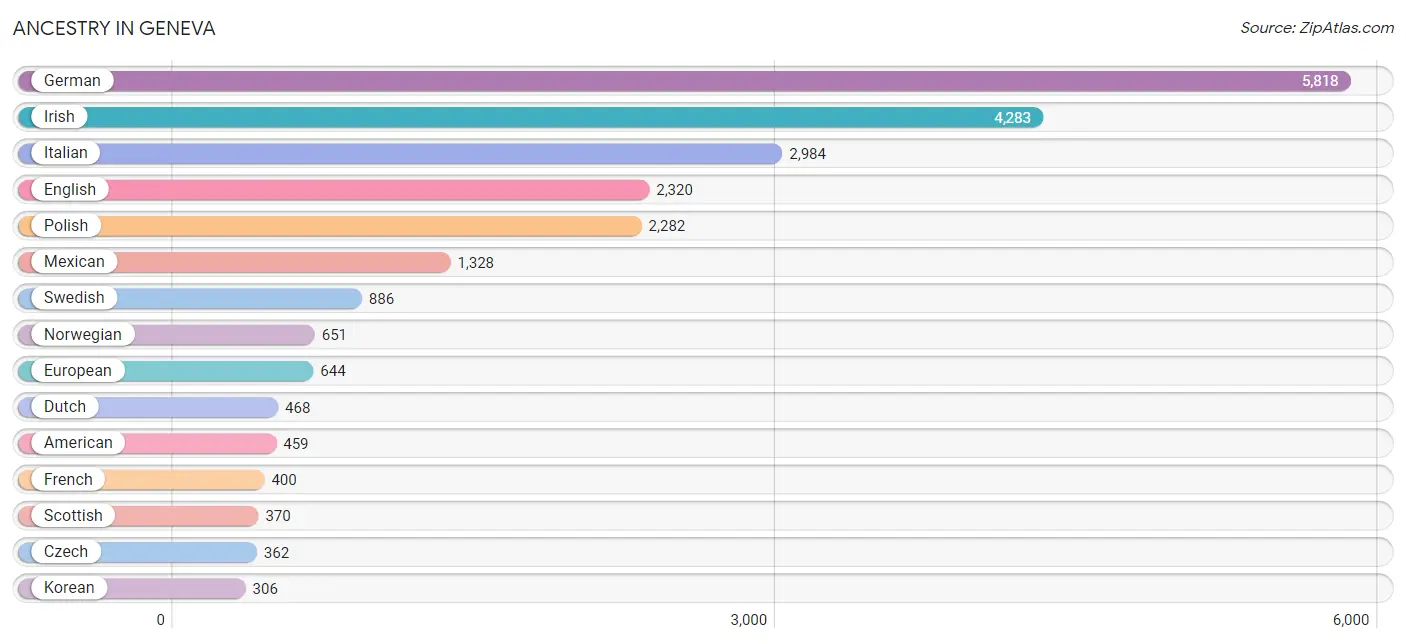
Ancestry in Geneva
The most populous ancestries reported in Geneva are German (5,818 | 27.2%), Irish (4,283 | 20.0%), Italian (2,984 | 14.0%), English (2,320 | 10.8%), and Polish (2,282 | 10.7%), together accounting for 82.7% of all Geneva residents.
| Ancestry | # Population | % Population |
| American | 459 | 2.1% |
| Armenian | 24 | 0.1% |
| Austrian | 81 | 0.4% |
| Belgian | 32 | 0.2% |
| Bhutanese | 183 | 0.9% |
| British | 64 | 0.3% |
| Central American | 13 | 0.1% |
| Central American Indian | 23 | 0.1% |
| Cherokee | 12 | 0.1% |
| Croatian | 44 | 0.2% |
| Cuban | 131 | 0.6% |
| Czech | 362 | 1.7% |
| Czechoslovakian | 55 | 0.3% |
| Danish | 107 | 0.5% |
| Delaware | 8 | 0.0% |
| Dutch | 468 | 2.2% |
| Eastern European | 92 | 0.4% |
| English | 2,320 | 10.8% |
| European | 644 | 3.0% |
| Filipino | 20 | 0.1% |
| Finnish | 145 | 0.7% |
| French | 400 | 1.9% |
| French Canadian | 266 | 1.2% |
| German | 5,818 | 27.2% |
| Greek | 177 | 0.8% |
| Hungarian | 93 | 0.4% |
| Indian (Asian) | 92 | 0.4% |
| Irish | 4,283 | 20.0% |
| Italian | 2,984 | 14.0% |
| Jamaican | 89 | 0.4% |
| Kenyan | 42 | 0.2% |
| Korean | 306 | 1.4% |
| Latvian | 14 | 0.1% |
| Lithuanian | 161 | 0.7% |
| Luxembourger | 33 | 0.2% |
| Mexican | 1,328 | 6.2% |
| Mexican American Indian | 64 | 0.3% |
| Northern European | 93 | 0.4% |
| Norwegian | 651 | 3.0% |
| Pakistani | 73 | 0.3% |
| Peruvian | 74 | 0.4% |
| Polish | 2,282 | 10.7% |
| Portuguese | 36 | 0.2% |
| Puerto Rican | 113 | 0.5% |
| Romanian | 101 | 0.5% |
| Russian | 182 | 0.9% |
| Salvadoran | 13 | 0.1% |
| Scandinavian | 68 | 0.3% |
| Scotch-Irish | 187 | 0.9% |
| Scottish | 370 | 1.7% |
| Serbian | 17 | 0.1% |
| Slavic | 4 | 0.0% |
| Slovak | 29 | 0.1% |
| Slovene | 51 | 0.2% |
| South American | 74 | 0.4% |
| Spaniard | 33 | 0.2% |
| Sri Lankan | 119 | 0.6% |
| Subsaharan African | 59 | 0.3% |
| Swedish | 886 | 4.1% |
| Swiss | 68 | 0.3% |
| Thai | 18 | 0.1% |
| Turkish | 50 | 0.2% |
| Ukrainian | 40 | 0.2% |
| Welsh | 48 | 0.2% |
| Yugoslavian | 18 | 0.1% | View All 65 Rows |
Immigrants in Geneva
The most numerous immigrant groups reported in Geneva came from Latin America (473 | 2.2%), Central America (387 | 1.8%), Mexico (387 | 1.8%), Asia (333 | 1.6%), and Eastern Asia (246 | 1.1%), together accounting for 8.5% of all Geneva residents.
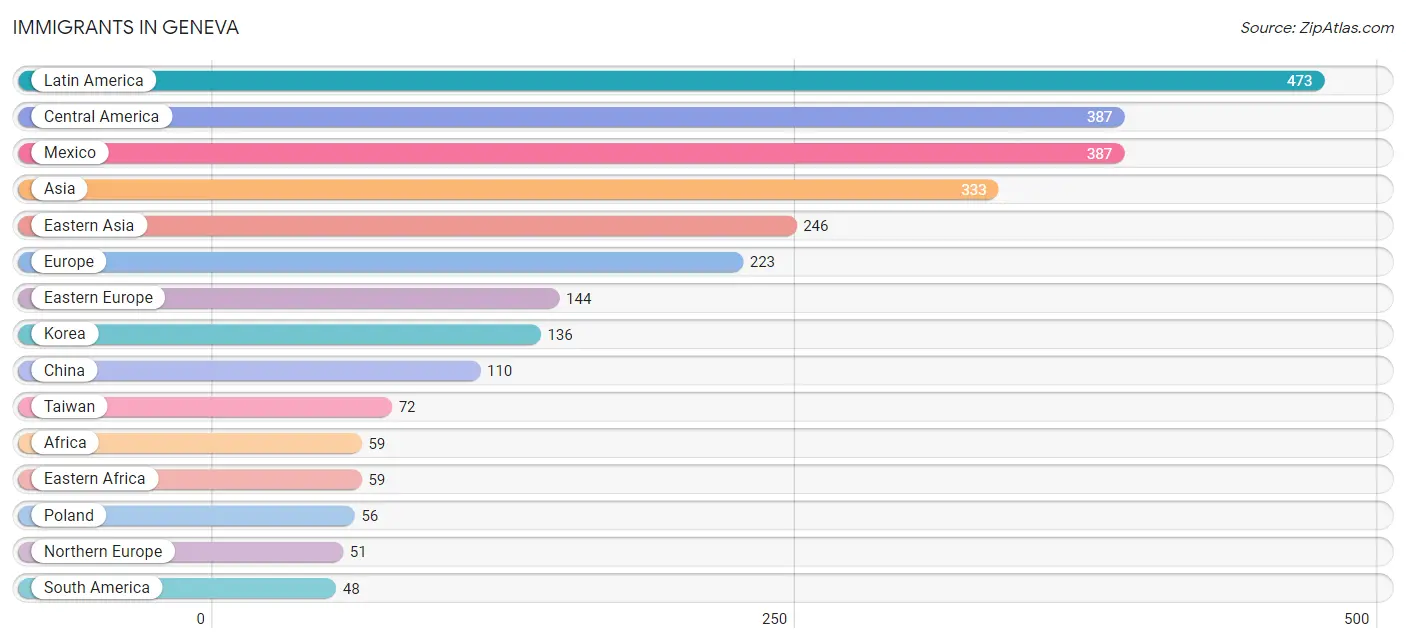
| Immigration Origin | # Population | % Population |
| Africa | 59 | 0.3% |
| Asia | 333 | 1.6% |
| Bosnia and Herzegovina | 17 | 0.1% |
| Brazil | 36 | 0.2% |
| Canada | 27 | 0.1% |
| Caribbean | 38 | 0.2% |
| Central America | 387 | 1.8% |
| Chile | 5 | 0.0% |
| China | 110 | 0.5% |
| Czechoslovakia | 36 | 0.2% |
| Eastern Africa | 59 | 0.3% |
| Eastern Asia | 246 | 1.1% |
| Eastern Europe | 144 | 0.7% |
| England | 13 | 0.1% |
| Europe | 223 | 1.0% |
| Germany | 18 | 0.1% |
| Hong Kong | 26 | 0.1% |
| India | 12 | 0.1% |
| Ireland | 7 | 0.0% |
| Italy | 10 | 0.1% |
| Jamaica | 38 | 0.2% |
| Kenya | 42 | 0.2% |
| Korea | 136 | 0.6% |
| Latin America | 473 | 2.2% |
| Mexico | 387 | 1.8% |
| Northern Europe | 51 | 0.2% |
| Pakistan | 16 | 0.1% |
| Peru | 7 | 0.0% |
| Poland | 56 | 0.3% |
| Russia | 11 | 0.1% |
| South America | 48 | 0.2% |
| South Central Asia | 28 | 0.1% |
| South Eastern Asia | 44 | 0.2% |
| Southern Europe | 10 | 0.1% |
| Taiwan | 72 | 0.3% |
| Turkey | 15 | 0.1% |
| Ukraine | 24 | 0.1% |
| Vietnam | 44 | 0.2% |
| Western Asia | 15 | 0.1% |
| Western Europe | 18 | 0.1% | View All 40 Rows |
Sex and Age in Geneva
Sex and Age in Geneva
The most populous age groups in Geneva are 55 to 59 Years (967 | 9.7%) for men and 55 to 59 Years (1,022 | 9.0%) for women.
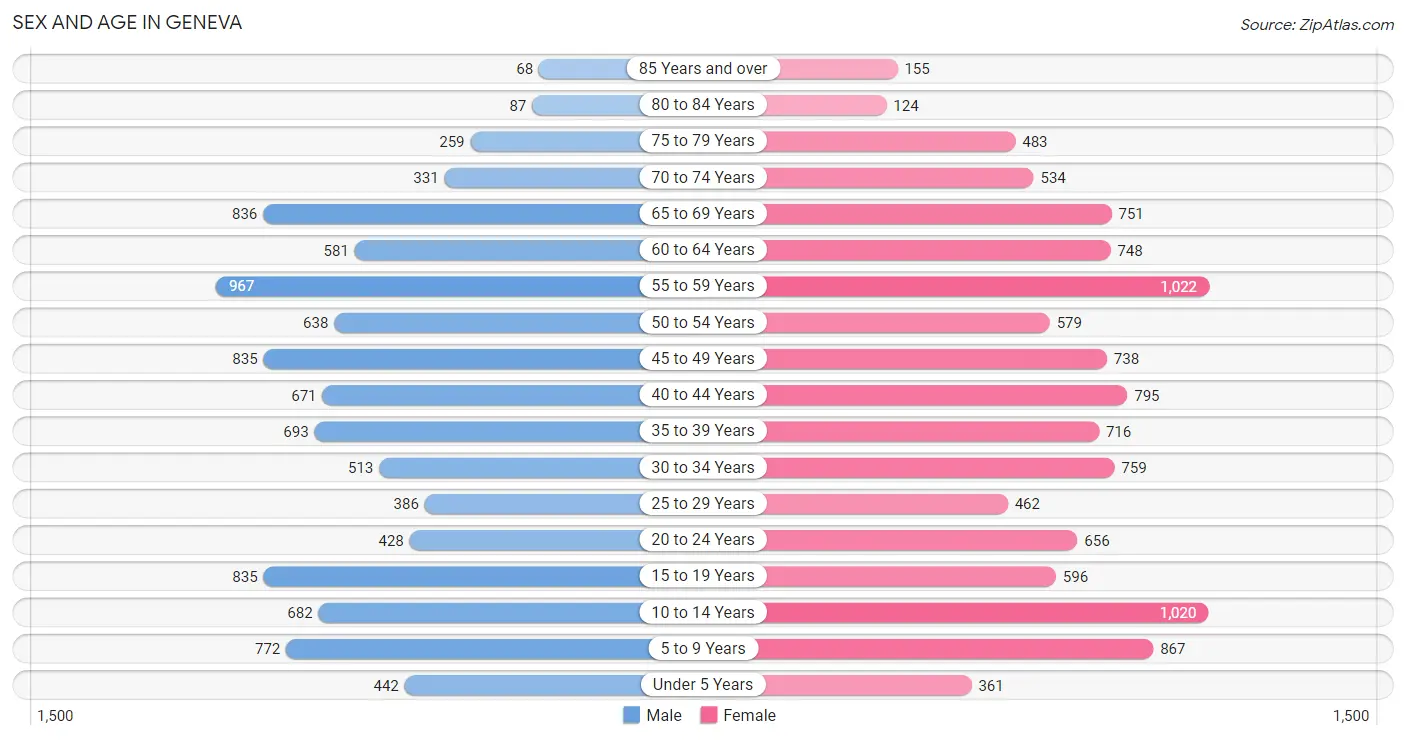
| Age Bracket | Male | Female |
| Under 5 Years | 442 (4.4%) | 361 (3.2%) |
| 5 to 9 Years | 772 (7.7%) | 867 (7.6%) |
| 10 to 14 Years | 682 (6.8%) | 1,020 (9.0%) |
| 15 to 19 Years | 835 (8.3%) | 596 (5.2%) |
| 20 to 24 Years | 428 (4.3%) | 656 (5.8%) |
| 25 to 29 Years | 386 (3.8%) | 462 (4.1%) |
| 30 to 34 Years | 513 (5.1%) | 759 (6.7%) |
| 35 to 39 Years | 693 (6.9%) | 716 (6.3%) |
| 40 to 44 Years | 671 (6.7%) | 795 (7.0%) |
| 45 to 49 Years | 835 (8.3%) | 738 (6.5%) |
| 50 to 54 Years | 638 (6.4%) | 579 (5.1%) |
| 55 to 59 Years | 967 (9.7%) | 1,022 (9.0%) |
| 60 to 64 Years | 581 (5.8%) | 748 (6.6%) |
| 65 to 69 Years | 836 (8.3%) | 751 (6.6%) |
| 70 to 74 Years | 331 (3.3%) | 534 (4.7%) |
| 75 to 79 Years | 259 (2.6%) | 483 (4.3%) |
| 80 to 84 Years | 87 (0.9%) | 124 (1.1%) |
| 85 Years and over | 68 (0.7%) | 155 (1.4%) |
| Total | 10,024 (100.0%) | 11,366 (100.0%) |
Families and Households in Geneva
Median Family Size in Geneva
The median family size in Geneva is 3.09 persons per family, with married-couple families (5,019 | 84.0%) accounting for the largest median family size of 3.15 persons per family. On the other hand, single male/father families (251 | 4.2%) represent the smallest median family size with 2.61 persons per family.
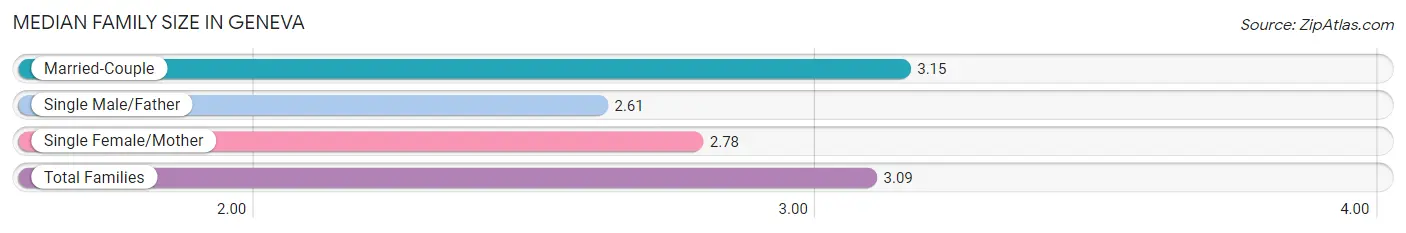
| Family Type | # Families | Family Size |
| Married-Couple | 5,019 (84.0%) | 3.15 |
| Single Male/Father | 251 (4.2%) | 2.61 |
| Single Female/Mother | 704 (11.8%) | 2.78 |
| Total Families | 5,974 (100.0%) | 3.09 |
Median Household Size in Geneva
The median household size in Geneva is 2.62 persons per household, with married-couple households (5,019 | 61.7%) accounting for the largest median household size of 3.18 persons per household. non-family households (2,167 | 26.6%) represent the smallest median household size with 1.20 persons per household.
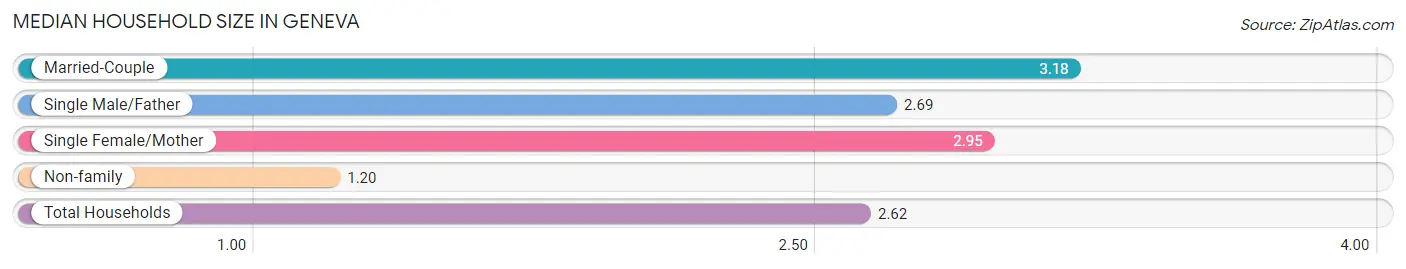
| Household Type | # Households | Household Size |
| Married-Couple | 5,019 (61.7%) | 3.18 |
| Single Male/Father | 251 (3.1%) | 2.69 |
| Single Female/Mother | 704 (8.6%) | 2.95 |
| Non-family | 2,167 (26.6%) | 1.20 |
| Total Households | 8,141 (100.0%) | 2.62 |
Household Size by Marriage Status in Geneva
Out of a total of 8,141 households in Geneva, 5,974 (73.4%) are family households, while 2,167 (26.6%) are nonfamily households. The most numerous type of family households are 2-person households, comprising 2,451, and the most common type of nonfamily households are 1-person households, comprising 1,723.
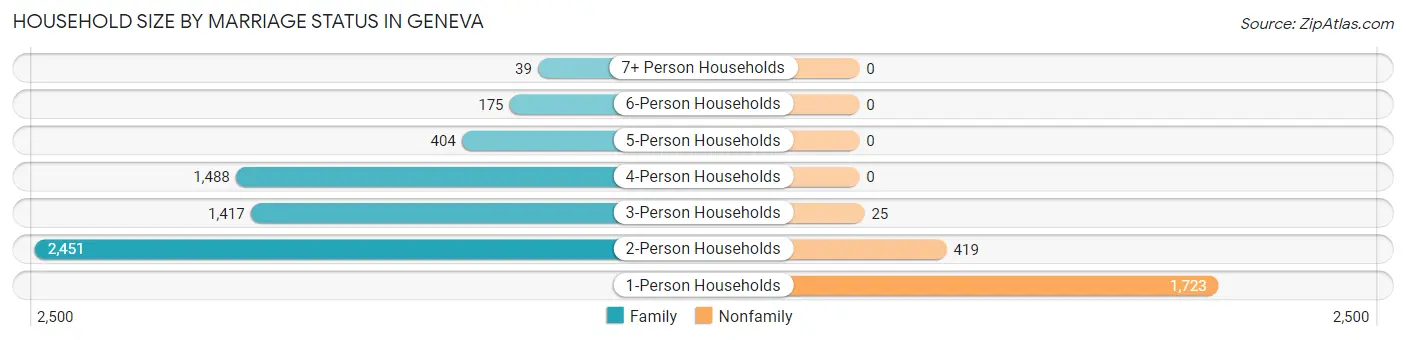
| Household Size | Family Households | Nonfamily Households |
| 1-Person Households | - | 1,723 (21.2%) |
| 2-Person Households | 2,451 (30.1%) | 419 (5.1%) |
| 3-Person Households | 1,417 (17.4%) | 25 (0.3%) |
| 4-Person Households | 1,488 (18.3%) | 0 (0.0%) |
| 5-Person Households | 404 (5.0%) | 0 (0.0%) |
| 6-Person Households | 175 (2.1%) | 0 (0.0%) |
| 7+ Person Households | 39 (0.5%) | 0 (0.0%) |
| Total | 5,974 (73.4%) | 2,167 (26.6%) |
Female Fertility in Geneva
Fertility by Age in Geneva
Average fertility rate in Geneva is 21.0 births per 1,000 women. Women in the age bracket of 35 to 50 years have the highest fertility rate with 33.0 births per 1,000 women. Women in the age bracket of 35 to 50 years acount for 77.4% of all women with births.
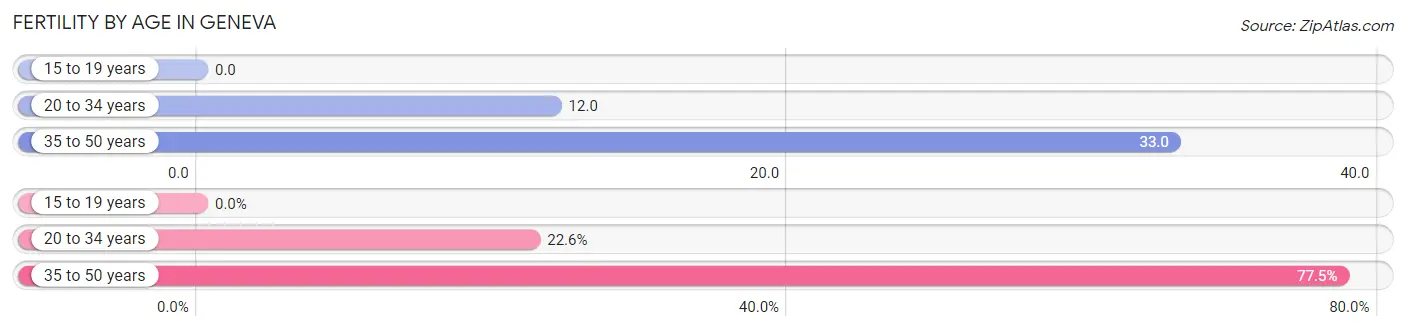
| Age Bracket | Women with Births | Births / 1,000 Women |
| 15 to 19 years | 0 (0.0%) | 0.0 |
| 20 to 34 years | 23 (22.6%) | 12.0 |
| 35 to 50 years | 79 (77.4%) | 33.0 |
| Total | 102 (100.0%) | 21.0 |
Fertility by Age by Marriage Status in Geneva
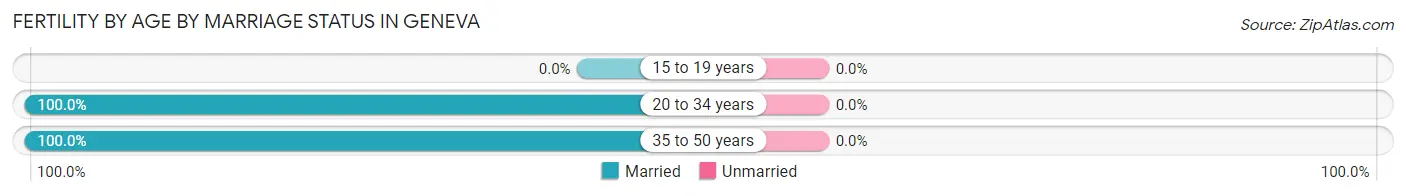
| Age Bracket | Married | Unmarried |
| 15 to 19 years | 0 (0.0%) | 0 (0.0%) |
| 20 to 34 years | 23 (100.0%) | 0 (0.0%) |
| 35 to 50 years | 79 (100.0%) | 0 (0.0%) |
| Total | 102 (100.0%) | 0 (0.0%) |
Fertility by Education in Geneva
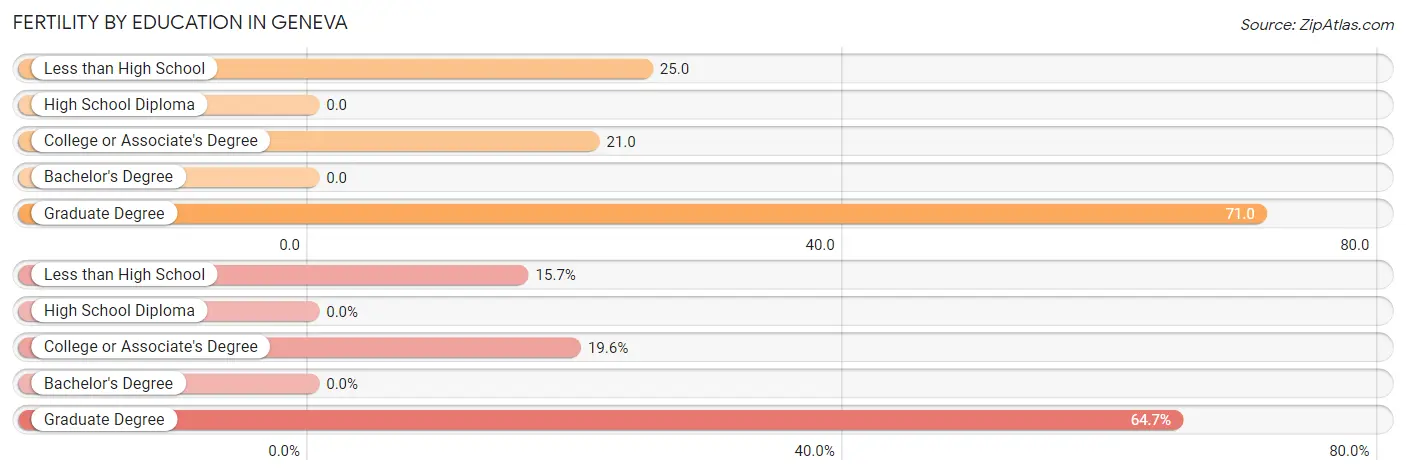
| Educational Attainment | Women with Births | Births / 1,000 Women |
| Less than High School | 16 (15.7%) | 25.0 |
| High School Diploma | 0 (0.0%) | 0.0 |
| College or Associate's Degree | 20 (19.6%) | 21.0 |
| Bachelor's Degree | 0 (0.0%) | 0.0 |
| Graduate Degree | 66 (64.7%) | 71.0 |
| Total | 102 (100.0%) | 21.0 |
Fertility by Education by Marriage Status in Geneva
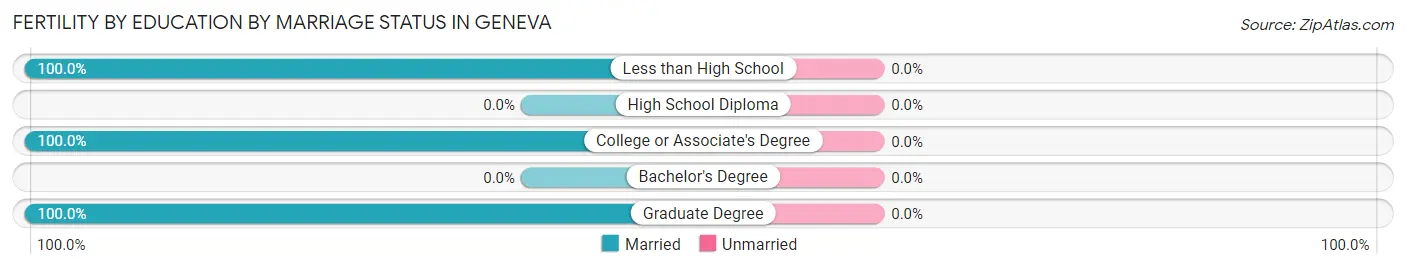
| Educational Attainment | Married | Unmarried |
| Less than High School | 16 (100.0%) | 0 (0.0%) |
| High School Diploma | 0 (0.0%) | 0 (0.0%) |
| College or Associate's Degree | 20 (100.0%) | 0 (0.0%) |
| Bachelor's Degree | 0 (0.0%) | 0 (0.0%) |
| Graduate Degree | 66 (100.0%) | 0 (0.0%) |
| Total | 102 (100.0%) | 0 (0.0%) |
Employment Characteristics in Geneva
Employment by Class of Employer in Geneva
Among the 11,479 employed individuals in Geneva, private company employees (7,840 | 68.3%), self-employed (not incorporated) (955 | 8.3%), and local government employees (873 | 7.6%) make up the most common classes of employment.
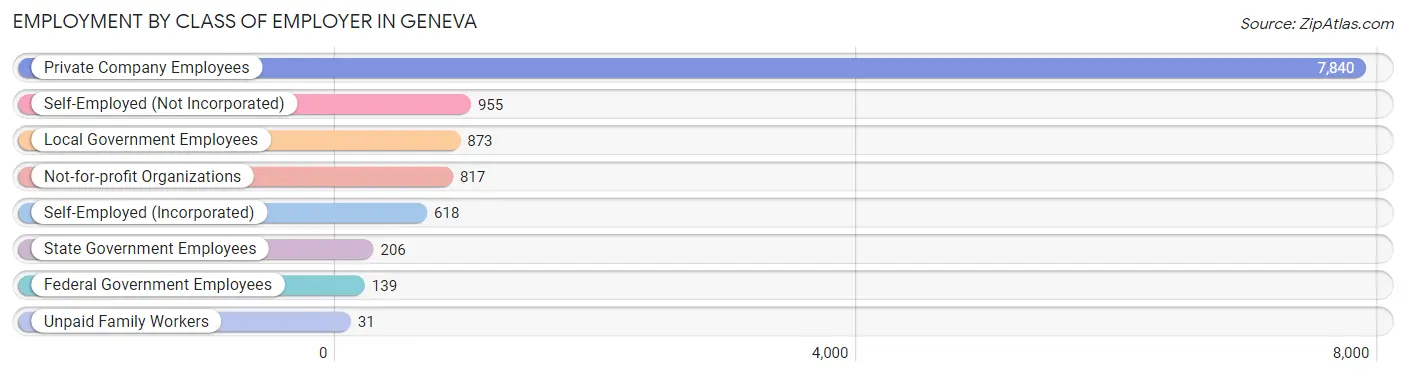
| Employer Class | # Employees | % Employees |
| Private Company Employees | 7,840 | 68.3% |
| Self-Employed (Incorporated) | 618 | 5.4% |
| Self-Employed (Not Incorporated) | 955 | 8.3% |
| Not-for-profit Organizations | 817 | 7.1% |
| Local Government Employees | 873 | 7.6% |
| State Government Employees | 206 | 1.8% |
| Federal Government Employees | 139 | 1.2% |
| Unpaid Family Workers | 31 | 0.3% |
| Total | 11,479 | 100.0% |
Employment Status by Age in Geneva
According to the labor force statistics for Geneva, out of the total population over 16 years of age (16,949), 70.3% or 11,915 individuals are in the labor force, with 2.0% or 238 of them unemployed. The age group with the highest labor force participation rate is 25 to 29 years, with 91.4% or 775 individuals in the labor force. Within the labor force, the 25 to 29 years age range has the highest percentage of unemployed individuals, with 8.0% or 62 of them being unemployed.
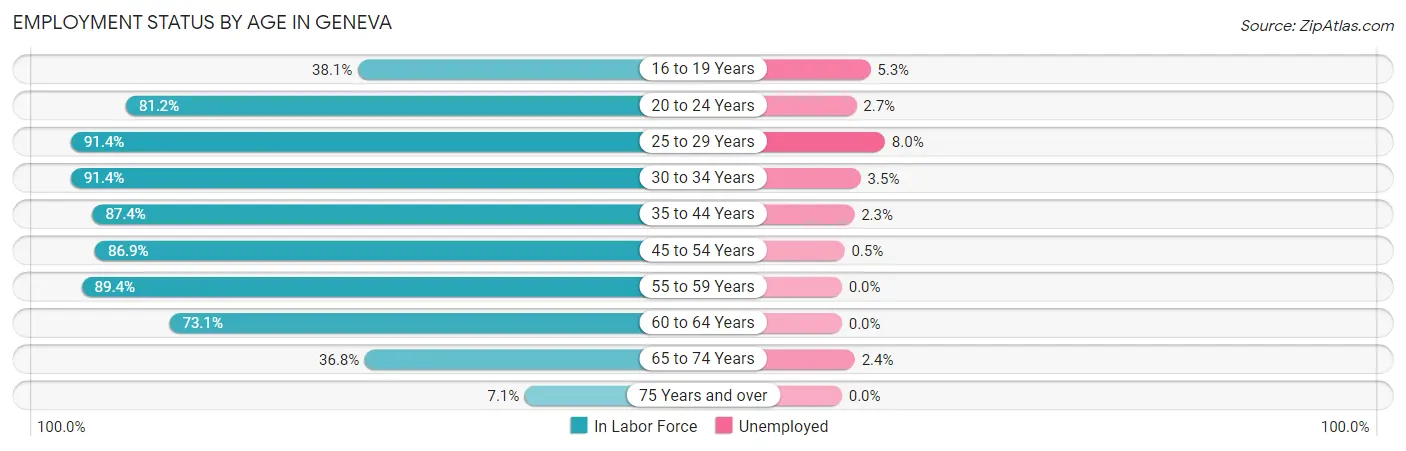
| Age Bracket | In Labor Force | Unemployed |
| 16 to 19 Years | 432 (38.1%) | 23 (5.3%) |
| 20 to 24 Years | 880 (81.2%) | 24 (2.7%) |
| 25 to 29 Years | 775 (91.4%) | 62 (8.0%) |
| 30 to 34 Years | 1,163 (91.4%) | 41 (3.5%) |
| 35 to 44 Years | 2,513 (87.4%) | 58 (2.3%) |
| 45 to 54 Years | 2,425 (86.9%) | 12 (0.5%) |
| 55 to 59 Years | 1,778 (89.4%) | 0 (0.0%) |
| 60 to 64 Years | 971 (73.1%) | 0 (0.0%) |
| 65 to 74 Years | 902 (36.8%) | 22 (2.4%) |
| 75 Years and over | 83 (7.1%) | 0 (0.0%) |
| Total | 11,915 (70.3%) | 238 (2.0%) |
Employment Status by Educational Attainment in Geneva
According to labor force statistics for Geneva, 86.7% of individuals (9,626) out of the total population between 25 and 64 years of age (11,103) are in the labor force, with 1.8% or 173 of them being unemployed. The group with the highest labor force participation rate are those with the educational attainment of less than high school, with 94.6% or 315 individuals in the labor force. Within the labor force, individuals with less than high school education have the highest percentage of unemployment, with 7.3% or 23 of them being unemployed.
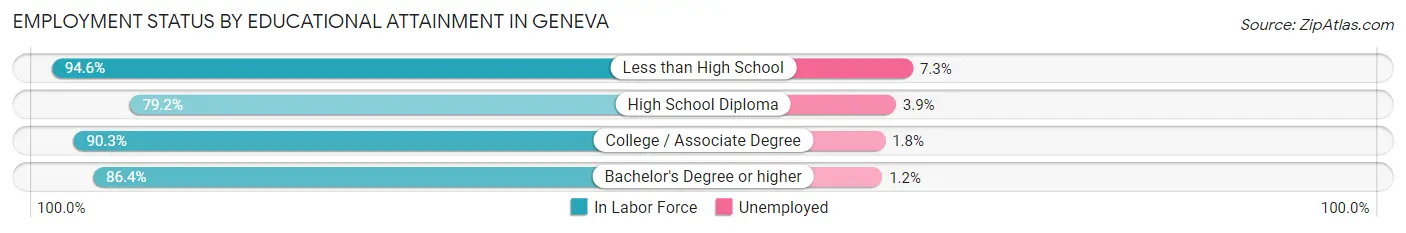
| Educational Attainment | In Labor Force | Unemployed |
| Less than High School | 315 (94.6%) | 24 (7.3%) |
| High School Diploma | 942 (79.2%) | 46 (3.9%) |
| College / Associate Degree | 2,043 (90.3%) | 41 (1.8%) |
| Bachelor's Degree or higher | 6,322 (86.4%) | 88 (1.2%) |
| Total | 9,626 (86.7%) | 200 (1.8%) |
Employment Occupations by Sex in Geneva
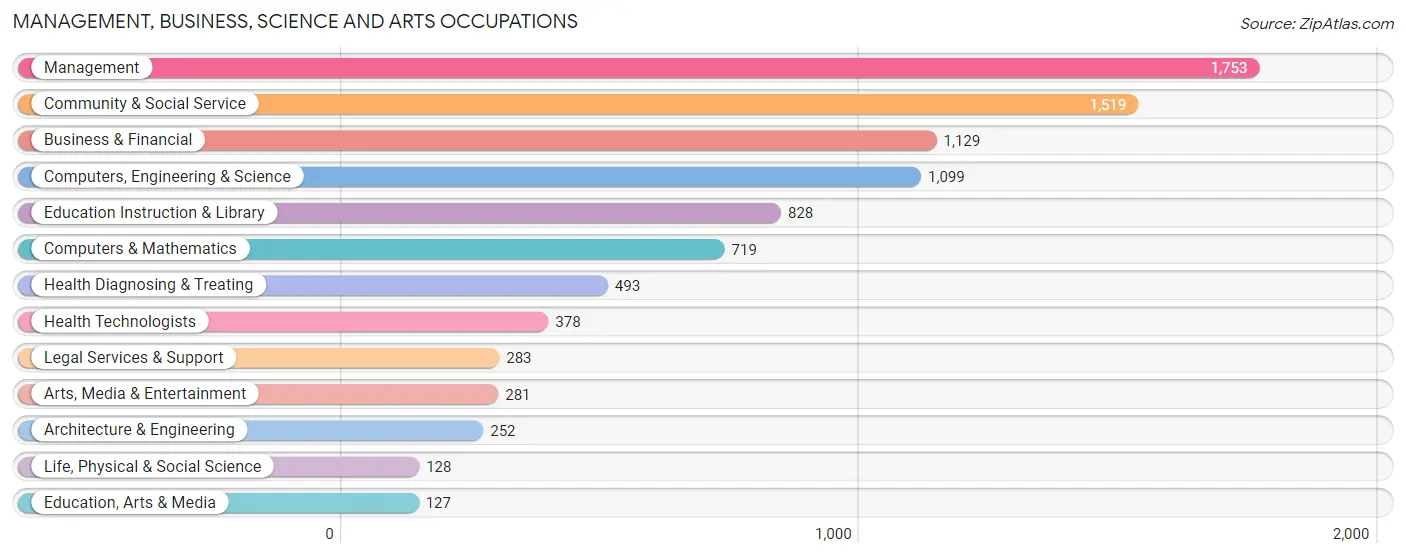
Management, Business, Science and Arts Occupations
The most common Management, Business, Science and Arts occupations in Geneva are Management (1,753 | 15.0%), Community & Social Service (1,519 | 13.0%), Business & Financial (1,129 | 9.7%), Computers, Engineering & Science (1,099 | 9.4%), and Education Instruction & Library (828 | 7.1%).
Management, Business, Science and Arts Occupations by Sex
Within the Management, Business, Science and Arts occupations in Geneva, the most male-oriented occupations are Architecture & Engineering (86.5%), Computers & Mathematics (72.2%), and Computers, Engineering & Science (71.9%), while the most female-oriented occupations are Education Instruction & Library (82.3%), Education, Arts & Media (75.6%), and Health Diagnosing & Treating (70.8%).
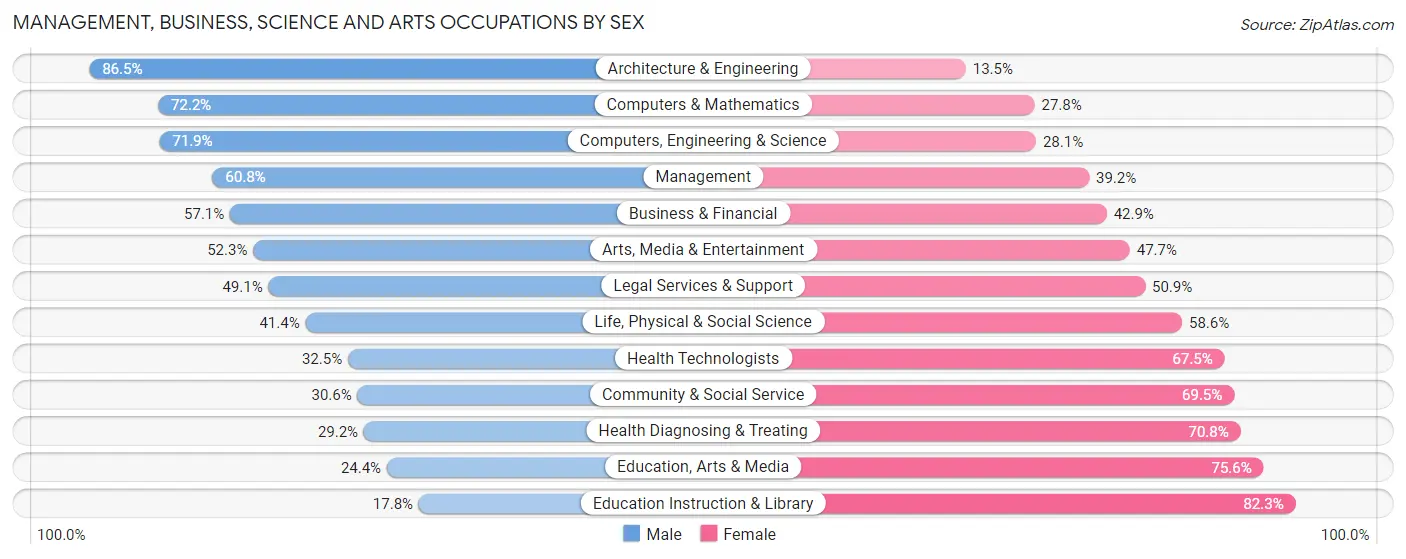
| Occupation | Male | Female |
| Management | 1,066 (60.8%) | 687 (39.2%) |
| Business & Financial | 645 (57.1%) | 484 (42.9%) |
| Computers, Engineering & Science | 790 (71.9%) | 309 (28.1%) |
| Computers & Mathematics | 519 (72.2%) | 200 (27.8%) |
| Architecture & Engineering | 218 (86.5%) | 34 (13.5%) |
| Life, Physical & Social Science | 53 (41.4%) | 75 (58.6%) |
| Community & Social Service | 464 (30.5%) | 1,055 (69.5%) |
| Education, Arts & Media | 31 (24.4%) | 96 (75.6%) |
| Legal Services & Support | 139 (49.1%) | 144 (50.9%) |
| Education Instruction & Library | 147 (17.7%) | 681 (82.3%) |
| Arts, Media & Entertainment | 147 (52.3%) | 134 (47.7%) |
| Health Diagnosing & Treating | 144 (29.2%) | 349 (70.8%) |
| Health Technologists | 123 (32.5%) | 255 (67.5%) |
| Total (Category) | 3,109 (51.9%) | 2,884 (48.1%) |
| Total (Overall) | 6,067 (51.9%) | 5,612 (48.0%) |
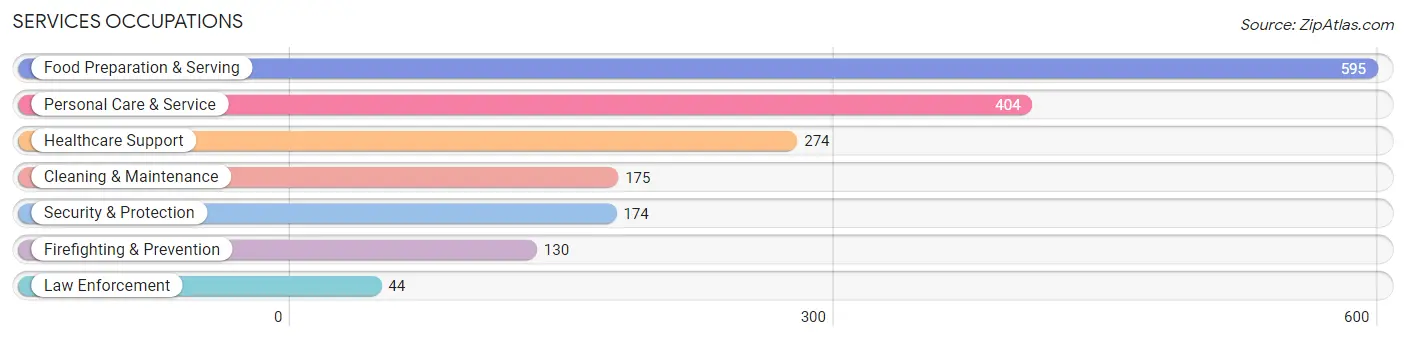
Services Occupations
The most common Services occupations in Geneva are Food Preparation & Serving (595 | 5.1%), Personal Care & Service (404 | 3.5%), Healthcare Support (274 | 2.4%), Cleaning & Maintenance (175 | 1.5%), and Security & Protection (174 | 1.5%).
Services Occupations by Sex
Within the Services occupations in Geneva, the most male-oriented occupations are Law Enforcement (100.0%), Security & Protection (90.8%), and Firefighting & Prevention (87.7%), while the most female-oriented occupations are Healthcare Support (90.1%), Personal Care & Service (72.0%), and Food Preparation & Serving (53.4%).
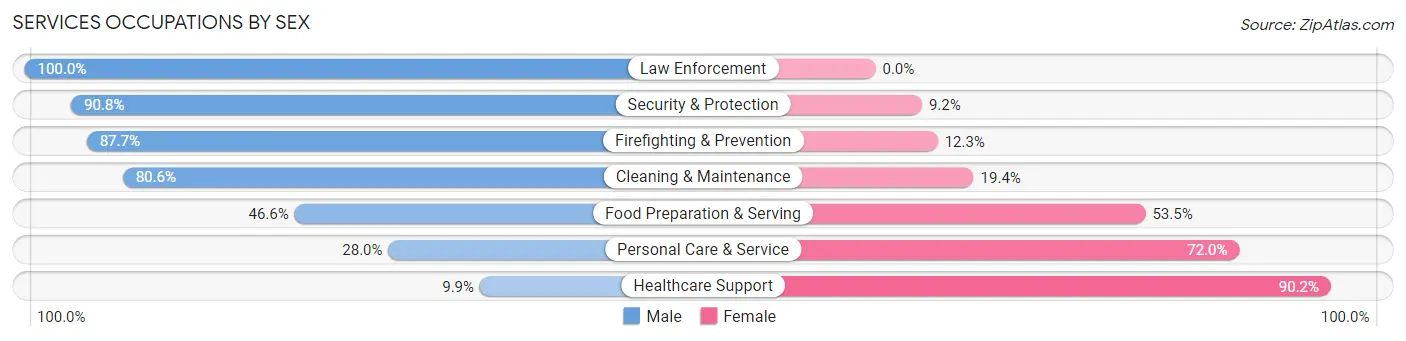
| Occupation | Male | Female |
| Healthcare Support | 27 (9.9%) | 247 (90.1%) |
| Security & Protection | 158 (90.8%) | 16 (9.2%) |
| Firefighting & Prevention | 114 (87.7%) | 16 (12.3%) |
| Law Enforcement | 44 (100.0%) | 0 (0.0%) |
| Food Preparation & Serving | 277 (46.6%) | 318 (53.4%) |
| Cleaning & Maintenance | 141 (80.6%) | 34 (19.4%) |
| Personal Care & Service | 113 (28.0%) | 291 (72.0%) |
| Total (Category) | 716 (44.1%) | 906 (55.9%) |
| Total (Overall) | 6,067 (51.9%) | 5,612 (48.0%) |
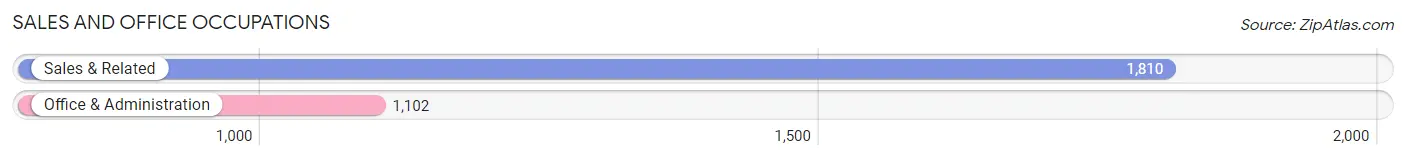
Sales and Office Occupations
The most common Sales and Office occupations in Geneva are Sales & Related (1,810 | 15.5%), and Office & Administration (1,102 | 9.4%).
Sales and Office Occupations by Sex
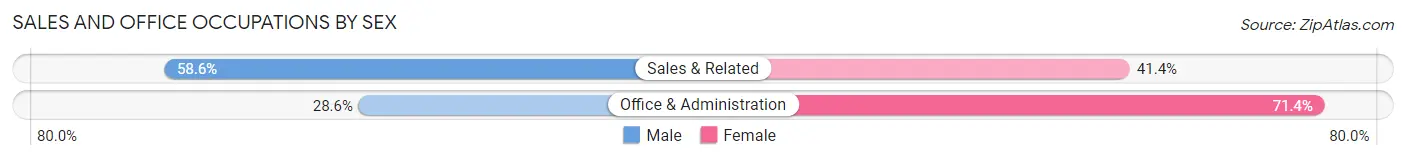
| Occupation | Male | Female |
| Sales & Related | 1,060 (58.6%) | 750 (41.4%) |
| Office & Administration | 315 (28.6%) | 787 (71.4%) |
| Total (Category) | 1,375 (47.2%) | 1,537 (52.8%) |
| Total (Overall) | 6,067 (51.9%) | 5,612 (48.0%) |
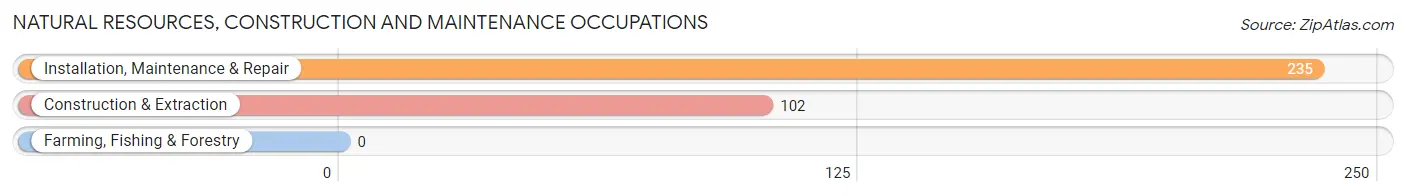
Natural Resources, Construction and Maintenance Occupations
The most common Natural Resources, Construction and Maintenance occupations in Geneva are Installation, Maintenance & Repair (235 | 2.0%), and Construction & Extraction (102 | 0.9%).
Natural Resources, Construction and Maintenance Occupations by Sex
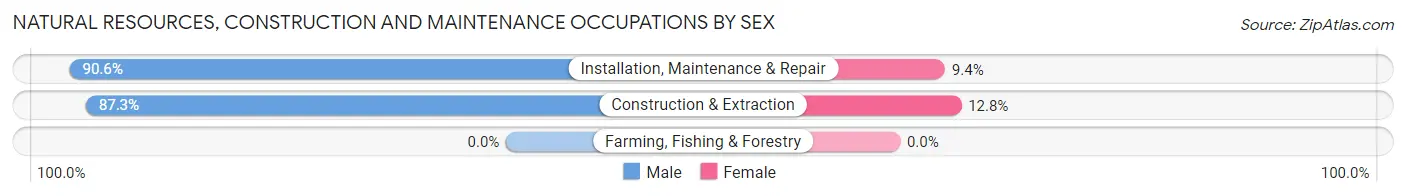
| Occupation | Male | Female |
| Farming, Fishing & Forestry | 0 (0.0%) | 0 (0.0%) |
| Construction & Extraction | 89 (87.3%) | 13 (12.8%) |
| Installation, Maintenance & Repair | 213 (90.6%) | 22 (9.4%) |
| Total (Category) | 302 (89.6%) | 35 (10.4%) |
| Total (Overall) | 6,067 (51.9%) | 5,612 (48.0%) |
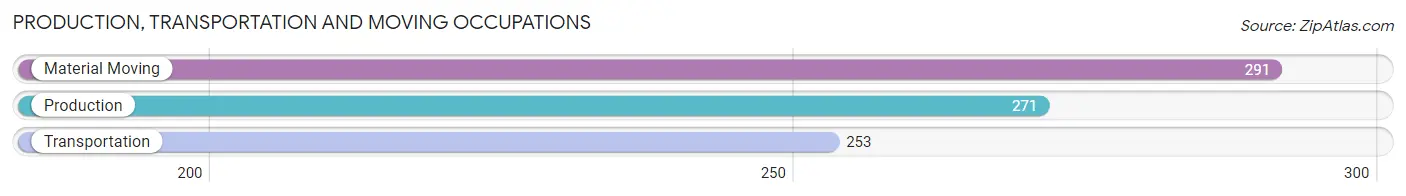
Production, Transportation and Moving Occupations
The most common Production, Transportation and Moving occupations in Geneva are Material Moving (291 | 2.5%), Production (271 | 2.3%), and Transportation (253 | 2.2%).
Production, Transportation and Moving Occupations by Sex
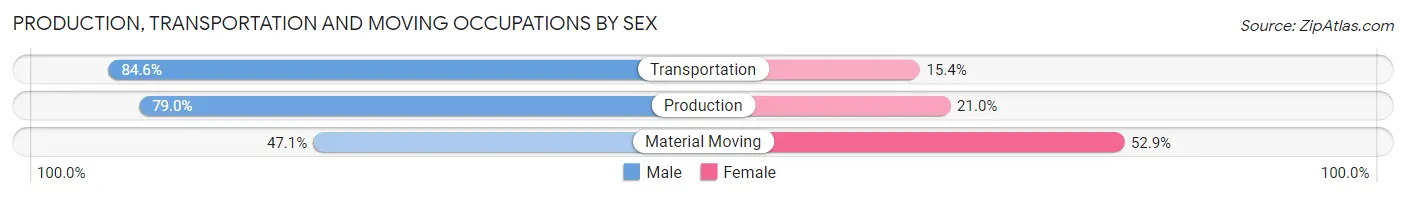
| Occupation | Male | Female |
| Production | 214 (79.0%) | 57 (21.0%) |
| Transportation | 214 (84.6%) | 39 (15.4%) |
| Material Moving | 137 (47.1%) | 154 (52.9%) |
| Total (Category) | 565 (69.3%) | 250 (30.7%) |
| Total (Overall) | 6,067 (51.9%) | 5,612 (48.0%) |
Employment Industries by Sex in Geneva
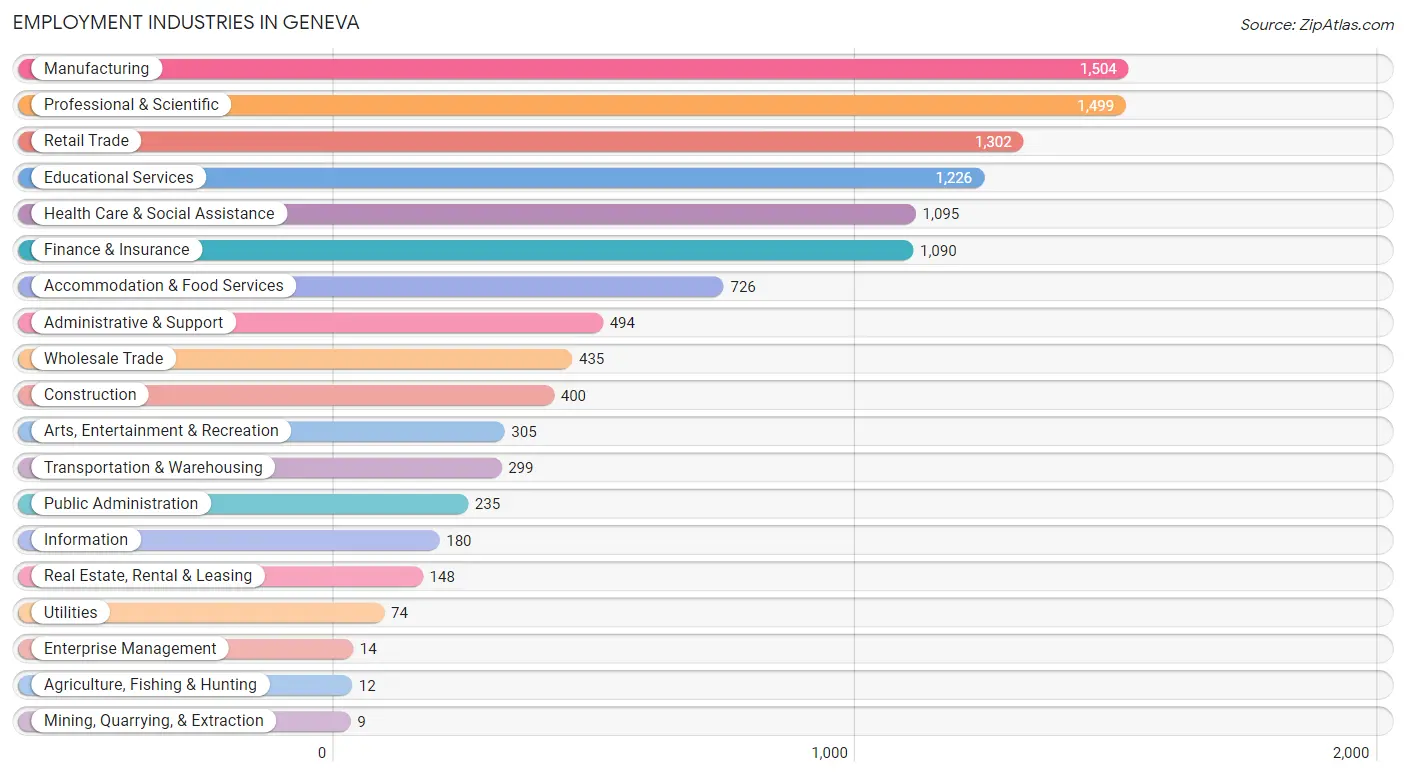
Employment Industries in Geneva
The major employment industries in Geneva include Manufacturing (1,504 | 12.9%), Professional & Scientific (1,499 | 12.8%), Retail Trade (1,302 | 11.2%), Educational Services (1,226 | 10.5%), and Health Care & Social Assistance (1,095 | 9.4%).
Employment Industries by Sex in Geneva
The Geneva industries that see more men than women are Agriculture, Fishing & Hunting (100.0%), Mining, Quarrying, & Extraction (100.0%), and Enterprise Management (100.0%), whereas the industries that tend to have a higher number of women are Health Care & Social Assistance (79.2%), Educational Services (76.3%), and Real Estate, Rental & Leasing (66.9%).
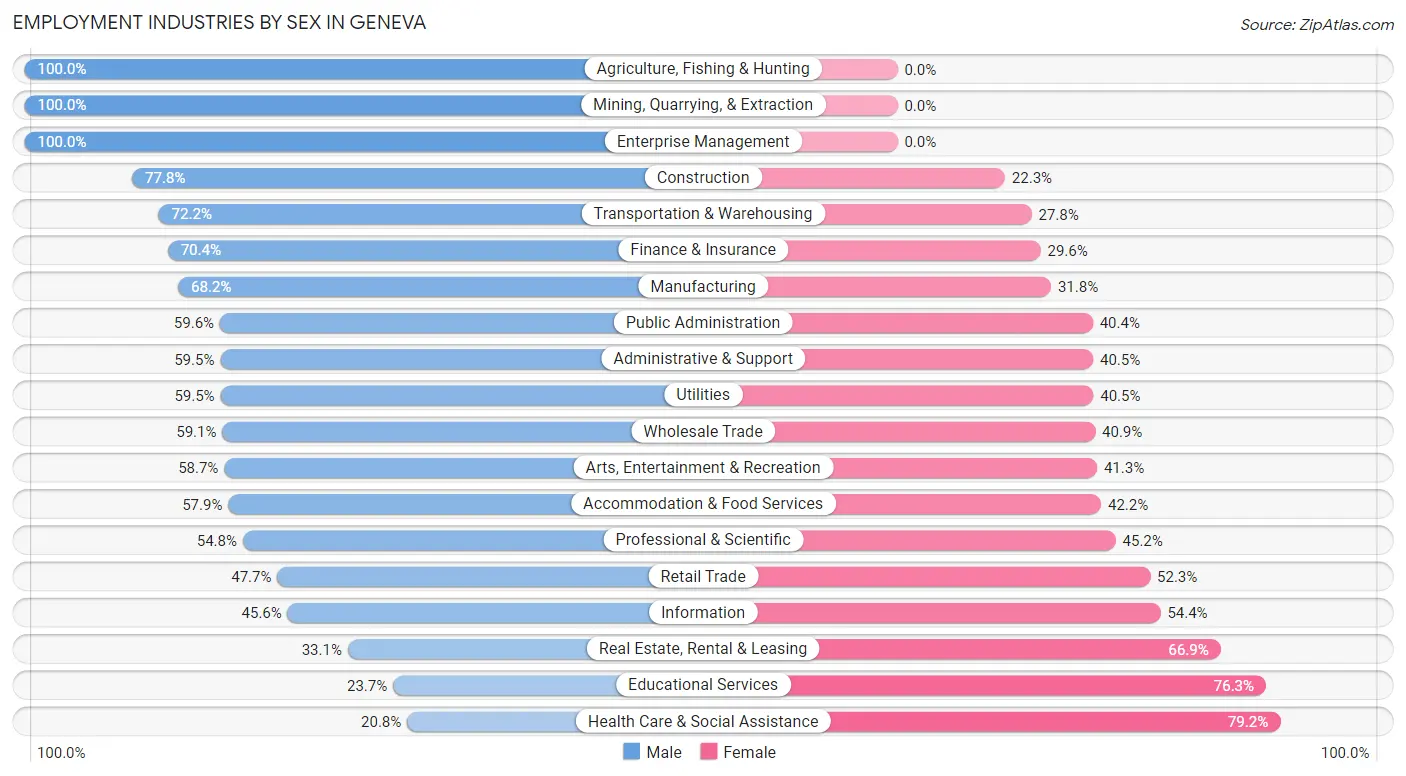
| Industry | Male | Female |
| Agriculture, Fishing & Hunting | 12 (100.0%) | 0 (0.0%) |
| Mining, Quarrying, & Extraction | 9 (100.0%) | 0 (0.0%) |
| Construction | 311 (77.7%) | 89 (22.3%) |
| Manufacturing | 1,026 (68.2%) | 478 (31.8%) |
| Wholesale Trade | 257 (59.1%) | 178 (40.9%) |
| Retail Trade | 621 (47.7%) | 681 (52.3%) |
| Transportation & Warehousing | 216 (72.2%) | 83 (27.8%) |
| Utilities | 44 (59.5%) | 30 (40.5%) |
| Information | 82 (45.6%) | 98 (54.4%) |
| Finance & Insurance | 767 (70.4%) | 323 (29.6%) |
| Real Estate, Rental & Leasing | 49 (33.1%) | 99 (66.9%) |
| Professional & Scientific | 822 (54.8%) | 677 (45.2%) |
| Enterprise Management | 14 (100.0%) | 0 (0.0%) |
| Administrative & Support | 294 (59.5%) | 200 (40.5%) |
| Educational Services | 291 (23.7%) | 935 (76.3%) |
| Health Care & Social Assistance | 228 (20.8%) | 867 (79.2%) |
| Arts, Entertainment & Recreation | 179 (58.7%) | 126 (41.3%) |
| Accommodation & Food Services | 420 (57.9%) | 306 (42.1%) |
| Public Administration | 140 (59.6%) | 95 (40.4%) |
| Total | 6,067 (51.9%) | 5,612 (48.0%) |
Education in Geneva
School Enrollment in Geneva
The most common levels of schooling among the 5,843 students in Geneva are high school (1,397 | 23.9%), middle school (1,388 | 23.7%), and elementary school (1,125 | 19.3%).
| School Level | # Students | % Students |
| Nursery / Preschool | 473 | 8.1% |
| Kindergarten | 182 | 3.1% |
| Elementary School | 1,125 | 19.3% |
| Middle School | 1,388 | 23.7% |
| High School | 1,397 | 23.9% |
| College / Undergraduate | 794 | 13.6% |
| Graduate / Professional | 484 | 8.3% |
| Total | 5,843 | 100.0% |
School Enrollment by Age by Funding Source in Geneva
Out of a total of 5,843 students who are enrolled in schools in Geneva, 1,017 (17.4%) attend a private institution, while the remaining 4,826 (82.6%) are enrolled in public schools. The age group of 25 to 34 year olds has the highest likelihood of being enrolled in private schools, with 164 (62.6% in the age bracket) enrolled. Conversely, the age group of 10 to 14 year olds has the lowest likelihood of being enrolled in a private school, with 1,574 (94.3% in the age bracket) attending a public institution.
| Age Bracket | Public School | Private School |
| 3 to 4 Year Olds | 86 (46.0%) | 101 (54.0%) |
| 5 to 9 Year Old | 1,282 (82.0%) | 282 (18.0%) |
| 10 to 14 Year Olds | 1,574 (94.3%) | 96 (5.8%) |
| 15 to 17 Year Olds | 843 (91.0%) | 83 (9.0%) |
| 18 to 19 Year Olds | 321 (91.7%) | 29 (8.3%) |
| 20 to 24 Year Olds | 426 (72.7%) | 160 (27.3%) |
| 25 to 34 Year Olds | 98 (37.4%) | 164 (62.6%) |
| 35 Years and over | 195 (65.4%) | 103 (34.6%) |
| Total | 4,826 (82.6%) | 1,017 (17.4%) |
Educational Attainment by Field of Study in Geneva
Business (2,454 | 24.9%), education (1,212 | 12.3%), social sciences (1,009 | 10.2%), science & technology (705 | 7.1%), and engineering (627 | 6.4%) are the most common fields of study among 9,865 individuals in Geneva who have obtained a bachelor's degree or higher.
| Field of Study | # Graduates | % Graduates |
| Computers & Mathematics | 467 | 4.7% |
| Bio, Nature & Agricultural | 553 | 5.6% |
| Physical & Health Sciences | 185 | 1.9% |
| Psychology | 373 | 3.8% |
| Social Sciences | 1,009 | 10.2% |
| Engineering | 627 | 6.4% |
| Multidisciplinary Studies | 54 | 0.5% |
| Science & Technology | 705 | 7.1% |
| Business | 2,454 | 24.9% |
| Education | 1,212 | 12.3% |
| Literature & Languages | 301 | 3.0% |
| Liberal Arts & History | 449 | 4.5% |
| Visual & Performing Arts | 467 | 4.7% |
| Communications | 511 | 5.2% |
| Arts & Humanities | 498 | 5.1% |
| Total | 9,865 | 100.0% |
Transportation & Commute in Geneva
Vehicle Availability by Sex in Geneva
The most prevalent vehicle ownership categories in Geneva are males with 2 vehicles (3,201, accounting for 54.1%) and females with 2 vehicles (2,846, making up 57.6%).
| Vehicles Available | Male | Female |
| No Vehicle | 26 (0.4%) | 0 (0.0%) |
| 1 Vehicle | 583 (9.9%) | 984 (17.7%) |
| 2 Vehicles | 3,201 (54.1%) | 2,846 (51.2%) |
| 3 Vehicles | 1,552 (26.2%) | 1,173 (21.1%) |
| 4 Vehicles | 516 (8.7%) | 513 (9.2%) |
| 5 or more Vehicles | 43 (0.7%) | 41 (0.7%) |
| Total | 5,921 (100.0%) | 5,557 (100.0%) |
Commute Time in Geneva
The most frequently occuring commute durations in Geneva are 5 to 9 minutes (1,460 commuters, 15.9%), 10 to 14 minutes (1,319 commuters, 14.4%), and 15 to 19 minutes (1,138 commuters, 12.4%).
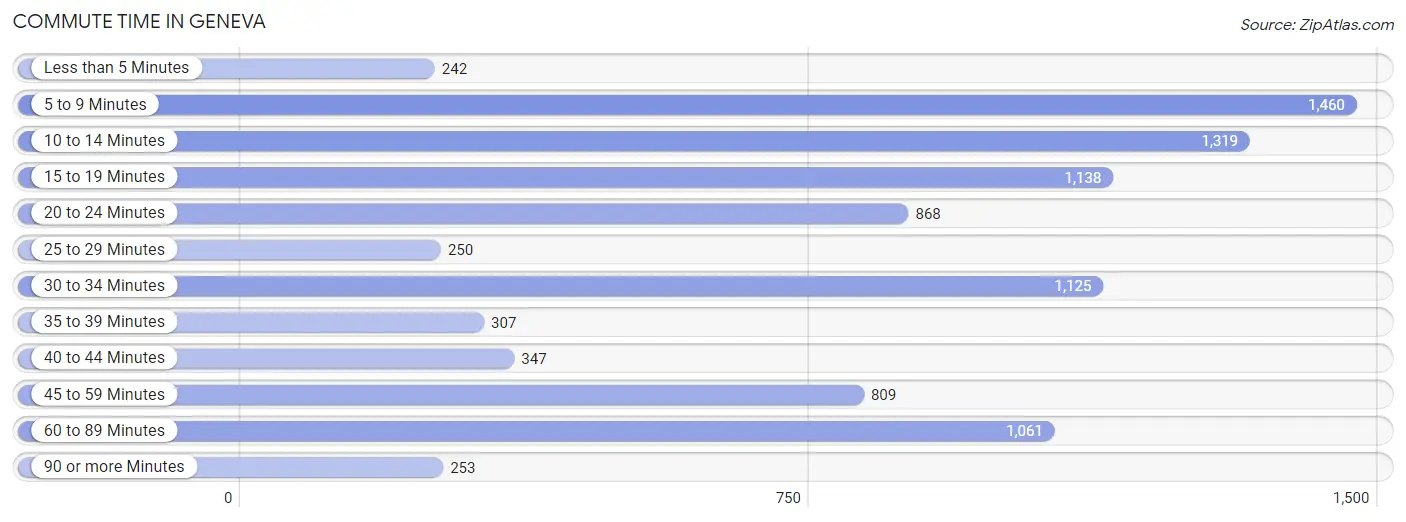
| Commute Time | # Commuters | % Commuters |
| Less than 5 Minutes | 242 | 2.6% |
| 5 to 9 Minutes | 1,460 | 15.9% |
| 10 to 14 Minutes | 1,319 | 14.4% |
| 15 to 19 Minutes | 1,138 | 12.4% |
| 20 to 24 Minutes | 868 | 9.5% |
| 25 to 29 Minutes | 250 | 2.7% |
| 30 to 34 Minutes | 1,125 | 12.3% |
| 35 to 39 Minutes | 307 | 3.3% |
| 40 to 44 Minutes | 347 | 3.8% |
| 45 to 59 Minutes | 809 | 8.8% |
| 60 to 89 Minutes | 1,061 | 11.6% |
| 90 or more Minutes | 253 | 2.8% |
Commute Time by Sex in Geneva
The most common commute times in Geneva are 60 to 89 minutes (684 commuters, 15.0%) for males and 5 to 9 minutes (805 commuters, 17.4%) for females.
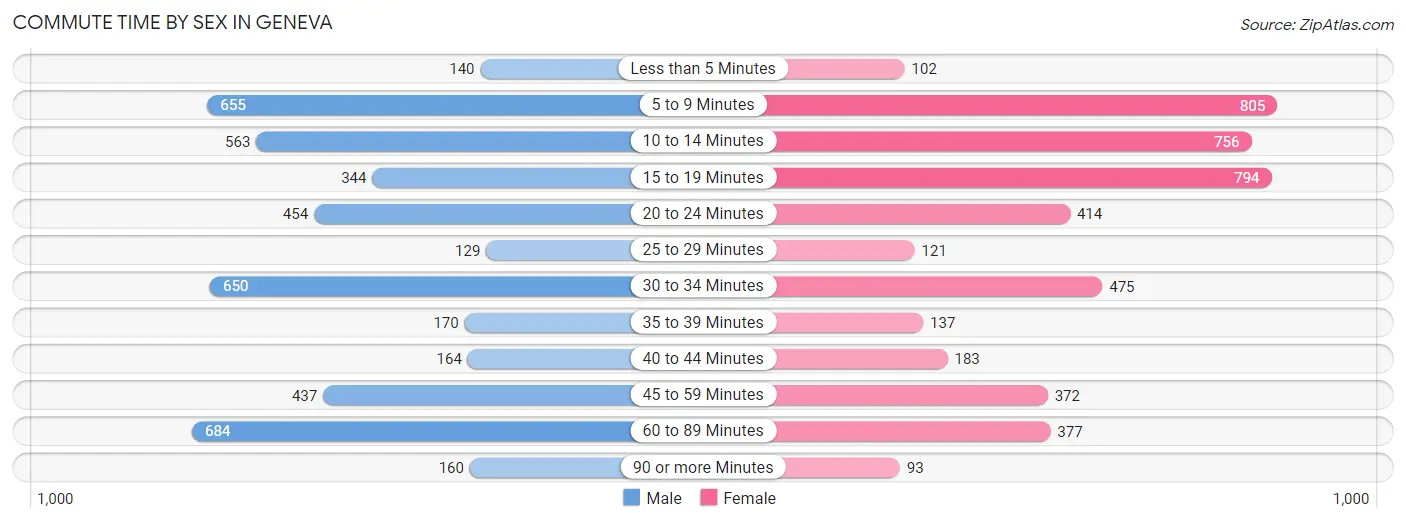
| Commute Time | Male | Female |
| Less than 5 Minutes | 140 (3.1%) | 102 (2.2%) |
| 5 to 9 Minutes | 655 (14.4%) | 805 (17.4%) |
| 10 to 14 Minutes | 563 (12.4%) | 756 (16.3%) |
| 15 to 19 Minutes | 344 (7.6%) | 794 (17.2%) |
| 20 to 24 Minutes | 454 (10.0%) | 414 (8.9%) |
| 25 to 29 Minutes | 129 (2.8%) | 121 (2.6%) |
| 30 to 34 Minutes | 650 (14.3%) | 475 (10.3%) |
| 35 to 39 Minutes | 170 (3.7%) | 137 (3.0%) |
| 40 to 44 Minutes | 164 (3.6%) | 183 (4.0%) |
| 45 to 59 Minutes | 437 (9.6%) | 372 (8.0%) |
| 60 to 89 Minutes | 684 (15.0%) | 377 (8.1%) |
| 90 or more Minutes | 160 (3.5%) | 93 (2.0%) |
Time of Departure to Work by Sex in Geneva
The most frequent times of departure to work in Geneva are 7:00 AM to 7:29 AM (658, 14.5%) for males and 7:00 AM to 7:29 AM (883, 19.1%) for females.
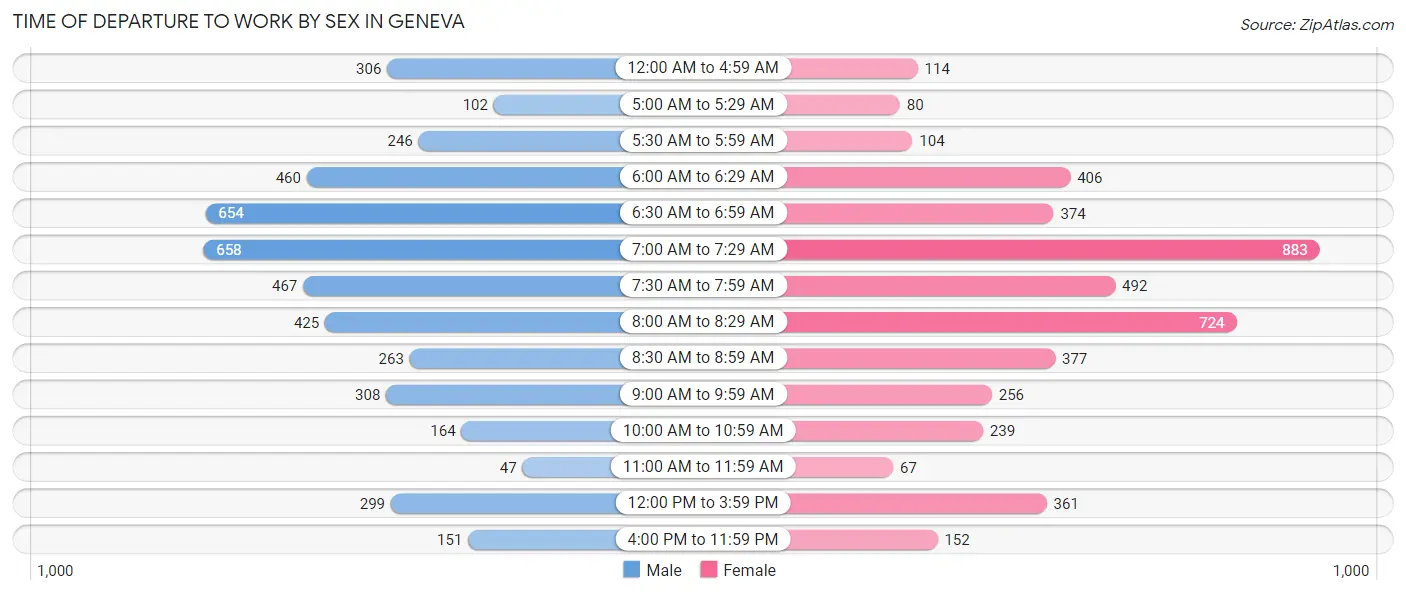
| Time of Departure | Male | Female |
| 12:00 AM to 4:59 AM | 306 (6.7%) | 114 (2.5%) |
| 5:00 AM to 5:29 AM | 102 (2.2%) | 80 (1.7%) |
| 5:30 AM to 5:59 AM | 246 (5.4%) | 104 (2.2%) |
| 6:00 AM to 6:29 AM | 460 (10.1%) | 406 (8.8%) |
| 6:30 AM to 6:59 AM | 654 (14.4%) | 374 (8.1%) |
| 7:00 AM to 7:29 AM | 658 (14.5%) | 883 (19.1%) |
| 7:30 AM to 7:59 AM | 467 (10.3%) | 492 (10.6%) |
| 8:00 AM to 8:29 AM | 425 (9.3%) | 724 (15.6%) |
| 8:30 AM to 8:59 AM | 263 (5.8%) | 377 (8.1%) |
| 9:00 AM to 9:59 AM | 308 (6.8%) | 256 (5.5%) |
| 10:00 AM to 10:59 AM | 164 (3.6%) | 239 (5.2%) |
| 11:00 AM to 11:59 AM | 47 (1.0%) | 67 (1.5%) |
| 12:00 PM to 3:59 PM | 299 (6.6%) | 361 (7.8%) |
| 4:00 PM to 11:59 PM | 151 (3.3%) | 152 (3.3%) |
| Total | 4,550 (100.0%) | 4,629 (100.0%) |
Housing Occupancy in Geneva
Occupancy by Ownership in Geneva
Of the total 8,141 dwellings in Geneva, owner-occupied units account for 6,928 (85.1%), while renter-occupied units make up 1,213 (14.9%).
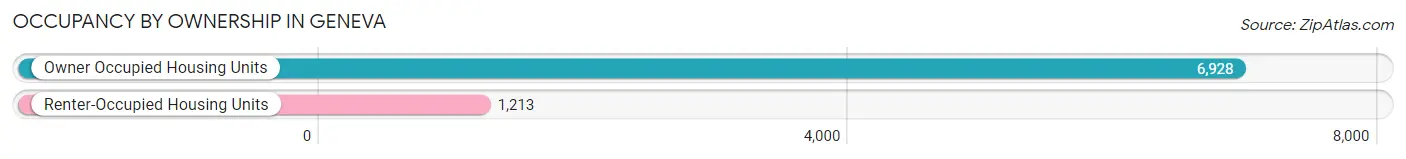
| Occupancy | # Housing Units | % Housing Units |
| Owner Occupied Housing Units | 6,928 | 85.1% |
| Renter-Occupied Housing Units | 1,213 | 14.9% |
| Total Occupied Housing Units | 8,141 | 100.0% |
Occupancy by Household Size in Geneva
| Household Size | # Housing Units | % Housing Units |
| 1-Person Household | 1,723 | 21.2% |
| 2-Person Household | 2,870 | 35.2% |
| 3-Person Household | 1,442 | 17.7% |
| 4+ Person Household | 2,106 | 25.9% |
| Total Housing Units | 8,141 | 100.0% |
Occupancy by Ownership by Household Size in Geneva
| Household Size | Owner-occupied | Renter-occupied |
| 1-Person Household | 1,330 (77.2%) | 393 (22.8%) |
| 2-Person Household | 2,329 (81.1%) | 541 (18.9%) |
| 3-Person Household | 1,285 (89.1%) | 157 (10.9%) |
| 4+ Person Household | 1,984 (94.2%) | 122 (5.8%) |
| Total Housing Units | 6,928 (85.1%) | 1,213 (14.9%) |
Occupancy by Educational Attainment in Geneva
| Household Size | Owner-occupied | Renter-occupied |
| Less than High School | 46 (37.1%) | 78 (62.9%) |
| High School Diploma | 750 (73.7%) | 268 (26.3%) |
| College/Associate Degree | 1,357 (80.2%) | 335 (19.8%) |
| Bachelor's Degree or higher | 4,775 (90.0%) | 532 (10.0%) |
Occupancy by Age of Householder in Geneva
| Age Bracket | # Households | % Households |
| Under 35 Years | 1,087 | 13.4% |
| 35 to 44 Years | 1,368 | 16.8% |
| 45 to 54 Years | 1,657 | 20.3% |
| 55 to 64 Years | 1,693 | 20.8% |
| 65 to 74 Years | 1,665 | 20.4% |
| 75 to 84 Years | 568 | 7.0% |
| 85 Years and Over | 103 | 1.3% |
| Total | 8,141 | 100.0% |
Housing Finances in Geneva
Median Income by Occupancy in Geneva
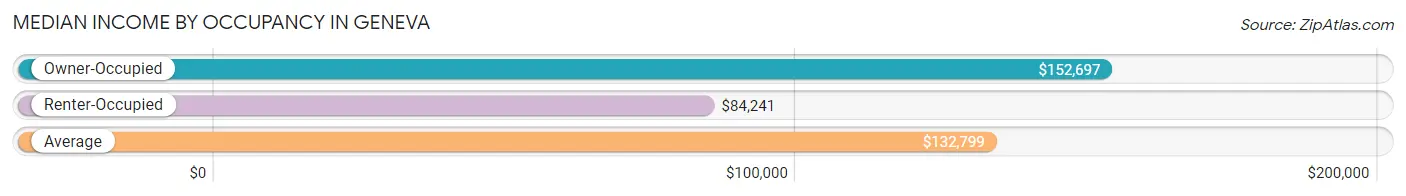
| Occupancy Type | # Households | Median Income |
| Owner-Occupied | 6,928 (85.1%) | $152,697 |
| Renter-Occupied | 1,213 (14.9%) | $84,241 |
| Average | 8,141 (100.0%) | $132,799 |
Occupancy by Householder Income Bracket in Geneva
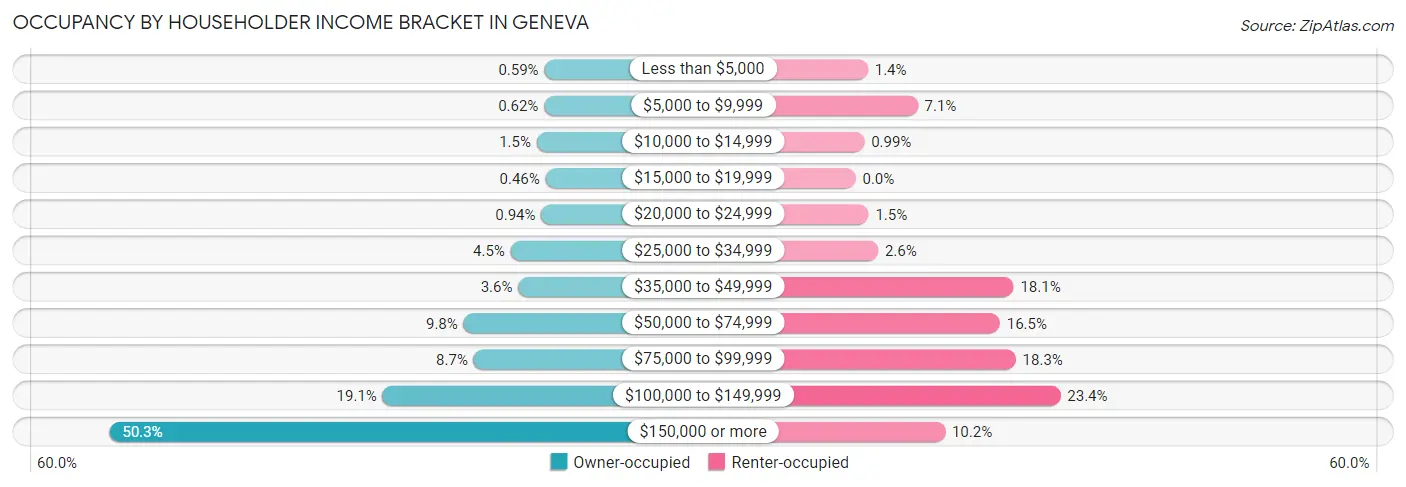
| Income Bracket | Owner-occupied | Renter-occupied |
| Less than $5,000 | 41 (0.6%) | 17 (1.4%) |
| $5,000 to $9,999 | 43 (0.6%) | 86 (7.1%) |
| $10,000 to $14,999 | 101 (1.5%) | 12 (1.0%) |
| $15,000 to $19,999 | 32 (0.5%) | 0 (0.0%) |
| $20,000 to $24,999 | 65 (0.9%) | 18 (1.5%) |
| $25,000 to $34,999 | 308 (4.4%) | 31 (2.6%) |
| $35,000 to $49,999 | 248 (3.6%) | 219 (18.0%) |
| $50,000 to $74,999 | 681 (9.8%) | 200 (16.5%) |
| $75,000 to $99,999 | 601 (8.7%) | 222 (18.3%) |
| $100,000 to $149,999 | 1,322 (19.1%) | 284 (23.4%) |
| $150,000 or more | 3,486 (50.3%) | 124 (10.2%) |
| Total | 6,928 (100.0%) | 1,213 (100.0%) |
Monthly Housing Cost Tiers in Geneva
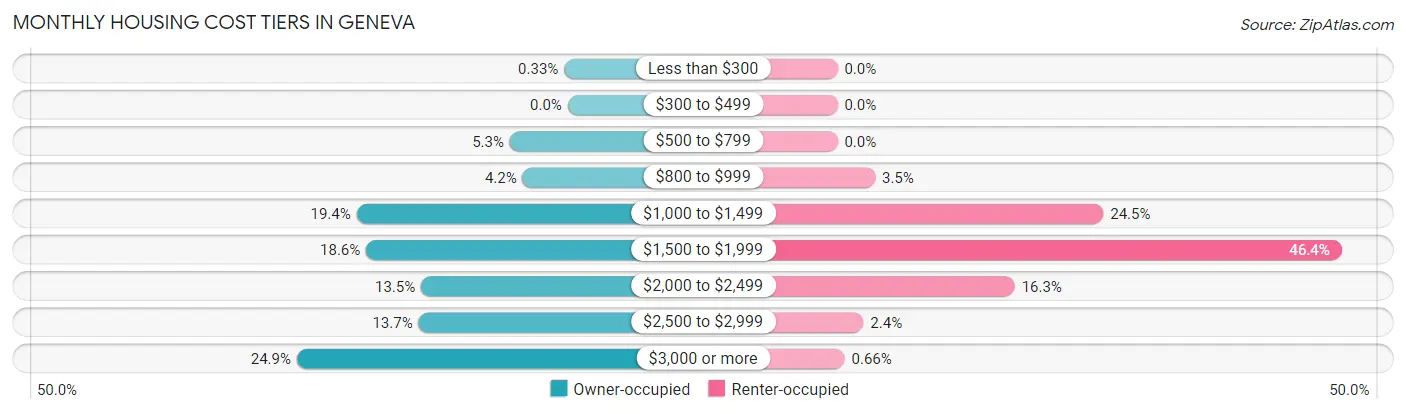
| Monthly Cost | Owner-occupied | Renter-occupied |
| Less than $300 | 23 (0.3%) | 0 (0.0%) |
| $300 to $499 | 0 (0.0%) | 0 (0.0%) |
| $500 to $799 | 369 (5.3%) | 0 (0.0%) |
| $800 to $999 | 288 (4.2%) | 42 (3.5%) |
| $1,000 to $1,499 | 1,347 (19.4%) | 297 (24.5%) |
| $1,500 to $1,999 | 1,286 (18.6%) | 563 (46.4%) |
| $2,000 to $2,499 | 935 (13.5%) | 198 (16.3%) |
| $2,500 to $2,999 | 952 (13.7%) | 29 (2.4%) |
| $3,000 or more | 1,728 (24.9%) | 8 (0.7%) |
| Total | 6,928 (100.0%) | 1,213 (100.0%) |
Physical Housing Characteristics in Geneva
Housing Structures in Geneva
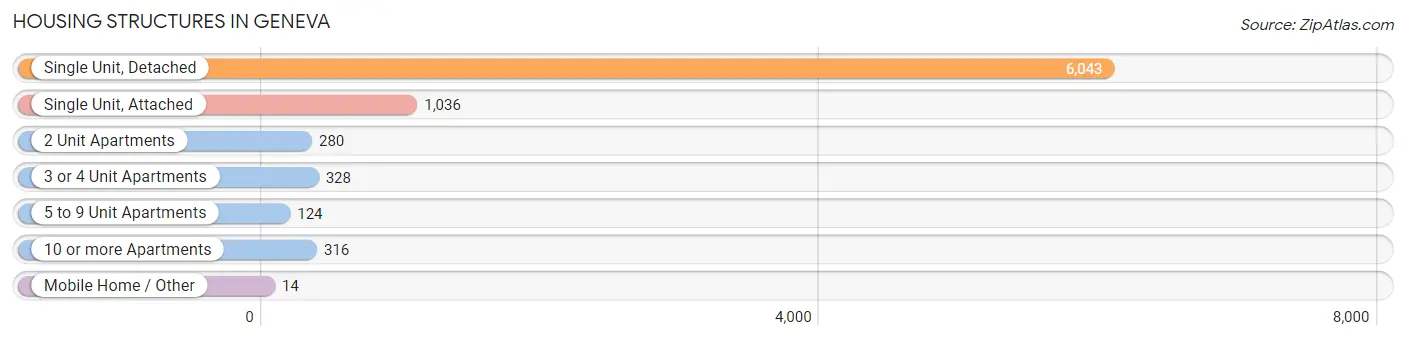
| Structure Type | # Housing Units | % Housing Units |
| Single Unit, Detached | 6,043 | 74.2% |
| Single Unit, Attached | 1,036 | 12.7% |
| 2 Unit Apartments | 280 | 3.4% |
| 3 or 4 Unit Apartments | 328 | 4.0% |
| 5 to 9 Unit Apartments | 124 | 1.5% |
| 10 or more Apartments | 316 | 3.9% |
| Mobile Home / Other | 14 | 0.2% |
| Total | 8,141 | 100.0% |
Housing Structures by Occupancy in Geneva
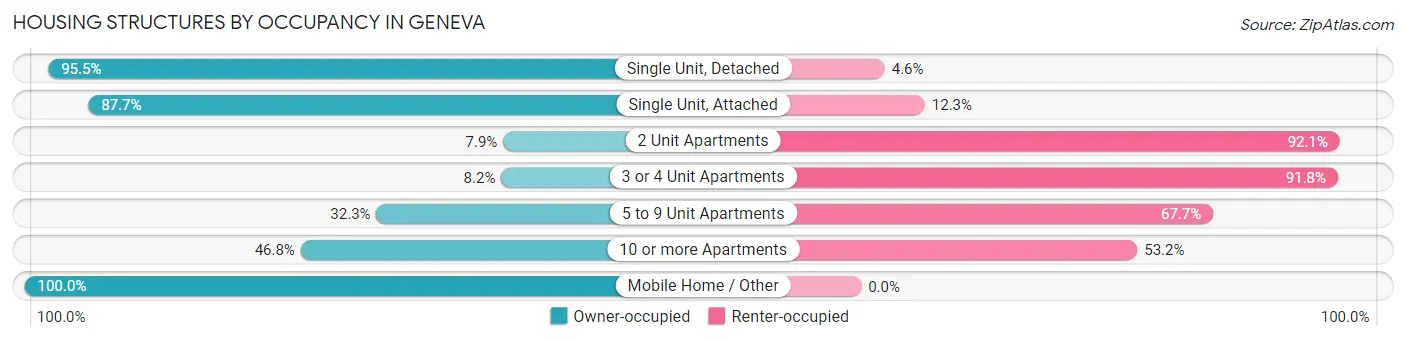
| Structure Type | Owner-occupied | Renter-occupied |
| Single Unit, Detached | 5,768 (95.5%) | 275 (4.5%) |
| Single Unit, Attached | 909 (87.7%) | 127 (12.3%) |
| 2 Unit Apartments | 22 (7.9%) | 258 (92.1%) |
| 3 or 4 Unit Apartments | 27 (8.2%) | 301 (91.8%) |
| 5 to 9 Unit Apartments | 40 (32.3%) | 84 (67.7%) |
| 10 or more Apartments | 148 (46.8%) | 168 (53.2%) |
| Mobile Home / Other | 14 (100.0%) | 0 (0.0%) |
| Total | 6,928 (85.1%) | 1,213 (14.9%) |
Housing Structures by Number of Rooms in Geneva
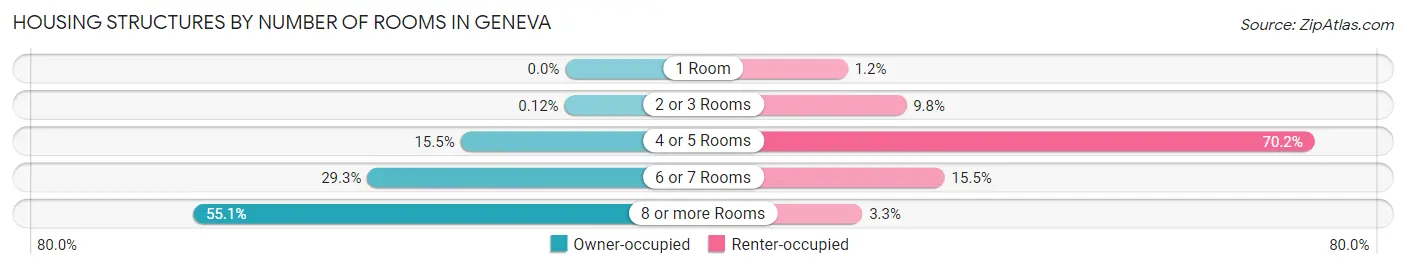
| Number of Rooms | Owner-occupied | Renter-occupied |
| 1 Room | 0 (0.0%) | 14 (1.1%) |
| 2 or 3 Rooms | 8 (0.1%) | 119 (9.8%) |
| 4 or 5 Rooms | 1,074 (15.5%) | 852 (70.2%) |
| 6 or 7 Rooms | 2,030 (29.3%) | 188 (15.5%) |
| 8 or more Rooms | 3,816 (55.1%) | 40 (3.3%) |
| Total | 6,928 (100.0%) | 1,213 (100.0%) |
Housing Structure by Heating Type in Geneva
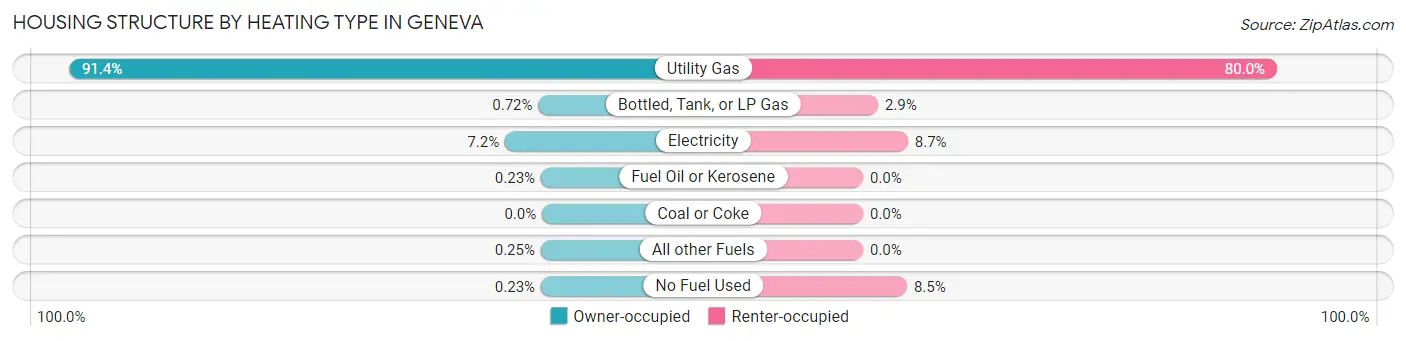
| Heating Type | Owner-occupied | Renter-occupied |
| Utility Gas | 6,333 (91.4%) | 970 (80.0%) |
| Bottled, Tank, or LP Gas | 50 (0.7%) | 35 (2.9%) |
| Electricity | 496 (7.2%) | 105 (8.7%) |
| Fuel Oil or Kerosene | 16 (0.2%) | 0 (0.0%) |
| Coal or Coke | 0 (0.0%) | 0 (0.0%) |
| All other Fuels | 17 (0.3%) | 0 (0.0%) |
| No Fuel Used | 16 (0.2%) | 103 (8.5%) |
| Total | 6,928 (100.0%) | 1,213 (100.0%) |
Household Vehicle Usage in Geneva
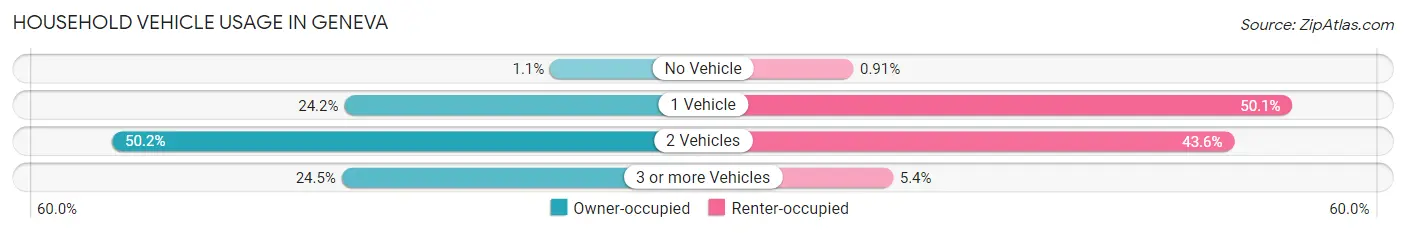
| Vehicles per Household | Owner-occupied | Renter-occupied |
| No Vehicle | 78 (1.1%) | 11 (0.9%) |
| 1 Vehicle | 1,676 (24.2%) | 608 (50.1%) |
| 2 Vehicles | 3,478 (50.2%) | 529 (43.6%) |
| 3 or more Vehicles | 1,696 (24.5%) | 65 (5.4%) |
| Total | 6,928 (100.0%) | 1,213 (100.0%) |
Real Estate & Mortgages in Geneva
Real Estate and Mortgage Overview in Geneva
| Characteristic | Without Mortgage | With Mortgage |
| Housing Units | 2,194 | 4,734 |
| Median Property Value | $382,400 | $398,000 |
| Median Household Income | $106,019 | $2,764 |
| Monthly Housing Costs | $1,167 | $1,690 |
| Real Estate Taxes | $9,183 | $17 |
Property Value by Mortgage Status in Geneva
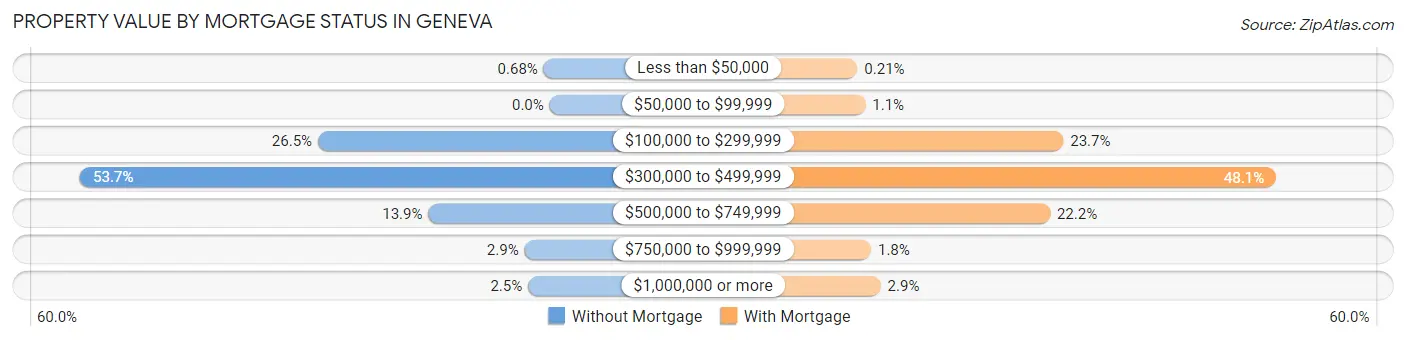
| Property Value | Without Mortgage | With Mortgage |
| Less than $50,000 | 15 (0.7%) | 10 (0.2%) |
| $50,000 to $99,999 | 0 (0.0%) | 53 (1.1%) |
| $100,000 to $299,999 | 581 (26.5%) | 1,124 (23.7%) |
| $300,000 to $499,999 | 1,177 (53.6%) | 2,275 (48.1%) |
| $500,000 to $749,999 | 304 (13.9%) | 1,052 (22.2%) |
| $750,000 to $999,999 | 63 (2.9%) | 84 (1.8%) |
| $1,000,000 or more | 54 (2.5%) | 136 (2.9%) |
| Total | 2,194 (100.0%) | 4,734 (100.0%) |
Household Income by Mortgage Status in Geneva
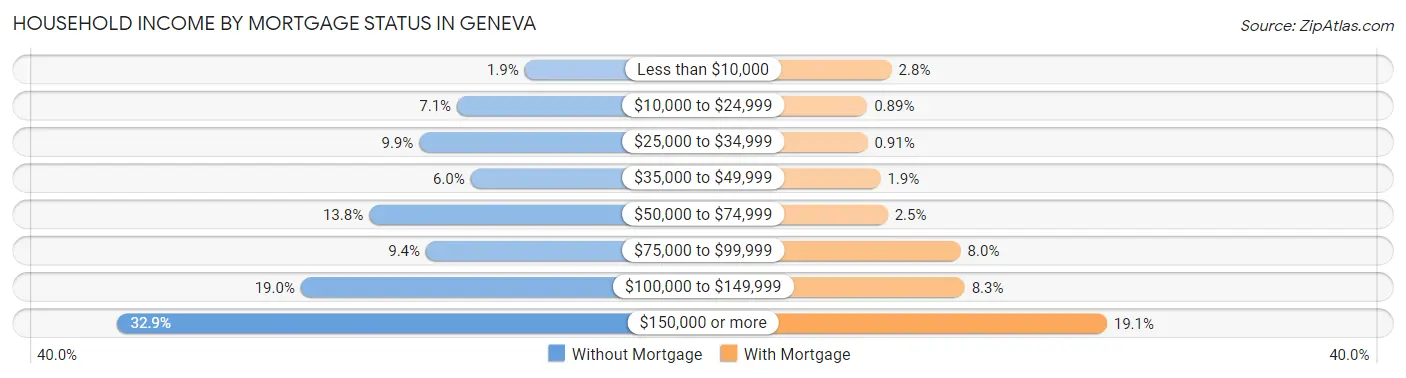
| Household Income | Without Mortgage | With Mortgage |
| Less than $10,000 | 42 (1.9%) | 130 (2.8%) |
| $10,000 to $24,999 | 155 (7.1%) | 42 (0.9%) |
| $25,000 to $34,999 | 218 (9.9%) | 43 (0.9%) |
| $35,000 to $49,999 | 132 (6.0%) | 90 (1.9%) |
| $50,000 to $74,999 | 302 (13.8%) | 116 (2.5%) |
| $75,000 to $99,999 | 207 (9.4%) | 379 (8.0%) |
| $100,000 to $149,999 | 416 (19.0%) | 394 (8.3%) |
| $150,000 or more | 722 (32.9%) | 906 (19.1%) |
| Total | 2,194 (100.0%) | 4,734 (100.0%) |
Property Value to Household Income Ratio in Geneva
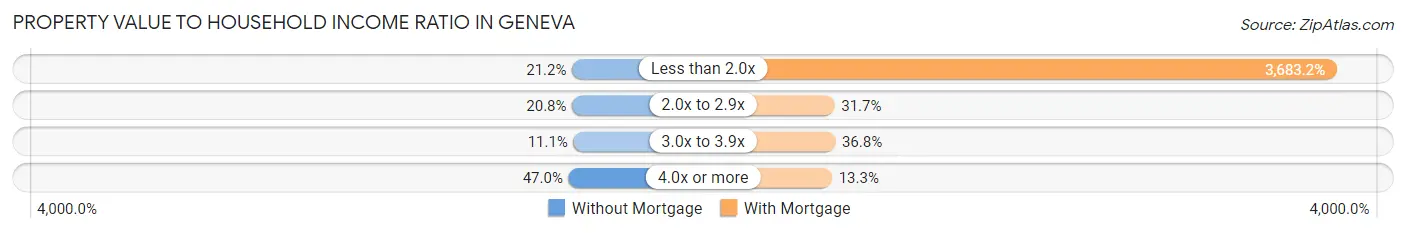
| Value-to-Income Ratio | Without Mortgage | With Mortgage |
| Less than 2.0x | 464 (21.1%) | 174,362 (3,683.2%) |
| 2.0x to 2.9x | 456 (20.8%) | 1,499 (31.7%) |
| 3.0x to 3.9x | 243 (11.1%) | 1,742 (36.8%) |
| 4.0x or more | 1,031 (47.0%) | 631 (13.3%) |
| Total | 2,194 (100.0%) | 4,734 (100.0%) |
Real Estate Taxes by Mortgage Status in Geneva
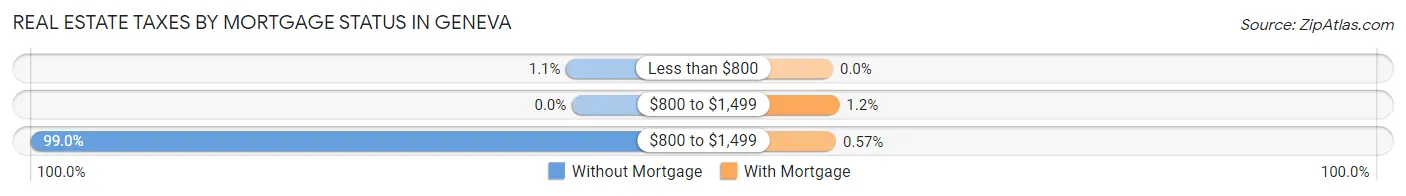
| Property Taxes | Without Mortgage | With Mortgage |
| Less than $800 | 23 (1.1%) | 0 (0.0%) |
| $800 to $1,499 | 0 (0.0%) | 55 (1.2%) |
| $800 to $1,499 | 2,171 (99.0%) | 27 (0.6%) |
| Total | 2,194 (100.0%) | 4,734 (100.0%) |
Health & Disability in Geneva
Health Insurance Coverage by Age in Geneva
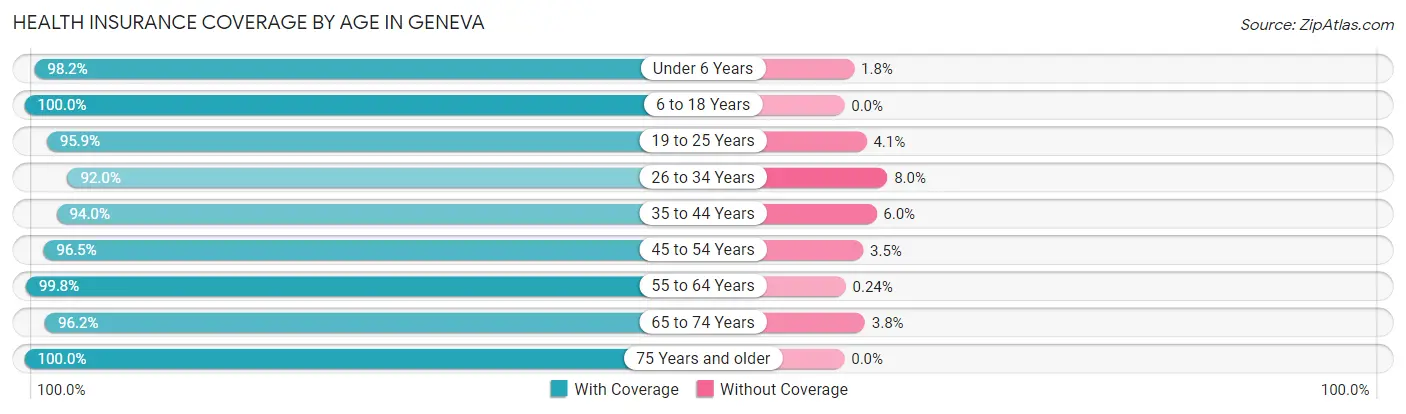
| Age Bracket | With Coverage | Without Coverage |
| Under 6 Years | 1,231 (98.2%) | 23 (1.8%) |
| 6 to 18 Years | 4,114 (100.0%) | 0 (0.0%) |
| 19 to 25 Years | 1,412 (95.9%) | 61 (4.1%) |
| 26 to 34 Years | 1,783 (92.0%) | 155 (8.0%) |
| 35 to 44 Years | 2,703 (94.0%) | 172 (6.0%) |
| 45 to 54 Years | 2,692 (96.5%) | 98 (3.5%) |
| 55 to 64 Years | 3,296 (99.8%) | 8 (0.2%) |
| 65 to 74 Years | 2,358 (96.2%) | 94 (3.8%) |
| 75 Years and older | 1,113 (100.0%) | 0 (0.0%) |
| Total | 20,702 (97.1%) | 611 (2.9%) |
Health Insurance Coverage by Citizenship Status in Geneva
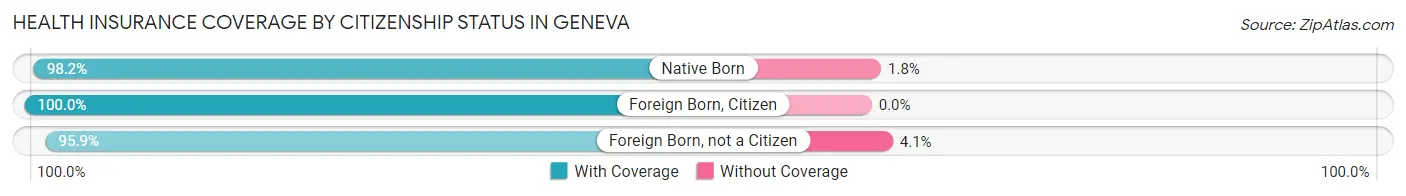
| Citizenship Status | With Coverage | Without Coverage |
| Native Born | 1,231 (98.2%) | 23 (1.8%) |
| Foreign Born, Citizen | 4,114 (100.0%) | 0 (0.0%) |
| Foreign Born, not a Citizen | 1,412 (95.9%) | 61 (4.1%) |
Health Insurance Coverage by Household Income in Geneva
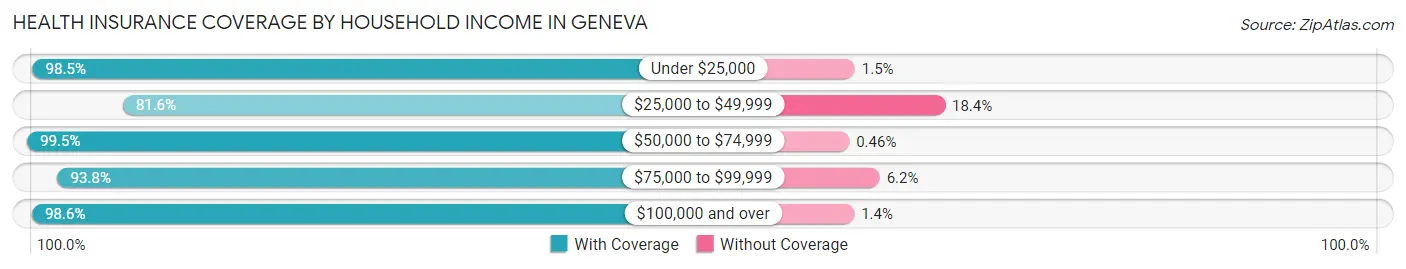
| Household Income | With Coverage | Without Coverage |
| Under $25,000 | 523 (98.5%) | 8 (1.5%) |
| $25,000 to $49,999 | 1,214 (81.6%) | 274 (18.4%) |
| $50,000 to $74,999 | 1,750 (99.5%) | 8 (0.5%) |
| $75,000 to $99,999 | 1,505 (93.8%) | 99 (6.2%) |
| $100,000 and over | 15,700 (98.6%) | 222 (1.4%) |
Public vs Private Health Insurance Coverage by Age in Geneva
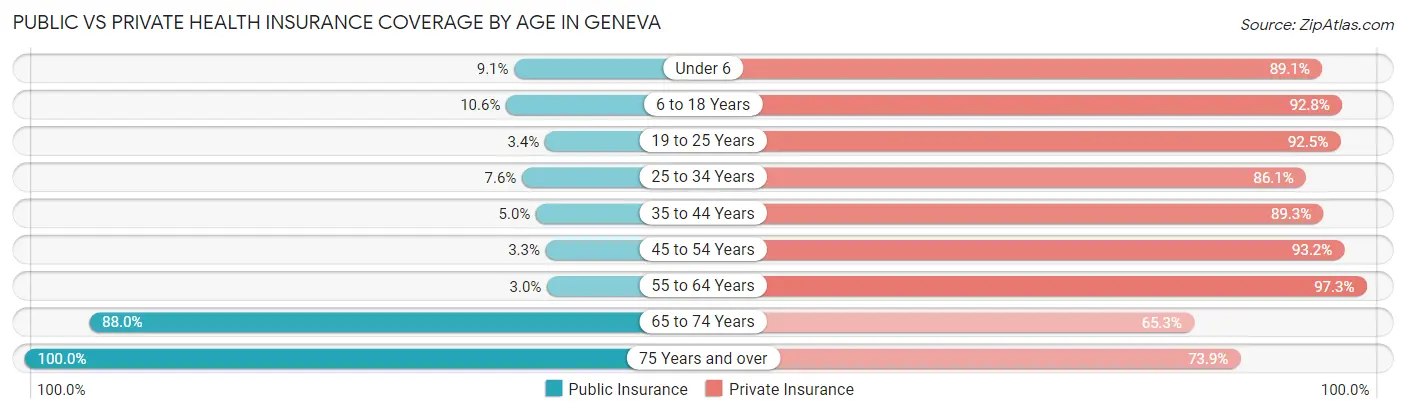
| Age Bracket | Public Insurance | Private Insurance |
| Under 6 | 114 (9.1%) | 1,117 (89.1%) |
| 6 to 18 Years | 436 (10.6%) | 3,817 (92.8%) |
| 19 to 25 Years | 50 (3.4%) | 1,362 (92.5%) |
| 25 to 34 Years | 148 (7.6%) | 1,668 (86.1%) |
| 35 to 44 Years | 145 (5.0%) | 2,568 (89.3%) |
| 45 to 54 Years | 91 (3.3%) | 2,601 (93.2%) |
| 55 to 64 Years | 99 (3.0%) | 3,216 (97.3%) |
| 65 to 74 Years | 2,158 (88.0%) | 1,602 (65.3%) |
| 75 Years and over | 1,113 (100.0%) | 823 (73.9%) |
| Total | 4,354 (20.4%) | 18,774 (88.1%) |
Disability Status by Sex by Age in Geneva
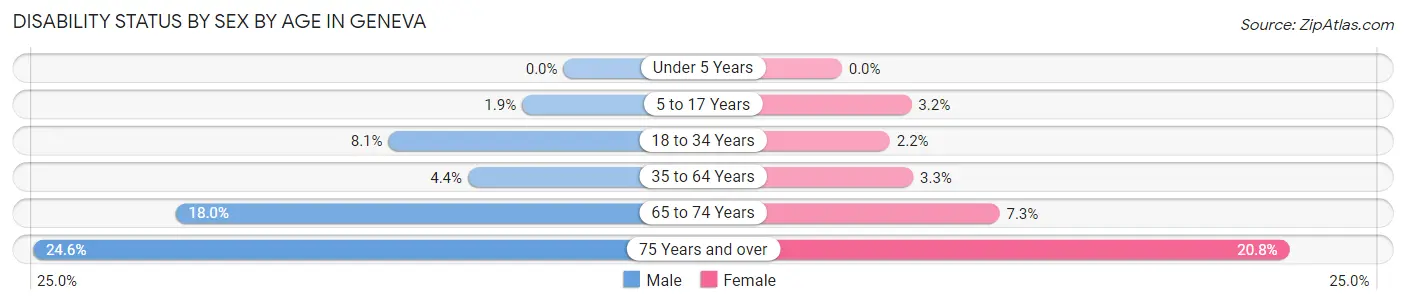
| Age Bracket | Male | Female |
| Under 5 Years | 0 (0.0%) | 0 (0.0%) |
| 5 to 17 Years | 37 (1.9%) | 77 (3.2%) |
| 18 to 34 Years | 137 (8.1%) | 44 (2.2%) |
| 35 to 64 Years | 194 (4.4%) | 152 (3.3%) |
| 65 to 74 Years | 210 (18.0%) | 94 (7.3%) |
| 75 Years and over | 95 (24.6%) | 151 (20.8%) |
Disability Class by Sex by Age in Geneva
Disability Class: Hearing Difficulty
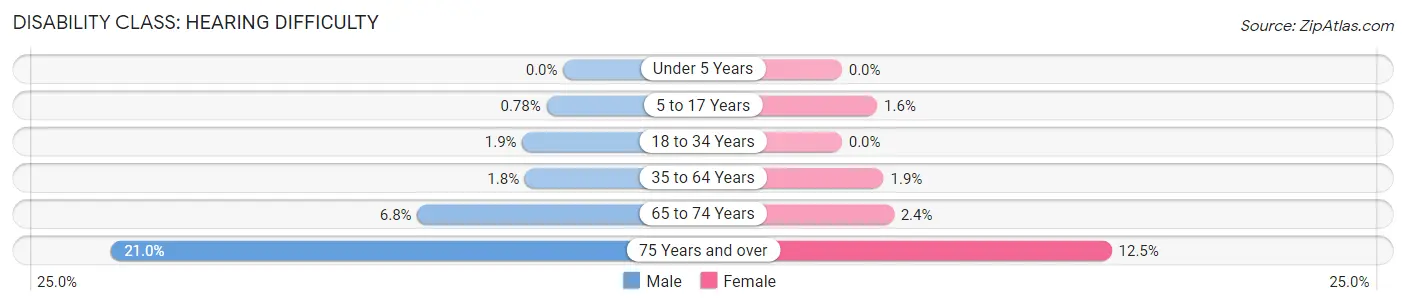
| Age Bracket | Male | Female |
| Under 5 Years | 0 (0.0%) | 0 (0.0%) |
| 5 to 17 Years | 15 (0.8%) | 39 (1.6%) |
| 18 to 34 Years | 32 (1.9%) | 0 (0.0%) |
| 35 to 64 Years | 78 (1.8%) | 89 (1.9%) |
| 65 to 74 Years | 79 (6.8%) | 31 (2.4%) |
| 75 Years and over | 81 (21.0%) | 91 (12.5%) |
Disability Class: Vision Difficulty
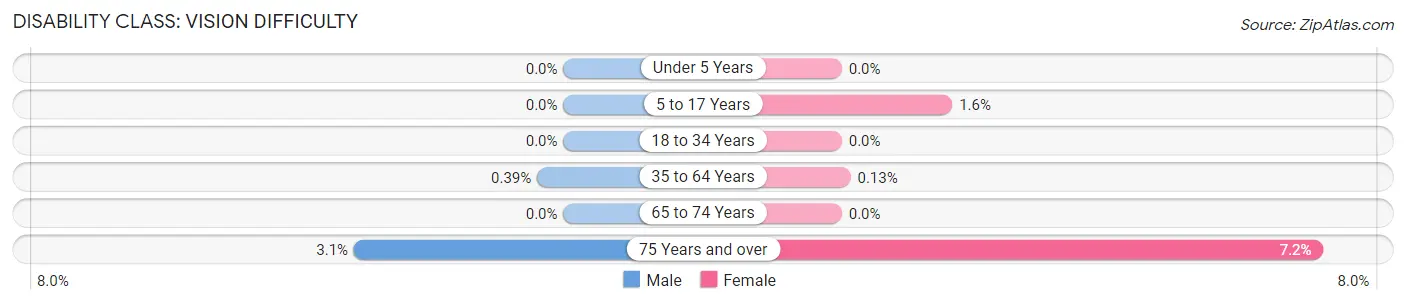
| Age Bracket | Male | Female |
| Under 5 Years | 0 (0.0%) | 0 (0.0%) |
| 5 to 17 Years | 0 (0.0%) | 39 (1.6%) |
| 18 to 34 Years | 0 (0.0%) | 0 (0.0%) |
| 35 to 64 Years | 17 (0.4%) | 6 (0.1%) |
| 65 to 74 Years | 0 (0.0%) | 0 (0.0%) |
| 75 Years and over | 12 (3.1%) | 52 (7.1%) |
Disability Class: Cognitive Difficulty
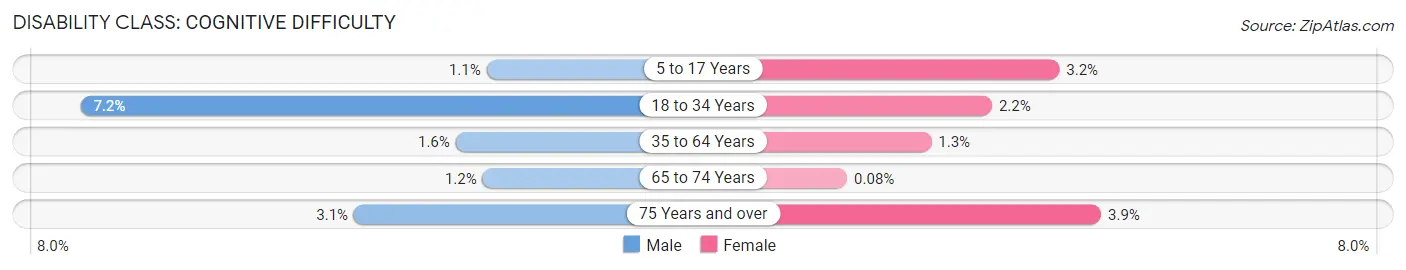
| Age Bracket | Male | Female |
| 5 to 17 Years | 22 (1.1%) | 77 (3.2%) |
| 18 to 34 Years | 121 (7.2%) | 44 (2.2%) |
| 35 to 64 Years | 70 (1.6%) | 61 (1.3%) |
| 65 to 74 Years | 14 (1.2%) | 1 (0.1%) |
| 75 Years and over | 12 (3.1%) | 28 (3.8%) |
Disability Class: Ambulatory Difficulty
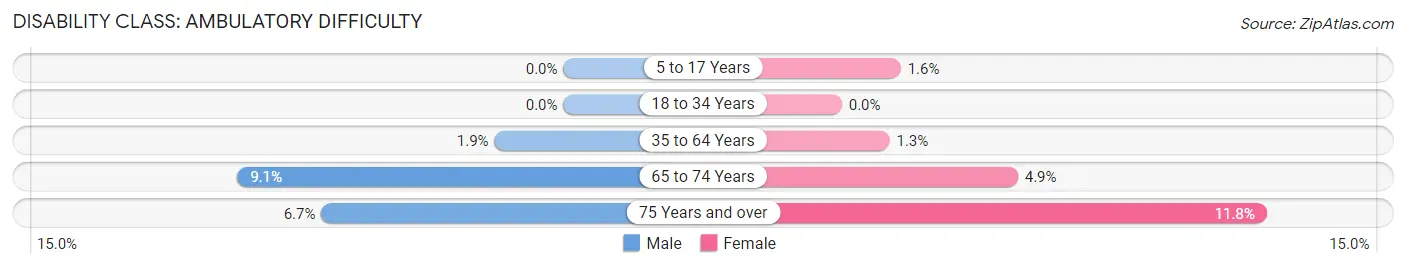
| Age Bracket | Male | Female |
| 5 to 17 Years | 0 (0.0%) | 39 (1.6%) |
| 18 to 34 Years | 0 (0.0%) | 0 (0.0%) |
| 35 to 64 Years | 84 (1.9%) | 61 (1.3%) |
| 65 to 74 Years | 106 (9.1%) | 63 (4.9%) |
| 75 Years and over | 26 (6.7%) | 86 (11.8%) |
Disability Class: Self-Care Difficulty
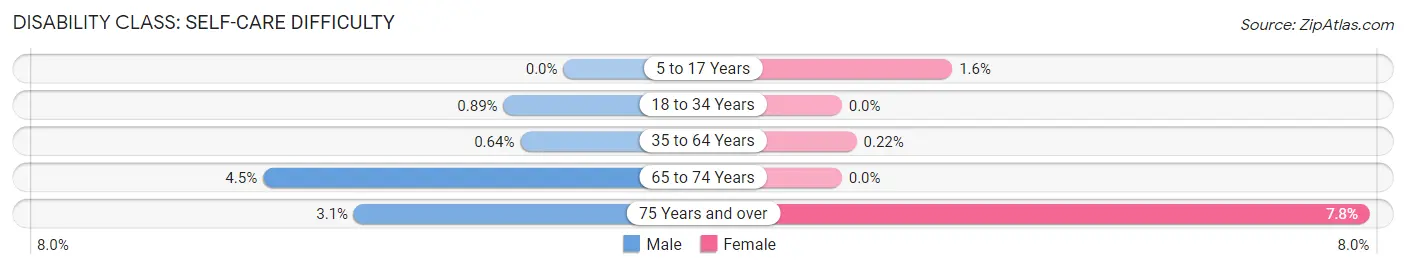
| Age Bracket | Male | Female |
| 5 to 17 Years | 0 (0.0%) | 39 (1.6%) |
| 18 to 34 Years | 15 (0.9%) | 0 (0.0%) |
| 35 to 64 Years | 28 (0.6%) | 10 (0.2%) |
| 65 to 74 Years | 52 (4.5%) | 0 (0.0%) |
| 75 Years and over | 12 (3.1%) | 57 (7.8%) |
Technology Access in Geneva
Computing Device Access in Geneva
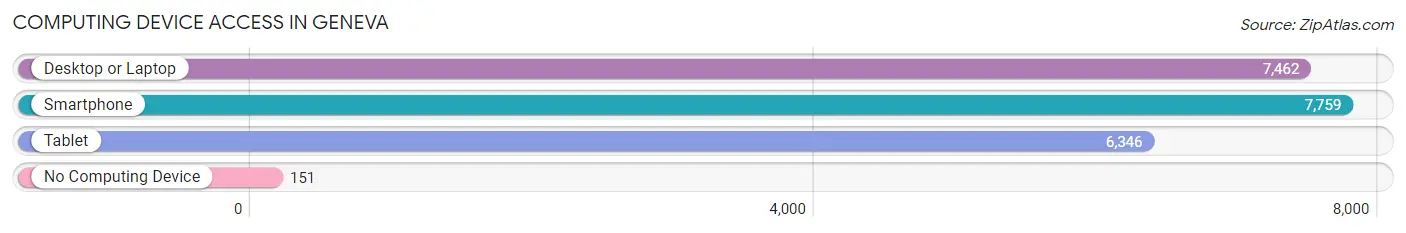
| Device Type | # Households | % Households |
| Desktop or Laptop | 7,462 | 91.7% |
| Smartphone | 7,759 | 95.3% |
| Tablet | 6,346 | 77.9% |
| No Computing Device | 151 | 1.8% |
| Total | 8,141 | 100.0% |
Internet Access in Geneva
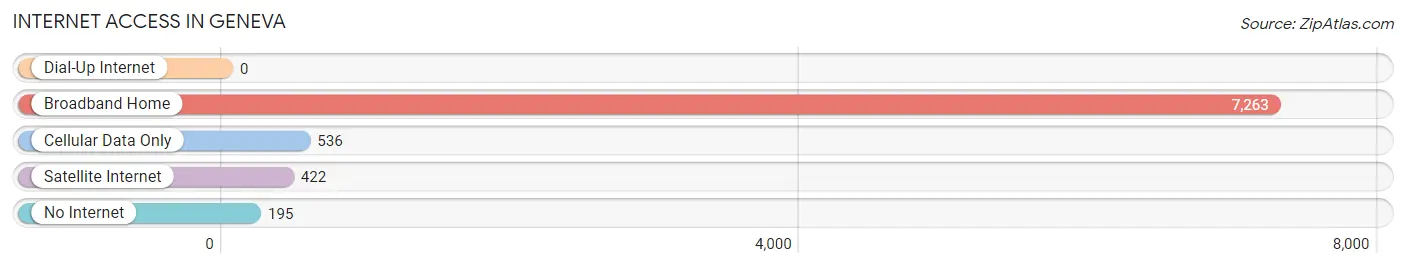
| Internet Type | # Households | % Households |
| Dial-Up Internet | 0 | 0.0% |
| Broadband Home | 7,263 | 89.2% |
| Cellular Data Only | 536 | 6.6% |
| Satellite Internet | 422 | 5.2% |
| No Internet | 195 | 2.4% |
| Total | 8,141 | 100.0% |
Geneva Summary
Geneva, Illinois is a city located in Kane County, Illinois, United States. It is located on the Fox River, about 40 miles west of Chicago. As of the 2010 census, the city had a population of 21,495.
History
Geneva was first settled in the 1830s by settlers from New England. The town was originally called Geneva Station, after the nearby Geneva Station of the Galena and Chicago Union Railroad. The town was officially incorporated in 1858.
In the late 19th century, Geneva was a popular summer resort for wealthy Chicagoans. The town was known for its many Victorian-style homes and its picturesque setting on the Fox River.
Geography
Geneva is located at 41°51'17" North, 88°18'11" West (41.854722, -88.303056). According to the United States Census Bureau, the city has a total area of 8.2 square miles, of which 8.1 square miles is land and 0.1 square miles is water.
Economy
Geneva is home to several large employers, including Fermilab, a national laboratory for particle physics research, and Delnor Hospital, a regional medical center. The city is also home to several small businesses, including restaurants, retail stores, and professional services.
Demographics
As of the 2010 census, there were 21,495 people, 8,717 households, and 5,717 families residing in the city. The population density was 2,637.3 people per square mile. The racial makeup of the city was 87.2% White, 4.3% African American, 0.3% Native American, 4.2% Asian, 0.1% Pacific Islander, 2.2% from other races, and 1.7% from two or more races. Hispanic or Latino of any race were 8.2% of the population.
The median income for a household in the city was $76,843, and the median income for a family was $93,919. The per capita income for the city was $37,945. About 3.2% of families and 4.7% of the population were below the poverty line, including 5.2% of those under age 18 and 4.2% of those age 65 or over.
Common Questions
What is Per Capita Income in Geneva?
Per Capita income in Geneva is $67,737.
What is the Median Family Income in Geneva?
Median Family Income in Geneva is $161,033.
What is the Median Household income in Geneva?
Median Household Income in Geneva is $132,799.
What is Income or Wage Gap in Geneva?
Income or Wage Gap in Geneva is 45.5%.
Women in Geneva earn 54.5 cents for every dollar earned by a man.
What is Inequality or Gini Index in Geneva?
Inequality or Gini Index in Geneva is 0.45.
What is the Total Population of Geneva?
Total Population of Geneva is 21,390.
What is the Total Male Population of Geneva?
Total Male Population of Geneva is 10,024.
What is the Total Female Population of Geneva?
Total Female Population of Geneva is 11,366.
What is the Ratio of Males per 100 Females in Geneva?
There are 88.19 Males per 100 Females in Geneva.
What is the Ratio of Females per 100 Males in Geneva?
There are 113.39 Females per 100 Males in Geneva.
What is the Median Population Age in Geneva?
Median Population Age in Geneva is 41.7 Years.
What is the Average Family Size in Geneva
Average Family Size in Geneva is 3.1 People.
What is the Average Household Size in Geneva
Average Household Size in Geneva is 2.6 People.
How Large is the Labor Force in Geneva?
There are 11,915 People in the Labor Forcein in Geneva.
What is the Percentage of People in the Labor Force in Geneva?
70.3% of People are in the Labor Force in Geneva.
What is the Unemployment Rate in Geneva?
Unemployment Rate in Geneva is 2.0%.