Evanston, IL Map & Demographics
Evanston Map
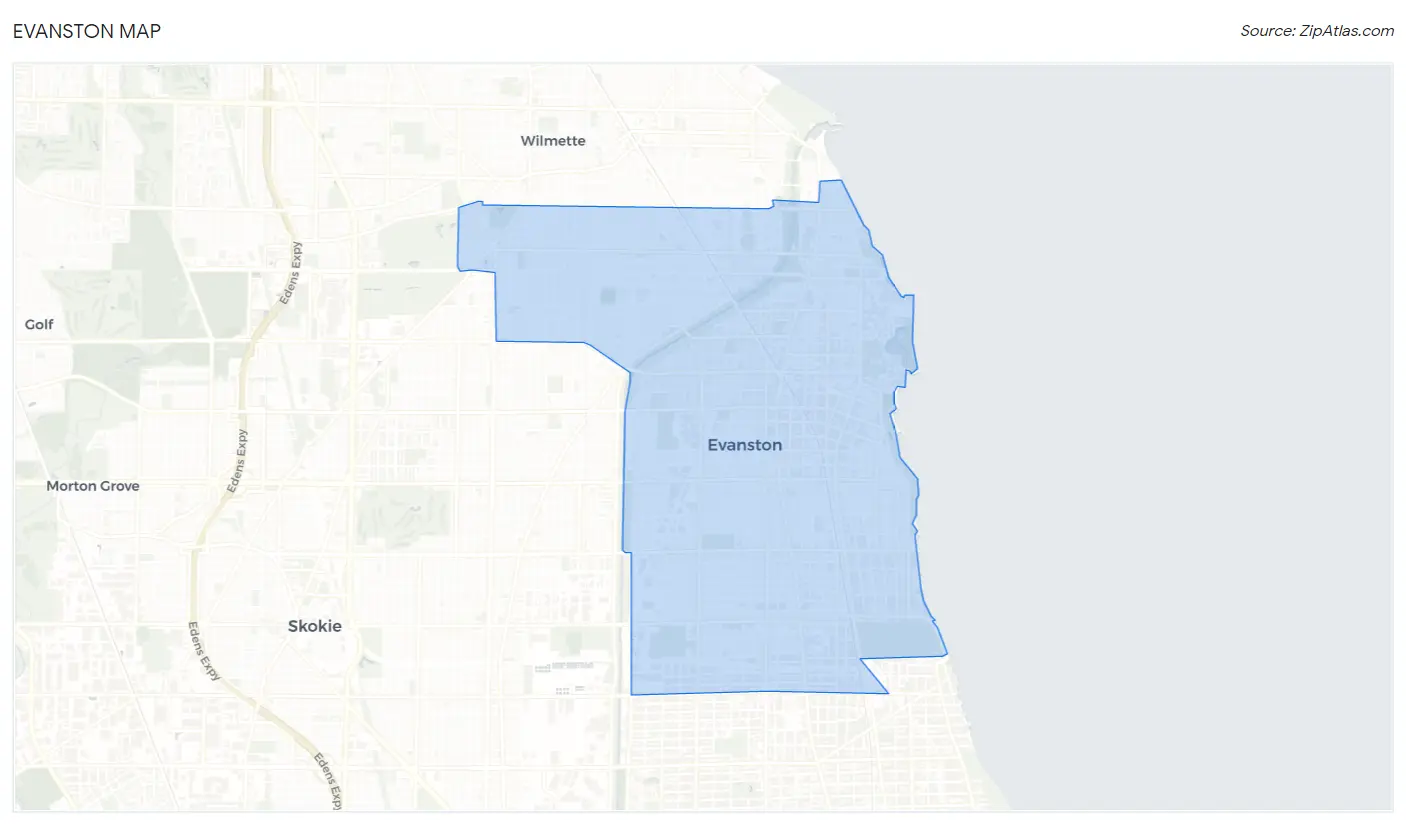
Evanston Overview
$63,888
PER CAPITA INCOME
$146,789
AVG FAMILY INCOME
$93,188
AVG HOUSEHOLD INCOME
24.0%
WAGE / INCOME GAP [ % ]
76.0¢/ $1
WAGE / INCOME GAP [ $ ]
0.55
INEQUALITY / GINI INDEX
77,181
TOTAL POPULATION
37,413
MALE POPULATION
39,768
FEMALE POPULATION
94.08
MALES / 100 FEMALES
106.29
FEMALES / 100 MALES
37.6
MEDIAN AGE
3.1
AVG FAMILY SIZE
2.3
AVG HOUSEHOLD SIZE
41,524
LABOR FORCE [ PEOPLE ]
64.5%
PERCENT IN LABOR FORCE
6.1%
UNEMPLOYMENT RATE
Income in Evanston
Income Overview in Evanston
Per Capita Income in Evanston is $63,888, while median incomes of families and households are $146,789 and $93,188 respectively.
| Characteristic | Number | Measure |
| Per Capita Income | 77,181 | $63,888 |
| Median Family Income | 16,321 | $146,789 |
| Mean Family Income | 16,321 | $216,623 |
| Median Household Income | 30,900 | $93,188 |
| Mean Household Income | 30,900 | $157,169 |
| Income Deficit | 16,321 | $0 |
| Wage / Income Gap (%) | 77,181 | 24.02% |
| Wage / Income Gap ($) | 77,181 | 75.98¢ per $1 |
| Gini / Inequality Index | 77,181 | 0.55 |
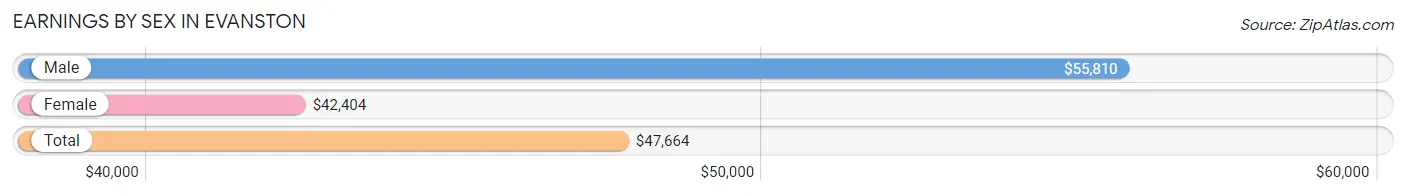
Earnings by Sex in Evanston
Average Earnings in Evanston are $47,664, $55,810 for men and $42,404 for women, a difference of 24.0%.
| Sex | Number | Average Earnings |
| Male | 22,477 (50.4%) | $55,810 |
| Female | 22,115 (49.6%) | $42,404 |
| Total | 44,592 (100.0%) | $47,664 |
Earnings by Sex by Income Bracket in Evanston
The most common earnings brackets in Evanston are $100,000+ for men (6,883 | 30.6%) and $100,000+ for women (4,492 | 20.3%).
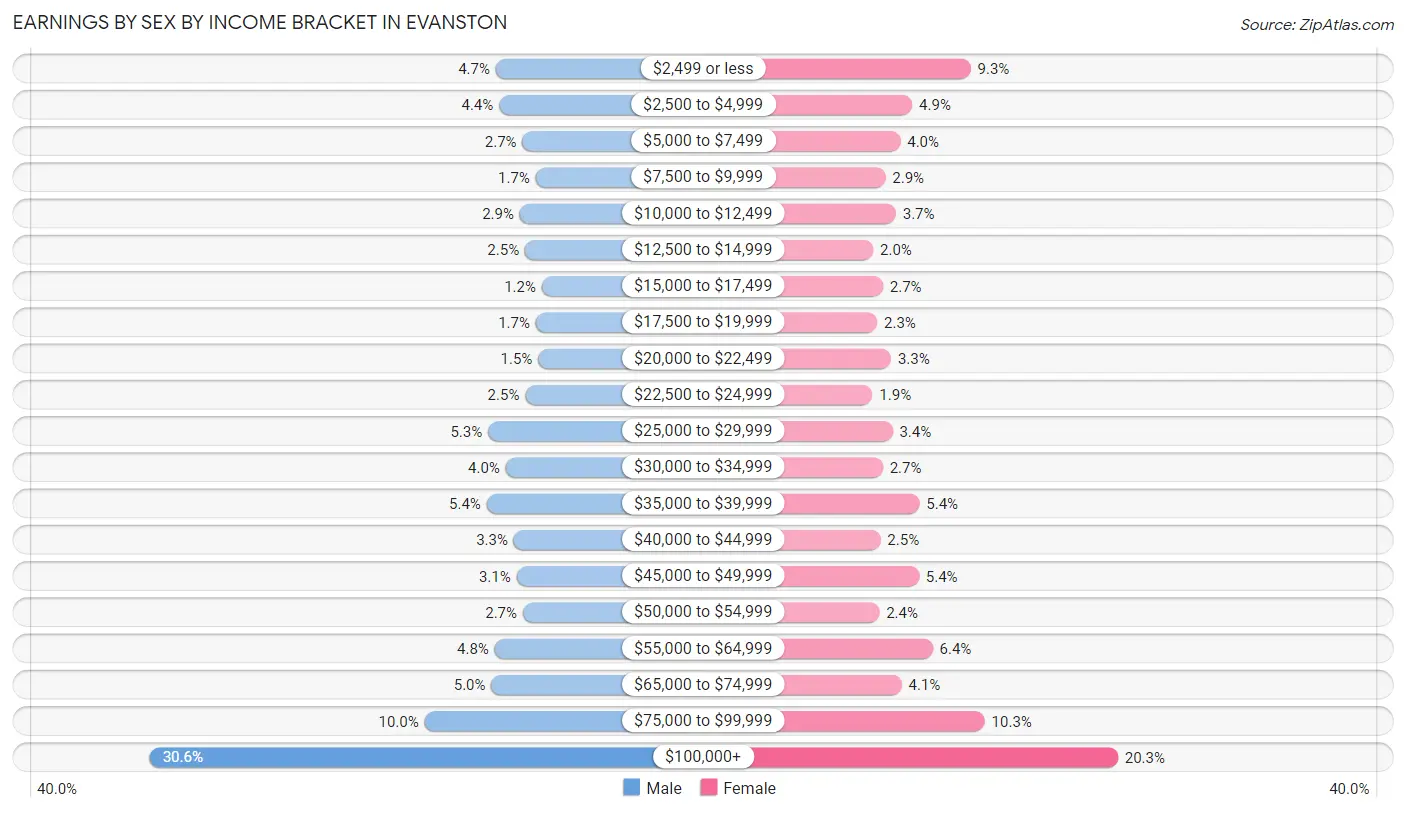
| Income | Male | Female |
| $2,499 or less | 1,054 (4.7%) | 2,053 (9.3%) |
| $2,500 to $4,999 | 999 (4.4%) | 1,083 (4.9%) |
| $5,000 to $7,499 | 604 (2.7%) | 886 (4.0%) |
| $7,500 to $9,999 | 381 (1.7%) | 639 (2.9%) |
| $10,000 to $12,499 | 649 (2.9%) | 812 (3.7%) |
| $12,500 to $14,999 | 563 (2.5%) | 436 (2.0%) |
| $15,000 to $17,499 | 278 (1.2%) | 596 (2.7%) |
| $17,500 to $19,999 | 380 (1.7%) | 501 (2.3%) |
| $20,000 to $22,499 | 339 (1.5%) | 733 (3.3%) |
| $22,500 to $24,999 | 558 (2.5%) | 425 (1.9%) |
| $25,000 to $29,999 | 1,184 (5.3%) | 756 (3.4%) |
| $30,000 to $34,999 | 888 (4.0%) | 595 (2.7%) |
| $35,000 to $39,999 | 1,207 (5.4%) | 1,204 (5.4%) |
| $40,000 to $44,999 | 751 (3.3%) | 557 (2.5%) |
| $45,000 to $49,999 | 704 (3.1%) | 1,194 (5.4%) |
| $50,000 to $54,999 | 599 (2.7%) | 538 (2.4%) |
| $55,000 to $64,999 | 1,072 (4.8%) | 1,423 (6.4%) |
| $65,000 to $74,999 | 1,129 (5.0%) | 908 (4.1%) |
| $75,000 to $99,999 | 2,255 (10.0%) | 2,284 (10.3%) |
| $100,000+ | 6,883 (30.6%) | 4,492 (20.3%) |
| Total | 22,477 (100.0%) | 22,115 (100.0%) |
Earnings by Sex by Educational Attainment in Evanston
Average earnings in Evanston are $72,904 for men and $55,713 for women, a difference of 23.6%. Men with an educational attainment of graduate degree enjoy the highest average annual earnings of $101,423, while those with less than high school education earn the least with $38,750. Women with an educational attainment of graduate degree earn the most with the average annual earnings of $76,286, while those with less than high school education have the smallest earnings of $21,573.
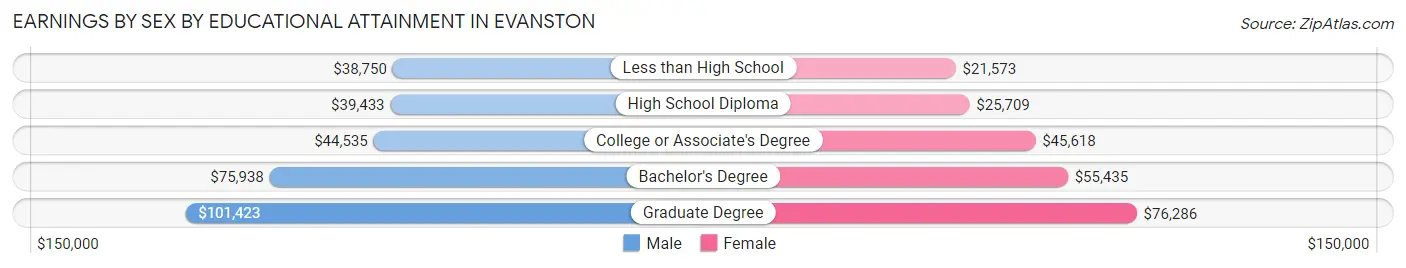
| Educational Attainment | Male Income | Female Income |
| Less than High School | $38,750 | $21,573 |
| High School Diploma | $39,433 | $25,709 |
| College or Associate's Degree | $44,535 | $45,618 |
| Bachelor's Degree | $75,938 | $55,435 |
| Graduate Degree | $101,423 | $76,286 |
| Total | $72,904 | $55,713 |
Family Income in Evanston
Family Income Brackets in Evanston
According to the Evanston family income data, there are 5,729 families falling into the $200,000+ income range, which is the most common income bracket and makes up 35.1% of all families. Conversely, the $10,000 to $14,999 income bracket is the least frequent group with only 114 families (0.7%) belonging to this category.
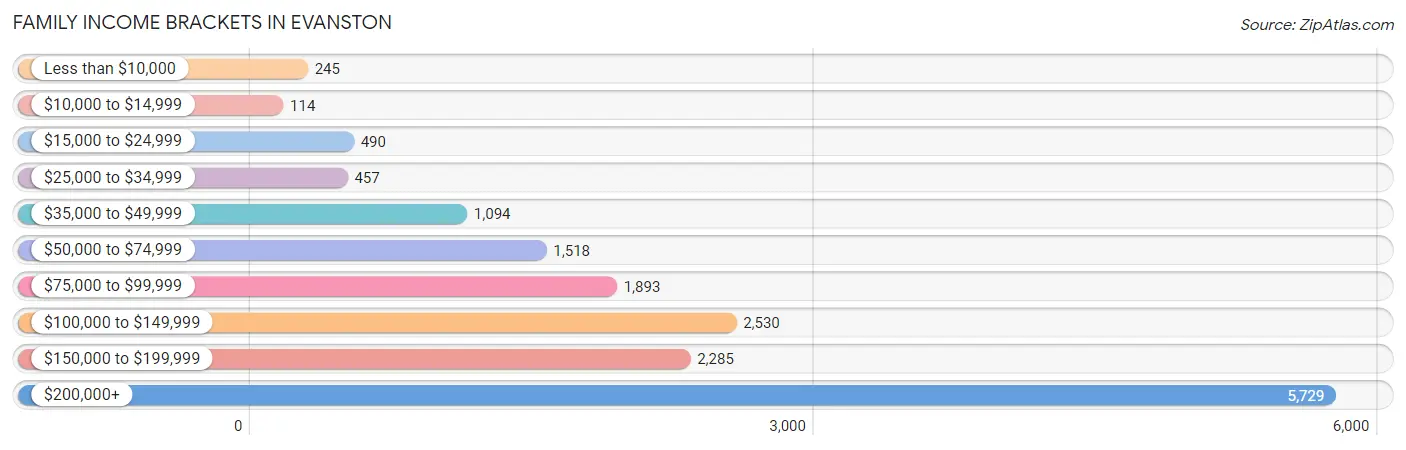
| Income Bracket | # Families | % Families |
| Less than $10,000 | 245 | 1.5% |
| $10,000 to $14,999 | 114 | 0.7% |
| $15,000 to $24,999 | 490 | 3.0% |
| $25,000 to $34,999 | 457 | 2.8% |
| $35,000 to $49,999 | 1,094 | 6.7% |
| $50,000 to $74,999 | 1,518 | 9.3% |
| $75,000 to $99,999 | 1,893 | 11.6% |
| $100,000 to $149,999 | 2,530 | 15.5% |
| $150,000 to $199,999 | 2,285 | 14.0% |
| $200,000+ | 5,729 | 35.1% |
Family Income by Famaliy Size in Evanston
4-person families (3,238 | 19.8%) account for the highest median family income in Evanston with $184,185 per family, while 2-person families (7,668 | 47.0%) have the highest median income of $65,422 per family member.
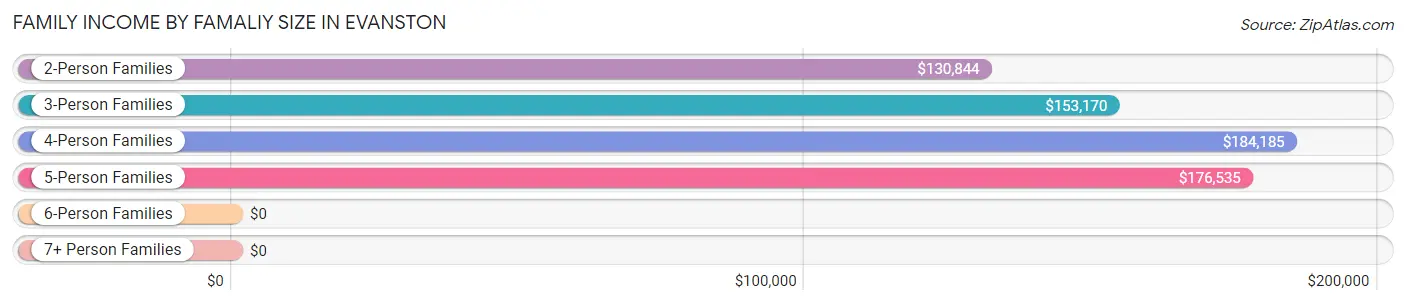
| Income Bracket | # Families | Median Income |
| 2-Person Families | 7,668 (47.0%) | $130,844 |
| 3-Person Families | 3,867 (23.7%) | $153,170 |
| 4-Person Families | 3,238 (19.8%) | $184,185 |
| 5-Person Families | 1,146 (7.0%) | $176,535 |
| 6-Person Families | 310 (1.9%) | $0 |
| 7+ Person Families | 92 (0.6%) | $0 |
| Total | 16,321 (100.0%) | $146,789 |
Family Income by Number of Earners in Evanston
The median family income in Evanston is $146,789, with families comprising 3+ earners (1,921) having the highest median family income of $183,021, while families with no earners (1,319) have the lowest median family income of $93,323, accounting for 11.8% and 8.1% of families, respectively.
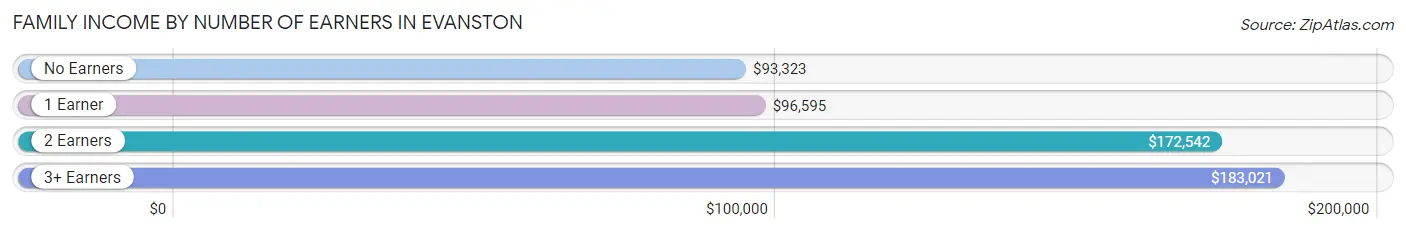
| Number of Earners | # Families | Median Income |
| No Earners | 1,319 (8.1%) | $93,323 |
| 1 Earner | 4,872 (29.8%) | $96,595 |
| 2 Earners | 8,209 (50.3%) | $172,542 |
| 3+ Earners | 1,921 (11.8%) | $183,021 |
| Total | 16,321 (100.0%) | $146,789 |
Household Income in Evanston
Household Income Brackets in Evanston
With 6,983 households falling in the category, the $200,000+ income range is the most frequent in Evanston, accounting for 22.6% of all households. In contrast, only 958 households (3.1%) fall into the $10,000 to $14,999 income bracket, making it the least populous group.
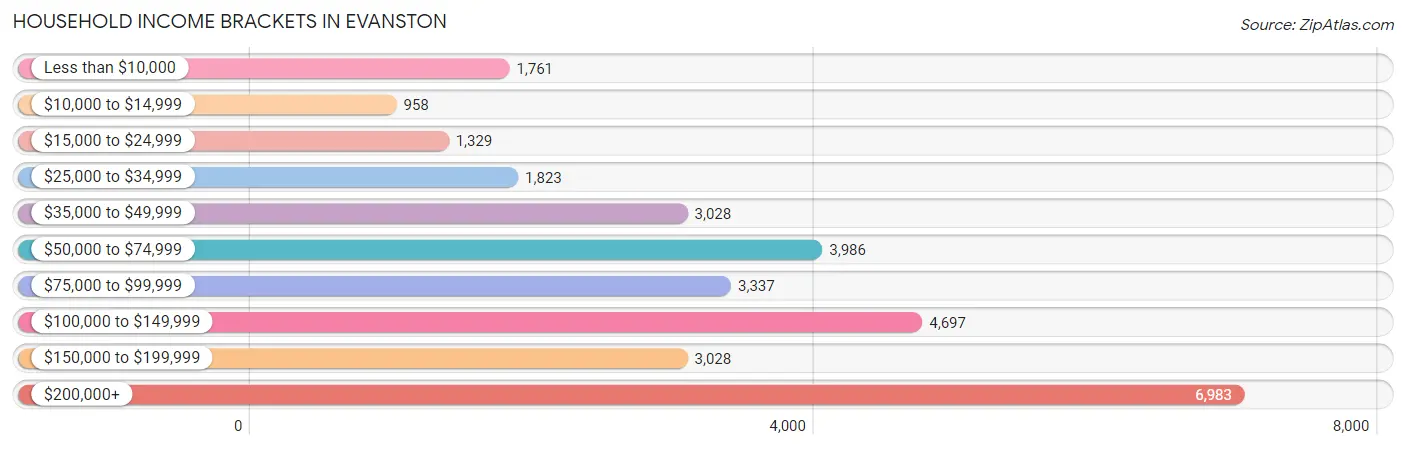
| Income Bracket | # Households | % Households |
| Less than $10,000 | 1,761 | 5.7% |
| $10,000 to $14,999 | 958 | 3.1% |
| $15,000 to $24,999 | 1,329 | 4.3% |
| $25,000 to $34,999 | 1,823 | 5.9% |
| $35,000 to $49,999 | 3,028 | 9.8% |
| $50,000 to $74,999 | 3,986 | 12.9% |
| $75,000 to $99,999 | 3,337 | 10.8% |
| $100,000 to $149,999 | 4,697 | 15.2% |
| $150,000 to $199,999 | 3,028 | 9.8% |
| $200,000+ | 6,983 | 22.6% |
Household Income by Householder Age in Evanston
The median household income in Evanston is $93,188, with the highest median household income of $121,219 found in the 45 to 64 years age bracket for the primary householder. A total of 11,261 households (36.4%) fall into this category. Meanwhile, the 15 to 24 years age bracket for the primary householder has the lowest median household income of $34,125, with 1,950 households (6.3%) in this group.
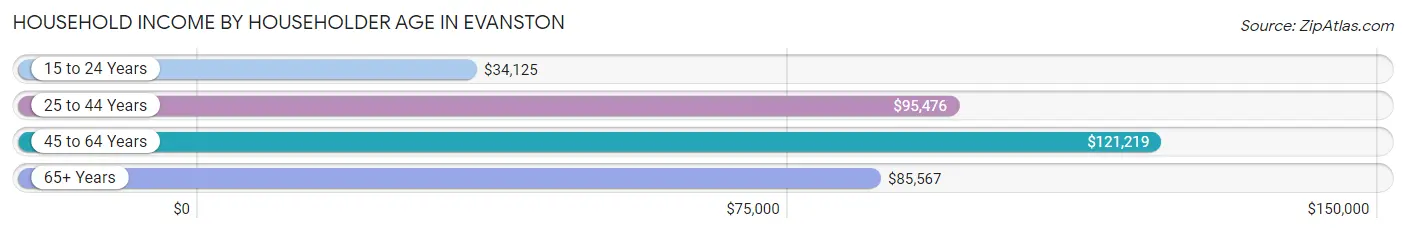
| Income Bracket | # Households | Median Income |
| 15 to 24 Years | 1,950 (6.3%) | $34,125 |
| 25 to 44 Years | 9,314 (30.1%) | $95,476 |
| 45 to 64 Years | 11,261 (36.4%) | $121,219 |
| 65+ Years | 8,375 (27.1%) | $85,567 |
| Total | 30,900 (100.0%) | $93,188 |
Poverty in Evanston
Income Below Poverty by Sex and Age in Evanston
With 10.9% poverty level for males and 12.2% for females among the residents of Evanston, 18 to 24 year old males and 18 to 24 year old females are the most vulnerable to poverty, with 1,479 males (38.6%) and 1,497 females (42.6%) in their respective age groups living below the poverty level.
| Age Bracket | Male | Female |
| Under 5 Years | 216 (10.4%) | 20 (1.3%) |
| 5 Years | 33 (8.9%) | 40 (11.4%) |
| 6 to 11 Years | 316 (11.7%) | 272 (11.4%) |
| 12 to 14 Years | 51 (3.9%) | 128 (10.3%) |
| 15 Years | 63 (18.9%) | 20 (6.4%) |
| 16 and 17 Years | 51 (7.7%) | 49 (6.5%) |
| 18 to 24 Years | 1,479 (38.6%) | 1,497 (42.6%) |
| 25 to 34 Years | 250 (5.6%) | 579 (11.4%) |
| 35 to 44 Years | 219 (4.8%) | 263 (5.9%) |
| 45 to 54 Years | 353 (8.0%) | 221 (4.9%) |
| 55 to 64 Years | 461 (10.5%) | 575 (12.3%) |
| 65 to 74 Years | 168 (4.9%) | 376 (8.9%) |
| 75 Years and over | 87 (5.1%) | 381 (12.1%) |
| Total | 3,747 (10.9%) | 4,421 (12.2%) |
Income Above Poverty by Sex and Age in Evanston
According to the poverty statistics in Evanston, males aged 12 to 14 years and females aged under 5 years are the age groups that are most secure financially, with 96.1% of males and 98.7% of females in these age groups living above the poverty line.
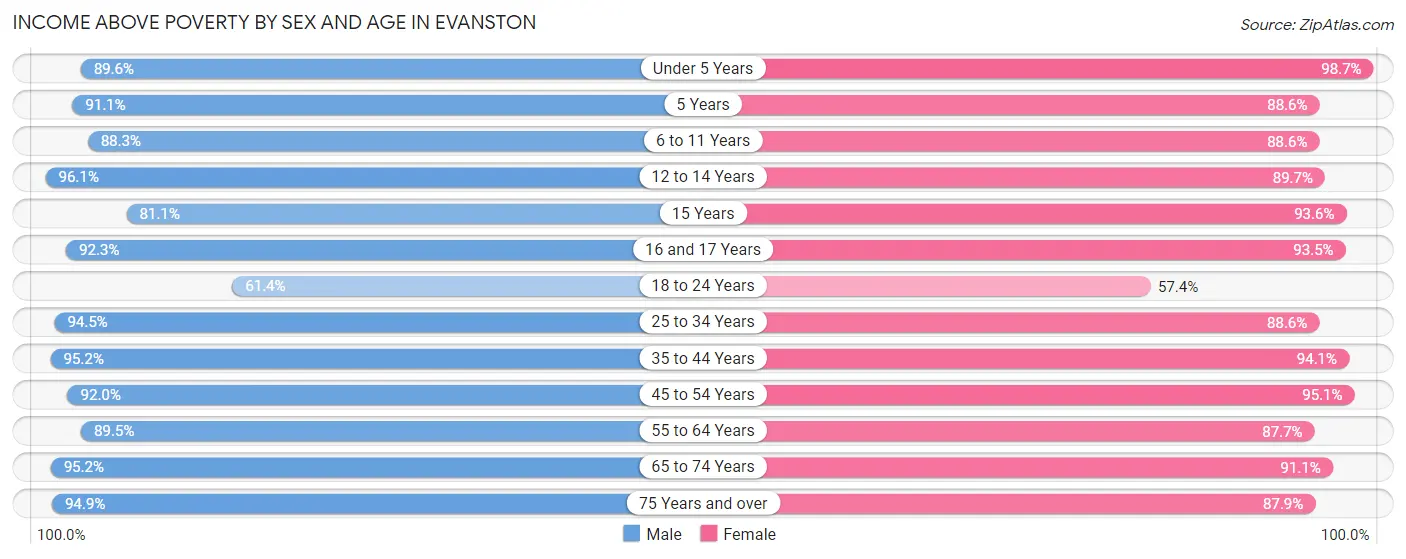
| Age Bracket | Male | Female |
| Under 5 Years | 1,857 (89.6%) | 1,486 (98.7%) |
| 5 Years | 339 (91.1%) | 312 (88.6%) |
| 6 to 11 Years | 2,381 (88.3%) | 2,117 (88.6%) |
| 12 to 14 Years | 1,261 (96.1%) | 1,109 (89.6%) |
| 15 Years | 270 (81.1%) | 294 (93.6%) |
| 16 and 17 Years | 611 (92.3%) | 701 (93.5%) |
| 18 to 24 Years | 2,356 (61.4%) | 2,018 (57.4%) |
| 25 to 34 Years | 4,252 (94.5%) | 4,496 (88.6%) |
| 35 to 44 Years | 4,330 (95.2%) | 4,200 (94.1%) |
| 45 to 54 Years | 4,065 (92.0%) | 4,321 (95.1%) |
| 55 to 64 Years | 3,944 (89.5%) | 4,108 (87.7%) |
| 65 to 74 Years | 3,293 (95.2%) | 3,850 (91.1%) |
| 75 Years and over | 1,623 (94.9%) | 2,754 (87.8%) |
| Total | 30,582 (89.1%) | 31,766 (87.8%) |
Income Below Poverty Among Married-Couple Families in Evanston
The poverty statistics for married-couple families in Evanston show that 1.6% or 202 of the total 12,586 families live below the poverty line. Families with 5 or more children have the highest poverty rate of 100.0%, comprising of 13 families. On the other hand, families with 1 or 2 children have the lowest poverty rate of 0.7%, which includes 31 families.
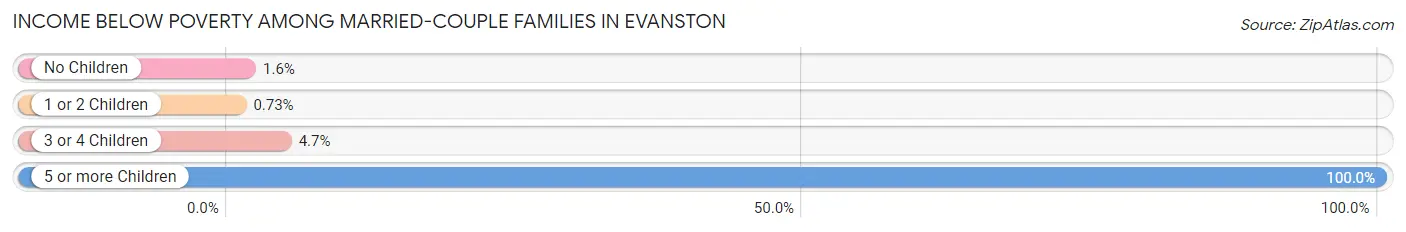
| Children | Above Poverty | Below Poverty |
| No Children | 7,330 (98.4%) | 117 (1.6%) |
| 1 or 2 Children | 4,217 (99.3%) | 31 (0.7%) |
| 3 or 4 Children | 837 (95.3%) | 41 (4.7%) |
| 5 or more Children | 0 (0.0%) | 13 (100.0%) |
| Total | 12,384 (98.4%) | 202 (1.6%) |
Income Below Poverty Among Single-Parent Households in Evanston
According to the poverty data in Evanston, 7.0% or 65 single-father households and 18.8% or 528 single-mother households are living below the poverty line. Among single-father households, those with 1 or 2 children have the highest poverty rate, with 65 households (13.0%) experiencing poverty. Likewise, among single-mother households, those with 3 or 4 children have the highest poverty rate, with 91 households (40.4%) falling below the poverty line.
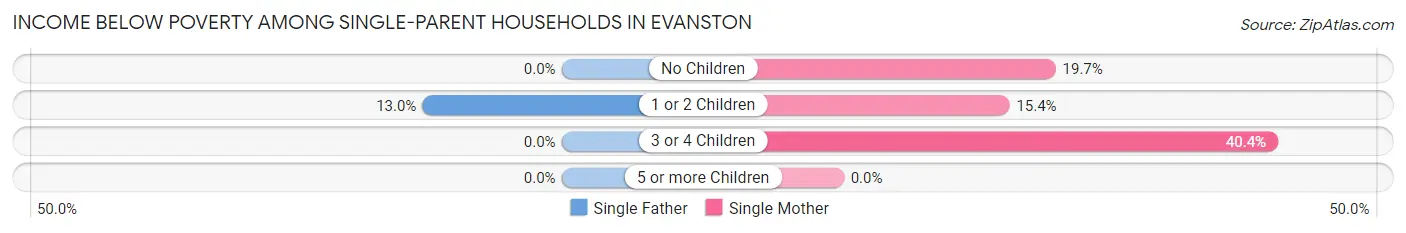
| Children | Single Father | Single Mother |
| No Children | 0 (0.0%) | 216 (19.7%) |
| 1 or 2 Children | 65 (13.0%) | 221 (15.4%) |
| 3 or 4 Children | 0 (0.0%) | 91 (40.4%) |
| 5 or more Children | 0 (0.0%) | 0 (0.0%) |
| Total | 65 (7.0%) | 528 (18.8%) |
Income Below Poverty Among Married-Couple vs Single-Parent Households in Evanston
The poverty data for Evanston shows that 202 of the married-couple family households (1.6%) and 593 of the single-parent households (15.9%) are living below the poverty level. Within the married-couple family households, those with 5 or more children have the highest poverty rate, with 13 households (100.0%) falling below the poverty line. Among the single-parent households, those with 3 or 4 children have the highest poverty rate, with 91 household (34.2%) living below poverty.
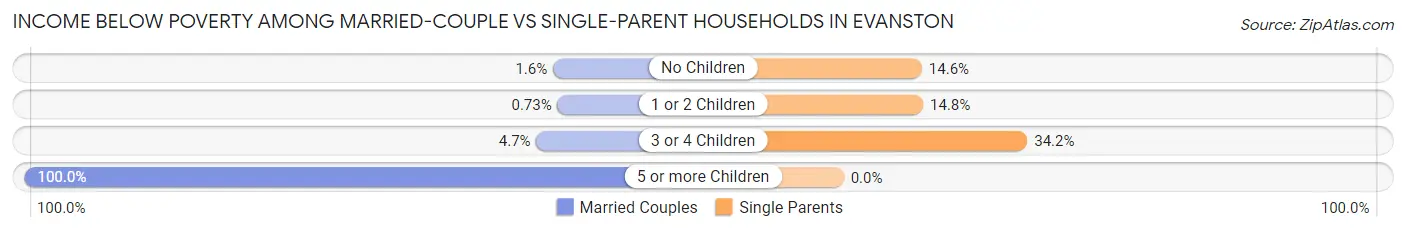
| Children | Married-Couple Families | Single-Parent Households |
| No Children | 117 (1.6%) | 216 (14.6%) |
| 1 or 2 Children | 31 (0.7%) | 286 (14.8%) |
| 3 or 4 Children | 41 (4.7%) | 91 (34.2%) |
| 5 or more Children | 13 (100.0%) | 0 (0.0%) |
| Total | 202 (1.6%) | 593 (15.9%) |
Race in Evanston
The most populous races in Evanston are White / Caucasian (47,556 | 61.6%), Black / African American (12,756 | 16.5%), and Hispanic or Latino (8,713 | 11.3%).
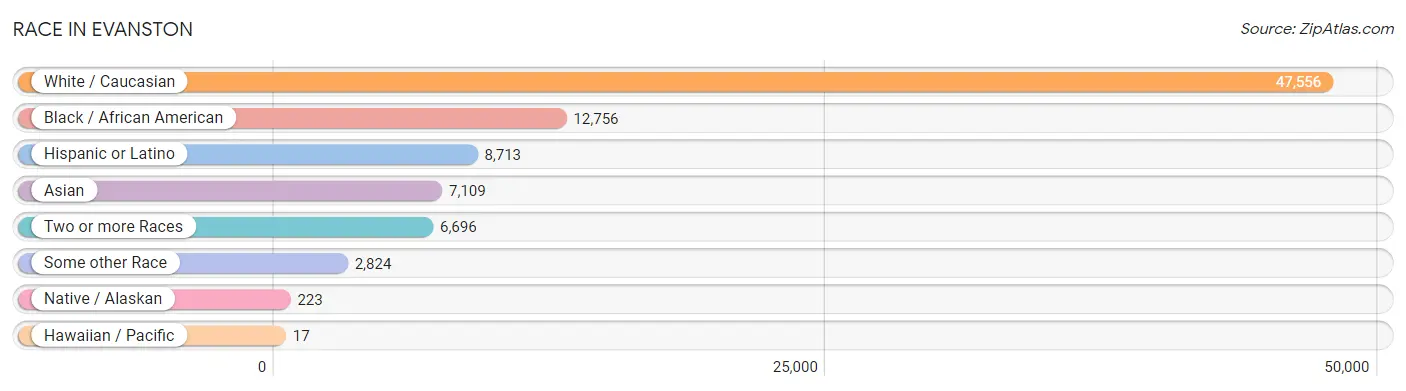
| Race | # Population | % Population |
| Asian | 7,109 | 9.2% |
| Black / African American | 12,756 | 16.5% |
| Hawaiian / Pacific | 17 | 0.0% |
| Hispanic or Latino | 8,713 | 11.3% |
| Native / Alaskan | 223 | 0.3% |
| White / Caucasian | 47,556 | 61.6% |
| Two or more Races | 6,696 | 8.7% |
| Some other Race | 2,824 | 3.7% |
| Total | 77,181 | 100.0% |
Ancestry in Evanston
The most populous ancestries reported in Evanston are German (11,115 | 14.4%), Irish (8,031 | 10.4%), English (6,436 | 8.3%), Mexican (5,295 | 6.9%), and Polish (4,782 | 6.2%), together accounting for 46.2% of all Evanston residents.
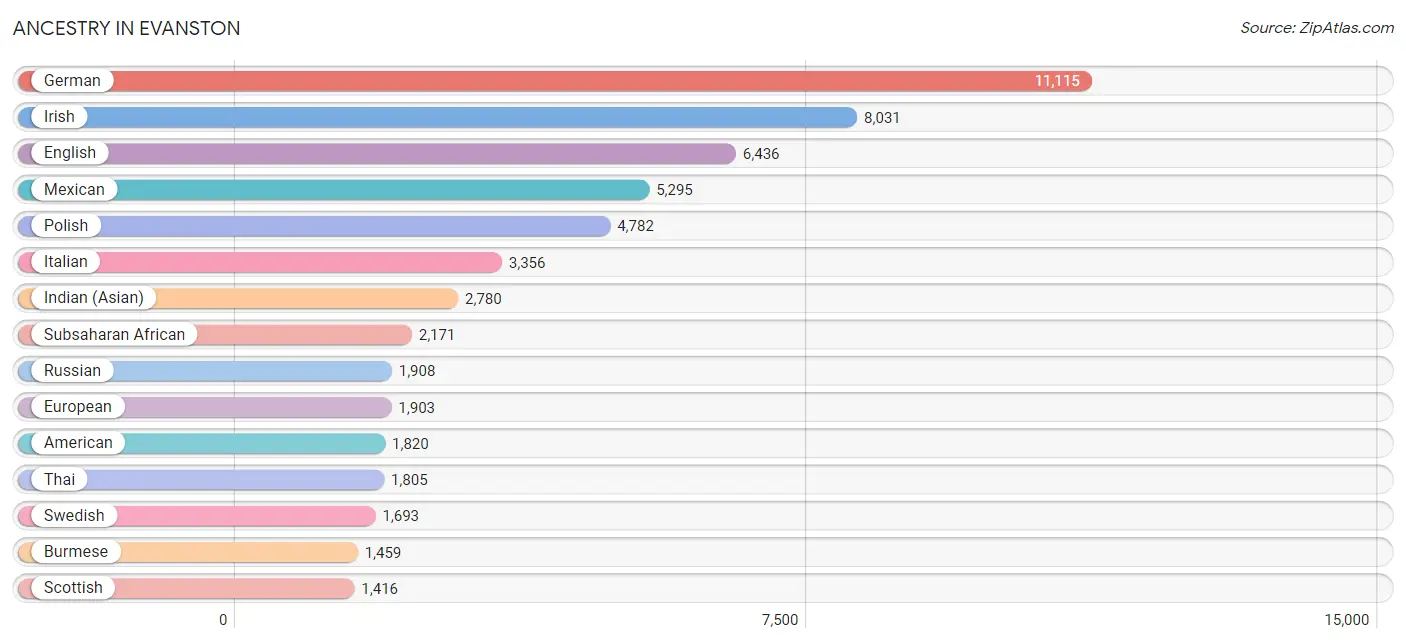
| Ancestry | # Population | % Population |
| African | 520 | 0.7% |
| Albanian | 28 | 0.0% |
| Alsatian | 17 | 0.0% |
| American | 1,820 | 2.4% |
| Arab | 313 | 0.4% |
| Argentinean | 106 | 0.1% |
| Armenian | 86 | 0.1% |
| Assyrian / Chaldean / Syriac | 81 | 0.1% |
| Australian | 309 | 0.4% |
| Austrian | 217 | 0.3% |
| Bahamian | 42 | 0.1% |
| Basque | 18 | 0.0% |
| Belgian | 259 | 0.3% |
| Belizean | 150 | 0.2% |
| Bhutanese | 697 | 0.9% |
| Bolivian | 40 | 0.1% |
| Brazilian | 19 | 0.0% |
| British | 736 | 0.9% |
| Bulgarian | 190 | 0.3% |
| Burmese | 1,459 | 1.9% |
| Canadian | 271 | 0.4% |
| Central American | 800 | 1.0% |
| Central American Indian | 104 | 0.1% |
| Cherokee | 222 | 0.3% |
| Chilean | 188 | 0.2% |
| Chippewa | 66 | 0.1% |
| Colombian | 190 | 0.3% |
| Costa Rican | 67 | 0.1% |
| Croatian | 325 | 0.4% |
| Cuban | 461 | 0.6% |
| Czech | 530 | 0.7% |
| Czechoslovakian | 37 | 0.1% |
| Danish | 233 | 0.3% |
| Dominican | 53 | 0.1% |
| Dutch | 1,001 | 1.3% |
| Eastern European | 1,221 | 1.6% |
| Ecuadorian | 17 | 0.0% |
| Egyptian | 11 | 0.0% |
| English | 6,436 | 8.3% |
| Ethiopian | 177 | 0.2% |
| European | 1,903 | 2.5% |
| Filipino | 75 | 0.1% |
| Finnish | 118 | 0.2% |
| French | 1,409 | 1.8% |
| French Canadian | 384 | 0.5% |
| German | 11,115 | 14.4% |
| Ghanaian | 482 | 0.6% |
| Greek | 483 | 0.6% |
| Guatemalan | 432 | 0.6% |
| Guyanese | 18 | 0.0% |
| Haitian | 452 | 0.6% |
| Hungarian | 670 | 0.9% |
| Indian (Asian) | 2,780 | 3.6% |
| Iranian | 136 | 0.2% |
| Iraqi | 13 | 0.0% |
| Irish | 8,031 | 10.4% |
| Israeli | 139 | 0.2% |
| Italian | 3,356 | 4.3% |
| Jamaican | 1,043 | 1.3% |
| Japanese | 104 | 0.1% |
| Kenyan | 9 | 0.0% |
| Korean | 1,243 | 1.6% |
| Laotian | 17 | 0.0% |
| Latvian | 91 | 0.1% |
| Lebanese | 72 | 0.1% |
| Lithuanian | 437 | 0.6% |
| Luxembourger | 41 | 0.1% |
| Macedonian | 8 | 0.0% |
| Mexican | 5,295 | 6.9% |
| Mexican American Indian | 146 | 0.2% |
| Moroccan | 20 | 0.0% |
| Native Hawaiian | 21 | 0.0% |
| Navajo | 14 | 0.0% |
| Nicaraguan | 8 | 0.0% |
| Nigerian | 328 | 0.4% |
| Northern European | 382 | 0.5% |
| Norwegian | 1,279 | 1.7% |
| Okinawan | 11 | 0.0% |
| Pakistani | 95 | 0.1% |
| Palestinian | 23 | 0.0% |
| Panamanian | 30 | 0.0% |
| Pennsylvania German | 18 | 0.0% |
| Peruvian | 86 | 0.1% |
| Polish | 4,782 | 6.2% |
| Portuguese | 161 | 0.2% |
| Potawatomi | 8 | 0.0% |
| Puerto Rican | 622 | 0.8% |
| Romanian | 373 | 0.5% |
| Russian | 1,908 | 2.5% |
| Salvadoran | 263 | 0.3% |
| Scandinavian | 482 | 0.6% |
| Scotch-Irish | 472 | 0.6% |
| Scottish | 1,416 | 1.8% |
| Senegalese | 11 | 0.0% |
| Serbian | 164 | 0.2% |
| Sierra Leonean | 139 | 0.2% |
| Sioux | 12 | 0.0% |
| Slavic | 88 | 0.1% |
| Slovak | 82 | 0.1% |
| Slovene | 104 | 0.1% |
| South American | 749 | 1.0% |
| Spaniard | 79 | 0.1% |
| Spanish | 220 | 0.3% |
| Sri Lankan | 482 | 0.6% |
| Subsaharan African | 2,171 | 2.8% |
| Sudanese | 371 | 0.5% |
| Swedish | 1,693 | 2.2% |
| Swiss | 326 | 0.4% |
| Syrian | 40 | 0.1% |
| Thai | 1,805 | 2.3% |
| Trinidadian and Tobagonian | 27 | 0.0% |
| Turkish | 444 | 0.6% |
| Ukrainian | 448 | 0.6% |
| Uruguayan | 23 | 0.0% |
| Venezuelan | 99 | 0.1% |
| Vietnamese | 9 | 0.0% |
| Welsh | 380 | 0.5% |
| West Indian | 22 | 0.0% |
| Yugoslavian | 64 | 0.1% |
| Zimbabwean | 51 | 0.1% | View All 120 Rows |
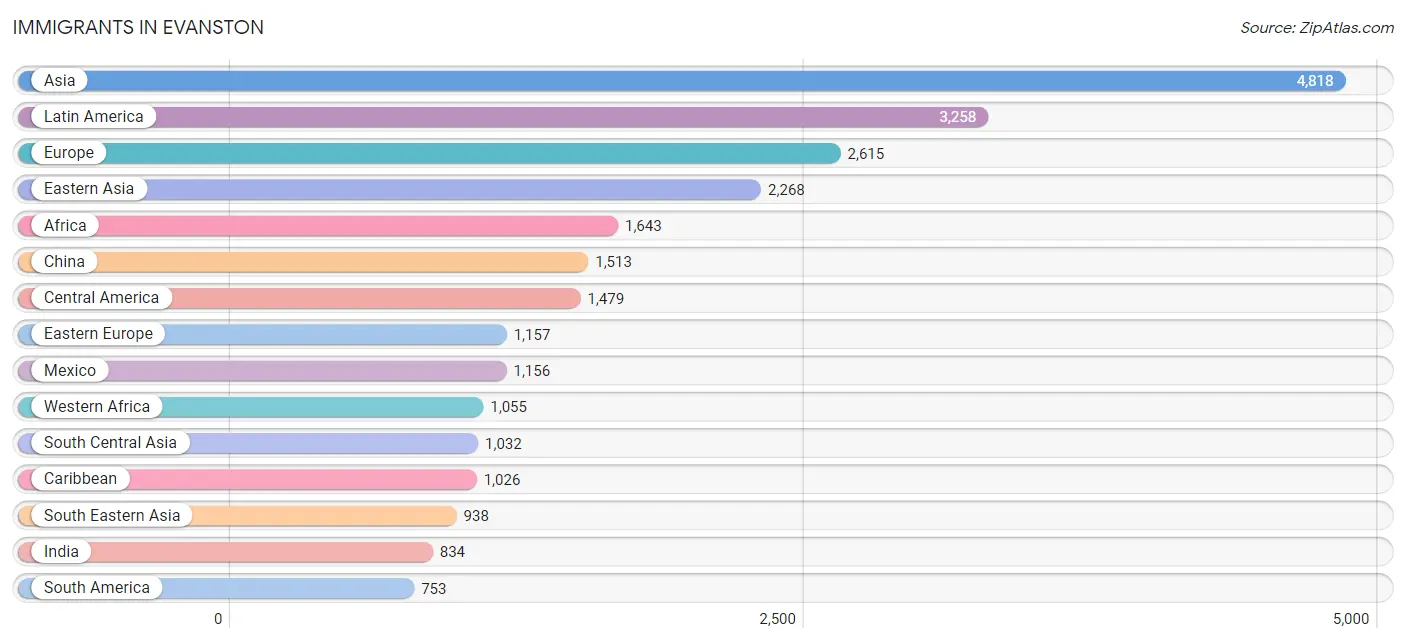
Immigrants in Evanston
The most numerous immigrant groups reported in Evanston came from Asia (4,818 | 6.2%), Latin America (3,258 | 4.2%), Europe (2,615 | 3.4%), Eastern Asia (2,268 | 2.9%), and Africa (1,643 | 2.1%), together accounting for 18.9% of all Evanston residents.
| Immigration Origin | # Population | % Population |
| Africa | 1,643 | 2.1% |
| Argentina | 21 | 0.0% |
| Asia | 4,818 | 6.2% |
| Australia | 34 | 0.0% |
| Bahamas | 9 | 0.0% |
| Bangladesh | 9 | 0.0% |
| Belarus | 34 | 0.0% |
| Belgium | 34 | 0.0% |
| Bolivia | 25 | 0.0% |
| Bosnia and Herzegovina | 26 | 0.0% |
| Brazil | 218 | 0.3% |
| Bulgaria | 54 | 0.1% |
| Cambodia | 34 | 0.0% |
| Cameroon | 15 | 0.0% |
| Canada | 155 | 0.2% |
| Caribbean | 1,026 | 1.3% |
| Central America | 1,479 | 1.9% |
| Chile | 159 | 0.2% |
| China | 1,513 | 2.0% |
| Colombia | 138 | 0.2% |
| Costa Rica | 46 | 0.1% |
| Croatia | 53 | 0.1% |
| Cuba | 59 | 0.1% |
| Czechoslovakia | 35 | 0.1% |
| Denmark | 13 | 0.0% |
| Dominican Republic | 19 | 0.0% |
| Eastern Africa | 173 | 0.2% |
| Eastern Asia | 2,268 | 2.9% |
| Eastern Europe | 1,157 | 1.5% |
| Ecuador | 9 | 0.0% |
| Egypt | 11 | 0.0% |
| El Salvador | 91 | 0.1% |
| England | 170 | 0.2% |
| Eritrea | 5 | 0.0% |
| Ethiopia | 119 | 0.2% |
| Europe | 2,615 | 3.4% |
| Fiji | 20 | 0.0% |
| France | 204 | 0.3% |
| Germany | 310 | 0.4% |
| Ghana | 341 | 0.4% |
| Greece | 22 | 0.0% |
| Grenada | 79 | 0.1% |
| Guatemala | 128 | 0.2% |
| Guyana | 18 | 0.0% |
| Haiti | 165 | 0.2% |
| Honduras | 20 | 0.0% |
| Hong Kong | 35 | 0.1% |
| Hungary | 31 | 0.0% |
| India | 834 | 1.1% |
| Indonesia | 14 | 0.0% |
| Iran | 58 | 0.1% |
| Iraq | 46 | 0.1% |
| Ireland | 81 | 0.1% |
| Israel | 178 | 0.2% |
| Italy | 68 | 0.1% |
| Jamaica | 673 | 0.9% |
| Japan | 192 | 0.3% |
| Jordan | 3 | 0.0% |
| Kenya | 13 | 0.0% |
| Korea | 563 | 0.7% |
| Latin America | 3,258 | 4.2% |
| Latvia | 10 | 0.0% |
| Lebanon | 12 | 0.0% |
| Malaysia | 14 | 0.0% |
| Mexico | 1,156 | 1.5% |
| Middle Africa | 50 | 0.1% |
| Moldova | 14 | 0.0% |
| Morocco | 10 | 0.0% |
| Nepal | 28 | 0.0% |
| Netherlands | 158 | 0.2% |
| Nicaragua | 8 | 0.0% |
| Nigeria | 559 | 0.7% |
| North Macedonia | 20 | 0.0% |
| Northern Africa | 251 | 0.3% |
| Northern Europe | 584 | 0.8% |
| Norway | 33 | 0.0% |
| Oceania | 69 | 0.1% |
| Pakistan | 60 | 0.1% |
| Panama | 30 | 0.0% |
| Peru | 89 | 0.1% |
| Philippines | 528 | 0.7% |
| Poland | 236 | 0.3% |
| Romania | 47 | 0.1% |
| Russia | 308 | 0.4% |
| Saudi Arabia | 11 | 0.0% |
| Scotland | 64 | 0.1% |
| Serbia | 19 | 0.0% |
| Sierra Leone | 151 | 0.2% |
| Singapore | 54 | 0.1% |
| South Africa | 46 | 0.1% |
| South America | 753 | 1.0% |
| South Central Asia | 1,032 | 1.3% |
| South Eastern Asia | 938 | 1.2% |
| Southern Europe | 144 | 0.2% |
| Spain | 54 | 0.1% |
| Sudan | 214 | 0.3% |
| Sweden | 40 | 0.1% |
| Switzerland | 24 | 0.0% |
| Syria | 10 | 0.0% |
| Taiwan | 41 | 0.1% |
| Thailand | 43 | 0.1% |
| Turkey | 214 | 0.3% |
| Ukraine | 146 | 0.2% |
| Venezuela | 76 | 0.1% |
| Vietnam | 245 | 0.3% |
| West Indies | 22 | 0.0% |
| Western Africa | 1,055 | 1.4% |
| Western Asia | 580 | 0.7% |
| Western Europe | 730 | 0.9% |
| Yemen | 86 | 0.1% |
| Zaire | 4 | 0.0% |
| Zimbabwe | 13 | 0.0% | View All 112 Rows |
Sex and Age in Evanston
Sex and Age in Evanston
The most populous age groups in Evanston are 20 to 24 Years (4,239 | 11.3%) for men and 20 to 24 Years (3,733 | 9.4%) for women.
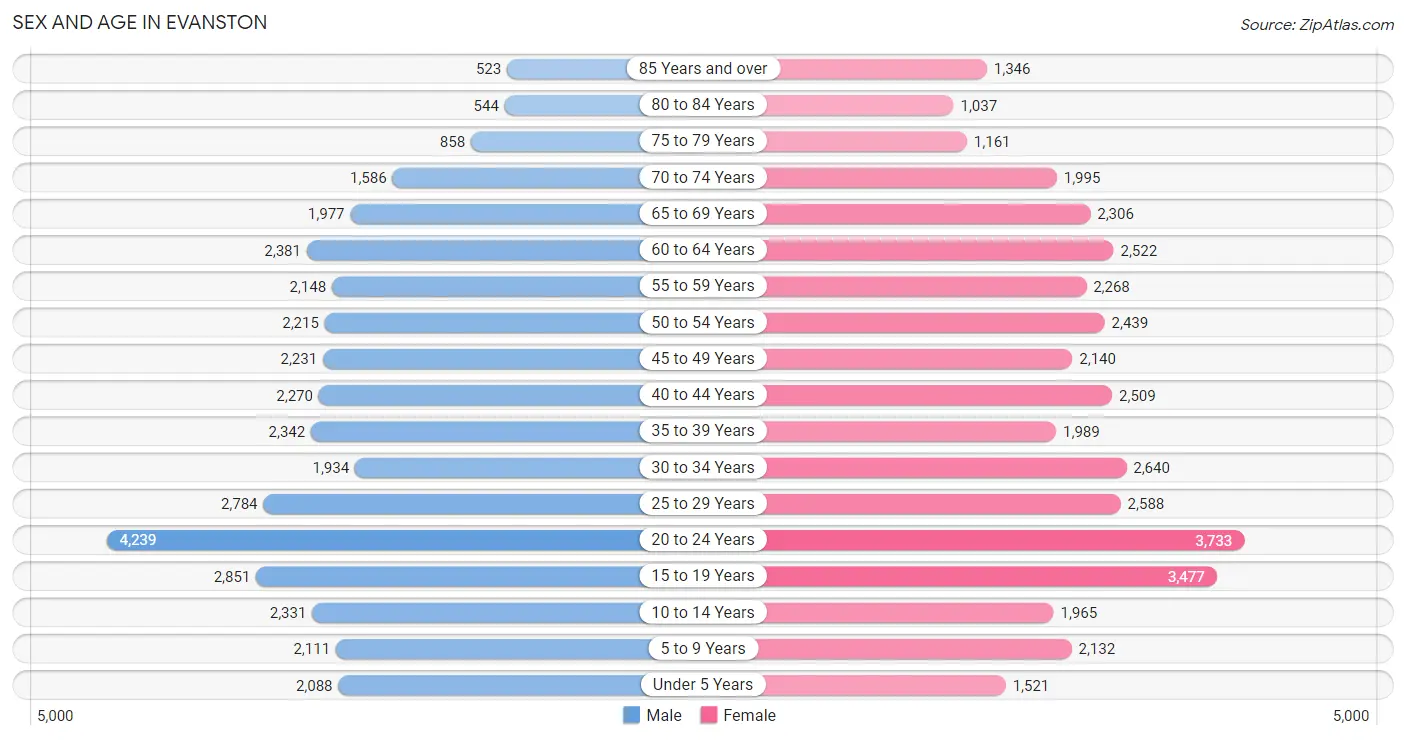
| Age Bracket | Male | Female |
| Under 5 Years | 2,088 (5.6%) | 1,521 (3.8%) |
| 5 to 9 Years | 2,111 (5.6%) | 2,132 (5.4%) |
| 10 to 14 Years | 2,331 (6.2%) | 1,965 (4.9%) |
| 15 to 19 Years | 2,851 (7.6%) | 3,477 (8.7%) |
| 20 to 24 Years | 4,239 (11.3%) | 3,733 (9.4%) |
| 25 to 29 Years | 2,784 (7.4%) | 2,588 (6.5%) |
| 30 to 34 Years | 1,934 (5.2%) | 2,640 (6.6%) |
| 35 to 39 Years | 2,342 (6.3%) | 1,989 (5.0%) |
| 40 to 44 Years | 2,270 (6.1%) | 2,509 (6.3%) |
| 45 to 49 Years | 2,231 (6.0%) | 2,140 (5.4%) |
| 50 to 54 Years | 2,215 (5.9%) | 2,439 (6.1%) |
| 55 to 59 Years | 2,148 (5.7%) | 2,268 (5.7%) |
| 60 to 64 Years | 2,381 (6.4%) | 2,522 (6.3%) |
| 65 to 69 Years | 1,977 (5.3%) | 2,306 (5.8%) |
| 70 to 74 Years | 1,586 (4.2%) | 1,995 (5.0%) |
| 75 to 79 Years | 858 (2.3%) | 1,161 (2.9%) |
| 80 to 84 Years | 544 (1.5%) | 1,037 (2.6%) |
| 85 Years and over | 523 (1.4%) | 1,346 (3.4%) |
| Total | 37,413 (100.0%) | 39,768 (100.0%) |
Families and Households in Evanston
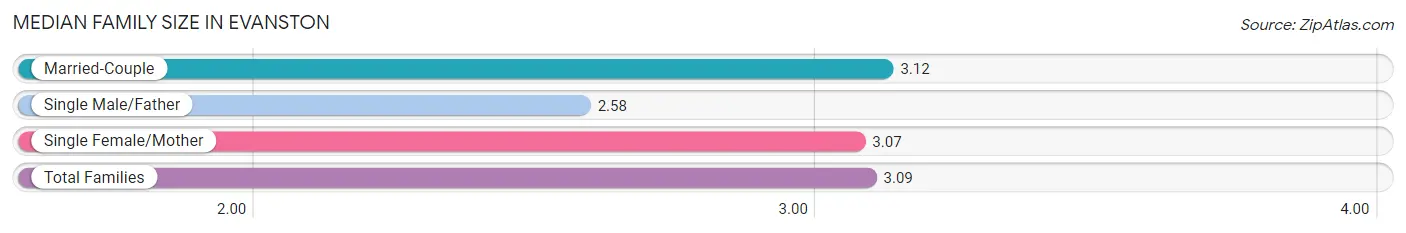
Median Family Size in Evanston
The median family size in Evanston is 3.09 persons per family, with married-couple families (12,586 | 77.1%) accounting for the largest median family size of 3.12 persons per family. On the other hand, single male/father families (930 | 5.7%) represent the smallest median family size with 2.58 persons per family.
| Family Type | # Families | Family Size |
| Married-Couple | 12,586 (77.1%) | 3.12 |
| Single Male/Father | 930 (5.7%) | 2.58 |
| Single Female/Mother | 2,805 (17.2%) | 3.07 |
| Total Families | 16,321 (100.0%) | 3.09 |
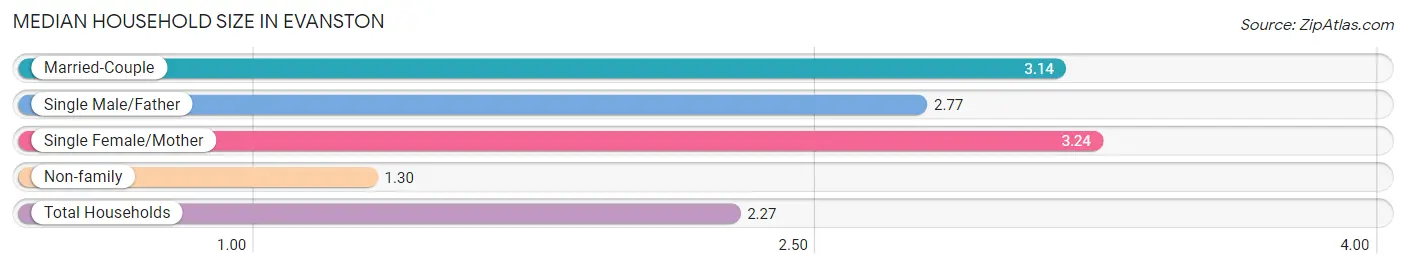
Median Household Size in Evanston
The median household size in Evanston is 2.27 persons per household, with single female/mother households (2,805 | 9.1%) accounting for the largest median household size of 3.24 persons per household. non-family households (14,579 | 47.2%) represent the smallest median household size with 1.30 persons per household.
| Household Type | # Households | Household Size |
| Married-Couple | 12,586 (40.7%) | 3.14 |
| Single Male/Father | 930 (3.0%) | 2.77 |
| Single Female/Mother | 2,805 (9.1%) | 3.24 |
| Non-family | 14,579 (47.2%) | 1.30 |
| Total Households | 30,900 (100.0%) | 2.27 |
Household Size by Marriage Status in Evanston
Out of a total of 30,900 households in Evanston, 16,321 (52.8%) are family households, while 14,579 (47.2%) are nonfamily households. The most numerous type of family households are 2-person households, comprising 7,337, and the most common type of nonfamily households are 1-person households, comprising 11,194.
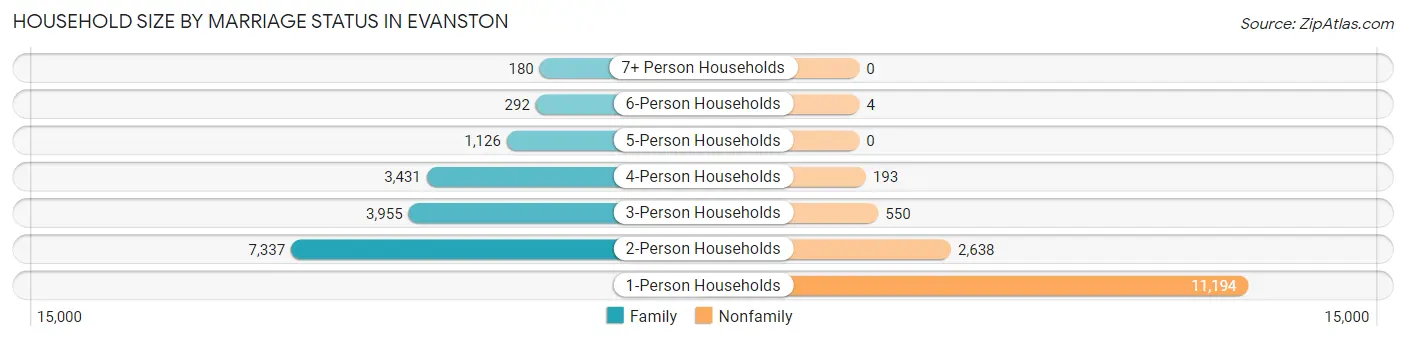
| Household Size | Family Households | Nonfamily Households |
| 1-Person Households | - | 11,194 (36.2%) |
| 2-Person Households | 7,337 (23.7%) | 2,638 (8.5%) |
| 3-Person Households | 3,955 (12.8%) | 550 (1.8%) |
| 4-Person Households | 3,431 (11.1%) | 193 (0.6%) |
| 5-Person Households | 1,126 (3.6%) | 0 (0.0%) |
| 6-Person Households | 292 (0.9%) | 4 (0.0%) |
| 7+ Person Households | 180 (0.6%) | 0 (0.0%) |
| Total | 16,321 (52.8%) | 14,579 (47.2%) |
Female Fertility in Evanston
Fertility by Age in Evanston
Average fertility rate in Evanston is 39.0 births per 1,000 women. Women in the age bracket of 20 to 34 years have the highest fertility rate with 58.0 births per 1,000 women. Women in the age bracket of 20 to 34 years acount for 68.1% of all women with births.
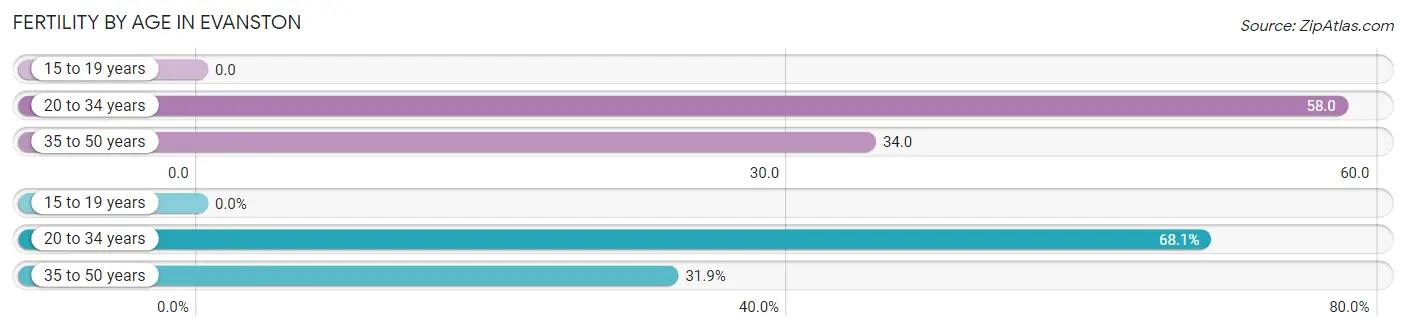
| Age Bracket | Women with Births | Births / 1,000 Women |
| 15 to 19 years | 0 (0.0%) | 0.0 |
| 20 to 34 years | 518 (68.1%) | 58.0 |
| 35 to 50 years | 243 (31.9%) | 34.0 |
| Total | 761 (100.0%) | 39.0 |
Fertility by Age by Marriage Status in Evanston
87.8% of women with births (761) in Evanston are married. The highest percentage of unmarried women with births falls into 20 to 34 years age bracket with 17.9% of them unmarried at the time of birth, while the lowest percentage of unmarried women with births belong to 35 to 50 years age bracket with 0.0% of them unmarried.
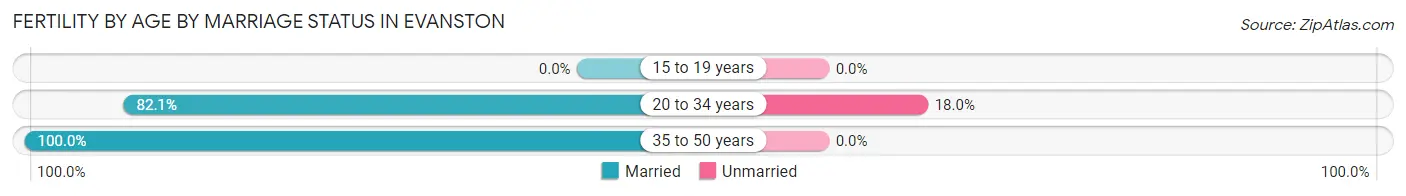
| Age Bracket | Married | Unmarried |
| 15 to 19 years | 0 (0.0%) | 0 (0.0%) |
| 20 to 34 years | 425 (82.1%) | 93 (17.9%) |
| 35 to 50 years | 243 (100.0%) | 0 (0.0%) |
| Total | 668 (87.8%) | 93 (12.2%) |
Fertility by Education in Evanston
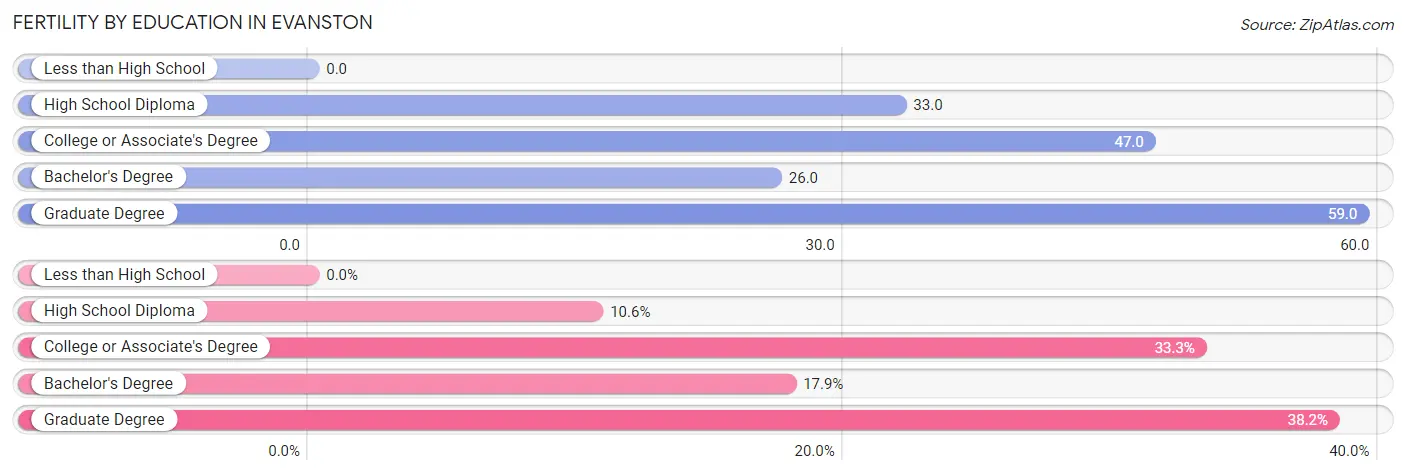
| Educational Attainment | Women with Births | Births / 1,000 Women |
| Less than High School | 0 (0.0%) | 0.0 |
| High School Diploma | 81 (10.6%) | 33.0 |
| College or Associate's Degree | 253 (33.3%) | 47.0 |
| Bachelor's Degree | 136 (17.9%) | 26.0 |
| Graduate Degree | 291 (38.2%) | 59.0 |
| Total | 761 (100.0%) | 39.0 |
Fertility by Education by Marriage Status in Evanston
12.2% of women with births in Evanston are unmarried. Women with the educational attainment of bachelor's degree are most likely to be married with 100.0% of them married at childbirth, while women with the educational attainment of high school diploma are least likely to be married with 50.6% of them unmarried at childbirth.
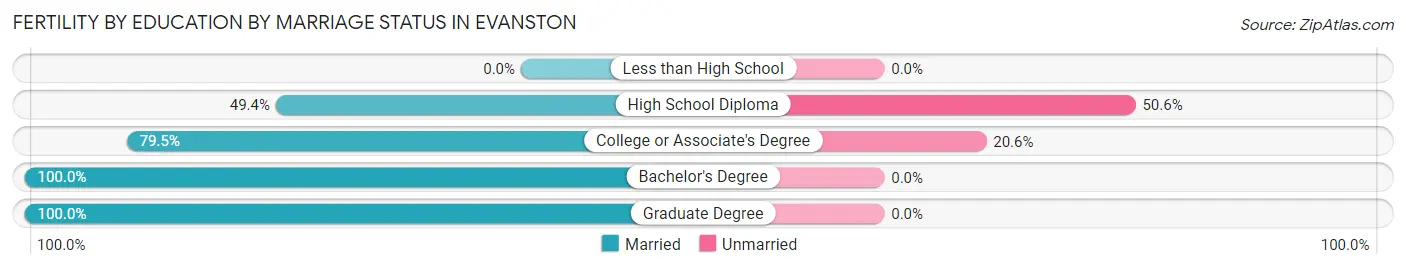
| Educational Attainment | Married | Unmarried |
| Less than High School | 0 (0.0%) | 0 (0.0%) |
| High School Diploma | 40 (49.4%) | 41 (50.6%) |
| College or Associate's Degree | 201 (79.4%) | 52 (20.5%) |
| Bachelor's Degree | 136 (100.0%) | 0 (0.0%) |
| Graduate Degree | 291 (100.0%) | 0 (0.0%) |
| Total | 668 (87.8%) | 93 (12.2%) |
Employment Characteristics in Evanston
Employment by Class of Employer in Evanston
Among the 38,172 employed individuals in Evanston, private company employees (21,379 | 56.0%), not-for-profit organizations (8,945 | 23.4%), and self-employed (not incorporated) (2,487 | 6.5%) make up the most common classes of employment.
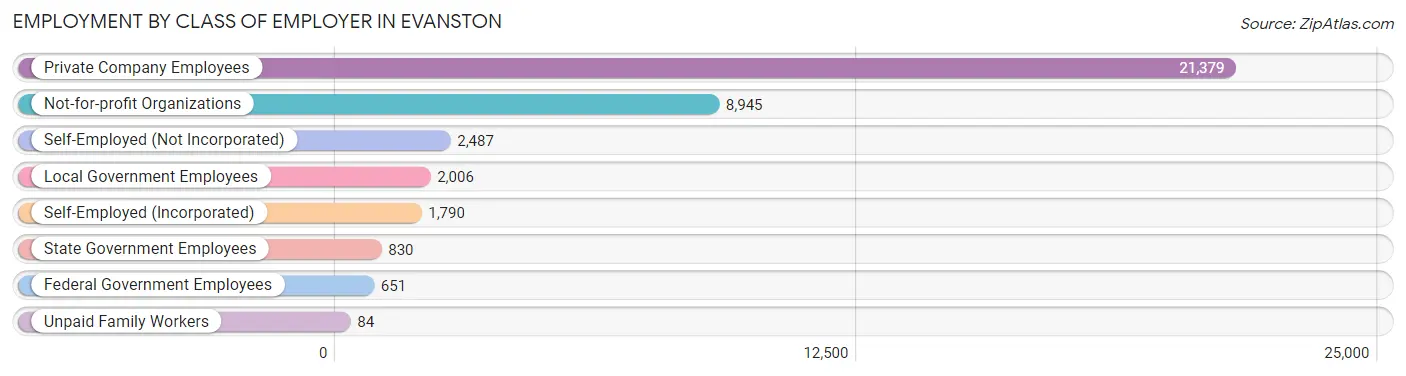
| Employer Class | # Employees | % Employees |
| Private Company Employees | 21,379 | 56.0% |
| Self-Employed (Incorporated) | 1,790 | 4.7% |
| Self-Employed (Not Incorporated) | 2,487 | 6.5% |
| Not-for-profit Organizations | 8,945 | 23.4% |
| Local Government Employees | 2,006 | 5.3% |
| State Government Employees | 830 | 2.2% |
| Federal Government Employees | 651 | 1.7% |
| Unpaid Family Workers | 84 | 0.2% |
| Total | 38,172 | 100.0% |
Employment Status by Age in Evanston
According to the labor force statistics for Evanston, out of the total population over 16 years of age (64,378), 64.5% or 41,524 individuals are in the labor force, with 6.1% or 2,533 of them unemployed. The age group with the highest labor force participation rate is 45 to 54 years, with 89.2% or 8,050 individuals in the labor force. Within the labor force, the 16 to 19 years age range has the highest percentage of unemployed individuals, with 26.9% or 502 of them being unemployed.
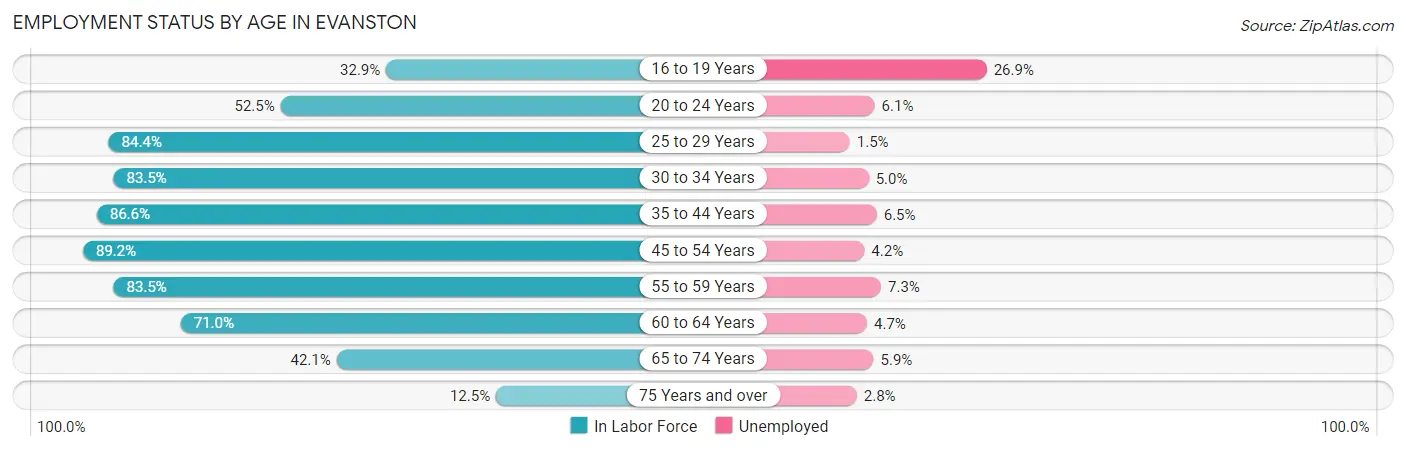
| Age Bracket | In Labor Force | Unemployed |
| 16 to 19 Years | 1,866 (32.9%) | 502 (26.9%) |
| 20 to 24 Years | 4,185 (52.5%) | 255 (6.1%) |
| 25 to 29 Years | 4,534 (84.4%) | 68 (1.5%) |
| 30 to 34 Years | 3,819 (83.5%) | 191 (5.0%) |
| 35 to 44 Years | 7,889 (86.6%) | 513 (6.5%) |
| 45 to 54 Years | 8,050 (89.2%) | 338 (4.2%) |
| 55 to 59 Years | 3,687 (83.5%) | 269 (7.3%) |
| 60 to 64 Years | 3,481 (71.0%) | 164 (4.7%) |
| 65 to 74 Years | 3,311 (42.1%) | 195 (5.9%) |
| 75 Years and over | 684 (12.5%) | 19 (2.8%) |
| Total | 41,524 (64.5%) | 2,533 (6.1%) |
Employment Status by Educational Attainment in Evanston
According to labor force statistics for Evanston, 84.1% of individuals (31,453) out of the total population between 25 and 64 years of age (37,400) are in the labor force, with 4.9% or 1,541 of them being unemployed. The group with the highest labor force participation rate are those with the educational attainment of bachelor's degree or higher, with 86.2% or 22,793 individuals in the labor force. Within the labor force, individuals with high school diploma education have the highest percentage of unemployment, with 13.6% or 336 of them being unemployed.
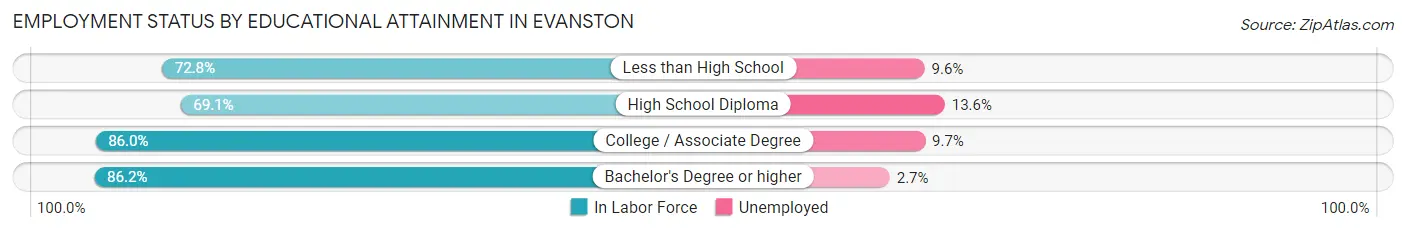
| Educational Attainment | In Labor Force | Unemployed |
| Less than High School | 806 (72.8%) | 106 (9.6%) |
| High School Diploma | 2,471 (69.1%) | 486 (13.6%) |
| College / Associate Degree | 5,396 (86.0%) | 609 (9.7%) |
| Bachelor's Degree or higher | 22,793 (86.2%) | 714 (2.7%) |
| Total | 31,453 (84.1%) | 1,833 (4.9%) |
Employment Occupations by Sex in Evanston
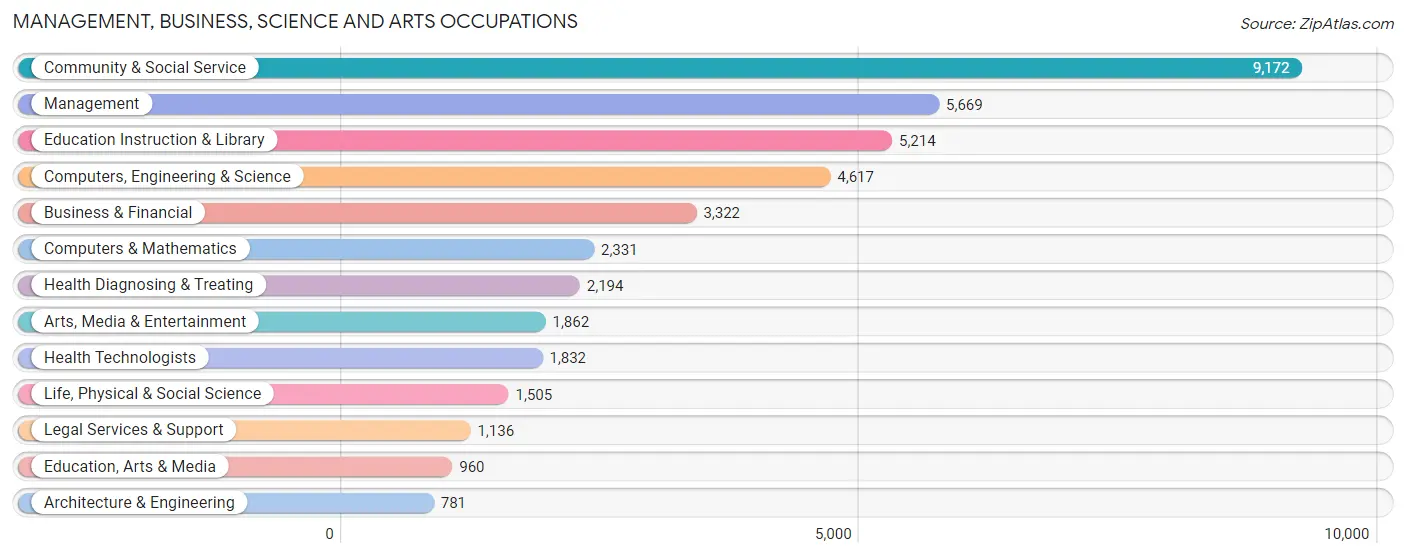
Management, Business, Science and Arts Occupations
The most common Management, Business, Science and Arts occupations in Evanston are Community & Social Service (9,172 | 23.5%), Management (5,669 | 14.5%), Education Instruction & Library (5,214 | 13.4%), Computers, Engineering & Science (4,617 | 11.8%), and Business & Financial (3,322 | 8.5%).
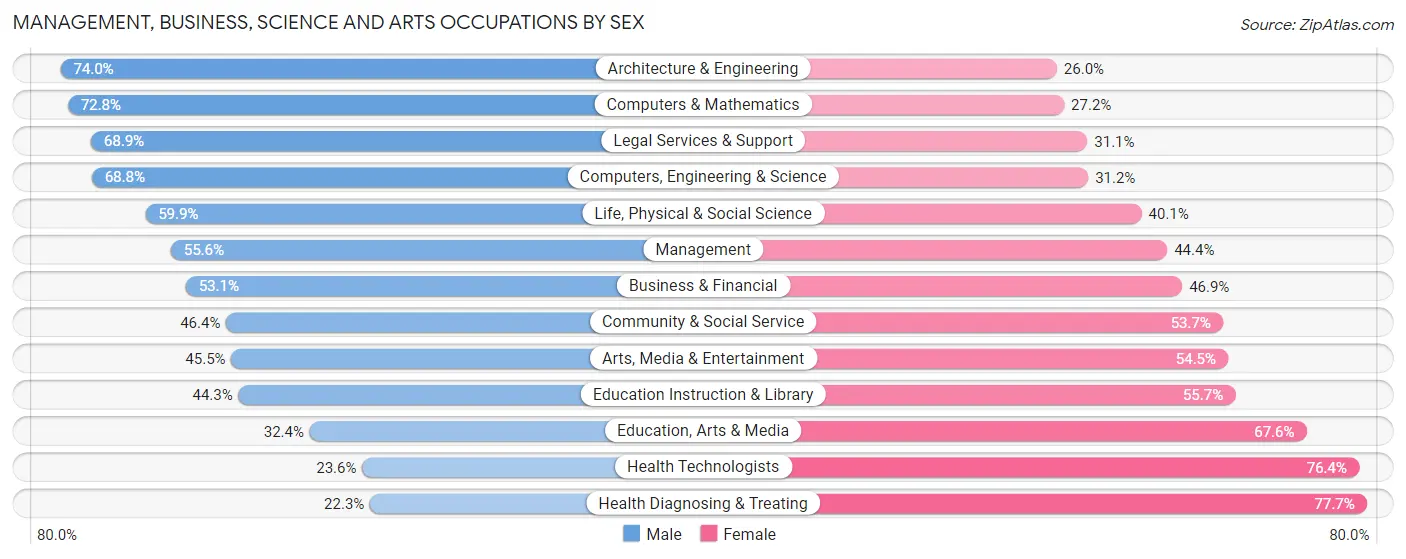
Management, Business, Science and Arts Occupations by Sex
Within the Management, Business, Science and Arts occupations in Evanston, the most male-oriented occupations are Architecture & Engineering (74.0%), Computers & Mathematics (72.8%), and Legal Services & Support (68.9%), while the most female-oriented occupations are Health Diagnosing & Treating (77.7%), Health Technologists (76.4%), and Education, Arts & Media (67.6%).
| Occupation | Male | Female |
| Management | 3,152 (55.6%) | 2,517 (44.4%) |
| Business & Financial | 1,764 (53.1%) | 1,558 (46.9%) |
| Computers, Engineering & Science | 3,176 (68.8%) | 1,441 (31.2%) |
| Computers & Mathematics | 1,697 (72.8%) | 634 (27.2%) |
| Architecture & Engineering | 578 (74.0%) | 203 (26.0%) |
| Life, Physical & Social Science | 901 (59.9%) | 604 (40.1%) |
| Community & Social Service | 4,251 (46.4%) | 4,921 (53.6%) |
| Education, Arts & Media | 311 (32.4%) | 649 (67.6%) |
| Legal Services & Support | 783 (68.9%) | 353 (31.1%) |
| Education Instruction & Library | 2,310 (44.3%) | 2,904 (55.7%) |
| Arts, Media & Entertainment | 847 (45.5%) | 1,015 (54.5%) |
| Health Diagnosing & Treating | 490 (22.3%) | 1,704 (77.7%) |
| Health Technologists | 433 (23.6%) | 1,399 (76.4%) |
| Total (Category) | 12,833 (51.4%) | 12,141 (48.6%) |
| Total (Overall) | 19,929 (51.1%) | 19,059 (48.9%) |
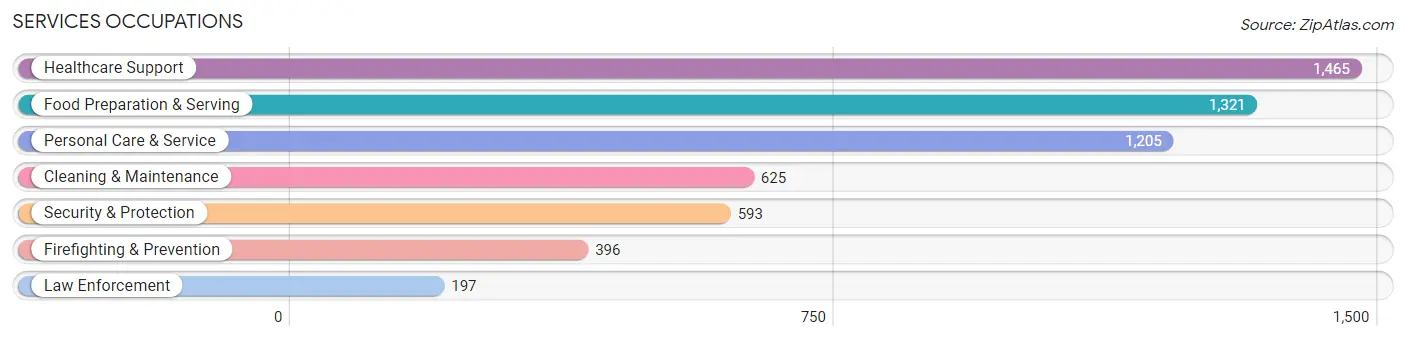
Services Occupations
The most common Services occupations in Evanston are Healthcare Support (1,465 | 3.8%), Food Preparation & Serving (1,321 | 3.4%), Personal Care & Service (1,205 | 3.1%), Cleaning & Maintenance (625 | 1.6%), and Security & Protection (593 | 1.5%).
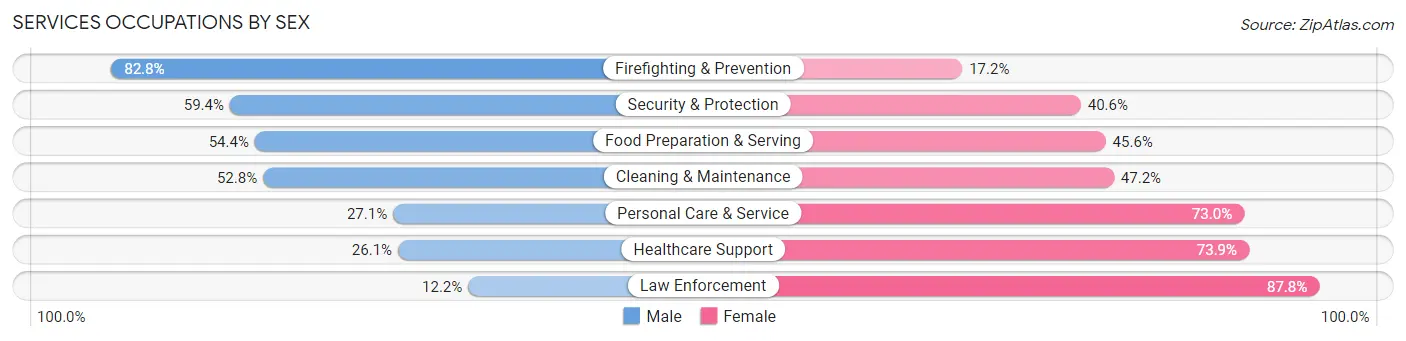
Services Occupations by Sex
Within the Services occupations in Evanston, the most male-oriented occupations are Firefighting & Prevention (82.8%), Security & Protection (59.4%), and Food Preparation & Serving (54.4%), while the most female-oriented occupations are Law Enforcement (87.8%), Healthcare Support (73.9%), and Personal Care & Service (73.0%).
| Occupation | Male | Female |
| Healthcare Support | 382 (26.1%) | 1,083 (73.9%) |
| Security & Protection | 352 (59.4%) | 241 (40.6%) |
| Firefighting & Prevention | 328 (82.8%) | 68 (17.2%) |
| Law Enforcement | 24 (12.2%) | 173 (87.8%) |
| Food Preparation & Serving | 719 (54.4%) | 602 (45.6%) |
| Cleaning & Maintenance | 330 (52.8%) | 295 (47.2%) |
| Personal Care & Service | 326 (27.1%) | 879 (73.0%) |
| Total (Category) | 2,109 (40.5%) | 3,100 (59.5%) |
| Total (Overall) | 19,929 (51.1%) | 19,059 (48.9%) |
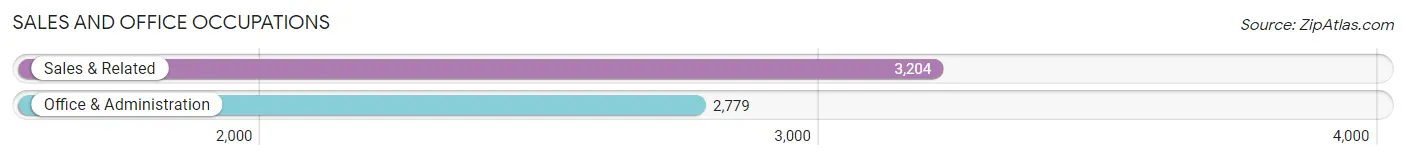
Sales and Office Occupations
The most common Sales and Office occupations in Evanston are Sales & Related (3,204 | 8.2%), and Office & Administration (2,779 | 7.1%).
Sales and Office Occupations by Sex
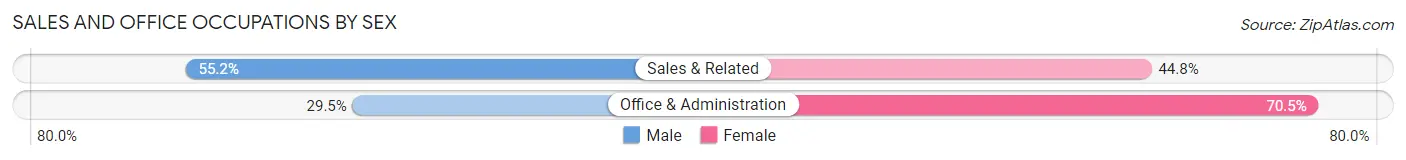
| Occupation | Male | Female |
| Sales & Related | 1,770 (55.2%) | 1,434 (44.8%) |
| Office & Administration | 821 (29.5%) | 1,958 (70.5%) |
| Total (Category) | 2,591 (43.3%) | 3,392 (56.7%) |
| Total (Overall) | 19,929 (51.1%) | 19,059 (48.9%) |
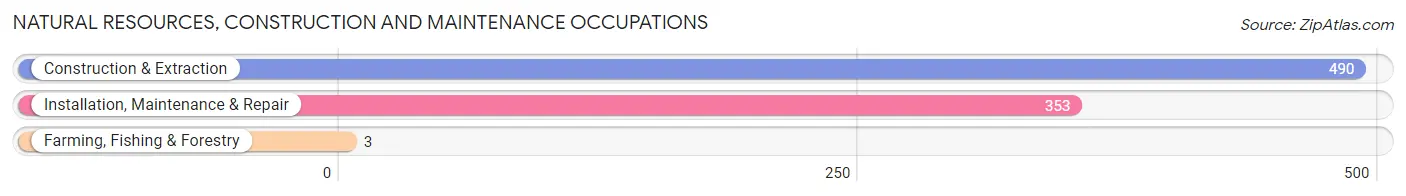
Natural Resources, Construction and Maintenance Occupations
The most common Natural Resources, Construction and Maintenance occupations in Evanston are Construction & Extraction (490 | 1.3%), Installation, Maintenance & Repair (353 | 0.9%), and Farming, Fishing & Forestry (3 | 0.0%).
Natural Resources, Construction and Maintenance Occupations by Sex
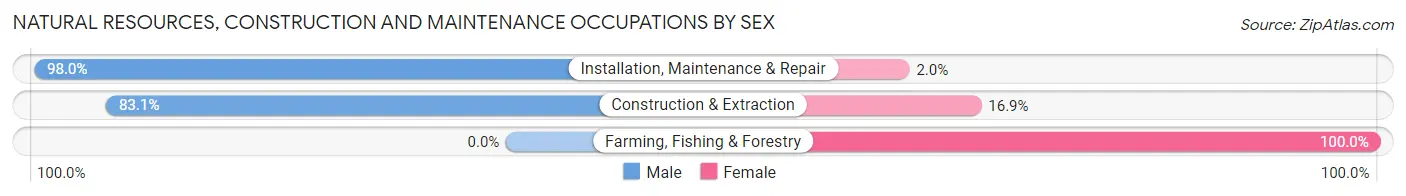
| Occupation | Male | Female |
| Farming, Fishing & Forestry | 0 (0.0%) | 3 (100.0%) |
| Construction & Extraction | 407 (83.1%) | 83 (16.9%) |
| Installation, Maintenance & Repair | 346 (98.0%) | 7 (2.0%) |
| Total (Category) | 753 (89.0%) | 93 (11.0%) |
| Total (Overall) | 19,929 (51.1%) | 19,059 (48.9%) |
Production, Transportation and Moving Occupations
The most common Production, Transportation and Moving occupations in Evanston are Material Moving (801 | 2.1%), Transportation (673 | 1.7%), and Production (502 | 1.3%).
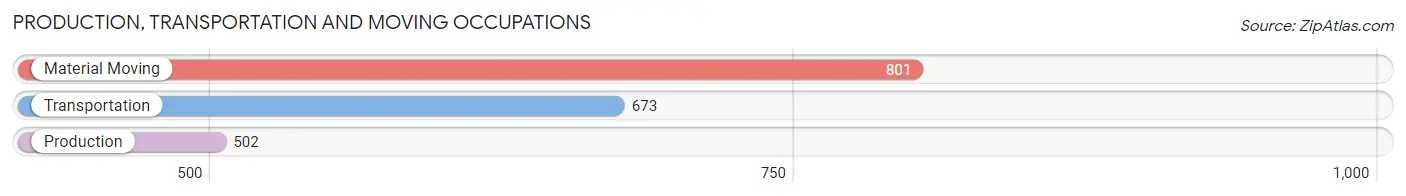
Production, Transportation and Moving Occupations by Sex
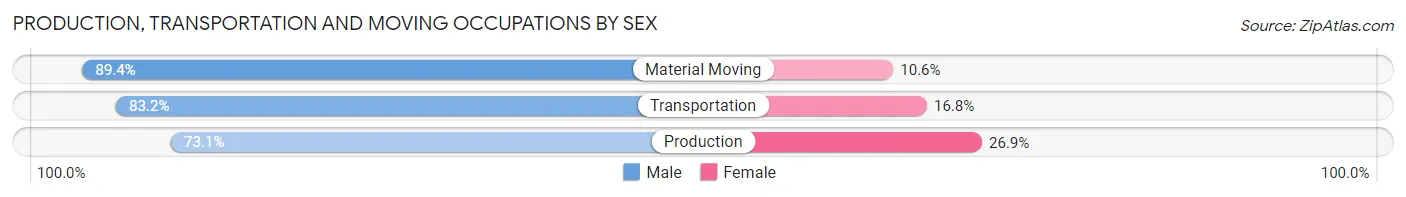
| Occupation | Male | Female |
| Production | 367 (73.1%) | 135 (26.9%) |
| Transportation | 560 (83.2%) | 113 (16.8%) |
| Material Moving | 716 (89.4%) | 85 (10.6%) |
| Total (Category) | 1,643 (83.2%) | 333 (16.9%) |
| Total (Overall) | 19,929 (51.1%) | 19,059 (48.9%) |
Employment Industries by Sex in Evanston
Employment Industries in Evanston
The major employment industries in Evanston include Educational Services (8,242 | 21.1%), Health Care & Social Assistance (6,034 | 15.5%), Professional & Scientific (6,028 | 15.5%), Retail Trade (3,053 | 7.8%), and Manufacturing (2,107 | 5.4%).
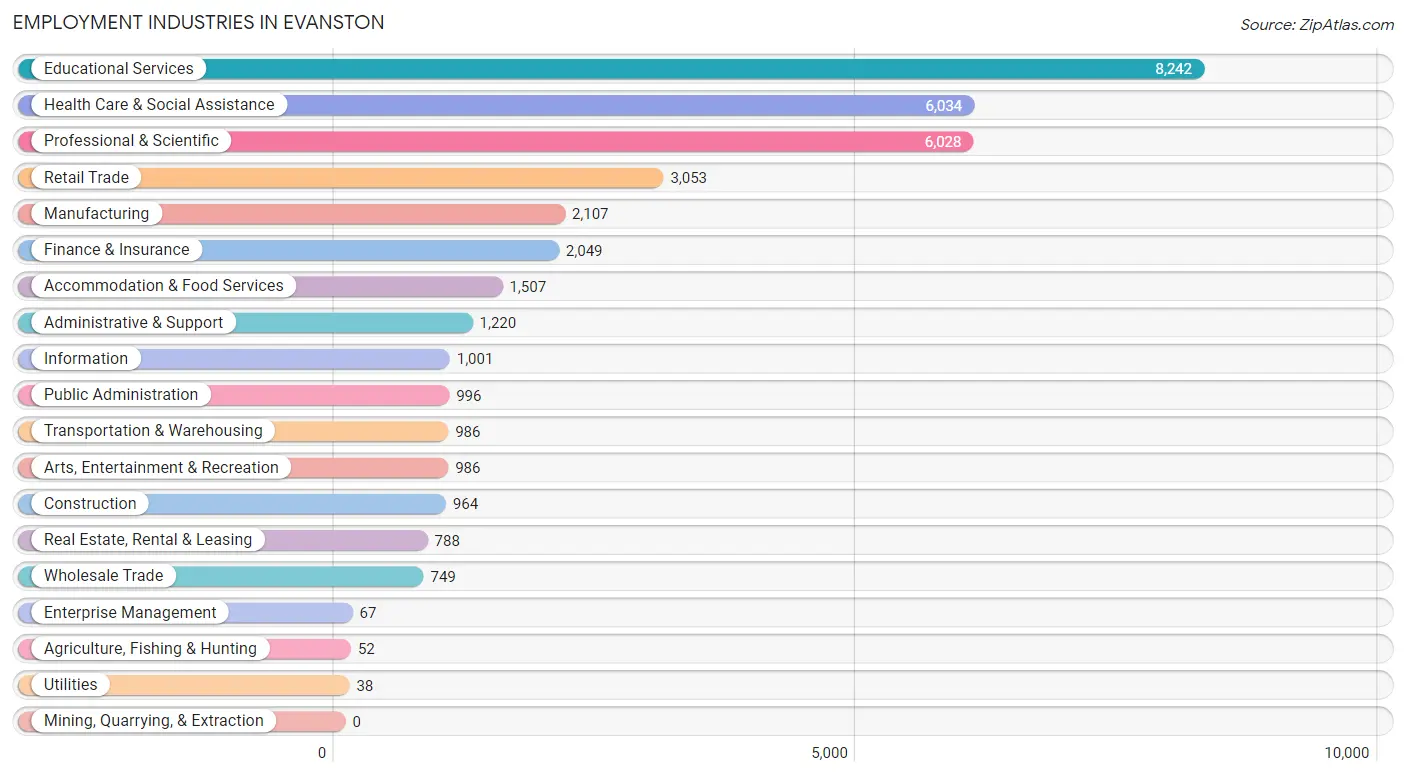
Employment Industries by Sex in Evanston
The Evanston industries that see more men than women are Transportation & Warehousing (81.5%), Wholesale Trade (74.4%), and Administrative & Support (70.1%), whereas the industries that tend to have a higher number of women are Agriculture, Fishing & Hunting (100.0%), Health Care & Social Assistance (73.2%), and Utilities (65.8%).
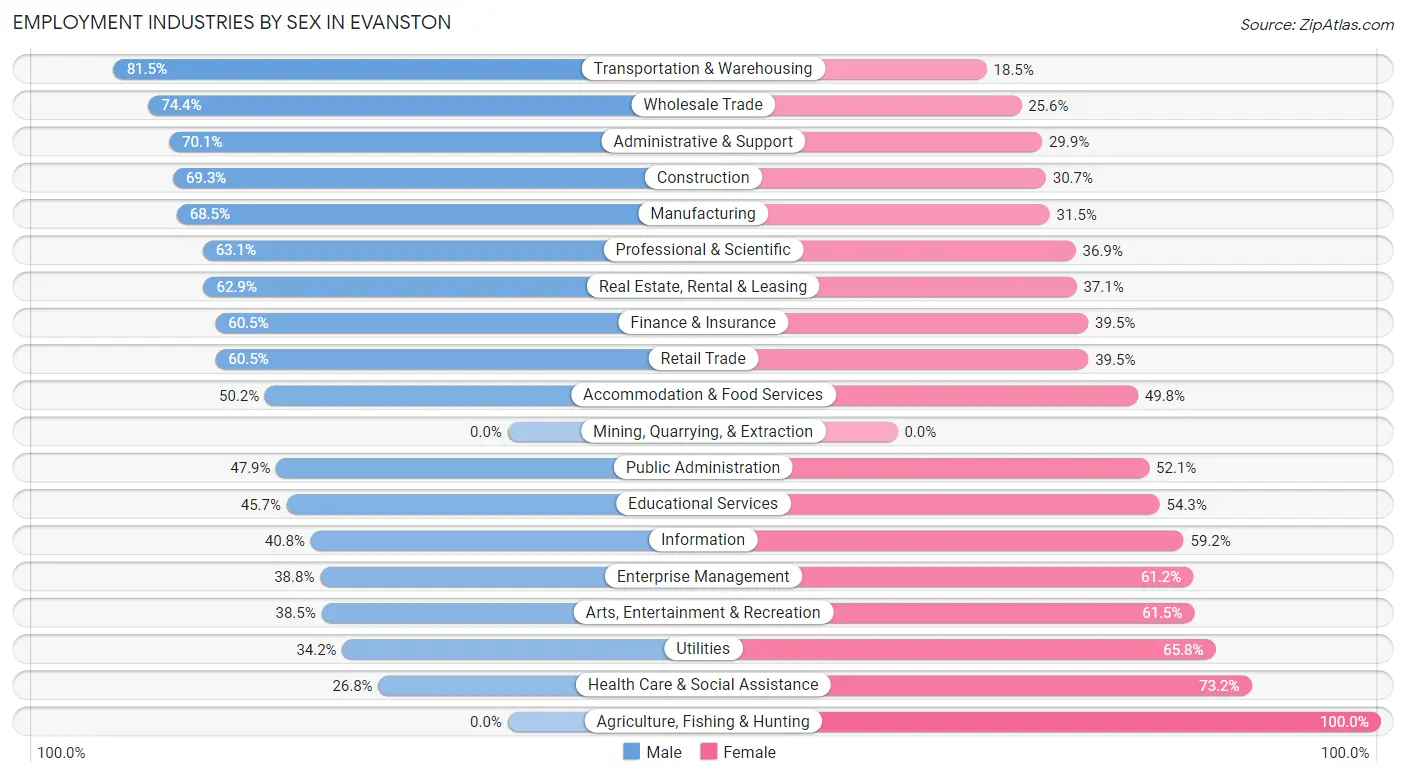
| Industry | Male | Female |
| Agriculture, Fishing & Hunting | 0 (0.0%) | 52 (100.0%) |
| Mining, Quarrying, & Extraction | 0 (0.0%) | 0 (0.0%) |
| Construction | 668 (69.3%) | 296 (30.7%) |
| Manufacturing | 1,443 (68.5%) | 664 (31.5%) |
| Wholesale Trade | 557 (74.4%) | 192 (25.6%) |
| Retail Trade | 1,847 (60.5%) | 1,206 (39.5%) |
| Transportation & Warehousing | 804 (81.5%) | 182 (18.5%) |
| Utilities | 13 (34.2%) | 25 (65.8%) |
| Information | 408 (40.8%) | 593 (59.2%) |
| Finance & Insurance | 1,240 (60.5%) | 809 (39.5%) |
| Real Estate, Rental & Leasing | 496 (62.9%) | 292 (37.1%) |
| Professional & Scientific | 3,805 (63.1%) | 2,223 (36.9%) |
| Enterprise Management | 26 (38.8%) | 41 (61.2%) |
| Administrative & Support | 855 (70.1%) | 365 (29.9%) |
| Educational Services | 3,769 (45.7%) | 4,473 (54.3%) |
| Health Care & Social Assistance | 1,615 (26.8%) | 4,419 (73.2%) |
| Arts, Entertainment & Recreation | 380 (38.5%) | 606 (61.5%) |
| Accommodation & Food Services | 757 (50.2%) | 750 (49.8%) |
| Public Administration | 477 (47.9%) | 519 (52.1%) |
| Total | 19,929 (51.1%) | 19,059 (48.9%) |
Education in Evanston
School Enrollment in Evanston
The most common levels of schooling among the 25,310 students in Evanston are college / undergraduate (9,444 | 37.3%), graduate / professional (4,064 | 16.1%), and elementary school (3,525 | 13.9%).
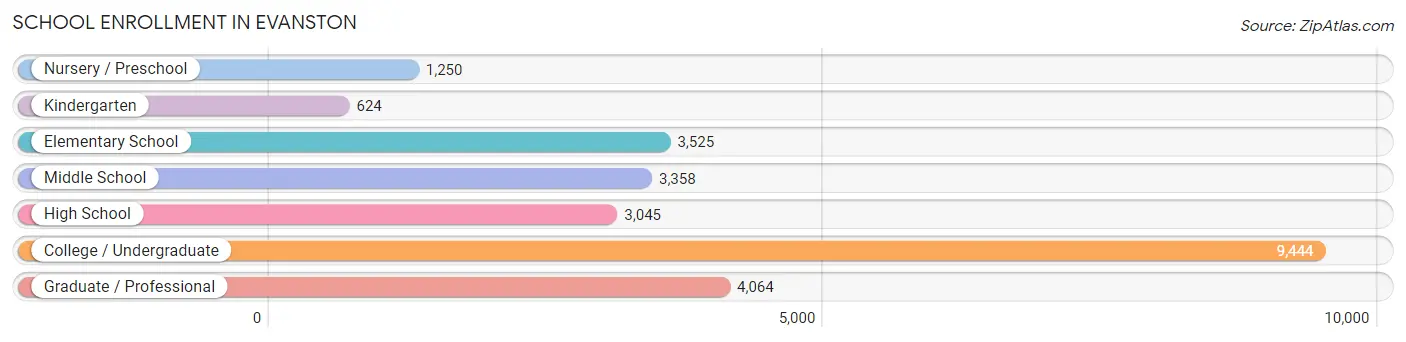
| School Level | # Students | % Students |
| Nursery / Preschool | 1,250 | 4.9% |
| Kindergarten | 624 | 2.5% |
| Elementary School | 3,525 | 13.9% |
| Middle School | 3,358 | 13.3% |
| High School | 3,045 | 12.0% |
| College / Undergraduate | 9,444 | 37.3% |
| Graduate / Professional | 4,064 | 16.1% |
| Total | 25,310 | 100.0% |
School Enrollment by Age by Funding Source in Evanston
Out of a total of 25,310 students who are enrolled in schools in Evanston, 13,591 (53.7%) attend a private institution, while the remaining 11,719 (46.3%) are enrolled in public schools. The age group of 20 to 24 year olds has the highest likelihood of being enrolled in private schools, with 5,218 (84.5% in the age bracket) enrolled. Conversely, the age group of 15 to 17 year olds has the lowest likelihood of being enrolled in a private school, with 1,867 (88.8% in the age bracket) attending a public institution.
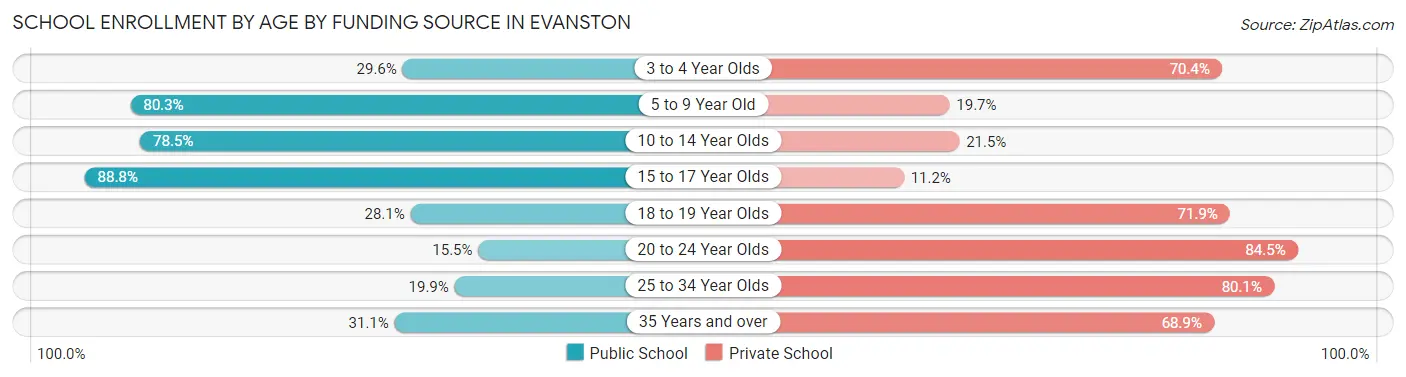
| Age Bracket | Public School | Private School |
| 3 to 4 Year Olds | 261 (29.6%) | 621 (70.4%) |
| 5 to 9 Year Old | 3,272 (80.3%) | 802 (19.7%) |
| 10 to 14 Year Olds | 3,362 (78.5%) | 922 (21.5%) |
| 15 to 17 Year Olds | 1,867 (88.8%) | 235 (11.2%) |
| 18 to 19 Year Olds | 1,061 (28.1%) | 2,713 (71.9%) |
| 20 to 24 Year Olds | 956 (15.5%) | 5,218 (84.5%) |
| 25 to 34 Year Olds | 547 (19.9%) | 2,202 (80.1%) |
| 35 Years and over | 395 (31.1%) | 876 (68.9%) |
| Total | 11,719 (46.3%) | 13,591 (53.7%) |
Educational Attainment by Field of Study in Evanston
Social sciences (5,798 | 14.8%), business (4,781 | 12.2%), literature & languages (3,586 | 9.2%), liberal arts & history (3,129 | 8.0%), and visual & performing arts (2,976 | 7.6%) are the most common fields of study among 39,088 individuals in Evanston who have obtained a bachelor's degree or higher.
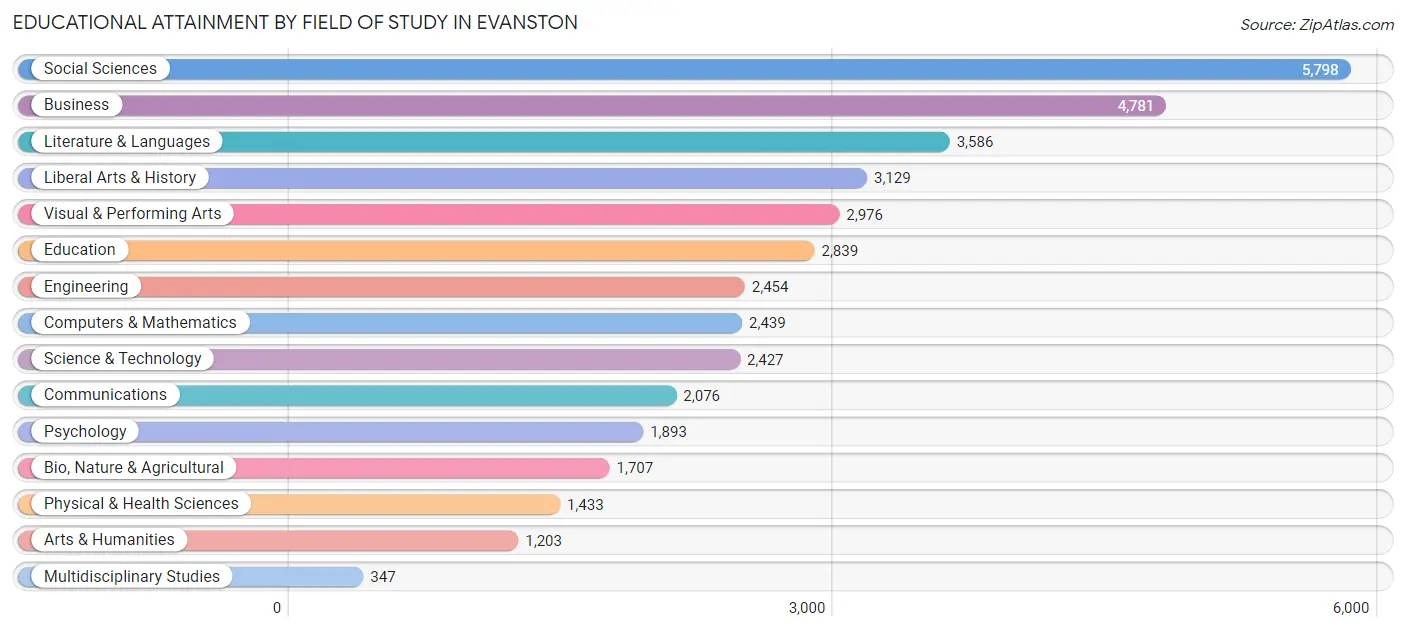
| Field of Study | # Graduates | % Graduates |
| Computers & Mathematics | 2,439 | 6.2% |
| Bio, Nature & Agricultural | 1,707 | 4.4% |
| Physical & Health Sciences | 1,433 | 3.7% |
| Psychology | 1,893 | 4.8% |
| Social Sciences | 5,798 | 14.8% |
| Engineering | 2,454 | 6.3% |
| Multidisciplinary Studies | 347 | 0.9% |
| Science & Technology | 2,427 | 6.2% |
| Business | 4,781 | 12.2% |
| Education | 2,839 | 7.3% |
| Literature & Languages | 3,586 | 9.2% |
| Liberal Arts & History | 3,129 | 8.0% |
| Visual & Performing Arts | 2,976 | 7.6% |
| Communications | 2,076 | 5.3% |
| Arts & Humanities | 1,203 | 3.1% |
| Total | 39,088 | 100.0% |
Transportation & Commute in Evanston
Vehicle Availability by Sex in Evanston
The most prevalent vehicle ownership categories in Evanston are males with 1 vehicle (7,759, accounting for 40.7%) and females with 1 vehicle (7,545, making up 43.6%).
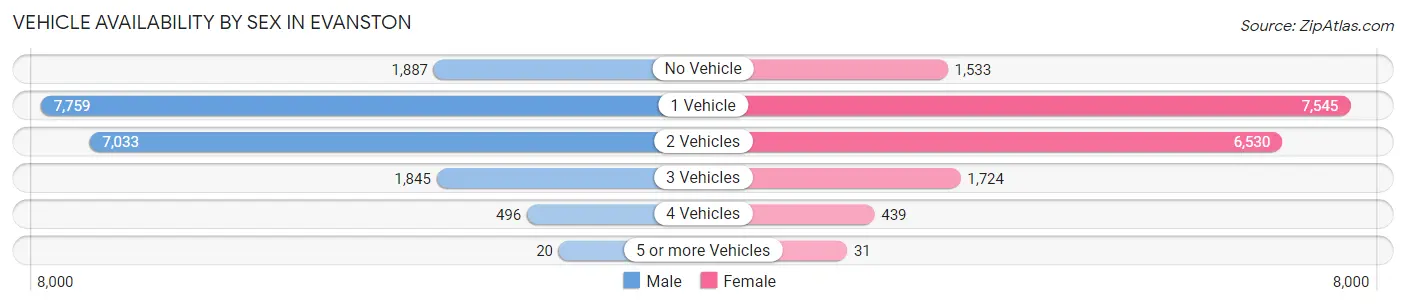
| Vehicles Available | Male | Female |
| No Vehicle | 1,887 (9.9%) | 1,533 (8.6%) |
| 1 Vehicle | 7,759 (40.7%) | 7,545 (42.4%) |
| 2 Vehicles | 7,033 (36.9%) | 6,530 (36.7%) |
| 3 Vehicles | 1,845 (9.7%) | 1,724 (9.7%) |
| 4 Vehicles | 496 (2.6%) | 439 (2.5%) |
| 5 or more Vehicles | 20 (0.1%) | 31 (0.2%) |
| Total | 19,040 (100.0%) | 17,802 (100.0%) |
Commute Time in Evanston
The most frequently occuring commute durations in Evanston are 10 to 14 minutes (4,326 commuters, 14.7%), 45 to 59 minutes (4,000 commuters, 13.6%), and 15 to 19 minutes (3,886 commuters, 13.2%).
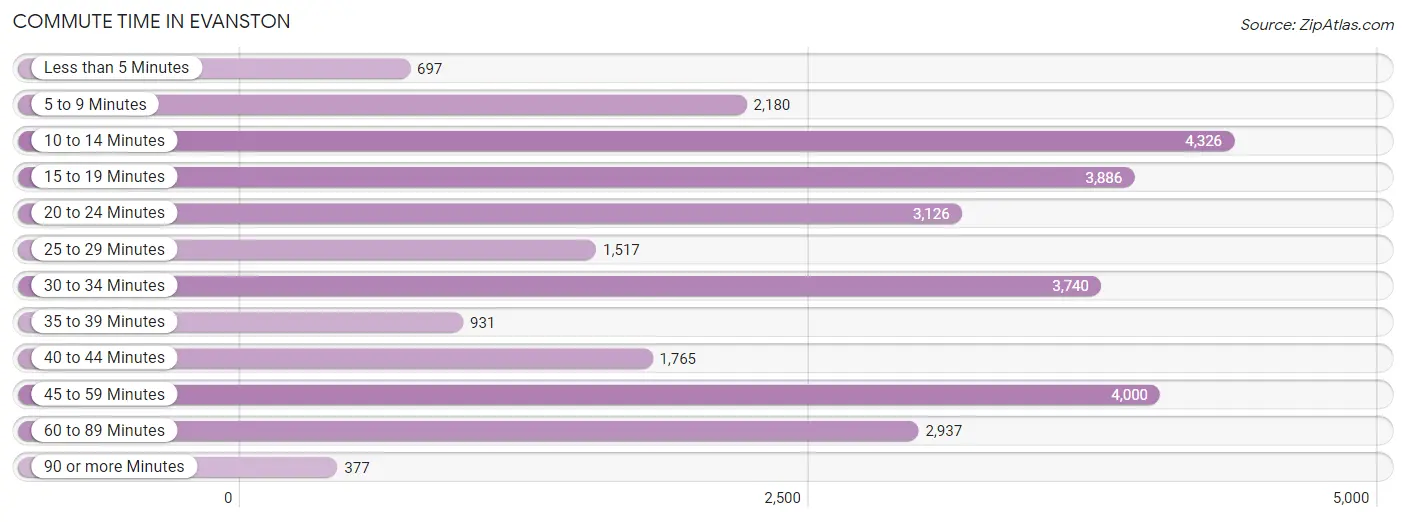
| Commute Time | # Commuters | % Commuters |
| Less than 5 Minutes | 697 | 2.4% |
| 5 to 9 Minutes | 2,180 | 7.4% |
| 10 to 14 Minutes | 4,326 | 14.7% |
| 15 to 19 Minutes | 3,886 | 13.2% |
| 20 to 24 Minutes | 3,126 | 10.6% |
| 25 to 29 Minutes | 1,517 | 5.1% |
| 30 to 34 Minutes | 3,740 | 12.7% |
| 35 to 39 Minutes | 931 | 3.2% |
| 40 to 44 Minutes | 1,765 | 6.0% |
| 45 to 59 Minutes | 4,000 | 13.6% |
| 60 to 89 Minutes | 2,937 | 10.0% |
| 90 or more Minutes | 377 | 1.3% |
Commute Time by Sex in Evanston
The most common commute times in Evanston are 45 to 59 minutes (2,299 commuters, 15.3%) for males and 10 to 14 minutes (2,188 commuters, 15.1%) for females.
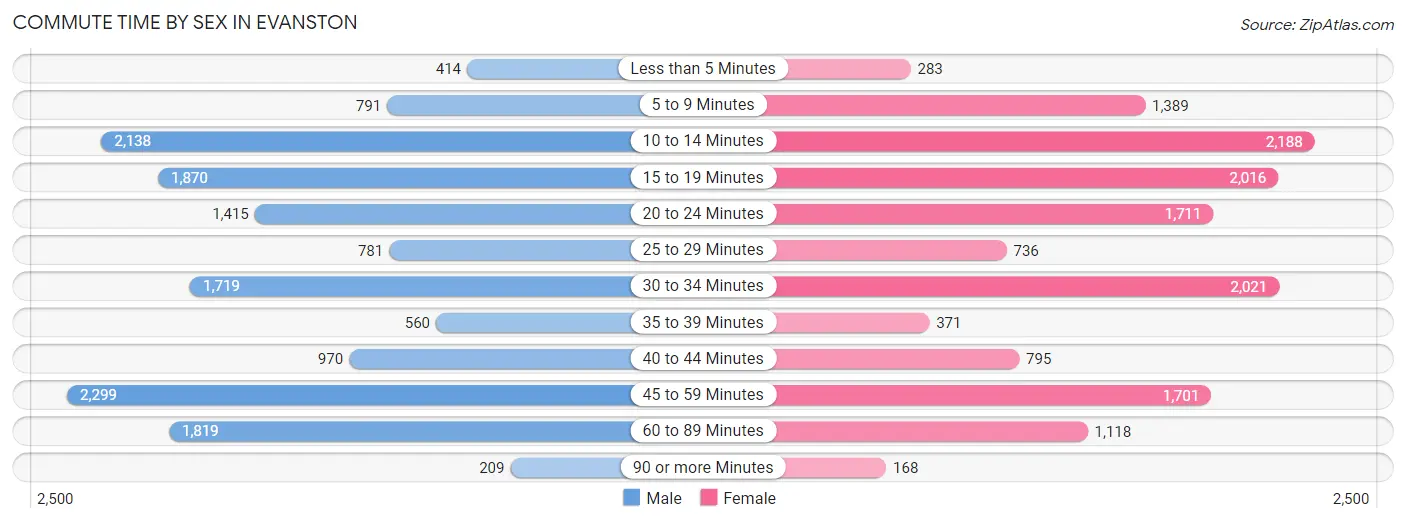
| Commute Time | Male | Female |
| Less than 5 Minutes | 414 (2.8%) | 283 (1.9%) |
| 5 to 9 Minutes | 791 (5.3%) | 1,389 (9.6%) |
| 10 to 14 Minutes | 2,138 (14.3%) | 2,188 (15.1%) |
| 15 to 19 Minutes | 1,870 (12.5%) | 2,016 (13.9%) |
| 20 to 24 Minutes | 1,415 (9.4%) | 1,711 (11.8%) |
| 25 to 29 Minutes | 781 (5.2%) | 736 (5.1%) |
| 30 to 34 Minutes | 1,719 (11.5%) | 2,021 (13.9%) |
| 35 to 39 Minutes | 560 (3.7%) | 371 (2.6%) |
| 40 to 44 Minutes | 970 (6.5%) | 795 (5.5%) |
| 45 to 59 Minutes | 2,299 (15.3%) | 1,701 (11.7%) |
| 60 to 89 Minutes | 1,819 (12.1%) | 1,118 (7.7%) |
| 90 or more Minutes | 209 (1.4%) | 168 (1.2%) |
Time of Departure to Work by Sex in Evanston
The most frequent times of departure to work in Evanston are 7:30 AM to 7:59 AM (2,271, 15.2%) for males and 8:00 AM to 8:29 AM (2,274, 15.7%) for females.
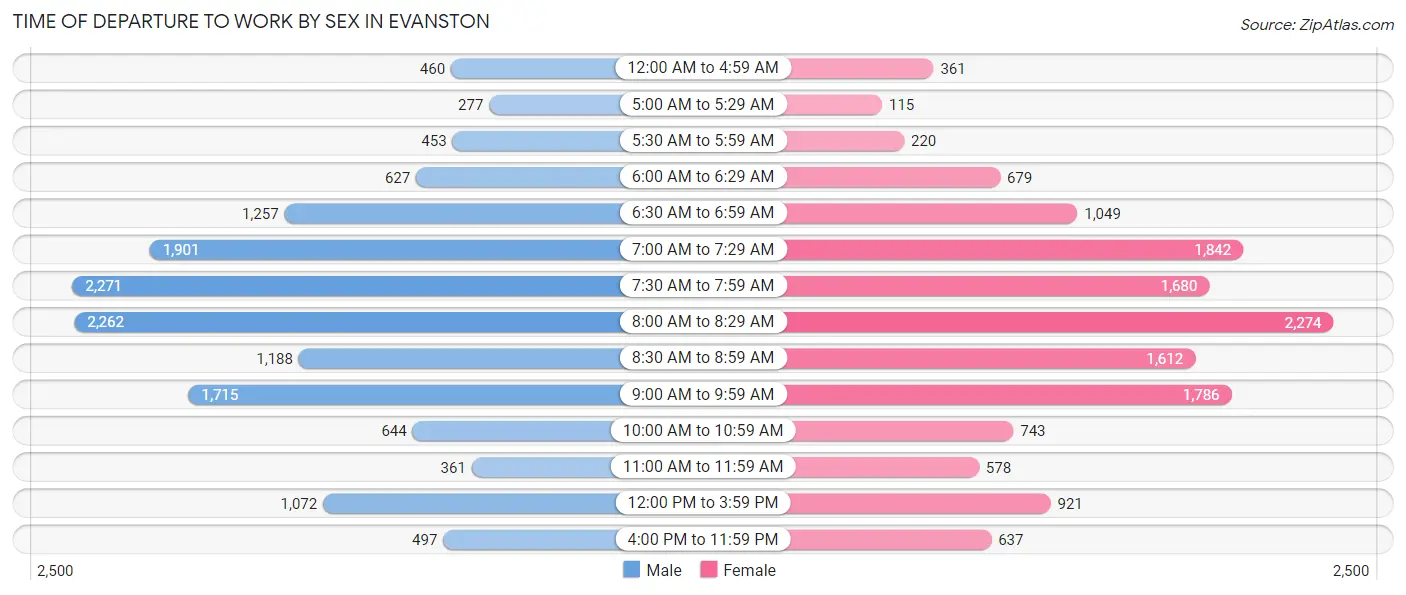
| Time of Departure | Male | Female |
| 12:00 AM to 4:59 AM | 460 (3.1%) | 361 (2.5%) |
| 5:00 AM to 5:29 AM | 277 (1.8%) | 115 (0.8%) |
| 5:30 AM to 5:59 AM | 453 (3.0%) | 220 (1.5%) |
| 6:00 AM to 6:29 AM | 627 (4.2%) | 679 (4.7%) |
| 6:30 AM to 6:59 AM | 1,257 (8.4%) | 1,049 (7.2%) |
| 7:00 AM to 7:29 AM | 1,901 (12.7%) | 1,842 (12.7%) |
| 7:30 AM to 7:59 AM | 2,271 (15.2%) | 1,680 (11.6%) |
| 8:00 AM to 8:29 AM | 2,262 (15.1%) | 2,274 (15.7%) |
| 8:30 AM to 8:59 AM | 1,188 (7.9%) | 1,612 (11.1%) |
| 9:00 AM to 9:59 AM | 1,715 (11.4%) | 1,786 (12.3%) |
| 10:00 AM to 10:59 AM | 644 (4.3%) | 743 (5.1%) |
| 11:00 AM to 11:59 AM | 361 (2.4%) | 578 (4.0%) |
| 12:00 PM to 3:59 PM | 1,072 (7.1%) | 921 (6.4%) |
| 4:00 PM to 11:59 PM | 497 (3.3%) | 637 (4.4%) |
| Total | 14,985 (100.0%) | 14,497 (100.0%) |
Housing Occupancy in Evanston
Occupancy by Ownership in Evanston
Of the total 30,900 dwellings in Evanston, owner-occupied units account for 17,280 (55.9%), while renter-occupied units make up 13,620 (44.1%).
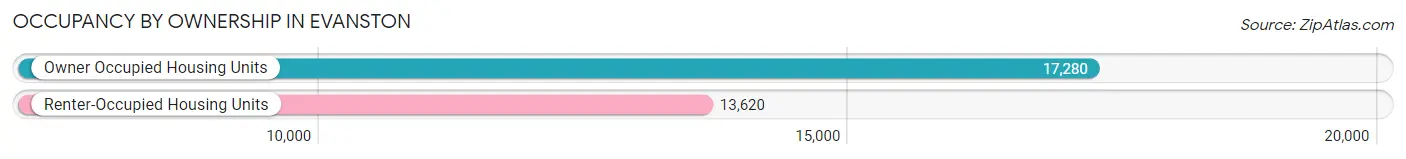
| Occupancy | # Housing Units | % Housing Units |
| Owner Occupied Housing Units | 17,280 | 55.9% |
| Renter-Occupied Housing Units | 13,620 | 44.1% |
| Total Occupied Housing Units | 30,900 | 100.0% |
Occupancy by Household Size in Evanston
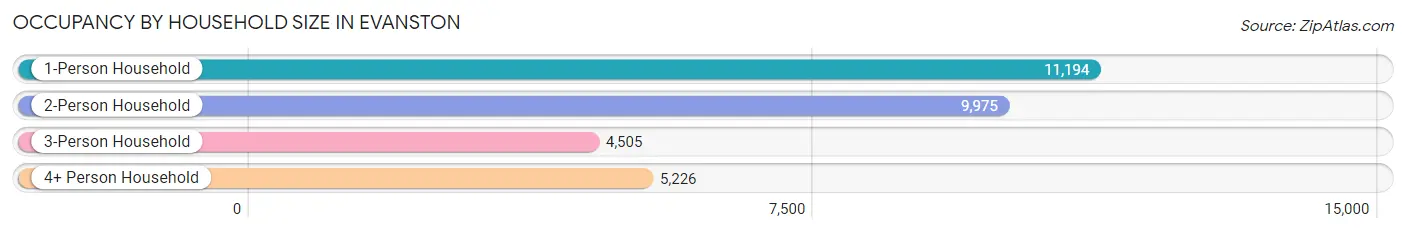
| Household Size | # Housing Units | % Housing Units |
| 1-Person Household | 11,194 | 36.2% |
| 2-Person Household | 9,975 | 32.3% |
| 3-Person Household | 4,505 | 14.6% |
| 4+ Person Household | 5,226 | 16.9% |
| Total Housing Units | 30,900 | 100.0% |
Occupancy by Ownership by Household Size in Evanston
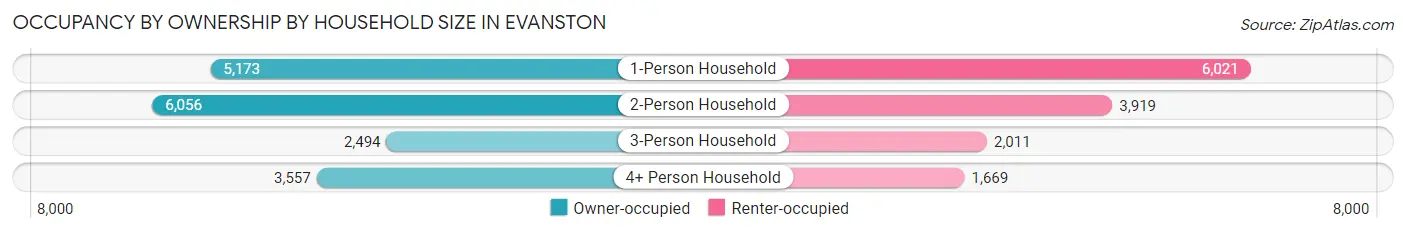
| Household Size | Owner-occupied | Renter-occupied |
| 1-Person Household | 5,173 (46.2%) | 6,021 (53.8%) |
| 2-Person Household | 6,056 (60.7%) | 3,919 (39.3%) |
| 3-Person Household | 2,494 (55.4%) | 2,011 (44.6%) |
| 4+ Person Household | 3,557 (68.1%) | 1,669 (31.9%) |
| Total Housing Units | 17,280 (55.9%) | 13,620 (44.1%) |
Occupancy by Educational Attainment in Evanston
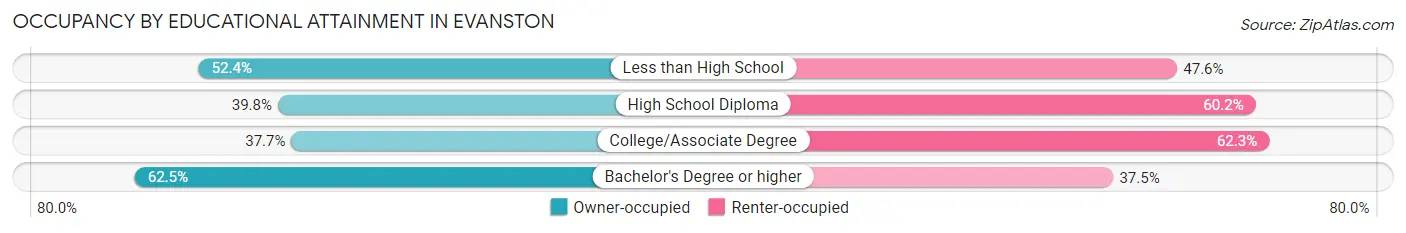
| Household Size | Owner-occupied | Renter-occupied |
| Less than High School | 395 (52.4%) | 359 (47.6%) |
| High School Diploma | 1,122 (39.8%) | 1,694 (60.2%) |
| College/Associate Degree | 2,010 (37.7%) | 3,322 (62.3%) |
| Bachelor's Degree or higher | 13,753 (62.5%) | 8,245 (37.5%) |
Occupancy by Age of Householder in Evanston
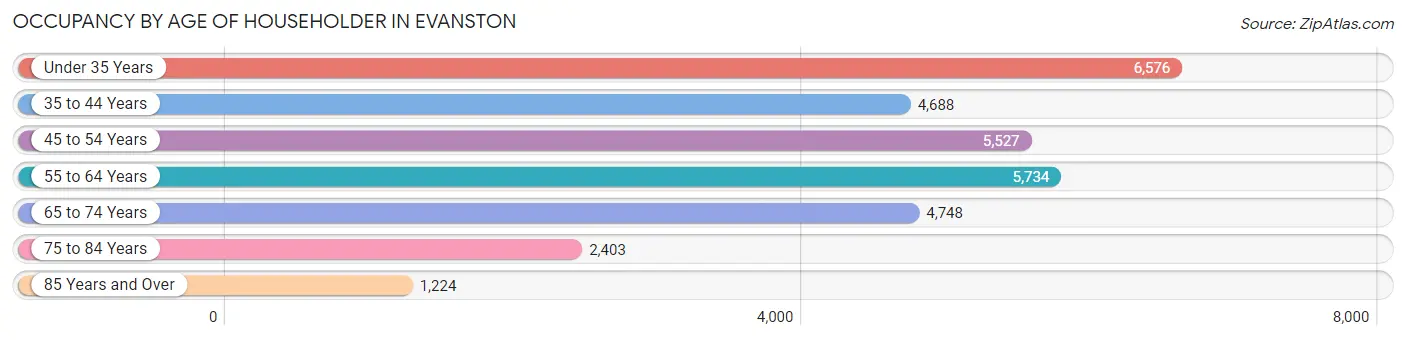
| Age Bracket | # Households | % Households |
| Under 35 Years | 6,576 | 21.3% |
| 35 to 44 Years | 4,688 | 15.2% |
| 45 to 54 Years | 5,527 | 17.9% |
| 55 to 64 Years | 5,734 | 18.6% |
| 65 to 74 Years | 4,748 | 15.4% |
| 75 to 84 Years | 2,403 | 7.8% |
| 85 Years and Over | 1,224 | 4.0% |
| Total | 30,900 | 100.0% |
Housing Finances in Evanston
Median Income by Occupancy in Evanston
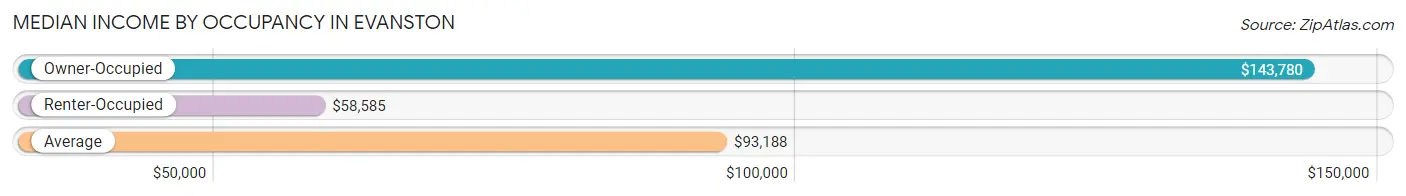
| Occupancy Type | # Households | Median Income |
| Owner-Occupied | 17,280 (55.9%) | $143,780 |
| Renter-Occupied | 13,620 (44.1%) | $58,585 |
| Average | 30,900 (100.0%) | $93,188 |
Occupancy by Householder Income Bracket in Evanston
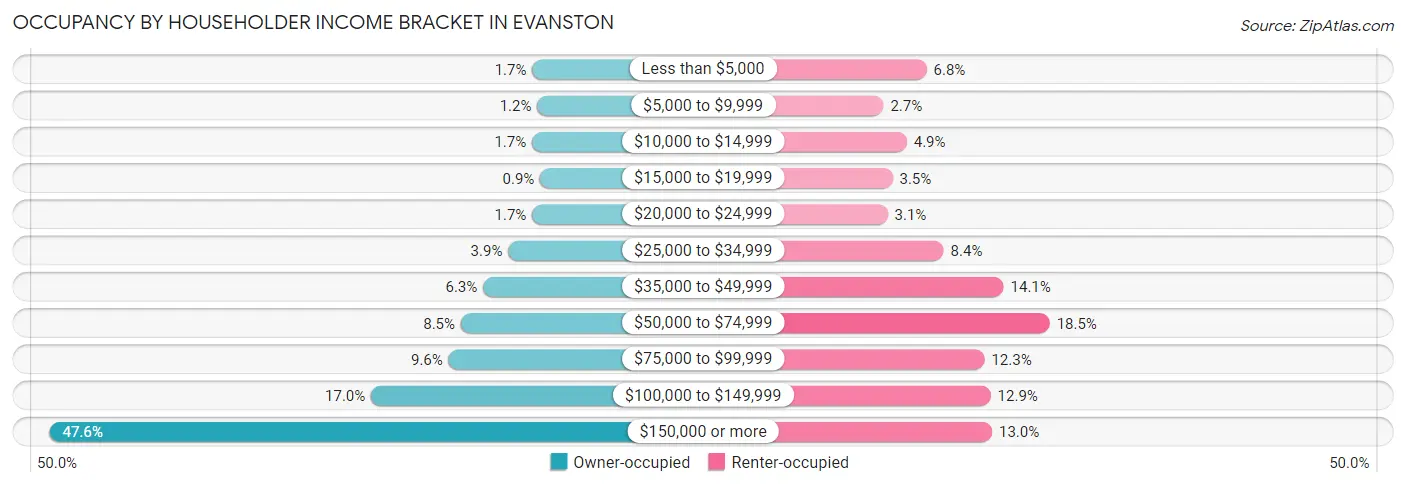
| Income Bracket | Owner-occupied | Renter-occupied |
| Less than $5,000 | 285 (1.7%) | 922 (6.8%) |
| $5,000 to $9,999 | 203 (1.2%) | 362 (2.7%) |
| $10,000 to $14,999 | 288 (1.7%) | 664 (4.9%) |
| $15,000 to $19,999 | 156 (0.9%) | 479 (3.5%) |
| $20,000 to $24,999 | 287 (1.7%) | 416 (3.0%) |
| $25,000 to $34,999 | 680 (3.9%) | 1,143 (8.4%) |
| $35,000 to $49,999 | 1,093 (6.3%) | 1,920 (14.1%) |
| $50,000 to $74,999 | 1,460 (8.5%) | 2,518 (18.5%) |
| $75,000 to $99,999 | 1,662 (9.6%) | 1,672 (12.3%) |
| $100,000 to $149,999 | 2,937 (17.0%) | 1,753 (12.9%) |
| $150,000 or more | 8,229 (47.6%) | 1,771 (13.0%) |
| Total | 17,280 (100.0%) | 13,620 (100.0%) |
Monthly Housing Cost Tiers in Evanston

| Monthly Cost | Owner-occupied | Renter-occupied |
| Less than $300 | 500 (2.9%) | 203 (1.5%) |
| $300 to $499 | 412 (2.4%) | 474 (3.5%) |
| $500 to $799 | 1,162 (6.7%) | 234 (1.7%) |
| $800 to $999 | 793 (4.6%) | 520 (3.8%) |
| $1,000 to $1,499 | 2,736 (15.8%) | 4,274 (31.4%) |
| $1,500 to $1,999 | 2,570 (14.9%) | 3,361 (24.7%) |
| $2,000 to $2,499 | 2,441 (14.1%) | 2,168 (15.9%) |
| $2,500 to $2,999 | 1,731 (10.0%) | 866 (6.4%) |
| $3,000 or more | 4,935 (28.6%) | 989 (7.3%) |
| Total | 17,280 (100.0%) | 13,620 (100.0%) |
Physical Housing Characteristics in Evanston
Housing Structures in Evanston
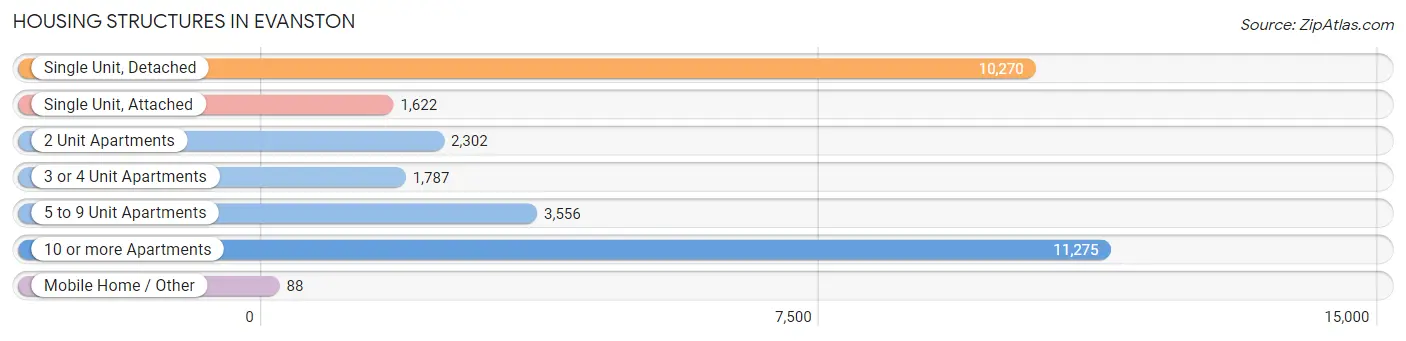
| Structure Type | # Housing Units | % Housing Units |
| Single Unit, Detached | 10,270 | 33.2% |
| Single Unit, Attached | 1,622 | 5.2% |
| 2 Unit Apartments | 2,302 | 7.4% |
| 3 or 4 Unit Apartments | 1,787 | 5.8% |
| 5 to 9 Unit Apartments | 3,556 | 11.5% |
| 10 or more Apartments | 11,275 | 36.5% |
| Mobile Home / Other | 88 | 0.3% |
| Total | 30,900 | 100.0% |
Housing Structures by Occupancy in Evanston
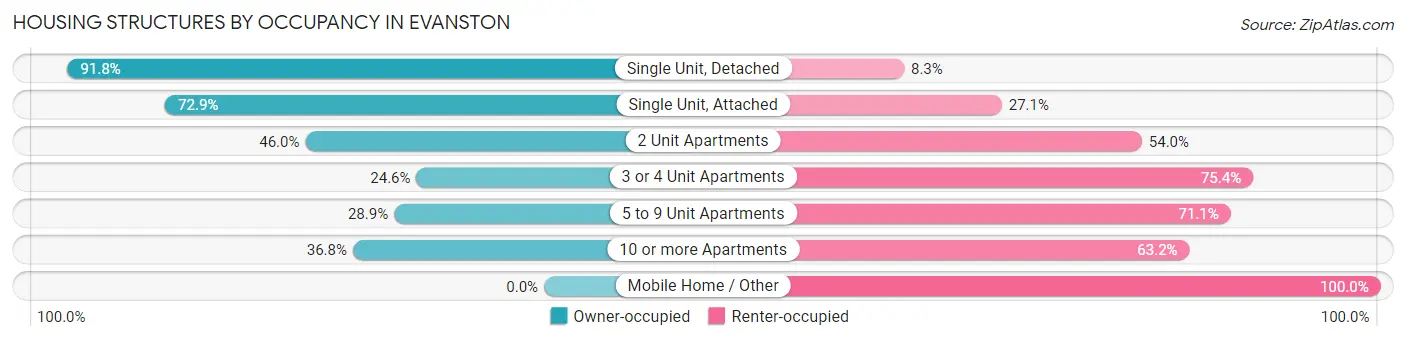
| Structure Type | Owner-occupied | Renter-occupied |
| Single Unit, Detached | 9,423 (91.7%) | 847 (8.3%) |
| Single Unit, Attached | 1,183 (72.9%) | 439 (27.1%) |
| 2 Unit Apartments | 1,058 (46.0%) | 1,244 (54.0%) |
| 3 or 4 Unit Apartments | 439 (24.6%) | 1,348 (75.4%) |
| 5 to 9 Unit Apartments | 1,027 (28.9%) | 2,529 (71.1%) |
| 10 or more Apartments | 4,150 (36.8%) | 7,125 (63.2%) |
| Mobile Home / Other | 0 (0.0%) | 88 (100.0%) |
| Total | 17,280 (55.9%) | 13,620 (44.1%) |
Housing Structures by Number of Rooms in Evanston
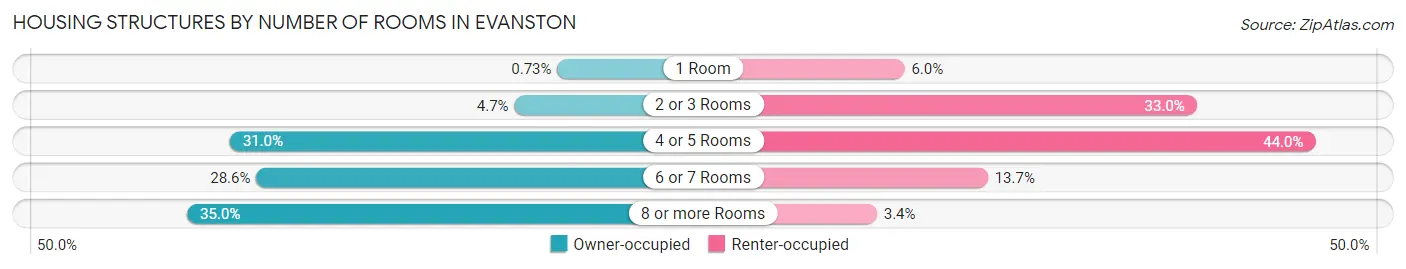
| Number of Rooms | Owner-occupied | Renter-occupied |
| 1 Room | 126 (0.7%) | 813 (6.0%) |
| 2 or 3 Rooms | 812 (4.7%) | 4,493 (33.0%) |
| 4 or 5 Rooms | 5,360 (31.0%) | 5,988 (44.0%) |
| 6 or 7 Rooms | 4,937 (28.6%) | 1,862 (13.7%) |
| 8 or more Rooms | 6,045 (35.0%) | 464 (3.4%) |
| Total | 17,280 (100.0%) | 13,620 (100.0%) |
Housing Structure by Heating Type in Evanston
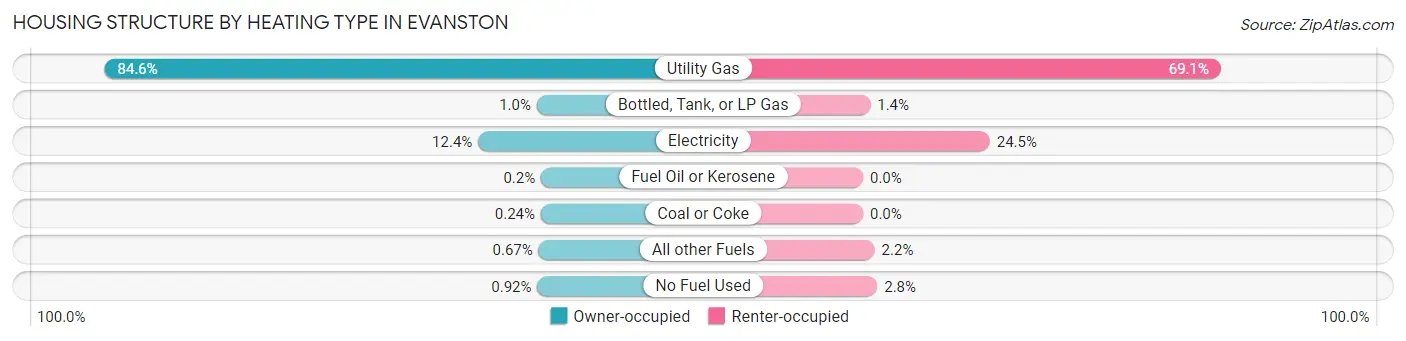
| Heating Type | Owner-occupied | Renter-occupied |
| Utility Gas | 14,615 (84.6%) | 9,414 (69.1%) |
| Bottled, Tank, or LP Gas | 178 (1.0%) | 191 (1.4%) |
| Electricity | 2,136 (12.4%) | 3,335 (24.5%) |
| Fuel Oil or Kerosene | 35 (0.2%) | 0 (0.0%) |
| Coal or Coke | 41 (0.2%) | 0 (0.0%) |
| All other Fuels | 116 (0.7%) | 305 (2.2%) |
| No Fuel Used | 159 (0.9%) | 375 (2.8%) |
| Total | 17,280 (100.0%) | 13,620 (100.0%) |
Household Vehicle Usage in Evanston
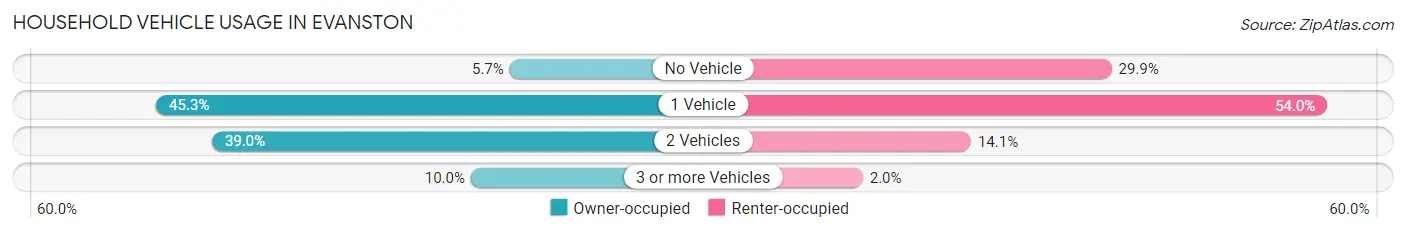
| Vehicles per Household | Owner-occupied | Renter-occupied |
| No Vehicle | 980 (5.7%) | 4,068 (29.9%) |
| 1 Vehicle | 7,825 (45.3%) | 7,357 (54.0%) |
| 2 Vehicles | 6,743 (39.0%) | 1,923 (14.1%) |
| 3 or more Vehicles | 1,732 (10.0%) | 272 (2.0%) |
| Total | 17,280 (100.0%) | 13,620 (100.0%) |
Real Estate & Mortgages in Evanston
Real Estate and Mortgage Overview in Evanston
| Characteristic | Without Mortgage | With Mortgage |
| Housing Units | 6,480 | 10,800 |
| Median Property Value | $423,000 | $471,900 |
| Median Household Income | $101,844 | $5,882 |
| Monthly Housing Costs | $1,138 | $4,675 |
| Real Estate Taxes | $7,710 | $79 |
Property Value by Mortgage Status in Evanston
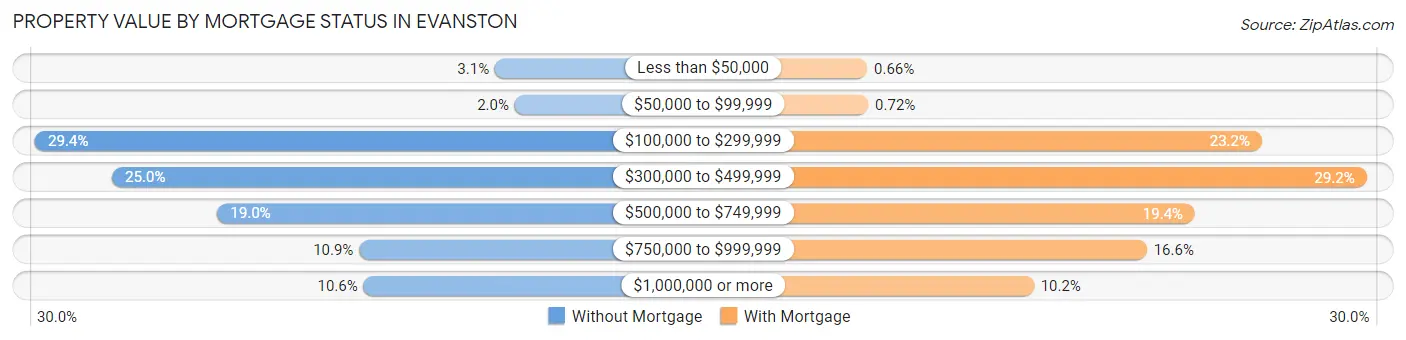
| Property Value | Without Mortgage | With Mortgage |
| Less than $50,000 | 202 (3.1%) | 71 (0.7%) |
| $50,000 to $99,999 | 129 (2.0%) | 78 (0.7%) |
| $100,000 to $299,999 | 1,905 (29.4%) | 2,507 (23.2%) |
| $300,000 to $499,999 | 1,620 (25.0%) | 3,154 (29.2%) |
| $500,000 to $749,999 | 1,230 (19.0%) | 2,094 (19.4%) |
| $750,000 to $999,999 | 705 (10.9%) | 1,797 (16.6%) |
| $1,000,000 or more | 689 (10.6%) | 1,099 (10.2%) |
| Total | 6,480 (100.0%) | 10,800 (100.0%) |
Household Income by Mortgage Status in Evanston
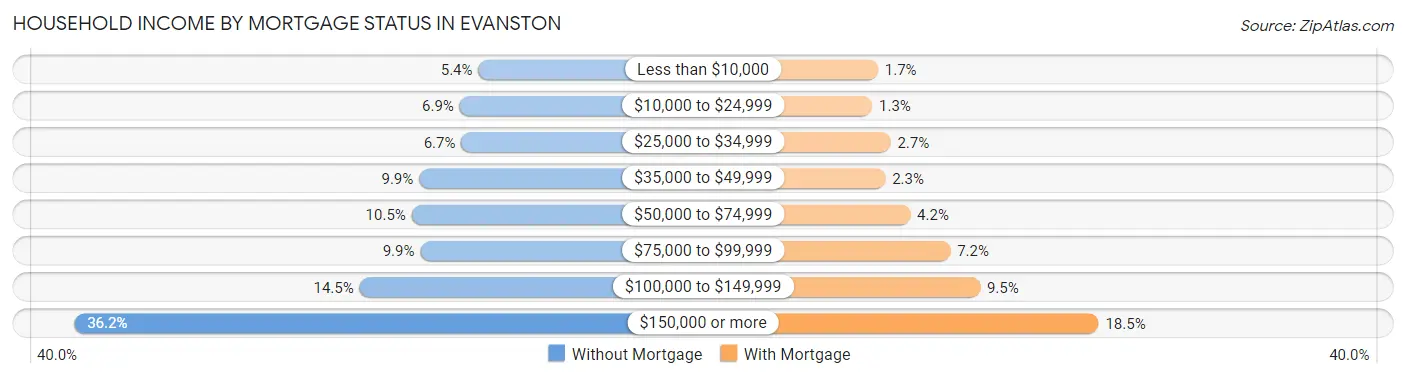
| Household Income | Without Mortgage | With Mortgage |
| Less than $10,000 | 352 (5.4%) | 184 (1.7%) |
| $10,000 to $24,999 | 444 (6.9%) | 136 (1.3%) |
| $25,000 to $34,999 | 436 (6.7%) | 287 (2.7%) |
| $35,000 to $49,999 | 644 (9.9%) | 244 (2.3%) |
| $50,000 to $74,999 | 681 (10.5%) | 449 (4.2%) |
| $75,000 to $99,999 | 638 (9.9%) | 779 (7.2%) |
| $100,000 to $149,999 | 938 (14.5%) | 1,024 (9.5%) |
| $150,000 or more | 2,347 (36.2%) | 1,999 (18.5%) |
| Total | 6,480 (100.0%) | 10,800 (100.0%) |
Property Value to Household Income Ratio in Evanston
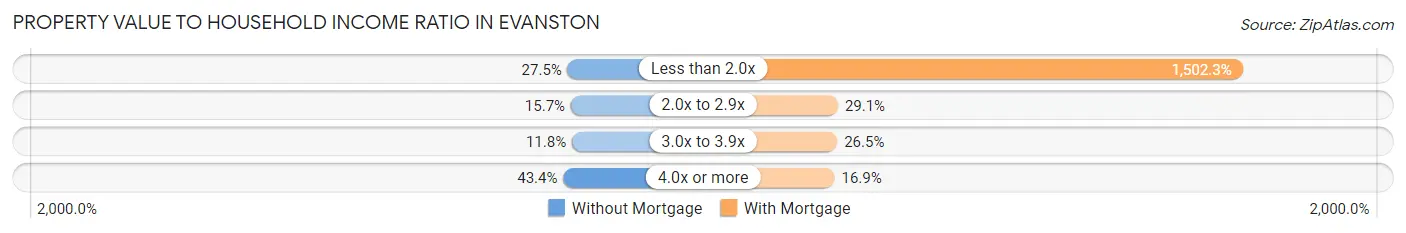
| Value-to-Income Ratio | Without Mortgage | With Mortgage |
| Less than 2.0x | 1,781 (27.5%) | 162,245 (1,502.3%) |
| 2.0x to 2.9x | 1,016 (15.7%) | 3,142 (29.1%) |
| 3.0x to 3.9x | 767 (11.8%) | 2,859 (26.5%) |
| 4.0x or more | 2,814 (43.4%) | 1,824 (16.9%) |
| Total | 6,480 (100.0%) | 10,800 (100.0%) |
Real Estate Taxes by Mortgage Status in Evanston
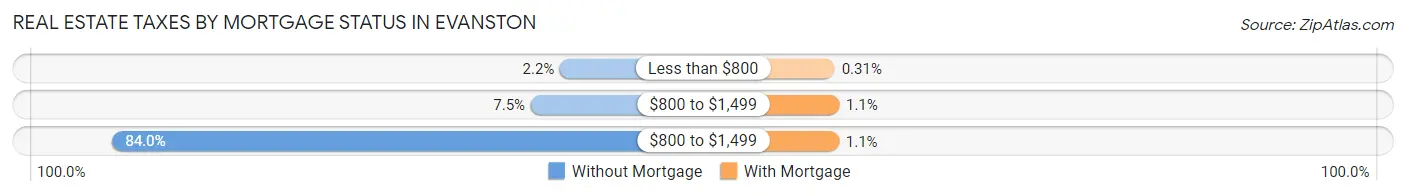
| Property Taxes | Without Mortgage | With Mortgage |
| Less than $800 | 141 (2.2%) | 34 (0.3%) |
| $800 to $1,499 | 487 (7.5%) | 118 (1.1%) |
| $800 to $1,499 | 5,442 (84.0%) | 115 (1.1%) |
| Total | 6,480 (100.0%) | 10,800 (100.0%) |
Health & Disability in Evanston
Health Insurance Coverage by Age in Evanston
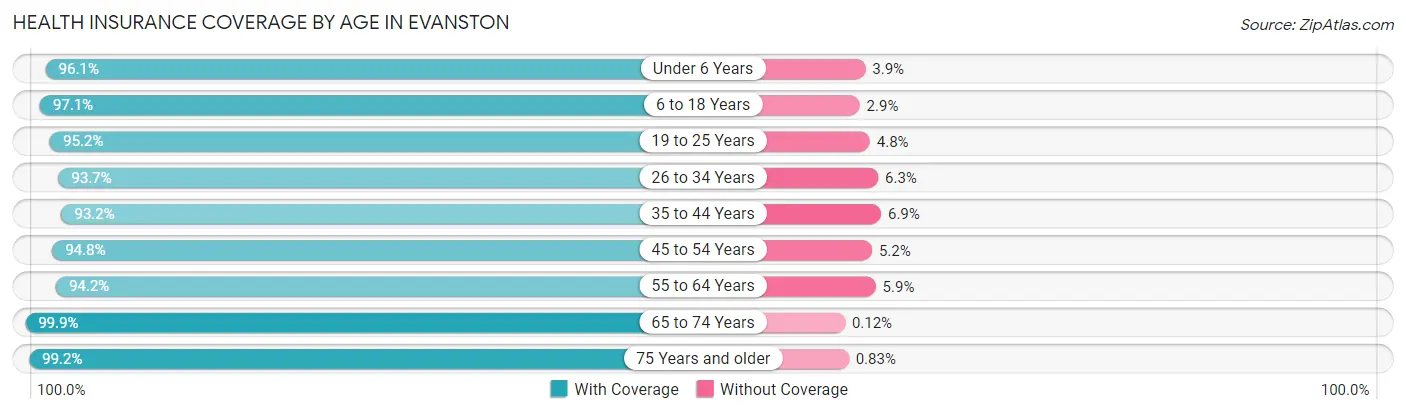
| Age Bracket | With Coverage | Without Coverage |
| Under 6 Years | 4,163 (96.1%) | 170 (3.9%) |
| 6 to 18 Years | 11,470 (97.1%) | 338 (2.9%) |
| 19 to 25 Years | 10,770 (95.2%) | 538 (4.8%) |
| 26 to 34 Years | 8,273 (93.7%) | 556 (6.3%) |
| 35 to 44 Years | 8,434 (93.1%) | 620 (6.9%) |
| 45 to 54 Years | 8,498 (94.8%) | 462 (5.2%) |
| 55 to 64 Years | 8,560 (94.2%) | 532 (5.9%) |
| 65 to 74 Years | 7,678 (99.9%) | 9 (0.1%) |
| 75 Years and older | 4,805 (99.2%) | 40 (0.8%) |
| Total | 72,651 (95.7%) | 3,265 (4.3%) |
Health Insurance Coverage by Citizenship Status in Evanston
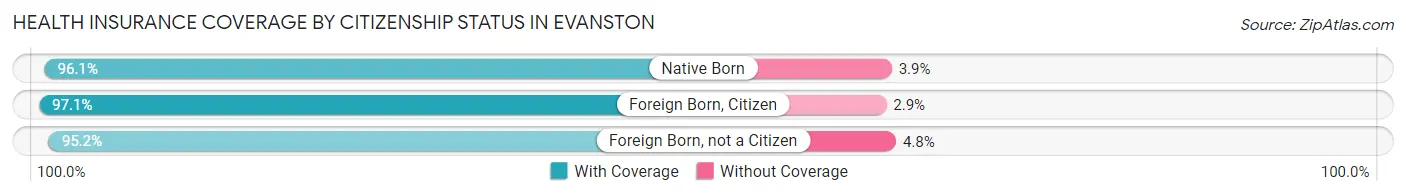
| Citizenship Status | With Coverage | Without Coverage |
| Native Born | 4,163 (96.1%) | 170 (3.9%) |
| Foreign Born, Citizen | 11,470 (97.1%) | 338 (2.9%) |
| Foreign Born, not a Citizen | 10,770 (95.2%) | 538 (4.8%) |
Health Insurance Coverage by Household Income in Evanston
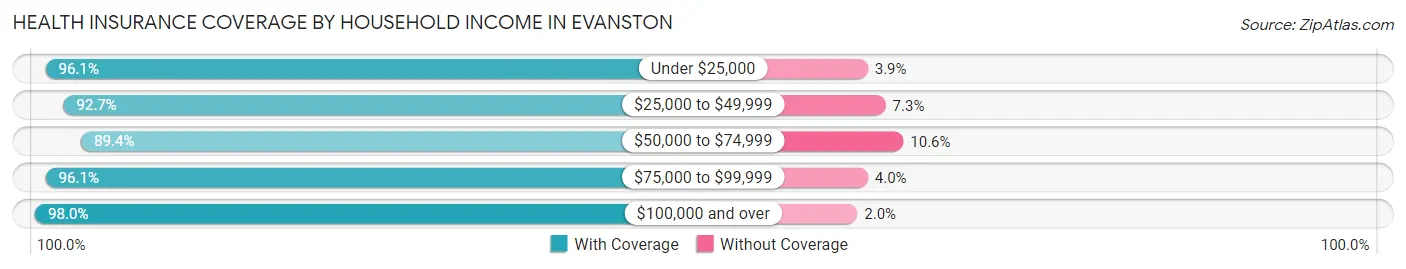
| Household Income | With Coverage | Without Coverage |
| Under $25,000 | 6,255 (96.1%) | 256 (3.9%) |
| $25,000 to $49,999 | 7,956 (92.7%) | 625 (7.3%) |
| $50,000 to $74,999 | 6,897 (89.4%) | 818 (10.6%) |
| $75,000 to $99,999 | 7,860 (96.1%) | 323 (4.0%) |
| $100,000 and over | 38,468 (98.0%) | 773 (2.0%) |
Public vs Private Health Insurance Coverage by Age in Evanston
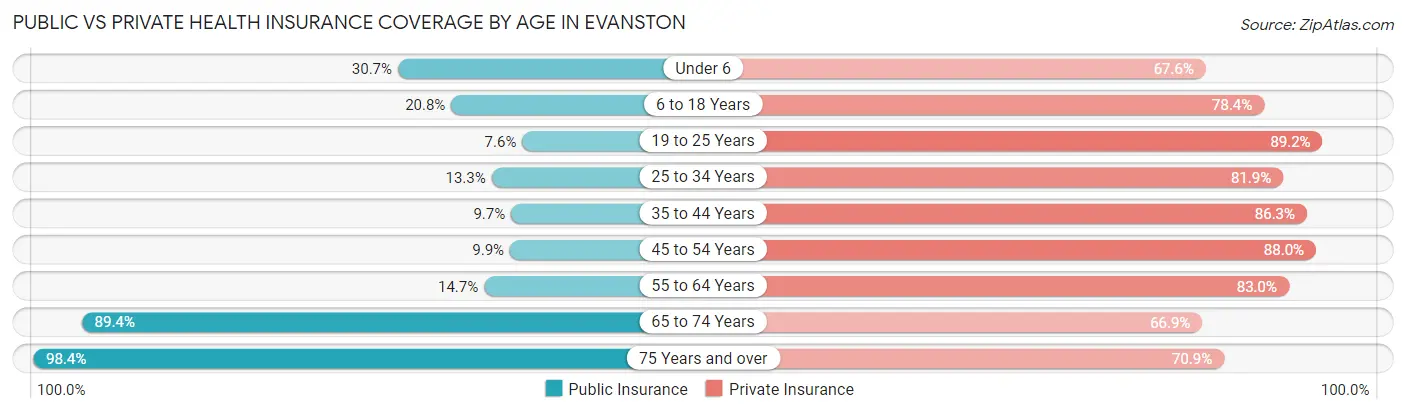
| Age Bracket | Public Insurance | Private Insurance |
| Under 6 | 1,331 (30.7%) | 2,927 (67.5%) |
| 6 to 18 Years | 2,458 (20.8%) | 9,255 (78.4%) |
| 19 to 25 Years | 863 (7.6%) | 10,088 (89.2%) |
| 25 to 34 Years | 1,176 (13.3%) | 7,230 (81.9%) |
| 35 to 44 Years | 879 (9.7%) | 7,815 (86.3%) |
| 45 to 54 Years | 889 (9.9%) | 7,885 (88.0%) |
| 55 to 64 Years | 1,338 (14.7%) | 7,544 (83.0%) |
| 65 to 74 Years | 6,873 (89.4%) | 5,142 (66.9%) |
| 75 Years and over | 4,769 (98.4%) | 3,437 (70.9%) |
| Total | 20,576 (27.1%) | 61,323 (80.8%) |
Disability Status by Sex by Age in Evanston
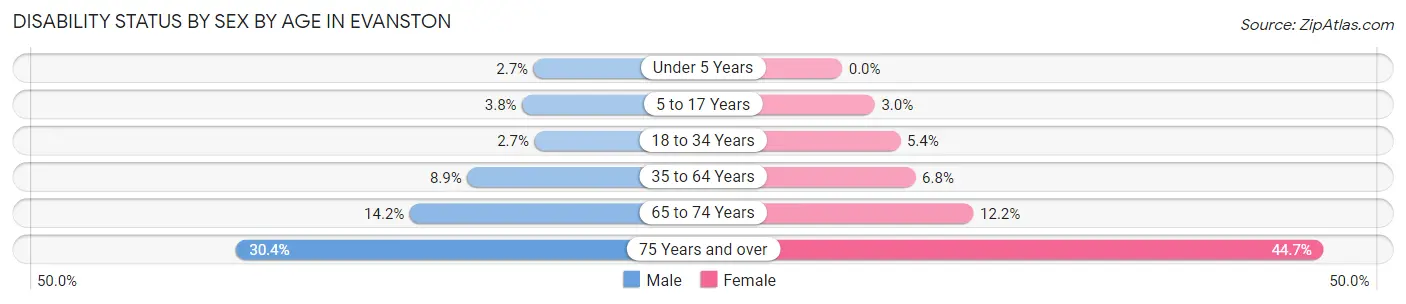
| Age Bracket | Male | Female |
| Under 5 Years | 57 (2.7%) | 0 (0.0%) |
| 5 to 17 Years | 207 (3.8%) | 157 (3.0%) |
| 18 to 34 Years | 284 (2.6%) | 611 (5.4%) |
| 35 to 64 Years | 1,191 (8.9%) | 934 (6.8%) |
| 65 to 74 Years | 492 (14.2%) | 515 (12.2%) |
| 75 Years and over | 519 (30.3%) | 1,402 (44.7%) |
Disability Class by Sex by Age in Evanston
Disability Class: Hearing Difficulty
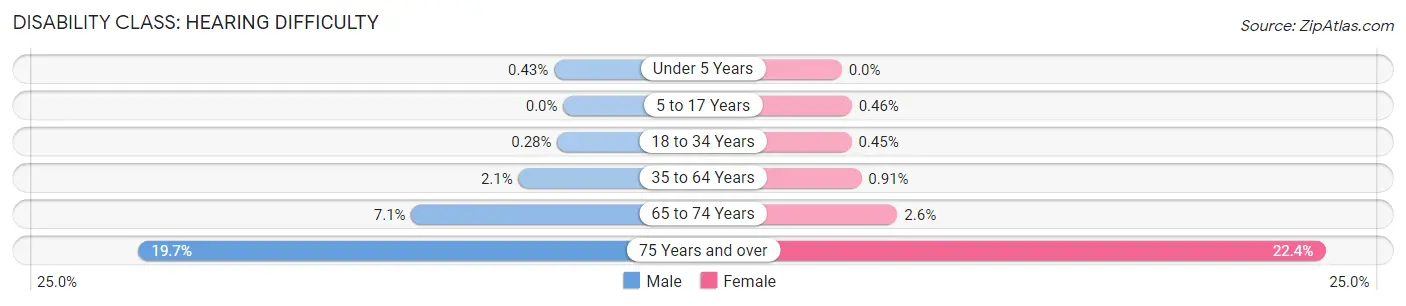
| Age Bracket | Male | Female |
| Under 5 Years | 9 (0.4%) | 0 (0.0%) |
| 5 to 17 Years | 0 (0.0%) | 24 (0.5%) |
| 18 to 34 Years | 30 (0.3%) | 51 (0.4%) |
| 35 to 64 Years | 279 (2.1%) | 125 (0.9%) |
| 65 to 74 Years | 244 (7.0%) | 109 (2.6%) |
| 75 Years and over | 337 (19.7%) | 703 (22.4%) |
Disability Class: Vision Difficulty
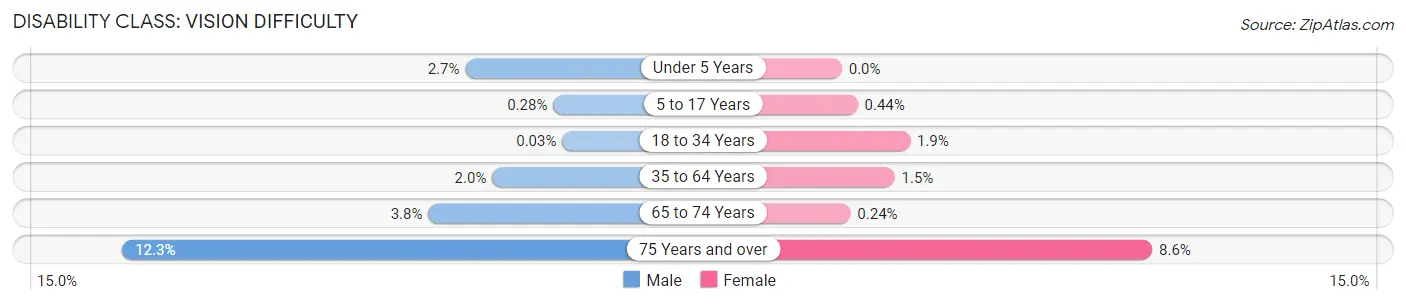
| Age Bracket | Male | Female |
| Under 5 Years | 57 (2.7%) | 0 (0.0%) |
| 5 to 17 Years | 15 (0.3%) | 23 (0.4%) |
| 18 to 34 Years | 3 (0.0%) | 215 (1.9%) |
| 35 to 64 Years | 265 (2.0%) | 202 (1.5%) |
| 65 to 74 Years | 130 (3.8%) | 10 (0.2%) |
| 75 Years and over | 210 (12.3%) | 271 (8.6%) |
Disability Class: Cognitive Difficulty
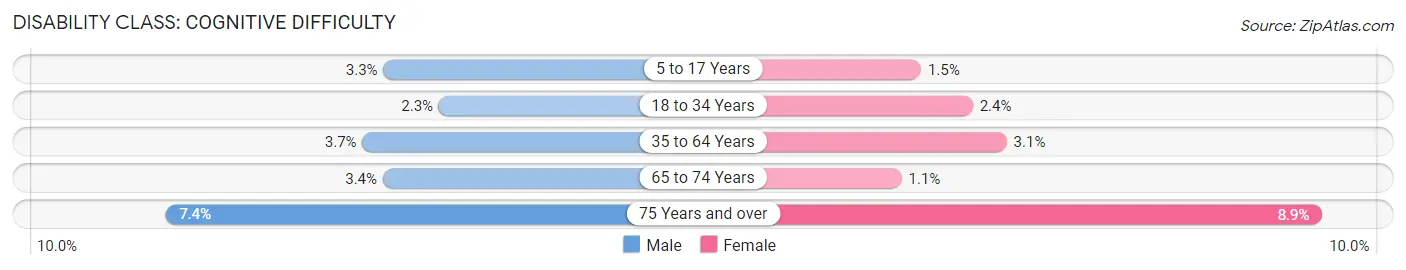
| Age Bracket | Male | Female |
| 5 to 17 Years | 182 (3.3%) | 76 (1.5%) |
| 18 to 34 Years | 248 (2.3%) | 275 (2.4%) |
| 35 to 64 Years | 499 (3.7%) | 419 (3.1%) |
| 65 to 74 Years | 116 (3.4%) | 47 (1.1%) |
| 75 Years and over | 126 (7.4%) | 279 (8.9%) |
Disability Class: Ambulatory Difficulty
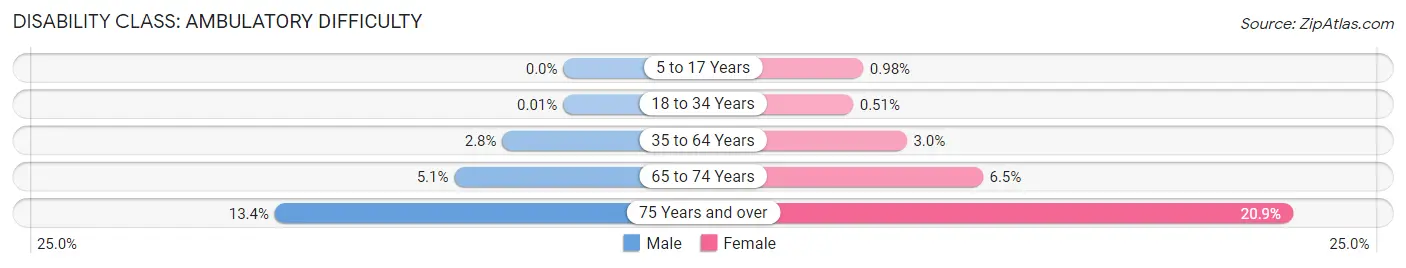
| Age Bracket | Male | Female |
| 5 to 17 Years | 0 (0.0%) | 51 (1.0%) |
| 18 to 34 Years | 1 (0.0%) | 58 (0.5%) |
| 35 to 64 Years | 379 (2.8%) | 412 (3.0%) |
| 65 to 74 Years | 175 (5.1%) | 276 (6.5%) |
| 75 Years and over | 229 (13.4%) | 656 (20.9%) |
Disability Class: Self-Care Difficulty
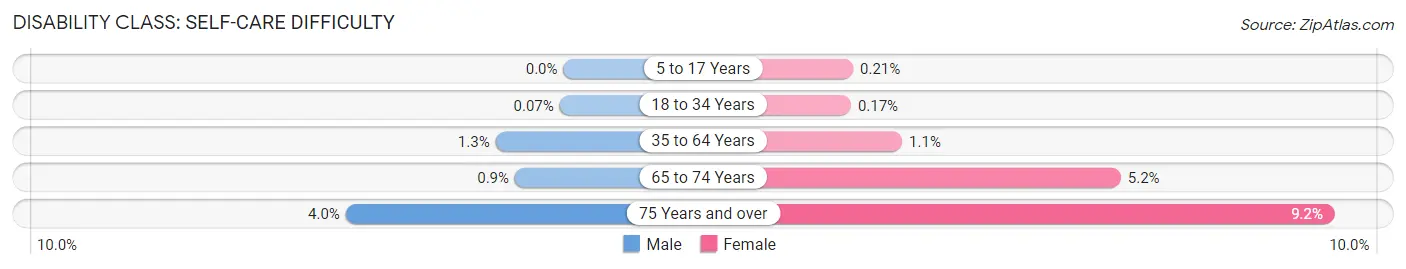
| Age Bracket | Male | Female |
| 5 to 17 Years | 0 (0.0%) | 11 (0.2%) |
| 18 to 34 Years | 8 (0.1%) | 19 (0.2%) |
| 35 to 64 Years | 169 (1.3%) | 154 (1.1%) |
| 65 to 74 Years | 31 (0.9%) | 219 (5.2%) |
| 75 Years and over | 69 (4.0%) | 287 (9.1%) |
Technology Access in Evanston
Computing Device Access in Evanston
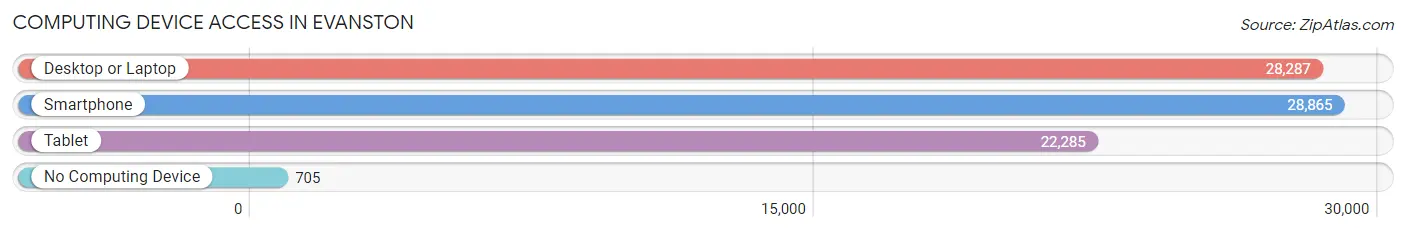
| Device Type | # Households | % Households |
| Desktop or Laptop | 28,287 | 91.5% |
| Smartphone | 28,865 | 93.4% |
| Tablet | 22,285 | 72.1% |
| No Computing Device | 705 | 2.3% |
| Total | 30,900 | 100.0% |
Internet Access in Evanston
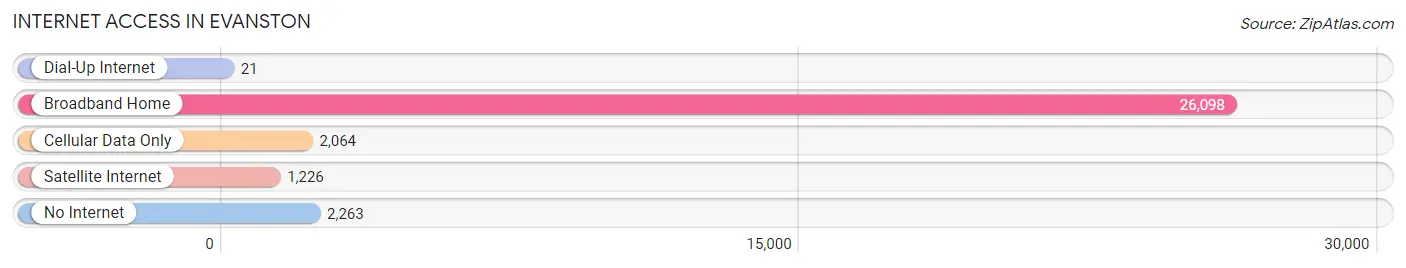
| Internet Type | # Households | % Households |
| Dial-Up Internet | 21 | 0.1% |
| Broadband Home | 26,098 | 84.5% |
| Cellular Data Only | 2,064 | 6.7% |
| Satellite Internet | 1,226 | 4.0% |
| No Internet | 2,263 | 7.3% |
| Total | 30,900 | 100.0% |
Evanston Summary
Evanston, Illinois is a city located in Cook County, just north of Chicago. It is a vibrant and diverse community that has a rich history, unique geography, a thriving economy, and a diverse population.
History
Evanston was founded in 1853 by John Evans, a former governor of the Colorado Territory. He named the city after himself and it was incorporated in 1863. The city was originally a farming community, but it quickly grew into a bustling suburb of Chicago. In the late 19th century, Evanston became a popular destination for wealthy Chicagoans who wanted to escape the hustle and bustle of the city.
The city was home to Northwestern University, which was founded in 1851. The university has grown to become one of the most prestigious universities in the country. It has also been a major contributor to the city’s economy and culture.
Evanston was also home to the first African-American mayor of a major city in the United States. In 1975, Lorraine H. Morton was elected mayor of Evanston and served until 1993. She was a major advocate for civil rights and was instrumental in the city’s growth and development.
Geography
Evanston is located on the shores of Lake Michigan, just north of Chicago. It is bordered by Wilmette to the north, Skokie to the west, and Chicago to the south. The city is divided into four distinct neighborhoods: Downtown, Central, South, and North.
The city is home to several parks and beaches, including Lighthouse Beach, Clark Street Beach, and Dawes Park. The city also has several museums, including the Evanston History Center and the Mitchell Museum of the American Indian.
Economy
Evanston has a thriving economy that is largely driven by the presence of Northwestern University. The university is the largest employer in the city and provides jobs for thousands of people. Other major employers in the city include the NorthShore University HealthSystem, the City of Evanston, and the Evanston Public Library.
The city is also home to several large corporations, including Kraft Foods, Wm. Wrigley Jr. Company, and the Chicago Tribune. The city also has a vibrant retail sector, with several shopping centers and boutiques.
Demographics
As of the 2010 census, the population of Evanston was 74,486. The city is racially and ethnically diverse, with a population that is 44.3% White, 28.7% African American, 15.3% Asian, and 8.2% Hispanic or Latino. The median household income in the city is $68,902, and the median home value is $400,000.
Evanston is a vibrant and diverse city that has a rich history, unique geography, a thriving economy, and a diverse population. It is a great place to live, work, and play, and it is a great place to call home.
Common Questions
What is Per Capita Income in Evanston?
Per Capita income in Evanston is $63,888.
What is the Median Family Income in Evanston?
Median Family Income in Evanston is $146,789.
What is the Median Household income in Evanston?
Median Household Income in Evanston is $93,188.
What is Income or Wage Gap in Evanston?
Income or Wage Gap in Evanston is 24.0%.
Women in Evanston earn 76.0 cents for every dollar earned by a man.
What is Inequality or Gini Index in Evanston?
Inequality or Gini Index in Evanston is 0.55.
What is the Total Population of Evanston?
Total Population of Evanston is 77,181.
What is the Total Male Population of Evanston?
Total Male Population of Evanston is 37,413.
What is the Total Female Population of Evanston?
Total Female Population of Evanston is 39,768.
What is the Ratio of Males per 100 Females in Evanston?
There are 94.08 Males per 100 Females in Evanston.
What is the Ratio of Females per 100 Males in Evanston?
There are 106.29 Females per 100 Males in Evanston.
What is the Median Population Age in Evanston?
Median Population Age in Evanston is 37.6 Years.
What is the Average Family Size in Evanston
Average Family Size in Evanston is 3.1 People.
What is the Average Household Size in Evanston
Average Household Size in Evanston is 2.3 People.
How Large is the Labor Force in Evanston?
There are 41,524 People in the Labor Forcein in Evanston.
What is the Percentage of People in the Labor Force in Evanston?
64.5% of People are in the Labor Force in Evanston.
What is the Unemployment Rate in Evanston?
Unemployment Rate in Evanston is 6.1%.