Third Lake, IL Map & Demographics
Third Lake Map
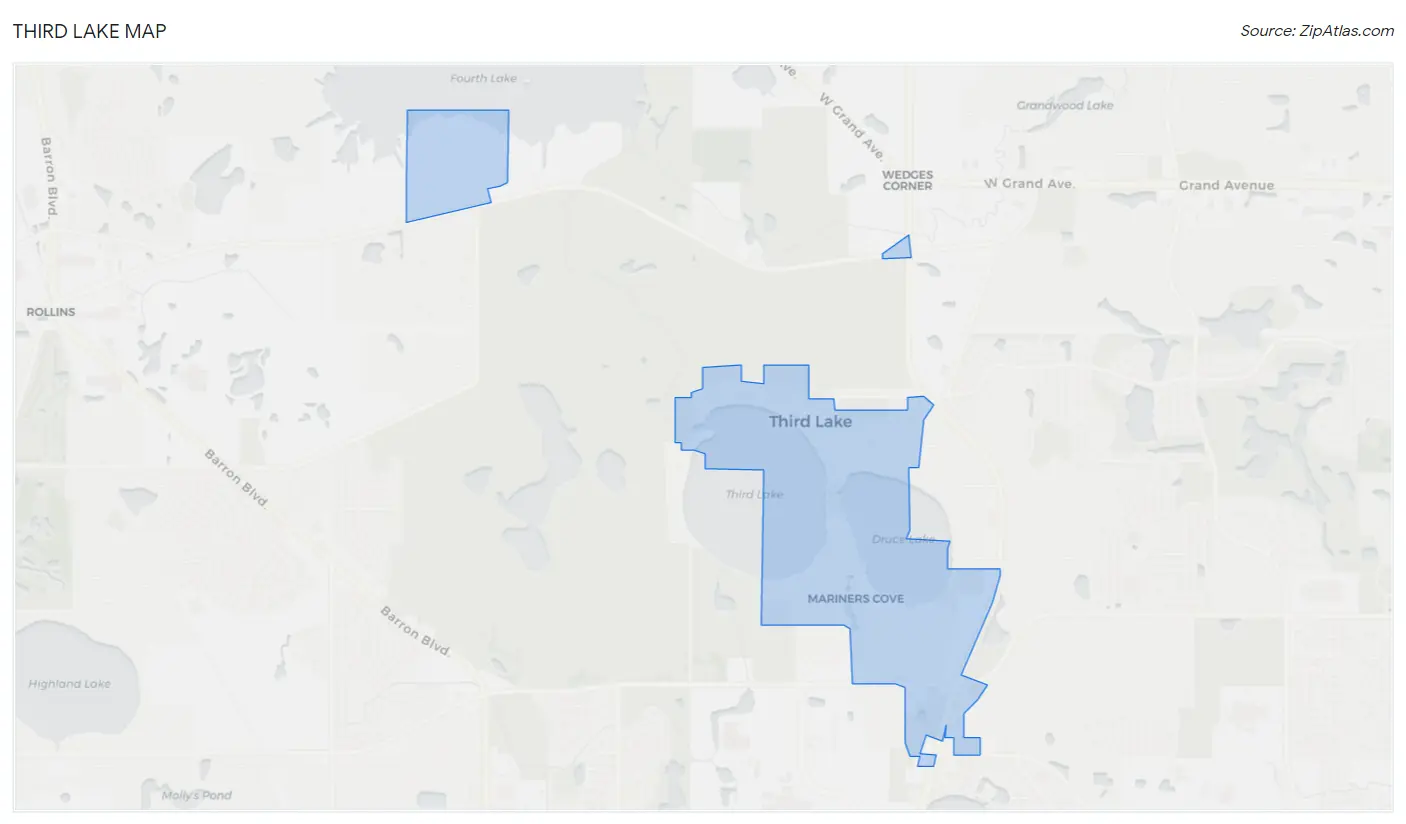
Third Lake Overview
$63,715
PER CAPITA INCOME
$153,819
AVG FAMILY INCOME
$152,593
AVG HOUSEHOLD INCOME
16.8%
WAGE / INCOME GAP [ % ]
83.2¢/ $1
WAGE / INCOME GAP [ $ ]
0.30
INEQUALITY / GINI INDEX
1,214
TOTAL POPULATION
612
MALE POPULATION
602
FEMALE POPULATION
101.66
MALES / 100 FEMALES
98.37
FEMALES / 100 MALES
50.3
MEDIAN AGE
2.9
AVG FAMILY SIZE
2.6
AVG HOUSEHOLD SIZE
653
LABOR FORCE [ PEOPLE ]
63.7%
PERCENT IN LABOR FORCE
3.7%
UNEMPLOYMENT RATE
Income in Third Lake
Income Overview in Third Lake
Per Capita Income in Third Lake is $63,715, while median incomes of families and households are $153,819 and $152,593 respectively.
| Characteristic | Number | Measure |
| Per Capita Income | 1,214 | $63,715 |
| Median Family Income | 385 | $153,819 |
| Mean Family Income | 385 | $183,778 |
| Median Household Income | 460 | $152,593 |
| Mean Household Income | 460 | $169,193 |
| Income Deficit | 385 | $0 |
| Wage / Income Gap (%) | 1,214 | 16.82% |
| Wage / Income Gap ($) | 1,214 | 83.18¢ per $1 |
| Gini / Inequality Index | 1,214 | 0.30 |
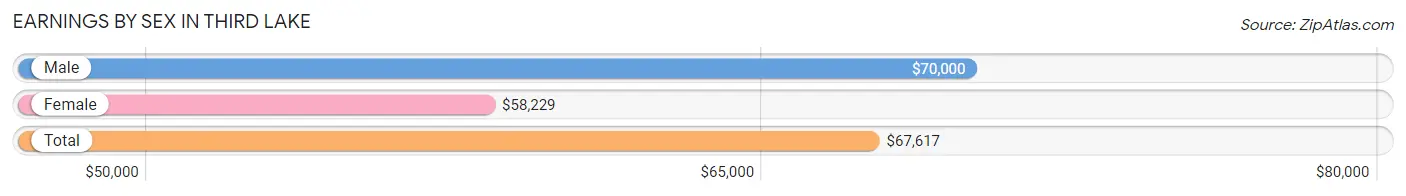
Earnings by Sex in Third Lake
Average Earnings in Third Lake are $67,617, $70,000 for men and $58,229 for women, a difference of 16.8%.
| Sex | Number | Average Earnings |
| Male | 376 (51.7%) | $70,000 |
| Female | 351 (48.3%) | $58,229 |
| Total | 727 (100.0%) | $67,617 |
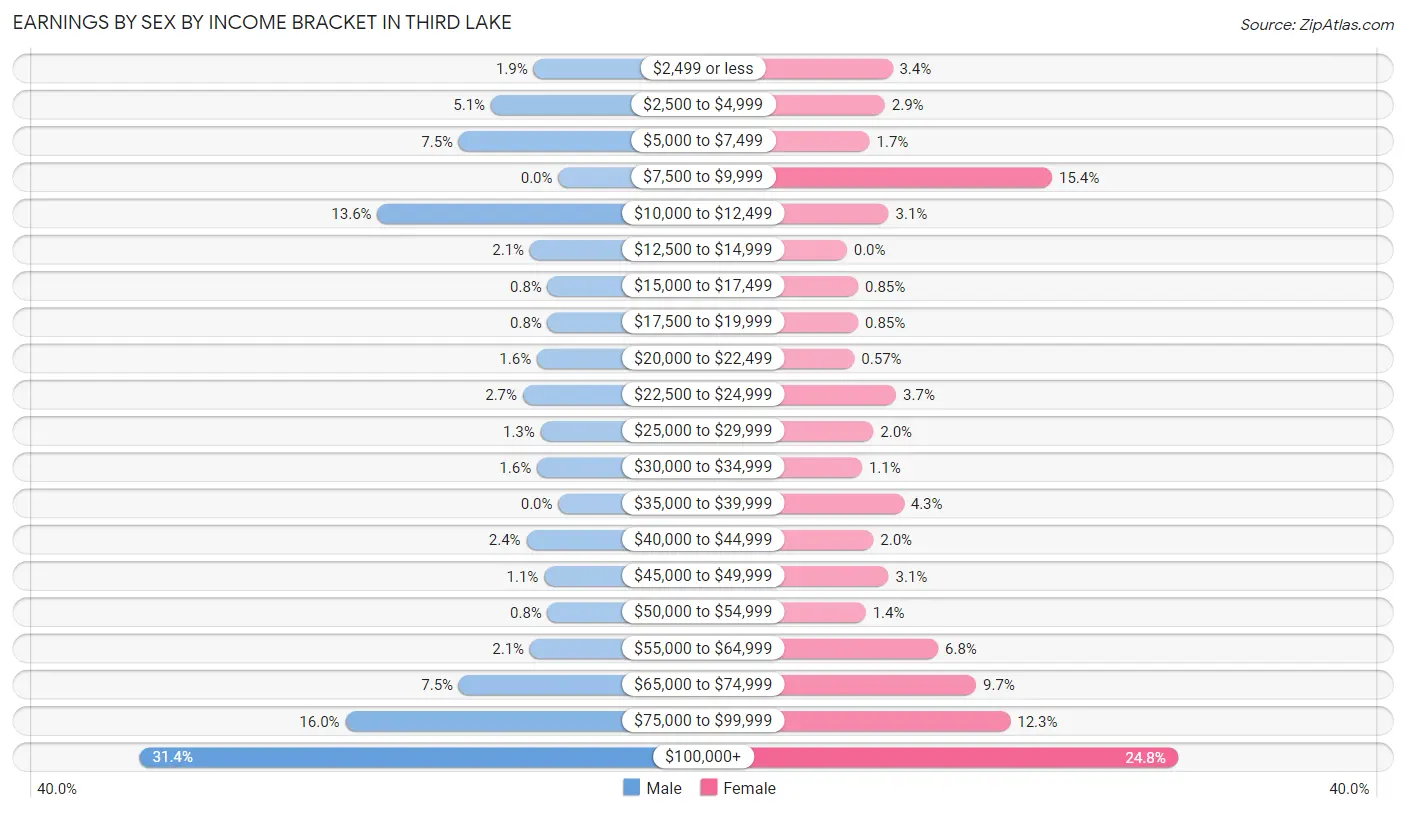
Earnings by Sex by Income Bracket in Third Lake
The most common earnings brackets in Third Lake are $100,000+ for men (118 | 31.4%) and $100,000+ for women (87 | 24.8%).
| Income | Male | Female |
| $2,499 or less | 7 (1.9%) | 12 (3.4%) |
| $2,500 to $4,999 | 19 (5.1%) | 10 (2.9%) |
| $5,000 to $7,499 | 28 (7.4%) | 6 (1.7%) |
| $7,500 to $9,999 | 0 (0.0%) | 54 (15.4%) |
| $10,000 to $12,499 | 51 (13.6%) | 11 (3.1%) |
| $12,500 to $14,999 | 8 (2.1%) | 0 (0.0%) |
| $15,000 to $17,499 | 3 (0.8%) | 3 (0.9%) |
| $17,500 to $19,999 | 3 (0.8%) | 3 (0.9%) |
| $20,000 to $22,499 | 6 (1.6%) | 2 (0.6%) |
| $22,500 to $24,999 | 10 (2.7%) | 13 (3.7%) |
| $25,000 to $29,999 | 5 (1.3%) | 7 (2.0%) |
| $30,000 to $34,999 | 6 (1.6%) | 4 (1.1%) |
| $35,000 to $39,999 | 0 (0.0%) | 15 (4.3%) |
| $40,000 to $44,999 | 9 (2.4%) | 7 (2.0%) |
| $45,000 to $49,999 | 4 (1.1%) | 11 (3.1%) |
| $50,000 to $54,999 | 3 (0.8%) | 5 (1.4%) |
| $55,000 to $64,999 | 8 (2.1%) | 24 (6.8%) |
| $65,000 to $74,999 | 28 (7.4%) | 34 (9.7%) |
| $75,000 to $99,999 | 60 (16.0%) | 43 (12.2%) |
| $100,000+ | 118 (31.4%) | 87 (24.8%) |
| Total | 376 (100.0%) | 351 (100.0%) |
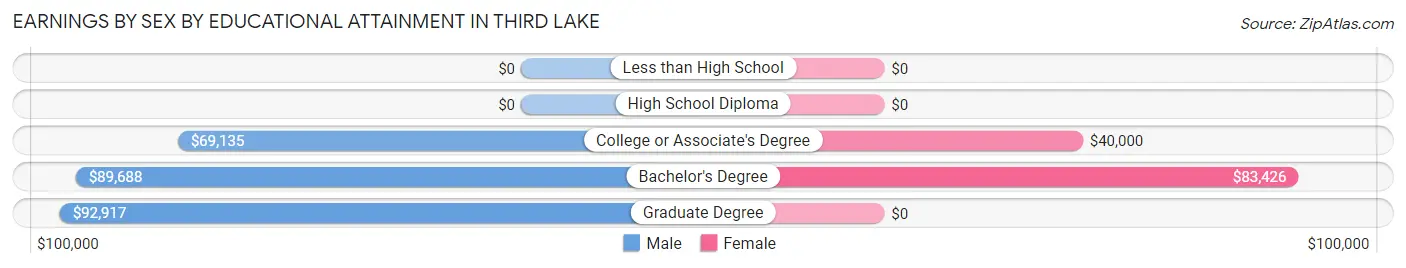
Earnings by Sex by Educational Attainment in Third Lake
Average earnings in Third Lake are $86,012 for men and $67,656 for women, a difference of 21.3%. Men with an educational attainment of graduate degree enjoy the highest average annual earnings of $92,917, while those with college or associate's degree education earn the least with $69,135. Women with an educational attainment of bachelor's degree earn the most with the average annual earnings of $83,426, while those with college or associate's degree education have the smallest earnings of $40,000.
| Educational Attainment | Male Income | Female Income |
| Less than High School | - | - |
| High School Diploma | - | - |
| College or Associate's Degree | $69,135 | $40,000 |
| Bachelor's Degree | $89,688 | $83,426 |
| Graduate Degree | $92,917 | $0 |
| Total | $86,012 | $67,656 |
Family Income in Third Lake
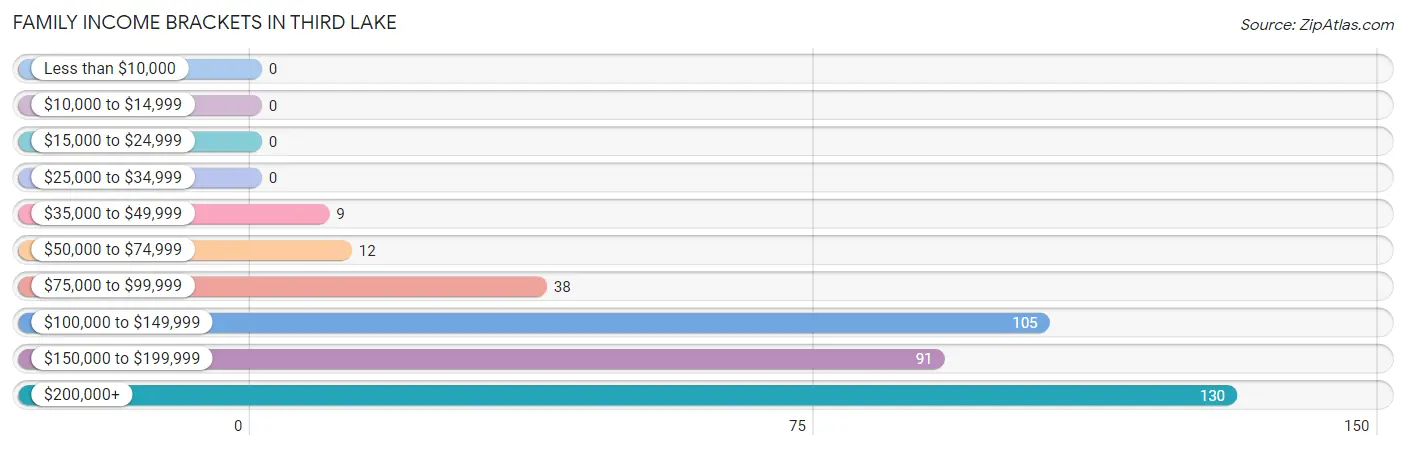
Family Income Brackets in Third Lake
According to the Third Lake family income data, there are 130 families falling into the $200,000+ income range, which is the most common income bracket and makes up 33.8% of all families.
| Income Bracket | # Families | % Families |
| Less than $10,000 | 0 | 0.0% |
| $10,000 to $14,999 | 0 | 0.0% |
| $15,000 to $24,999 | 0 | 0.0% |
| $25,000 to $34,999 | 0 | 0.0% |
| $35,000 to $49,999 | 9 | 2.3% |
| $50,000 to $74,999 | 12 | 3.1% |
| $75,000 to $99,999 | 38 | 9.9% |
| $100,000 to $149,999 | 105 | 27.3% |
| $150,000 to $199,999 | 91 | 23.6% |
| $200,000+ | 130 | 33.8% |
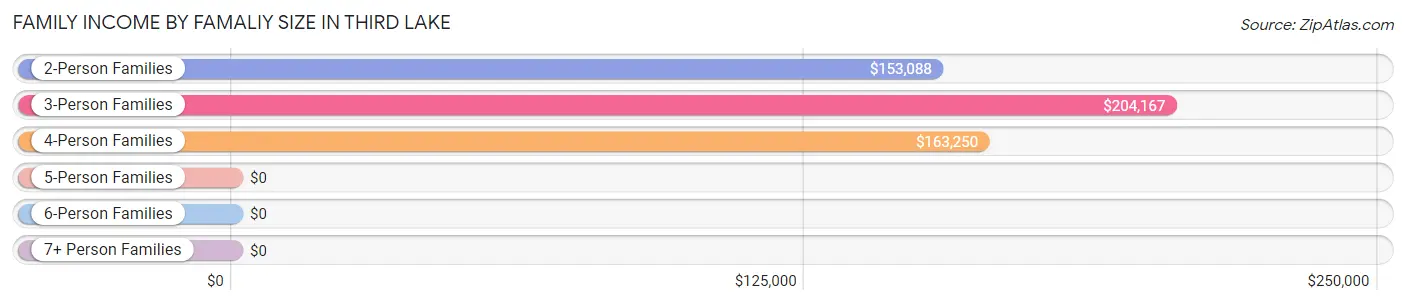
Family Income by Famaliy Size in Third Lake
3-person families (78 | 20.3%) account for the highest median family income in Third Lake with $204,167 per family, while 2-person families (208 | 54.0%) have the highest median income of $76,544 per family member.
| Income Bracket | # Families | Median Income |
| 2-Person Families | 208 (54.0%) | $153,088 |
| 3-Person Families | 78 (20.3%) | $204,167 |
| 4-Person Families | 89 (23.1%) | $163,250 |
| 5-Person Families | 8 (2.1%) | $0 |
| 6-Person Families | 0 (0.0%) | $0 |
| 7+ Person Families | 2 (0.5%) | $0 |
| Total | 385 (100.0%) | $153,819 |
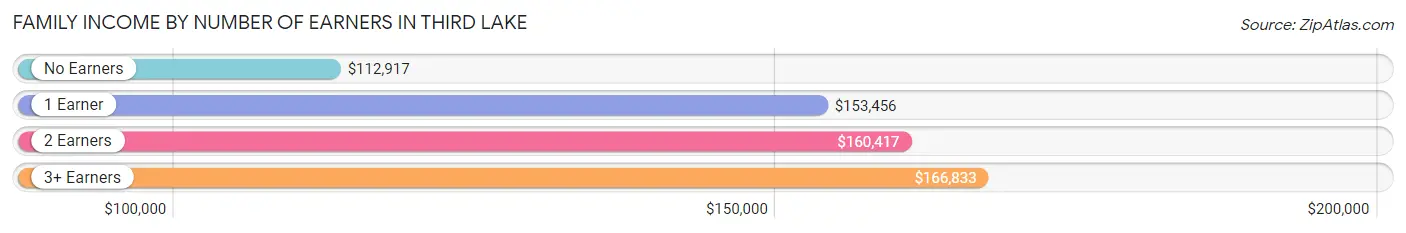
Family Income by Number of Earners in Third Lake
The median family income in Third Lake is $153,819, with families comprising 3+ earners (40) having the highest median family income of $166,833, while families with no earners (35) have the lowest median family income of $112,917, accounting for 10.4% and 9.1% of families, respectively.
| Number of Earners | # Families | Median Income |
| No Earners | 35 (9.1%) | $112,917 |
| 1 Earner | 143 (37.1%) | $153,456 |
| 2 Earners | 167 (43.4%) | $160,417 |
| 3+ Earners | 40 (10.4%) | $166,833 |
| Total | 385 (100.0%) | $153,819 |
Household Income in Third Lake
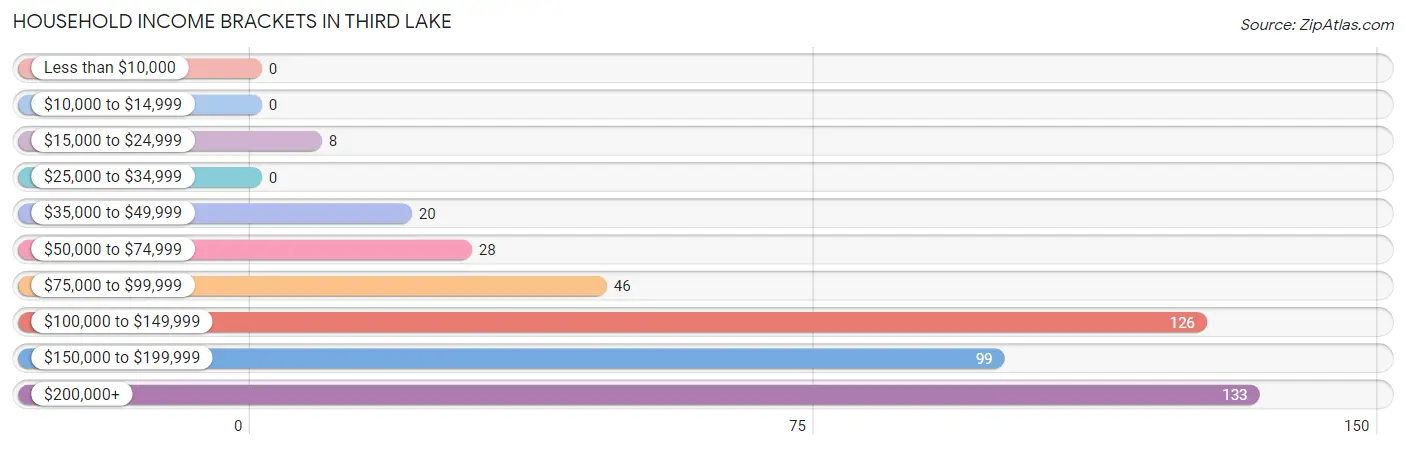
Household Income Brackets in Third Lake
With 133 households falling in the category, the $200,000+ income range is the most frequent in Third Lake, accounting for 28.9% of all households.
| Income Bracket | # Households | % Households |
| Less than $10,000 | 0 | 0.0% |
| $10,000 to $14,999 | 0 | 0.0% |
| $15,000 to $24,999 | 8 | 1.7% |
| $25,000 to $34,999 | 0 | 0.0% |
| $35,000 to $49,999 | 20 | 4.3% |
| $50,000 to $74,999 | 28 | 6.1% |
| $75,000 to $99,999 | 46 | 10.0% |
| $100,000 to $149,999 | 126 | 27.4% |
| $150,000 to $199,999 | 99 | 21.5% |
| $200,000+ | 133 | 28.9% |
Household Income by Householder Age in Third Lake
The median household income in Third Lake is $152,593, with the highest median household income of $165,987 found in the 45 to 64 years age bracket for the primary householder. A total of 205 households (44.6%) fall into this category. Meanwhile, the 15 to 24 years age bracket for the primary householder has the lowest median household income of $0, with 7 households (1.5%) in this group.
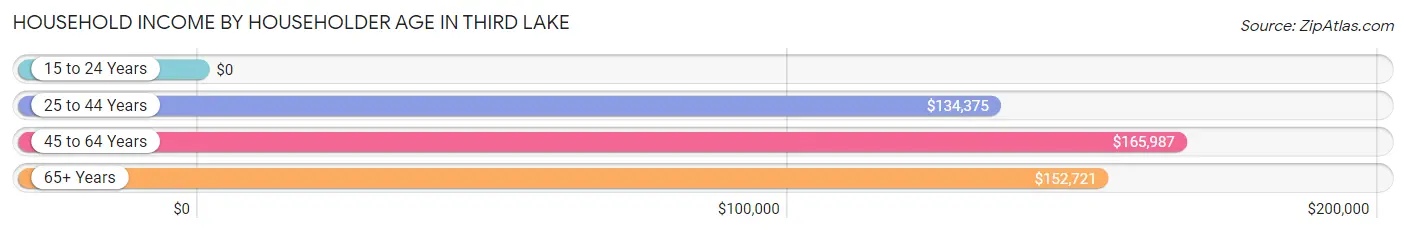
| Income Bracket | # Households | Median Income |
| 15 to 24 Years | 7 (1.5%) | $0 |
| 25 to 44 Years | 89 (19.4%) | $134,375 |
| 45 to 64 Years | 205 (44.6%) | $165,987 |
| 65+ Years | 159 (34.6%) | $152,721 |
| Total | 460 (100.0%) | $152,593 |
Poverty in Third Lake
Income Below Poverty by Sex and Age in Third Lake
With 2.9% poverty level for males and 1.7% for females among the residents of Third Lake, 35 to 44 year old males and 75 year old and over females are the most vulnerable to poverty, with 11 males (14.9%) and 3 females (9.4%) in their respective age groups living below the poverty level.
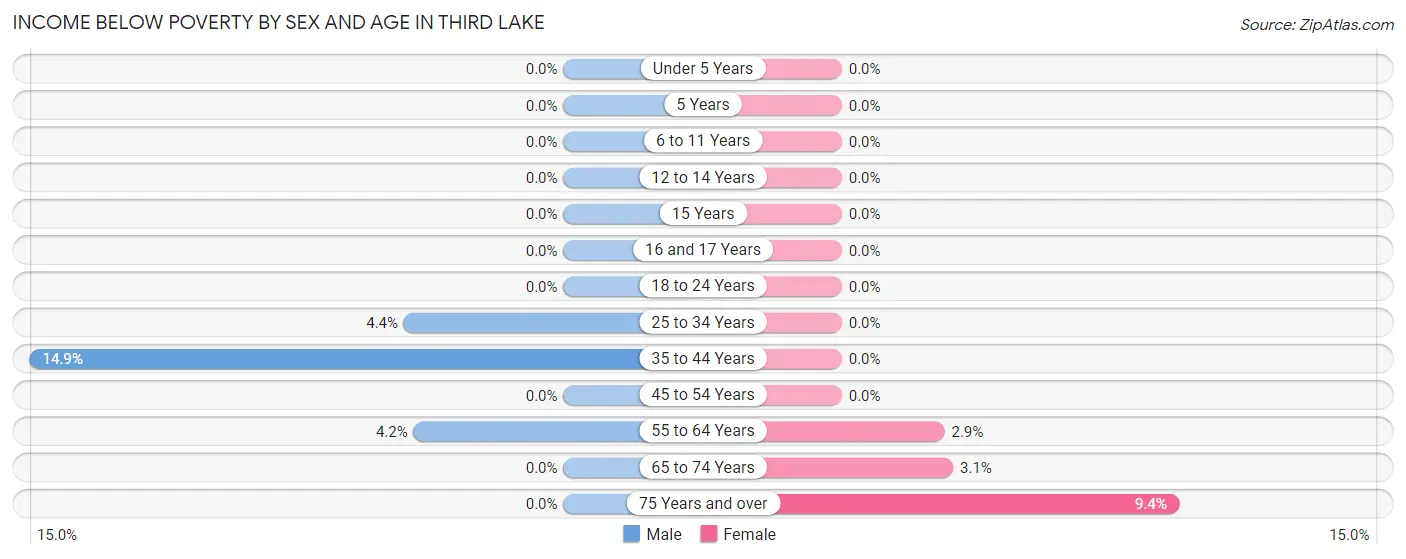
| Age Bracket | Male | Female |
| Under 5 Years | 0 (0.0%) | 0 (0.0%) |
| 5 Years | 0 (0.0%) | 0 (0.0%) |
| 6 to 11 Years | 0 (0.0%) | 0 (0.0%) |
| 12 to 14 Years | 0 (0.0%) | 0 (0.0%) |
| 15 Years | 0 (0.0%) | 0 (0.0%) |
| 16 and 17 Years | 0 (0.0%) | 0 (0.0%) |
| 18 to 24 Years | 0 (0.0%) | 0 (0.0%) |
| 25 to 34 Years | 2 (4.4%) | 0 (0.0%) |
| 35 to 44 Years | 11 (14.9%) | 0 (0.0%) |
| 45 to 54 Years | 0 (0.0%) | 0 (0.0%) |
| 55 to 64 Years | 5 (4.2%) | 3 (2.9%) |
| 65 to 74 Years | 0 (0.0%) | 4 (3.1%) |
| 75 Years and over | 0 (0.0%) | 3 (9.4%) |
| Total | 18 (2.9%) | 10 (1.7%) |
Income Above Poverty by Sex and Age in Third Lake
According to the poverty statistics in Third Lake, males aged under 5 years and females aged under 5 years are the age groups that are most secure financially, with 100.0% of males and 100.0% of females in these age groups living above the poverty line.
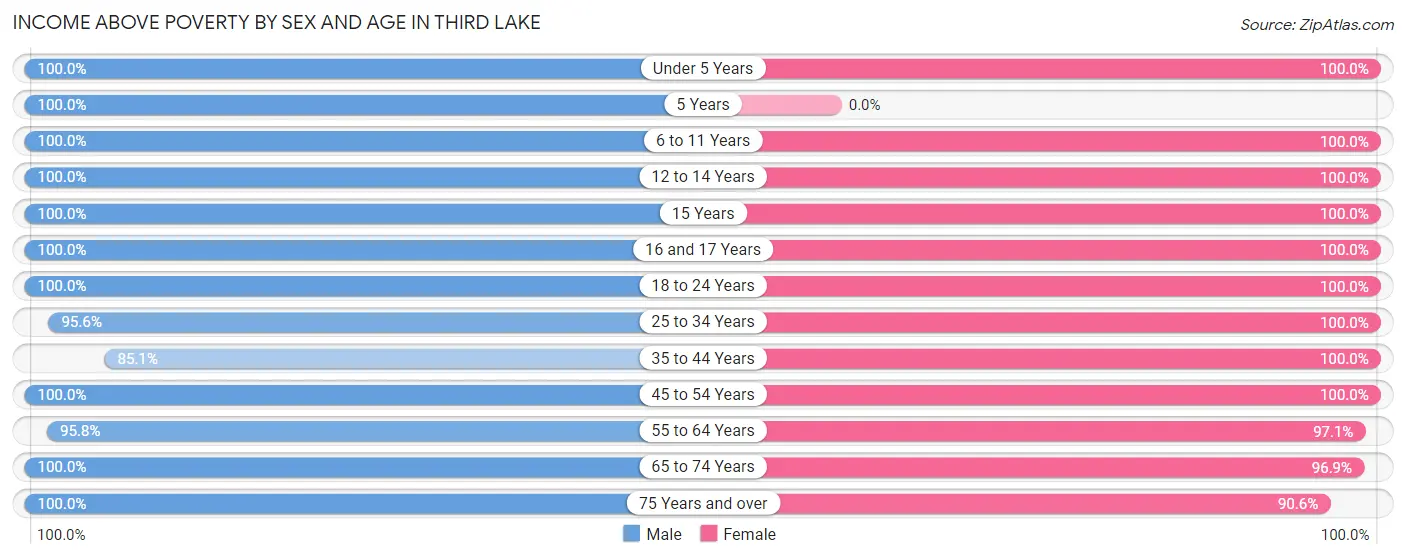
| Age Bracket | Male | Female |
| Under 5 Years | 18 (100.0%) | 23 (100.0%) |
| 5 Years | 5 (100.0%) | 0 (0.0%) |
| 6 to 11 Years | 36 (100.0%) | 31 (100.0%) |
| 12 to 14 Years | 26 (100.0%) | 40 (100.0%) |
| 15 Years | 5 (100.0%) | 5 (100.0%) |
| 16 and 17 Years | 3 (100.0%) | 19 (100.0%) |
| 18 to 24 Years | 93 (100.0%) | 30 (100.0%) |
| 25 to 34 Years | 43 (95.6%) | 28 (100.0%) |
| 35 to 44 Years | 63 (85.1%) | 53 (100.0%) |
| 45 to 54 Years | 69 (100.0%) | 107 (100.0%) |
| 55 to 64 Years | 115 (95.8%) | 102 (97.1%) |
| 65 to 74 Years | 65 (100.0%) | 125 (96.9%) |
| 75 Years and over | 53 (100.0%) | 29 (90.6%) |
| Total | 594 (97.1%) | 592 (98.3%) |
Income Below Poverty Among Married-Couple Families in Third Lake
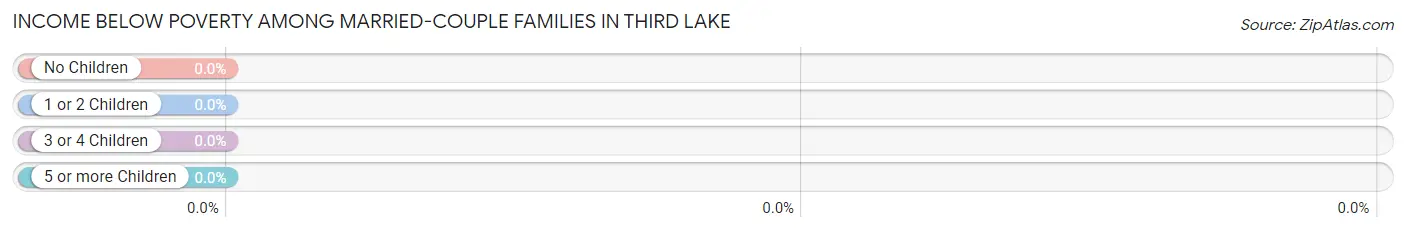
| Children | Above Poverty | Below Poverty |
| No Children | 244 (100.0%) | 0 (0.0%) |
| 1 or 2 Children | 113 (100.0%) | 0 (0.0%) |
| 3 or 4 Children | 2 (100.0%) | 0 (0.0%) |
| 5 or more Children | 2 (100.0%) | 0 (0.0%) |
| Total | 361 (100.0%) | 0 (0.0%) |
Income Below Poverty Among Single-Parent Households in Third Lake
| Children | Single Father | Single Mother |
| No Children | 0 (0.0%) | 0 (0.0%) |
| 1 or 2 Children | 0 (0.0%) | 0 (0.0%) |
| 3 or 4 Children | 0 (0.0%) | 0 (0.0%) |
| 5 or more Children | 0 (0.0%) | 0 (0.0%) |
| Total | 0 (0.0%) | 0 (0.0%) |
Income Below Poverty Among Married-Couple vs Single-Parent Households in Third Lake
| Children | Married-Couple Families | Single-Parent Households |
| No Children | 0 (0.0%) | 0 (0.0%) |
| 1 or 2 Children | 0 (0.0%) | 0 (0.0%) |
| 3 or 4 Children | 0 (0.0%) | 0 (0.0%) |
| 5 or more Children | 0 (0.0%) | 0 (0.0%) |
| Total | 0 (0.0%) | 0 (0.0%) |
Race in Third Lake
The most populous races in Third Lake are White / Caucasian (1,112 | 91.6%), Hispanic or Latino (101 | 8.3%), and Native / Alaskan (52 | 4.3%).
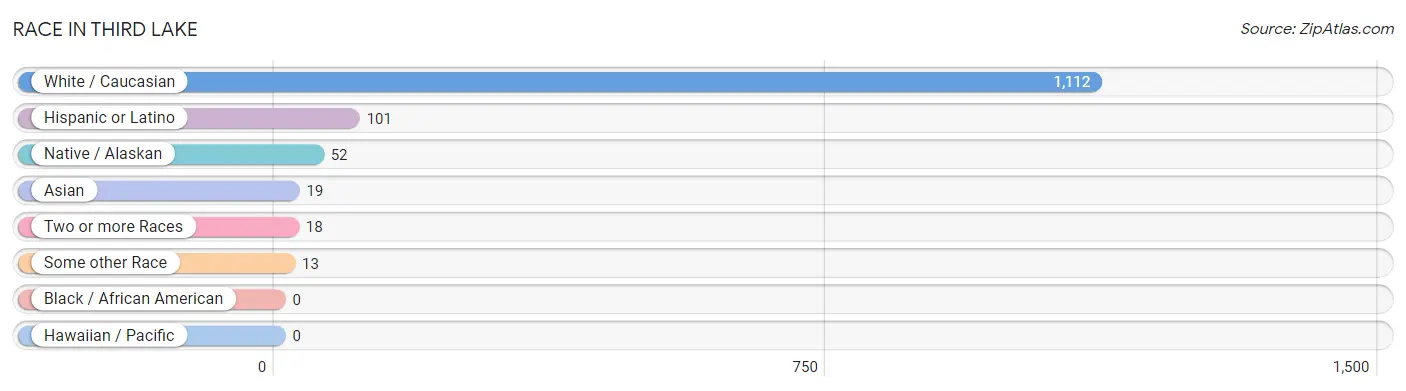
| Race | # Population | % Population |
| Asian | 19 | 1.6% |
| Black / African American | 0 | 0.0% |
| Hawaiian / Pacific | 0 | 0.0% |
| Hispanic or Latino | 101 | 8.3% |
| Native / Alaskan | 52 | 4.3% |
| White / Caucasian | 1,112 | 91.6% |
| Two or more Races | 18 | 1.5% |
| Some other Race | 13 | 1.1% |
| Total | 1,214 | 100.0% |
Ancestry in Third Lake
The most populous ancestries reported in Third Lake are German (412 | 33.9%), Irish (232 | 19.1%), Italian (183 | 15.1%), Polish (182 | 15.0%), and English (128 | 10.5%), together accounting for 93.7% of all Third Lake residents.
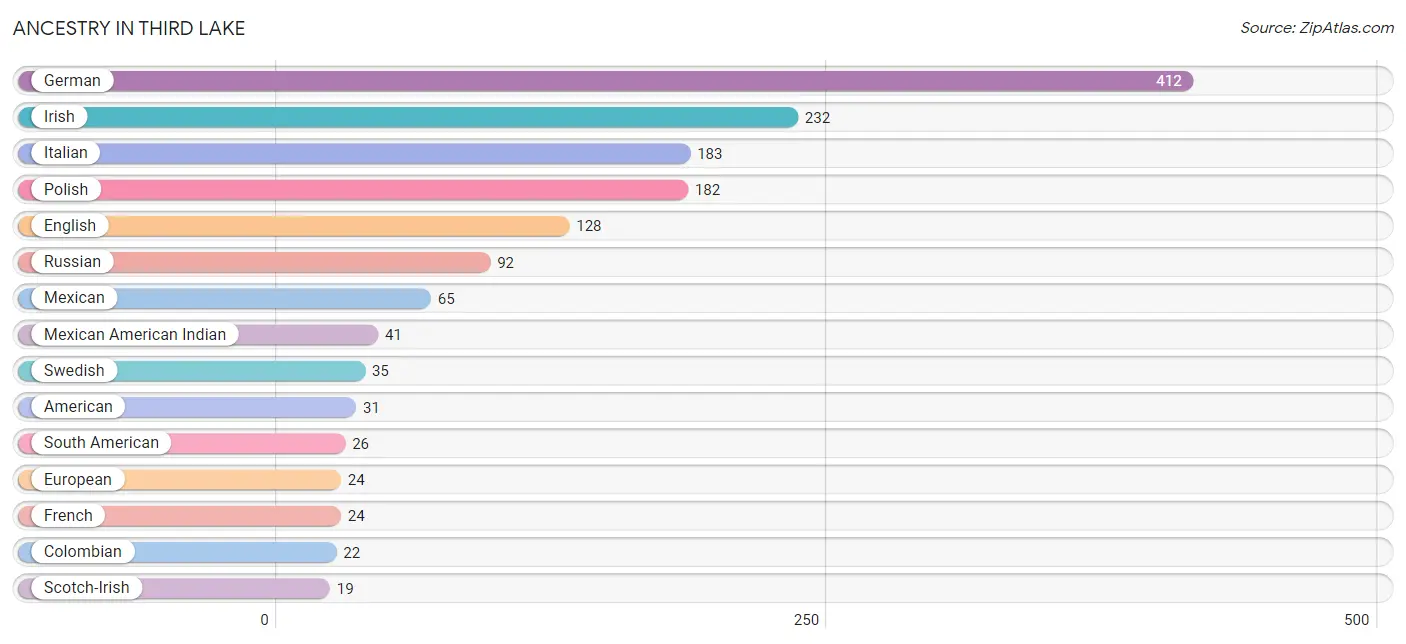
| Ancestry | # Population | % Population |
| American | 31 | 2.5% |
| Austrian | 2 | 0.2% |
| Belgian | 8 | 0.7% |
| Blackfeet | 4 | 0.3% |
| British | 4 | 0.3% |
| Central American | 3 | 0.3% |
| Colombian | 22 | 1.8% |
| Croatian | 7 | 0.6% |
| Czech | 14 | 1.1% |
| Danish | 3 | 0.3% |
| Dutch | 16 | 1.3% |
| Ecuadorian | 4 | 0.3% |
| English | 128 | 10.5% |
| European | 24 | 2.0% |
| Finnish | 2 | 0.2% |
| French | 24 | 2.0% |
| German | 412 | 33.9% |
| Greek | 7 | 0.6% |
| Guatemalan | 3 | 0.3% |
| Hungarian | 3 | 0.3% |
| Irish | 232 | 19.1% |
| Italian | 183 | 15.1% |
| Korean | 3 | 0.3% |
| Luxembourger | 3 | 0.3% |
| Macedonian | 2 | 0.2% |
| Mexican | 65 | 5.3% |
| Mexican American Indian | 41 | 3.4% |
| Northern European | 6 | 0.5% |
| Norwegian | 15 | 1.2% |
| Polish | 182 | 15.0% |
| Portuguese | 3 | 0.3% |
| Russian | 92 | 7.6% |
| Scandinavian | 3 | 0.3% |
| Scotch-Irish | 19 | 1.6% |
| Scottish | 17 | 1.4% |
| Serbian | 3 | 0.3% |
| Slavic | 6 | 0.5% |
| Slovak | 3 | 0.3% |
| Slovene | 3 | 0.3% |
| South American | 26 | 2.1% |
| Spaniard | 7 | 0.6% |
| Swedish | 35 | 2.9% |
| Thai | 16 | 1.3% |
| Ukrainian | 11 | 0.9% |
| Welsh | 2 | 0.2% |
| Yugoslavian | 3 | 0.3% | View All 46 Rows |
Immigrants in Third Lake
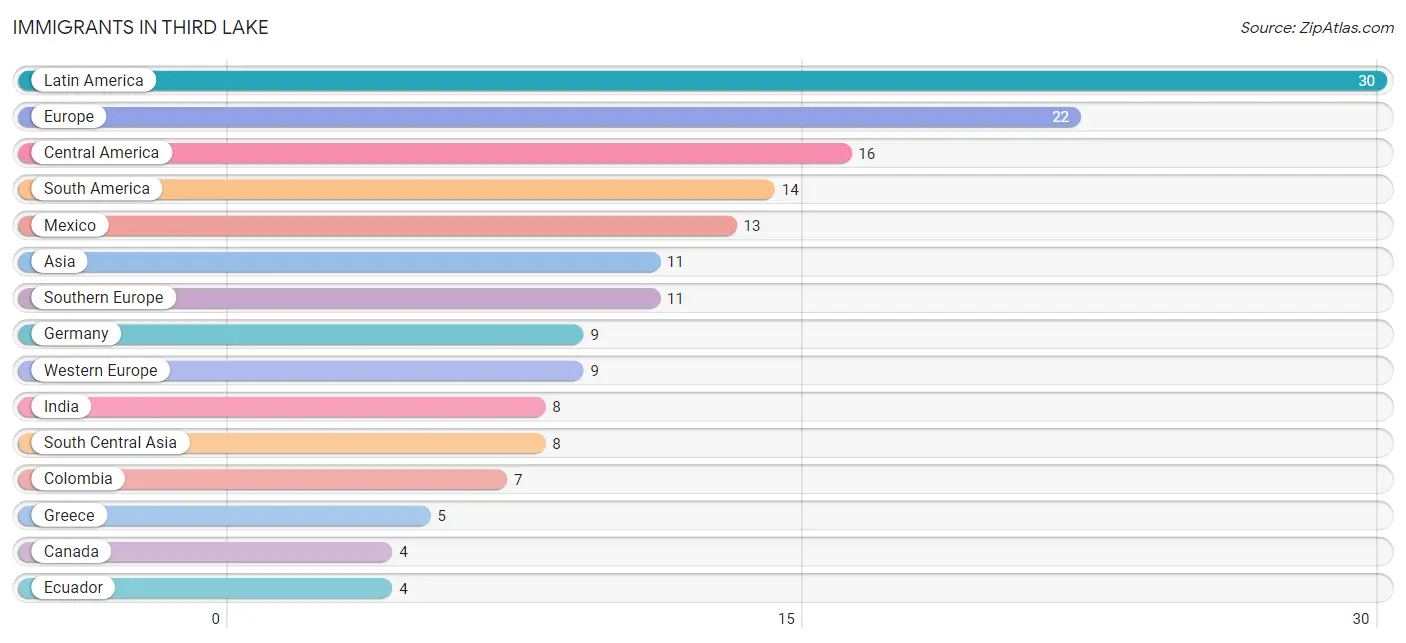
The most numerous immigrant groups reported in Third Lake came from Latin America (30 | 2.5%), Europe (22 | 1.8%), Central America (16 | 1.3%), South America (14 | 1.1%), and Mexico (13 | 1.1%), together accounting for 7.8% of all Third Lake residents.
| Immigration Origin | # Population | % Population |
| Asia | 11 | 0.9% |
| Brazil | 3 | 0.3% |
| Canada | 4 | 0.3% |
| Central America | 16 | 1.3% |
| Colombia | 7 | 0.6% |
| Eastern Europe | 2 | 0.2% |
| Ecuador | 4 | 0.3% |
| Europe | 22 | 1.8% |
| Germany | 9 | 0.7% |
| Greece | 5 | 0.4% |
| Guatemala | 3 | 0.3% |
| India | 8 | 0.7% |
| Italy | 2 | 0.2% |
| Latin America | 30 | 2.5% |
| Mexico | 13 | 1.1% |
| Philippines | 3 | 0.3% |
| Serbia | 2 | 0.2% |
| South America | 14 | 1.1% |
| South Central Asia | 8 | 0.7% |
| South Eastern Asia | 3 | 0.3% |
| Southern Europe | 11 | 0.9% |
| Spain | 4 | 0.3% |
| Western Europe | 9 | 0.7% | View All 23 Rows |
Sex and Age in Third Lake
Sex and Age in Third Lake
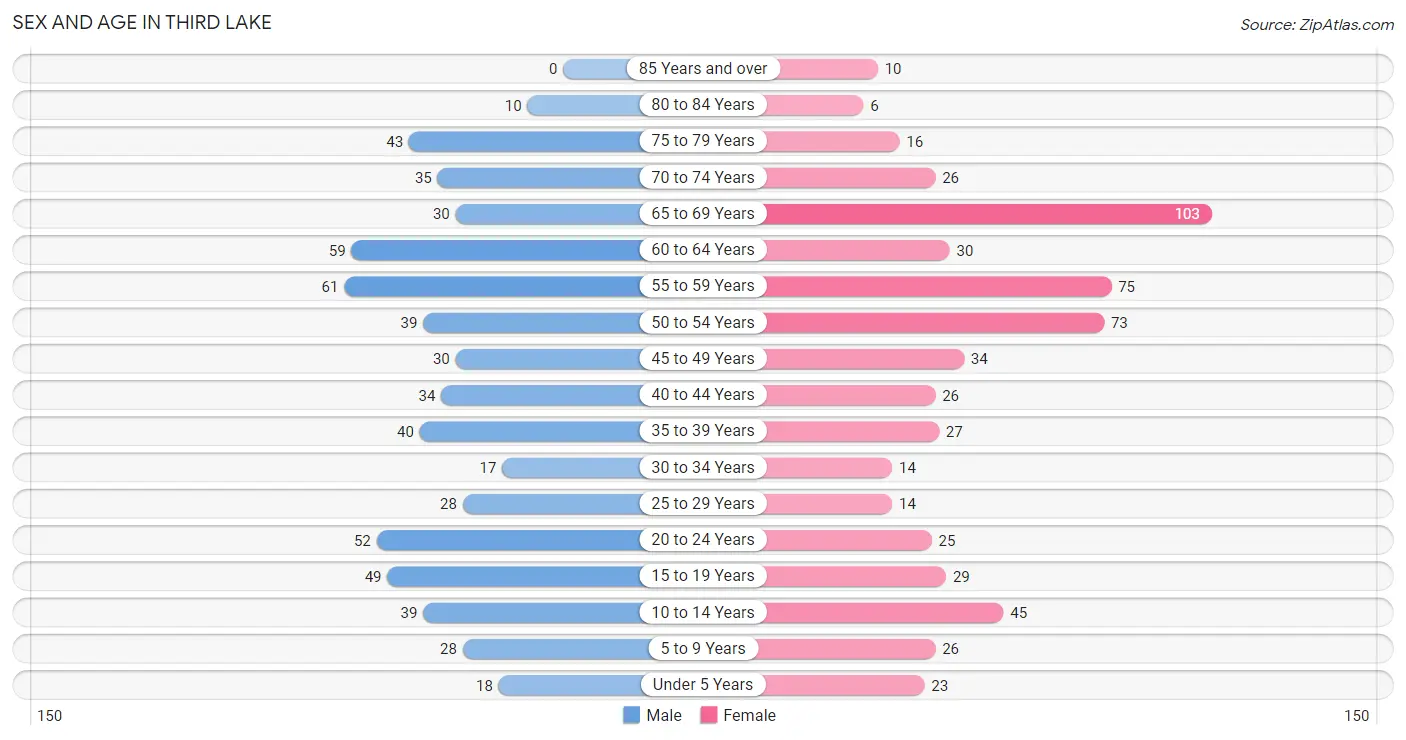
The most populous age groups in Third Lake are 55 to 59 Years (61 | 10.0%) for men and 65 to 69 Years (103 | 17.1%) for women.
| Age Bracket | Male | Female |
| Under 5 Years | 18 (2.9%) | 23 (3.8%) |
| 5 to 9 Years | 28 (4.6%) | 26 (4.3%) |
| 10 to 14 Years | 39 (6.4%) | 45 (7.5%) |
| 15 to 19 Years | 49 (8.0%) | 29 (4.8%) |
| 20 to 24 Years | 52 (8.5%) | 25 (4.2%) |
| 25 to 29 Years | 28 (4.6%) | 14 (2.3%) |
| 30 to 34 Years | 17 (2.8%) | 14 (2.3%) |
| 35 to 39 Years | 40 (6.5%) | 27 (4.5%) |
| 40 to 44 Years | 34 (5.6%) | 26 (4.3%) |
| 45 to 49 Years | 30 (4.9%) | 34 (5.7%) |
| 50 to 54 Years | 39 (6.4%) | 73 (12.1%) |
| 55 to 59 Years | 61 (10.0%) | 75 (12.5%) |
| 60 to 64 Years | 59 (9.6%) | 30 (5.0%) |
| 65 to 69 Years | 30 (4.9%) | 103 (17.1%) |
| 70 to 74 Years | 35 (5.7%) | 26 (4.3%) |
| 75 to 79 Years | 43 (7.0%) | 16 (2.7%) |
| 80 to 84 Years | 10 (1.6%) | 6 (1.0%) |
| 85 Years and over | 0 (0.0%) | 10 (1.7%) |
| Total | 612 (100.0%) | 602 (100.0%) |
Families and Households in Third Lake
Median Family Size in Third Lake
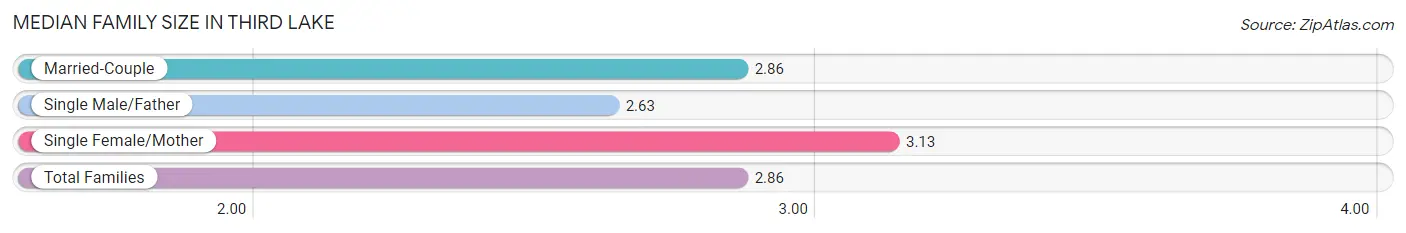
The median family size in Third Lake is 2.86 persons per family, with single female/mother families (16 | 4.2%) accounting for the largest median family size of 3.13 persons per family. On the other hand, single male/father families (8 | 2.1%) represent the smallest median family size with 2.63 persons per family.
| Family Type | # Families | Family Size |
| Married-Couple | 361 (93.8%) | 2.86 |
| Single Male/Father | 8 (2.1%) | 2.63 |
| Single Female/Mother | 16 (4.2%) | 3.13 |
| Total Families | 385 (100.0%) | 2.86 |
Median Household Size in Third Lake
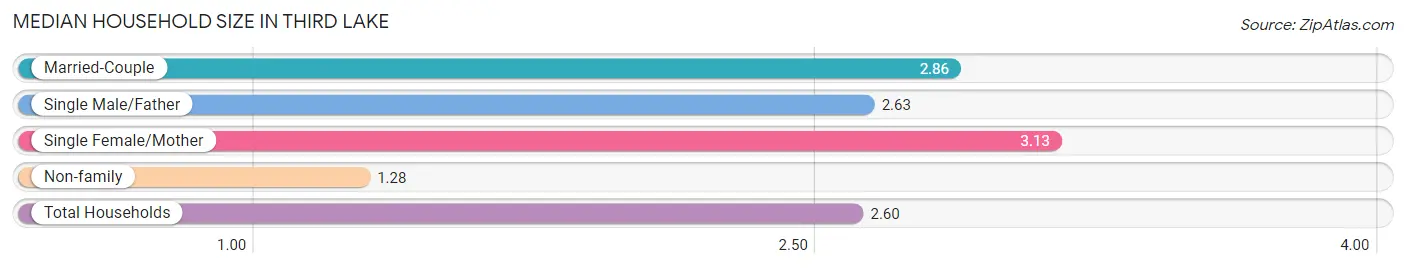
The median household size in Third Lake is 2.60 persons per household, with single female/mother households (16 | 3.5%) accounting for the largest median household size of 3.13 persons per household. non-family households (75 | 16.3%) represent the smallest median household size with 1.28 persons per household.
| Household Type | # Households | Household Size |
| Married-Couple | 361 (78.5%) | 2.86 |
| Single Male/Father | 8 (1.7%) | 2.63 |
| Single Female/Mother | 16 (3.5%) | 3.13 |
| Non-family | 75 (16.3%) | 1.28 |
| Total Households | 460 (100.0%) | 2.60 |
Household Size by Marriage Status in Third Lake
Out of a total of 460 households in Third Lake, 385 (83.7%) are family households, while 75 (16.3%) are nonfamily households. The most numerous type of family households are 2-person households, comprising 208, and the most common type of nonfamily households are 1-person households, comprising 53.
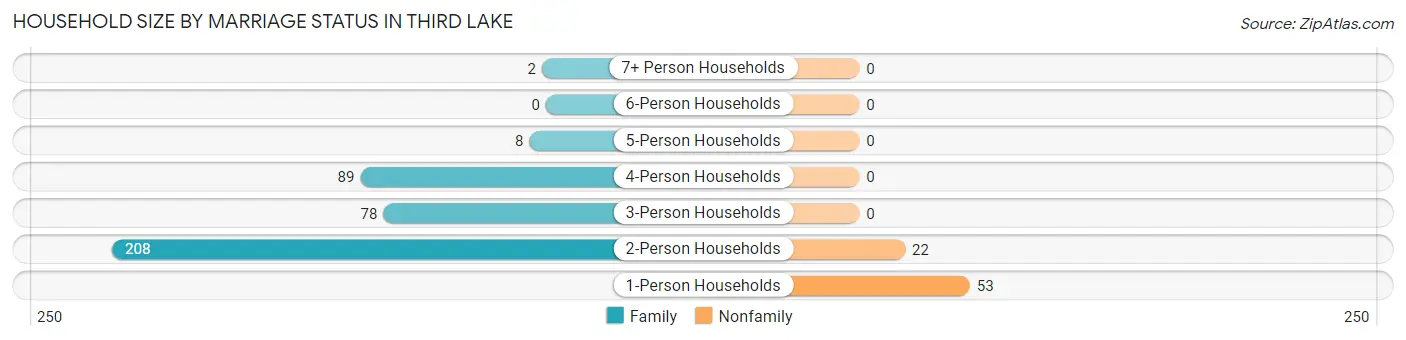
| Household Size | Family Households | Nonfamily Households |
| 1-Person Households | - | 53 (11.5%) |
| 2-Person Households | 208 (45.2%) | 22 (4.8%) |
| 3-Person Households | 78 (17.0%) | 0 (0.0%) |
| 4-Person Households | 89 (19.4%) | 0 (0.0%) |
| 5-Person Households | 8 (1.7%) | 0 (0.0%) |
| 6-Person Households | 0 (0.0%) | 0 (0.0%) |
| 7+ Person Households | 2 (0.4%) | 0 (0.0%) |
| Total | 385 (83.7%) | 75 (16.3%) |
Female Fertility in Third Lake
Fertility by Age in Third Lake
Average fertility rate in Third Lake is 36.0 births per 1,000 women. Women in the age bracket of 35 to 50 years have the highest fertility rate with 61.0 births per 1,000 women. Women in the age bracket of 35 to 50 years acount for 100.0% of all women with births.
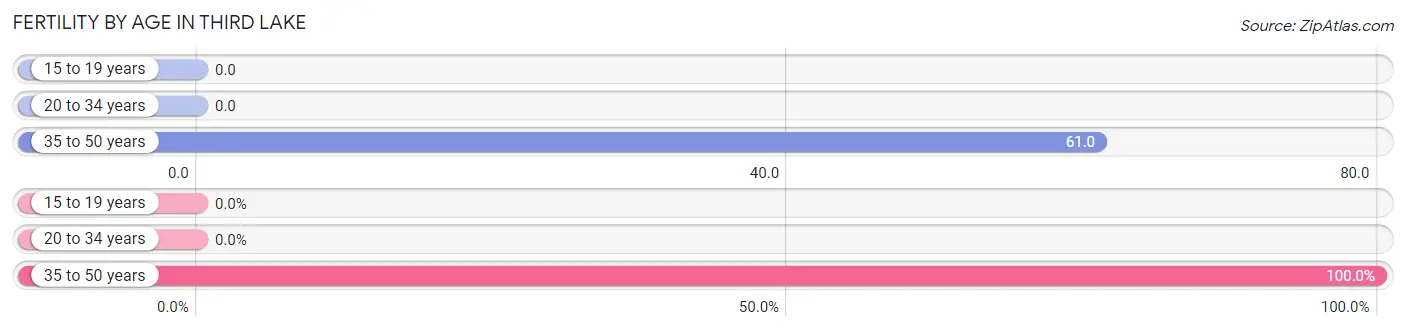
| Age Bracket | Women with Births | Births / 1,000 Women |
| 15 to 19 years | 0 (0.0%) | 0.0 |
| 20 to 34 years | 0 (0.0%) | 0.0 |
| 35 to 50 years | 7 (100.0%) | 61.0 |
| Total | 7 (100.0%) | 36.0 |
Fertility by Age by Marriage Status in Third Lake
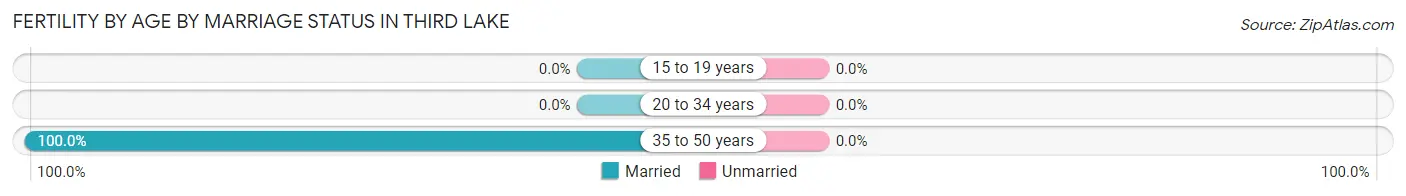
| Age Bracket | Married | Unmarried |
| 15 to 19 years | 0 (0.0%) | 0 (0.0%) |
| 20 to 34 years | 0 (0.0%) | 0 (0.0%) |
| 35 to 50 years | 7 (100.0%) | 0 (0.0%) |
| Total | 7 (100.0%) | 0 (0.0%) |
Fertility by Education in Third Lake
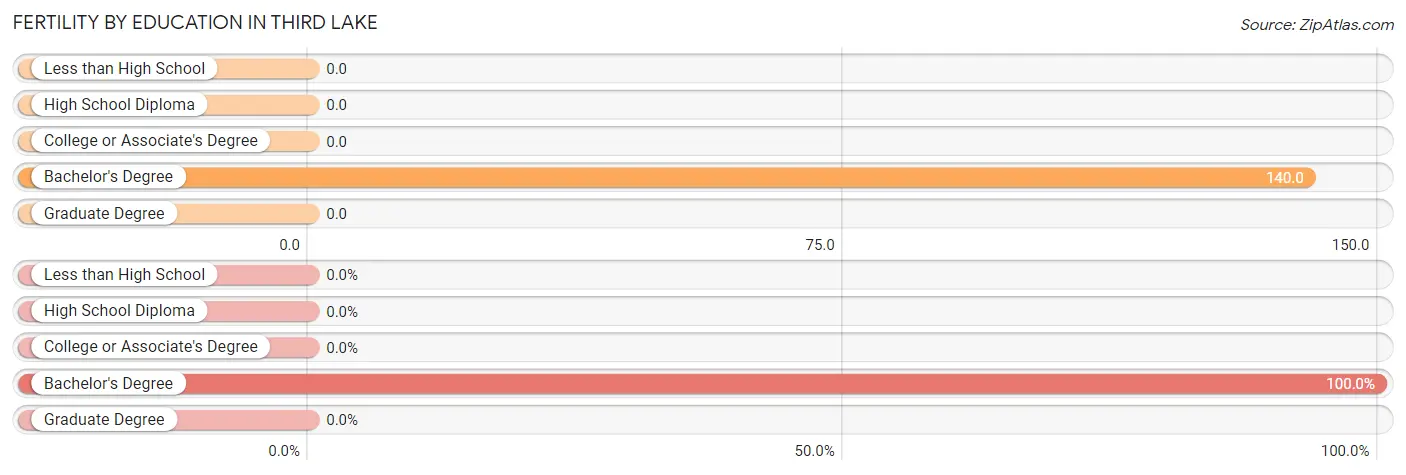
| Educational Attainment | Women with Births | Births / 1,000 Women |
| Less than High School | 0 (0.0%) | 0.0 |
| High School Diploma | 0 (0.0%) | 0.0 |
| College or Associate's Degree | 0 (0.0%) | 0.0 |
| Bachelor's Degree | 7 (100.0%) | 140.0 |
| Graduate Degree | 0 (0.0%) | 0.0 |
| Total | 7 (100.0%) | 36.0 |
Fertility by Education by Marriage Status in Third Lake
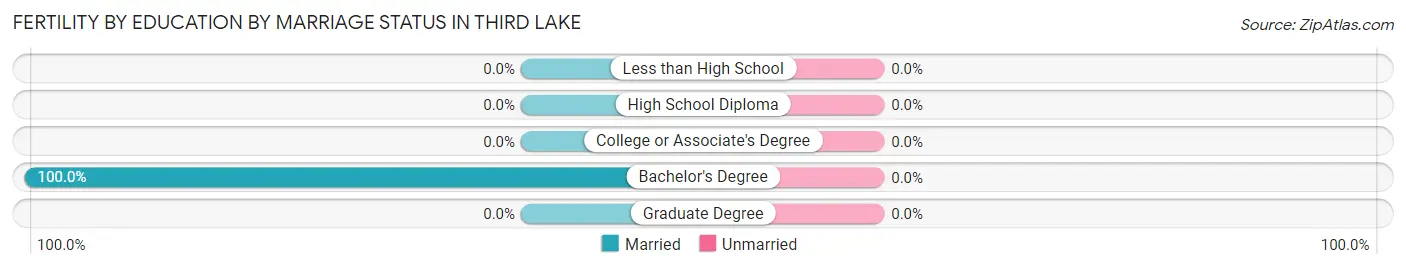
| Educational Attainment | Married | Unmarried |
| Less than High School | 0 (0.0%) | 0 (0.0%) |
| High School Diploma | 0 (0.0%) | 0 (0.0%) |
| College or Associate's Degree | 0 (0.0%) | 0 (0.0%) |
| Bachelor's Degree | 7 (100.0%) | 0 (0.0%) |
| Graduate Degree | 0 (0.0%) | 0 (0.0%) |
| Total | 7 (100.0%) | 0 (0.0%) |
Employment Characteristics in Third Lake
Employment by Class of Employer in Third Lake
Among the 626 employed individuals in Third Lake, private company employees (426 | 68.0%), local government employees (76 | 12.1%), and not-for-profit organizations (67 | 10.7%) make up the most common classes of employment.
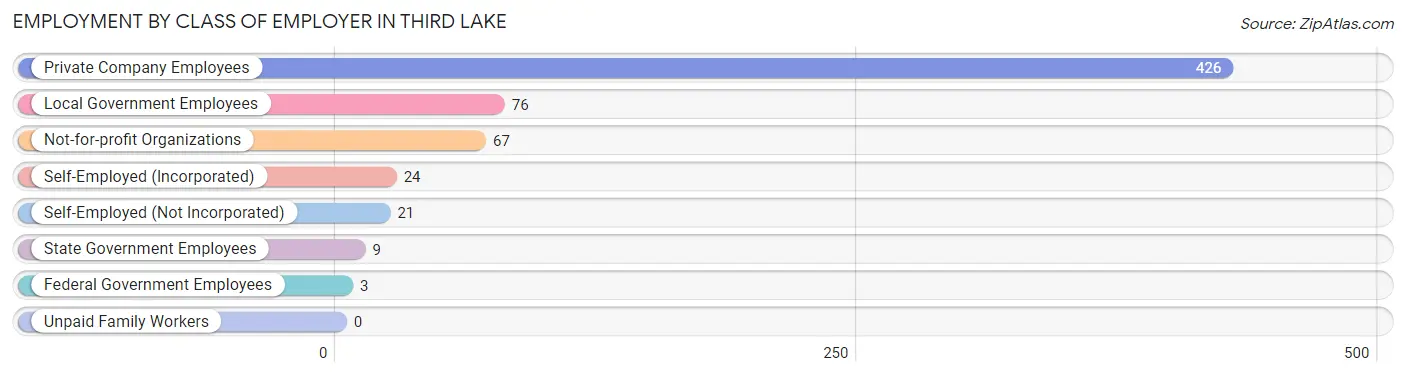
| Employer Class | # Employees | % Employees |
| Private Company Employees | 426 | 68.0% |
| Self-Employed (Incorporated) | 24 | 3.8% |
| Self-Employed (Not Incorporated) | 21 | 3.4% |
| Not-for-profit Organizations | 67 | 10.7% |
| Local Government Employees | 76 | 12.1% |
| State Government Employees | 9 | 1.4% |
| Federal Government Employees | 3 | 0.5% |
| Unpaid Family Workers | 0 | 0.0% |
| Total | 626 | 100.0% |
Employment Status by Age in Third Lake
According to the labor force statistics for Third Lake, out of the total population over 16 years of age (1,025), 63.7% or 653 individuals are in the labor force, with 3.7% or 24 of them unemployed. The age group with the highest labor force participation rate is 30 to 34 years, with 100.0% or 31 individuals in the labor force. Within the labor force, the 35 to 44 years age range has the highest percentage of unemployed individuals, with 13.0% or 14 of them being unemployed.
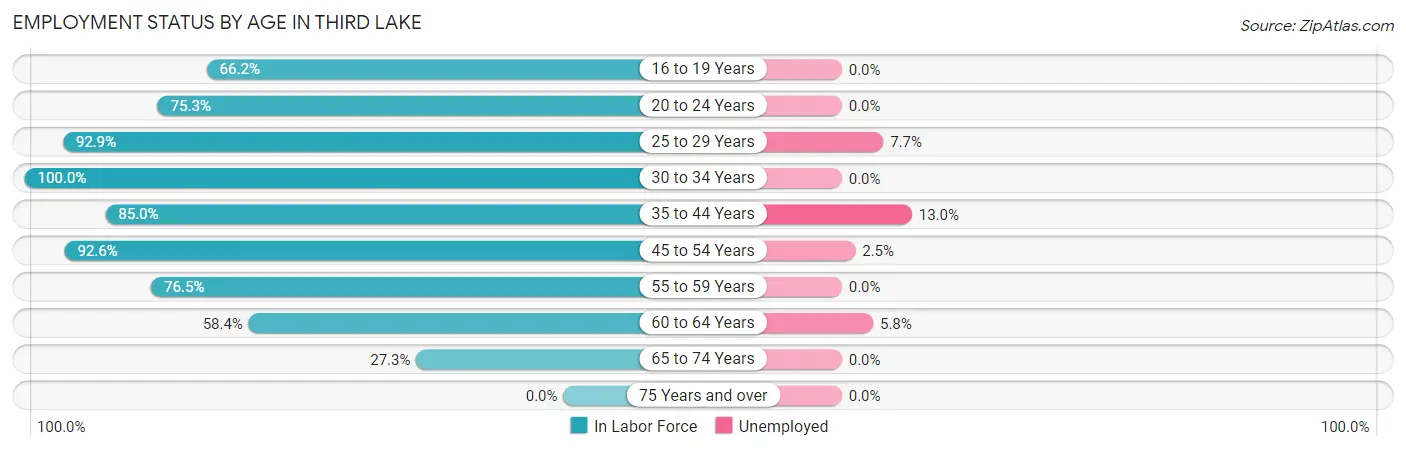
| Age Bracket | In Labor Force | Unemployed |
| 16 to 19 Years | 45 (66.2%) | 0 (0.0%) |
| 20 to 24 Years | 58 (75.3%) | 0 (0.0%) |
| 25 to 29 Years | 39 (92.9%) | 3 (7.7%) |
| 30 to 34 Years | 31 (100.0%) | 0 (0.0%) |
| 35 to 44 Years | 108 (85.0%) | 14 (13.0%) |
| 45 to 54 Years | 163 (92.6%) | 4 (2.5%) |
| 55 to 59 Years | 104 (76.5%) | 0 (0.0%) |
| 60 to 64 Years | 52 (58.4%) | 3 (5.8%) |
| 65 to 74 Years | 53 (27.3%) | 0 (0.0%) |
| 75 Years and over | 0 (0.0%) | 0 (0.0%) |
| Total | 653 (63.7%) | 24 (3.7%) |
Employment Status by Educational Attainment in Third Lake
According to labor force statistics for Third Lake, 82.7% of individuals (497) out of the total population between 25 and 64 years of age (601) are in the labor force, with 4.9% or 24 of them being unemployed. The group with the highest labor force participation rate are those with the educational attainment of less than high school, with 100.0% or 7 individuals in the labor force. Within the labor force, individuals with college / associate degree education have the highest percentage of unemployment, with 13.5% or 15 of them being unemployed.
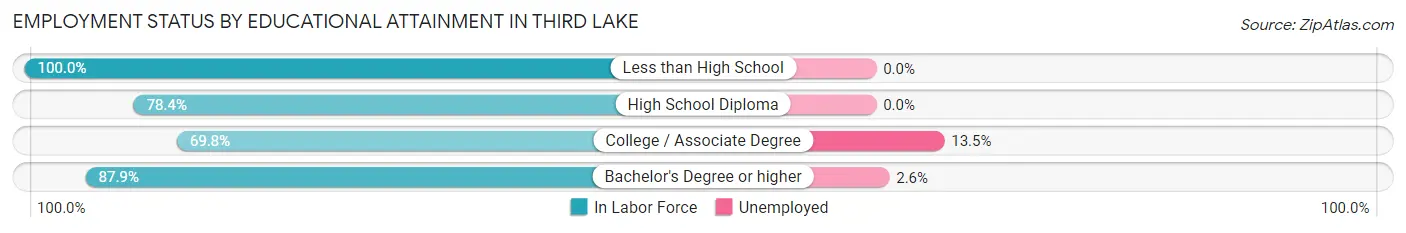
| Educational Attainment | In Labor Force | Unemployed |
| Less than High School | 7 (100.0%) | 0 (0.0%) |
| High School Diploma | 29 (78.4%) | 0 (0.0%) |
| College / Associate Degree | 111 (69.8%) | 21 (13.5%) |
| Bachelor's Degree or higher | 350 (87.9%) | 10 (2.6%) |
| Total | 497 (82.7%) | 29 (4.9%) |
Employment Occupations by Sex in Third Lake
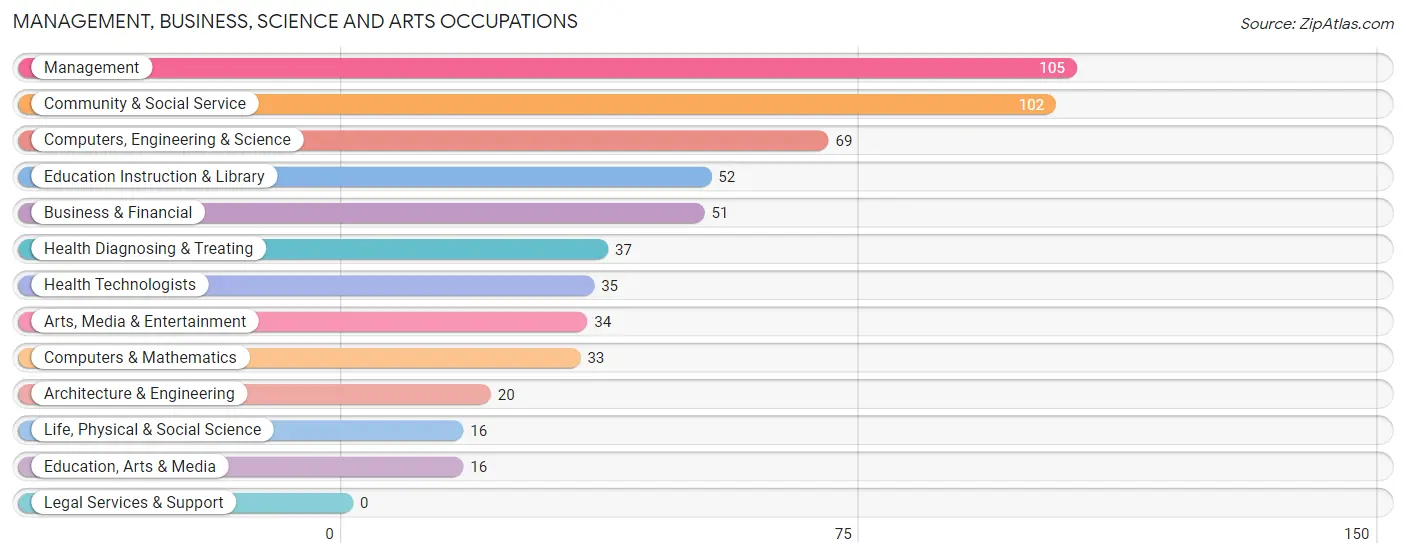
Management, Business, Science and Arts Occupations
The most common Management, Business, Science and Arts occupations in Third Lake are Management (105 | 16.8%), Community & Social Service (102 | 16.3%), Computers, Engineering & Science (69 | 11.0%), Education Instruction & Library (52 | 8.3%), and Business & Financial (51 | 8.2%).
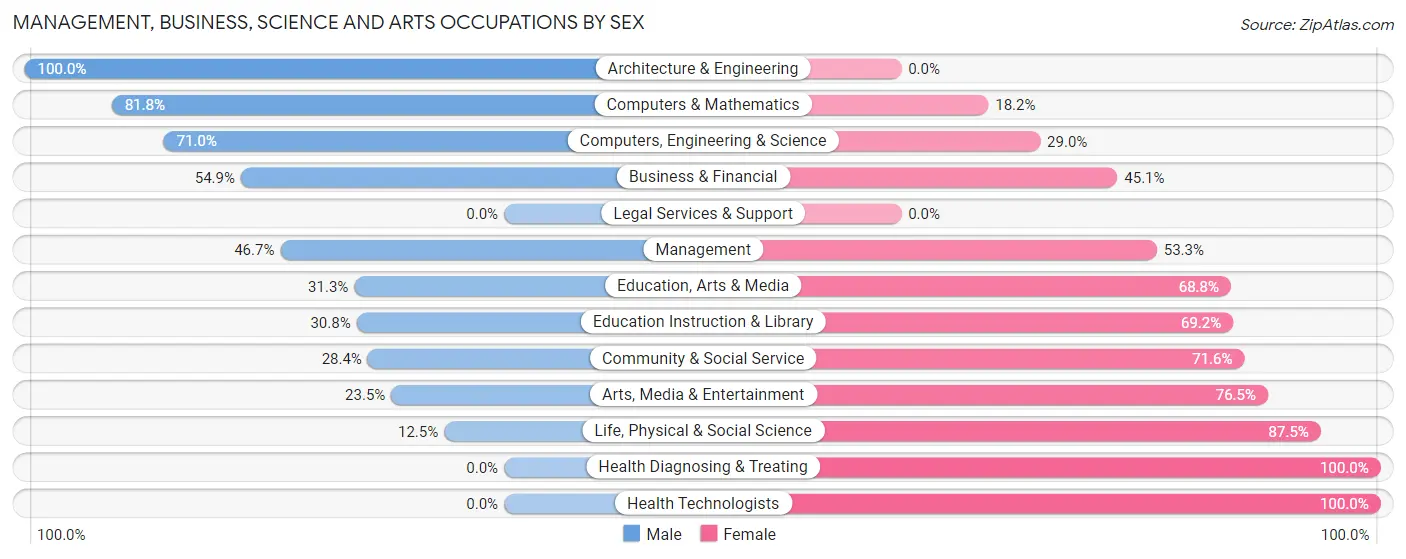
Management, Business, Science and Arts Occupations by Sex
Within the Management, Business, Science and Arts occupations in Third Lake, the most male-oriented occupations are Architecture & Engineering (100.0%), Computers & Mathematics (81.8%), and Computers, Engineering & Science (71.0%), while the most female-oriented occupations are Health Diagnosing & Treating (100.0%), Health Technologists (100.0%), and Life, Physical & Social Science (87.5%).
| Occupation | Male | Female |
| Management | 49 (46.7%) | 56 (53.3%) |
| Business & Financial | 28 (54.9%) | 23 (45.1%) |
| Computers, Engineering & Science | 49 (71.0%) | 20 (29.0%) |
| Computers & Mathematics | 27 (81.8%) | 6 (18.2%) |
| Architecture & Engineering | 20 (100.0%) | 0 (0.0%) |
| Life, Physical & Social Science | 2 (12.5%) | 14 (87.5%) |
| Community & Social Service | 29 (28.4%) | 73 (71.6%) |
| Education, Arts & Media | 5 (31.2%) | 11 (68.8%) |
| Legal Services & Support | 0 (0.0%) | 0 (0.0%) |
| Education Instruction & Library | 16 (30.8%) | 36 (69.2%) |
| Arts, Media & Entertainment | 8 (23.5%) | 26 (76.5%) |
| Health Diagnosing & Treating | 0 (0.0%) | 37 (100.0%) |
| Health Technologists | 0 (0.0%) | 35 (100.0%) |
| Total (Category) | 155 (42.6%) | 209 (57.4%) |
| Total (Overall) | 342 (54.6%) | 284 (45.4%) |
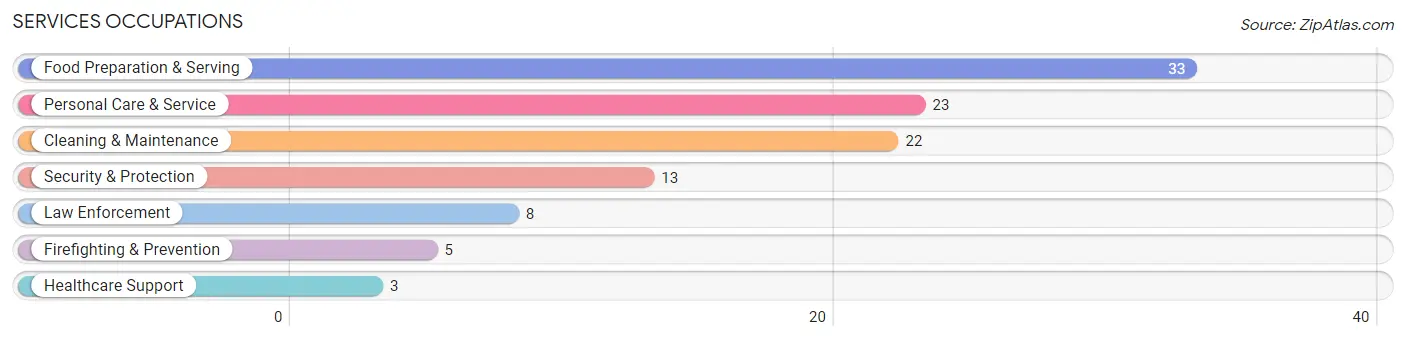
Services Occupations
The most common Services occupations in Third Lake are Food Preparation & Serving (33 | 5.3%), Personal Care & Service (23 | 3.7%), Cleaning & Maintenance (22 | 3.5%), Security & Protection (13 | 2.1%), and Law Enforcement (8 | 1.3%).
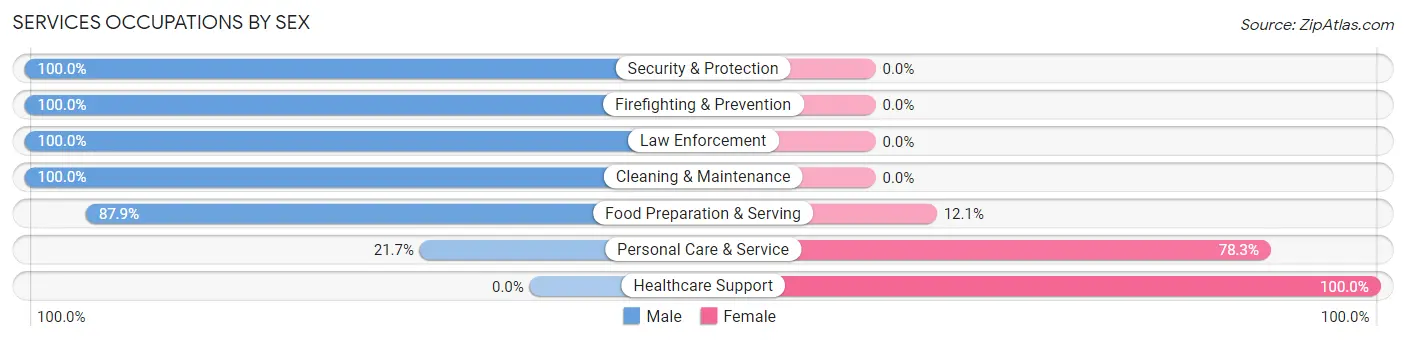
Services Occupations by Sex
Within the Services occupations in Third Lake, the most male-oriented occupations are Security & Protection (100.0%), Firefighting & Prevention (100.0%), and Law Enforcement (100.0%), while the most female-oriented occupations are Healthcare Support (100.0%), Personal Care & Service (78.3%), and Food Preparation & Serving (12.1%).
| Occupation | Male | Female |
| Healthcare Support | 0 (0.0%) | 3 (100.0%) |
| Security & Protection | 13 (100.0%) | 0 (0.0%) |
| Firefighting & Prevention | 5 (100.0%) | 0 (0.0%) |
| Law Enforcement | 8 (100.0%) | 0 (0.0%) |
| Food Preparation & Serving | 29 (87.9%) | 4 (12.1%) |
| Cleaning & Maintenance | 22 (100.0%) | 0 (0.0%) |
| Personal Care & Service | 5 (21.7%) | 18 (78.3%) |
| Total (Category) | 69 (73.4%) | 25 (26.6%) |
| Total (Overall) | 342 (54.6%) | 284 (45.4%) |
Sales and Office Occupations
The most common Sales and Office occupations in Third Lake are Sales & Related (72 | 11.5%), and Office & Administration (24 | 3.8%).
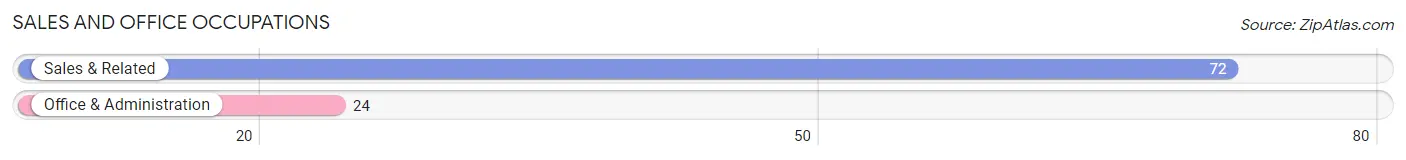
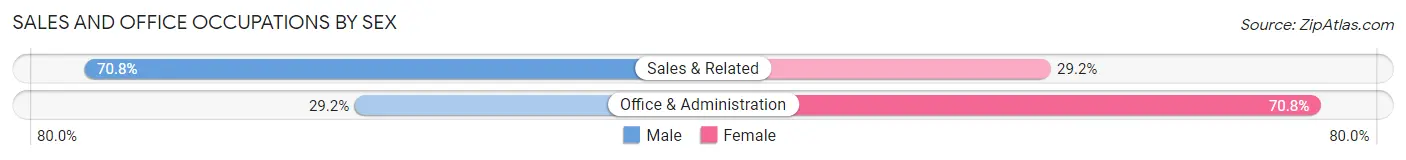
Sales and Office Occupations by Sex
| Occupation | Male | Female |
| Sales & Related | 51 (70.8%) | 21 (29.2%) |
| Office & Administration | 7 (29.2%) | 17 (70.8%) |
| Total (Category) | 58 (60.4%) | 38 (39.6%) |
| Total (Overall) | 342 (54.6%) | 284 (45.4%) |
Natural Resources, Construction and Maintenance Occupations
The most common Natural Resources, Construction and Maintenance occupations in Third Lake are Construction & Extraction (25 | 4.0%), and Installation, Maintenance & Repair (9 | 1.4%).
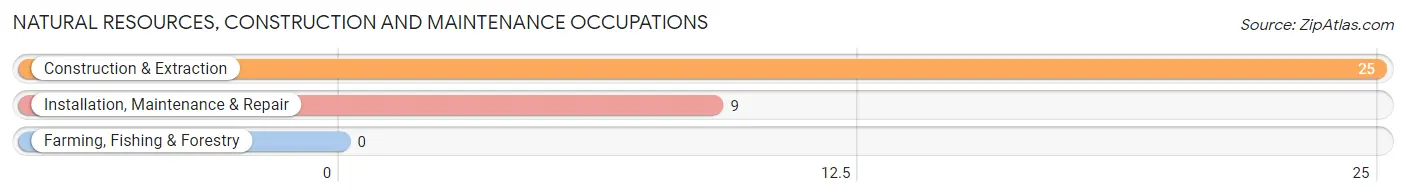
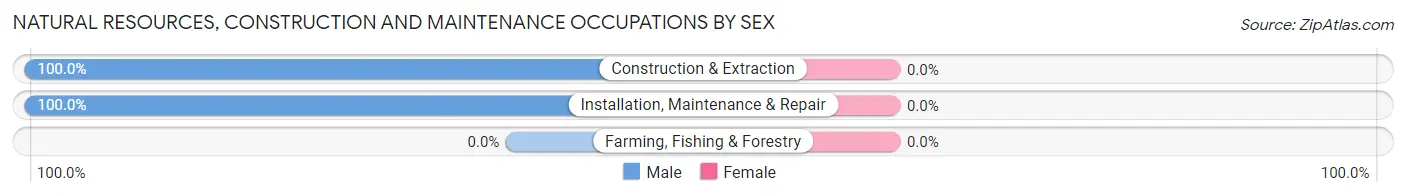
Natural Resources, Construction and Maintenance Occupations by Sex
| Occupation | Male | Female |
| Farming, Fishing & Forestry | 0 (0.0%) | 0 (0.0%) |
| Construction & Extraction | 25 (100.0%) | 0 (0.0%) |
| Installation, Maintenance & Repair | 9 (100.0%) | 0 (0.0%) |
| Total (Category) | 34 (100.0%) | 0 (0.0%) |
| Total (Overall) | 342 (54.6%) | 284 (45.4%) |
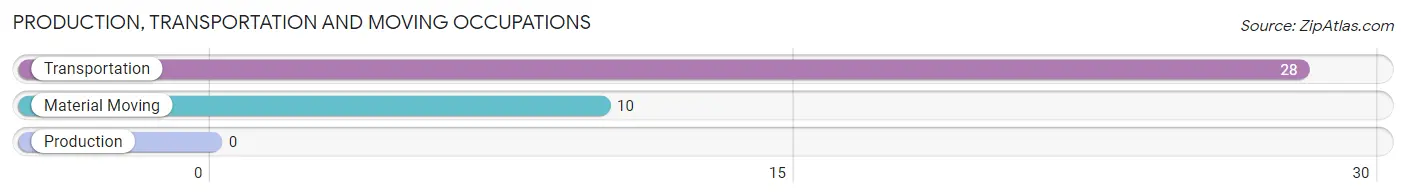
Production, Transportation and Moving Occupations
The most common Production, Transportation and Moving occupations in Third Lake are Transportation (28 | 4.5%), and Material Moving (10 | 1.6%).
Production, Transportation and Moving Occupations by Sex
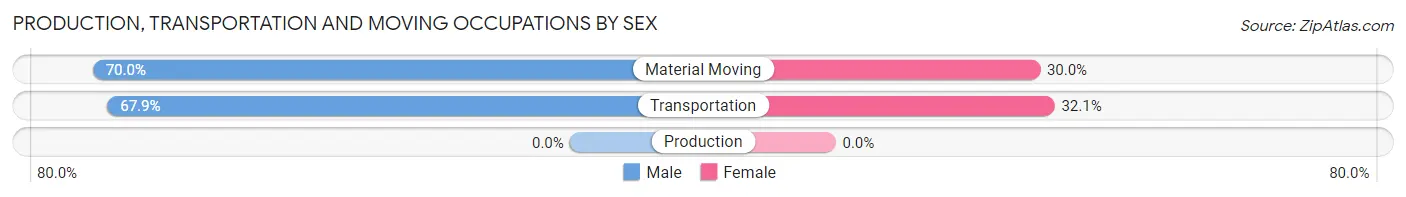
| Occupation | Male | Female |
| Production | 0 (0.0%) | 0 (0.0%) |
| Transportation | 19 (67.9%) | 9 (32.1%) |
| Material Moving | 7 (70.0%) | 3 (30.0%) |
| Total (Category) | 26 (68.4%) | 12 (31.6%) |
| Total (Overall) | 342 (54.6%) | 284 (45.4%) |
Employment Industries by Sex in Third Lake
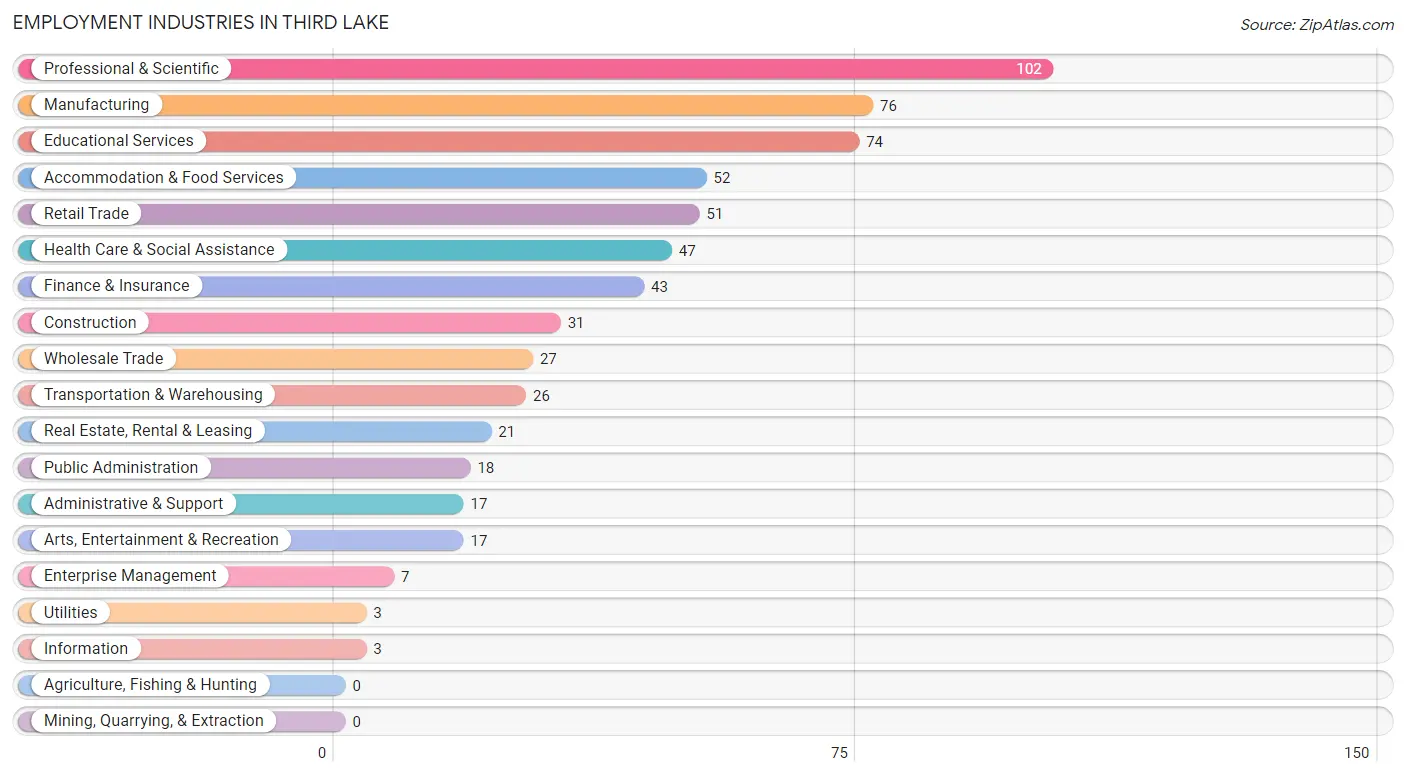
Employment Industries in Third Lake
The major employment industries in Third Lake include Professional & Scientific (102 | 16.3%), Manufacturing (76 | 12.1%), Educational Services (74 | 11.8%), Accommodation & Food Services (52 | 8.3%), and Retail Trade (51 | 8.2%).
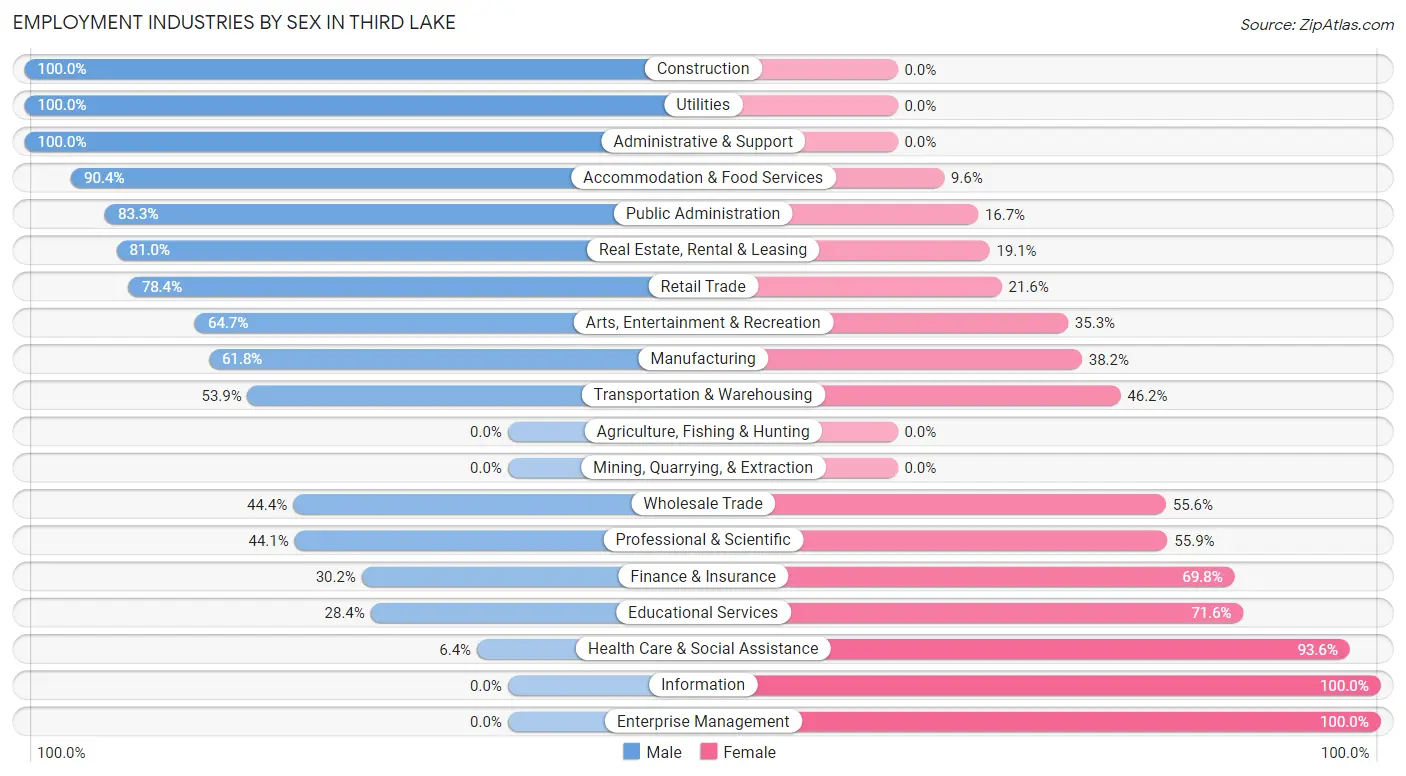
Employment Industries by Sex in Third Lake
The Third Lake industries that see more men than women are Construction (100.0%), Utilities (100.0%), and Administrative & Support (100.0%), whereas the industries that tend to have a higher number of women are Information (100.0%), Enterprise Management (100.0%), and Health Care & Social Assistance (93.6%).
| Industry | Male | Female |
| Agriculture, Fishing & Hunting | 0 (0.0%) | 0 (0.0%) |
| Mining, Quarrying, & Extraction | 0 (0.0%) | 0 (0.0%) |
| Construction | 31 (100.0%) | 0 (0.0%) |
| Manufacturing | 47 (61.8%) | 29 (38.2%) |
| Wholesale Trade | 12 (44.4%) | 15 (55.6%) |
| Retail Trade | 40 (78.4%) | 11 (21.6%) |
| Transportation & Warehousing | 14 (53.8%) | 12 (46.2%) |
| Utilities | 3 (100.0%) | 0 (0.0%) |
| Information | 0 (0.0%) | 3 (100.0%) |
| Finance & Insurance | 13 (30.2%) | 30 (69.8%) |
| Real Estate, Rental & Leasing | 17 (80.9%) | 4 (19.1%) |
| Professional & Scientific | 45 (44.1%) | 57 (55.9%) |
| Enterprise Management | 0 (0.0%) | 7 (100.0%) |
| Administrative & Support | 17 (100.0%) | 0 (0.0%) |
| Educational Services | 21 (28.4%) | 53 (71.6%) |
| Health Care & Social Assistance | 3 (6.4%) | 44 (93.6%) |
| Arts, Entertainment & Recreation | 11 (64.7%) | 6 (35.3%) |
| Accommodation & Food Services | 47 (90.4%) | 5 (9.6%) |
| Public Administration | 15 (83.3%) | 3 (16.7%) |
| Total | 342 (54.6%) | 284 (45.4%) |
Education in Third Lake
School Enrollment in Third Lake
The most common levels of schooling among the 303 students in Third Lake are high school (99 | 32.7%), college / undergraduate (80 | 26.4%), and elementary school (57 | 18.8%).
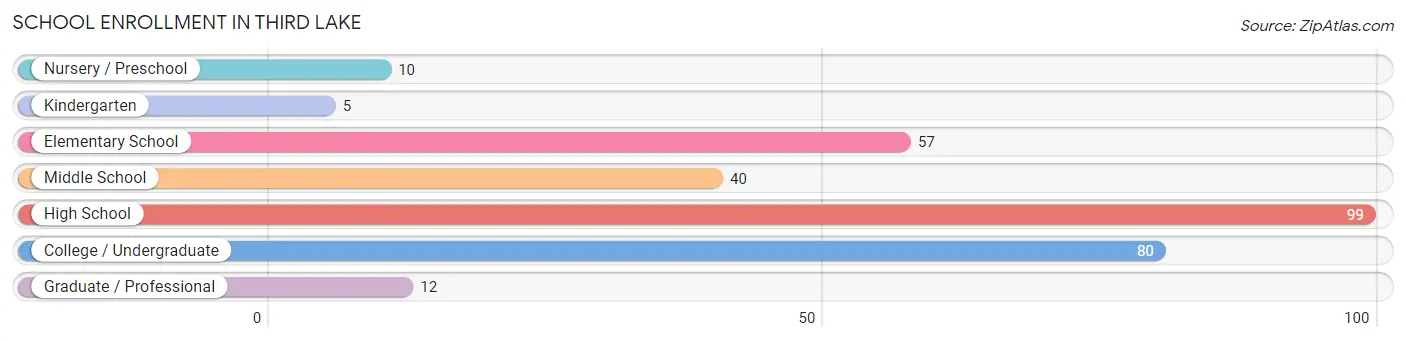
| School Level | # Students | % Students |
| Nursery / Preschool | 10 | 3.3% |
| Kindergarten | 5 | 1.7% |
| Elementary School | 57 | 18.8% |
| Middle School | 40 | 13.2% |
| High School | 99 | 32.7% |
| College / Undergraduate | 80 | 26.4% |
| Graduate / Professional | 12 | 4.0% |
| Total | 303 | 100.0% |
School Enrollment by Age by Funding Source in Third Lake
Out of a total of 303 students who are enrolled in schools in Third Lake, 71 (23.4%) attend a private institution, while the remaining 232 (76.6%) are enrolled in public schools. The age group of 3 to 4 year olds has the highest likelihood of being enrolled in private schools, with 5 (71.4% in the age bracket) enrolled. Conversely, the age group of 18 to 19 year olds has the lowest likelihood of being enrolled in a private school, with 46 (100.0% in the age bracket) attending a public institution.
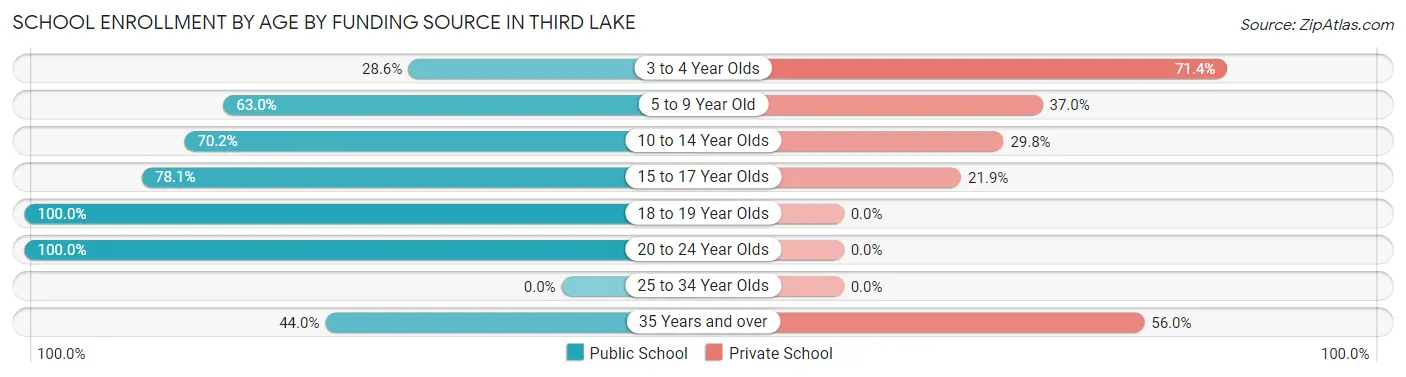
| Age Bracket | Public School | Private School |
| 3 to 4 Year Olds | 2 (28.6%) | 5 (71.4%) |
| 5 to 9 Year Old | 34 (63.0%) | 20 (37.0%) |
| 10 to 14 Year Olds | 59 (70.2%) | 25 (29.8%) |
| 15 to 17 Year Olds | 25 (78.1%) | 7 (21.9%) |
| 18 to 19 Year Olds | 46 (100.0%) | 0 (0.0%) |
| 20 to 24 Year Olds | 55 (100.0%) | 0 (0.0%) |
| 25 to 34 Year Olds | 0 (0.0%) | 0 (0.0%) |
| 35 Years and over | 11 (44.0%) | 14 (56.0%) |
| Total | 232 (76.6%) | 71 (23.4%) |
Educational Attainment by Field of Study in Third Lake
Psychology (125 | 19.4%), business (94 | 14.6%), social sciences (57 | 8.8%), computers & mathematics (52 | 8.1%), and visual & performing arts (52 | 8.1%) are the most common fields of study among 644 individuals in Third Lake who have obtained a bachelor's degree or higher.
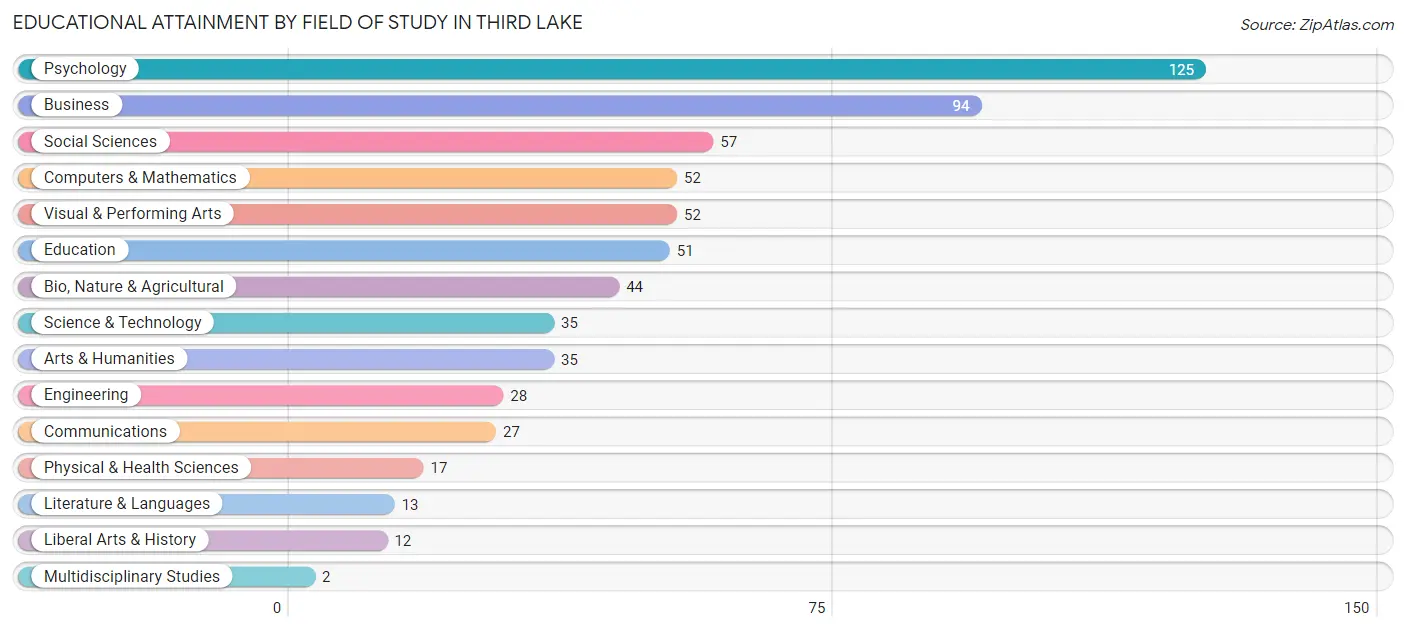
| Field of Study | # Graduates | % Graduates |
| Computers & Mathematics | 52 | 8.1% |
| Bio, Nature & Agricultural | 44 | 6.8% |
| Physical & Health Sciences | 17 | 2.6% |
| Psychology | 125 | 19.4% |
| Social Sciences | 57 | 8.8% |
| Engineering | 28 | 4.3% |
| Multidisciplinary Studies | 2 | 0.3% |
| Science & Technology | 35 | 5.4% |
| Business | 94 | 14.6% |
| Education | 51 | 7.9% |
| Literature & Languages | 13 | 2.0% |
| Liberal Arts & History | 12 | 1.9% |
| Visual & Performing Arts | 52 | 8.1% |
| Communications | 27 | 4.2% |
| Arts & Humanities | 35 | 5.4% |
| Total | 644 | 100.0% |
Transportation & Commute in Third Lake
Vehicle Availability by Sex in Third Lake
The most prevalent vehicle ownership categories in Third Lake are males with 2 vehicles (124, accounting for 36.8%) and females with 2 vehicles (127, making up 43.7%).
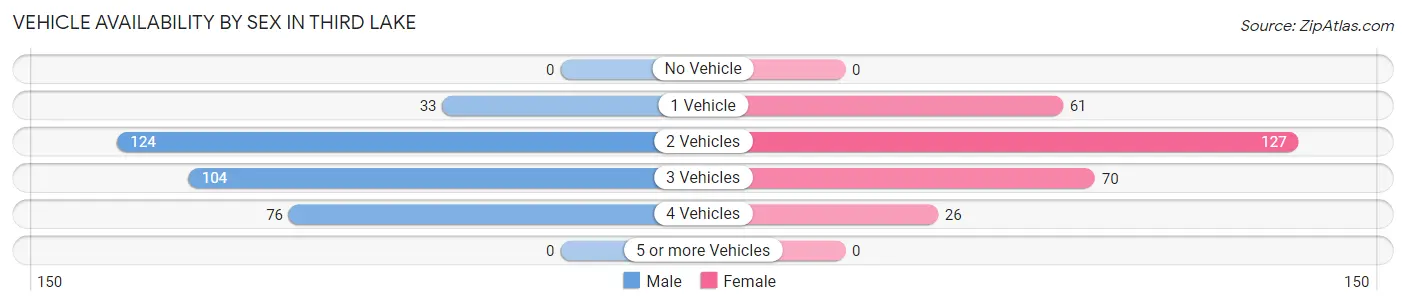
| Vehicles Available | Male | Female |
| No Vehicle | 0 (0.0%) | 0 (0.0%) |
| 1 Vehicle | 33 (9.8%) | 61 (21.5%) |
| 2 Vehicles | 124 (36.8%) | 127 (44.7%) |
| 3 Vehicles | 104 (30.9%) | 70 (24.6%) |
| 4 Vehicles | 76 (22.6%) | 26 (9.1%) |
| 5 or more Vehicles | 0 (0.0%) | 0 (0.0%) |
| Total | 337 (100.0%) | 284 (100.0%) |
Commute Time in Third Lake
The most frequently occuring commute durations in Third Lake are 20 to 24 minutes (100 commuters, 19.2%), 10 to 14 minutes (85 commuters, 16.3%), and 15 to 19 minutes (59 commuters, 11.3%).
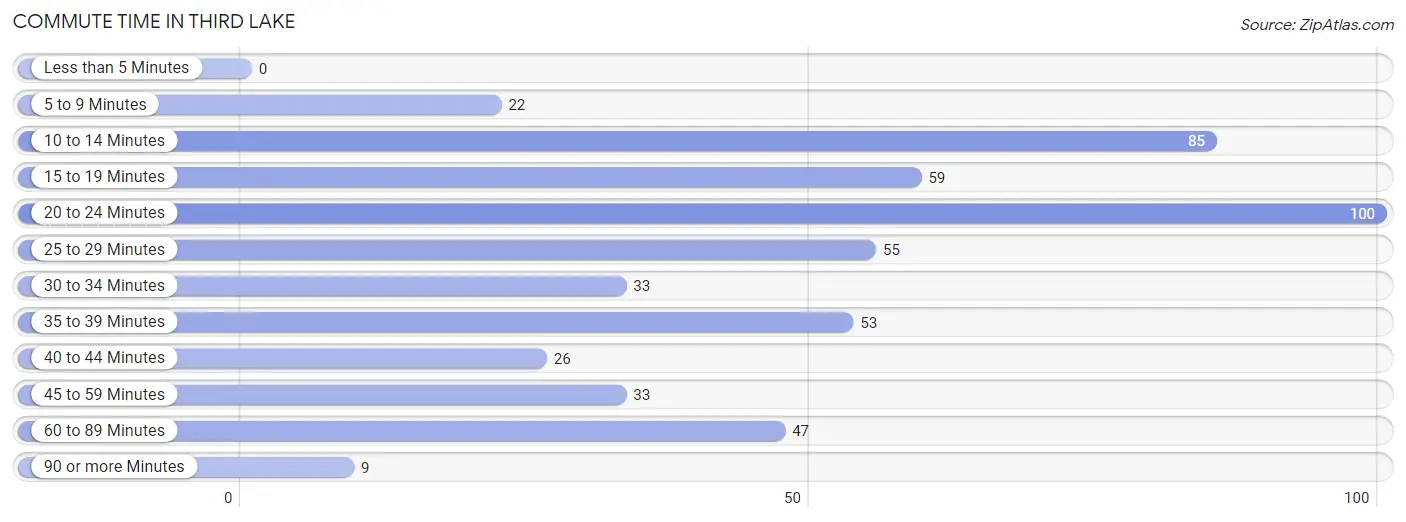
| Commute Time | # Commuters | % Commuters |
| Less than 5 Minutes | 0 | 0.0% |
| 5 to 9 Minutes | 22 | 4.2% |
| 10 to 14 Minutes | 85 | 16.3% |
| 15 to 19 Minutes | 59 | 11.3% |
| 20 to 24 Minutes | 100 | 19.2% |
| 25 to 29 Minutes | 55 | 10.5% |
| 30 to 34 Minutes | 33 | 6.3% |
| 35 to 39 Minutes | 53 | 10.2% |
| 40 to 44 Minutes | 26 | 5.0% |
| 45 to 59 Minutes | 33 | 6.3% |
| 60 to 89 Minutes | 47 | 9.0% |
| 90 or more Minutes | 9 | 1.7% |
Commute Time by Sex in Third Lake
The most common commute times in Third Lake are 20 to 24 minutes (52 commuters, 19.0%) for males and 20 to 24 minutes (48 commuters, 19.4%) for females.
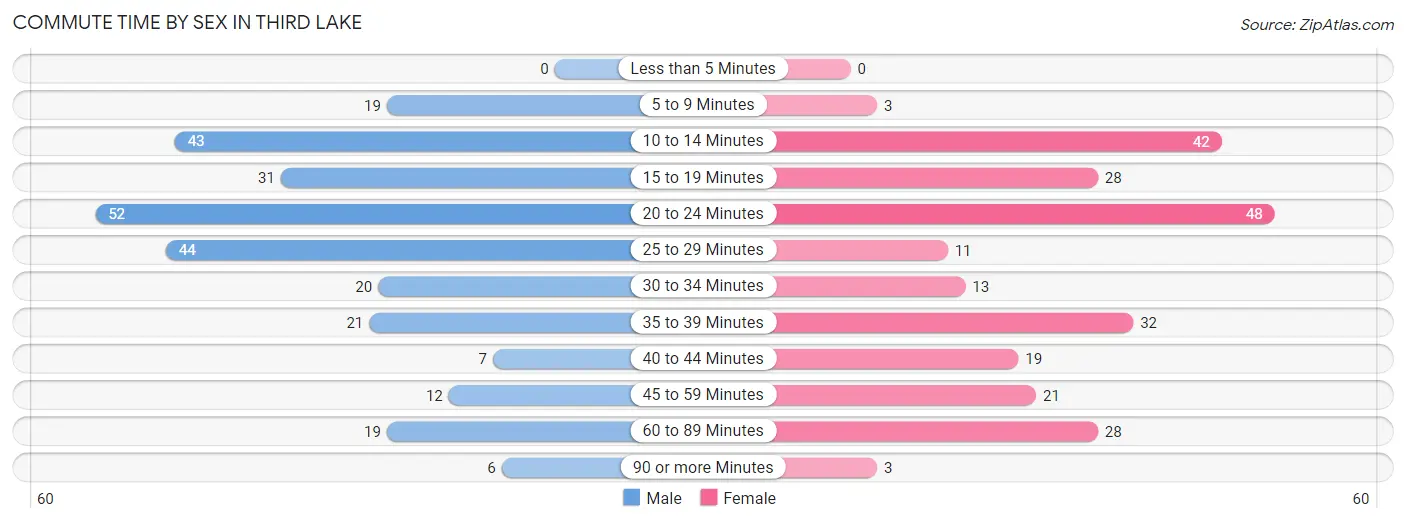
| Commute Time | Male | Female |
| Less than 5 Minutes | 0 (0.0%) | 0 (0.0%) |
| 5 to 9 Minutes | 19 (6.9%) | 3 (1.2%) |
| 10 to 14 Minutes | 43 (15.7%) | 42 (16.9%) |
| 15 to 19 Minutes | 31 (11.3%) | 28 (11.3%) |
| 20 to 24 Minutes | 52 (19.0%) | 48 (19.4%) |
| 25 to 29 Minutes | 44 (16.1%) | 11 (4.4%) |
| 30 to 34 Minutes | 20 (7.3%) | 13 (5.2%) |
| 35 to 39 Minutes | 21 (7.7%) | 32 (12.9%) |
| 40 to 44 Minutes | 7 (2.5%) | 19 (7.7%) |
| 45 to 59 Minutes | 12 (4.4%) | 21 (8.5%) |
| 60 to 89 Minutes | 19 (6.9%) | 28 (11.3%) |
| 90 or more Minutes | 6 (2.2%) | 3 (1.2%) |
Time of Departure to Work by Sex in Third Lake
The most frequent times of departure to work in Third Lake are 7:00 AM to 7:29 AM (60, 21.9%) for males and 7:30 AM to 7:59 AM (63, 25.4%) for females.
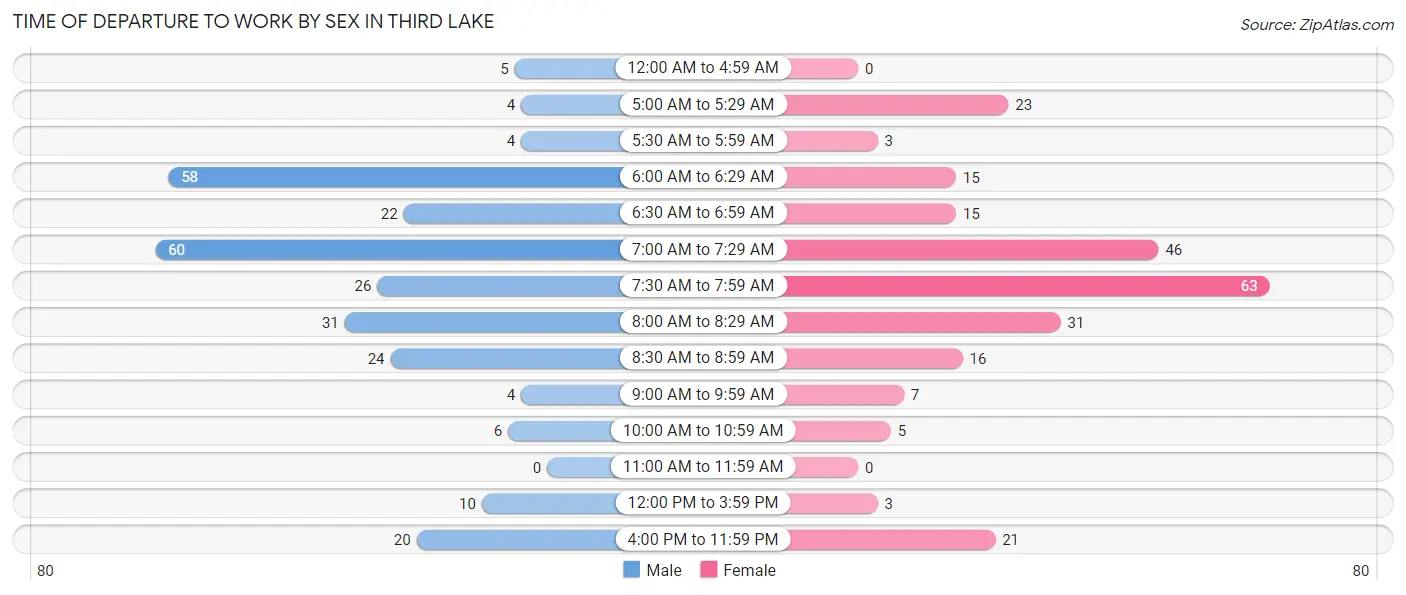
| Time of Departure | Male | Female |
| 12:00 AM to 4:59 AM | 5 (1.8%) | 0 (0.0%) |
| 5:00 AM to 5:29 AM | 4 (1.5%) | 23 (9.3%) |
| 5:30 AM to 5:59 AM | 4 (1.5%) | 3 (1.2%) |
| 6:00 AM to 6:29 AM | 58 (21.2%) | 15 (6.0%) |
| 6:30 AM to 6:59 AM | 22 (8.0%) | 15 (6.0%) |
| 7:00 AM to 7:29 AM | 60 (21.9%) | 46 (18.5%) |
| 7:30 AM to 7:59 AM | 26 (9.5%) | 63 (25.4%) |
| 8:00 AM to 8:29 AM | 31 (11.3%) | 31 (12.5%) |
| 8:30 AM to 8:59 AM | 24 (8.8%) | 16 (6.5%) |
| 9:00 AM to 9:59 AM | 4 (1.5%) | 7 (2.8%) |
| 10:00 AM to 10:59 AM | 6 (2.2%) | 5 (2.0%) |
| 11:00 AM to 11:59 AM | 0 (0.0%) | 0 (0.0%) |
| 12:00 PM to 3:59 PM | 10 (3.6%) | 3 (1.2%) |
| 4:00 PM to 11:59 PM | 20 (7.3%) | 21 (8.5%) |
| Total | 274 (100.0%) | 248 (100.0%) |
Housing Occupancy in Third Lake
Occupancy by Ownership in Third Lake
Of the total 460 dwellings in Third Lake, owner-occupied units account for 457 (99.4%), while renter-occupied units make up 3 (0.6%).
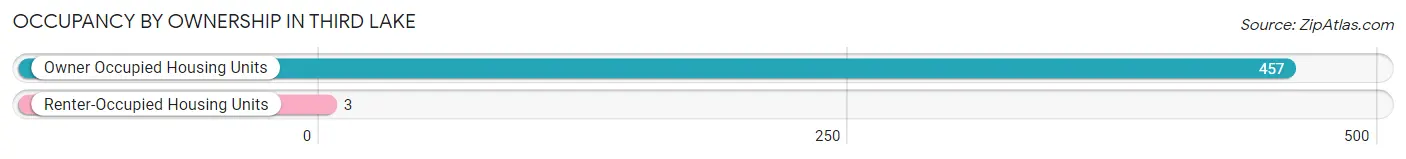
| Occupancy | # Housing Units | % Housing Units |
| Owner Occupied Housing Units | 457 | 99.4% |
| Renter-Occupied Housing Units | 3 | 0.6% |
| Total Occupied Housing Units | 460 | 100.0% |
Occupancy by Household Size in Third Lake
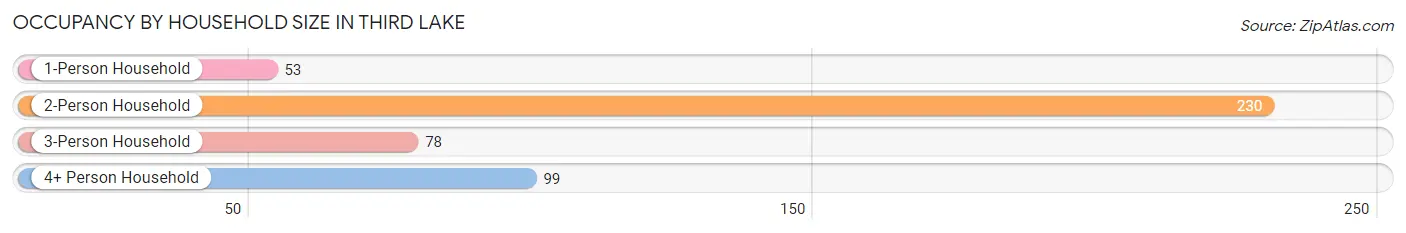
| Household Size | # Housing Units | % Housing Units |
| 1-Person Household | 53 | 11.5% |
| 2-Person Household | 230 | 50.0% |
| 3-Person Household | 78 | 17.0% |
| 4+ Person Household | 99 | 21.5% |
| Total Housing Units | 460 | 100.0% |
Occupancy by Ownership by Household Size in Third Lake
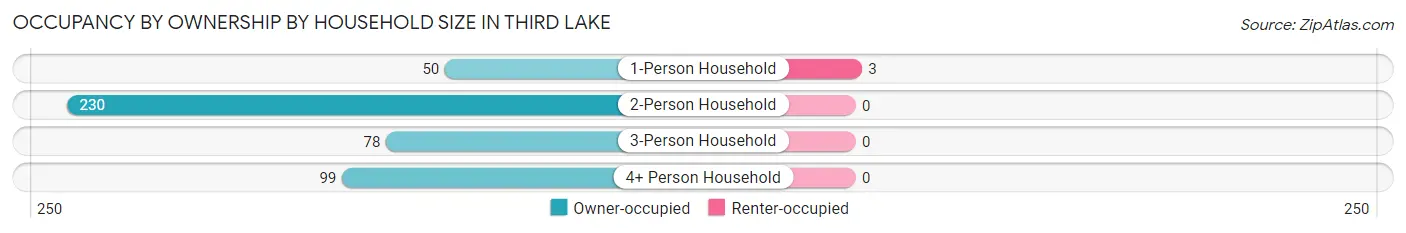
| Household Size | Owner-occupied | Renter-occupied |
| 1-Person Household | 50 (94.3%) | 3 (5.7%) |
| 2-Person Household | 230 (100.0%) | 0 (0.0%) |
| 3-Person Household | 78 (100.0%) | 0 (0.0%) |
| 4+ Person Household | 99 (100.0%) | 0 (0.0%) |
| Total Housing Units | 457 (99.4%) | 3 (0.6%) |
Occupancy by Educational Attainment in Third Lake
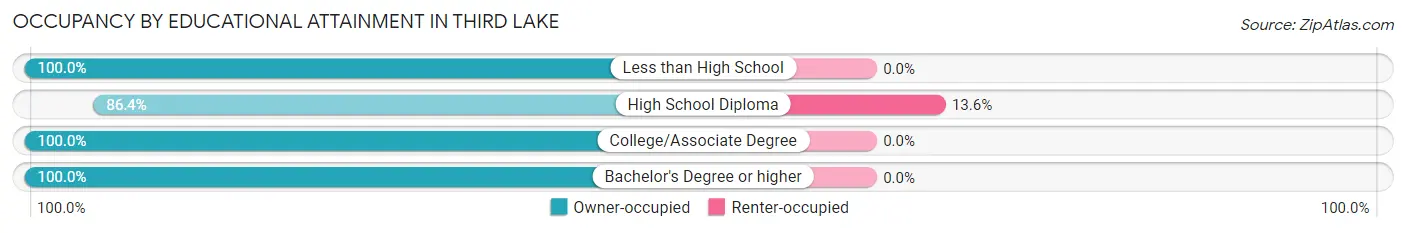
| Household Size | Owner-occupied | Renter-occupied |
| Less than High School | 6 (100.0%) | 0 (0.0%) |
| High School Diploma | 19 (86.4%) | 3 (13.6%) |
| College/Associate Degree | 112 (100.0%) | 0 (0.0%) |
| Bachelor's Degree or higher | 320 (100.0%) | 0 (0.0%) |
Occupancy by Age of Householder in Third Lake
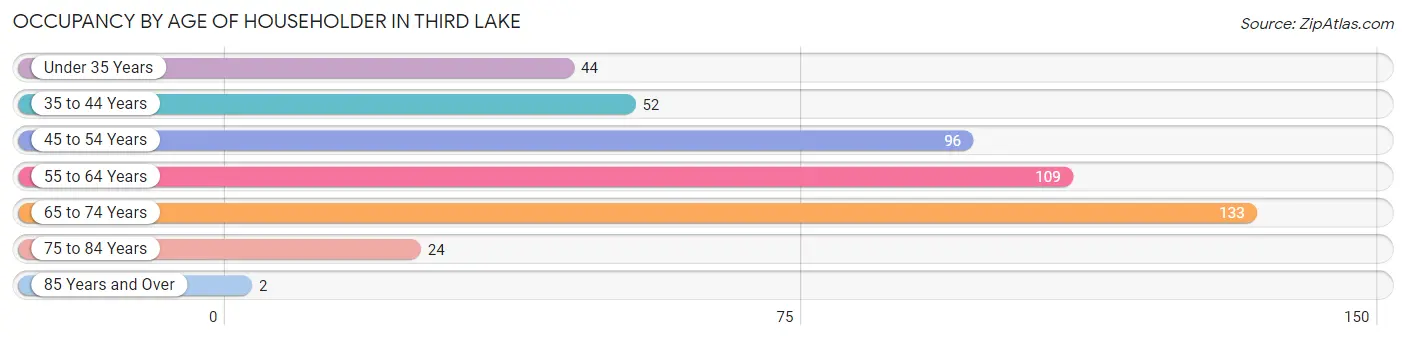
| Age Bracket | # Households | % Households |
| Under 35 Years | 44 | 9.6% |
| 35 to 44 Years | 52 | 11.3% |
| 45 to 54 Years | 96 | 20.9% |
| 55 to 64 Years | 109 | 23.7% |
| 65 to 74 Years | 133 | 28.9% |
| 75 to 84 Years | 24 | 5.2% |
| 85 Years and Over | 2 | 0.4% |
| Total | 460 | 100.0% |
Housing Finances in Third Lake
Median Income by Occupancy in Third Lake
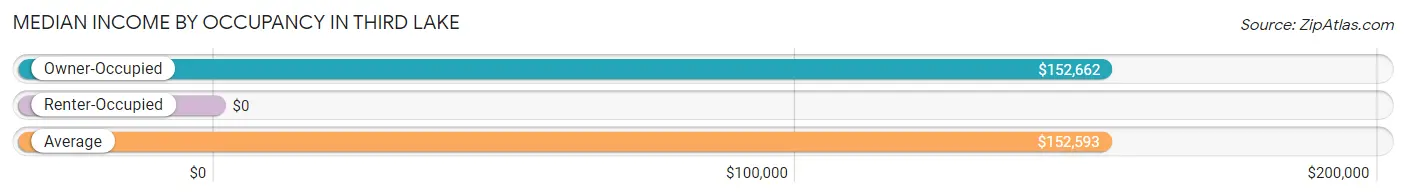
| Occupancy Type | # Households | Median Income |
| Owner-Occupied | 457 (99.4%) | $152,662 |
| Renter-Occupied | 3 (0.6%) | $0 |
| Average | 460 (100.0%) | $152,593 |
Occupancy by Householder Income Bracket in Third Lake
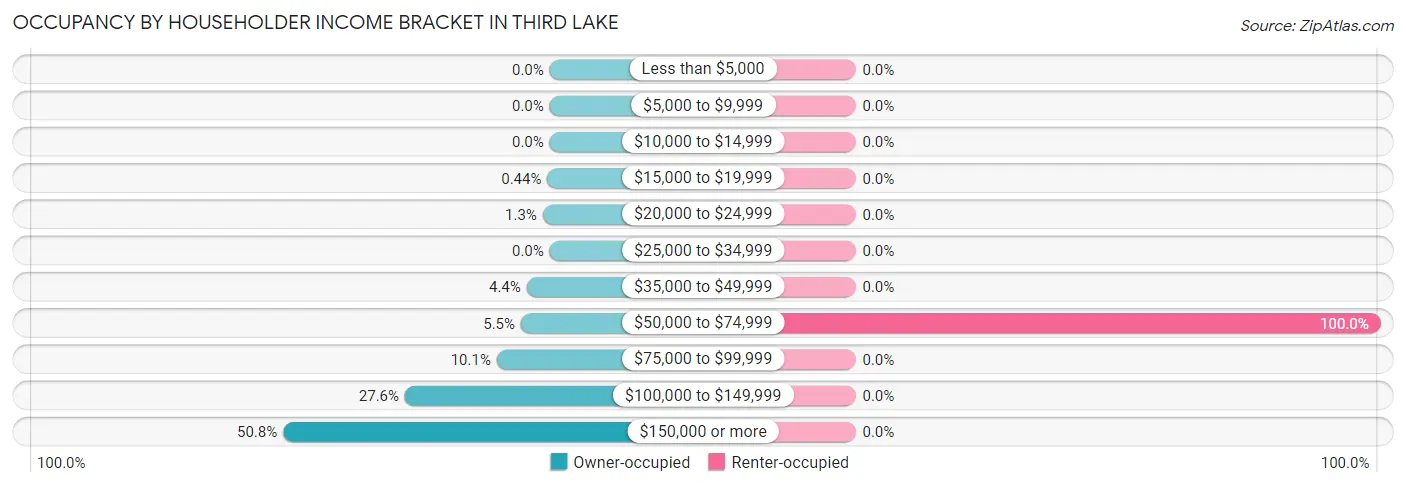
| Income Bracket | Owner-occupied | Renter-occupied |
| Less than $5,000 | 0 (0.0%) | 0 (0.0%) |
| $5,000 to $9,999 | 0 (0.0%) | 0 (0.0%) |
| $10,000 to $14,999 | 0 (0.0%) | 0 (0.0%) |
| $15,000 to $19,999 | 2 (0.4%) | 0 (0.0%) |
| $20,000 to $24,999 | 6 (1.3%) | 0 (0.0%) |
| $25,000 to $34,999 | 0 (0.0%) | 0 (0.0%) |
| $35,000 to $49,999 | 20 (4.4%) | 0 (0.0%) |
| $50,000 to $74,999 | 25 (5.5%) | 3 (100.0%) |
| $75,000 to $99,999 | 46 (10.1%) | 0 (0.0%) |
| $100,000 to $149,999 | 126 (27.6%) | 0 (0.0%) |
| $150,000 or more | 232 (50.8%) | 0 (0.0%) |
| Total | 457 (100.0%) | 3 (100.0%) |
Monthly Housing Cost Tiers in Third Lake
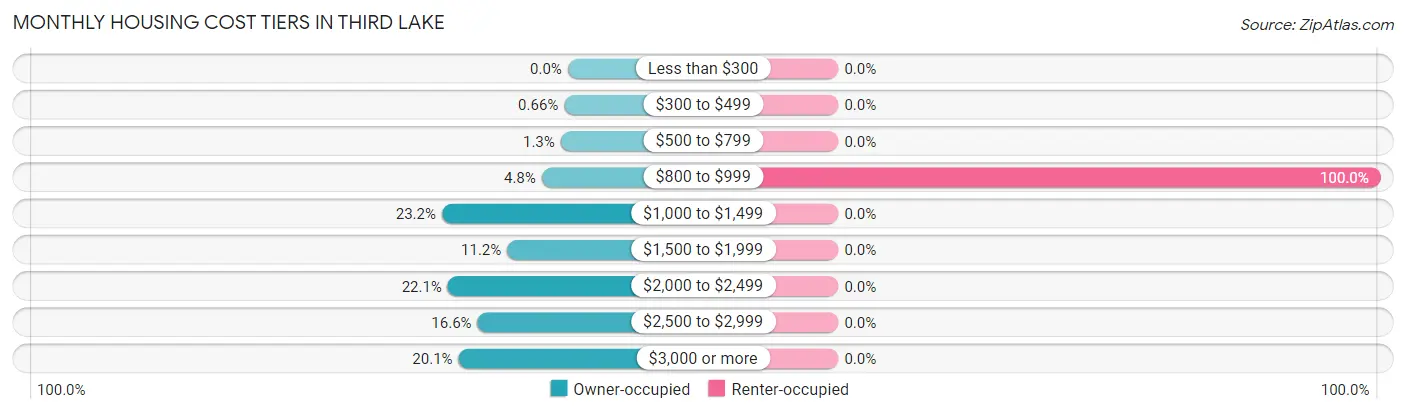
| Monthly Cost | Owner-occupied | Renter-occupied |
| Less than $300 | 0 (0.0%) | 0 (0.0%) |
| $300 to $499 | 3 (0.7%) | 0 (0.0%) |
| $500 to $799 | 6 (1.3%) | 0 (0.0%) |
| $800 to $999 | 22 (4.8%) | 3 (100.0%) |
| $1,000 to $1,499 | 106 (23.2%) | 0 (0.0%) |
| $1,500 to $1,999 | 51 (11.2%) | 0 (0.0%) |
| $2,000 to $2,499 | 101 (22.1%) | 0 (0.0%) |
| $2,500 to $2,999 | 76 (16.6%) | 0 (0.0%) |
| $3,000 or more | 92 (20.1%) | 0 (0.0%) |
| Total | 457 (100.0%) | 3 (100.0%) |
Physical Housing Characteristics in Third Lake
Housing Structures in Third Lake
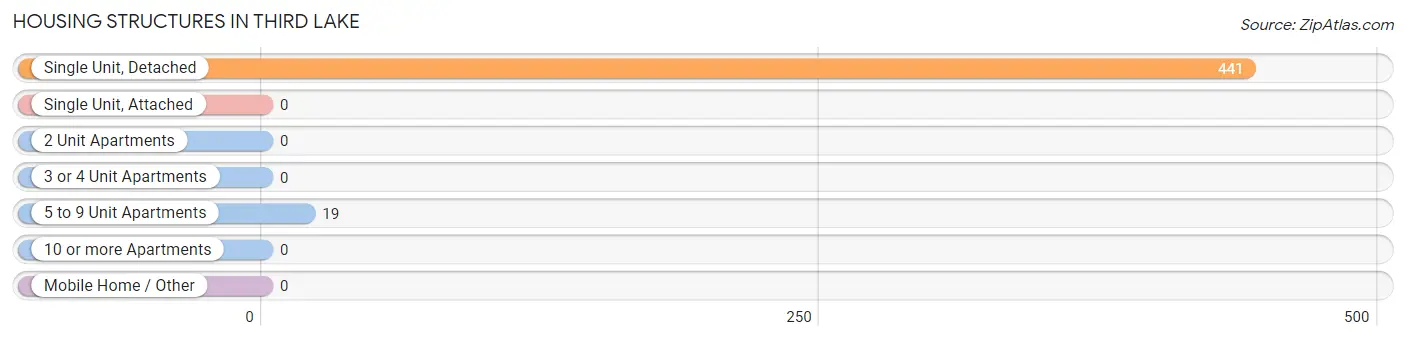
| Structure Type | # Housing Units | % Housing Units |
| Single Unit, Detached | 441 | 95.9% |
| Single Unit, Attached | 0 | 0.0% |
| 2 Unit Apartments | 0 | 0.0% |
| 3 or 4 Unit Apartments | 0 | 0.0% |
| 5 to 9 Unit Apartments | 19 | 4.1% |
| 10 or more Apartments | 0 | 0.0% |
| Mobile Home / Other | 0 | 0.0% |
| Total | 460 | 100.0% |
Housing Structures by Occupancy in Third Lake
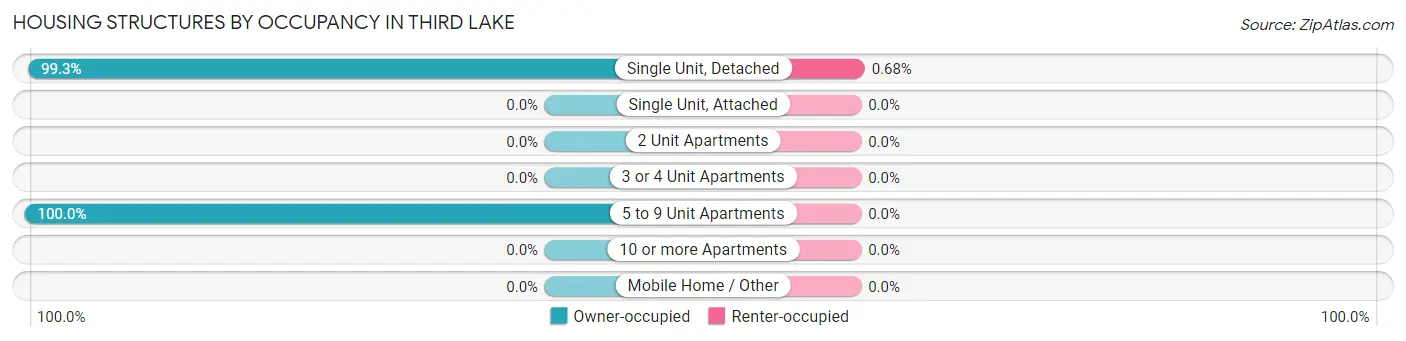
| Structure Type | Owner-occupied | Renter-occupied |
| Single Unit, Detached | 438 (99.3%) | 3 (0.7%) |
| Single Unit, Attached | 0 (0.0%) | 0 (0.0%) |
| 2 Unit Apartments | 0 (0.0%) | 0 (0.0%) |
| 3 or 4 Unit Apartments | 0 (0.0%) | 0 (0.0%) |
| 5 to 9 Unit Apartments | 19 (100.0%) | 0 (0.0%) |
| 10 or more Apartments | 0 (0.0%) | 0 (0.0%) |
| Mobile Home / Other | 0 (0.0%) | 0 (0.0%) |
| Total | 457 (99.4%) | 3 (0.6%) |
Housing Structures by Number of Rooms in Third Lake
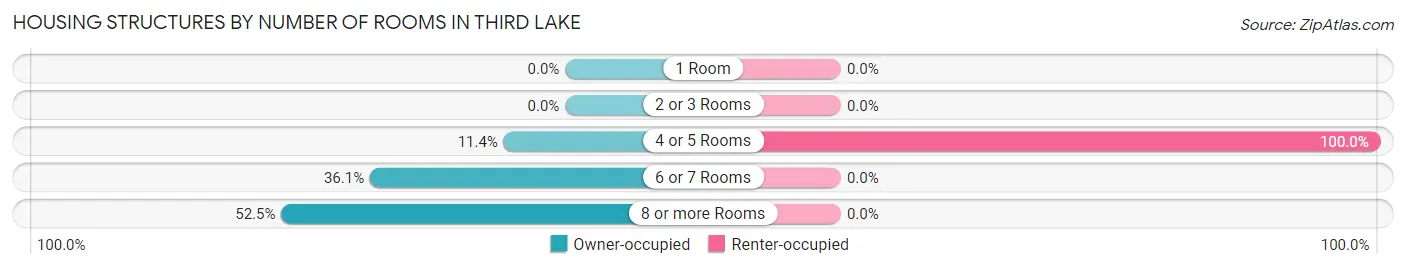
| Number of Rooms | Owner-occupied | Renter-occupied |
| 1 Room | 0 (0.0%) | 0 (0.0%) |
| 2 or 3 Rooms | 0 (0.0%) | 0 (0.0%) |
| 4 or 5 Rooms | 52 (11.4%) | 3 (100.0%) |
| 6 or 7 Rooms | 165 (36.1%) | 0 (0.0%) |
| 8 or more Rooms | 240 (52.5%) | 0 (0.0%) |
| Total | 457 (100.0%) | 3 (100.0%) |
Housing Structure by Heating Type in Third Lake
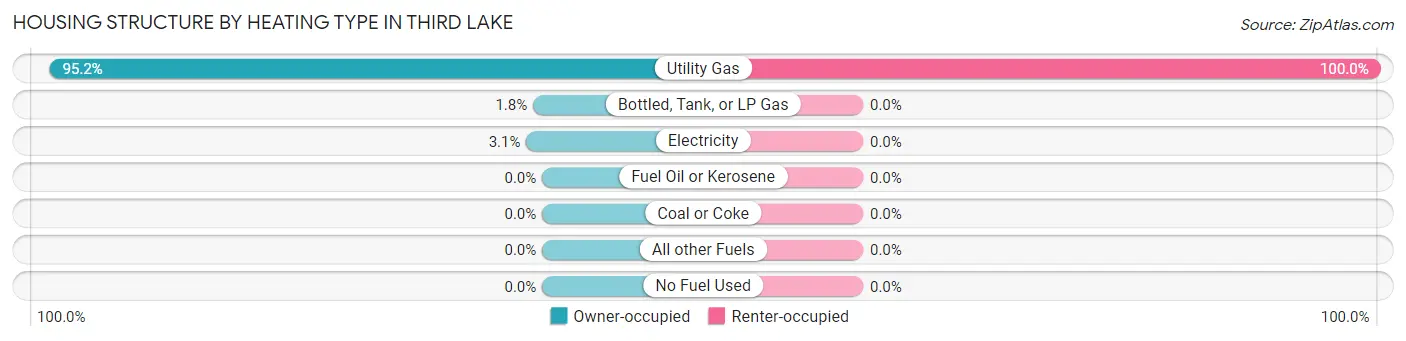
| Heating Type | Owner-occupied | Renter-occupied |
| Utility Gas | 435 (95.2%) | 3 (100.0%) |
| Bottled, Tank, or LP Gas | 8 (1.8%) | 0 (0.0%) |
| Electricity | 14 (3.1%) | 0 (0.0%) |
| Fuel Oil or Kerosene | 0 (0.0%) | 0 (0.0%) |
| Coal or Coke | 0 (0.0%) | 0 (0.0%) |
| All other Fuels | 0 (0.0%) | 0 (0.0%) |
| No Fuel Used | 0 (0.0%) | 0 (0.0%) |
| Total | 457 (100.0%) | 3 (100.0%) |
Household Vehicle Usage in Third Lake
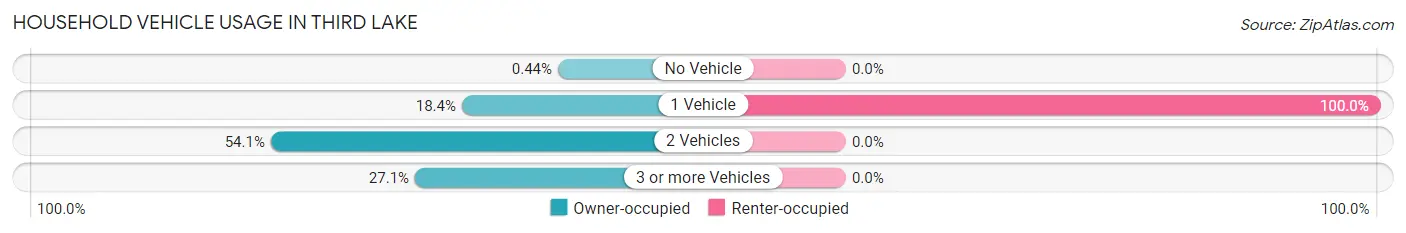
| Vehicles per Household | Owner-occupied | Renter-occupied |
| No Vehicle | 2 (0.4%) | 0 (0.0%) |
| 1 Vehicle | 84 (18.4%) | 3 (100.0%) |
| 2 Vehicles | 247 (54.0%) | 0 (0.0%) |
| 3 or more Vehicles | 124 (27.1%) | 0 (0.0%) |
| Total | 457 (100.0%) | 3 (100.0%) |
Real Estate & Mortgages in Third Lake
Real Estate and Mortgage Overview in Third Lake
| Characteristic | Without Mortgage | With Mortgage |
| Housing Units | 163 | 294 |
| Median Property Value | $335,000 | $305,600 |
| Median Household Income | $153,407 | $132 |
| Monthly Housing Costs | $1,094 | $92 |
| Real Estate Taxes | $9,478 | $2 |
Property Value by Mortgage Status in Third Lake
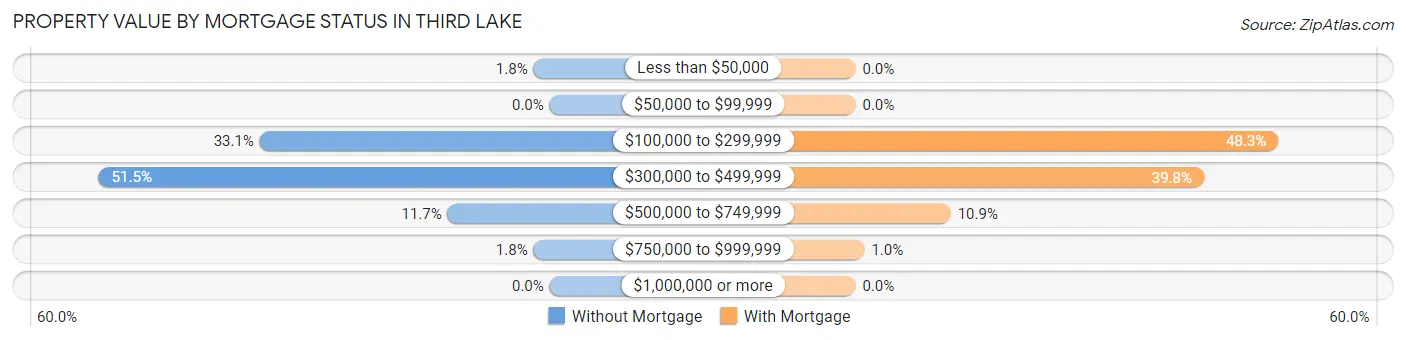
| Property Value | Without Mortgage | With Mortgage |
| Less than $50,000 | 3 (1.8%) | 0 (0.0%) |
| $50,000 to $99,999 | 0 (0.0%) | 0 (0.0%) |
| $100,000 to $299,999 | 54 (33.1%) | 142 (48.3%) |
| $300,000 to $499,999 | 84 (51.5%) | 117 (39.8%) |
| $500,000 to $749,999 | 19 (11.7%) | 32 (10.9%) |
| $750,000 to $999,999 | 3 (1.8%) | 3 (1.0%) |
| $1,000,000 or more | 0 (0.0%) | 0 (0.0%) |
| Total | 163 (100.0%) | 294 (100.0%) |
Household Income by Mortgage Status in Third Lake
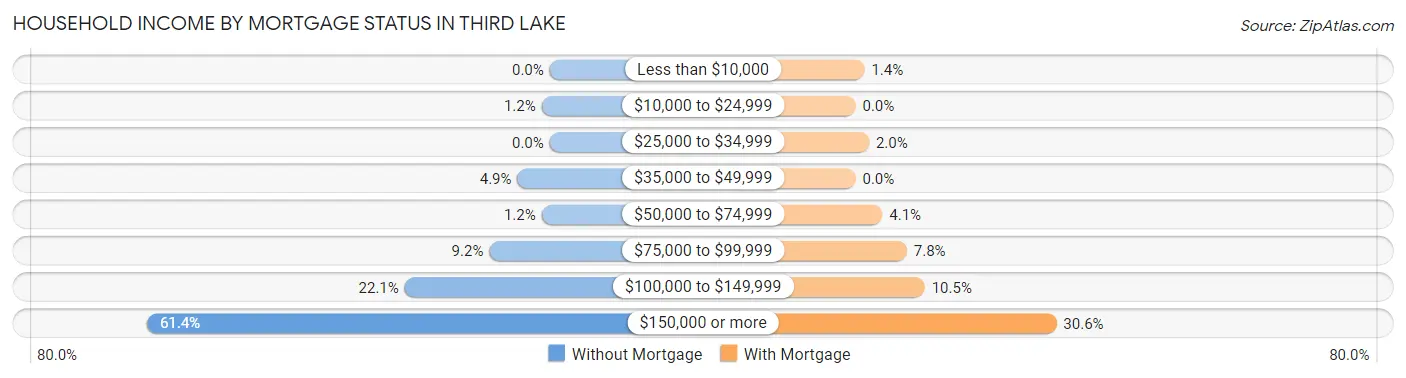
| Household Income | Without Mortgage | With Mortgage |
| Less than $10,000 | 0 (0.0%) | 4 (1.4%) |
| $10,000 to $24,999 | 2 (1.2%) | 0 (0.0%) |
| $25,000 to $34,999 | 0 (0.0%) | 6 (2.0%) |
| $35,000 to $49,999 | 8 (4.9%) | 0 (0.0%) |
| $50,000 to $74,999 | 2 (1.2%) | 12 (4.1%) |
| $75,000 to $99,999 | 15 (9.2%) | 23 (7.8%) |
| $100,000 to $149,999 | 36 (22.1%) | 31 (10.5%) |
| $150,000 or more | 100 (61.4%) | 90 (30.6%) |
| Total | 163 (100.0%) | 294 (100.0%) |
Property Value to Household Income Ratio in Third Lake
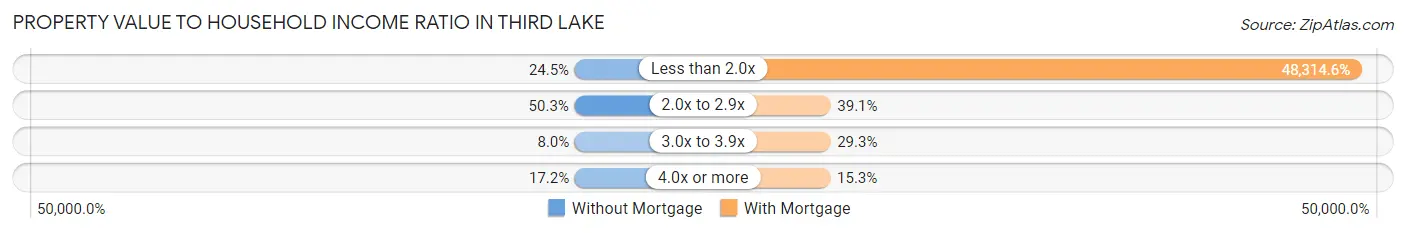
| Value-to-Income Ratio | Without Mortgage | With Mortgage |
| Less than 2.0x | 40 (24.5%) | 142,045 (48,314.6%) |
| 2.0x to 2.9x | 82 (50.3%) | 115 (39.1%) |
| 3.0x to 3.9x | 13 (8.0%) | 86 (29.2%) |
| 4.0x or more | 28 (17.2%) | 45 (15.3%) |
| Total | 163 (100.0%) | 294 (100.0%) |
Real Estate Taxes by Mortgage Status in Third Lake
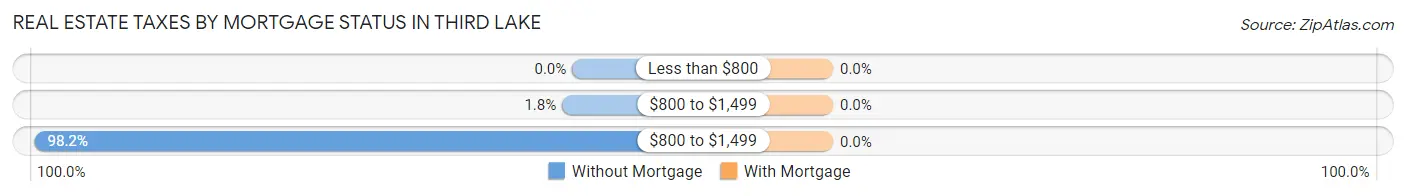
| Property Taxes | Without Mortgage | With Mortgage |
| Less than $800 | 0 (0.0%) | 0 (0.0%) |
| $800 to $1,499 | 3 (1.8%) | 0 (0.0%) |
| $800 to $1,499 | 160 (98.2%) | 0 (0.0%) |
| Total | 163 (100.0%) | 294 (100.0%) |
Health & Disability in Third Lake
Health Insurance Coverage by Age in Third Lake
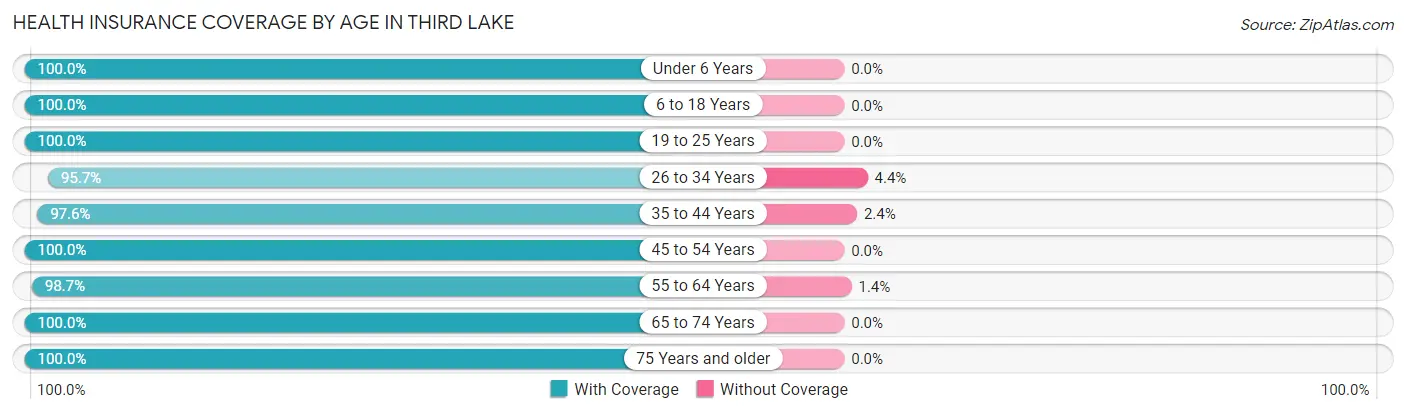
| Age Bracket | With Coverage | Without Coverage |
| Under 6 Years | 46 (100.0%) | 0 (0.0%) |
| 6 to 18 Years | 211 (100.0%) | 0 (0.0%) |
| 19 to 25 Years | 81 (100.0%) | 0 (0.0%) |
| 26 to 34 Years | 66 (95.7%) | 3 (4.3%) |
| 35 to 44 Years | 124 (97.6%) | 3 (2.4%) |
| 45 to 54 Years | 176 (100.0%) | 0 (0.0%) |
| 55 to 64 Years | 219 (98.7%) | 3 (1.3%) |
| 65 to 74 Years | 194 (100.0%) | 0 (0.0%) |
| 75 Years and older | 85 (100.0%) | 0 (0.0%) |
| Total | 1,202 (99.3%) | 9 (0.7%) |
Health Insurance Coverage by Citizenship Status in Third Lake
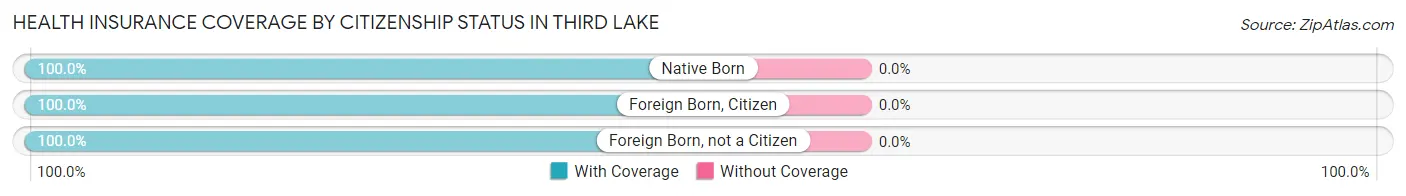
| Citizenship Status | With Coverage | Without Coverage |
| Native Born | 46 (100.0%) | 0 (0.0%) |
| Foreign Born, Citizen | 211 (100.0%) | 0 (0.0%) |
| Foreign Born, not a Citizen | 81 (100.0%) | 0 (0.0%) |
Health Insurance Coverage by Household Income in Third Lake
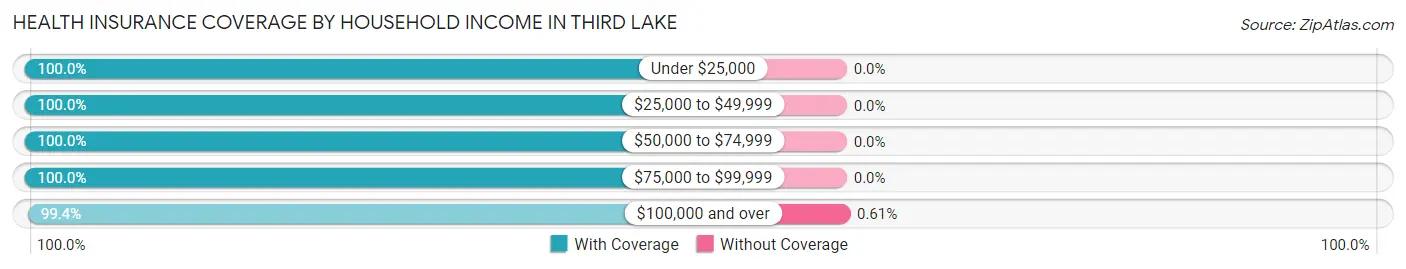
| Household Income | With Coverage | Without Coverage |
| Under $25,000 | 12 (100.0%) | 0 (0.0%) |
| $25,000 to $49,999 | 31 (100.0%) | 0 (0.0%) |
| $50,000 to $74,999 | 59 (100.0%) | 0 (0.0%) |
| $75,000 to $99,999 | 112 (100.0%) | 0 (0.0%) |
| $100,000 and over | 978 (99.4%) | 6 (0.6%) |
Public vs Private Health Insurance Coverage by Age in Third Lake
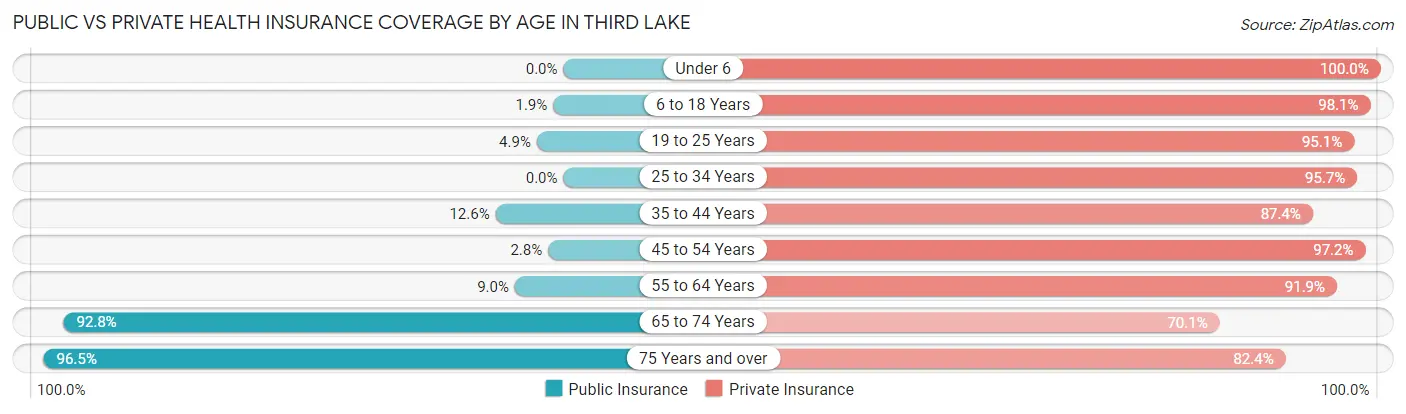
| Age Bracket | Public Insurance | Private Insurance |
| Under 6 | 0 (0.0%) | 46 (100.0%) |
| 6 to 18 Years | 4 (1.9%) | 207 (98.1%) |
| 19 to 25 Years | 4 (4.9%) | 77 (95.1%) |
| 25 to 34 Years | 0 (0.0%) | 66 (95.7%) |
| 35 to 44 Years | 16 (12.6%) | 111 (87.4%) |
| 45 to 54 Years | 5 (2.8%) | 171 (97.2%) |
| 55 to 64 Years | 20 (9.0%) | 204 (91.9%) |
| 65 to 74 Years | 180 (92.8%) | 136 (70.1%) |
| 75 Years and over | 82 (96.5%) | 70 (82.4%) |
| Total | 311 (25.7%) | 1,088 (89.8%) |
Disability Status by Sex by Age in Third Lake
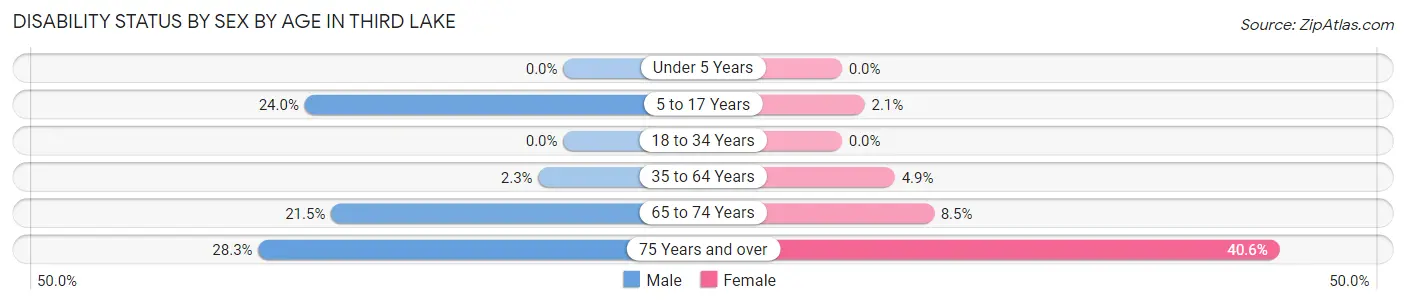
| Age Bracket | Male | Female |
| Under 5 Years | 0 (0.0%) | 0 (0.0%) |
| 5 to 17 Years | 18 (24.0%) | 2 (2.1%) |
| 18 to 34 Years | 0 (0.0%) | 0 (0.0%) |
| 35 to 64 Years | 6 (2.3%) | 13 (4.9%) |
| 65 to 74 Years | 14 (21.5%) | 11 (8.5%) |
| 75 Years and over | 15 (28.3%) | 13 (40.6%) |
Disability Class by Sex by Age in Third Lake
Disability Class: Hearing Difficulty
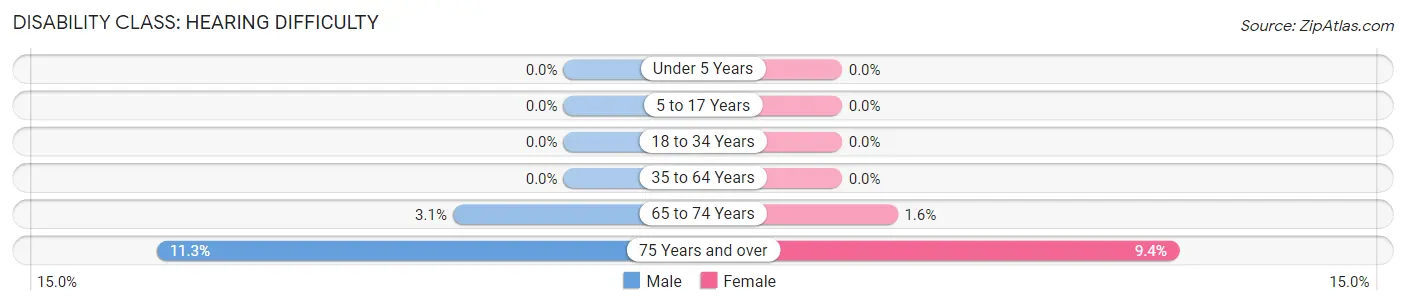
| Age Bracket | Male | Female |
| Under 5 Years | 0 (0.0%) | 0 (0.0%) |
| 5 to 17 Years | 0 (0.0%) | 0 (0.0%) |
| 18 to 34 Years | 0 (0.0%) | 0 (0.0%) |
| 35 to 64 Years | 0 (0.0%) | 0 (0.0%) |
| 65 to 74 Years | 2 (3.1%) | 2 (1.5%) |
| 75 Years and over | 6 (11.3%) | 3 (9.4%) |
Disability Class: Vision Difficulty
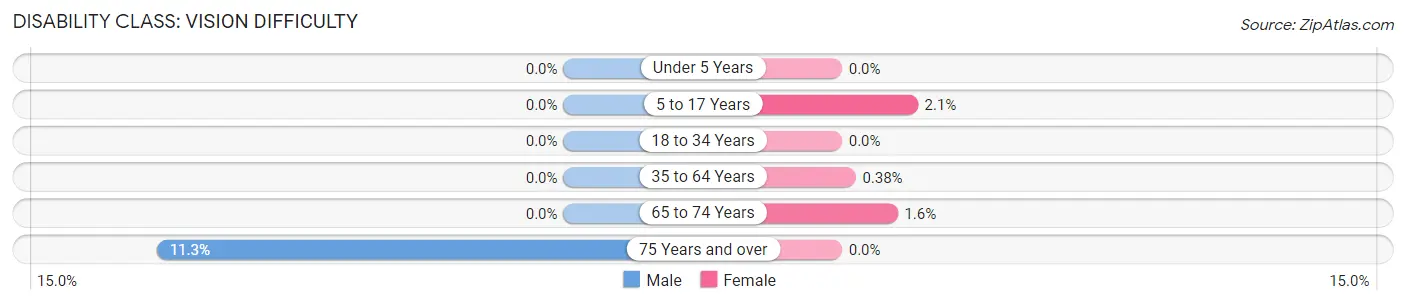
| Age Bracket | Male | Female |
| Under 5 Years | 0 (0.0%) | 0 (0.0%) |
| 5 to 17 Years | 0 (0.0%) | 2 (2.1%) |
| 18 to 34 Years | 0 (0.0%) | 0 (0.0%) |
| 35 to 64 Years | 0 (0.0%) | 1 (0.4%) |
| 65 to 74 Years | 0 (0.0%) | 2 (1.5%) |
| 75 Years and over | 6 (11.3%) | 0 (0.0%) |
Disability Class: Cognitive Difficulty
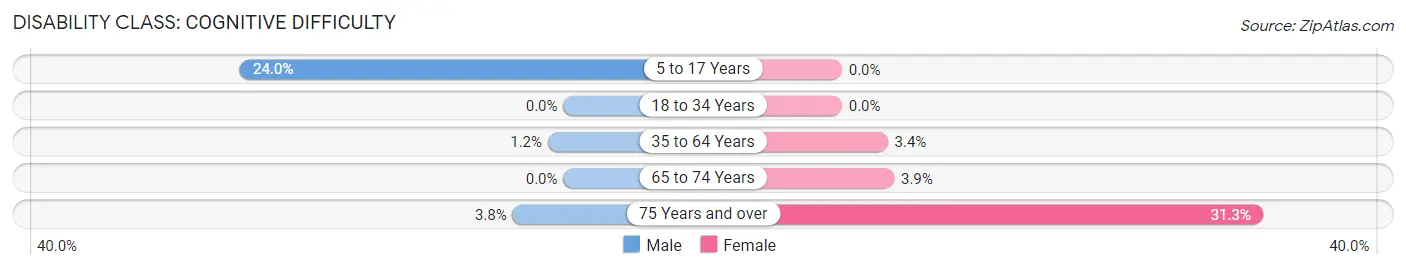
| Age Bracket | Male | Female |
| 5 to 17 Years | 18 (24.0%) | 0 (0.0%) |
| 18 to 34 Years | 0 (0.0%) | 0 (0.0%) |
| 35 to 64 Years | 3 (1.1%) | 9 (3.4%) |
| 65 to 74 Years | 0 (0.0%) | 5 (3.9%) |
| 75 Years and over | 2 (3.8%) | 10 (31.2%) |
Disability Class: Ambulatory Difficulty
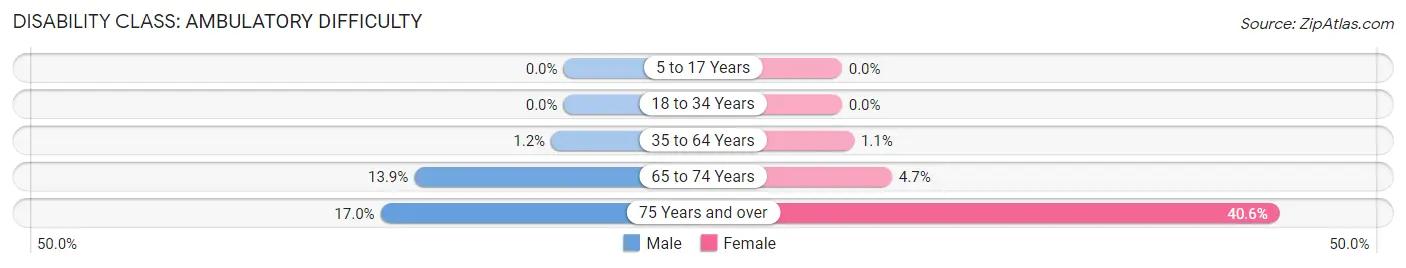
| Age Bracket | Male | Female |
| 5 to 17 Years | 0 (0.0%) | 0 (0.0%) |
| 18 to 34 Years | 0 (0.0%) | 0 (0.0%) |
| 35 to 64 Years | 3 (1.1%) | 3 (1.1%) |
| 65 to 74 Years | 9 (13.9%) | 6 (4.6%) |
| 75 Years and over | 9 (17.0%) | 13 (40.6%) |
Disability Class: Self-Care Difficulty
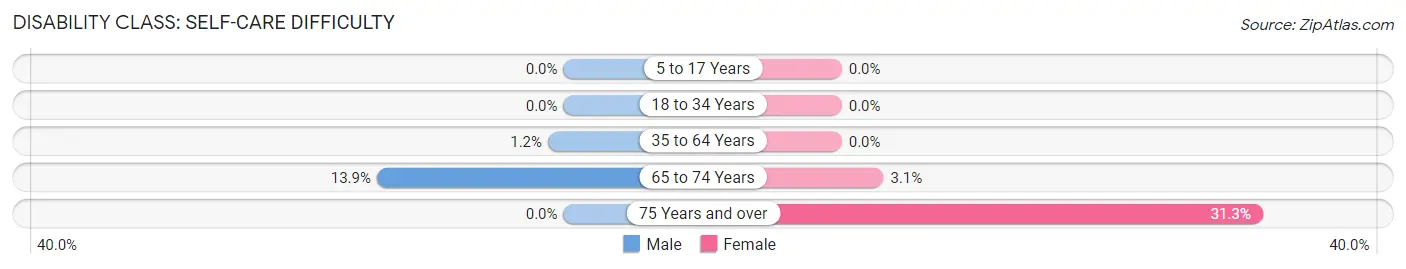
| Age Bracket | Male | Female |
| 5 to 17 Years | 0 (0.0%) | 0 (0.0%) |
| 18 to 34 Years | 0 (0.0%) | 0 (0.0%) |
| 35 to 64 Years | 3 (1.1%) | 0 (0.0%) |
| 65 to 74 Years | 9 (13.9%) | 4 (3.1%) |
| 75 Years and over | 0 (0.0%) | 10 (31.2%) |
Technology Access in Third Lake
Computing Device Access in Third Lake
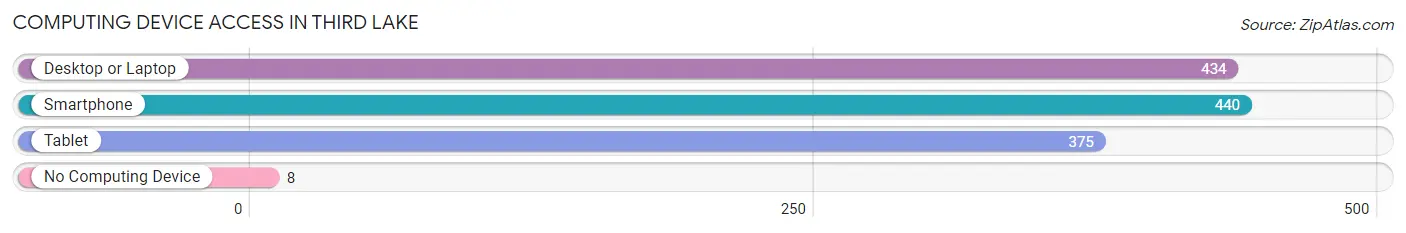
| Device Type | # Households | % Households |
| Desktop or Laptop | 434 | 94.4% |
| Smartphone | 440 | 95.7% |
| Tablet | 375 | 81.5% |
| No Computing Device | 8 | 1.7% |
| Total | 460 | 100.0% |
Internet Access in Third Lake
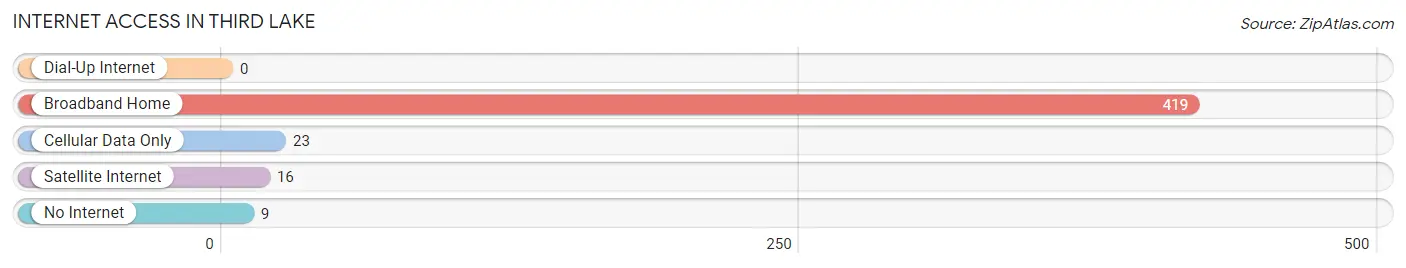
| Internet Type | # Households | % Households |
| Dial-Up Internet | 0 | 0.0% |
| Broadband Home | 419 | 91.1% |
| Cellular Data Only | 23 | 5.0% |
| Satellite Internet | 16 | 3.5% |
| No Internet | 9 | 2.0% |
| Total | 460 | 100.0% |
Third Lake Summary
History
Third Lake is a village located in Lake County, Illinois, United States. It is a part of the Chicago metropolitan area and is located approximately 40 miles northwest of downtown Chicago. The village was incorporated in 1956 and has a population of approximately 2,000 people.
Third Lake was originally inhabited by the Potawatomi Native American tribe. The first settlers arrived in the area in the early 1800s and the village was officially established in 1836. The village was named after the third lake in the area, which is now known as Lake Marie.
The village was primarily an agricultural community until the 1950s when it began to experience rapid growth due to its proximity to Chicago. The village was incorporated in 1956 and has since become a popular bedroom community for those who work in the city.
Geography
Third Lake is located in Lake County, Illinois, approximately 40 miles northwest of downtown Chicago. The village is situated on the shores of Lake Marie, which is the third lake in the area. The village is bordered by Grayslake to the north, Round Lake to the east, and Lake Villa to the south.
The village has a total area of 1.3 square miles, all of which is land. The terrain is mostly flat with some rolling hills. The village is located in the Fox River watershed and is home to several small creeks and streams.
Economy
The economy of Third Lake is largely based on tourism and retail. The village is home to several small businesses, including restaurants, shops, and other services. The village is also home to a number of small manufacturing companies.
The village is also home to a number of corporate headquarters, including the headquarters of the Lake County Forest Preserve District. The village is also home to a number of corporate offices, including those of the Lake County Health Department and the Lake County Sheriff's Office.
Demographics
As of the 2010 census, the population of Third Lake was 2,000. The racial makeup of the village was 94.2% White, 1.2% African American, 0.7% Native American, 1.2% Asian, 0.2% Pacific Islander, and 2.7% from other races. Hispanic or Latino of any race were 5.2% of the population.
The median household income in Third Lake was $60,000, and the median family income was $68,000. The per capita income for the village was $25,000. About 4.2% of families and 5.7% of the population were below the poverty line, including 8.2% of those under age 18 and 4.2% of those age 65 or over.
The village is served by two public school districts, Grayslake Community Consolidated School District 46 and Round Lake Area Schools District 116. The village is also home to a number of private schools, including St. Joseph Catholic School and Third Lake Montessori School.
Common Questions
What is Per Capita Income in Third Lake?
Per Capita income in Third Lake is $63,715.
What is the Median Family Income in Third Lake?
Median Family Income in Third Lake is $153,819.
What is the Median Household income in Third Lake?
Median Household Income in Third Lake is $152,593.
What is Income or Wage Gap in Third Lake?
Income or Wage Gap in Third Lake is 16.8%.
Women in Third Lake earn 83.2 cents for every dollar earned by a man.
What is Inequality or Gini Index in Third Lake?
Inequality or Gini Index in Third Lake is 0.30.
What is the Total Population of Third Lake?
Total Population of Third Lake is 1,214.
What is the Total Male Population of Third Lake?
Total Male Population of Third Lake is 612.
What is the Total Female Population of Third Lake?
Total Female Population of Third Lake is 602.
What is the Ratio of Males per 100 Females in Third Lake?
There are 101.66 Males per 100 Females in Third Lake.
What is the Ratio of Females per 100 Males in Third Lake?
There are 98.37 Females per 100 Males in Third Lake.
What is the Median Population Age in Third Lake?
Median Population Age in Third Lake is 50.3 Years.
What is the Average Family Size in Third Lake
Average Family Size in Third Lake is 2.9 People.
What is the Average Household Size in Third Lake
Average Household Size in Third Lake is 2.6 People.
How Large is the Labor Force in Third Lake?
There are 653 People in the Labor Forcein in Third Lake.
What is the Percentage of People in the Labor Force in Third Lake?
63.7% of People are in the Labor Force in Third Lake.
What is the Unemployment Rate in Third Lake?
Unemployment Rate in Third Lake is 3.7%.