Downers Grove, IL Map & Demographics
Downers Grove Map
Downers Grove Overview
$63,831
PER CAPITA INCOME
$154,211
AVG FAMILY INCOME
$115,461
AVG HOUSEHOLD INCOME
41.5%
WAGE / INCOME GAP [ % ]
58.5¢/ $1
WAGE / INCOME GAP [ $ ]
0.49
INEQUALITY / GINI INDEX
49,996
TOTAL POPULATION
24,466
MALE POPULATION
25,530
FEMALE POPULATION
95.83
MALES / 100 FEMALES
104.35
FEMALES / 100 MALES
42.6
MEDIAN AGE
3.1
AVG FAMILY SIZE
2.5
AVG HOUSEHOLD SIZE
27,054
LABOR FORCE [ PEOPLE ]
67.0%
PERCENT IN LABOR FORCE
4.1%
UNEMPLOYMENT RATE
Income in Downers Grove
Income Overview in Downers Grove
Per Capita Income in Downers Grove is $63,831, while median incomes of families and households are $154,211 and $115,461 respectively.
| Characteristic | Number | Measure |
| Per Capita Income | 49,996 | $63,831 |
| Median Family Income | 13,344 | $154,211 |
| Mean Family Income | 13,344 | $198,580 |
| Median Household Income | 20,196 | $115,461 |
| Mean Household Income | 20,196 | $156,339 |
| Income Deficit | 13,344 | $0 |
| Wage / Income Gap (%) | 49,996 | 41.51% |
| Wage / Income Gap ($) | 49,996 | 58.49¢ per $1 |
| Gini / Inequality Index | 49,996 | 0.49 |
Earnings by Sex in Downers Grove
Average Earnings in Downers Grove are $59,607, $83,021 for men and $48,561 for women, a difference of 41.5%.
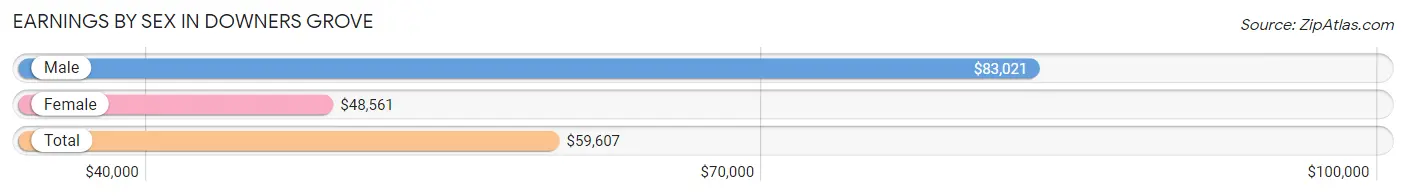
| Sex | Number | Average Earnings |
| Male | 15,174 (52.8%) | $83,021 |
| Female | 13,580 (47.2%) | $48,561 |
| Total | 28,754 (100.0%) | $59,607 |
Earnings by Sex by Income Bracket in Downers Grove
The most common earnings brackets in Downers Grove are $100,000+ for men (6,442 | 42.4%) and $100,000+ for women (2,506 | 18.4%).
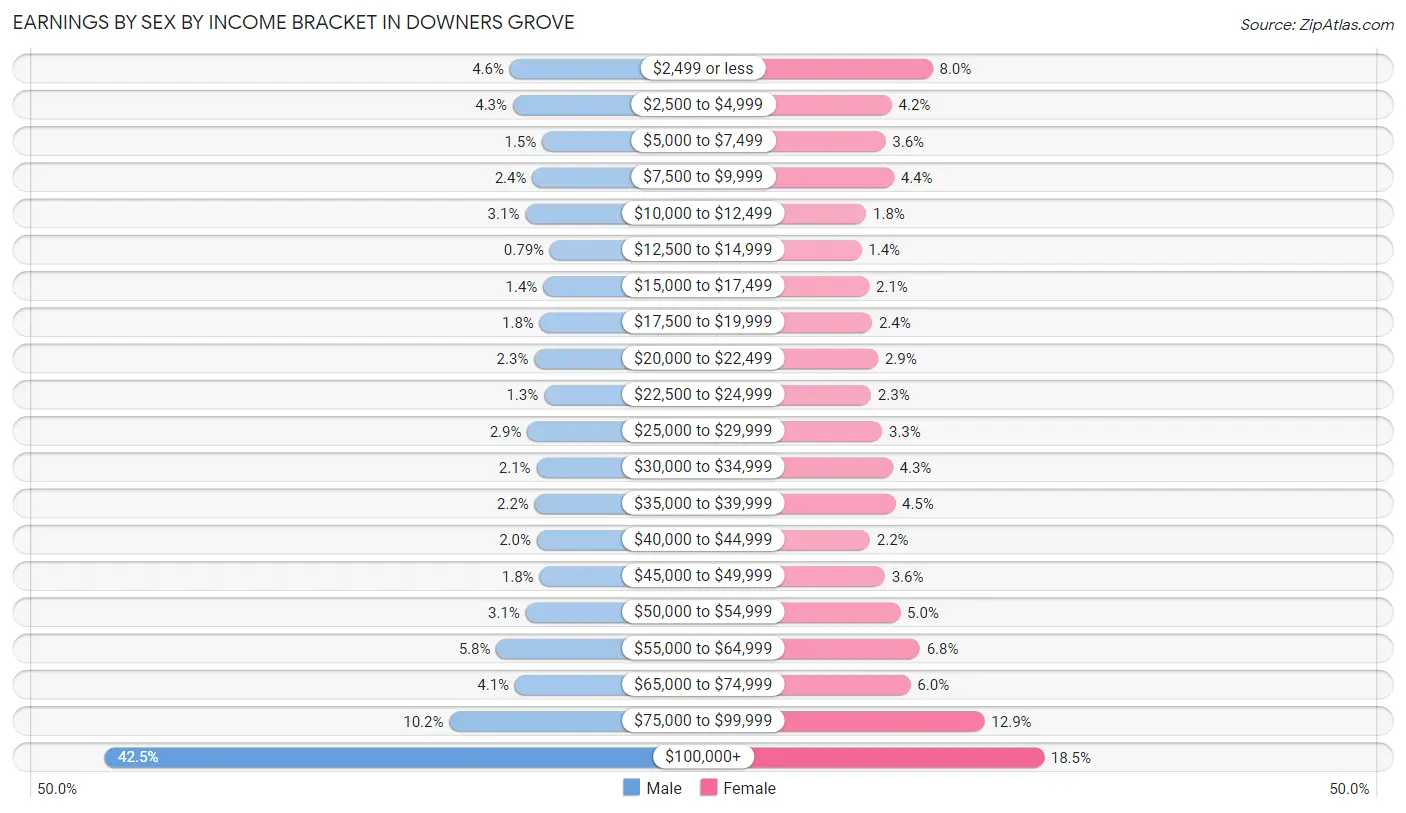
| Income | Male | Female |
| $2,499 or less | 690 (4.5%) | 1,091 (8.0%) |
| $2,500 to $4,999 | 646 (4.3%) | 570 (4.2%) |
| $5,000 to $7,499 | 230 (1.5%) | 490 (3.6%) |
| $7,500 to $9,999 | 370 (2.4%) | 598 (4.4%) |
| $10,000 to $12,499 | 470 (3.1%) | 246 (1.8%) |
| $12,500 to $14,999 | 120 (0.8%) | 185 (1.4%) |
| $15,000 to $17,499 | 216 (1.4%) | 284 (2.1%) |
| $17,500 to $19,999 | 266 (1.8%) | 321 (2.4%) |
| $20,000 to $22,499 | 343 (2.3%) | 397 (2.9%) |
| $22,500 to $24,999 | 203 (1.3%) | 307 (2.3%) |
| $25,000 to $29,999 | 442 (2.9%) | 448 (3.3%) |
| $30,000 to $34,999 | 311 (2.1%) | 582 (4.3%) |
| $35,000 to $39,999 | 337 (2.2%) | 614 (4.5%) |
| $40,000 to $44,999 | 306 (2.0%) | 293 (2.2%) |
| $45,000 to $49,999 | 268 (1.8%) | 482 (3.5%) |
| $50,000 to $54,999 | 464 (3.1%) | 678 (5.0%) |
| $55,000 to $64,999 | 882 (5.8%) | 928 (6.8%) |
| $65,000 to $74,999 | 617 (4.1%) | 809 (6.0%) |
| $75,000 to $99,999 | 1,551 (10.2%) | 1,751 (12.9%) |
| $100,000+ | 6,442 (42.4%) | 2,506 (18.4%) |
| Total | 15,174 (100.0%) | 13,580 (100.0%) |
Earnings by Sex by Educational Attainment in Downers Grove
Average earnings in Downers Grove are $97,888 for men and $54,890 for women, a difference of 43.9%. Men with an educational attainment of graduate degree enjoy the highest average annual earnings of $145,259, while those with less than high school education earn the least with $28,403. Women with an educational attainment of graduate degree earn the most with the average annual earnings of $72,287, while those with less than high school education have the smallest earnings of $2,499.
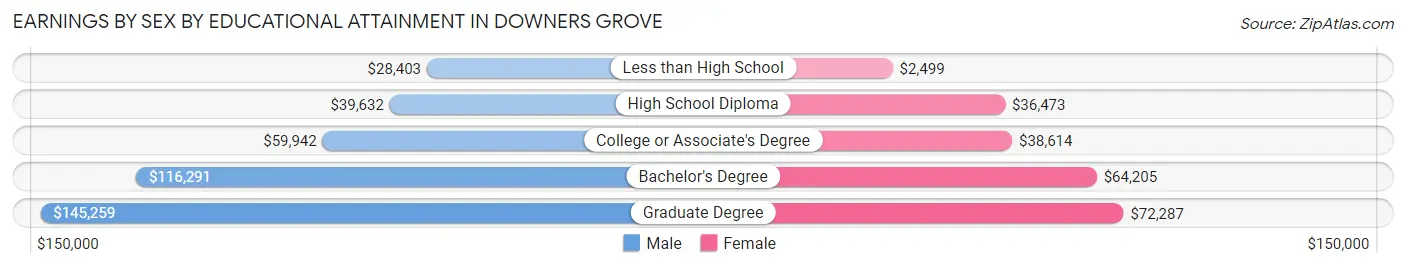
| Educational Attainment | Male Income | Female Income |
| Less than High School | $28,403 | $2,499 |
| High School Diploma | $39,632 | $36,473 |
| College or Associate's Degree | $59,942 | $38,614 |
| Bachelor's Degree | $116,291 | $64,205 |
| Graduate Degree | $145,259 | $72,287 |
| Total | $97,888 | $54,890 |
Family Income in Downers Grove
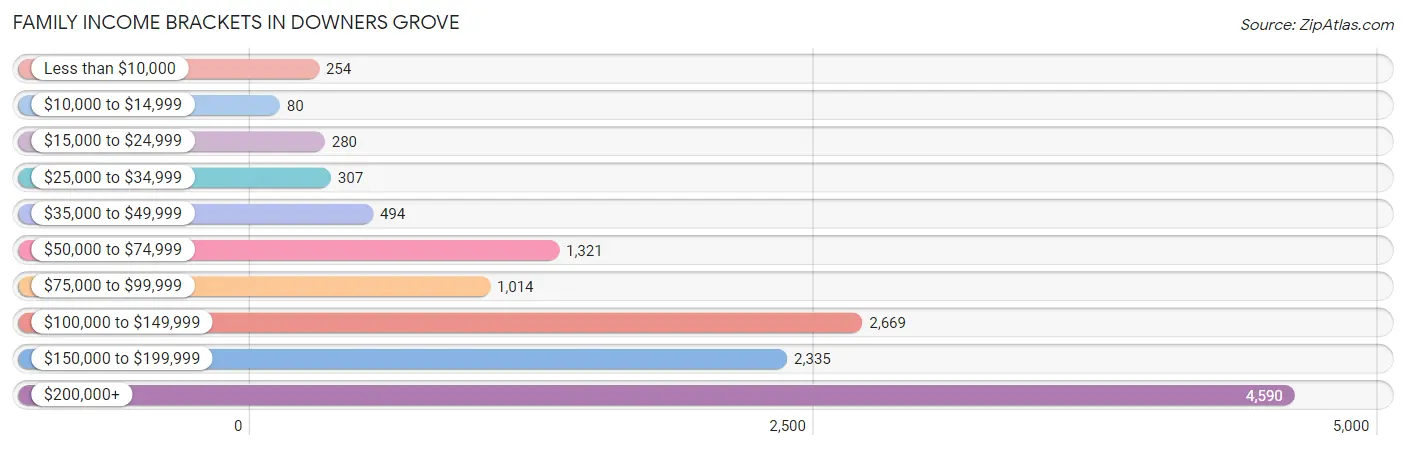
Family Income Brackets in Downers Grove
According to the Downers Grove family income data, there are 4,590 families falling into the $200,000+ income range, which is the most common income bracket and makes up 34.4% of all families. Conversely, the $10,000 to $14,999 income bracket is the least frequent group with only 80 families (0.6%) belonging to this category.
| Income Bracket | # Families | % Families |
| Less than $10,000 | 254 | 1.9% |
| $10,000 to $14,999 | 80 | 0.6% |
| $15,000 to $24,999 | 280 | 2.1% |
| $25,000 to $34,999 | 307 | 2.3% |
| $35,000 to $49,999 | 494 | 3.7% |
| $50,000 to $74,999 | 1,321 | 9.9% |
| $75,000 to $99,999 | 1,014 | 7.6% |
| $100,000 to $149,999 | 2,669 | 20.0% |
| $150,000 to $199,999 | 2,335 | 17.5% |
| $200,000+ | 4,590 | 34.4% |
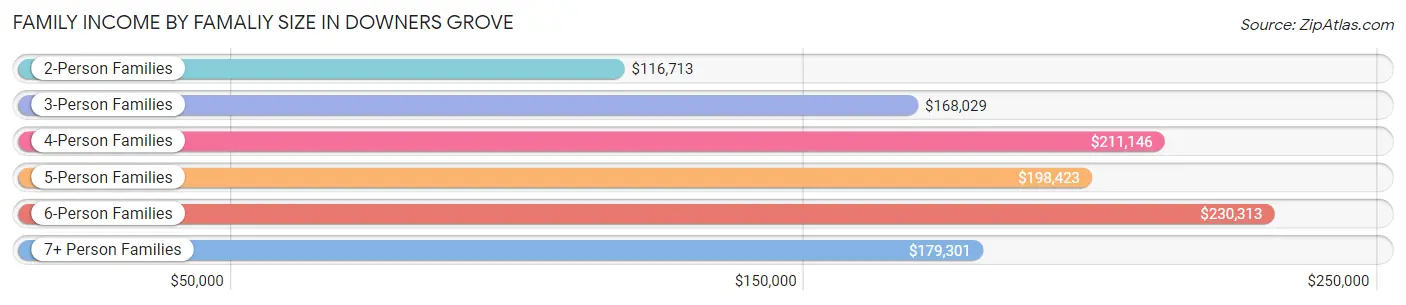
Family Income by Famaliy Size in Downers Grove
6-person families (290 | 2.2%) account for the highest median family income in Downers Grove with $230,313 per family, while 2-person families (6,494 | 48.7%) have the highest median income of $58,356 per family member.
| Income Bracket | # Families | Median Income |
| 2-Person Families | 6,494 (48.7%) | $116,713 |
| 3-Person Families | 2,597 (19.5%) | $168,029 |
| 4-Person Families | 2,781 (20.8%) | $211,146 |
| 5-Person Families | 1,115 (8.4%) | $198,423 |
| 6-Person Families | 290 (2.2%) | $230,313 |
| 7+ Person Families | 67 (0.5%) | $179,301 |
| Total | 13,344 (100.0%) | $154,211 |
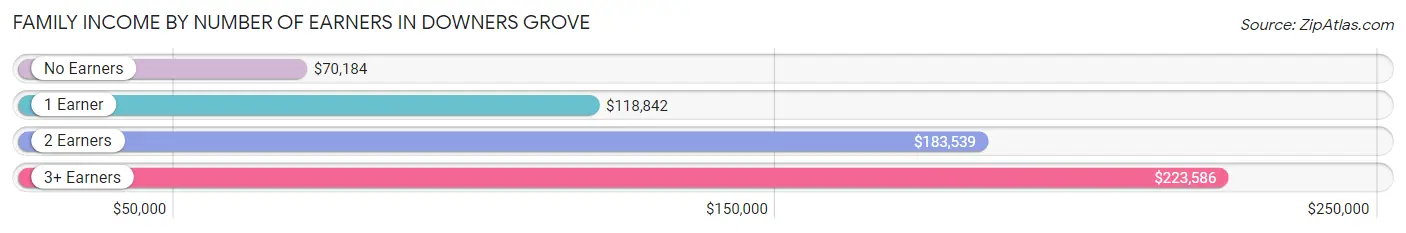
Family Income by Number of Earners in Downers Grove
The median family income in Downers Grove is $154,211, with families comprising 3+ earners (1,893) having the highest median family income of $223,586, while families with no earners (1,893) have the lowest median family income of $70,184, accounting for 14.2% and 14.2% of families, respectively.
| Number of Earners | # Families | Median Income |
| No Earners | 1,893 (14.2%) | $70,184 |
| 1 Earner | 3,212 (24.1%) | $118,842 |
| 2 Earners | 6,346 (47.6%) | $183,539 |
| 3+ Earners | 1,893 (14.2%) | $223,586 |
| Total | 13,344 (100.0%) | $154,211 |
Household Income in Downers Grove
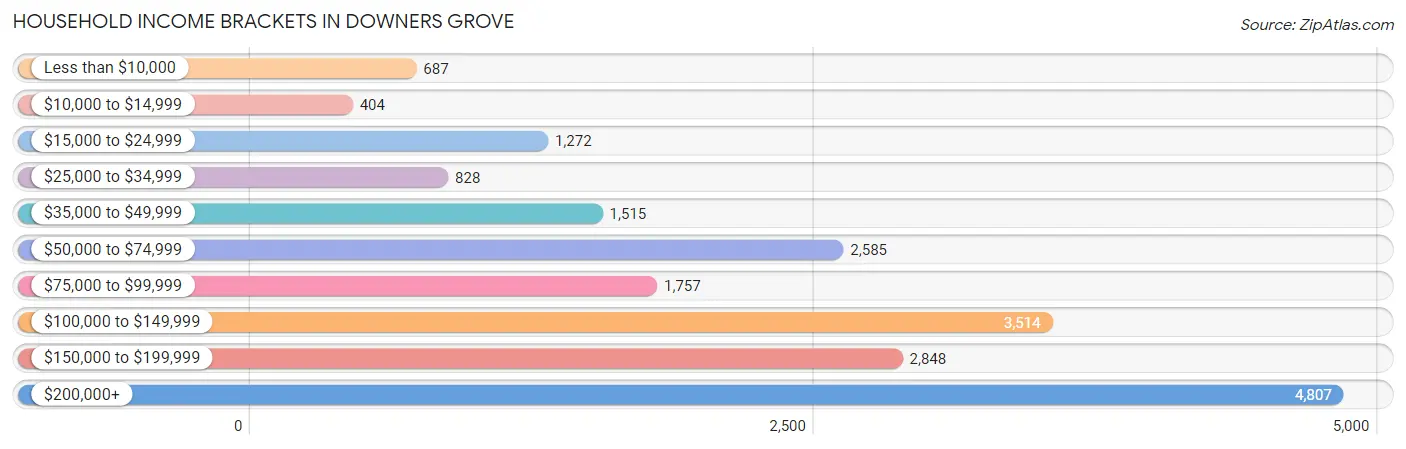
Household Income Brackets in Downers Grove
With 4,807 households falling in the category, the $200,000+ income range is the most frequent in Downers Grove, accounting for 23.8% of all households. In contrast, only 404 households (2.0%) fall into the $10,000 to $14,999 income bracket, making it the least populous group.
| Income Bracket | # Households | % Households |
| Less than $10,000 | 687 | 3.4% |
| $10,000 to $14,999 | 404 | 2.0% |
| $15,000 to $24,999 | 1,272 | 6.3% |
| $25,000 to $34,999 | 828 | 4.1% |
| $35,000 to $49,999 | 1,515 | 7.5% |
| $50,000 to $74,999 | 2,585 | 12.8% |
| $75,000 to $99,999 | 1,757 | 8.7% |
| $100,000 to $149,999 | 3,514 | 17.4% |
| $150,000 to $199,999 | 2,848 | 14.1% |
| $200,000+ | 4,807 | 23.8% |
Household Income by Householder Age in Downers Grove
The median household income in Downers Grove is $115,461, with the highest median household income of $144,223 found in the 25 to 44 years age bracket for the primary householder. A total of 5,759 households (28.5%) fall into this category. Meanwhile, the 15 to 24 years age bracket for the primary householder has the lowest median household income of $0, with 222 households (1.1%) in this group.
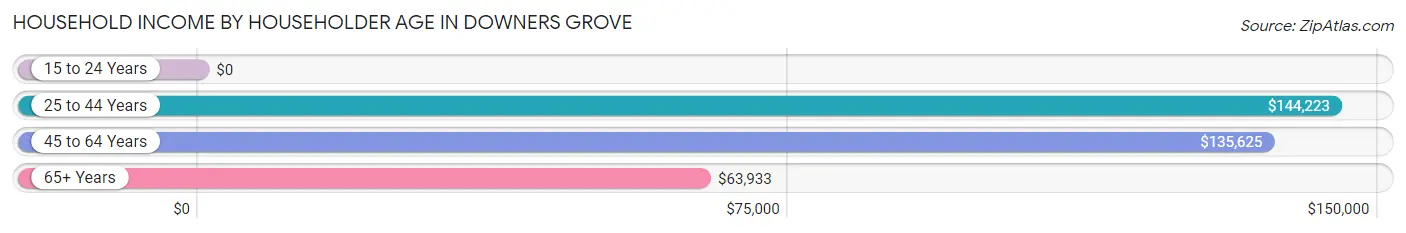
| Income Bracket | # Households | Median Income |
| 15 to 24 Years | 222 (1.1%) | $0 |
| 25 to 44 Years | 5,759 (28.5%) | $144,223 |
| 45 to 64 Years | 7,884 (39.0%) | $135,625 |
| 65+ Years | 6,331 (31.4%) | $63,933 |
| Total | 20,196 (100.0%) | $115,461 |
Poverty in Downers Grove
Income Below Poverty by Sex and Age in Downers Grove
With 4.2% poverty level for males and 6.1% for females among the residents of Downers Grove, 75 year old and over males and 15 year old females are the most vulnerable to poverty, with 111 males (7.8%) and 82 females (17.7%) in their respective age groups living below the poverty level.
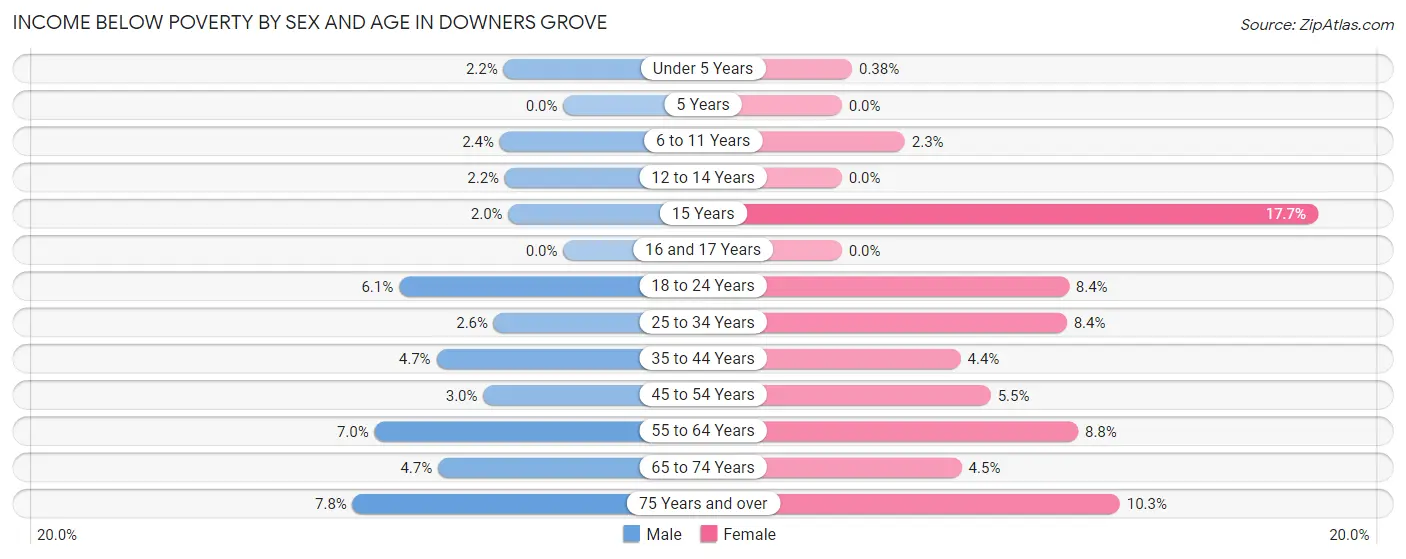
| Age Bracket | Male | Female |
| Under 5 Years | 33 (2.2%) | 5 (0.4%) |
| 5 Years | 0 (0.0%) | 0 (0.0%) |
| 6 to 11 Years | 44 (2.4%) | 40 (2.3%) |
| 12 to 14 Years | 19 (2.2%) | 0 (0.0%) |
| 15 Years | 7 (2.0%) | 82 (17.7%) |
| 16 and 17 Years | 0 (0.0%) | 0 (0.0%) |
| 18 to 24 Years | 106 (6.1%) | 137 (8.4%) |
| 25 to 34 Years | 76 (2.6%) | 268 (8.4%) |
| 35 to 44 Years | 129 (4.7%) | 131 (4.4%) |
| 45 to 54 Years | 101 (3.0%) | 175 (5.5%) |
| 55 to 64 Years | 261 (7.0%) | 316 (8.8%) |
| 65 to 74 Years | 128 (4.6%) | 149 (4.4%) |
| 75 Years and over | 111 (7.8%) | 230 (10.3%) |
| Total | 1,015 (4.2%) | 1,533 (6.1%) |
Income Above Poverty by Sex and Age in Downers Grove
According to the poverty statistics in Downers Grove, males aged 5 years and females aged 5 years are the age groups that are most secure financially, with 100.0% of males and 100.0% of females in these age groups living above the poverty line.
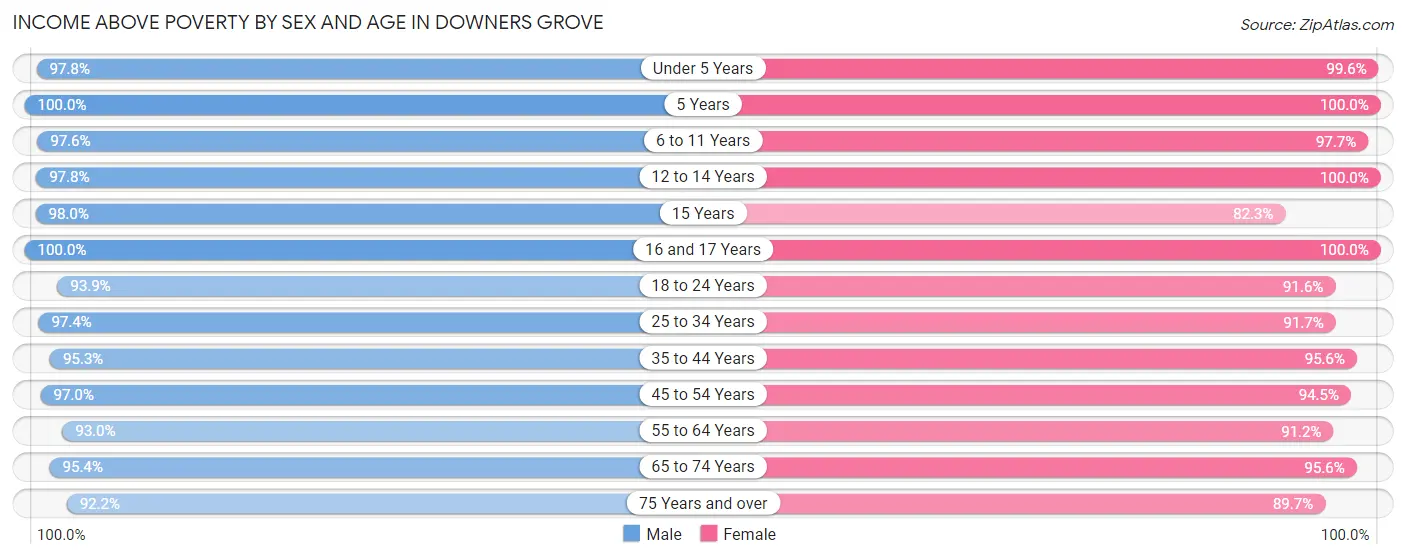
| Age Bracket | Male | Female |
| Under 5 Years | 1,454 (97.8%) | 1,320 (99.6%) |
| 5 Years | 284 (100.0%) | 317 (100.0%) |
| 6 to 11 Years | 1,821 (97.6%) | 1,668 (97.7%) |
| 12 to 14 Years | 858 (97.8%) | 779 (100.0%) |
| 15 Years | 336 (98.0%) | 382 (82.3%) |
| 16 and 17 Years | 651 (100.0%) | 523 (100.0%) |
| 18 to 24 Years | 1,631 (93.9%) | 1,488 (91.6%) |
| 25 to 34 Years | 2,870 (97.4%) | 2,941 (91.6%) |
| 35 to 44 Years | 2,607 (95.3%) | 2,838 (95.6%) |
| 45 to 54 Years | 3,298 (97.0%) | 2,991 (94.5%) |
| 55 to 64 Years | 3,463 (93.0%) | 3,289 (91.2%) |
| 65 to 74 Years | 2,626 (95.4%) | 3,199 (95.6%) |
| 75 Years and over | 1,308 (92.2%) | 1,998 (89.7%) |
| Total | 23,207 (95.8%) | 23,733 (93.9%) |
Income Below Poverty Among Married-Couple Families in Downers Grove
The poverty statistics for married-couple families in Downers Grove show that 2.9% or 328 of the total 11,245 families live below the poverty line. Families with no children have the highest poverty rate of 4.2%, comprising of 269 families. On the other hand, families with 1 or 2 children have the lowest poverty rate of 0.9%, which includes 35 families.
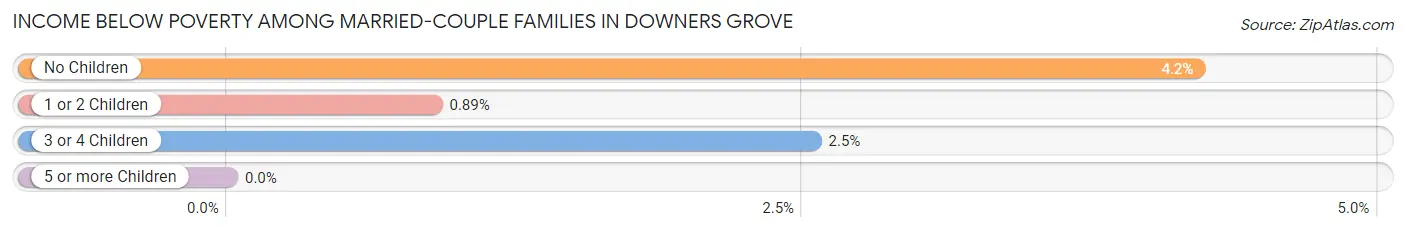
| Children | Above Poverty | Below Poverty |
| No Children | 6,113 (95.8%) | 269 (4.2%) |
| 1 or 2 Children | 3,882 (99.1%) | 35 (0.9%) |
| 3 or 4 Children | 922 (97.5%) | 24 (2.5%) |
| 5 or more Children | 0 (0.0%) | 0 (0.0%) |
| Total | 10,917 (97.1%) | 328 (2.9%) |
Income Below Poverty Among Single-Parent Households in Downers Grove
According to the poverty data in Downers Grove, 2.0% or 19 single-father households and 10.9% or 123 single-mother households are living below the poverty line. Among single-father households, those with no children have the highest poverty rate, with 19 households (3.0%) experiencing poverty. Likewise, among single-mother households, those with no children have the highest poverty rate, with 63 households (11.2%) falling below the poverty line.
| Children | Single Father | Single Mother |
| No Children | 19 (3.0%) | 63 (11.2%) |
| 1 or 2 Children | 0 (0.0%) | 60 (11.1%) |
| 3 or 4 Children | 0 (0.0%) | 0 (0.0%) |
| 5 or more Children | 0 (0.0%) | 0 (0.0%) |
| Total | 19 (2.0%) | 123 (10.9%) |
Income Below Poverty Among Married-Couple vs Single-Parent Households in Downers Grove
The poverty data for Downers Grove shows that 328 of the married-couple family households (2.9%) and 142 of the single-parent households (6.8%) are living below the poverty level. Within the married-couple family households, those with no children have the highest poverty rate, with 269 households (4.2%) falling below the poverty line. Among the single-parent households, those with 1 or 2 children have the highest poverty rate, with 60 household (7.0%) living below poverty.
| Children | Married-Couple Families | Single-Parent Households |
| No Children | 269 (4.2%) | 82 (6.9%) |
| 1 or 2 Children | 35 (0.9%) | 60 (7.0%) |
| 3 or 4 Children | 24 (2.5%) | 0 (0.0%) |
| 5 or more Children | 0 (0.0%) | 0 (0.0%) |
| Total | 328 (2.9%) | 142 (6.8%) |
Race in Downers Grove
The most populous races in Downers Grove are White / Caucasian (42,298 | 84.6%), Asian (2,973 | 5.9%), and Hispanic or Latino (2,752 | 5.5%).
| Race | # Population | % Population |
| Asian | 2,973 | 5.9% |
| Black / African American | 1,659 | 3.3% |
| Hawaiian / Pacific | 14 | 0.0% |
| Hispanic or Latino | 2,752 | 5.5% |
| Native / Alaskan | 15 | 0.0% |
| White / Caucasian | 42,298 | 84.6% |
| Two or more Races | 2,461 | 4.9% |
| Some other Race | 576 | 1.1% |
| Total | 49,996 | 100.0% |
Ancestry in Downers Grove
The most populous ancestries reported in Downers Grove are German (11,718 | 23.4%), Irish (10,776 | 21.5%), Polish (6,434 | 12.9%), Italian (5,860 | 11.7%), and English (3,771 | 7.5%), together accounting for 77.1% of all Downers Grove residents.
| Ancestry | # Population | % Population |
| Afghan | 45 | 0.1% |
| African | 26 | 0.1% |
| Albanian | 197 | 0.4% |
| American | 1,561 | 3.1% |
| Arab | 225 | 0.4% |
| Argentinean | 7 | 0.0% |
| Armenian | 154 | 0.3% |
| Assyrian / Chaldean / Syriac | 77 | 0.2% |
| Australian | 61 | 0.1% |
| Austrian | 116 | 0.2% |
| Belgian | 44 | 0.1% |
| Belizean | 1 | 0.0% |
| Bhutanese | 260 | 0.5% |
| Blackfeet | 29 | 0.1% |
| British | 410 | 0.8% |
| Bulgarian | 21 | 0.0% |
| Burmese | 187 | 0.4% |
| Canadian | 64 | 0.1% |
| Celtic | 56 | 0.1% |
| Central American | 116 | 0.2% |
| Central American Indian | 16 | 0.0% |
| Cherokee | 16 | 0.0% |
| Chickasaw | 2 | 0.0% |
| Colombian | 61 | 0.1% |
| Comanche | 9 | 0.0% |
| Croatian | 563 | 1.1% |
| Cuban | 211 | 0.4% |
| Czech | 1,256 | 2.5% |
| Czechoslovakian | 93 | 0.2% |
| Danish | 286 | 0.6% |
| Dutch | 817 | 1.6% |
| Eastern European | 332 | 0.7% |
| Egyptian | 79 | 0.2% |
| English | 3,771 | 7.5% |
| Ethiopian | 51 | 0.1% |
| European | 1,159 | 2.3% |
| Filipino | 50 | 0.1% |
| Finnish | 95 | 0.2% |
| French | 1,183 | 2.4% |
| French Canadian | 96 | 0.2% |
| German | 11,718 | 23.4% |
| Ghanaian | 28 | 0.1% |
| Greek | 735 | 1.5% |
| Guatemalan | 116 | 0.2% |
| Hopi | 7 | 0.0% |
| Hungarian | 288 | 0.6% |
| Icelander | 6 | 0.0% |
| Indian (Asian) | 978 | 2.0% |
| Iranian | 16 | 0.0% |
| Iraqi | 9 | 0.0% |
| Irish | 10,776 | 21.5% |
| Italian | 5,860 | 11.7% |
| Jamaican | 38 | 0.1% |
| Japanese | 24 | 0.1% |
| Korean | 613 | 1.2% |
| Laotian | 38 | 0.1% |
| Lebanese | 97 | 0.2% |
| Lithuanian | 1,124 | 2.2% |
| Luxembourger | 54 | 0.1% |
| Macedonian | 67 | 0.1% |
| Malaysian | 45 | 0.1% |
| Mexican | 1,751 | 3.5% |
| Mexican American Indian | 15 | 0.0% |
| Moroccan | 19 | 0.0% |
| Native Hawaiian | 14 | 0.0% |
| Northern European | 88 | 0.2% |
| Norwegian | 619 | 1.2% |
| Okinawan | 8 | 0.0% |
| Pakistani | 47 | 0.1% |
| Palestinian | 13 | 0.0% |
| Peruvian | 13 | 0.0% |
| Polish | 6,434 | 12.9% |
| Portuguese | 44 | 0.1% |
| Puerto Rican | 219 | 0.4% |
| Romanian | 388 | 0.8% |
| Russian | 430 | 0.9% |
| Samoan | 14 | 0.0% |
| Scandinavian | 241 | 0.5% |
| Scotch-Irish | 368 | 0.7% |
| Scottish | 570 | 1.1% |
| Serbian | 563 | 1.1% |
| Slavic | 44 | 0.1% |
| Slovak | 272 | 0.5% |
| Slovene | 223 | 0.4% |
| South American | 129 | 0.3% |
| Spaniard | 105 | 0.2% |
| Spanish | 59 | 0.1% |
| Sri Lankan | 55 | 0.1% |
| Subsaharan African | 105 | 0.2% |
| Swedish | 1,470 | 2.9% |
| Swiss | 157 | 0.3% |
| Syrian | 8 | 0.0% |
| Thai | 1,239 | 2.5% |
| Turkish | 25 | 0.1% |
| Ukrainian | 426 | 0.9% |
| Venezuelan | 48 | 0.1% |
| Welsh | 286 | 0.6% |
| West Indian | 27 | 0.1% |
| Yugoslavian | 115 | 0.2% | View All 99 Rows |
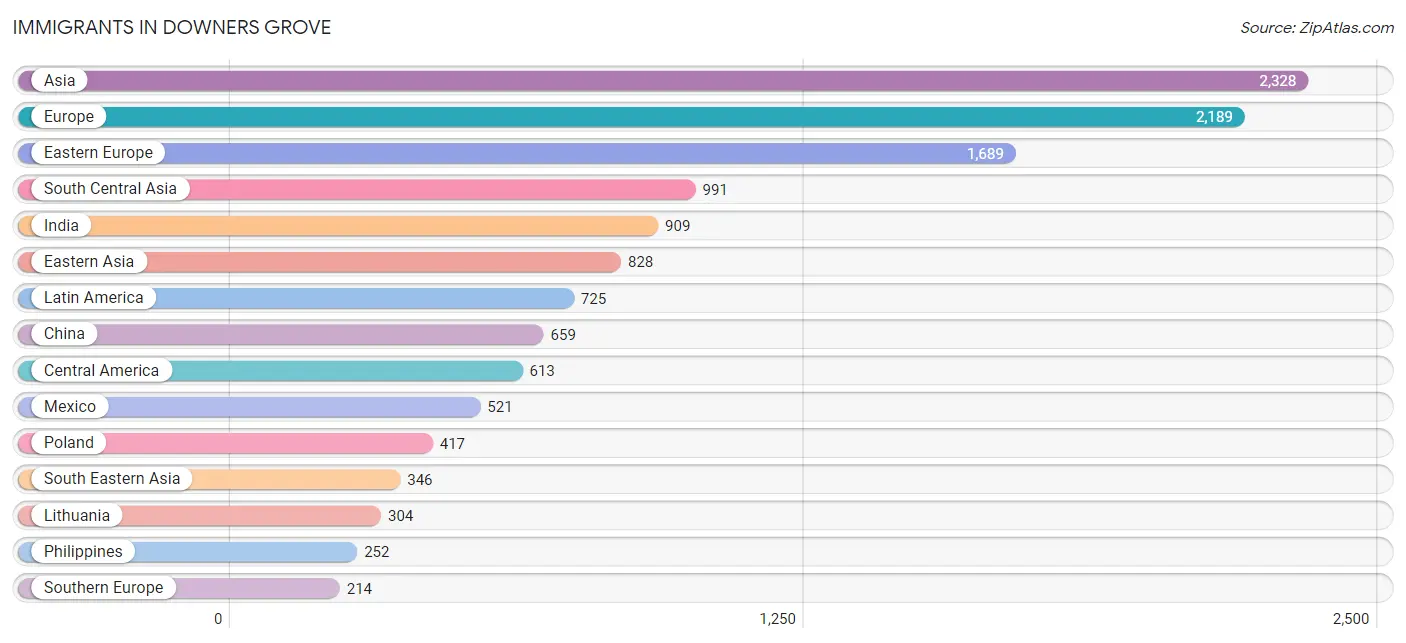
Immigrants in Downers Grove
The most numerous immigrant groups reported in Downers Grove came from Asia (2,328 | 4.7%), Europe (2,189 | 4.4%), Eastern Europe (1,689 | 3.4%), South Central Asia (991 | 2.0%), and India (909 | 1.8%), together accounting for 16.2% of all Downers Grove residents.
| Immigration Origin | # Population | % Population |
| Afghanistan | 33 | 0.1% |
| Africa | 183 | 0.4% |
| Albania | 70 | 0.1% |
| Argentina | 7 | 0.0% |
| Asia | 2,328 | 4.7% |
| Australia | 12 | 0.0% |
| Austria | 22 | 0.0% |
| Belarus | 83 | 0.2% |
| Belize | 1 | 0.0% |
| Bosnia and Herzegovina | 44 | 0.1% |
| Bulgaria | 15 | 0.0% |
| Cambodia | 8 | 0.0% |
| Canada | 54 | 0.1% |
| Caribbean | 14 | 0.0% |
| Central America | 613 | 1.2% |
| China | 659 | 1.3% |
| Colombia | 34 | 0.1% |
| Croatia | 73 | 0.2% |
| Czechoslovakia | 134 | 0.3% |
| Eastern Africa | 86 | 0.2% |
| Eastern Asia | 828 | 1.7% |
| Eastern Europe | 1,689 | 3.4% |
| Egypt | 56 | 0.1% |
| England | 43 | 0.1% |
| Ethiopia | 35 | 0.1% |
| Europe | 2,189 | 4.4% |
| France | 56 | 0.1% |
| Germany | 59 | 0.1% |
| Greece | 72 | 0.1% |
| Guatemala | 91 | 0.2% |
| Hong Kong | 32 | 0.1% |
| India | 909 | 1.8% |
| Indonesia | 13 | 0.0% |
| Iraq | 48 | 0.1% |
| Ireland | 31 | 0.1% |
| Italy | 105 | 0.2% |
| Japan | 42 | 0.1% |
| Korea | 127 | 0.3% |
| Laos | 17 | 0.0% |
| Latin America | 725 | 1.5% |
| Lebanon | 65 | 0.1% |
| Lithuania | 304 | 0.6% |
| Malaysia | 16 | 0.0% |
| Mexico | 521 | 1.0% |
| Moldova | 58 | 0.1% |
| Netherlands | 31 | 0.1% |
| North Macedonia | 23 | 0.1% |
| Northern Africa | 56 | 0.1% |
| Northern Europe | 92 | 0.2% |
| Oceania | 12 | 0.0% |
| Pakistan | 38 | 0.1% |
| Philippines | 252 | 0.5% |
| Poland | 417 | 0.8% |
| Romania | 140 | 0.3% |
| Russia | 59 | 0.1% |
| Saudi Arabia | 24 | 0.1% |
| Serbia | 54 | 0.1% |
| Singapore | 8 | 0.0% |
| South Africa | 41 | 0.1% |
| South America | 98 | 0.2% |
| South Central Asia | 991 | 2.0% |
| South Eastern Asia | 346 | 0.7% |
| Southern Europe | 214 | 0.4% |
| Spain | 37 | 0.1% |
| Sri Lanka | 11 | 0.0% |
| Switzerland | 13 | 0.0% |
| Taiwan | 87 | 0.2% |
| Trinidad and Tobago | 14 | 0.0% |
| Turkey | 10 | 0.0% |
| Uganda | 51 | 0.1% |
| Ukraine | 179 | 0.4% |
| Venezuela | 57 | 0.1% |
| Vietnam | 32 | 0.1% |
| Western Asia | 147 | 0.3% |
| Western Europe | 181 | 0.4% | View All 75 Rows |
Sex and Age in Downers Grove
Sex and Age in Downers Grove
The most populous age groups in Downers Grove are 55 to 59 Years (2,065 | 8.4%) for men and 60 to 64 Years (1,899 | 7.4%) for women.
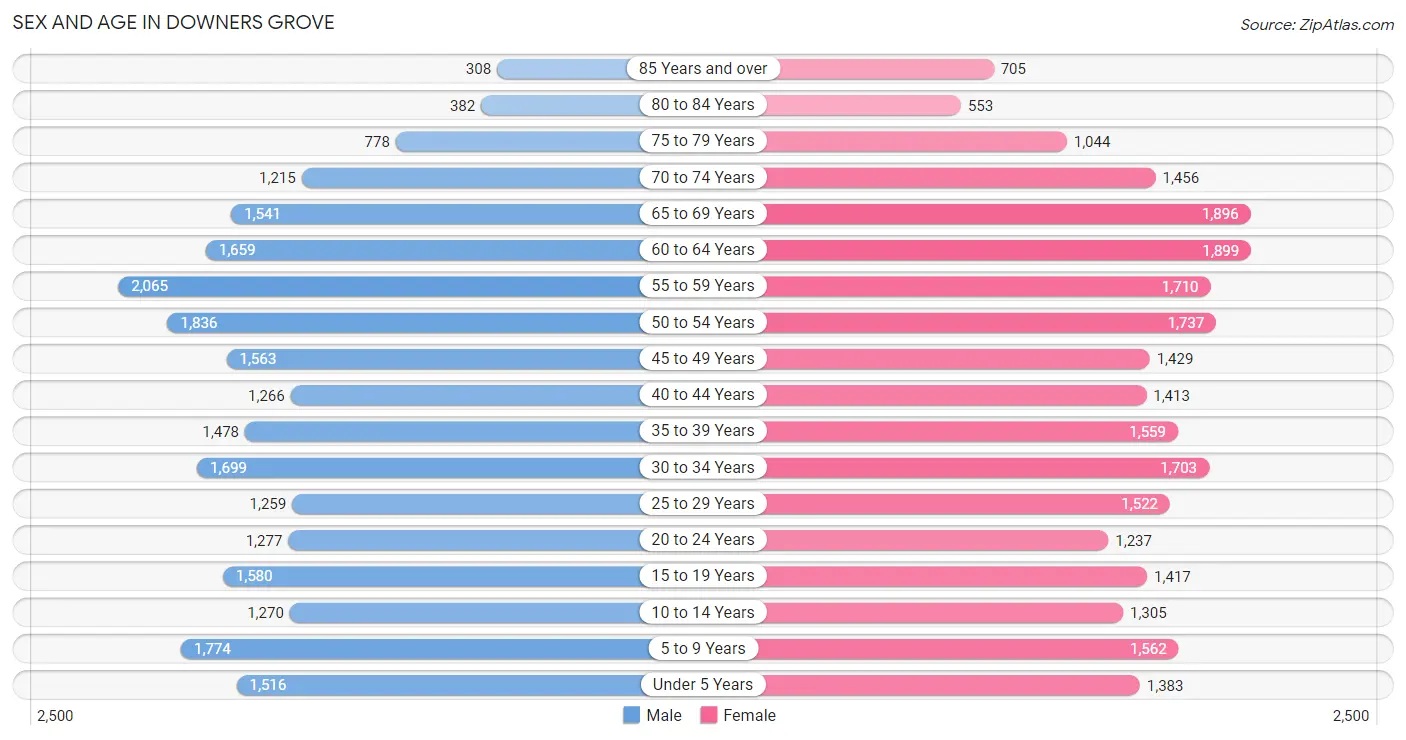
| Age Bracket | Male | Female |
| Under 5 Years | 1,516 (6.2%) | 1,383 (5.4%) |
| 5 to 9 Years | 1,774 (7.2%) | 1,562 (6.1%) |
| 10 to 14 Years | 1,270 (5.2%) | 1,305 (5.1%) |
| 15 to 19 Years | 1,580 (6.5%) | 1,417 (5.6%) |
| 20 to 24 Years | 1,277 (5.2%) | 1,237 (4.9%) |
| 25 to 29 Years | 1,259 (5.1%) | 1,522 (6.0%) |
| 30 to 34 Years | 1,699 (6.9%) | 1,703 (6.7%) |
| 35 to 39 Years | 1,478 (6.0%) | 1,559 (6.1%) |
| 40 to 44 Years | 1,266 (5.2%) | 1,413 (5.5%) |
| 45 to 49 Years | 1,563 (6.4%) | 1,429 (5.6%) |
| 50 to 54 Years | 1,836 (7.5%) | 1,737 (6.8%) |
| 55 to 59 Years | 2,065 (8.4%) | 1,710 (6.7%) |
| 60 to 64 Years | 1,659 (6.8%) | 1,899 (7.4%) |
| 65 to 69 Years | 1,541 (6.3%) | 1,896 (7.4%) |
| 70 to 74 Years | 1,215 (5.0%) | 1,456 (5.7%) |
| 75 to 79 Years | 778 (3.2%) | 1,044 (4.1%) |
| 80 to 84 Years | 382 (1.6%) | 553 (2.2%) |
| 85 Years and over | 308 (1.3%) | 705 (2.8%) |
| Total | 24,466 (100.0%) | 25,530 (100.0%) |
Families and Households in Downers Grove
Median Family Size in Downers Grove
The median family size in Downers Grove is 3.06 persons per family, with married-couple families (11,245 | 84.3%) accounting for the largest median family size of 3.12 persons per family. On the other hand, single male/father families (971 | 7.3%) represent the smallest median family size with 2.49 persons per family.
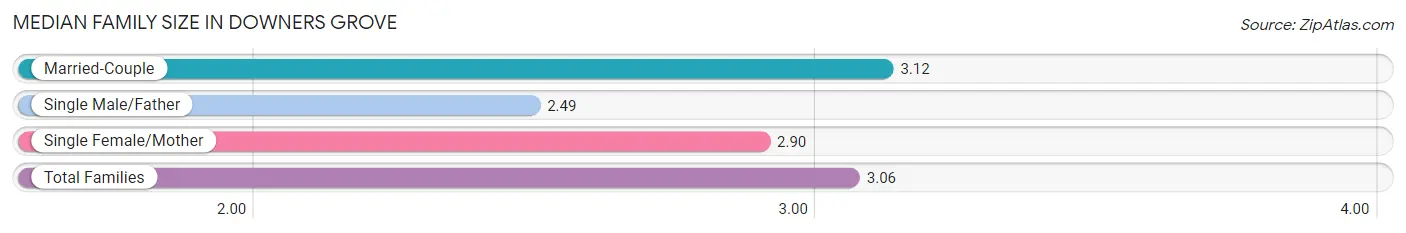
| Family Type | # Families | Family Size |
| Married-Couple | 11,245 (84.3%) | 3.12 |
| Single Male/Father | 971 (7.3%) | 2.49 |
| Single Female/Mother | 1,128 (8.5%) | 2.90 |
| Total Families | 13,344 (100.0%) | 3.06 |
Median Household Size in Downers Grove
The median household size in Downers Grove is 2.45 persons per household, with single female/mother households (1,128 | 5.6%) accounting for the largest median household size of 3.18 persons per household. non-family households (6,852 | 33.9%) represent the smallest median household size with 1.16 persons per household.
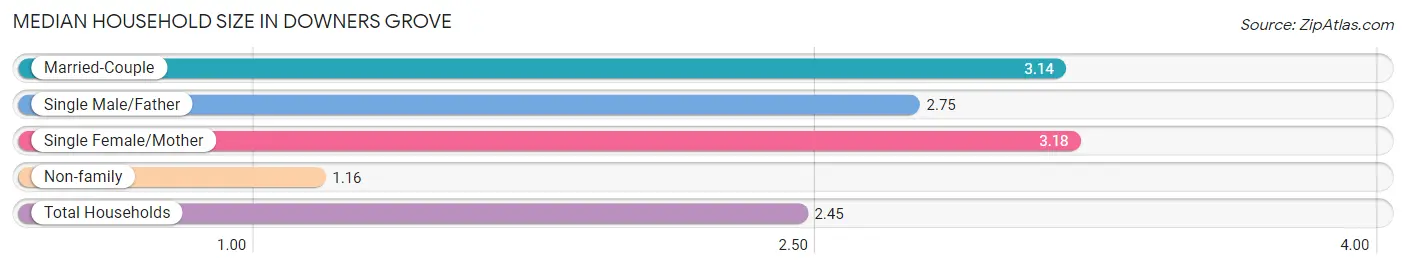
| Household Type | # Households | Household Size |
| Married-Couple | 11,245 (55.7%) | 3.14 |
| Single Male/Father | 971 (4.8%) | 2.75 |
| Single Female/Mother | 1,128 (5.6%) | 3.18 |
| Non-family | 6,852 (33.9%) | 1.16 |
| Total Households | 20,196 (100.0%) | 2.45 |
Household Size by Marriage Status in Downers Grove
Out of a total of 20,196 households in Downers Grove, 13,344 (66.1%) are family households, while 6,852 (33.9%) are nonfamily households. The most numerous type of family households are 2-person households, comprising 6,212, and the most common type of nonfamily households are 1-person households, comprising 5,862.
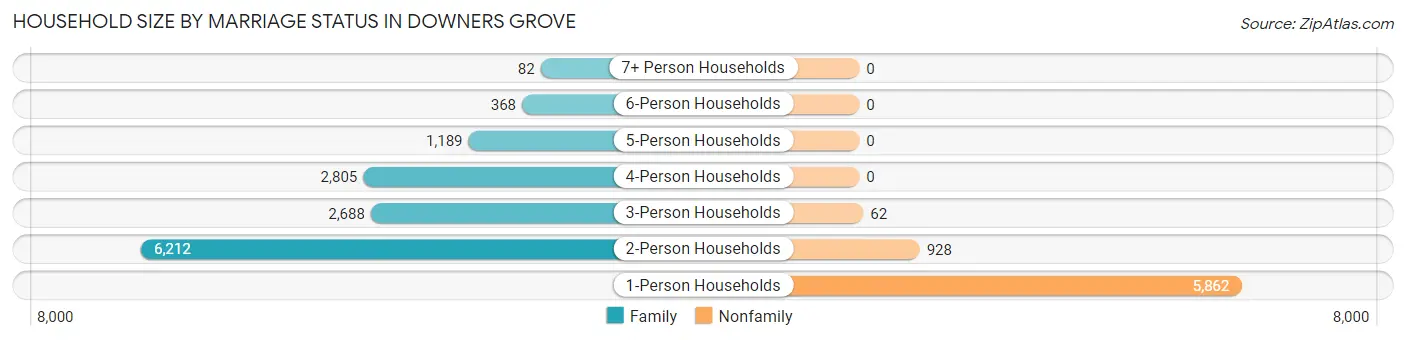
| Household Size | Family Households | Nonfamily Households |
| 1-Person Households | - | 5,862 (29.0%) |
| 2-Person Households | 6,212 (30.8%) | 928 (4.6%) |
| 3-Person Households | 2,688 (13.3%) | 62 (0.3%) |
| 4-Person Households | 2,805 (13.9%) | 0 (0.0%) |
| 5-Person Households | 1,189 (5.9%) | 0 (0.0%) |
| 6-Person Households | 368 (1.8%) | 0 (0.0%) |
| 7+ Person Households | 82 (0.4%) | 0 (0.0%) |
| Total | 13,344 (66.1%) | 6,852 (33.9%) |
Female Fertility in Downers Grove
Fertility by Age in Downers Grove
Average fertility rate in Downers Grove is 62.0 births per 1,000 women. Women in the age bracket of 20 to 34 years have the highest fertility rate with 79.0 births per 1,000 women. Women in the age bracket of 20 to 34 years acount for 53.8% of all women with births.
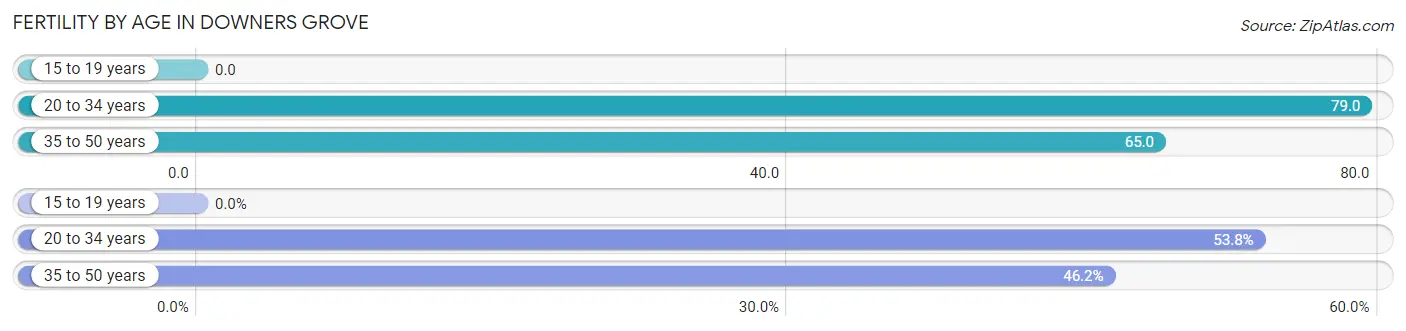
| Age Bracket | Women with Births | Births / 1,000 Women |
| 15 to 19 years | 0 (0.0%) | 0.0 |
| 20 to 34 years | 352 (53.8%) | 79.0 |
| 35 to 50 years | 302 (46.2%) | 65.0 |
| Total | 654 (100.0%) | 62.0 |
Fertility by Age by Marriage Status in Downers Grove
93.6% of women with births (654) in Downers Grove are married. The highest percentage of unmarried women with births falls into 20 to 34 years age bracket with 9.9% of them unmarried at the time of birth, while the lowest percentage of unmarried women with births belong to 35 to 50 years age bracket with 2.3% of them unmarried.
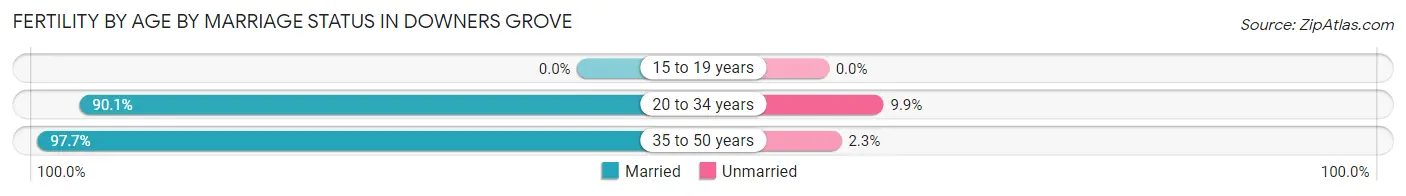
| Age Bracket | Married | Unmarried |
| 15 to 19 years | 0 (0.0%) | 0 (0.0%) |
| 20 to 34 years | 317 (90.1%) | 35 (9.9%) |
| 35 to 50 years | 295 (97.7%) | 7 (2.3%) |
| Total | 612 (93.6%) | 42 (6.4%) |
Fertility by Education in Downers Grove
Average fertility rate in Downers Grove is 62.0 births per 1,000 women. Women with the education attainment of graduate degree have the highest fertility rate of 84.0 births per 1,000 women, while women with the education attainment of college or associate's degree have the lowest fertility at 23.0 births per 1,000 women. Women with the education attainment of bachelor's degree represent 43.4% of all women with births.
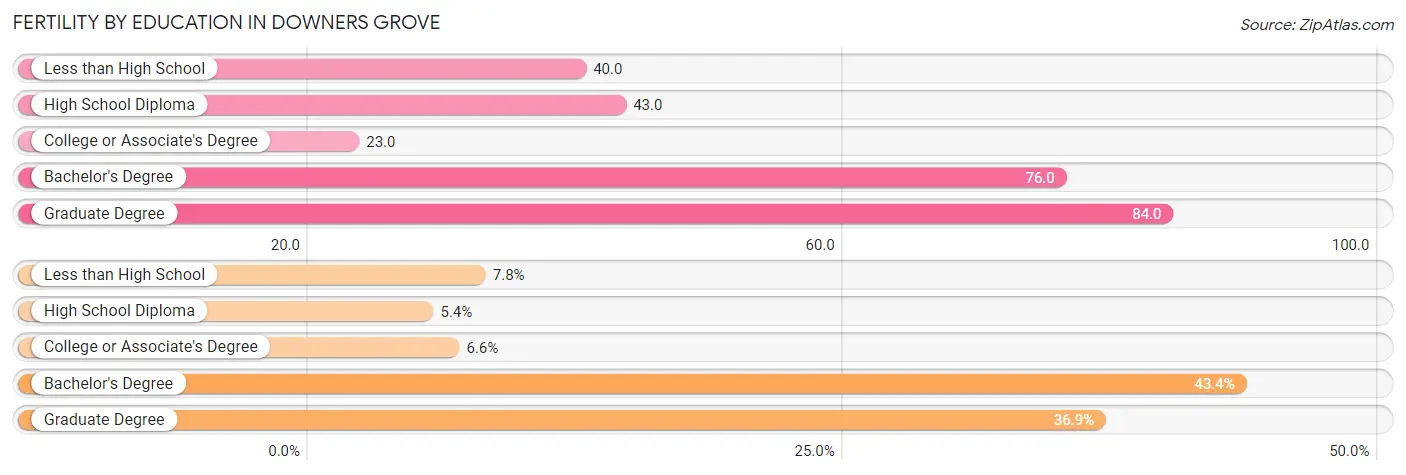
| Educational Attainment | Women with Births | Births / 1,000 Women |
| Less than High School | 51 (7.8%) | 40.0 |
| High School Diploma | 35 (5.3%) | 43.0 |
| College or Associate's Degree | 43 (6.6%) | 23.0 |
| Bachelor's Degree | 284 (43.4%) | 76.0 |
| Graduate Degree | 241 (36.8%) | 84.0 |
| Total | 654 (100.0%) | 62.0 |
Fertility by Education by Marriage Status in Downers Grove
6.4% of women with births in Downers Grove are unmarried. Women with the educational attainment of less than high school are most likely to be married with 100.0% of them married at childbirth, while women with the educational attainment of high school diploma are least likely to be married with 100.0% of them unmarried at childbirth.
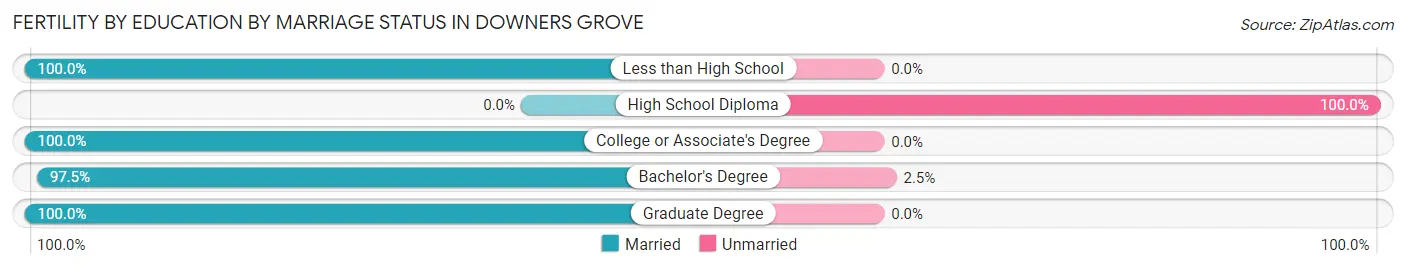
| Educational Attainment | Married | Unmarried |
| Less than High School | 51 (100.0%) | 0 (0.0%) |
| High School Diploma | 0 (0.0%) | 35 (100.0%) |
| College or Associate's Degree | 43 (100.0%) | 0 (0.0%) |
| Bachelor's Degree | 277 (97.5%) | 7 (2.5%) |
| Graduate Degree | 241 (100.0%) | 0 (0.0%) |
| Total | 612 (93.6%) | 42 (6.4%) |
Employment Characteristics in Downers Grove
Employment by Class of Employer in Downers Grove
Among the 25,268 employed individuals in Downers Grove, private company employees (17,614 | 69.7%), not-for-profit organizations (2,067 | 8.2%), and local government employees (2,003 | 7.9%) make up the most common classes of employment.
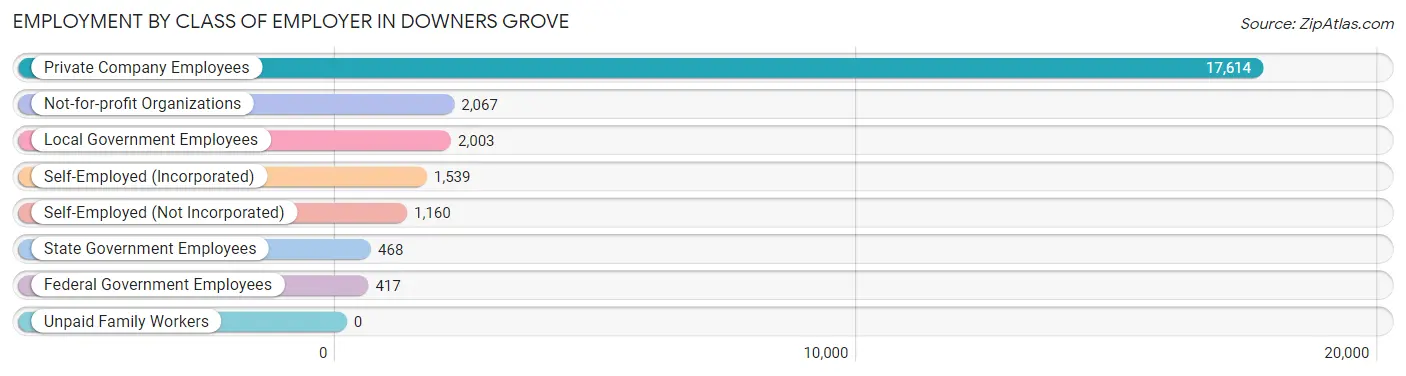
| Employer Class | # Employees | % Employees |
| Private Company Employees | 17,614 | 69.7% |
| Self-Employed (Incorporated) | 1,539 | 6.1% |
| Self-Employed (Not Incorporated) | 1,160 | 4.6% |
| Not-for-profit Organizations | 2,067 | 8.2% |
| Local Government Employees | 2,003 | 7.9% |
| State Government Employees | 468 | 1.8% |
| Federal Government Employees | 417 | 1.7% |
| Unpaid Family Workers | 0 | 0.0% |
| Total | 25,268 | 100.0% |
Employment Status by Age in Downers Grove
According to the labor force statistics for Downers Grove, out of the total population over 16 years of age (40,379), 67.0% or 27,054 individuals are in the labor force, with 4.1% or 1,109 of them unemployed. The age group with the highest labor force participation rate is 30 to 34 years, with 90.4% or 3,075 individuals in the labor force. Within the labor force, the 16 to 19 years age range has the highest percentage of unemployed individuals, with 16.2% or 187 of them being unemployed.
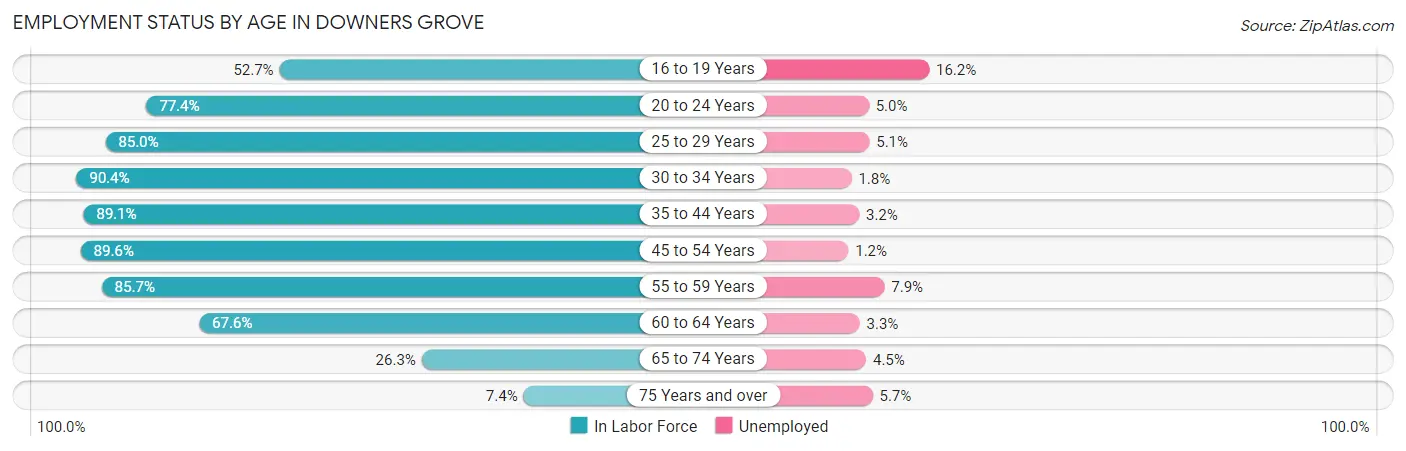
| Age Bracket | In Labor Force | Unemployed |
| 16 to 19 Years | 1,154 (52.7%) | 187 (16.2%) |
| 20 to 24 Years | 1,946 (77.4%) | 97 (5.0%) |
| 25 to 29 Years | 2,364 (85.0%) | 121 (5.1%) |
| 30 to 34 Years | 3,075 (90.4%) | 55 (1.8%) |
| 35 to 44 Years | 5,093 (89.1%) | 163 (3.2%) |
| 45 to 54 Years | 5,882 (89.6%) | 71 (1.2%) |
| 55 to 59 Years | 3,235 (85.7%) | 256 (7.9%) |
| 60 to 64 Years | 2,405 (67.6%) | 79 (3.3%) |
| 65 to 74 Years | 1,606 (26.3%) | 72 (4.5%) |
| 75 Years and over | 279 (7.4%) | 16 (5.7%) |
| Total | 27,054 (67.0%) | 1,109 (4.1%) |
Employment Status by Educational Attainment in Downers Grove
According to labor force statistics for Downers Grove, 85.5% of individuals (22,056) out of the total population between 25 and 64 years of age (25,797) are in the labor force, with 3.4% or 750 of them being unemployed. The group with the highest labor force participation rate are those with the educational attainment of bachelor's degree or higher, with 90.1% or 14,977 individuals in the labor force. Within the labor force, individuals with high school diploma education have the highest percentage of unemployment, with 7.5% or 178 of them being unemployed.
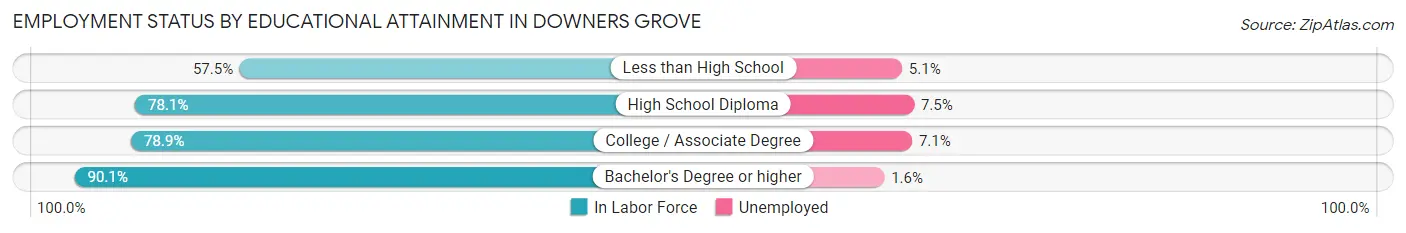
| Educational Attainment | In Labor Force | Unemployed |
| Less than High School | 375 (57.5%) | 33 (5.1%) |
| High School Diploma | 2,371 (78.1%) | 228 (7.5%) |
| College / Associate Degree | 4,328 (78.9%) | 390 (7.1%) |
| Bachelor's Degree or higher | 14,977 (90.1%) | 266 (1.6%) |
| Total | 22,056 (85.5%) | 877 (3.4%) |
Employment Occupations by Sex in Downers Grove
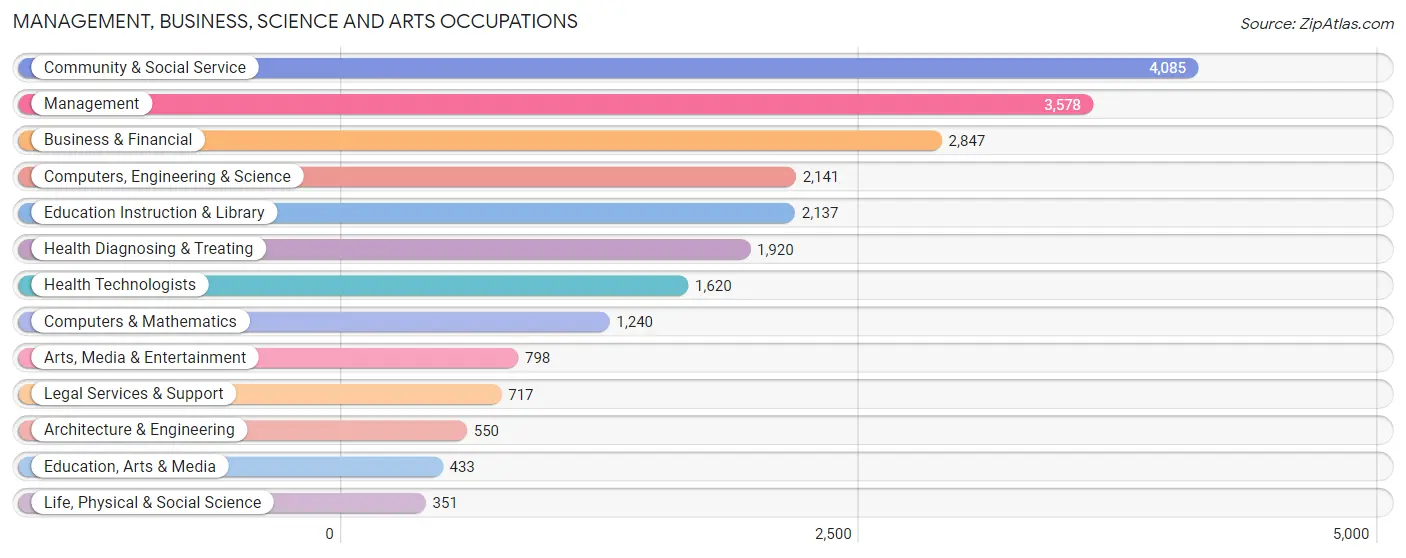
Management, Business, Science and Arts Occupations
The most common Management, Business, Science and Arts occupations in Downers Grove are Community & Social Service (4,085 | 15.8%), Management (3,578 | 13.8%), Business & Financial (2,847 | 11.0%), Computers, Engineering & Science (2,141 | 8.3%), and Education Instruction & Library (2,137 | 8.3%).
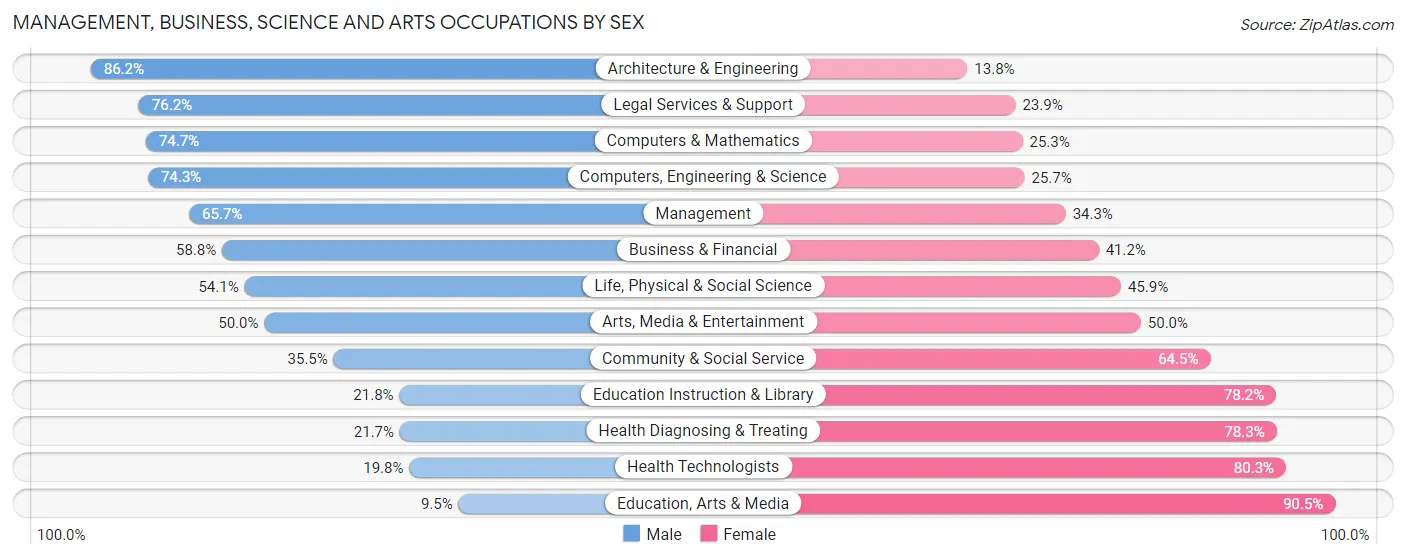
Management, Business, Science and Arts Occupations by Sex
Within the Management, Business, Science and Arts occupations in Downers Grove, the most male-oriented occupations are Architecture & Engineering (86.2%), Legal Services & Support (76.1%), and Computers & Mathematics (74.7%), while the most female-oriented occupations are Education, Arts & Media (90.5%), Health Technologists (80.2%), and Health Diagnosing & Treating (78.3%).
| Occupation | Male | Female |
| Management | 2,350 (65.7%) | 1,228 (34.3%) |
| Business & Financial | 1,674 (58.8%) | 1,173 (41.2%) |
| Computers, Engineering & Science | 1,590 (74.3%) | 551 (25.7%) |
| Computers & Mathematics | 926 (74.7%) | 314 (25.3%) |
| Architecture & Engineering | 474 (86.2%) | 76 (13.8%) |
| Life, Physical & Social Science | 190 (54.1%) | 161 (45.9%) |
| Community & Social Service | 1,452 (35.5%) | 2,633 (64.5%) |
| Education, Arts & Media | 41 (9.5%) | 392 (90.5%) |
| Legal Services & Support | 546 (76.1%) | 171 (23.8%) |
| Education Instruction & Library | 466 (21.8%) | 1,671 (78.2%) |
| Arts, Media & Entertainment | 399 (50.0%) | 399 (50.0%) |
| Health Diagnosing & Treating | 417 (21.7%) | 1,503 (78.3%) |
| Health Technologists | 320 (19.8%) | 1,300 (80.2%) |
| Total (Category) | 7,483 (51.4%) | 7,088 (48.6%) |
| Total (Overall) | 13,954 (53.9%) | 11,935 (46.1%) |
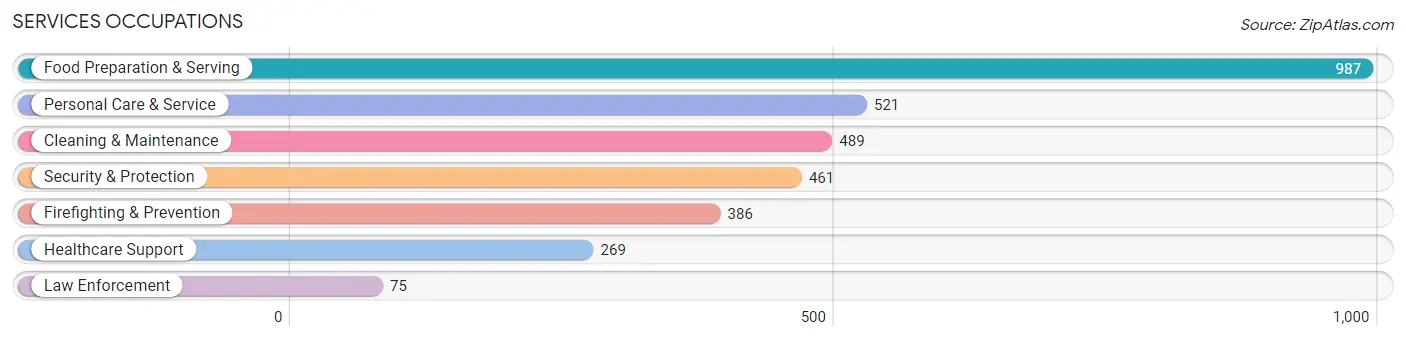
Services Occupations
The most common Services occupations in Downers Grove are Food Preparation & Serving (987 | 3.8%), Personal Care & Service (521 | 2.0%), Cleaning & Maintenance (489 | 1.9%), Security & Protection (461 | 1.8%), and Firefighting & Prevention (386 | 1.5%).
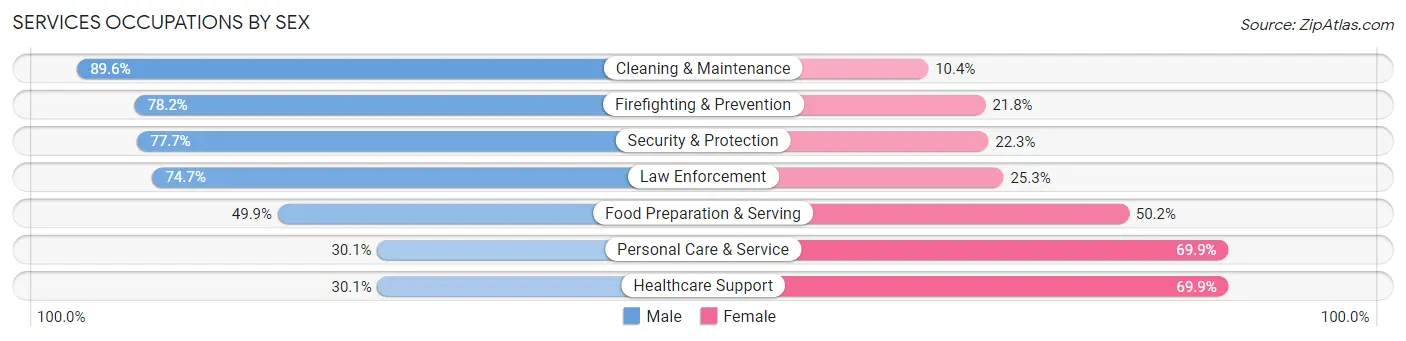
Services Occupations by Sex
Within the Services occupations in Downers Grove, the most male-oriented occupations are Cleaning & Maintenance (89.6%), Firefighting & Prevention (78.2%), and Security & Protection (77.7%), while the most female-oriented occupations are Healthcare Support (69.9%), Personal Care & Service (69.9%), and Food Preparation & Serving (50.1%).
| Occupation | Male | Female |
| Healthcare Support | 81 (30.1%) | 188 (69.9%) |
| Security & Protection | 358 (77.7%) | 103 (22.3%) |
| Firefighting & Prevention | 302 (78.2%) | 84 (21.8%) |
| Law Enforcement | 56 (74.7%) | 19 (25.3%) |
| Food Preparation & Serving | 492 (49.8%) | 495 (50.1%) |
| Cleaning & Maintenance | 438 (89.6%) | 51 (10.4%) |
| Personal Care & Service | 157 (30.1%) | 364 (69.9%) |
| Total (Category) | 1,526 (56.0%) | 1,201 (44.0%) |
| Total (Overall) | 13,954 (53.9%) | 11,935 (46.1%) |
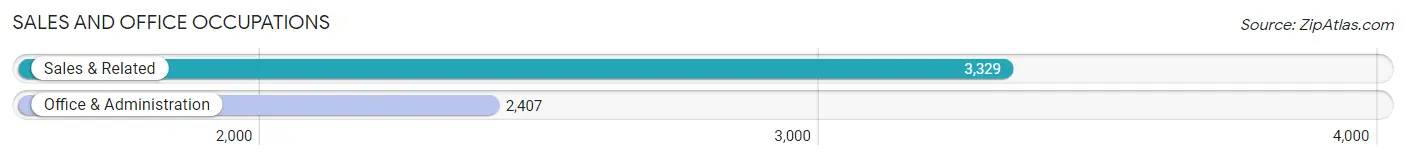
Sales and Office Occupations
The most common Sales and Office occupations in Downers Grove are Sales & Related (3,329 | 12.9%), and Office & Administration (2,407 | 9.3%).
Sales and Office Occupations by Sex
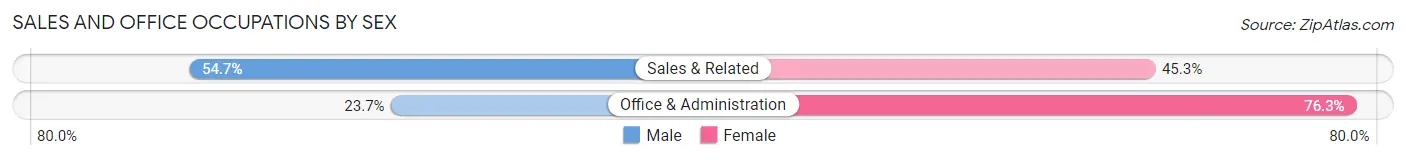
| Occupation | Male | Female |
| Sales & Related | 1,821 (54.7%) | 1,508 (45.3%) |
| Office & Administration | 571 (23.7%) | 1,836 (76.3%) |
| Total (Category) | 2,392 (41.7%) | 3,344 (58.3%) |
| Total (Overall) | 13,954 (53.9%) | 11,935 (46.1%) |
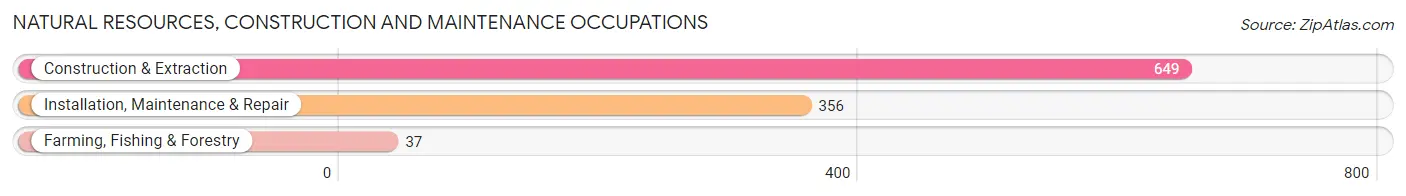
Natural Resources, Construction and Maintenance Occupations
The most common Natural Resources, Construction and Maintenance occupations in Downers Grove are Construction & Extraction (649 | 2.5%), Installation, Maintenance & Repair (356 | 1.4%), and Farming, Fishing & Forestry (37 | 0.1%).
Natural Resources, Construction and Maintenance Occupations by Sex
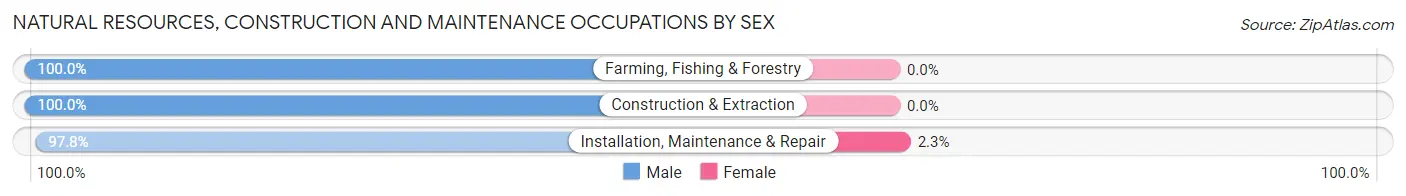
| Occupation | Male | Female |
| Farming, Fishing & Forestry | 37 (100.0%) | 0 (0.0%) |
| Construction & Extraction | 649 (100.0%) | 0 (0.0%) |
| Installation, Maintenance & Repair | 348 (97.8%) | 8 (2.2%) |
| Total (Category) | 1,034 (99.2%) | 8 (0.8%) |
| Total (Overall) | 13,954 (53.9%) | 11,935 (46.1%) |
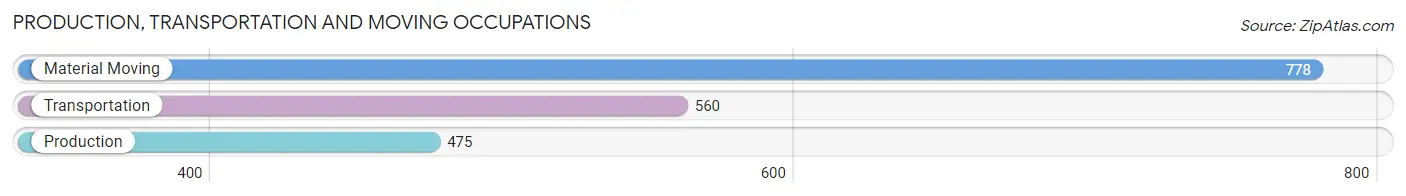
Production, Transportation and Moving Occupations
The most common Production, Transportation and Moving occupations in Downers Grove are Material Moving (778 | 3.0%), Transportation (560 | 2.2%), and Production (475 | 1.8%).
Production, Transportation and Moving Occupations by Sex
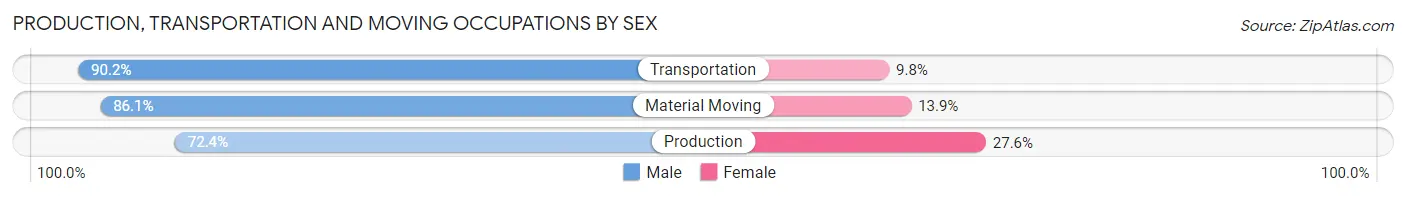
| Occupation | Male | Female |
| Production | 344 (72.4%) | 131 (27.6%) |
| Transportation | 505 (90.2%) | 55 (9.8%) |
| Material Moving | 670 (86.1%) | 108 (13.9%) |
| Total (Category) | 1,519 (83.8%) | 294 (16.2%) |
| Total (Overall) | 13,954 (53.9%) | 11,935 (46.1%) |
Employment Industries by Sex in Downers Grove
Employment Industries in Downers Grove
The major employment industries in Downers Grove include Professional & Scientific (3,965 | 15.3%), Educational Services (2,984 | 11.5%), Health Care & Social Assistance (2,807 | 10.8%), Manufacturing (2,345 | 9.1%), and Retail Trade (2,308 | 8.9%).
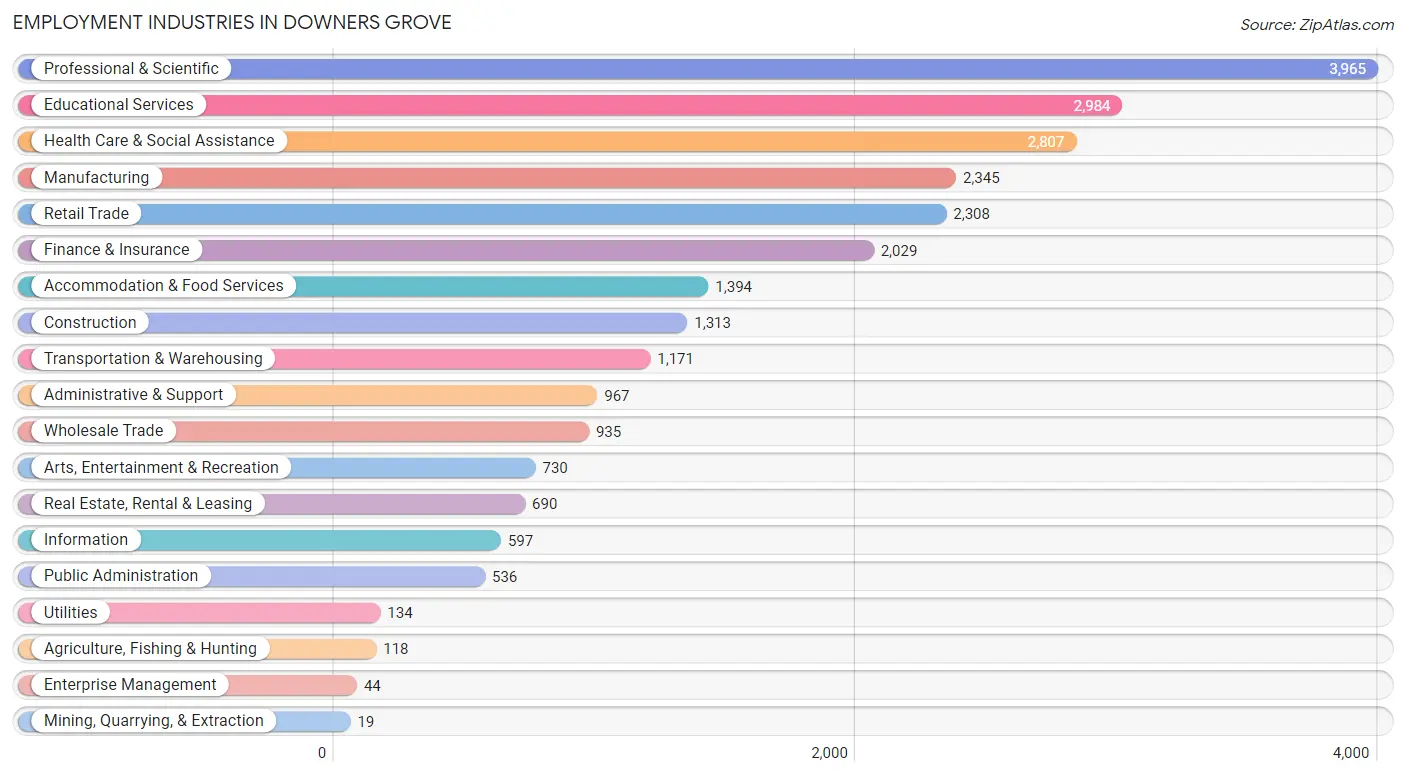
Employment Industries by Sex in Downers Grove
The Downers Grove industries that see more men than women are Agriculture, Fishing & Hunting (91.5%), Construction (88.6%), and Utilities (76.9%), whereas the industries that tend to have a higher number of women are Health Care & Social Assistance (81.4%), Enterprise Management (75.0%), and Educational Services (73.8%).
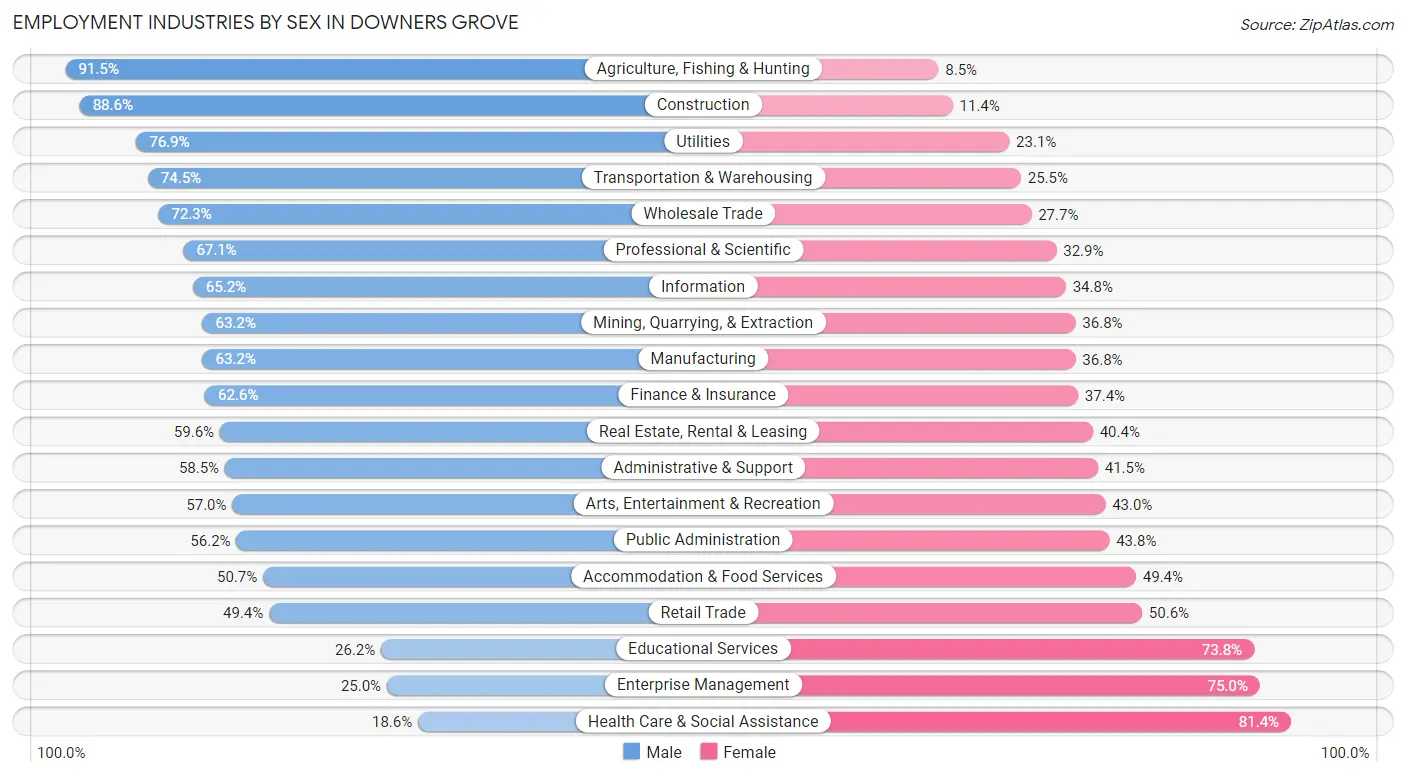
| Industry | Male | Female |
| Agriculture, Fishing & Hunting | 108 (91.5%) | 10 (8.5%) |
| Mining, Quarrying, & Extraction | 12 (63.2%) | 7 (36.8%) |
| Construction | 1,163 (88.6%) | 150 (11.4%) |
| Manufacturing | 1,481 (63.2%) | 864 (36.8%) |
| Wholesale Trade | 676 (72.3%) | 259 (27.7%) |
| Retail Trade | 1,140 (49.4%) | 1,168 (50.6%) |
| Transportation & Warehousing | 872 (74.5%) | 299 (25.5%) |
| Utilities | 103 (76.9%) | 31 (23.1%) |
| Information | 389 (65.2%) | 208 (34.8%) |
| Finance & Insurance | 1,271 (62.6%) | 758 (37.4%) |
| Real Estate, Rental & Leasing | 411 (59.6%) | 279 (40.4%) |
| Professional & Scientific | 2,661 (67.1%) | 1,304 (32.9%) |
| Enterprise Management | 11 (25.0%) | 33 (75.0%) |
| Administrative & Support | 566 (58.5%) | 401 (41.5%) |
| Educational Services | 782 (26.2%) | 2,202 (73.8%) |
| Health Care & Social Assistance | 521 (18.6%) | 2,286 (81.4%) |
| Arts, Entertainment & Recreation | 416 (57.0%) | 314 (43.0%) |
| Accommodation & Food Services | 706 (50.6%) | 688 (49.3%) |
| Public Administration | 301 (56.2%) | 235 (43.8%) |
| Total | 13,954 (53.9%) | 11,935 (46.1%) |
Education in Downers Grove
School Enrollment in Downers Grove
The most common levels of schooling among the 11,769 students in Downers Grove are elementary school (2,603 | 22.1%), high school (2,561 | 21.8%), and middle school (2,065 | 17.5%).
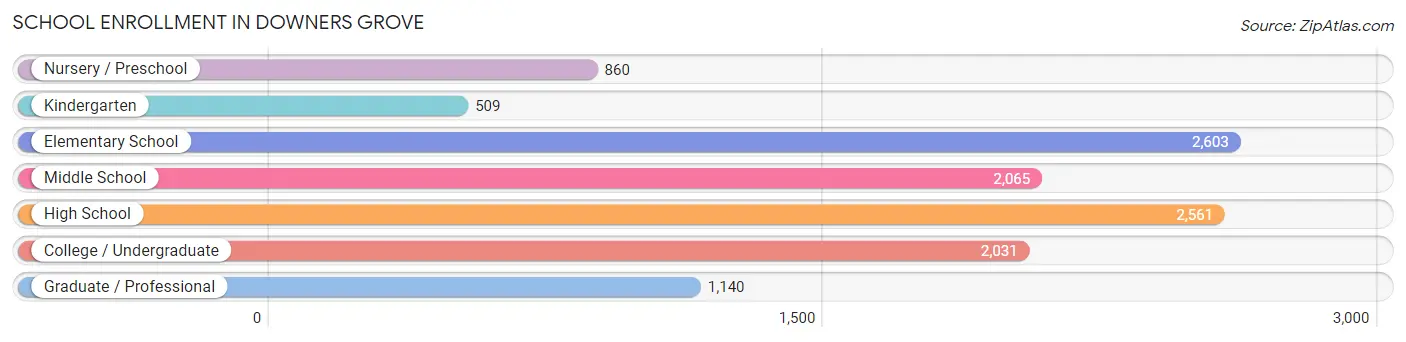
| School Level | # Students | % Students |
| Nursery / Preschool | 860 | 7.3% |
| Kindergarten | 509 | 4.3% |
| Elementary School | 2,603 | 22.1% |
| Middle School | 2,065 | 17.5% |
| High School | 2,561 | 21.8% |
| College / Undergraduate | 2,031 | 17.3% |
| Graduate / Professional | 1,140 | 9.7% |
| Total | 11,769 | 100.0% |
School Enrollment by Age by Funding Source in Downers Grove
Out of a total of 11,769 students who are enrolled in schools in Downers Grove, 2,966 (25.2%) attend a private institution, while the remaining 8,803 (74.8%) are enrolled in public schools. The age group of 25 to 34 year olds has the highest likelihood of being enrolled in private schools, with 490 (61.6% in the age bracket) enrolled. Conversely, the age group of 15 to 17 year olds has the lowest likelihood of being enrolled in a private school, with 1,739 (88.3% in the age bracket) attending a public institution.
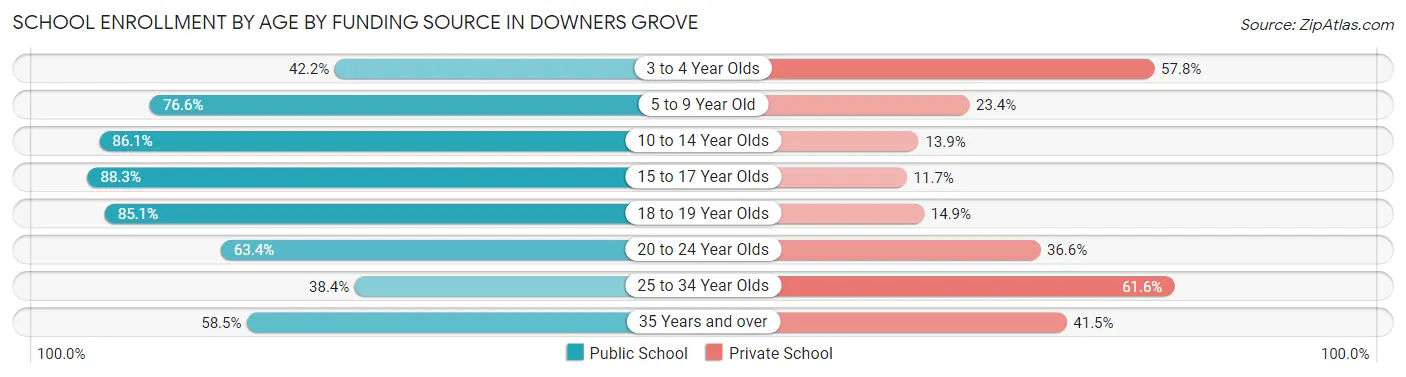
| Age Bracket | Public School | Private School |
| 3 to 4 Year Olds | 237 (42.2%) | 325 (57.8%) |
| 5 to 9 Year Old | 2,448 (76.6%) | 746 (23.4%) |
| 10 to 14 Year Olds | 2,206 (86.1%) | 357 (13.9%) |
| 15 to 17 Year Olds | 1,739 (88.3%) | 231 (11.7%) |
| 18 to 19 Year Olds | 729 (85.1%) | 128 (14.9%) |
| 20 to 24 Year Olds | 850 (63.4%) | 490 (36.6%) |
| 25 to 34 Year Olds | 306 (38.4%) | 490 (61.6%) |
| 35 Years and over | 285 (58.5%) | 202 (41.5%) |
| Total | 8,803 (74.8%) | 2,966 (25.2%) |
Educational Attainment by Field of Study in Downers Grove
Business (4,844 | 21.1%), education (2,394 | 10.4%), science & technology (2,001 | 8.7%), engineering (1,831 | 8.0%), and social sciences (1,816 | 7.9%) are the most common fields of study among 22,966 individuals in Downers Grove who have obtained a bachelor's degree or higher.
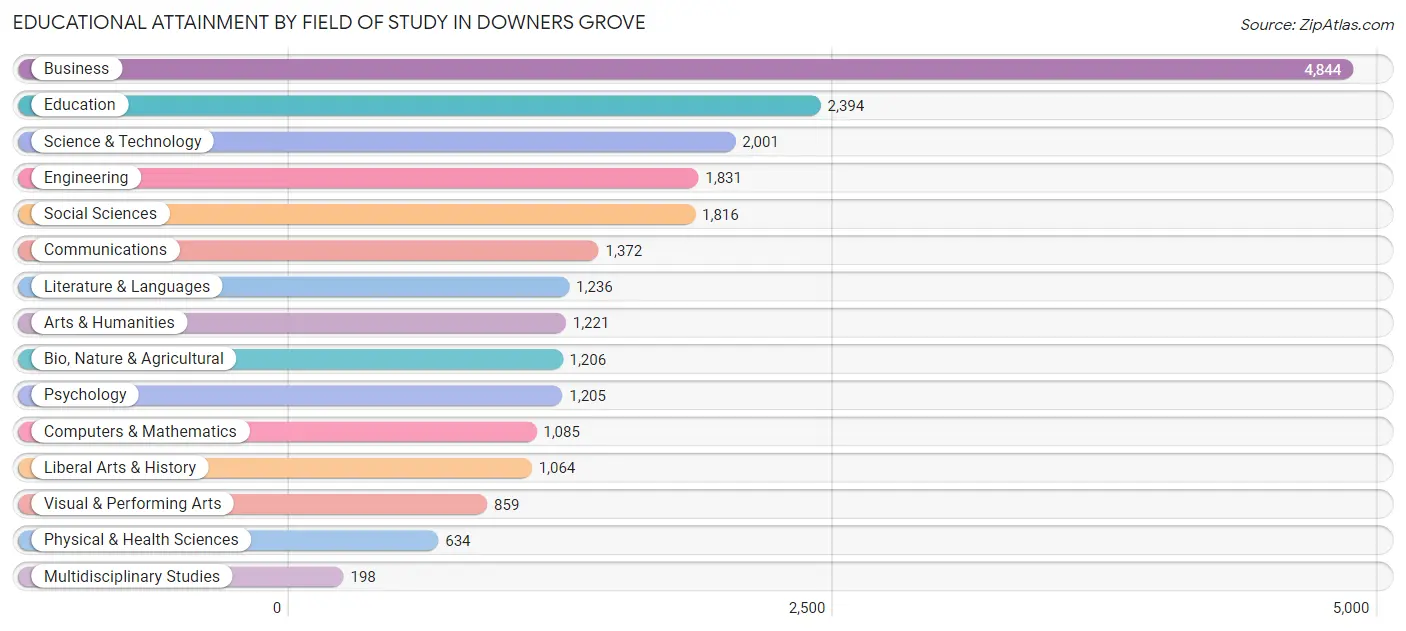
| Field of Study | # Graduates | % Graduates |
| Computers & Mathematics | 1,085 | 4.7% |
| Bio, Nature & Agricultural | 1,206 | 5.2% |
| Physical & Health Sciences | 634 | 2.8% |
| Psychology | 1,205 | 5.2% |
| Social Sciences | 1,816 | 7.9% |
| Engineering | 1,831 | 8.0% |
| Multidisciplinary Studies | 198 | 0.9% |
| Science & Technology | 2,001 | 8.7% |
| Business | 4,844 | 21.1% |
| Education | 2,394 | 10.4% |
| Literature & Languages | 1,236 | 5.4% |
| Liberal Arts & History | 1,064 | 4.6% |
| Visual & Performing Arts | 859 | 3.7% |
| Communications | 1,372 | 6.0% |
| Arts & Humanities | 1,221 | 5.3% |
| Total | 22,966 | 100.0% |
Transportation & Commute in Downers Grove
Vehicle Availability by Sex in Downers Grove
The most prevalent vehicle ownership categories in Downers Grove are males with 2 vehicles (6,471, accounting for 47.9%) and females with 2 vehicles (5,497, making up 55.8%).
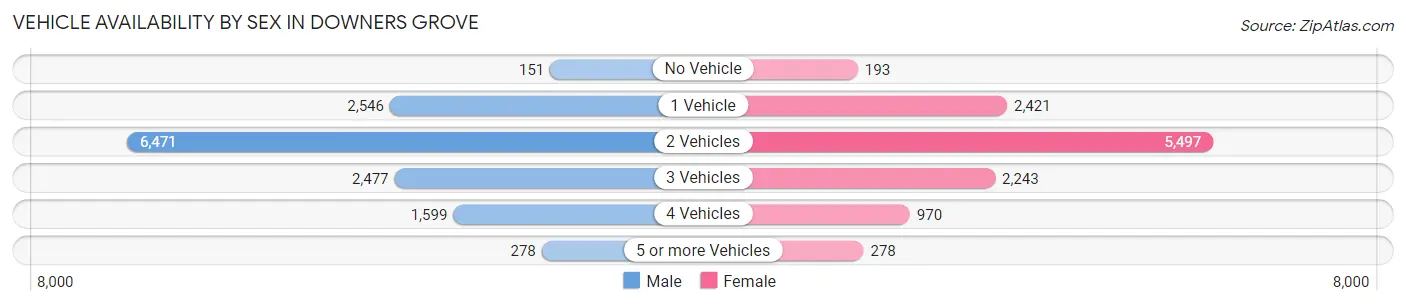
| Vehicles Available | Male | Female |
| No Vehicle | 151 (1.1%) | 193 (1.7%) |
| 1 Vehicle | 2,546 (18.8%) | 2,421 (20.9%) |
| 2 Vehicles | 6,471 (47.9%) | 5,497 (47.4%) |
| 3 Vehicles | 2,477 (18.3%) | 2,243 (19.3%) |
| 4 Vehicles | 1,599 (11.8%) | 970 (8.4%) |
| 5 or more Vehicles | 278 (2.1%) | 278 (2.4%) |
| Total | 13,522 (100.0%) | 11,602 (100.0%) |
Commute Time in Downers Grove
The most frequently occuring commute durations in Downers Grove are 15 to 19 minutes (3,265 commuters, 16.3%), 30 to 34 minutes (3,019 commuters, 15.1%), and 10 to 14 minutes (2,395 commuters, 12.0%).
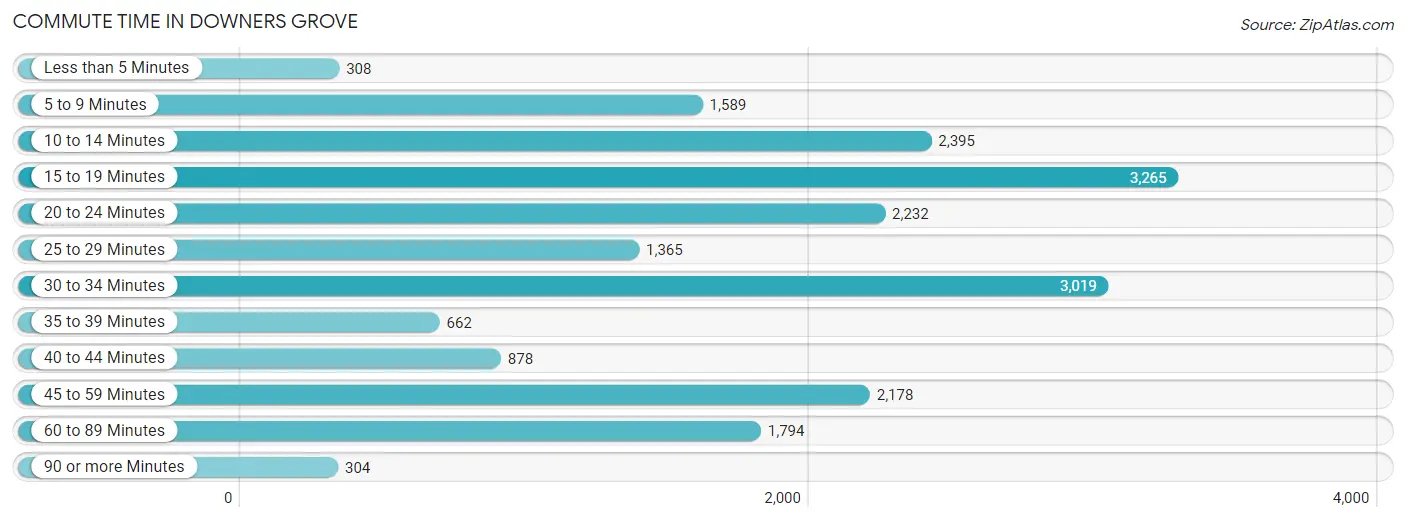
| Commute Time | # Commuters | % Commuters |
| Less than 5 Minutes | 308 | 1.5% |
| 5 to 9 Minutes | 1,589 | 8.0% |
| 10 to 14 Minutes | 2,395 | 12.0% |
| 15 to 19 Minutes | 3,265 | 16.3% |
| 20 to 24 Minutes | 2,232 | 11.2% |
| 25 to 29 Minutes | 1,365 | 6.8% |
| 30 to 34 Minutes | 3,019 | 15.1% |
| 35 to 39 Minutes | 662 | 3.3% |
| 40 to 44 Minutes | 878 | 4.4% |
| 45 to 59 Minutes | 2,178 | 10.9% |
| 60 to 89 Minutes | 1,794 | 9.0% |
| 90 or more Minutes | 304 | 1.5% |
Commute Time by Sex in Downers Grove
The most common commute times in Downers Grove are 30 to 34 minutes (1,686 commuters, 15.7%) for males and 15 to 19 minutes (1,653 commuters, 17.8%) for females.
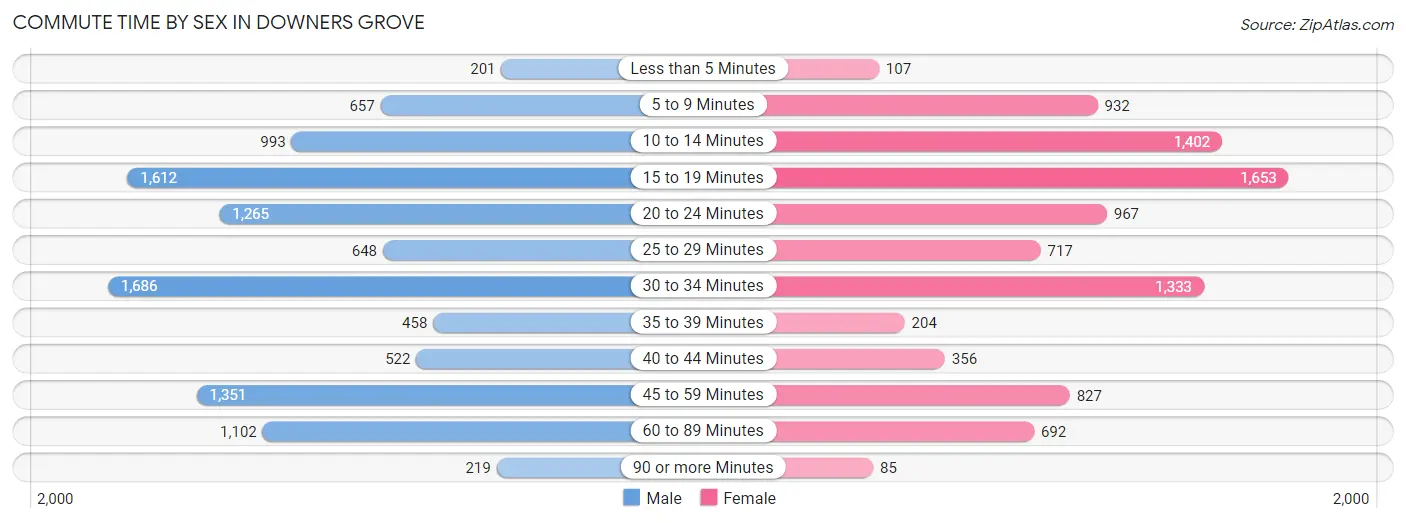
| Commute Time | Male | Female |
| Less than 5 Minutes | 201 (1.9%) | 107 (1.1%) |
| 5 to 9 Minutes | 657 (6.1%) | 932 (10.1%) |
| 10 to 14 Minutes | 993 (9.3%) | 1,402 (15.1%) |
| 15 to 19 Minutes | 1,612 (15.0%) | 1,653 (17.8%) |
| 20 to 24 Minutes | 1,265 (11.8%) | 967 (10.4%) |
| 25 to 29 Minutes | 648 (6.0%) | 717 (7.7%) |
| 30 to 34 Minutes | 1,686 (15.7%) | 1,333 (14.4%) |
| 35 to 39 Minutes | 458 (4.3%) | 204 (2.2%) |
| 40 to 44 Minutes | 522 (4.9%) | 356 (3.8%) |
| 45 to 59 Minutes | 1,351 (12.6%) | 827 (8.9%) |
| 60 to 89 Minutes | 1,102 (10.3%) | 692 (7.5%) |
| 90 or more Minutes | 219 (2.0%) | 85 (0.9%) |
Time of Departure to Work by Sex in Downers Grove
The most frequent times of departure to work in Downers Grove are 7:00 AM to 7:29 AM (1,977, 18.4%) for males and 7:00 AM to 7:29 AM (1,698, 18.3%) for females.
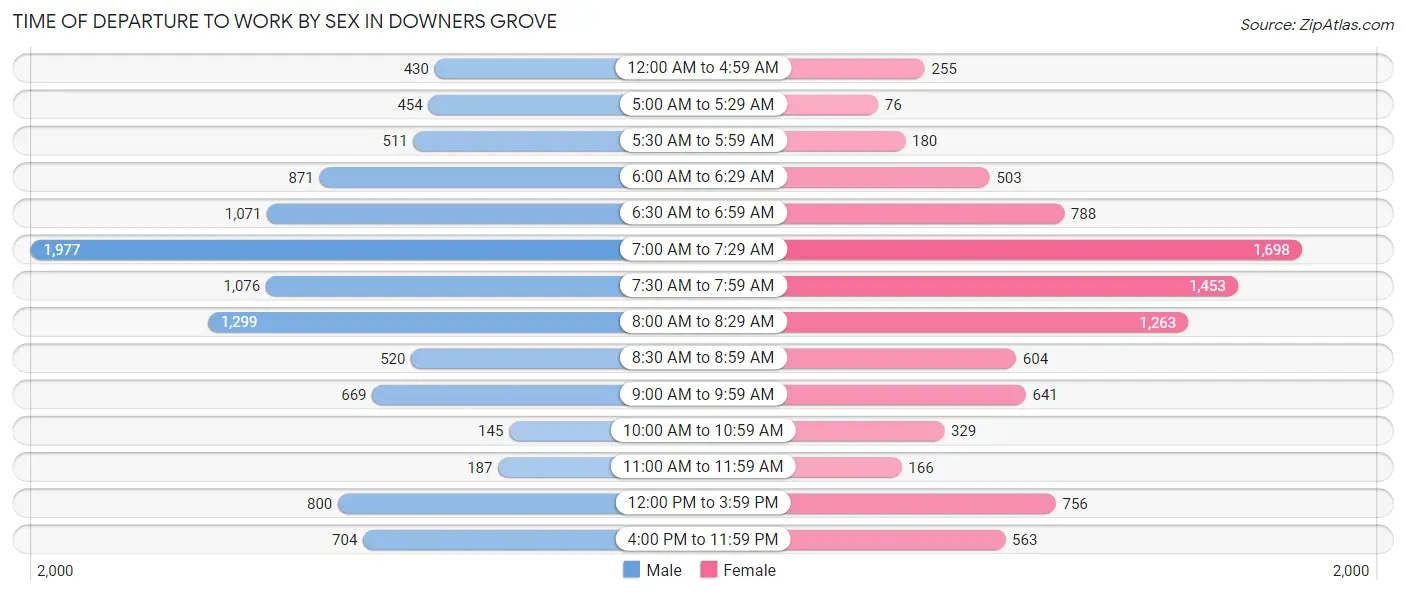
| Time of Departure | Male | Female |
| 12:00 AM to 4:59 AM | 430 (4.0%) | 255 (2.8%) |
| 5:00 AM to 5:29 AM | 454 (4.2%) | 76 (0.8%) |
| 5:30 AM to 5:59 AM | 511 (4.8%) | 180 (1.9%) |
| 6:00 AM to 6:29 AM | 871 (8.1%) | 503 (5.4%) |
| 6:30 AM to 6:59 AM | 1,071 (10.0%) | 788 (8.5%) |
| 7:00 AM to 7:29 AM | 1,977 (18.4%) | 1,698 (18.3%) |
| 7:30 AM to 7:59 AM | 1,076 (10.0%) | 1,453 (15.7%) |
| 8:00 AM to 8:29 AM | 1,299 (12.1%) | 1,263 (13.6%) |
| 8:30 AM to 8:59 AM | 520 (4.9%) | 604 (6.5%) |
| 9:00 AM to 9:59 AM | 669 (6.2%) | 641 (6.9%) |
| 10:00 AM to 10:59 AM | 145 (1.3%) | 329 (3.5%) |
| 11:00 AM to 11:59 AM | 187 (1.8%) | 166 (1.8%) |
| 12:00 PM to 3:59 PM | 800 (7.5%) | 756 (8.2%) |
| 4:00 PM to 11:59 PM | 704 (6.6%) | 563 (6.1%) |
| Total | 10,714 (100.0%) | 9,275 (100.0%) |
Housing Occupancy in Downers Grove
Occupancy by Ownership in Downers Grove
Of the total 20,196 dwellings in Downers Grove, owner-occupied units account for 15,188 (75.2%), while renter-occupied units make up 5,008 (24.8%).
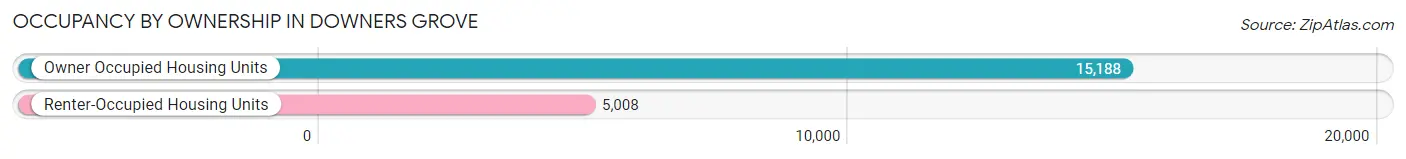
| Occupancy | # Housing Units | % Housing Units |
| Owner Occupied Housing Units | 15,188 | 75.2% |
| Renter-Occupied Housing Units | 5,008 | 24.8% |
| Total Occupied Housing Units | 20,196 | 100.0% |
Occupancy by Household Size in Downers Grove
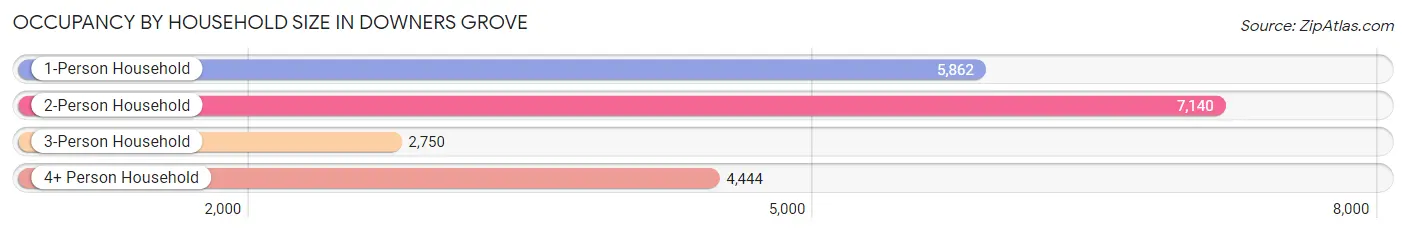
| Household Size | # Housing Units | % Housing Units |
| 1-Person Household | 5,862 | 29.0% |
| 2-Person Household | 7,140 | 35.3% |
| 3-Person Household | 2,750 | 13.6% |
| 4+ Person Household | 4,444 | 22.0% |
| Total Housing Units | 20,196 | 100.0% |
Occupancy by Ownership by Household Size in Downers Grove
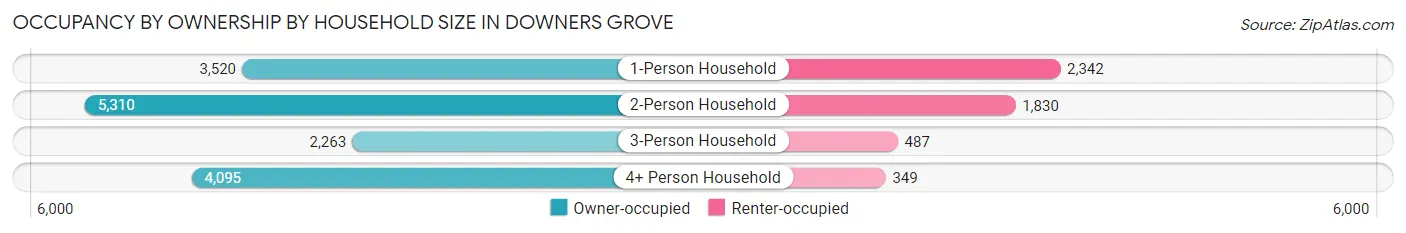
| Household Size | Owner-occupied | Renter-occupied |
| 1-Person Household | 3,520 (60.1%) | 2,342 (40.0%) |
| 2-Person Household | 5,310 (74.4%) | 1,830 (25.6%) |
| 3-Person Household | 2,263 (82.3%) | 487 (17.7%) |
| 4+ Person Household | 4,095 (92.1%) | 349 (7.9%) |
| Total Housing Units | 15,188 (75.2%) | 5,008 (24.8%) |
Occupancy by Educational Attainment in Downers Grove
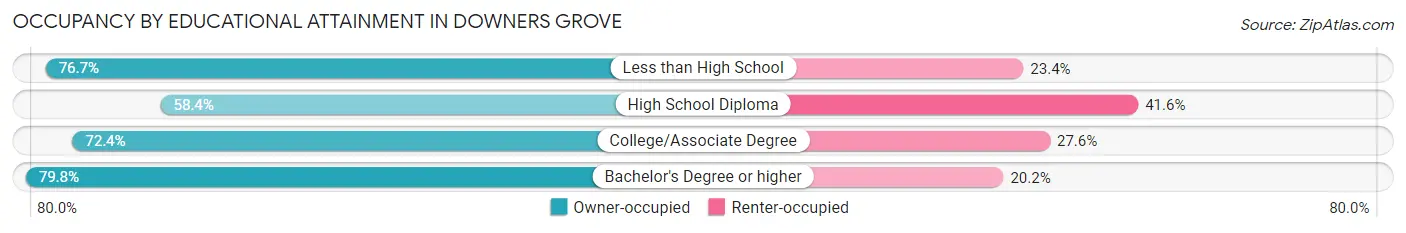
| Household Size | Owner-occupied | Renter-occupied |
| Less than High School | 371 (76.6%) | 113 (23.4%) |
| High School Diploma | 1,536 (58.4%) | 1,093 (41.6%) |
| College/Associate Degree | 3,453 (72.4%) | 1,315 (27.6%) |
| Bachelor's Degree or higher | 9,828 (79.8%) | 2,487 (20.2%) |
Occupancy by Age of Householder in Downers Grove
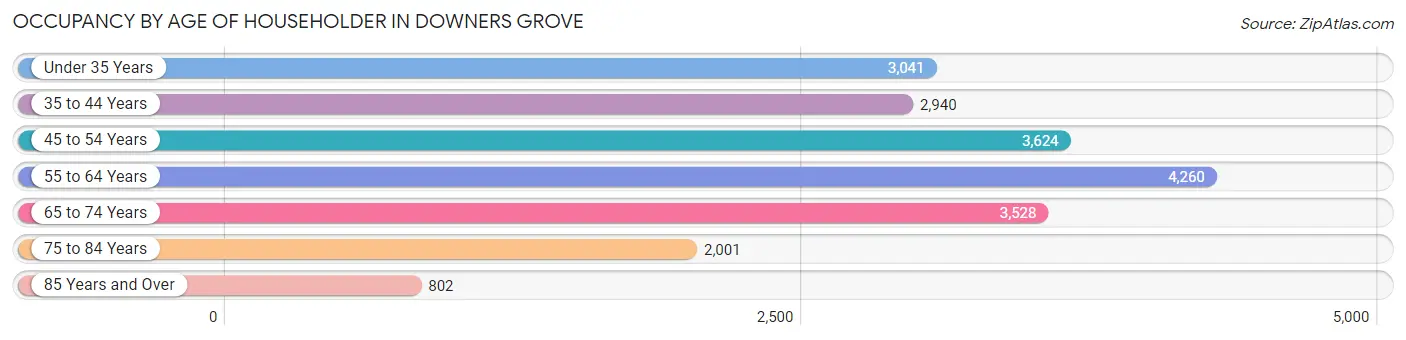
| Age Bracket | # Households | % Households |
| Under 35 Years | 3,041 | 15.1% |
| 35 to 44 Years | 2,940 | 14.6% |
| 45 to 54 Years | 3,624 | 17.9% |
| 55 to 64 Years | 4,260 | 21.1% |
| 65 to 74 Years | 3,528 | 17.5% |
| 75 to 84 Years | 2,001 | 9.9% |
| 85 Years and Over | 802 | 4.0% |
| Total | 20,196 | 100.0% |
Housing Finances in Downers Grove
Median Income by Occupancy in Downers Grove
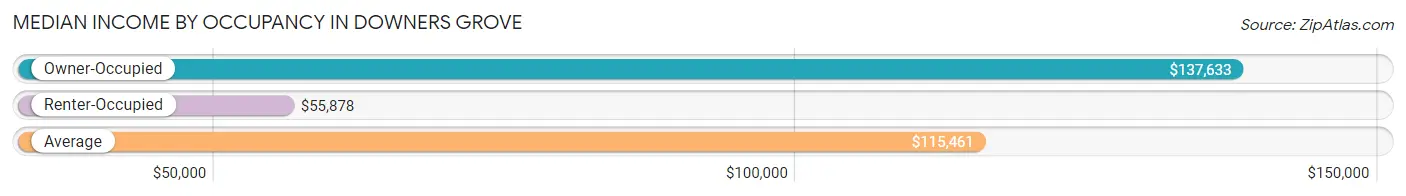
| Occupancy Type | # Households | Median Income |
| Owner-Occupied | 15,188 (75.2%) | $137,633 |
| Renter-Occupied | 5,008 (24.8%) | $55,878 |
| Average | 20,196 (100.0%) | $115,461 |
Occupancy by Householder Income Bracket in Downers Grove
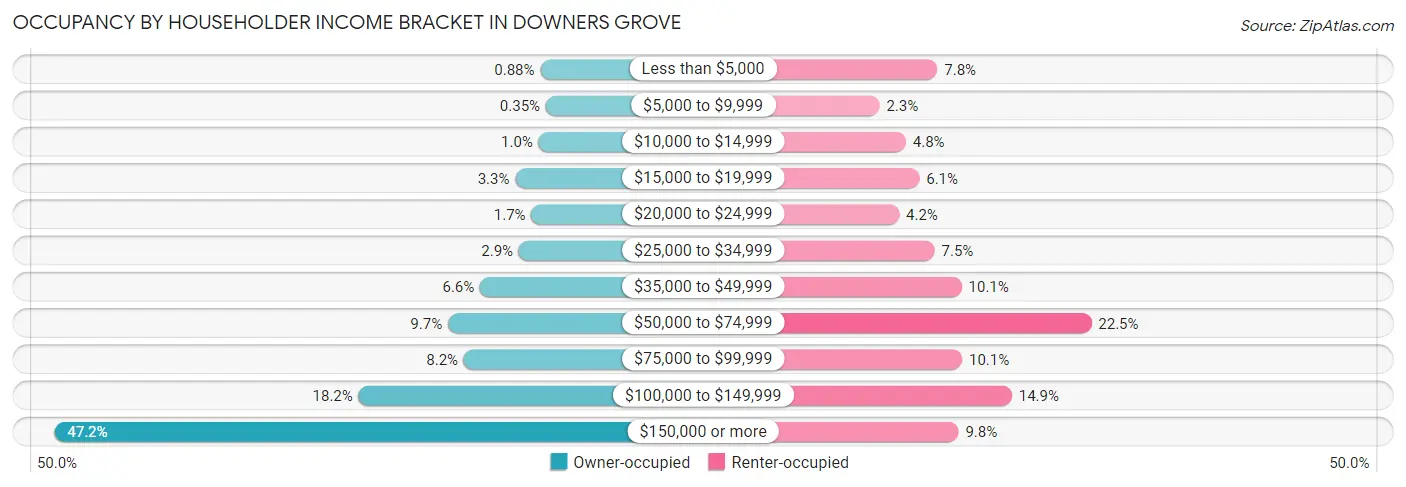
| Income Bracket | Owner-occupied | Renter-occupied |
| Less than $5,000 | 134 (0.9%) | 390 (7.8%) |
| $5,000 to $9,999 | 53 (0.4%) | 114 (2.3%) |
| $10,000 to $14,999 | 158 (1.0%) | 240 (4.8%) |
| $15,000 to $19,999 | 497 (3.3%) | 304 (6.1%) |
| $20,000 to $24,999 | 262 (1.7%) | 208 (4.2%) |
| $25,000 to $34,999 | 443 (2.9%) | 377 (7.5%) |
| $35,000 to $49,999 | 1,006 (6.6%) | 506 (10.1%) |
| $50,000 to $74,999 | 1,470 (9.7%) | 1,125 (22.5%) |
| $75,000 to $99,999 | 1,239 (8.2%) | 508 (10.1%) |
| $100,000 to $149,999 | 2,763 (18.2%) | 745 (14.9%) |
| $150,000 or more | 7,163 (47.2%) | 491 (9.8%) |
| Total | 15,188 (100.0%) | 5,008 (100.0%) |
Monthly Housing Cost Tiers in Downers Grove
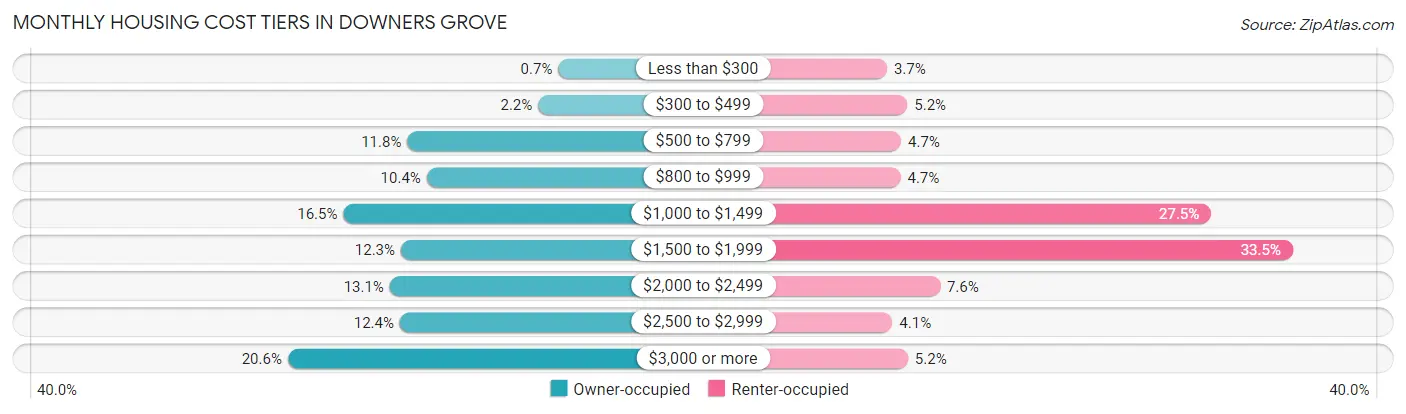
| Monthly Cost | Owner-occupied | Renter-occupied |
| Less than $300 | 106 (0.7%) | 183 (3.6%) |
| $300 to $499 | 331 (2.2%) | 258 (5.1%) |
| $500 to $799 | 1,795 (11.8%) | 235 (4.7%) |
| $800 to $999 | 1,578 (10.4%) | 233 (4.6%) |
| $1,000 to $1,499 | 2,511 (16.5%) | 1,378 (27.5%) |
| $1,500 to $1,999 | 1,866 (12.3%) | 1,679 (33.5%) |
| $2,000 to $2,499 | 1,991 (13.1%) | 378 (7.5%) |
| $2,500 to $2,999 | 1,878 (12.4%) | 203 (4.1%) |
| $3,000 or more | 3,132 (20.6%) | 260 (5.2%) |
| Total | 15,188 (100.0%) | 5,008 (100.0%) |
Physical Housing Characteristics in Downers Grove
Housing Structures in Downers Grove
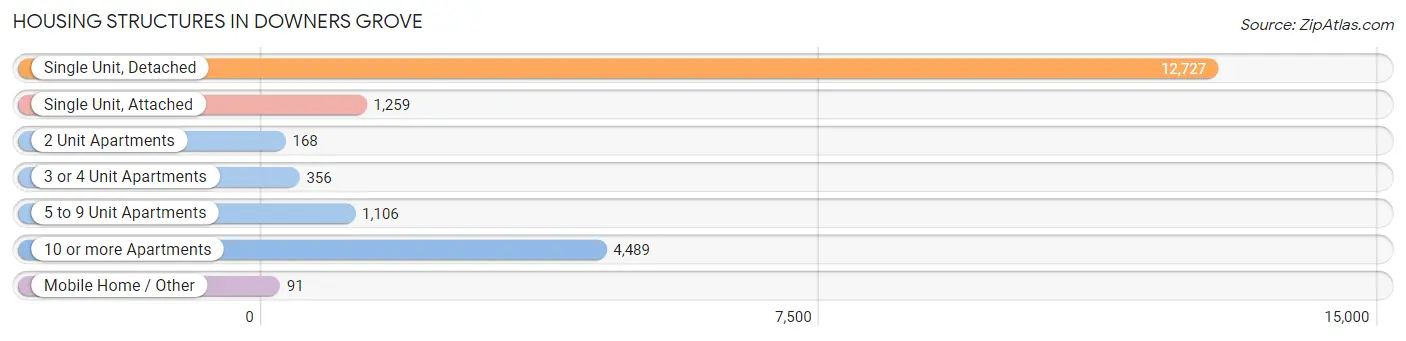
| Structure Type | # Housing Units | % Housing Units |
| Single Unit, Detached | 12,727 | 63.0% |
| Single Unit, Attached | 1,259 | 6.2% |
| 2 Unit Apartments | 168 | 0.8% |
| 3 or 4 Unit Apartments | 356 | 1.8% |
| 5 to 9 Unit Apartments | 1,106 | 5.5% |
| 10 or more Apartments | 4,489 | 22.2% |
| Mobile Home / Other | 91 | 0.4% |
| Total | 20,196 | 100.0% |
Housing Structures by Occupancy in Downers Grove
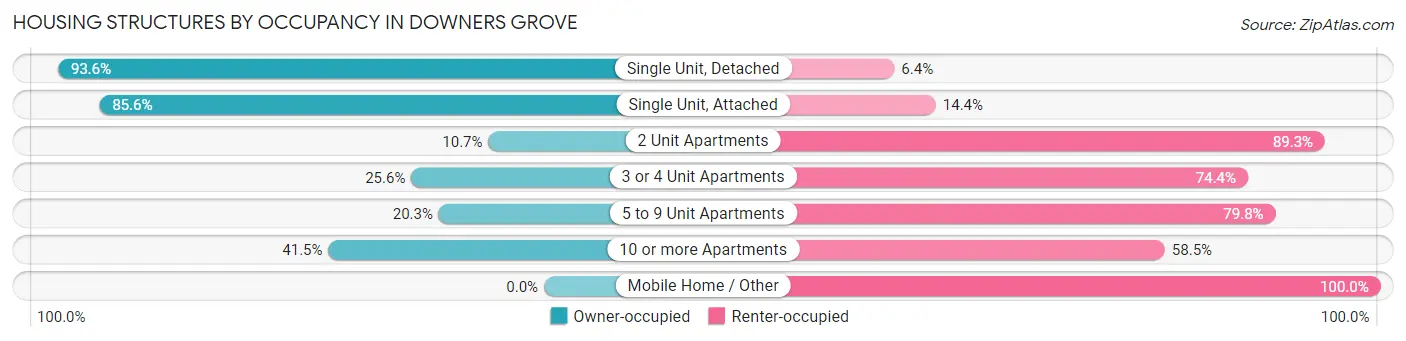
| Structure Type | Owner-occupied | Renter-occupied |
| Single Unit, Detached | 11,913 (93.6%) | 814 (6.4%) |
| Single Unit, Attached | 1,078 (85.6%) | 181 (14.4%) |
| 2 Unit Apartments | 18 (10.7%) | 150 (89.3%) |
| 3 or 4 Unit Apartments | 91 (25.6%) | 265 (74.4%) |
| 5 to 9 Unit Apartments | 224 (20.3%) | 882 (79.7%) |
| 10 or more Apartments | 1,864 (41.5%) | 2,625 (58.5%) |
| Mobile Home / Other | 0 (0.0%) | 91 (100.0%) |
| Total | 15,188 (75.2%) | 5,008 (24.8%) |
Housing Structures by Number of Rooms in Downers Grove
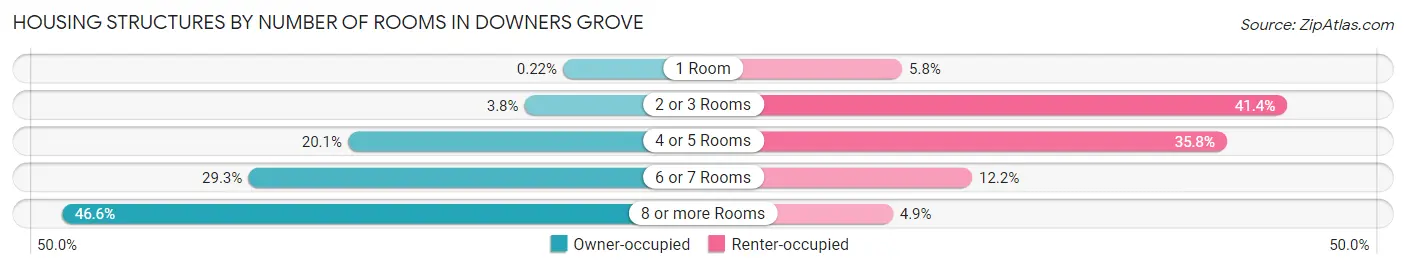
| Number of Rooms | Owner-occupied | Renter-occupied |
| 1 Room | 34 (0.2%) | 288 (5.8%) |
| 2 or 3 Rooms | 574 (3.8%) | 2,071 (41.3%) |
| 4 or 5 Rooms | 3,054 (20.1%) | 1,792 (35.8%) |
| 6 or 7 Rooms | 4,454 (29.3%) | 612 (12.2%) |
| 8 or more Rooms | 7,072 (46.6%) | 245 (4.9%) |
| Total | 15,188 (100.0%) | 5,008 (100.0%) |
Housing Structure by Heating Type in Downers Grove
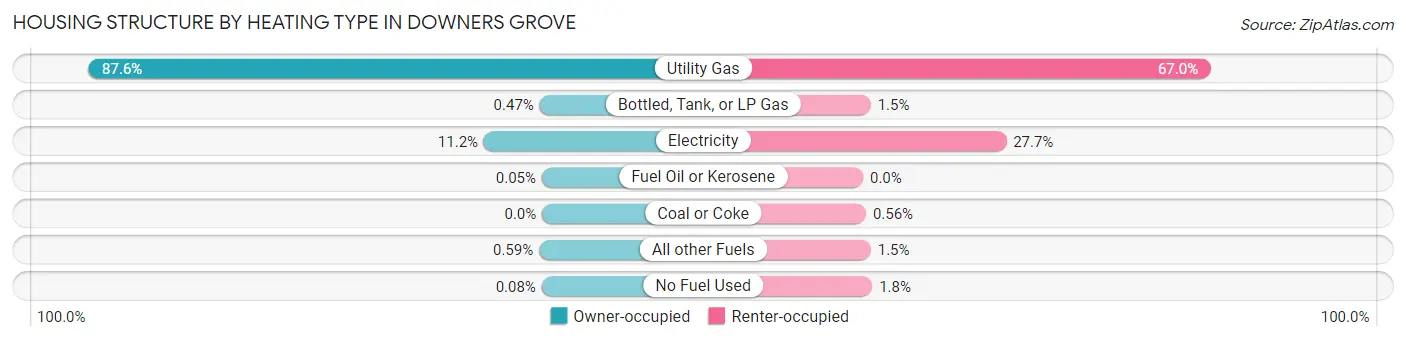
| Heating Type | Owner-occupied | Renter-occupied |
| Utility Gas | 13,300 (87.6%) | 3,357 (67.0%) |
| Bottled, Tank, or LP Gas | 72 (0.5%) | 74 (1.5%) |
| Electricity | 1,707 (11.2%) | 1,385 (27.7%) |
| Fuel Oil or Kerosene | 7 (0.1%) | 0 (0.0%) |
| Coal or Coke | 0 (0.0%) | 28 (0.6%) |
| All other Fuels | 90 (0.6%) | 75 (1.5%) |
| No Fuel Used | 12 (0.1%) | 89 (1.8%) |
| Total | 15,188 (100.0%) | 5,008 (100.0%) |
Household Vehicle Usage in Downers Grove
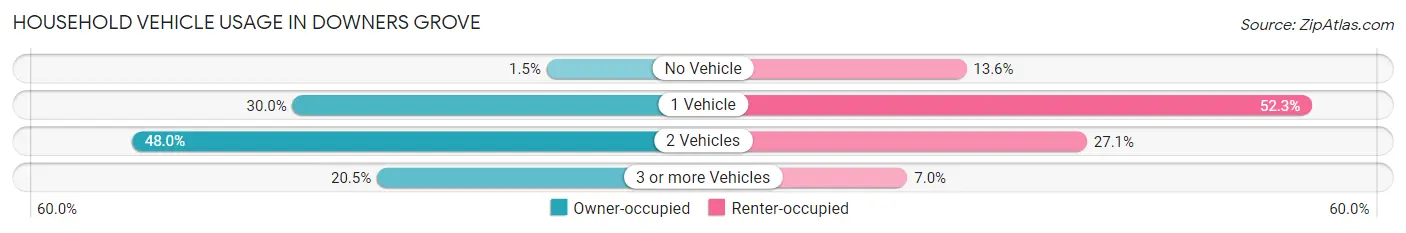
| Vehicles per Household | Owner-occupied | Renter-occupied |
| No Vehicle | 230 (1.5%) | 681 (13.6%) |
| 1 Vehicle | 4,553 (30.0%) | 2,620 (52.3%) |
| 2 Vehicles | 7,288 (48.0%) | 1,357 (27.1%) |
| 3 or more Vehicles | 3,117 (20.5%) | 350 (7.0%) |
| Total | 15,188 (100.0%) | 5,008 (100.0%) |
Real Estate & Mortgages in Downers Grove
Real Estate and Mortgage Overview in Downers Grove
| Characteristic | Without Mortgage | With Mortgage |
| Housing Units | 5,709 | 9,479 |
| Median Property Value | $376,100 | $452,000 |
| Median Household Income | $90,988 | $5,414 |
| Monthly Housing Costs | $886 | $3,116 |
| Real Estate Taxes | $6,556 | $22 |
Property Value by Mortgage Status in Downers Grove
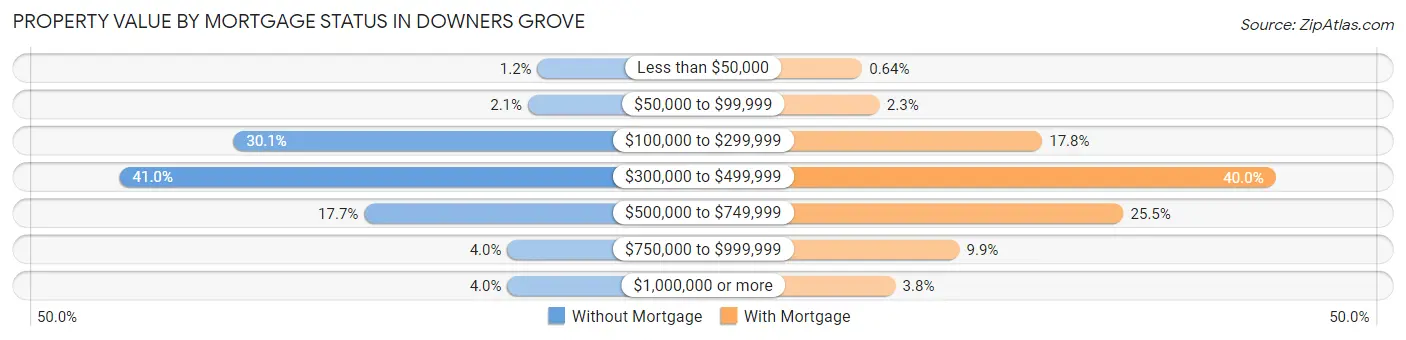
| Property Value | Without Mortgage | With Mortgage |
| Less than $50,000 | 66 (1.2%) | 61 (0.6%) |
| $50,000 to $99,999 | 118 (2.1%) | 220 (2.3%) |
| $100,000 to $299,999 | 1,719 (30.1%) | 1,686 (17.8%) |
| $300,000 to $499,999 | 2,338 (40.9%) | 3,791 (40.0%) |
| $500,000 to $749,999 | 1,008 (17.7%) | 2,420 (25.5%) |
| $750,000 to $999,999 | 230 (4.0%) | 939 (9.9%) |
| $1,000,000 or more | 230 (4.0%) | 362 (3.8%) |
| Total | 5,709 (100.0%) | 9,479 (100.0%) |
Household Income by Mortgage Status in Downers Grove
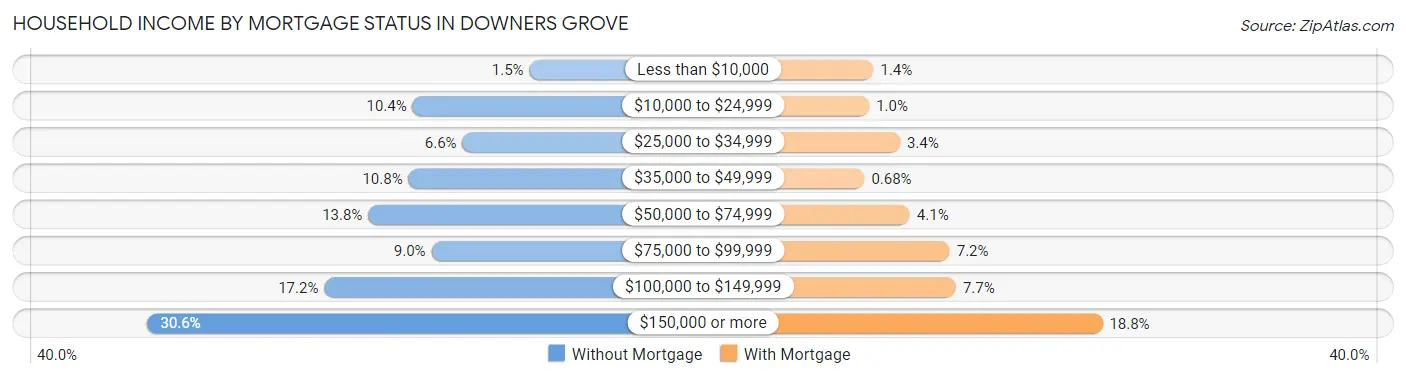
| Household Income | Without Mortgage | With Mortgage |
| Less than $10,000 | 88 (1.5%) | 130 (1.4%) |
| $10,000 to $24,999 | 596 (10.4%) | 99 (1.0%) |
| $25,000 to $34,999 | 379 (6.6%) | 321 (3.4%) |
| $35,000 to $49,999 | 614 (10.7%) | 64 (0.7%) |
| $50,000 to $74,999 | 789 (13.8%) | 392 (4.1%) |
| $75,000 to $99,999 | 514 (9.0%) | 681 (7.2%) |
| $100,000 to $149,999 | 980 (17.2%) | 725 (7.6%) |
| $150,000 or more | 1,749 (30.6%) | 1,783 (18.8%) |
| Total | 5,709 (100.0%) | 9,479 (100.0%) |
Property Value to Household Income Ratio in Downers Grove
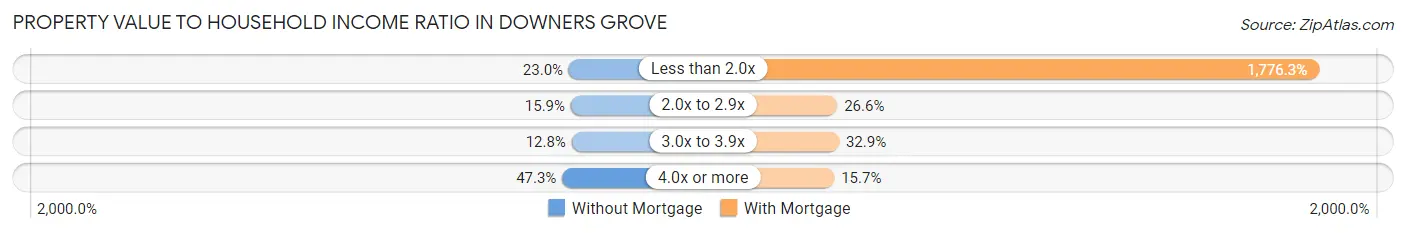
| Value-to-Income Ratio | Without Mortgage | With Mortgage |
| Less than 2.0x | 1,311 (23.0%) | 168,374 (1,776.3%) |
| 2.0x to 2.9x | 910 (15.9%) | 2,524 (26.6%) |
| 3.0x to 3.9x | 729 (12.8%) | 3,117 (32.9%) |
| 4.0x or more | 2,698 (47.3%) | 1,491 (15.7%) |
| Total | 5,709 (100.0%) | 9,479 (100.0%) |
Real Estate Taxes by Mortgage Status in Downers Grove
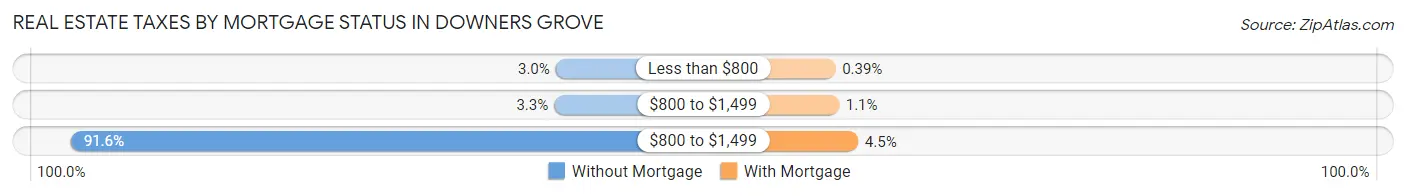
| Property Taxes | Without Mortgage | With Mortgage |
| Less than $800 | 172 (3.0%) | 37 (0.4%) |
| $800 to $1,499 | 188 (3.3%) | 100 (1.1%) |
| $800 to $1,499 | 5,227 (91.6%) | 430 (4.5%) |
| Total | 5,709 (100.0%) | 9,479 (100.0%) |
Health & Disability in Downers Grove
Health Insurance Coverage by Age in Downers Grove
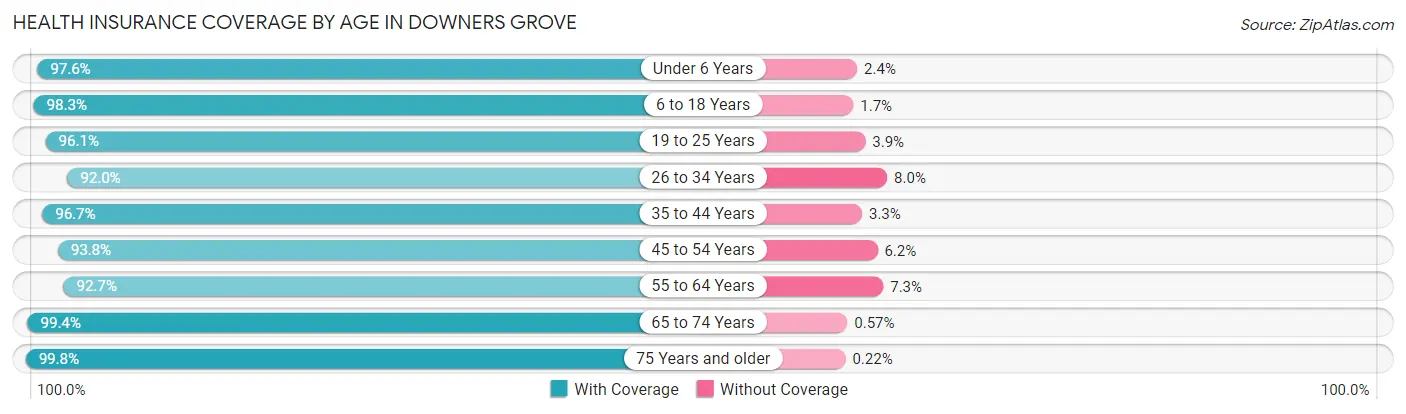
| Age Bracket | With Coverage | Without Coverage |
| Under 6 Years | 3,416 (97.6%) | 84 (2.4%) |
| 6 to 18 Years | 7,722 (98.3%) | 133 (1.7%) |
| 19 to 25 Years | 3,250 (96.1%) | 133 (3.9%) |
| 26 to 34 Years | 5,300 (92.0%) | 460 (8.0%) |
| 35 to 44 Years | 5,492 (96.7%) | 188 (3.3%) |
| 45 to 54 Years | 6,149 (93.8%) | 406 (6.2%) |
| 55 to 64 Years | 6,796 (92.7%) | 533 (7.3%) |
| 65 to 74 Years | 6,067 (99.4%) | 35 (0.6%) |
| 75 Years and older | 3,639 (99.8%) | 8 (0.2%) |
| Total | 47,831 (96.0%) | 1,980 (4.0%) |
Health Insurance Coverage by Citizenship Status in Downers Grove
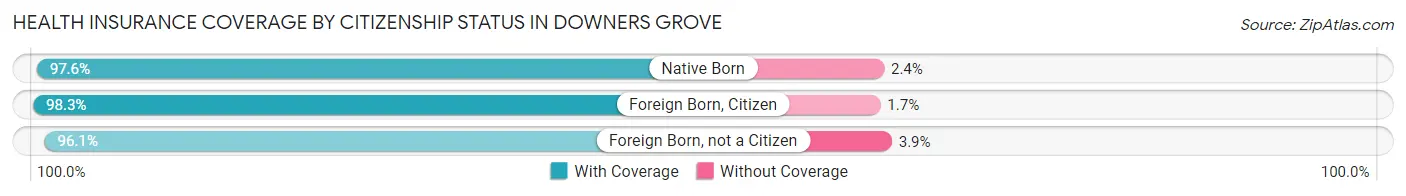
| Citizenship Status | With Coverage | Without Coverage |
| Native Born | 3,416 (97.6%) | 84 (2.4%) |
| Foreign Born, Citizen | 7,722 (98.3%) | 133 (1.7%) |
| Foreign Born, not a Citizen | 3,250 (96.1%) | 133 (3.9%) |
Health Insurance Coverage by Household Income in Downers Grove
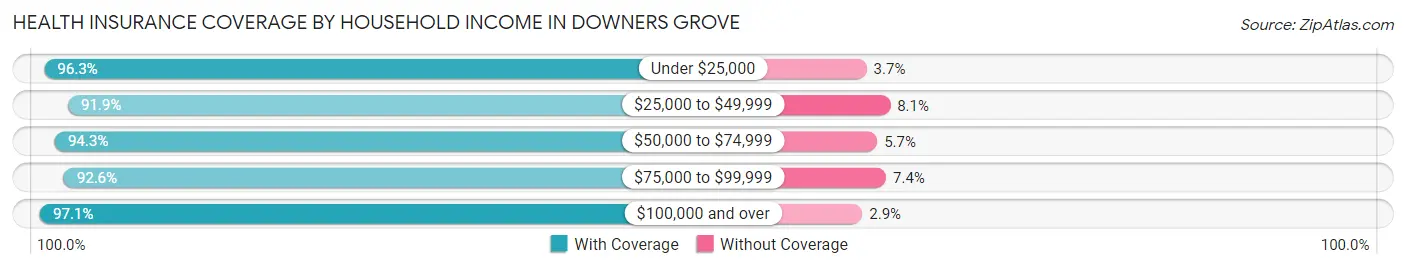
| Household Income | With Coverage | Without Coverage |
| Under $25,000 | 3,210 (96.3%) | 124 (3.7%) |
| $25,000 to $49,999 | 3,283 (91.9%) | 291 (8.1%) |
| $50,000 to $74,999 | 4,435 (94.3%) | 268 (5.7%) |
| $75,000 to $99,999 | 3,210 (92.6%) | 255 (7.4%) |
| $100,000 and over | 33,379 (97.1%) | 1,002 (2.9%) |
Public vs Private Health Insurance Coverage by Age in Downers Grove
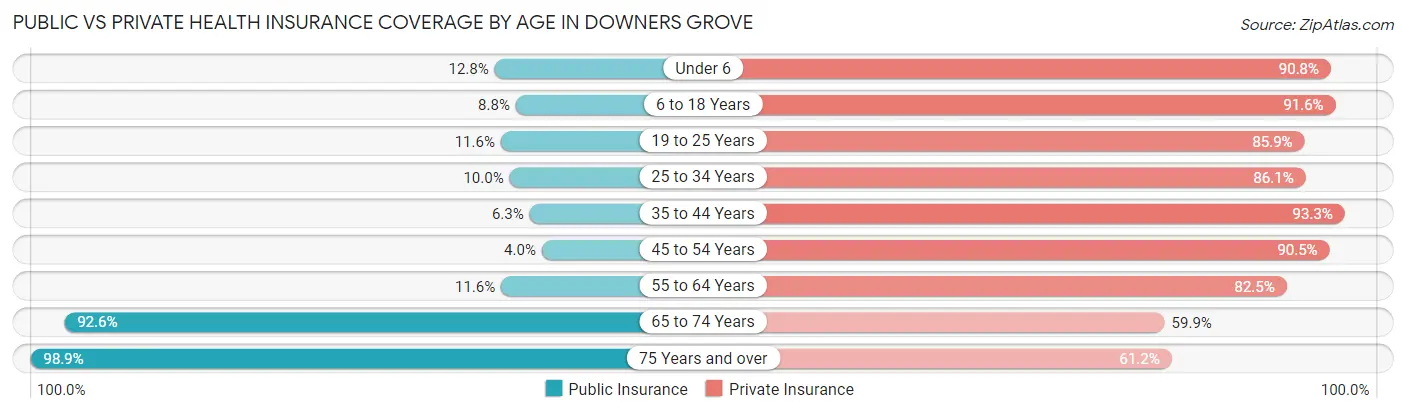
| Age Bracket | Public Insurance | Private Insurance |
| Under 6 | 447 (12.8%) | 3,177 (90.8%) |
| 6 to 18 Years | 694 (8.8%) | 7,197 (91.6%) |
| 19 to 25 Years | 393 (11.6%) | 2,905 (85.9%) |
| 25 to 34 Years | 576 (10.0%) | 4,957 (86.1%) |
| 35 to 44 Years | 356 (6.3%) | 5,301 (93.3%) |
| 45 to 54 Years | 263 (4.0%) | 5,933 (90.5%) |
| 55 to 64 Years | 848 (11.6%) | 6,049 (82.5%) |
| 65 to 74 Years | 5,653 (92.6%) | 3,657 (59.9%) |
| 75 Years and over | 3,608 (98.9%) | 2,232 (61.2%) |
| Total | 12,838 (25.8%) | 41,408 (83.1%) |
Disability Status by Sex by Age in Downers Grove
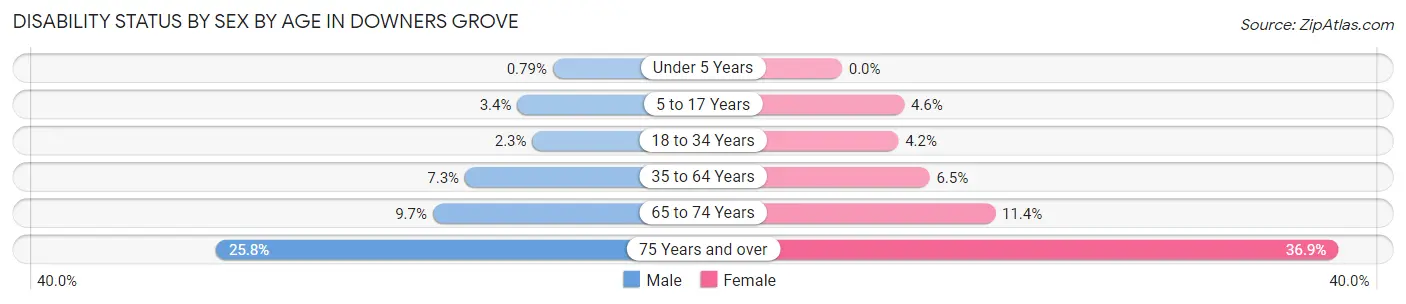
| Age Bracket | Male | Female |
| Under 5 Years | 12 (0.8%) | 0 (0.0%) |
| 5 to 17 Years | 138 (3.4%) | 178 (4.6%) |
| 18 to 34 Years | 111 (2.3%) | 205 (4.2%) |
| 35 to 64 Years | 721 (7.3%) | 632 (6.5%) |
| 65 to 74 Years | 267 (9.7%) | 381 (11.4%) |
| 75 Years and over | 366 (25.8%) | 821 (36.8%) |
Disability Class by Sex by Age in Downers Grove
Disability Class: Hearing Difficulty
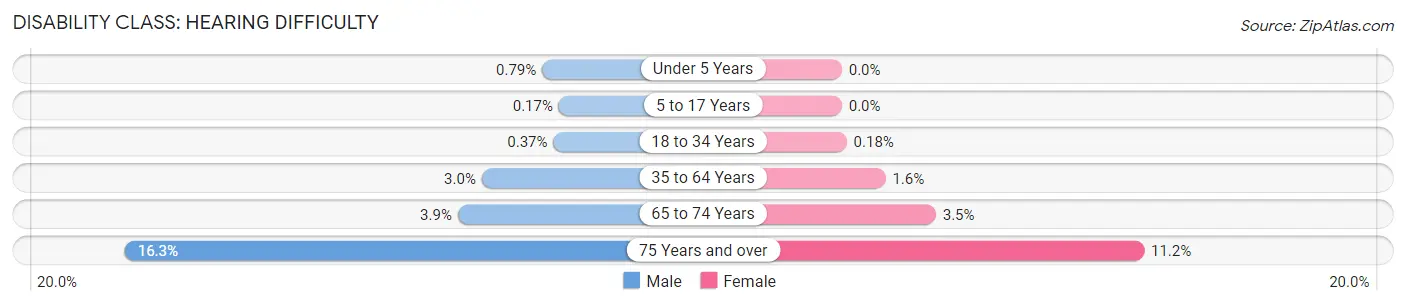
| Age Bracket | Male | Female |
| Under 5 Years | 12 (0.8%) | 0 (0.0%) |
| 5 to 17 Years | 7 (0.2%) | 0 (0.0%) |
| 18 to 34 Years | 18 (0.4%) | 9 (0.2%) |
| 35 to 64 Years | 299 (3.0%) | 157 (1.6%) |
| 65 to 74 Years | 108 (3.9%) | 117 (3.5%) |
| 75 Years and over | 231 (16.3%) | 250 (11.2%) |
Disability Class: Vision Difficulty
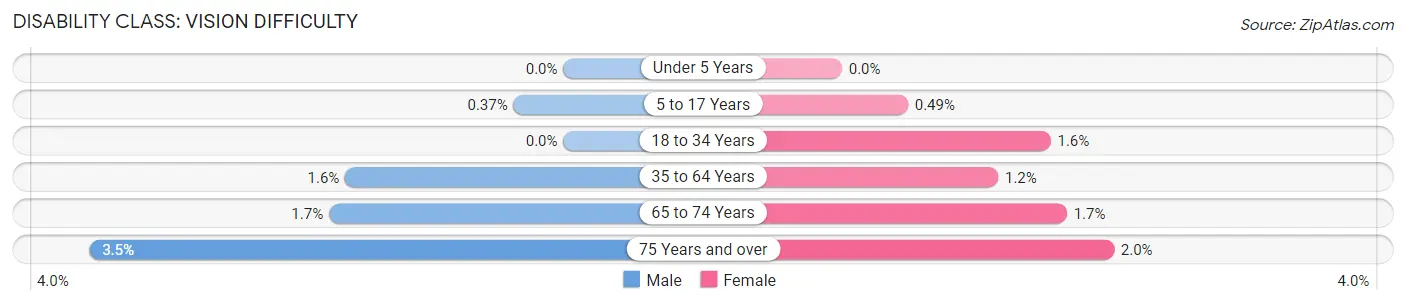
| Age Bracket | Male | Female |
| Under 5 Years | 0 (0.0%) | 0 (0.0%) |
| 5 to 17 Years | 15 (0.4%) | 19 (0.5%) |
| 18 to 34 Years | 0 (0.0%) | 76 (1.5%) |
| 35 to 64 Years | 160 (1.6%) | 113 (1.2%) |
| 65 to 74 Years | 48 (1.7%) | 56 (1.7%) |
| 75 Years and over | 50 (3.5%) | 45 (2.0%) |
Disability Class: Cognitive Difficulty
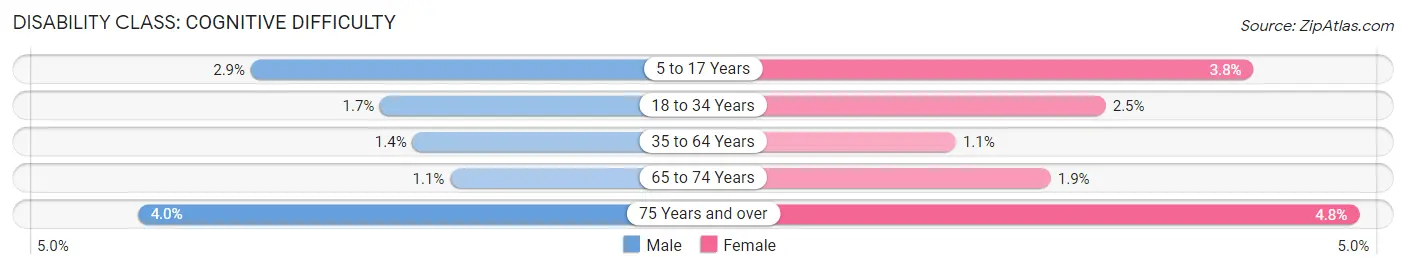
| Age Bracket | Male | Female |
| 5 to 17 Years | 117 (2.9%) | 147 (3.8%) |
| 18 to 34 Years | 82 (1.7%) | 120 (2.5%) |
| 35 to 64 Years | 138 (1.4%) | 103 (1.1%) |
| 65 to 74 Years | 29 (1.1%) | 65 (1.9%) |
| 75 Years and over | 56 (4.0%) | 107 (4.8%) |
Disability Class: Ambulatory Difficulty
| Age Bracket | Male | Female |
| 5 to 17 Years | 13 (0.3%) | 0 (0.0%) |
| 18 to 34 Years | 0 (0.0%) | 17 (0.4%) |
| 35 to 64 Years | 378 (3.8%) | 374 (3.8%) |
| 65 to 74 Years | 132 (4.8%) | 248 (7.4%) |
| 75 Years and over | 112 (7.9%) | 594 (26.7%) |
Disability Class: Self-Care Difficulty
| Age Bracket | Male | Female |
| 5 to 17 Years | 52 (1.3%) | 17 (0.4%) |
| 18 to 34 Years | 16 (0.3%) | 0 (0.0%) |
| 35 to 64 Years | 34 (0.3%) | 176 (1.8%) |
| 65 to 74 Years | 16 (0.6%) | 77 (2.3%) |
| 75 Years and over | 57 (4.0%) | 125 (5.6%) |
Technology Access in Downers Grove
Computing Device Access in Downers Grove
| Device Type | # Households | % Households |
| Desktop or Laptop | 18,082 | 89.5% |
| Smartphone | 18,274 | 90.5% |
| Tablet | 14,671 | 72.6% |
| No Computing Device | 810 | 4.0% |
| Total | 20,196 | 100.0% |
Internet Access in Downers Grove
| Internet Type | # Households | % Households |
| Dial-Up Internet | 48 | 0.2% |
| Broadband Home | 17,243 | 85.4% |
| Cellular Data Only | 1,199 | 5.9% |
| Satellite Internet | 742 | 3.7% |
| No Internet | 1,480 | 7.3% |
| Total | 20,196 | 100.0% |
Downers Grove Summary
Downers Grove is a village located in DuPage County, Illinois, United States. It is a suburb of Chicago, located approximately 22 miles (35 km) west of the Loop. As of the 2010 census, the village had a population of 48,735.
History
Downers Grove was first settled in 1832 by Pierce Downer, a religious leader from New York. The area was originally known as “Downer’s Grove” after Pierce Downer, but the name was eventually shortened to Downers Grove. The village was incorporated in 1873.
In the late 19th century, Downers Grove was a popular summer resort for Chicagoans. The village was home to several large hotels, including the Hotel Florence, which was built in 1876 and was the largest hotel in the area.
Geography
Downers Grove is located at 41°47′N 88°3′W (41.78, -88.05). According to the 2010 census, Downers Grove has a total area of 8.8 square miles (22.8 km2), of which 8.7 square miles (22.6 km2) is land and 0.1 square miles (0.2 km2) (1.17%) is water.
Economy
Downers Grove is home to a variety of businesses, including several Fortune 500 companies. The village is home to the headquarters of Dover Corporation, DeVry University, and Advocate Health Care. Other major employers in the village include the University of Illinois at Chicago, the University of Chicago, and the Argonne National Laboratory.
Demographics
As of the 2010 census, there were 48,735 people, 19,945 households, and 11,945 families residing in the village. The population density was 5,567.3 people per square mile (2,154.7/km2). There were 20,845 housing units at an average density of 2,382.3 per square mile (919.7/km2). The racial makeup of the village was 81.2% White, 5.2% African American, 0.2% Native American, 8.3% Asian, 0.1% Pacific Islander, 3.2% from other races, and 2.0% from two or more races. Hispanic or Latino of any race were 8.9% of the population.
The median income for a household in the village was $76,824, and the median income for a family was $95,919. Males had a median income of $63,917 versus $45,945 for females. The per capita income for the village was $37,945. About 2.3% of families and 3.7% of the population were below the poverty line, including 4.2% of those under age 18 and 3.3% of those age 65 or over.
Common Questions
What is Per Capita Income in Downers Grove?
Per Capita income in Downers Grove is $63,831.
What is the Median Family Income in Downers Grove?
Median Family Income in Downers Grove is $154,211.
What is the Median Household income in Downers Grove?
Median Household Income in Downers Grove is $115,461.
What is Income or Wage Gap in Downers Grove?
Income or Wage Gap in Downers Grove is 41.5%.
Women in Downers Grove earn 58.5 cents for every dollar earned by a man.
What is Inequality or Gini Index in Downers Grove?
Inequality or Gini Index in Downers Grove is 0.49.
What is the Total Population of Downers Grove?
Total Population of Downers Grove is 49,996.
What is the Total Male Population of Downers Grove?
Total Male Population of Downers Grove is 24,466.
What is the Total Female Population of Downers Grove?
Total Female Population of Downers Grove is 25,530.
What is the Ratio of Males per 100 Females in Downers Grove?
There are 95.83 Males per 100 Females in Downers Grove.
What is the Ratio of Females per 100 Males in Downers Grove?
There are 104.35 Females per 100 Males in Downers Grove.
What is the Median Population Age in Downers Grove?
Median Population Age in Downers Grove is 42.6 Years.
What is the Average Family Size in Downers Grove
Average Family Size in Downers Grove is 3.1 People.
What is the Average Household Size in Downers Grove
Average Household Size in Downers Grove is 2.5 People.
How Large is the Labor Force in Downers Grove?
There are 27,054 People in the Labor Forcein in Downers Grove.
What is the Percentage of People in the Labor Force in Downers Grove?
67.0% of People are in the Labor Force in Downers Grove.
What is the Unemployment Rate in Downers Grove?
Unemployment Rate in Downers Grove is 4.1%.