Glenview, IL Map & Demographics
Glenview Map
Glenview Overview
$75,876
PER CAPITA INCOME
$171,932
AVG FAMILY INCOME
$134,910
AVG HOUSEHOLD INCOME
40.7%
WAGE / INCOME GAP [ % ]
59.3¢/ $1
WAGE / INCOME GAP [ $ ]
0.49
INEQUALITY / GINI INDEX
47,896
TOTAL POPULATION
22,637
MALE POPULATION
25,259
FEMALE POPULATION
89.62
MALES / 100 FEMALES
111.58
FEMALES / 100 MALES
46.5
MEDIAN AGE
3.0
AVG FAMILY SIZE
2.5
AVG HOUSEHOLD SIZE
23,832
LABOR FORCE [ PEOPLE ]
62.5%
PERCENT IN LABOR FORCE
3.7%
UNEMPLOYMENT RATE
Income in Glenview
Income Overview in Glenview
Per Capita Income in Glenview is $75,876, while median incomes of families and households are $171,932 and $134,910 respectively.
| Characteristic | Number | Measure |
| Per Capita Income | 47,896 | $75,876 |
| Median Family Income | 13,432 | $171,932 |
| Mean Family Income | 13,432 | $231,007 |
| Median Household Income | 18,451 | $134,910 |
| Mean Household Income | 18,451 | $193,326 |
| Income Deficit | 13,432 | $0 |
| Wage / Income Gap (%) | 47,896 | 40.74% |
| Wage / Income Gap ($) | 47,896 | 59.26¢ per $1 |
| Gini / Inequality Index | 47,896 | 0.49 |
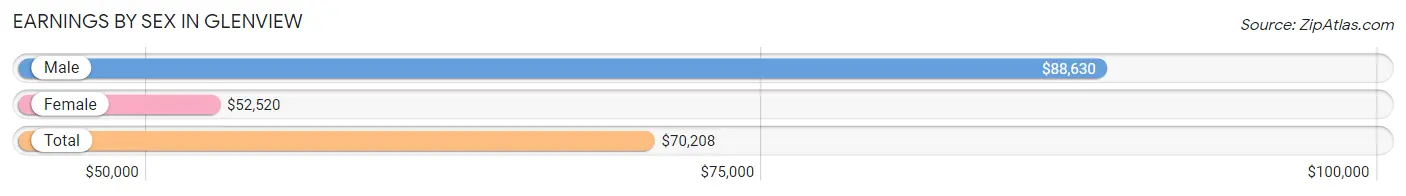
Earnings by Sex in Glenview
Average Earnings in Glenview are $70,208, $88,630 for men and $52,520 for women, a difference of 40.7%.
| Sex | Number | Average Earnings |
| Male | 13,319 (53.0%) | $88,630 |
| Female | 11,820 (47.0%) | $52,520 |
| Total | 25,139 (100.0%) | $70,208 |
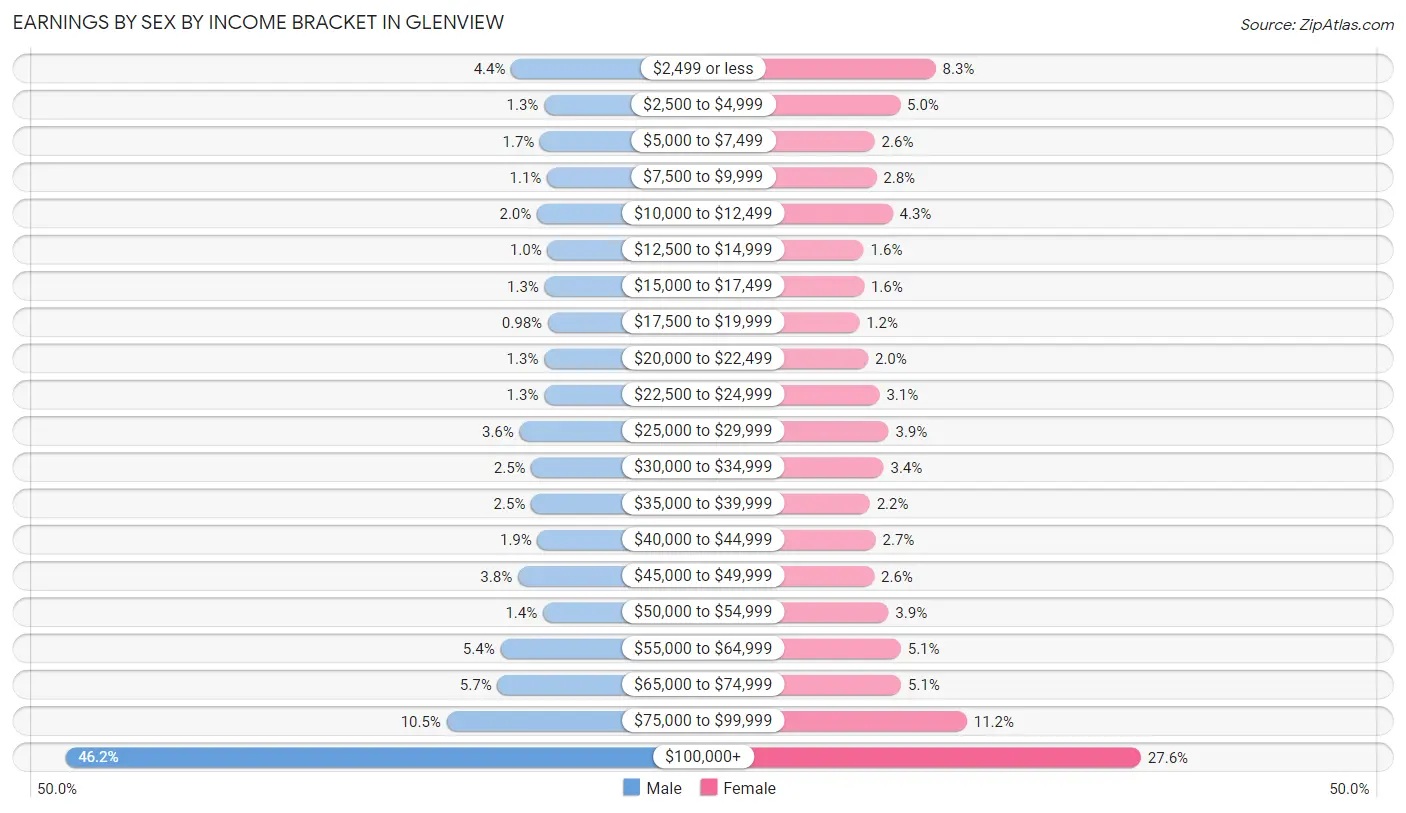
Earnings by Sex by Income Bracket in Glenview
The most common earnings brackets in Glenview are $100,000+ for men (6,152 | 46.2%) and $100,000+ for women (3,257 | 27.6%).
| Income | Male | Female |
| $2,499 or less | 588 (4.4%) | 984 (8.3%) |
| $2,500 to $4,999 | 177 (1.3%) | 590 (5.0%) |
| $5,000 to $7,499 | 227 (1.7%) | 309 (2.6%) |
| $7,500 to $9,999 | 140 (1.1%) | 328 (2.8%) |
| $10,000 to $12,499 | 265 (2.0%) | 507 (4.3%) |
| $12,500 to $14,999 | 134 (1.0%) | 187 (1.6%) |
| $15,000 to $17,499 | 170 (1.3%) | 190 (1.6%) |
| $17,500 to $19,999 | 131 (1.0%) | 137 (1.2%) |
| $20,000 to $22,499 | 176 (1.3%) | 235 (2.0%) |
| $22,500 to $24,999 | 176 (1.3%) | 362 (3.1%) |
| $25,000 to $29,999 | 483 (3.6%) | 462 (3.9%) |
| $30,000 to $34,999 | 335 (2.5%) | 407 (3.4%) |
| $35,000 to $39,999 | 338 (2.5%) | 254 (2.1%) |
| $40,000 to $44,999 | 258 (1.9%) | 319 (2.7%) |
| $45,000 to $49,999 | 504 (3.8%) | 303 (2.6%) |
| $50,000 to $54,999 | 191 (1.4%) | 461 (3.9%) |
| $55,000 to $64,999 | 722 (5.4%) | 598 (5.1%) |
| $65,000 to $74,999 | 759 (5.7%) | 602 (5.1%) |
| $75,000 to $99,999 | 1,393 (10.5%) | 1,328 (11.2%) |
| $100,000+ | 6,152 (46.2%) | 3,257 (27.6%) |
| Total | 13,319 (100.0%) | 11,820 (100.0%) |
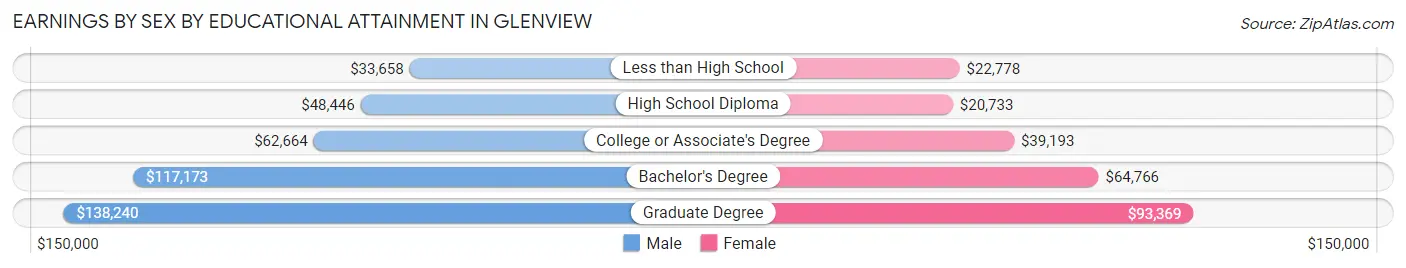
Earnings by Sex by Educational Attainment in Glenview
Average earnings in Glenview are $102,446 for men and $59,197 for women, a difference of 42.2%. Men with an educational attainment of graduate degree enjoy the highest average annual earnings of $138,240, while those with less than high school education earn the least with $33,658. Women with an educational attainment of graduate degree earn the most with the average annual earnings of $93,369, while those with high school diploma education have the smallest earnings of $20,733.
| Educational Attainment | Male Income | Female Income |
| Less than High School | $33,658 | $22,778 |
| High School Diploma | $48,446 | $20,733 |
| College or Associate's Degree | $62,664 | $39,193 |
| Bachelor's Degree | $117,173 | $64,766 |
| Graduate Degree | $138,240 | $93,369 |
| Total | $102,446 | $59,197 |
Family Income in Glenview
Family Income Brackets in Glenview
According to the Glenview family income data, there are 5,601 families falling into the $200,000+ income range, which is the most common income bracket and makes up 41.7% of all families. Conversely, the $10,000 to $14,999 income bracket is the least frequent group with only 67 families (0.5%) belonging to this category.
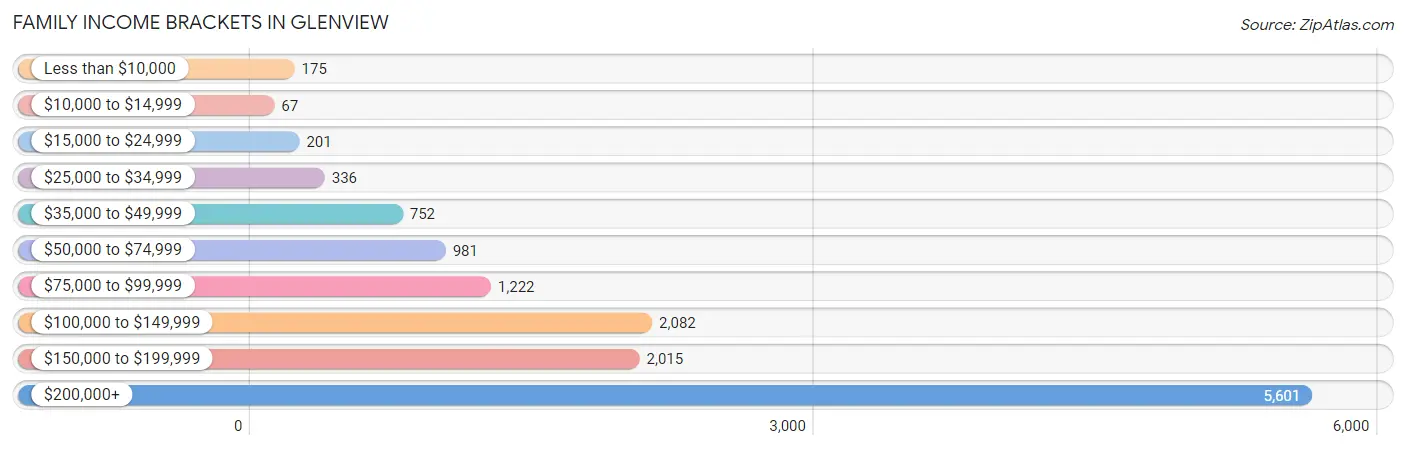
| Income Bracket | # Families | % Families |
| Less than $10,000 | 175 | 1.3% |
| $10,000 to $14,999 | 67 | 0.5% |
| $15,000 to $24,999 | 201 | 1.5% |
| $25,000 to $34,999 | 336 | 2.5% |
| $35,000 to $49,999 | 752 | 5.6% |
| $50,000 to $74,999 | 981 | 7.3% |
| $75,000 to $99,999 | 1,222 | 9.1% |
| $100,000 to $149,999 | 2,082 | 15.5% |
| $150,000 to $199,999 | 2,015 | 15.0% |
| $200,000+ | 5,601 | 41.7% |
Family Income by Famaliy Size in Glenview
4-person families (2,770 | 20.6%) account for the highest median family income in Glenview with $229,826 per family, while 2-person families (6,545 | 48.7%) have the highest median income of $70,202 per family member.
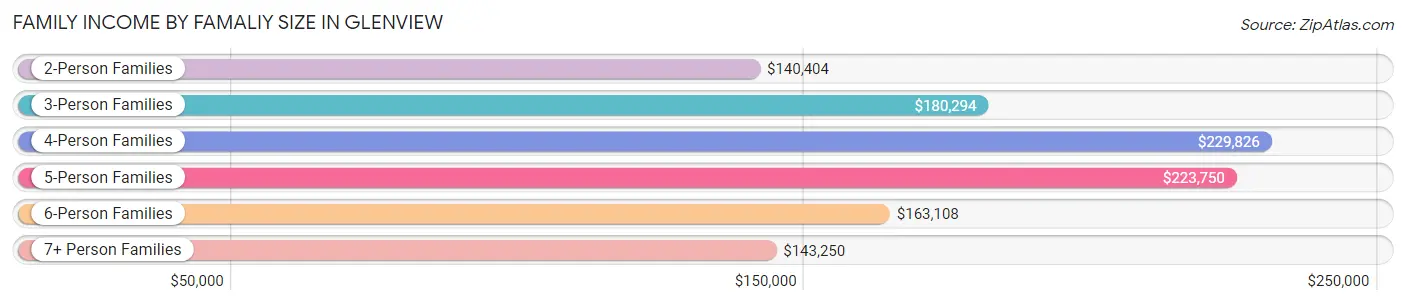
| Income Bracket | # Families | Median Income |
| 2-Person Families | 6,545 (48.7%) | $140,404 |
| 3-Person Families | 2,566 (19.1%) | $180,294 |
| 4-Person Families | 2,770 (20.6%) | $229,826 |
| 5-Person Families | 1,115 (8.3%) | $223,750 |
| 6-Person Families | 326 (2.4%) | $163,108 |
| 7+ Person Families | 110 (0.8%) | $143,250 |
| Total | 13,432 (100.0%) | $171,932 |
Family Income by Number of Earners in Glenview
The median family income in Glenview is $171,932, with families comprising 3+ earners (1,553) having the highest median family income of $218,594, while families with no earners (1,762) have the lowest median family income of $87,283, accounting for 11.6% and 13.1% of families, respectively.
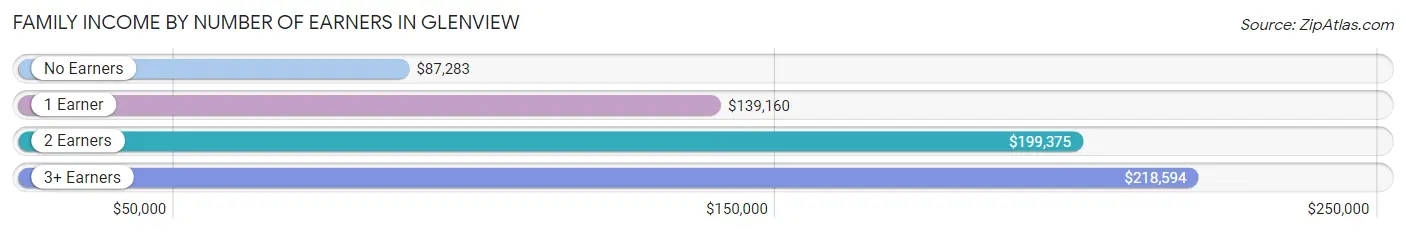
| Number of Earners | # Families | Median Income |
| No Earners | 1,762 (13.1%) | $87,283 |
| 1 Earner | 3,467 (25.8%) | $139,160 |
| 2 Earners | 6,650 (49.5%) | $199,375 |
| 3+ Earners | 1,553 (11.6%) | $218,594 |
| Total | 13,432 (100.0%) | $171,932 |
Household Income in Glenview
Household Income Brackets in Glenview
With 6,144 households falling in the category, the $200,000+ income range is the most frequent in Glenview, accounting for 33.3% of all households. In contrast, only 295 households (1.6%) fall into the $10,000 to $14,999 income bracket, making it the least populous group.
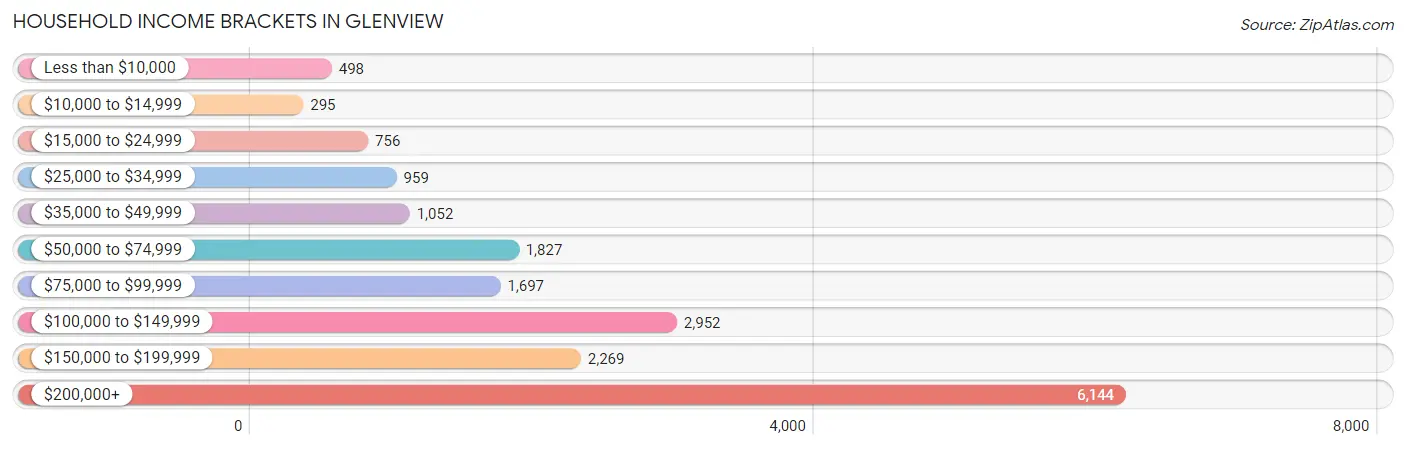
| Income Bracket | # Households | % Households |
| Less than $10,000 | 498 | 2.7% |
| $10,000 to $14,999 | 295 | 1.6% |
| $15,000 to $24,999 | 756 | 4.1% |
| $25,000 to $34,999 | 959 | 5.2% |
| $35,000 to $49,999 | 1,052 | 5.7% |
| $50,000 to $74,999 | 1,827 | 9.9% |
| $75,000 to $99,999 | 1,697 | 9.2% |
| $100,000 to $149,999 | 2,952 | 16.0% |
| $150,000 to $199,999 | 2,269 | 12.3% |
| $200,000+ | 6,144 | 33.3% |
Household Income by Householder Age in Glenview
The median household income in Glenview is $134,910, with the highest median household income of $178,308 found in the 45 to 64 years age bracket for the primary householder. A total of 7,163 households (38.8%) fall into this category. Meanwhile, the 15 to 24 years age bracket for the primary householder has the lowest median household income of $56,121, with 218 households (1.2%) in this group.
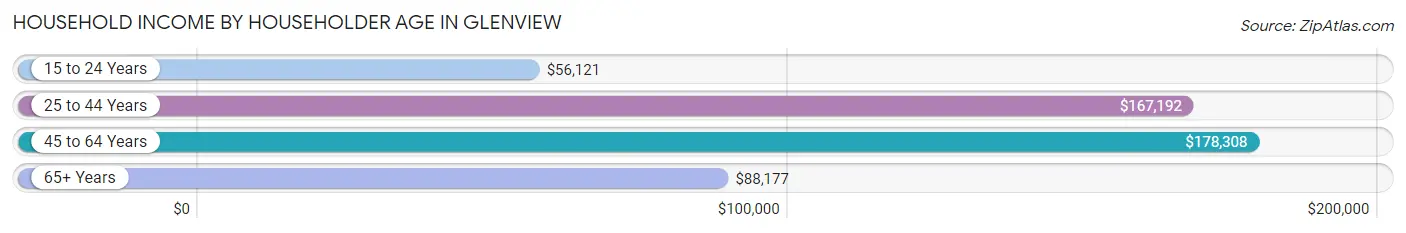
| Income Bracket | # Households | Median Income |
| 15 to 24 Years | 218 (1.2%) | $56,121 |
| 25 to 44 Years | 3,982 (21.6%) | $167,192 |
| 45 to 64 Years | 7,163 (38.8%) | $178,308 |
| 65+ Years | 7,088 (38.4%) | $88,177 |
| Total | 18,451 (100.0%) | $134,910 |
Poverty in Glenview
Income Below Poverty by Sex and Age in Glenview
With 4.3% poverty level for males and 5.7% for females among the residents of Glenview, 15 year old males and 12 to 14 year old females are the most vulnerable to poverty, with 67 males (14.1%) and 157 females (16.0%) in their respective age groups living below the poverty level.
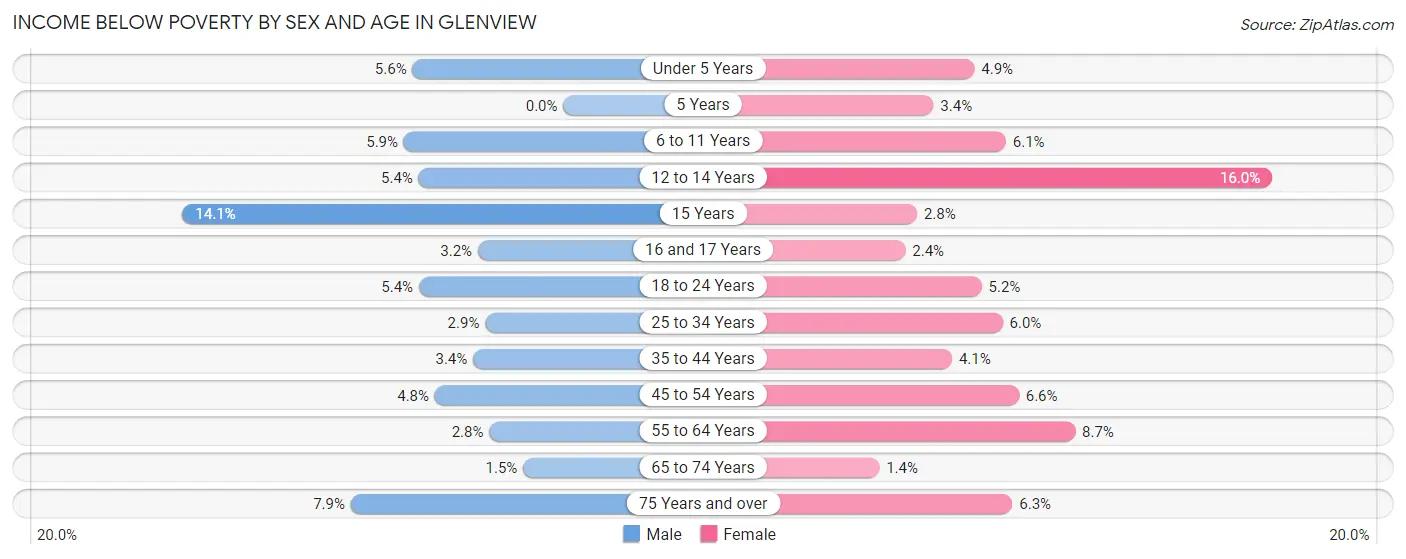
| Age Bracket | Male | Female |
| Under 5 Years | 82 (5.6%) | 76 (4.9%) |
| 5 Years | 0 (0.0%) | 7 (3.4%) |
| 6 to 11 Years | 101 (5.9%) | 113 (6.1%) |
| 12 to 14 Years | 50 (5.4%) | 157 (16.0%) |
| 15 Years | 67 (14.1%) | 8 (2.8%) |
| 16 and 17 Years | 26 (3.2%) | 21 (2.4%) |
| 18 to 24 Years | 65 (5.4%) | 66 (5.2%) |
| 25 to 34 Years | 51 (2.9%) | 92 (6.0%) |
| 35 to 44 Years | 87 (3.4%) | 124 (4.1%) |
| 45 to 54 Years | 163 (4.8%) | 220 (6.6%) |
| 55 to 64 Years | 83 (2.8%) | 292 (8.7%) |
| 65 to 74 Years | 42 (1.5%) | 47 (1.4%) |
| 75 Years and over | 144 (7.9%) | 191 (6.3%) |
| Total | 961 (4.3%) | 1,414 (5.7%) |
Income Above Poverty by Sex and Age in Glenview
According to the poverty statistics in Glenview, males aged 5 years and females aged 65 to 74 years are the age groups that are most secure financially, with 100.0% of males and 98.6% of females in these age groups living above the poverty line.
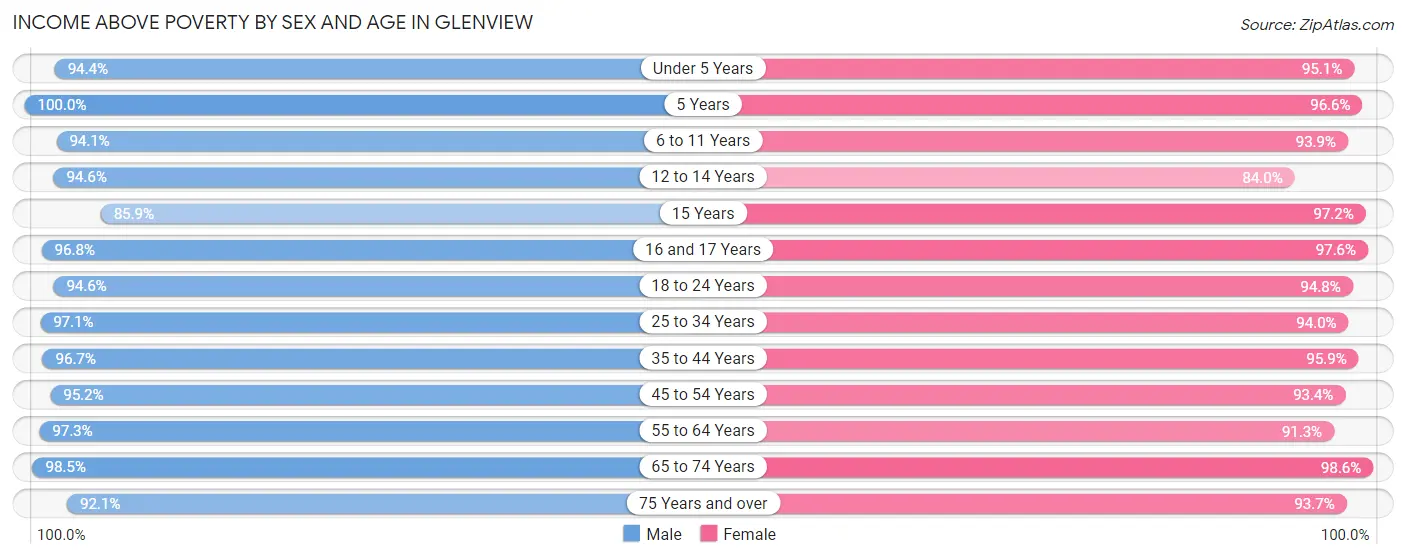
| Age Bracket | Male | Female |
| Under 5 Years | 1,383 (94.4%) | 1,469 (95.1%) |
| 5 Years | 279 (100.0%) | 199 (96.6%) |
| 6 to 11 Years | 1,605 (94.1%) | 1,741 (93.9%) |
| 12 to 14 Years | 881 (94.6%) | 826 (84.0%) |
| 15 Years | 407 (85.9%) | 279 (97.2%) |
| 16 and 17 Years | 795 (96.8%) | 868 (97.6%) |
| 18 to 24 Years | 1,147 (94.6%) | 1,206 (94.8%) |
| 25 to 34 Years | 1,707 (97.1%) | 1,450 (94.0%) |
| 35 to 44 Years | 2,508 (96.7%) | 2,910 (95.9%) |
| 45 to 54 Years | 3,254 (95.2%) | 3,130 (93.4%) |
| 55 to 64 Years | 2,933 (97.3%) | 3,078 (91.3%) |
| 65 to 74 Years | 2,775 (98.5%) | 3,332 (98.6%) |
| 75 Years and over | 1,681 (92.1%) | 2,827 (93.7%) |
| Total | 21,355 (95.7%) | 23,315 (94.3%) |
Income Below Poverty Among Married-Couple Families in Glenview
The poverty statistics for married-couple families in Glenview show that 2.6% or 294 of the total 11,317 families live below the poverty line. Families with 3 or 4 children have the highest poverty rate of 8.5%, comprising of 90 families. On the other hand, families with 5 or more children have the lowest poverty rate of 0.0%, which includes 0 families.
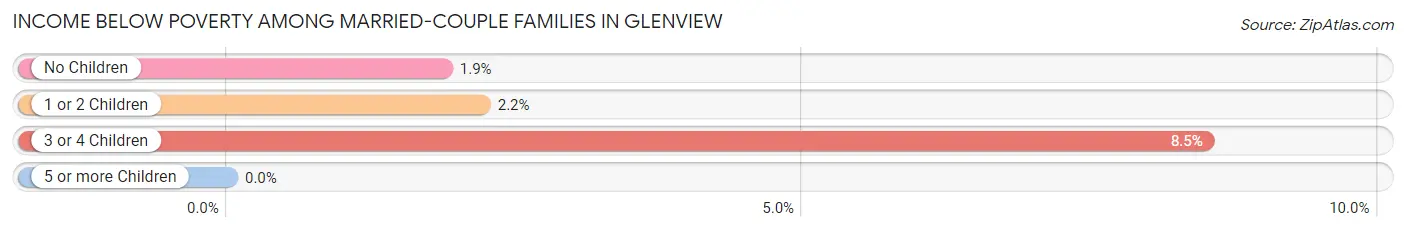
| Children | Above Poverty | Below Poverty |
| No Children | 6,306 (98.1%) | 120 (1.9%) |
| 1 or 2 Children | 3,741 (97.8%) | 84 (2.2%) |
| 3 or 4 Children | 969 (91.5%) | 90 (8.5%) |
| 5 or more Children | 7 (100.0%) | 0 (0.0%) |
| Total | 11,023 (97.4%) | 294 (2.6%) |
Income Below Poverty Among Single-Parent Households in Glenview
According to the poverty data in Glenview, 2.9% or 18 single-father households and 7.1% or 105 single-mother households are living below the poverty line. Among single-father households, those with 3 or 4 children have the highest poverty rate, with 18 households (100.0%) experiencing poverty. Likewise, among single-mother households, those with 3 or 4 children have the highest poverty rate, with 20 households (15.8%) falling below the poverty line.

| Children | Single Father | Single Mother |
| No Children | 0 (0.0%) | 20 (2.3%) |
| 1 or 2 Children | 0 (0.0%) | 65 (13.6%) |
| 3 or 4 Children | 18 (100.0%) | 20 (15.8%) |
| 5 or more Children | 0 (0.0%) | 0 (0.0%) |
| Total | 18 (2.9%) | 105 (7.1%) |
Income Below Poverty Among Married-Couple vs Single-Parent Households in Glenview
The poverty data for Glenview shows that 294 of the married-couple family households (2.6%) and 123 of the single-parent households (5.8%) are living below the poverty level. Within the married-couple family households, those with 3 or 4 children have the highest poverty rate, with 90 households (8.5%) falling below the poverty line. Among the single-parent households, those with 3 or 4 children have the highest poverty rate, with 38 household (26.2%) living below poverty.
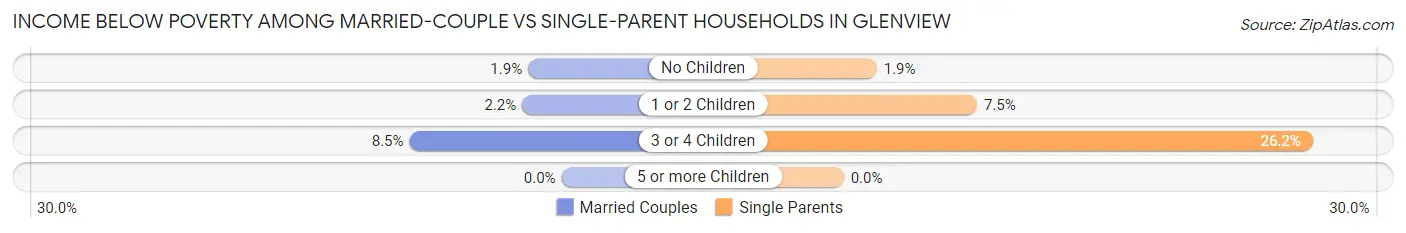
| Children | Married-Couple Families | Single-Parent Households |
| No Children | 120 (1.9%) | 20 (1.8%) |
| 1 or 2 Children | 84 (2.2%) | 65 (7.4%) |
| 3 or 4 Children | 90 (8.5%) | 38 (26.2%) |
| 5 or more Children | 0 (0.0%) | 0 (0.0%) |
| Total | 294 (2.6%) | 123 (5.8%) |
Race in Glenview
The most populous races in Glenview are White / Caucasian (35,610 | 74.4%), Asian (7,663 | 16.0%), and Hispanic or Latino (3,641 | 7.6%).
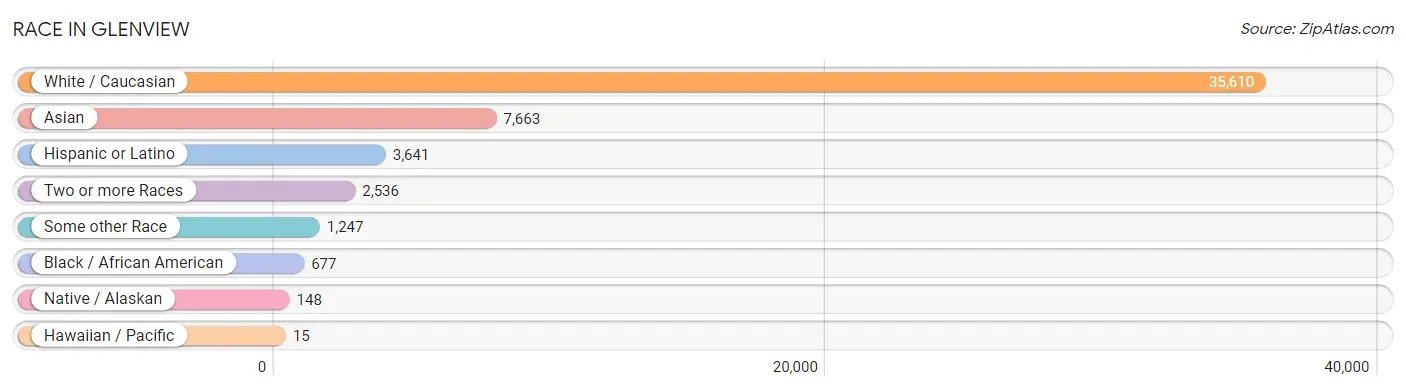
| Race | # Population | % Population |
| Asian | 7,663 | 16.0% |
| Black / African American | 677 | 1.4% |
| Hawaiian / Pacific | 15 | 0.0% |
| Hispanic or Latino | 3,641 | 7.6% |
| Native / Alaskan | 148 | 0.3% |
| White / Caucasian | 35,610 | 74.4% |
| Two or more Races | 2,536 | 5.3% |
| Some other Race | 1,247 | 2.6% |
| Total | 47,896 | 100.0% |
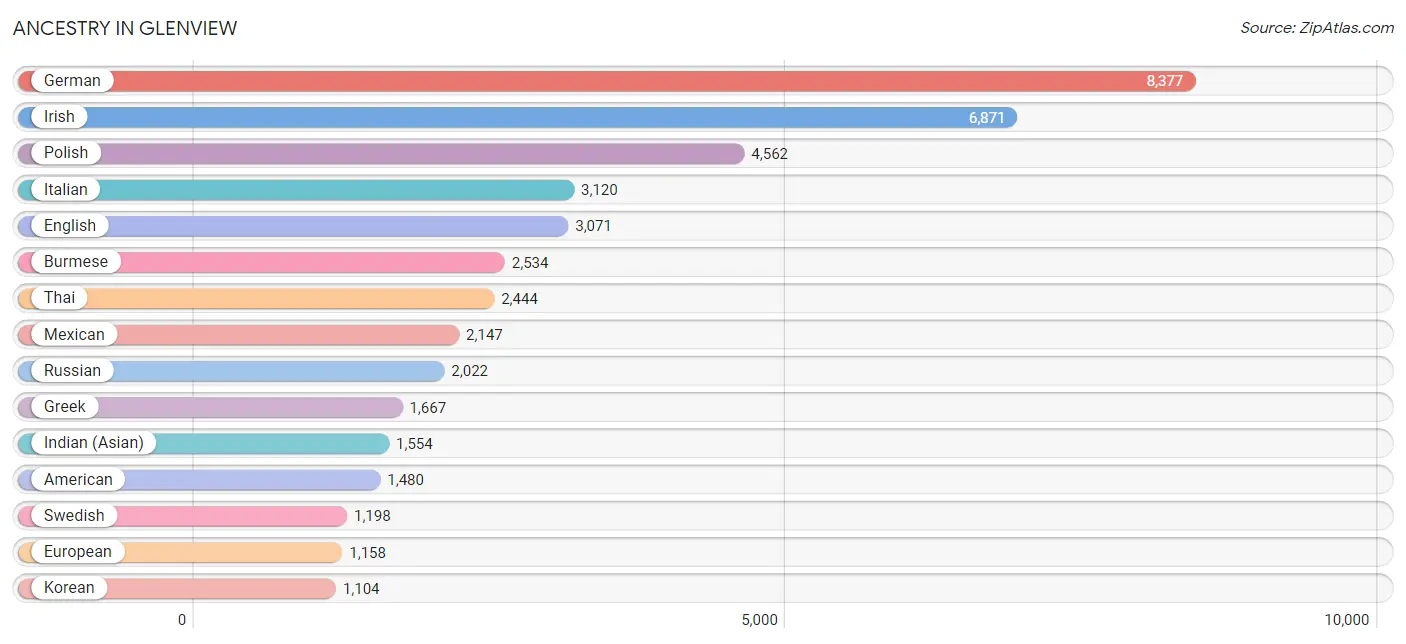
Ancestry in Glenview
The most populous ancestries reported in Glenview are German (8,377 | 17.5%), Irish (6,871 | 14.3%), Polish (4,562 | 9.5%), Italian (3,120 | 6.5%), and English (3,071 | 6.4%), together accounting for 54.3% of all Glenview residents.
| Ancestry | # Population | % Population |
| Afghan | 16 | 0.0% |
| African | 14 | 0.0% |
| Alaskan Athabascan | 7 | 0.0% |
| Albanian | 18 | 0.0% |
| American | 1,480 | 3.1% |
| Arab | 127 | 0.3% |
| Argentinean | 35 | 0.1% |
| Armenian | 77 | 0.2% |
| Assyrian / Chaldean / Syriac | 365 | 0.8% |
| Austrian | 148 | 0.3% |
| Basque | 5 | 0.0% |
| Belgian | 67 | 0.1% |
| Bhutanese | 256 | 0.5% |
| Blackfeet | 14 | 0.0% |
| Bolivian | 27 | 0.1% |
| Brazilian | 83 | 0.2% |
| British | 173 | 0.4% |
| Bulgarian | 135 | 0.3% |
| Burmese | 2,534 | 5.3% |
| Cambodian | 274 | 0.6% |
| Canadian | 36 | 0.1% |
| Central American | 405 | 0.9% |
| Central American Indian | 115 | 0.2% |
| Cherokee | 49 | 0.1% |
| Chinese | 7 | 0.0% |
| Colombian | 169 | 0.4% |
| Croatian | 137 | 0.3% |
| Cuban | 239 | 0.5% |
| Czech | 495 | 1.0% |
| Czechoslovakian | 9 | 0.0% |
| Danish | 160 | 0.3% |
| Dutch | 382 | 0.8% |
| Eastern European | 548 | 1.1% |
| Ecuadorian | 138 | 0.3% |
| English | 3,071 | 6.4% |
| Estonian | 6 | 0.0% |
| European | 1,158 | 2.4% |
| Filipino | 281 | 0.6% |
| Finnish | 36 | 0.1% |
| French | 534 | 1.1% |
| French Canadian | 132 | 0.3% |
| German | 8,377 | 17.5% |
| Ghanaian | 38 | 0.1% |
| Greek | 1,667 | 3.5% |
| Guatemalan | 129 | 0.3% |
| Hungarian | 258 | 0.5% |
| Icelander | 29 | 0.1% |
| Indian (Asian) | 1,554 | 3.2% |
| Indonesian | 30 | 0.1% |
| Iranian | 104 | 0.2% |
| Iraqi | 57 | 0.1% |
| Irish | 6,871 | 14.3% |
| Israeli | 6 | 0.0% |
| Italian | 3,120 | 6.5% |
| Jamaican | 18 | 0.0% |
| Korean | 1,104 | 2.3% |
| Latvian | 15 | 0.0% |
| Lebanese | 25 | 0.1% |
| Lithuanian | 235 | 0.5% |
| Luxembourger | 83 | 0.2% |
| Macedonian | 23 | 0.1% |
| Maltese | 5 | 0.0% |
| Menominee | 7 | 0.0% |
| Mexican | 2,147 | 4.5% |
| Mexican American Indian | 18 | 0.0% |
| Native Hawaiian | 4 | 0.0% |
| Nigerian | 26 | 0.1% |
| Northern European | 146 | 0.3% |
| Norwegian | 666 | 1.4% |
| Osage | 34 | 0.1% |
| Pakistani | 145 | 0.3% |
| Palestinian | 9 | 0.0% |
| Peruvian | 9 | 0.0% |
| Polish | 4,562 | 9.5% |
| Portuguese | 35 | 0.1% |
| Puerto Rican | 338 | 0.7% |
| Romanian | 426 | 0.9% |
| Russian | 2,022 | 4.2% |
| Salvadoran | 276 | 0.6% |
| Scandinavian | 121 | 0.3% |
| Scotch-Irish | 317 | 0.7% |
| Scottish | 554 | 1.2% |
| Serbian | 160 | 0.3% |
| Slavic | 24 | 0.1% |
| Slovak | 113 | 0.2% |
| Slovene | 83 | 0.2% |
| South African | 6 | 0.0% |
| South American | 378 | 0.8% |
| Spaniard | 20 | 0.0% |
| Spanish | 66 | 0.1% |
| Sri Lankan | 160 | 0.3% |
| Subsaharan African | 84 | 0.2% |
| Swedish | 1,198 | 2.5% |
| Swiss | 105 | 0.2% |
| Syrian | 25 | 0.1% |
| Thai | 2,444 | 5.1% |
| Turkish | 28 | 0.1% |
| Ukrainian | 460 | 1.0% |
| Welsh | 172 | 0.4% |
| Yugoslavian | 71 | 0.2% | View All 100 Rows |
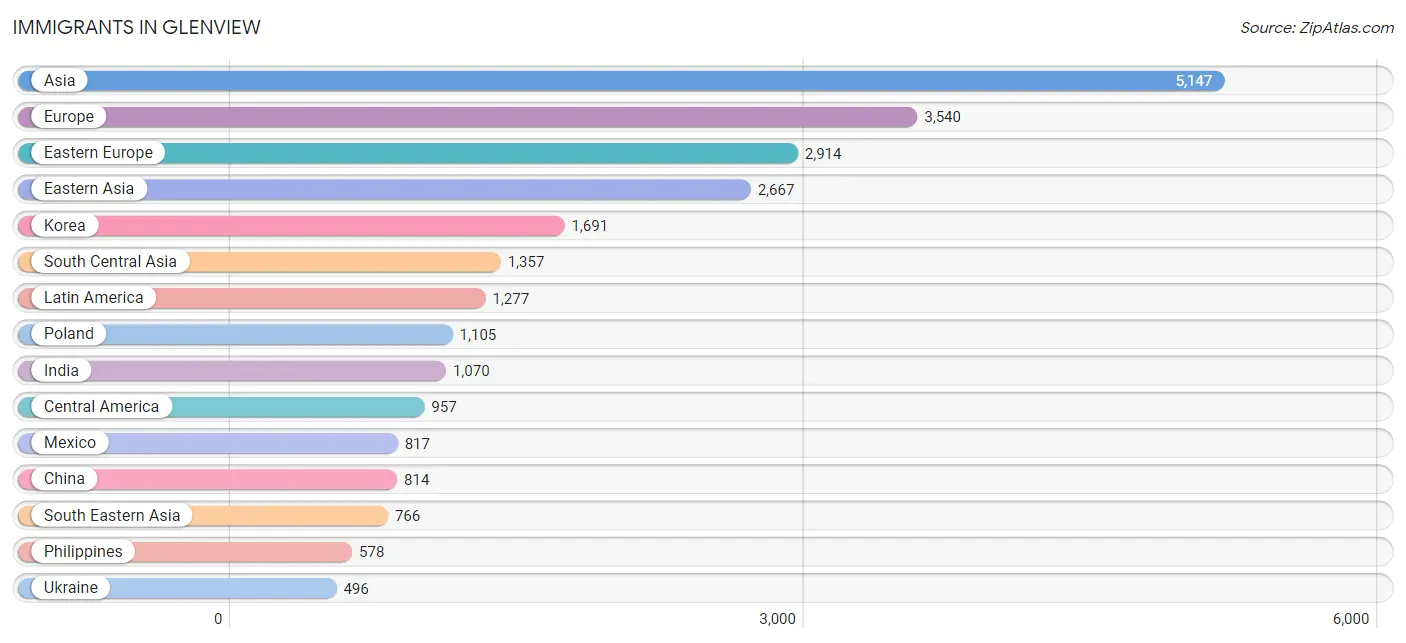
Immigrants in Glenview
The most numerous immigrant groups reported in Glenview came from Asia (5,147 | 10.7%), Europe (3,540 | 7.4%), Eastern Europe (2,914 | 6.1%), Eastern Asia (2,667 | 5.6%), and Korea (1,691 | 3.5%), together accounting for 33.3% of all Glenview residents.
| Immigration Origin | # Population | % Population |
| Afghanistan | 16 | 0.0% |
| Africa | 183 | 0.4% |
| Argentina | 26 | 0.1% |
| Asia | 5,147 | 10.7% |
| Bangladesh | 55 | 0.1% |
| Belarus | 31 | 0.1% |
| Bolivia | 7 | 0.0% |
| Bosnia and Herzegovina | 114 | 0.2% |
| Brazil | 34 | 0.1% |
| Bulgaria | 112 | 0.2% |
| Canada | 134 | 0.3% |
| Caribbean | 112 | 0.2% |
| Central America | 957 | 2.0% |
| China | 814 | 1.7% |
| Colombia | 82 | 0.2% |
| Croatia | 35 | 0.1% |
| Cuba | 76 | 0.2% |
| Czechoslovakia | 64 | 0.1% |
| Eastern Africa | 58 | 0.1% |
| Eastern Asia | 2,667 | 5.6% |
| Eastern Europe | 2,914 | 6.1% |
| Ecuador | 50 | 0.1% |
| El Salvador | 100 | 0.2% |
| England | 71 | 0.2% |
| Europe | 3,540 | 7.4% |
| Fiji | 26 | 0.1% |
| France | 8 | 0.0% |
| Germany | 159 | 0.3% |
| Ghana | 20 | 0.0% |
| Greece | 279 | 0.6% |
| Guatemala | 40 | 0.1% |
| Hong Kong | 120 | 0.3% |
| Hungary | 55 | 0.1% |
| India | 1,070 | 2.2% |
| Iran | 88 | 0.2% |
| Iraq | 125 | 0.3% |
| Ireland | 38 | 0.1% |
| Israel | 35 | 0.1% |
| Italy | 46 | 0.1% |
| Jamaica | 36 | 0.1% |
| Japan | 37 | 0.1% |
| Kenya | 58 | 0.1% |
| Korea | 1,691 | 3.5% |
| Latin America | 1,277 | 2.7% |
| Latvia | 6 | 0.0% |
| Lebanon | 3 | 0.0% |
| Malaysia | 27 | 0.1% |
| Mexico | 817 | 1.7% |
| Nigeria | 26 | 0.1% |
| North Macedonia | 23 | 0.1% |
| Northern Europe | 134 | 0.3% |
| Oceania | 26 | 0.1% |
| Pakistan | 80 | 0.2% |
| Peru | 9 | 0.0% |
| Philippines | 578 | 1.2% |
| Poland | 1,105 | 2.3% |
| Romania | 246 | 0.5% |
| Russia | 464 | 1.0% |
| Serbia | 8 | 0.0% |
| South Africa | 39 | 0.1% |
| South America | 208 | 0.4% |
| South Central Asia | 1,357 | 2.8% |
| South Eastern Asia | 766 | 1.6% |
| Southern Europe | 325 | 0.7% |
| Syria | 109 | 0.2% |
| Taiwan | 249 | 0.5% |
| Thailand | 108 | 0.2% |
| Turkey | 41 | 0.1% |
| Ukraine | 496 | 1.0% |
| Uzbekistan | 40 | 0.1% |
| Vietnam | 27 | 0.1% |
| Western Africa | 46 | 0.1% |
| Western Asia | 357 | 0.7% |
| Western Europe | 167 | 0.4% | View All 74 Rows |
Sex and Age in Glenview
Sex and Age in Glenview
The most populous age groups in Glenview are 50 to 54 Years (1,796 | 7.9%) for men and 65 to 69 Years (1,867 | 7.4%) for women.
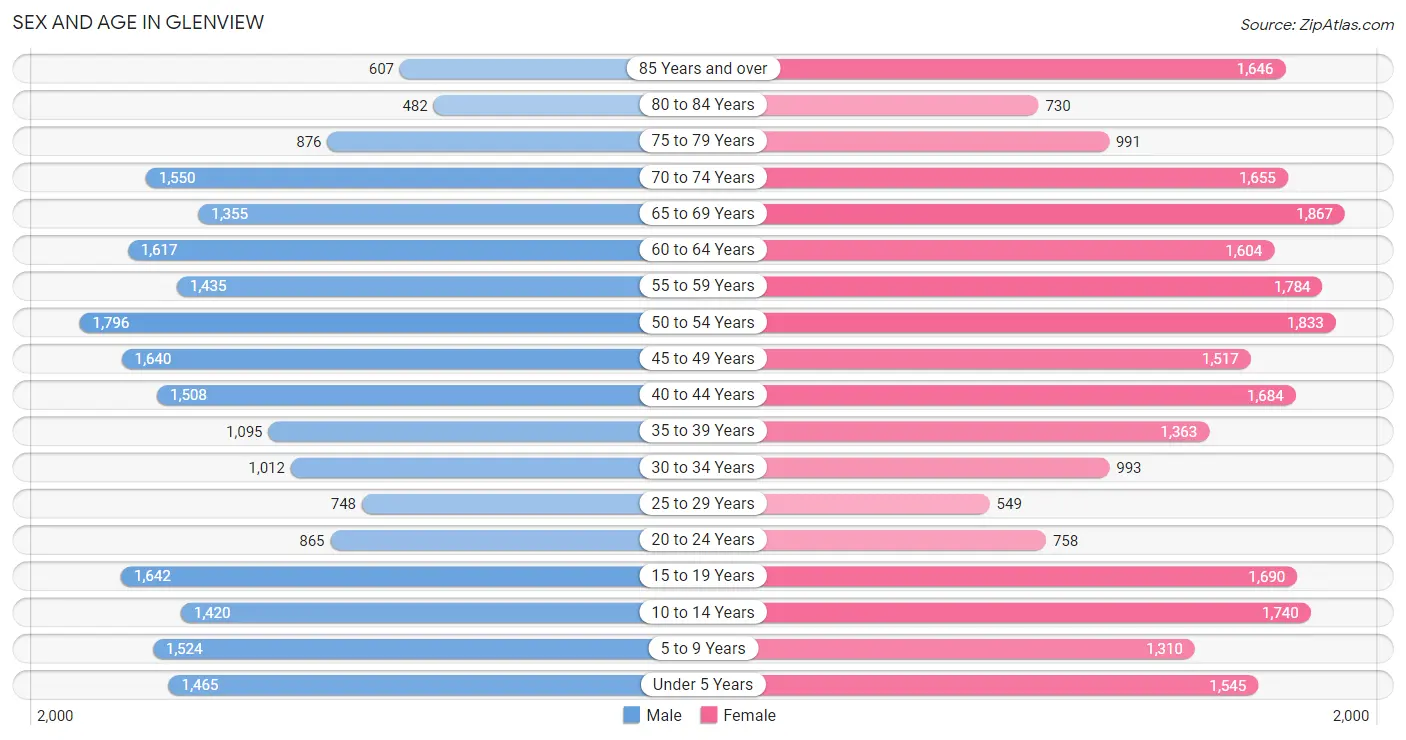
| Age Bracket | Male | Female |
| Under 5 Years | 1,465 (6.5%) | 1,545 (6.1%) |
| 5 to 9 Years | 1,524 (6.7%) | 1,310 (5.2%) |
| 10 to 14 Years | 1,420 (6.3%) | 1,740 (6.9%) |
| 15 to 19 Years | 1,642 (7.2%) | 1,690 (6.7%) |
| 20 to 24 Years | 865 (3.8%) | 758 (3.0%) |
| 25 to 29 Years | 748 (3.3%) | 549 (2.2%) |
| 30 to 34 Years | 1,012 (4.5%) | 993 (3.9%) |
| 35 to 39 Years | 1,095 (4.8%) | 1,363 (5.4%) |
| 40 to 44 Years | 1,508 (6.7%) | 1,684 (6.7%) |
| 45 to 49 Years | 1,640 (7.2%) | 1,517 (6.0%) |
| 50 to 54 Years | 1,796 (7.9%) | 1,833 (7.3%) |
| 55 to 59 Years | 1,435 (6.3%) | 1,784 (7.1%) |
| 60 to 64 Years | 1,617 (7.1%) | 1,604 (6.4%) |
| 65 to 69 Years | 1,355 (6.0%) | 1,867 (7.4%) |
| 70 to 74 Years | 1,550 (6.9%) | 1,655 (6.6%) |
| 75 to 79 Years | 876 (3.9%) | 991 (3.9%) |
| 80 to 84 Years | 482 (2.1%) | 730 (2.9%) |
| 85 Years and over | 607 (2.7%) | 1,646 (6.5%) |
| Total | 22,637 (100.0%) | 25,259 (100.0%) |
Families and Households in Glenview
Median Family Size in Glenview
The median family size in Glenview is 3.05 persons per family, with married-couple families (11,317 | 84.3%) accounting for the largest median family size of 3.13 persons per family. On the other hand, single female/mother families (1,487 | 11.1%) represent the smallest median family size with 2.58 persons per family.
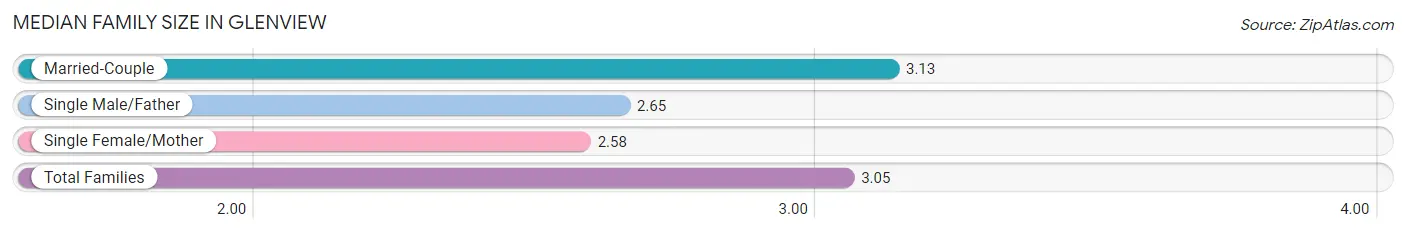
| Family Type | # Families | Family Size |
| Married-Couple | 11,317 (84.3%) | 3.13 |
| Single Male/Father | 628 (4.7%) | 2.65 |
| Single Female/Mother | 1,487 (11.1%) | 2.58 |
| Total Families | 13,432 (100.0%) | 3.05 |
Median Household Size in Glenview
The median household size in Glenview is 2.55 persons per household, with married-couple households (11,317 | 61.3%) accounting for the largest median household size of 3.15 persons per household. non-family households (5,019 | 27.2%) represent the smallest median household size with 1.13 persons per household.
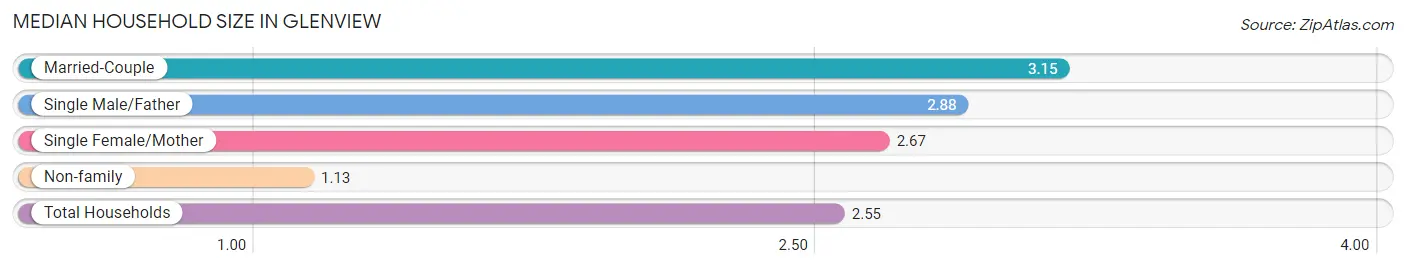
| Household Type | # Households | Household Size |
| Married-Couple | 11,317 (61.3%) | 3.15 |
| Single Male/Father | 628 (3.4%) | 2.88 |
| Single Female/Mother | 1,487 (8.1%) | 2.67 |
| Non-family | 5,019 (27.2%) | 1.13 |
| Total Households | 18,451 (100.0%) | 2.55 |
Household Size by Marriage Status in Glenview
Out of a total of 18,451 households in Glenview, 13,432 (72.8%) are family households, while 5,019 (27.2%) are nonfamily households. The most numerous type of family households are 2-person households, comprising 6,366, and the most common type of nonfamily households are 1-person households, comprising 4,523.
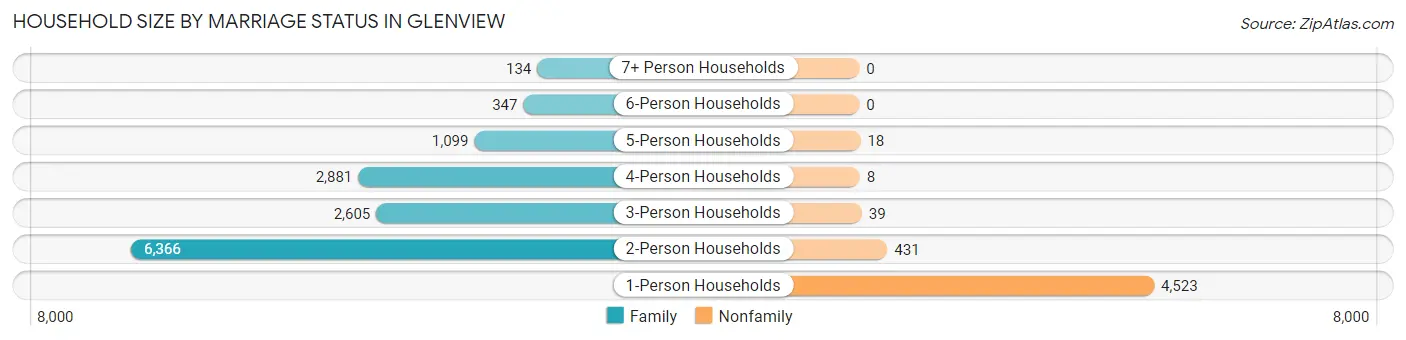
| Household Size | Family Households | Nonfamily Households |
| 1-Person Households | - | 4,523 (24.5%) |
| 2-Person Households | 6,366 (34.5%) | 431 (2.3%) |
| 3-Person Households | 2,605 (14.1%) | 39 (0.2%) |
| 4-Person Households | 2,881 (15.6%) | 8 (0.0%) |
| 5-Person Households | 1,099 (6.0%) | 18 (0.1%) |
| 6-Person Households | 347 (1.9%) | 0 (0.0%) |
| 7+ Person Households | 134 (0.7%) | 0 (0.0%) |
| Total | 13,432 (72.8%) | 5,019 (27.2%) |
Female Fertility in Glenview
Fertility by Age in Glenview
Average fertility rate in Glenview is 52.0 births per 1,000 women. Women in the age bracket of 20 to 34 years have the highest fertility rate with 107.0 births per 1,000 women. Women in the age bracket of 20 to 34 years acount for 53.1% of all women with births.
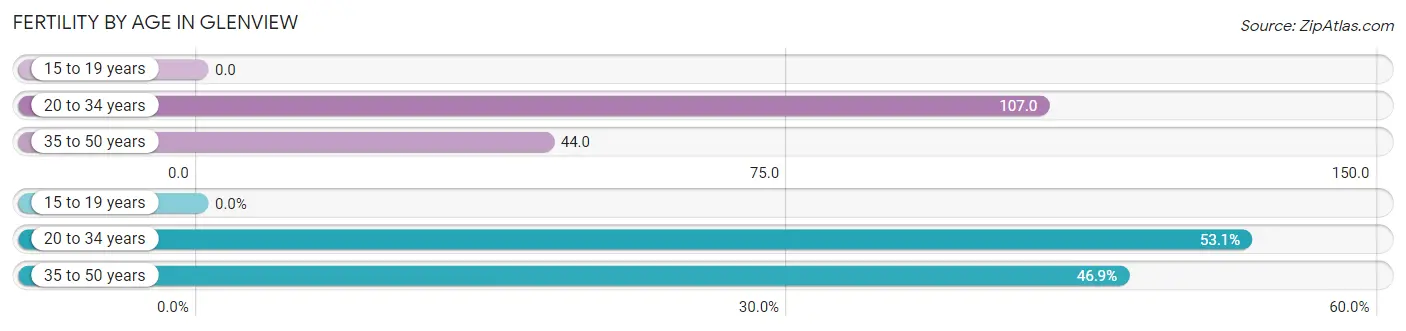
| Age Bracket | Women with Births | Births / 1,000 Women |
| 15 to 19 years | 0 (0.0%) | 0.0 |
| 20 to 34 years | 246 (53.1%) | 107.0 |
| 35 to 50 years | 217 (46.9%) | 44.0 |
| Total | 463 (100.0%) | 52.0 |
Fertility by Age by Marriage Status in Glenview
97.6% of women with births (463) in Glenview are married. The highest percentage of unmarried women with births falls into 35 to 50 years age bracket with 5.1% of them unmarried at the time of birth, while the lowest percentage of unmarried women with births belong to 20 to 34 years age bracket with 0.0% of them unmarried.
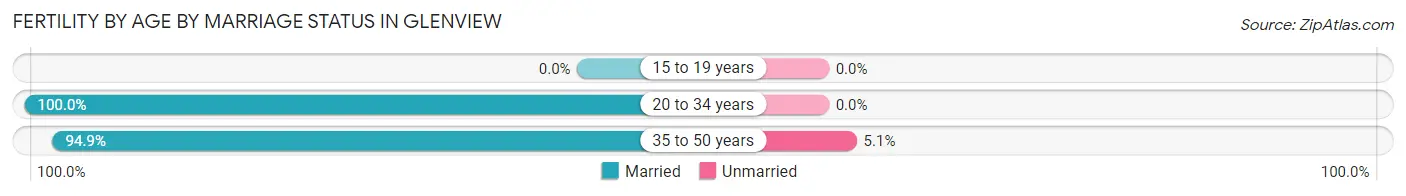
| Age Bracket | Married | Unmarried |
| 15 to 19 years | 0 (0.0%) | 0 (0.0%) |
| 20 to 34 years | 246 (100.0%) | 0 (0.0%) |
| 35 to 50 years | 206 (94.9%) | 11 (5.1%) |
| Total | 452 (97.6%) | 11 (2.4%) |
Fertility by Education in Glenview
Average fertility rate in Glenview is 52.0 births per 1,000 women. Women with the education attainment of graduate degree have the highest fertility rate of 73.0 births per 1,000 women, while women with the education attainment of less than high school have the lowest fertility at 9.0 births per 1,000 women. Women with the education attainment of graduate degree represent 41.5% of all women with births.
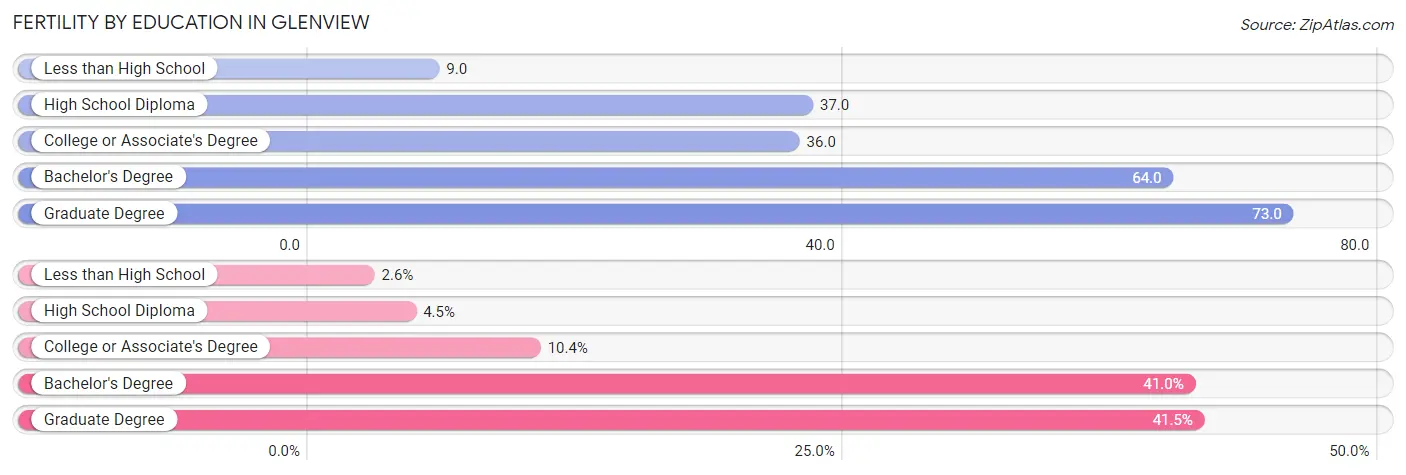
| Educational Attainment | Women with Births | Births / 1,000 Women |
| Less than High School | 12 (2.6%) | 9.0 |
| High School Diploma | 21 (4.5%) | 37.0 |
| College or Associate's Degree | 48 (10.4%) | 36.0 |
| Bachelor's Degree | 190 (41.0%) | 64.0 |
| Graduate Degree | 192 (41.5%) | 73.0 |
| Total | 463 (100.0%) | 52.0 |
Fertility by Education by Marriage Status in Glenview
2.4% of women with births in Glenview are unmarried. Women with the educational attainment of less than high school are most likely to be married with 100.0% of them married at childbirth, while women with the educational attainment of high school diploma are least likely to be married with 52.4% of them unmarried at childbirth.
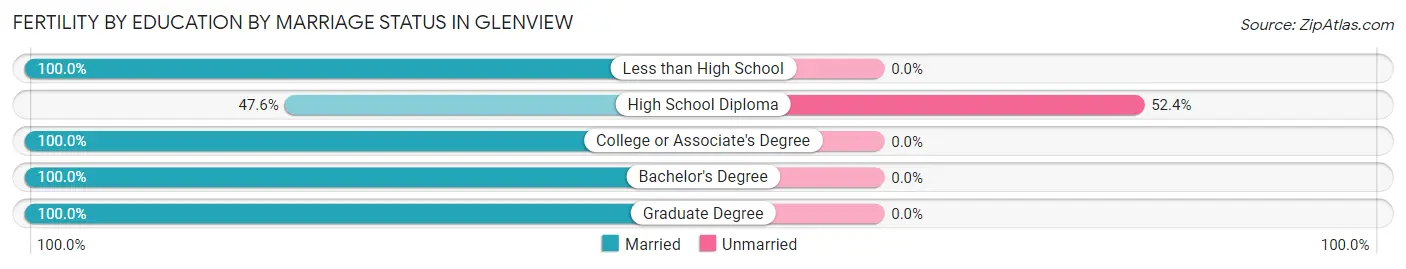
| Educational Attainment | Married | Unmarried |
| Less than High School | 12 (100.0%) | 0 (0.0%) |
| High School Diploma | 10 (47.6%) | 11 (52.4%) |
| College or Associate's Degree | 48 (100.0%) | 0 (0.0%) |
| Bachelor's Degree | 190 (100.0%) | 0 (0.0%) |
| Graduate Degree | 192 (100.0%) | 0 (0.0%) |
| Total | 452 (97.6%) | 11 (2.4%) |
Employment Characteristics in Glenview
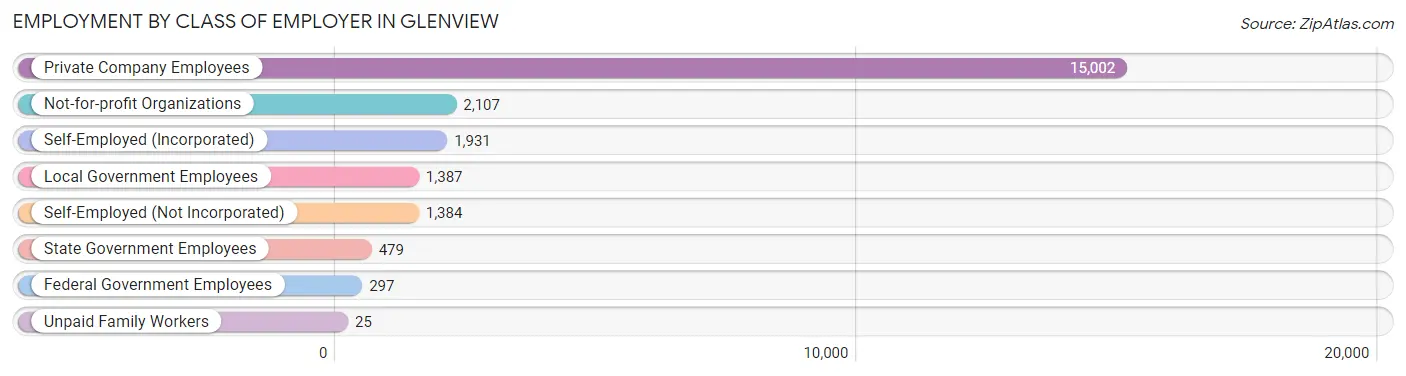
Employment by Class of Employer in Glenview
Among the 22,612 employed individuals in Glenview, private company employees (15,002 | 66.3%), not-for-profit organizations (2,107 | 9.3%), and self-employed (incorporated) (1,931 | 8.5%) make up the most common classes of employment.
| Employer Class | # Employees | % Employees |
| Private Company Employees | 15,002 | 66.3% |
| Self-Employed (Incorporated) | 1,931 | 8.5% |
| Self-Employed (Not Incorporated) | 1,384 | 6.1% |
| Not-for-profit Organizations | 2,107 | 9.3% |
| Local Government Employees | 1,387 | 6.1% |
| State Government Employees | 479 | 2.1% |
| Federal Government Employees | 297 | 1.3% |
| Unpaid Family Workers | 25 | 0.1% |
| Total | 22,612 | 100.0% |
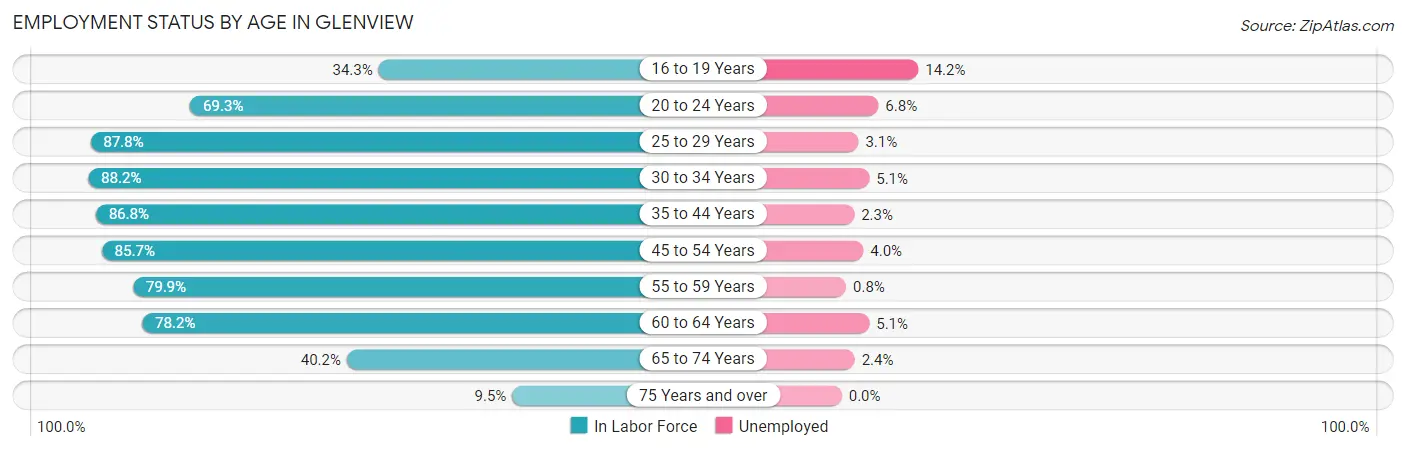
Employment Status by Age in Glenview
According to the labor force statistics for Glenview, out of the total population over 16 years of age (38,131), 62.5% or 23,832 individuals are in the labor force, with 3.7% or 882 of them unemployed. The age group with the highest labor force participation rate is 30 to 34 years, with 88.2% or 1,768 individuals in the labor force. Within the labor force, the 16 to 19 years age range has the highest percentage of unemployed individuals, with 14.2% or 125 of them being unemployed.
| Age Bracket | In Labor Force | Unemployed |
| 16 to 19 Years | 882 (34.3%) | 125 (14.2%) |
| 20 to 24 Years | 1,125 (69.3%) | 76 (6.8%) |
| 25 to 29 Years | 1,139 (87.8%) | 35 (3.1%) |
| 30 to 34 Years | 1,768 (88.2%) | 90 (5.1%) |
| 35 to 44 Years | 4,904 (86.8%) | 113 (2.3%) |
| 45 to 54 Years | 5,816 (85.7%) | 233 (4.0%) |
| 55 to 59 Years | 2,572 (79.9%) | 21 (0.8%) |
| 60 to 64 Years | 2,519 (78.2%) | 128 (5.1%) |
| 65 to 74 Years | 2,584 (40.2%) | 62 (2.4%) |
| 75 Years and over | 507 (9.5%) | 0 (0.0%) |
| Total | 23,832 (62.5%) | 882 (3.7%) |
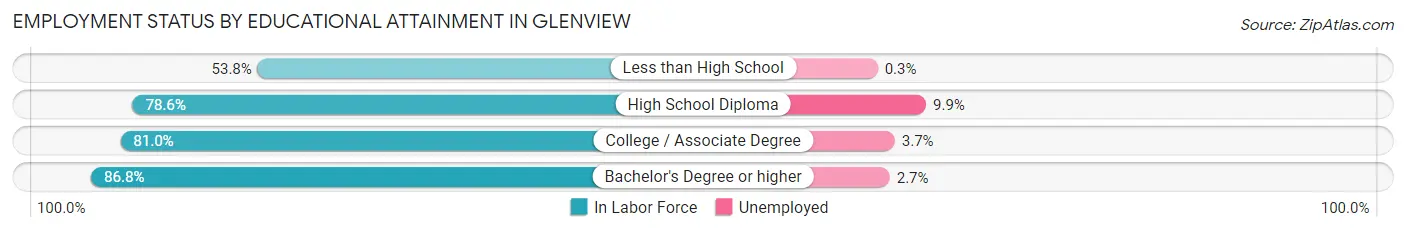
Employment Status by Educational Attainment in Glenview
According to labor force statistics for Glenview, 84.4% of individuals (18,718) out of the total population between 25 and 64 years of age (22,178) are in the labor force, with 3.3% or 618 of them being unemployed. The group with the highest labor force participation rate are those with the educational attainment of bachelor's degree or higher, with 86.8% or 14,487 individuals in the labor force. Within the labor force, individuals with high school diploma education have the highest percentage of unemployment, with 9.9% or 118 of them being unemployed.
| Educational Attainment | In Labor Force | Unemployed |
| Less than High School | 350 (53.8%) | 2 (0.3%) |
| High School Diploma | 1,187 (78.6%) | 149 (9.9%) |
| College / Associate Degree | 2,695 (81.0%) | 123 (3.7%) |
| Bachelor's Degree or higher | 14,487 (86.8%) | 451 (2.7%) |
| Total | 18,718 (84.4%) | 732 (3.3%) |
Employment Occupations by Sex in Glenview
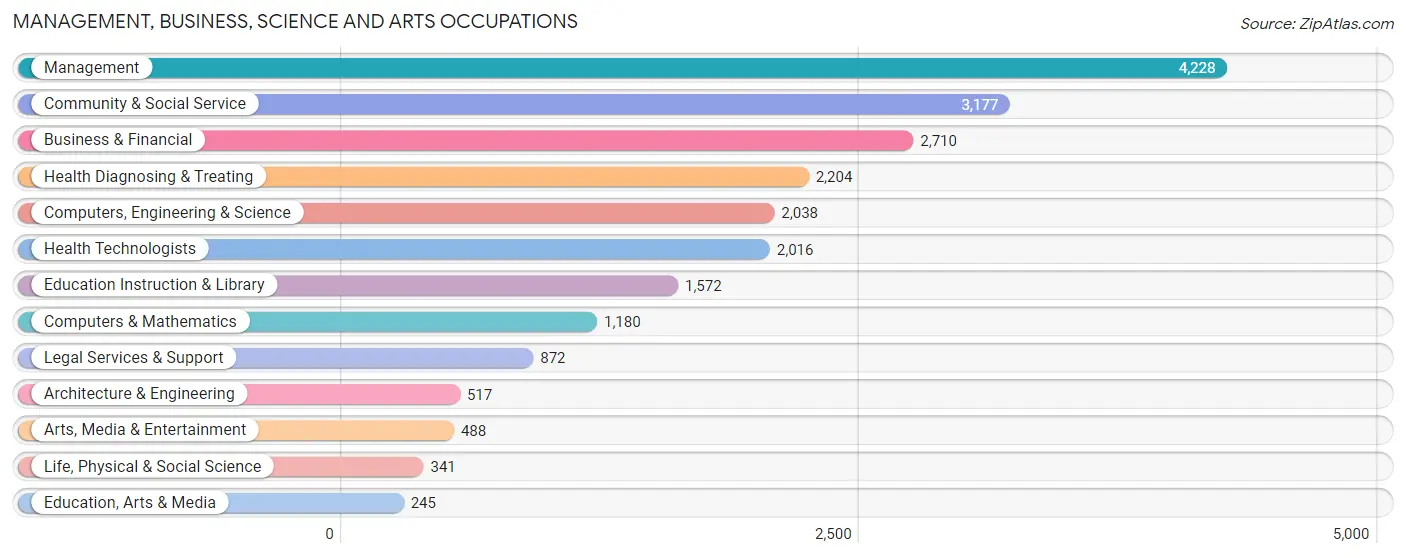
Management, Business, Science and Arts Occupations
The most common Management, Business, Science and Arts occupations in Glenview are Management (4,228 | 18.5%), Community & Social Service (3,177 | 13.9%), Business & Financial (2,710 | 11.8%), Health Diagnosing & Treating (2,204 | 9.6%), and Computers, Engineering & Science (2,038 | 8.9%).
Management, Business, Science and Arts Occupations by Sex
Within the Management, Business, Science and Arts occupations in Glenview, the most male-oriented occupations are Computers & Mathematics (81.2%), Computers, Engineering & Science (75.0%), and Architecture & Engineering (74.3%), while the most female-oriented occupations are Education, Arts & Media (68.6%), Education Instruction & Library (68.4%), and Health Diagnosing & Treating (64.3%).
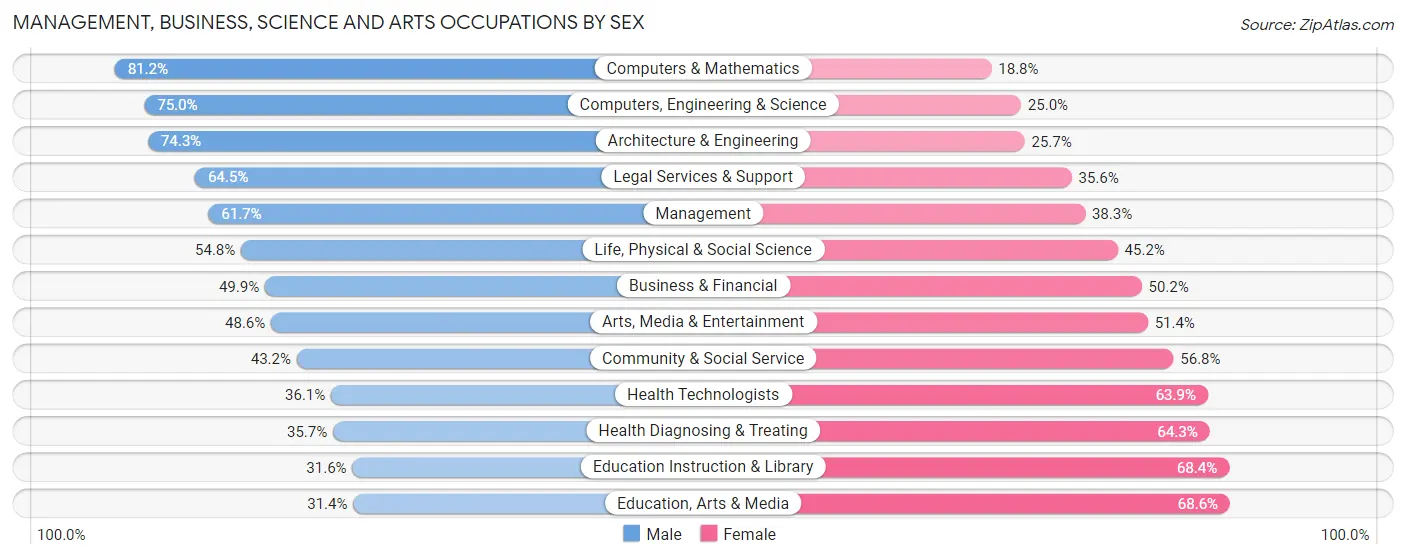
| Occupation | Male | Female |
| Management | 2,607 (61.7%) | 1,621 (38.3%) |
| Business & Financial | 1,351 (49.8%) | 1,359 (50.1%) |
| Computers, Engineering & Science | 1,529 (75.0%) | 509 (25.0%) |
| Computers & Mathematics | 958 (81.2%) | 222 (18.8%) |
| Architecture & Engineering | 384 (74.3%) | 133 (25.7%) |
| Life, Physical & Social Science | 187 (54.8%) | 154 (45.2%) |
| Community & Social Service | 1,373 (43.2%) | 1,804 (56.8%) |
| Education, Arts & Media | 77 (31.4%) | 168 (68.6%) |
| Legal Services & Support | 562 (64.4%) | 310 (35.5%) |
| Education Instruction & Library | 497 (31.6%) | 1,075 (68.4%) |
| Arts, Media & Entertainment | 237 (48.6%) | 251 (51.4%) |
| Health Diagnosing & Treating | 786 (35.7%) | 1,418 (64.3%) |
| Health Technologists | 727 (36.1%) | 1,289 (63.9%) |
| Total (Category) | 7,646 (53.3%) | 6,711 (46.7%) |
| Total (Overall) | 12,238 (53.5%) | 10,638 (46.5%) |
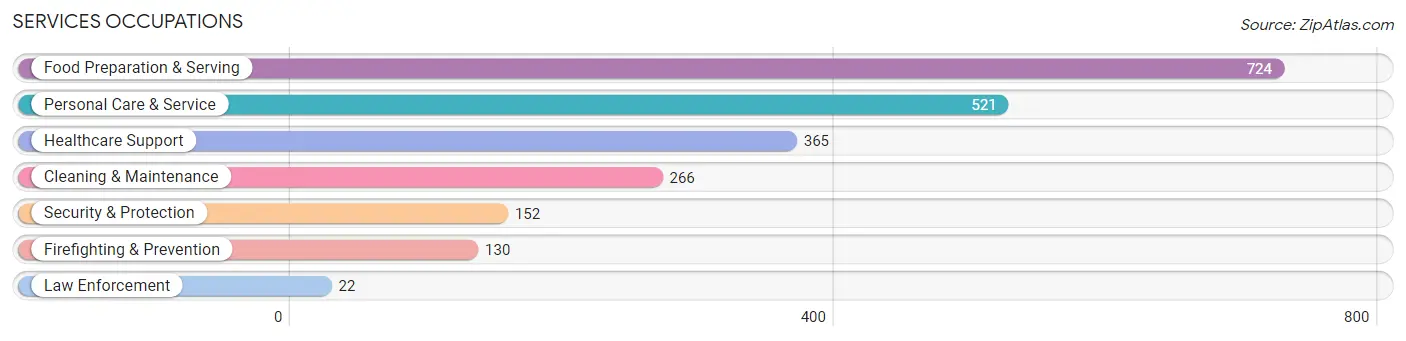
Services Occupations
The most common Services occupations in Glenview are Food Preparation & Serving (724 | 3.2%), Personal Care & Service (521 | 2.3%), Healthcare Support (365 | 1.6%), Cleaning & Maintenance (266 | 1.2%), and Security & Protection (152 | 0.7%).
Services Occupations by Sex
Within the Services occupations in Glenview, the most male-oriented occupations are Law Enforcement (100.0%), Security & Protection (66.4%), and Food Preparation & Serving (63.0%), while the most female-oriented occupations are Healthcare Support (91.5%), Personal Care & Service (79.6%), and Cleaning & Maintenance (50.0%).
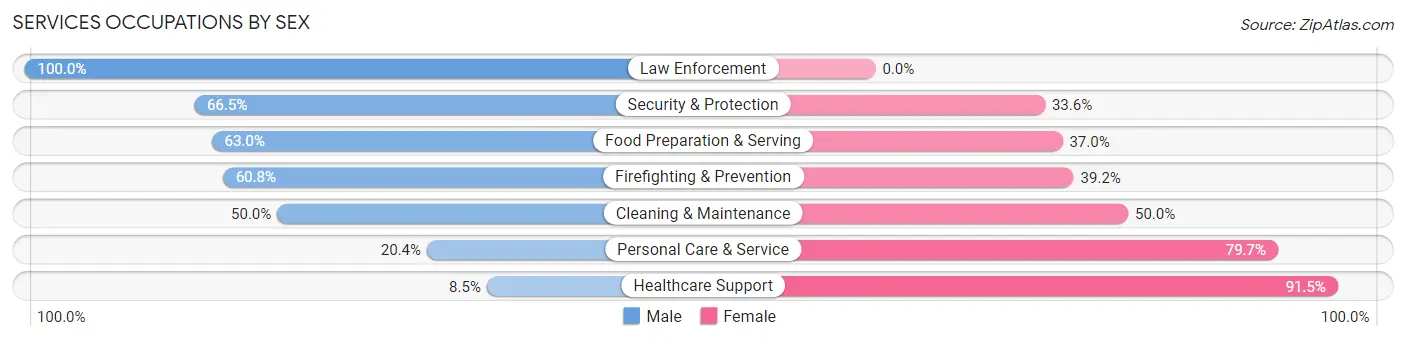
| Occupation | Male | Female |
| Healthcare Support | 31 (8.5%) | 334 (91.5%) |
| Security & Protection | 101 (66.4%) | 51 (33.6%) |
| Firefighting & Prevention | 79 (60.8%) | 51 (39.2%) |
| Law Enforcement | 22 (100.0%) | 0 (0.0%) |
| Food Preparation & Serving | 456 (63.0%) | 268 (37.0%) |
| Cleaning & Maintenance | 133 (50.0%) | 133 (50.0%) |
| Personal Care & Service | 106 (20.3%) | 415 (79.6%) |
| Total (Category) | 827 (40.8%) | 1,201 (59.2%) |
| Total (Overall) | 12,238 (53.5%) | 10,638 (46.5%) |
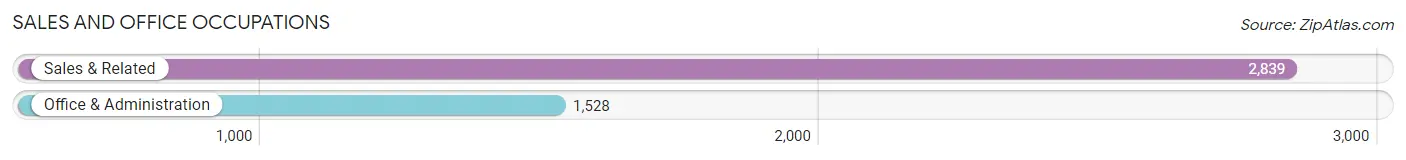
Sales and Office Occupations
The most common Sales and Office occupations in Glenview are Sales & Related (2,839 | 12.4%), and Office & Administration (1,528 | 6.7%).
Sales and Office Occupations by Sex
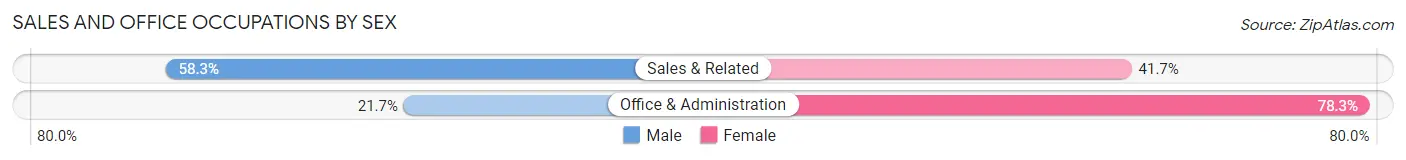
| Occupation | Male | Female |
| Sales & Related | 1,655 (58.3%) | 1,184 (41.7%) |
| Office & Administration | 331 (21.7%) | 1,197 (78.3%) |
| Total (Category) | 1,986 (45.5%) | 2,381 (54.5%) |
| Total (Overall) | 12,238 (53.5%) | 10,638 (46.5%) |
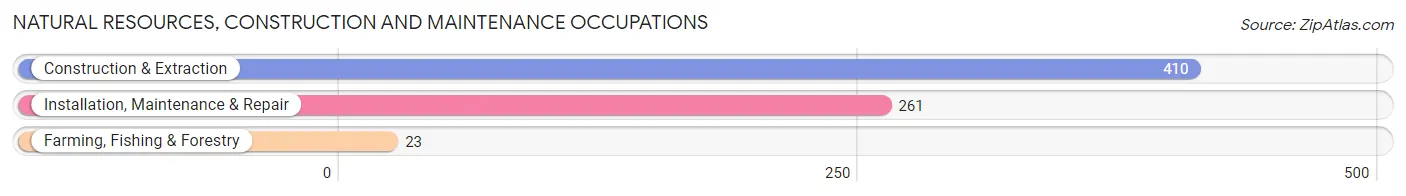
Natural Resources, Construction and Maintenance Occupations
The most common Natural Resources, Construction and Maintenance occupations in Glenview are Construction & Extraction (410 | 1.8%), Installation, Maintenance & Repair (261 | 1.1%), and Farming, Fishing & Forestry (23 | 0.1%).
Natural Resources, Construction and Maintenance Occupations by Sex
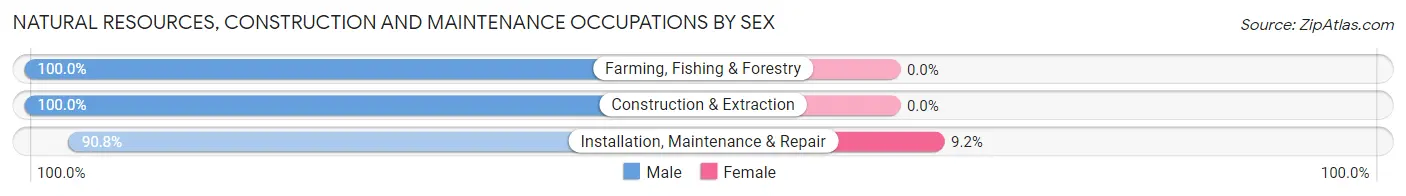
| Occupation | Male | Female |
| Farming, Fishing & Forestry | 23 (100.0%) | 0 (0.0%) |
| Construction & Extraction | 410 (100.0%) | 0 (0.0%) |
| Installation, Maintenance & Repair | 237 (90.8%) | 24 (9.2%) |
| Total (Category) | 670 (96.5%) | 24 (3.5%) |
| Total (Overall) | 12,238 (53.5%) | 10,638 (46.5%) |
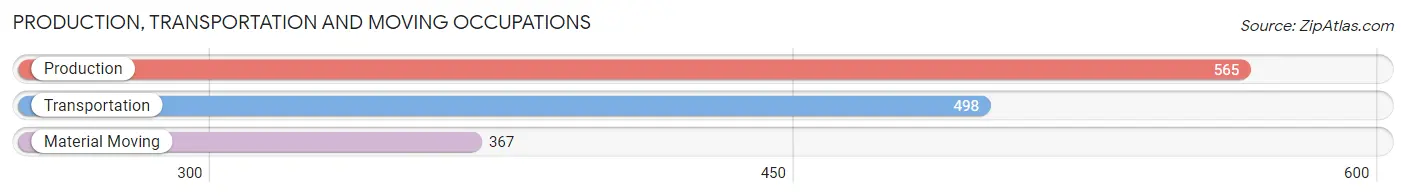
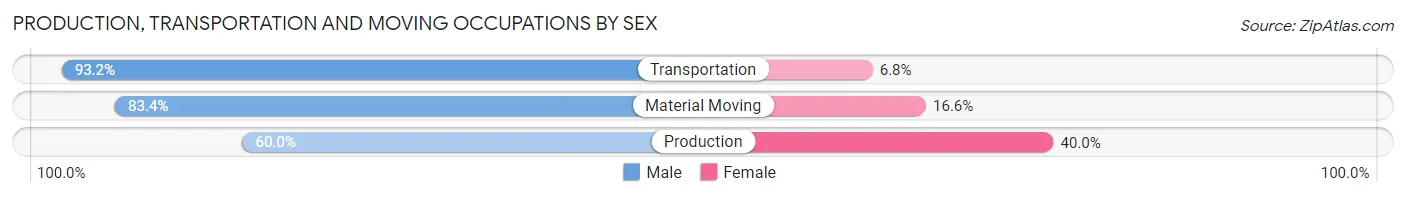
Production, Transportation and Moving Occupations
The most common Production, Transportation and Moving occupations in Glenview are Production (565 | 2.5%), Transportation (498 | 2.2%), and Material Moving (367 | 1.6%).
Production, Transportation and Moving Occupations by Sex
| Occupation | Male | Female |
| Production | 339 (60.0%) | 226 (40.0%) |
| Transportation | 464 (93.2%) | 34 (6.8%) |
| Material Moving | 306 (83.4%) | 61 (16.6%) |
| Total (Category) | 1,109 (77.5%) | 321 (22.5%) |
| Total (Overall) | 12,238 (53.5%) | 10,638 (46.5%) |
Employment Industries by Sex in Glenview
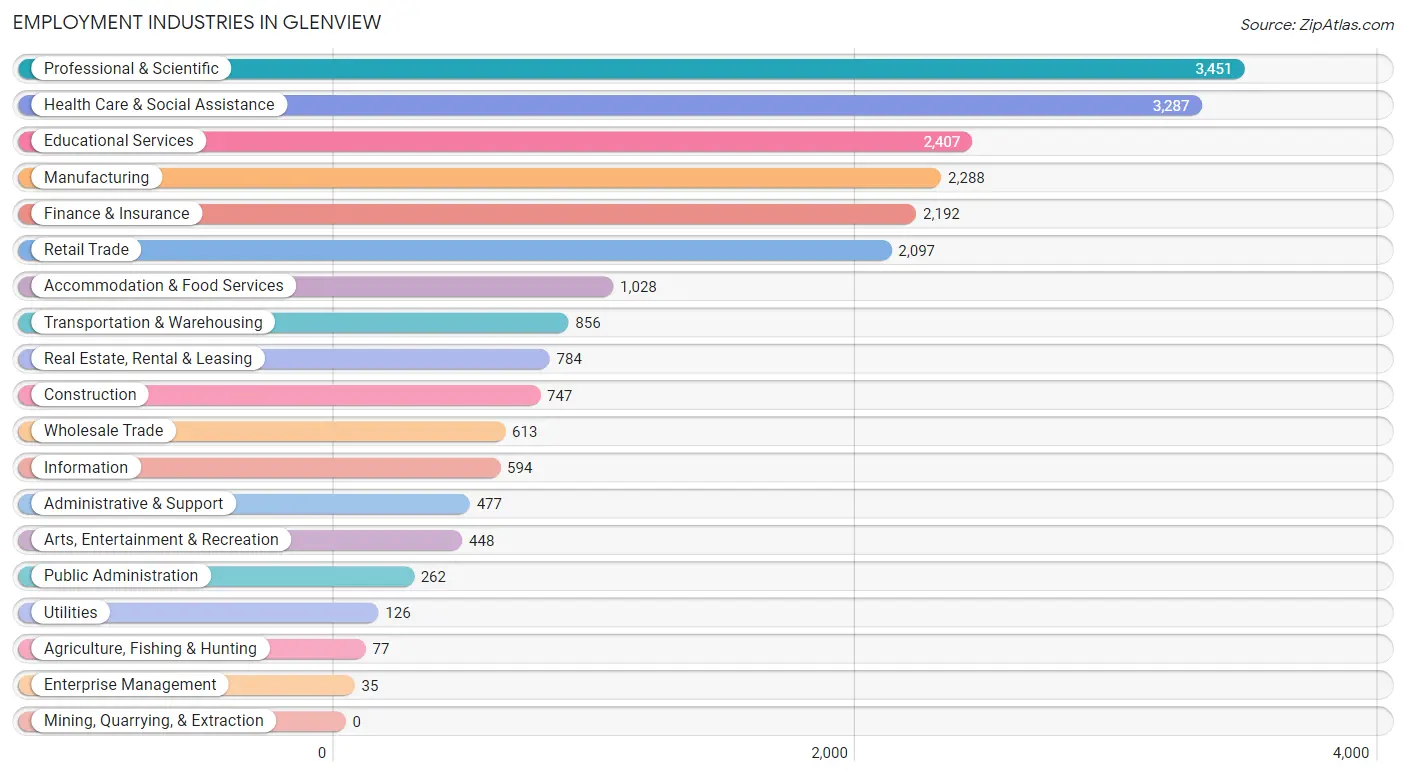
Employment Industries in Glenview
The major employment industries in Glenview include Professional & Scientific (3,451 | 15.1%), Health Care & Social Assistance (3,287 | 14.4%), Educational Services (2,407 | 10.5%), Manufacturing (2,288 | 10.0%), and Finance & Insurance (2,192 | 9.6%).
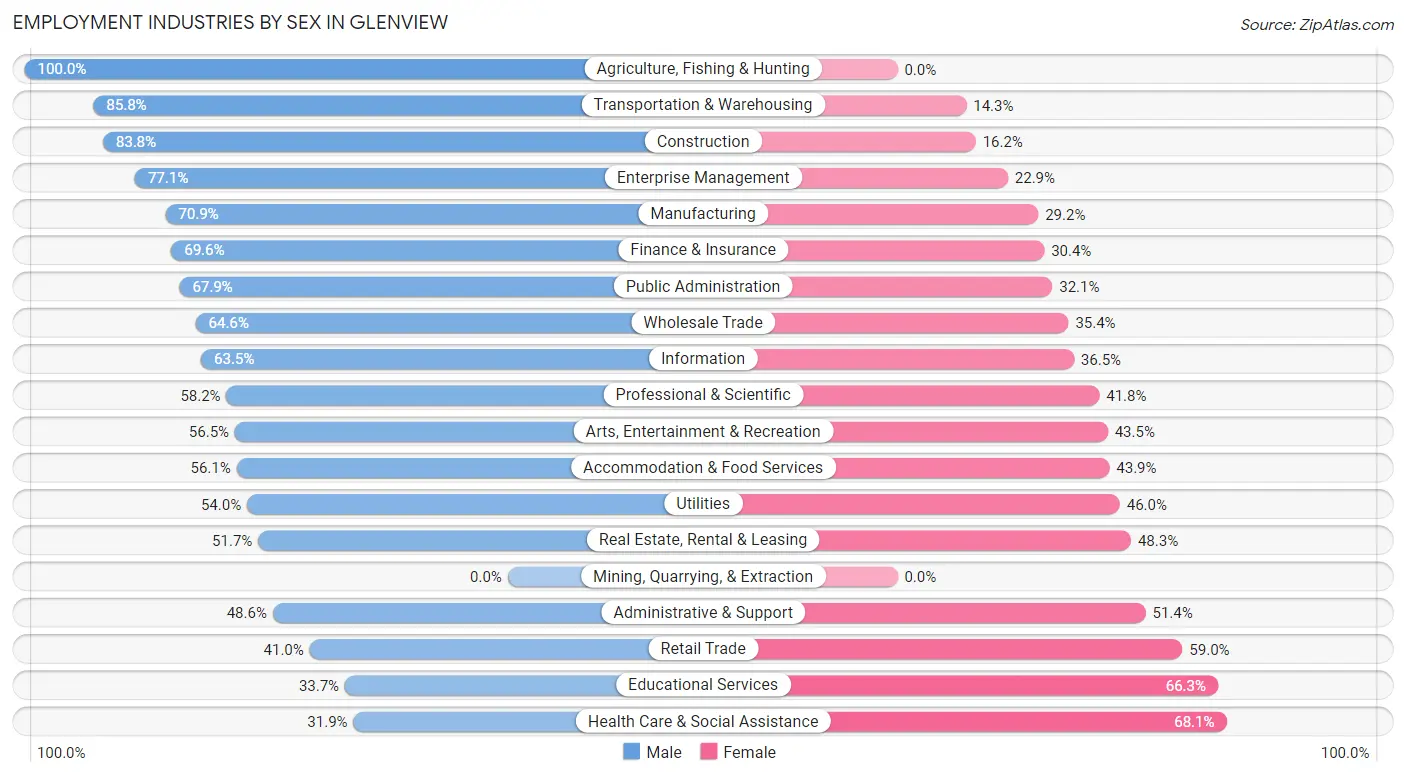
Employment Industries by Sex in Glenview
The Glenview industries that see more men than women are Agriculture, Fishing & Hunting (100.0%), Transportation & Warehousing (85.8%), and Construction (83.8%), whereas the industries that tend to have a higher number of women are Health Care & Social Assistance (68.1%), Educational Services (66.3%), and Retail Trade (59.0%).
| Industry | Male | Female |
| Agriculture, Fishing & Hunting | 77 (100.0%) | 0 (0.0%) |
| Mining, Quarrying, & Extraction | 0 (0.0%) | 0 (0.0%) |
| Construction | 626 (83.8%) | 121 (16.2%) |
| Manufacturing | 1,621 (70.9%) | 667 (29.1%) |
| Wholesale Trade | 396 (64.6%) | 217 (35.4%) |
| Retail Trade | 860 (41.0%) | 1,237 (59.0%) |
| Transportation & Warehousing | 734 (85.8%) | 122 (14.2%) |
| Utilities | 68 (54.0%) | 58 (46.0%) |
| Information | 377 (63.5%) | 217 (36.5%) |
| Finance & Insurance | 1,526 (69.6%) | 666 (30.4%) |
| Real Estate, Rental & Leasing | 405 (51.7%) | 379 (48.3%) |
| Professional & Scientific | 2,009 (58.2%) | 1,442 (41.8%) |
| Enterprise Management | 27 (77.1%) | 8 (22.9%) |
| Administrative & Support | 232 (48.6%) | 245 (51.4%) |
| Educational Services | 811 (33.7%) | 1,596 (66.3%) |
| Health Care & Social Assistance | 1,050 (31.9%) | 2,237 (68.1%) |
| Arts, Entertainment & Recreation | 253 (56.5%) | 195 (43.5%) |
| Accommodation & Food Services | 577 (56.1%) | 451 (43.9%) |
| Public Administration | 178 (67.9%) | 84 (32.1%) |
| Total | 12,238 (53.5%) | 10,638 (46.5%) |
Education in Glenview
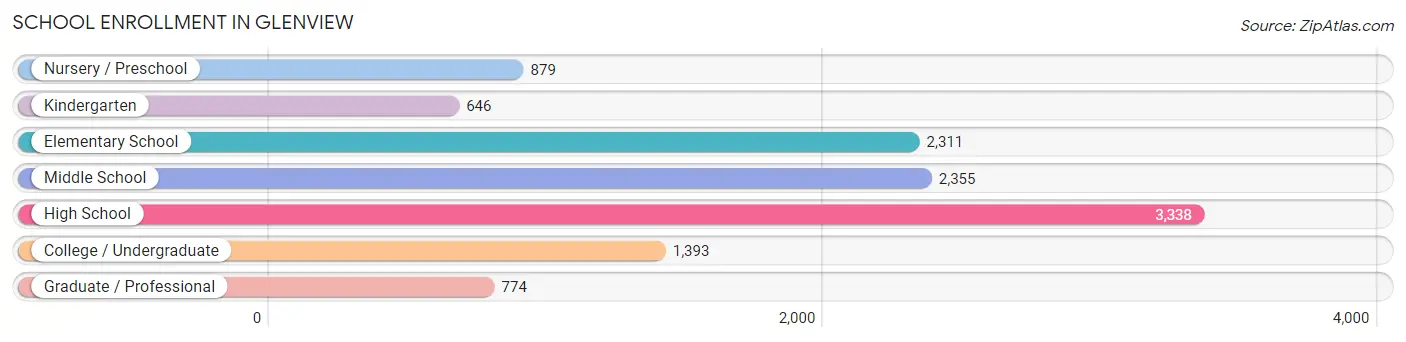
School Enrollment in Glenview
The most common levels of schooling among the 11,696 students in Glenview are high school (3,338 | 28.5%), middle school (2,355 | 20.1%), and elementary school (2,311 | 19.8%).
| School Level | # Students | % Students |
| Nursery / Preschool | 879 | 7.5% |
| Kindergarten | 646 | 5.5% |
| Elementary School | 2,311 | 19.8% |
| Middle School | 2,355 | 20.1% |
| High School | 3,338 | 28.5% |
| College / Undergraduate | 1,393 | 11.9% |
| Graduate / Professional | 774 | 6.6% |
| Total | 11,696 | 100.0% |
School Enrollment by Age by Funding Source in Glenview
Out of a total of 11,696 students who are enrolled in schools in Glenview, 2,526 (21.6%) attend a private institution, while the remaining 9,170 (78.4%) are enrolled in public schools. The age group of 3 to 4 year olds has the highest likelihood of being enrolled in private schools, with 490 (69.3% in the age bracket) enrolled. Conversely, the age group of 15 to 17 year olds has the lowest likelihood of being enrolled in a private school, with 2,255 (91.9% in the age bracket) attending a public institution.
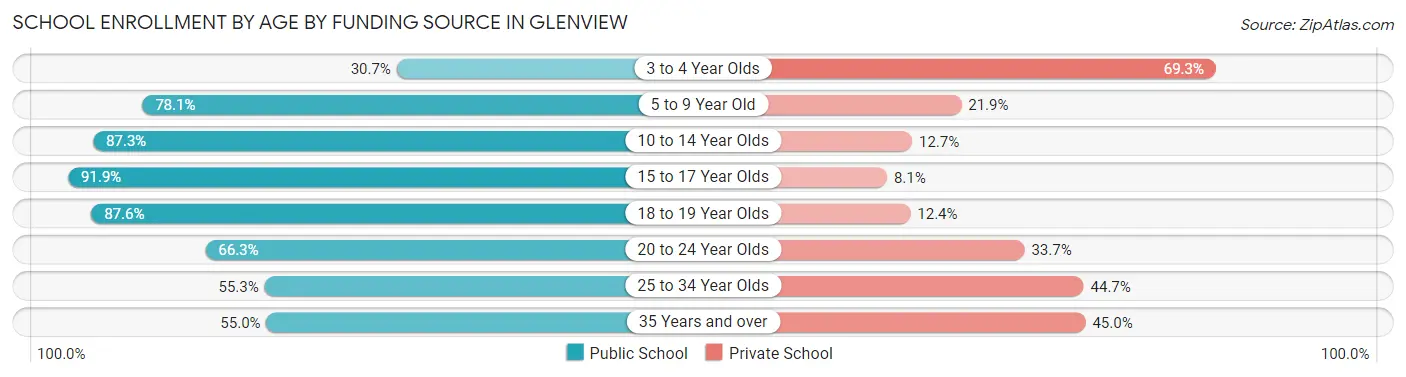
| Age Bracket | Public School | Private School |
| 3 to 4 Year Olds | 217 (30.7%) | 490 (69.3%) |
| 5 to 9 Year Old | 2,149 (78.1%) | 603 (21.9%) |
| 10 to 14 Year Olds | 2,713 (87.3%) | 396 (12.7%) |
| 15 to 17 Year Olds | 2,255 (91.9%) | 198 (8.1%) |
| 18 to 19 Year Olds | 712 (87.6%) | 101 (12.4%) |
| 20 to 24 Year Olds | 579 (66.3%) | 294 (33.7%) |
| 25 to 34 Year Olds | 229 (55.3%) | 185 (44.7%) |
| 35 Years and over | 316 (55.0%) | 259 (45.0%) |
| Total | 9,170 (78.4%) | 2,526 (21.6%) |
Educational Attainment by Field of Study in Glenview
Business (5,736 | 22.4%), education (2,317 | 9.0%), science & technology (2,308 | 9.0%), social sciences (2,189 | 8.6%), and engineering (1,892 | 7.4%) are the most common fields of study among 25,604 individuals in Glenview who have obtained a bachelor's degree or higher.
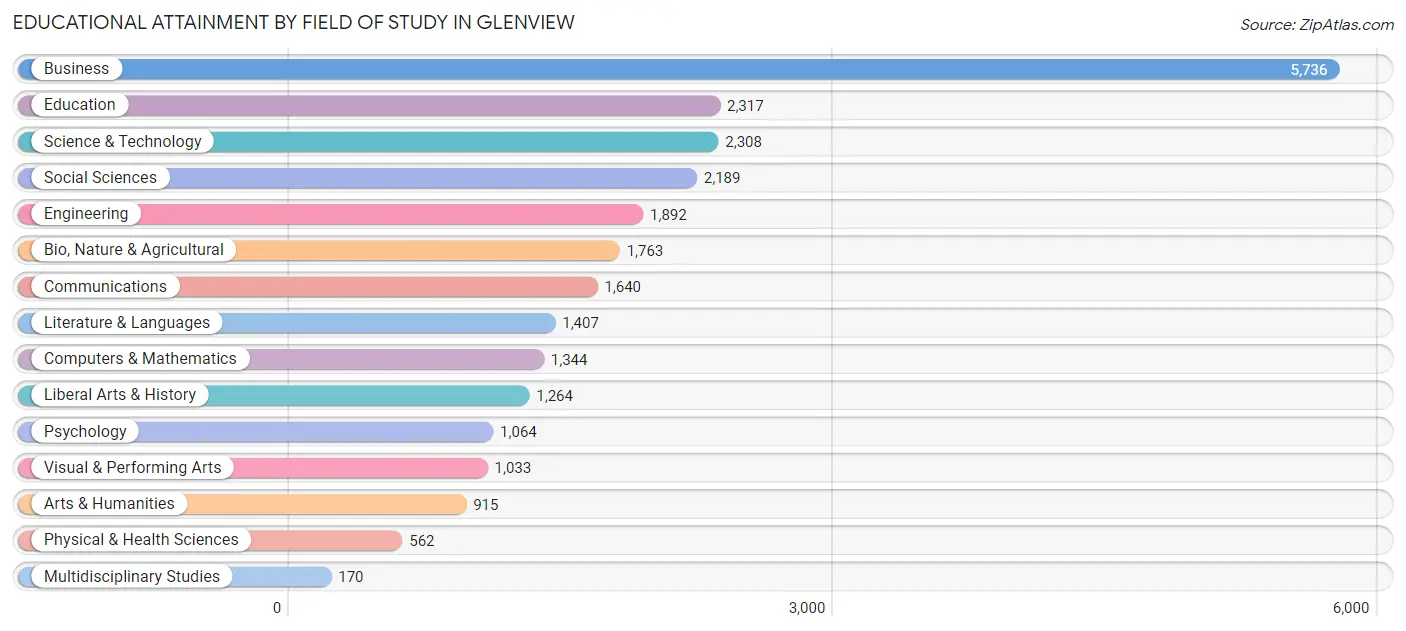
| Field of Study | # Graduates | % Graduates |
| Computers & Mathematics | 1,344 | 5.2% |
| Bio, Nature & Agricultural | 1,763 | 6.9% |
| Physical & Health Sciences | 562 | 2.2% |
| Psychology | 1,064 | 4.2% |
| Social Sciences | 2,189 | 8.6% |
| Engineering | 1,892 | 7.4% |
| Multidisciplinary Studies | 170 | 0.7% |
| Science & Technology | 2,308 | 9.0% |
| Business | 5,736 | 22.4% |
| Education | 2,317 | 9.0% |
| Literature & Languages | 1,407 | 5.5% |
| Liberal Arts & History | 1,264 | 4.9% |
| Visual & Performing Arts | 1,033 | 4.0% |
| Communications | 1,640 | 6.4% |
| Arts & Humanities | 915 | 3.6% |
| Total | 25,604 | 100.0% |
Transportation & Commute in Glenview
Vehicle Availability by Sex in Glenview
The most prevalent vehicle ownership categories in Glenview are males with 2 vehicles (7,235, accounting for 59.4%) and females with 2 vehicles (5,889, making up 69.4%).
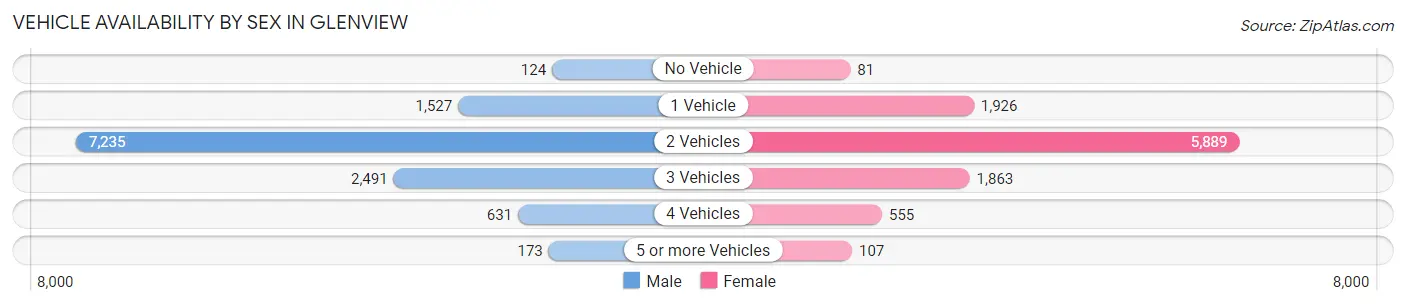
| Vehicles Available | Male | Female |
| No Vehicle | 124 (1.0%) | 81 (0.8%) |
| 1 Vehicle | 1,527 (12.5%) | 1,926 (18.5%) |
| 2 Vehicles | 7,235 (59.4%) | 5,889 (56.5%) |
| 3 Vehicles | 2,491 (20.4%) | 1,863 (17.9%) |
| 4 Vehicles | 631 (5.2%) | 555 (5.3%) |
| 5 or more Vehicles | 173 (1.4%) | 107 (1.0%) |
| Total | 12,181 (100.0%) | 10,421 (100.0%) |
Commute Time in Glenview
The most frequently occuring commute durations in Glenview are 30 to 34 minutes (2,419 commuters, 13.1%), 20 to 24 minutes (2,275 commuters, 12.3%), and 15 to 19 minutes (2,195 commuters, 11.9%).
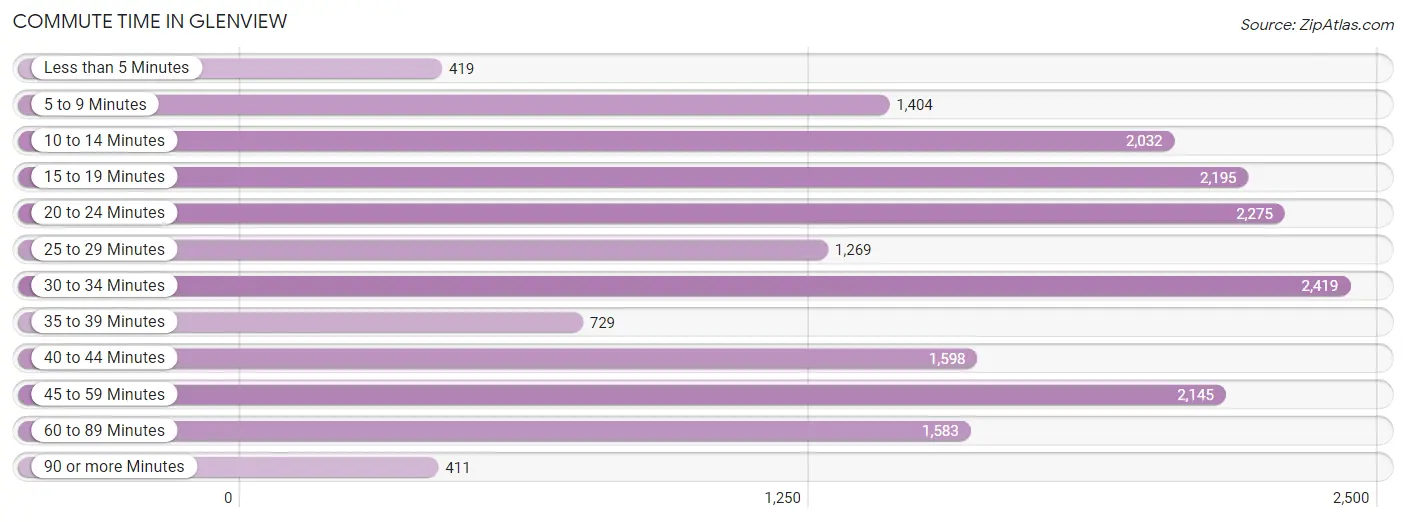
| Commute Time | # Commuters | % Commuters |
| Less than 5 Minutes | 419 | 2.3% |
| 5 to 9 Minutes | 1,404 | 7.6% |
| 10 to 14 Minutes | 2,032 | 11.0% |
| 15 to 19 Minutes | 2,195 | 11.9% |
| 20 to 24 Minutes | 2,275 | 12.3% |
| 25 to 29 Minutes | 1,269 | 6.9% |
| 30 to 34 Minutes | 2,419 | 13.1% |
| 35 to 39 Minutes | 729 | 4.0% |
| 40 to 44 Minutes | 1,598 | 8.6% |
| 45 to 59 Minutes | 2,145 | 11.6% |
| 60 to 89 Minutes | 1,583 | 8.6% |
| 90 or more Minutes | 411 | 2.2% |
Commute Time by Sex in Glenview
The most common commute times in Glenview are 30 to 34 minutes (1,432 commuters, 14.3%) for males and 15 to 19 minutes (1,276 commuters, 15.0%) for females.
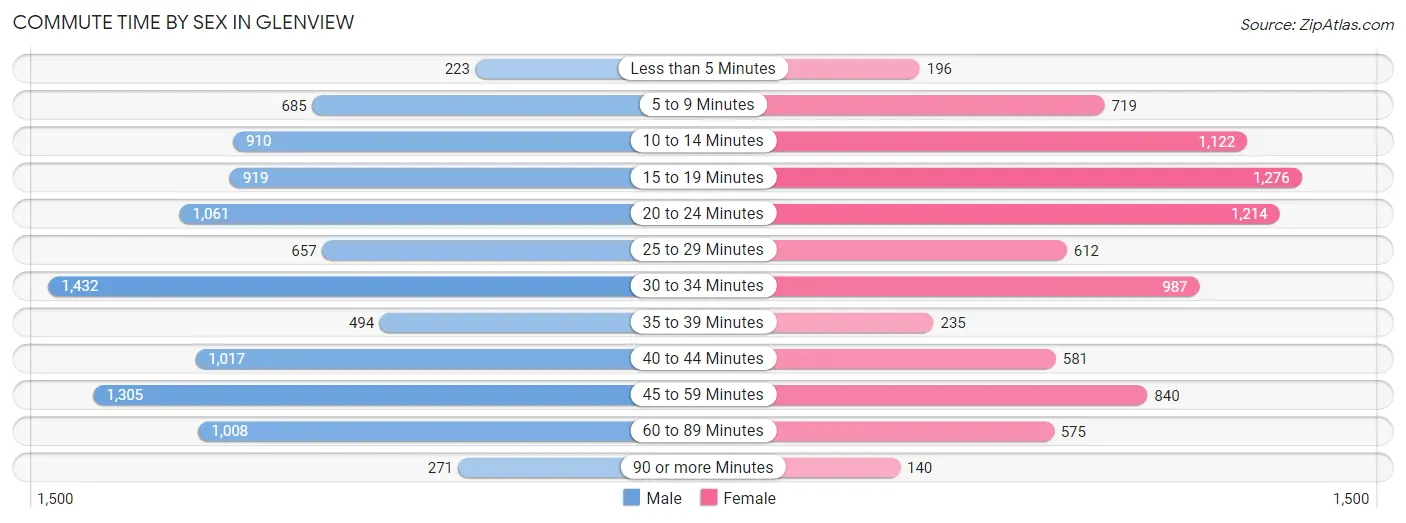
| Commute Time | Male | Female |
| Less than 5 Minutes | 223 (2.2%) | 196 (2.3%) |
| 5 to 9 Minutes | 685 (6.9%) | 719 (8.5%) |
| 10 to 14 Minutes | 910 (9.1%) | 1,122 (13.2%) |
| 15 to 19 Minutes | 919 (9.2%) | 1,276 (15.0%) |
| 20 to 24 Minutes | 1,061 (10.6%) | 1,214 (14.3%) |
| 25 to 29 Minutes | 657 (6.6%) | 612 (7.2%) |
| 30 to 34 Minutes | 1,432 (14.3%) | 987 (11.6%) |
| 35 to 39 Minutes | 494 (5.0%) | 235 (2.8%) |
| 40 to 44 Minutes | 1,017 (10.2%) | 581 (6.8%) |
| 45 to 59 Minutes | 1,305 (13.1%) | 840 (9.9%) |
| 60 to 89 Minutes | 1,008 (10.1%) | 575 (6.8%) |
| 90 or more Minutes | 271 (2.7%) | 140 (1.7%) |
Time of Departure to Work by Sex in Glenview
The most frequent times of departure to work in Glenview are 7:00 AM to 7:29 AM (1,831, 18.3%) for males and 7:30 AM to 7:59 AM (1,568, 18.4%) for females.
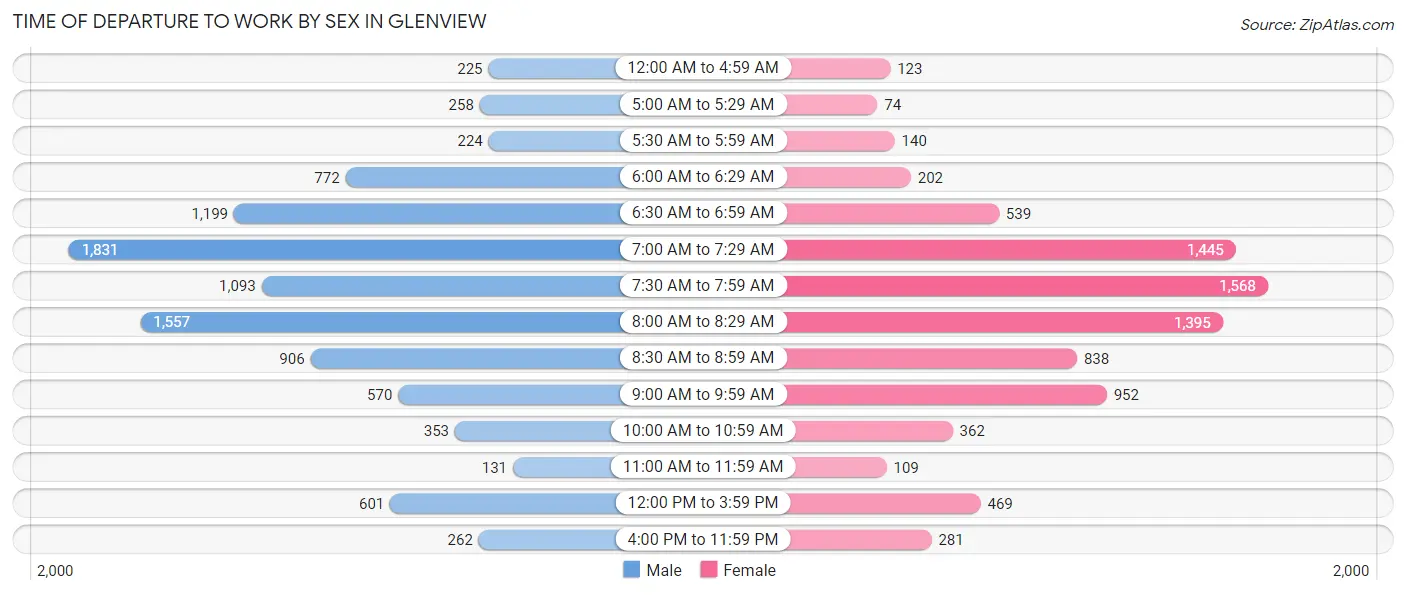
| Time of Departure | Male | Female |
| 12:00 AM to 4:59 AM | 225 (2.2%) | 123 (1.5%) |
| 5:00 AM to 5:29 AM | 258 (2.6%) | 74 (0.9%) |
| 5:30 AM to 5:59 AM | 224 (2.2%) | 140 (1.7%) |
| 6:00 AM to 6:29 AM | 772 (7.7%) | 202 (2.4%) |
| 6:30 AM to 6:59 AM | 1,199 (12.0%) | 539 (6.3%) |
| 7:00 AM to 7:29 AM | 1,831 (18.3%) | 1,445 (17.0%) |
| 7:30 AM to 7:59 AM | 1,093 (11.0%) | 1,568 (18.4%) |
| 8:00 AM to 8:29 AM | 1,557 (15.6%) | 1,395 (16.4%) |
| 8:30 AM to 8:59 AM | 906 (9.1%) | 838 (9.9%) |
| 9:00 AM to 9:59 AM | 570 (5.7%) | 952 (11.2%) |
| 10:00 AM to 10:59 AM | 353 (3.5%) | 362 (4.3%) |
| 11:00 AM to 11:59 AM | 131 (1.3%) | 109 (1.3%) |
| 12:00 PM to 3:59 PM | 601 (6.0%) | 469 (5.5%) |
| 4:00 PM to 11:59 PM | 262 (2.6%) | 281 (3.3%) |
| Total | 9,982 (100.0%) | 8,497 (100.0%) |
Housing Occupancy in Glenview
Occupancy by Ownership in Glenview
Of the total 18,451 dwellings in Glenview, owner-occupied units account for 14,364 (77.8%), while renter-occupied units make up 4,087 (22.2%).
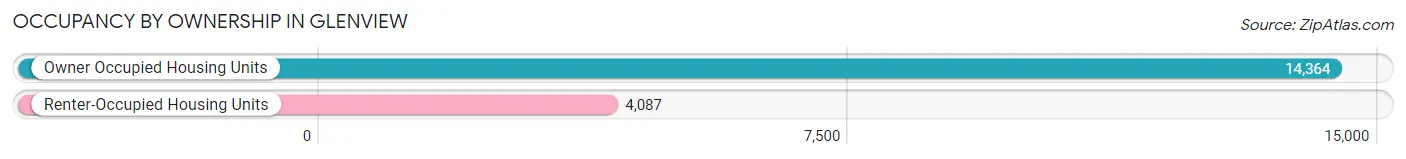
| Occupancy | # Housing Units | % Housing Units |
| Owner Occupied Housing Units | 14,364 | 77.8% |
| Renter-Occupied Housing Units | 4,087 | 22.2% |
| Total Occupied Housing Units | 18,451 | 100.0% |
Occupancy by Household Size in Glenview
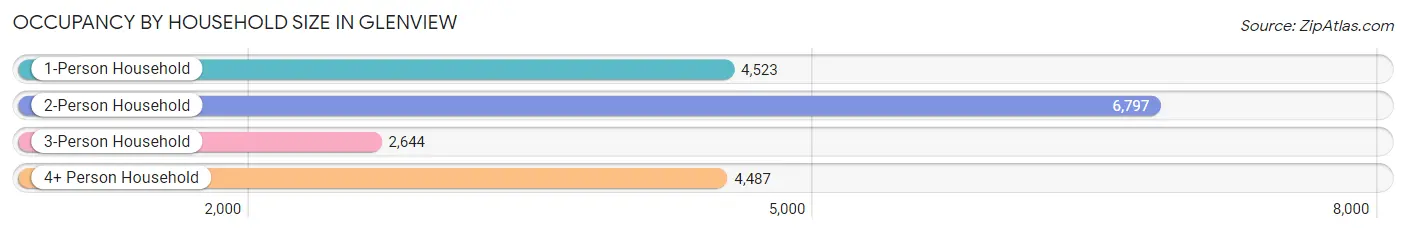
| Household Size | # Housing Units | % Housing Units |
| 1-Person Household | 4,523 | 24.5% |
| 2-Person Household | 6,797 | 36.8% |
| 3-Person Household | 2,644 | 14.3% |
| 4+ Person Household | 4,487 | 24.3% |
| Total Housing Units | 18,451 | 100.0% |
Occupancy by Ownership by Household Size in Glenview
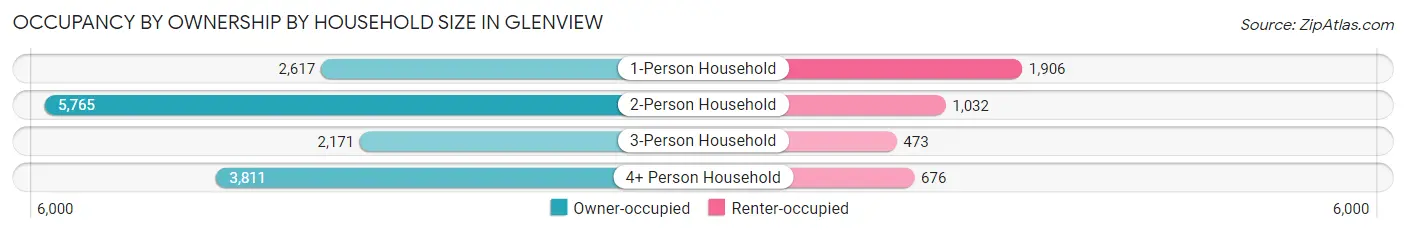
| Household Size | Owner-occupied | Renter-occupied |
| 1-Person Household | 2,617 (57.9%) | 1,906 (42.1%) |
| 2-Person Household | 5,765 (84.8%) | 1,032 (15.2%) |
| 3-Person Household | 2,171 (82.1%) | 473 (17.9%) |
| 4+ Person Household | 3,811 (84.9%) | 676 (15.1%) |
| Total Housing Units | 14,364 (77.8%) | 4,087 (22.2%) |
Occupancy by Educational Attainment in Glenview
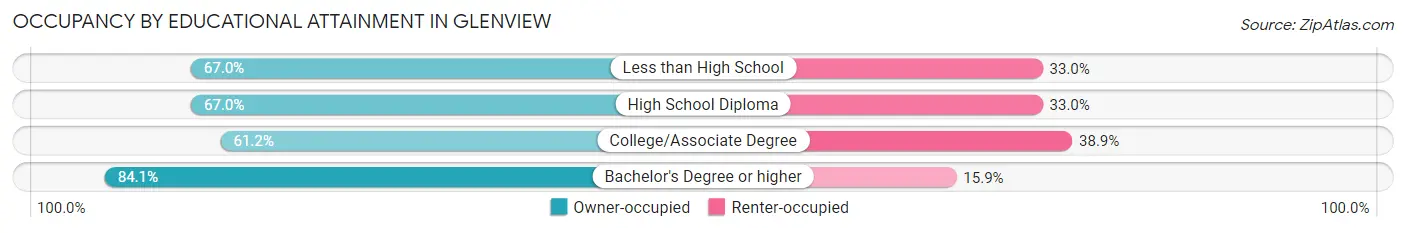
| Household Size | Owner-occupied | Renter-occupied |
| Less than High School | 313 (67.0%) | 154 (33.0%) |
| High School Diploma | 997 (67.0%) | 491 (33.0%) |
| College/Associate Degree | 2,180 (61.2%) | 1,385 (38.9%) |
| Bachelor's Degree or higher | 10,874 (84.1%) | 2,057 (15.9%) |
Occupancy by Age of Householder in Glenview
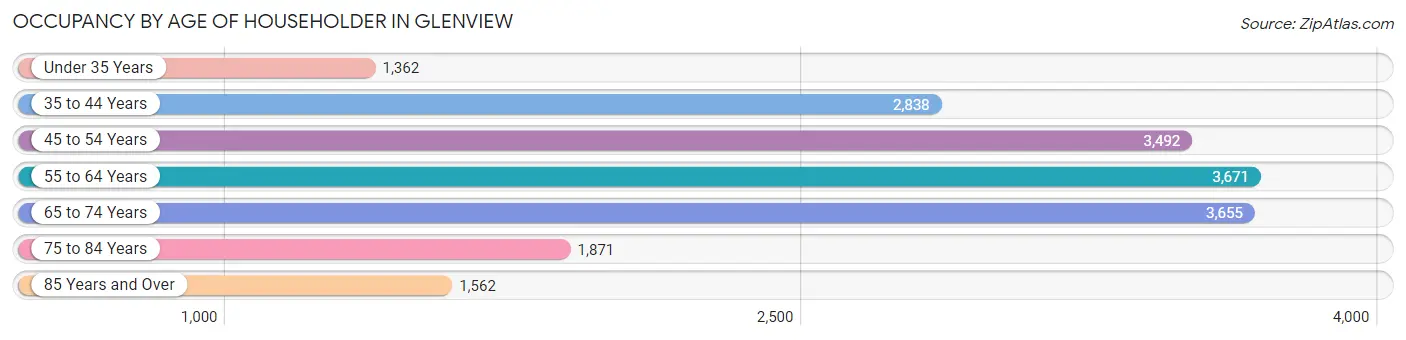
| Age Bracket | # Households | % Households |
| Under 35 Years | 1,362 | 7.4% |
| 35 to 44 Years | 2,838 | 15.4% |
| 45 to 54 Years | 3,492 | 18.9% |
| 55 to 64 Years | 3,671 | 19.9% |
| 65 to 74 Years | 3,655 | 19.8% |
| 75 to 84 Years | 1,871 | 10.1% |
| 85 Years and Over | 1,562 | 8.5% |
| Total | 18,451 | 100.0% |
Housing Finances in Glenview
Median Income by Occupancy in Glenview
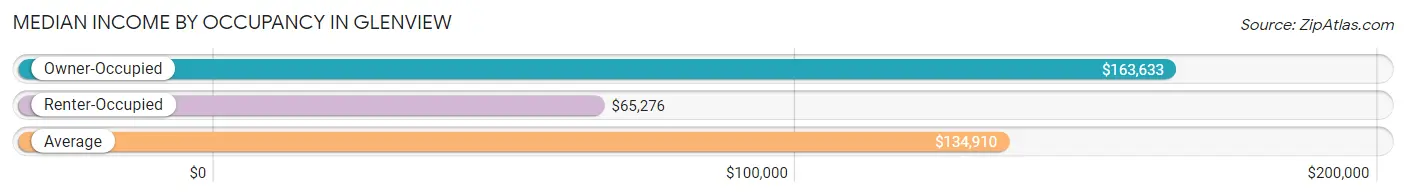
| Occupancy Type | # Households | Median Income |
| Owner-Occupied | 14,364 (77.8%) | $163,633 |
| Renter-Occupied | 4,087 (22.2%) | $65,276 |
| Average | 18,451 (100.0%) | $134,910 |
Occupancy by Householder Income Bracket in Glenview
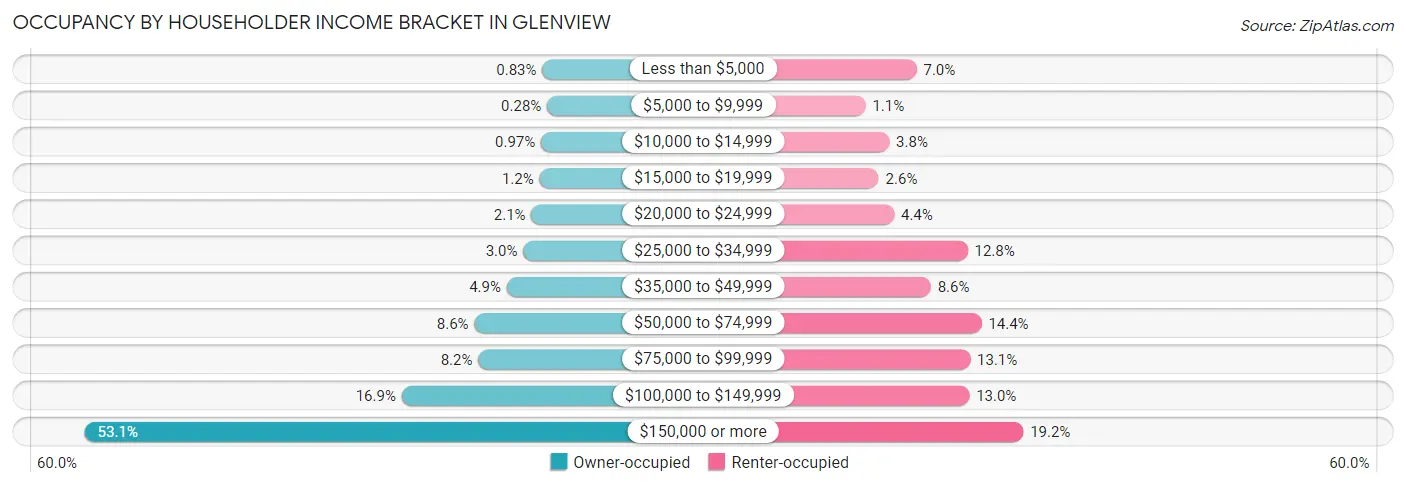
| Income Bracket | Owner-occupied | Renter-occupied |
| Less than $5,000 | 119 (0.8%) | 285 (7.0%) |
| $5,000 to $9,999 | 40 (0.3%) | 46 (1.1%) |
| $10,000 to $14,999 | 140 (1.0%) | 157 (3.8%) |
| $15,000 to $19,999 | 165 (1.1%) | 108 (2.6%) |
| $20,000 to $24,999 | 299 (2.1%) | 180 (4.4%) |
| $25,000 to $34,999 | 433 (3.0%) | 523 (12.8%) |
| $35,000 to $49,999 | 703 (4.9%) | 351 (8.6%) |
| $50,000 to $74,999 | 1,234 (8.6%) | 588 (14.4%) |
| $75,000 to $99,999 | 1,171 (8.2%) | 535 (13.1%) |
| $100,000 to $149,999 | 2,428 (16.9%) | 531 (13.0%) |
| $150,000 or more | 7,632 (53.1%) | 783 (19.2%) |
| Total | 14,364 (100.0%) | 4,087 (100.0%) |
Monthly Housing Cost Tiers in Glenview
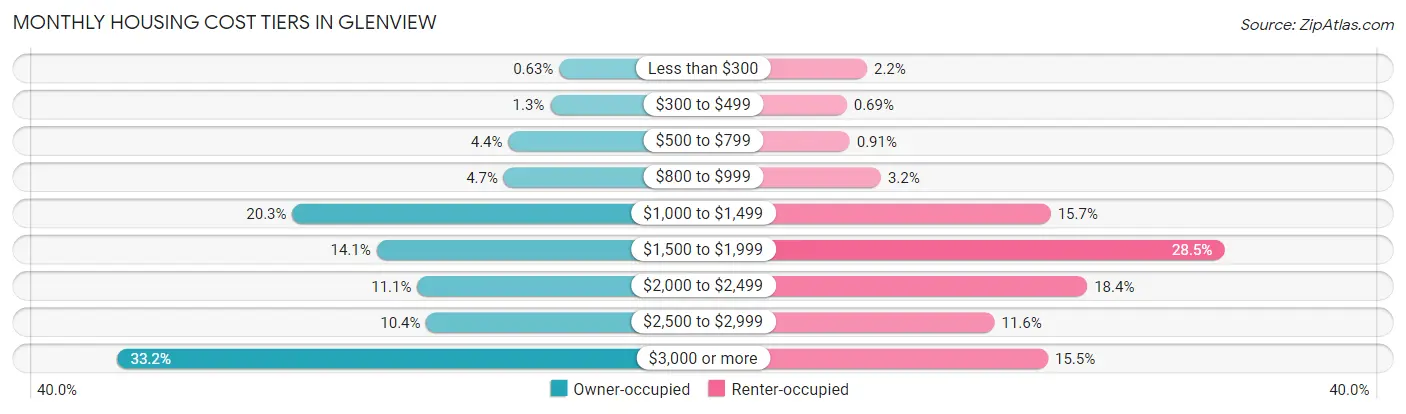
| Monthly Cost | Owner-occupied | Renter-occupied |
| Less than $300 | 91 (0.6%) | 89 (2.2%) |
| $300 to $499 | 185 (1.3%) | 28 (0.7%) |
| $500 to $799 | 628 (4.4%) | 37 (0.9%) |
| $800 to $999 | 676 (4.7%) | 131 (3.2%) |
| $1,000 to $1,499 | 2,913 (20.3%) | 642 (15.7%) |
| $1,500 to $1,999 | 2,023 (14.1%) | 1,164 (28.5%) |
| $2,000 to $2,499 | 1,591 (11.1%) | 752 (18.4%) |
| $2,500 to $2,999 | 1,496 (10.4%) | 473 (11.6%) |
| $3,000 or more | 4,761 (33.2%) | 634 (15.5%) |
| Total | 14,364 (100.0%) | 4,087 (100.0%) |
Physical Housing Characteristics in Glenview
Housing Structures in Glenview
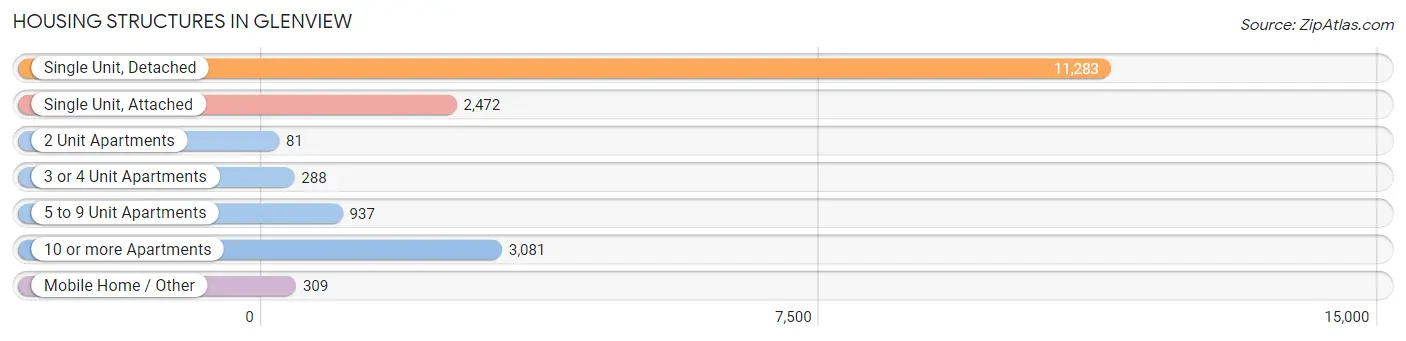
| Structure Type | # Housing Units | % Housing Units |
| Single Unit, Detached | 11,283 | 61.2% |
| Single Unit, Attached | 2,472 | 13.4% |
| 2 Unit Apartments | 81 | 0.4% |
| 3 or 4 Unit Apartments | 288 | 1.6% |
| 5 to 9 Unit Apartments | 937 | 5.1% |
| 10 or more Apartments | 3,081 | 16.7% |
| Mobile Home / Other | 309 | 1.7% |
| Total | 18,451 | 100.0% |
Housing Structures by Occupancy in Glenview
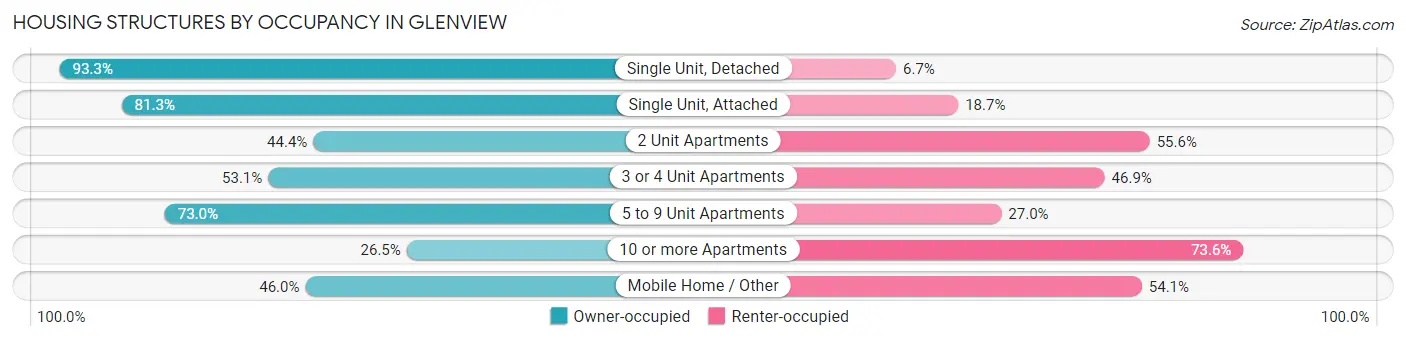
| Structure Type | Owner-occupied | Renter-occupied |
| Single Unit, Detached | 10,524 (93.3%) | 759 (6.7%) |
| Single Unit, Attached | 2,010 (81.3%) | 462 (18.7%) |
| 2 Unit Apartments | 36 (44.4%) | 45 (55.6%) |
| 3 or 4 Unit Apartments | 153 (53.1%) | 135 (46.9%) |
| 5 to 9 Unit Apartments | 684 (73.0%) | 253 (27.0%) |
| 10 or more Apartments | 815 (26.5%) | 2,266 (73.6%) |
| Mobile Home / Other | 142 (46.0%) | 167 (54.0%) |
| Total | 14,364 (77.8%) | 4,087 (22.2%) |
Housing Structures by Number of Rooms in Glenview
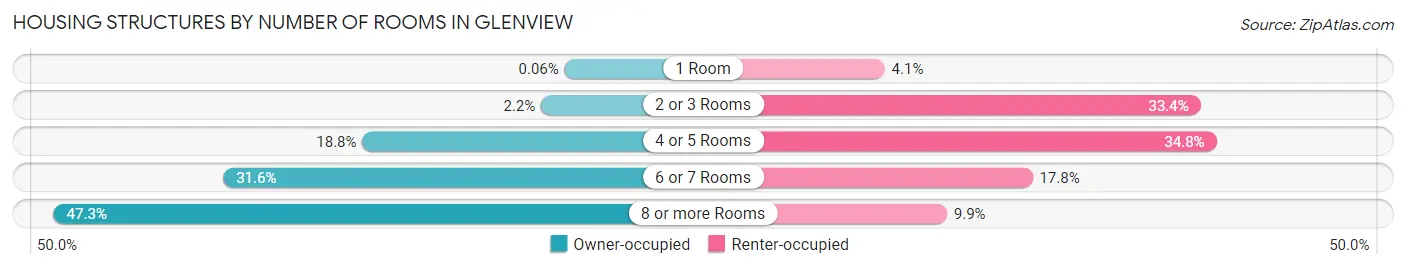
| Number of Rooms | Owner-occupied | Renter-occupied |
| 1 Room | 8 (0.1%) | 169 (4.1%) |
| 2 or 3 Rooms | 321 (2.2%) | 1,363 (33.4%) |
| 4 or 5 Rooms | 2,695 (18.8%) | 1,423 (34.8%) |
| 6 or 7 Rooms | 4,544 (31.6%) | 728 (17.8%) |
| 8 or more Rooms | 6,796 (47.3%) | 404 (9.9%) |
| Total | 14,364 (100.0%) | 4,087 (100.0%) |
Housing Structure by Heating Type in Glenview
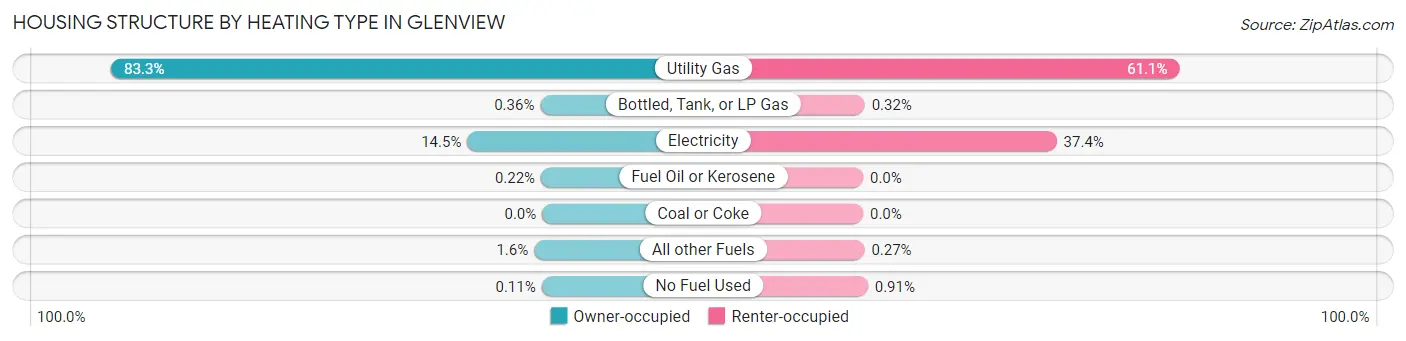
| Heating Type | Owner-occupied | Renter-occupied |
| Utility Gas | 11,964 (83.3%) | 2,497 (61.1%) |
| Bottled, Tank, or LP Gas | 52 (0.4%) | 13 (0.3%) |
| Electricity | 2,078 (14.5%) | 1,529 (37.4%) |
| Fuel Oil or Kerosene | 32 (0.2%) | 0 (0.0%) |
| Coal or Coke | 0 (0.0%) | 0 (0.0%) |
| All other Fuels | 222 (1.5%) | 11 (0.3%) |
| No Fuel Used | 16 (0.1%) | 37 (0.9%) |
| Total | 14,364 (100.0%) | 4,087 (100.0%) |
Household Vehicle Usage in Glenview
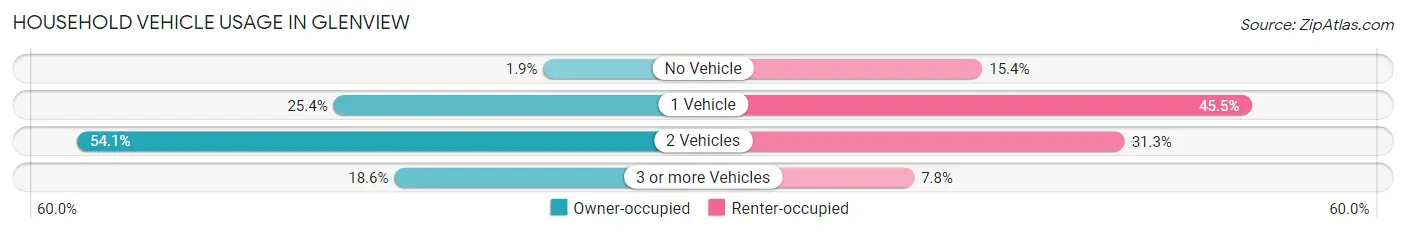
| Vehicles per Household | Owner-occupied | Renter-occupied |
| No Vehicle | 272 (1.9%) | 629 (15.4%) |
| 1 Vehicle | 3,649 (25.4%) | 1,860 (45.5%) |
| 2 Vehicles | 7,773 (54.1%) | 1,281 (31.3%) |
| 3 or more Vehicles | 2,670 (18.6%) | 317 (7.8%) |
| Total | 14,364 (100.0%) | 4,087 (100.0%) |
Real Estate & Mortgages in Glenview
Real Estate and Mortgage Overview in Glenview
| Characteristic | Without Mortgage | With Mortgage |
| Housing Units | 5,688 | 8,676 |
| Median Property Value | $575,900 | $600,900 |
| Median Household Income | $126,824 | $5,212 |
| Monthly Housing Costs | $1,319 | $4,645 |
| Real Estate Taxes | $10,001 | $76 |
Property Value by Mortgage Status in Glenview
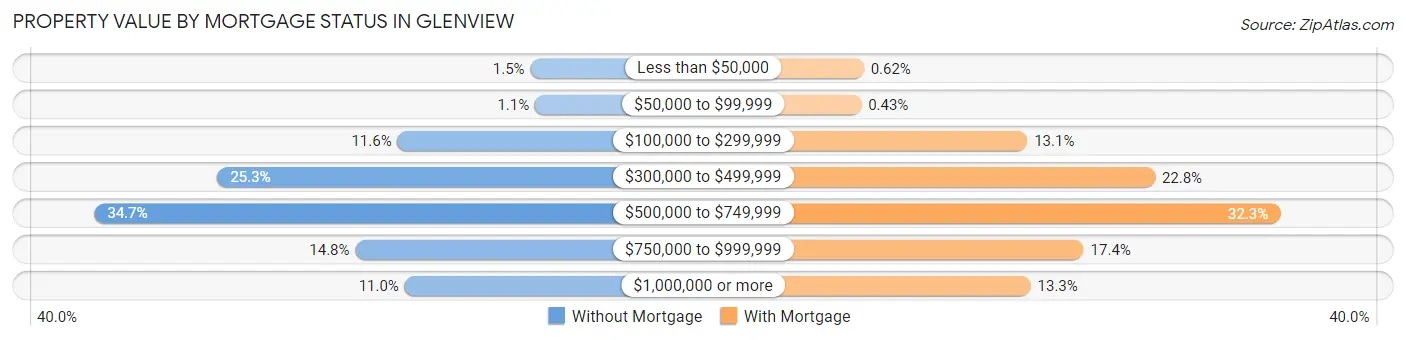
| Property Value | Without Mortgage | With Mortgage |
| Less than $50,000 | 83 (1.5%) | 54 (0.6%) |
| $50,000 to $99,999 | 63 (1.1%) | 37 (0.4%) |
| $100,000 to $299,999 | 659 (11.6%) | 1,135 (13.1%) |
| $300,000 to $499,999 | 1,440 (25.3%) | 1,979 (22.8%) |
| $500,000 to $749,999 | 1,973 (34.7%) | 2,806 (32.3%) |
| $750,000 to $999,999 | 842 (14.8%) | 1,508 (17.4%) |
| $1,000,000 or more | 628 (11.0%) | 1,157 (13.3%) |
| Total | 5,688 (100.0%) | 8,676 (100.0%) |
Household Income by Mortgage Status in Glenview
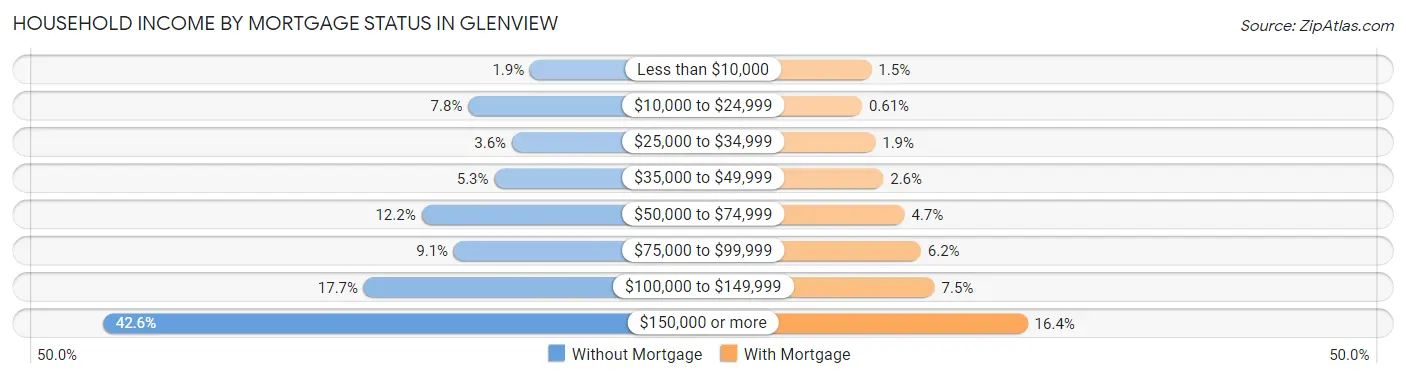
| Household Income | Without Mortgage | With Mortgage |
| Less than $10,000 | 106 (1.9%) | 131 (1.5%) |
| $10,000 to $24,999 | 441 (7.7%) | 53 (0.6%) |
| $25,000 to $34,999 | 204 (3.6%) | 163 (1.9%) |
| $35,000 to $49,999 | 299 (5.3%) | 229 (2.6%) |
| $50,000 to $74,999 | 694 (12.2%) | 404 (4.7%) |
| $75,000 to $99,999 | 518 (9.1%) | 540 (6.2%) |
| $100,000 to $149,999 | 1,006 (17.7%) | 653 (7.5%) |
| $150,000 or more | 2,420 (42.5%) | 1,422 (16.4%) |
| Total | 5,688 (100.0%) | 8,676 (100.0%) |
Property Value to Household Income Ratio in Glenview
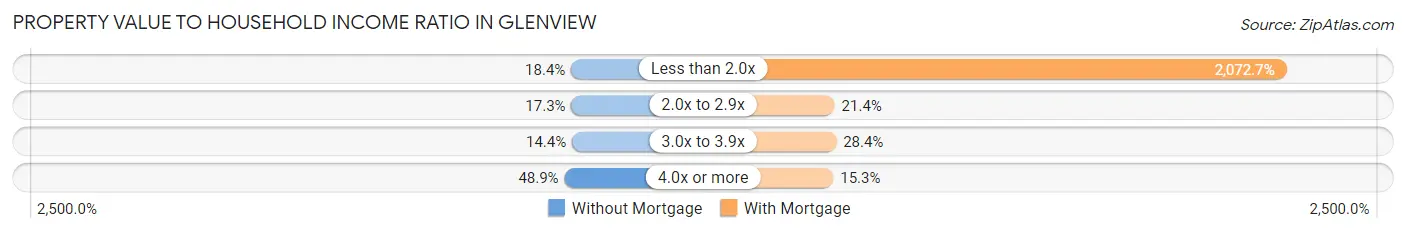
| Value-to-Income Ratio | Without Mortgage | With Mortgage |
| Less than 2.0x | 1,045 (18.4%) | 179,825 (2,072.7%) |
| 2.0x to 2.9x | 985 (17.3%) | 1,856 (21.4%) |
| 3.0x to 3.9x | 820 (14.4%) | 2,463 (28.4%) |
| 4.0x or more | 2,783 (48.9%) | 1,323 (15.2%) |
| Total | 5,688 (100.0%) | 8,676 (100.0%) |
Real Estate Taxes by Mortgage Status in Glenview
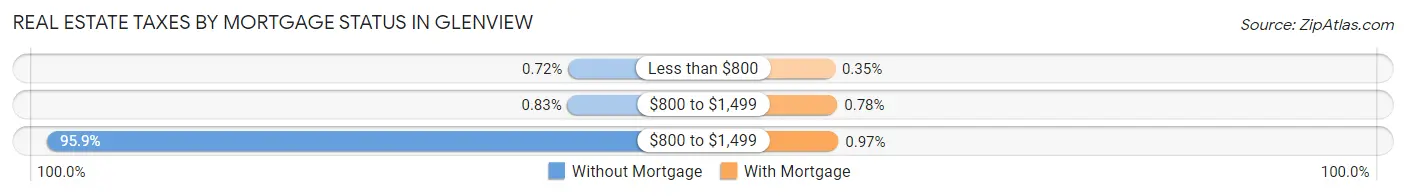
| Property Taxes | Without Mortgage | With Mortgage |
| Less than $800 | 41 (0.7%) | 30 (0.4%) |
| $800 to $1,499 | 47 (0.8%) | 68 (0.8%) |
| $800 to $1,499 | 5,453 (95.9%) | 84 (1.0%) |
| Total | 5,688 (100.0%) | 8,676 (100.0%) |
Health & Disability in Glenview
Health Insurance Coverage by Age in Glenview
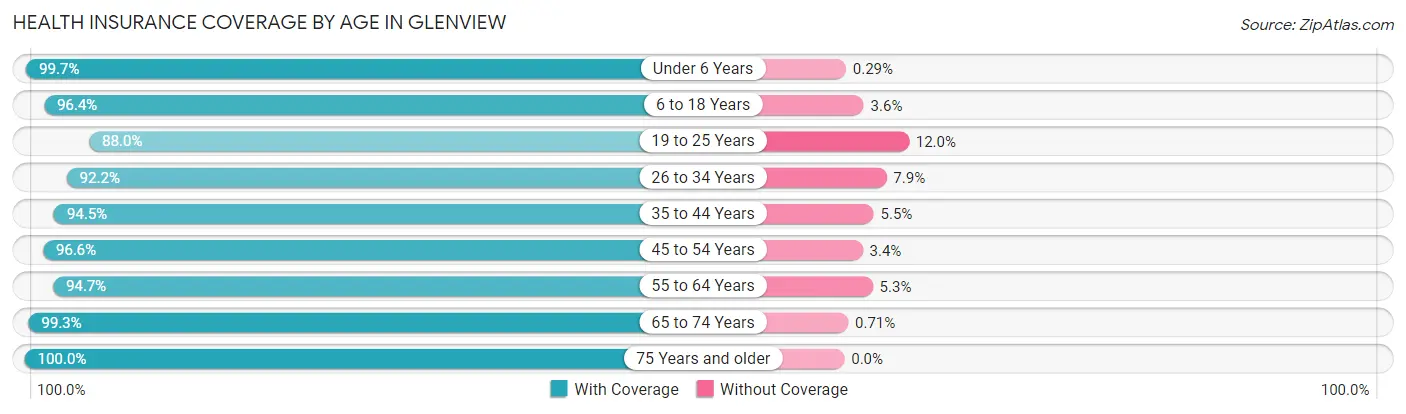
| Age Bracket | With Coverage | Without Coverage |
| Under 6 Years | 3,485 (99.7%) | 10 (0.3%) |
| 6 to 18 Years | 8,222 (96.4%) | 308 (3.6%) |
| 19 to 25 Years | 1,938 (88.0%) | 265 (12.0%) |
| 26 to 34 Years | 2,748 (92.1%) | 234 (7.9%) |
| 35 to 44 Years | 5,308 (94.5%) | 307 (5.5%) |
| 45 to 54 Years | 6,536 (96.6%) | 231 (3.4%) |
| 55 to 64 Years | 6,046 (94.7%) | 338 (5.3%) |
| 65 to 74 Years | 6,152 (99.3%) | 44 (0.7%) |
| 75 Years and older | 4,843 (100.0%) | 0 (0.0%) |
| Total | 45,278 (96.3%) | 1,737 (3.7%) |
Health Insurance Coverage by Citizenship Status in Glenview
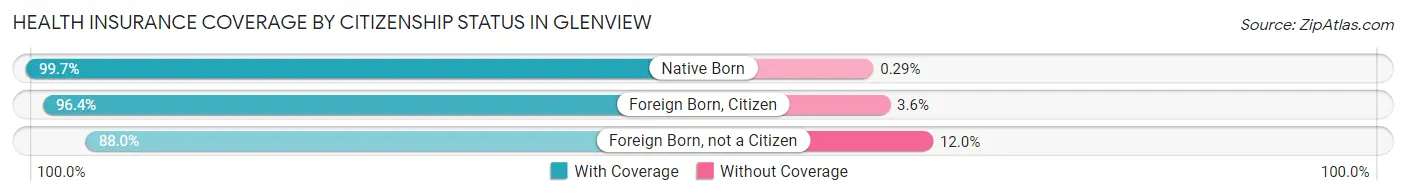
| Citizenship Status | With Coverage | Without Coverage |
| Native Born | 3,485 (99.7%) | 10 (0.3%) |
| Foreign Born, Citizen | 8,222 (96.4%) | 308 (3.6%) |
| Foreign Born, not a Citizen | 1,938 (88.0%) | 265 (12.0%) |
Health Insurance Coverage by Household Income in Glenview
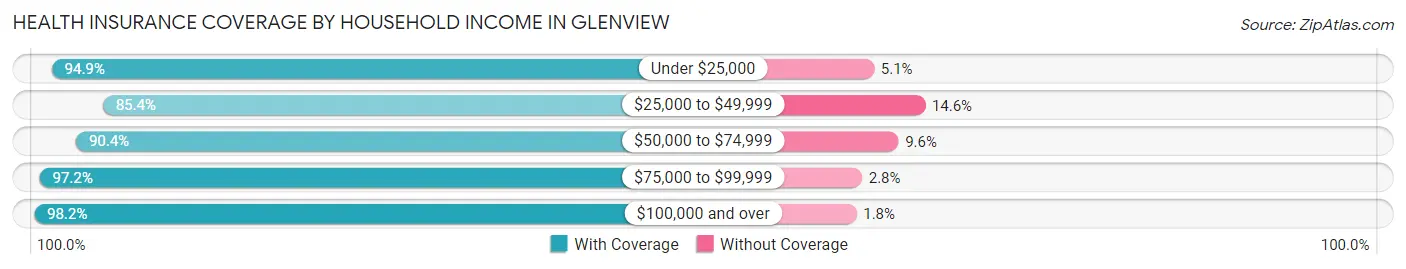
| Household Income | With Coverage | Without Coverage |
| Under $25,000 | 2,229 (94.9%) | 119 (5.1%) |
| $25,000 to $49,999 | 3,229 (85.4%) | 554 (14.6%) |
| $50,000 to $74,999 | 3,405 (90.4%) | 363 (9.6%) |
| $75,000 to $99,999 | 3,732 (97.2%) | 108 (2.8%) |
| $100,000 and over | 32,640 (98.2%) | 590 (1.8%) |
Public vs Private Health Insurance Coverage by Age in Glenview
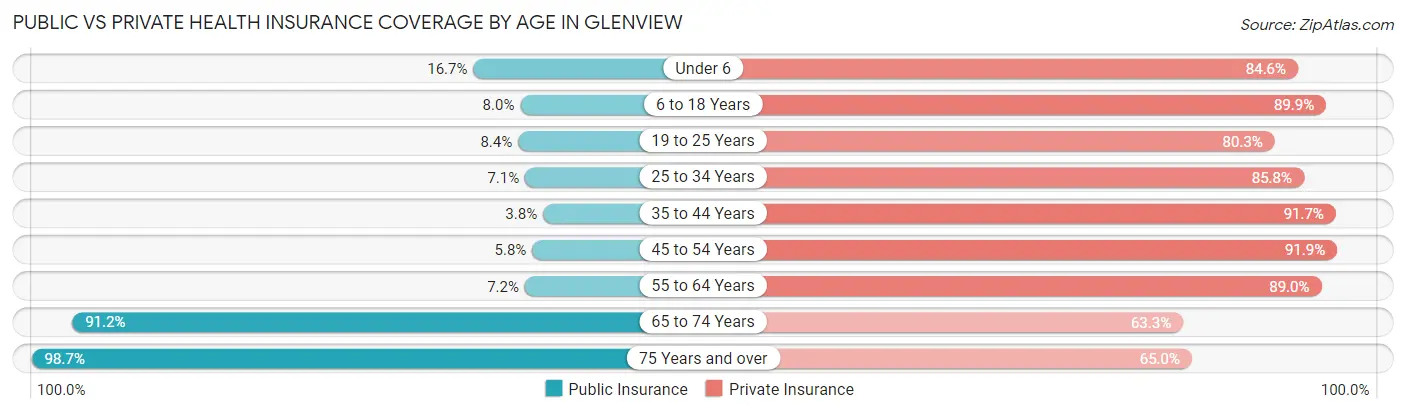
| Age Bracket | Public Insurance | Private Insurance |
| Under 6 | 584 (16.7%) | 2,958 (84.6%) |
| 6 to 18 Years | 682 (8.0%) | 7,667 (89.9%) |
| 19 to 25 Years | 185 (8.4%) | 1,770 (80.3%) |
| 25 to 34 Years | 212 (7.1%) | 2,557 (85.8%) |
| 35 to 44 Years | 212 (3.8%) | 5,147 (91.7%) |
| 45 to 54 Years | 392 (5.8%) | 6,220 (91.9%) |
| 55 to 64 Years | 457 (7.2%) | 5,681 (89.0%) |
| 65 to 74 Years | 5,648 (91.2%) | 3,923 (63.3%) |
| 75 Years and over | 4,781 (98.7%) | 3,146 (65.0%) |
| Total | 13,153 (28.0%) | 39,069 (83.1%) |
Disability Status by Sex by Age in Glenview
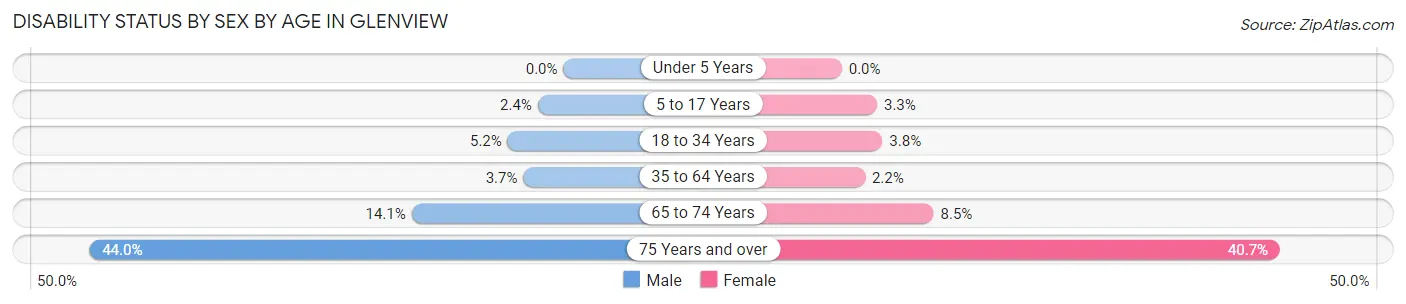
| Age Bracket | Male | Female |
| Under 5 Years | 0 (0.0%) | 0 (0.0%) |
| 5 to 17 Years | 101 (2.4%) | 138 (3.3%) |
| 18 to 34 Years | 151 (5.2%) | 106 (3.8%) |
| 35 to 64 Years | 335 (3.7%) | 210 (2.1%) |
| 65 to 74 Years | 397 (14.1%) | 288 (8.5%) |
| 75 Years and over | 803 (44.0%) | 1,227 (40.7%) |
Disability Class by Sex by Age in Glenview
Disability Class: Hearing Difficulty
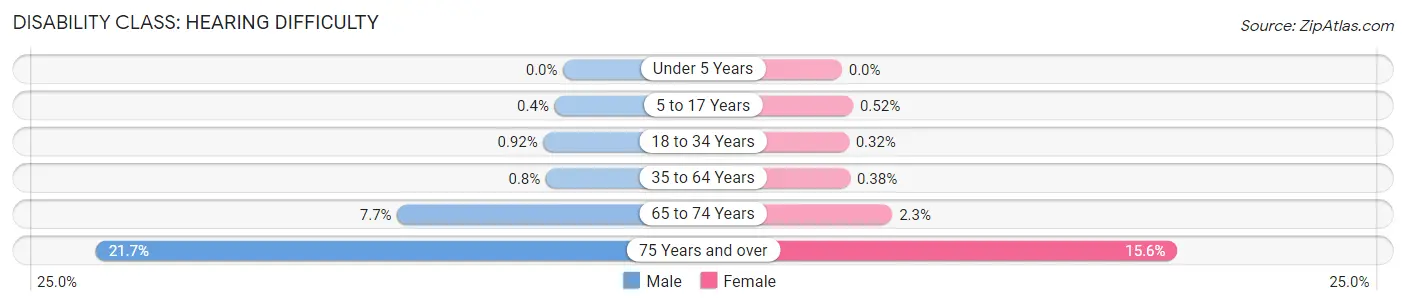
| Age Bracket | Male | Female |
| Under 5 Years | 0 (0.0%) | 0 (0.0%) |
| 5 to 17 Years | 17 (0.4%) | 22 (0.5%) |
| 18 to 34 Years | 27 (0.9%) | 9 (0.3%) |
| 35 to 64 Years | 72 (0.8%) | 37 (0.4%) |
| 65 to 74 Years | 217 (7.7%) | 79 (2.3%) |
| 75 Years and over | 396 (21.7%) | 470 (15.6%) |
Disability Class: Vision Difficulty
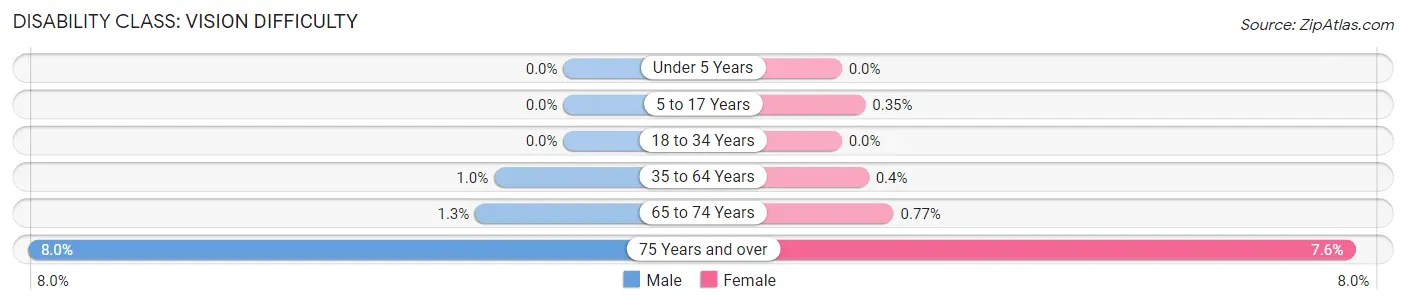
| Age Bracket | Male | Female |
| Under 5 Years | 0 (0.0%) | 0 (0.0%) |
| 5 to 17 Years | 0 (0.0%) | 15 (0.4%) |
| 18 to 34 Years | 0 (0.0%) | 0 (0.0%) |
| 35 to 64 Years | 93 (1.0%) | 39 (0.4%) |
| 65 to 74 Years | 37 (1.3%) | 26 (0.8%) |
| 75 Years and over | 145 (8.0%) | 230 (7.6%) |
Disability Class: Cognitive Difficulty
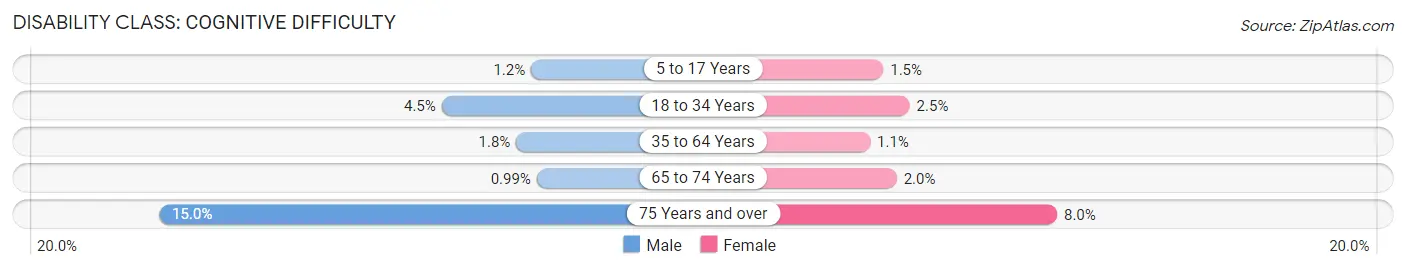
| Age Bracket | Male | Female |
| 5 to 17 Years | 51 (1.2%) | 65 (1.5%) |
| 18 to 34 Years | 132 (4.5%) | 71 (2.5%) |
| 35 to 64 Years | 158 (1.8%) | 102 (1.1%) |
| 65 to 74 Years | 28 (1.0%) | 69 (2.0%) |
| 75 Years and over | 274 (15.0%) | 241 (8.0%) |
Disability Class: Ambulatory Difficulty
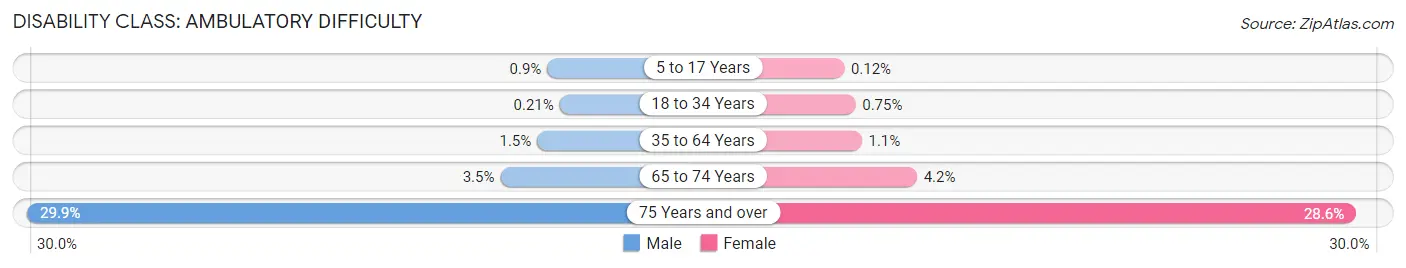
| Age Bracket | Male | Female |
| 5 to 17 Years | 38 (0.9%) | 5 (0.1%) |
| 18 to 34 Years | 6 (0.2%) | 21 (0.7%) |
| 35 to 64 Years | 132 (1.5%) | 107 (1.1%) |
| 65 to 74 Years | 99 (3.5%) | 141 (4.2%) |
| 75 Years and over | 545 (29.9%) | 864 (28.6%) |
Disability Class: Self-Care Difficulty
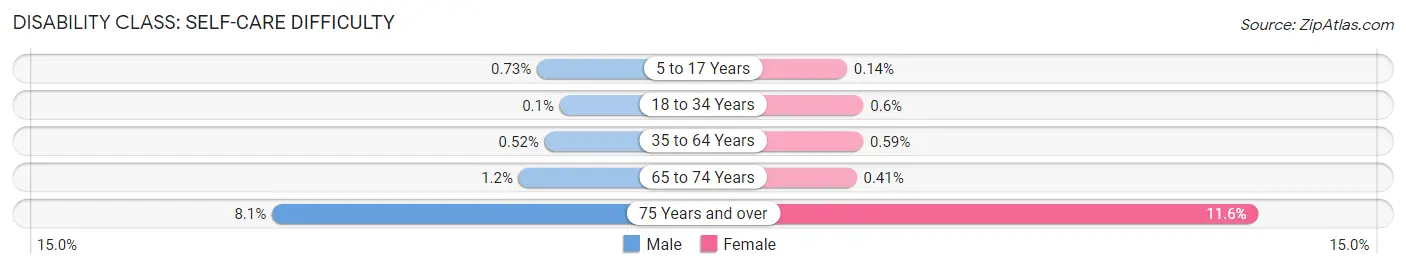
| Age Bracket | Male | Female |
| 5 to 17 Years | 31 (0.7%) | 6 (0.1%) |
| 18 to 34 Years | 3 (0.1%) | 17 (0.6%) |
| 35 to 64 Years | 47 (0.5%) | 58 (0.6%) |
| 65 to 74 Years | 35 (1.2%) | 14 (0.4%) |
| 75 Years and over | 148 (8.1%) | 350 (11.6%) |
Technology Access in Glenview
Computing Device Access in Glenview
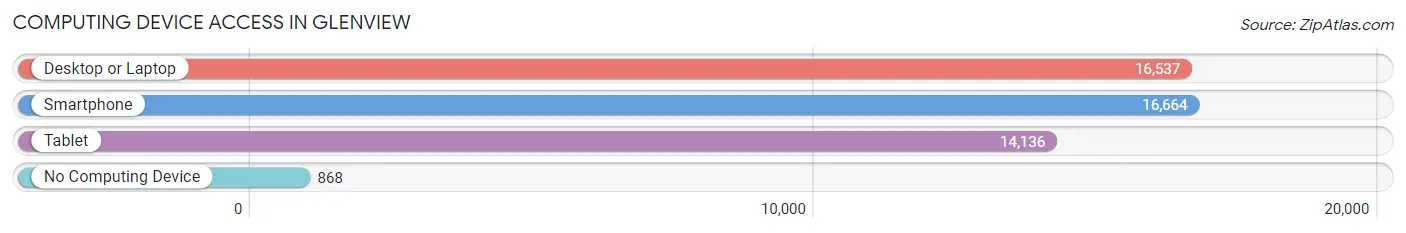
| Device Type | # Households | % Households |
| Desktop or Laptop | 16,537 | 89.6% |
| Smartphone | 16,664 | 90.3% |
| Tablet | 14,136 | 76.6% |
| No Computing Device | 868 | 4.7% |
| Total | 18,451 | 100.0% |
Internet Access in Glenview
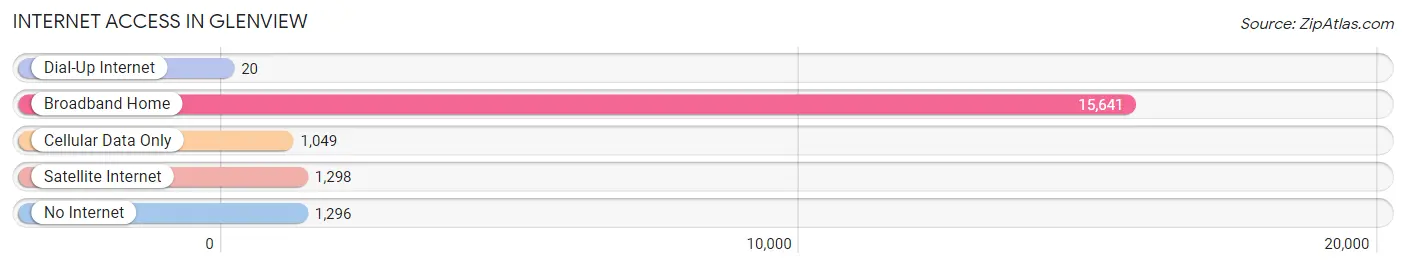
| Internet Type | # Households | % Households |
| Dial-Up Internet | 20 | 0.1% |
| Broadband Home | 15,641 | 84.8% |
| Cellular Data Only | 1,049 | 5.7% |
| Satellite Internet | 1,298 | 7.0% |
| No Internet | 1,296 | 7.0% |
| Total | 18,451 | 100.0% |
Glenview Summary
Glenview is a village located in Cook County, Illinois, United States. It is a northern suburb of Chicago, located approximately 17 miles from the city’s downtown. As of the 2010 census, the village had a population of 44,692. The village is located in the New Trier Township and is named after the Glen of the North Branch of the Chicago River.
History
The area that is now Glenview was first settled in 1834 by German and Irish immigrants. The first settlers were farmers who grew wheat, corn, and other crops. The area was known as “The Glen” because of its location near the North Branch of the Chicago River. In 1858, the first post office was established in the area and the village was officially incorporated in 1899.
In the early 1900s, the village began to grow rapidly as the Chicago and Northwestern Railroad built a station in the area. This allowed for easy access to Chicago and the surrounding suburbs. The village also began to attract new businesses and industries, including a brickyard, a lumberyard, and a dairy.
In the 1920s, the village experienced a population boom as more people moved to the area. This growth was fueled by the construction of the Glenview Naval Air Station in 1923. The air station was a major employer in the area and attracted many new residents.
In the 1950s, the village experienced another population boom as more people moved to the area to take advantage of the new housing developments. This growth was also fueled by the construction of the Edens Expressway, which provided easy access to Chicago and the surrounding suburbs.
Geography
Glenview is located in Cook County, Illinois, approximately 17 miles from the city of Chicago. The village is located in the New Trier Township and is bordered by Northbrook to the north, Northfield to the east, Wilmette to the south, and Niles to the west. The village covers an area of 8.9 square miles and has a population density of 4,976 people per square mile.
The village is located on the North Branch of the Chicago River and is home to several parks and recreational areas. The village is also home to the Glenview Naval Air Station, which is now a museum and park.
Economy
The economy of Glenview is largely based on the service industry. The village is home to several large employers, including Kraft Foods, AbbVie, and the Glenview Naval Air Station. The village is also home to several small businesses, including restaurants, retail stores, and professional services.
The village is also home to several educational institutions, including Glenbrook South High School, Glenbrook North High School, and the Glenview Public Library.
Demographics
As of the 2010 census, the village had a population of 44,692. The population is largely white (86.2%), with a small percentage of African Americans (4.3%), Asians (4.2%), and Hispanics (3.3%). The median household income is $90,845 and the median home value is $521,000.
The village is home to several religious institutions, including Catholic, Protestant, Jewish, and Muslim. The village is also home to several cultural institutions, including the Glenview Public Library, the Glenview Historical Society, and the Glenview Art Center.
Conclusion
Glenview is a village located in Cook County, Illinois, approximately 17 miles from the city of Chicago. The village is home to several large employers, including Kraft Foods, AbbVie, and the Glenview Naval Air Station. The village is also home to several small businesses, educational institutions, and cultural institutions. As of the 2010 census, the village had a population of 44,692, with a median household income of $90,845 and a median home value of $521,000.
Common Questions
What is Per Capita Income in Glenview?
Per Capita income in Glenview is $75,876.
What is the Median Family Income in Glenview?
Median Family Income in Glenview is $171,932.
What is the Median Household income in Glenview?
Median Household Income in Glenview is $134,910.
What is Income or Wage Gap in Glenview?
Income or Wage Gap in Glenview is 40.7%.
Women in Glenview earn 59.3 cents for every dollar earned by a man.
What is Inequality or Gini Index in Glenview?
Inequality or Gini Index in Glenview is 0.49.
What is the Total Population of Glenview?
Total Population of Glenview is 47,896.
What is the Total Male Population of Glenview?
Total Male Population of Glenview is 22,637.
What is the Total Female Population of Glenview?
Total Female Population of Glenview is 25,259.
What is the Ratio of Males per 100 Females in Glenview?
There are 89.62 Males per 100 Females in Glenview.
What is the Ratio of Females per 100 Males in Glenview?
There are 111.58 Females per 100 Males in Glenview.
What is the Median Population Age in Glenview?
Median Population Age in Glenview is 46.5 Years.
What is the Average Family Size in Glenview
Average Family Size in Glenview is 3.0 People.
What is the Average Household Size in Glenview
Average Household Size in Glenview is 2.5 People.
How Large is the Labor Force in Glenview?
There are 23,832 People in the Labor Forcein in Glenview.
What is the Percentage of People in the Labor Force in Glenview?
62.5% of People are in the Labor Force in Glenview.
What is the Unemployment Rate in Glenview?
Unemployment Rate in Glenview is 3.7%.