North Barrington, IL Map & Demographics
North Barrington Map
North Barrington Overview
$96,303
PER CAPITA INCOME
$220,714
AVG FAMILY INCOME
$212,321
AVG HOUSEHOLD INCOME
55.9%
WAGE / INCOME GAP [ % ]
44.1¢/ $1
WAGE / INCOME GAP [ $ ]
0.46
INEQUALITY / GINI INDEX
3,119
TOTAL POPULATION
1,567
MALE POPULATION
1,552
FEMALE POPULATION
100.97
MALES / 100 FEMALES
99.04
FEMALES / 100 MALES
47.6
MEDIAN AGE
3.1
AVG FAMILY SIZE
2.9
AVG HOUSEHOLD SIZE
1,505
LABOR FORCE [ PEOPLE ]
59.6%
PERCENT IN LABOR FORCE
5.0%
UNEMPLOYMENT RATE
Income in North Barrington
Income Overview in North Barrington
Per Capita Income in North Barrington is $96,303, while median incomes of families and households are $220,714 and $212,321 respectively.
| Characteristic | Number | Measure |
| Per Capita Income | 3,119 | $96,303 |
| Median Family Income | 930 | $220,714 |
| Mean Family Income | 930 | $295,148 |
| Median Household Income | 1,081 | $212,321 |
| Mean Household Income | 1,081 | $271,988 |
| Income Deficit | 930 | $0 |
| Wage / Income Gap (%) | 3,119 | 55.92% |
| Wage / Income Gap ($) | 3,119 | 44.08¢ per $1 |
| Gini / Inequality Index | 3,119 | 0.46 |
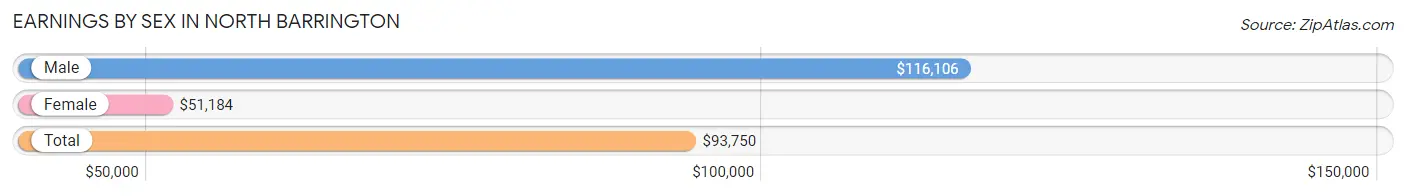
Earnings by Sex in North Barrington
Average Earnings in North Barrington are $93,750, $116,106 for men and $51,184 for women, a difference of 55.9%.
| Sex | Number | Average Earnings |
| Male | 967 (57.7%) | $116,106 |
| Female | 710 (42.3%) | $51,184 |
| Total | 1,677 (100.0%) | $93,750 |
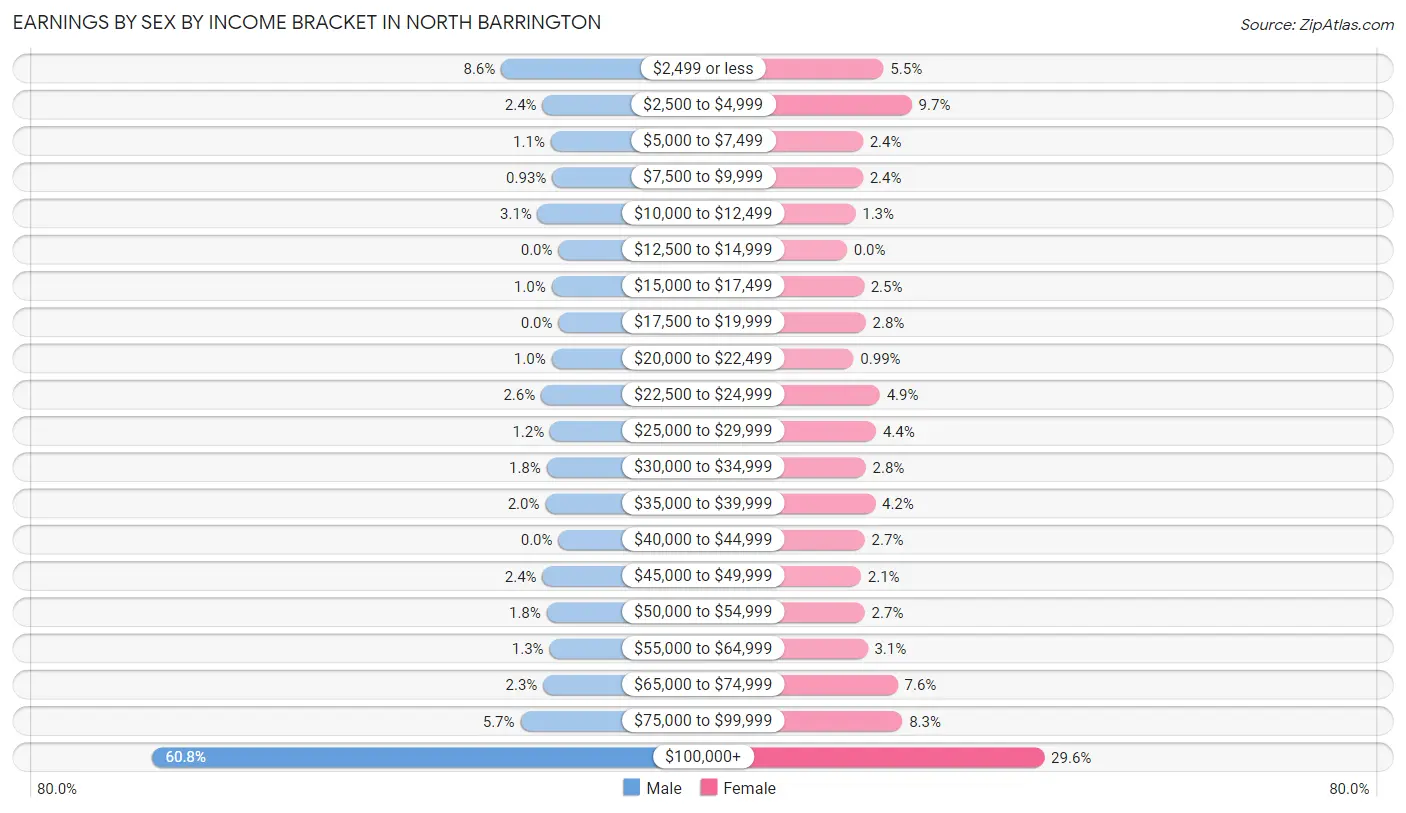
Earnings by Sex by Income Bracket in North Barrington
The most common earnings brackets in North Barrington are $100,000+ for men (588 | 60.8%) and $100,000+ for women (210 | 29.6%).
| Income | Male | Female |
| $2,499 or less | 83 (8.6%) | 39 (5.5%) |
| $2,500 to $4,999 | 23 (2.4%) | 69 (9.7%) |
| $5,000 to $7,499 | 11 (1.1%) | 17 (2.4%) |
| $7,500 to $9,999 | 9 (0.9%) | 17 (2.4%) |
| $10,000 to $12,499 | 30 (3.1%) | 9 (1.3%) |
| $12,500 to $14,999 | 0 (0.0%) | 0 (0.0%) |
| $15,000 to $17,499 | 10 (1.0%) | 18 (2.5%) |
| $17,500 to $19,999 | 0 (0.0%) | 20 (2.8%) |
| $20,000 to $22,499 | 10 (1.0%) | 7 (1.0%) |
| $22,500 to $24,999 | 25 (2.6%) | 35 (4.9%) |
| $25,000 to $29,999 | 12 (1.2%) | 31 (4.4%) |
| $30,000 to $34,999 | 17 (1.8%) | 20 (2.8%) |
| $35,000 to $39,999 | 19 (2.0%) | 30 (4.2%) |
| $40,000 to $44,999 | 0 (0.0%) | 19 (2.7%) |
| $45,000 to $49,999 | 23 (2.4%) | 15 (2.1%) |
| $50,000 to $54,999 | 17 (1.8%) | 19 (2.7%) |
| $55,000 to $64,999 | 13 (1.3%) | 22 (3.1%) |
| $65,000 to $74,999 | 22 (2.3%) | 54 (7.6%) |
| $75,000 to $99,999 | 55 (5.7%) | 59 (8.3%) |
| $100,000+ | 588 (60.8%) | 210 (29.6%) |
| Total | 967 (100.0%) | 710 (100.0%) |
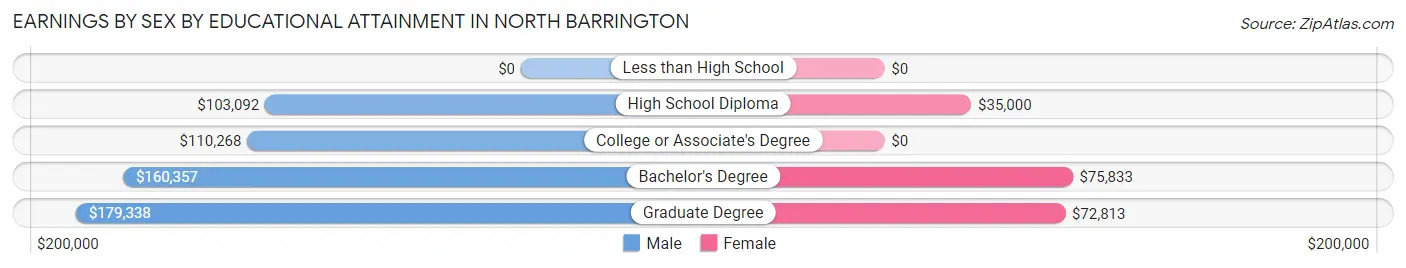
Earnings by Sex by Educational Attainment in North Barrington
Average earnings in North Barrington are $147,857 for men and $72,065 for women, a difference of 51.3%. Men with an educational attainment of graduate degree enjoy the highest average annual earnings of $179,338, while those with high school diploma education earn the least with $103,092. Women with an educational attainment of bachelor's degree earn the most with the average annual earnings of $75,833, while those with high school diploma education have the smallest earnings of $35,000.
| Educational Attainment | Male Income | Female Income |
| Less than High School | - | - |
| High School Diploma | $103,092 | $35,000 |
| College or Associate's Degree | $110,268 | $0 |
| Bachelor's Degree | $160,357 | $75,833 |
| Graduate Degree | $179,338 | $72,813 |
| Total | $147,857 | $72,065 |
Family Income in North Barrington
Family Income Brackets in North Barrington
According to the North Barrington family income data, there are 514 families falling into the $200,000+ income range, which is the most common income bracket and makes up 55.3% of all families.
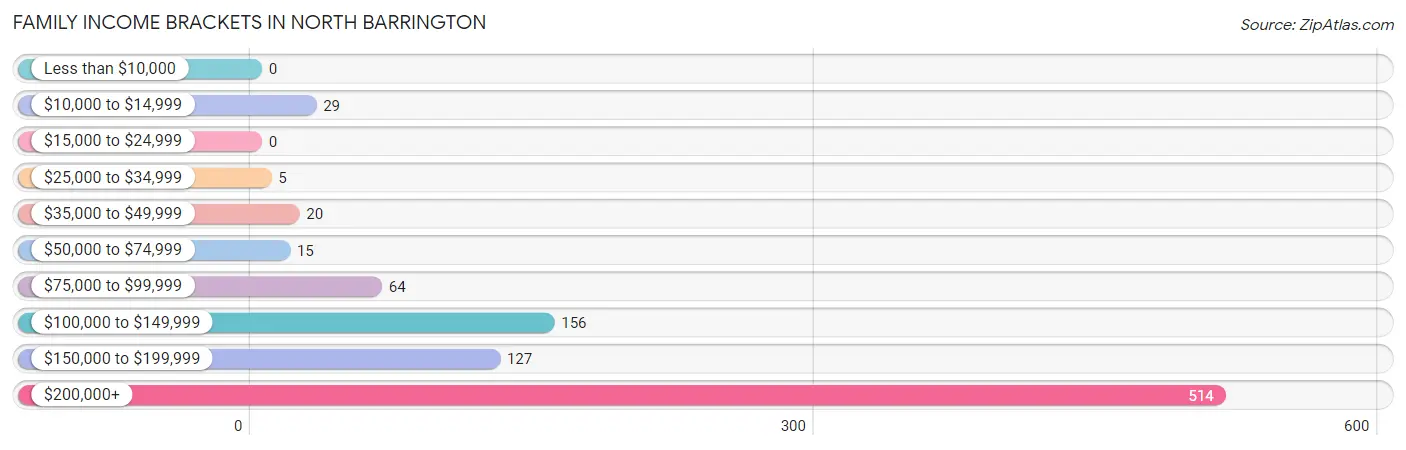
| Income Bracket | # Families | % Families |
| Less than $10,000 | 0 | 0.0% |
| $10,000 to $14,999 | 29 | 3.1% |
| $15,000 to $24,999 | 0 | 0.0% |
| $25,000 to $34,999 | 5 | 0.5% |
| $35,000 to $49,999 | 20 | 2.2% |
| $50,000 to $74,999 | 15 | 1.6% |
| $75,000 to $99,999 | 64 | 6.9% |
| $100,000 to $149,999 | 156 | 16.8% |
| $150,000 to $199,999 | 127 | 13.7% |
| $200,000+ | 514 | 55.3% |
Family Income by Famaliy Size in North Barrington
4-person families (221 | 23.8%) account for the highest median family income in North Barrington with $250,001 per family, while 2-person families (454 | 48.8%) have the highest median income of $91,000 per family member.
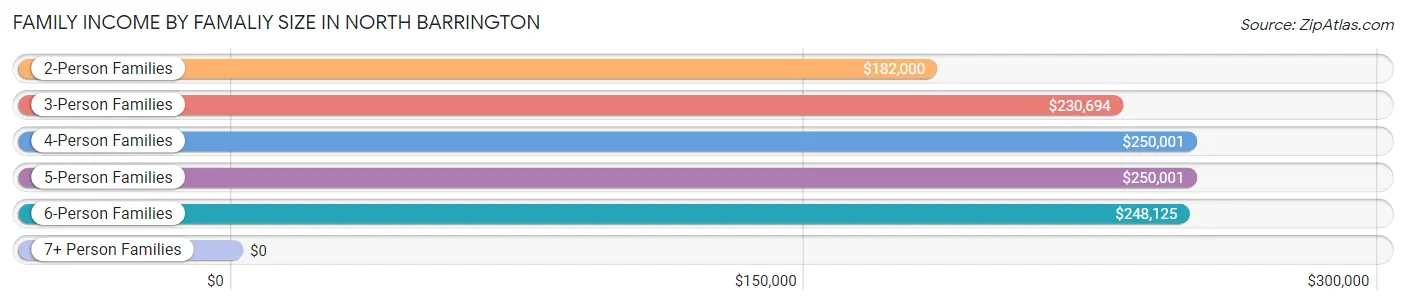
| Income Bracket | # Families | Median Income |
| 2-Person Families | 454 (48.8%) | $182,000 |
| 3-Person Families | 185 (19.9%) | $230,694 |
| 4-Person Families | 221 (23.8%) | $250,001 |
| 5-Person Families | 43 (4.6%) | $250,001 |
| 6-Person Families | 27 (2.9%) | $248,125 |
| 7+ Person Families | 0 (0.0%) | $0 |
| Total | 930 (100.0%) | $220,714 |
Family Income by Number of Earners in North Barrington
The median family income in North Barrington is $220,714, with families comprising 3+ earners (146) having the highest median family income of $248,333, while families with no earners (133) have the lowest median family income of $105,234, accounting for 15.7% and 14.3% of families, respectively.
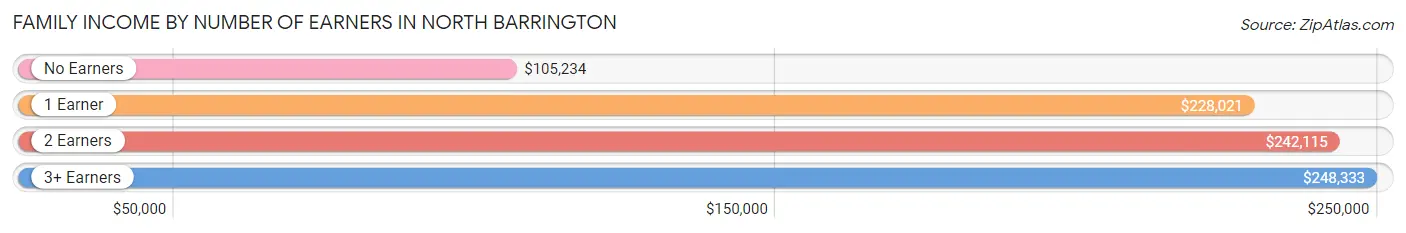
| Number of Earners | # Families | Median Income |
| No Earners | 133 (14.3%) | $105,234 |
| 1 Earner | 299 (32.2%) | $228,021 |
| 2 Earners | 352 (37.9%) | $242,115 |
| 3+ Earners | 146 (15.7%) | $248,333 |
| Total | 930 (100.0%) | $220,714 |
Household Income in North Barrington
Household Income Brackets in North Barrington
With 558 households falling in the category, the $200,000+ income range is the most frequent in North Barrington, accounting for 51.6% of all households.
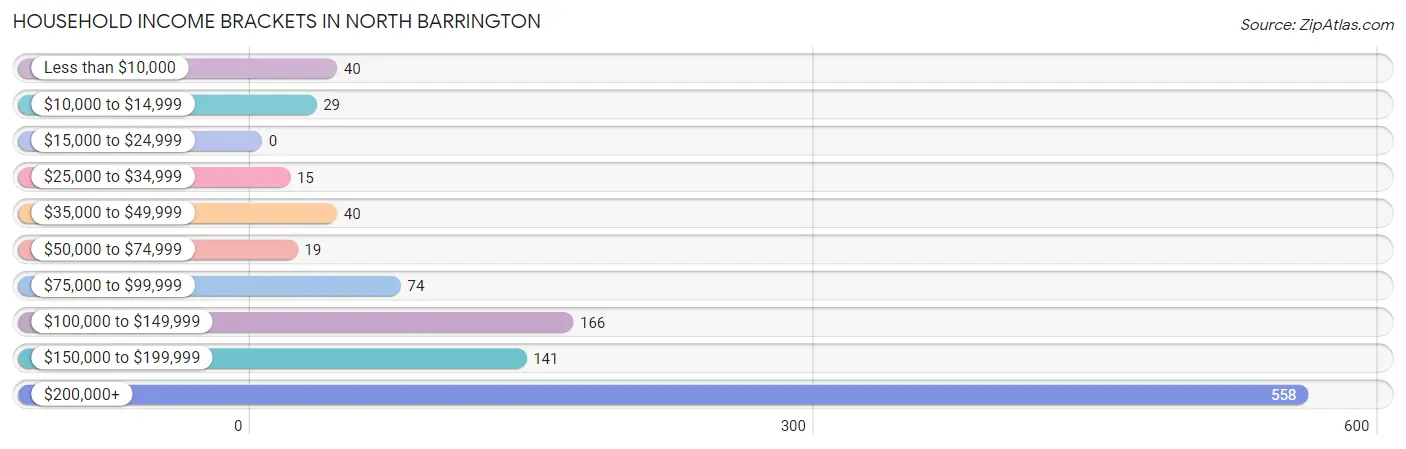
| Income Bracket | # Households | % Households |
| Less than $10,000 | 40 | 3.7% |
| $10,000 to $14,999 | 29 | 2.7% |
| $15,000 to $24,999 | 0 | 0.0% |
| $25,000 to $34,999 | 15 | 1.4% |
| $35,000 to $49,999 | 40 | 3.7% |
| $50,000 to $74,999 | 19 | 1.8% |
| $75,000 to $99,999 | 74 | 6.8% |
| $100,000 to $149,999 | 166 | 15.4% |
| $150,000 to $199,999 | 141 | 13.0% |
| $200,000+ | 558 | 51.6% |
Household Income by Householder Age in North Barrington
The median household income in North Barrington is $212,321, with the highest median household income of $250,001 found in the 25 to 44 years age bracket for the primary householder. A total of 149 households (13.8%) fall into this category.
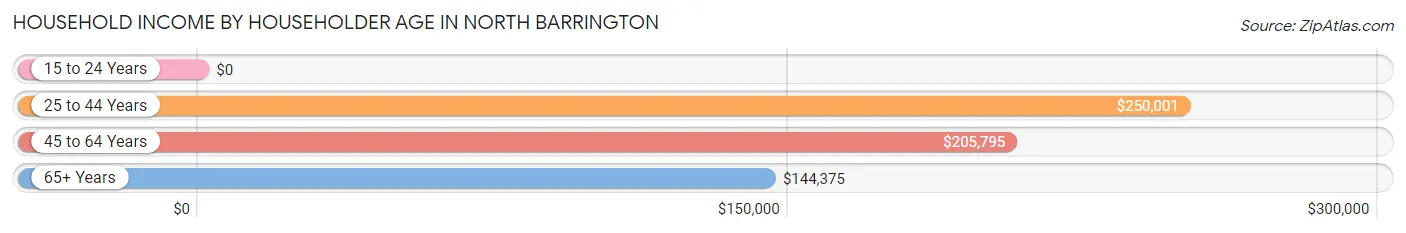
| Income Bracket | # Households | Median Income |
| 15 to 24 Years | 0 (0.0%) | $0 |
| 25 to 44 Years | 149 (13.8%) | $250,001 |
| 45 to 64 Years | 605 (56.0%) | $205,795 |
| 65+ Years | 327 (30.2%) | $144,375 |
| Total | 1,081 (100.0%) | $212,321 |
Poverty in North Barrington
Income Below Poverty by Sex and Age in North Barrington
With 2.2% poverty level for males and 6.8% for females among the residents of North Barrington, 75 year old and over males and 75 year old and over females are the most vulnerable to poverty, with 29 males (25.4%) and 29 females (25.0%) in their respective age groups living below the poverty level.
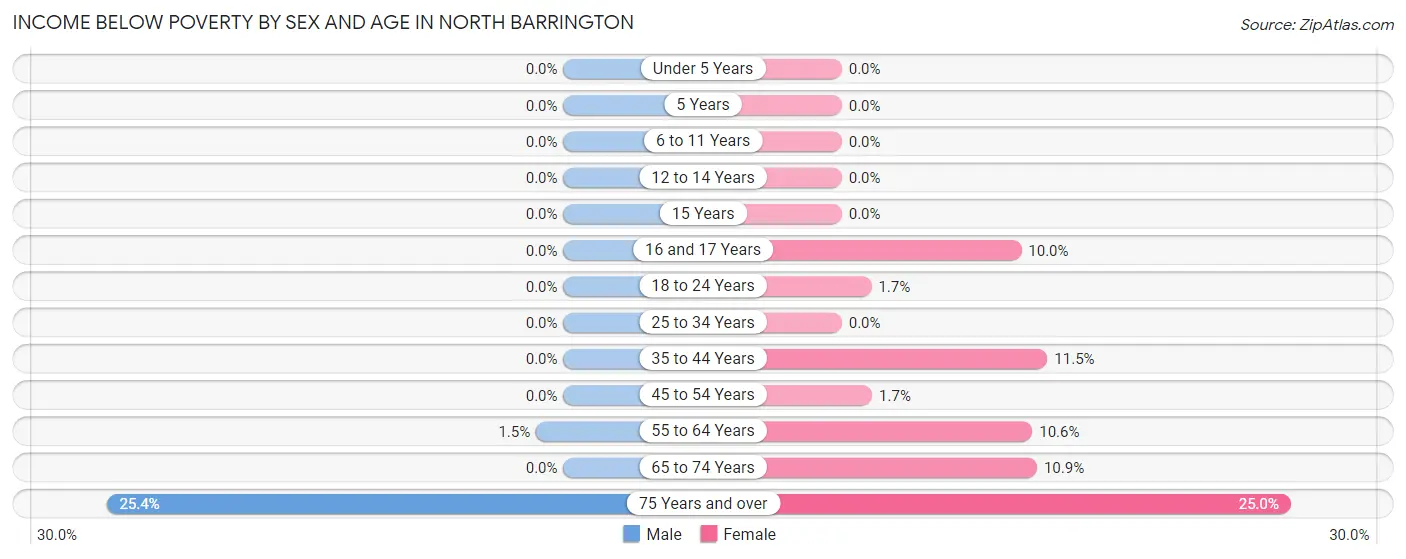
| Age Bracket | Male | Female |
| Under 5 Years | 0 (0.0%) | 0 (0.0%) |
| 5 Years | 0 (0.0%) | 0 (0.0%) |
| 6 to 11 Years | 0 (0.0%) | 0 (0.0%) |
| 12 to 14 Years | 0 (0.0%) | 0 (0.0%) |
| 15 Years | 0 (0.0%) | 0 (0.0%) |
| 16 and 17 Years | 0 (0.0%) | 6 (10.0%) |
| 18 to 24 Years | 0 (0.0%) | 2 (1.7%) |
| 25 to 34 Years | 0 (0.0%) | 0 (0.0%) |
| 35 to 44 Years | 0 (0.0%) | 15 (11.5%) |
| 45 to 54 Years | 0 (0.0%) | 5 (1.7%) |
| 55 to 64 Years | 4 (1.5%) | 28 (10.6%) |
| 65 to 74 Years | 0 (0.0%) | 20 (10.9%) |
| 75 Years and over | 29 (25.4%) | 29 (25.0%) |
| Total | 33 (2.2%) | 105 (6.8%) |
Income Above Poverty by Sex and Age in North Barrington
According to the poverty statistics in North Barrington, males aged under 5 years and females aged under 5 years are the age groups that are most secure financially, with 100.0% of males and 100.0% of females in these age groups living above the poverty line.
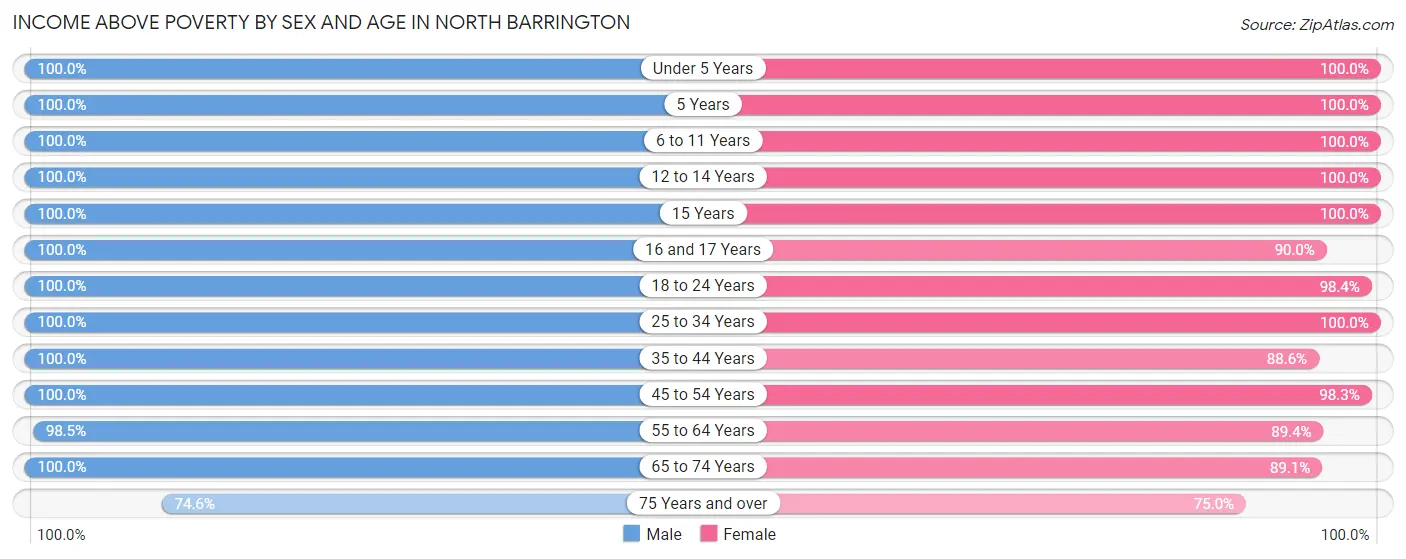
| Age Bracket | Male | Female |
| Under 5 Years | 41 (100.0%) | 30 (100.0%) |
| 5 Years | 7 (100.0%) | 29 (100.0%) |
| 6 to 11 Years | 67 (100.0%) | 164 (100.0%) |
| 12 to 14 Years | 83 (100.0%) | 73 (100.0%) |
| 15 Years | 34 (100.0%) | 17 (100.0%) |
| 16 and 17 Years | 95 (100.0%) | 54 (90.0%) |
| 18 to 24 Years | 112 (100.0%) | 119 (98.4%) |
| 25 to 34 Years | 94 (100.0%) | 62 (100.0%) |
| 35 to 44 Years | 134 (100.0%) | 116 (88.5%) |
| 45 to 54 Years | 271 (100.0%) | 291 (98.3%) |
| 55 to 64 Years | 259 (98.5%) | 236 (89.4%) |
| 65 to 74 Years | 209 (100.0%) | 164 (89.1%) |
| 75 Years and over | 85 (74.6%) | 87 (75.0%) |
| Total | 1,491 (97.8%) | 1,442 (93.2%) |
Income Below Poverty Among Married-Couple Families in North Barrington
The poverty statistics for married-couple families in North Barrington show that 3.4% or 29 of the total 858 families live below the poverty line. Families with no children have the highest poverty rate of 5.7%, comprising of 29 families. On the other hand, families with 1 or 2 children have the lowest poverty rate of 0.0%, which includes 0 families.
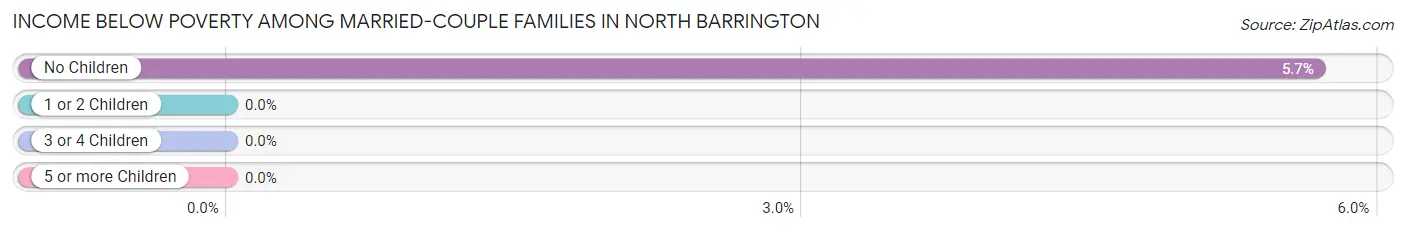
| Children | Above Poverty | Below Poverty |
| No Children | 482 (94.3%) | 29 (5.7%) |
| 1 or 2 Children | 292 (100.0%) | 0 (0.0%) |
| 3 or 4 Children | 55 (100.0%) | 0 (0.0%) |
| 5 or more Children | 0 (0.0%) | 0 (0.0%) |
| Total | 829 (96.6%) | 29 (3.4%) |
Income Below Poverty Among Single-Parent Households in North Barrington
| Children | Single Father | Single Mother |
| No Children | 0 (0.0%) | 0 (0.0%) |
| 1 or 2 Children | 0 (0.0%) | 0 (0.0%) |
| 3 or 4 Children | 0 (0.0%) | 0 (0.0%) |
| 5 or more Children | 0 (0.0%) | 0 (0.0%) |
| Total | 0 (0.0%) | 0 (0.0%) |
Income Below Poverty Among Married-Couple vs Single-Parent Households in North Barrington
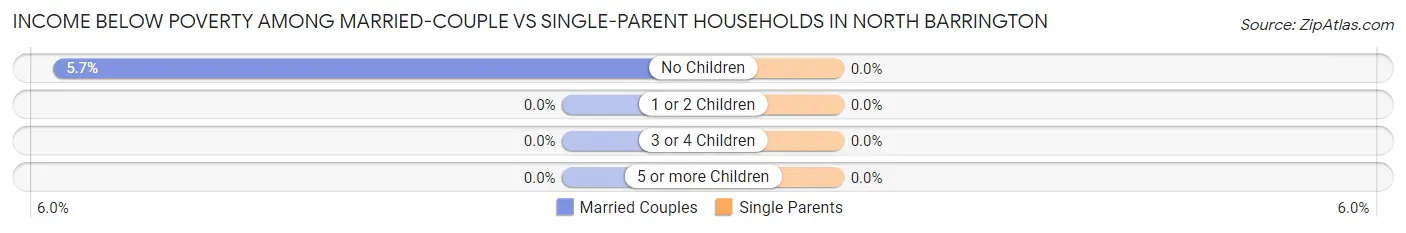
| Children | Married-Couple Families | Single-Parent Households |
| No Children | 29 (5.7%) | 0 (0.0%) |
| 1 or 2 Children | 0 (0.0%) | 0 (0.0%) |
| 3 or 4 Children | 0 (0.0%) | 0 (0.0%) |
| 5 or more Children | 0 (0.0%) | 0 (0.0%) |
| Total | 29 (3.4%) | 0 (0.0%) |
Race in North Barrington
The most populous races in North Barrington are White / Caucasian (2,617 | 83.9%), Asian (261 | 8.4%), and Two or more Races (173 | 5.6%).
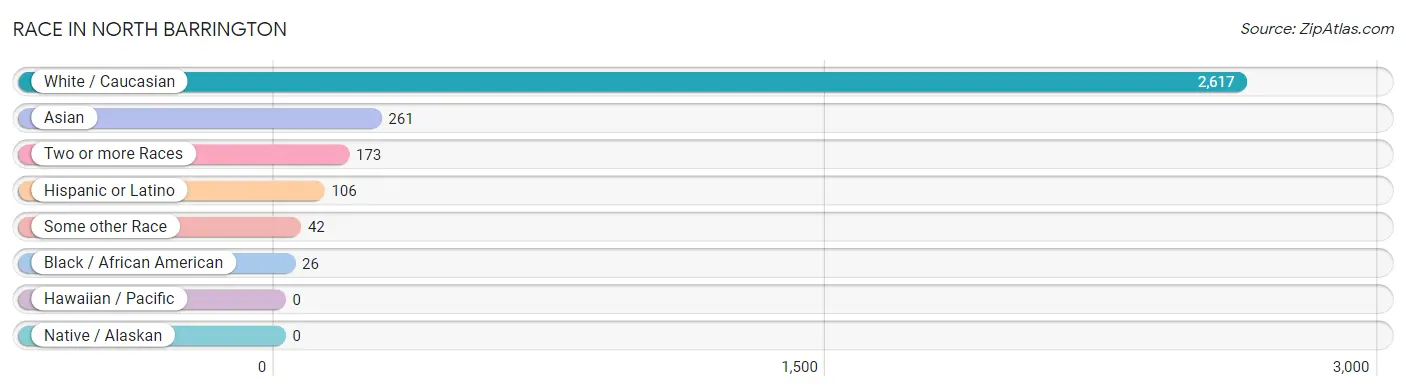
| Race | # Population | % Population |
| Asian | 261 | 8.4% |
| Black / African American | 26 | 0.8% |
| Hawaiian / Pacific | 0 | 0.0% |
| Hispanic or Latino | 106 | 3.4% |
| Native / Alaskan | 0 | 0.0% |
| White / Caucasian | 2,617 | 83.9% |
| Two or more Races | 173 | 5.6% |
| Some other Race | 42 | 1.3% |
| Total | 3,119 | 100.0% |
Ancestry in North Barrington
The most populous ancestries reported in North Barrington are German (642 | 20.6%), Irish (442 | 14.2%), Italian (336 | 10.8%), Polish (287 | 9.2%), and English (246 | 7.9%), together accounting for 62.6% of all North Barrington residents.
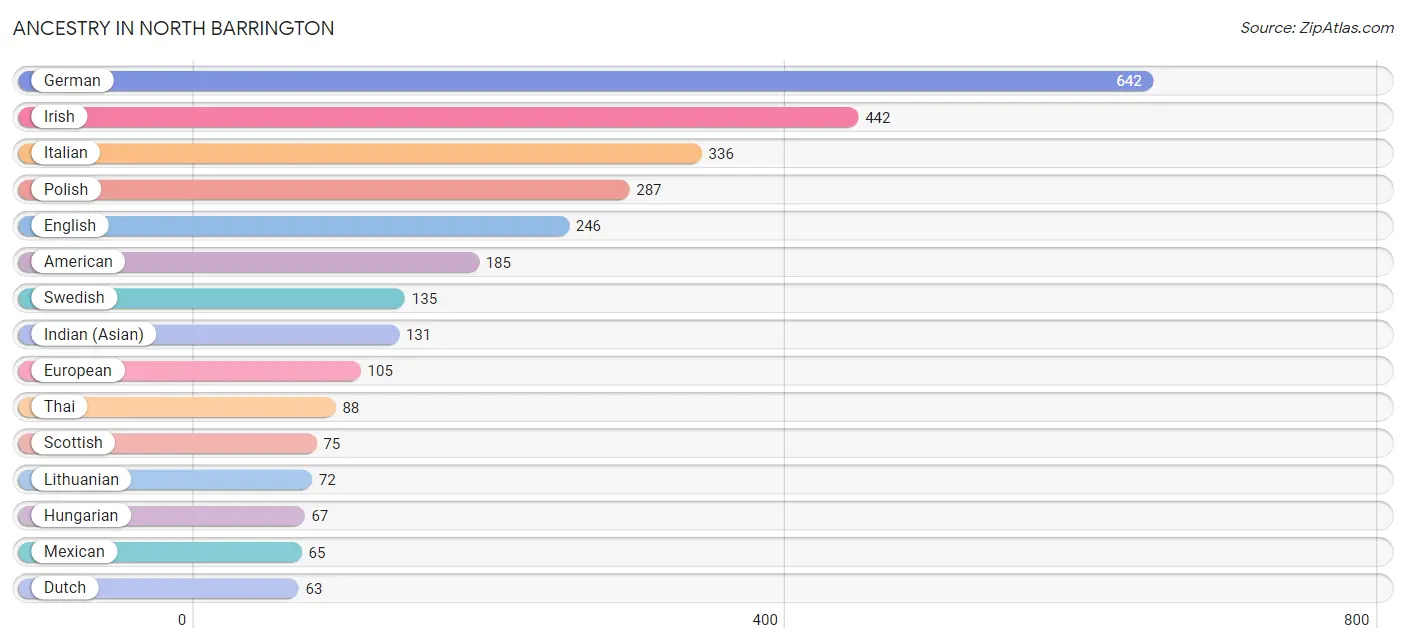
| Ancestry | # Population | % Population |
| American | 185 | 5.9% |
| Arab | 11 | 0.4% |
| Armenian | 17 | 0.5% |
| Assyrian / Chaldean / Syriac | 28 | 0.9% |
| Austrian | 7 | 0.2% |
| Belizean | 3 | 0.1% |
| British | 17 | 0.5% |
| Bulgarian | 4 | 0.1% |
| Burmese | 23 | 0.7% |
| Central American | 13 | 0.4% |
| Cuban | 5 | 0.2% |
| Czech | 38 | 1.2% |
| Czechoslovakian | 6 | 0.2% |
| Danish | 6 | 0.2% |
| Dutch | 63 | 2.0% |
| Eastern European | 24 | 0.8% |
| Ecuadorian | 4 | 0.1% |
| Egyptian | 11 | 0.4% |
| English | 246 | 7.9% |
| European | 105 | 3.4% |
| Finnish | 22 | 0.7% |
| French | 39 | 1.3% |
| French Canadian | 11 | 0.4% |
| German | 642 | 20.6% |
| Greek | 43 | 1.4% |
| Guatemalan | 11 | 0.4% |
| Hungarian | 67 | 2.1% |
| Indian (Asian) | 131 | 4.2% |
| Irish | 442 | 14.2% |
| Italian | 336 | 10.8% |
| Korean | 15 | 0.5% |
| Lithuanian | 72 | 2.3% |
| Mexican | 65 | 2.1% |
| Norwegian | 59 | 1.9% |
| Pakistani | 17 | 0.5% |
| Polish | 287 | 9.2% |
| Puerto Rican | 15 | 0.5% |
| Romanian | 6 | 0.2% |
| Russian | 22 | 0.7% |
| Salvadoran | 2 | 0.1% |
| Scotch-Irish | 12 | 0.4% |
| Scottish | 75 | 2.4% |
| Serbian | 13 | 0.4% |
| South American | 4 | 0.1% |
| Spanish | 4 | 0.1% |
| Sri Lankan | 39 | 1.3% |
| Swedish | 135 | 4.3% |
| Swiss | 33 | 1.1% |
| Thai | 88 | 2.8% |
| Turkish | 29 | 0.9% | View All 50 Rows |
Immigrants in North Barrington
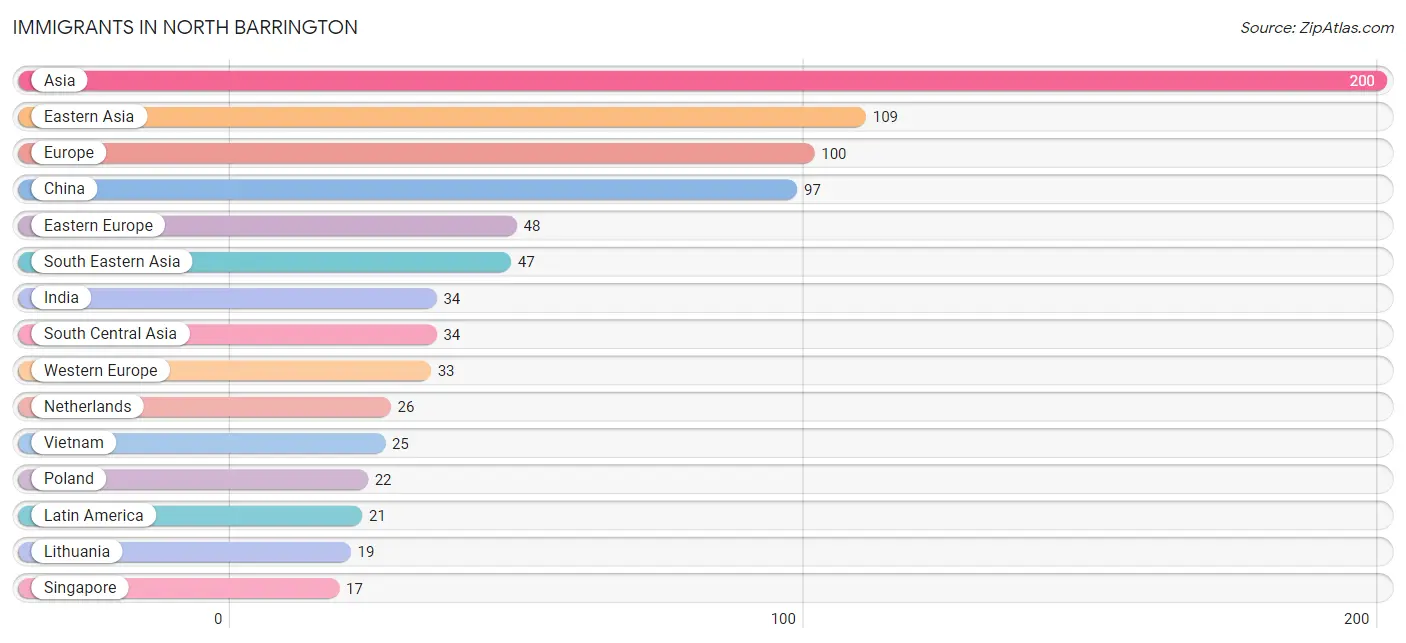
The most numerous immigrant groups reported in North Barrington came from Asia (200 | 6.4%), Eastern Asia (109 | 3.5%), Europe (100 | 3.2%), China (97 | 3.1%), and Eastern Europe (48 | 1.5%), together accounting for 17.8% of all North Barrington residents.
| Immigration Origin | # Population | % Population |
| Africa | 5 | 0.2% |
| Asia | 200 | 6.4% |
| Belgium | 7 | 0.2% |
| Bulgaria | 4 | 0.1% |
| Canada | 5 | 0.2% |
| Caribbean | 5 | 0.2% |
| Central America | 16 | 0.5% |
| China | 97 | 3.1% |
| Cuba | 5 | 0.2% |
| Eastern Asia | 109 | 3.5% |
| Eastern Europe | 48 | 1.5% |
| Egypt | 5 | 0.2% |
| England | 4 | 0.1% |
| Europe | 100 | 3.2% |
| Guatemala | 9 | 0.3% |
| India | 34 | 1.1% |
| Italy | 7 | 0.2% |
| Korea | 12 | 0.4% |
| Latin America | 21 | 0.7% |
| Lithuania | 19 | 0.6% |
| Mexico | 7 | 0.2% |
| Netherlands | 26 | 0.8% |
| Northern Africa | 5 | 0.2% |
| Northern Europe | 12 | 0.4% |
| Norway | 3 | 0.1% |
| Philippines | 5 | 0.2% |
| Poland | 22 | 0.7% |
| Russia | 3 | 0.1% |
| Singapore | 17 | 0.5% |
| South Central Asia | 34 | 1.1% |
| South Eastern Asia | 47 | 1.5% |
| Southern Europe | 7 | 0.2% |
| Turkey | 10 | 0.3% |
| Vietnam | 25 | 0.8% |
| Western Asia | 10 | 0.3% |
| Western Europe | 33 | 1.1% | View All 36 Rows |
Sex and Age in North Barrington
Sex and Age in North Barrington
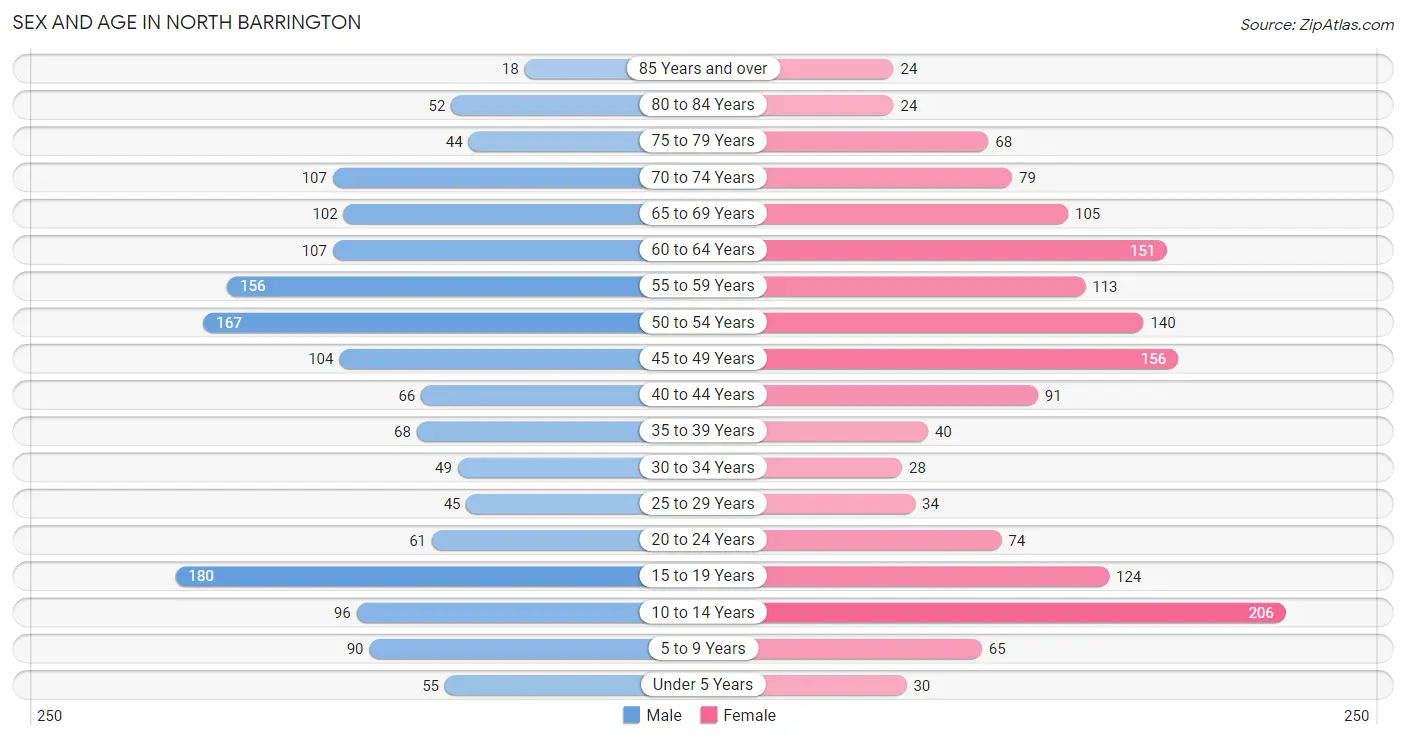
The most populous age groups in North Barrington are 15 to 19 Years (180 | 11.5%) for men and 10 to 14 Years (206 | 13.3%) for women.
| Age Bracket | Male | Female |
| Under 5 Years | 55 (3.5%) | 30 (1.9%) |
| 5 to 9 Years | 90 (5.7%) | 65 (4.2%) |
| 10 to 14 Years | 96 (6.1%) | 206 (13.3%) |
| 15 to 19 Years | 180 (11.5%) | 124 (8.0%) |
| 20 to 24 Years | 61 (3.9%) | 74 (4.8%) |
| 25 to 29 Years | 45 (2.9%) | 34 (2.2%) |
| 30 to 34 Years | 49 (3.1%) | 28 (1.8%) |
| 35 to 39 Years | 68 (4.3%) | 40 (2.6%) |
| 40 to 44 Years | 66 (4.2%) | 91 (5.9%) |
| 45 to 49 Years | 104 (6.6%) | 156 (10.1%) |
| 50 to 54 Years | 167 (10.7%) | 140 (9.0%) |
| 55 to 59 Years | 156 (10.0%) | 113 (7.3%) |
| 60 to 64 Years | 107 (6.8%) | 151 (9.7%) |
| 65 to 69 Years | 102 (6.5%) | 105 (6.8%) |
| 70 to 74 Years | 107 (6.8%) | 79 (5.1%) |
| 75 to 79 Years | 44 (2.8%) | 68 (4.4%) |
| 80 to 84 Years | 52 (3.3%) | 24 (1.5%) |
| 85 Years and over | 18 (1.1%) | 24 (1.5%) |
| Total | 1,567 (100.0%) | 1,552 (100.0%) |
Families and Households in North Barrington
Median Family Size in North Barrington
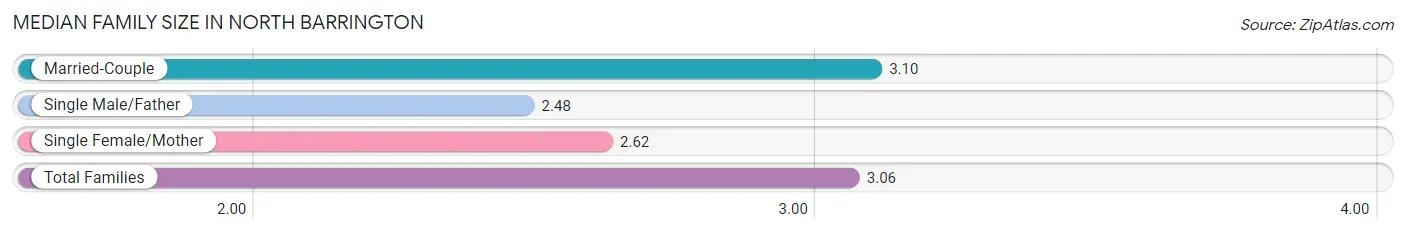
The median family size in North Barrington is 3.06 persons per family, with married-couple families (858 | 92.3%) accounting for the largest median family size of 3.1 persons per family. On the other hand, single male/father families (33 | 3.5%) represent the smallest median family size with 2.48 persons per family.
| Family Type | # Families | Family Size |
| Married-Couple | 858 (92.3%) | 3.10 |
| Single Male/Father | 33 (3.5%) | 2.48 |
| Single Female/Mother | 39 (4.2%) | 2.62 |
| Total Families | 930 (100.0%) | 3.06 |
Median Household Size in North Barrington
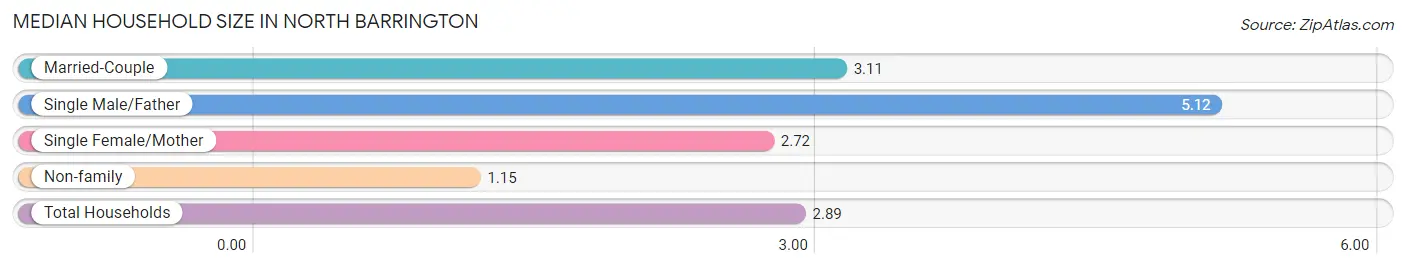
The median household size in North Barrington is 2.89 persons per household, with single male/father households (33 | 3.0%) accounting for the largest median household size of 5.12 persons per household. non-family households (151 | 14.0%) represent the smallest median household size with 1.15 persons per household.
| Household Type | # Households | Household Size |
| Married-Couple | 858 (79.4%) | 3.11 |
| Single Male/Father | 33 (3.0%) | 5.12 |
| Single Female/Mother | 39 (3.6%) | 2.72 |
| Non-family | 151 (14.0%) | 1.15 |
| Total Households | 1,081 (100.0%) | 2.89 |
Household Size by Marriage Status in North Barrington
Out of a total of 1,081 households in North Barrington, 930 (86.0%) are family households, while 151 (14.0%) are nonfamily households. The most numerous type of family households are 2-person households, comprising 444, and the most common type of nonfamily households are 1-person households, comprising 130.
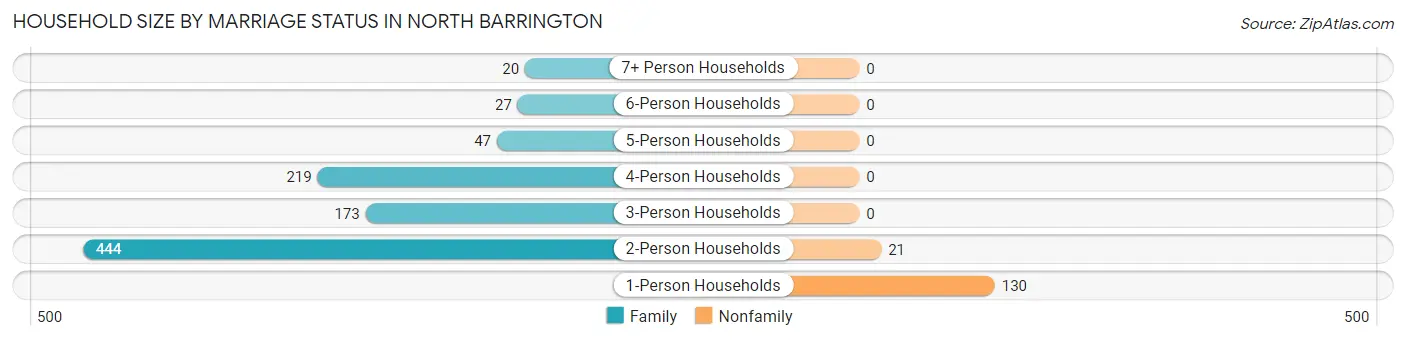
| Household Size | Family Households | Nonfamily Households |
| 1-Person Households | - | 130 (12.0%) |
| 2-Person Households | 444 (41.1%) | 21 (1.9%) |
| 3-Person Households | 173 (16.0%) | 0 (0.0%) |
| 4-Person Households | 219 (20.3%) | 0 (0.0%) |
| 5-Person Households | 47 (4.3%) | 0 (0.0%) |
| 6-Person Households | 27 (2.5%) | 0 (0.0%) |
| 7+ Person Households | 20 (1.8%) | 0 (0.0%) |
| Total | 930 (86.0%) | 151 (14.0%) |
Female Fertility in North Barrington
Fertility by Age in North Barrington
Average fertility rate in North Barrington is 31.0 births per 1,000 women. Women in the age bracket of 20 to 34 years have the highest fertility rate with 88.0 births per 1,000 women. Women in the age bracket of 20 to 34 years acount for 63.2% of all women with births.
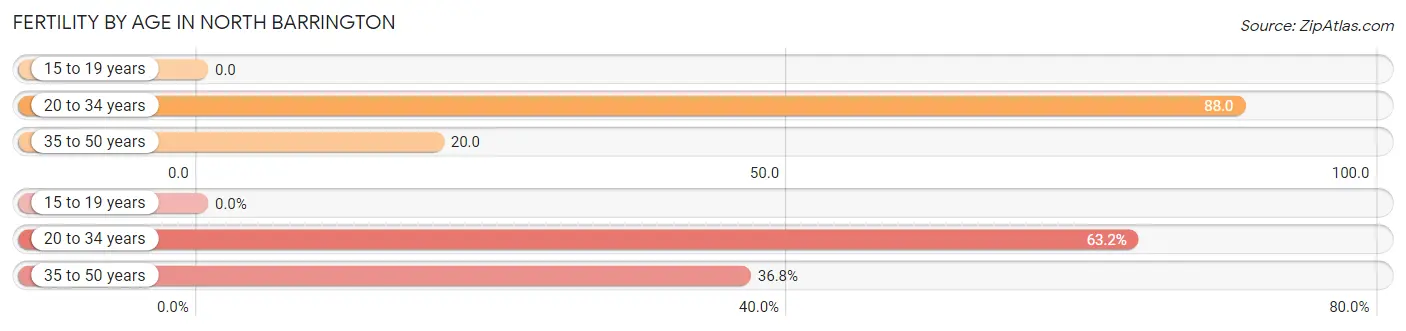
| Age Bracket | Women with Births | Births / 1,000 Women |
| 15 to 19 years | 0 (0.0%) | 0.0 |
| 20 to 34 years | 12 (63.2%) | 88.0 |
| 35 to 50 years | 7 (36.8%) | 20.0 |
| Total | 19 (100.0%) | 31.0 |
Fertility by Age by Marriage Status in North Barrington
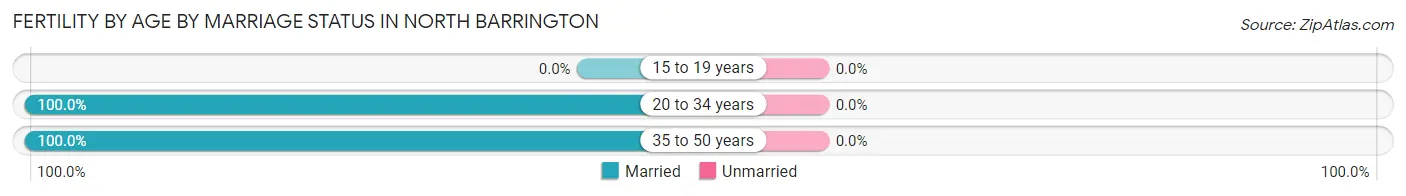
| Age Bracket | Married | Unmarried |
| 15 to 19 years | 0 (0.0%) | 0 (0.0%) |
| 20 to 34 years | 12 (100.0%) | 0 (0.0%) |
| 35 to 50 years | 7 (100.0%) | 0 (0.0%) |
| Total | 19 (100.0%) | 0 (0.0%) |
Fertility by Education in North Barrington
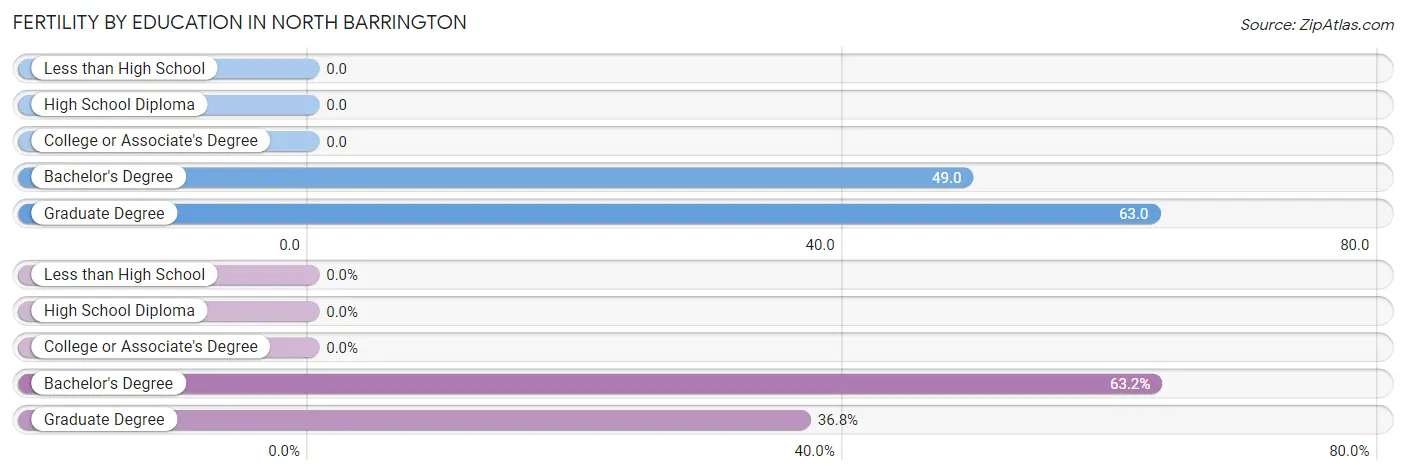
| Educational Attainment | Women with Births | Births / 1,000 Women |
| Less than High School | 0 (0.0%) | 0.0 |
| High School Diploma | 0 (0.0%) | 0.0 |
| College or Associate's Degree | 0 (0.0%) | 0.0 |
| Bachelor's Degree | 12 (63.2%) | 49.0 |
| Graduate Degree | 7 (36.8%) | 63.0 |
| Total | 19 (100.0%) | 31.0 |
Fertility by Education by Marriage Status in North Barrington
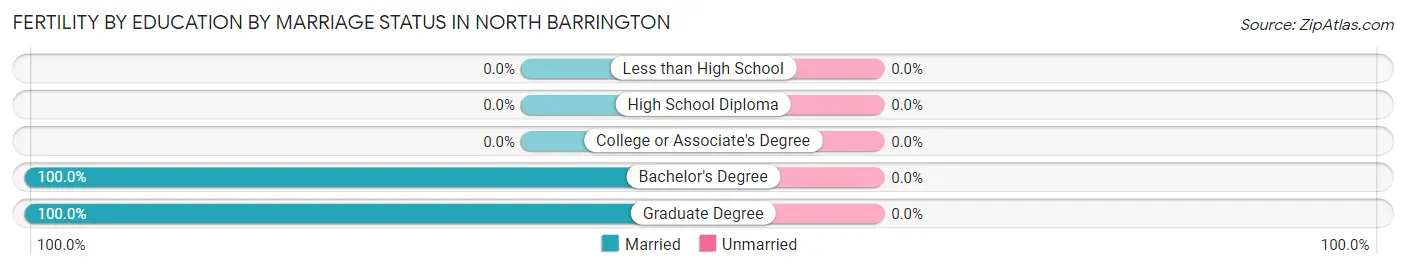
| Educational Attainment | Married | Unmarried |
| Less than High School | 0 (0.0%) | 0 (0.0%) |
| High School Diploma | 0 (0.0%) | 0 (0.0%) |
| College or Associate's Degree | 0 (0.0%) | 0 (0.0%) |
| Bachelor's Degree | 12 (100.0%) | 0 (0.0%) |
| Graduate Degree | 7 (100.0%) | 0 (0.0%) |
| Total | 19 (100.0%) | 0 (0.0%) |
Employment Characteristics in North Barrington
Employment by Class of Employer in North Barrington
Among the 1,382 employed individuals in North Barrington, private company employees (903 | 65.3%), self-employed (incorporated) (245 | 17.7%), and not-for-profit organizations (86 | 6.2%) make up the most common classes of employment.
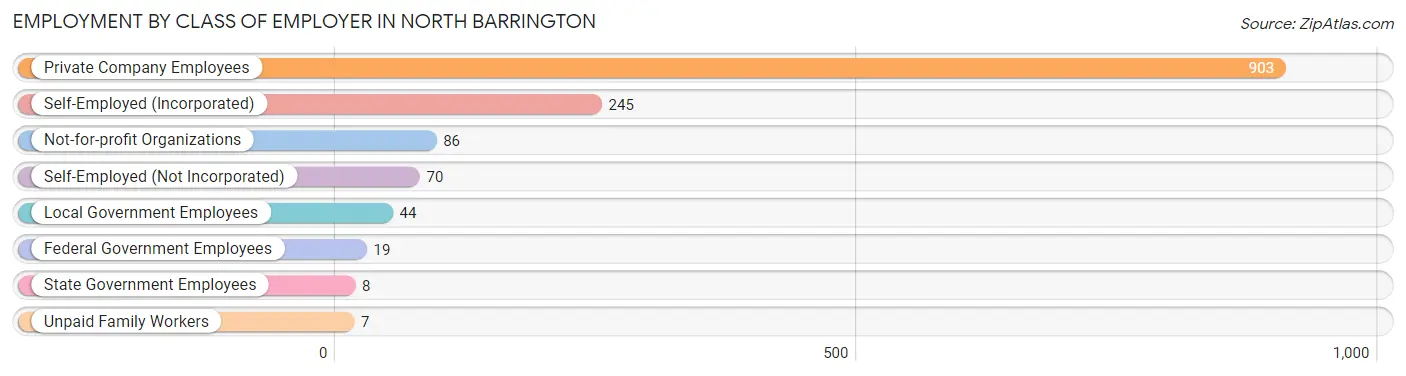
| Employer Class | # Employees | % Employees |
| Private Company Employees | 903 | 65.3% |
| Self-Employed (Incorporated) | 245 | 17.7% |
| Self-Employed (Not Incorporated) | 70 | 5.1% |
| Not-for-profit Organizations | 86 | 6.2% |
| Local Government Employees | 44 | 3.2% |
| State Government Employees | 8 | 0.6% |
| Federal Government Employees | 19 | 1.4% |
| Unpaid Family Workers | 7 | 0.5% |
| Total | 1,382 | 100.0% |
Employment Status by Age in North Barrington
According to the labor force statistics for North Barrington, out of the total population over 16 years of age (2,526), 59.6% or 1,505 individuals are in the labor force, with 5.0% or 75 of them unemployed. The age group with the highest labor force participation rate is 35 to 44 years, with 81.5% or 216 individuals in the labor force. Within the labor force, the 45 to 54 years age range has the highest percentage of unemployed individuals, with 10.5% or 47 of them being unemployed.
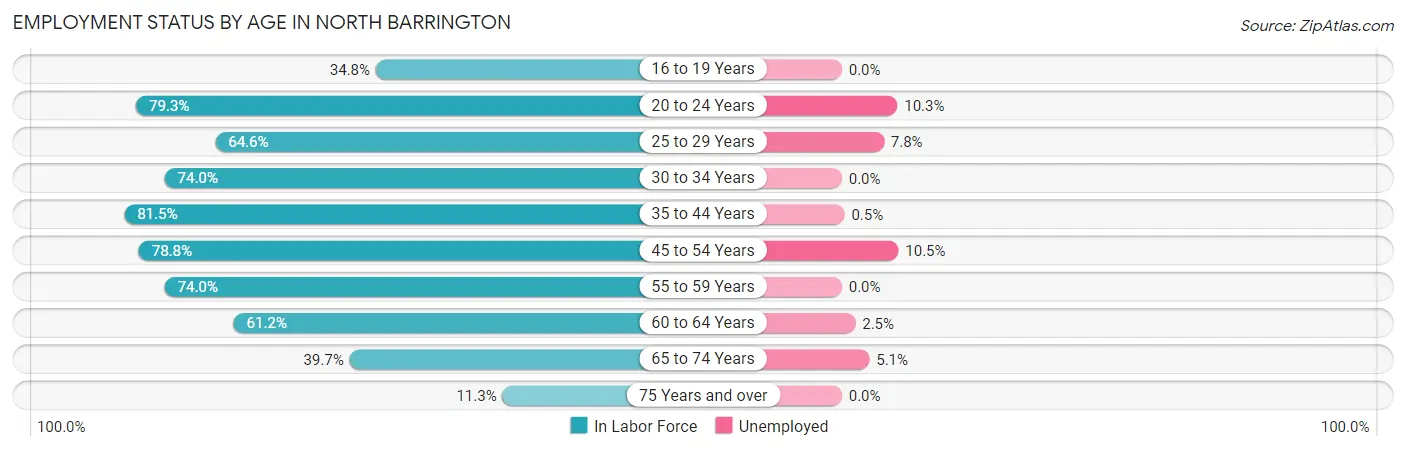
| Age Bracket | In Labor Force | Unemployed |
| 16 to 19 Years | 88 (34.8%) | 0 (0.0%) |
| 20 to 24 Years | 107 (79.3%) | 11 (10.3%) |
| 25 to 29 Years | 51 (64.6%) | 4 (7.8%) |
| 30 to 34 Years | 57 (74.0%) | 0 (0.0%) |
| 35 to 44 Years | 216 (81.5%) | 1 (0.5%) |
| 45 to 54 Years | 447 (78.8%) | 47 (10.5%) |
| 55 to 59 Years | 199 (74.0%) | 0 (0.0%) |
| 60 to 64 Years | 158 (61.2%) | 4 (2.5%) |
| 65 to 74 Years | 156 (39.7%) | 8 (5.1%) |
| 75 Years and over | 26 (11.3%) | 0 (0.0%) |
| Total | 1,505 (59.6%) | 75 (5.0%) |
Employment Status by Educational Attainment in North Barrington
According to labor force statistics for North Barrington, 74.5% of individuals (1,129) out of the total population between 25 and 64 years of age (1,515) are in the labor force, with 5.0% or 56 of them being unemployed. The group with the highest labor force participation rate are those with the educational attainment of high school diploma, with 76.2% or 77 individuals in the labor force. Within the labor force, individuals with high school diploma education have the highest percentage of unemployment, with 18.2% or 14 of them being unemployed.
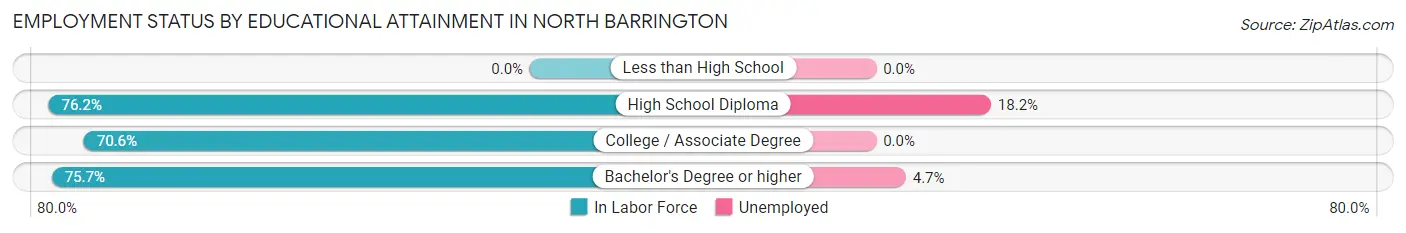
| Educational Attainment | In Labor Force | Unemployed |
| Less than High School | 0 (0.0%) | 0 (0.0%) |
| High School Diploma | 77 (76.2%) | 18 (18.2%) |
| College / Associate Degree | 163 (70.6%) | 0 (0.0%) |
| Bachelor's Degree or higher | 888 (75.7%) | 55 (4.7%) |
| Total | 1,129 (74.5%) | 76 (5.0%) |
Employment Occupations by Sex in North Barrington
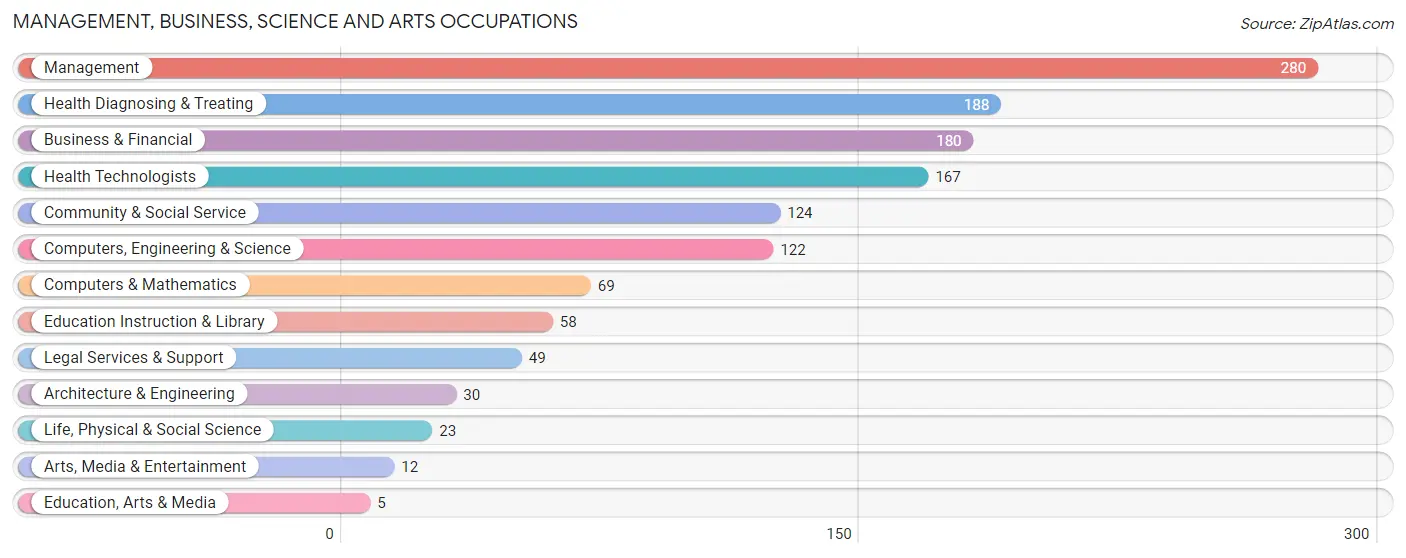
Management, Business, Science and Arts Occupations
The most common Management, Business, Science and Arts occupations in North Barrington are Management (280 | 19.6%), Health Diagnosing & Treating (188 | 13.2%), Business & Financial (180 | 12.6%), Health Technologists (167 | 11.7%), and Community & Social Service (124 | 8.7%).
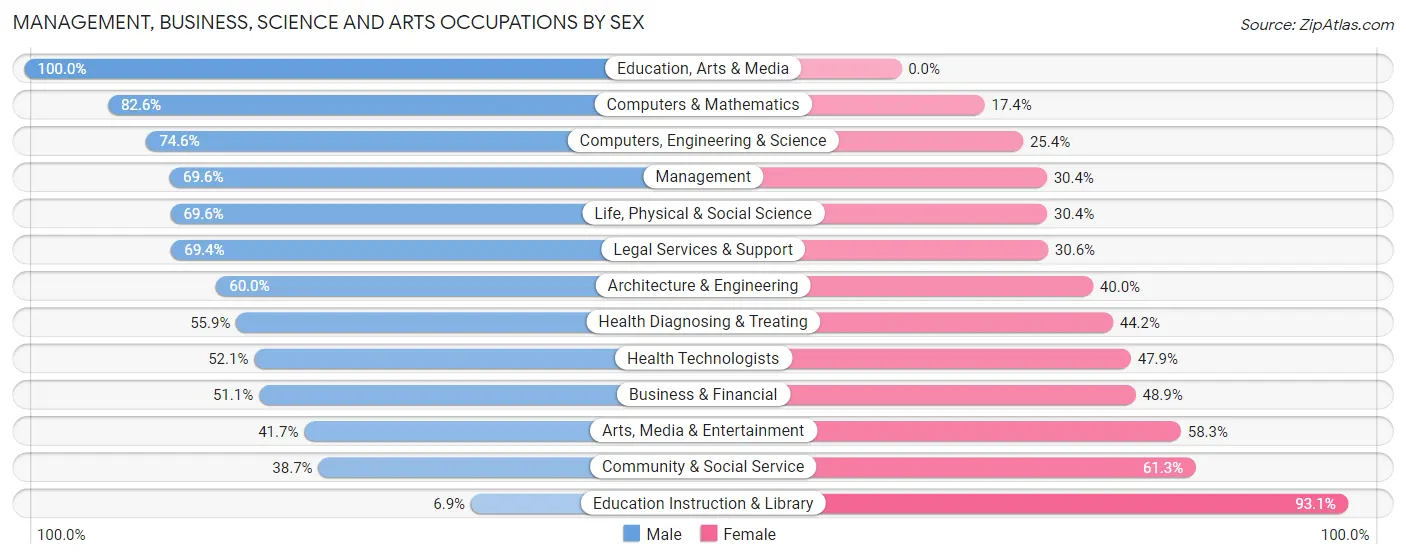
Management, Business, Science and Arts Occupations by Sex
Within the Management, Business, Science and Arts occupations in North Barrington, the most male-oriented occupations are Education, Arts & Media (100.0%), Computers & Mathematics (82.6%), and Computers, Engineering & Science (74.6%), while the most female-oriented occupations are Education Instruction & Library (93.1%), Community & Social Service (61.3%), and Arts, Media & Entertainment (58.3%).
| Occupation | Male | Female |
| Management | 195 (69.6%) | 85 (30.4%) |
| Business & Financial | 92 (51.1%) | 88 (48.9%) |
| Computers, Engineering & Science | 91 (74.6%) | 31 (25.4%) |
| Computers & Mathematics | 57 (82.6%) | 12 (17.4%) |
| Architecture & Engineering | 18 (60.0%) | 12 (40.0%) |
| Life, Physical & Social Science | 16 (69.6%) | 7 (30.4%) |
| Community & Social Service | 48 (38.7%) | 76 (61.3%) |
| Education, Arts & Media | 5 (100.0%) | 0 (0.0%) |
| Legal Services & Support | 34 (69.4%) | 15 (30.6%) |
| Education Instruction & Library | 4 (6.9%) | 54 (93.1%) |
| Arts, Media & Entertainment | 5 (41.7%) | 7 (58.3%) |
| Health Diagnosing & Treating | 105 (55.8%) | 83 (44.2%) |
| Health Technologists | 87 (52.1%) | 80 (47.9%) |
| Total (Category) | 531 (59.4%) | 363 (40.6%) |
| Total (Overall) | 853 (59.7%) | 577 (40.4%) |
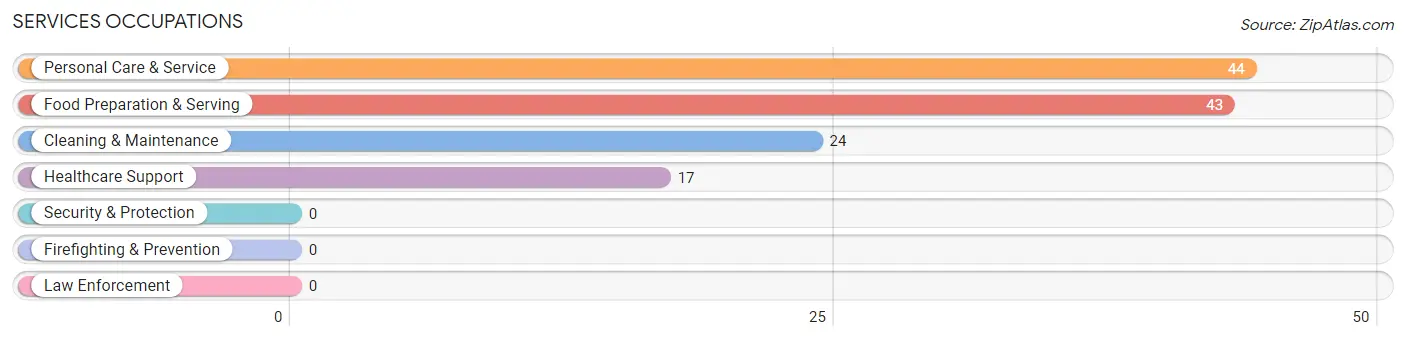
Services Occupations
The most common Services occupations in North Barrington are Personal Care & Service (44 | 3.1%), Food Preparation & Serving (43 | 3.0%), Cleaning & Maintenance (24 | 1.7%), and Healthcare Support (17 | 1.2%).
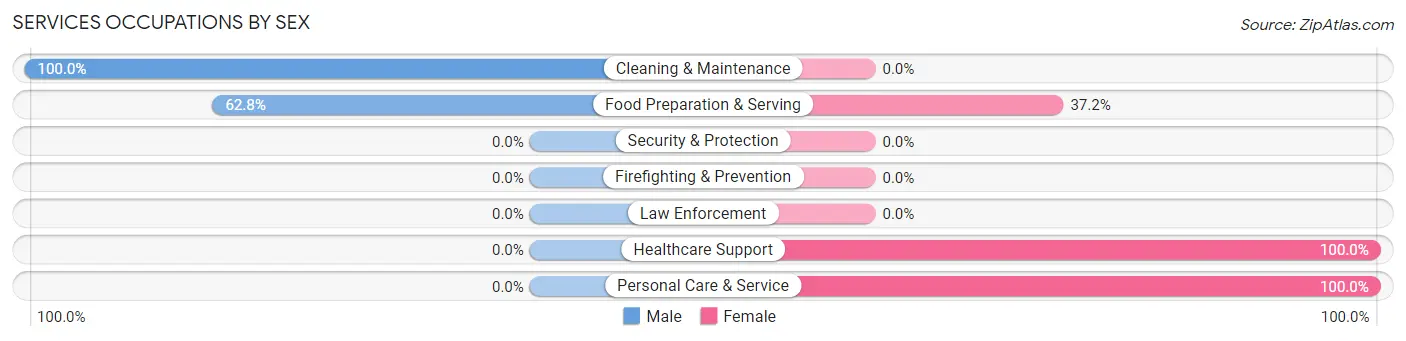
Services Occupations by Sex
Within the Services occupations in North Barrington, the most male-oriented occupations are Cleaning & Maintenance (100.0%), and Food Preparation & Serving (62.8%), while the most female-oriented occupations are Healthcare Support (100.0%), Personal Care & Service (100.0%), and Food Preparation & Serving (37.2%).
| Occupation | Male | Female |
| Healthcare Support | 0 (0.0%) | 17 (100.0%) |
| Security & Protection | 0 (0.0%) | 0 (0.0%) |
| Firefighting & Prevention | 0 (0.0%) | 0 (0.0%) |
| Law Enforcement | 0 (0.0%) | 0 (0.0%) |
| Food Preparation & Serving | 27 (62.8%) | 16 (37.2%) |
| Cleaning & Maintenance | 24 (100.0%) | 0 (0.0%) |
| Personal Care & Service | 0 (0.0%) | 44 (100.0%) |
| Total (Category) | 51 (39.8%) | 77 (60.2%) |
| Total (Overall) | 853 (59.7%) | 577 (40.4%) |
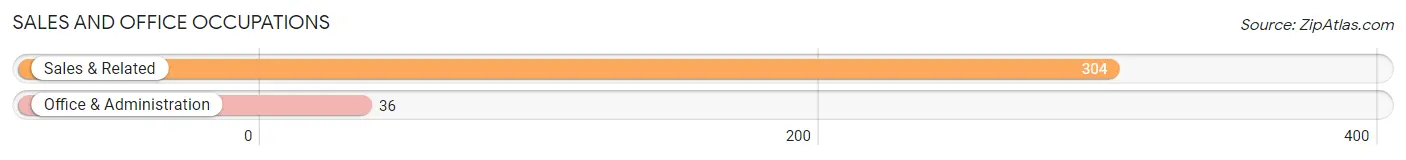
Sales and Office Occupations
The most common Sales and Office occupations in North Barrington are Sales & Related (304 | 21.3%), and Office & Administration (36 | 2.5%).
Sales and Office Occupations by Sex
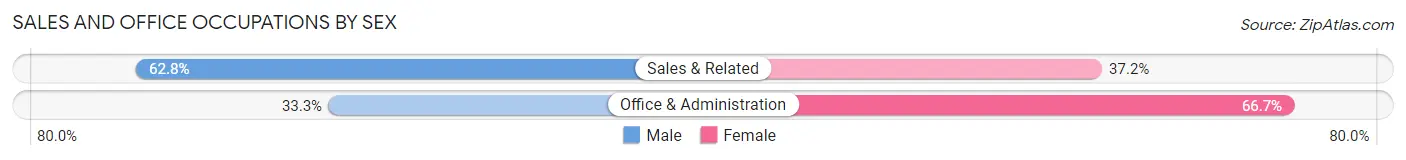
| Occupation | Male | Female |
| Sales & Related | 191 (62.8%) | 113 (37.2%) |
| Office & Administration | 12 (33.3%) | 24 (66.7%) |
| Total (Category) | 203 (59.7%) | 137 (40.3%) |
| Total (Overall) | 853 (59.7%) | 577 (40.4%) |
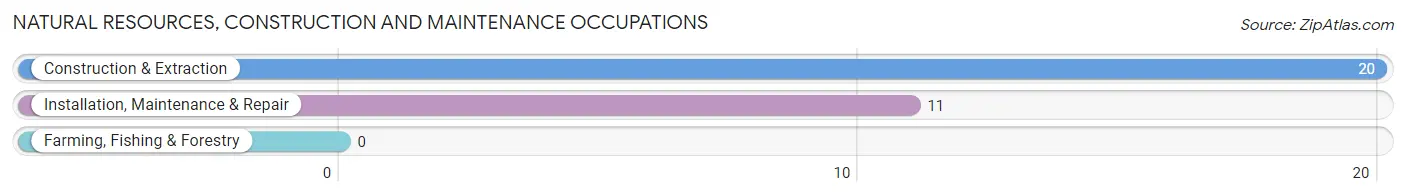
Natural Resources, Construction and Maintenance Occupations
The most common Natural Resources, Construction and Maintenance occupations in North Barrington are Construction & Extraction (20 | 1.4%), and Installation, Maintenance & Repair (11 | 0.8%).
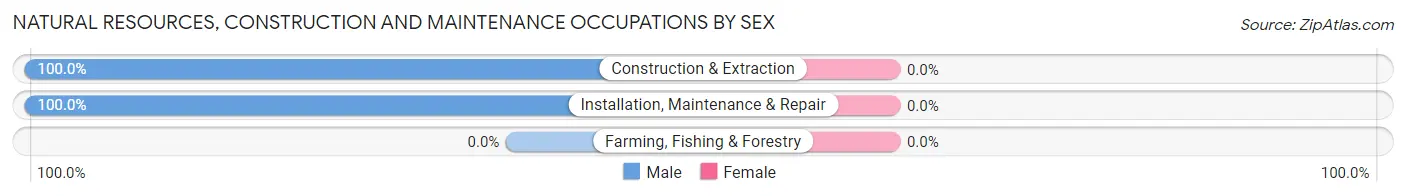
Natural Resources, Construction and Maintenance Occupations by Sex
| Occupation | Male | Female |
| Farming, Fishing & Forestry | 0 (0.0%) | 0 (0.0%) |
| Construction & Extraction | 20 (100.0%) | 0 (0.0%) |
| Installation, Maintenance & Repair | 11 (100.0%) | 0 (0.0%) |
| Total (Category) | 31 (100.0%) | 0 (0.0%) |
| Total (Overall) | 853 (59.7%) | 577 (40.4%) |
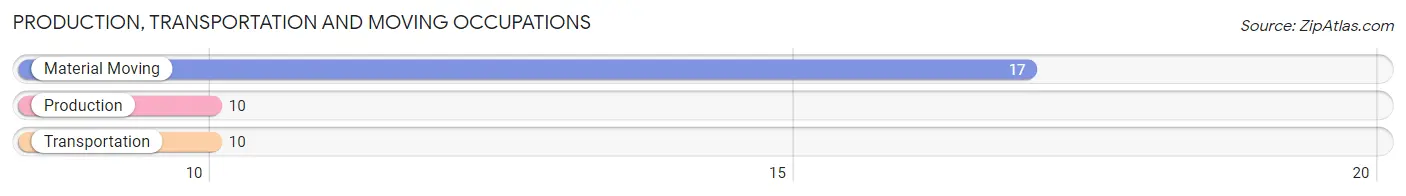
Production, Transportation and Moving Occupations
The most common Production, Transportation and Moving occupations in North Barrington are Material Moving (17 | 1.2%), Production (10 | 0.7%), and Transportation (10 | 0.7%).
Production, Transportation and Moving Occupations by Sex
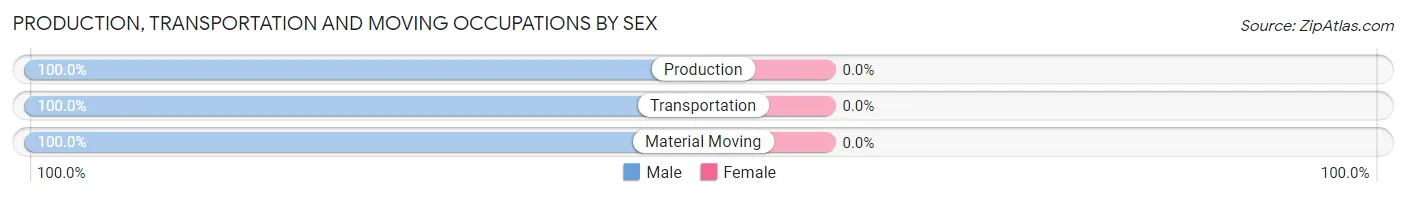
| Occupation | Male | Female |
| Production | 10 (100.0%) | 0 (0.0%) |
| Transportation | 10 (100.0%) | 0 (0.0%) |
| Material Moving | 17 (100.0%) | 0 (0.0%) |
| Total (Category) | 37 (100.0%) | 0 (0.0%) |
| Total (Overall) | 853 (59.7%) | 577 (40.4%) |
Employment Industries by Sex in North Barrington
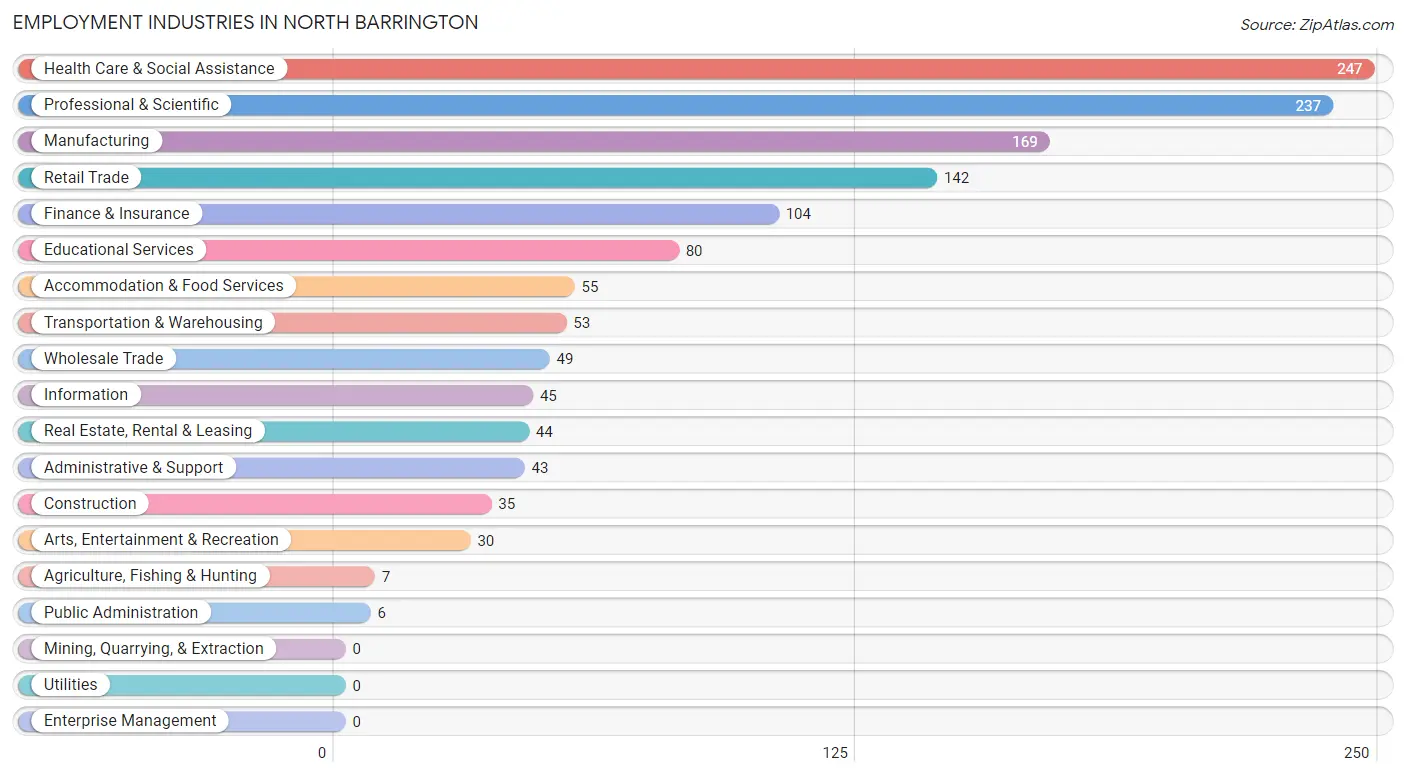
Employment Industries in North Barrington
The major employment industries in North Barrington include Health Care & Social Assistance (247 | 17.3%), Professional & Scientific (237 | 16.6%), Manufacturing (169 | 11.8%), Retail Trade (142 | 9.9%), and Finance & Insurance (104 | 7.3%).
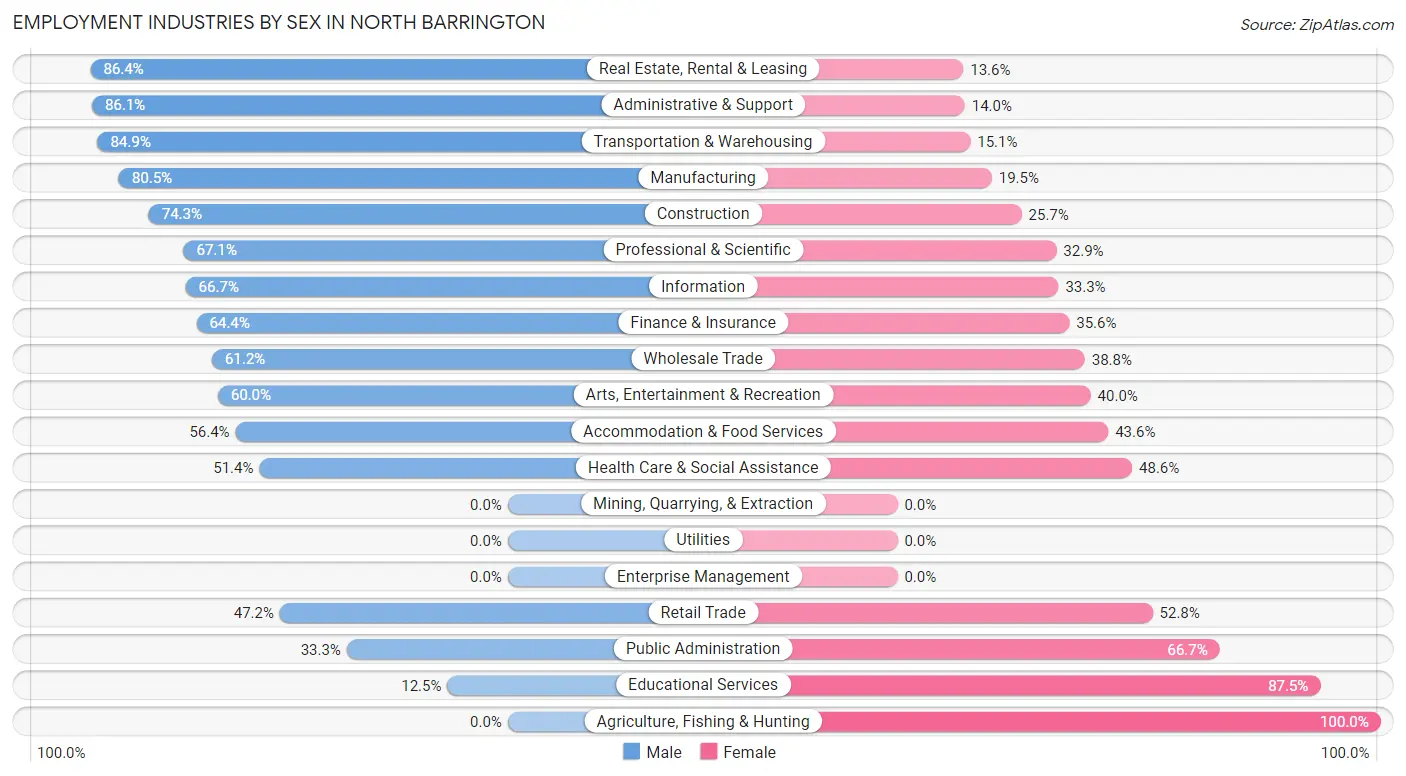
Employment Industries by Sex in North Barrington
The North Barrington industries that see more men than women are Real Estate, Rental & Leasing (86.4%), Administrative & Support (86.1%), and Transportation & Warehousing (84.9%), whereas the industries that tend to have a higher number of women are Agriculture, Fishing & Hunting (100.0%), Educational Services (87.5%), and Public Administration (66.7%).
| Industry | Male | Female |
| Agriculture, Fishing & Hunting | 0 (0.0%) | 7 (100.0%) |
| Mining, Quarrying, & Extraction | 0 (0.0%) | 0 (0.0%) |
| Construction | 26 (74.3%) | 9 (25.7%) |
| Manufacturing | 136 (80.5%) | 33 (19.5%) |
| Wholesale Trade | 30 (61.2%) | 19 (38.8%) |
| Retail Trade | 67 (47.2%) | 75 (52.8%) |
| Transportation & Warehousing | 45 (84.9%) | 8 (15.1%) |
| Utilities | 0 (0.0%) | 0 (0.0%) |
| Information | 30 (66.7%) | 15 (33.3%) |
| Finance & Insurance | 67 (64.4%) | 37 (35.6%) |
| Real Estate, Rental & Leasing | 38 (86.4%) | 6 (13.6%) |
| Professional & Scientific | 159 (67.1%) | 78 (32.9%) |
| Enterprise Management | 0 (0.0%) | 0 (0.0%) |
| Administrative & Support | 37 (86.1%) | 6 (14.0%) |
| Educational Services | 10 (12.5%) | 70 (87.5%) |
| Health Care & Social Assistance | 127 (51.4%) | 120 (48.6%) |
| Arts, Entertainment & Recreation | 18 (60.0%) | 12 (40.0%) |
| Accommodation & Food Services | 31 (56.4%) | 24 (43.6%) |
| Public Administration | 2 (33.3%) | 4 (66.7%) |
| Total | 853 (59.7%) | 577 (40.4%) |
Education in North Barrington
School Enrollment in North Barrington
The most common levels of schooling among the 866 students in North Barrington are high school (265 | 30.6%), middle school (253 | 29.2%), and elementary school (122 | 14.1%).
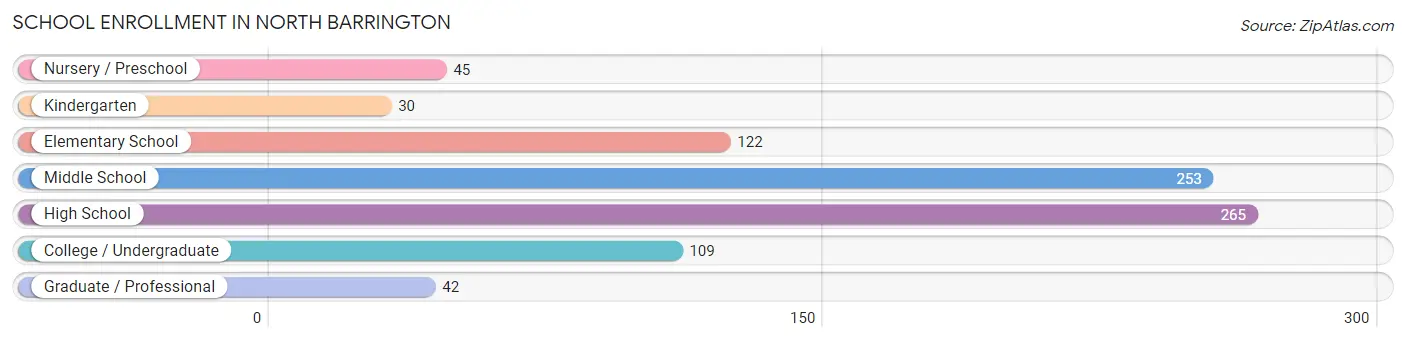
| School Level | # Students | % Students |
| Nursery / Preschool | 45 | 5.2% |
| Kindergarten | 30 | 3.5% |
| Elementary School | 122 | 14.1% |
| Middle School | 253 | 29.2% |
| High School | 265 | 30.6% |
| College / Undergraduate | 109 | 12.6% |
| Graduate / Professional | 42 | 4.9% |
| Total | 866 | 100.0% |
School Enrollment by Age by Funding Source in North Barrington
Out of a total of 866 students who are enrolled in schools in North Barrington, 132 (15.2%) attend a private institution, while the remaining 734 (84.8%) are enrolled in public schools. The age group of 25 to 34 year olds has the highest likelihood of being enrolled in private schools, with 11 (100.0% in the age bracket) enrolled. Conversely, the age group of 18 to 19 year olds has the lowest likelihood of being enrolled in a private school, with 89 (100.0% in the age bracket) attending a public institution.
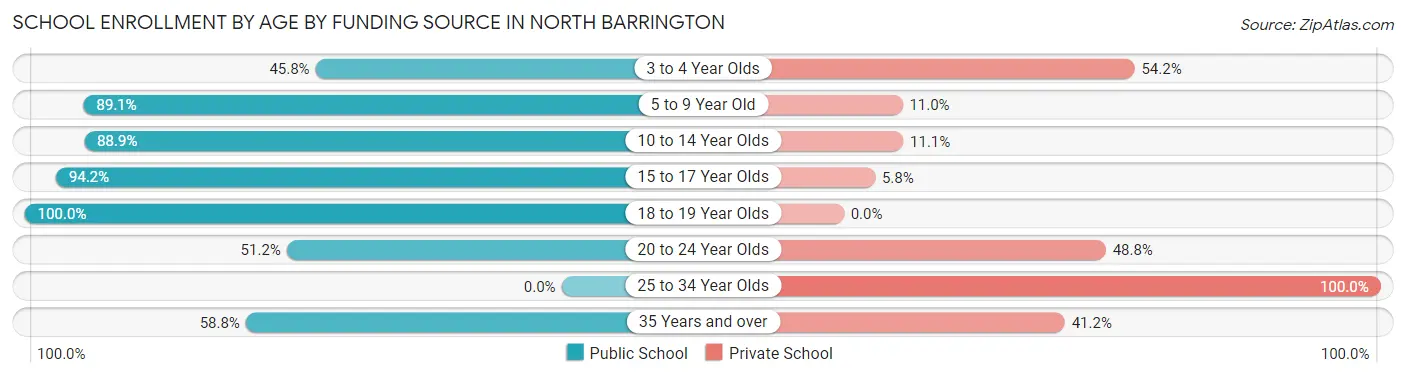
| Age Bracket | Public School | Private School |
| 3 to 4 Year Olds | 11 (45.8%) | 13 (54.2%) |
| 5 to 9 Year Old | 122 (89.0%) | 15 (11.0%) |
| 10 to 14 Year Olds | 265 (88.9%) | 33 (11.1%) |
| 15 to 17 Year Olds | 194 (94.2%) | 12 (5.8%) |
| 18 to 19 Year Olds | 89 (100.0%) | 0 (0.0%) |
| 20 to 24 Year Olds | 43 (51.2%) | 41 (48.8%) |
| 25 to 34 Year Olds | 0 (0.0%) | 11 (100.0%) |
| 35 Years and over | 10 (58.8%) | 7 (41.2%) |
| Total | 734 (84.8%) | 132 (15.2%) |
Educational Attainment by Field of Study in North Barrington
Business (440 | 25.2%), engineering (198 | 11.4%), social sciences (168 | 9.6%), science & technology (167 | 9.6%), and communications (122 | 7.0%) are the most common fields of study among 1,745 individuals in North Barrington who have obtained a bachelor's degree or higher.
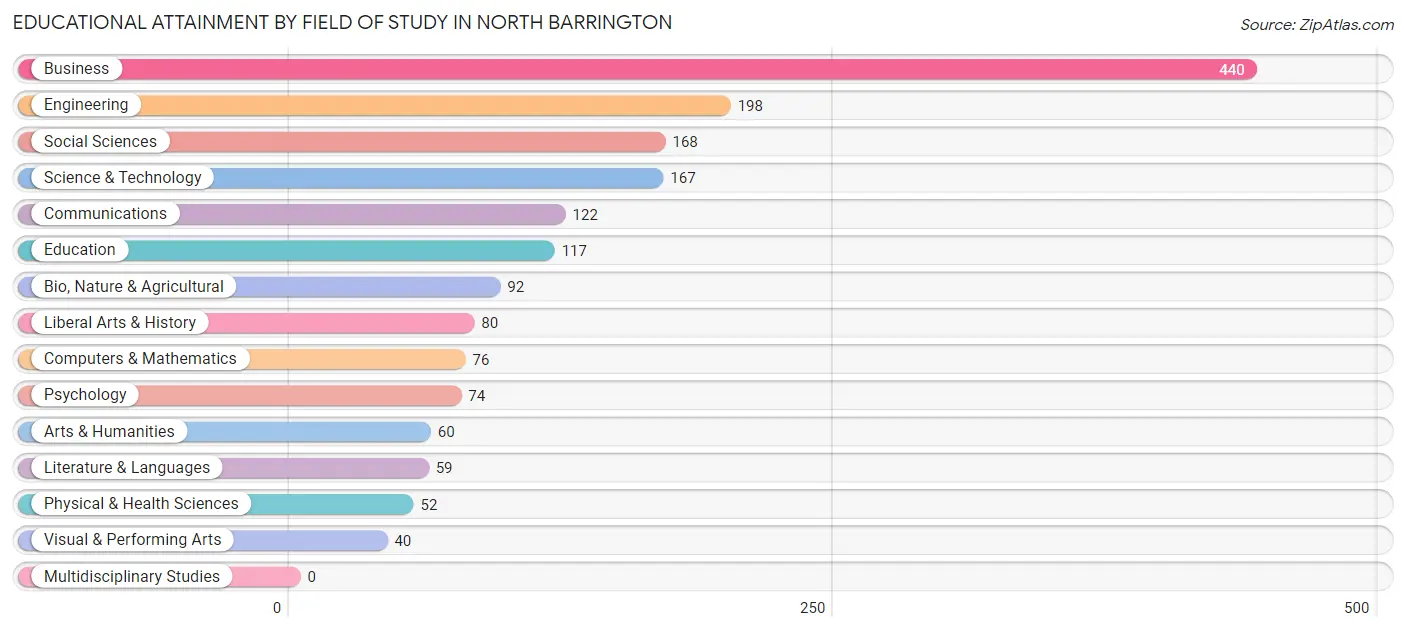
| Field of Study | # Graduates | % Graduates |
| Computers & Mathematics | 76 | 4.4% |
| Bio, Nature & Agricultural | 92 | 5.3% |
| Physical & Health Sciences | 52 | 3.0% |
| Psychology | 74 | 4.2% |
| Social Sciences | 168 | 9.6% |
| Engineering | 198 | 11.4% |
| Multidisciplinary Studies | 0 | 0.0% |
| Science & Technology | 167 | 9.6% |
| Business | 440 | 25.2% |
| Education | 117 | 6.7% |
| Literature & Languages | 59 | 3.4% |
| Liberal Arts & History | 80 | 4.6% |
| Visual & Performing Arts | 40 | 2.3% |
| Communications | 122 | 7.0% |
| Arts & Humanities | 60 | 3.4% |
| Total | 1,745 | 100.0% |
Transportation & Commute in North Barrington
Vehicle Availability by Sex in North Barrington
The most prevalent vehicle ownership categories in North Barrington are males with 2 vehicles (455, accounting for 55.1%) and females with 2 vehicles (264, making up 81.8%).
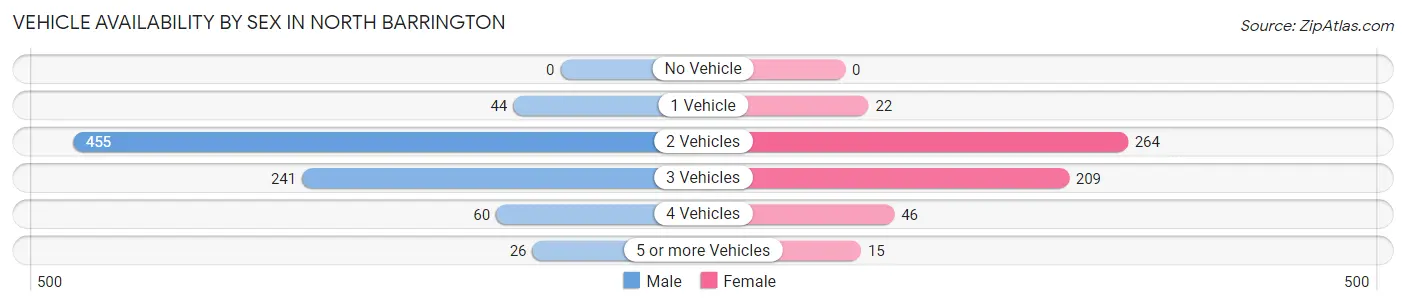
| Vehicles Available | Male | Female |
| No Vehicle | 0 (0.0%) | 0 (0.0%) |
| 1 Vehicle | 44 (5.3%) | 22 (4.0%) |
| 2 Vehicles | 455 (55.1%) | 264 (47.5%) |
| 3 Vehicles | 241 (29.2%) | 209 (37.6%) |
| 4 Vehicles | 60 (7.3%) | 46 (8.3%) |
| 5 or more Vehicles | 26 (3.2%) | 15 (2.7%) |
| Total | 826 (100.0%) | 556 (100.0%) |
Commute Time in North Barrington
The most frequently occuring commute durations in North Barrington are 30 to 34 minutes (142 commuters, 14.5%), 45 to 59 minutes (108 commuters, 11.0%), and 10 to 14 minutes (101 commuters, 10.3%).
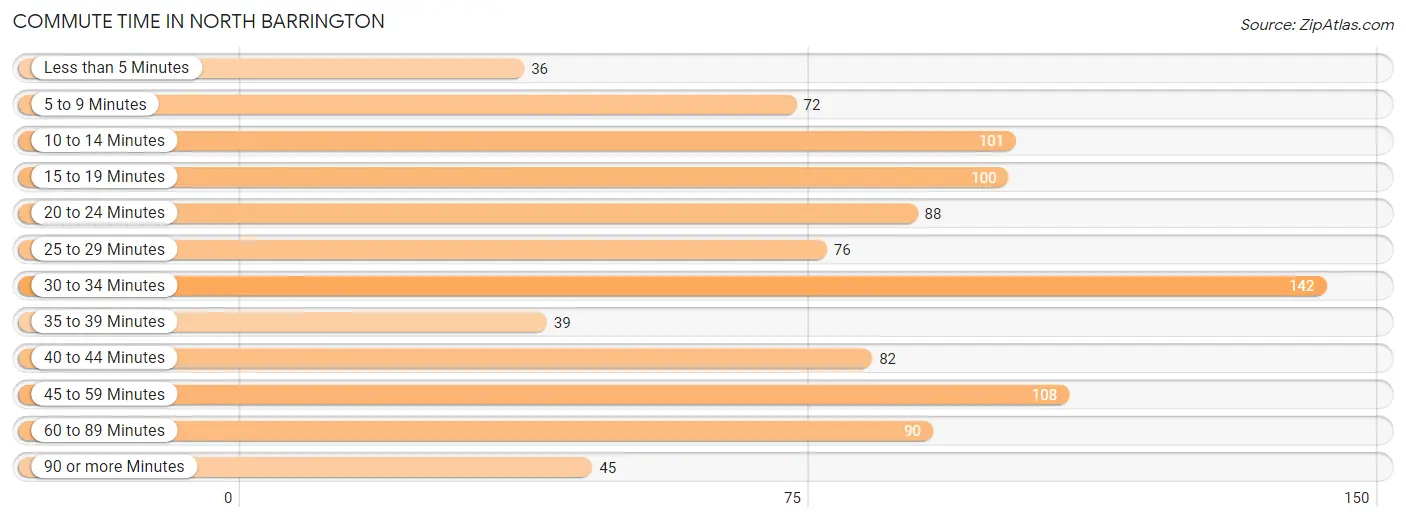
| Commute Time | # Commuters | % Commuters |
| Less than 5 Minutes | 36 | 3.7% |
| 5 to 9 Minutes | 72 | 7.3% |
| 10 to 14 Minutes | 101 | 10.3% |
| 15 to 19 Minutes | 100 | 10.2% |
| 20 to 24 Minutes | 88 | 9.0% |
| 25 to 29 Minutes | 76 | 7.8% |
| 30 to 34 Minutes | 142 | 14.5% |
| 35 to 39 Minutes | 39 | 4.0% |
| 40 to 44 Minutes | 82 | 8.4% |
| 45 to 59 Minutes | 108 | 11.0% |
| 60 to 89 Minutes | 90 | 9.2% |
| 90 or more Minutes | 45 | 4.6% |
Commute Time by Sex in North Barrington
The most common commute times in North Barrington are 30 to 34 minutes (119 commuters, 20.7%) for males and 45 to 59 minutes (64 commuters, 15.8%) for females.
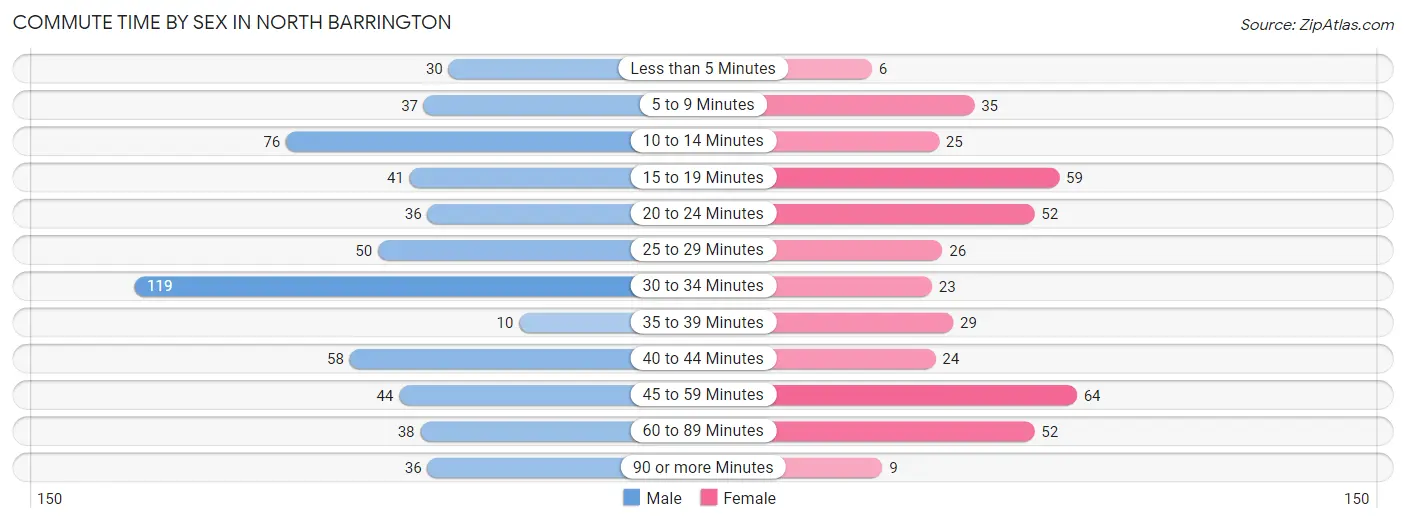
| Commute Time | Male | Female |
| Less than 5 Minutes | 30 (5.2%) | 6 (1.5%) |
| 5 to 9 Minutes | 37 (6.4%) | 35 (8.7%) |
| 10 to 14 Minutes | 76 (13.2%) | 25 (6.2%) |
| 15 to 19 Minutes | 41 (7.1%) | 59 (14.6%) |
| 20 to 24 Minutes | 36 (6.3%) | 52 (12.9%) |
| 25 to 29 Minutes | 50 (8.7%) | 26 (6.4%) |
| 30 to 34 Minutes | 119 (20.7%) | 23 (5.7%) |
| 35 to 39 Minutes | 10 (1.7%) | 29 (7.2%) |
| 40 to 44 Minutes | 58 (10.1%) | 24 (5.9%) |
| 45 to 59 Minutes | 44 (7.6%) | 64 (15.8%) |
| 60 to 89 Minutes | 38 (6.6%) | 52 (12.9%) |
| 90 or more Minutes | 36 (6.3%) | 9 (2.2%) |
Time of Departure to Work by Sex in North Barrington
The most frequent times of departure to work in North Barrington are 7:30 AM to 7:59 AM (113, 19.7%) for males and 8:00 AM to 8:29 AM (106, 26.2%) for females.
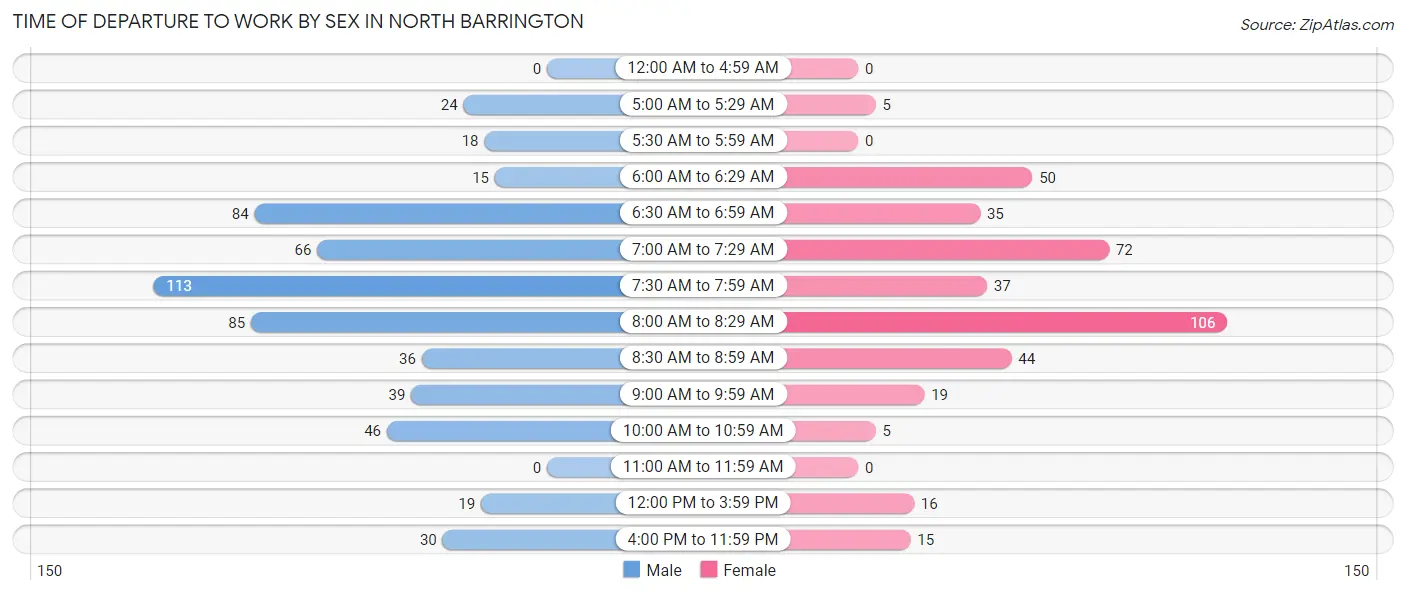
| Time of Departure | Male | Female |
| 12:00 AM to 4:59 AM | 0 (0.0%) | 0 (0.0%) |
| 5:00 AM to 5:29 AM | 24 (4.2%) | 5 (1.2%) |
| 5:30 AM to 5:59 AM | 18 (3.1%) | 0 (0.0%) |
| 6:00 AM to 6:29 AM | 15 (2.6%) | 50 (12.4%) |
| 6:30 AM to 6:59 AM | 84 (14.6%) | 35 (8.7%) |
| 7:00 AM to 7:29 AM | 66 (11.5%) | 72 (17.8%) |
| 7:30 AM to 7:59 AM | 113 (19.7%) | 37 (9.2%) |
| 8:00 AM to 8:29 AM | 85 (14.8%) | 106 (26.2%) |
| 8:30 AM to 8:59 AM | 36 (6.3%) | 44 (10.9%) |
| 9:00 AM to 9:59 AM | 39 (6.8%) | 19 (4.7%) |
| 10:00 AM to 10:59 AM | 46 (8.0%) | 5 (1.2%) |
| 11:00 AM to 11:59 AM | 0 (0.0%) | 0 (0.0%) |
| 12:00 PM to 3:59 PM | 19 (3.3%) | 16 (4.0%) |
| 4:00 PM to 11:59 PM | 30 (5.2%) | 15 (3.7%) |
| Total | 575 (100.0%) | 404 (100.0%) |
Housing Occupancy in North Barrington
Occupancy by Ownership in North Barrington
Of the total 1,081 dwellings in North Barrington, owner-occupied units account for 1,056 (97.7%), while renter-occupied units make up 25 (2.3%).
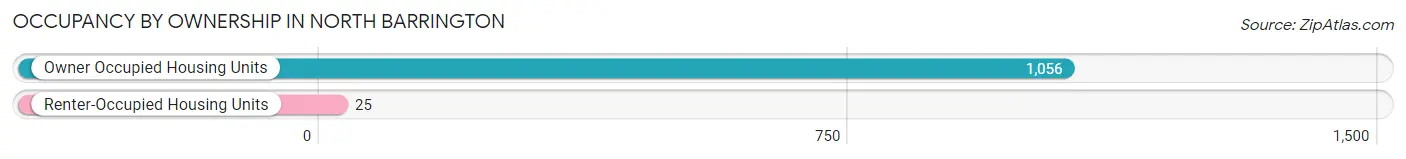
| Occupancy | # Housing Units | % Housing Units |
| Owner Occupied Housing Units | 1,056 | 97.7% |
| Renter-Occupied Housing Units | 25 | 2.3% |
| Total Occupied Housing Units | 1,081 | 100.0% |
Occupancy by Household Size in North Barrington
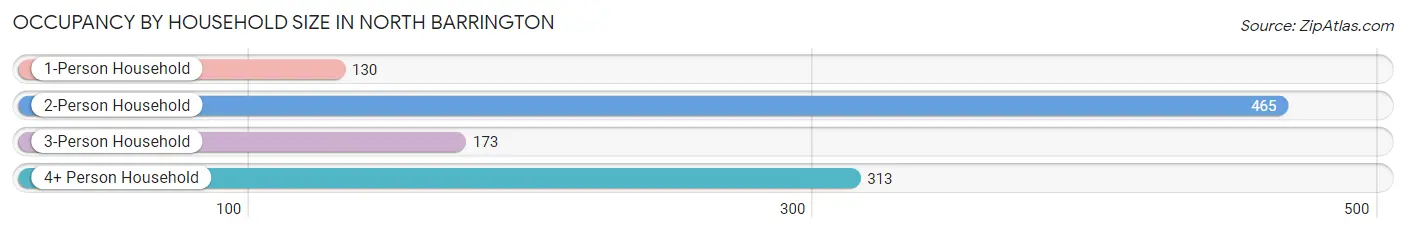
| Household Size | # Housing Units | % Housing Units |
| 1-Person Household | 130 | 12.0% |
| 2-Person Household | 465 | 43.0% |
| 3-Person Household | 173 | 16.0% |
| 4+ Person Household | 313 | 28.9% |
| Total Housing Units | 1,081 | 100.0% |
Occupancy by Ownership by Household Size in North Barrington
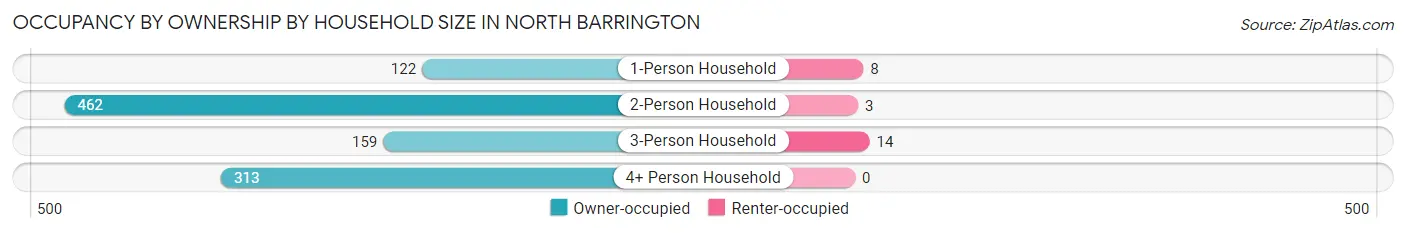
| Household Size | Owner-occupied | Renter-occupied |
| 1-Person Household | 122 (93.9%) | 8 (6.1%) |
| 2-Person Household | 462 (99.4%) | 3 (0.6%) |
| 3-Person Household | 159 (91.9%) | 14 (8.1%) |
| 4+ Person Household | 313 (100.0%) | 0 (0.0%) |
| Total Housing Units | 1,056 (97.7%) | 25 (2.3%) |
Occupancy by Educational Attainment in North Barrington
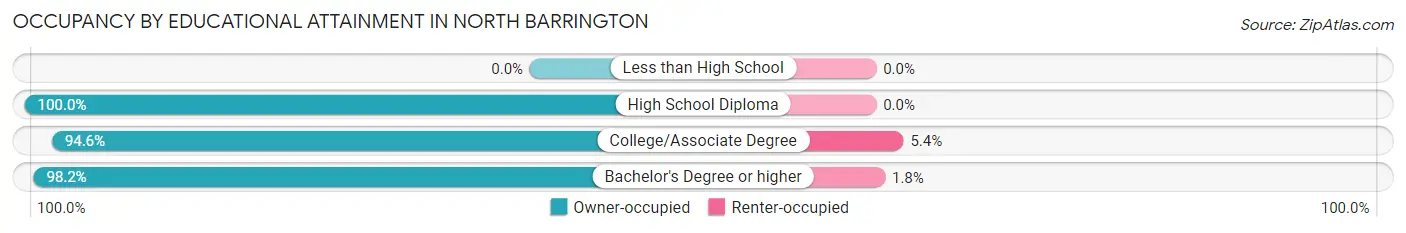
| Household Size | Owner-occupied | Renter-occupied |
| Less than High School | 0 (0.0%) | 0 (0.0%) |
| High School Diploma | 45 (100.0%) | 0 (0.0%) |
| College/Associate Degree | 175 (94.6%) | 10 (5.4%) |
| Bachelor's Degree or higher | 836 (98.2%) | 15 (1.8%) |
Occupancy by Age of Householder in North Barrington
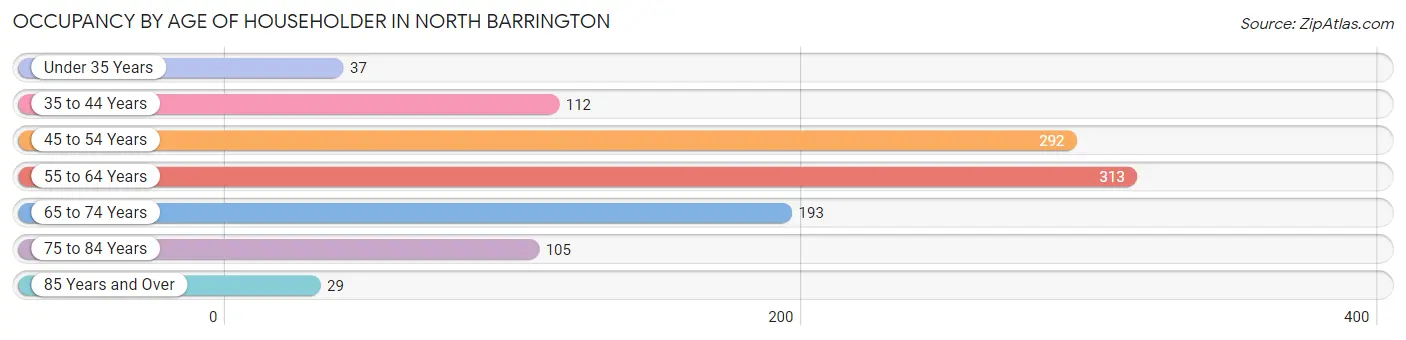
| Age Bracket | # Households | % Households |
| Under 35 Years | 37 | 3.4% |
| 35 to 44 Years | 112 | 10.4% |
| 45 to 54 Years | 292 | 27.0% |
| 55 to 64 Years | 313 | 28.9% |
| 65 to 74 Years | 193 | 17.8% |
| 75 to 84 Years | 105 | 9.7% |
| 85 Years and Over | 29 | 2.7% |
| Total | 1,081 | 100.0% |
Housing Finances in North Barrington
Median Income by Occupancy in North Barrington
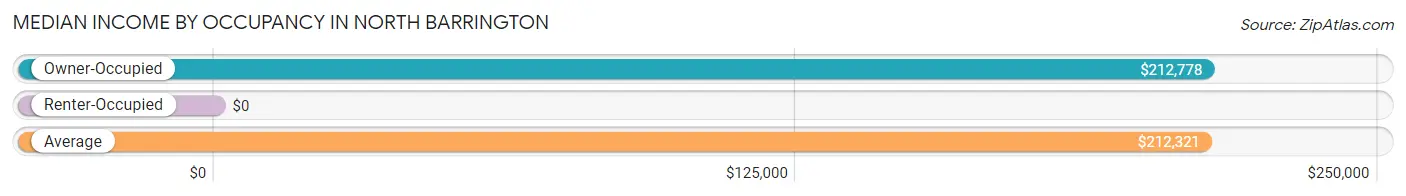
| Occupancy Type | # Households | Median Income |
| Owner-Occupied | 1,056 (97.7%) | $212,778 |
| Renter-Occupied | 25 (2.3%) | $0 |
| Average | 1,081 (100.0%) | $212,321 |
Occupancy by Householder Income Bracket in North Barrington
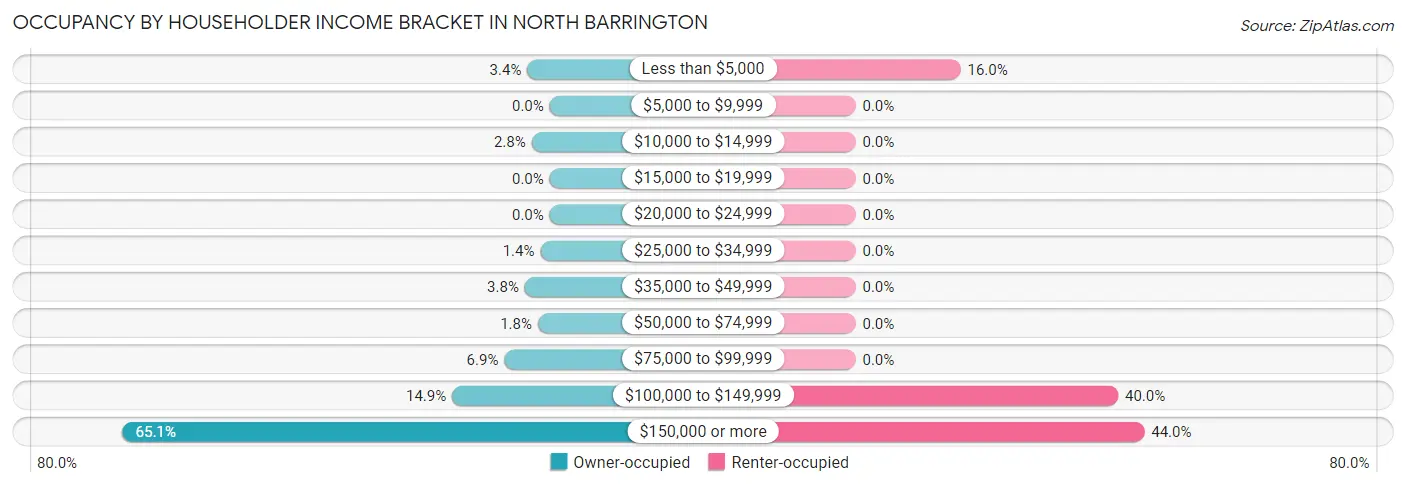
| Income Bracket | Owner-occupied | Renter-occupied |
| Less than $5,000 | 36 (3.4%) | 4 (16.0%) |
| $5,000 to $9,999 | 0 (0.0%) | 0 (0.0%) |
| $10,000 to $14,999 | 29 (2.8%) | 0 (0.0%) |
| $15,000 to $19,999 | 0 (0.0%) | 0 (0.0%) |
| $20,000 to $24,999 | 0 (0.0%) | 0 (0.0%) |
| $25,000 to $34,999 | 15 (1.4%) | 0 (0.0%) |
| $35,000 to $49,999 | 40 (3.8%) | 0 (0.0%) |
| $50,000 to $74,999 | 19 (1.8%) | 0 (0.0%) |
| $75,000 to $99,999 | 73 (6.9%) | 0 (0.0%) |
| $100,000 to $149,999 | 157 (14.9%) | 10 (40.0%) |
| $150,000 or more | 687 (65.1%) | 11 (44.0%) |
| Total | 1,056 (100.0%) | 25 (100.0%) |
Monthly Housing Cost Tiers in North Barrington
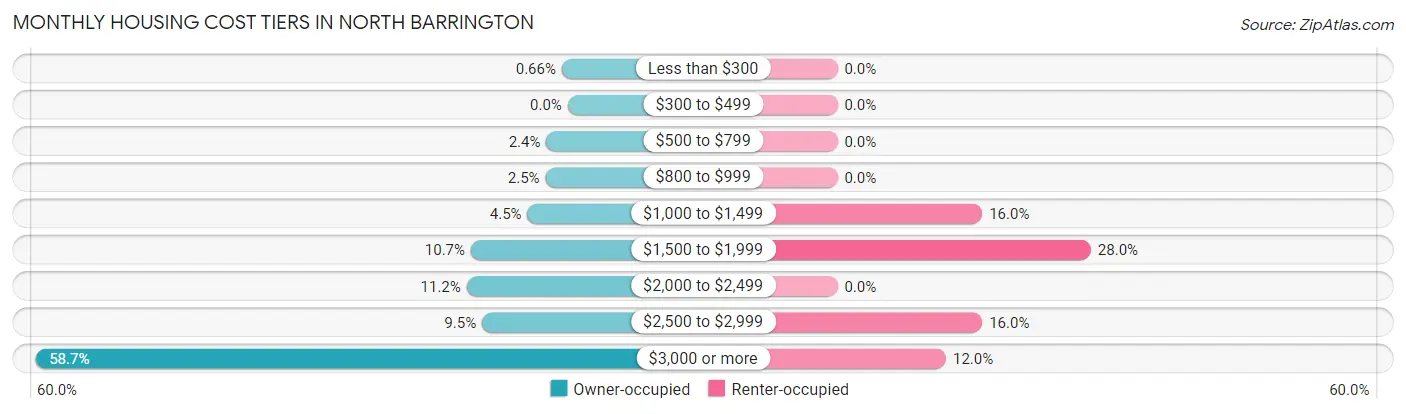
| Monthly Cost | Owner-occupied | Renter-occupied |
| Less than $300 | 7 (0.7%) | 0 (0.0%) |
| $300 to $499 | 0 (0.0%) | 0 (0.0%) |
| $500 to $799 | 25 (2.4%) | 0 (0.0%) |
| $800 to $999 | 26 (2.5%) | 0 (0.0%) |
| $1,000 to $1,499 | 47 (4.4%) | 4 (16.0%) |
| $1,500 to $1,999 | 113 (10.7%) | 7 (28.0%) |
| $2,000 to $2,499 | 118 (11.2%) | 0 (0.0%) |
| $2,500 to $2,999 | 100 (9.5%) | 4 (16.0%) |
| $3,000 or more | 620 (58.7%) | 3 (12.0%) |
| Total | 1,056 (100.0%) | 25 (100.0%) |
Physical Housing Characteristics in North Barrington
Housing Structures in North Barrington
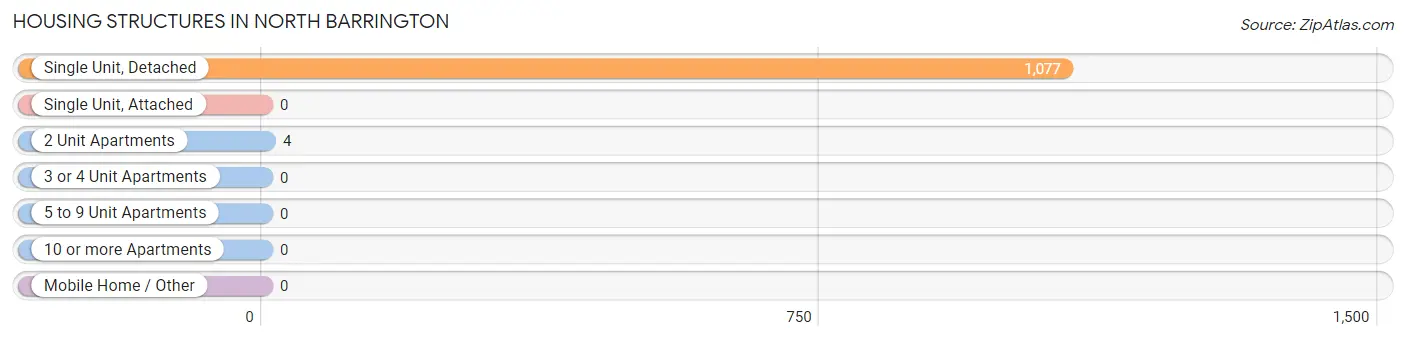
| Structure Type | # Housing Units | % Housing Units |
| Single Unit, Detached | 1,077 | 99.6% |
| Single Unit, Attached | 0 | 0.0% |
| 2 Unit Apartments | 4 | 0.4% |
| 3 or 4 Unit Apartments | 0 | 0.0% |
| 5 to 9 Unit Apartments | 0 | 0.0% |
| 10 or more Apartments | 0 | 0.0% |
| Mobile Home / Other | 0 | 0.0% |
| Total | 1,081 | 100.0% |
Housing Structures by Occupancy in North Barrington
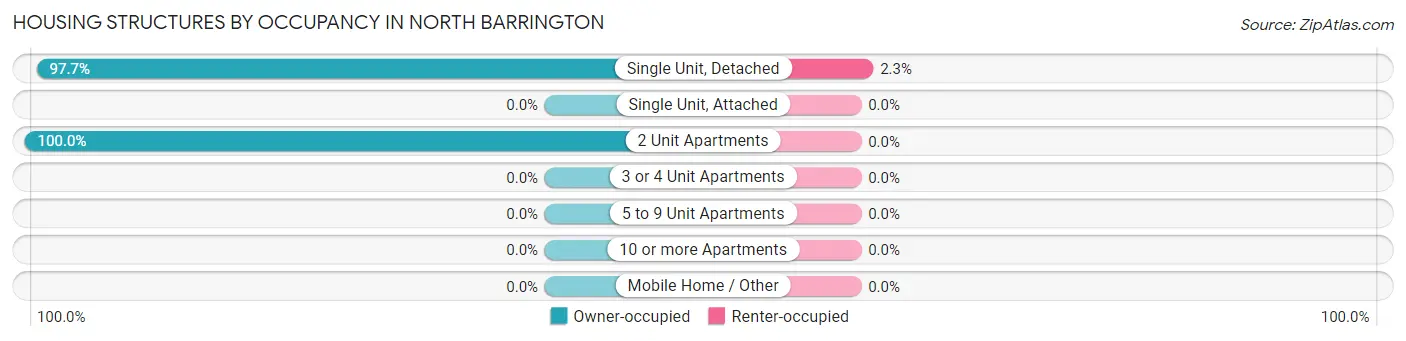
| Structure Type | Owner-occupied | Renter-occupied |
| Single Unit, Detached | 1,052 (97.7%) | 25 (2.3%) |
| Single Unit, Attached | 0 (0.0%) | 0 (0.0%) |
| 2 Unit Apartments | 4 (100.0%) | 0 (0.0%) |
| 3 or 4 Unit Apartments | 0 (0.0%) | 0 (0.0%) |
| 5 to 9 Unit Apartments | 0 (0.0%) | 0 (0.0%) |
| 10 or more Apartments | 0 (0.0%) | 0 (0.0%) |
| Mobile Home / Other | 0 (0.0%) | 0 (0.0%) |
| Total | 1,056 (97.7%) | 25 (2.3%) |
Housing Structures by Number of Rooms in North Barrington
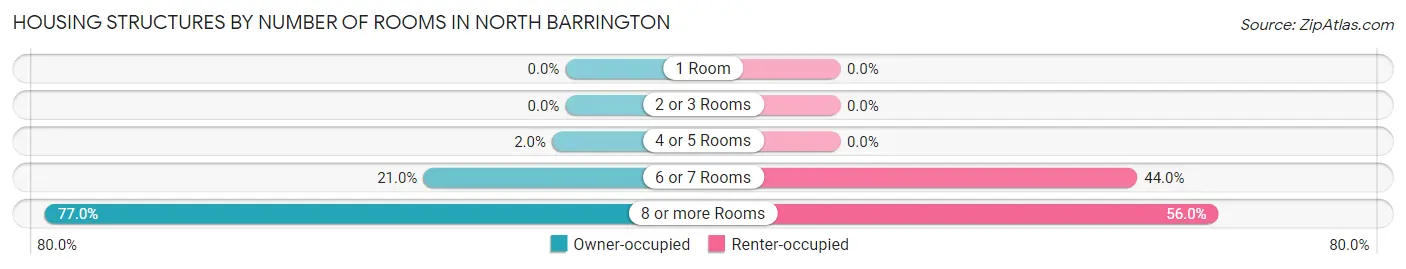
| Number of Rooms | Owner-occupied | Renter-occupied |
| 1 Room | 0 (0.0%) | 0 (0.0%) |
| 2 or 3 Rooms | 0 (0.0%) | 0 (0.0%) |
| 4 or 5 Rooms | 21 (2.0%) | 0 (0.0%) |
| 6 or 7 Rooms | 222 (21.0%) | 11 (44.0%) |
| 8 or more Rooms | 813 (77.0%) | 14 (56.0%) |
| Total | 1,056 (100.0%) | 25 (100.0%) |
Housing Structure by Heating Type in North Barrington
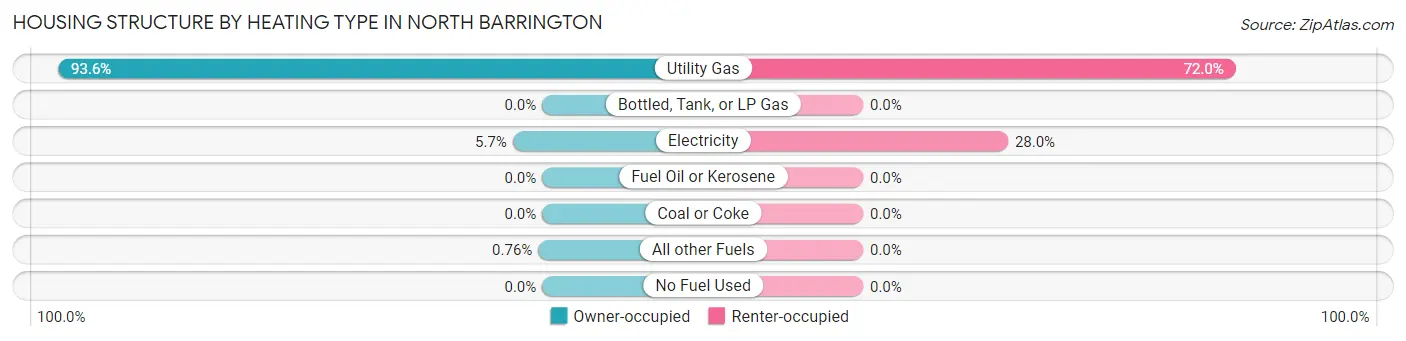
| Heating Type | Owner-occupied | Renter-occupied |
| Utility Gas | 988 (93.6%) | 18 (72.0%) |
| Bottled, Tank, or LP Gas | 0 (0.0%) | 0 (0.0%) |
| Electricity | 60 (5.7%) | 7 (28.0%) |
| Fuel Oil or Kerosene | 0 (0.0%) | 0 (0.0%) |
| Coal or Coke | 0 (0.0%) | 0 (0.0%) |
| All other Fuels | 8 (0.8%) | 0 (0.0%) |
| No Fuel Used | 0 (0.0%) | 0 (0.0%) |
| Total | 1,056 (100.0%) | 25 (100.0%) |
Household Vehicle Usage in North Barrington
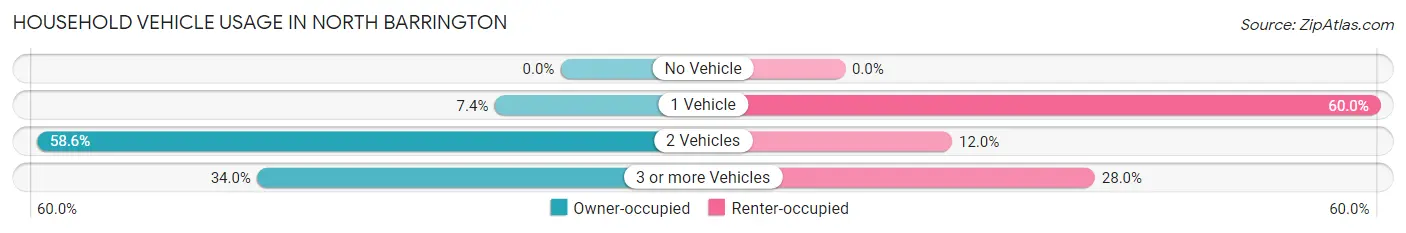
| Vehicles per Household | Owner-occupied | Renter-occupied |
| No Vehicle | 0 (0.0%) | 0 (0.0%) |
| 1 Vehicle | 78 (7.4%) | 15 (60.0%) |
| 2 Vehicles | 619 (58.6%) | 3 (12.0%) |
| 3 or more Vehicles | 359 (34.0%) | 7 (28.0%) |
| Total | 1,056 (100.0%) | 25 (100.0%) |
Real Estate & Mortgages in North Barrington
Real Estate and Mortgage Overview in North Barrington
| Characteristic | Without Mortgage | With Mortgage |
| Housing Units | 359 | 697 |
| Median Property Value | $753,100 | $645,800 |
| Median Household Income | $231,042 | $471 |
| Monthly Housing Costs | $1,501 | $558 |
| Real Estate Taxes | $10,001 | $7 |
Property Value by Mortgage Status in North Barrington
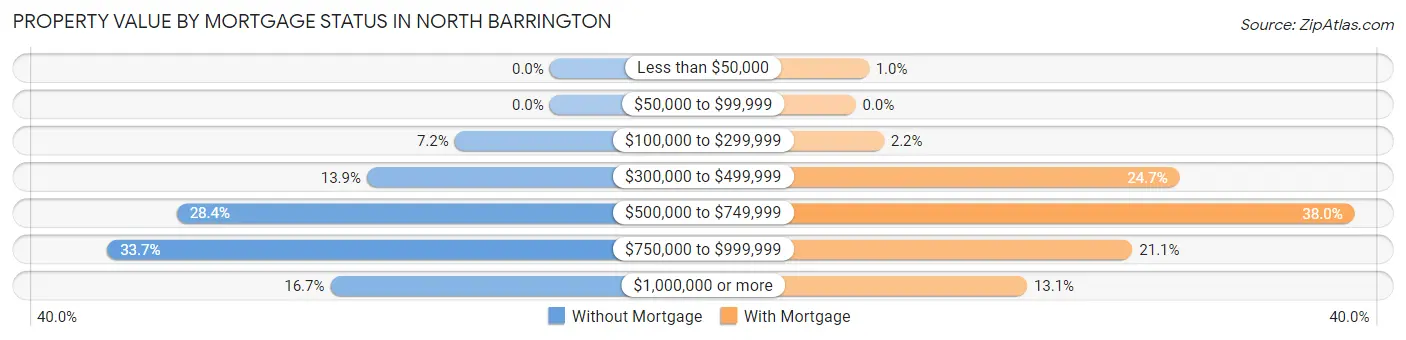
| Property Value | Without Mortgage | With Mortgage |
| Less than $50,000 | 0 (0.0%) | 7 (1.0%) |
| $50,000 to $99,999 | 0 (0.0%) | 0 (0.0%) |
| $100,000 to $299,999 | 26 (7.2%) | 15 (2.1%) |
| $300,000 to $499,999 | 50 (13.9%) | 172 (24.7%) |
| $500,000 to $749,999 | 102 (28.4%) | 265 (38.0%) |
| $750,000 to $999,999 | 121 (33.7%) | 147 (21.1%) |
| $1,000,000 or more | 60 (16.7%) | 91 (13.1%) |
| Total | 359 (100.0%) | 697 (100.0%) |
Household Income by Mortgage Status in North Barrington
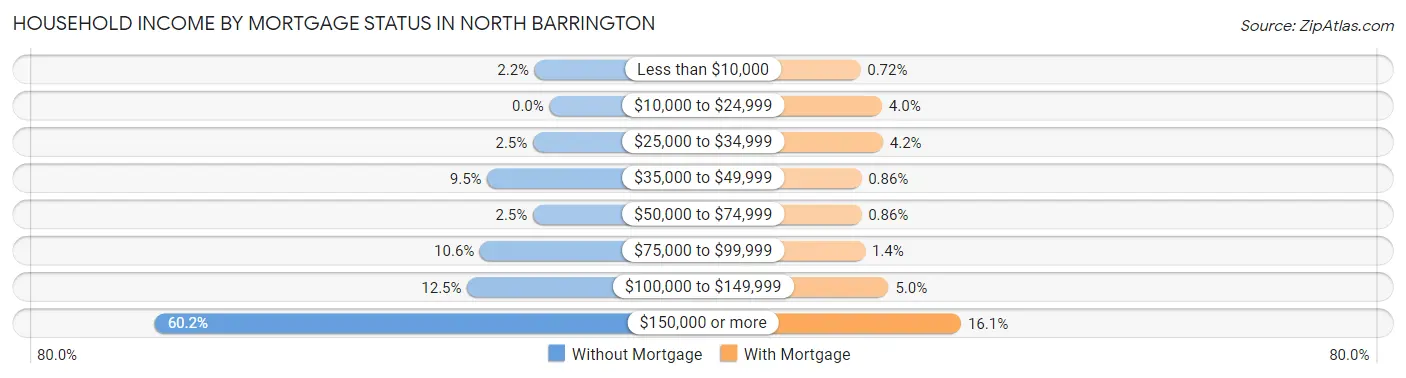
| Household Income | Without Mortgage | With Mortgage |
| Less than $10,000 | 8 (2.2%) | 5 (0.7%) |
| $10,000 to $24,999 | 0 (0.0%) | 28 (4.0%) |
| $25,000 to $34,999 | 9 (2.5%) | 29 (4.2%) |
| $35,000 to $49,999 | 34 (9.5%) | 6 (0.9%) |
| $50,000 to $74,999 | 9 (2.5%) | 6 (0.9%) |
| $75,000 to $99,999 | 38 (10.6%) | 10 (1.4%) |
| $100,000 to $149,999 | 45 (12.5%) | 35 (5.0%) |
| $150,000 or more | 216 (60.2%) | 112 (16.1%) |
| Total | 359 (100.0%) | 697 (100.0%) |
Property Value to Household Income Ratio in North Barrington
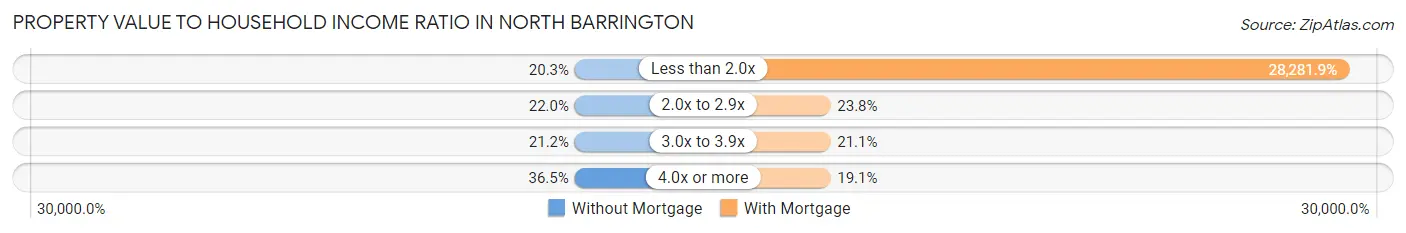
| Value-to-Income Ratio | Without Mortgage | With Mortgage |
| Less than 2.0x | 73 (20.3%) | 197,125 (28,281.9%) |
| 2.0x to 2.9x | 79 (22.0%) | 166 (23.8%) |
| 3.0x to 3.9x | 76 (21.2%) | 147 (21.1%) |
| 4.0x or more | 131 (36.5%) | 133 (19.1%) |
| Total | 359 (100.0%) | 697 (100.0%) |
Real Estate Taxes by Mortgage Status in North Barrington
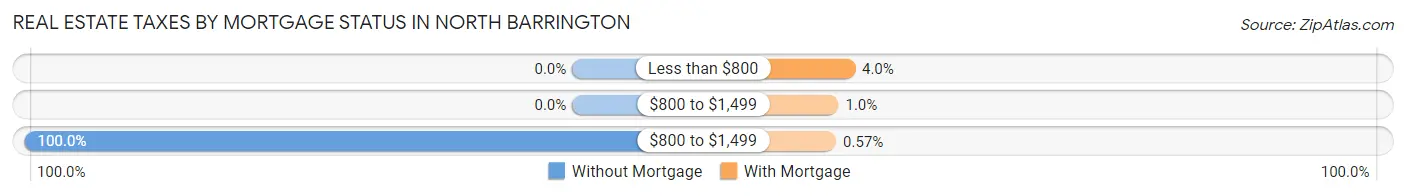
| Property Taxes | Without Mortgage | With Mortgage |
| Less than $800 | 0 (0.0%) | 28 (4.0%) |
| $800 to $1,499 | 0 (0.0%) | 7 (1.0%) |
| $800 to $1,499 | 359 (100.0%) | 4 (0.6%) |
| Total | 359 (100.0%) | 697 (100.0%) |
Health & Disability in North Barrington
Health Insurance Coverage by Age in North Barrington
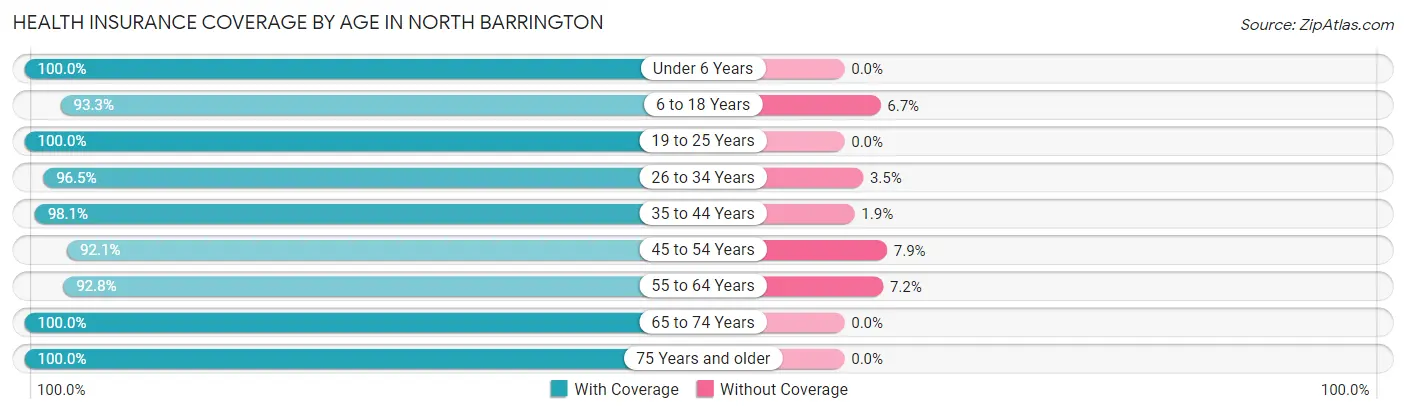
| Age Bracket | With Coverage | Without Coverage |
| Under 6 Years | 136 (100.0%) | 0 (0.0%) |
| 6 to 18 Years | 611 (93.3%) | 44 (6.7%) |
| 19 to 25 Years | 231 (100.0%) | 0 (0.0%) |
| 26 to 34 Years | 111 (96.5%) | 4 (3.5%) |
| 35 to 44 Years | 260 (98.1%) | 5 (1.9%) |
| 45 to 54 Years | 522 (92.1%) | 45 (7.9%) |
| 55 to 64 Years | 489 (92.8%) | 38 (7.2%) |
| 65 to 74 Years | 393 (100.0%) | 0 (0.0%) |
| 75 Years and older | 230 (100.0%) | 0 (0.0%) |
| Total | 2,983 (95.6%) | 136 (4.4%) |
Health Insurance Coverage by Citizenship Status in North Barrington
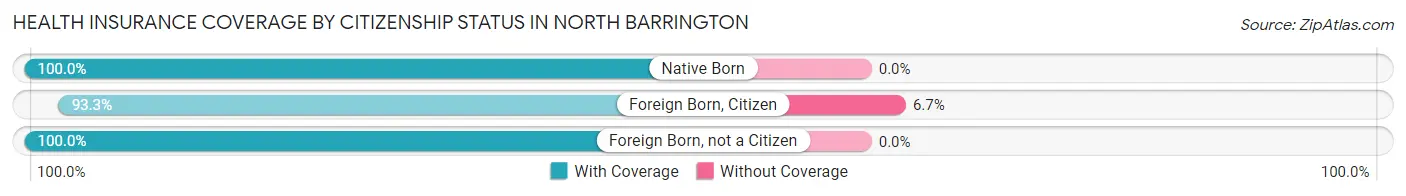
| Citizenship Status | With Coverage | Without Coverage |
| Native Born | 136 (100.0%) | 0 (0.0%) |
| Foreign Born, Citizen | 611 (93.3%) | 44 (6.7%) |
| Foreign Born, not a Citizen | 231 (100.0%) | 0 (0.0%) |
Health Insurance Coverage by Household Income in North Barrington
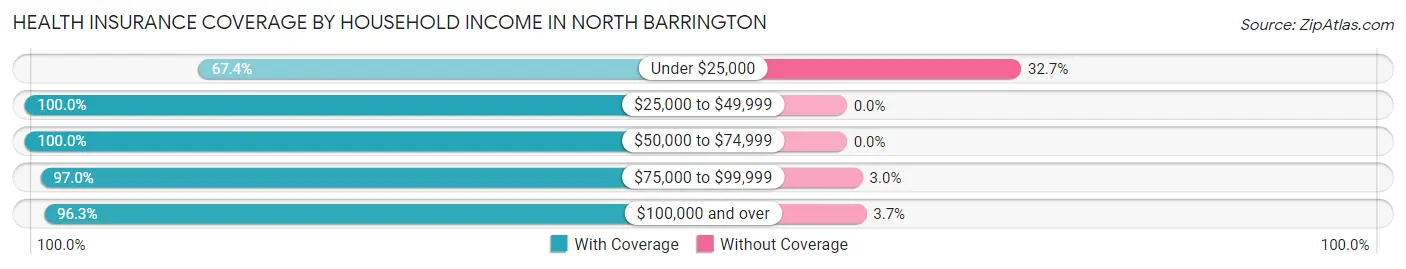
| Household Income | With Coverage | Without Coverage |
| Under $25,000 | 66 (67.3%) | 32 (32.7%) |
| $25,000 to $49,999 | 78 (100.0%) | 0 (0.0%) |
| $50,000 to $74,999 | 62 (100.0%) | 0 (0.0%) |
| $75,000 to $99,999 | 196 (97.0%) | 6 (3.0%) |
| $100,000 and over | 2,581 (96.3%) | 98 (3.7%) |
Public vs Private Health Insurance Coverage by Age in North Barrington
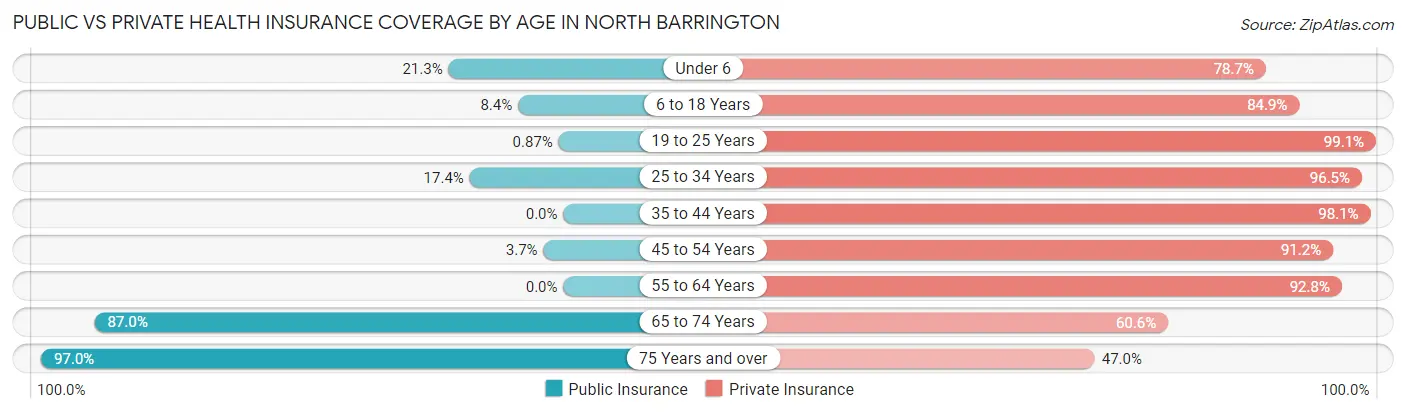
| Age Bracket | Public Insurance | Private Insurance |
| Under 6 | 29 (21.3%) | 107 (78.7%) |
| 6 to 18 Years | 55 (8.4%) | 556 (84.9%) |
| 19 to 25 Years | 2 (0.9%) | 229 (99.1%) |
| 25 to 34 Years | 20 (17.4%) | 111 (96.5%) |
| 35 to 44 Years | 0 (0.0%) | 260 (98.1%) |
| 45 to 54 Years | 21 (3.7%) | 517 (91.2%) |
| 55 to 64 Years | 0 (0.0%) | 489 (92.8%) |
| 65 to 74 Years | 342 (87.0%) | 238 (60.6%) |
| 75 Years and over | 223 (97.0%) | 108 (47.0%) |
| Total | 692 (22.2%) | 2,615 (83.8%) |
Disability Status by Sex by Age in North Barrington
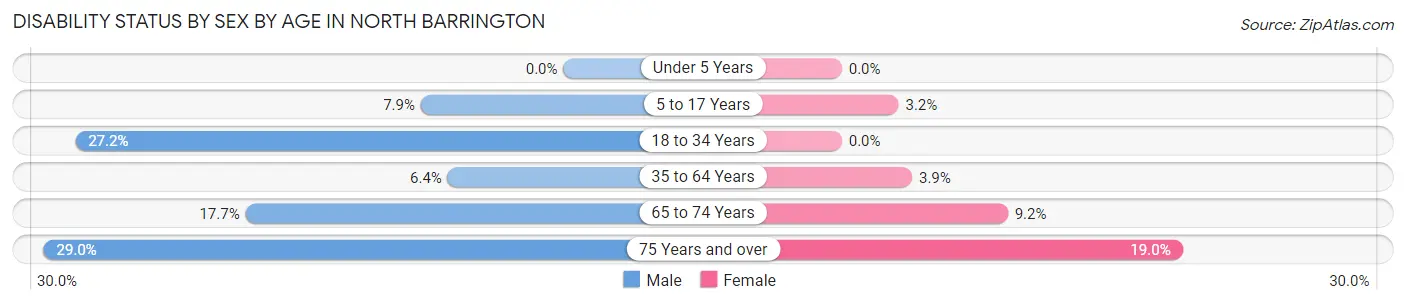
| Age Bracket | Male | Female |
| Under 5 Years | 0 (0.0%) | 0 (0.0%) |
| 5 to 17 Years | 25 (7.9%) | 11 (3.2%) |
| 18 to 34 Years | 56 (27.2%) | 0 (0.0%) |
| 35 to 64 Years | 43 (6.4%) | 27 (3.9%) |
| 65 to 74 Years | 37 (17.7%) | 17 (9.2%) |
| 75 Years and over | 33 (28.9%) | 22 (19.0%) |
Disability Class by Sex by Age in North Barrington
Disability Class: Hearing Difficulty
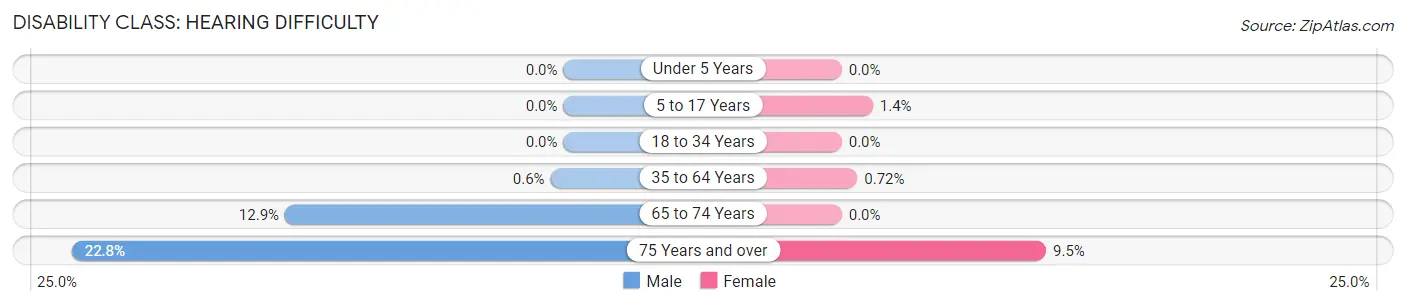
| Age Bracket | Male | Female |
| Under 5 Years | 0 (0.0%) | 0 (0.0%) |
| 5 to 17 Years | 0 (0.0%) | 5 (1.4%) |
| 18 to 34 Years | 0 (0.0%) | 0 (0.0%) |
| 35 to 64 Years | 4 (0.6%) | 5 (0.7%) |
| 65 to 74 Years | 27 (12.9%) | 0 (0.0%) |
| 75 Years and over | 26 (22.8%) | 11 (9.5%) |
Disability Class: Vision Difficulty
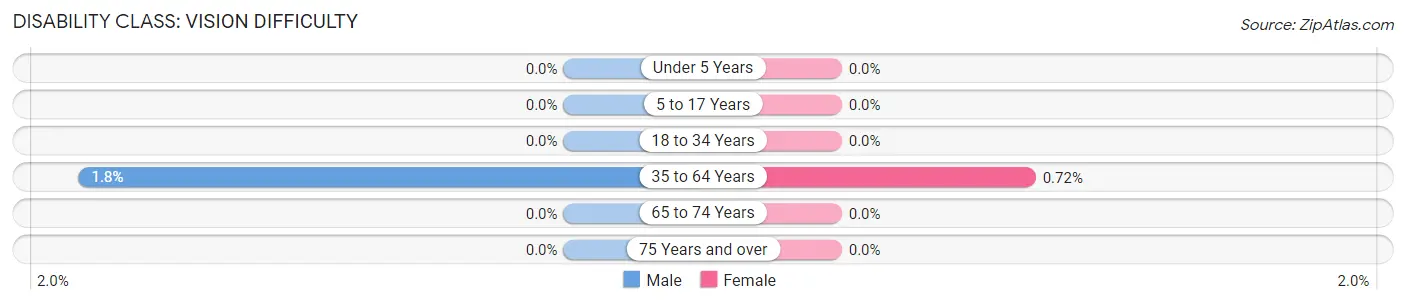
| Age Bracket | Male | Female |
| Under 5 Years | 0 (0.0%) | 0 (0.0%) |
| 5 to 17 Years | 0 (0.0%) | 0 (0.0%) |
| 18 to 34 Years | 0 (0.0%) | 0 (0.0%) |
| 35 to 64 Years | 12 (1.8%) | 5 (0.7%) |
| 65 to 74 Years | 0 (0.0%) | 0 (0.0%) |
| 75 Years and over | 0 (0.0%) | 0 (0.0%) |
Disability Class: Cognitive Difficulty
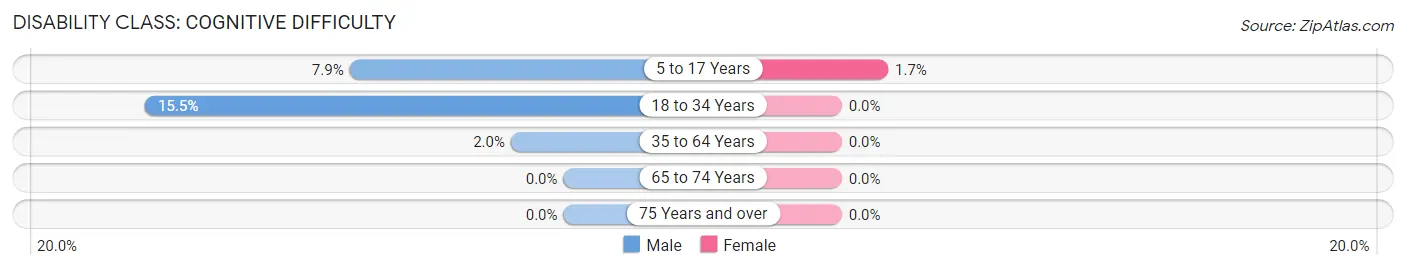
| Age Bracket | Male | Female |
| 5 to 17 Years | 25 (7.9%) | 6 (1.7%) |
| 18 to 34 Years | 32 (15.5%) | 0 (0.0%) |
| 35 to 64 Years | 13 (1.9%) | 0 (0.0%) |
| 65 to 74 Years | 0 (0.0%) | 0 (0.0%) |
| 75 Years and over | 0 (0.0%) | 0 (0.0%) |
Disability Class: Ambulatory Difficulty
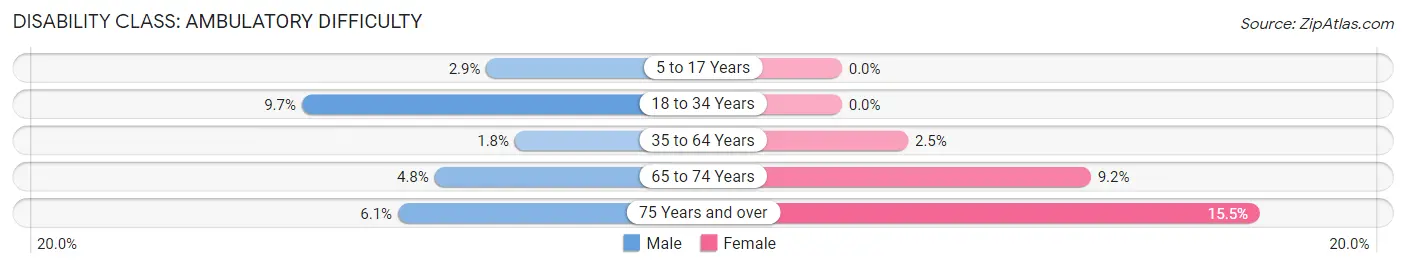
| Age Bracket | Male | Female |
| 5 to 17 Years | 9 (2.9%) | 0 (0.0%) |
| 18 to 34 Years | 20 (9.7%) | 0 (0.0%) |
| 35 to 64 Years | 12 (1.8%) | 17 (2.5%) |
| 65 to 74 Years | 10 (4.8%) | 17 (9.2%) |
| 75 Years and over | 7 (6.1%) | 18 (15.5%) |
Disability Class: Self-Care Difficulty
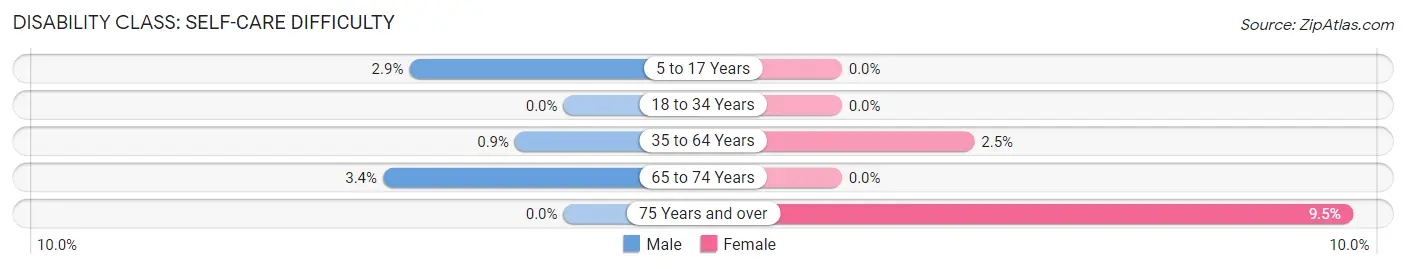
| Age Bracket | Male | Female |
| 5 to 17 Years | 9 (2.9%) | 0 (0.0%) |
| 18 to 34 Years | 0 (0.0%) | 0 (0.0%) |
| 35 to 64 Years | 6 (0.9%) | 17 (2.5%) |
| 65 to 74 Years | 7 (3.4%) | 0 (0.0%) |
| 75 Years and over | 0 (0.0%) | 11 (9.5%) |
Technology Access in North Barrington
Computing Device Access in North Barrington
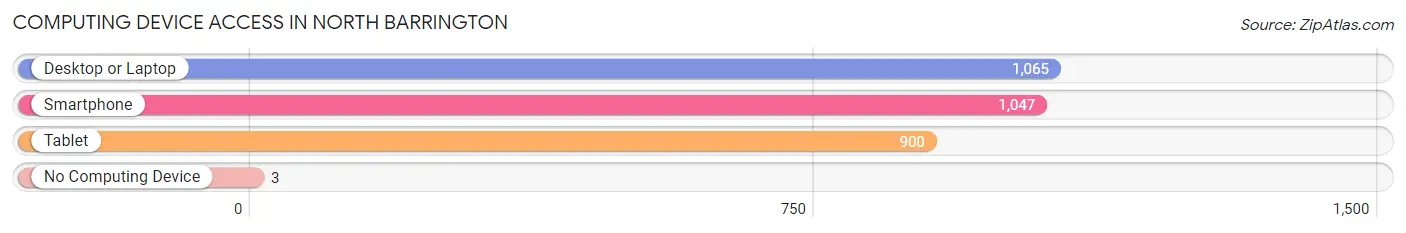
| Device Type | # Households | % Households |
| Desktop or Laptop | 1,065 | 98.5% |
| Smartphone | 1,047 | 96.9% |
| Tablet | 900 | 83.3% |
| No Computing Device | 3 | 0.3% |
| Total | 1,081 | 100.0% |
Internet Access in North Barrington
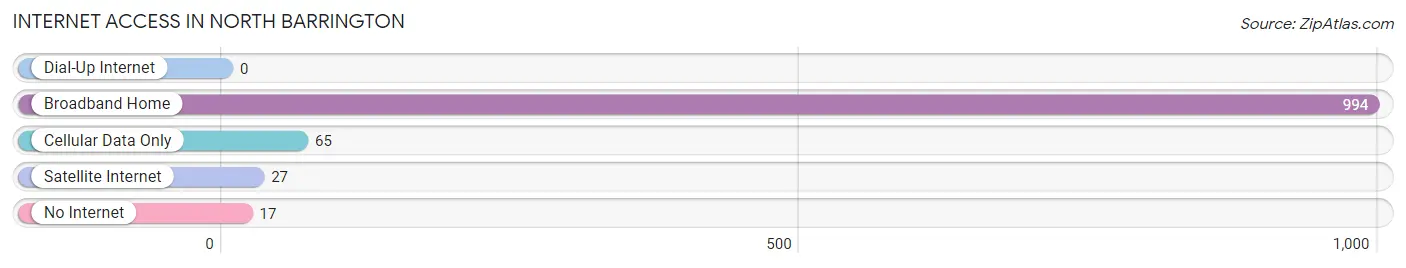
| Internet Type | # Households | % Households |
| Dial-Up Internet | 0 | 0.0% |
| Broadband Home | 994 | 91.9% |
| Cellular Data Only | 65 | 6.0% |
| Satellite Internet | 27 | 2.5% |
| No Internet | 17 | 1.6% |
| Total | 1,081 | 100.0% |
North Barrington Summary
Barrington, Illinois is a village located in both Cook and Lake counties in the state of Illinois. It is a part of the Chicago metropolitan area and is located approximately 40 miles northwest of downtown Chicago. The village is divided into two parts, North Barrington and South Barrington. North Barrington is located in Lake County and is the larger of the two parts.
History
North Barrington was first settled in the early 1800s by settlers from New England. The first settlers were mostly farmers and the area was known as the Barrington Township. The first post office was established in 1837 and the village was officially incorporated in 1959.
The village was originally a farming community and the main crops were corn, wheat, and oats. In the late 1800s, the village began to grow and develop as a resort community. The village was known for its beautiful scenery and was a popular destination for wealthy Chicagoans.
In the early 1900s, the village began to develop into a residential community. The village was known for its large estates and many wealthy Chicagoans built homes in the area. The village was also known for its excellent schools and was a popular destination for families.
Geography
North Barrington is located in Lake County, Illinois. It is bordered by Lake Zurich to the north, Lake Barrington to the east, and South Barrington to the south. The village is located approximately 40 miles northwest of downtown Chicago.
The village is located in the Fox River Valley and is surrounded by rolling hills and wooded areas. The village is also home to several lakes, including Lake Barrington, Lake Zurich, and Lake Cook.
Economy
North Barrington is a wealthy village and the median household income is over $100,000. The village is home to several large corporations, including Motorola Solutions, W.W. Grainger, and Baxter International. The village is also home to several small businesses, including restaurants, retail stores, and professional services.
The village is also home to several golf courses, including the Barrington Country Club and the Lake Barrington Shores Golf Club. The village is also home to several parks, including the Lake Barrington Shores Park and the North Barrington Park District.
Demographics
As of the 2010 census, the population of North Barrington was 4,209. The racial makeup of the village was 94.3% White, 0.7% African American, 0.2% Native American, 2.2% Asian, 0.1% Pacific Islander, 0.9% from other races, and 1.7% from two or more races. Hispanic or Latino of any race were 3.2% of the population.
The median age in the village was 44.7 years. About 24.3% of residents were under the age of 18, 5.3% were between the ages of 18 and 24, 24.3% were from 25 to 44, 33.2% were from 45 to 64, and 12.9% were 65 years of age or older. The gender makeup of the village was 48.7% male and 51.3% female.
Conclusion
North Barrington, Illinois is a village located in both Cook and Lake counties in the state of Illinois. It is a part of the Chicago metropolitan area and is located approximately 40 miles northwest of downtown Chicago. The village is divided into two parts, North Barrington and South Barrington. North Barrington is located in Lake County and is the larger of the two parts. The village was first settled in the early 1800s by settlers from New England and was originally a farming community. In the late 1800s, the village began to grow and develop as a resort community and in the early 1900s, the village began to develop into a residential community. North Barrington is a wealthy village and the median household income is over $100,000. As of the 2010 census, the population of North Barrington was 4,209. The racial makeup of the village was 94.3% White, 0.7% African American, 0.2% Native American, 2.2% Asian, 0.1% Pacific Islander, 0.9% from other races, and 1.7% from two or more races. The village is home to several large corporations, including Motorola Solutions, W.W. Grainger, and Baxter International. The village is also home to several small businesses, including restaurants, retail stores, and professional services.
Common Questions
What is Per Capita Income in North Barrington?
Per Capita income in North Barrington is $96,303.
What is the Median Family Income in North Barrington?
Median Family Income in North Barrington is $220,714.
What is the Median Household income in North Barrington?
Median Household Income in North Barrington is $212,321.
What is Income or Wage Gap in North Barrington?
Income or Wage Gap in North Barrington is 55.9%.
Women in North Barrington earn 44.1 cents for every dollar earned by a man.
What is Inequality or Gini Index in North Barrington?
Inequality or Gini Index in North Barrington is 0.46.
What is the Total Population of North Barrington?
Total Population of North Barrington is 3,119.
What is the Total Male Population of North Barrington?
Total Male Population of North Barrington is 1,567.
What is the Total Female Population of North Barrington?
Total Female Population of North Barrington is 1,552.
What is the Ratio of Males per 100 Females in North Barrington?
There are 100.97 Males per 100 Females in North Barrington.
What is the Ratio of Females per 100 Males in North Barrington?
There are 99.04 Females per 100 Males in North Barrington.
What is the Median Population Age in North Barrington?
Median Population Age in North Barrington is 47.6 Years.
What is the Average Family Size in North Barrington
Average Family Size in North Barrington is 3.1 People.
What is the Average Household Size in North Barrington
Average Household Size in North Barrington is 2.9 People.
How Large is the Labor Force in North Barrington?
There are 1,505 People in the Labor Forcein in North Barrington.
What is the Percentage of People in the Labor Force in North Barrington?
59.6% of People are in the Labor Force in North Barrington.
What is the Unemployment Rate in North Barrington?
Unemployment Rate in North Barrington is 5.0%.