Port Barrington, IL Map & Demographics
Port Barrington Map
Port Barrington Overview
$65,860
PER CAPITA INCOME
$157,250
AVG FAMILY INCOME
$146,000
AVG HOUSEHOLD INCOME
55.8%
WAGE / INCOME GAP [ % ]
44.2¢/ $1
WAGE / INCOME GAP [ $ ]
0.41
INEQUALITY / GINI INDEX
1,557
TOTAL POPULATION
801
MALE POPULATION
756
FEMALE POPULATION
105.95
MALES / 100 FEMALES
94.38
FEMALES / 100 MALES
39.9
MEDIAN AGE
3.1
AVG FAMILY SIZE
2.9
AVG HOUSEHOLD SIZE
902
LABOR FORCE [ PEOPLE ]
71.1%
PERCENT IN LABOR FORCE
3.4%
UNEMPLOYMENT RATE
Income in Port Barrington
Income Overview in Port Barrington
Per Capita Income in Port Barrington is $65,860, while median incomes of families and households are $157,250 and $146,000 respectively.
| Characteristic | Number | Measure |
| Per Capita Income | 1,557 | $65,860 |
| Median Family Income | 449 | $157,250 |
| Mean Family Income | 449 | $201,554 |
| Median Household Income | 530 | $146,000 |
| Mean Household Income | 530 | $191,203 |
| Income Deficit | 449 | $0 |
| Wage / Income Gap (%) | 1,557 | 55.83% |
| Wage / Income Gap ($) | 1,557 | 44.17¢ per $1 |
| Gini / Inequality Index | 1,557 | 0.41 |
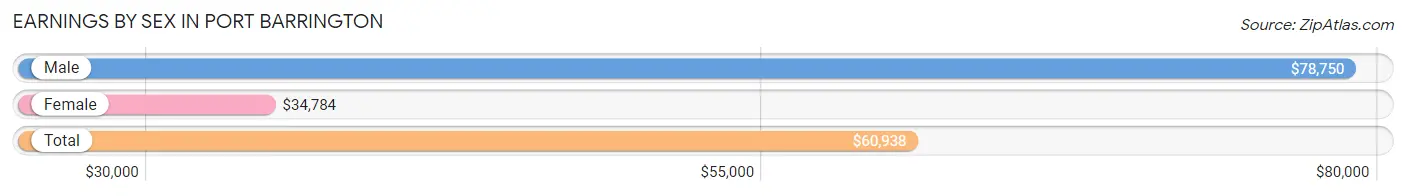
Earnings by Sex in Port Barrington
Average Earnings in Port Barrington are $60,938, $78,750 for men and $34,784 for women, a difference of 55.8%.
| Sex | Number | Average Earnings |
| Male | 506 (51.2%) | $78,750 |
| Female | 483 (48.8%) | $34,784 |
| Total | 989 (100.0%) | $60,938 |
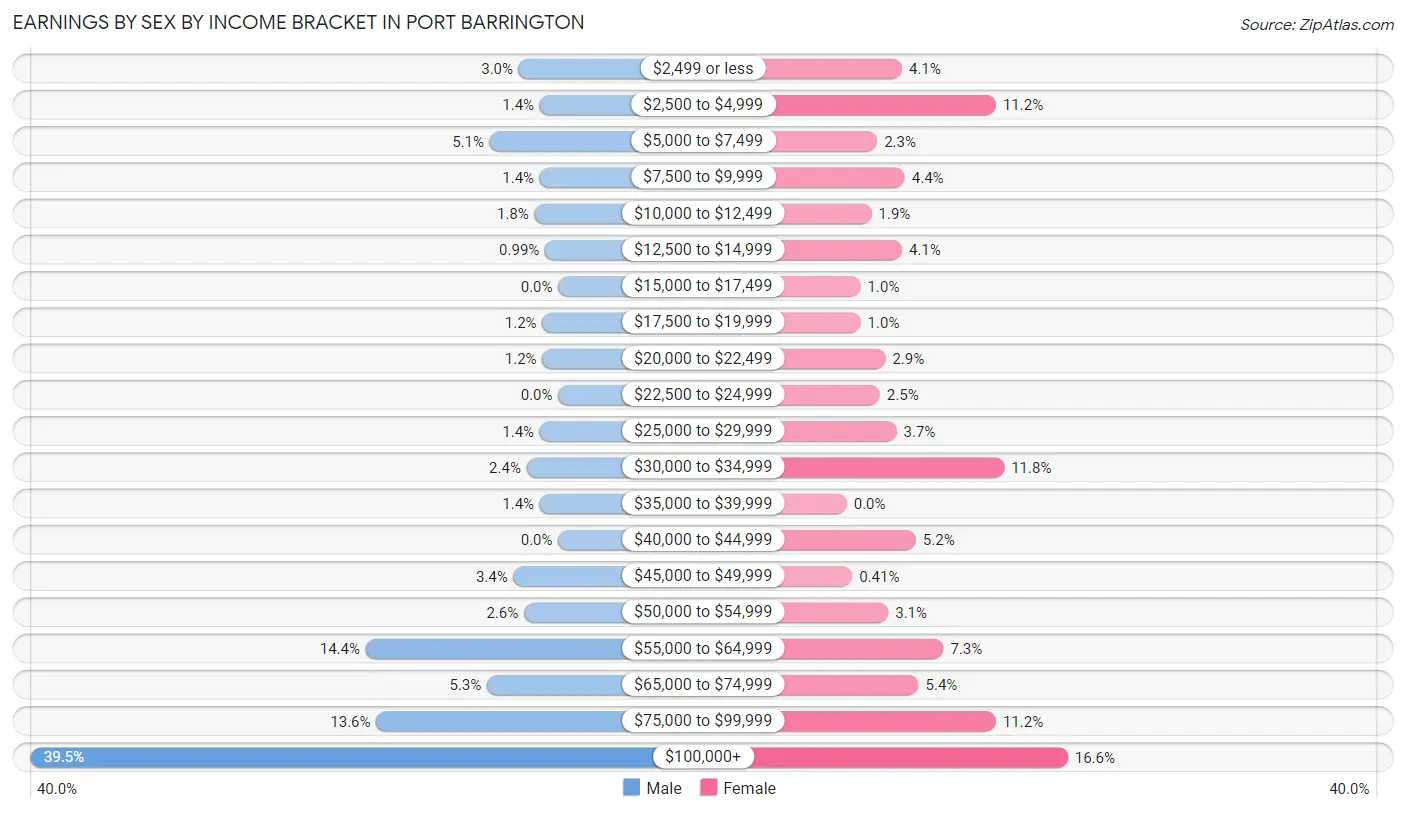
Earnings by Sex by Income Bracket in Port Barrington
The most common earnings brackets in Port Barrington are $100,000+ for men (200 | 39.5%) and $100,000+ for women (80 | 16.6%).
| Income | Male | Female |
| $2,499 or less | 15 (3.0%) | 20 (4.1%) |
| $2,500 to $4,999 | 7 (1.4%) | 54 (11.2%) |
| $5,000 to $7,499 | 26 (5.1%) | 11 (2.3%) |
| $7,500 to $9,999 | 7 (1.4%) | 21 (4.3%) |
| $10,000 to $12,499 | 9 (1.8%) | 9 (1.9%) |
| $12,500 to $14,999 | 5 (1.0%) | 20 (4.1%) |
| $15,000 to $17,499 | 0 (0.0%) | 5 (1.0%) |
| $17,500 to $19,999 | 6 (1.2%) | 5 (1.0%) |
| $20,000 to $22,499 | 6 (1.2%) | 14 (2.9%) |
| $22,500 to $24,999 | 0 (0.0%) | 12 (2.5%) |
| $25,000 to $29,999 | 7 (1.4%) | 18 (3.7%) |
| $30,000 to $34,999 | 12 (2.4%) | 57 (11.8%) |
| $35,000 to $39,999 | 7 (1.4%) | 0 (0.0%) |
| $40,000 to $44,999 | 0 (0.0%) | 25 (5.2%) |
| $45,000 to $49,999 | 17 (3.4%) | 2 (0.4%) |
| $50,000 to $54,999 | 13 (2.6%) | 15 (3.1%) |
| $55,000 to $64,999 | 73 (14.4%) | 35 (7.2%) |
| $65,000 to $74,999 | 27 (5.3%) | 26 (5.4%) |
| $75,000 to $99,999 | 69 (13.6%) | 54 (11.2%) |
| $100,000+ | 200 (39.5%) | 80 (16.6%) |
| Total | 506 (100.0%) | 483 (100.0%) |
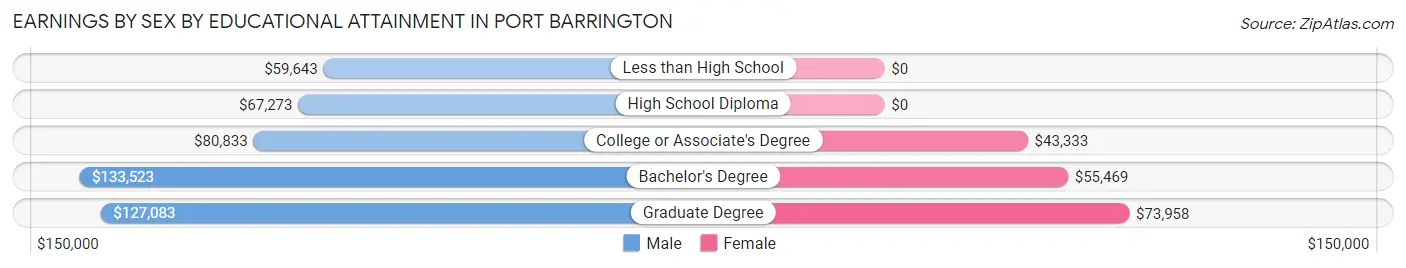
Earnings by Sex by Educational Attainment in Port Barrington
Average earnings in Port Barrington are $92,500 for men and $56,750 for women, a difference of 38.7%. Men with an educational attainment of bachelor's degree enjoy the highest average annual earnings of $133,523, while those with less than high school education earn the least with $59,643. Women with an educational attainment of graduate degree earn the most with the average annual earnings of $73,958, while those with college or associate's degree education have the smallest earnings of $43,333.
| Educational Attainment | Male Income | Female Income |
| Less than High School | $59,643 | $0 |
| High School Diploma | $67,273 | $0 |
| College or Associate's Degree | $80,833 | $43,333 |
| Bachelor's Degree | $133,523 | $55,469 |
| Graduate Degree | $127,083 | $73,958 |
| Total | $92,500 | $56,750 |
Family Income in Port Barrington
Family Income Brackets in Port Barrington
According to the Port Barrington family income data, there are 133 families falling into the $200,000+ income range, which is the most common income bracket and makes up 29.6% of all families.
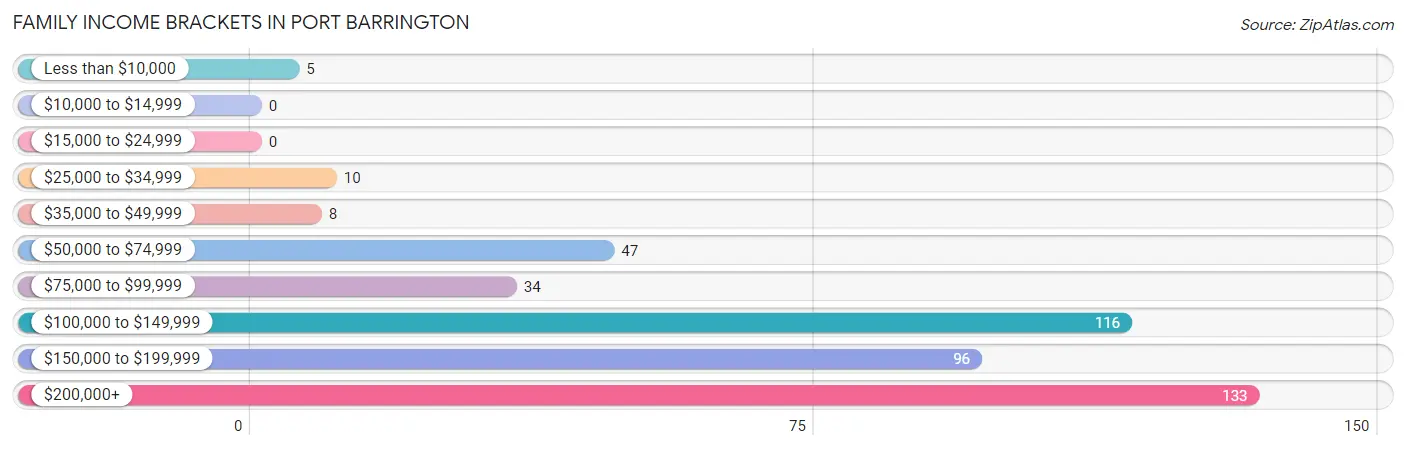
| Income Bracket | # Families | % Families |
| Less than $10,000 | 5 | 1.1% |
| $10,000 to $14,999 | 0 | 0.0% |
| $15,000 to $24,999 | 0 | 0.0% |
| $25,000 to $34,999 | 10 | 2.2% |
| $35,000 to $49,999 | 8 | 1.8% |
| $50,000 to $74,999 | 47 | 10.5% |
| $75,000 to $99,999 | 34 | 7.6% |
| $100,000 to $149,999 | 116 | 25.8% |
| $150,000 to $199,999 | 96 | 21.4% |
| $200,000+ | 133 | 29.6% |
Family Income by Famaliy Size in Port Barrington
3-person families (118 | 26.3%) account for the highest median family income in Port Barrington with $191,667 per family, while 3-person families (118 | 26.3%) have the highest median income of $63,889 per family member.
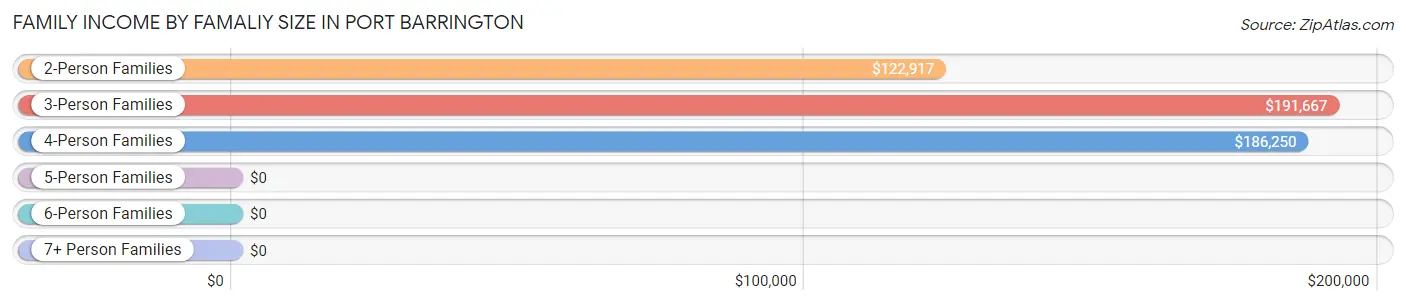
| Income Bracket | # Families | Median Income |
| 2-Person Families | 201 (44.8%) | $122,917 |
| 3-Person Families | 118 (26.3%) | $191,667 |
| 4-Person Families | 86 (19.2%) | $186,250 |
| 5-Person Families | 34 (7.6%) | $0 |
| 6-Person Families | 3 (0.7%) | $0 |
| 7+ Person Families | 7 (1.6%) | $0 |
| Total | 449 (100.0%) | $157,250 |
Family Income by Number of Earners in Port Barrington
The median family income in Port Barrington is $157,250, with families comprising 2 earners (238) having the highest median family income of $181,042, while families with no earners (31) have the lowest median family income of $75,313, accounting for 53.0% and 6.9% of families, respectively.
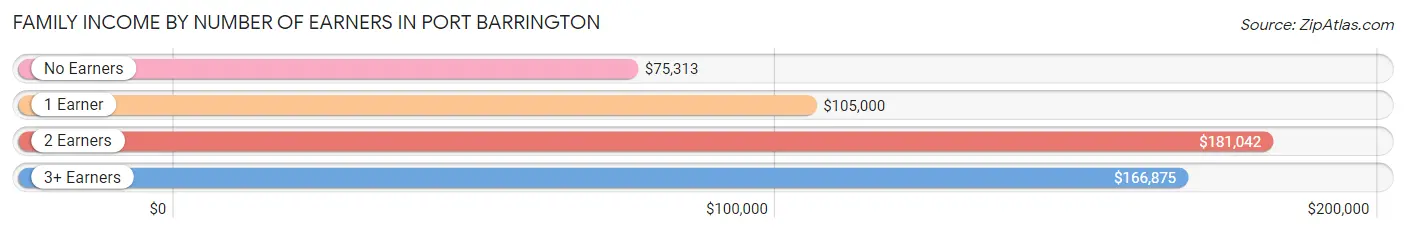
| Number of Earners | # Families | Median Income |
| No Earners | 31 (6.9%) | $75,313 |
| 1 Earner | 112 (24.9%) | $105,000 |
| 2 Earners | 238 (53.0%) | $181,042 |
| 3+ Earners | 68 (15.1%) | $166,875 |
| Total | 449 (100.0%) | $157,250 |
Household Income in Port Barrington
Household Income Brackets in Port Barrington
With 147 households falling in the category, the $200,000+ income range is the most frequent in Port Barrington, accounting for 27.7% of all households.
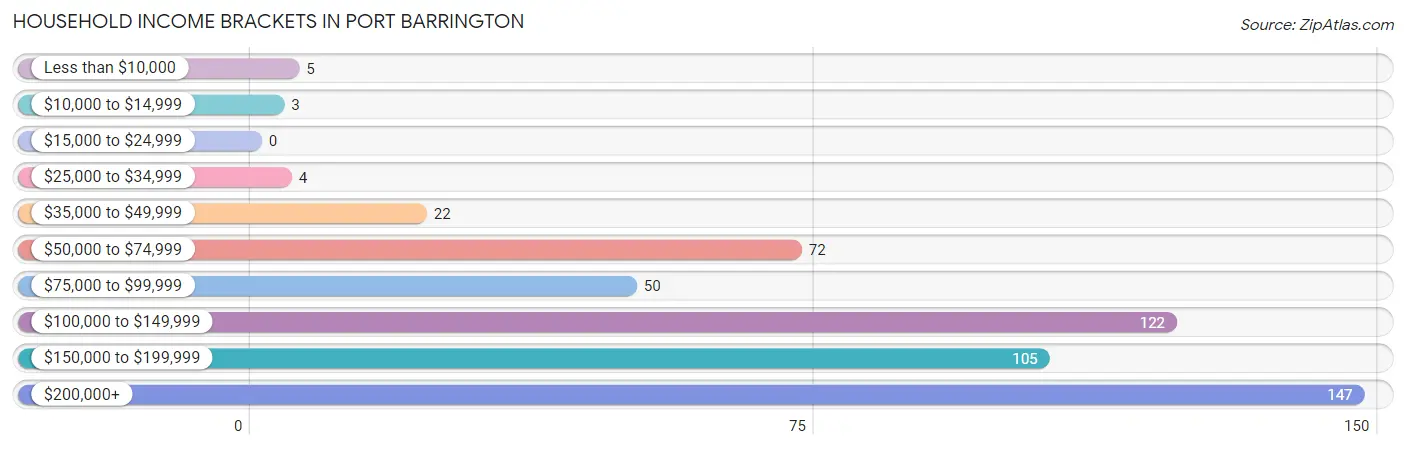
| Income Bracket | # Households | % Households |
| Less than $10,000 | 5 | 0.9% |
| $10,000 to $14,999 | 3 | 0.6% |
| $15,000 to $24,999 | 0 | 0.0% |
| $25,000 to $34,999 | 4 | 0.8% |
| $35,000 to $49,999 | 22 | 4.2% |
| $50,000 to $74,999 | 72 | 13.6% |
| $75,000 to $99,999 | 50 | 9.4% |
| $100,000 to $149,999 | 122 | 23.0% |
| $150,000 to $199,999 | 105 | 19.8% |
| $200,000+ | 147 | 27.7% |
Household Income by Householder Age in Port Barrington
The median household income in Port Barrington is $146,000, with the highest median household income of $166,094 found in the 45 to 64 years age bracket for the primary householder. A total of 261 households (49.2%) fall into this category. Meanwhile, the 15 to 24 years age bracket for the primary householder has the lowest median household income of $0, with 6 households (1.1%) in this group.
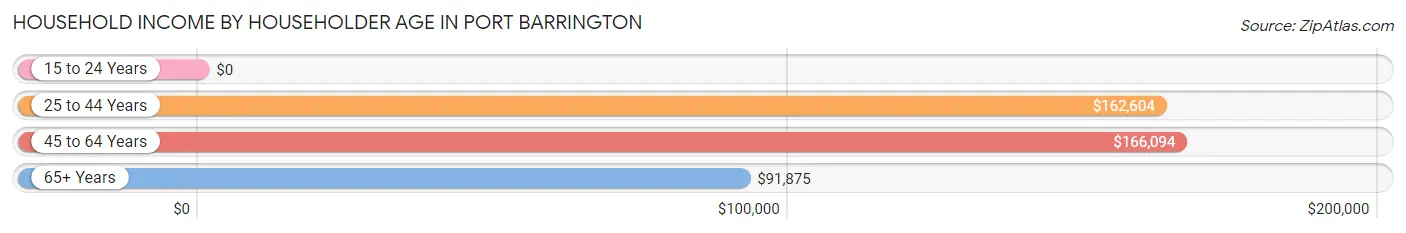
| Income Bracket | # Households | Median Income |
| 15 to 24 Years | 6 (1.1%) | $0 |
| 25 to 44 Years | 163 (30.7%) | $162,604 |
| 45 to 64 Years | 261 (49.2%) | $166,094 |
| 65+ Years | 100 (18.9%) | $91,875 |
| Total | 530 (100.0%) | $146,000 |
Poverty in Port Barrington
Income Below Poverty by Sex and Age in Port Barrington
With 1.4% poverty level for males and 1.6% for females among the residents of Port Barrington, 12 to 14 year old males and 18 to 24 year old females are the most vulnerable to poverty, with 3 males (11.5%) and 7 females (10.0%) in their respective age groups living below the poverty level.
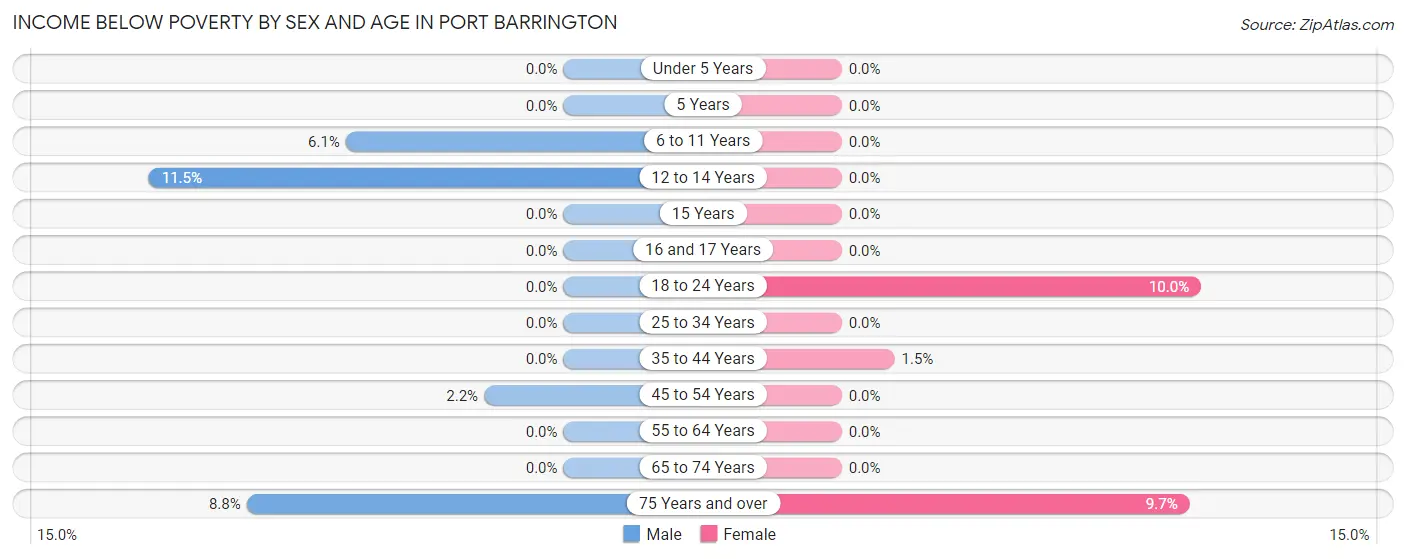
| Age Bracket | Male | Female |
| Under 5 Years | 0 (0.0%) | 0 (0.0%) |
| 5 Years | 0 (0.0%) | 0 (0.0%) |
| 6 to 11 Years | 2 (6.1%) | 0 (0.0%) |
| 12 to 14 Years | 3 (11.5%) | 0 (0.0%) |
| 15 Years | 0 (0.0%) | 0 (0.0%) |
| 16 and 17 Years | 0 (0.0%) | 0 (0.0%) |
| 18 to 24 Years | 0 (0.0%) | 7 (10.0%) |
| 25 to 34 Years | 0 (0.0%) | 0 (0.0%) |
| 35 to 44 Years | 0 (0.0%) | 2 (1.5%) |
| 45 to 54 Years | 3 (2.2%) | 0 (0.0%) |
| 55 to 64 Years | 0 (0.0%) | 0 (0.0%) |
| 65 to 74 Years | 0 (0.0%) | 0 (0.0%) |
| 75 Years and over | 3 (8.8%) | 3 (9.7%) |
| Total | 11 (1.4%) | 12 (1.6%) |
Income Above Poverty by Sex and Age in Port Barrington
According to the poverty statistics in Port Barrington, males aged under 5 years and females aged under 5 years are the age groups that are most secure financially, with 100.0% of males and 100.0% of females in these age groups living above the poverty line.
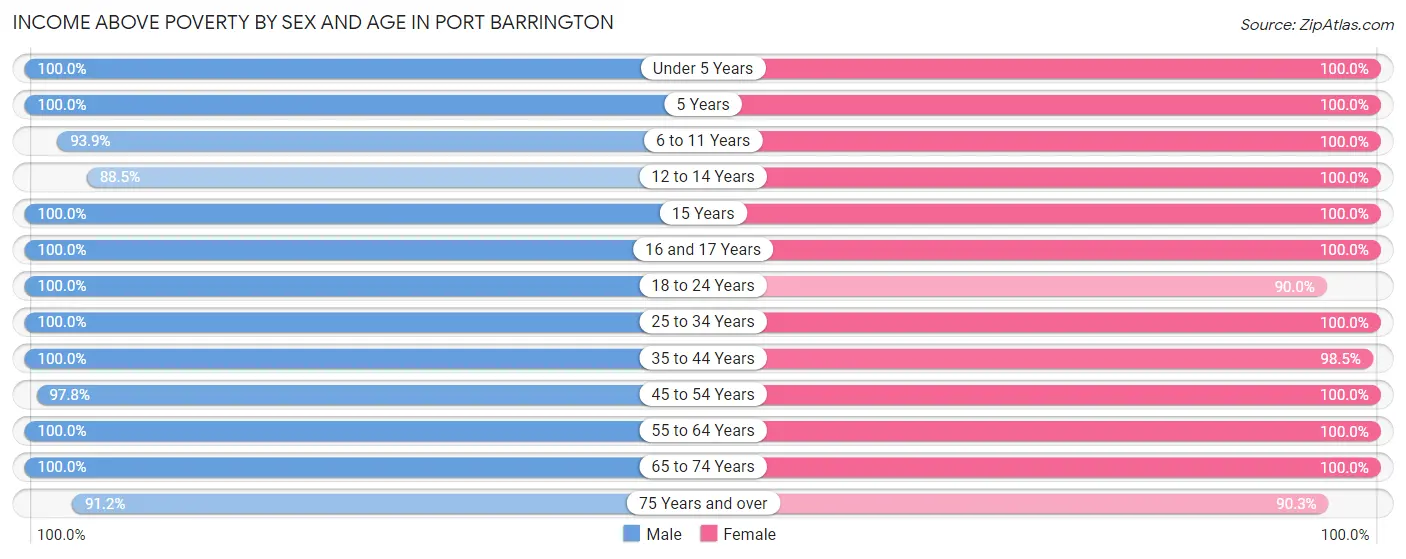
| Age Bracket | Male | Female |
| Under 5 Years | 37 (100.0%) | 28 (100.0%) |
| 5 Years | 11 (100.0%) | 4 (100.0%) |
| 6 to 11 Years | 31 (93.9%) | 45 (100.0%) |
| 12 to 14 Years | 23 (88.5%) | 21 (100.0%) |
| 15 Years | 46 (100.0%) | 7 (100.0%) |
| 16 and 17 Years | 44 (100.0%) | 51 (100.0%) |
| 18 to 24 Years | 69 (100.0%) | 63 (90.0%) |
| 25 to 34 Years | 84 (100.0%) | 77 (100.0%) |
| 35 to 44 Years | 103 (100.0%) | 134 (98.5%) |
| 45 to 54 Years | 133 (97.8%) | 122 (100.0%) |
| 55 to 64 Years | 105 (100.0%) | 104 (100.0%) |
| 65 to 74 Years | 56 (100.0%) | 47 (100.0%) |
| 75 Years and over | 31 (91.2%) | 28 (90.3%) |
| Total | 773 (98.6%) | 731 (98.4%) |
Income Below Poverty Among Married-Couple Families in Port Barrington
The poverty statistics for married-couple families in Port Barrington show that 0.8% or 3 of the total 359 families live below the poverty line. Families with no children have the highest poverty rate of 1.3%, comprising of 3 families. On the other hand, families with 1 or 2 children have the lowest poverty rate of 0.0%, which includes 0 families.
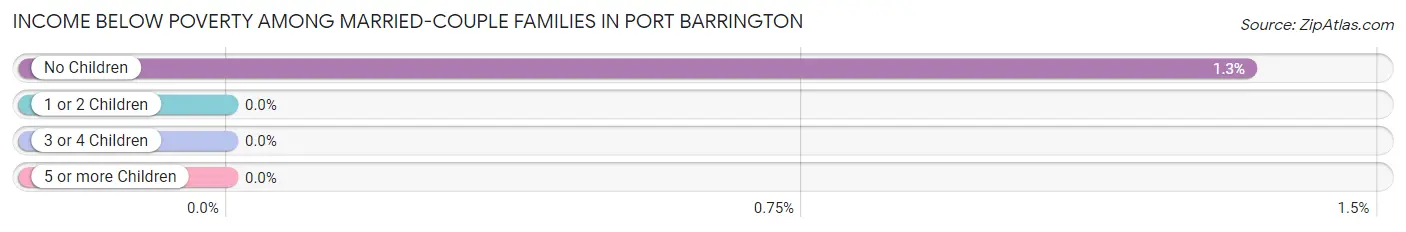
| Children | Above Poverty | Below Poverty |
| No Children | 223 (98.7%) | 3 (1.3%) |
| 1 or 2 Children | 113 (100.0%) | 0 (0.0%) |
| 3 or 4 Children | 20 (100.0%) | 0 (0.0%) |
| 5 or more Children | 0 (0.0%) | 0 (0.0%) |
| Total | 356 (99.2%) | 3 (0.8%) |
Income Below Poverty Among Single-Parent Households in Port Barrington
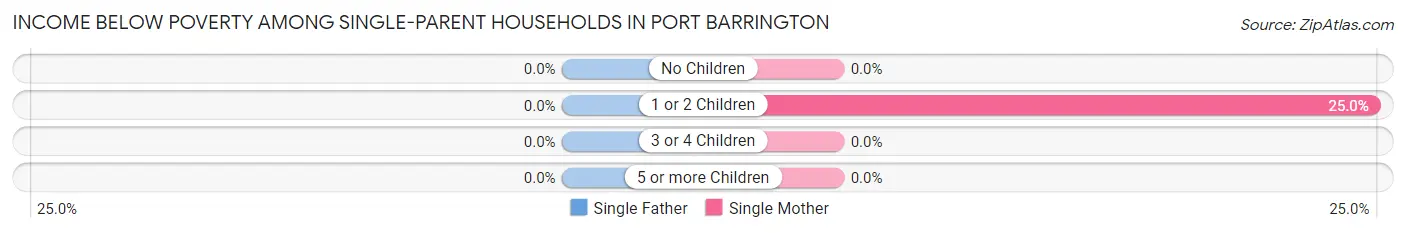
| Children | Single Father | Single Mother |
| No Children | 0 (0.0%) | 0 (0.0%) |
| 1 or 2 Children | 0 (0.0%) | 2 (25.0%) |
| 3 or 4 Children | 0 (0.0%) | 0 (0.0%) |
| 5 or more Children | 0 (0.0%) | 0 (0.0%) |
| Total | 0 (0.0%) | 2 (7.1%) |
Income Below Poverty Among Married-Couple vs Single-Parent Households in Port Barrington
The poverty data for Port Barrington shows that 3 of the married-couple family households (0.8%) and 2 of the single-parent households (2.2%) are living below the poverty level. Within the married-couple family households, those with no children have the highest poverty rate, with 3 households (1.3%) falling below the poverty line. Among the single-parent households, those with 1 or 2 children have the highest poverty rate, with 2 household (3.7%) living below poverty.
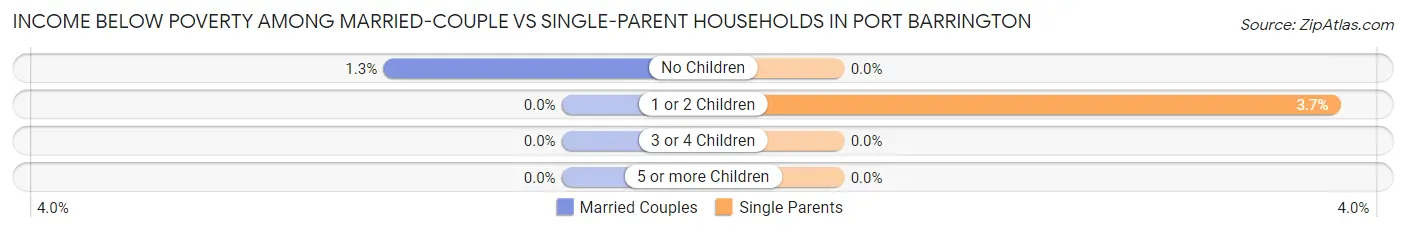
| Children | Married-Couple Families | Single-Parent Households |
| No Children | 3 (1.3%) | 0 (0.0%) |
| 1 or 2 Children | 0 (0.0%) | 2 (3.7%) |
| 3 or 4 Children | 0 (0.0%) | 0 (0.0%) |
| 5 or more Children | 0 (0.0%) | 0 (0.0%) |
| Total | 3 (0.8%) | 2 (2.2%) |
Race in Port Barrington
The most populous races in Port Barrington are White / Caucasian (1,353 | 86.9%), Hispanic or Latino (182 | 11.7%), and Two or more Races (85 | 5.5%).
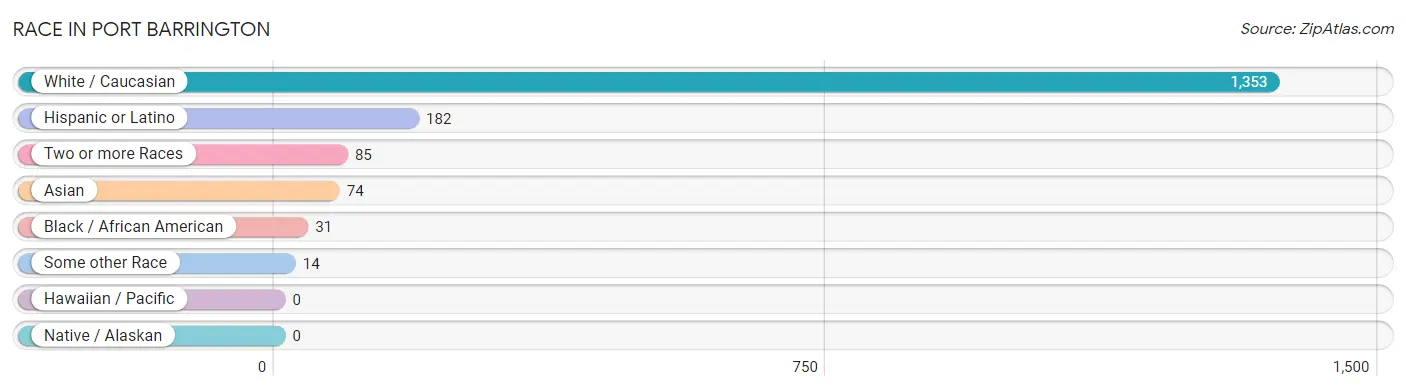
| Race | # Population | % Population |
| Asian | 74 | 4.8% |
| Black / African American | 31 | 2.0% |
| Hawaiian / Pacific | 0 | 0.0% |
| Hispanic or Latino | 182 | 11.7% |
| Native / Alaskan | 0 | 0.0% |
| White / Caucasian | 1,353 | 86.9% |
| Two or more Races | 85 | 5.5% |
| Some other Race | 14 | 0.9% |
| Total | 1,557 | 100.0% |
Ancestry in Port Barrington
The most populous ancestries reported in Port Barrington are Irish (363 | 23.3%), German (341 | 21.9%), Italian (258 | 16.6%), Polish (218 | 14.0%), and Mexican (117 | 7.5%), together accounting for 83.3% of all Port Barrington residents.
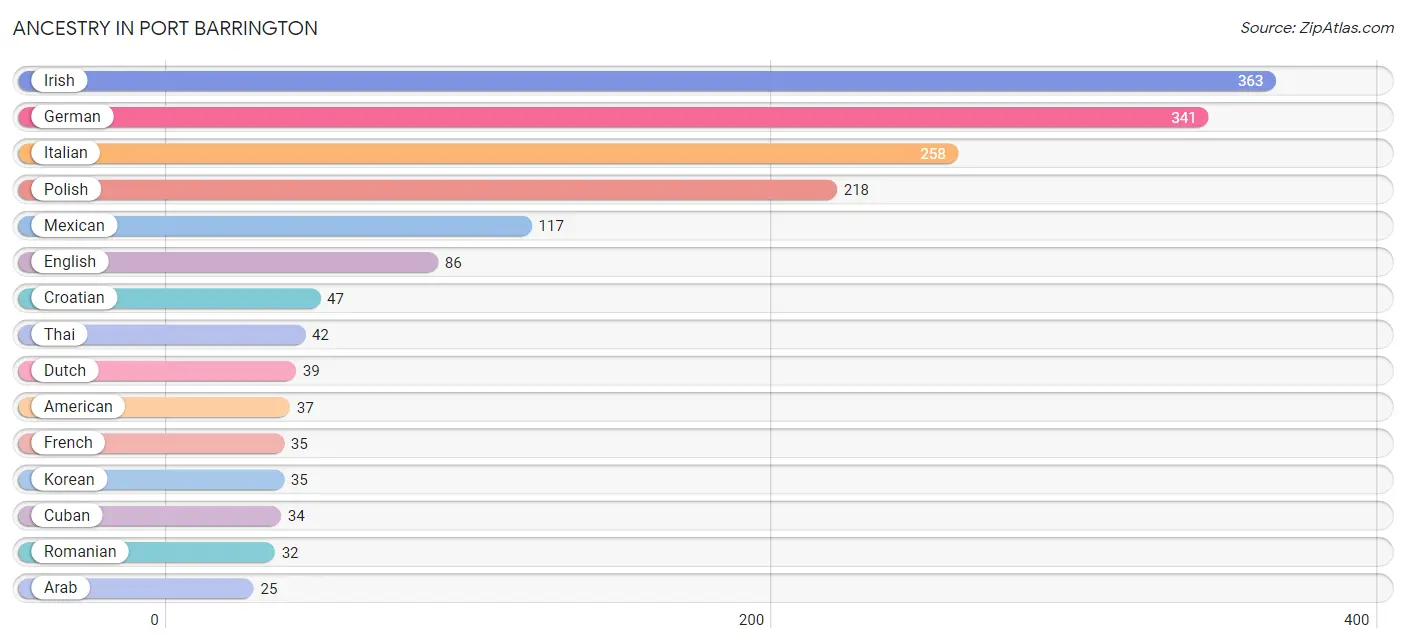
| Ancestry | # Population | % Population |
| American | 37 | 2.4% |
| Arab | 25 | 1.6% |
| Bhutanese | 9 | 0.6% |
| Burmese | 8 | 0.5% |
| Cherokee | 2 | 0.1% |
| Colombian | 7 | 0.4% |
| Croatian | 47 | 3.0% |
| Cuban | 34 | 2.2% |
| Czech | 20 | 1.3% |
| Czechoslovakian | 2 | 0.1% |
| Danish | 6 | 0.4% |
| Dutch | 39 | 2.5% |
| Eastern European | 2 | 0.1% |
| English | 86 | 5.5% |
| European | 10 | 0.6% |
| Finnish | 5 | 0.3% |
| French | 35 | 2.2% |
| French Canadian | 2 | 0.1% |
| German | 341 | 21.9% |
| Hungarian | 6 | 0.4% |
| Indian (Asian) | 9 | 0.6% |
| Irish | 363 | 23.3% |
| Italian | 258 | 16.6% |
| Jordanian | 19 | 1.2% |
| Korean | 35 | 2.2% |
| Latvian | 6 | 0.4% |
| Lebanese | 6 | 0.4% |
| Lithuanian | 2 | 0.1% |
| Luxembourger | 5 | 0.3% |
| Macedonian | 3 | 0.2% |
| Mexican | 117 | 7.5% |
| Norwegian | 13 | 0.8% |
| Polish | 218 | 14.0% |
| Puerto Rican | 6 | 0.4% |
| Romanian | 32 | 2.1% |
| Russian | 11 | 0.7% |
| Scandinavian | 2 | 0.1% |
| Scotch-Irish | 12 | 0.8% |
| Scottish | 16 | 1.0% |
| Serbian | 4 | 0.3% |
| Slovak | 6 | 0.4% |
| South American | 10 | 0.6% |
| Spanish | 3 | 0.2% |
| Swedish | 11 | 0.7% |
| Thai | 42 | 2.7% |
| Ukrainian | 9 | 0.6% |
| Venezuelan | 3 | 0.2% |
| Welsh | 14 | 0.9% | View All 48 Rows |
Immigrants in Port Barrington
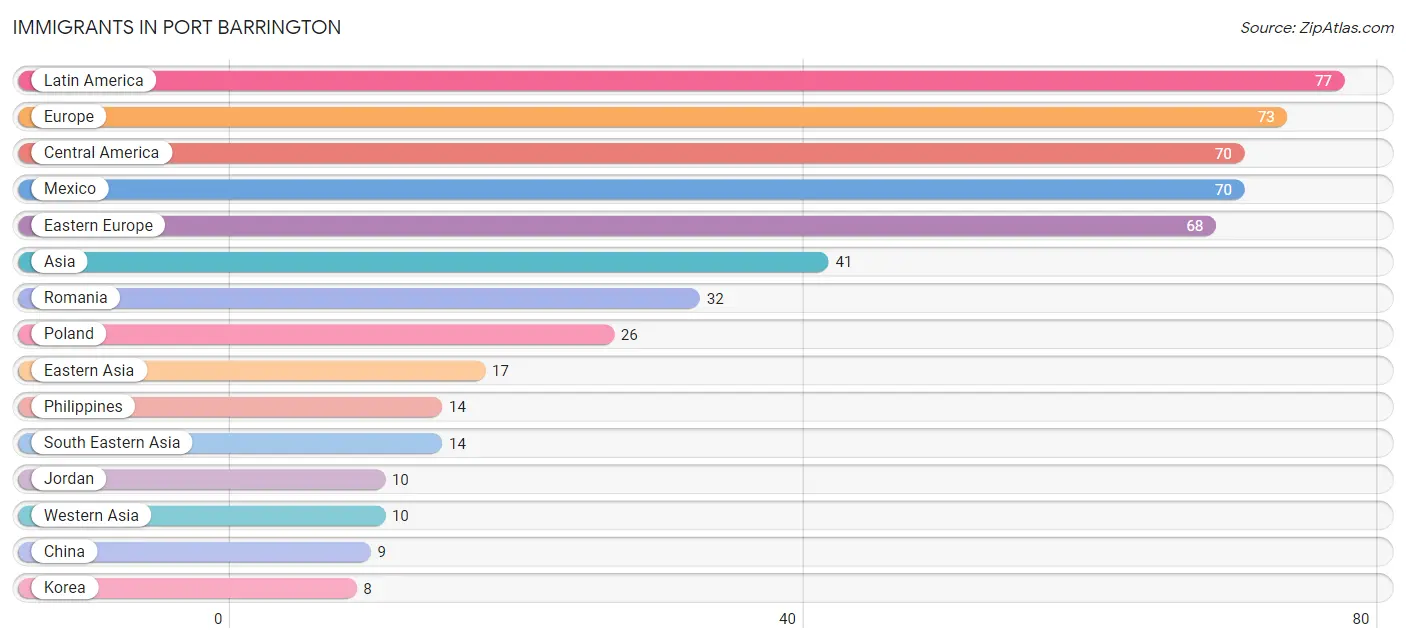
The most numerous immigrant groups reported in Port Barrington came from Latin America (77 | 5.0%), Europe (73 | 4.7%), Central America (70 | 4.5%), Mexico (70 | 4.5%), and Eastern Europe (68 | 4.4%), together accounting for 23.0% of all Port Barrington residents.
| Immigration Origin | # Population | % Population |
| Asia | 41 | 2.6% |
| Central America | 70 | 4.5% |
| China | 9 | 0.6% |
| Colombia | 7 | 0.4% |
| Eastern Asia | 17 | 1.1% |
| Eastern Europe | 68 | 4.4% |
| Europe | 73 | 4.7% |
| Germany | 3 | 0.2% |
| Jordan | 10 | 0.6% |
| Korea | 8 | 0.5% |
| Latin America | 77 | 5.0% |
| Mexico | 70 | 4.5% |
| North Macedonia | 3 | 0.2% |
| Philippines | 14 | 0.9% |
| Poland | 26 | 1.7% |
| Romania | 32 | 2.1% |
| South America | 7 | 0.4% |
| South Eastern Asia | 14 | 0.9% |
| Ukraine | 7 | 0.4% |
| Western Asia | 10 | 0.6% |
| Western Europe | 3 | 0.2% | View All 21 Rows |
Sex and Age in Port Barrington
Sex and Age in Port Barrington
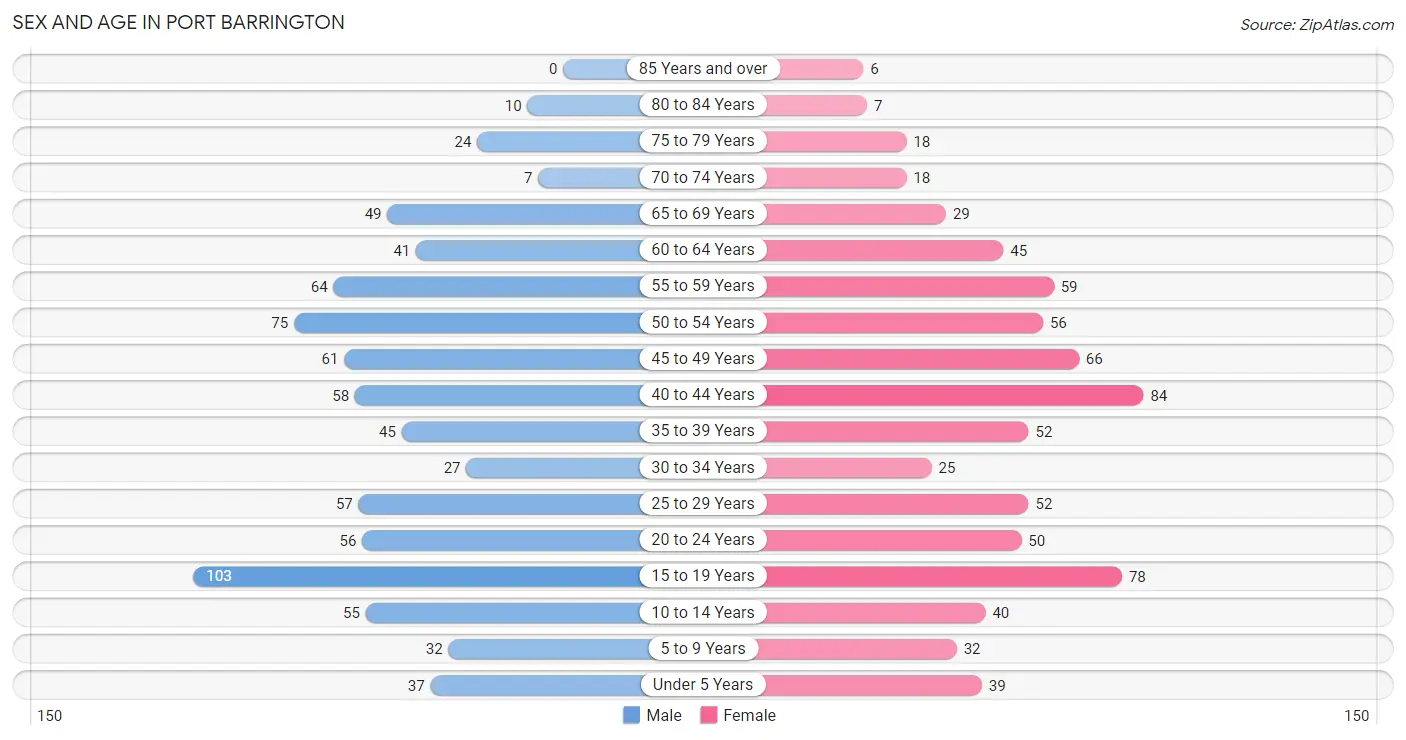
The most populous age groups in Port Barrington are 15 to 19 Years (103 | 12.9%) for men and 40 to 44 Years (84 | 11.1%) for women.
| Age Bracket | Male | Female |
| Under 5 Years | 37 (4.6%) | 39 (5.2%) |
| 5 to 9 Years | 32 (4.0%) | 32 (4.2%) |
| 10 to 14 Years | 55 (6.9%) | 40 (5.3%) |
| 15 to 19 Years | 103 (12.9%) | 78 (10.3%) |
| 20 to 24 Years | 56 (7.0%) | 50 (6.6%) |
| 25 to 29 Years | 57 (7.1%) | 52 (6.9%) |
| 30 to 34 Years | 27 (3.4%) | 25 (3.3%) |
| 35 to 39 Years | 45 (5.6%) | 52 (6.9%) |
| 40 to 44 Years | 58 (7.2%) | 84 (11.1%) |
| 45 to 49 Years | 61 (7.6%) | 66 (8.7%) |
| 50 to 54 Years | 75 (9.4%) | 56 (7.4%) |
| 55 to 59 Years | 64 (8.0%) | 59 (7.8%) |
| 60 to 64 Years | 41 (5.1%) | 45 (5.9%) |
| 65 to 69 Years | 49 (6.1%) | 29 (3.8%) |
| 70 to 74 Years | 7 (0.9%) | 18 (2.4%) |
| 75 to 79 Years | 24 (3.0%) | 18 (2.4%) |
| 80 to 84 Years | 10 (1.3%) | 7 (0.9%) |
| 85 Years and over | 0 (0.0%) | 6 (0.8%) |
| Total | 801 (100.0%) | 756 (100.0%) |
Families and Households in Port Barrington
Median Family Size in Port Barrington
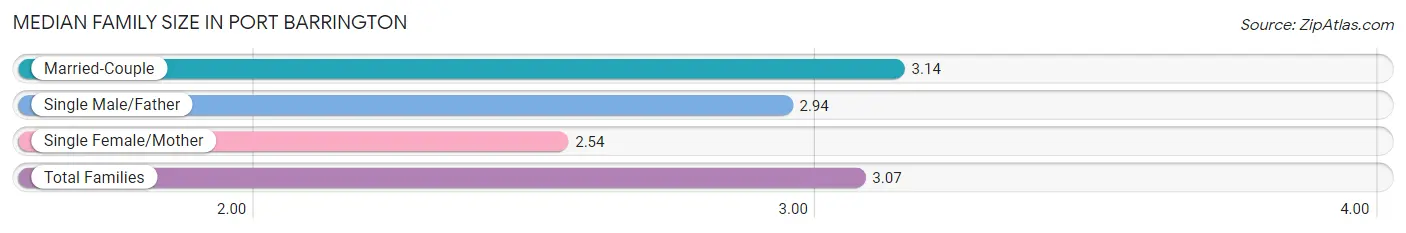
The median family size in Port Barrington is 3.07 persons per family, with married-couple families (359 | 80.0%) accounting for the largest median family size of 3.14 persons per family. On the other hand, single female/mother families (28 | 6.2%) represent the smallest median family size with 2.54 persons per family.
| Family Type | # Families | Family Size |
| Married-Couple | 359 (80.0%) | 3.14 |
| Single Male/Father | 62 (13.8%) | 2.94 |
| Single Female/Mother | 28 (6.2%) | 2.54 |
| Total Families | 449 (100.0%) | 3.07 |
Median Household Size in Port Barrington
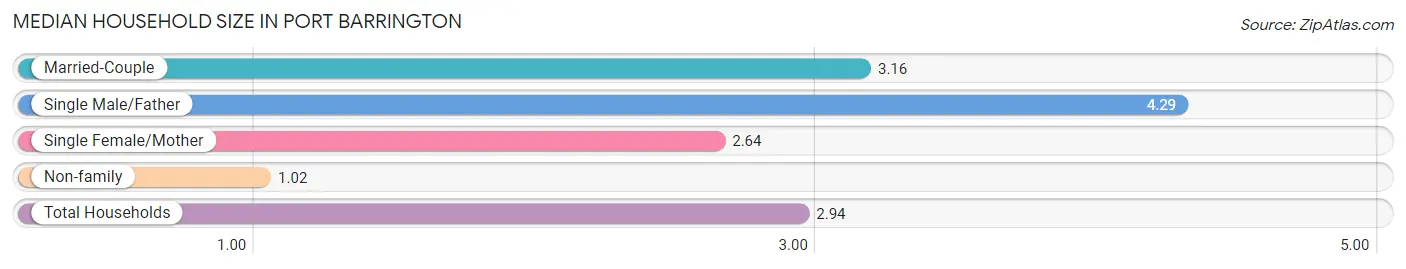
The median household size in Port Barrington is 2.94 persons per household, with single male/father households (62 | 11.7%) accounting for the largest median household size of 4.29 persons per household. non-family households (81 | 15.3%) represent the smallest median household size with 1.02 persons per household.
| Household Type | # Households | Household Size |
| Married-Couple | 359 (67.7%) | 3.16 |
| Single Male/Father | 62 (11.7%) | 4.29 |
| Single Female/Mother | 28 (5.3%) | 2.64 |
| Non-family | 81 (15.3%) | 1.02 |
| Total Households | 530 (100.0%) | 2.94 |
Household Size by Marriage Status in Port Barrington
Out of a total of 530 households in Port Barrington, 449 (84.7%) are family households, while 81 (15.3%) are nonfamily households. The most numerous type of family households are 2-person households, comprising 185, and the most common type of nonfamily households are 1-person households, comprising 79.
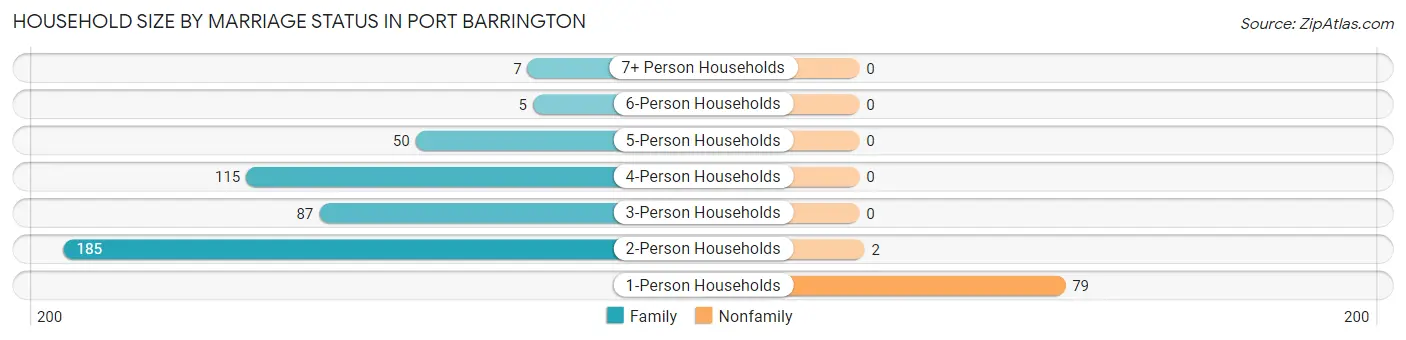
| Household Size | Family Households | Nonfamily Households |
| 1-Person Households | - | 79 (14.9%) |
| 2-Person Households | 185 (34.9%) | 2 (0.4%) |
| 3-Person Households | 87 (16.4%) | 0 (0.0%) |
| 4-Person Households | 115 (21.7%) | 0 (0.0%) |
| 5-Person Households | 50 (9.4%) | 0 (0.0%) |
| 6-Person Households | 5 (0.9%) | 0 (0.0%) |
| 7+ Person Households | 7 (1.3%) | 0 (0.0%) |
| Total | 449 (84.7%) | 81 (15.3%) |
Female Fertility in Port Barrington
Fertility by Age in Port Barrington
Average fertility rate in Port Barrington is 45.0 births per 1,000 women. Women in the age bracket of 35 to 50 years have the highest fertility rate with 72.0 births per 1,000 women. Women in the age bracket of 35 to 50 years acount for 84.2% of all women with births.
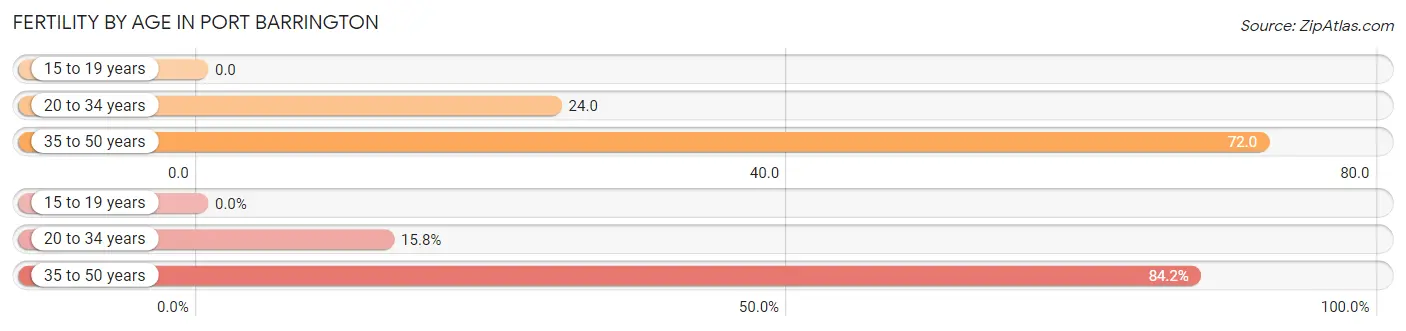
| Age Bracket | Women with Births | Births / 1,000 Women |
| 15 to 19 years | 0 (0.0%) | 0.0 |
| 20 to 34 years | 3 (15.8%) | 24.0 |
| 35 to 50 years | 16 (84.2%) | 72.0 |
| Total | 19 (100.0%) | 45.0 |
Fertility by Age by Marriage Status in Port Barrington
47.4% of women with births (19) in Port Barrington are married. The highest percentage of unmarried women with births falls into 35 to 50 years age bracket with 62.5% of them unmarried at the time of birth, while the lowest percentage of unmarried women with births belong to 20 to 34 years age bracket with 0.0% of them unmarried.
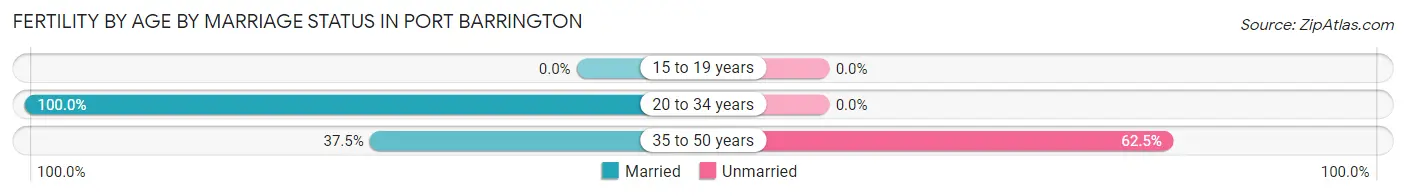
| Age Bracket | Married | Unmarried |
| 15 to 19 years | 0 (0.0%) | 0 (0.0%) |
| 20 to 34 years | 3 (100.0%) | 0 (0.0%) |
| 35 to 50 years | 6 (37.5%) | 10 (62.5%) |
| Total | 9 (47.4%) | 10 (52.6%) |
Fertility by Education in Port Barrington
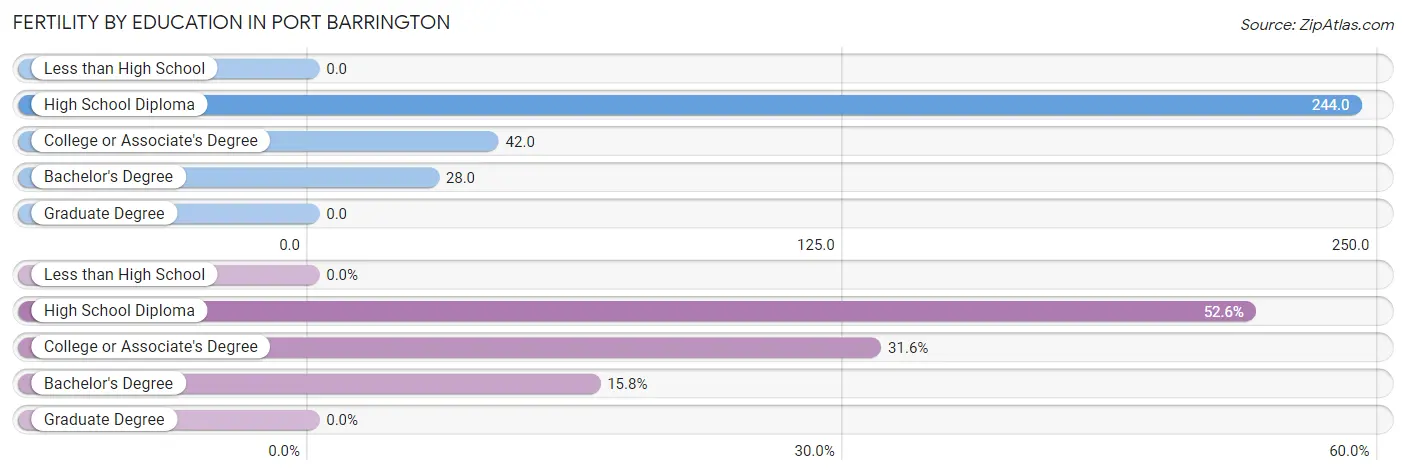
| Educational Attainment | Women with Births | Births / 1,000 Women |
| Less than High School | 0 (0.0%) | 0.0 |
| High School Diploma | 10 (52.6%) | 244.0 |
| College or Associate's Degree | 6 (31.6%) | 42.0 |
| Bachelor's Degree | 3 (15.8%) | 28.0 |
| Graduate Degree | 0 (0.0%) | 0.0 |
| Total | 19 (100.0%) | 45.0 |
Fertility by Education by Marriage Status in Port Barrington
52.6% of women with births in Port Barrington are unmarried. Women with the educational attainment of college or associate's degree are most likely to be married with 100.0% of them married at childbirth, while women with the educational attainment of high school diploma are least likely to be married with 100.0% of them unmarried at childbirth.
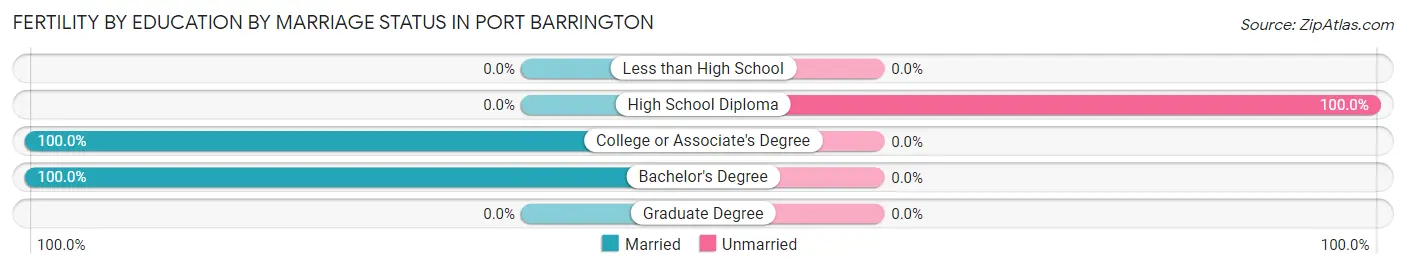
| Educational Attainment | Married | Unmarried |
| Less than High School | 0 (0.0%) | 0 (0.0%) |
| High School Diploma | 0 (0.0%) | 10 (100.0%) |
| College or Associate's Degree | 6 (100.0%) | 0 (0.0%) |
| Bachelor's Degree | 3 (100.0%) | 0 (0.0%) |
| Graduate Degree | 0 (0.0%) | 0 (0.0%) |
| Total | 9 (47.4%) | 10 (52.6%) |
Employment Characteristics in Port Barrington
Employment by Class of Employer in Port Barrington
Among the 869 employed individuals in Port Barrington, private company employees (594 | 68.3%), local government employees (74 | 8.5%), and not-for-profit organizations (69 | 7.9%) make up the most common classes of employment.
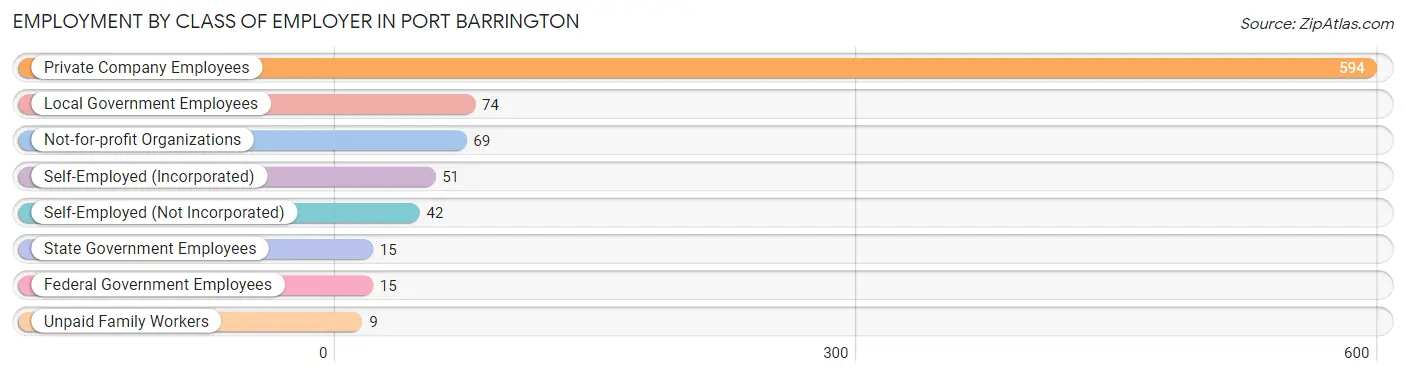
| Employer Class | # Employees | % Employees |
| Private Company Employees | 594 | 68.3% |
| Self-Employed (Incorporated) | 51 | 5.9% |
| Self-Employed (Not Incorporated) | 42 | 4.8% |
| Not-for-profit Organizations | 69 | 7.9% |
| Local Government Employees | 74 | 8.5% |
| State Government Employees | 15 | 1.7% |
| Federal Government Employees | 15 | 1.7% |
| Unpaid Family Workers | 9 | 1.0% |
| Total | 869 | 100.0% |
Employment Status by Age in Port Barrington
According to the labor force statistics for Port Barrington, out of the total population over 16 years of age (1,269), 71.1% or 902 individuals are in the labor force, with 3.4% or 31 of them unemployed. The age group with the highest labor force participation rate is 30 to 34 years, with 100.0% or 52 individuals in the labor force. Within the labor force, the 16 to 19 years age range has the highest percentage of unemployed individuals, with 15.6% or 7 of them being unemployed.
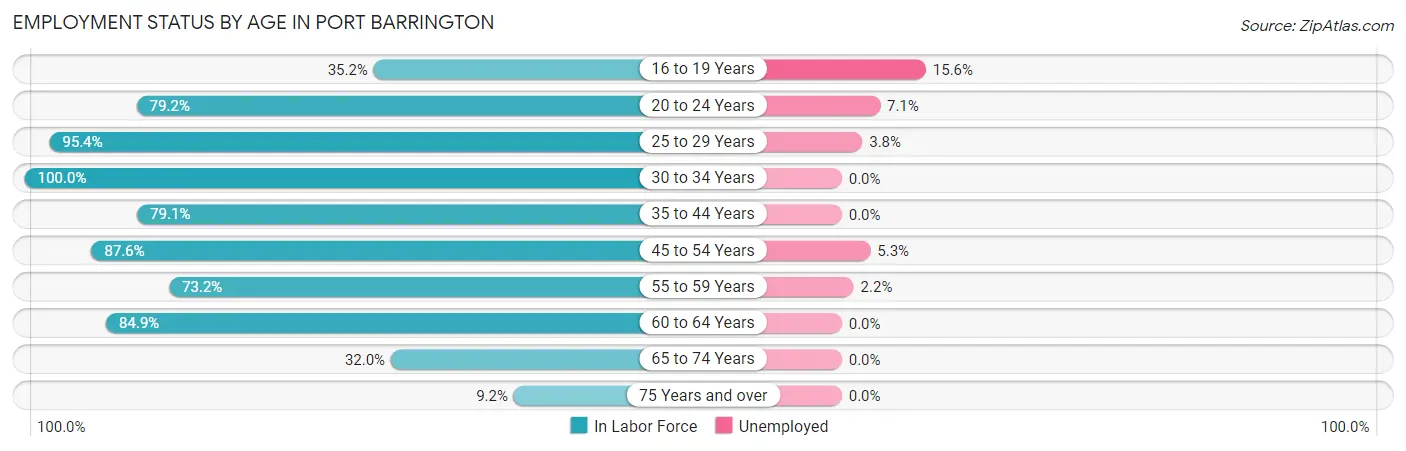
| Age Bracket | In Labor Force | Unemployed |
| 16 to 19 Years | 45 (35.2%) | 7 (15.6%) |
| 20 to 24 Years | 84 (79.2%) | 6 (7.1%) |
| 25 to 29 Years | 104 (95.4%) | 4 (3.8%) |
| 30 to 34 Years | 52 (100.0%) | 0 (0.0%) |
| 35 to 44 Years | 189 (79.1%) | 0 (0.0%) |
| 45 to 54 Years | 226 (87.6%) | 12 (5.3%) |
| 55 to 59 Years | 90 (73.2%) | 2 (2.2%) |
| 60 to 64 Years | 73 (84.9%) | 0 (0.0%) |
| 65 to 74 Years | 33 (32.0%) | 0 (0.0%) |
| 75 Years and over | 6 (9.2%) | 0 (0.0%) |
| Total | 902 (71.1%) | 31 (3.4%) |
Employment Status by Educational Attainment in Port Barrington
According to labor force statistics for Port Barrington, 84.7% of individuals (734) out of the total population between 25 and 64 years of age (867) are in the labor force, with 2.5% or 18 of them being unemployed. The group with the highest labor force participation rate are those with the educational attainment of bachelor's degree or higher, with 91.9% or 399 individuals in the labor force. Within the labor force, individuals with high school diploma education have the highest percentage of unemployment, with 6.2% or 7 of them being unemployed.
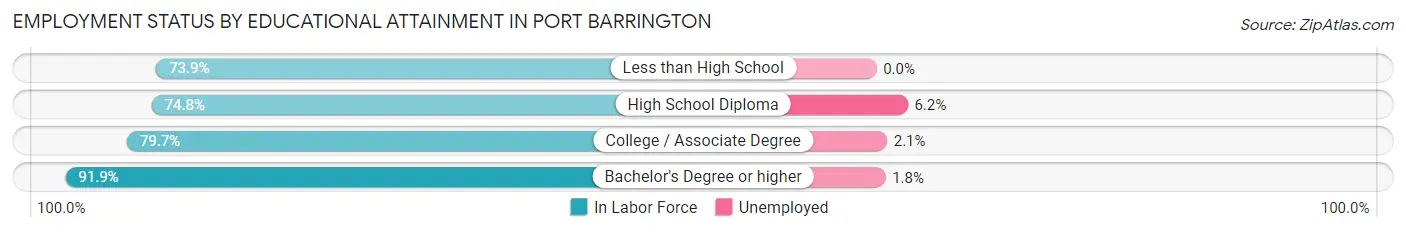
| Educational Attainment | In Labor Force | Unemployed |
| Less than High School | 34 (73.9%) | 0 (0.0%) |
| High School Diploma | 113 (74.8%) | 9 (6.2%) |
| College / Associate Degree | 188 (79.7%) | 5 (2.1%) |
| Bachelor's Degree or higher | 399 (91.9%) | 8 (1.8%) |
| Total | 734 (84.7%) | 22 (2.5%) |
Employment Occupations by Sex in Port Barrington
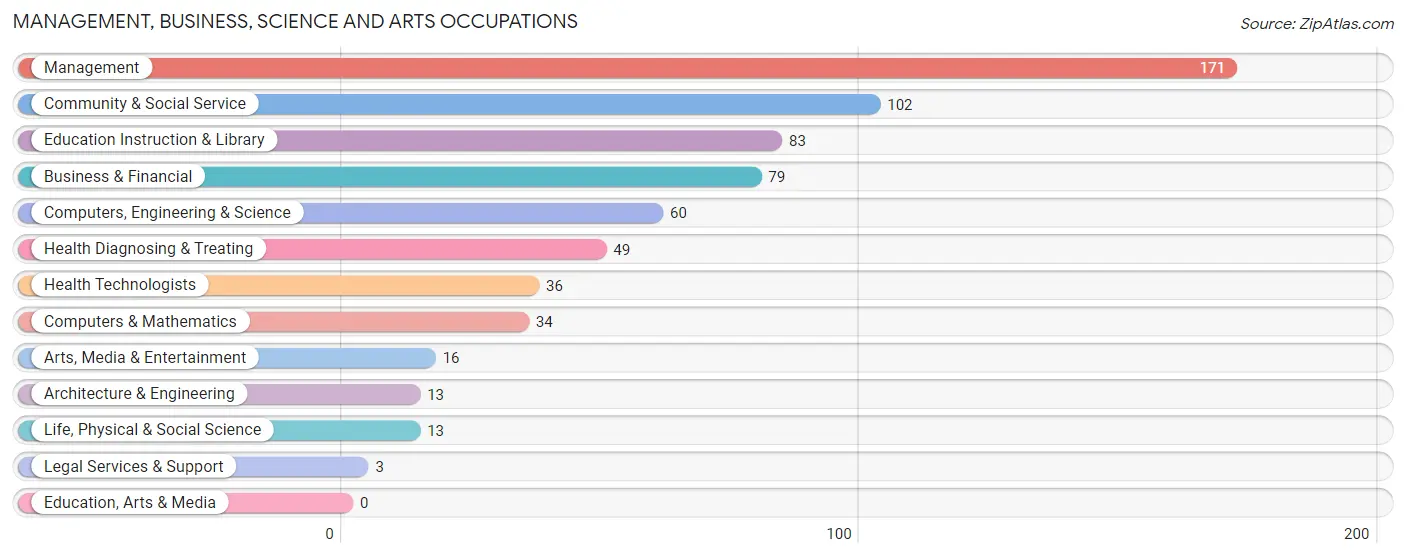
Management, Business, Science and Arts Occupations
The most common Management, Business, Science and Arts occupations in Port Barrington are Management (171 | 19.6%), Community & Social Service (102 | 11.7%), Education Instruction & Library (83 | 9.5%), Business & Financial (79 | 9.1%), and Computers, Engineering & Science (60 | 6.9%).
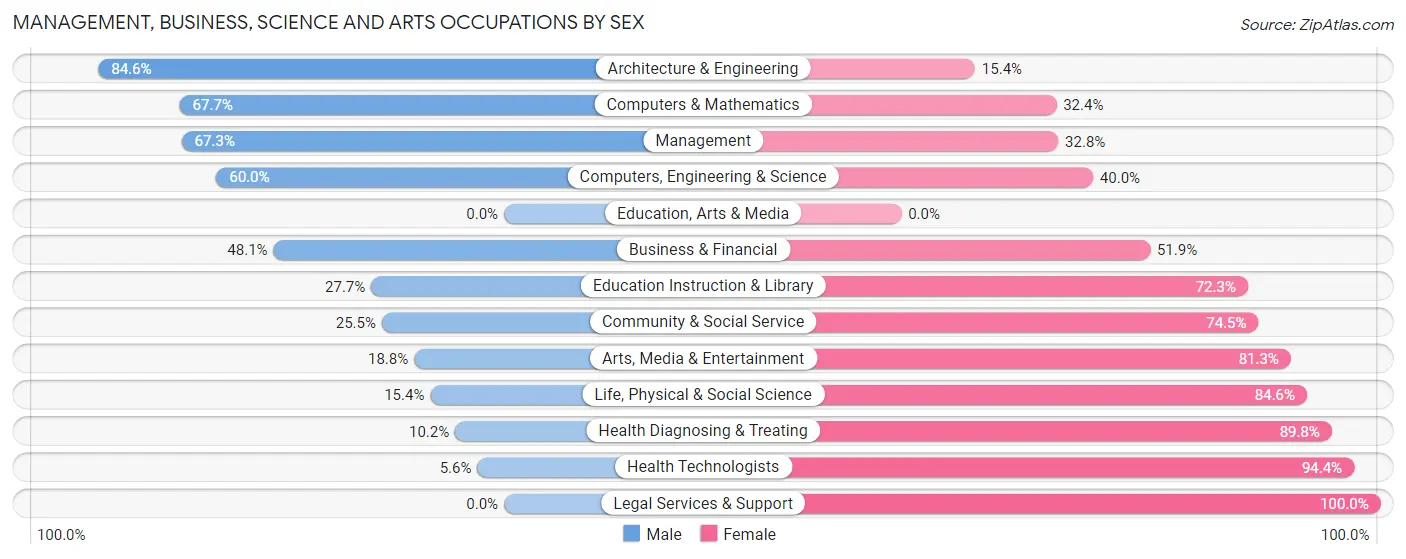
Management, Business, Science and Arts Occupations by Sex
Within the Management, Business, Science and Arts occupations in Port Barrington, the most male-oriented occupations are Architecture & Engineering (84.6%), Computers & Mathematics (67.6%), and Management (67.2%), while the most female-oriented occupations are Legal Services & Support (100.0%), Health Technologists (94.4%), and Health Diagnosing & Treating (89.8%).
| Occupation | Male | Female |
| Management | 115 (67.2%) | 56 (32.8%) |
| Business & Financial | 38 (48.1%) | 41 (51.9%) |
| Computers, Engineering & Science | 36 (60.0%) | 24 (40.0%) |
| Computers & Mathematics | 23 (67.6%) | 11 (32.4%) |
| Architecture & Engineering | 11 (84.6%) | 2 (15.4%) |
| Life, Physical & Social Science | 2 (15.4%) | 11 (84.6%) |
| Community & Social Service | 26 (25.5%) | 76 (74.5%) |
| Education, Arts & Media | 0 (0.0%) | 0 (0.0%) |
| Legal Services & Support | 0 (0.0%) | 3 (100.0%) |
| Education Instruction & Library | 23 (27.7%) | 60 (72.3%) |
| Arts, Media & Entertainment | 3 (18.8%) | 13 (81.2%) |
| Health Diagnosing & Treating | 5 (10.2%) | 44 (89.8%) |
| Health Technologists | 2 (5.6%) | 34 (94.4%) |
| Total (Category) | 220 (47.7%) | 241 (52.3%) |
| Total (Overall) | 470 (54.0%) | 401 (46.0%) |
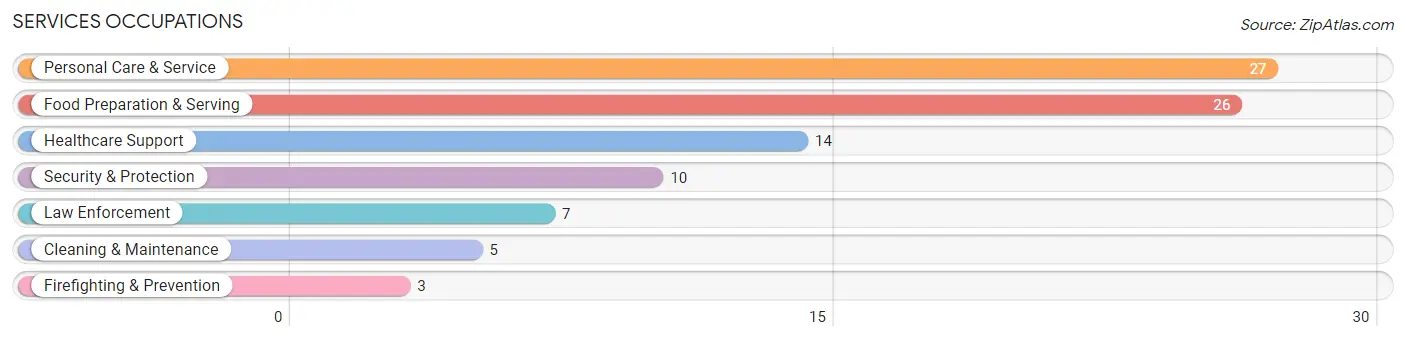
Services Occupations
The most common Services occupations in Port Barrington are Personal Care & Service (27 | 3.1%), Food Preparation & Serving (26 | 3.0%), Healthcare Support (14 | 1.6%), Security & Protection (10 | 1.1%), and Law Enforcement (7 | 0.8%).
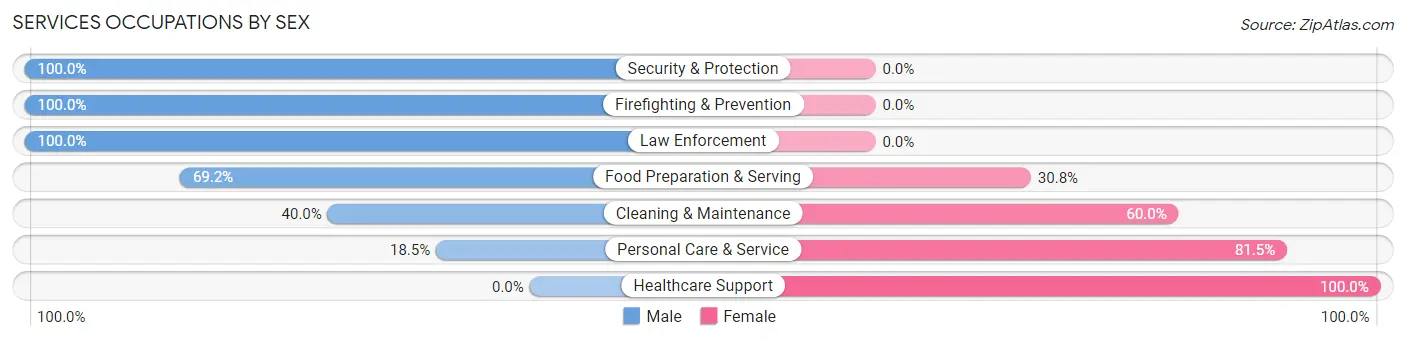
Services Occupations by Sex
Within the Services occupations in Port Barrington, the most male-oriented occupations are Security & Protection (100.0%), Firefighting & Prevention (100.0%), and Law Enforcement (100.0%), while the most female-oriented occupations are Healthcare Support (100.0%), Personal Care & Service (81.5%), and Cleaning & Maintenance (60.0%).
| Occupation | Male | Female |
| Healthcare Support | 0 (0.0%) | 14 (100.0%) |
| Security & Protection | 10 (100.0%) | 0 (0.0%) |
| Firefighting & Prevention | 3 (100.0%) | 0 (0.0%) |
| Law Enforcement | 7 (100.0%) | 0 (0.0%) |
| Food Preparation & Serving | 18 (69.2%) | 8 (30.8%) |
| Cleaning & Maintenance | 2 (40.0%) | 3 (60.0%) |
| Personal Care & Service | 5 (18.5%) | 22 (81.5%) |
| Total (Category) | 35 (42.7%) | 47 (57.3%) |
| Total (Overall) | 470 (54.0%) | 401 (46.0%) |
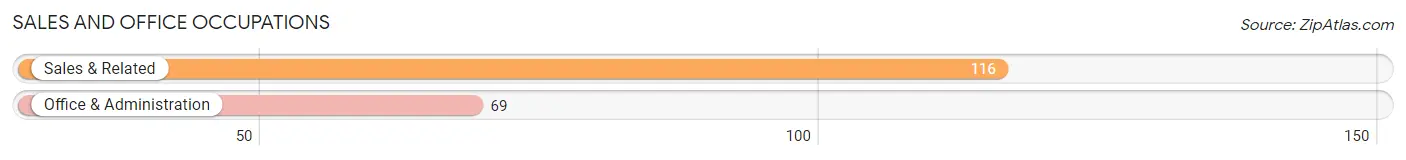
Sales and Office Occupations
The most common Sales and Office occupations in Port Barrington are Sales & Related (116 | 13.3%), and Office & Administration (69 | 7.9%).
Sales and Office Occupations by Sex
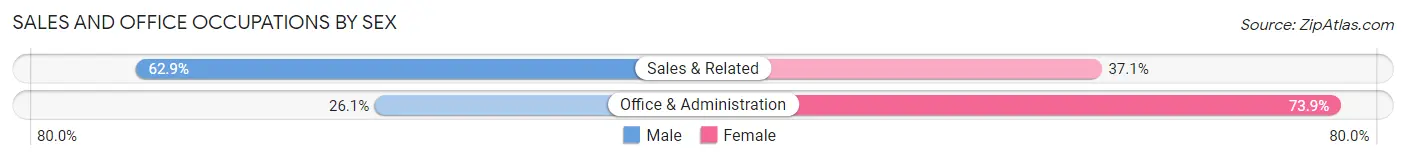
| Occupation | Male | Female |
| Sales & Related | 73 (62.9%) | 43 (37.1%) |
| Office & Administration | 18 (26.1%) | 51 (73.9%) |
| Total (Category) | 91 (49.2%) | 94 (50.8%) |
| Total (Overall) | 470 (54.0%) | 401 (46.0%) |
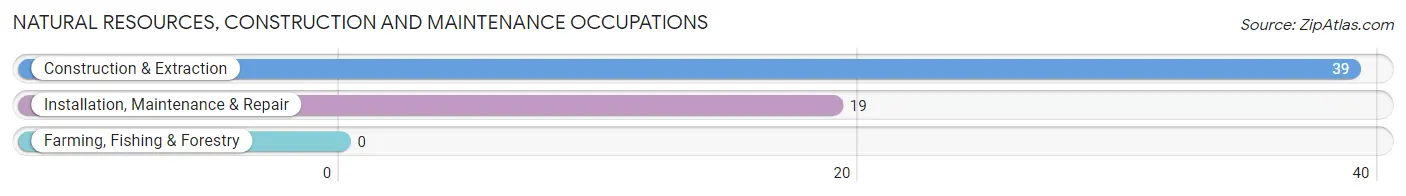
Natural Resources, Construction and Maintenance Occupations
The most common Natural Resources, Construction and Maintenance occupations in Port Barrington are Construction & Extraction (39 | 4.5%), and Installation, Maintenance & Repair (19 | 2.2%).
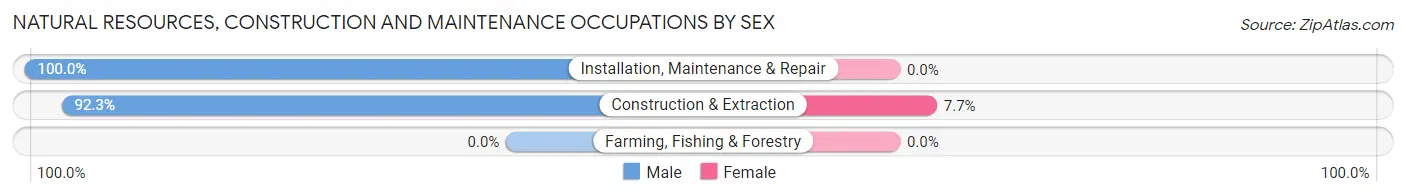
Natural Resources, Construction and Maintenance Occupations by Sex
| Occupation | Male | Female |
| Farming, Fishing & Forestry | 0 (0.0%) | 0 (0.0%) |
| Construction & Extraction | 36 (92.3%) | 3 (7.7%) |
| Installation, Maintenance & Repair | 19 (100.0%) | 0 (0.0%) |
| Total (Category) | 55 (94.8%) | 3 (5.2%) |
| Total (Overall) | 470 (54.0%) | 401 (46.0%) |
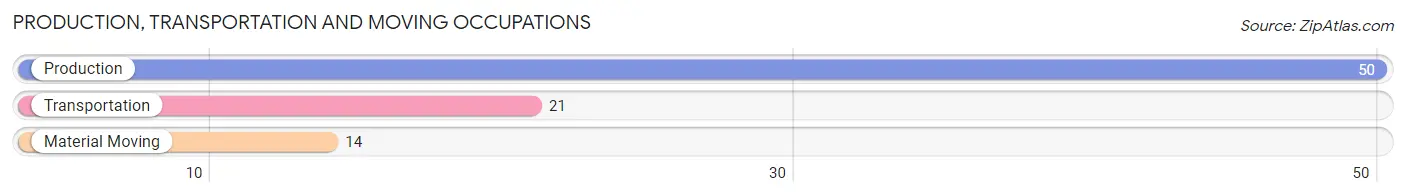
Production, Transportation and Moving Occupations
The most common Production, Transportation and Moving occupations in Port Barrington are Production (50 | 5.7%), Transportation (21 | 2.4%), and Material Moving (14 | 1.6%).
Production, Transportation and Moving Occupations by Sex
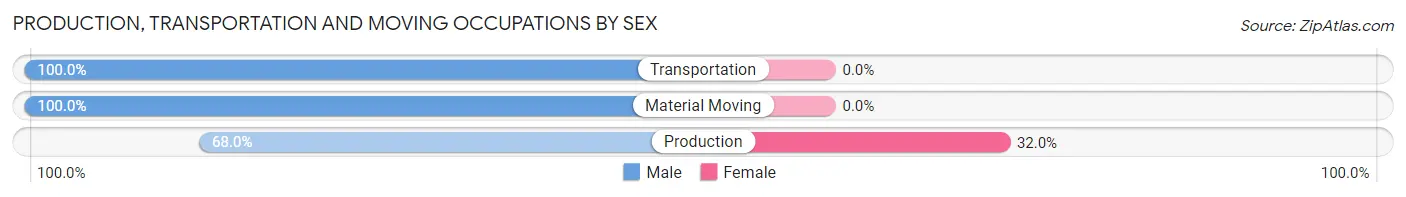
| Occupation | Male | Female |
| Production | 34 (68.0%) | 16 (32.0%) |
| Transportation | 21 (100.0%) | 0 (0.0%) |
| Material Moving | 14 (100.0%) | 0 (0.0%) |
| Total (Category) | 69 (81.2%) | 16 (18.8%) |
| Total (Overall) | 470 (54.0%) | 401 (46.0%) |
Employment Industries by Sex in Port Barrington
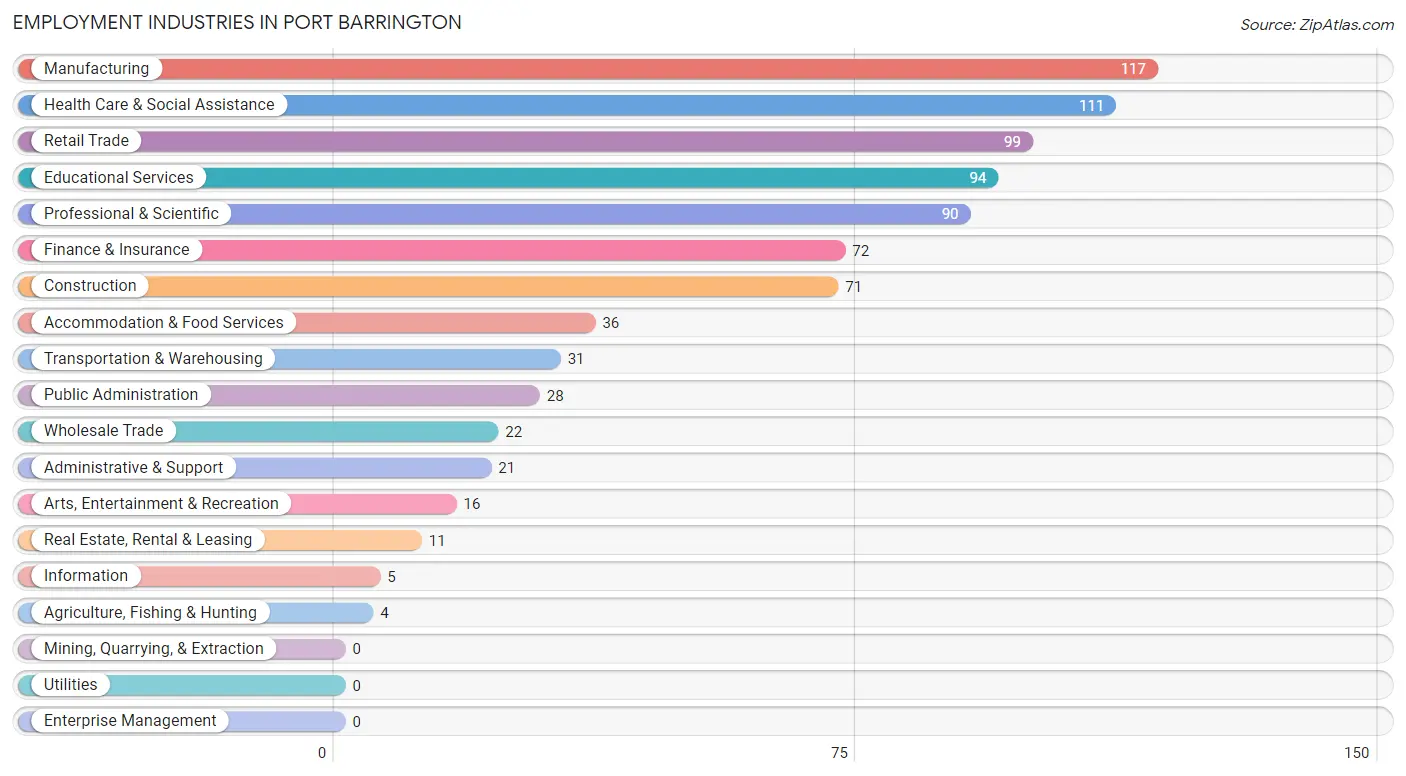
Employment Industries in Port Barrington
The major employment industries in Port Barrington include Manufacturing (117 | 13.4%), Health Care & Social Assistance (111 | 12.7%), Retail Trade (99 | 11.4%), Educational Services (94 | 10.8%), and Professional & Scientific (90 | 10.3%).
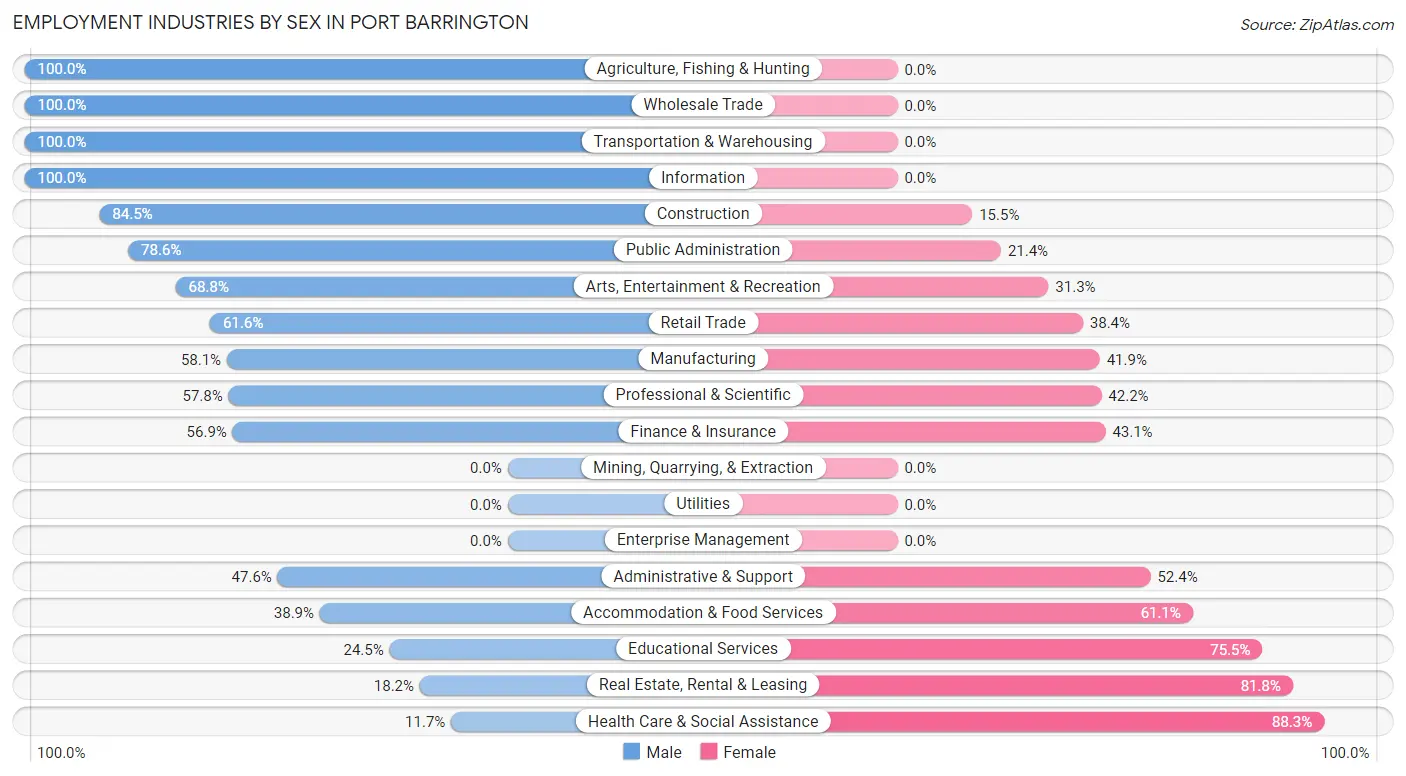
Employment Industries by Sex in Port Barrington
The Port Barrington industries that see more men than women are Agriculture, Fishing & Hunting (100.0%), Wholesale Trade (100.0%), and Transportation & Warehousing (100.0%), whereas the industries that tend to have a higher number of women are Health Care & Social Assistance (88.3%), Real Estate, Rental & Leasing (81.8%), and Educational Services (75.5%).
| Industry | Male | Female |
| Agriculture, Fishing & Hunting | 4 (100.0%) | 0 (0.0%) |
| Mining, Quarrying, & Extraction | 0 (0.0%) | 0 (0.0%) |
| Construction | 60 (84.5%) | 11 (15.5%) |
| Manufacturing | 68 (58.1%) | 49 (41.9%) |
| Wholesale Trade | 22 (100.0%) | 0 (0.0%) |
| Retail Trade | 61 (61.6%) | 38 (38.4%) |
| Transportation & Warehousing | 31 (100.0%) | 0 (0.0%) |
| Utilities | 0 (0.0%) | 0 (0.0%) |
| Information | 5 (100.0%) | 0 (0.0%) |
| Finance & Insurance | 41 (56.9%) | 31 (43.1%) |
| Real Estate, Rental & Leasing | 2 (18.2%) | 9 (81.8%) |
| Professional & Scientific | 52 (57.8%) | 38 (42.2%) |
| Enterprise Management | 0 (0.0%) | 0 (0.0%) |
| Administrative & Support | 10 (47.6%) | 11 (52.4%) |
| Educational Services | 23 (24.5%) | 71 (75.5%) |
| Health Care & Social Assistance | 13 (11.7%) | 98 (88.3%) |
| Arts, Entertainment & Recreation | 11 (68.8%) | 5 (31.2%) |
| Accommodation & Food Services | 14 (38.9%) | 22 (61.1%) |
| Public Administration | 22 (78.6%) | 6 (21.4%) |
| Total | 470 (54.0%) | 401 (46.0%) |
Education in Port Barrington
School Enrollment in Port Barrington
The most common levels of schooling among the 413 students in Port Barrington are high school (124 | 30.0%), middle school (109 | 26.4%), and college / undergraduate (77 | 18.6%).
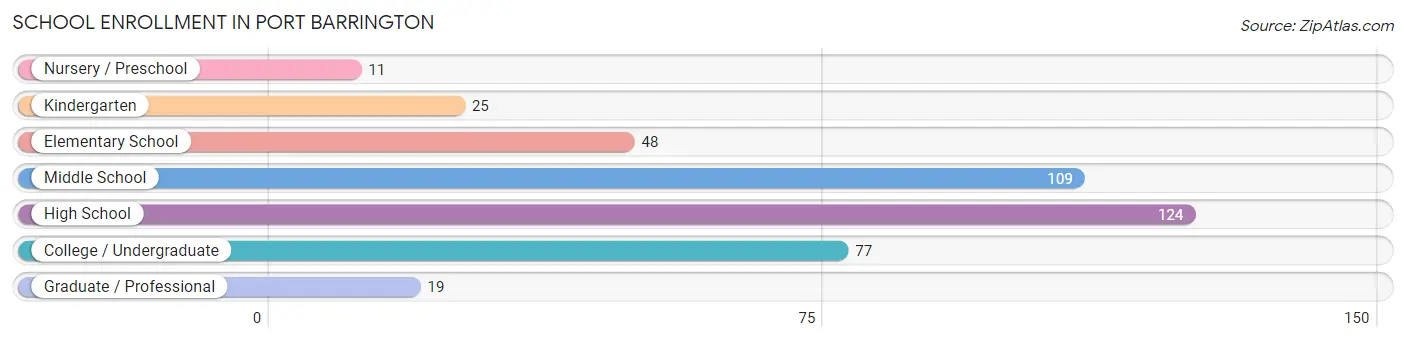
| School Level | # Students | % Students |
| Nursery / Preschool | 11 | 2.7% |
| Kindergarten | 25 | 6.0% |
| Elementary School | 48 | 11.6% |
| Middle School | 109 | 26.4% |
| High School | 124 | 30.0% |
| College / Undergraduate | 77 | 18.6% |
| Graduate / Professional | 19 | 4.6% |
| Total | 413 | 100.0% |
School Enrollment by Age by Funding Source in Port Barrington
Out of a total of 413 students who are enrolled in schools in Port Barrington, 45 (10.9%) attend a private institution, while the remaining 368 (89.1%) are enrolled in public schools. The age group of 3 to 4 year olds has the highest likelihood of being enrolled in private schools, with 5 (100.0% in the age bracket) enrolled. Conversely, the age group of 18 to 19 year olds has the lowest likelihood of being enrolled in a private school, with 27 (100.0% in the age bracket) attending a public institution.
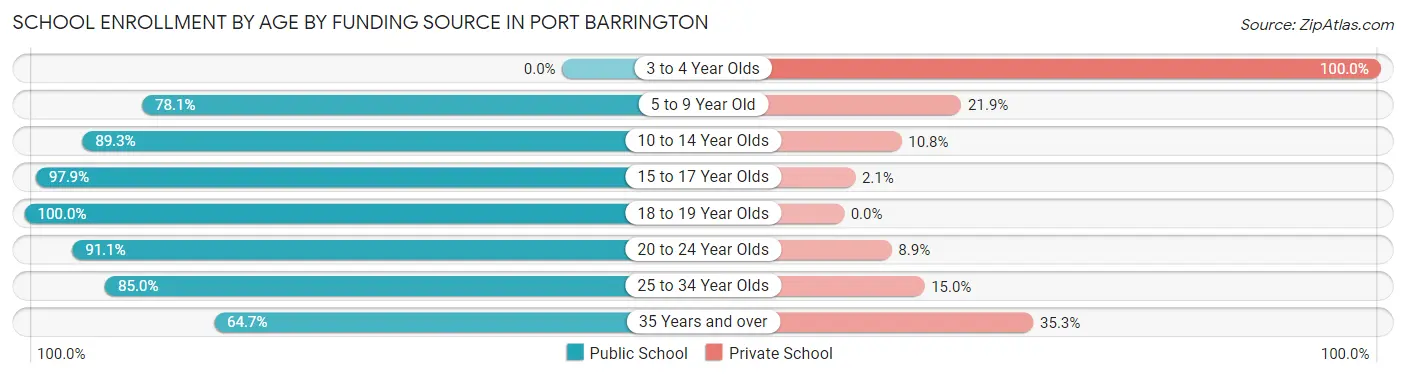
| Age Bracket | Public School | Private School |
| 3 to 4 Year Olds | 0 (0.0%) | 5 (100.0%) |
| 5 to 9 Year Old | 50 (78.1%) | 14 (21.9%) |
| 10 to 14 Year Olds | 83 (89.2%) | 10 (10.7%) |
| 15 to 17 Year Olds | 139 (97.9%) | 3 (2.1%) |
| 18 to 19 Year Olds | 27 (100.0%) | 0 (0.0%) |
| 20 to 24 Year Olds | 41 (91.1%) | 4 (8.9%) |
| 25 to 34 Year Olds | 17 (85.0%) | 3 (15.0%) |
| 35 Years and over | 11 (64.7%) | 6 (35.3%) |
| Total | 368 (89.1%) | 45 (10.9%) |
Educational Attainment by Field of Study in Port Barrington
Business (134 | 26.1%), engineering (51 | 9.9%), communications (45 | 8.7%), science & technology (42 | 8.2%), and physical & health sciences (37 | 7.2%) are the most common fields of study among 514 individuals in Port Barrington who have obtained a bachelor's degree or higher.
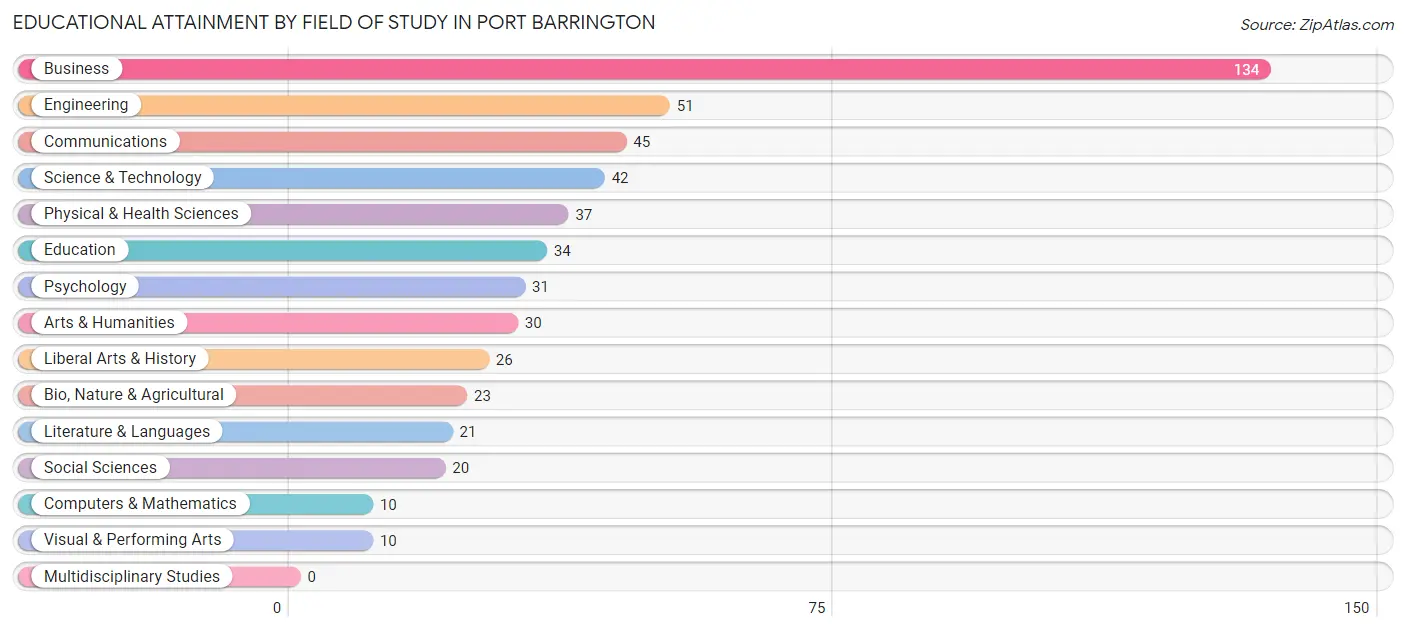
| Field of Study | # Graduates | % Graduates |
| Computers & Mathematics | 10 | 1.9% |
| Bio, Nature & Agricultural | 23 | 4.5% |
| Physical & Health Sciences | 37 | 7.2% |
| Psychology | 31 | 6.0% |
| Social Sciences | 20 | 3.9% |
| Engineering | 51 | 9.9% |
| Multidisciplinary Studies | 0 | 0.0% |
| Science & Technology | 42 | 8.2% |
| Business | 134 | 26.1% |
| Education | 34 | 6.6% |
| Literature & Languages | 21 | 4.1% |
| Liberal Arts & History | 26 | 5.1% |
| Visual & Performing Arts | 10 | 1.9% |
| Communications | 45 | 8.7% |
| Arts & Humanities | 30 | 5.8% |
| Total | 514 | 100.0% |
Transportation & Commute in Port Barrington
Vehicle Availability by Sex in Port Barrington
The most prevalent vehicle ownership categories in Port Barrington are males with 2 vehicles (181, accounting for 38.5%) and females with 2 vehicles (175, making up 45.4%).
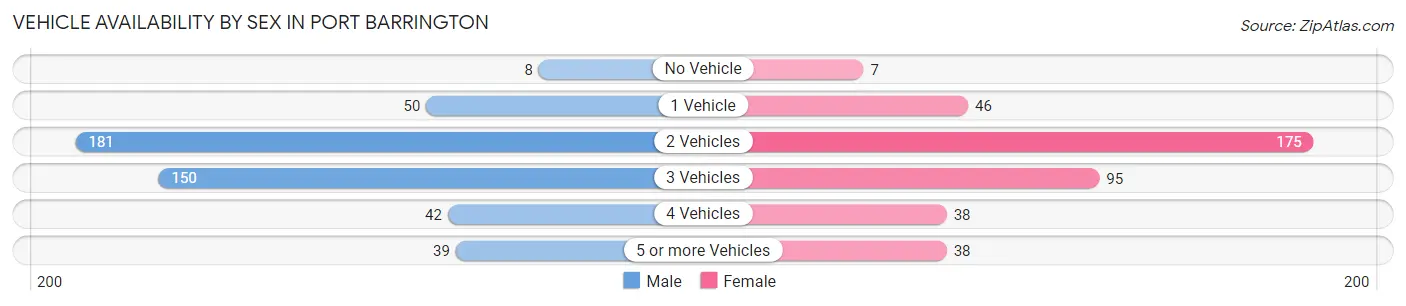
| Vehicles Available | Male | Female |
| No Vehicle | 8 (1.7%) | 7 (1.8%) |
| 1 Vehicle | 50 (10.6%) | 46 (11.5%) |
| 2 Vehicles | 181 (38.5%) | 175 (43.9%) |
| 3 Vehicles | 150 (31.9%) | 95 (23.8%) |
| 4 Vehicles | 42 (8.9%) | 38 (9.5%) |
| 5 or more Vehicles | 39 (8.3%) | 38 (9.5%) |
| Total | 470 (100.0%) | 399 (100.0%) |
Commute Time in Port Barrington
The most frequently occuring commute durations in Port Barrington are 45 to 59 minutes (118 commuters, 16.0%), 40 to 44 minutes (92 commuters, 12.4%), and 60 to 89 minutes (91 commuters, 12.3%).
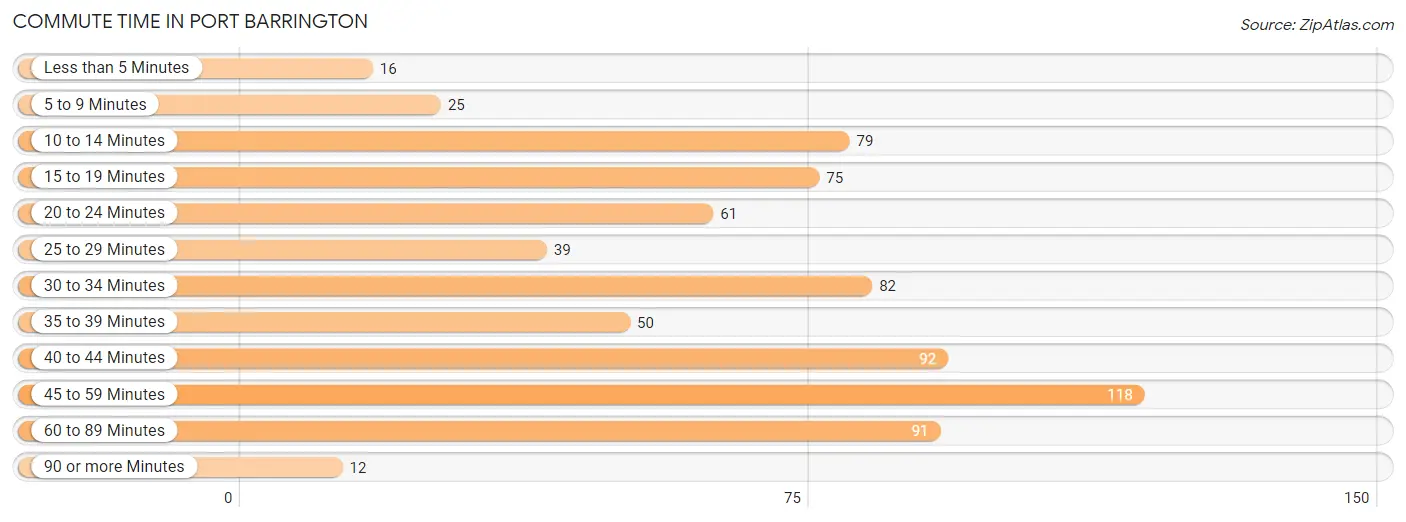
| Commute Time | # Commuters | % Commuters |
| Less than 5 Minutes | 16 | 2.2% |
| 5 to 9 Minutes | 25 | 3.4% |
| 10 to 14 Minutes | 79 | 10.7% |
| 15 to 19 Minutes | 75 | 10.1% |
| 20 to 24 Minutes | 61 | 8.2% |
| 25 to 29 Minutes | 39 | 5.3% |
| 30 to 34 Minutes | 82 | 11.1% |
| 35 to 39 Minutes | 50 | 6.8% |
| 40 to 44 Minutes | 92 | 12.4% |
| 45 to 59 Minutes | 118 | 16.0% |
| 60 to 89 Minutes | 91 | 12.3% |
| 90 or more Minutes | 12 | 1.6% |
Commute Time by Sex in Port Barrington
The most common commute times in Port Barrington are 45 to 59 minutes (71 commuters, 17.5%) for males and 30 to 34 minutes (49 commuters, 14.7%) for females.
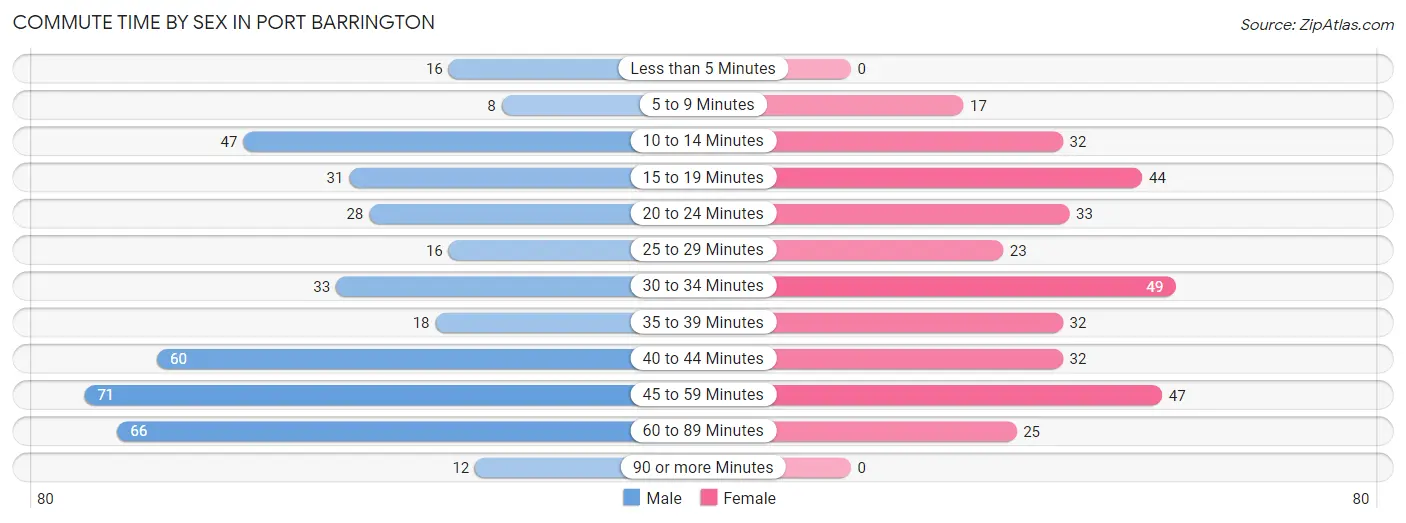
| Commute Time | Male | Female |
| Less than 5 Minutes | 16 (3.9%) | 0 (0.0%) |
| 5 to 9 Minutes | 8 (2.0%) | 17 (5.1%) |
| 10 to 14 Minutes | 47 (11.6%) | 32 (9.6%) |
| 15 to 19 Minutes | 31 (7.6%) | 44 (13.2%) |
| 20 to 24 Minutes | 28 (6.9%) | 33 (9.9%) |
| 25 to 29 Minutes | 16 (3.9%) | 23 (6.9%) |
| 30 to 34 Minutes | 33 (8.1%) | 49 (14.7%) |
| 35 to 39 Minutes | 18 (4.4%) | 32 (9.6%) |
| 40 to 44 Minutes | 60 (14.8%) | 32 (9.6%) |
| 45 to 59 Minutes | 71 (17.5%) | 47 (14.1%) |
| 60 to 89 Minutes | 66 (16.3%) | 25 (7.5%) |
| 90 or more Minutes | 12 (3.0%) | 0 (0.0%) |
Time of Departure to Work by Sex in Port Barrington
The most frequent times of departure to work in Port Barrington are 7:00 AM to 7:29 AM (73, 18.0%) for males and 6:30 AM to 6:59 AM (95, 28.4%) for females.
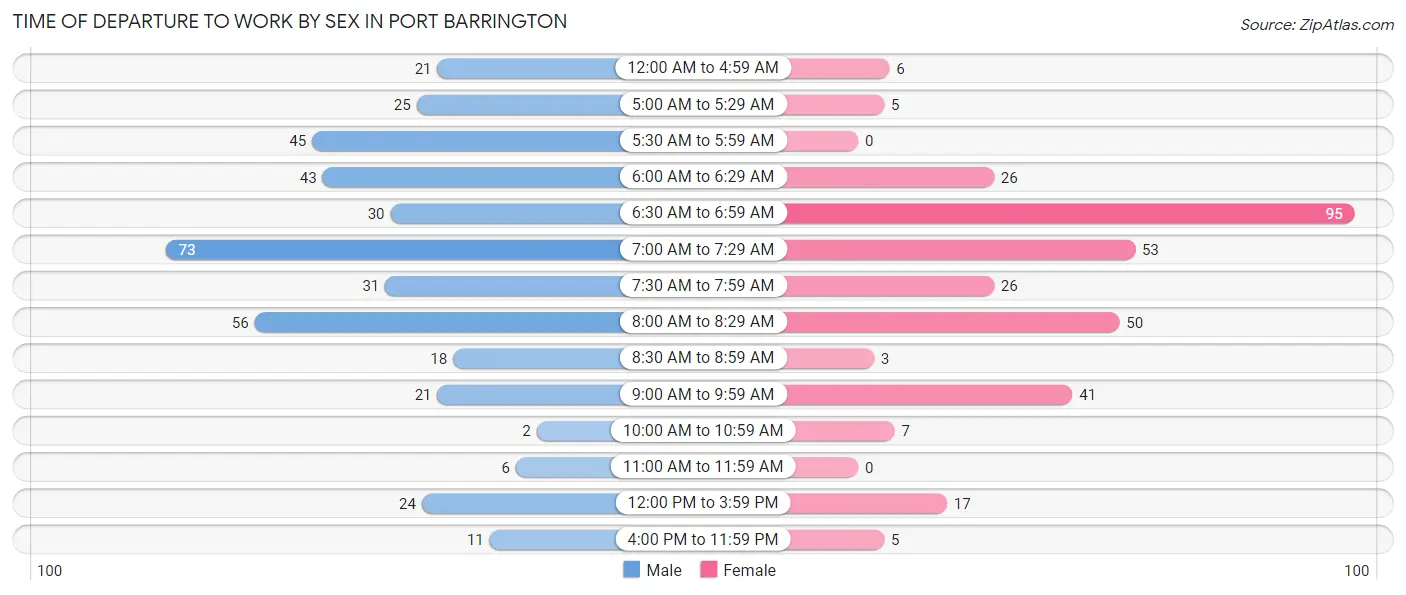
| Time of Departure | Male | Female |
| 12:00 AM to 4:59 AM | 21 (5.2%) | 6 (1.8%) |
| 5:00 AM to 5:29 AM | 25 (6.2%) | 5 (1.5%) |
| 5:30 AM to 5:59 AM | 45 (11.1%) | 0 (0.0%) |
| 6:00 AM to 6:29 AM | 43 (10.6%) | 26 (7.8%) |
| 6:30 AM to 6:59 AM | 30 (7.4%) | 95 (28.4%) |
| 7:00 AM to 7:29 AM | 73 (18.0%) | 53 (15.9%) |
| 7:30 AM to 7:59 AM | 31 (7.6%) | 26 (7.8%) |
| 8:00 AM to 8:29 AM | 56 (13.8%) | 50 (15.0%) |
| 8:30 AM to 8:59 AM | 18 (4.4%) | 3 (0.9%) |
| 9:00 AM to 9:59 AM | 21 (5.2%) | 41 (12.3%) |
| 10:00 AM to 10:59 AM | 2 (0.5%) | 7 (2.1%) |
| 11:00 AM to 11:59 AM | 6 (1.5%) | 0 (0.0%) |
| 12:00 PM to 3:59 PM | 24 (5.9%) | 17 (5.1%) |
| 4:00 PM to 11:59 PM | 11 (2.7%) | 5 (1.5%) |
| Total | 406 (100.0%) | 334 (100.0%) |
Housing Occupancy in Port Barrington
Occupancy by Ownership in Port Barrington
Of the total 530 dwellings in Port Barrington, owner-occupied units account for 492 (92.8%), while renter-occupied units make up 38 (7.2%).
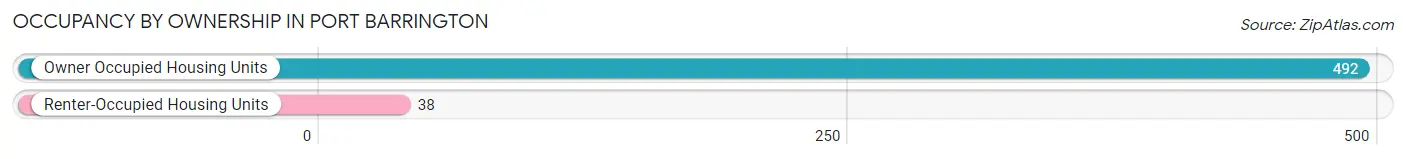
| Occupancy | # Housing Units | % Housing Units |
| Owner Occupied Housing Units | 492 | 92.8% |
| Renter-Occupied Housing Units | 38 | 7.2% |
| Total Occupied Housing Units | 530 | 100.0% |
Occupancy by Household Size in Port Barrington
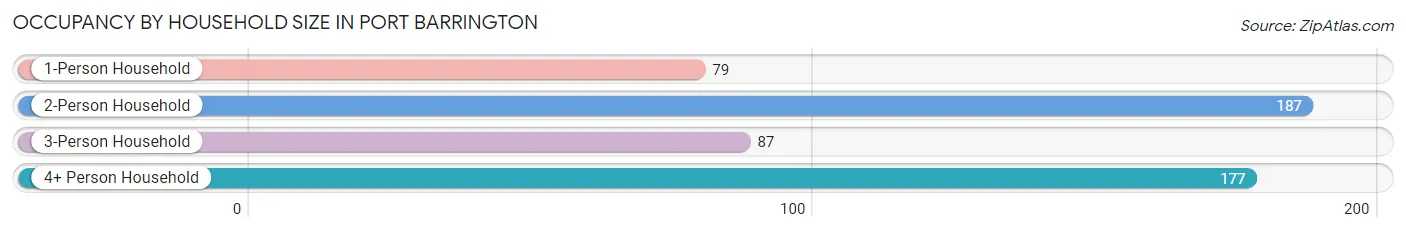
| Household Size | # Housing Units | % Housing Units |
| 1-Person Household | 79 | 14.9% |
| 2-Person Household | 187 | 35.3% |
| 3-Person Household | 87 | 16.4% |
| 4+ Person Household | 177 | 33.4% |
| Total Housing Units | 530 | 100.0% |
Occupancy by Ownership by Household Size in Port Barrington
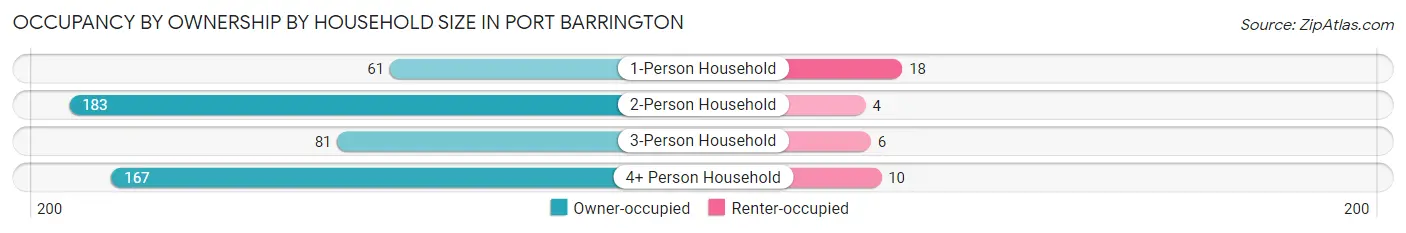
| Household Size | Owner-occupied | Renter-occupied |
| 1-Person Household | 61 (77.2%) | 18 (22.8%) |
| 2-Person Household | 183 (97.9%) | 4 (2.1%) |
| 3-Person Household | 81 (93.1%) | 6 (6.9%) |
| 4+ Person Household | 167 (94.4%) | 10 (5.7%) |
| Total Housing Units | 492 (92.8%) | 38 (7.2%) |
Occupancy by Educational Attainment in Port Barrington
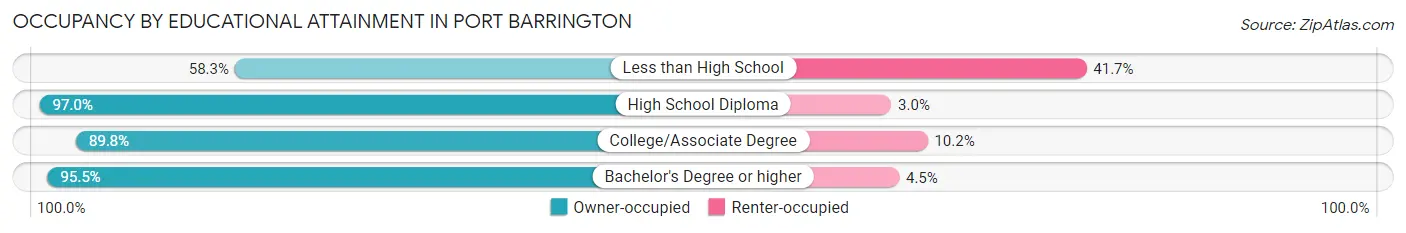
| Household Size | Owner-occupied | Renter-occupied |
| Less than High School | 14 (58.3%) | 10 (41.7%) |
| High School Diploma | 98 (97.0%) | 3 (3.0%) |
| College/Associate Degree | 106 (89.8%) | 12 (10.2%) |
| Bachelor's Degree or higher | 274 (95.5%) | 13 (4.5%) |
Occupancy by Age of Householder in Port Barrington
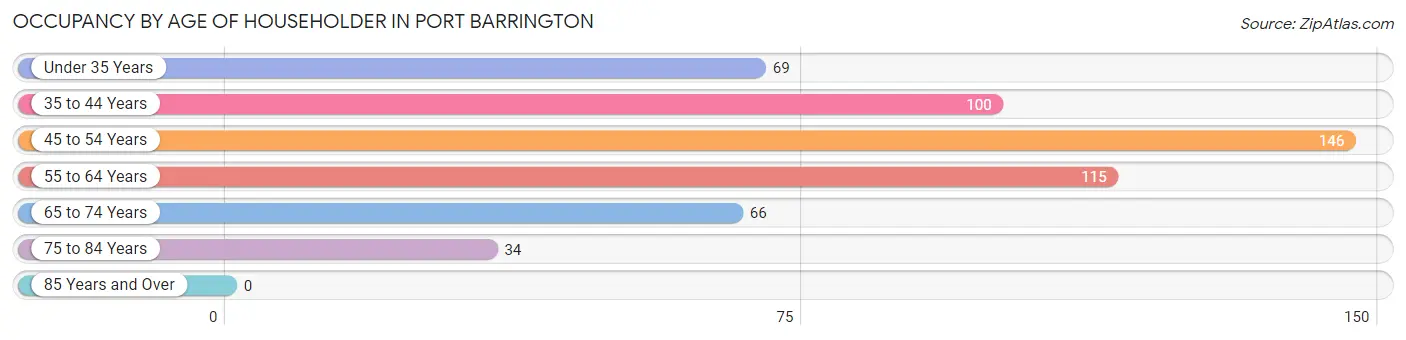
| Age Bracket | # Households | % Households |
| Under 35 Years | 69 | 13.0% |
| 35 to 44 Years | 100 | 18.9% |
| 45 to 54 Years | 146 | 27.6% |
| 55 to 64 Years | 115 | 21.7% |
| 65 to 74 Years | 66 | 12.4% |
| 75 to 84 Years | 34 | 6.4% |
| 85 Years and Over | 0 | 0.0% |
| Total | 530 | 100.0% |
Housing Finances in Port Barrington
Median Income by Occupancy in Port Barrington
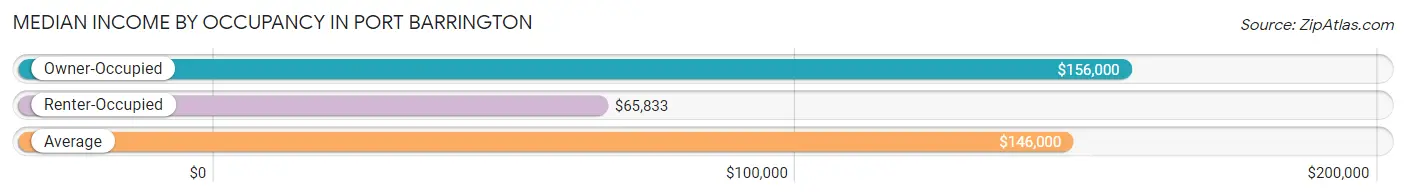
| Occupancy Type | # Households | Median Income |
| Owner-Occupied | 492 (92.8%) | $156,000 |
| Renter-Occupied | 38 (7.2%) | $65,833 |
| Average | 530 (100.0%) | $146,000 |
Occupancy by Householder Income Bracket in Port Barrington
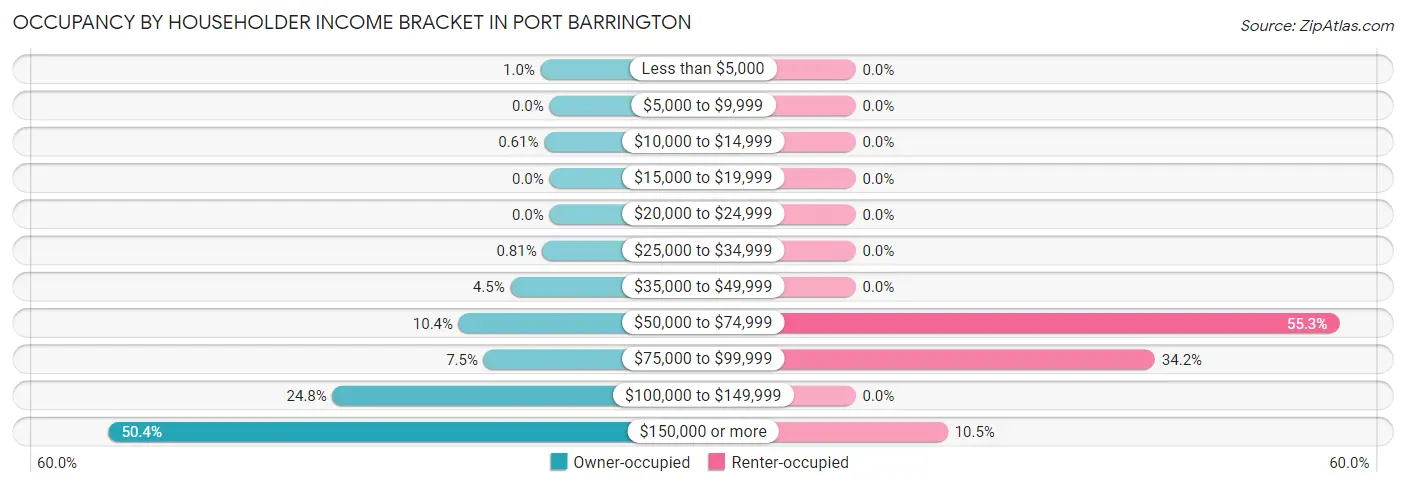
| Income Bracket | Owner-occupied | Renter-occupied |
| Less than $5,000 | 5 (1.0%) | 0 (0.0%) |
| $5,000 to $9,999 | 0 (0.0%) | 0 (0.0%) |
| $10,000 to $14,999 | 3 (0.6%) | 0 (0.0%) |
| $15,000 to $19,999 | 0 (0.0%) | 0 (0.0%) |
| $20,000 to $24,999 | 0 (0.0%) | 0 (0.0%) |
| $25,000 to $34,999 | 4 (0.8%) | 0 (0.0%) |
| $35,000 to $49,999 | 22 (4.5%) | 0 (0.0%) |
| $50,000 to $74,999 | 51 (10.4%) | 21 (55.3%) |
| $75,000 to $99,999 | 37 (7.5%) | 13 (34.2%) |
| $100,000 to $149,999 | 122 (24.8%) | 0 (0.0%) |
| $150,000 or more | 248 (50.4%) | 4 (10.5%) |
| Total | 492 (100.0%) | 38 (100.0%) |
Monthly Housing Cost Tiers in Port Barrington
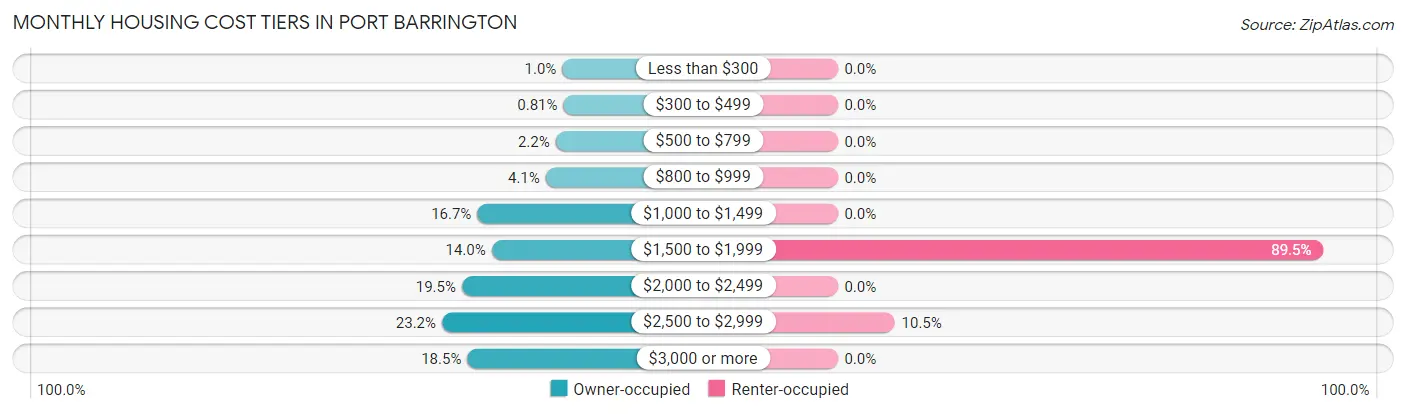
| Monthly Cost | Owner-occupied | Renter-occupied |
| Less than $300 | 5 (1.0%) | 0 (0.0%) |
| $300 to $499 | 4 (0.8%) | 0 (0.0%) |
| $500 to $799 | 11 (2.2%) | 0 (0.0%) |
| $800 to $999 | 20 (4.1%) | 0 (0.0%) |
| $1,000 to $1,499 | 82 (16.7%) | 0 (0.0%) |
| $1,500 to $1,999 | 69 (14.0%) | 34 (89.5%) |
| $2,000 to $2,499 | 96 (19.5%) | 0 (0.0%) |
| $2,500 to $2,999 | 114 (23.2%) | 4 (10.5%) |
| $3,000 or more | 91 (18.5%) | 0 (0.0%) |
| Total | 492 (100.0%) | 38 (100.0%) |
Physical Housing Characteristics in Port Barrington
Housing Structures in Port Barrington
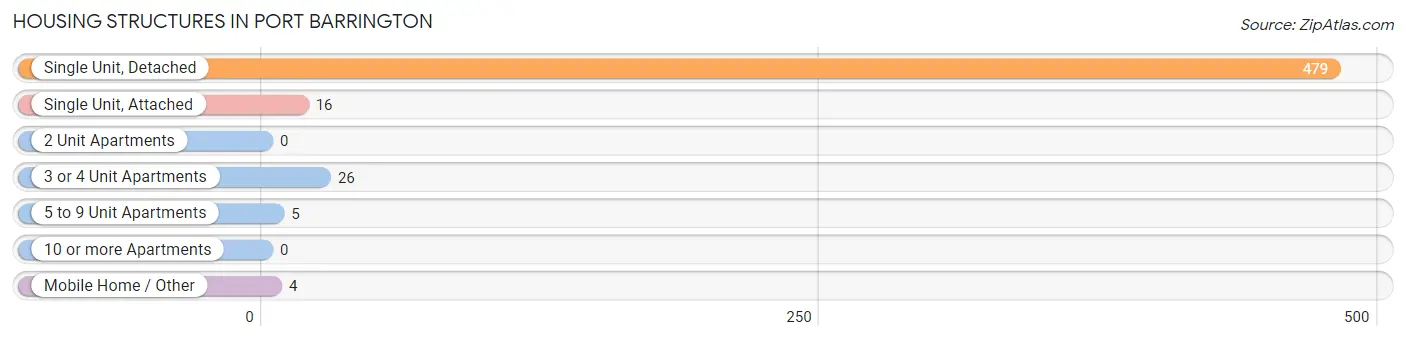
| Structure Type | # Housing Units | % Housing Units |
| Single Unit, Detached | 479 | 90.4% |
| Single Unit, Attached | 16 | 3.0% |
| 2 Unit Apartments | 0 | 0.0% |
| 3 or 4 Unit Apartments | 26 | 4.9% |
| 5 to 9 Unit Apartments | 5 | 0.9% |
| 10 or more Apartments | 0 | 0.0% |
| Mobile Home / Other | 4 | 0.7% |
| Total | 530 | 100.0% |
Housing Structures by Occupancy in Port Barrington
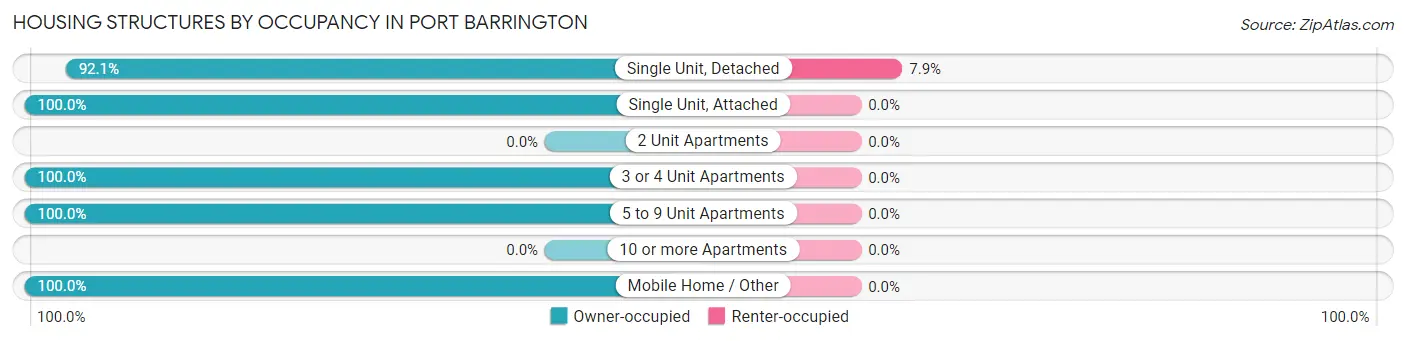
| Structure Type | Owner-occupied | Renter-occupied |
| Single Unit, Detached | 441 (92.1%) | 38 (7.9%) |
| Single Unit, Attached | 16 (100.0%) | 0 (0.0%) |
| 2 Unit Apartments | 0 (0.0%) | 0 (0.0%) |
| 3 or 4 Unit Apartments | 26 (100.0%) | 0 (0.0%) |
| 5 to 9 Unit Apartments | 5 (100.0%) | 0 (0.0%) |
| 10 or more Apartments | 0 (0.0%) | 0 (0.0%) |
| Mobile Home / Other | 4 (100.0%) | 0 (0.0%) |
| Total | 492 (92.8%) | 38 (7.2%) |
Housing Structures by Number of Rooms in Port Barrington
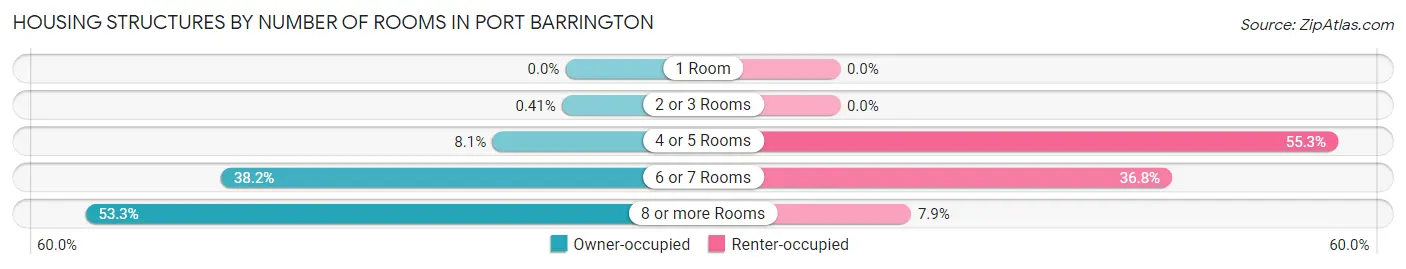
| Number of Rooms | Owner-occupied | Renter-occupied |
| 1 Room | 0 (0.0%) | 0 (0.0%) |
| 2 or 3 Rooms | 2 (0.4%) | 0 (0.0%) |
| 4 or 5 Rooms | 40 (8.1%) | 21 (55.3%) |
| 6 or 7 Rooms | 188 (38.2%) | 14 (36.8%) |
| 8 or more Rooms | 262 (53.2%) | 3 (7.9%) |
| Total | 492 (100.0%) | 38 (100.0%) |
Housing Structure by Heating Type in Port Barrington
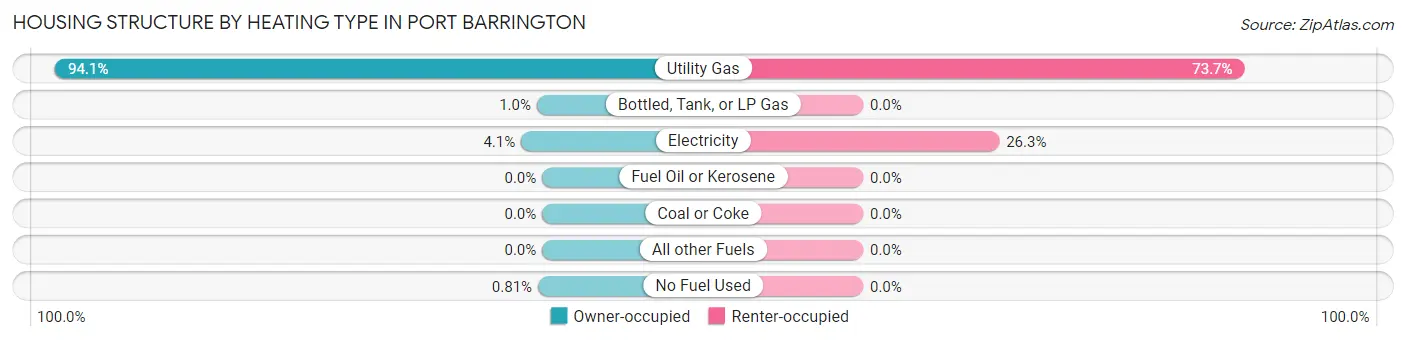
| Heating Type | Owner-occupied | Renter-occupied |
| Utility Gas | 463 (94.1%) | 28 (73.7%) |
| Bottled, Tank, or LP Gas | 5 (1.0%) | 0 (0.0%) |
| Electricity | 20 (4.1%) | 10 (26.3%) |
| Fuel Oil or Kerosene | 0 (0.0%) | 0 (0.0%) |
| Coal or Coke | 0 (0.0%) | 0 (0.0%) |
| All other Fuels | 0 (0.0%) | 0 (0.0%) |
| No Fuel Used | 4 (0.8%) | 0 (0.0%) |
| Total | 492 (100.0%) | 38 (100.0%) |
Household Vehicle Usage in Port Barrington
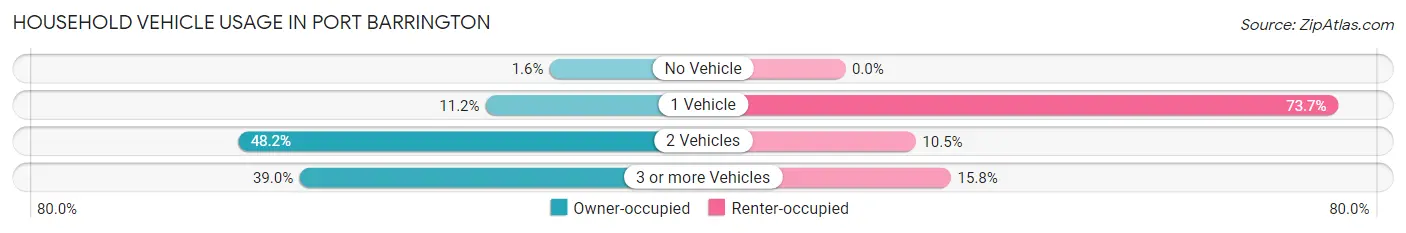
| Vehicles per Household | Owner-occupied | Renter-occupied |
| No Vehicle | 8 (1.6%) | 0 (0.0%) |
| 1 Vehicle | 55 (11.2%) | 28 (73.7%) |
| 2 Vehicles | 237 (48.2%) | 4 (10.5%) |
| 3 or more Vehicles | 192 (39.0%) | 6 (15.8%) |
| Total | 492 (100.0%) | 38 (100.0%) |
Real Estate & Mortgages in Port Barrington
Real Estate and Mortgage Overview in Port Barrington
| Characteristic | Without Mortgage | With Mortgage |
| Housing Units | 78 | 414 |
| Median Property Value | $358,300 | $353,300 |
| Median Household Income | $132,000 | $218 |
| Monthly Housing Costs | $1,082 | $91 |
| Real Estate Taxes | $8,672 | $4 |
Property Value by Mortgage Status in Port Barrington
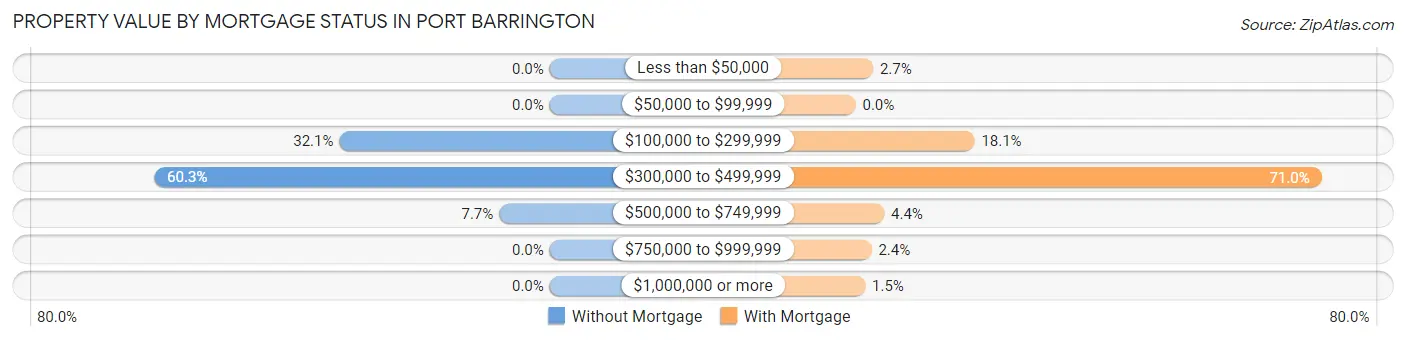
| Property Value | Without Mortgage | With Mortgage |
| Less than $50,000 | 0 (0.0%) | 11 (2.7%) |
| $50,000 to $99,999 | 0 (0.0%) | 0 (0.0%) |
| $100,000 to $299,999 | 25 (32.1%) | 75 (18.1%) |
| $300,000 to $499,999 | 47 (60.3%) | 294 (71.0%) |
| $500,000 to $749,999 | 6 (7.7%) | 18 (4.3%) |
| $750,000 to $999,999 | 0 (0.0%) | 10 (2.4%) |
| $1,000,000 or more | 0 (0.0%) | 6 (1.5%) |
| Total | 78 (100.0%) | 414 (100.0%) |
Household Income by Mortgage Status in Port Barrington
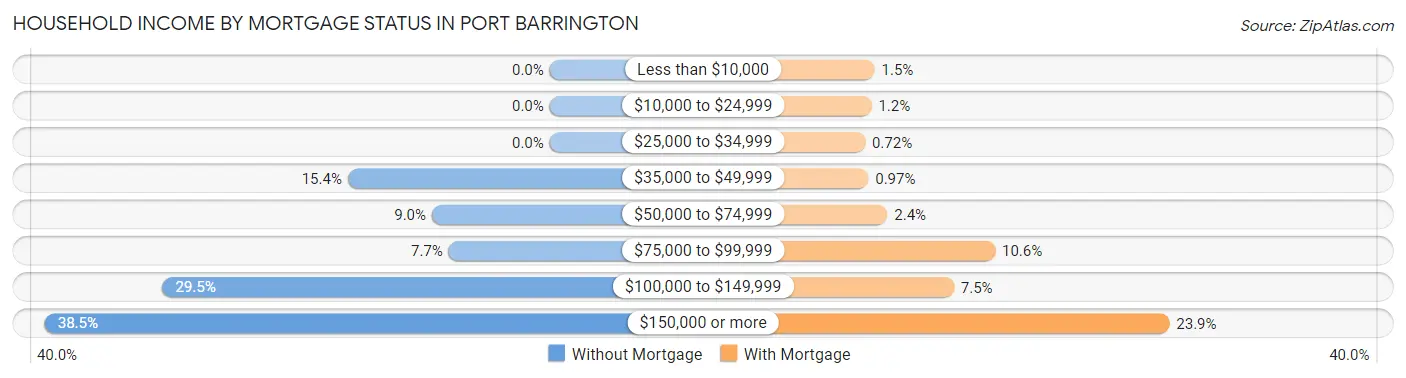
| Household Income | Without Mortgage | With Mortgage |
| Less than $10,000 | 0 (0.0%) | 6 (1.5%) |
| $10,000 to $24,999 | 0 (0.0%) | 5 (1.2%) |
| $25,000 to $34,999 | 0 (0.0%) | 3 (0.7%) |
| $35,000 to $49,999 | 12 (15.4%) | 4 (1.0%) |
| $50,000 to $74,999 | 7 (9.0%) | 10 (2.4%) |
| $75,000 to $99,999 | 6 (7.7%) | 44 (10.6%) |
| $100,000 to $149,999 | 23 (29.5%) | 31 (7.5%) |
| $150,000 or more | 30 (38.5%) | 99 (23.9%) |
| Total | 78 (100.0%) | 414 (100.0%) |
Property Value to Household Income Ratio in Port Barrington
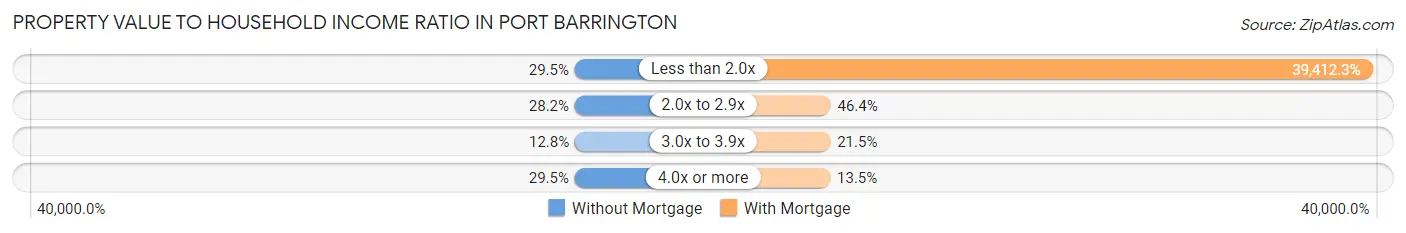
| Value-to-Income Ratio | Without Mortgage | With Mortgage |
| Less than 2.0x | 23 (29.5%) | 163,167 (39,412.3%) |
| 2.0x to 2.9x | 22 (28.2%) | 192 (46.4%) |
| 3.0x to 3.9x | 10 (12.8%) | 89 (21.5%) |
| 4.0x or more | 23 (29.5%) | 56 (13.5%) |
| Total | 78 (100.0%) | 414 (100.0%) |
Real Estate Taxes by Mortgage Status in Port Barrington
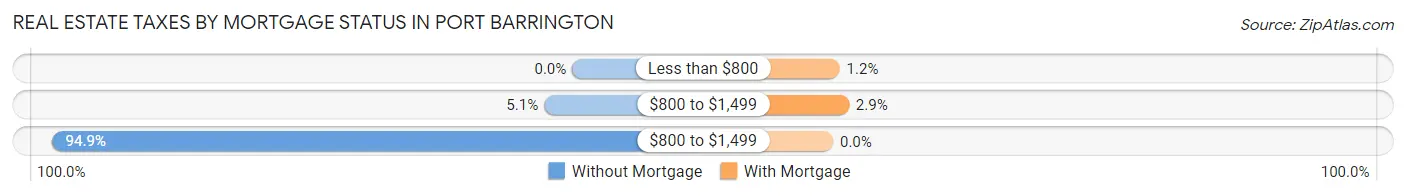
| Property Taxes | Without Mortgage | With Mortgage |
| Less than $800 | 0 (0.0%) | 5 (1.2%) |
| $800 to $1,499 | 4 (5.1%) | 12 (2.9%) |
| $800 to $1,499 | 74 (94.9%) | 0 (0.0%) |
| Total | 78 (100.0%) | 414 (100.0%) |
Health & Disability in Port Barrington
Health Insurance Coverage by Age in Port Barrington
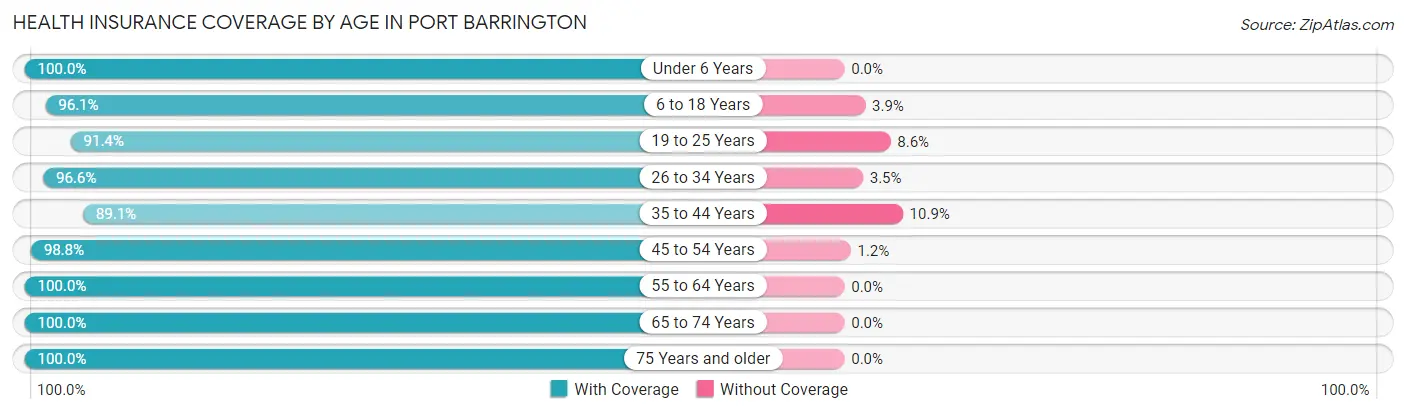
| Age Bracket | With Coverage | Without Coverage |
| Under 6 Years | 101 (100.0%) | 0 (0.0%) |
| 6 to 18 Years | 297 (96.1%) | 12 (3.9%) |
| 19 to 25 Years | 117 (91.4%) | 11 (8.6%) |
| 26 to 34 Years | 140 (96.6%) | 5 (3.5%) |
| 35 to 44 Years | 213 (89.1%) | 26 (10.9%) |
| 45 to 54 Years | 255 (98.8%) | 3 (1.2%) |
| 55 to 64 Years | 209 (100.0%) | 0 (0.0%) |
| 65 to 74 Years | 103 (100.0%) | 0 (0.0%) |
| 75 Years and older | 65 (100.0%) | 0 (0.0%) |
| Total | 1,500 (96.3%) | 57 (3.7%) |
Health Insurance Coverage by Citizenship Status in Port Barrington
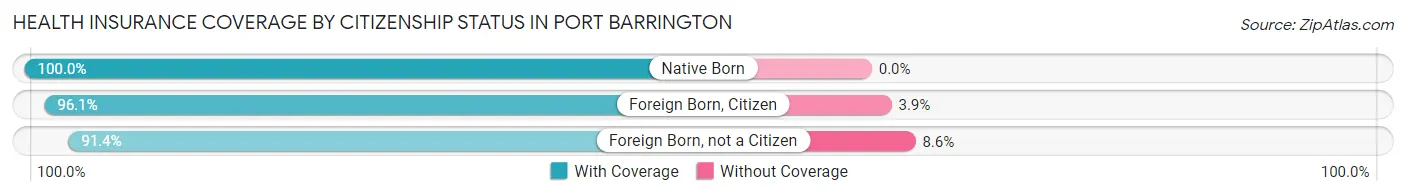
| Citizenship Status | With Coverage | Without Coverage |
| Native Born | 101 (100.0%) | 0 (0.0%) |
| Foreign Born, Citizen | 297 (96.1%) | 12 (3.9%) |
| Foreign Born, not a Citizen | 117 (91.4%) | 11 (8.6%) |
Health Insurance Coverage by Household Income in Port Barrington
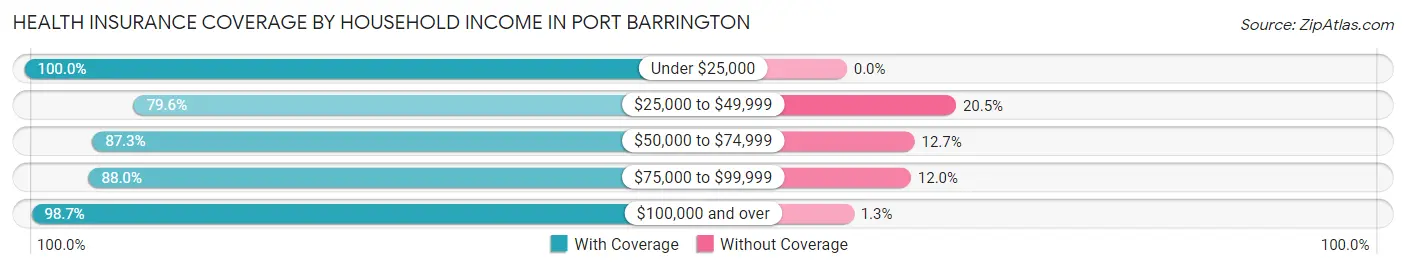
| Household Income | With Coverage | Without Coverage |
| Under $25,000 | 16 (100.0%) | 0 (0.0%) |
| $25,000 to $49,999 | 35 (79.5%) | 9 (20.4%) |
| $50,000 to $74,999 | 117 (87.3%) | 17 (12.7%) |
| $75,000 to $99,999 | 110 (88.0%) | 15 (12.0%) |
| $100,000 and over | 1,222 (98.7%) | 16 (1.3%) |
Public vs Private Health Insurance Coverage by Age in Port Barrington
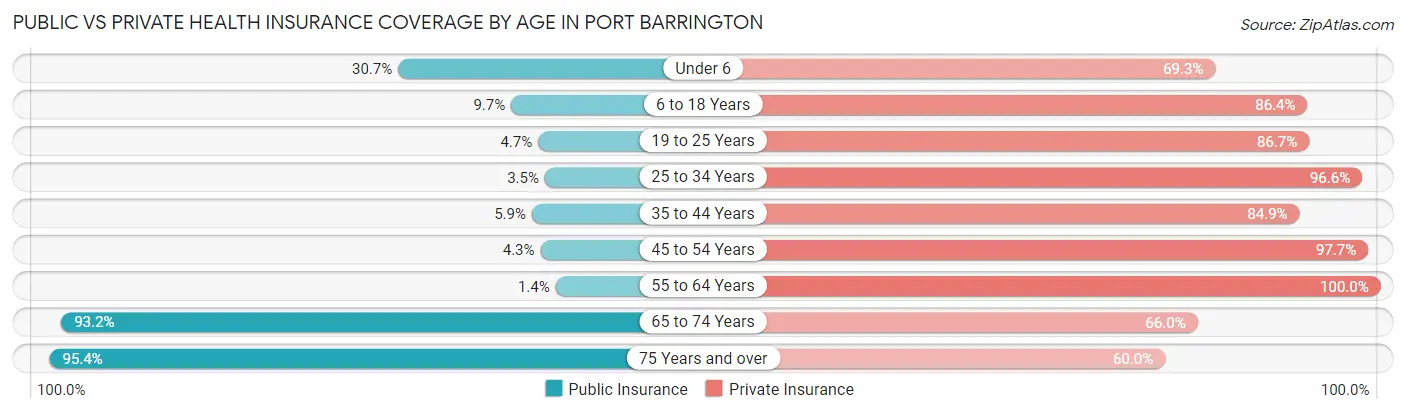
| Age Bracket | Public Insurance | Private Insurance |
| Under 6 | 31 (30.7%) | 70 (69.3%) |
| 6 to 18 Years | 30 (9.7%) | 267 (86.4%) |
| 19 to 25 Years | 6 (4.7%) | 111 (86.7%) |
| 25 to 34 Years | 5 (3.5%) | 140 (96.6%) |
| 35 to 44 Years | 14 (5.9%) | 203 (84.9%) |
| 45 to 54 Years | 11 (4.3%) | 252 (97.7%) |
| 55 to 64 Years | 3 (1.4%) | 209 (100.0%) |
| 65 to 74 Years | 96 (93.2%) | 68 (66.0%) |
| 75 Years and over | 62 (95.4%) | 39 (60.0%) |
| Total | 258 (16.6%) | 1,359 (87.3%) |
Disability Status by Sex by Age in Port Barrington
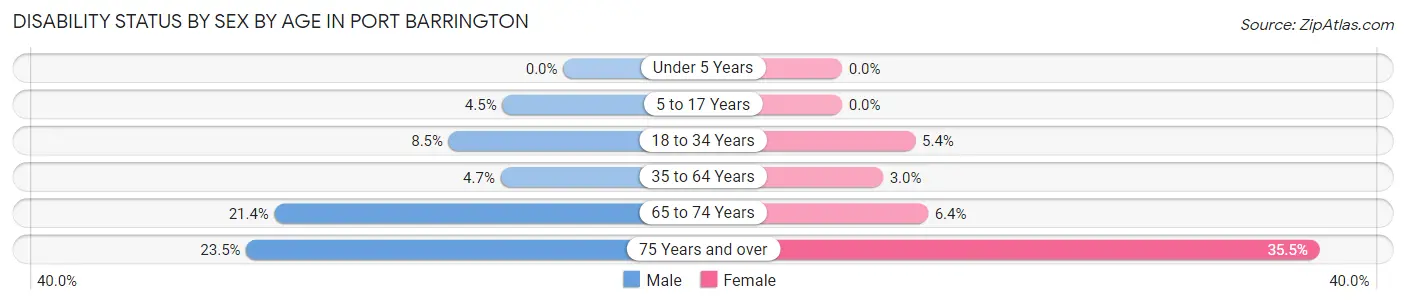
| Age Bracket | Male | Female |
| Under 5 Years | 0 (0.0%) | 0 (0.0%) |
| 5 to 17 Years | 8 (4.5%) | 0 (0.0%) |
| 18 to 34 Years | 13 (8.5%) | 8 (5.4%) |
| 35 to 64 Years | 16 (4.6%) | 11 (3.0%) |
| 65 to 74 Years | 12 (21.4%) | 3 (6.4%) |
| 75 Years and over | 8 (23.5%) | 11 (35.5%) |
Disability Class by Sex by Age in Port Barrington
Disability Class: Hearing Difficulty
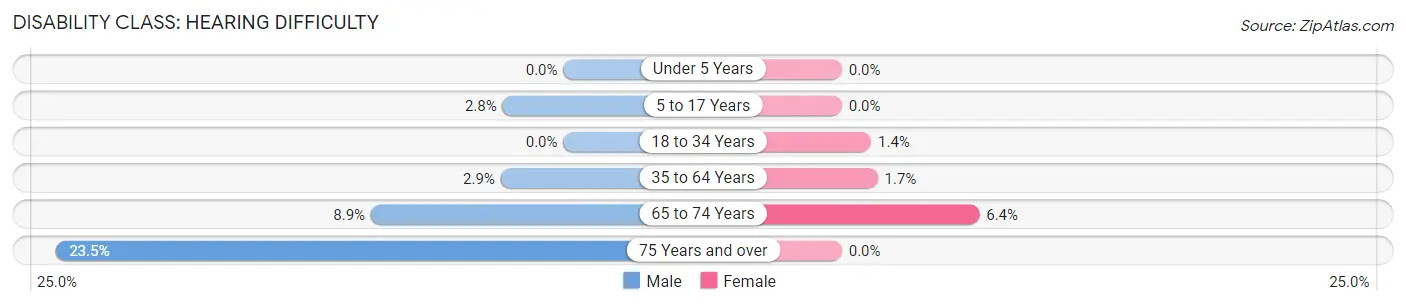
| Age Bracket | Male | Female |
| Under 5 Years | 0 (0.0%) | 0 (0.0%) |
| 5 to 17 Years | 5 (2.8%) | 0 (0.0%) |
| 18 to 34 Years | 0 (0.0%) | 2 (1.4%) |
| 35 to 64 Years | 10 (2.9%) | 6 (1.7%) |
| 65 to 74 Years | 5 (8.9%) | 3 (6.4%) |
| 75 Years and over | 8 (23.5%) | 0 (0.0%) |
Disability Class: Vision Difficulty
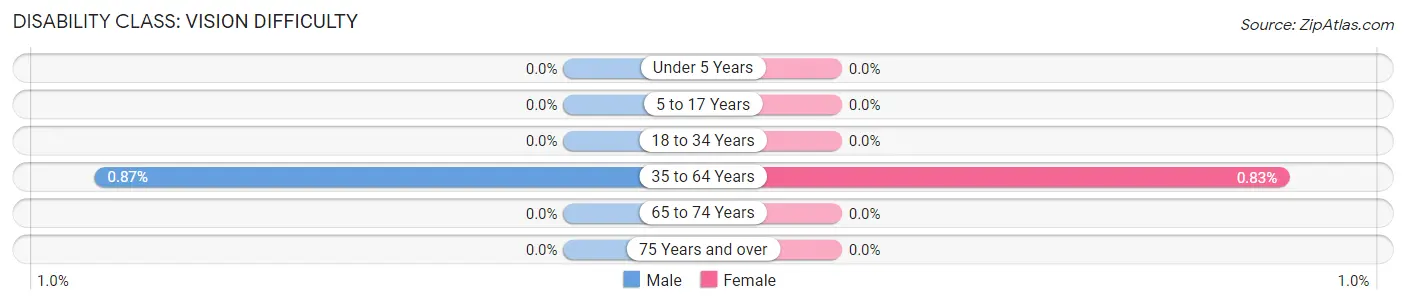
| Age Bracket | Male | Female |
| Under 5 Years | 0 (0.0%) | 0 (0.0%) |
| 5 to 17 Years | 0 (0.0%) | 0 (0.0%) |
| 18 to 34 Years | 0 (0.0%) | 0 (0.0%) |
| 35 to 64 Years | 3 (0.9%) | 3 (0.8%) |
| 65 to 74 Years | 0 (0.0%) | 0 (0.0%) |
| 75 Years and over | 0 (0.0%) | 0 (0.0%) |
Disability Class: Cognitive Difficulty
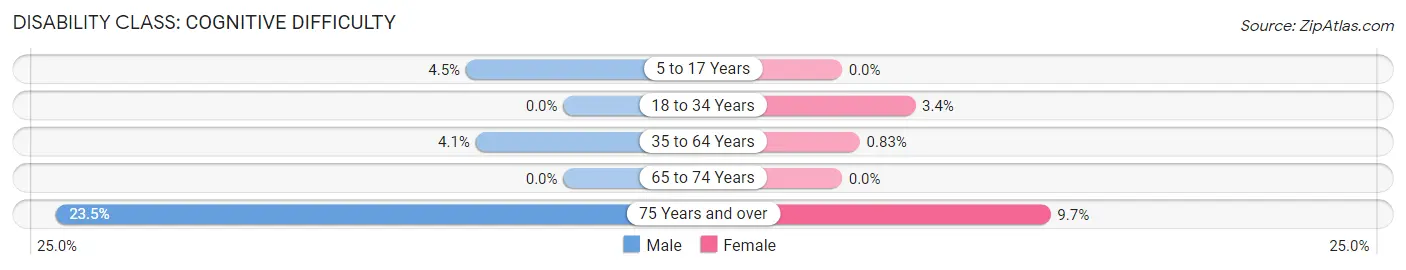
| Age Bracket | Male | Female |
| 5 to 17 Years | 8 (4.5%) | 0 (0.0%) |
| 18 to 34 Years | 0 (0.0%) | 5 (3.4%) |
| 35 to 64 Years | 14 (4.1%) | 3 (0.8%) |
| 65 to 74 Years | 0 (0.0%) | 0 (0.0%) |
| 75 Years and over | 8 (23.5%) | 3 (9.7%) |
Disability Class: Ambulatory Difficulty
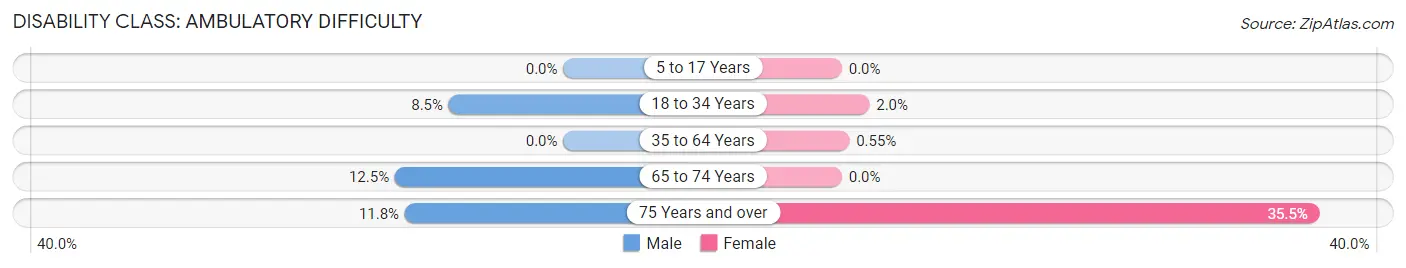
| Age Bracket | Male | Female |
| 5 to 17 Years | 0 (0.0%) | 0 (0.0%) |
| 18 to 34 Years | 13 (8.5%) | 3 (2.0%) |
| 35 to 64 Years | 0 (0.0%) | 2 (0.5%) |
| 65 to 74 Years | 7 (12.5%) | 0 (0.0%) |
| 75 Years and over | 4 (11.8%) | 11 (35.5%) |
Disability Class: Self-Care Difficulty
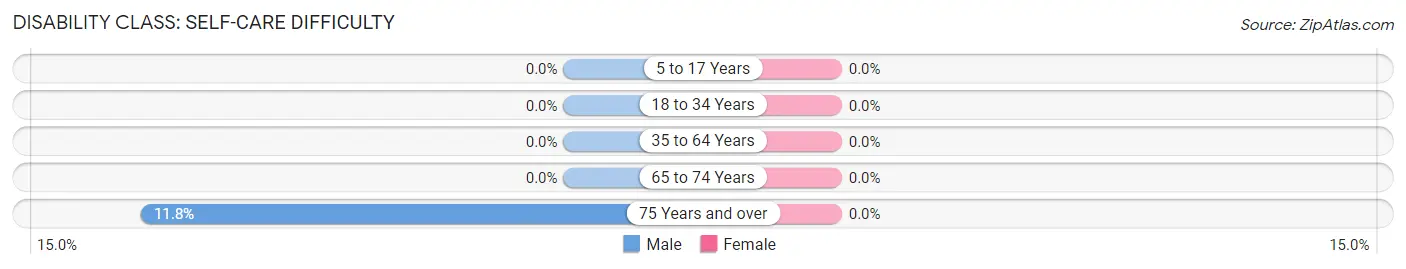
| Age Bracket | Male | Female |
| 5 to 17 Years | 0 (0.0%) | 0 (0.0%) |
| 18 to 34 Years | 0 (0.0%) | 0 (0.0%) |
| 35 to 64 Years | 0 (0.0%) | 0 (0.0%) |
| 65 to 74 Years | 0 (0.0%) | 0 (0.0%) |
| 75 Years and over | 4 (11.8%) | 0 (0.0%) |
Technology Access in Port Barrington
Computing Device Access in Port Barrington
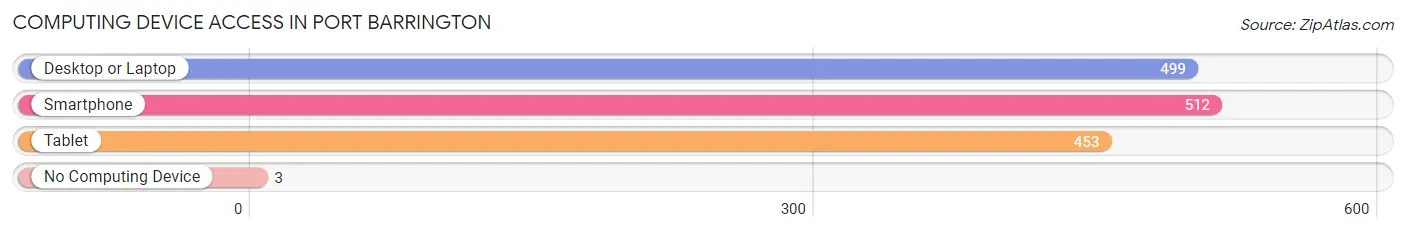
| Device Type | # Households | % Households |
| Desktop or Laptop | 499 | 94.2% |
| Smartphone | 512 | 96.6% |
| Tablet | 453 | 85.5% |
| No Computing Device | 3 | 0.6% |
| Total | 530 | 100.0% |
Internet Access in Port Barrington
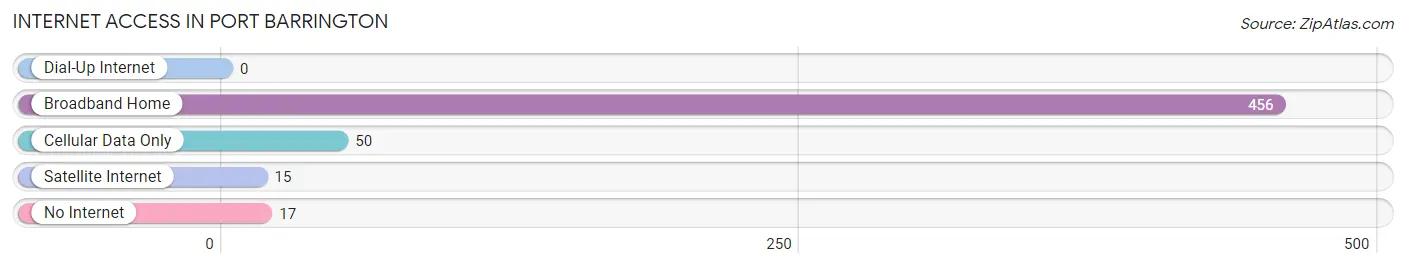
| Internet Type | # Households | % Households |
| Dial-Up Internet | 0 | 0.0% |
| Broadband Home | 456 | 86.0% |
| Cellular Data Only | 50 | 9.4% |
| Satellite Internet | 15 | 2.8% |
| No Internet | 17 | 3.2% |
| Total | 530 | 100.0% |
Port Barrington Summary
Port Barrington is a small village located in the northern part of Lake County, Illinois. It is situated on the Fox River, about 40 miles northwest of Chicago. The village has a population of about 1,400 people and covers an area of 1.2 square miles.
History
Port Barrington was first settled in the early 1800s by settlers from New England. The village was originally known as “Port Barrington” due to its location on the Fox River, which was used as a port for shipping goods. The village was officially incorporated in 1872.
In the late 1800s, the village was a popular destination for tourists and vacationers. The Fox River was a popular spot for fishing and boating, and the village was home to several resorts and hotels.
In the early 1900s, the village began to experience a decline in population as people moved away to larger cities. However, the village experienced a resurgence in the 1950s and 1960s, when it became a popular destination for weekenders and vacationers.
Geography
Port Barrington is located in the northern part of Lake County, Illinois. It is situated on the Fox River, about 40 miles northwest of Chicago. The village has a total area of 1.2 square miles, all of which is land.
The village is located in a rural area, with rolling hills and wooded areas. The Fox River runs through the village, providing a scenic backdrop. The village is also home to several parks and recreational areas, including the Port Barrington Nature Preserve.
Economy
The economy of Port Barrington is largely based on tourism and recreation. The village is home to several resorts and hotels, as well as a number of restaurants and bars. The village also has a marina, which provides access to the Fox River for boaters and fishermen.
In addition, the village is home to several small businesses, including a grocery store, a hardware store, and a gas station. The village also has a post office and a library.
Demographics
As of the 2010 census, the population of Port Barrington was 1,400. The racial makeup of the village was 94.3% White, 0.7% African American, 0.3% Native American, 0.7% Asian, and 3.0% from other races. Hispanic or Latino of any race were 2.3% of the population.
The median household income in Port Barrington was $63,750, and the median family income was $76,250. The per capita income for the village was $30,945. About 4.3% of families and 5.7% of the population were below the poverty line.
Common Questions
What is Per Capita Income in Port Barrington?
Per Capita income in Port Barrington is $65,860.
What is the Median Family Income in Port Barrington?
Median Family Income in Port Barrington is $157,250.
What is the Median Household income in Port Barrington?
Median Household Income in Port Barrington is $146,000.
What is Income or Wage Gap in Port Barrington?
Income or Wage Gap in Port Barrington is 55.8%.
Women in Port Barrington earn 44.2 cents for every dollar earned by a man.
What is Inequality or Gini Index in Port Barrington?
Inequality or Gini Index in Port Barrington is 0.41.
What is the Total Population of Port Barrington?
Total Population of Port Barrington is 1,557.
What is the Total Male Population of Port Barrington?
Total Male Population of Port Barrington is 801.
What is the Total Female Population of Port Barrington?
Total Female Population of Port Barrington is 756.
What is the Ratio of Males per 100 Females in Port Barrington?
There are 105.95 Males per 100 Females in Port Barrington.
What is the Ratio of Females per 100 Males in Port Barrington?
There are 94.38 Females per 100 Males in Port Barrington.
What is the Median Population Age in Port Barrington?
Median Population Age in Port Barrington is 39.9 Years.
What is the Average Family Size in Port Barrington
Average Family Size in Port Barrington is 3.1 People.
What is the Average Household Size in Port Barrington
Average Household Size in Port Barrington is 2.9 People.
How Large is the Labor Force in Port Barrington?
There are 902 People in the Labor Forcein in Port Barrington.
What is the Percentage of People in the Labor Force in Port Barrington?
71.1% of People are in the Labor Force in Port Barrington.
What is the Unemployment Rate in Port Barrington?
Unemployment Rate in Port Barrington is 3.4%.