Hinsdale, IL Map & Demographics
Hinsdale Map
Hinsdale Overview
$128,458
PER CAPITA INCOME
$250,001
AVG FAMILY INCOME
$250,001
AVG HOUSEHOLD INCOME
73.0%
WAGE / INCOME GAP [ % ]
27.0¢/ $1
WAGE / INCOME GAP [ $ ]
0.50
INEQUALITY / GINI INDEX
17,169
TOTAL POPULATION
8,640
MALE POPULATION
8,529
FEMALE POPULATION
101.30
MALES / 100 FEMALES
98.72
FEMALES / 100 MALES
42.3
MEDIAN AGE
3.3
AVG FAMILY SIZE
2.9
AVG HOUSEHOLD SIZE
7,752
LABOR FORCE [ PEOPLE ]
63.2%
PERCENT IN LABOR FORCE
2.6%
UNEMPLOYMENT RATE
Hinsdale Zip Codes
Income in Hinsdale
Income Overview in Hinsdale
Per Capita Income in Hinsdale is $128,458, while median incomes of families and households are $250,001 and $250,001 respectively.
| Characteristic | Number | Measure |
| Per Capita Income | 17,169 | $128,458 |
| Median Family Income | 4,831 | $250,001 |
| Mean Family Income | 4,831 | $425,055 |
| Median Household Income | 5,744 | $250,001 |
| Mean Household Income | 5,744 | $380,479 |
| Income Deficit | 4,831 | $0 |
| Wage / Income Gap (%) | 17,169 | 73.04% |
| Wage / Income Gap ($) | 17,169 | 26.96¢ per $1 |
| Gini / Inequality Index | 17,169 | 0.50 |
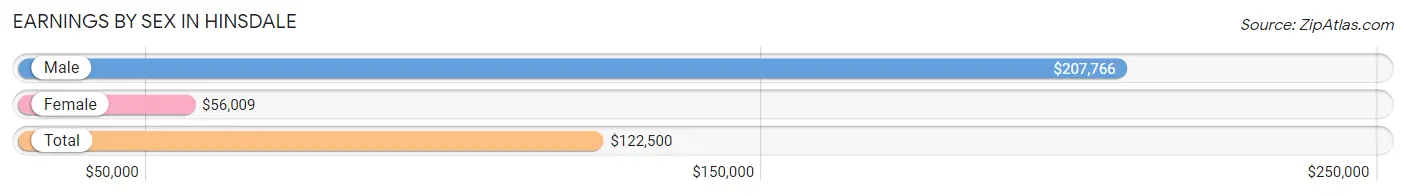
Earnings by Sex in Hinsdale
Average Earnings in Hinsdale are $122,500, $207,766 for men and $56,009 for women, a difference of 73.0%.
| Sex | Number | Average Earnings |
| Male | 4,668 (56.7%) | $207,766 |
| Female | 3,570 (43.3%) | $56,009 |
| Total | 8,238 (100.0%) | $122,500 |
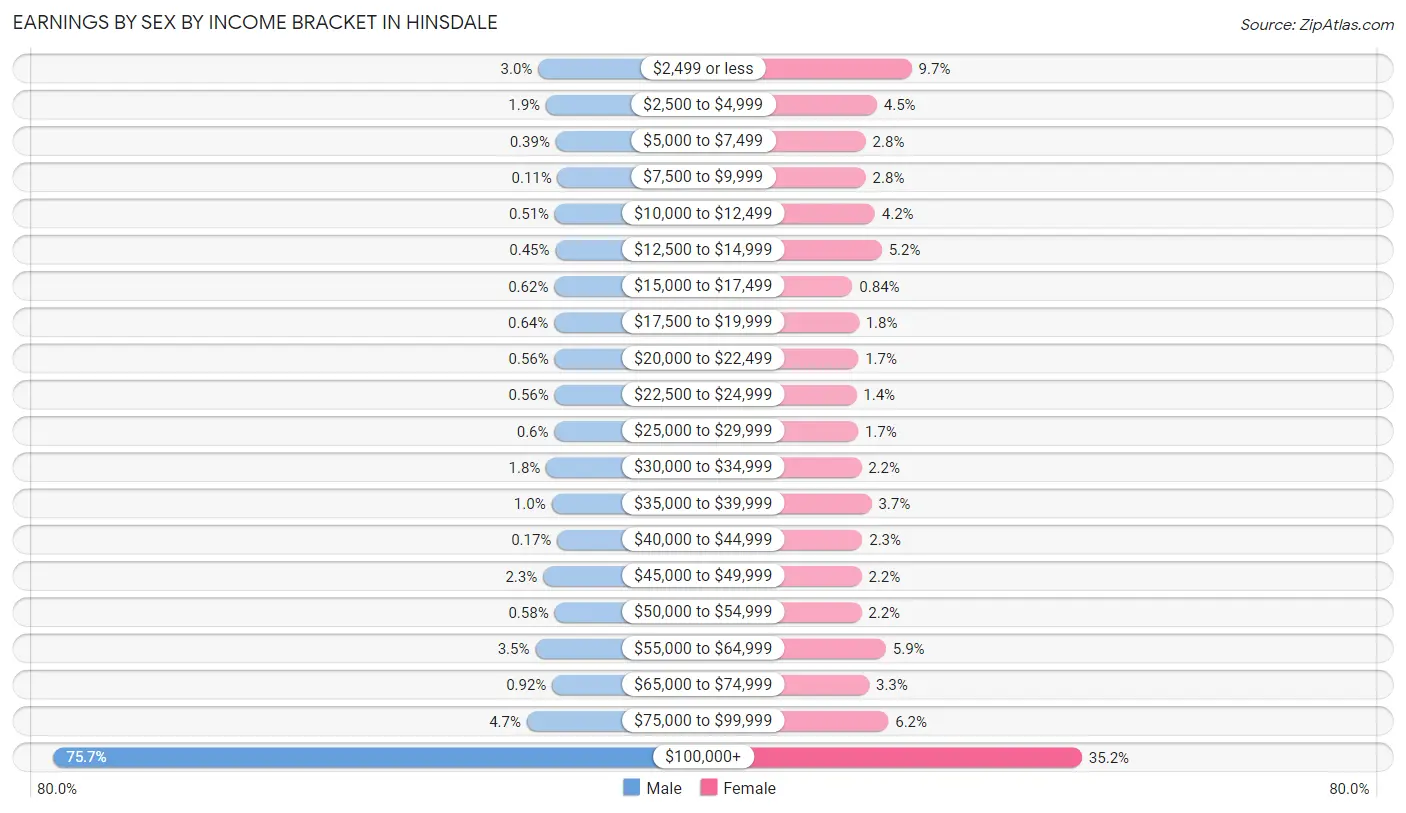
Earnings by Sex by Income Bracket in Hinsdale
The most common earnings brackets in Hinsdale are $100,000+ for men (3,533 | 75.7%) and $100,000+ for women (1,258 | 35.2%).
| Income | Male | Female |
| $2,499 or less | 141 (3.0%) | 347 (9.7%) |
| $2,500 to $4,999 | 87 (1.9%) | 161 (4.5%) |
| $5,000 to $7,499 | 18 (0.4%) | 101 (2.8%) |
| $7,500 to $9,999 | 5 (0.1%) | 101 (2.8%) |
| $10,000 to $12,499 | 24 (0.5%) | 150 (4.2%) |
| $12,500 to $14,999 | 21 (0.4%) | 187 (5.2%) |
| $15,000 to $17,499 | 29 (0.6%) | 30 (0.8%) |
| $17,500 to $19,999 | 30 (0.6%) | 64 (1.8%) |
| $20,000 to $22,499 | 26 (0.6%) | 61 (1.7%) |
| $22,500 to $24,999 | 26 (0.6%) | 51 (1.4%) |
| $25,000 to $29,999 | 28 (0.6%) | 60 (1.7%) |
| $30,000 to $34,999 | 85 (1.8%) | 77 (2.2%) |
| $35,000 to $39,999 | 48 (1.0%) | 132 (3.7%) |
| $40,000 to $44,999 | 8 (0.2%) | 83 (2.3%) |
| $45,000 to $49,999 | 107 (2.3%) | 79 (2.2%) |
| $50,000 to $54,999 | 27 (0.6%) | 78 (2.2%) |
| $55,000 to $64,999 | 161 (3.5%) | 209 (5.9%) |
| $65,000 to $74,999 | 43 (0.9%) | 119 (3.3%) |
| $75,000 to $99,999 | 221 (4.7%) | 222 (6.2%) |
| $100,000+ | 3,533 (75.7%) | 1,258 (35.2%) |
| Total | 4,668 (100.0%) | 3,570 (100.0%) |
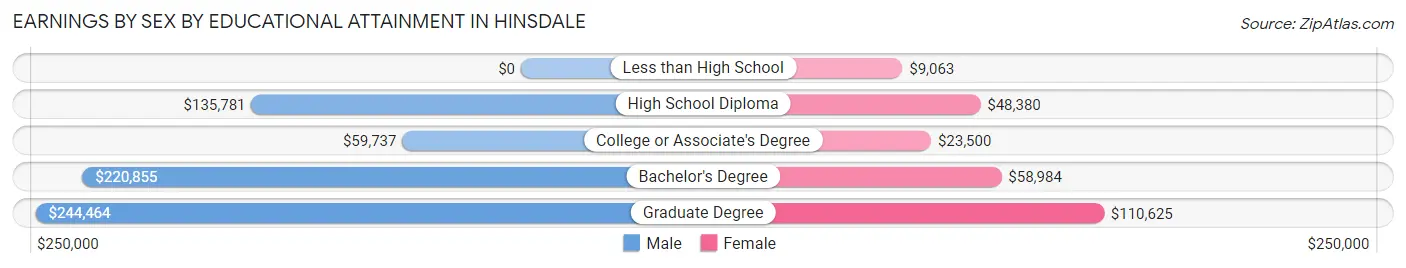
Earnings by Sex by Educational Attainment in Hinsdale
Average earnings in Hinsdale are $224,103 for men and $66,010 for women, a difference of 70.5%. Men with an educational attainment of graduate degree enjoy the highest average annual earnings of $244,464, while those with college or associate's degree education earn the least with $59,737. Women with an educational attainment of graduate degree earn the most with the average annual earnings of $110,625, while those with less than high school education have the smallest earnings of $9,063.
| Educational Attainment | Male Income | Female Income |
| Less than High School | - | - |
| High School Diploma | $135,781 | $48,380 |
| College or Associate's Degree | $59,737 | $23,500 |
| Bachelor's Degree | $220,855 | $58,984 |
| Graduate Degree | $244,464 | $110,625 |
| Total | $224,103 | $66,010 |
Family Income in Hinsdale
Family Income Brackets in Hinsdale
According to the Hinsdale family income data, there are 3,169 families falling into the $200,000+ income range, which is the most common income bracket and makes up 65.6% of all families.
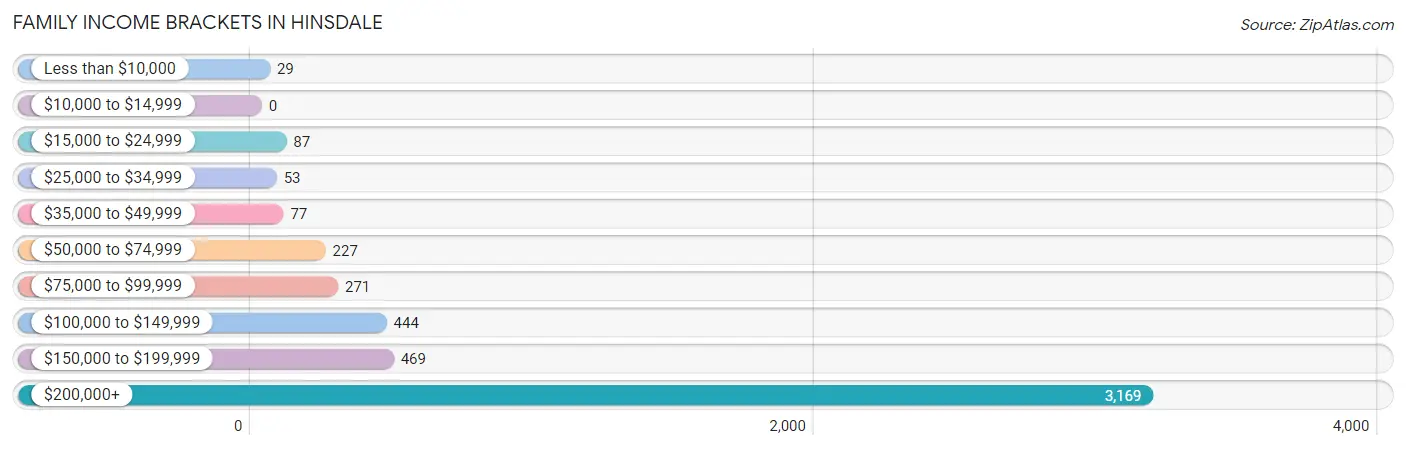
| Income Bracket | # Families | % Families |
| Less than $10,000 | 29 | 0.6% |
| $10,000 to $14,999 | 0 | 0.0% |
| $15,000 to $24,999 | 87 | 1.8% |
| $25,000 to $34,999 | 53 | 1.1% |
| $35,000 to $49,999 | 77 | 1.6% |
| $50,000 to $74,999 | 227 | 4.7% |
| $75,000 to $99,999 | 271 | 5.6% |
| $100,000 to $149,999 | 444 | 9.2% |
| $150,000 to $199,999 | 469 | 9.7% |
| $200,000+ | 3,169 | 65.6% |
Family Income by Famaliy Size in Hinsdale
3-person families (1,154 | 23.9%) account for the highest median family income in Hinsdale with $250,001 per family, while 2-person families (1,676 | 34.7%) have the highest median income of $105,350 per family member.
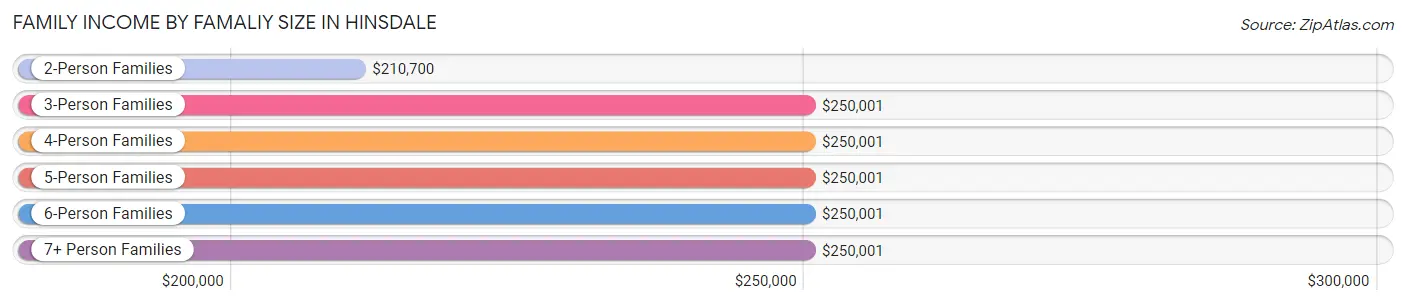
| Income Bracket | # Families | Median Income |
| 2-Person Families | 1,676 (34.7%) | $210,700 |
| 3-Person Families | 1,154 (23.9%) | $250,001 |
| 4-Person Families | 1,281 (26.5%) | $250,001 |
| 5-Person Families | 587 (12.1%) | $250,001 |
| 6-Person Families | 105 (2.2%) | $250,001 |
| 7+ Person Families | 28 (0.6%) | $250,001 |
| Total | 4,831 (100.0%) | $250,001 |
Family Income by Number of Earners in Hinsdale
The median family income in Hinsdale is $250,001, with families comprising 1 earner (1,530) having the highest median family income of $250,001, while families with no earners (407) have the lowest median family income of $107,083, accounting for 31.7% and 8.4% of families, respectively.
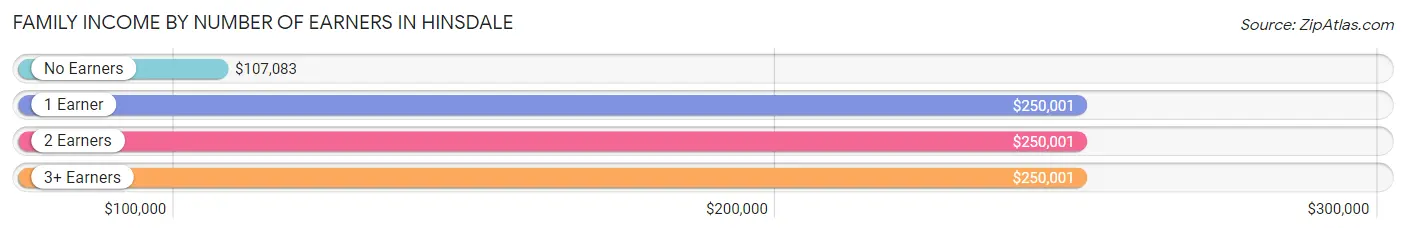
| Number of Earners | # Families | Median Income |
| No Earners | 407 (8.4%) | $107,083 |
| 1 Earner | 1,530 (31.7%) | $250,001 |
| 2 Earners | 2,606 (53.9%) | $250,001 |
| 3+ Earners | 288 (6.0%) | $250,001 |
| Total | 4,831 (100.0%) | $250,001 |
Household Income in Hinsdale
Household Income Brackets in Hinsdale
With 3,354 households falling in the category, the $200,000+ income range is the most frequent in Hinsdale, accounting for 58.4% of all households. In contrast, only 40 households (0.7%) fall into the $10,000 to $14,999 income bracket, making it the least populous group.
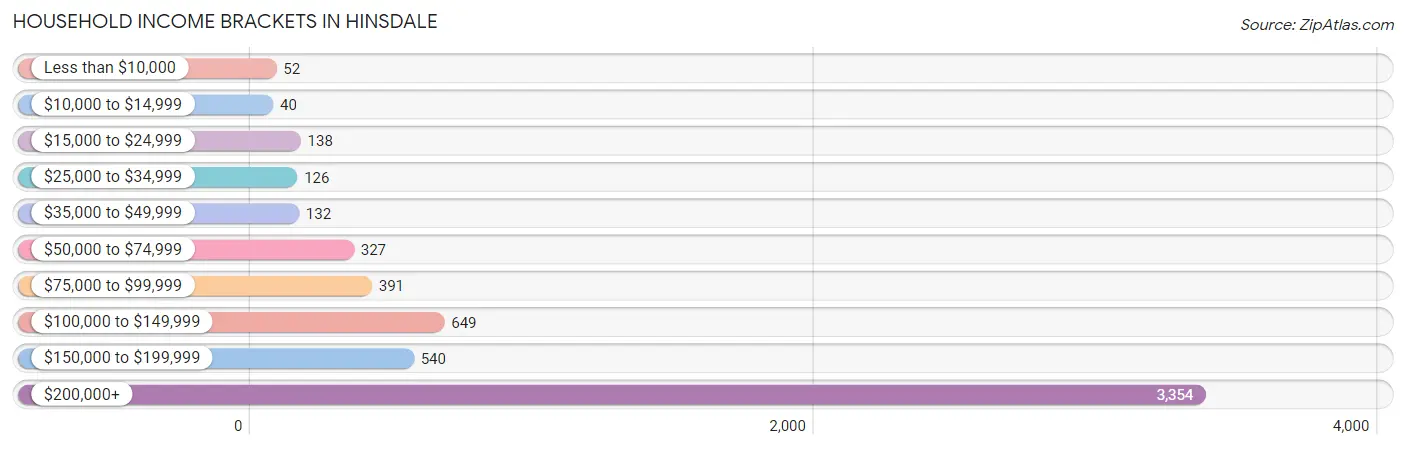
| Income Bracket | # Households | % Households |
| Less than $10,000 | 52 | 0.9% |
| $10,000 to $14,999 | 40 | 0.7% |
| $15,000 to $24,999 | 138 | 2.4% |
| $25,000 to $34,999 | 126 | 2.2% |
| $35,000 to $49,999 | 132 | 2.3% |
| $50,000 to $74,999 | 327 | 5.7% |
| $75,000 to $99,999 | 391 | 6.8% |
| $100,000 to $149,999 | 649 | 11.3% |
| $150,000 to $199,999 | 540 | 9.4% |
| $200,000+ | 3,354 | 58.4% |
Household Income by Householder Age in Hinsdale
The median household income in Hinsdale is $250,001, with the highest median household income of $250,001 found in the 25 to 44 years age bracket for the primary householder. A total of 1,594 households (27.8%) fall into this category. Meanwhile, the 15 to 24 years age bracket for the primary householder has the lowest median household income of $0, with 20 households (0.4%) in this group.
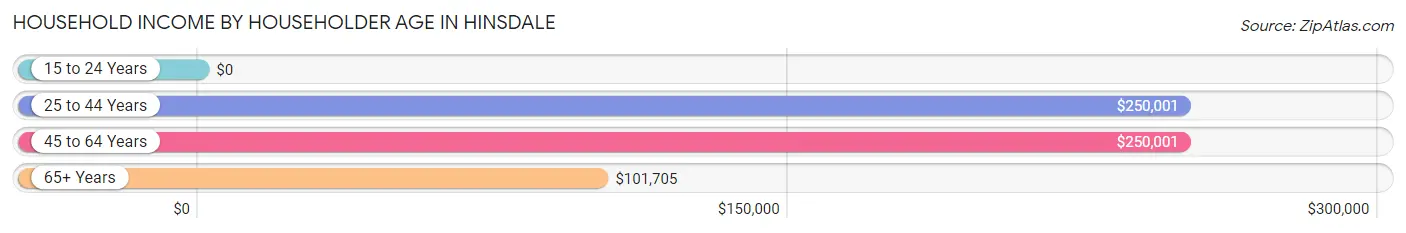
| Income Bracket | # Households | Median Income |
| 15 to 24 Years | 20 (0.4%) | $0 |
| 25 to 44 Years | 1,594 (27.8%) | $250,001 |
| 45 to 64 Years | 2,616 (45.5%) | $250,001 |
| 65+ Years | 1,514 (26.4%) | $101,705 |
| Total | 5,744 (100.0%) | $250,001 |
Poverty in Hinsdale
Income Below Poverty by Sex and Age in Hinsdale
With 1.1% poverty level for males and 1.8% for females among the residents of Hinsdale, 75 year old and over males and 25 to 34 year old females are the most vulnerable to poverty, with 15 males (3.4%) and 37 females (7.3%) in their respective age groups living below the poverty level.
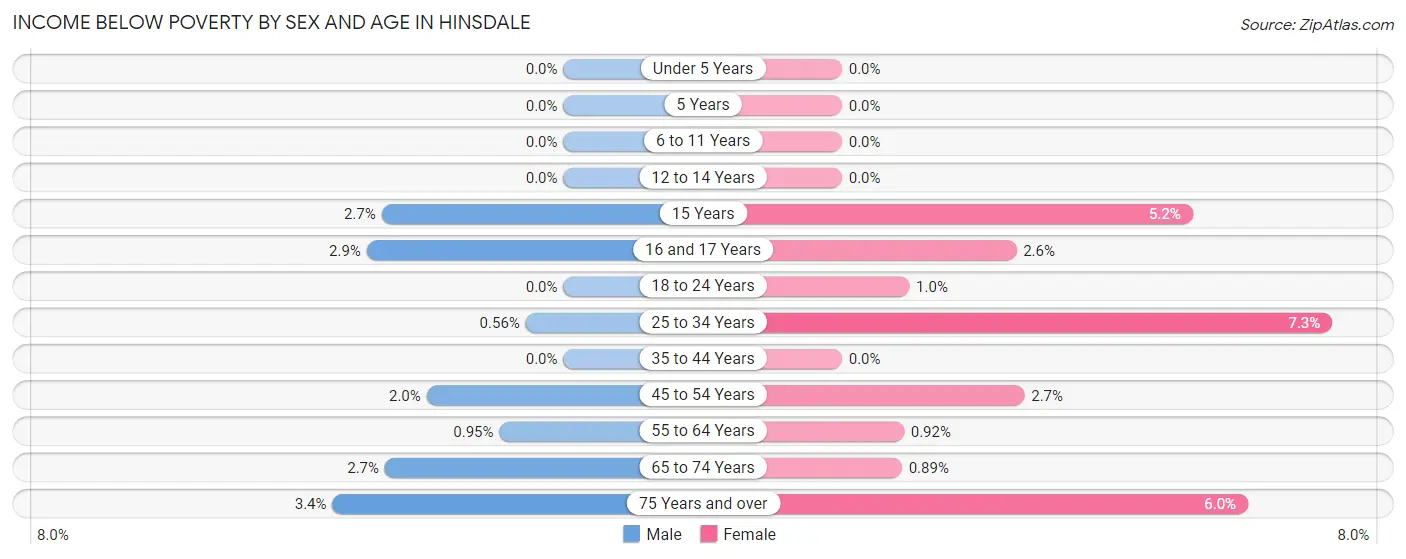
| Age Bracket | Male | Female |
| Under 5 Years | 0 (0.0%) | 0 (0.0%) |
| 5 Years | 0 (0.0%) | 0 (0.0%) |
| 6 to 11 Years | 0 (0.0%) | 0 (0.0%) |
| 12 to 14 Years | 0 (0.0%) | 0 (0.0%) |
| 15 Years | 6 (2.7%) | 11 (5.2%) |
| 16 and 17 Years | 7 (2.9%) | 9 (2.6%) |
| 18 to 24 Years | 0 (0.0%) | 3 (1.0%) |
| 25 to 34 Years | 2 (0.6%) | 37 (7.3%) |
| 35 to 44 Years | 0 (0.0%) | 0 (0.0%) |
| 45 to 54 Years | 33 (2.0%) | 37 (2.7%) |
| 55 to 64 Years | 10 (0.9%) | 10 (0.9%) |
| 65 to 74 Years | 18 (2.6%) | 6 (0.9%) |
| 75 Years and over | 15 (3.4%) | 36 (6.0%) |
| Total | 91 (1.1%) | 149 (1.8%) |
Income Above Poverty by Sex and Age in Hinsdale
According to the poverty statistics in Hinsdale, males aged under 5 years and females aged under 5 years are the age groups that are most secure financially, with 100.0% of males and 100.0% of females in these age groups living above the poverty line.
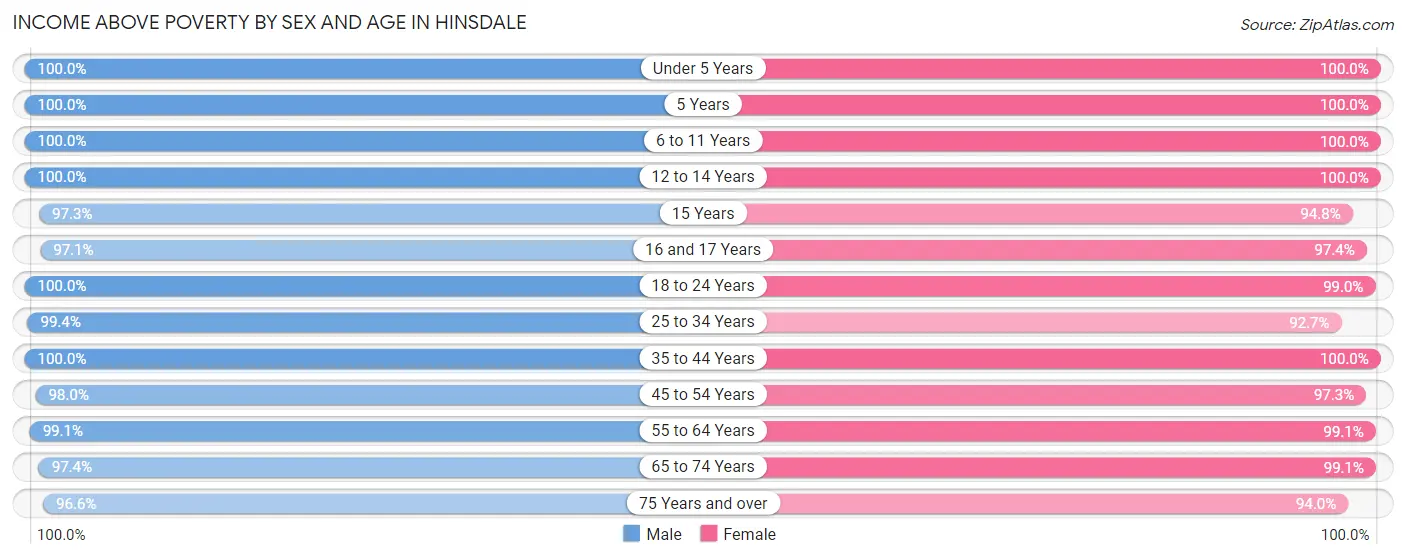
| Age Bracket | Male | Female |
| Under 5 Years | 610 (100.0%) | 452 (100.0%) |
| 5 Years | 174 (100.0%) | 75 (100.0%) |
| 6 to 11 Years | 1,180 (100.0%) | 917 (100.0%) |
| 12 to 14 Years | 532 (100.0%) | 519 (100.0%) |
| 15 Years | 216 (97.3%) | 200 (94.8%) |
| 16 and 17 Years | 233 (97.1%) | 338 (97.4%) |
| 18 to 24 Years | 352 (100.0%) | 296 (99.0%) |
| 25 to 34 Years | 355 (99.4%) | 471 (92.7%) |
| 35 to 44 Years | 1,090 (100.0%) | 1,301 (100.0%) |
| 45 to 54 Years | 1,589 (98.0%) | 1,326 (97.3%) |
| 55 to 64 Years | 1,047 (99.1%) | 1,079 (99.1%) |
| 65 to 74 Years | 662 (97.4%) | 668 (99.1%) |
| 75 Years and over | 422 (96.6%) | 561 (94.0%) |
| Total | 8,462 (98.9%) | 8,203 (98.2%) |
Income Below Poverty Among Married-Couple Families in Hinsdale
The poverty statistics for married-couple families in Hinsdale show that 0.5% or 24 of the total 4,434 families live below the poverty line. Families with no children have the highest poverty rate of 1.3%, comprising of 24 families. On the other hand, families with 1 or 2 children have the lowest poverty rate of 0.0%, which includes 0 families.
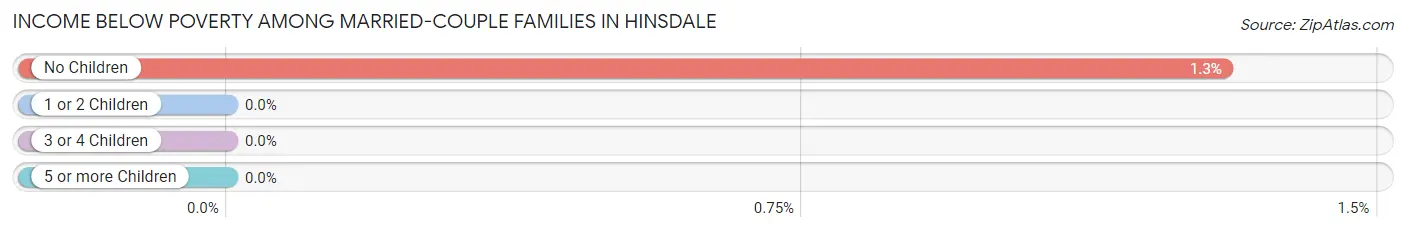
| Children | Above Poverty | Below Poverty |
| No Children | 1,821 (98.7%) | 24 (1.3%) |
| 1 or 2 Children | 1,954 (100.0%) | 0 (0.0%) |
| 3 or 4 Children | 628 (100.0%) | 0 (0.0%) |
| 5 or more Children | 7 (100.0%) | 0 (0.0%) |
| Total | 4,410 (99.5%) | 24 (0.5%) |
Income Below Poverty Among Single-Parent Households in Hinsdale
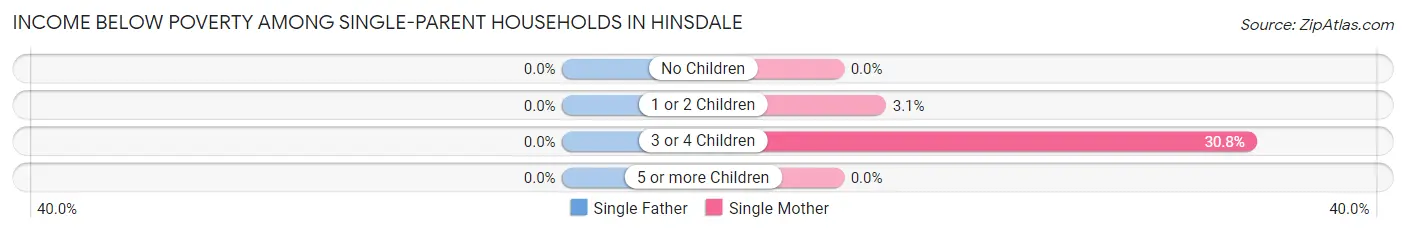
| Children | Single Father | Single Mother |
| No Children | 0 (0.0%) | 0 (0.0%) |
| 1 or 2 Children | 0 (0.0%) | 5 (3.1%) |
| 3 or 4 Children | 0 (0.0%) | 8 (30.8%) |
| 5 or more Children | 0 (0.0%) | 0 (0.0%) |
| Total | 0 (0.0%) | 13 (5.0%) |
Income Below Poverty Among Married-Couple vs Single-Parent Households in Hinsdale
The poverty data for Hinsdale shows that 24 of the married-couple family households (0.5%) and 13 of the single-parent households (3.3%) are living below the poverty level. Within the married-couple family households, those with no children have the highest poverty rate, with 24 households (1.3%) falling below the poverty line. Among the single-parent households, those with 3 or 4 children have the highest poverty rate, with 8 household (23.5%) living below poverty.
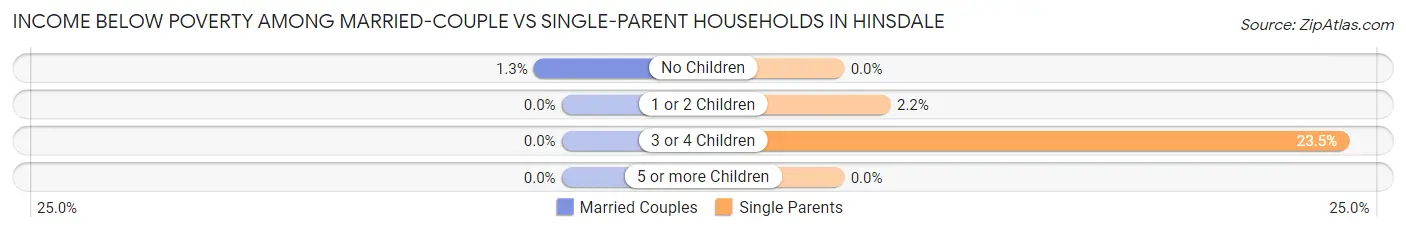
| Children | Married-Couple Families | Single-Parent Households |
| No Children | 24 (1.3%) | 0 (0.0%) |
| 1 or 2 Children | 0 (0.0%) | 5 (2.2%) |
| 3 or 4 Children | 0 (0.0%) | 8 (23.5%) |
| 5 or more Children | 0 (0.0%) | 0 (0.0%) |
| Total | 24 (0.5%) | 13 (3.3%) |
Race in Hinsdale
The most populous races in Hinsdale are White / Caucasian (13,127 | 76.5%), Asian (2,349 | 13.7%), and Two or more Races (1,238 | 7.2%).
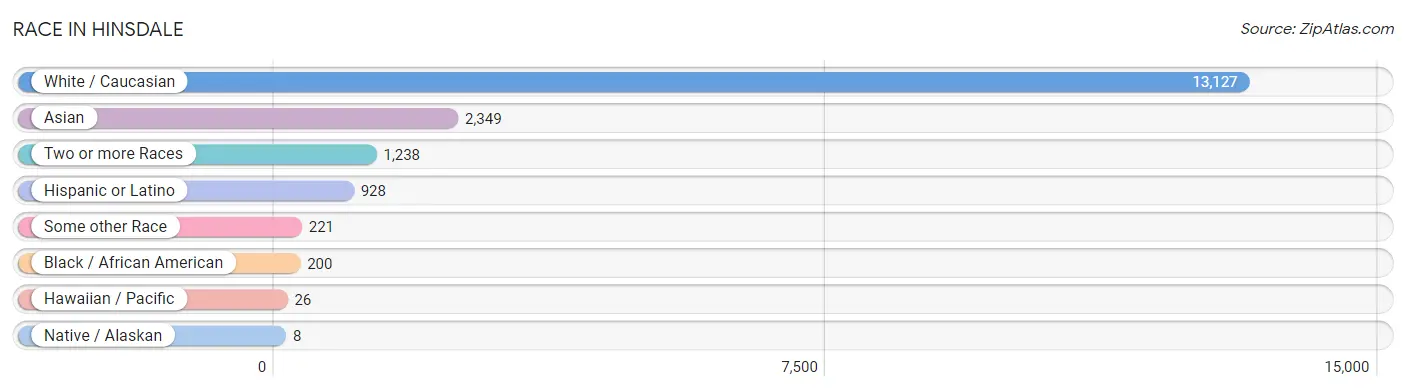
| Race | # Population | % Population |
| Asian | 2,349 | 13.7% |
| Black / African American | 200 | 1.2% |
| Hawaiian / Pacific | 26 | 0.2% |
| Hispanic or Latino | 928 | 5.4% |
| Native / Alaskan | 8 | 0.1% |
| White / Caucasian | 13,127 | 76.5% |
| Two or more Races | 1,238 | 7.2% |
| Some other Race | 221 | 1.3% |
| Total | 17,169 | 100.0% |
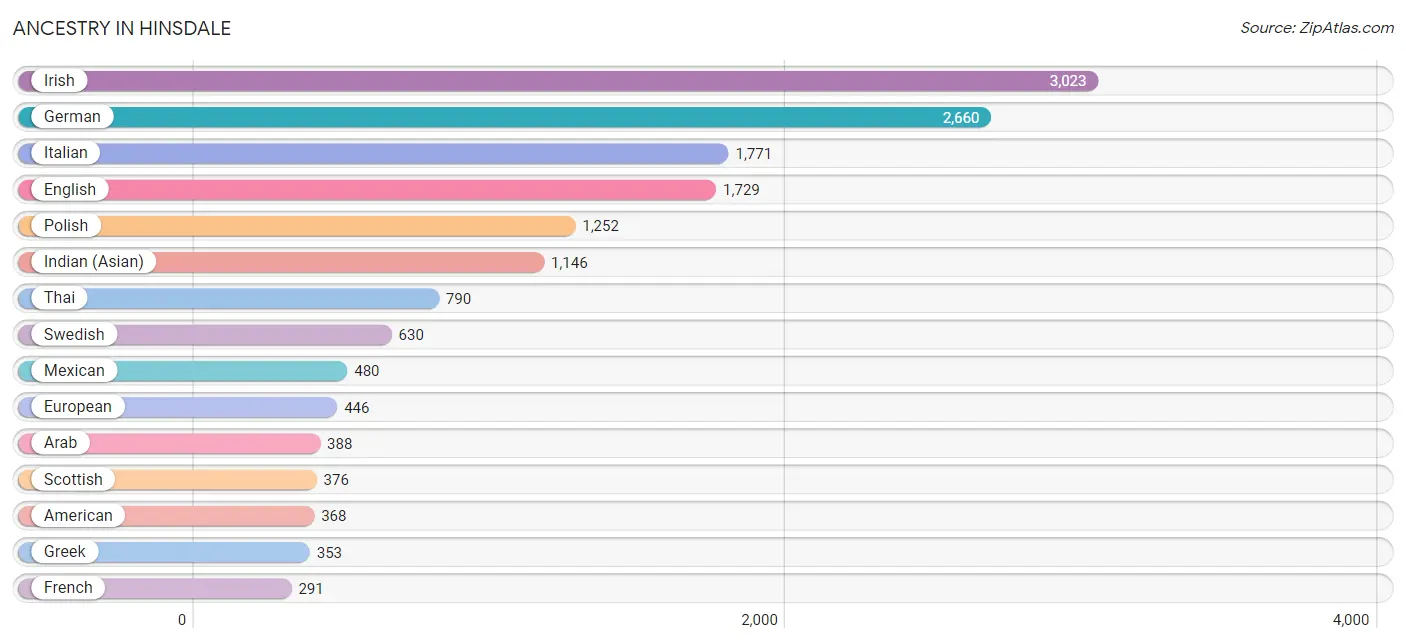
Ancestry in Hinsdale
The most populous ancestries reported in Hinsdale are Irish (3,023 | 17.6%), German (2,660 | 15.5%), Italian (1,771 | 10.3%), English (1,729 | 10.1%), and Polish (1,252 | 7.3%), together accounting for 60.8% of all Hinsdale residents.
| Ancestry | # Population | % Population |
| American | 368 | 2.1% |
| Arab | 388 | 2.3% |
| Armenian | 9 | 0.1% |
| Austrian | 67 | 0.4% |
| Belgian | 67 | 0.4% |
| Bhutanese | 11 | 0.1% |
| Blackfeet | 3 | 0.0% |
| Bolivian | 41 | 0.2% |
| Brazilian | 28 | 0.2% |
| British | 119 | 0.7% |
| Bulgarian | 7 | 0.0% |
| Burmese | 96 | 0.6% |
| Central American | 8 | 0.1% |
| Chickasaw | 16 | 0.1% |
| Chippewa | 14 | 0.1% |
| Colombian | 95 | 0.5% |
| Croatian | 37 | 0.2% |
| Cuban | 59 | 0.3% |
| Czech | 283 | 1.7% |
| Czechoslovakian | 28 | 0.2% |
| Danish | 84 | 0.5% |
| Dutch | 246 | 1.4% |
| Eastern European | 39 | 0.2% |
| Egyptian | 111 | 0.6% |
| English | 1,729 | 10.1% |
| European | 446 | 2.6% |
| Filipino | 73 | 0.4% |
| Finnish | 143 | 0.8% |
| French | 291 | 1.7% |
| French Canadian | 76 | 0.4% |
| German | 2,660 | 15.5% |
| Greek | 353 | 2.1% |
| Honduran | 8 | 0.1% |
| Hungarian | 168 | 1.0% |
| Indian (Asian) | 1,146 | 6.7% |
| Iranian | 88 | 0.5% |
| Iraqi | 18 | 0.1% |
| Irish | 3,023 | 17.6% |
| Italian | 1,771 | 10.3% |
| Jordanian | 9 | 0.1% |
| Korean | 157 | 0.9% |
| Latvian | 95 | 0.5% |
| Lebanese | 164 | 1.0% |
| Lithuanian | 216 | 1.3% |
| Luxembourger | 2 | 0.0% |
| Mexican | 480 | 2.8% |
| Moroccan | 31 | 0.2% |
| Native Hawaiian | 26 | 0.2% |
| Nigerian | 80 | 0.5% |
| Northern European | 50 | 0.3% |
| Norwegian | 234 | 1.4% |
| Pakistani | 25 | 0.2% |
| Palestinian | 24 | 0.1% |
| Polish | 1,252 | 7.3% |
| Portuguese | 9 | 0.1% |
| Puerto Rican | 189 | 1.1% |
| Romanian | 86 | 0.5% |
| Russian | 83 | 0.5% |
| Scandinavian | 110 | 0.6% |
| Scotch-Irish | 104 | 0.6% |
| Scottish | 376 | 2.2% |
| Serbian | 83 | 0.5% |
| Slovak | 26 | 0.2% |
| Slovene | 6 | 0.0% |
| South African | 27 | 0.2% |
| South American | 154 | 0.9% |
| Spaniard | 6 | 0.0% |
| Spanish | 32 | 0.2% |
| Sri Lankan | 23 | 0.1% |
| Subsaharan African | 107 | 0.6% |
| Swedish | 630 | 3.7% |
| Swiss | 41 | 0.2% |
| Syrian | 22 | 0.1% |
| Thai | 790 | 4.6% |
| Trinidadian and Tobagonian | 20 | 0.1% |
| Turkish | 30 | 0.2% |
| Ukrainian | 61 | 0.4% |
| Venezuelan | 18 | 0.1% |
| Welsh | 76 | 0.4% |
| Yugoslavian | 7 | 0.0% | View All 80 Rows |
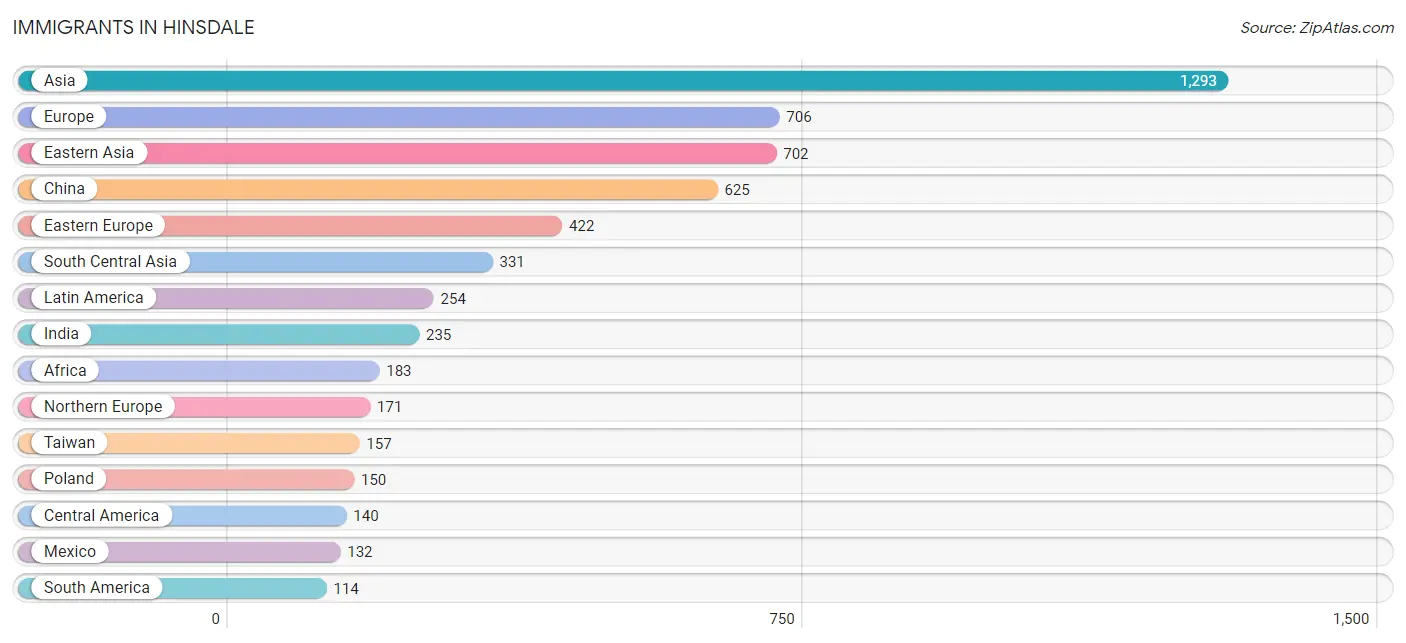
Immigrants in Hinsdale
The most numerous immigrant groups reported in Hinsdale came from Asia (1,293 | 7.5%), Europe (706 | 4.1%), Eastern Asia (702 | 4.1%), China (625 | 3.6%), and Eastern Europe (422 | 2.5%), together accounting for 21.8% of all Hinsdale residents.
| Immigration Origin | # Population | % Population |
| Africa | 183 | 1.1% |
| Asia | 1,293 | 7.5% |
| Australia | 32 | 0.2% |
| Bolivia | 13 | 0.1% |
| Brazil | 34 | 0.2% |
| Bulgaria | 22 | 0.1% |
| Canada | 48 | 0.3% |
| Central America | 140 | 0.8% |
| China | 625 | 3.6% |
| Colombia | 67 | 0.4% |
| Eastern Asia | 702 | 4.1% |
| Eastern Europe | 422 | 2.5% |
| Egypt | 61 | 0.4% |
| England | 29 | 0.2% |
| Europe | 706 | 4.1% |
| France | 16 | 0.1% |
| Germany | 16 | 0.1% |
| Greece | 32 | 0.2% |
| Honduras | 8 | 0.1% |
| India | 235 | 1.4% |
| Indonesia | 4 | 0.0% |
| Iran | 63 | 0.4% |
| Ireland | 40 | 0.2% |
| Italy | 29 | 0.2% |
| Japan | 25 | 0.2% |
| Korea | 52 | 0.3% |
| Latin America | 254 | 1.5% |
| Lebanon | 45 | 0.3% |
| Lithuania | 82 | 0.5% |
| Malaysia | 28 | 0.2% |
| Mexico | 132 | 0.8% |
| Morocco | 19 | 0.1% |
| Netherlands | 15 | 0.1% |
| Nigeria | 35 | 0.2% |
| Northern Africa | 80 | 0.5% |
| Northern Europe | 171 | 1.0% |
| Oceania | 32 | 0.2% |
| Pakistan | 24 | 0.1% |
| Philippines | 47 | 0.3% |
| Poland | 150 | 0.9% |
| Portugal | 5 | 0.0% |
| Romania | 86 | 0.5% |
| Saudi Arabia | 9 | 0.1% |
| Serbia | 82 | 0.5% |
| South Africa | 68 | 0.4% |
| South America | 114 | 0.7% |
| South Central Asia | 331 | 1.9% |
| South Eastern Asia | 108 | 0.6% |
| Southern Europe | 66 | 0.4% |
| Sri Lanka | 9 | 0.1% |
| Sweden | 63 | 0.4% |
| Syria | 8 | 0.1% |
| Taiwan | 157 | 0.9% |
| Thailand | 25 | 0.2% |
| Turkey | 44 | 0.3% |
| Vietnam | 4 | 0.0% |
| Western Africa | 35 | 0.2% |
| Western Asia | 106 | 0.6% |
| Western Europe | 47 | 0.3% | View All 59 Rows |
Sex and Age in Hinsdale
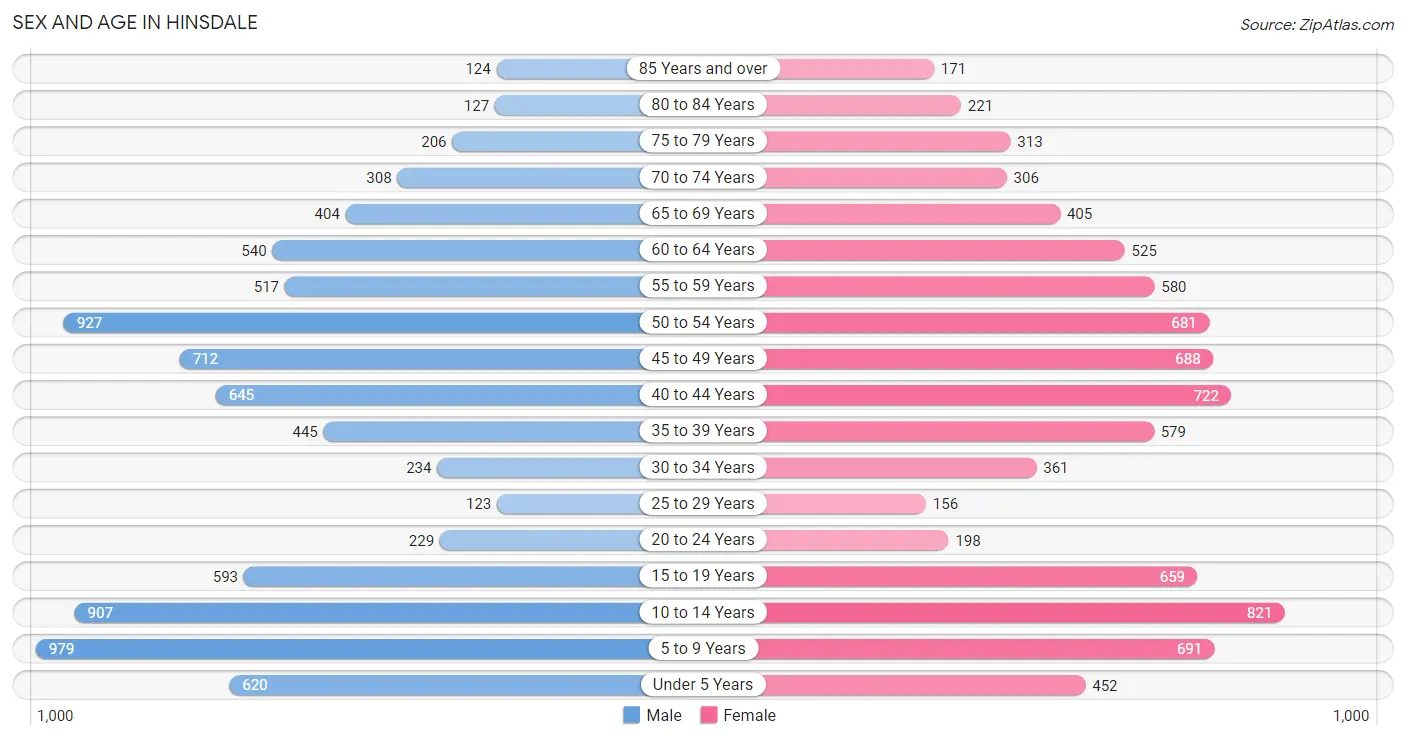
Sex and Age in Hinsdale
The most populous age groups in Hinsdale are 5 to 9 Years (979 | 11.3%) for men and 10 to 14 Years (821 | 9.6%) for women.
| Age Bracket | Male | Female |
| Under 5 Years | 620 (7.2%) | 452 (5.3%) |
| 5 to 9 Years | 979 (11.3%) | 691 (8.1%) |
| 10 to 14 Years | 907 (10.5%) | 821 (9.6%) |
| 15 to 19 Years | 593 (6.9%) | 659 (7.7%) |
| 20 to 24 Years | 229 (2.6%) | 198 (2.3%) |
| 25 to 29 Years | 123 (1.4%) | 156 (1.8%) |
| 30 to 34 Years | 234 (2.7%) | 361 (4.2%) |
| 35 to 39 Years | 445 (5.1%) | 579 (6.8%) |
| 40 to 44 Years | 645 (7.5%) | 722 (8.5%) |
| 45 to 49 Years | 712 (8.2%) | 688 (8.1%) |
| 50 to 54 Years | 927 (10.7%) | 681 (8.0%) |
| 55 to 59 Years | 517 (6.0%) | 580 (6.8%) |
| 60 to 64 Years | 540 (6.2%) | 525 (6.2%) |
| 65 to 69 Years | 404 (4.7%) | 405 (4.8%) |
| 70 to 74 Years | 308 (3.6%) | 306 (3.6%) |
| 75 to 79 Years | 206 (2.4%) | 313 (3.7%) |
| 80 to 84 Years | 127 (1.5%) | 221 (2.6%) |
| 85 Years and over | 124 (1.4%) | 171 (2.0%) |
| Total | 8,640 (100.0%) | 8,529 (100.0%) |
Families and Households in Hinsdale
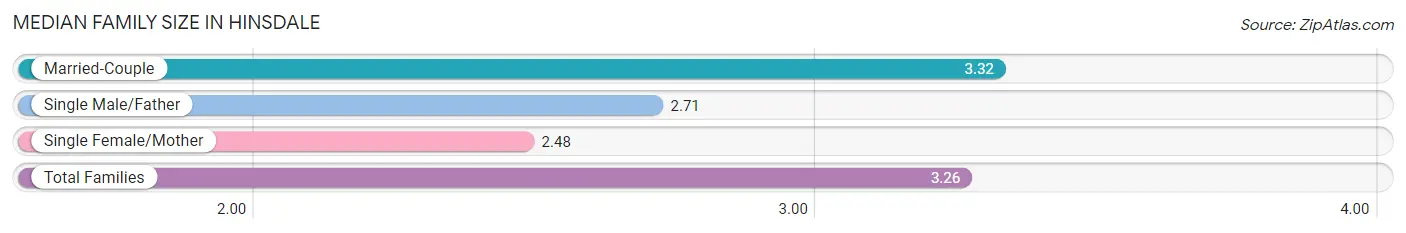
Median Family Size in Hinsdale
The median family size in Hinsdale is 3.26 persons per family, with married-couple families (4,434 | 91.8%) accounting for the largest median family size of 3.32 persons per family. On the other hand, single female/mother families (259 | 5.4%) represent the smallest median family size with 2.48 persons per family.
| Family Type | # Families | Family Size |
| Married-Couple | 4,434 (91.8%) | 3.32 |
| Single Male/Father | 138 (2.9%) | 2.71 |
| Single Female/Mother | 259 (5.4%) | 2.48 |
| Total Families | 4,831 (100.0%) | 3.26 |
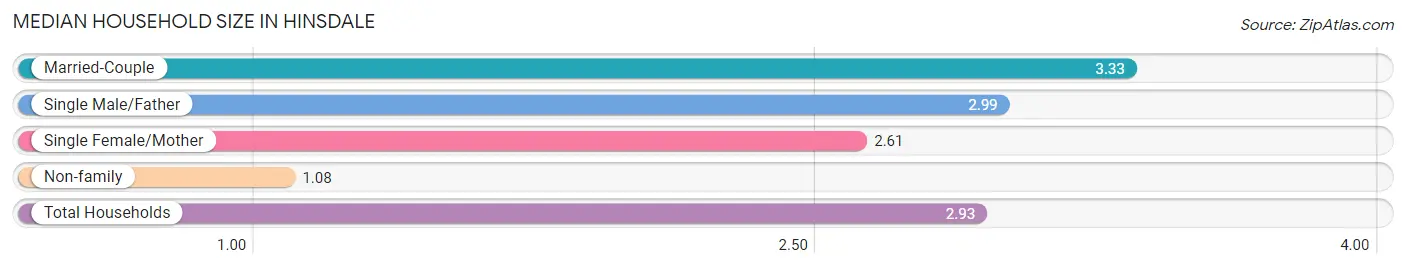
Median Household Size in Hinsdale
The median household size in Hinsdale is 2.93 persons per household, with married-couple households (4,434 | 77.2%) accounting for the largest median household size of 3.33 persons per household. non-family households (913 | 15.9%) represent the smallest median household size with 1.08 persons per household.
| Household Type | # Households | Household Size |
| Married-Couple | 4,434 (77.2%) | 3.33 |
| Single Male/Father | 138 (2.4%) | 2.99 |
| Single Female/Mother | 259 (4.5%) | 2.61 |
| Non-family | 913 (15.9%) | 1.08 |
| Total Households | 5,744 (100.0%) | 2.93 |
Household Size by Marriage Status in Hinsdale
Out of a total of 5,744 households in Hinsdale, 4,831 (84.1%) are family households, while 913 (15.9%) are nonfamily households. The most numerous type of family households are 2-person households, comprising 1,598, and the most common type of nonfamily households are 1-person households, comprising 820.
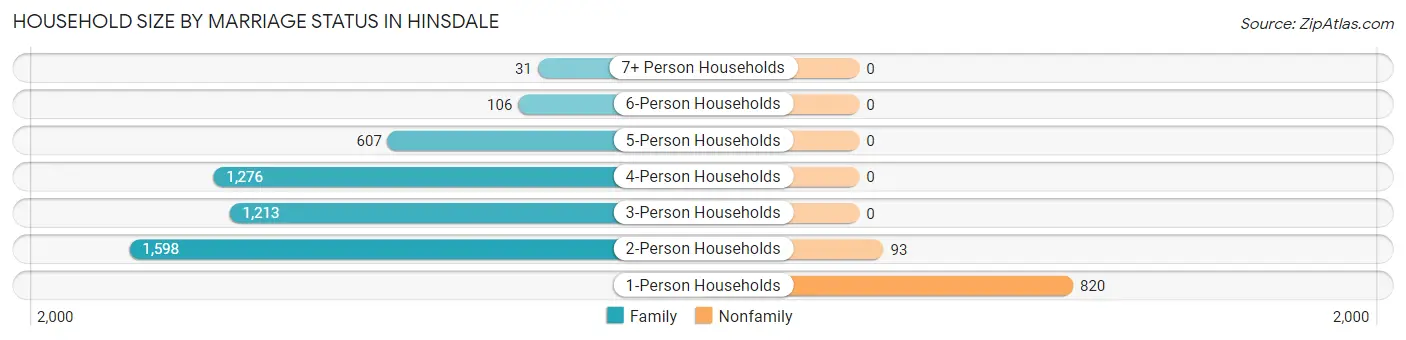
| Household Size | Family Households | Nonfamily Households |
| 1-Person Households | - | 820 (14.3%) |
| 2-Person Households | 1,598 (27.8%) | 93 (1.6%) |
| 3-Person Households | 1,213 (21.1%) | 0 (0.0%) |
| 4-Person Households | 1,276 (22.2%) | 0 (0.0%) |
| 5-Person Households | 607 (10.6%) | 0 (0.0%) |
| 6-Person Households | 106 (1.8%) | 0 (0.0%) |
| 7+ Person Households | 31 (0.5%) | 0 (0.0%) |
| Total | 4,831 (84.1%) | 913 (15.9%) |
Female Fertility in Hinsdale
Fertility by Age in Hinsdale
Average fertility rate in Hinsdale is 54.0 births per 1,000 women. Women in the age bracket of 20 to 34 years have the highest fertility rate with 108.0 births per 1,000 women. Women in the age bracket of 35 to 50 years acount for 59.9% of all women with births.
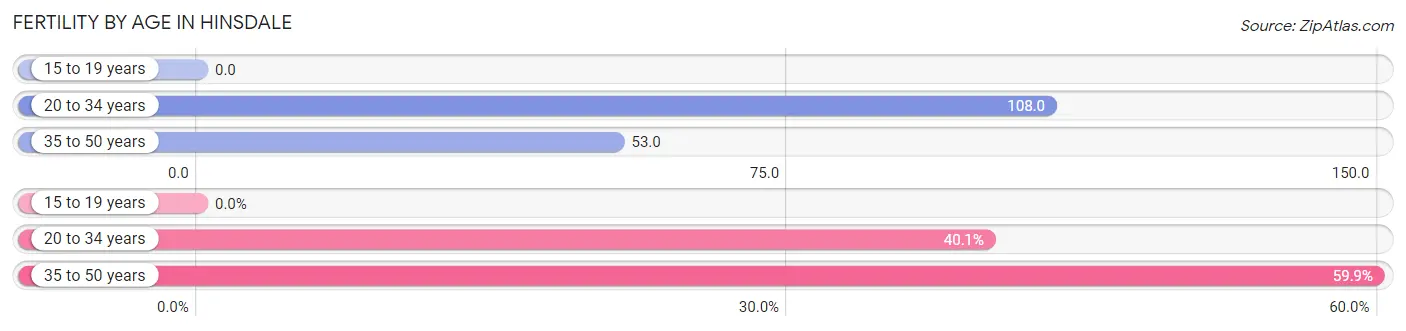
| Age Bracket | Women with Births | Births / 1,000 Women |
| 15 to 19 years | 0 (0.0%) | 0.0 |
| 20 to 34 years | 77 (40.1%) | 108.0 |
| 35 to 50 years | 115 (59.9%) | 53.0 |
| Total | 192 (100.0%) | 54.0 |
Fertility by Age by Marriage Status in Hinsdale
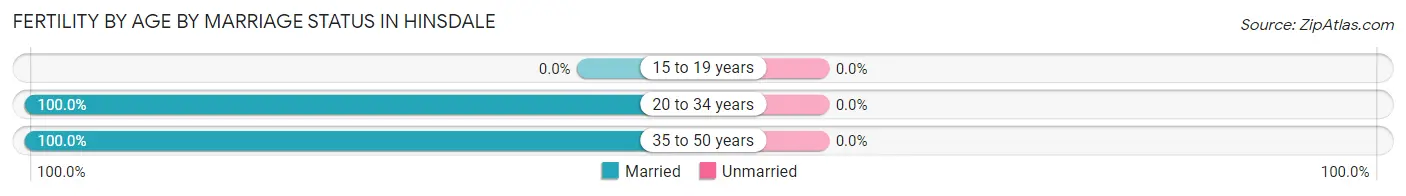
| Age Bracket | Married | Unmarried |
| 15 to 19 years | 0 (0.0%) | 0 (0.0%) |
| 20 to 34 years | 77 (100.0%) | 0 (0.0%) |
| 35 to 50 years | 115 (100.0%) | 0 (0.0%) |
| Total | 192 (100.0%) | 0 (0.0%) |
Fertility by Education in Hinsdale
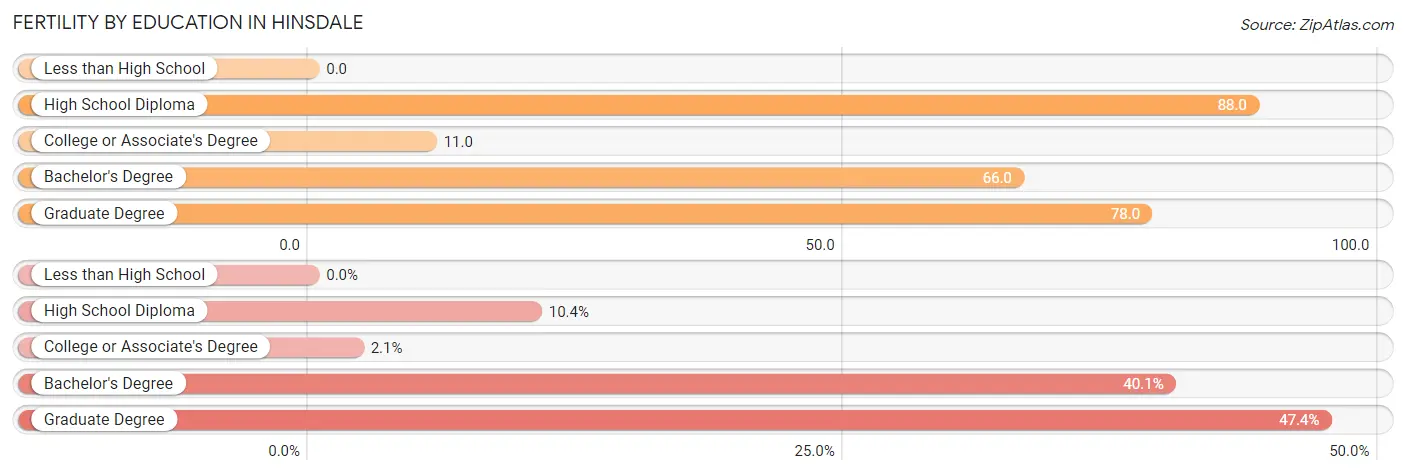
| Educational Attainment | Women with Births | Births / 1,000 Women |
| Less than High School | 0 (0.0%) | 0.0 |
| High School Diploma | 20 (10.4%) | 88.0 |
| College or Associate's Degree | 4 (2.1%) | 11.0 |
| Bachelor's Degree | 77 (40.1%) | 66.0 |
| Graduate Degree | 91 (47.4%) | 78.0 |
| Total | 192 (100.0%) | 54.0 |
Fertility by Education by Marriage Status in Hinsdale
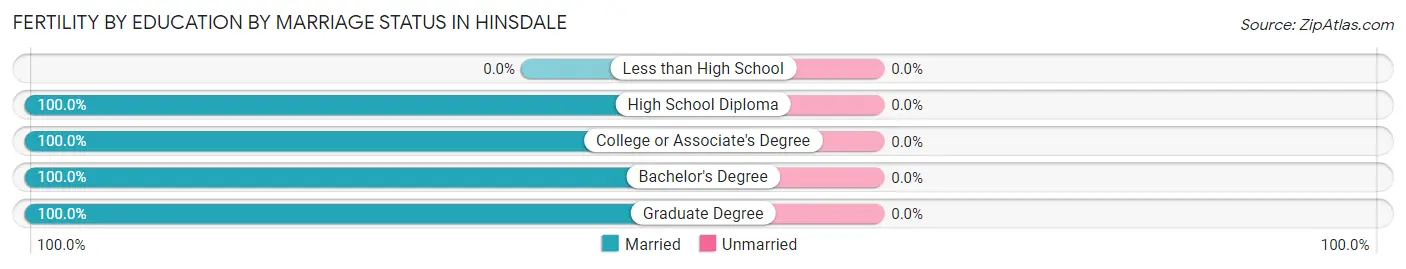
| Educational Attainment | Married | Unmarried |
| Less than High School | 0 (0.0%) | 0 (0.0%) |
| High School Diploma | 20 (100.0%) | 0 (0.0%) |
| College or Associate's Degree | 4 (100.0%) | 0 (0.0%) |
| Bachelor's Degree | 77 (100.0%) | 0 (0.0%) |
| Graduate Degree | 91 (100.0%) | 0 (0.0%) |
| Total | 192 (100.0%) | 0 (0.0%) |
Employment Characteristics in Hinsdale
Employment by Class of Employer in Hinsdale
Among the 7,480 employed individuals in Hinsdale, private company employees (5,089 | 68.0%), self-employed (incorporated) (800 | 10.7%), and self-employed (not incorporated) (526 | 7.0%) make up the most common classes of employment.
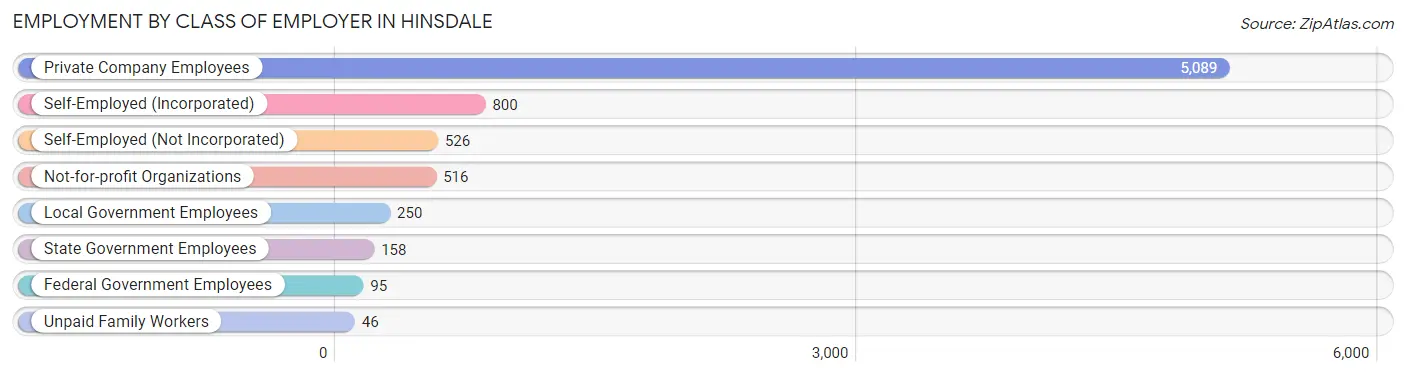
| Employer Class | # Employees | % Employees |
| Private Company Employees | 5,089 | 68.0% |
| Self-Employed (Incorporated) | 800 | 10.7% |
| Self-Employed (Not Incorporated) | 526 | 7.0% |
| Not-for-profit Organizations | 516 | 6.9% |
| Local Government Employees | 250 | 3.3% |
| State Government Employees | 158 | 2.1% |
| Federal Government Employees | 95 | 1.3% |
| Unpaid Family Workers | 46 | 0.6% |
| Total | 7,480 | 100.0% |
Employment Status by Age in Hinsdale
According to the labor force statistics for Hinsdale, out of the total population over 16 years of age (12,266), 63.2% or 7,752 individuals are in the labor force, with 2.6% or 202 of them unemployed. The age group with the highest labor force participation rate is 30 to 34 years, with 83.7% or 498 individuals in the labor force. Within the labor force, the 20 to 24 years age range has the highest percentage of unemployed individuals, with 10.9% or 33 of them being unemployed.
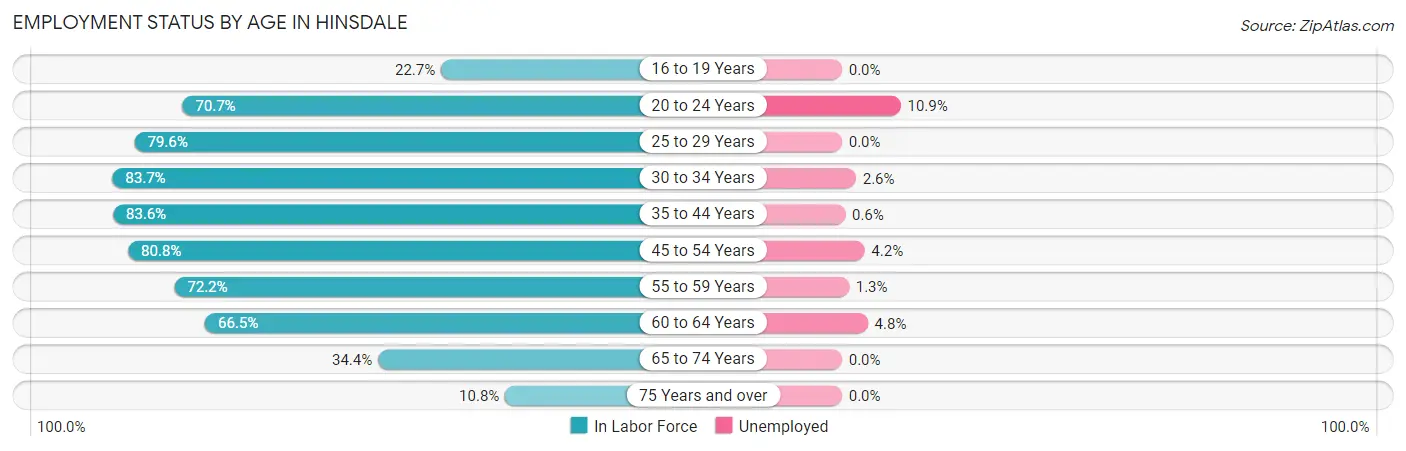
| Age Bracket | In Labor Force | Unemployed |
| 16 to 19 Years | 186 (22.7%) | 0 (0.0%) |
| 20 to 24 Years | 302 (70.7%) | 33 (10.9%) |
| 25 to 29 Years | 222 (79.6%) | 0 (0.0%) |
| 30 to 34 Years | 498 (83.7%) | 13 (2.6%) |
| 35 to 44 Years | 1,999 (83.6%) | 12 (0.6%) |
| 45 to 54 Years | 2,430 (80.8%) | 102 (4.2%) |
| 55 to 59 Years | 792 (72.2%) | 10 (1.3%) |
| 60 to 64 Years | 708 (66.5%) | 34 (4.8%) |
| 65 to 74 Years | 490 (34.4%) | 0 (0.0%) |
| 75 Years and over | 125 (10.8%) | 0 (0.0%) |
| Total | 7,752 (63.2%) | 202 (2.6%) |
Employment Status by Educational Attainment in Hinsdale
According to labor force statistics for Hinsdale, 78.8% of individuals (6,647) out of the total population between 25 and 64 years of age (8,435) are in the labor force, with 2.5% or 166 of them being unemployed. The group with the highest labor force participation rate are those with the educational attainment of bachelor's degree or higher, with 80.3% or 5,818 individuals in the labor force. Within the labor force, individuals with college / associate degree education have the highest percentage of unemployment, with 3.8% or 21 of them being unemployed.
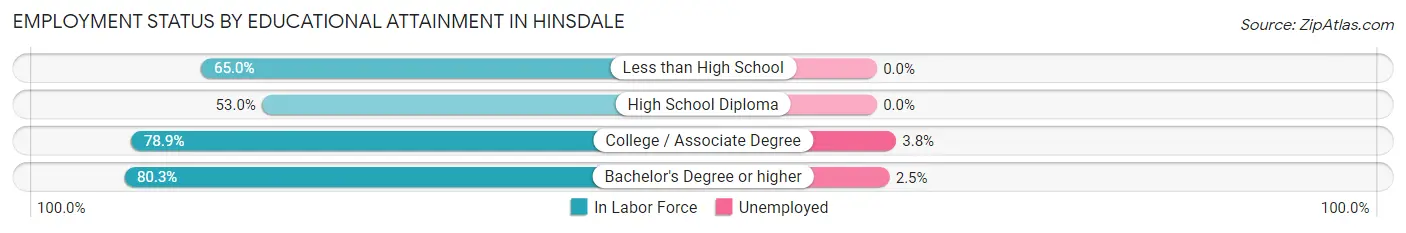
| Educational Attainment | In Labor Force | Unemployed |
| Less than High School | 78 (65.0%) | 0 (0.0%) |
| High School Diploma | 193 (53.0%) | 0 (0.0%) |
| College / Associate Degree | 557 (78.9%) | 27 (3.8%) |
| Bachelor's Degree or higher | 5,818 (80.3%) | 181 (2.5%) |
| Total | 6,647 (78.8%) | 211 (2.5%) |
Employment Occupations by Sex in Hinsdale
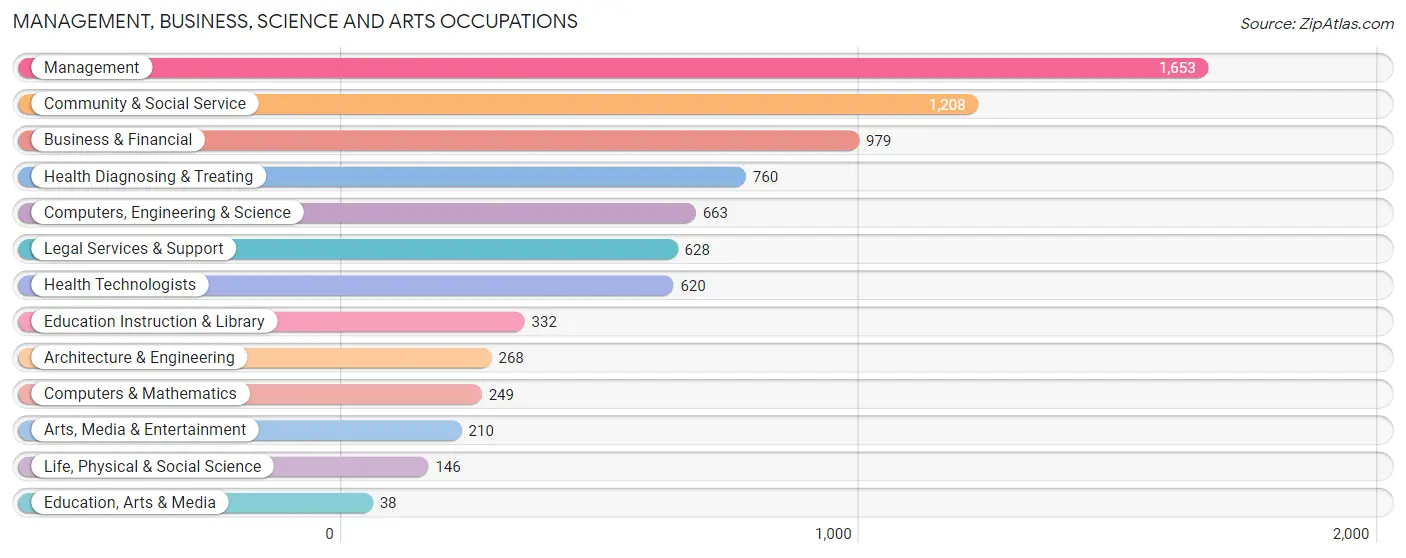
Management, Business, Science and Arts Occupations
The most common Management, Business, Science and Arts occupations in Hinsdale are Management (1,653 | 21.9%), Community & Social Service (1,208 | 16.0%), Business & Financial (979 | 13.0%), Health Diagnosing & Treating (760 | 10.1%), and Computers, Engineering & Science (663 | 8.8%).
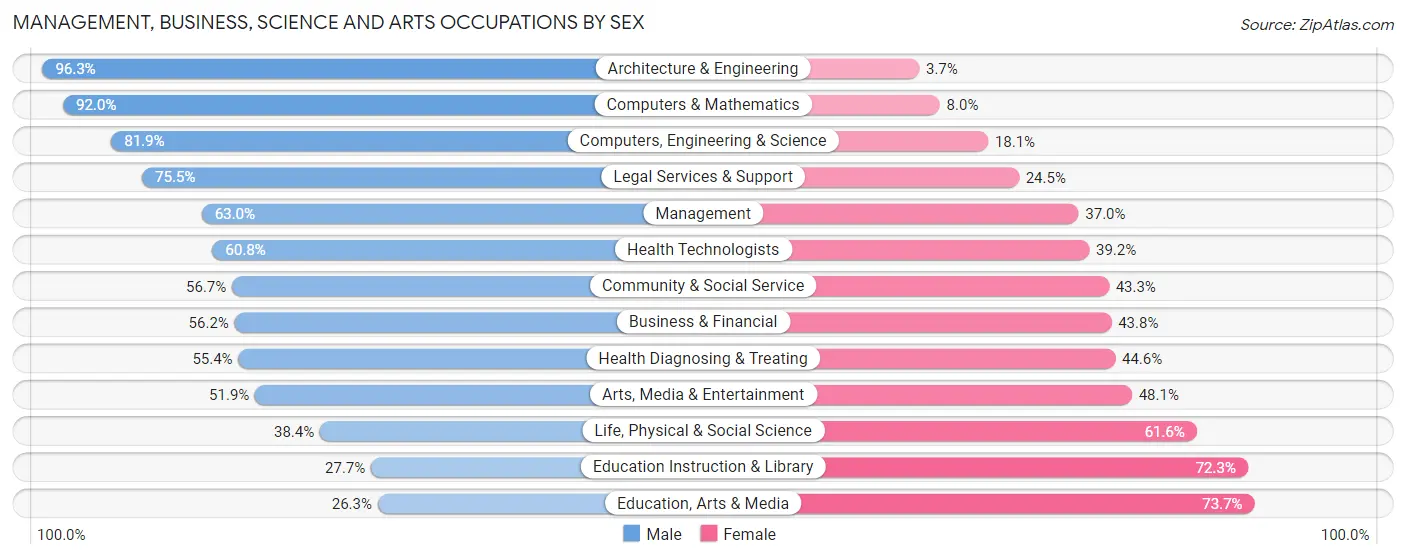
Management, Business, Science and Arts Occupations by Sex
Within the Management, Business, Science and Arts occupations in Hinsdale, the most male-oriented occupations are Architecture & Engineering (96.3%), Computers & Mathematics (92.0%), and Computers, Engineering & Science (81.9%), while the most female-oriented occupations are Education, Arts & Media (73.7%), Education Instruction & Library (72.3%), and Life, Physical & Social Science (61.6%).
| Occupation | Male | Female |
| Management | 1,042 (63.0%) | 611 (37.0%) |
| Business & Financial | 550 (56.2%) | 429 (43.8%) |
| Computers, Engineering & Science | 543 (81.9%) | 120 (18.1%) |
| Computers & Mathematics | 229 (92.0%) | 20 (8.0%) |
| Architecture & Engineering | 258 (96.3%) | 10 (3.7%) |
| Life, Physical & Social Science | 56 (38.4%) | 90 (61.6%) |
| Community & Social Service | 685 (56.7%) | 523 (43.3%) |
| Education, Arts & Media | 10 (26.3%) | 28 (73.7%) |
| Legal Services & Support | 474 (75.5%) | 154 (24.5%) |
| Education Instruction & Library | 92 (27.7%) | 240 (72.3%) |
| Arts, Media & Entertainment | 109 (51.9%) | 101 (48.1%) |
| Health Diagnosing & Treating | 421 (55.4%) | 339 (44.6%) |
| Health Technologists | 377 (60.8%) | 243 (39.2%) |
| Total (Category) | 3,241 (61.6%) | 2,022 (38.4%) |
| Total (Overall) | 4,427 (58.6%) | 3,123 (41.4%) |
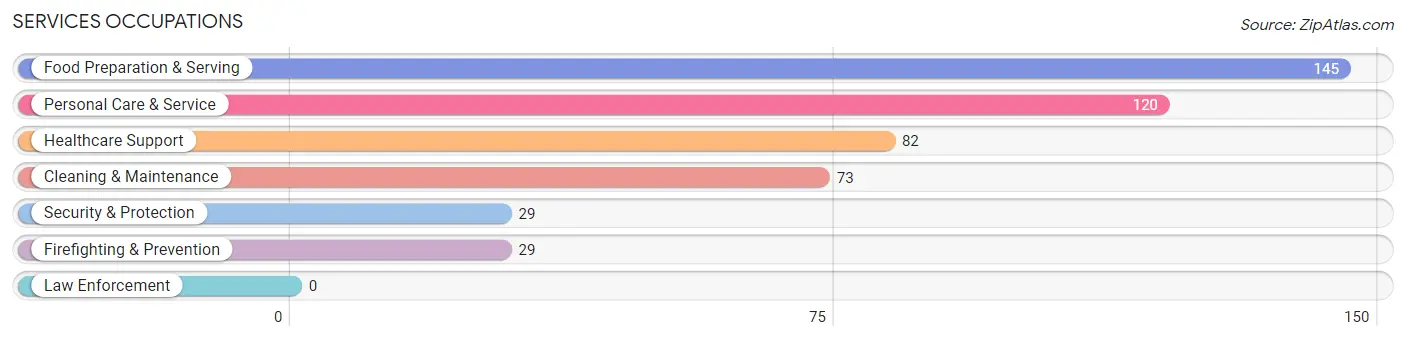
Services Occupations
The most common Services occupations in Hinsdale are Food Preparation & Serving (145 | 1.9%), Personal Care & Service (120 | 1.6%), Healthcare Support (82 | 1.1%), Cleaning & Maintenance (73 | 1.0%), and Security & Protection (29 | 0.4%).
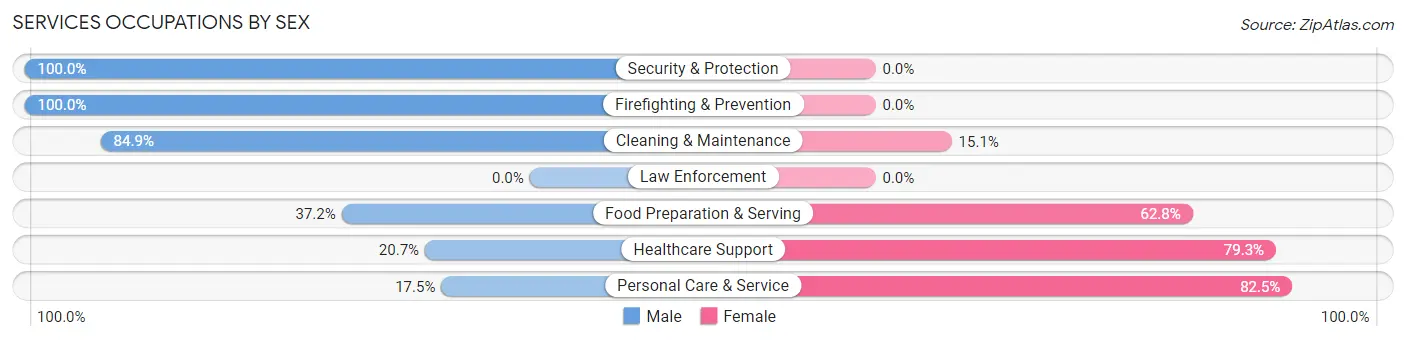
Services Occupations by Sex
Within the Services occupations in Hinsdale, the most male-oriented occupations are Security & Protection (100.0%), Firefighting & Prevention (100.0%), and Cleaning & Maintenance (84.9%), while the most female-oriented occupations are Personal Care & Service (82.5%), Healthcare Support (79.3%), and Food Preparation & Serving (62.8%).
| Occupation | Male | Female |
| Healthcare Support | 17 (20.7%) | 65 (79.3%) |
| Security & Protection | 29 (100.0%) | 0 (0.0%) |
| Firefighting & Prevention | 29 (100.0%) | 0 (0.0%) |
| Law Enforcement | 0 (0.0%) | 0 (0.0%) |
| Food Preparation & Serving | 54 (37.2%) | 91 (62.8%) |
| Cleaning & Maintenance | 62 (84.9%) | 11 (15.1%) |
| Personal Care & Service | 21 (17.5%) | 99 (82.5%) |
| Total (Category) | 183 (40.8%) | 266 (59.2%) |
| Total (Overall) | 4,427 (58.6%) | 3,123 (41.4%) |
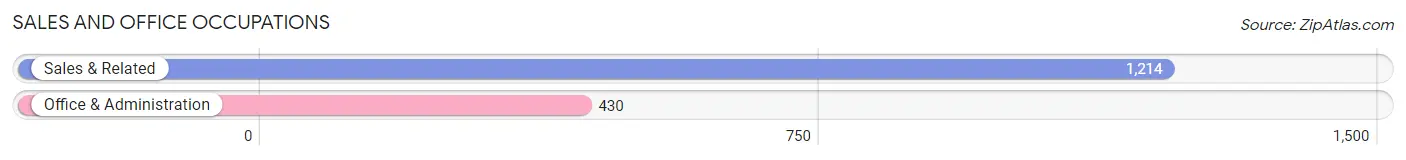
Sales and Office Occupations
The most common Sales and Office occupations in Hinsdale are Sales & Related (1,214 | 16.1%), and Office & Administration (430 | 5.7%).
Sales and Office Occupations by Sex
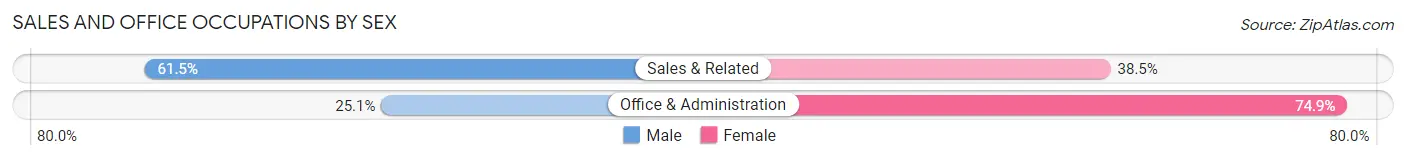
| Occupation | Male | Female |
| Sales & Related | 747 (61.5%) | 467 (38.5%) |
| Office & Administration | 108 (25.1%) | 322 (74.9%) |
| Total (Category) | 855 (52.0%) | 789 (48.0%) |
| Total (Overall) | 4,427 (58.6%) | 3,123 (41.4%) |
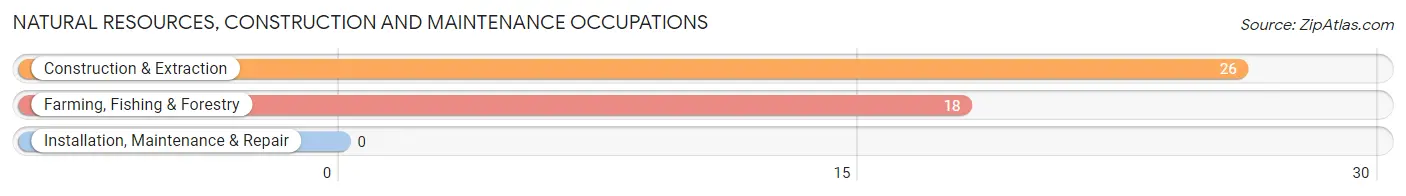
Natural Resources, Construction and Maintenance Occupations
The most common Natural Resources, Construction and Maintenance occupations in Hinsdale are Construction & Extraction (26 | 0.3%), and Farming, Fishing & Forestry (18 | 0.2%).
Natural Resources, Construction and Maintenance Occupations by Sex
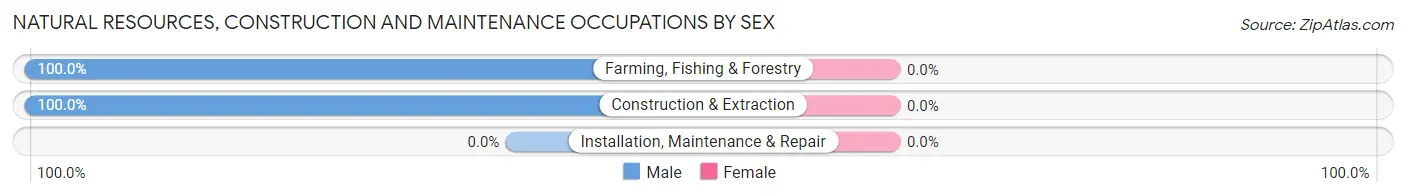
| Occupation | Male | Female |
| Farming, Fishing & Forestry | 18 (100.0%) | 0 (0.0%) |
| Construction & Extraction | 26 (100.0%) | 0 (0.0%) |
| Installation, Maintenance & Repair | 0 (0.0%) | 0 (0.0%) |
| Total (Category) | 44 (100.0%) | 0 (0.0%) |
| Total (Overall) | 4,427 (58.6%) | 3,123 (41.4%) |
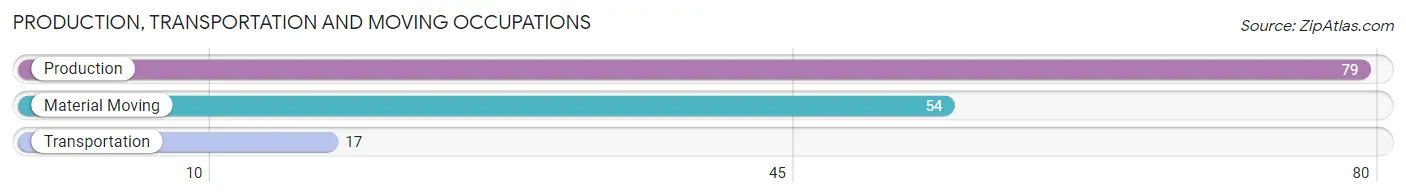
Production, Transportation and Moving Occupations
The most common Production, Transportation and Moving occupations in Hinsdale are Production (79 | 1.1%), Material Moving (54 | 0.7%), and Transportation (17 | 0.2%).
Production, Transportation and Moving Occupations by Sex
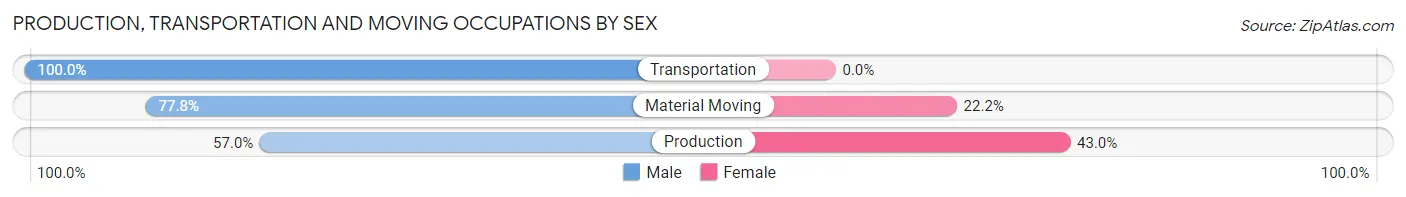
| Occupation | Male | Female |
| Production | 45 (57.0%) | 34 (43.0%) |
| Transportation | 17 (100.0%) | 0 (0.0%) |
| Material Moving | 42 (77.8%) | 12 (22.2%) |
| Total (Category) | 104 (69.3%) | 46 (30.7%) |
| Total (Overall) | 4,427 (58.6%) | 3,123 (41.4%) |
Employment Industries by Sex in Hinsdale
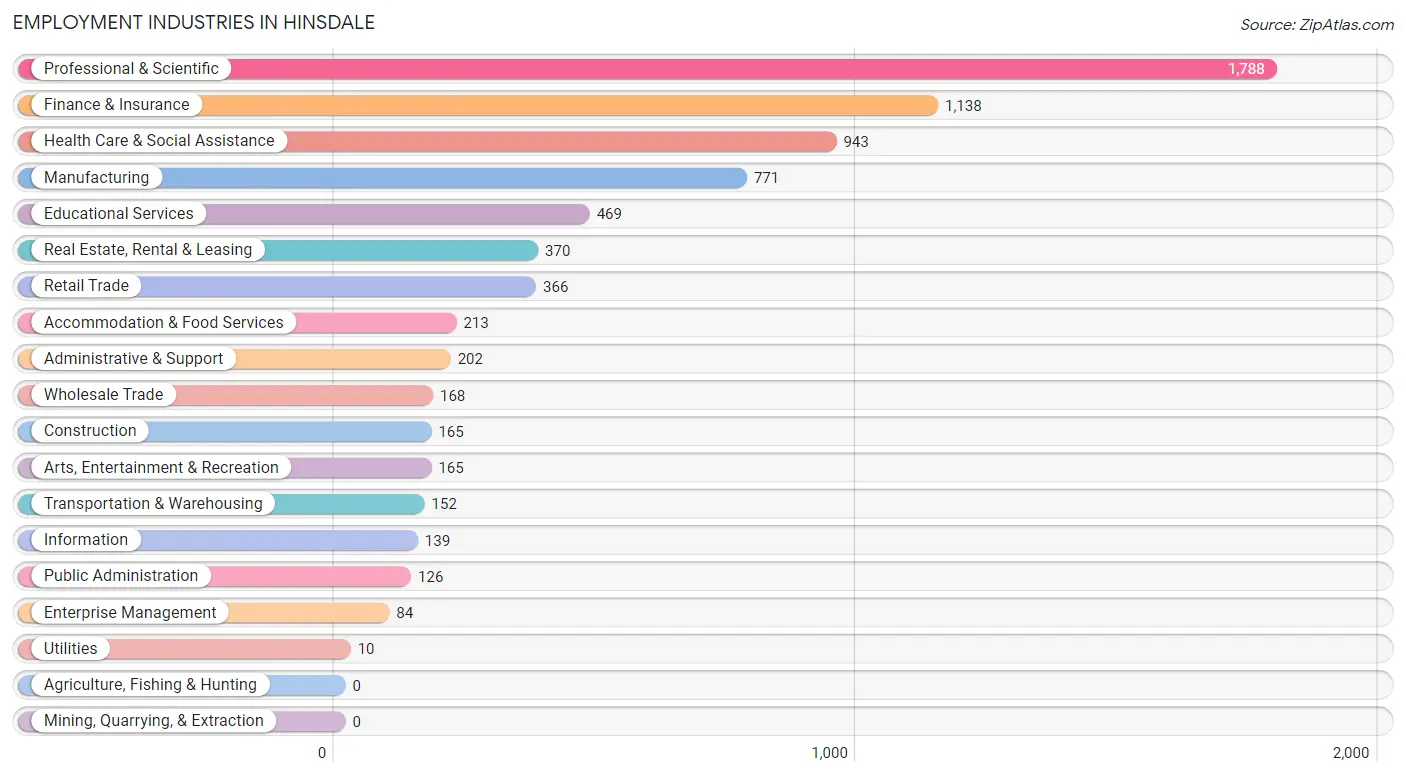
Employment Industries in Hinsdale
The major employment industries in Hinsdale include Professional & Scientific (1,788 | 23.7%), Finance & Insurance (1,138 | 15.1%), Health Care & Social Assistance (943 | 12.5%), Manufacturing (771 | 10.2%), and Educational Services (469 | 6.2%).
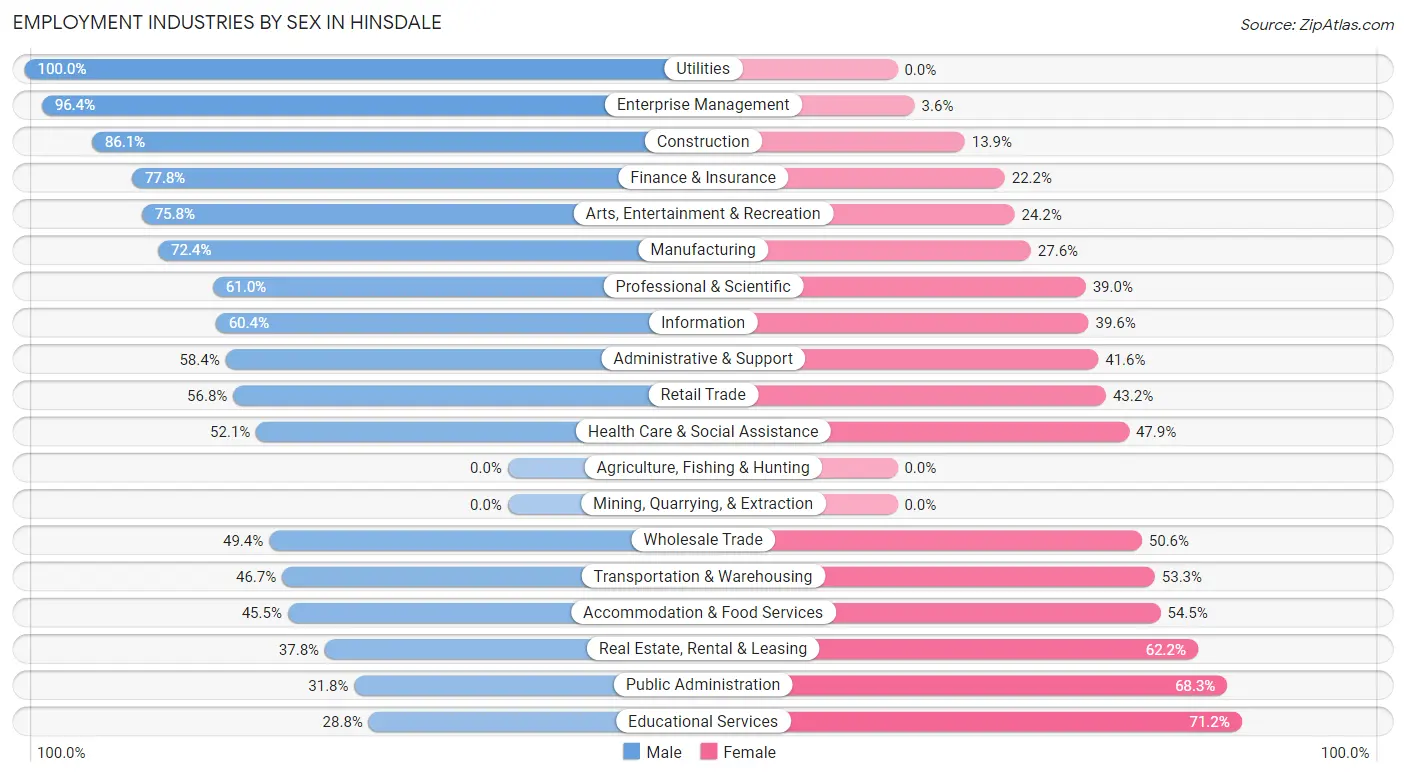
Employment Industries by Sex in Hinsdale
The Hinsdale industries that see more men than women are Utilities (100.0%), Enterprise Management (96.4%), and Construction (86.1%), whereas the industries that tend to have a higher number of women are Educational Services (71.2%), Public Administration (68.2%), and Real Estate, Rental & Leasing (62.2%).
| Industry | Male | Female |
| Agriculture, Fishing & Hunting | 0 (0.0%) | 0 (0.0%) |
| Mining, Quarrying, & Extraction | 0 (0.0%) | 0 (0.0%) |
| Construction | 142 (86.1%) | 23 (13.9%) |
| Manufacturing | 558 (72.4%) | 213 (27.6%) |
| Wholesale Trade | 83 (49.4%) | 85 (50.6%) |
| Retail Trade | 208 (56.8%) | 158 (43.2%) |
| Transportation & Warehousing | 71 (46.7%) | 81 (53.3%) |
| Utilities | 10 (100.0%) | 0 (0.0%) |
| Information | 84 (60.4%) | 55 (39.6%) |
| Finance & Insurance | 885 (77.8%) | 253 (22.2%) |
| Real Estate, Rental & Leasing | 140 (37.8%) | 230 (62.2%) |
| Professional & Scientific | 1,091 (61.0%) | 697 (39.0%) |
| Enterprise Management | 81 (96.4%) | 3 (3.6%) |
| Administrative & Support | 118 (58.4%) | 84 (41.6%) |
| Educational Services | 135 (28.8%) | 334 (71.2%) |
| Health Care & Social Assistance | 491 (52.1%) | 452 (47.9%) |
| Arts, Entertainment & Recreation | 125 (75.8%) | 40 (24.2%) |
| Accommodation & Food Services | 97 (45.5%) | 116 (54.5%) |
| Public Administration | 40 (31.8%) | 86 (68.2%) |
| Total | 4,427 (58.6%) | 3,123 (41.4%) |
Education in Hinsdale
School Enrollment in Hinsdale
The most common levels of schooling among the 5,502 students in Hinsdale are elementary school (1,577 | 28.7%), high school (1,322 | 24.0%), and middle school (1,266 | 23.0%).
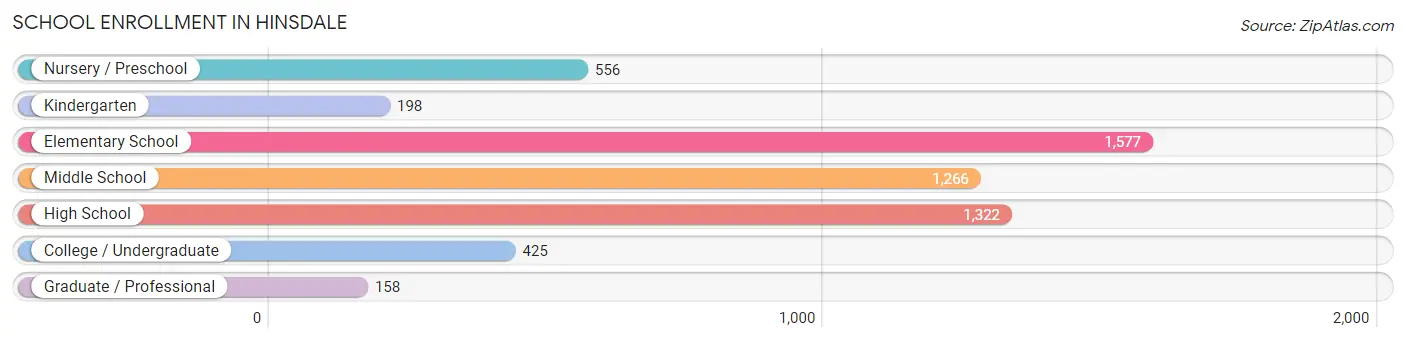
| School Level | # Students | % Students |
| Nursery / Preschool | 556 | 10.1% |
| Kindergarten | 198 | 3.6% |
| Elementary School | 1,577 | 28.7% |
| Middle School | 1,266 | 23.0% |
| High School | 1,322 | 24.0% |
| College / Undergraduate | 425 | 7.7% |
| Graduate / Professional | 158 | 2.9% |
| Total | 5,502 | 100.0% |
School Enrollment by Age by Funding Source in Hinsdale
Out of a total of 5,502 students who are enrolled in schools in Hinsdale, 1,029 (18.7%) attend a private institution, while the remaining 4,473 (81.3%) are enrolled in public schools. The age group of 3 to 4 year olds has the highest likelihood of being enrolled in private schools, with 277 (71.6% in the age bracket) enrolled. Conversely, the age group of 15 to 17 year olds has the lowest likelihood of being enrolled in a private school, with 949 (93.0% in the age bracket) attending a public institution.
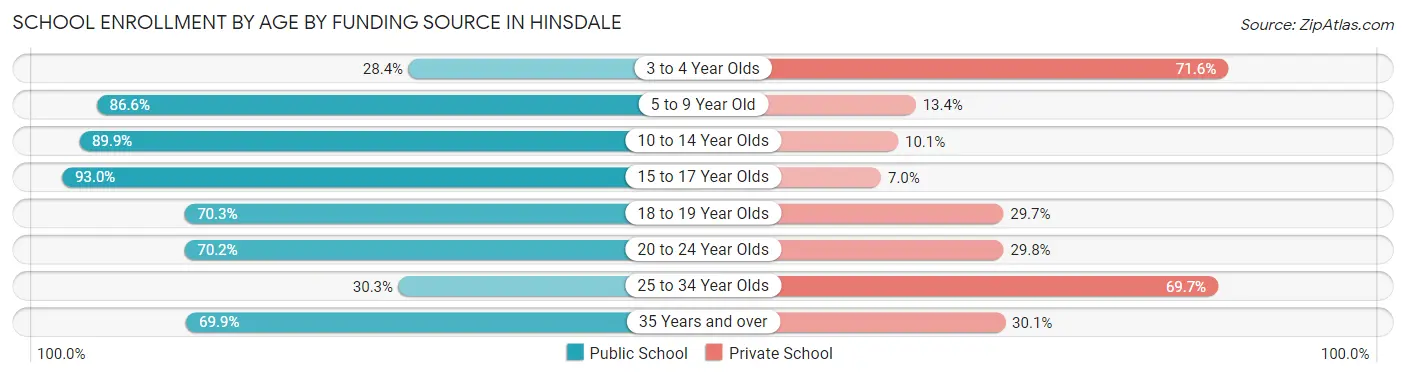
| Age Bracket | Public School | Private School |
| 3 to 4 Year Olds | 110 (28.4%) | 277 (71.6%) |
| 5 to 9 Year Old | 1,413 (86.6%) | 219 (13.4%) |
| 10 to 14 Year Olds | 1,553 (89.9%) | 175 (10.1%) |
| 15 to 17 Year Olds | 949 (93.0%) | 71 (7.0%) |
| 18 to 19 Year Olds | 163 (70.3%) | 69 (29.7%) |
| 20 to 24 Year Olds | 144 (70.2%) | 61 (29.8%) |
| 25 to 34 Year Olds | 53 (30.3%) | 122 (69.7%) |
| 35 Years and over | 86 (69.9%) | 37 (30.1%) |
| Total | 4,473 (81.3%) | 1,029 (18.7%) |
Educational Attainment by Field of Study in Hinsdale
Business (2,835 | 29.5%), social sciences (1,264 | 13.1%), bio, nature & agricultural (749 | 7.8%), engineering (709 | 7.4%), and science & technology (595 | 6.2%) are the most common fields of study among 9,620 individuals in Hinsdale who have obtained a bachelor's degree or higher.
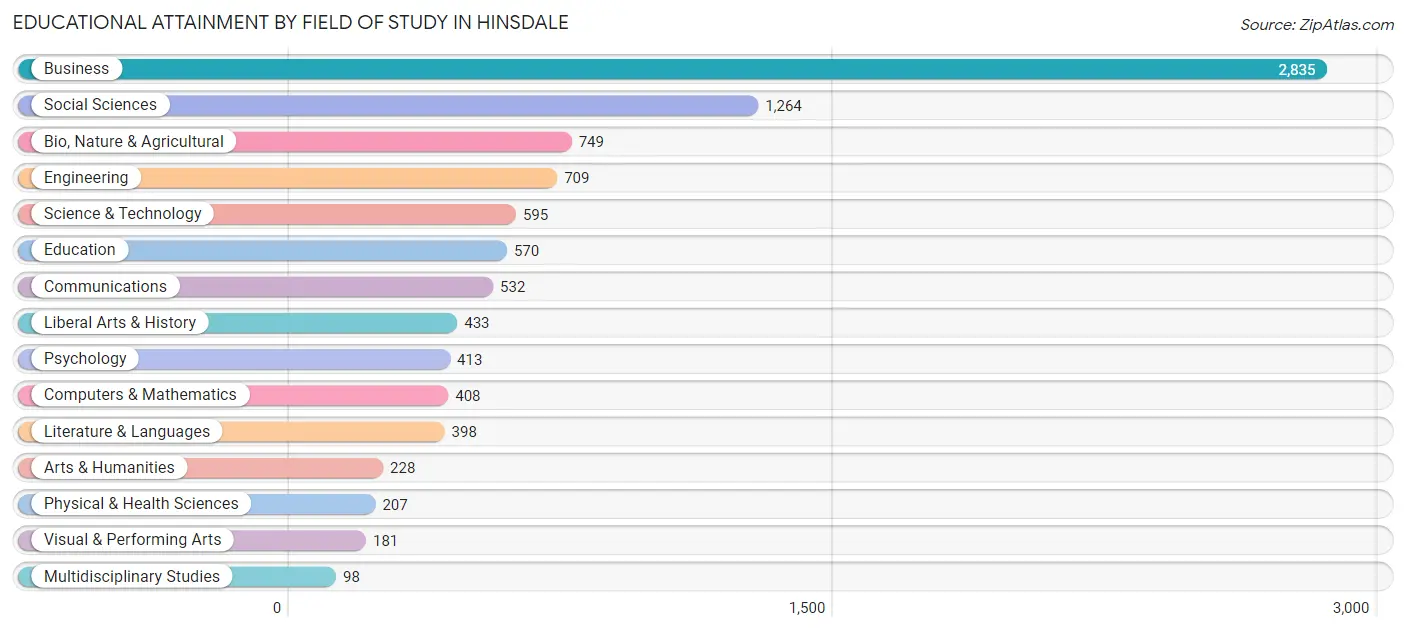
| Field of Study | # Graduates | % Graduates |
| Computers & Mathematics | 408 | 4.2% |
| Bio, Nature & Agricultural | 749 | 7.8% |
| Physical & Health Sciences | 207 | 2.1% |
| Psychology | 413 | 4.3% |
| Social Sciences | 1,264 | 13.1% |
| Engineering | 709 | 7.4% |
| Multidisciplinary Studies | 98 | 1.0% |
| Science & Technology | 595 | 6.2% |
| Business | 2,835 | 29.5% |
| Education | 570 | 5.9% |
| Literature & Languages | 398 | 4.1% |
| Liberal Arts & History | 433 | 4.5% |
| Visual & Performing Arts | 181 | 1.9% |
| Communications | 532 | 5.5% |
| Arts & Humanities | 228 | 2.4% |
| Total | 9,620 | 100.0% |
Transportation & Commute in Hinsdale
Vehicle Availability by Sex in Hinsdale
The most prevalent vehicle ownership categories in Hinsdale are males with 2 vehicles (2,433, accounting for 55.8%) and females with 2 vehicles (1,652, making up 79.0%).
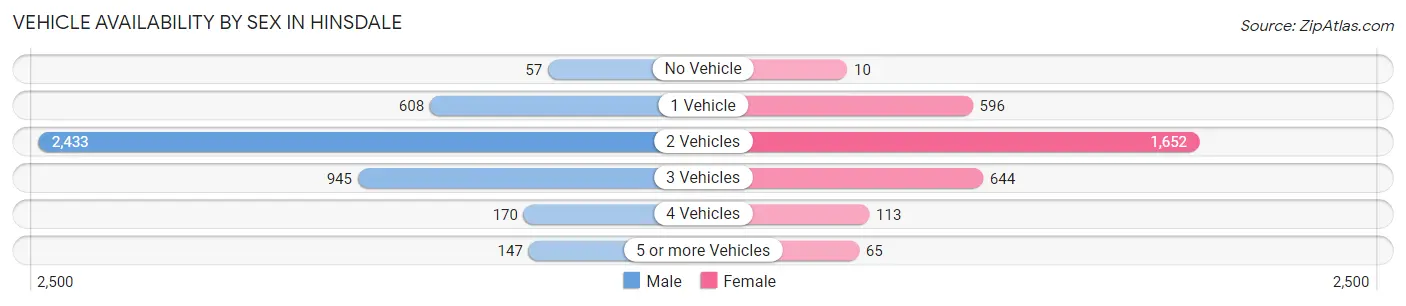
| Vehicles Available | Male | Female |
| No Vehicle | 57 (1.3%) | 10 (0.3%) |
| 1 Vehicle | 608 (13.9%) | 596 (19.4%) |
| 2 Vehicles | 2,433 (55.8%) | 1,652 (53.6%) |
| 3 Vehicles | 945 (21.7%) | 644 (20.9%) |
| 4 Vehicles | 170 (3.9%) | 113 (3.7%) |
| 5 or more Vehicles | 147 (3.4%) | 65 (2.1%) |
| Total | 4,360 (100.0%) | 3,080 (100.0%) |
Commute Time in Hinsdale
The most frequently occuring commute durations in Hinsdale are 45 to 59 minutes (865 commuters, 16.1%), 20 to 24 minutes (618 commuters, 11.5%), and 60 to 89 minutes (594 commuters, 11.0%).
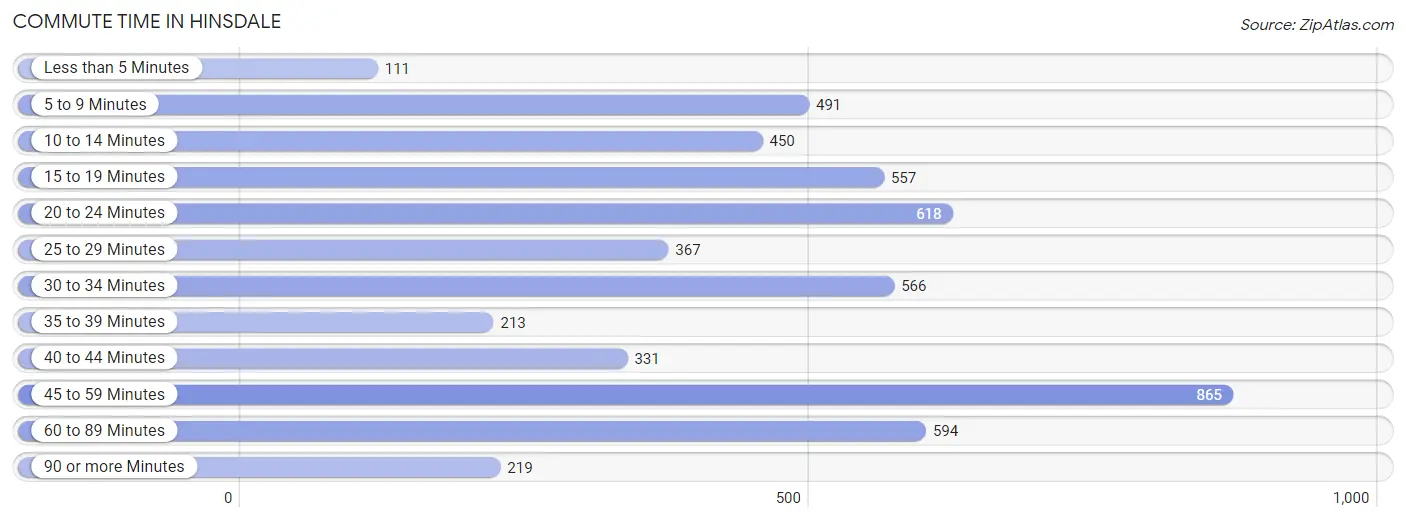
| Commute Time | # Commuters | % Commuters |
| Less than 5 Minutes | 111 | 2.1% |
| 5 to 9 Minutes | 491 | 9.1% |
| 10 to 14 Minutes | 450 | 8.4% |
| 15 to 19 Minutes | 557 | 10.3% |
| 20 to 24 Minutes | 618 | 11.5% |
| 25 to 29 Minutes | 367 | 6.8% |
| 30 to 34 Minutes | 566 | 10.5% |
| 35 to 39 Minutes | 213 | 4.0% |
| 40 to 44 Minutes | 331 | 6.1% |
| 45 to 59 Minutes | 865 | 16.1% |
| 60 to 89 Minutes | 594 | 11.0% |
| 90 or more Minutes | 219 | 4.1% |
Commute Time by Sex in Hinsdale
The most common commute times in Hinsdale are 45 to 59 minutes (591 commuters, 18.1%) for males and 20 to 24 minutes (342 commuters, 16.2%) for females.
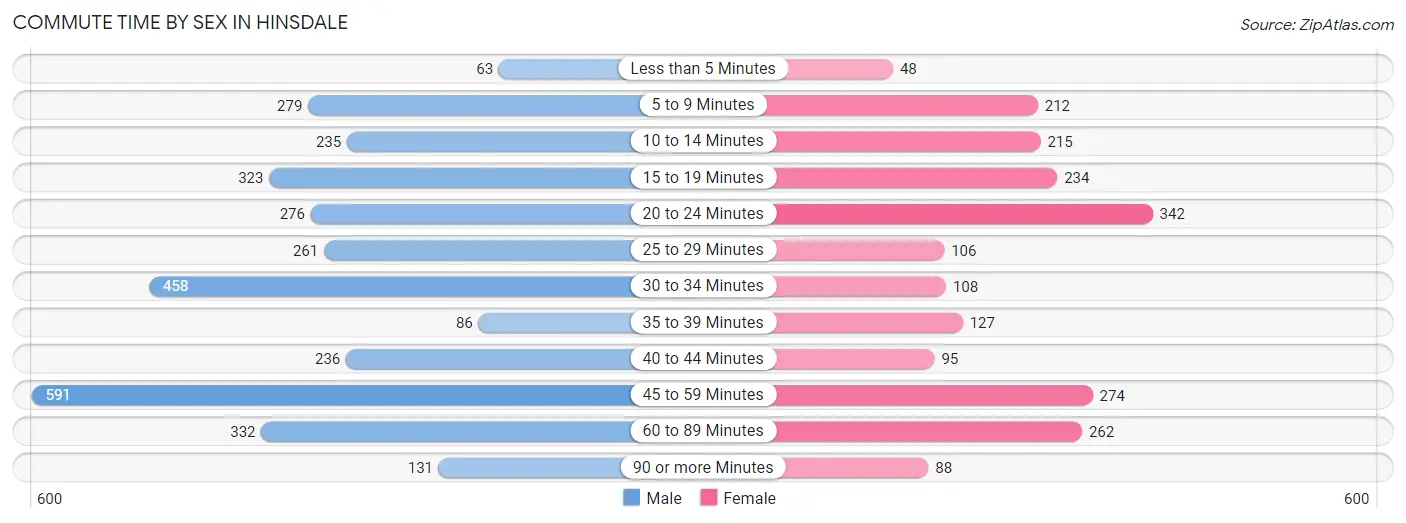
| Commute Time | Male | Female |
| Less than 5 Minutes | 63 (1.9%) | 48 (2.3%) |
| 5 to 9 Minutes | 279 (8.5%) | 212 (10.0%) |
| 10 to 14 Minutes | 235 (7.2%) | 215 (10.2%) |
| 15 to 19 Minutes | 323 (9.9%) | 234 (11.1%) |
| 20 to 24 Minutes | 276 (8.4%) | 342 (16.2%) |
| 25 to 29 Minutes | 261 (8.0%) | 106 (5.0%) |
| 30 to 34 Minutes | 458 (14.0%) | 108 (5.1%) |
| 35 to 39 Minutes | 86 (2.6%) | 127 (6.0%) |
| 40 to 44 Minutes | 236 (7.2%) | 95 (4.5%) |
| 45 to 59 Minutes | 591 (18.1%) | 274 (13.0%) |
| 60 to 89 Minutes | 332 (10.2%) | 262 (12.4%) |
| 90 or more Minutes | 131 (4.0%) | 88 (4.2%) |
Time of Departure to Work by Sex in Hinsdale
The most frequent times of departure to work in Hinsdale are 7:00 AM to 7:29 AM (658, 20.1%) for males and 8:00 AM to 8:29 AM (502, 23.8%) for females.
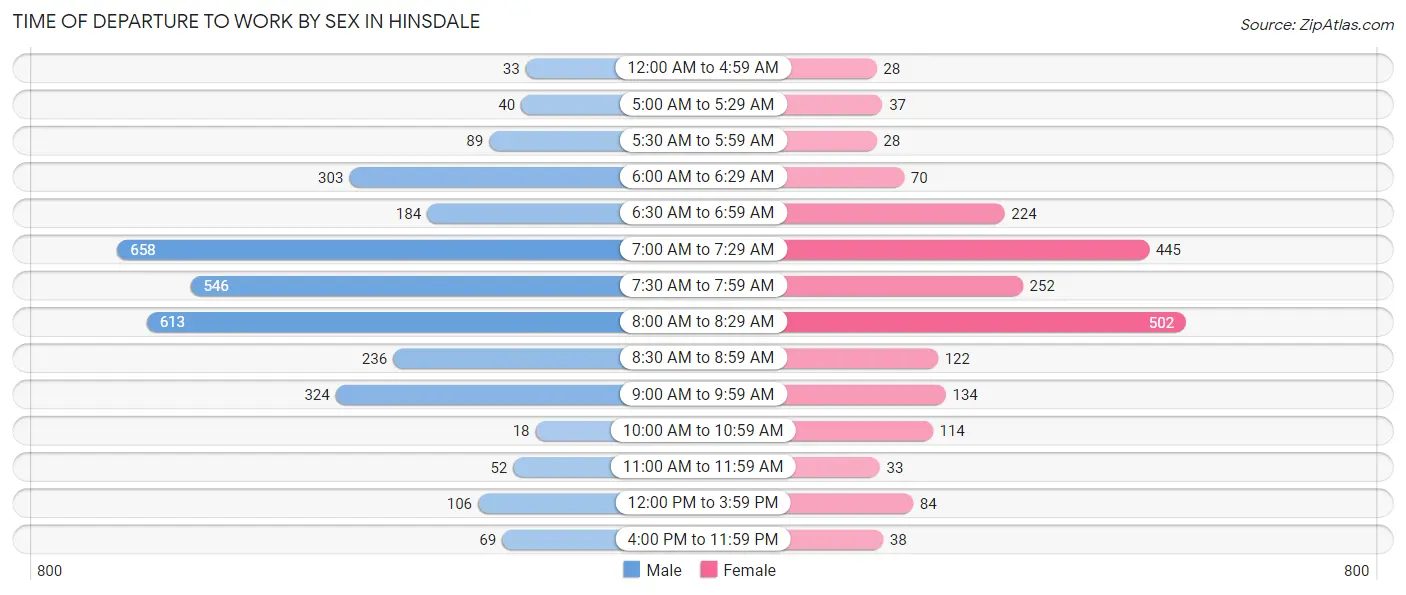
| Time of Departure | Male | Female |
| 12:00 AM to 4:59 AM | 33 (1.0%) | 28 (1.3%) |
| 5:00 AM to 5:29 AM | 40 (1.2%) | 37 (1.8%) |
| 5:30 AM to 5:59 AM | 89 (2.7%) | 28 (1.3%) |
| 6:00 AM to 6:29 AM | 303 (9.3%) | 70 (3.3%) |
| 6:30 AM to 6:59 AM | 184 (5.6%) | 224 (10.6%) |
| 7:00 AM to 7:29 AM | 658 (20.1%) | 445 (21.1%) |
| 7:30 AM to 7:59 AM | 546 (16.7%) | 252 (11.9%) |
| 8:00 AM to 8:29 AM | 613 (18.7%) | 502 (23.8%) |
| 8:30 AM to 8:59 AM | 236 (7.2%) | 122 (5.8%) |
| 9:00 AM to 9:59 AM | 324 (9.9%) | 134 (6.4%) |
| 10:00 AM to 10:59 AM | 18 (0.5%) | 114 (5.4%) |
| 11:00 AM to 11:59 AM | 52 (1.6%) | 33 (1.6%) |
| 12:00 PM to 3:59 PM | 106 (3.2%) | 84 (4.0%) |
| 4:00 PM to 11:59 PM | 69 (2.1%) | 38 (1.8%) |
| Total | 3,271 (100.0%) | 2,111 (100.0%) |
Housing Occupancy in Hinsdale
Occupancy by Ownership in Hinsdale
Of the total 5,744 dwellings in Hinsdale, owner-occupied units account for 5,134 (89.4%), while renter-occupied units make up 610 (10.6%).
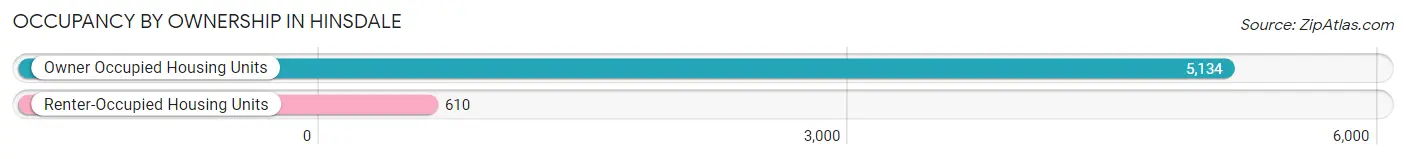
| Occupancy | # Housing Units | % Housing Units |
| Owner Occupied Housing Units | 5,134 | 89.4% |
| Renter-Occupied Housing Units | 610 | 10.6% |
| Total Occupied Housing Units | 5,744 | 100.0% |
Occupancy by Household Size in Hinsdale
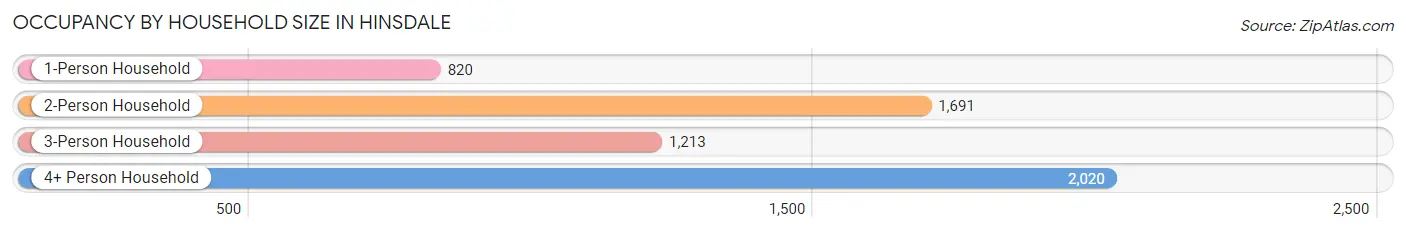
| Household Size | # Housing Units | % Housing Units |
| 1-Person Household | 820 | 14.3% |
| 2-Person Household | 1,691 | 29.4% |
| 3-Person Household | 1,213 | 21.1% |
| 4+ Person Household | 2,020 | 35.2% |
| Total Housing Units | 5,744 | 100.0% |
Occupancy by Ownership by Household Size in Hinsdale
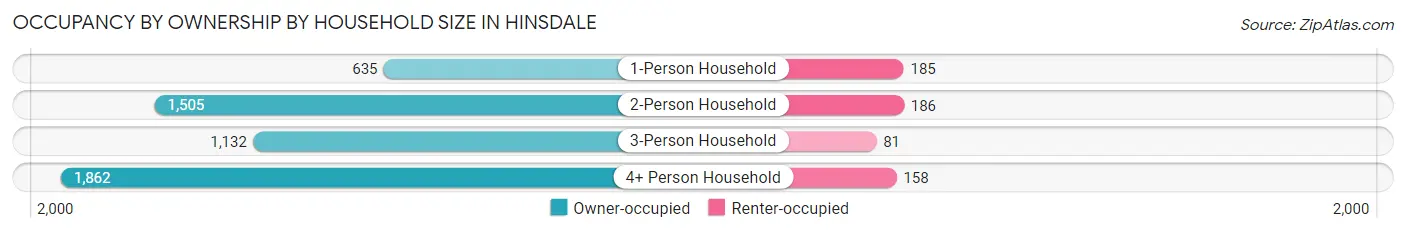
| Household Size | Owner-occupied | Renter-occupied |
| 1-Person Household | 635 (77.4%) | 185 (22.6%) |
| 2-Person Household | 1,505 (89.0%) | 186 (11.0%) |
| 3-Person Household | 1,132 (93.3%) | 81 (6.7%) |
| 4+ Person Household | 1,862 (92.2%) | 158 (7.8%) |
| Total Housing Units | 5,134 (89.4%) | 610 (10.6%) |
Occupancy by Educational Attainment in Hinsdale
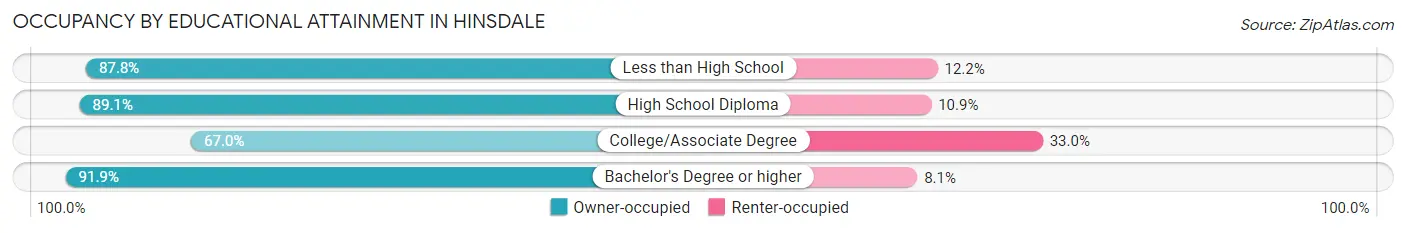
| Household Size | Owner-occupied | Renter-occupied |
| Less than High School | 101 (87.8%) | 14 (12.2%) |
| High School Diploma | 212 (89.1%) | 26 (10.9%) |
| College/Associate Degree | 353 (67.0%) | 174 (33.0%) |
| Bachelor's Degree or higher | 4,468 (91.9%) | 396 (8.1%) |
Occupancy by Age of Householder in Hinsdale
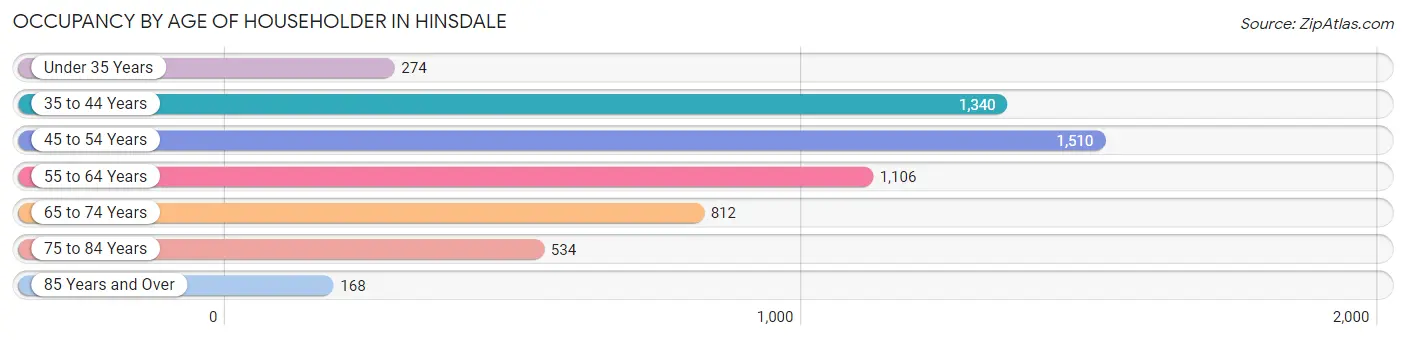
| Age Bracket | # Households | % Households |
| Under 35 Years | 274 | 4.8% |
| 35 to 44 Years | 1,340 | 23.3% |
| 45 to 54 Years | 1,510 | 26.3% |
| 55 to 64 Years | 1,106 | 19.3% |
| 65 to 74 Years | 812 | 14.1% |
| 75 to 84 Years | 534 | 9.3% |
| 85 Years and Over | 168 | 2.9% |
| Total | 5,744 | 100.0% |
Housing Finances in Hinsdale
Median Income by Occupancy in Hinsdale
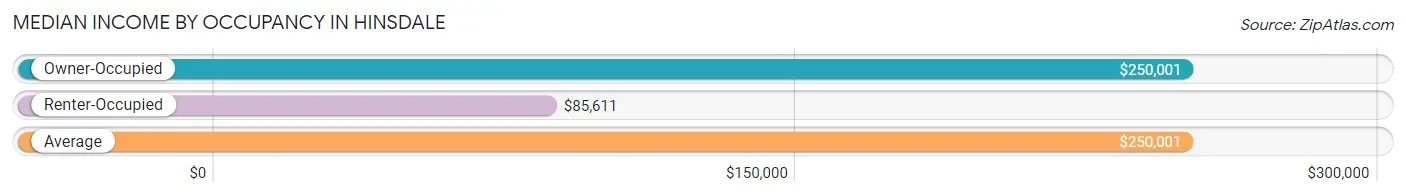
| Occupancy Type | # Households | Median Income |
| Owner-Occupied | 5,134 (89.4%) | $250,001 |
| Renter-Occupied | 610 (10.6%) | $85,611 |
| Average | 5,744 (100.0%) | $250,001 |
Occupancy by Householder Income Bracket in Hinsdale
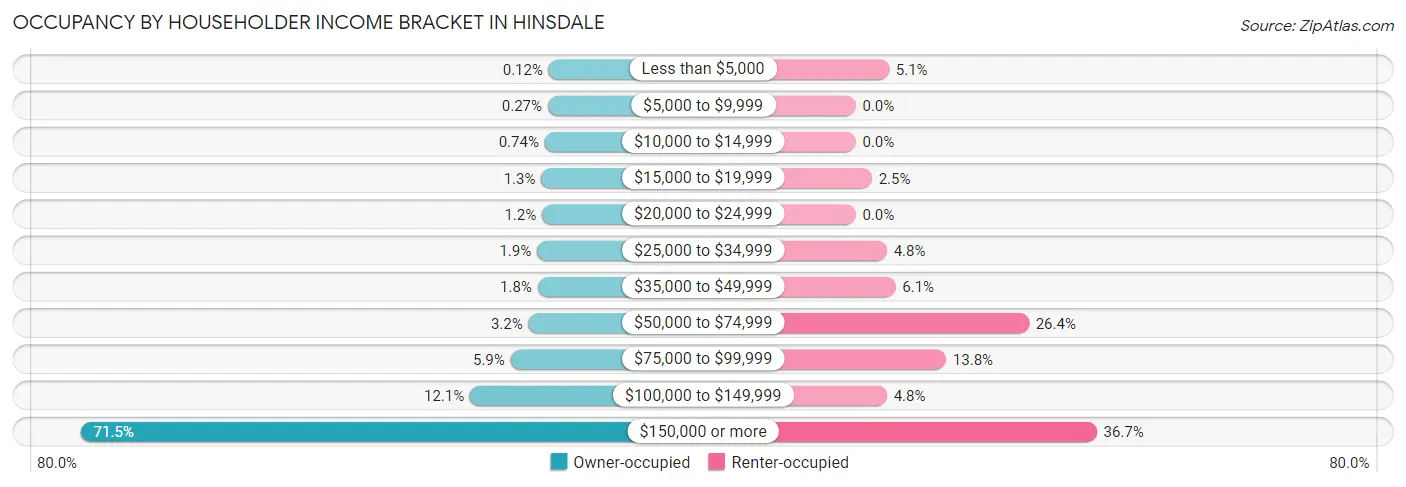
| Income Bracket | Owner-occupied | Renter-occupied |
| Less than $5,000 | 6 (0.1%) | 31 (5.1%) |
| $5,000 to $9,999 | 14 (0.3%) | 0 (0.0%) |
| $10,000 to $14,999 | 38 (0.7%) | 0 (0.0%) |
| $15,000 to $19,999 | 65 (1.3%) | 15 (2.5%) |
| $20,000 to $24,999 | 59 (1.1%) | 0 (0.0%) |
| $25,000 to $34,999 | 98 (1.9%) | 29 (4.8%) |
| $35,000 to $49,999 | 93 (1.8%) | 37 (6.1%) |
| $50,000 to $74,999 | 165 (3.2%) | 161 (26.4%) |
| $75,000 to $99,999 | 305 (5.9%) | 84 (13.8%) |
| $100,000 to $149,999 | 622 (12.1%) | 29 (4.8%) |
| $150,000 or more | 3,669 (71.5%) | 224 (36.7%) |
| Total | 5,134 (100.0%) | 610 (100.0%) |
Monthly Housing Cost Tiers in Hinsdale
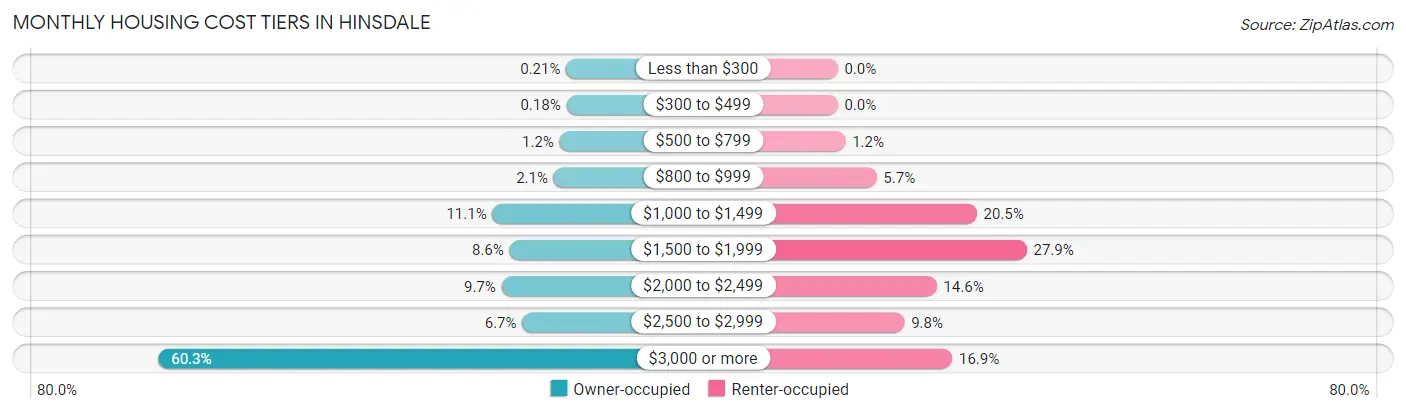
| Monthly Cost | Owner-occupied | Renter-occupied |
| Less than $300 | 11 (0.2%) | 0 (0.0%) |
| $300 to $499 | 9 (0.2%) | 0 (0.0%) |
| $500 to $799 | 61 (1.2%) | 7 (1.1%) |
| $800 to $999 | 105 (2.1%) | 35 (5.7%) |
| $1,000 to $1,499 | 569 (11.1%) | 125 (20.5%) |
| $1,500 to $1,999 | 440 (8.6%) | 170 (27.9%) |
| $2,000 to $2,499 | 500 (9.7%) | 89 (14.6%) |
| $2,500 to $2,999 | 343 (6.7%) | 60 (9.8%) |
| $3,000 or more | 3,096 (60.3%) | 103 (16.9%) |
| Total | 5,134 (100.0%) | 610 (100.0%) |
Physical Housing Characteristics in Hinsdale
Housing Structures in Hinsdale
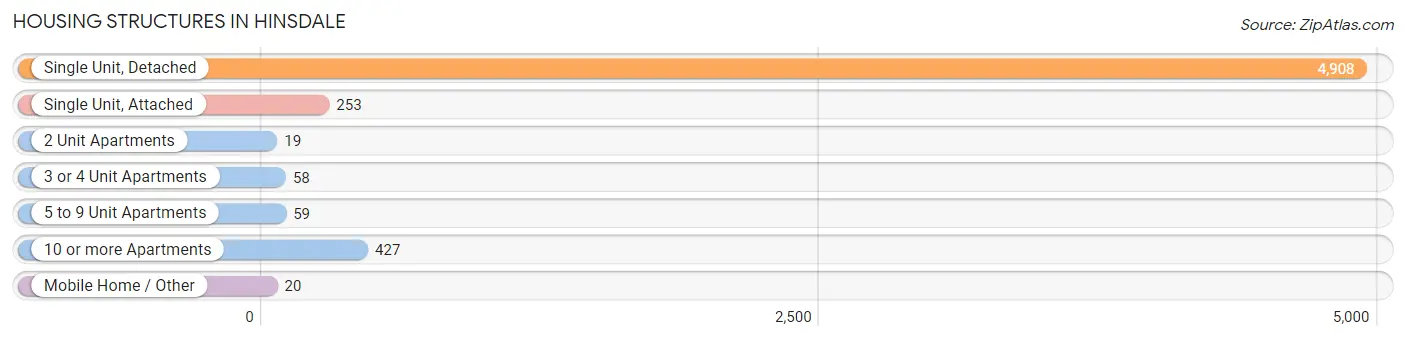
| Structure Type | # Housing Units | % Housing Units |
| Single Unit, Detached | 4,908 | 85.5% |
| Single Unit, Attached | 253 | 4.4% |
| 2 Unit Apartments | 19 | 0.3% |
| 3 or 4 Unit Apartments | 58 | 1.0% |
| 5 to 9 Unit Apartments | 59 | 1.0% |
| 10 or more Apartments | 427 | 7.4% |
| Mobile Home / Other | 20 | 0.4% |
| Total | 5,744 | 100.0% |
Housing Structures by Occupancy in Hinsdale
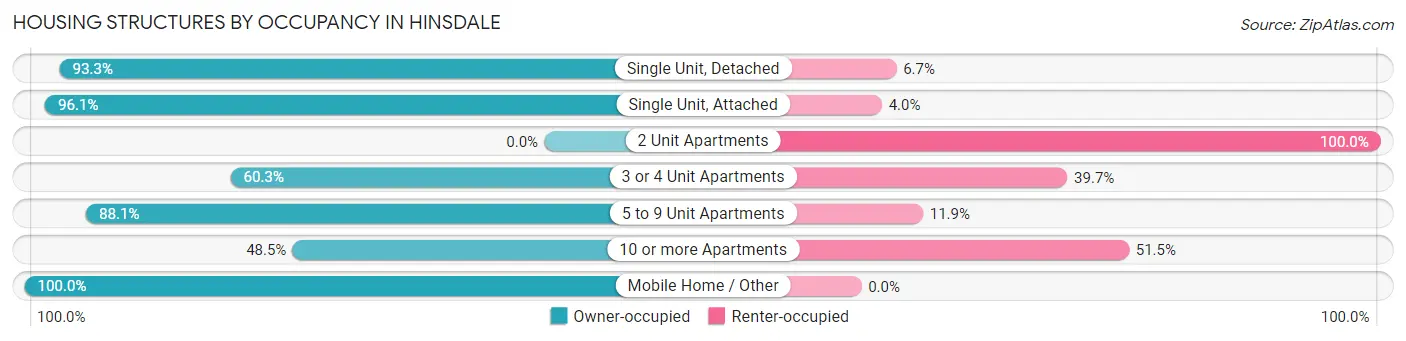
| Structure Type | Owner-occupied | Renter-occupied |
| Single Unit, Detached | 4,577 (93.3%) | 331 (6.7%) |
| Single Unit, Attached | 243 (96.1%) | 10 (4.0%) |
| 2 Unit Apartments | 0 (0.0%) | 19 (100.0%) |
| 3 or 4 Unit Apartments | 35 (60.3%) | 23 (39.7%) |
| 5 to 9 Unit Apartments | 52 (88.1%) | 7 (11.9%) |
| 10 or more Apartments | 207 (48.5%) | 220 (51.5%) |
| Mobile Home / Other | 20 (100.0%) | 0 (0.0%) |
| Total | 5,134 (89.4%) | 610 (10.6%) |
Housing Structures by Number of Rooms in Hinsdale
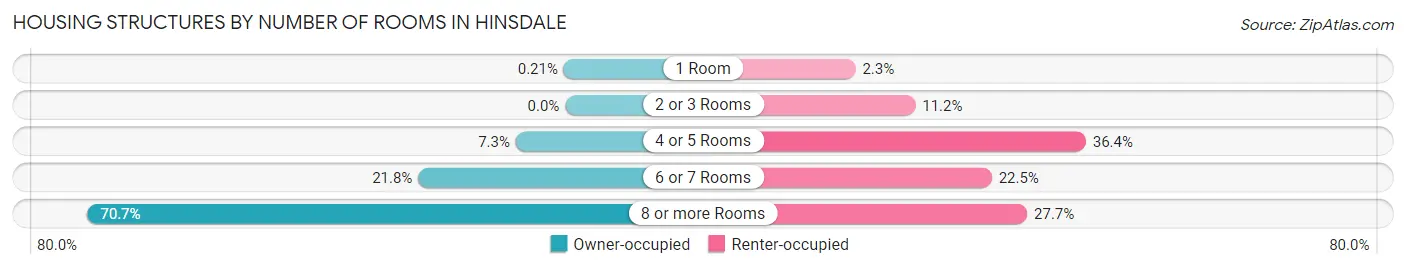
| Number of Rooms | Owner-occupied | Renter-occupied |
| 1 Room | 11 (0.2%) | 14 (2.3%) |
| 2 or 3 Rooms | 0 (0.0%) | 68 (11.2%) |
| 4 or 5 Rooms | 376 (7.3%) | 222 (36.4%) |
| 6 or 7 Rooms | 1,117 (21.8%) | 137 (22.5%) |
| 8 or more Rooms | 3,630 (70.7%) | 169 (27.7%) |
| Total | 5,134 (100.0%) | 610 (100.0%) |
Housing Structure by Heating Type in Hinsdale
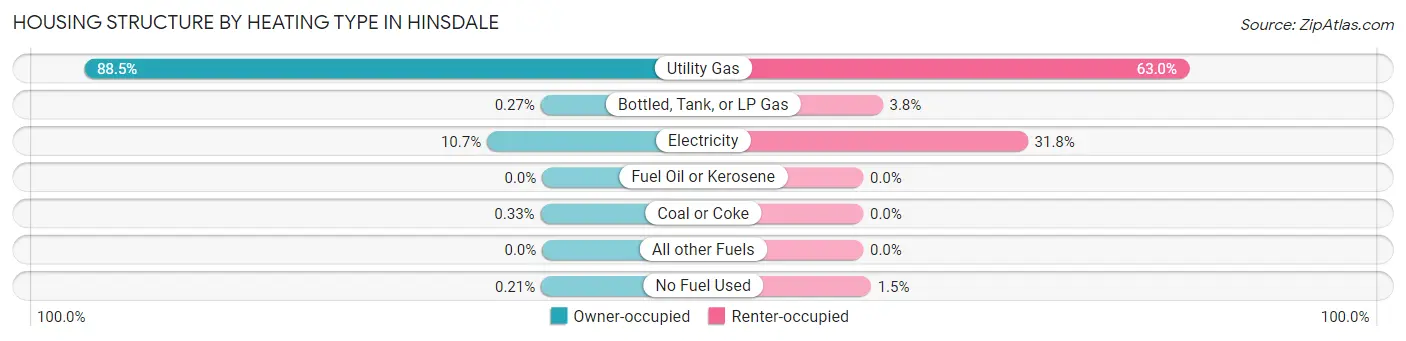
| Heating Type | Owner-occupied | Renter-occupied |
| Utility Gas | 4,545 (88.5%) | 384 (62.9%) |
| Bottled, Tank, or LP Gas | 14 (0.3%) | 23 (3.8%) |
| Electricity | 547 (10.6%) | 194 (31.8%) |
| Fuel Oil or Kerosene | 0 (0.0%) | 0 (0.0%) |
| Coal or Coke | 17 (0.3%) | 0 (0.0%) |
| All other Fuels | 0 (0.0%) | 0 (0.0%) |
| No Fuel Used | 11 (0.2%) | 9 (1.5%) |
| Total | 5,134 (100.0%) | 610 (100.0%) |
Household Vehicle Usage in Hinsdale
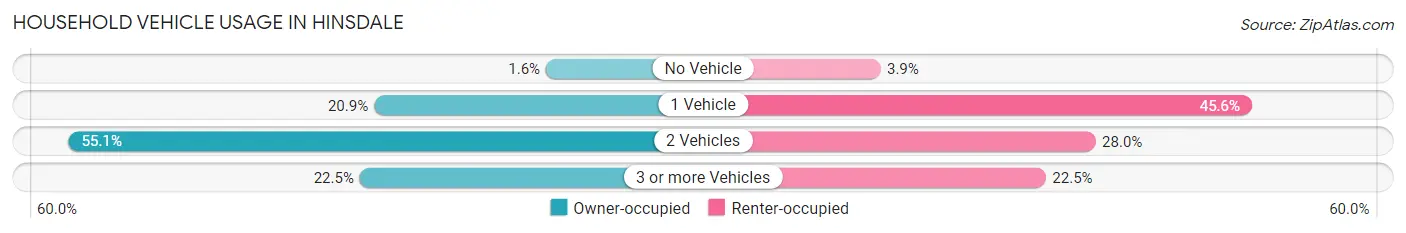
| Vehicles per Household | Owner-occupied | Renter-occupied |
| No Vehicle | 82 (1.6%) | 24 (3.9%) |
| 1 Vehicle | 1,071 (20.9%) | 278 (45.6%) |
| 2 Vehicles | 2,828 (55.1%) | 171 (28.0%) |
| 3 or more Vehicles | 1,153 (22.5%) | 137 (22.5%) |
| Total | 5,134 (100.0%) | 610 (100.0%) |
Real Estate & Mortgages in Hinsdale
Real Estate and Mortgage Overview in Hinsdale
| Characteristic | Without Mortgage | With Mortgage |
| Housing Units | 1,839 | 3,295 |
| Median Property Value | $914,500 | $977,100 |
| Median Household Income | $179,861 | $2,641 |
| Monthly Housing Costs | $1,501 | $2,781 |
| Real Estate Taxes | $10,001 | $11 |
Property Value by Mortgage Status in Hinsdale
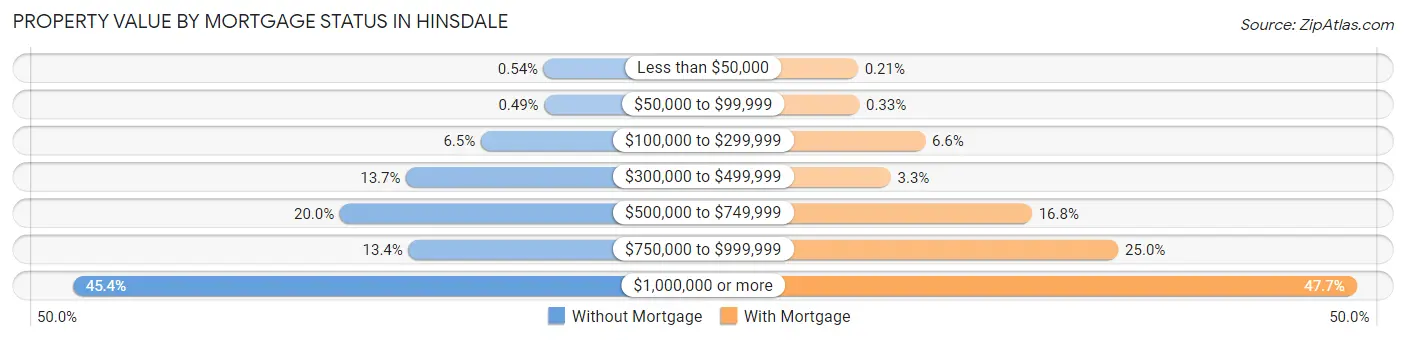
| Property Value | Without Mortgage | With Mortgage |
| Less than $50,000 | 10 (0.5%) | 7 (0.2%) |
| $50,000 to $99,999 | 9 (0.5%) | 11 (0.3%) |
| $100,000 to $299,999 | 120 (6.5%) | 218 (6.6%) |
| $300,000 to $499,999 | 251 (13.7%) | 110 (3.3%) |
| $500,000 to $749,999 | 367 (20.0%) | 553 (16.8%) |
| $750,000 to $999,999 | 247 (13.4%) | 824 (25.0%) |
| $1,000,000 or more | 835 (45.4%) | 1,572 (47.7%) |
| Total | 1,839 (100.0%) | 3,295 (100.0%) |
Household Income by Mortgage Status in Hinsdale
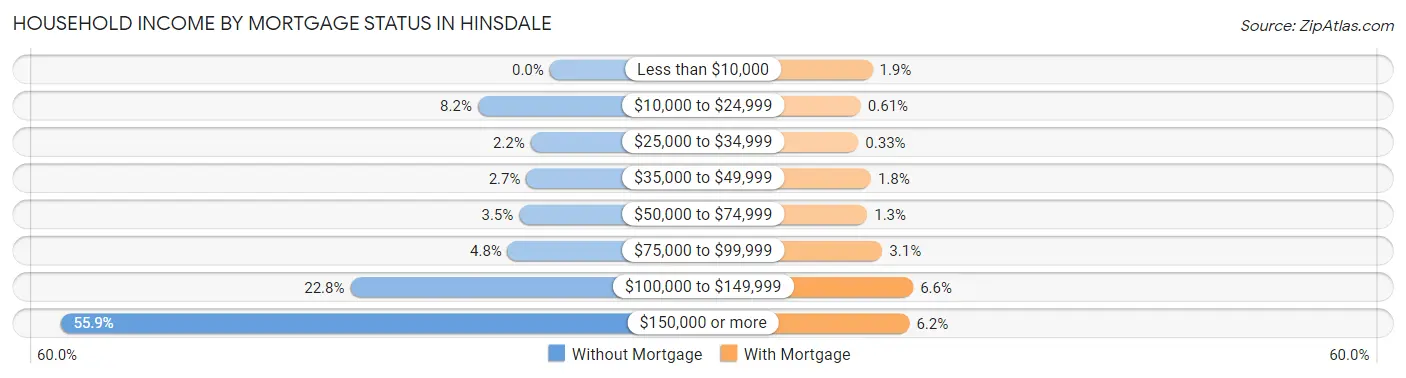
| Household Income | Without Mortgage | With Mortgage |
| Less than $10,000 | 0 (0.0%) | 64 (1.9%) |
| $10,000 to $24,999 | 151 (8.2%) | 20 (0.6%) |
| $25,000 to $34,999 | 40 (2.2%) | 11 (0.3%) |
| $35,000 to $49,999 | 49 (2.7%) | 58 (1.8%) |
| $50,000 to $74,999 | 64 (3.5%) | 44 (1.3%) |
| $75,000 to $99,999 | 88 (4.8%) | 101 (3.1%) |
| $100,000 to $149,999 | 419 (22.8%) | 217 (6.6%) |
| $150,000 or more | 1,028 (55.9%) | 203 (6.2%) |
| Total | 1,839 (100.0%) | 3,295 (100.0%) |
Property Value to Household Income Ratio in Hinsdale
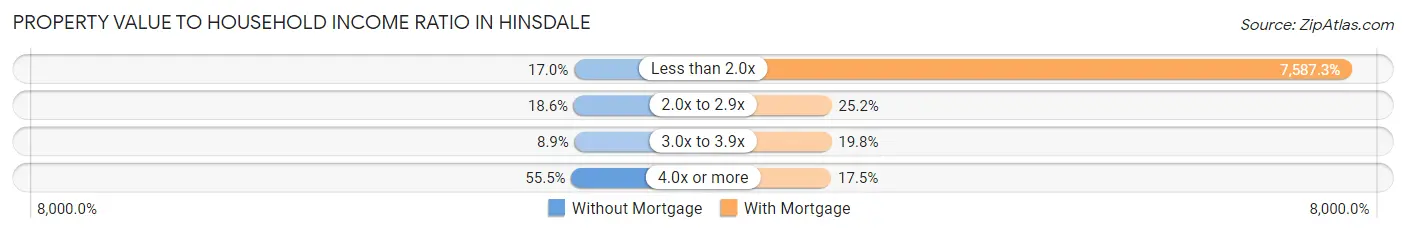
| Value-to-Income Ratio | Without Mortgage | With Mortgage |
| Less than 2.0x | 312 (17.0%) | 250,001 (7,587.3%) |
| 2.0x to 2.9x | 342 (18.6%) | 831 (25.2%) |
| 3.0x to 3.9x | 164 (8.9%) | 653 (19.8%) |
| 4.0x or more | 1,021 (55.5%) | 578 (17.5%) |
| Total | 1,839 (100.0%) | 3,295 (100.0%) |
Real Estate Taxes by Mortgage Status in Hinsdale
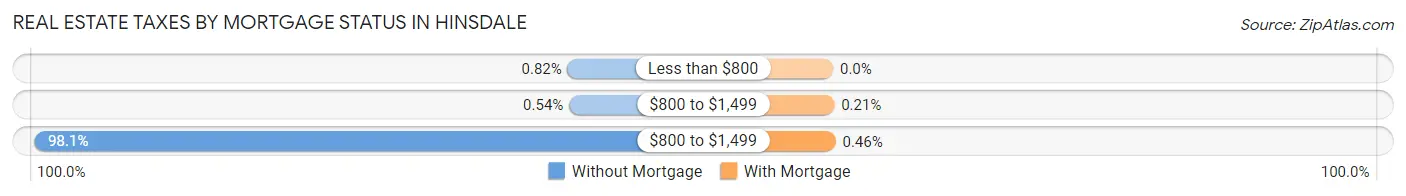
| Property Taxes | Without Mortgage | With Mortgage |
| Less than $800 | 15 (0.8%) | 0 (0.0%) |
| $800 to $1,499 | 10 (0.5%) | 7 (0.2%) |
| $800 to $1,499 | 1,804 (98.1%) | 15 (0.5%) |
| Total | 1,839 (100.0%) | 3,295 (100.0%) |
Health & Disability in Hinsdale
Health Insurance Coverage by Age in Hinsdale
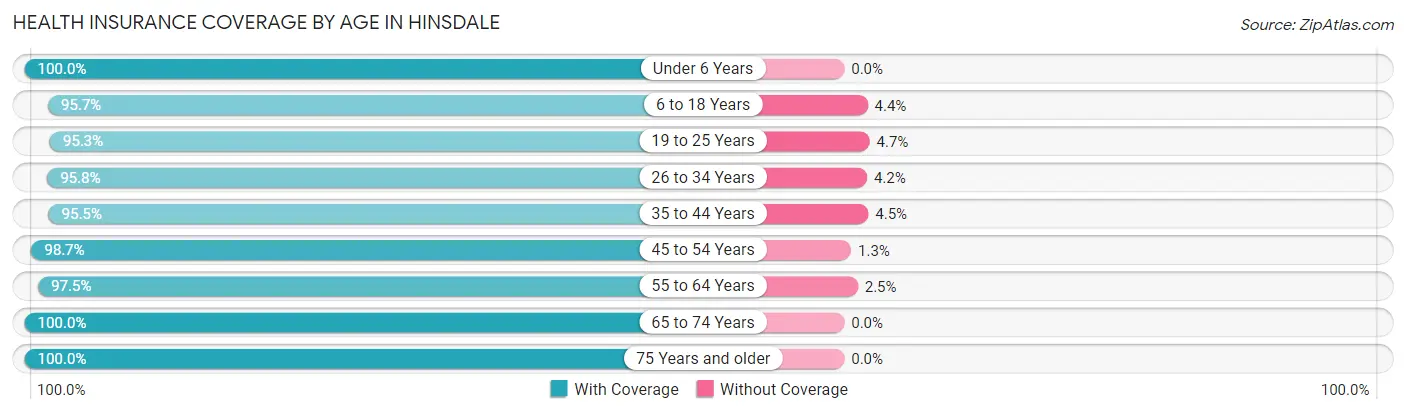
| Age Bracket | With Coverage | Without Coverage |
| Under 6 Years | 1,322 (100.0%) | 0 (0.0%) |
| 6 to 18 Years | 4,159 (95.7%) | 189 (4.3%) |
| 19 to 25 Years | 484 (95.3%) | 24 (4.7%) |
| 26 to 34 Years | 793 (95.8%) | 35 (4.2%) |
| 35 to 44 Years | 2,284 (95.5%) | 107 (4.5%) |
| 45 to 54 Years | 2,947 (98.7%) | 38 (1.3%) |
| 55 to 64 Years | 2,092 (97.5%) | 54 (2.5%) |
| 65 to 74 Years | 1,354 (100.0%) | 0 (0.0%) |
| 75 Years and older | 1,034 (100.0%) | 0 (0.0%) |
| Total | 16,469 (97.4%) | 447 (2.6%) |
Health Insurance Coverage by Citizenship Status in Hinsdale
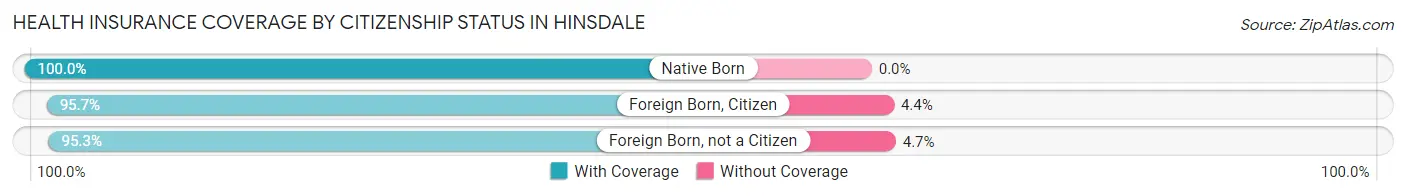
| Citizenship Status | With Coverage | Without Coverage |
| Native Born | 1,322 (100.0%) | 0 (0.0%) |
| Foreign Born, Citizen | 4,159 (95.7%) | 189 (4.3%) |
| Foreign Born, not a Citizen | 484 (95.3%) | 24 (4.7%) |
Health Insurance Coverage by Household Income in Hinsdale
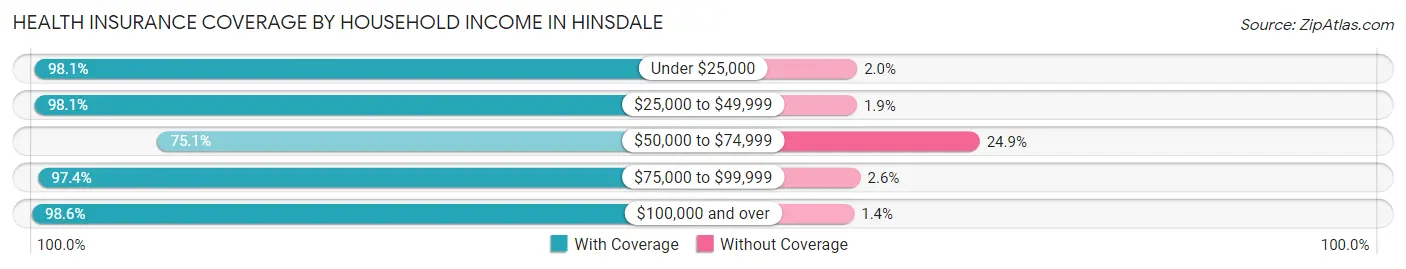
| Household Income | With Coverage | Without Coverage |
| Under $25,000 | 352 (98.1%) | 7 (1.9%) |
| $25,000 to $49,999 | 414 (98.1%) | 8 (1.9%) |
| $50,000 to $74,999 | 627 (75.1%) | 208 (24.9%) |
| $75,000 to $99,999 | 902 (97.4%) | 24 (2.6%) |
| $100,000 and over | 14,115 (98.6%) | 200 (1.4%) |
Public vs Private Health Insurance Coverage by Age in Hinsdale
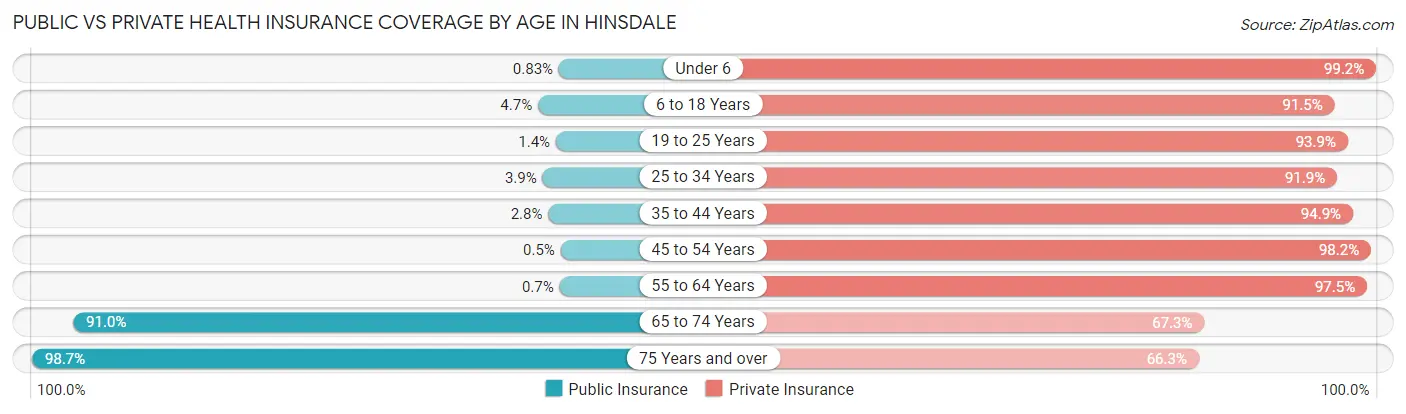
| Age Bracket | Public Insurance | Private Insurance |
| Under 6 | 11 (0.8%) | 1,311 (99.2%) |
| 6 to 18 Years | 205 (4.7%) | 3,977 (91.5%) |
| 19 to 25 Years | 7 (1.4%) | 477 (93.9%) |
| 25 to 34 Years | 32 (3.9%) | 761 (91.9%) |
| 35 to 44 Years | 67 (2.8%) | 2,268 (94.9%) |
| 45 to 54 Years | 15 (0.5%) | 2,932 (98.2%) |
| 55 to 64 Years | 15 (0.7%) | 2,092 (97.5%) |
| 65 to 74 Years | 1,232 (91.0%) | 911 (67.3%) |
| 75 Years and over | 1,020 (98.7%) | 685 (66.2%) |
| Total | 2,604 (15.4%) | 15,414 (91.1%) |
Disability Status by Sex by Age in Hinsdale
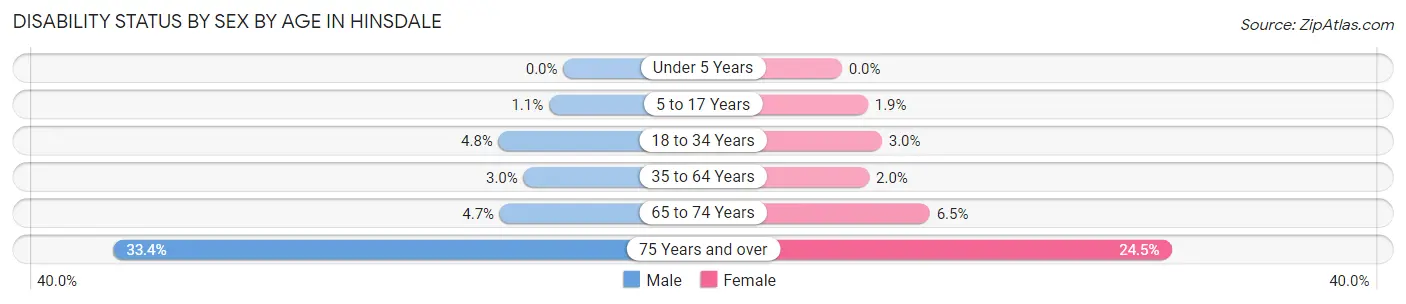
| Age Bracket | Male | Female |
| Under 5 Years | 0 (0.0%) | 0 (0.0%) |
| 5 to 17 Years | 25 (1.1%) | 40 (1.9%) |
| 18 to 34 Years | 34 (4.8%) | 24 (3.0%) |
| 35 to 64 Years | 111 (2.9%) | 76 (2.0%) |
| 65 to 74 Years | 32 (4.7%) | 44 (6.5%) |
| 75 Years and over | 146 (33.4%) | 146 (24.5%) |
Disability Class by Sex by Age in Hinsdale
Disability Class: Hearing Difficulty
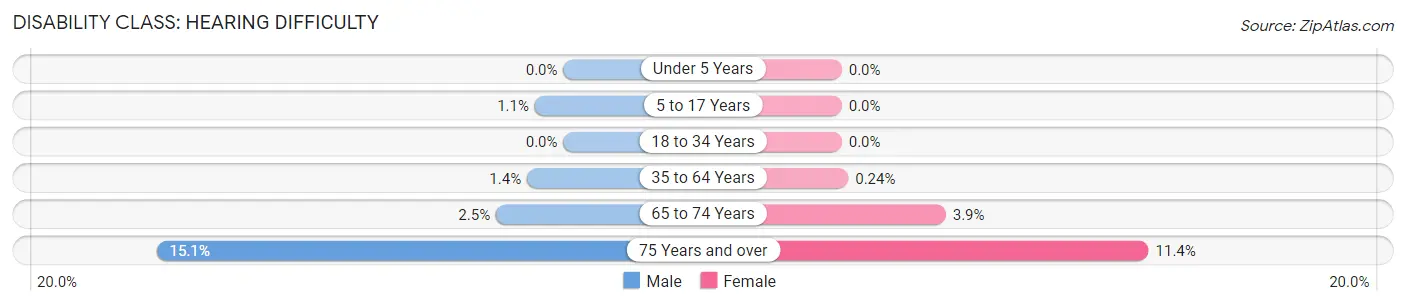
| Age Bracket | Male | Female |
| Under 5 Years | 0 (0.0%) | 0 (0.0%) |
| 5 to 17 Years | 25 (1.1%) | 0 (0.0%) |
| 18 to 34 Years | 0 (0.0%) | 0 (0.0%) |
| 35 to 64 Years | 51 (1.3%) | 9 (0.2%) |
| 65 to 74 Years | 17 (2.5%) | 26 (3.9%) |
| 75 Years and over | 66 (15.1%) | 68 (11.4%) |
Disability Class: Vision Difficulty
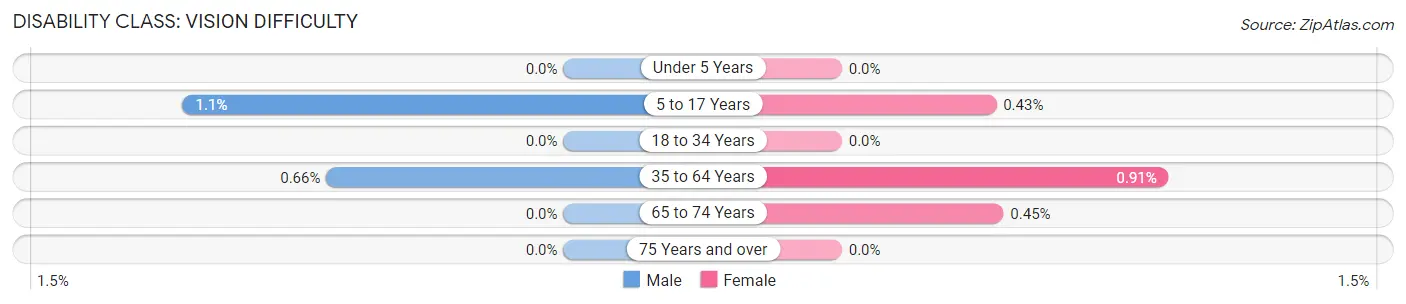
| Age Bracket | Male | Female |
| Under 5 Years | 0 (0.0%) | 0 (0.0%) |
| 5 to 17 Years | 25 (1.1%) | 9 (0.4%) |
| 18 to 34 Years | 0 (0.0%) | 0 (0.0%) |
| 35 to 64 Years | 25 (0.7%) | 34 (0.9%) |
| 65 to 74 Years | 0 (0.0%) | 3 (0.4%) |
| 75 Years and over | 0 (0.0%) | 0 (0.0%) |
Disability Class: Cognitive Difficulty
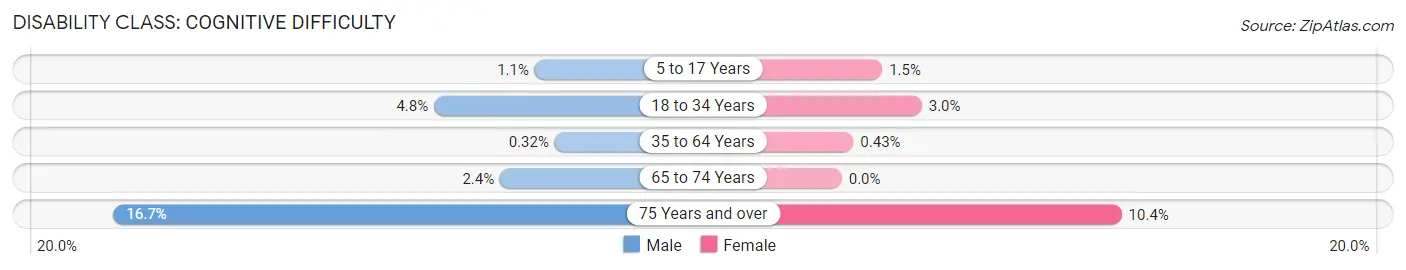
| Age Bracket | Male | Female |
| 5 to 17 Years | 25 (1.1%) | 31 (1.5%) |
| 18 to 34 Years | 34 (4.8%) | 24 (3.0%) |
| 35 to 64 Years | 12 (0.3%) | 16 (0.4%) |
| 65 to 74 Years | 16 (2.4%) | 0 (0.0%) |
| 75 Years and over | 73 (16.7%) | 62 (10.4%) |
Disability Class: Ambulatory Difficulty
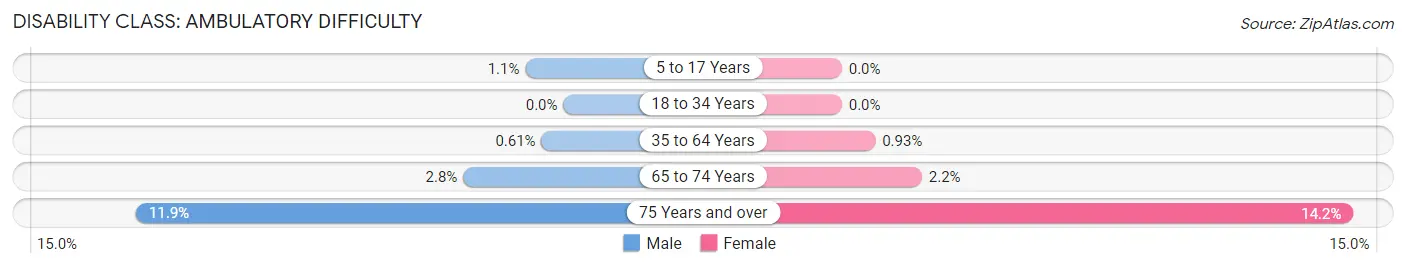
| Age Bracket | Male | Female |
| 5 to 17 Years | 25 (1.1%) | 0 (0.0%) |
| 18 to 34 Years | 0 (0.0%) | 0 (0.0%) |
| 35 to 64 Years | 23 (0.6%) | 35 (0.9%) |
| 65 to 74 Years | 19 (2.8%) | 15 (2.2%) |
| 75 Years and over | 52 (11.9%) | 85 (14.2%) |
Disability Class: Self-Care Difficulty
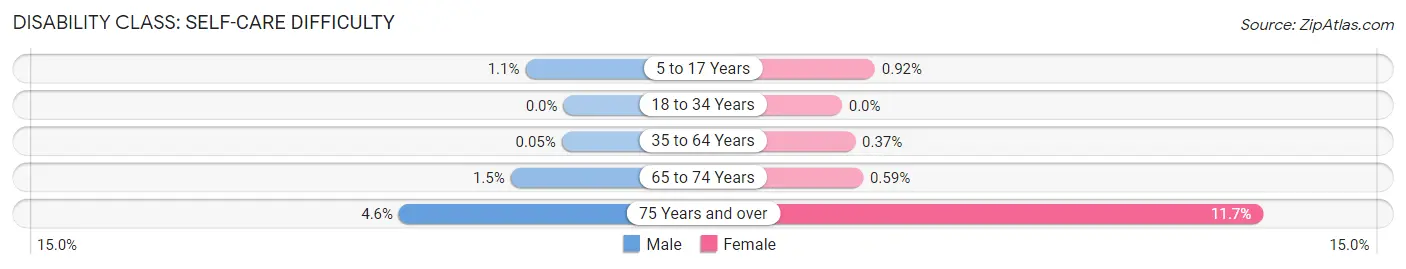
| Age Bracket | Male | Female |
| 5 to 17 Years | 25 (1.1%) | 19 (0.9%) |
| 18 to 34 Years | 0 (0.0%) | 0 (0.0%) |
| 35 to 64 Years | 2 (0.1%) | 14 (0.4%) |
| 65 to 74 Years | 10 (1.5%) | 4 (0.6%) |
| 75 Years and over | 20 (4.6%) | 70 (11.7%) |
Technology Access in Hinsdale
Computing Device Access in Hinsdale
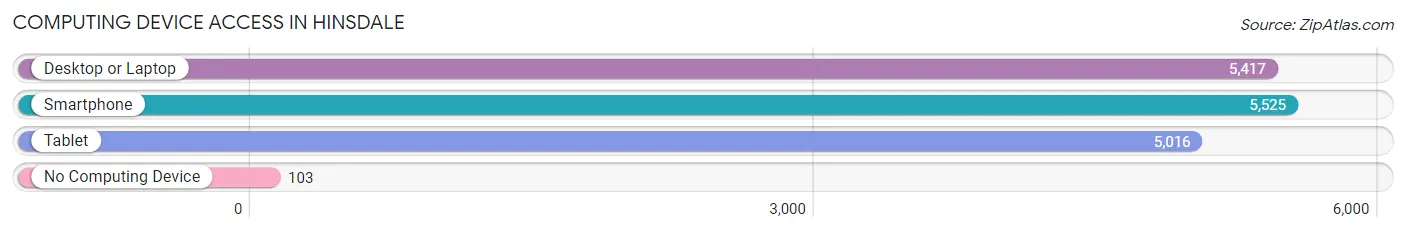
| Device Type | # Households | % Households |
| Desktop or Laptop | 5,417 | 94.3% |
| Smartphone | 5,525 | 96.2% |
| Tablet | 5,016 | 87.3% |
| No Computing Device | 103 | 1.8% |
| Total | 5,744 | 100.0% |
Internet Access in Hinsdale
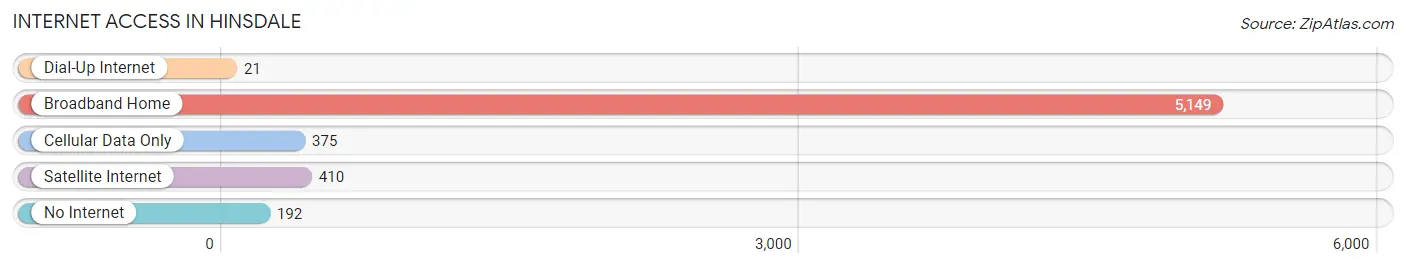
| Internet Type | # Households | % Households |
| Dial-Up Internet | 21 | 0.4% |
| Broadband Home | 5,149 | 89.6% |
| Cellular Data Only | 375 | 6.5% |
| Satellite Internet | 410 | 7.1% |
| No Internet | 192 | 3.3% |
| Total | 5,744 | 100.0% |
Hinsdale Summary
Hinsdale, Illinois is a village located in DuPage and Cook counties in the state of Illinois. It is a western suburb of Chicago and is located approximately 25 miles from the city. The village has a population of 16,816 as of the 2010 census.
History
Hinsdale was first settled in 1834 by William and Jane Gray. The village was originally known as Hinsdale Station and was named after Sylvester Hinsdale, a local landowner. The village was incorporated in 1873 and was the first village in DuPage County to incorporate.
Geography
Hinsdale is located at 41°47'17" North, 87°57'51" West (41.7881, -87.9643). The village has a total area of 5.2 square miles, all of which is land. The village is located in the Chicago metropolitan area and is bordered by the villages of Oak Brook, Clarendon Hills, Burr Ridge, and Willowbrook.
Economy
Hinsdale is a wealthy suburb of Chicago and has a strong economy. The village is home to many corporate headquarters, including Ace Hardware, Grainger, and McDonald's. The village also has a strong retail sector, with many upscale stores and restaurants located in the downtown area.
Demographics
As of the 2010 census, Hinsdale had a population of 16,816. The racial makeup of the village was 90.2% White, 1.2% African American, 0.1% Native American, 6.7% Asian, 0.1% Pacific Islander, 0.7% from other races, and 1.1% from two or more races. Hispanic or Latino of any race were 3.2% of the population.
The median income for a household in the village was $150,853, and the median income for a family was $179,853. The per capita income for the village was $77,853. About 1.2% of families and 2.2% of the population were below the poverty line, including 1.7% of those under age 18 and 2.2% of those age 65 or over.
Common Questions
What is Per Capita Income in Hinsdale?
Per Capita income in Hinsdale is $128,458.
What is the Median Family Income in Hinsdale?
Median Family Income in Hinsdale is $250,001.
What is the Median Household income in Hinsdale?
Median Household Income in Hinsdale is $250,001.
What is Income or Wage Gap in Hinsdale?
Income or Wage Gap in Hinsdale is 73.0%.
Women in Hinsdale earn 27.0 cents for every dollar earned by a man.
What is Inequality or Gini Index in Hinsdale?
Inequality or Gini Index in Hinsdale is 0.50.
What is the Total Population of Hinsdale?
Total Population of Hinsdale is 17,169.
What is the Total Male Population of Hinsdale?
Total Male Population of Hinsdale is 8,640.
What is the Total Female Population of Hinsdale?
Total Female Population of Hinsdale is 8,529.
What is the Ratio of Males per 100 Females in Hinsdale?
There are 101.30 Males per 100 Females in Hinsdale.
What is the Ratio of Females per 100 Males in Hinsdale?
There are 98.72 Females per 100 Males in Hinsdale.
What is the Median Population Age in Hinsdale?
Median Population Age in Hinsdale is 42.3 Years.
What is the Average Family Size in Hinsdale
Average Family Size in Hinsdale is 3.3 People.
What is the Average Household Size in Hinsdale
Average Household Size in Hinsdale is 2.9 People.
How Large is the Labor Force in Hinsdale?
There are 7,752 People in the Labor Forcein in Hinsdale.
What is the Percentage of People in the Labor Force in Hinsdale?
63.2% of People are in the Labor Force in Hinsdale.
What is the Unemployment Rate in Hinsdale?
Unemployment Rate in Hinsdale is 2.6%.