Highland Park, IL Map & Demographics
Highland Park Map
Highland Park Overview
$97,953
PER CAPITA INCOME
$208,419
AVG FAMILY INCOME
$159,567
AVG HOUSEHOLD INCOME
47.5%
WAGE / INCOME GAP [ % ]
52.5¢/ $1
WAGE / INCOME GAP [ $ ]
0.52
INEQUALITY / GINI INDEX
30,209
TOTAL POPULATION
14,629
MALE POPULATION
15,580
FEMALE POPULATION
93.90
MALES / 100 FEMALES
106.50
FEMALES / 100 MALES
48.0
MEDIAN AGE
3.0
AVG FAMILY SIZE
2.5
AVG HOUSEHOLD SIZE
15,470
LABOR FORCE [ PEOPLE ]
64.8%
PERCENT IN LABOR FORCE
3.4%
UNEMPLOYMENT RATE
Highland Park Zip Codes
Income in Highland Park
Income Overview in Highland Park
Per Capita Income in Highland Park is $97,953, while median incomes of families and households are $208,419 and $159,567 respectively.
| Characteristic | Number | Measure |
| Per Capita Income | 30,209 | $97,953 |
| Median Family Income | 8,721 | $208,419 |
| Mean Family Income | 8,721 | $298,817 |
| Median Household Income | 12,095 | $159,567 |
| Mean Household Income | 12,095 | $242,218 |
| Income Deficit | 8,721 | $0 |
| Wage / Income Gap (%) | 30,209 | 47.52% |
| Wage / Income Gap ($) | 30,209 | 52.48¢ per $1 |
| Gini / Inequality Index | 30,209 | 0.52 |
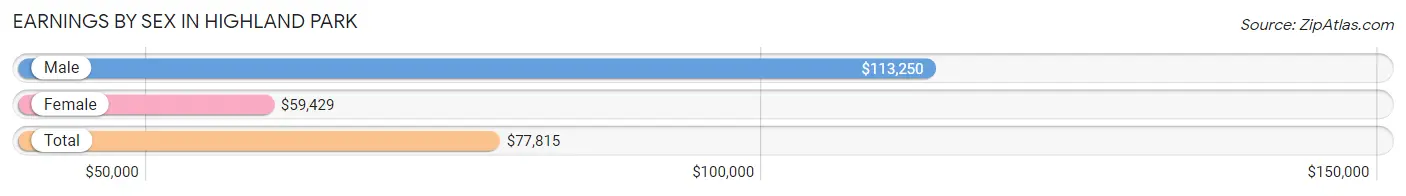
Earnings by Sex in Highland Park
Average Earnings in Highland Park are $77,815, $113,250 for men and $59,429 for women, a difference of 47.5%.
| Sex | Number | Average Earnings |
| Male | 8,916 (54.5%) | $113,250 |
| Female | 7,437 (45.5%) | $59,429 |
| Total | 16,353 (100.0%) | $77,815 |
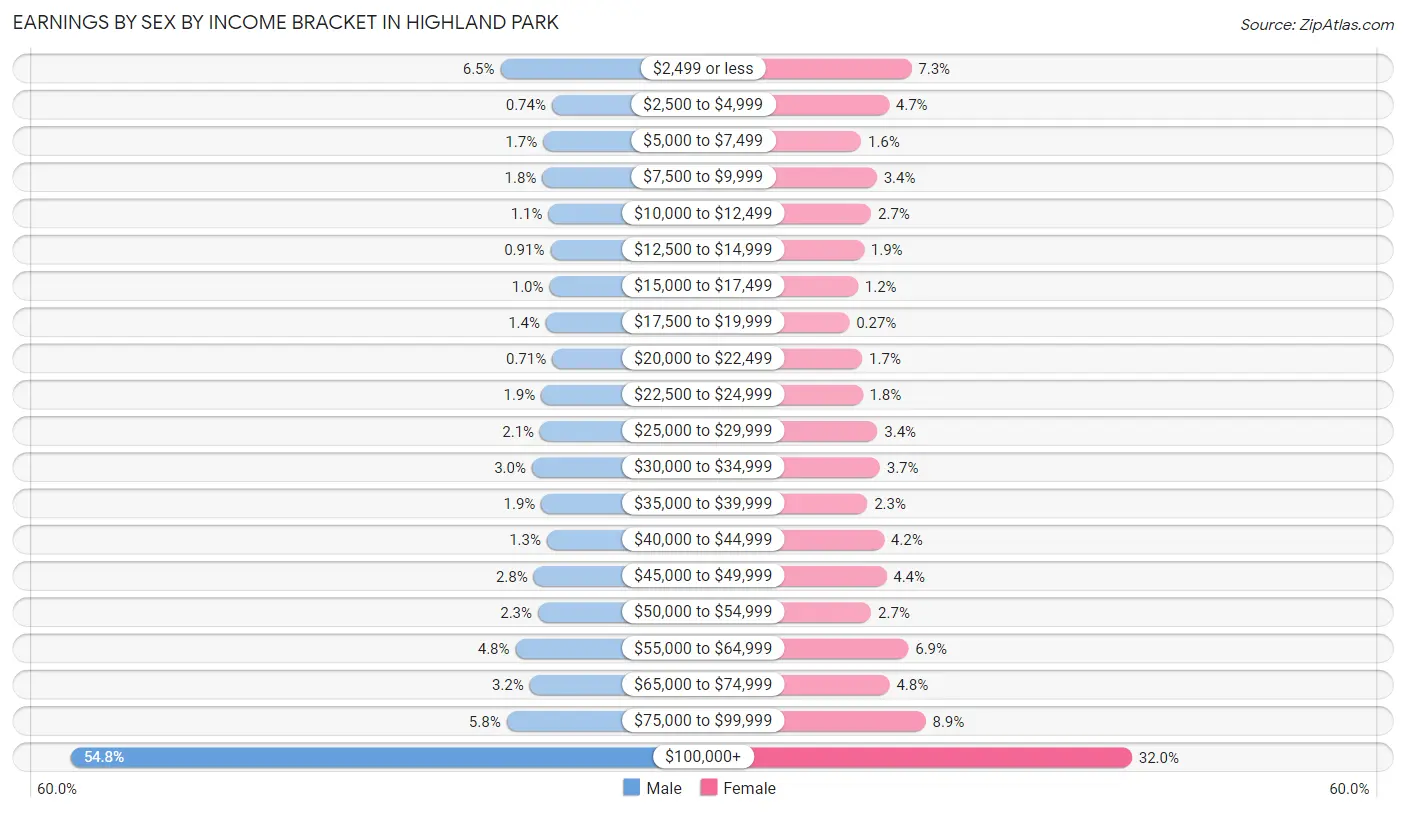
Earnings by Sex by Income Bracket in Highland Park
The most common earnings brackets in Highland Park are $100,000+ for men (4,887 | 54.8%) and $100,000+ for women (2,383 | 32.0%).
| Income | Male | Female |
| $2,499 or less | 581 (6.5%) | 540 (7.3%) |
| $2,500 to $4,999 | 66 (0.7%) | 352 (4.7%) |
| $5,000 to $7,499 | 154 (1.7%) | 119 (1.6%) |
| $7,500 to $9,999 | 161 (1.8%) | 250 (3.4%) |
| $10,000 to $12,499 | 101 (1.1%) | 203 (2.7%) |
| $12,500 to $14,999 | 81 (0.9%) | 143 (1.9%) |
| $15,000 to $17,499 | 90 (1.0%) | 92 (1.2%) |
| $17,500 to $19,999 | 126 (1.4%) | 20 (0.3%) |
| $20,000 to $22,499 | 63 (0.7%) | 129 (1.7%) |
| $22,500 to $24,999 | 173 (1.9%) | 131 (1.8%) |
| $25,000 to $29,999 | 185 (2.1%) | 255 (3.4%) |
| $30,000 to $34,999 | 266 (3.0%) | 276 (3.7%) |
| $35,000 to $39,999 | 172 (1.9%) | 171 (2.3%) |
| $40,000 to $44,999 | 116 (1.3%) | 310 (4.2%) |
| $45,000 to $49,999 | 249 (2.8%) | 330 (4.4%) |
| $50,000 to $54,999 | 205 (2.3%) | 204 (2.7%) |
| $55,000 to $64,999 | 431 (4.8%) | 514 (6.9%) |
| $65,000 to $74,999 | 289 (3.2%) | 357 (4.8%) |
| $75,000 to $99,999 | 520 (5.8%) | 658 (8.8%) |
| $100,000+ | 4,887 (54.8%) | 2,383 (32.0%) |
| Total | 8,916 (100.0%) | 7,437 (100.0%) |
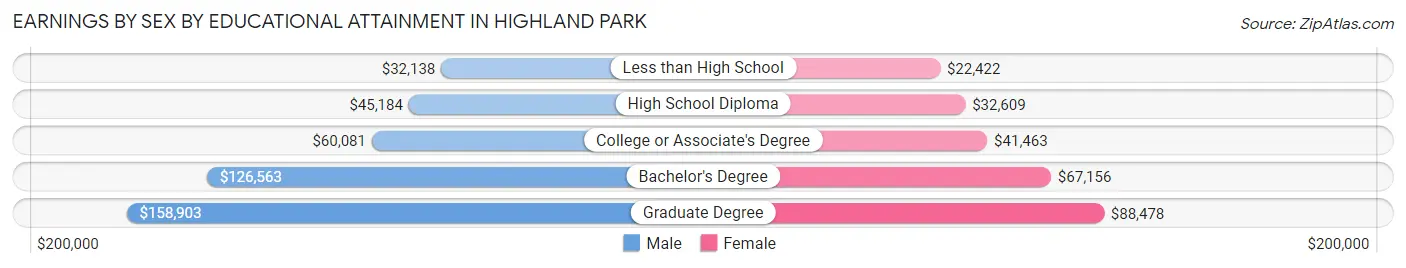
Earnings by Sex by Educational Attainment in Highland Park
Average earnings in Highland Park are $124,264 for men and $66,029 for women, a difference of 46.9%. Men with an educational attainment of graduate degree enjoy the highest average annual earnings of $158,903, while those with less than high school education earn the least with $32,138. Women with an educational attainment of graduate degree earn the most with the average annual earnings of $88,478, while those with less than high school education have the smallest earnings of $22,422.
| Educational Attainment | Male Income | Female Income |
| Less than High School | $32,138 | $22,422 |
| High School Diploma | $45,184 | $32,609 |
| College or Associate's Degree | $60,081 | $41,463 |
| Bachelor's Degree | $126,563 | $67,156 |
| Graduate Degree | $158,903 | $88,478 |
| Total | $124,264 | $66,029 |
Family Income in Highland Park
Family Income Brackets in Highland Park
According to the Highland Park family income data, there are 4,509 families falling into the $200,000+ income range, which is the most common income bracket and makes up 51.7% of all families. Conversely, the $10,000 to $14,999 income bracket is the least frequent group with only 9 families (0.1%) belonging to this category.
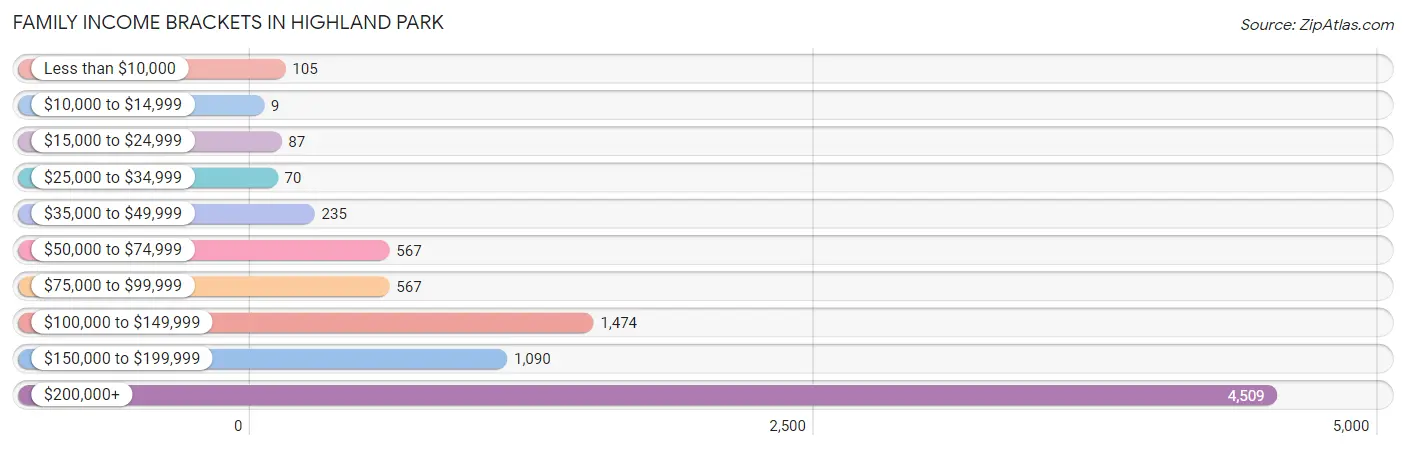
| Income Bracket | # Families | % Families |
| Less than $10,000 | 105 | 1.2% |
| $10,000 to $14,999 | 9 | 0.1% |
| $15,000 to $24,999 | 87 | 1.0% |
| $25,000 to $34,999 | 70 | 0.8% |
| $35,000 to $49,999 | 235 | 2.7% |
| $50,000 to $74,999 | 567 | 6.5% |
| $75,000 to $99,999 | 567 | 6.5% |
| $100,000 to $149,999 | 1,474 | 16.9% |
| $150,000 to $199,999 | 1,090 | 12.5% |
| $200,000+ | 4,509 | 51.7% |
Family Income by Famaliy Size in Highland Park
4-person families (1,849 | 21.2%) account for the highest median family income in Highland Park with $250,001 per family, while 2-person families (4,398 | 50.4%) have the highest median income of $95,529 per family member.
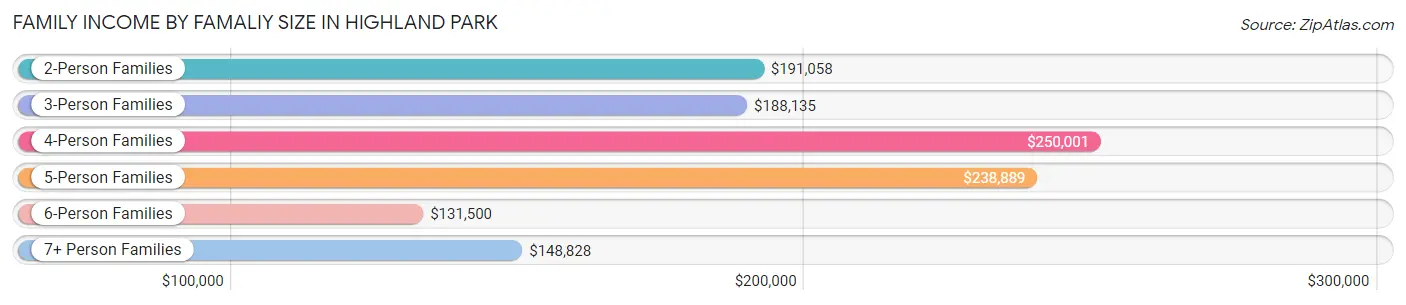
| Income Bracket | # Families | Median Income |
| 2-Person Families | 4,398 (50.4%) | $191,058 |
| 3-Person Families | 1,675 (19.2%) | $188,135 |
| 4-Person Families | 1,849 (21.2%) | $250,001 |
| 5-Person Families | 662 (7.6%) | $238,889 |
| 6-Person Families | 82 (0.9%) | $131,500 |
| 7+ Person Families | 55 (0.6%) | $148,828 |
| Total | 8,721 (100.0%) | $208,419 |
Family Income by Number of Earners in Highland Park
The median family income in Highland Park is $208,419, with families comprising 2 earners (4,531) having the highest median family income of $250,001, while families with no earners (1,052) have the lowest median family income of $137,500, accounting for 52.0% and 12.1% of families, respectively.
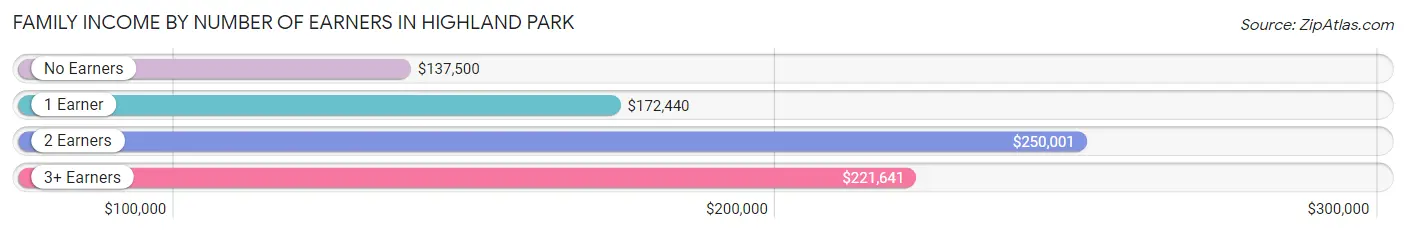
| Number of Earners | # Families | Median Income |
| No Earners | 1,052 (12.1%) | $137,500 |
| 1 Earner | 2,385 (27.4%) | $172,440 |
| 2 Earners | 4,531 (52.0%) | $250,001 |
| 3+ Earners | 753 (8.6%) | $221,641 |
| Total | 8,721 (100.0%) | $208,419 |
Household Income in Highland Park
Household Income Brackets in Highland Park
With 4,898 households falling in the category, the $200,000+ income range is the most frequent in Highland Park, accounting for 40.5% of all households. In contrast, only 181 households (1.5%) fall into the $10,000 to $14,999 income bracket, making it the least populous group.
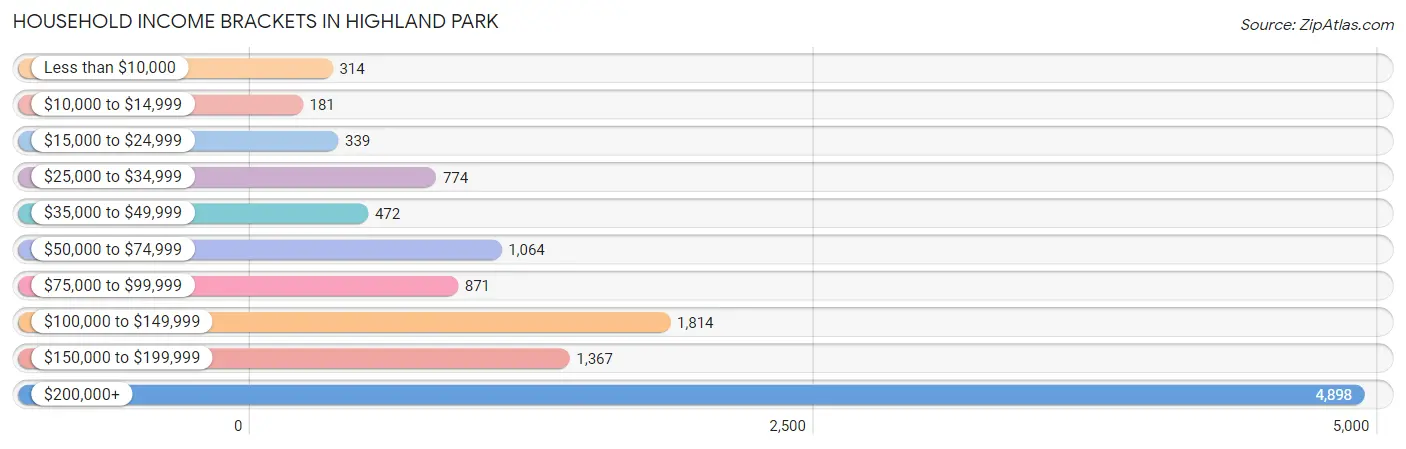
| Income Bracket | # Households | % Households |
| Less than $10,000 | 314 | 2.6% |
| $10,000 to $14,999 | 181 | 1.5% |
| $15,000 to $24,999 | 339 | 2.8% |
| $25,000 to $34,999 | 774 | 6.4% |
| $35,000 to $49,999 | 472 | 3.9% |
| $50,000 to $74,999 | 1,064 | 8.8% |
| $75,000 to $99,999 | 871 | 7.2% |
| $100,000 to $149,999 | 1,814 | 15.0% |
| $150,000 to $199,999 | 1,367 | 11.3% |
| $200,000+ | 4,898 | 40.5% |
Household Income by Householder Age in Highland Park
The median household income in Highland Park is $159,567, with the highest median household income of $189,182 found in the 45 to 64 years age bracket for the primary householder. A total of 4,375 households (36.2%) fall into this category. Meanwhile, the 15 to 24 years age bracket for the primary householder has the lowest median household income of $0, with 78 households (0.6%) in this group.
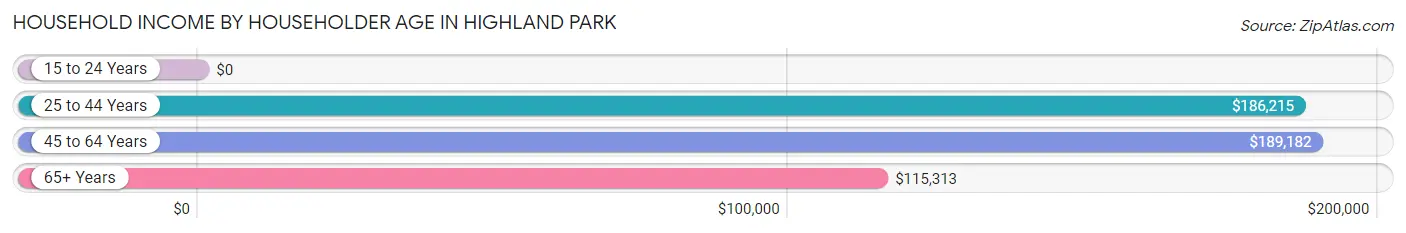
| Income Bracket | # Households | Median Income |
| 15 to 24 Years | 78 (0.6%) | $0 |
| 25 to 44 Years | 2,691 (22.3%) | $186,215 |
| 45 to 64 Years | 4,375 (36.2%) | $189,182 |
| 65+ Years | 4,951 (40.9%) | $115,313 |
| Total | 12,095 (100.0%) | $159,567 |
Poverty in Highland Park
Income Below Poverty by Sex and Age in Highland Park
With 3.2% poverty level for males and 3.6% for females among the residents of Highland Park, 18 to 24 year old males and 18 to 24 year old females are the most vulnerable to poverty, with 75 males (11.4%) and 105 females (15.3%) in their respective age groups living below the poverty level.
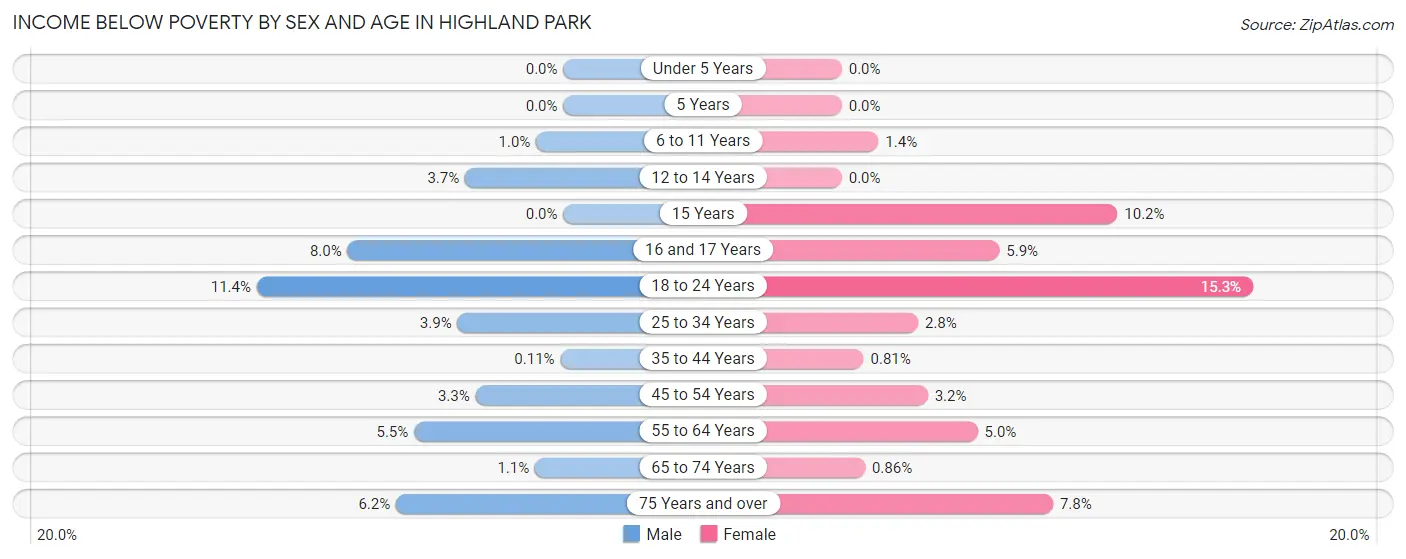
| Age Bracket | Male | Female |
| Under 5 Years | 0 (0.0%) | 0 (0.0%) |
| 5 Years | 0 (0.0%) | 0 (0.0%) |
| 6 to 11 Years | 13 (1.0%) | 16 (1.4%) |
| 12 to 14 Years | 20 (3.6%) | 0 (0.0%) |
| 15 Years | 0 (0.0%) | 22 (10.2%) |
| 16 and 17 Years | 35 (8.0%) | 23 (5.9%) |
| 18 to 24 Years | 75 (11.4%) | 105 (15.3%) |
| 25 to 34 Years | 35 (3.9%) | 29 (2.8%) |
| 35 to 44 Years | 2 (0.1%) | 15 (0.8%) |
| 45 to 54 Years | 57 (3.3%) | 63 (3.2%) |
| 55 to 64 Years | 123 (5.5%) | 121 (5.0%) |
| 65 to 74 Years | 22 (1.1%) | 19 (0.9%) |
| 75 Years and over | 86 (6.2%) | 139 (7.8%) |
| Total | 468 (3.2%) | 552 (3.6%) |
Income Above Poverty by Sex and Age in Highland Park
According to the poverty statistics in Highland Park, males aged under 5 years and females aged under 5 years are the age groups that are most secure financially, with 100.0% of males and 100.0% of females in these age groups living above the poverty line.
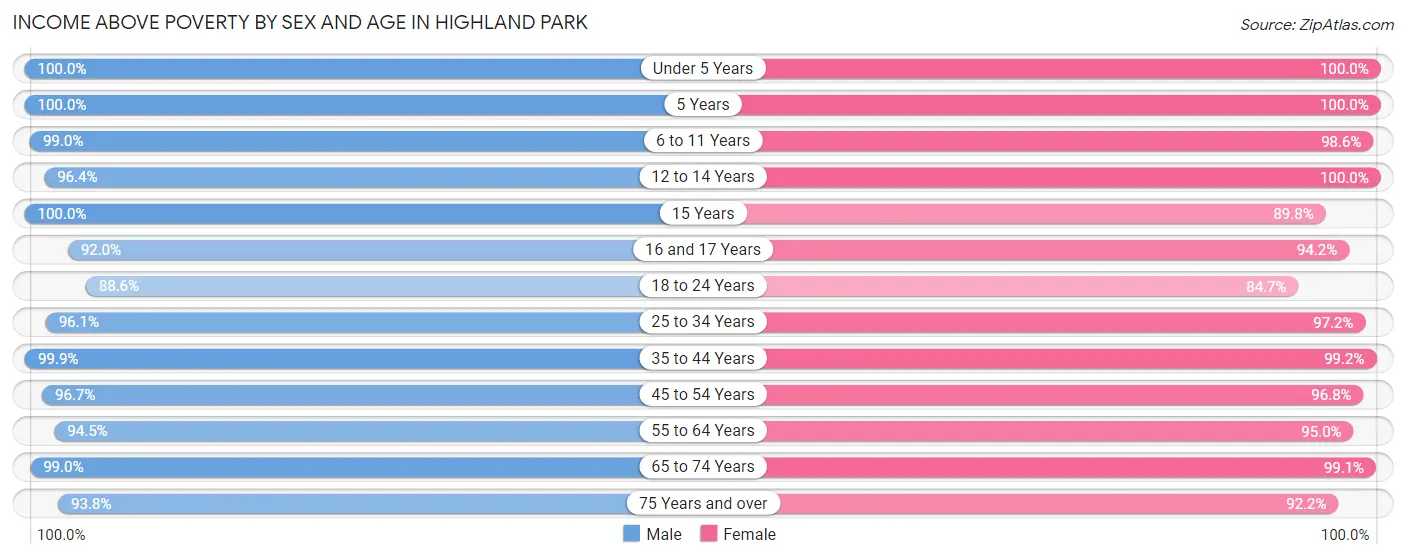
| Age Bracket | Male | Female |
| Under 5 Years | 999 (100.0%) | 874 (100.0%) |
| 5 Years | 220 (100.0%) | 373 (100.0%) |
| 6 to 11 Years | 1,273 (99.0%) | 1,159 (98.6%) |
| 12 to 14 Years | 528 (96.4%) | 493 (100.0%) |
| 15 Years | 147 (100.0%) | 193 (89.8%) |
| 16 and 17 Years | 402 (92.0%) | 370 (94.2%) |
| 18 to 24 Years | 584 (88.6%) | 583 (84.7%) |
| 25 to 34 Years | 856 (96.1%) | 997 (97.2%) |
| 35 to 44 Years | 1,889 (99.9%) | 1,837 (99.2%) |
| 45 to 54 Years | 1,692 (96.7%) | 1,910 (96.8%) |
| 55 to 64 Years | 2,096 (94.5%) | 2,282 (95.0%) |
| 65 to 74 Years | 2,064 (99.0%) | 2,202 (99.1%) |
| 75 Years and over | 1,298 (93.8%) | 1,633 (92.2%) |
| Total | 14,048 (96.8%) | 14,906 (96.4%) |
Income Below Poverty Among Married-Couple Families in Highland Park
The poverty statistics for married-couple families in Highland Park show that 0.6% or 45 of the total 7,842 families live below the poverty line. Families with 3 or 4 children have the highest poverty rate of 2.6%, comprising of 15 families. On the other hand, families with 5 or more children have the lowest poverty rate of 0.0%, which includes 0 families.
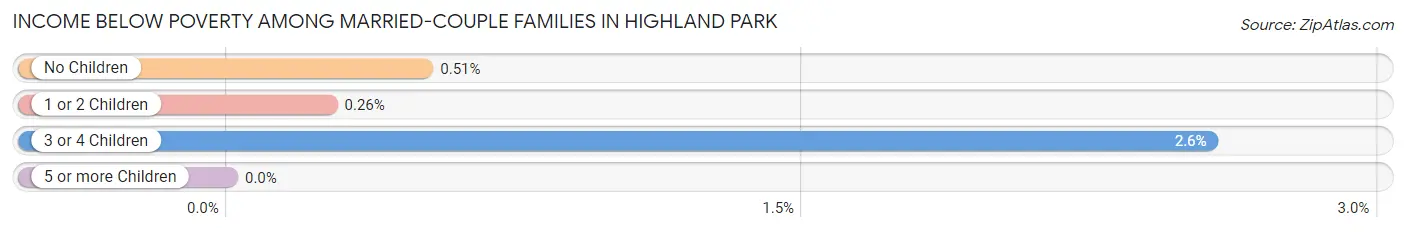
| Children | Above Poverty | Below Poverty |
| No Children | 4,476 (99.5%) | 23 (0.5%) |
| 1 or 2 Children | 2,729 (99.7%) | 7 (0.3%) |
| 3 or 4 Children | 572 (97.4%) | 15 (2.6%) |
| 5 or more Children | 20 (100.0%) | 0 (0.0%) |
| Total | 7,797 (99.4%) | 45 (0.6%) |
Income Below Poverty Among Single-Parent Households in Highland Park
According to the poverty data in Highland Park, 15.7% or 58 single-father households and 5.9% or 30 single-mother households are living below the poverty line. Among single-father households, those with 1 or 2 children have the highest poverty rate, with 37 households (21.6%) experiencing poverty. Likewise, among single-mother households, those with 3 or 4 children have the highest poverty rate, with 5 households (27.8%) falling below the poverty line.
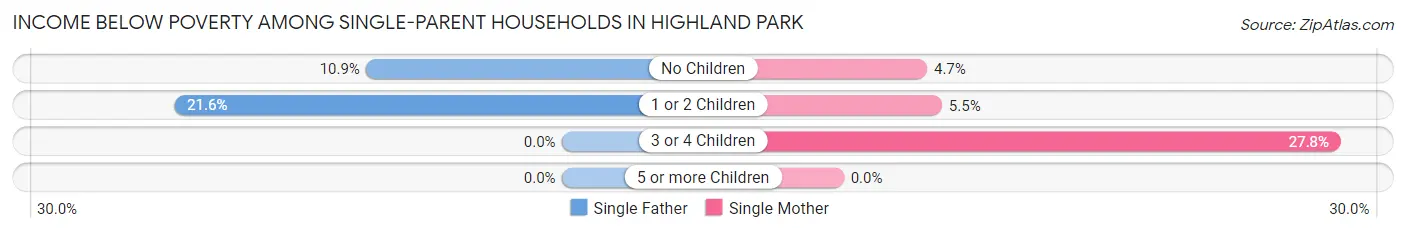
| Children | Single Father | Single Mother |
| No Children | 21 (10.9%) | 11 (4.7%) |
| 1 or 2 Children | 37 (21.6%) | 14 (5.5%) |
| 3 or 4 Children | 0 (0.0%) | 5 (27.8%) |
| 5 or more Children | 0 (0.0%) | 0 (0.0%) |
| Total | 58 (15.7%) | 30 (5.9%) |
Income Below Poverty Among Married-Couple vs Single-Parent Households in Highland Park
The poverty data for Highland Park shows that 45 of the married-couple family households (0.6%) and 88 of the single-parent households (10.0%) are living below the poverty level. Within the married-couple family households, those with 3 or 4 children have the highest poverty rate, with 15 households (2.6%) falling below the poverty line. Among the single-parent households, those with 3 or 4 children have the highest poverty rate, with 5 household (20.0%) living below poverty.
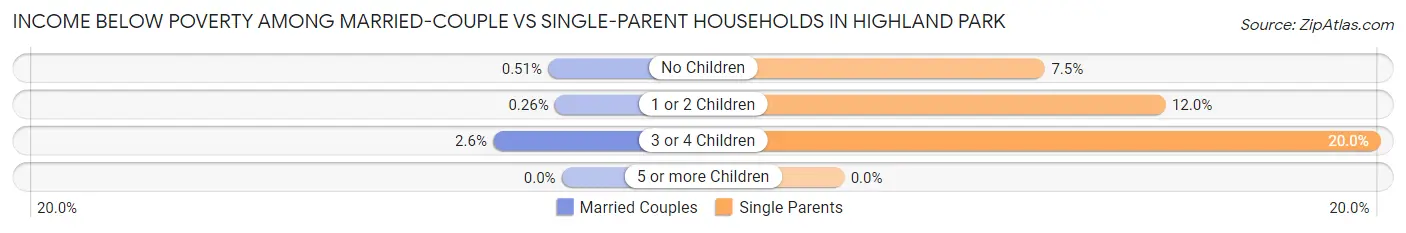
| Children | Married-Couple Families | Single-Parent Households |
| No Children | 23 (0.5%) | 32 (7.5%) |
| 1 or 2 Children | 7 (0.3%) | 51 (12.0%) |
| 3 or 4 Children | 15 (2.6%) | 5 (20.0%) |
| 5 or more Children | 0 (0.0%) | 0 (0.0%) |
| Total | 45 (0.6%) | 88 (10.0%) |
Race in Highland Park
The most populous races in Highland Park are White / Caucasian (26,142 | 86.5%), Hispanic or Latino (3,049 | 10.1%), and Two or more Races (1,925 | 6.4%).
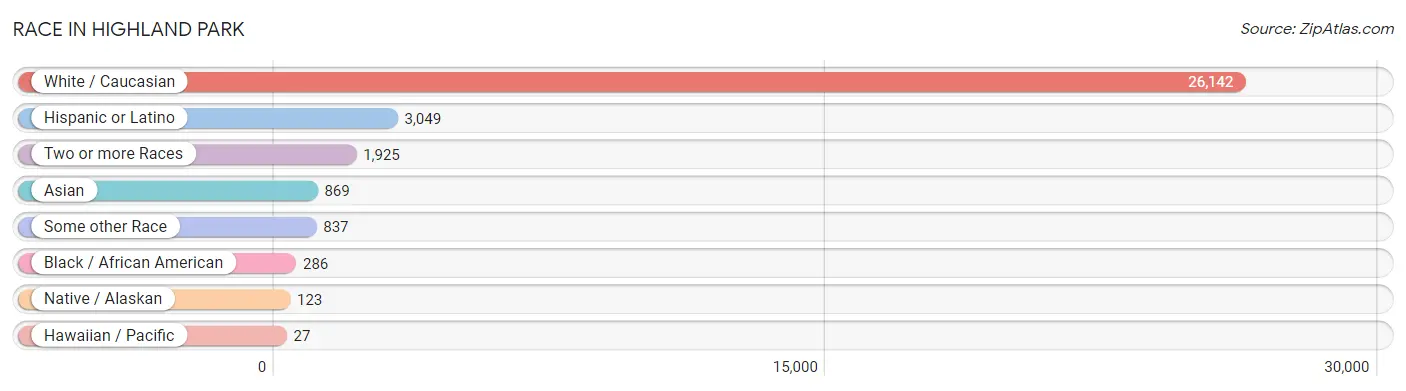
| Race | # Population | % Population |
| Asian | 869 | 2.9% |
| Black / African American | 286 | 0.9% |
| Hawaiian / Pacific | 27 | 0.1% |
| Hispanic or Latino | 3,049 | 10.1% |
| Native / Alaskan | 123 | 0.4% |
| White / Caucasian | 26,142 | 86.5% |
| Two or more Races | 1,925 | 6.4% |
| Some other Race | 837 | 2.8% |
| Total | 30,209 | 100.0% |
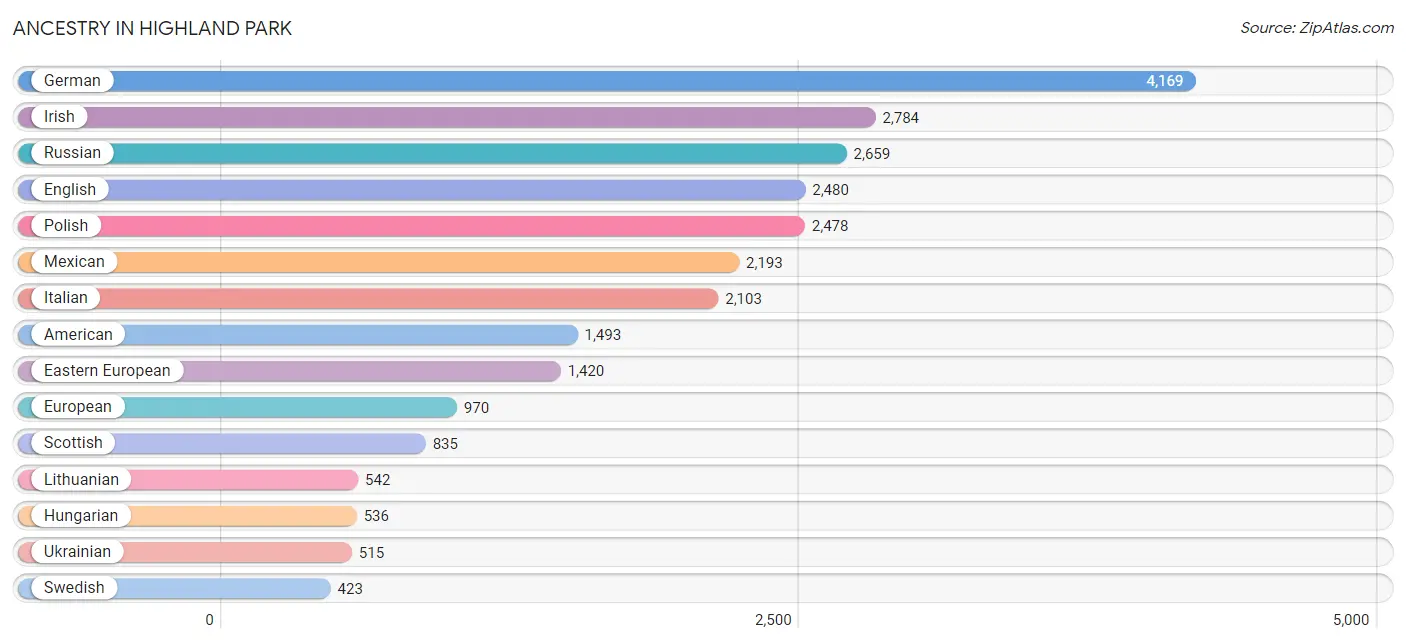
Ancestry in Highland Park
The most populous ancestries reported in Highland Park are German (4,169 | 13.8%), Irish (2,784 | 9.2%), Russian (2,659 | 8.8%), English (2,480 | 8.2%), and Polish (2,478 | 8.2%), together accounting for 48.2% of all Highland Park residents.
| Ancestry | # Population | % Population |
| African | 11 | 0.0% |
| American | 1,493 | 4.9% |
| Arab | 107 | 0.4% |
| Argentinean | 18 | 0.1% |
| Armenian | 44 | 0.2% |
| Assyrian / Chaldean / Syriac | 47 | 0.2% |
| Australian | 11 | 0.0% |
| Austrian | 275 | 0.9% |
| Barbadian | 47 | 0.2% |
| Belgian | 43 | 0.1% |
| Belizean | 15 | 0.1% |
| Bhutanese | 153 | 0.5% |
| Bolivian | 36 | 0.1% |
| Brazilian | 37 | 0.1% |
| British | 151 | 0.5% |
| Bulgarian | 74 | 0.2% |
| Burmese | 169 | 0.6% |
| Cambodian | 14 | 0.1% |
| Canadian | 123 | 0.4% |
| Central American | 37 | 0.1% |
| Central American Indian | 10 | 0.0% |
| Cherokee | 11 | 0.0% |
| Colombian | 119 | 0.4% |
| Croatian | 102 | 0.3% |
| Cuban | 55 | 0.2% |
| Czech | 99 | 0.3% |
| Czechoslovakian | 29 | 0.1% |
| Danish | 165 | 0.5% |
| Dominican | 1 | 0.0% |
| Dutch | 221 | 0.7% |
| Eastern European | 1,420 | 4.7% |
| Egyptian | 44 | 0.2% |
| English | 2,480 | 8.2% |
| European | 970 | 3.2% |
| Finnish | 18 | 0.1% |
| French | 387 | 1.3% |
| French Canadian | 82 | 0.3% |
| German | 4,169 | 13.8% |
| Greek | 338 | 1.1% |
| Guatemalan | 8 | 0.0% |
| Hungarian | 536 | 1.8% |
| Icelander | 3 | 0.0% |
| Indian (Asian) | 338 | 1.1% |
| Iranian | 80 | 0.3% |
| Irish | 2,784 | 9.2% |
| Israeli | 91 | 0.3% |
| Italian | 2,103 | 7.0% |
| Jamaican | 25 | 0.1% |
| Korean | 394 | 1.3% |
| Latvian | 104 | 0.3% |
| Lebanese | 63 | 0.2% |
| Lithuanian | 542 | 1.8% |
| Luxembourger | 42 | 0.1% |
| Mexican | 2,193 | 7.3% |
| Mexican American Indian | 123 | 0.4% |
| Mongolian | 8 | 0.0% |
| Native Hawaiian | 27 | 0.1% |
| Nicaraguan | 29 | 0.1% |
| Northern European | 69 | 0.2% |
| Norwegian | 350 | 1.2% |
| Pakistani | 36 | 0.1% |
| Peruvian | 60 | 0.2% |
| Polish | 2,478 | 8.2% |
| Portuguese | 20 | 0.1% |
| Puerto Rican | 417 | 1.4% |
| Romanian | 120 | 0.4% |
| Russian | 2,659 | 8.8% |
| Scandinavian | 180 | 0.6% |
| Scotch-Irish | 223 | 0.7% |
| Scottish | 835 | 2.8% |
| Serbian | 32 | 0.1% |
| Slovak | 58 | 0.2% |
| Slovene | 10 | 0.0% |
| South African | 35 | 0.1% |
| South American | 252 | 0.8% |
| Spanish | 32 | 0.1% |
| Subsaharan African | 46 | 0.2% |
| Swedish | 423 | 1.4% |
| Swiss | 21 | 0.1% |
| Thai | 243 | 0.8% |
| Turkish | 52 | 0.2% |
| Ukrainian | 515 | 1.7% |
| Venezuelan | 19 | 0.1% |
| Welsh | 81 | 0.3% |
| Yugoslavian | 98 | 0.3% | View All 85 Rows |
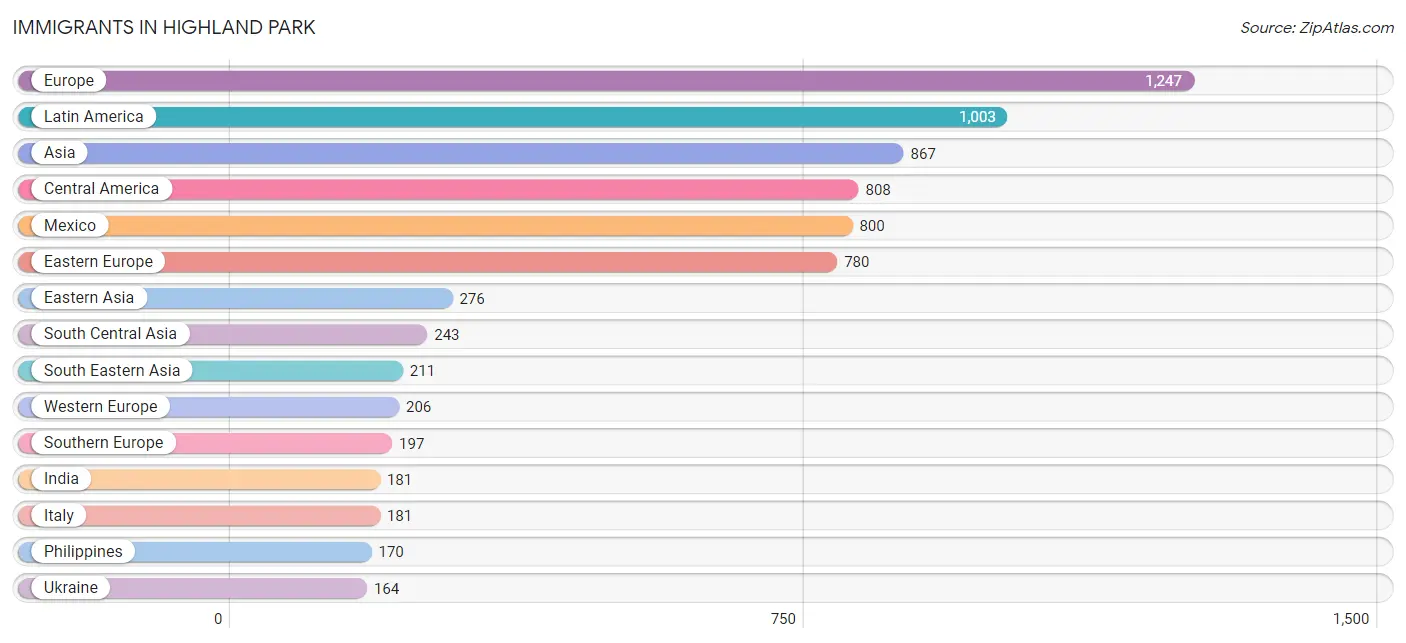
Immigrants in Highland Park
The most numerous immigrant groups reported in Highland Park came from Europe (1,247 | 4.1%), Latin America (1,003 | 3.3%), Asia (867 | 2.9%), Central America (808 | 2.7%), and Mexico (800 | 2.6%), together accounting for 15.6% of all Highland Park residents.
| Immigration Origin | # Population | % Population |
| Africa | 161 | 0.5% |
| Argentina | 7 | 0.0% |
| Asia | 867 | 2.9% |
| Austria | 8 | 0.0% |
| Barbados | 22 | 0.1% |
| Belarus | 79 | 0.3% |
| Bosnia and Herzegovina | 97 | 0.3% |
| Brazil | 29 | 0.1% |
| Bulgaria | 135 | 0.4% |
| Cambodia | 10 | 0.0% |
| Canada | 118 | 0.4% |
| Caribbean | 74 | 0.2% |
| Central America | 808 | 2.7% |
| China | 131 | 0.4% |
| Colombia | 22 | 0.1% |
| Cuba | 31 | 0.1% |
| Eastern Asia | 276 | 0.9% |
| Eastern Europe | 780 | 2.6% |
| Egypt | 16 | 0.1% |
| England | 10 | 0.0% |
| Europe | 1,247 | 4.1% |
| France | 29 | 0.1% |
| Germany | 163 | 0.5% |
| Greece | 16 | 0.1% |
| Guatemala | 8 | 0.0% |
| Hong Kong | 8 | 0.0% |
| Hungary | 8 | 0.0% |
| India | 181 | 0.6% |
| Iran | 32 | 0.1% |
| Ireland | 12 | 0.0% |
| Israel | 45 | 0.2% |
| Italy | 181 | 0.6% |
| Jamaica | 21 | 0.1% |
| Japan | 59 | 0.2% |
| Korea | 72 | 0.2% |
| Latin America | 1,003 | 3.3% |
| Lebanon | 7 | 0.0% |
| Lithuania | 37 | 0.1% |
| Malaysia | 8 | 0.0% |
| Mexico | 800 | 2.6% |
| Moldova | 17 | 0.1% |
| Morocco | 8 | 0.0% |
| Netherlands | 6 | 0.0% |
| Northern Africa | 30 | 0.1% |
| Northern Europe | 64 | 0.2% |
| Pakistan | 6 | 0.0% |
| Peru | 37 | 0.1% |
| Philippines | 170 | 0.6% |
| Poland | 86 | 0.3% |
| Romania | 28 | 0.1% |
| Russia | 102 | 0.3% |
| South Africa | 131 | 0.4% |
| South America | 121 | 0.4% |
| South Central Asia | 243 | 0.8% |
| South Eastern Asia | 211 | 0.7% |
| Southern Europe | 197 | 0.6% |
| Thailand | 23 | 0.1% |
| Turkey | 85 | 0.3% |
| Ukraine | 164 | 0.5% |
| Venezuela | 19 | 0.1% |
| Western Asia | 137 | 0.4% |
| Western Europe | 206 | 0.7% | View All 62 Rows |
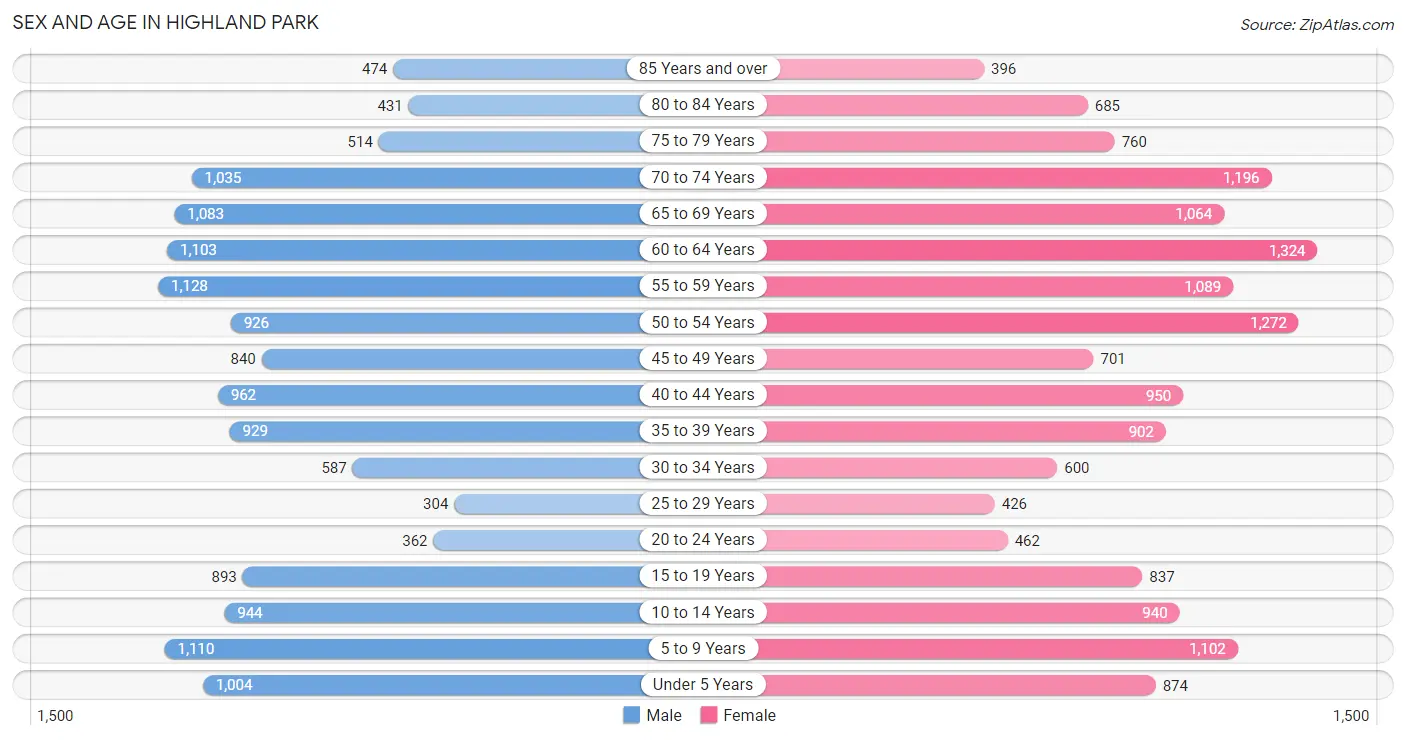
Sex and Age in Highland Park
Sex and Age in Highland Park
The most populous age groups in Highland Park are 55 to 59 Years (1,128 | 7.7%) for men and 60 to 64 Years (1,324 | 8.5%) for women.
| Age Bracket | Male | Female |
| Under 5 Years | 1,004 (6.9%) | 874 (5.6%) |
| 5 to 9 Years | 1,110 (7.6%) | 1,102 (7.1%) |
| 10 to 14 Years | 944 (6.5%) | 940 (6.0%) |
| 15 to 19 Years | 893 (6.1%) | 837 (5.4%) |
| 20 to 24 Years | 362 (2.5%) | 462 (3.0%) |
| 25 to 29 Years | 304 (2.1%) | 426 (2.7%) |
| 30 to 34 Years | 587 (4.0%) | 600 (3.8%) |
| 35 to 39 Years | 929 (6.4%) | 902 (5.8%) |
| 40 to 44 Years | 962 (6.6%) | 950 (6.1%) |
| 45 to 49 Years | 840 (5.7%) | 701 (4.5%) |
| 50 to 54 Years | 926 (6.3%) | 1,272 (8.2%) |
| 55 to 59 Years | 1,128 (7.7%) | 1,089 (7.0%) |
| 60 to 64 Years | 1,103 (7.5%) | 1,324 (8.5%) |
| 65 to 69 Years | 1,083 (7.4%) | 1,064 (6.8%) |
| 70 to 74 Years | 1,035 (7.1%) | 1,196 (7.7%) |
| 75 to 79 Years | 514 (3.5%) | 760 (4.9%) |
| 80 to 84 Years | 431 (2.9%) | 685 (4.4%) |
| 85 Years and over | 474 (3.2%) | 396 (2.5%) |
| Total | 14,629 (100.0%) | 15,580 (100.0%) |
Families and Households in Highland Park
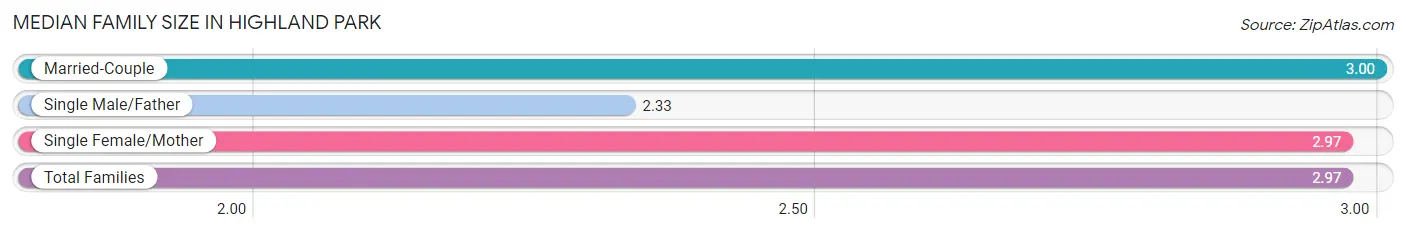
Median Family Size in Highland Park
The median family size in Highland Park is 2.97 persons per family, with married-couple families (7,842 | 89.9%) accounting for the largest median family size of 3 persons per family. On the other hand, single male/father families (370 | 4.2%) represent the smallest median family size with 2.33 persons per family.
| Family Type | # Families | Family Size |
| Married-Couple | 7,842 (89.9%) | 3.00 |
| Single Male/Father | 370 (4.2%) | 2.33 |
| Single Female/Mother | 509 (5.8%) | 2.97 |
| Total Families | 8,721 (100.0%) | 2.97 |
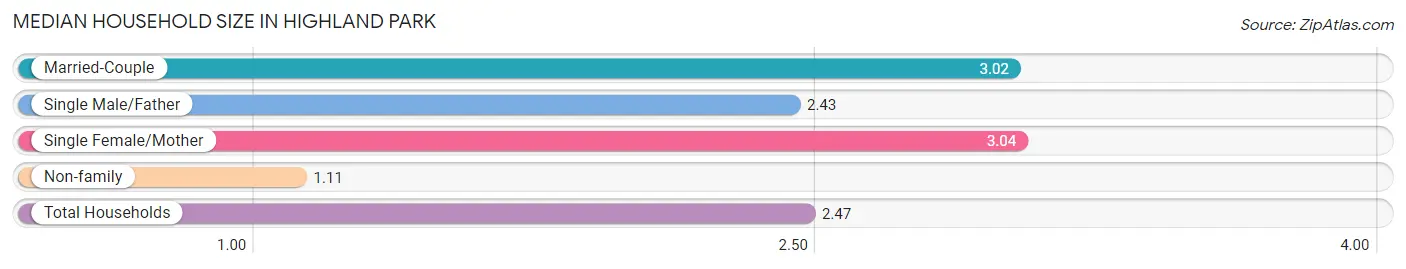
Median Household Size in Highland Park
The median household size in Highland Park is 2.47 persons per household, with single female/mother households (509 | 4.2%) accounting for the largest median household size of 3.04 persons per household. non-family households (3,374 | 27.9%) represent the smallest median household size with 1.11 persons per household.
| Household Type | # Households | Household Size |
| Married-Couple | 7,842 (64.8%) | 3.02 |
| Single Male/Father | 370 (3.1%) | 2.43 |
| Single Female/Mother | 509 (4.2%) | 3.04 |
| Non-family | 3,374 (27.9%) | 1.11 |
| Total Households | 12,095 (100.0%) | 2.47 |
Household Size by Marriage Status in Highland Park
Out of a total of 12,095 households in Highland Park, 8,721 (72.1%) are family households, while 3,374 (27.9%) are nonfamily households. The most numerous type of family households are 2-person households, comprising 4,335, and the most common type of nonfamily households are 1-person households, comprising 3,011.
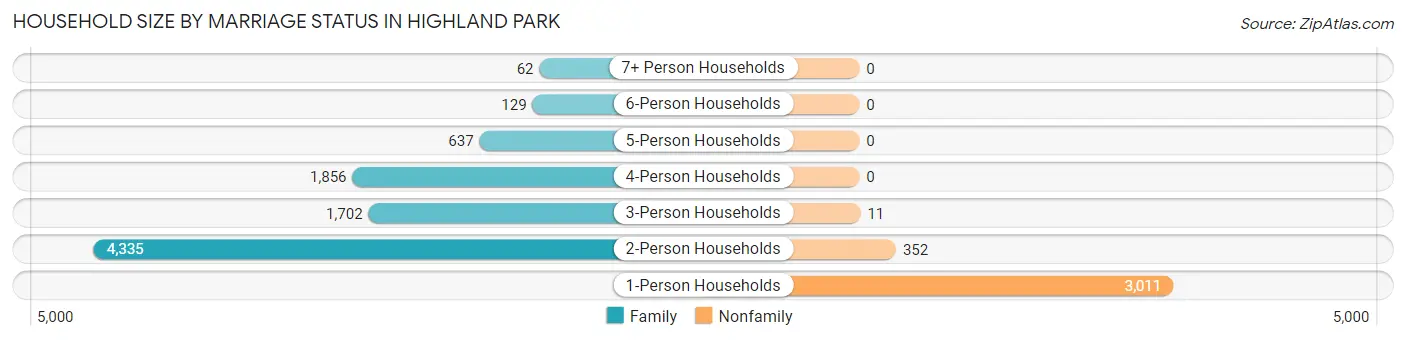
| Household Size | Family Households | Nonfamily Households |
| 1-Person Households | - | 3,011 (24.9%) |
| 2-Person Households | 4,335 (35.8%) | 352 (2.9%) |
| 3-Person Households | 1,702 (14.1%) | 11 (0.1%) |
| 4-Person Households | 1,856 (15.3%) | 0 (0.0%) |
| 5-Person Households | 637 (5.3%) | 0 (0.0%) |
| 6-Person Households | 129 (1.1%) | 0 (0.0%) |
| 7+ Person Households | 62 (0.5%) | 0 (0.0%) |
| Total | 8,721 (72.1%) | 3,374 (27.9%) |
Female Fertility in Highland Park
Fertility by Age in Highland Park
Average fertility rate in Highland Park is 79.0 births per 1,000 women. Women in the age bracket of 35 to 50 years have the highest fertility rate with 105.0 births per 1,000 women. Women in the age bracket of 35 to 50 years acount for 71.0% of all women with births.
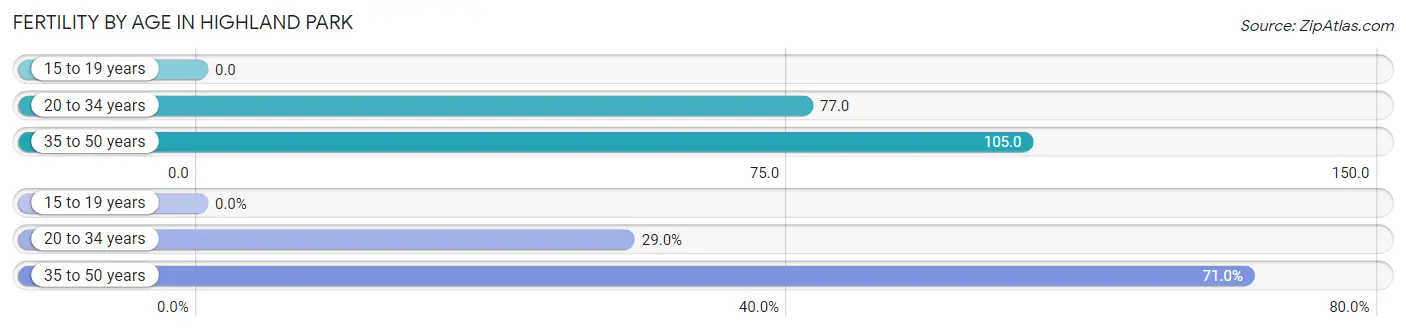
| Age Bracket | Women with Births | Births / 1,000 Women |
| 15 to 19 years | 0 (0.0%) | 0.0 |
| 20 to 34 years | 115 (29.0%) | 77.0 |
| 35 to 50 years | 282 (71.0%) | 105.0 |
| Total | 397 (100.0%) | 79.0 |
Fertility by Age by Marriage Status in Highland Park
99.7% of women with births (397) in Highland Park are married. The highest percentage of unmarried women with births falls into 20 to 34 years age bracket with 0.9% of them unmarried at the time of birth, while the lowest percentage of unmarried women with births belong to 35 to 50 years age bracket with 0.0% of them unmarried.
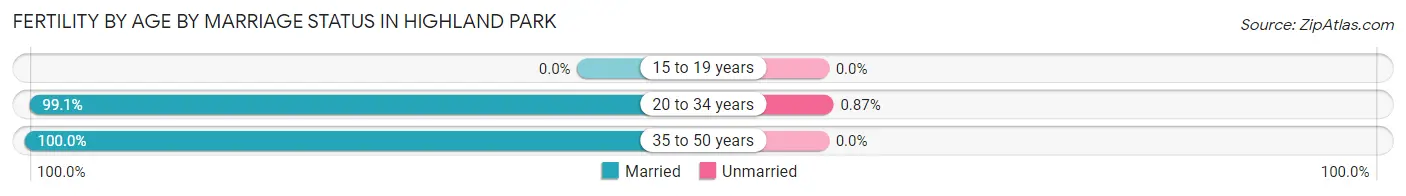
| Age Bracket | Married | Unmarried |
| 15 to 19 years | 0 (0.0%) | 0 (0.0%) |
| 20 to 34 years | 114 (99.1%) | 1 (0.9%) |
| 35 to 50 years | 282 (100.0%) | 0 (0.0%) |
| Total | 396 (99.8%) | 1 (0.3%) |
Fertility by Education in Highland Park
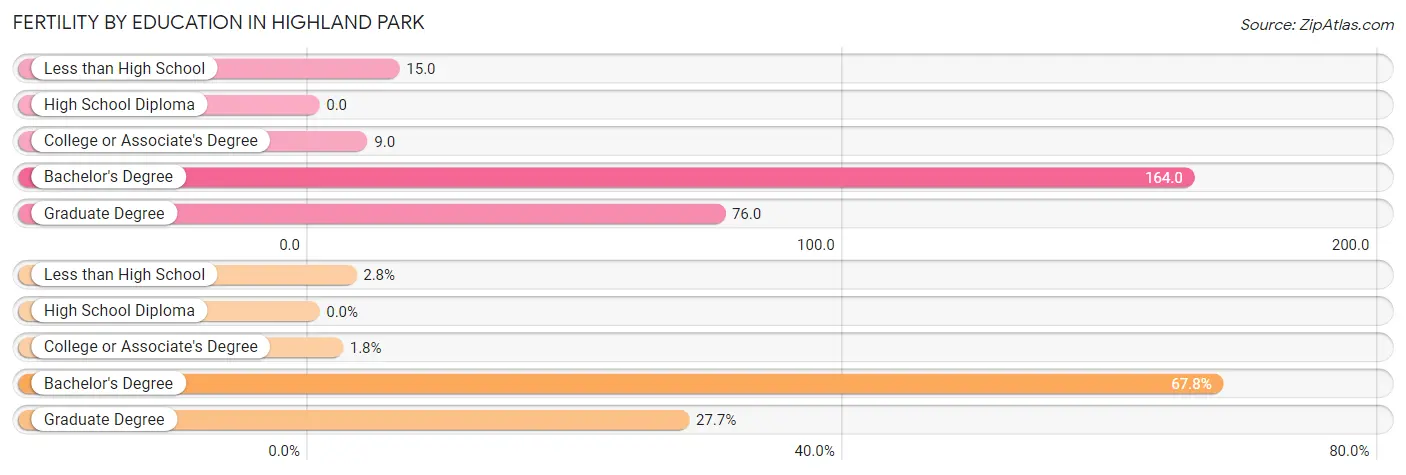
| Educational Attainment | Women with Births | Births / 1,000 Women |
| Less than High School | 11 (2.8%) | 15.0 |
| High School Diploma | 0 (0.0%) | 0.0 |
| College or Associate's Degree | 7 (1.8%) | 9.0 |
| Bachelor's Degree | 269 (67.8%) | 164.0 |
| Graduate Degree | 110 (27.7%) | 76.0 |
| Total | 397 (100.0%) | 79.0 |
Fertility by Education by Marriage Status in Highland Park
0.3% of women with births in Highland Park are unmarried. Women with the educational attainment of college or associate's degree are most likely to be married with 100.0% of them married at childbirth, while women with the educational attainment of less than high school are least likely to be married with 9.1% of them unmarried at childbirth.
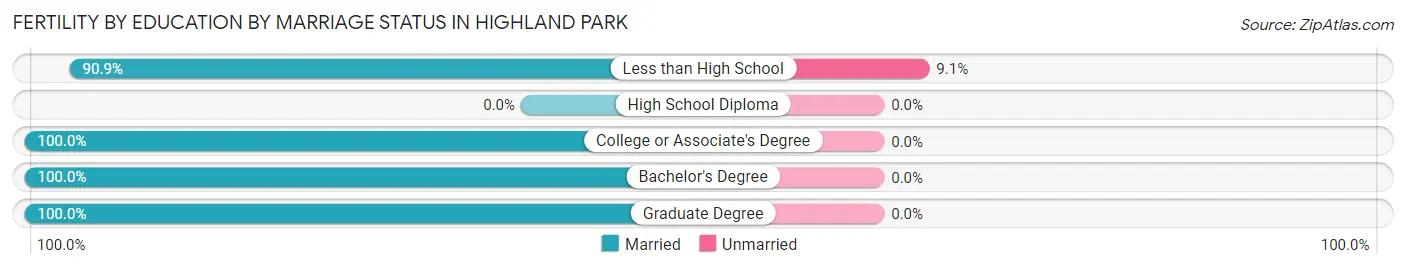
| Educational Attainment | Married | Unmarried |
| Less than High School | 10 (90.9%) | 1 (9.1%) |
| High School Diploma | 0 (0.0%) | 0 (0.0%) |
| College or Associate's Degree | 7 (100.0%) | 0 (0.0%) |
| Bachelor's Degree | 269 (100.0%) | 0 (0.0%) |
| Graduate Degree | 110 (100.0%) | 0 (0.0%) |
| Total | 396 (99.8%) | 1 (0.3%) |
Employment Characteristics in Highland Park
Employment by Class of Employer in Highland Park
Among the 14,720 employed individuals in Highland Park, private company employees (9,090 | 61.8%), not-for-profit organizations (1,801 | 12.2%), and self-employed (incorporated) (1,513 | 10.3%) make up the most common classes of employment.
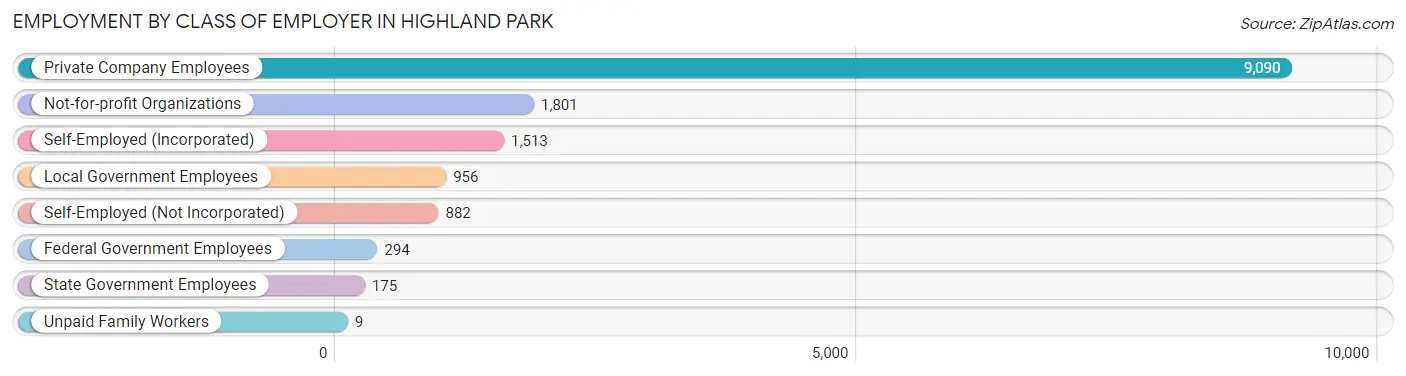
| Employer Class | # Employees | % Employees |
| Private Company Employees | 9,090 | 61.8% |
| Self-Employed (Incorporated) | 1,513 | 10.3% |
| Self-Employed (Not Incorporated) | 882 | 6.0% |
| Not-for-profit Organizations | 1,801 | 12.2% |
| Local Government Employees | 956 | 6.5% |
| State Government Employees | 175 | 1.2% |
| Federal Government Employees | 294 | 2.0% |
| Unpaid Family Workers | 9 | 0.1% |
| Total | 14,720 | 100.0% |
Employment Status by Age in Highland Park
According to the labor force statistics for Highland Park, out of the total population over 16 years of age (23,873), 64.8% or 15,470 individuals are in the labor force, with 3.4% or 526 of them unemployed. The age group with the highest labor force participation rate is 35 to 44 years, with 90.8% or 3,399 individuals in the labor force. Within the labor force, the 20 to 24 years age range has the highest percentage of unemployed individuals, with 24.2% or 128 of them being unemployed.
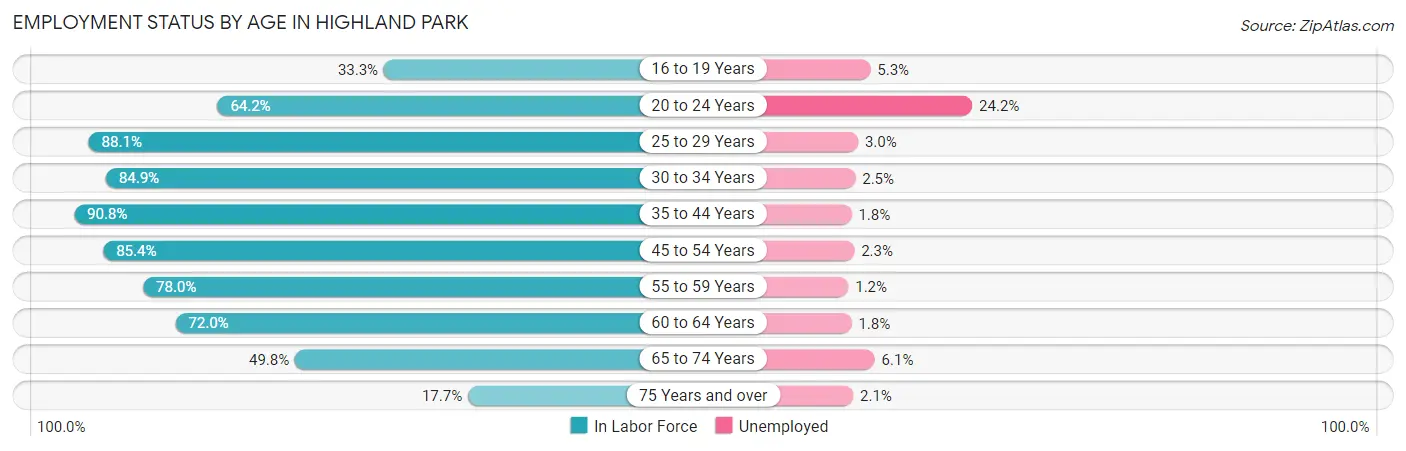
| Age Bracket | In Labor Force | Unemployed |
| 16 to 19 Years | 456 (33.3%) | 24 (5.3%) |
| 20 to 24 Years | 529 (64.2%) | 128 (24.2%) |
| 25 to 29 Years | 643 (88.1%) | 19 (3.0%) |
| 30 to 34 Years | 1,008 (84.9%) | 25 (2.5%) |
| 35 to 44 Years | 3,399 (90.8%) | 61 (1.8%) |
| 45 to 54 Years | 3,193 (85.4%) | 73 (2.3%) |
| 55 to 59 Years | 1,729 (78.0%) | 21 (1.2%) |
| 60 to 64 Years | 1,747 (72.0%) | 31 (1.8%) |
| 65 to 74 Years | 2,180 (49.8%) | 133 (6.1%) |
| 75 Years and over | 577 (17.7%) | 12 (2.1%) |
| Total | 15,470 (64.8%) | 526 (3.4%) |
Employment Status by Educational Attainment in Highland Park
According to labor force statistics for Highland Park, 83.5% of individuals (11,726) out of the total population between 25 and 64 years of age (14,043) are in the labor force, with 2.0% or 235 of them being unemployed. The group with the highest labor force participation rate are those with the educational attainment of bachelor's degree or higher, with 84.7% or 9,303 individuals in the labor force. Within the labor force, individuals with less than high school education have the highest percentage of unemployment, with 7.5% or 17 of them being unemployed.
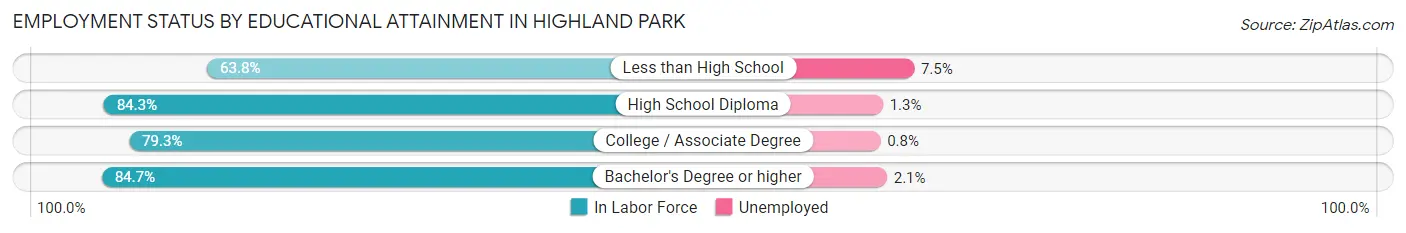
| Educational Attainment | In Labor Force | Unemployed |
| Less than High School | 226 (63.8%) | 27 (7.5%) |
| High School Diploma | 724 (84.3%) | 11 (1.3%) |
| College / Associate Degree | 1,465 (79.3%) | 15 (0.8%) |
| Bachelor's Degree or higher | 9,303 (84.7%) | 231 (2.1%) |
| Total | 11,726 (83.5%) | 281 (2.0%) |
Employment Occupations by Sex in Highland Park
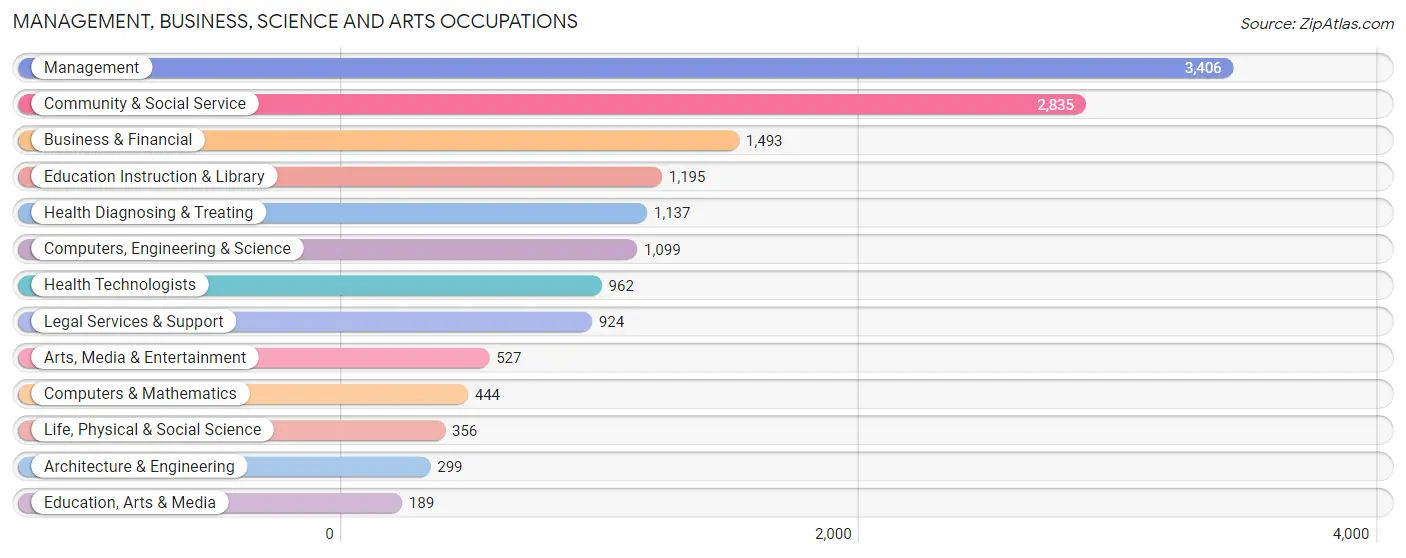
Management, Business, Science and Arts Occupations
The most common Management, Business, Science and Arts occupations in Highland Park are Management (3,406 | 23.1%), Community & Social Service (2,835 | 19.2%), Business & Financial (1,493 | 10.1%), Education Instruction & Library (1,195 | 8.1%), and Health Diagnosing & Treating (1,137 | 7.7%).
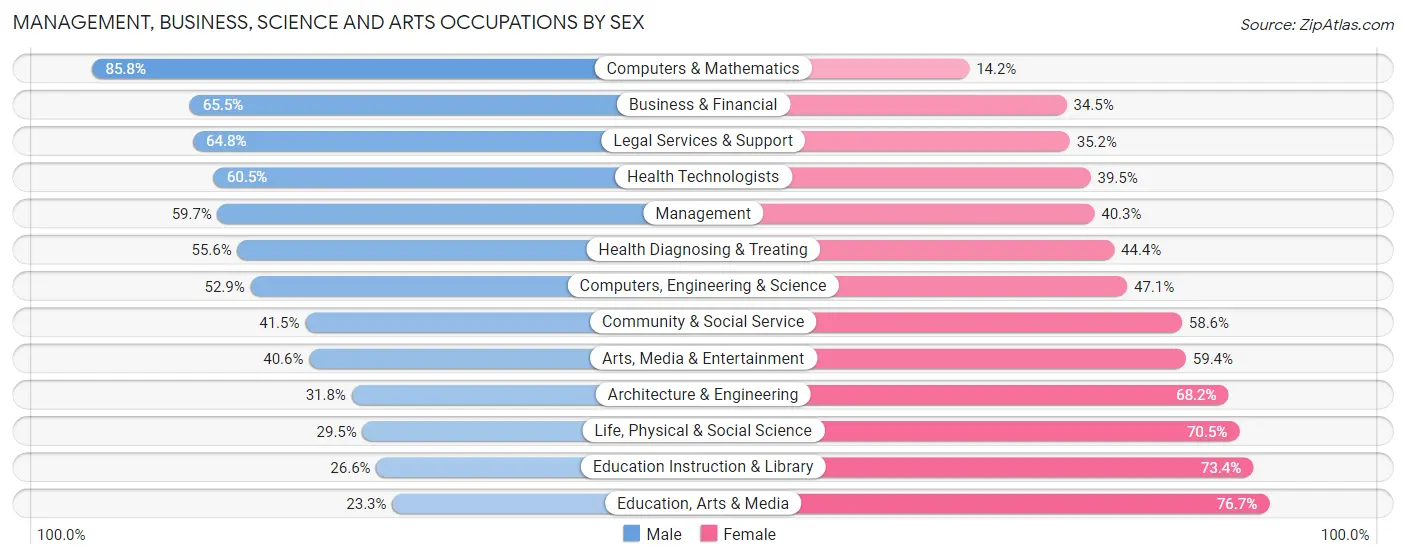
Management, Business, Science and Arts Occupations by Sex
Within the Management, Business, Science and Arts occupations in Highland Park, the most male-oriented occupations are Computers & Mathematics (85.8%), Business & Financial (65.5%), and Legal Services & Support (64.8%), while the most female-oriented occupations are Education, Arts & Media (76.7%), Education Instruction & Library (73.4%), and Life, Physical & Social Science (70.5%).
| Occupation | Male | Female |
| Management | 2,034 (59.7%) | 1,372 (40.3%) |
| Business & Financial | 978 (65.5%) | 515 (34.5%) |
| Computers, Engineering & Science | 581 (52.9%) | 518 (47.1%) |
| Computers & Mathematics | 381 (85.8%) | 63 (14.2%) |
| Architecture & Engineering | 95 (31.8%) | 204 (68.2%) |
| Life, Physical & Social Science | 105 (29.5%) | 251 (70.5%) |
| Community & Social Service | 1,175 (41.4%) | 1,660 (58.6%) |
| Education, Arts & Media | 44 (23.3%) | 145 (76.7%) |
| Legal Services & Support | 599 (64.8%) | 325 (35.2%) |
| Education Instruction & Library | 318 (26.6%) | 877 (73.4%) |
| Arts, Media & Entertainment | 214 (40.6%) | 313 (59.4%) |
| Health Diagnosing & Treating | 632 (55.6%) | 505 (44.4%) |
| Health Technologists | 582 (60.5%) | 380 (39.5%) |
| Total (Category) | 5,400 (54.2%) | 4,570 (45.8%) |
| Total (Overall) | 8,118 (54.9%) | 6,658 (45.1%) |
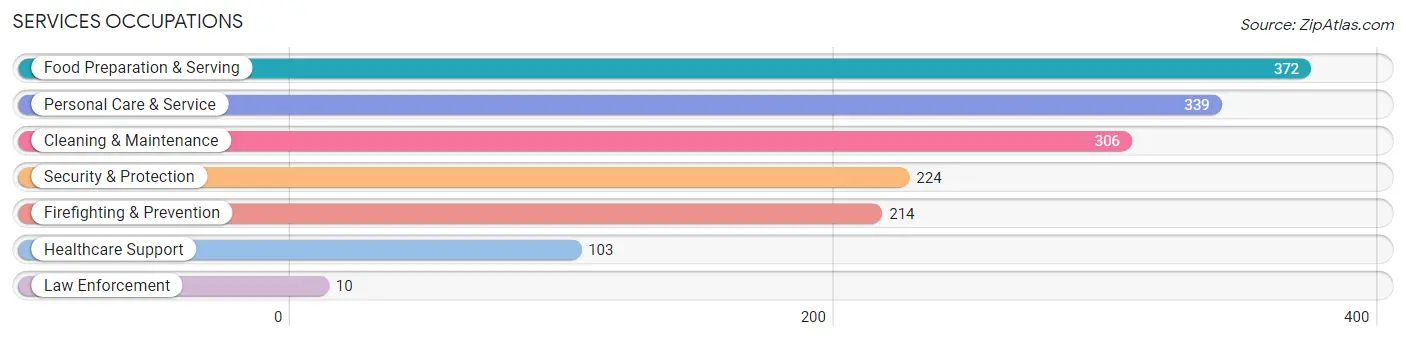
Services Occupations
The most common Services occupations in Highland Park are Food Preparation & Serving (372 | 2.5%), Personal Care & Service (339 | 2.3%), Cleaning & Maintenance (306 | 2.1%), Security & Protection (224 | 1.5%), and Firefighting & Prevention (214 | 1.5%).
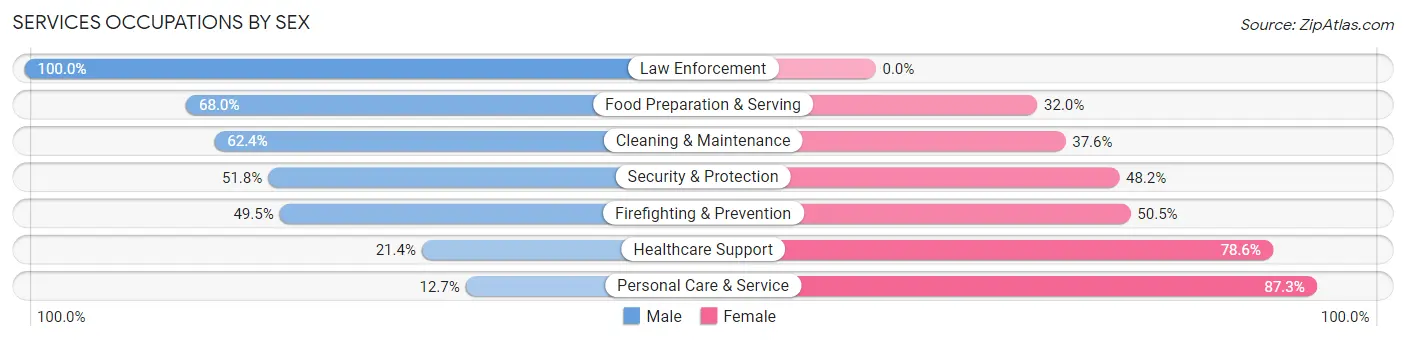
Services Occupations by Sex
Within the Services occupations in Highland Park, the most male-oriented occupations are Law Enforcement (100.0%), Food Preparation & Serving (68.0%), and Cleaning & Maintenance (62.4%), while the most female-oriented occupations are Personal Care & Service (87.3%), Healthcare Support (78.6%), and Firefighting & Prevention (50.5%).
| Occupation | Male | Female |
| Healthcare Support | 22 (21.4%) | 81 (78.6%) |
| Security & Protection | 116 (51.8%) | 108 (48.2%) |
| Firefighting & Prevention | 106 (49.5%) | 108 (50.5%) |
| Law Enforcement | 10 (100.0%) | 0 (0.0%) |
| Food Preparation & Serving | 253 (68.0%) | 119 (32.0%) |
| Cleaning & Maintenance | 191 (62.4%) | 115 (37.6%) |
| Personal Care & Service | 43 (12.7%) | 296 (87.3%) |
| Total (Category) | 625 (46.5%) | 719 (53.5%) |
| Total (Overall) | 8,118 (54.9%) | 6,658 (45.1%) |
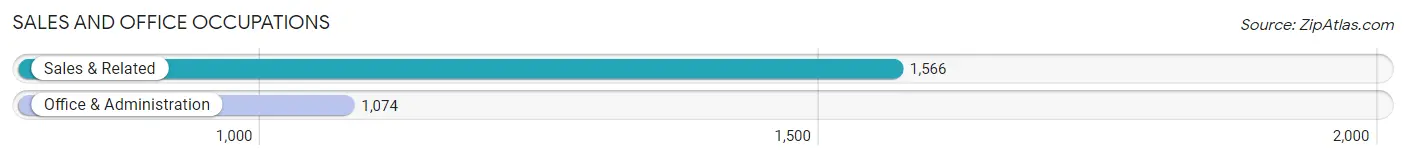
Sales and Office Occupations
The most common Sales and Office occupations in Highland Park are Sales & Related (1,566 | 10.6%), and Office & Administration (1,074 | 7.3%).
Sales and Office Occupations by Sex
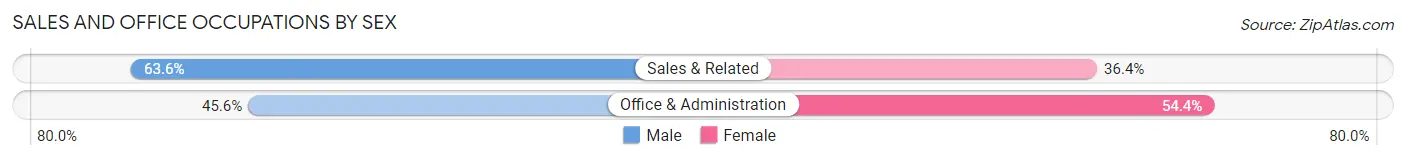
| Occupation | Male | Female |
| Sales & Related | 996 (63.6%) | 570 (36.4%) |
| Office & Administration | 490 (45.6%) | 584 (54.4%) |
| Total (Category) | 1,486 (56.3%) | 1,154 (43.7%) |
| Total (Overall) | 8,118 (54.9%) | 6,658 (45.1%) |
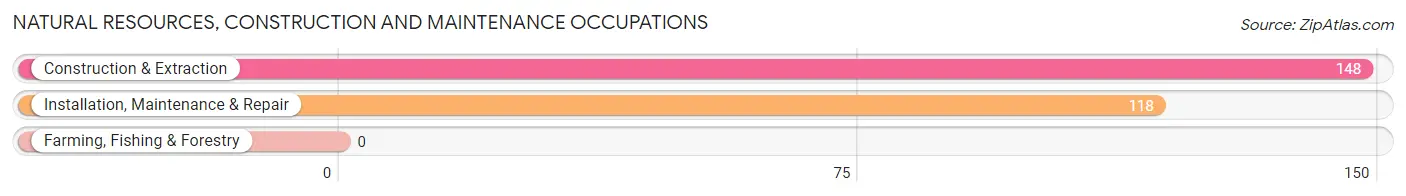
Natural Resources, Construction and Maintenance Occupations
The most common Natural Resources, Construction and Maintenance occupations in Highland Park are Construction & Extraction (148 | 1.0%), and Installation, Maintenance & Repair (118 | 0.8%).
Natural Resources, Construction and Maintenance Occupations by Sex
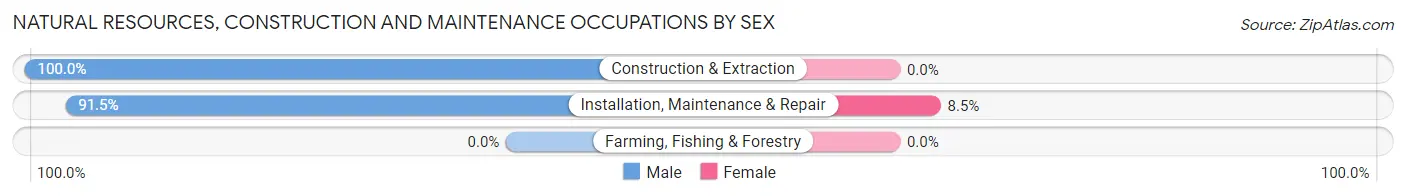
| Occupation | Male | Female |
| Farming, Fishing & Forestry | 0 (0.0%) | 0 (0.0%) |
| Construction & Extraction | 148 (100.0%) | 0 (0.0%) |
| Installation, Maintenance & Repair | 108 (91.5%) | 10 (8.5%) |
| Total (Category) | 256 (96.2%) | 10 (3.8%) |
| Total (Overall) | 8,118 (54.9%) | 6,658 (45.1%) |
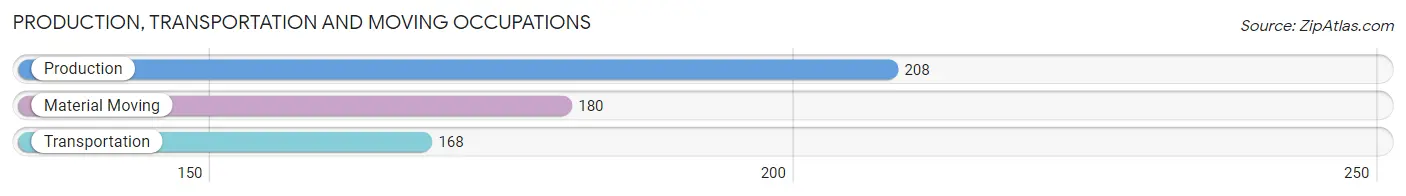
Production, Transportation and Moving Occupations
The most common Production, Transportation and Moving occupations in Highland Park are Production (208 | 1.4%), Material Moving (180 | 1.2%), and Transportation (168 | 1.1%).
Production, Transportation and Moving Occupations by Sex
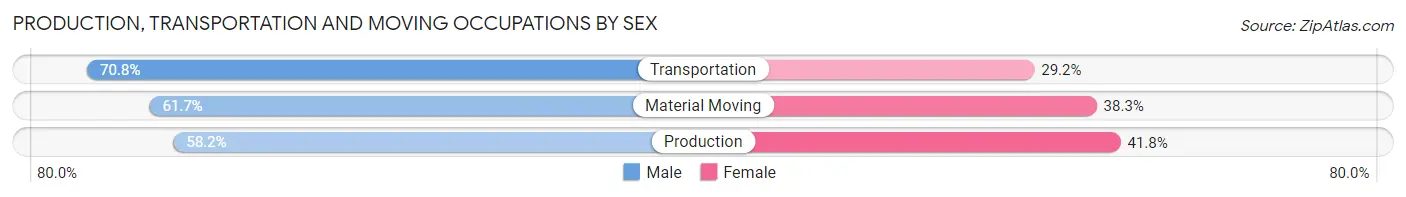
| Occupation | Male | Female |
| Production | 121 (58.2%) | 87 (41.8%) |
| Transportation | 119 (70.8%) | 49 (29.2%) |
| Material Moving | 111 (61.7%) | 69 (38.3%) |
| Total (Category) | 351 (63.1%) | 205 (36.9%) |
| Total (Overall) | 8,118 (54.9%) | 6,658 (45.1%) |
Employment Industries by Sex in Highland Park
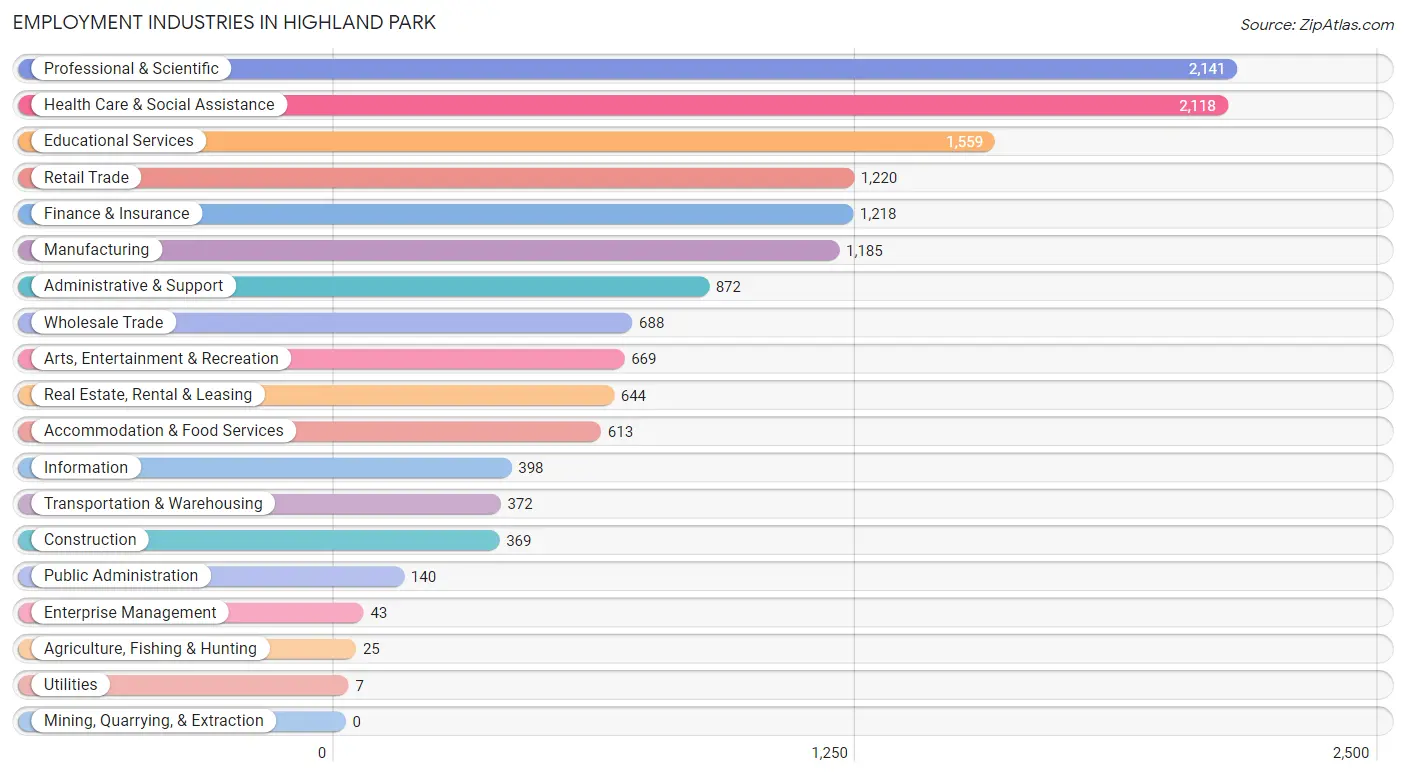
Employment Industries in Highland Park
The major employment industries in Highland Park include Professional & Scientific (2,141 | 14.5%), Health Care & Social Assistance (2,118 | 14.3%), Educational Services (1,559 | 10.5%), Retail Trade (1,220 | 8.3%), and Finance & Insurance (1,218 | 8.2%).
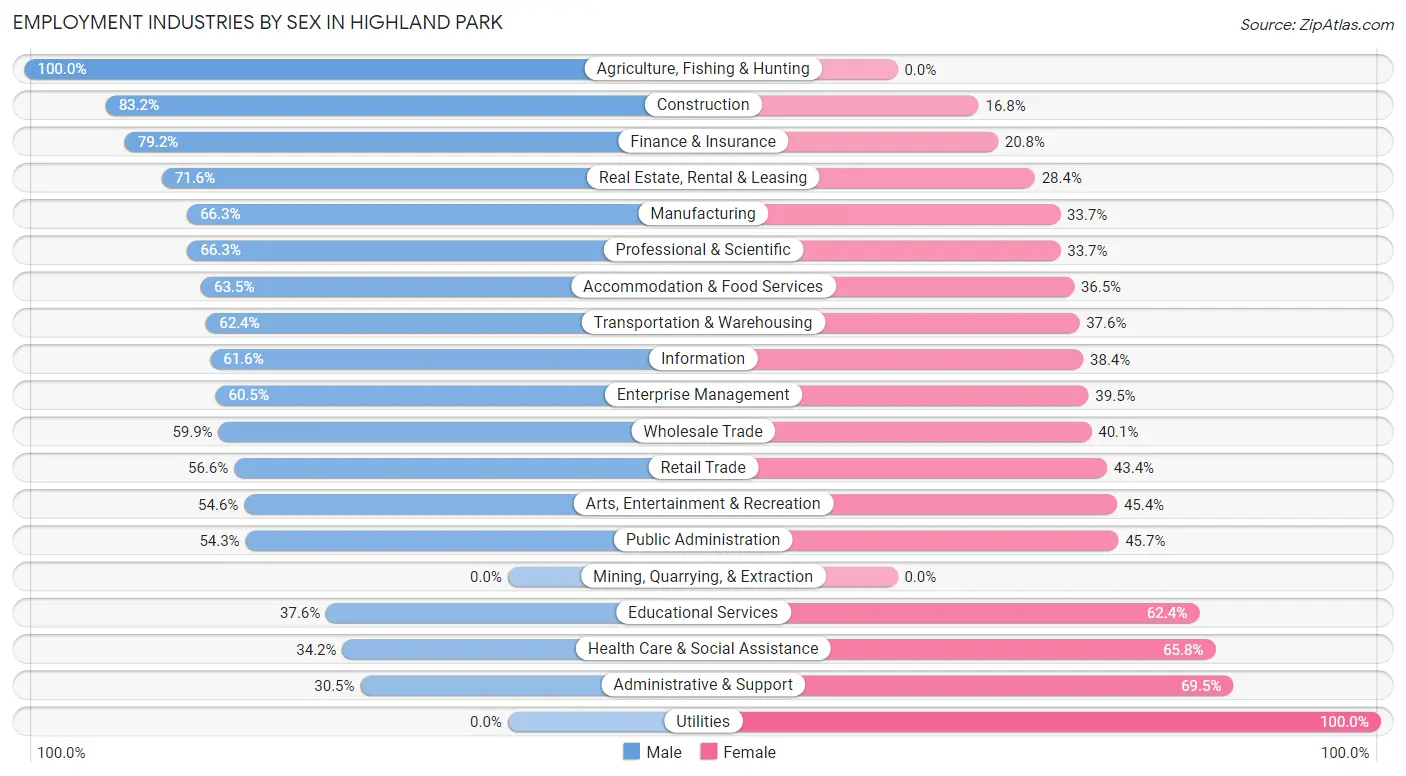
Employment Industries by Sex in Highland Park
The Highland Park industries that see more men than women are Agriculture, Fishing & Hunting (100.0%), Construction (83.2%), and Finance & Insurance (79.2%), whereas the industries that tend to have a higher number of women are Utilities (100.0%), Administrative & Support (69.5%), and Health Care & Social Assistance (65.8%).
| Industry | Male | Female |
| Agriculture, Fishing & Hunting | 25 (100.0%) | 0 (0.0%) |
| Mining, Quarrying, & Extraction | 0 (0.0%) | 0 (0.0%) |
| Construction | 307 (83.2%) | 62 (16.8%) |
| Manufacturing | 786 (66.3%) | 399 (33.7%) |
| Wholesale Trade | 412 (59.9%) | 276 (40.1%) |
| Retail Trade | 691 (56.6%) | 529 (43.4%) |
| Transportation & Warehousing | 232 (62.4%) | 140 (37.6%) |
| Utilities | 0 (0.0%) | 7 (100.0%) |
| Information | 245 (61.6%) | 153 (38.4%) |
| Finance & Insurance | 965 (79.2%) | 253 (20.8%) |
| Real Estate, Rental & Leasing | 461 (71.6%) | 183 (28.4%) |
| Professional & Scientific | 1,419 (66.3%) | 722 (33.7%) |
| Enterprise Management | 26 (60.5%) | 17 (39.5%) |
| Administrative & Support | 266 (30.5%) | 606 (69.5%) |
| Educational Services | 586 (37.6%) | 973 (62.4%) |
| Health Care & Social Assistance | 725 (34.2%) | 1,393 (65.8%) |
| Arts, Entertainment & Recreation | 365 (54.6%) | 304 (45.4%) |
| Accommodation & Food Services | 389 (63.5%) | 224 (36.5%) |
| Public Administration | 76 (54.3%) | 64 (45.7%) |
| Total | 8,118 (54.9%) | 6,658 (45.1%) |
Education in Highland Park
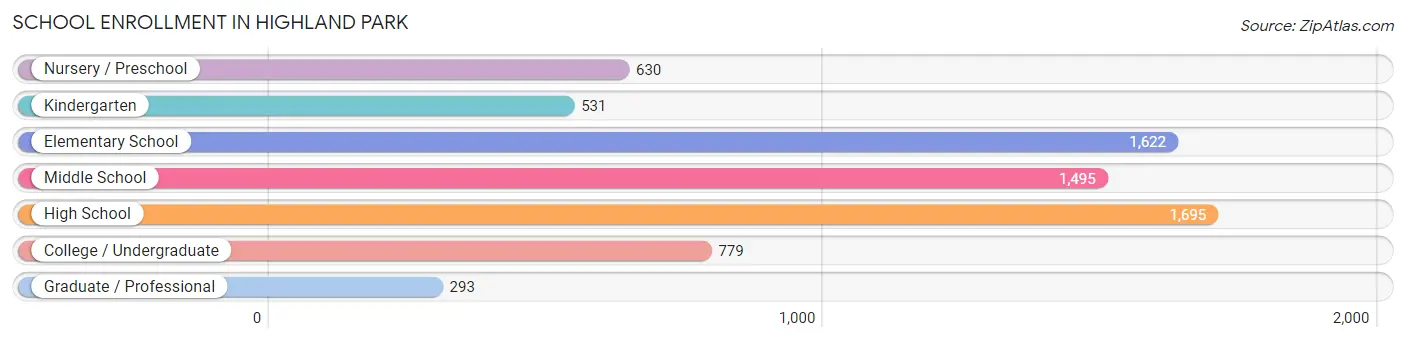
School Enrollment in Highland Park
The most common levels of schooling among the 7,045 students in Highland Park are high school (1,695 | 24.1%), elementary school (1,622 | 23.0%), and middle school (1,495 | 21.2%).
| School Level | # Students | % Students |
| Nursery / Preschool | 630 | 8.9% |
| Kindergarten | 531 | 7.5% |
| Elementary School | 1,622 | 23.0% |
| Middle School | 1,495 | 21.2% |
| High School | 1,695 | 24.1% |
| College / Undergraduate | 779 | 11.1% |
| Graduate / Professional | 293 | 4.2% |
| Total | 7,045 | 100.0% |
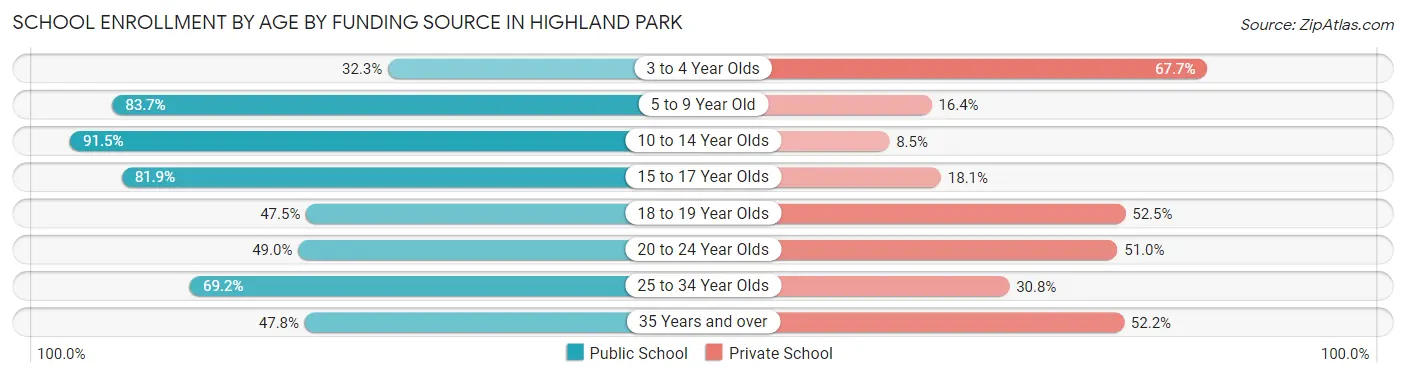
School Enrollment by Age by Funding Source in Highland Park
Out of a total of 7,045 students who are enrolled in schools in Highland Park, 1,705 (24.2%) attend a private institution, while the remaining 5,340 (75.8%) are enrolled in public schools. The age group of 3 to 4 year olds has the highest likelihood of being enrolled in private schools, with 304 (67.7% in the age bracket) enrolled. Conversely, the age group of 10 to 14 year olds has the lowest likelihood of being enrolled in a private school, with 1,715 (91.5% in the age bracket) attending a public institution.
| Age Bracket | Public School | Private School |
| 3 to 4 Year Olds | 145 (32.3%) | 304 (67.7%) |
| 5 to 9 Year Old | 1,786 (83.7%) | 349 (16.4%) |
| 10 to 14 Year Olds | 1,715 (91.5%) | 159 (8.5%) |
| 15 to 17 Year Olds | 973 (81.9%) | 215 (18.1%) |
| 18 to 19 Year Olds | 203 (47.5%) | 224 (52.5%) |
| 20 to 24 Year Olds | 203 (49.0%) | 211 (51.0%) |
| 25 to 34 Year Olds | 166 (69.2%) | 74 (30.8%) |
| 35 Years and over | 152 (47.8%) | 166 (52.2%) |
| Total | 5,340 (75.8%) | 1,705 (24.2%) |
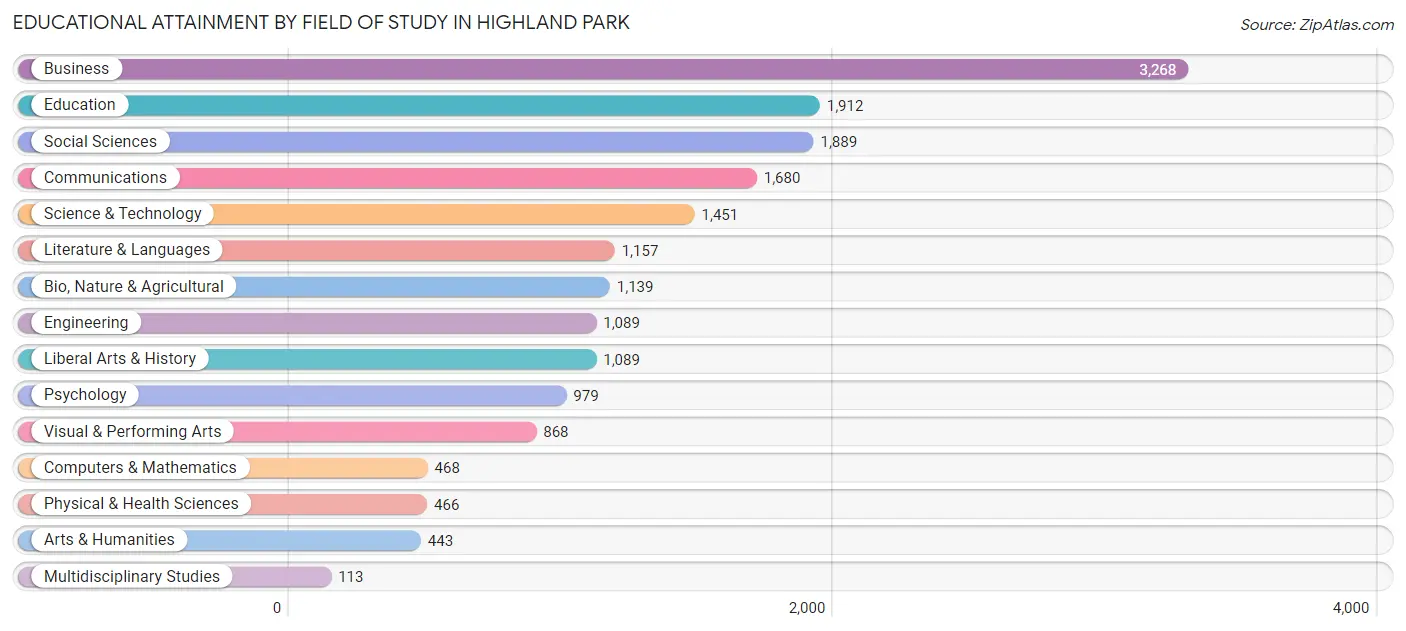
Educational Attainment by Field of Study in Highland Park
Business (3,268 | 18.1%), education (1,912 | 10.6%), social sciences (1,889 | 10.5%), communications (1,680 | 9.3%), and science & technology (1,451 | 8.1%) are the most common fields of study among 18,011 individuals in Highland Park who have obtained a bachelor's degree or higher.
| Field of Study | # Graduates | % Graduates |
| Computers & Mathematics | 468 | 2.6% |
| Bio, Nature & Agricultural | 1,139 | 6.3% |
| Physical & Health Sciences | 466 | 2.6% |
| Psychology | 979 | 5.4% |
| Social Sciences | 1,889 | 10.5% |
| Engineering | 1,089 | 6.0% |
| Multidisciplinary Studies | 113 | 0.6% |
| Science & Technology | 1,451 | 8.1% |
| Business | 3,268 | 18.1% |
| Education | 1,912 | 10.6% |
| Literature & Languages | 1,157 | 6.4% |
| Liberal Arts & History | 1,089 | 6.0% |
| Visual & Performing Arts | 868 | 4.8% |
| Communications | 1,680 | 9.3% |
| Arts & Humanities | 443 | 2.5% |
| Total | 18,011 | 100.0% |
Transportation & Commute in Highland Park
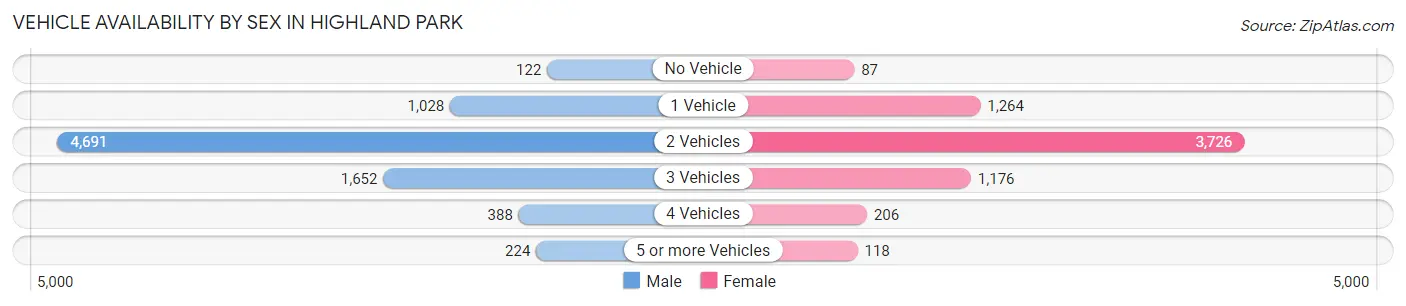
Vehicle Availability by Sex in Highland Park
The most prevalent vehicle ownership categories in Highland Park are males with 2 vehicles (4,691, accounting for 57.9%) and females with 2 vehicles (3,726, making up 71.3%).
| Vehicles Available | Male | Female |
| No Vehicle | 122 (1.5%) | 87 (1.3%) |
| 1 Vehicle | 1,028 (12.7%) | 1,264 (19.2%) |
| 2 Vehicles | 4,691 (57.9%) | 3,726 (56.7%) |
| 3 Vehicles | 1,652 (20.4%) | 1,176 (17.9%) |
| 4 Vehicles | 388 (4.8%) | 206 (3.1%) |
| 5 or more Vehicles | 224 (2.8%) | 118 (1.8%) |
| Total | 8,105 (100.0%) | 6,577 (100.0%) |
Commute Time in Highland Park
The most frequently occuring commute durations in Highland Park are 20 to 24 minutes (1,694 commuters, 14.8%), 5 to 9 minutes (1,381 commuters, 12.1%), and 60 to 89 minutes (1,360 commuters, 11.9%).
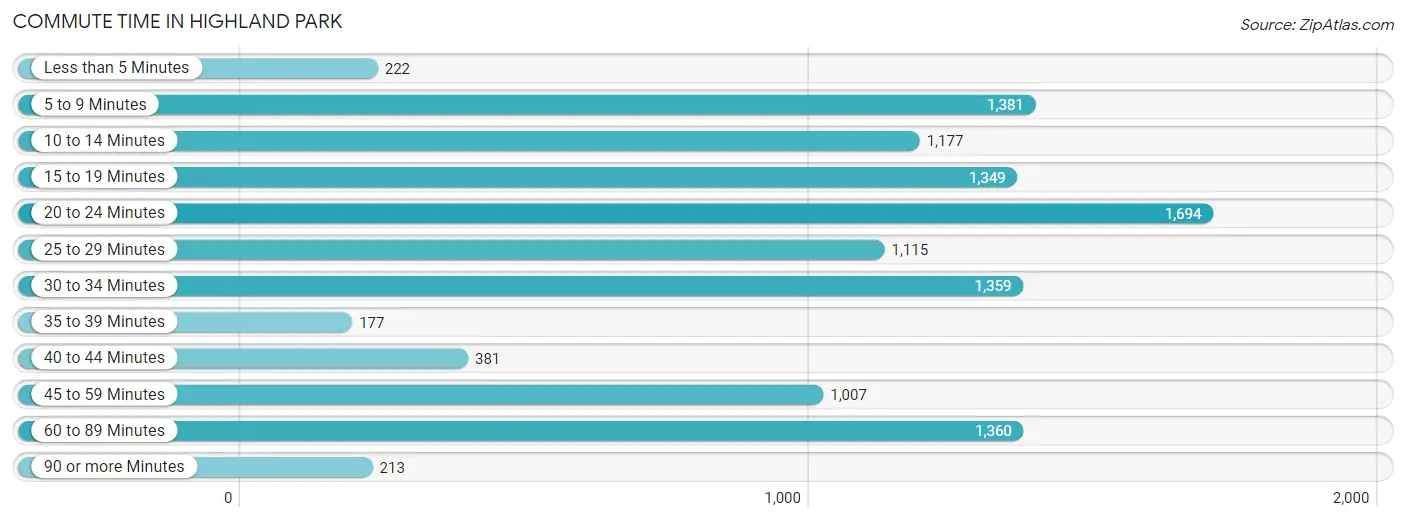
| Commute Time | # Commuters | % Commuters |
| Less than 5 Minutes | 222 | 1.9% |
| 5 to 9 Minutes | 1,381 | 12.1% |
| 10 to 14 Minutes | 1,177 | 10.3% |
| 15 to 19 Minutes | 1,349 | 11.8% |
| 20 to 24 Minutes | 1,694 | 14.8% |
| 25 to 29 Minutes | 1,115 | 9.8% |
| 30 to 34 Minutes | 1,359 | 11.9% |
| 35 to 39 Minutes | 177 | 1.5% |
| 40 to 44 Minutes | 381 | 3.3% |
| 45 to 59 Minutes | 1,007 | 8.8% |
| 60 to 89 Minutes | 1,360 | 11.9% |
| 90 or more Minutes | 213 | 1.9% |
Commute Time by Sex in Highland Park
The most common commute times in Highland Park are 60 to 89 minutes (1,037 commuters, 16.2%) for males and 20 to 24 minutes (871 commuters, 17.2%) for females.
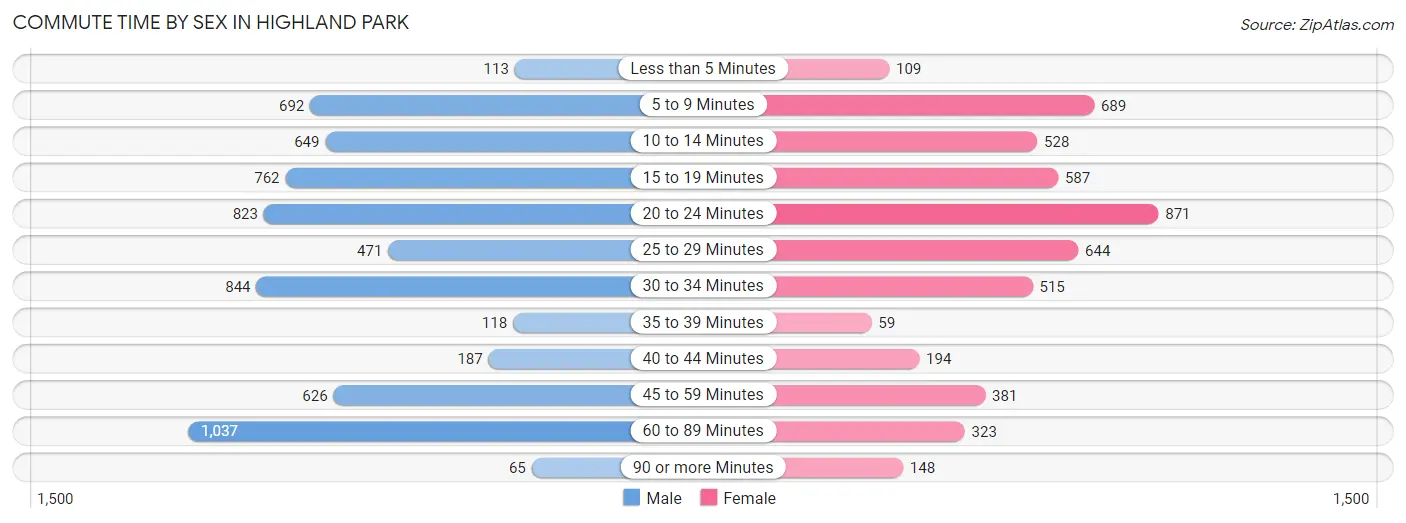
| Commute Time | Male | Female |
| Less than 5 Minutes | 113 (1.8%) | 109 (2.2%) |
| 5 to 9 Minutes | 692 (10.8%) | 689 (13.7%) |
| 10 to 14 Minutes | 649 (10.2%) | 528 (10.5%) |
| 15 to 19 Minutes | 762 (11.9%) | 587 (11.6%) |
| 20 to 24 Minutes | 823 (12.9%) | 871 (17.2%) |
| 25 to 29 Minutes | 471 (7.4%) | 644 (12.8%) |
| 30 to 34 Minutes | 844 (13.2%) | 515 (10.2%) |
| 35 to 39 Minutes | 118 (1.8%) | 59 (1.2%) |
| 40 to 44 Minutes | 187 (2.9%) | 194 (3.8%) |
| 45 to 59 Minutes | 626 (9.8%) | 381 (7.5%) |
| 60 to 89 Minutes | 1,037 (16.2%) | 323 (6.4%) |
| 90 or more Minutes | 65 (1.0%) | 148 (2.9%) |
Time of Departure to Work by Sex in Highland Park
The most frequent times of departure to work in Highland Park are 8:00 AM to 8:29 AM (1,328, 20.8%) for males and 7:30 AM to 7:59 AM (1,122, 22.2%) for females.
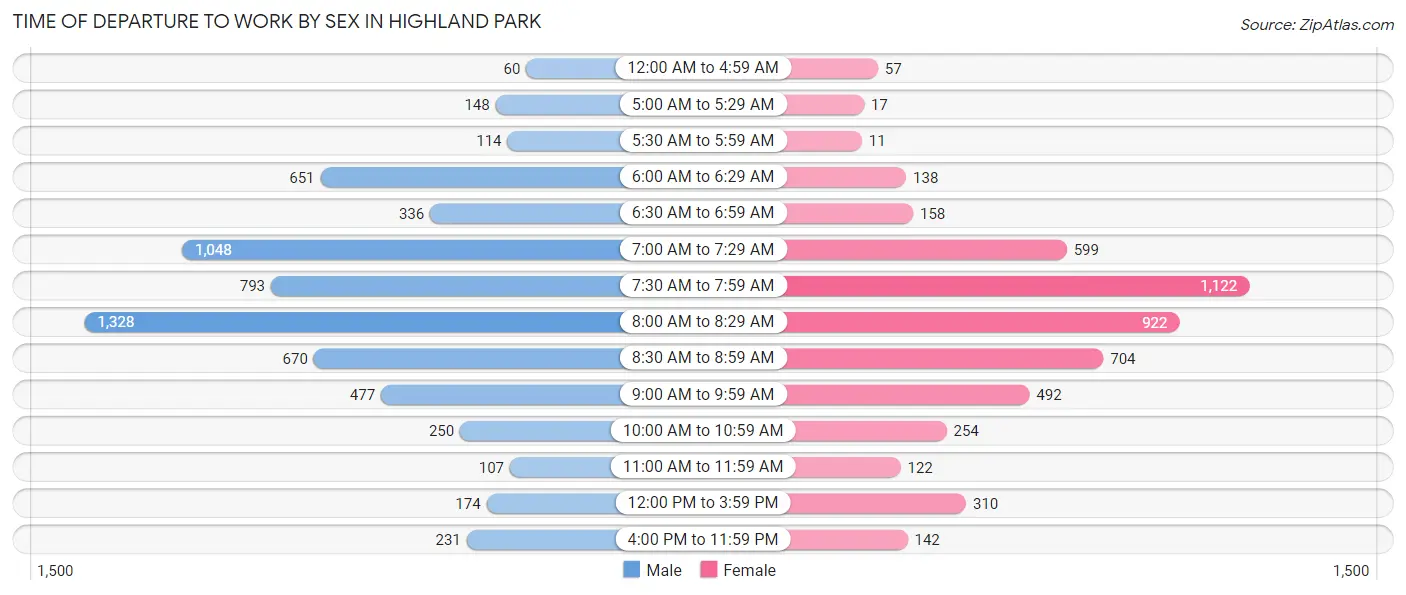
| Time of Departure | Male | Female |
| 12:00 AM to 4:59 AM | 60 (0.9%) | 57 (1.1%) |
| 5:00 AM to 5:29 AM | 148 (2.3%) | 17 (0.3%) |
| 5:30 AM to 5:59 AM | 114 (1.8%) | 11 (0.2%) |
| 6:00 AM to 6:29 AM | 651 (10.2%) | 138 (2.7%) |
| 6:30 AM to 6:59 AM | 336 (5.3%) | 158 (3.1%) |
| 7:00 AM to 7:29 AM | 1,048 (16.4%) | 599 (11.9%) |
| 7:30 AM to 7:59 AM | 793 (12.4%) | 1,122 (22.2%) |
| 8:00 AM to 8:29 AM | 1,328 (20.8%) | 922 (18.3%) |
| 8:30 AM to 8:59 AM | 670 (10.5%) | 704 (14.0%) |
| 9:00 AM to 9:59 AM | 477 (7.5%) | 492 (9.8%) |
| 10:00 AM to 10:59 AM | 250 (3.9%) | 254 (5.0%) |
| 11:00 AM to 11:59 AM | 107 (1.7%) | 122 (2.4%) |
| 12:00 PM to 3:59 PM | 174 (2.7%) | 310 (6.1%) |
| 4:00 PM to 11:59 PM | 231 (3.6%) | 142 (2.8%) |
| Total | 6,387 (100.0%) | 5,048 (100.0%) |
Housing Occupancy in Highland Park
Occupancy by Ownership in Highland Park
Of the total 12,095 dwellings in Highland Park, owner-occupied units account for 10,172 (84.1%), while renter-occupied units make up 1,923 (15.9%).
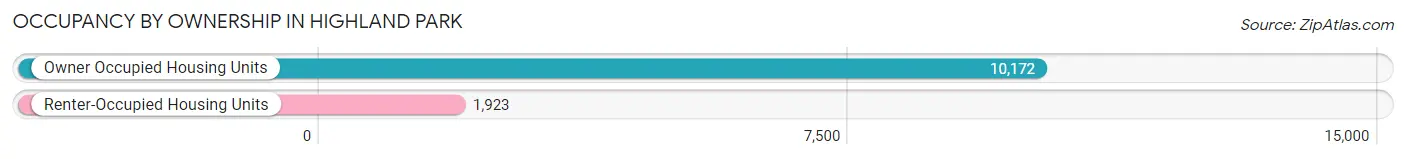
| Occupancy | # Housing Units | % Housing Units |
| Owner Occupied Housing Units | 10,172 | 84.1% |
| Renter-Occupied Housing Units | 1,923 | 15.9% |
| Total Occupied Housing Units | 12,095 | 100.0% |
Occupancy by Household Size in Highland Park
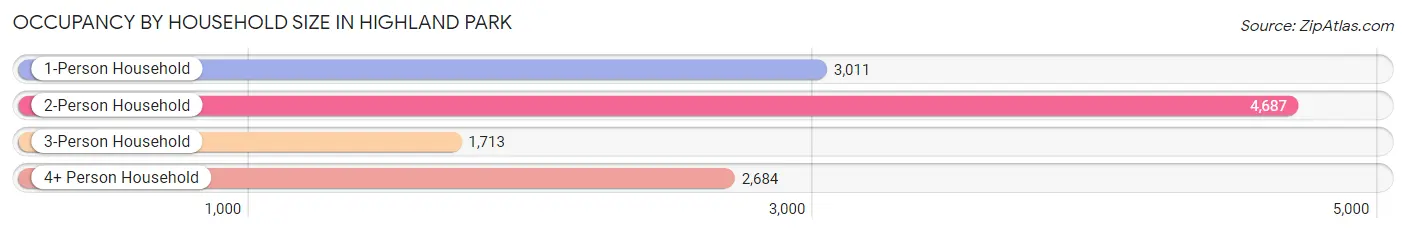
| Household Size | # Housing Units | % Housing Units |
| 1-Person Household | 3,011 | 24.9% |
| 2-Person Household | 4,687 | 38.8% |
| 3-Person Household | 1,713 | 14.2% |
| 4+ Person Household | 2,684 | 22.2% |
| Total Housing Units | 12,095 | 100.0% |
Occupancy by Ownership by Household Size in Highland Park
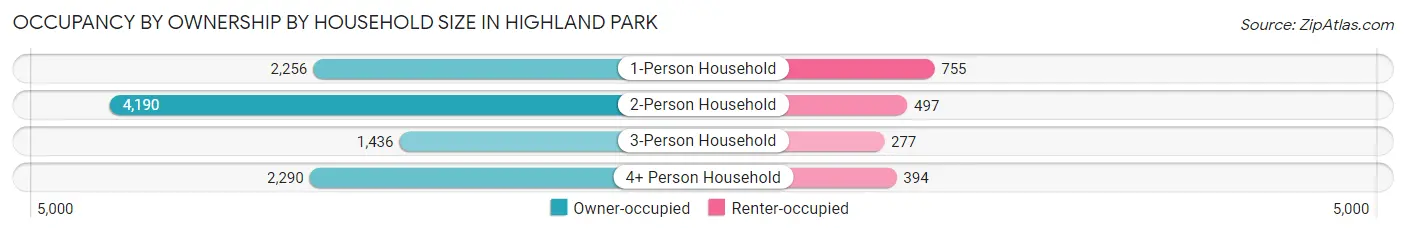
| Household Size | Owner-occupied | Renter-occupied |
| 1-Person Household | 2,256 (74.9%) | 755 (25.1%) |
| 2-Person Household | 4,190 (89.4%) | 497 (10.6%) |
| 3-Person Household | 1,436 (83.8%) | 277 (16.2%) |
| 4+ Person Household | 2,290 (85.3%) | 394 (14.7%) |
| Total Housing Units | 10,172 (84.1%) | 1,923 (15.9%) |
Occupancy by Educational Attainment in Highland Park
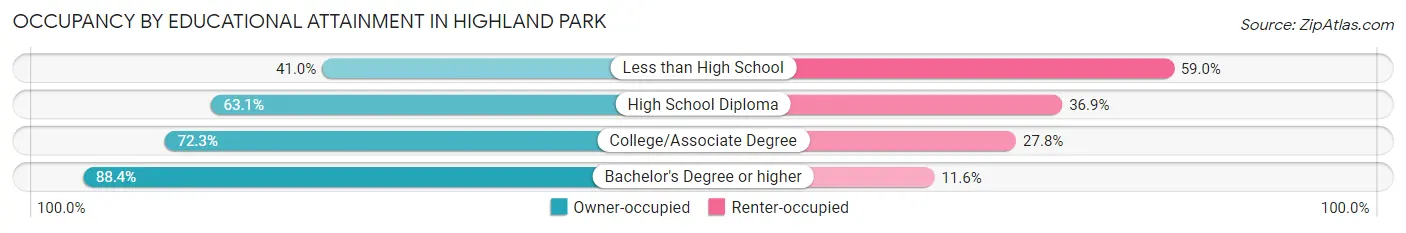
| Household Size | Owner-occupied | Renter-occupied |
| Less than High School | 73 (41.0%) | 105 (59.0%) |
| High School Diploma | 455 (63.1%) | 266 (36.9%) |
| College/Associate Degree | 1,151 (72.3%) | 442 (27.8%) |
| Bachelor's Degree or higher | 8,493 (88.4%) | 1,110 (11.6%) |
Occupancy by Age of Householder in Highland Park
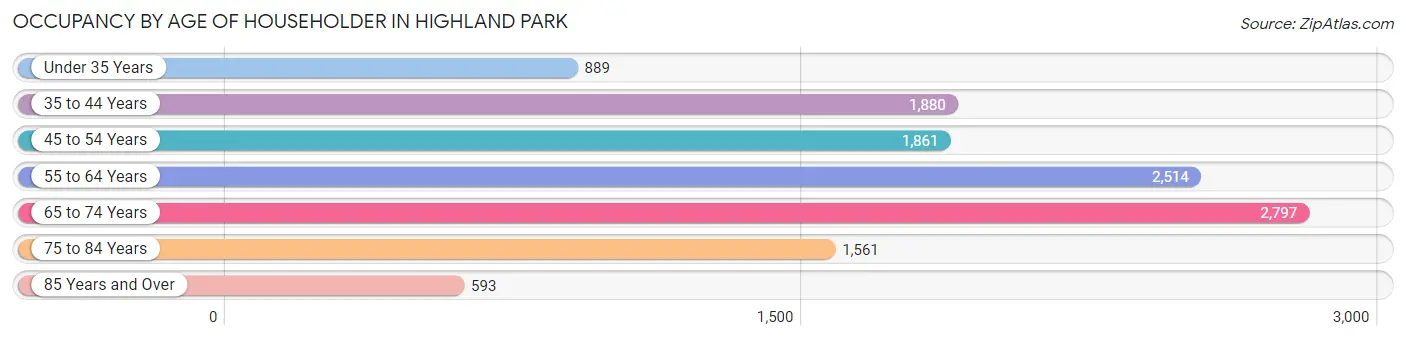
| Age Bracket | # Households | % Households |
| Under 35 Years | 889 | 7.3% |
| 35 to 44 Years | 1,880 | 15.5% |
| 45 to 54 Years | 1,861 | 15.4% |
| 55 to 64 Years | 2,514 | 20.8% |
| 65 to 74 Years | 2,797 | 23.1% |
| 75 to 84 Years | 1,561 | 12.9% |
| 85 Years and Over | 593 | 4.9% |
| Total | 12,095 | 100.0% |
Housing Finances in Highland Park
Median Income by Occupancy in Highland Park
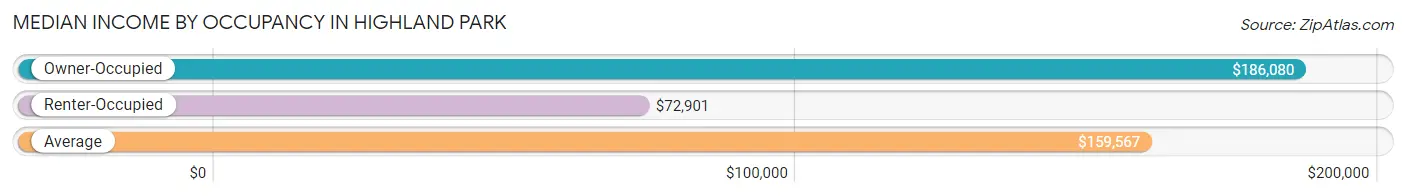
| Occupancy Type | # Households | Median Income |
| Owner-Occupied | 10,172 (84.1%) | $186,080 |
| Renter-Occupied | 1,923 (15.9%) | $72,901 |
| Average | 12,095 (100.0%) | $159,567 |
Occupancy by Householder Income Bracket in Highland Park
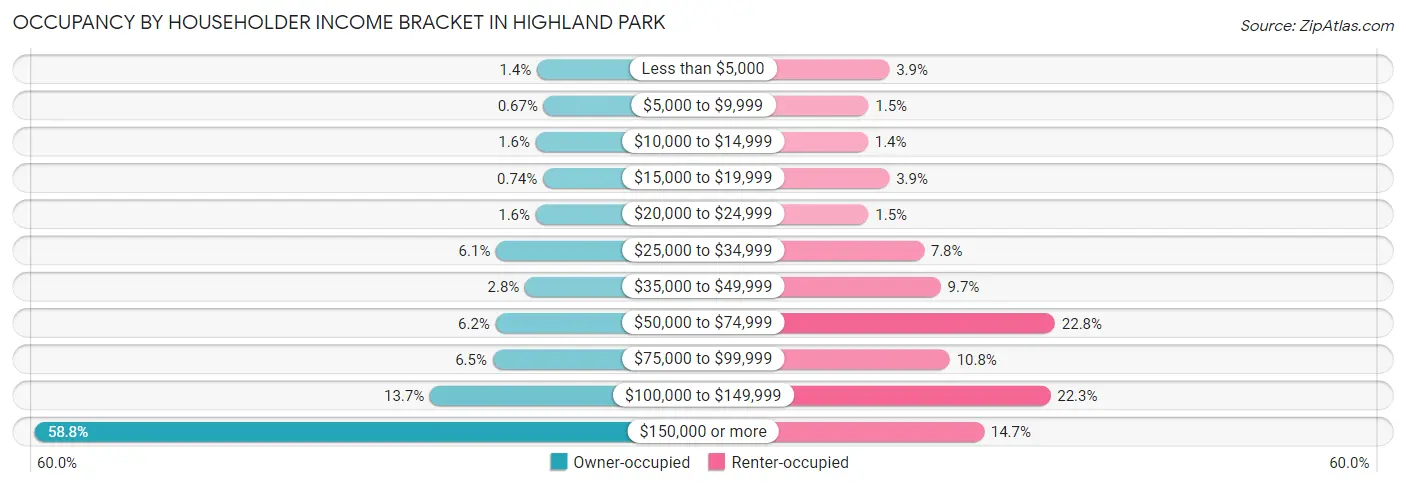
| Income Bracket | Owner-occupied | Renter-occupied |
| Less than $5,000 | 145 (1.4%) | 74 (3.8%) |
| $5,000 to $9,999 | 68 (0.7%) | 28 (1.5%) |
| $10,000 to $14,999 | 160 (1.6%) | 27 (1.4%) |
| $15,000 to $19,999 | 75 (0.7%) | 74 (3.8%) |
| $20,000 to $24,999 | 160 (1.6%) | 28 (1.5%) |
| $25,000 to $34,999 | 620 (6.1%) | 150 (7.8%) |
| $35,000 to $49,999 | 284 (2.8%) | 187 (9.7%) |
| $50,000 to $74,999 | 627 (6.2%) | 438 (22.8%) |
| $75,000 to $99,999 | 660 (6.5%) | 207 (10.8%) |
| $100,000 to $149,999 | 1,389 (13.7%) | 428 (22.3%) |
| $150,000 or more | 5,984 (58.8%) | 282 (14.7%) |
| Total | 10,172 (100.0%) | 1,923 (100.0%) |
Monthly Housing Cost Tiers in Highland Park
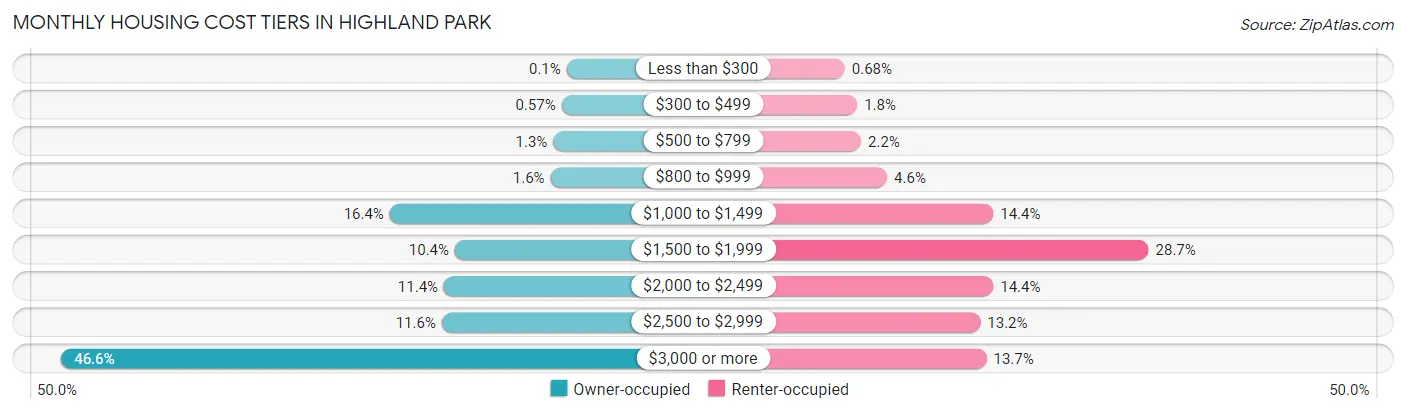
| Monthly Cost | Owner-occupied | Renter-occupied |
| Less than $300 | 10 (0.1%) | 13 (0.7%) |
| $300 to $499 | 58 (0.6%) | 35 (1.8%) |
| $500 to $799 | 136 (1.3%) | 42 (2.2%) |
| $800 to $999 | 162 (1.6%) | 88 (4.6%) |
| $1,000 to $1,499 | 1,667 (16.4%) | 276 (14.3%) |
| $1,500 to $1,999 | 1,057 (10.4%) | 551 (28.6%) |
| $2,000 to $2,499 | 1,160 (11.4%) | 276 (14.3%) |
| $2,500 to $2,999 | 1,180 (11.6%) | 253 (13.2%) |
| $3,000 or more | 4,742 (46.6%) | 264 (13.7%) |
| Total | 10,172 (100.0%) | 1,923 (100.0%) |
Physical Housing Characteristics in Highland Park
Housing Structures in Highland Park
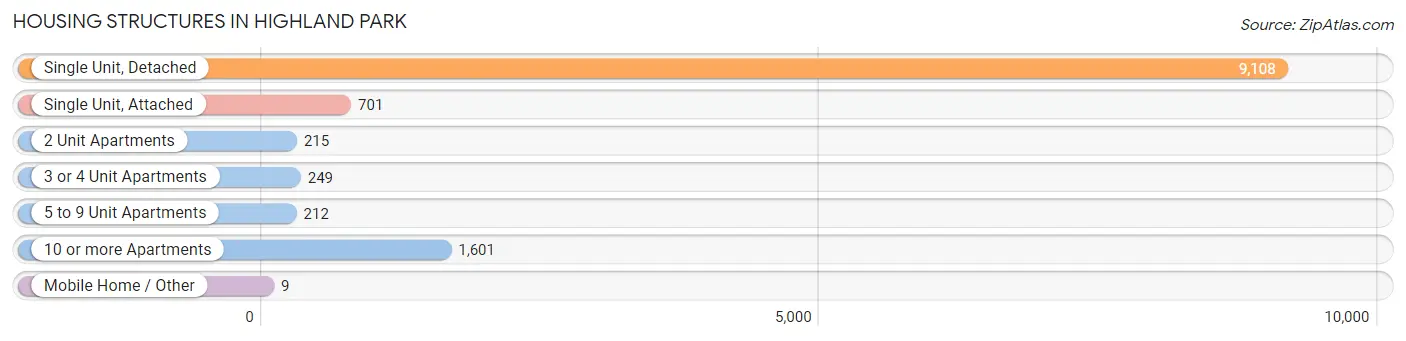
| Structure Type | # Housing Units | % Housing Units |
| Single Unit, Detached | 9,108 | 75.3% |
| Single Unit, Attached | 701 | 5.8% |
| 2 Unit Apartments | 215 | 1.8% |
| 3 or 4 Unit Apartments | 249 | 2.1% |
| 5 to 9 Unit Apartments | 212 | 1.8% |
| 10 or more Apartments | 1,601 | 13.2% |
| Mobile Home / Other | 9 | 0.1% |
| Total | 12,095 | 100.0% |
Housing Structures by Occupancy in Highland Park
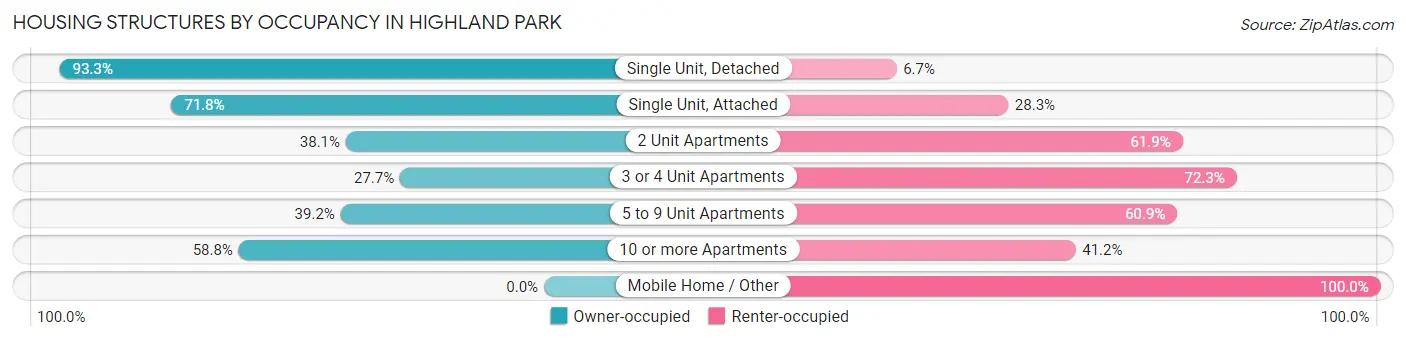
| Structure Type | Owner-occupied | Renter-occupied |
| Single Unit, Detached | 8,494 (93.3%) | 614 (6.7%) |
| Single Unit, Attached | 503 (71.8%) | 198 (28.2%) |
| 2 Unit Apartments | 82 (38.1%) | 133 (61.9%) |
| 3 or 4 Unit Apartments | 69 (27.7%) | 180 (72.3%) |
| 5 to 9 Unit Apartments | 83 (39.2%) | 129 (60.9%) |
| 10 or more Apartments | 941 (58.8%) | 660 (41.2%) |
| Mobile Home / Other | 0 (0.0%) | 9 (100.0%) |
| Total | 10,172 (84.1%) | 1,923 (15.9%) |
Housing Structures by Number of Rooms in Highland Park
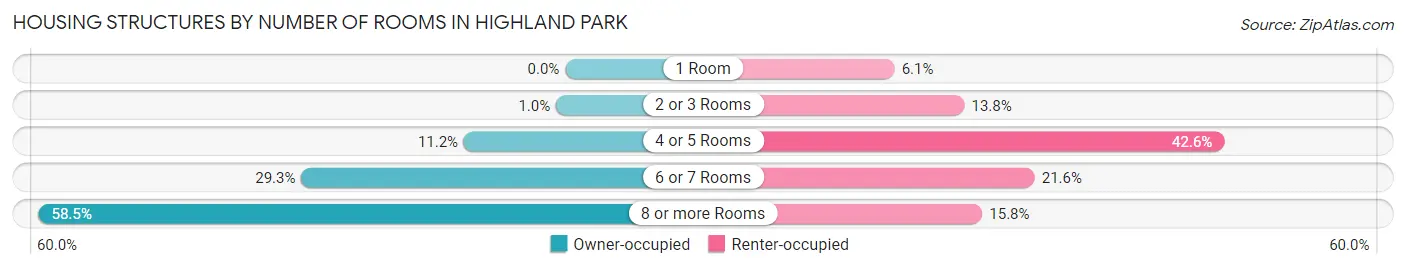
| Number of Rooms | Owner-occupied | Renter-occupied |
| 1 Room | 0 (0.0%) | 117 (6.1%) |
| 2 or 3 Rooms | 104 (1.0%) | 266 (13.8%) |
| 4 or 5 Rooms | 1,143 (11.2%) | 820 (42.6%) |
| 6 or 7 Rooms | 2,979 (29.3%) | 416 (21.6%) |
| 8 or more Rooms | 5,946 (58.5%) | 304 (15.8%) |
| Total | 10,172 (100.0%) | 1,923 (100.0%) |
Housing Structure by Heating Type in Highland Park
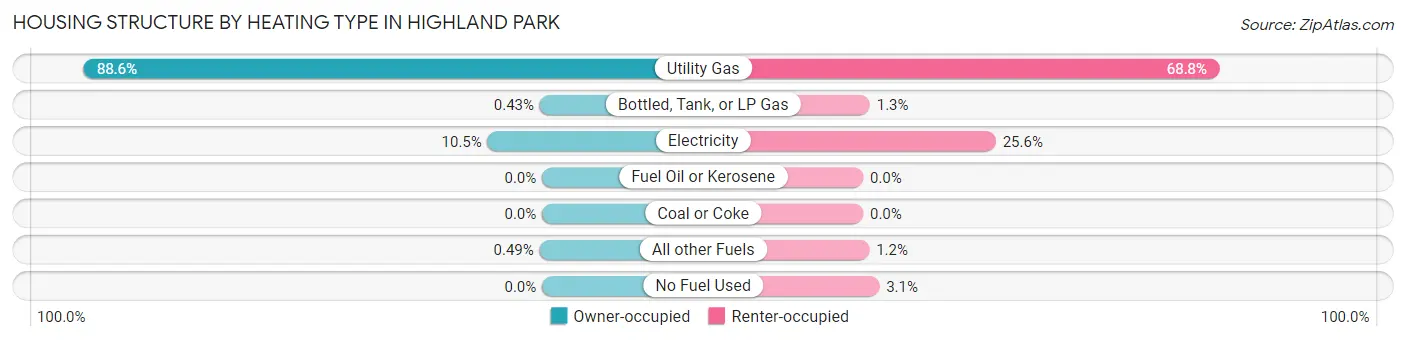
| Heating Type | Owner-occupied | Renter-occupied |
| Utility Gas | 9,007 (88.5%) | 1,322 (68.8%) |
| Bottled, Tank, or LP Gas | 44 (0.4%) | 25 (1.3%) |
| Electricity | 1,071 (10.5%) | 493 (25.6%) |
| Fuel Oil or Kerosene | 0 (0.0%) | 0 (0.0%) |
| Coal or Coke | 0 (0.0%) | 0 (0.0%) |
| All other Fuels | 50 (0.5%) | 23 (1.2%) |
| No Fuel Used | 0 (0.0%) | 60 (3.1%) |
| Total | 10,172 (100.0%) | 1,923 (100.0%) |
Household Vehicle Usage in Highland Park
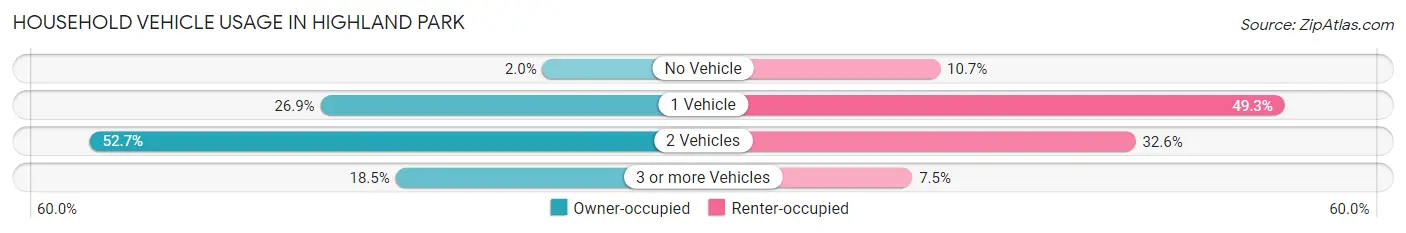
| Vehicles per Household | Owner-occupied | Renter-occupied |
| No Vehicle | 201 (2.0%) | 205 (10.7%) |
| 1 Vehicle | 2,732 (26.9%) | 947 (49.2%) |
| 2 Vehicles | 5,362 (52.7%) | 626 (32.6%) |
| 3 or more Vehicles | 1,877 (18.4%) | 145 (7.5%) |
| Total | 10,172 (100.0%) | 1,923 (100.0%) |
Real Estate & Mortgages in Highland Park
Real Estate and Mortgage Overview in Highland Park
| Characteristic | Without Mortgage | With Mortgage |
| Housing Units | 3,312 | 6,860 |
| Median Property Value | $588,300 | $594,900 |
| Median Household Income | $137,857 | $4,482 |
| Monthly Housing Costs | $1,501 | $4,286 |
| Real Estate Taxes | $10,001 | $66 |
Property Value by Mortgage Status in Highland Park
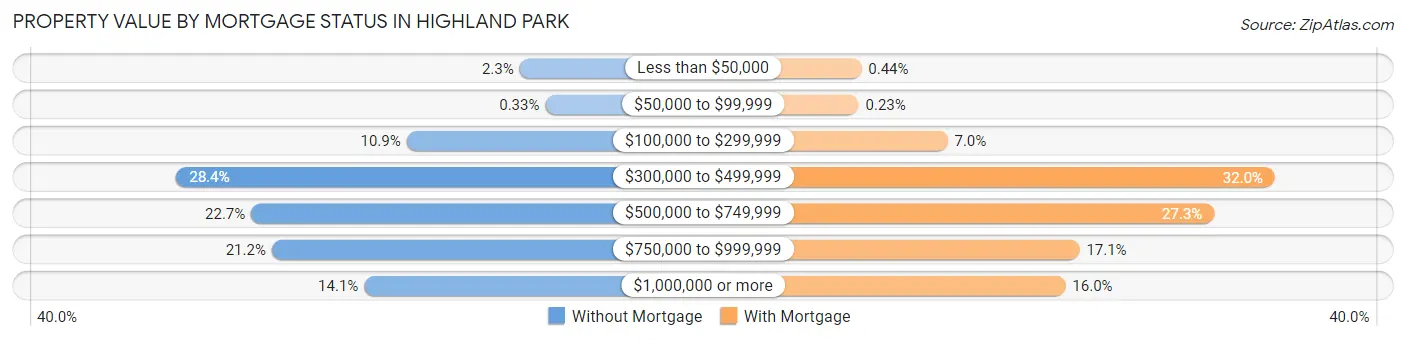
| Property Value | Without Mortgage | With Mortgage |
| Less than $50,000 | 76 (2.3%) | 30 (0.4%) |
| $50,000 to $99,999 | 11 (0.3%) | 16 (0.2%) |
| $100,000 to $299,999 | 361 (10.9%) | 481 (7.0%) |
| $300,000 to $499,999 | 942 (28.4%) | 2,192 (32.0%) |
| $500,000 to $749,999 | 753 (22.7%) | 1,874 (27.3%) |
| $750,000 to $999,999 | 701 (21.2%) | 1,170 (17.1%) |
| $1,000,000 or more | 468 (14.1%) | 1,097 (16.0%) |
| Total | 3,312 (100.0%) | 6,860 (100.0%) |
Household Income by Mortgage Status in Highland Park
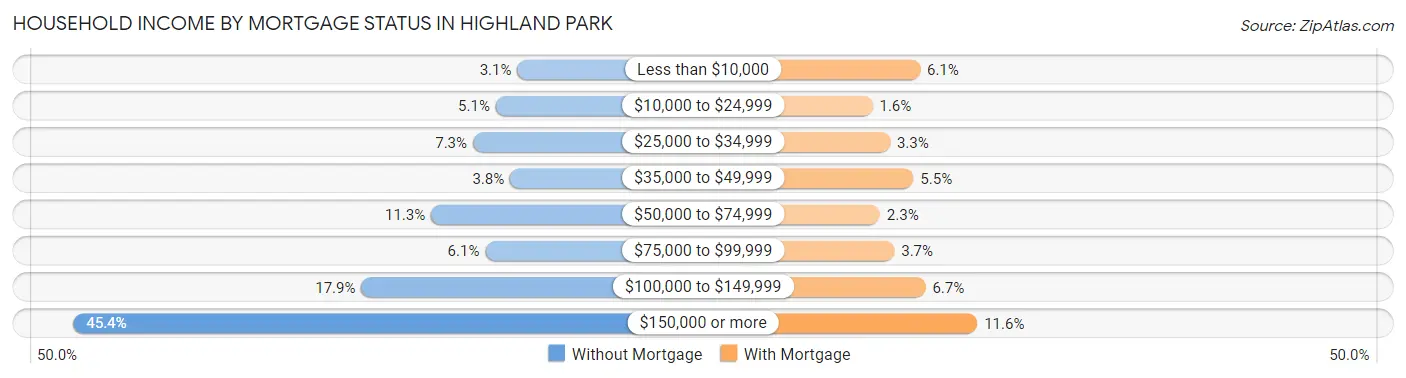
| Household Income | Without Mortgage | With Mortgage |
| Less than $10,000 | 102 (3.1%) | 421 (6.1%) |
| $10,000 to $24,999 | 170 (5.1%) | 111 (1.6%) |
| $25,000 to $34,999 | 242 (7.3%) | 225 (3.3%) |
| $35,000 to $49,999 | 125 (3.8%) | 378 (5.5%) |
| $50,000 to $74,999 | 374 (11.3%) | 159 (2.3%) |
| $75,000 to $99,999 | 203 (6.1%) | 253 (3.7%) |
| $100,000 to $149,999 | 594 (17.9%) | 457 (6.7%) |
| $150,000 or more | 1,502 (45.4%) | 795 (11.6%) |
| Total | 3,312 (100.0%) | 6,860 (100.0%) |
Property Value to Household Income Ratio in Highland Park
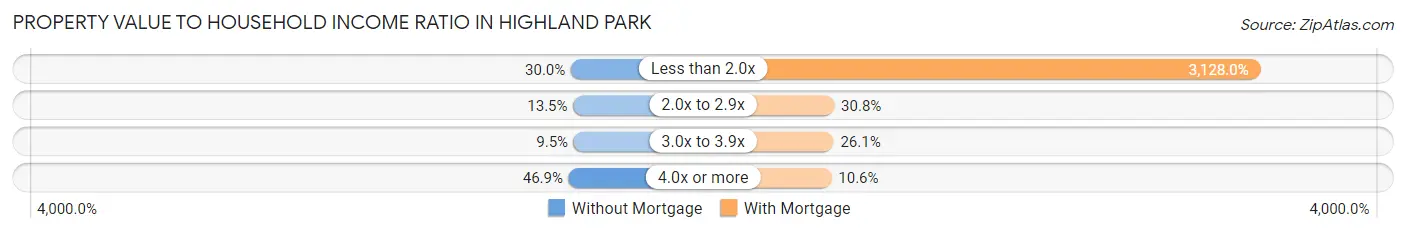
| Value-to-Income Ratio | Without Mortgage | With Mortgage |
| Less than 2.0x | 994 (30.0%) | 214,583 (3,128.0%) |
| 2.0x to 2.9x | 448 (13.5%) | 2,110 (30.8%) |
| 3.0x to 3.9x | 316 (9.5%) | 1,787 (26.1%) |
| 4.0x or more | 1,554 (46.9%) | 724 (10.5%) |
| Total | 3,312 (100.0%) | 6,860 (100.0%) |
Real Estate Taxes by Mortgage Status in Highland Park
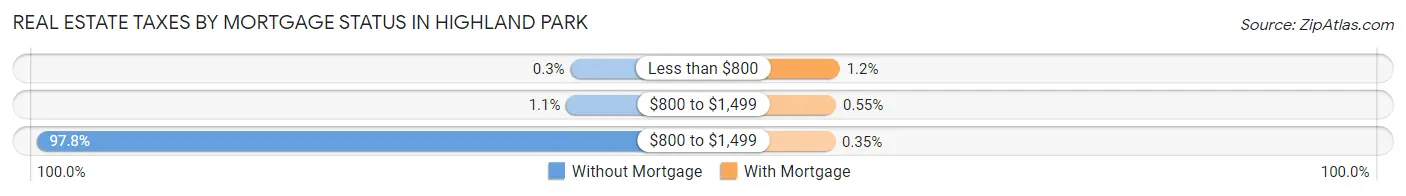
| Property Taxes | Without Mortgage | With Mortgage |
| Less than $800 | 10 (0.3%) | 84 (1.2%) |
| $800 to $1,499 | 35 (1.1%) | 38 (0.5%) |
| $800 to $1,499 | 3,239 (97.8%) | 24 (0.4%) |
| Total | 3,312 (100.0%) | 6,860 (100.0%) |
Health & Disability in Highland Park
Health Insurance Coverage by Age in Highland Park
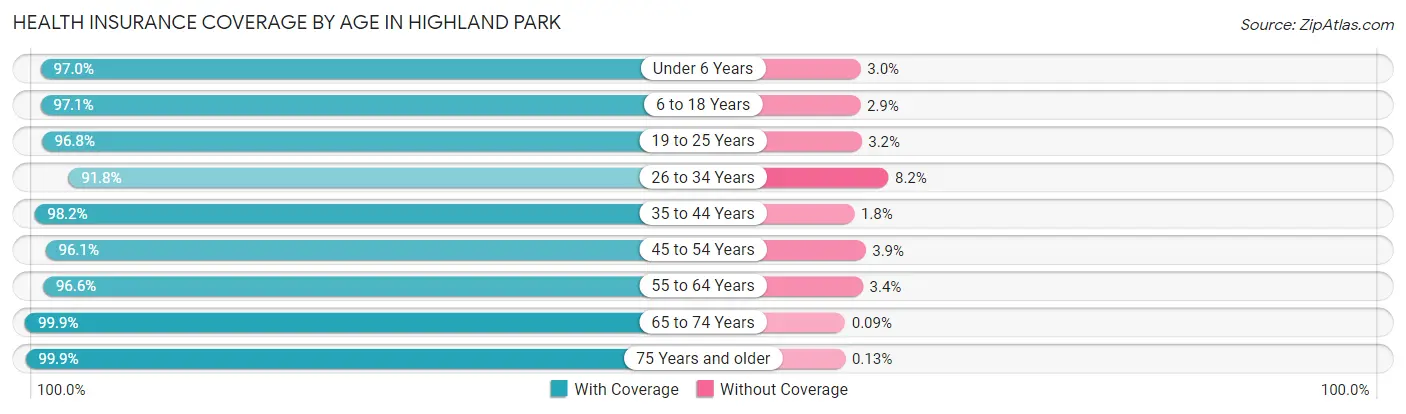
| Age Bracket | With Coverage | Without Coverage |
| Under 6 Years | 2,397 (97.0%) | 74 (3.0%) |
| 6 to 18 Years | 4,899 (97.1%) | 148 (2.9%) |
| 19 to 25 Years | 1,098 (96.8%) | 36 (3.2%) |
| 26 to 34 Years | 1,586 (91.8%) | 141 (8.2%) |
| 35 to 44 Years | 3,584 (98.2%) | 66 (1.8%) |
| 45 to 54 Years | 3,562 (96.1%) | 145 (3.9%) |
| 55 to 64 Years | 4,459 (96.6%) | 158 (3.4%) |
| 65 to 74 Years | 4,303 (99.9%) | 4 (0.1%) |
| 75 Years and older | 3,152 (99.9%) | 4 (0.1%) |
| Total | 29,040 (97.4%) | 776 (2.6%) |
Health Insurance Coverage by Citizenship Status in Highland Park
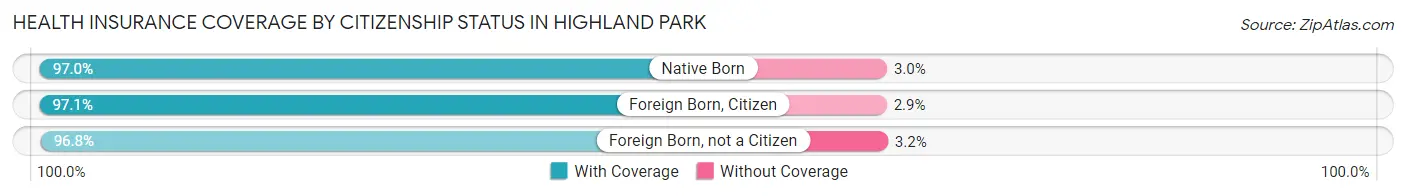
| Citizenship Status | With Coverage | Without Coverage |
| Native Born | 2,397 (97.0%) | 74 (3.0%) |
| Foreign Born, Citizen | 4,899 (97.1%) | 148 (2.9%) |
| Foreign Born, not a Citizen | 1,098 (96.8%) | 36 (3.2%) |
Health Insurance Coverage by Household Income in Highland Park
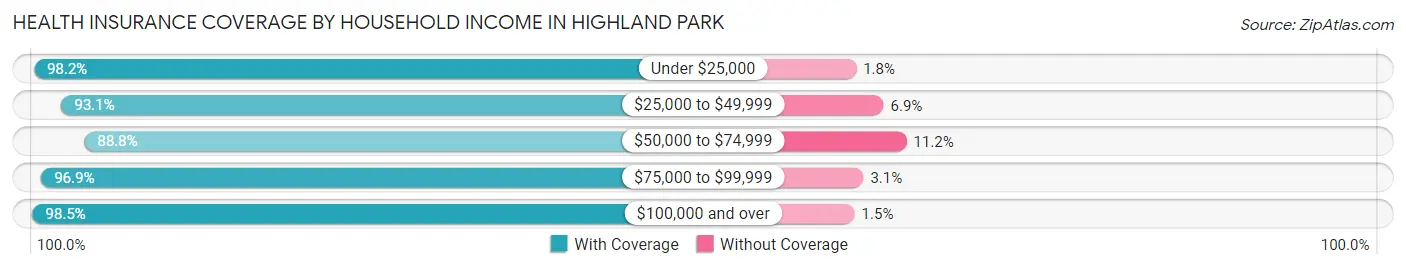
| Household Income | With Coverage | Without Coverage |
| Under $25,000 | 1,117 (98.2%) | 20 (1.8%) |
| $25,000 to $49,999 | 1,622 (93.1%) | 120 (6.9%) |
| $50,000 to $74,999 | 1,929 (88.8%) | 243 (11.2%) |
| $75,000 to $99,999 | 1,738 (96.9%) | 56 (3.1%) |
| $100,000 and over | 22,548 (98.5%) | 337 (1.5%) |
Public vs Private Health Insurance Coverage by Age in Highland Park
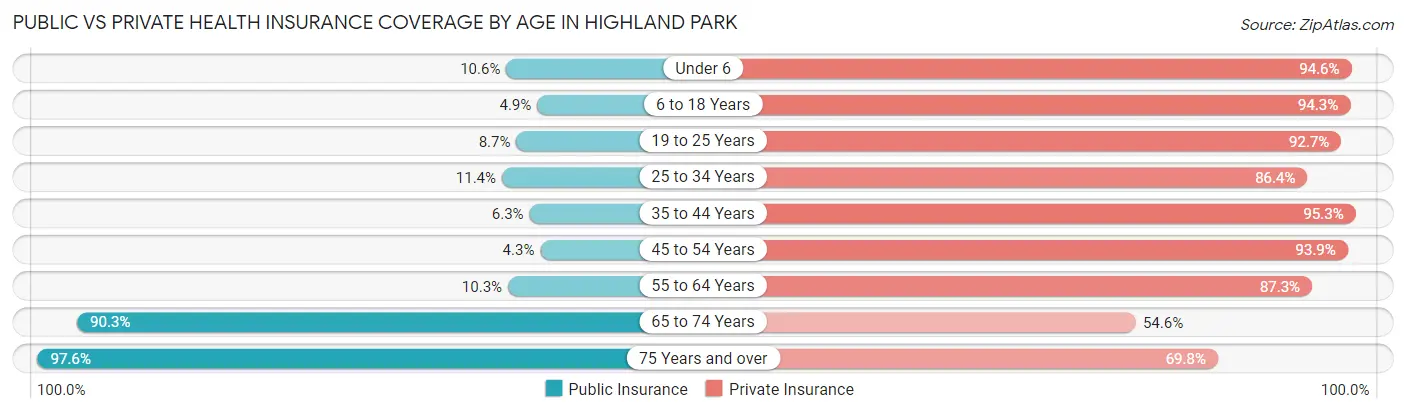
| Age Bracket | Public Insurance | Private Insurance |
| Under 6 | 262 (10.6%) | 2,337 (94.6%) |
| 6 to 18 Years | 246 (4.9%) | 4,761 (94.3%) |
| 19 to 25 Years | 99 (8.7%) | 1,051 (92.7%) |
| 25 to 34 Years | 197 (11.4%) | 1,492 (86.4%) |
| 35 to 44 Years | 230 (6.3%) | 3,480 (95.3%) |
| 45 to 54 Years | 159 (4.3%) | 3,480 (93.9%) |
| 55 to 64 Years | 475 (10.3%) | 4,029 (87.3%) |
| 65 to 74 Years | 3,887 (90.2%) | 2,352 (54.6%) |
| 75 Years and over | 3,080 (97.6%) | 2,202 (69.8%) |
| Total | 8,635 (29.0%) | 25,184 (84.5%) |
Disability Status by Sex by Age in Highland Park
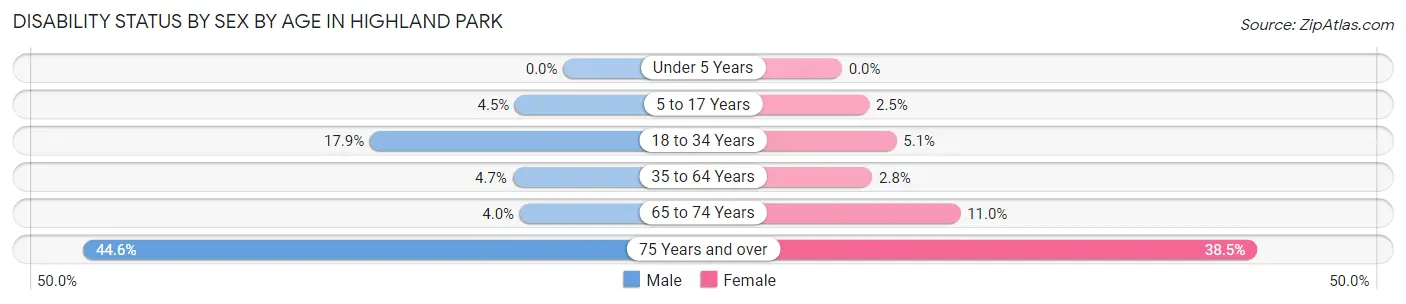
| Age Bracket | Male | Female |
| Under 5 Years | 0 (0.0%) | 0 (0.0%) |
| 5 to 17 Years | 118 (4.5%) | 67 (2.5%) |
| 18 to 34 Years | 275 (17.9%) | 85 (5.1%) |
| 35 to 64 Years | 270 (4.7%) | 175 (2.8%) |
| 65 to 74 Years | 84 (4.0%) | 244 (11.0%) |
| 75 Years and over | 617 (44.6%) | 683 (38.5%) |
Disability Class by Sex by Age in Highland Park
Disability Class: Hearing Difficulty
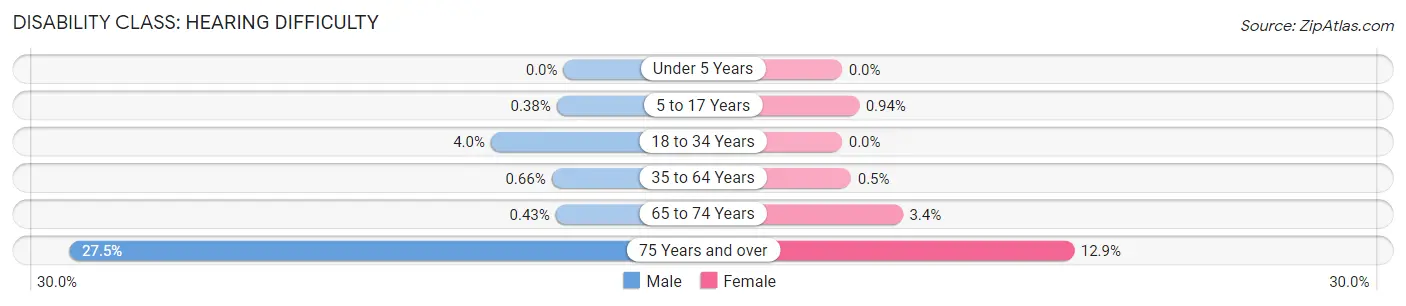
| Age Bracket | Male | Female |
| Under 5 Years | 0 (0.0%) | 0 (0.0%) |
| 5 to 17 Years | 10 (0.4%) | 25 (0.9%) |
| 18 to 34 Years | 62 (4.0%) | 0 (0.0%) |
| 35 to 64 Years | 38 (0.7%) | 31 (0.5%) |
| 65 to 74 Years | 9 (0.4%) | 75 (3.4%) |
| 75 Years and over | 381 (27.5%) | 229 (12.9%) |
Disability Class: Vision Difficulty
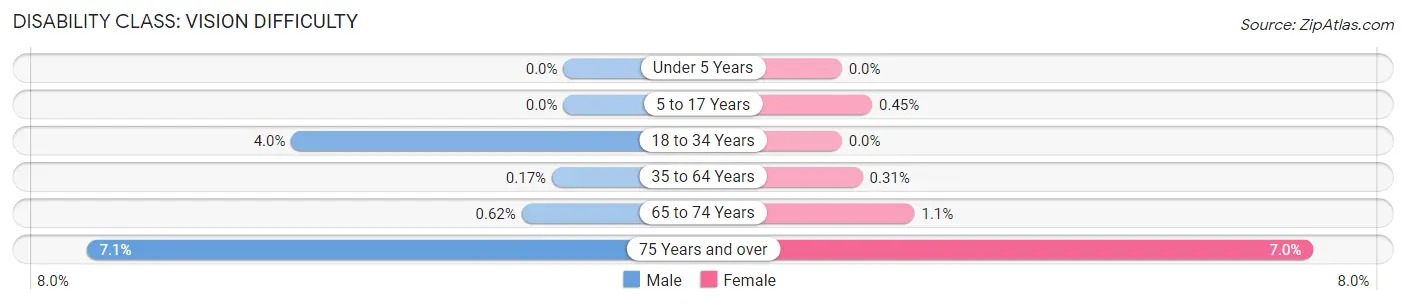
| Age Bracket | Male | Female |
| Under 5 Years | 0 (0.0%) | 0 (0.0%) |
| 5 to 17 Years | 0 (0.0%) | 12 (0.4%) |
| 18 to 34 Years | 62 (4.0%) | 0 (0.0%) |
| 35 to 64 Years | 10 (0.2%) | 19 (0.3%) |
| 65 to 74 Years | 13 (0.6%) | 24 (1.1%) |
| 75 Years and over | 98 (7.1%) | 124 (7.0%) |
Disability Class: Cognitive Difficulty
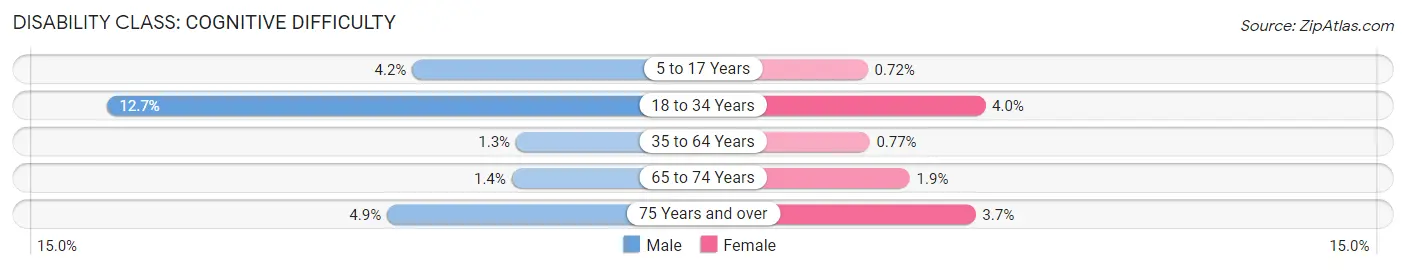
| Age Bracket | Male | Female |
| 5 to 17 Years | 111 (4.2%) | 19 (0.7%) |
| 18 to 34 Years | 195 (12.7%) | 67 (4.0%) |
| 35 to 64 Years | 76 (1.3%) | 48 (0.8%) |
| 65 to 74 Years | 30 (1.4%) | 42 (1.9%) |
| 75 Years and over | 68 (4.9%) | 66 (3.7%) |
Disability Class: Ambulatory Difficulty
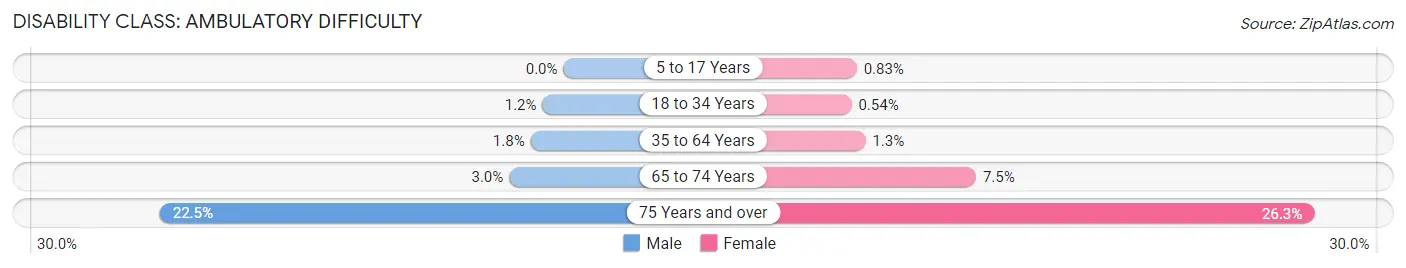
| Age Bracket | Male | Female |
| 5 to 17 Years | 0 (0.0%) | 22 (0.8%) |
| 18 to 34 Years | 18 (1.2%) | 9 (0.5%) |
| 35 to 64 Years | 105 (1.8%) | 82 (1.3%) |
| 65 to 74 Years | 63 (3.0%) | 166 (7.5%) |
| 75 Years and over | 311 (22.5%) | 466 (26.3%) |
Disability Class: Self-Care Difficulty
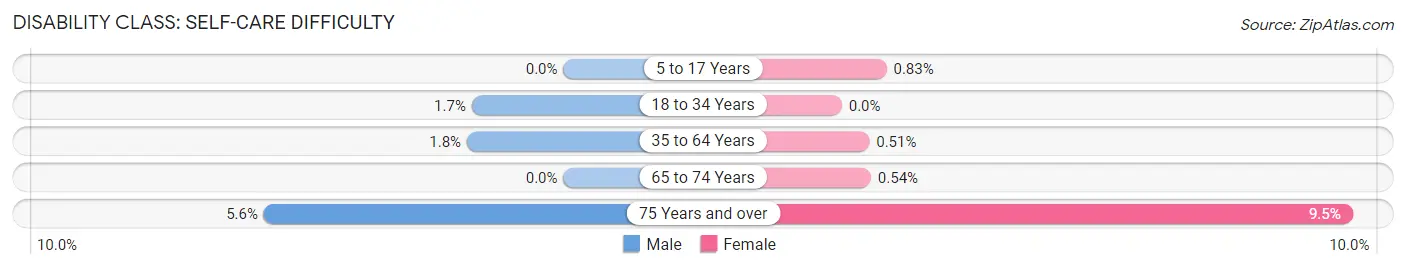
| Age Bracket | Male | Female |
| 5 to 17 Years | 0 (0.0%) | 22 (0.8%) |
| 18 to 34 Years | 26 (1.7%) | 0 (0.0%) |
| 35 to 64 Years | 103 (1.8%) | 32 (0.5%) |
| 65 to 74 Years | 0 (0.0%) | 12 (0.5%) |
| 75 Years and over | 77 (5.6%) | 168 (9.5%) |
Technology Access in Highland Park
Computing Device Access in Highland Park
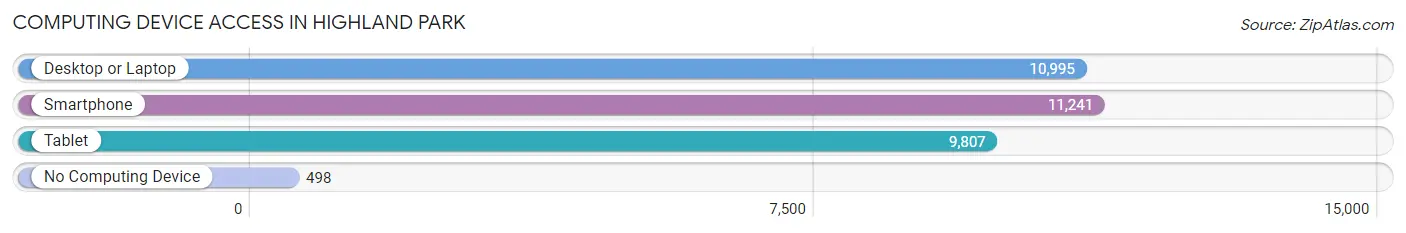
| Device Type | # Households | % Households |
| Desktop or Laptop | 10,995 | 90.9% |
| Smartphone | 11,241 | 92.9% |
| Tablet | 9,807 | 81.1% |
| No Computing Device | 498 | 4.1% |
| Total | 12,095 | 100.0% |
Internet Access in Highland Park
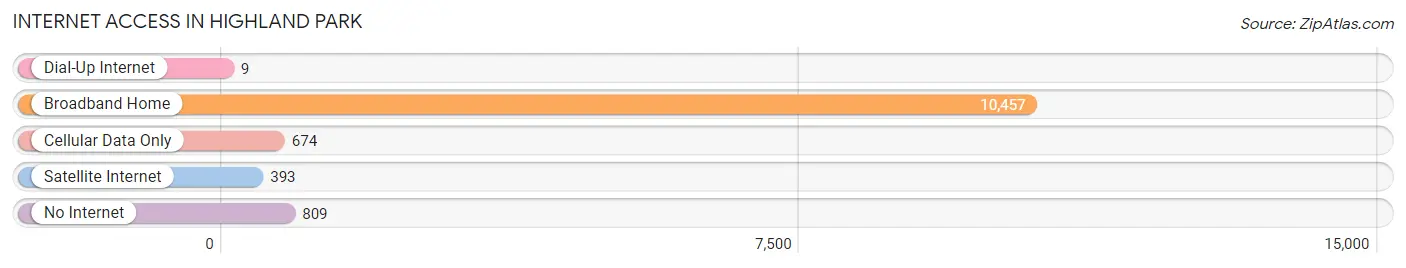
| Internet Type | # Households | % Households |
| Dial-Up Internet | 9 | 0.1% |
| Broadband Home | 10,457 | 86.5% |
| Cellular Data Only | 674 | 5.6% |
| Satellite Internet | 393 | 3.3% |
| No Internet | 809 | 6.7% |
| Total | 12,095 | 100.0% |
Highland Park Summary
Highland Park, Illinois is a small city located in Lake County, Illinois, approximately 25 miles north of Chicago. It is a part of the Chicago metropolitan area and is bordered by the cities of Deerfield, Highwood, Northbrook, and Glencoe. The city has a population of approximately 30,000 people and covers an area of 8.2 square miles.
History
Highland Park was first settled in 1835 by a group of settlers from New England. The settlers were attracted to the area due to its proximity to Lake Michigan and the abundance of natural resources. The city was officially incorporated in 1869 and was named after its high elevation, which provided a view of the lake.
In the late 19th century, Highland Park became a popular summer destination for wealthy Chicagoans. The city was home to several large estates and mansions, and was known for its beautiful parks and gardens.
In the early 20th century, Highland Park began to experience rapid growth due to the influx of new residents. The city was home to several large factories, including the Ravinia Manufacturing Company, which produced furniture and other goods.
Geography
Highland Park is located in Lake County, Illinois, approximately 25 miles north of Chicago. The city is bordered by the cities of Deerfield, Highwood, Northbrook, and Glencoe. The city has a total area of 8.2 square miles, of which 8.1 square miles is land and 0.1 square miles is water.
The city is situated on the western shore of Lake Michigan and is home to several parks and beaches. The city is also home to several small lakes, including Lake Michigan, Lake Forest, and Lake Bluff.
Economy
Highland Park is home to several large businesses and industries. The city is home to several large retail stores, including the Highland Park Shopping Center and the North Shore Plaza. The city is also home to several large manufacturing companies, including the Ravinia Manufacturing Company and the Highland Park Manufacturing Company.
The city is also home to several large medical centers, including the Highland Park Hospital and the North Shore University Health System. The city is also home to several large educational institutions, including the Highland Park High School and the North Shore Community College.
Demographics
As of the 2010 census, the population of Highland Park was 29,763. The racial makeup of the city was 87.3% White, 4.2% African American, 0.2% Native American, 4.7% Asian, 0.1% Pacific Islander, 1.7% from other races, and 2.0% from two or more races. Hispanic or Latino of any race were 5.3% of the population.
The median income for a household in the city was $90,945, and the median income for a family was $106,945. The per capita income for the city was $45,945. About 4.2% of families and 5.7% of the population were below the poverty line, including 6.3% of those under age 18 and 4.2% of those age 65 or over.
Common Questions
What is Per Capita Income in Highland Park?
Per Capita income in Highland Park is $97,953.
What is the Median Family Income in Highland Park?
Median Family Income in Highland Park is $208,419.
What is the Median Household income in Highland Park?
Median Household Income in Highland Park is $159,567.
What is Income or Wage Gap in Highland Park?
Income or Wage Gap in Highland Park is 47.5%.
Women in Highland Park earn 52.5 cents for every dollar earned by a man.
What is Inequality or Gini Index in Highland Park?
Inequality or Gini Index in Highland Park is 0.52.
What is the Total Population of Highland Park?
Total Population of Highland Park is 30,209.
What is the Total Male Population of Highland Park?
Total Male Population of Highland Park is 14,629.
What is the Total Female Population of Highland Park?
Total Female Population of Highland Park is 15,580.
What is the Ratio of Males per 100 Females in Highland Park?
There are 93.90 Males per 100 Females in Highland Park.
What is the Ratio of Females per 100 Males in Highland Park?
There are 106.50 Females per 100 Males in Highland Park.
What is the Median Population Age in Highland Park?
Median Population Age in Highland Park is 48.0 Years.
What is the Average Family Size in Highland Park
Average Family Size in Highland Park is 3.0 People.
What is the Average Household Size in Highland Park
Average Household Size in Highland Park is 2.5 People.
How Large is the Labor Force in Highland Park?
There are 15,470 People in the Labor Forcein in Highland Park.
What is the Percentage of People in the Labor Force in Highland Park?
64.8% of People are in the Labor Force in Highland Park.
What is the Unemployment Rate in Highland Park?
Unemployment Rate in Highland Park is 3.4%.