Lemont, IL Map & Demographics
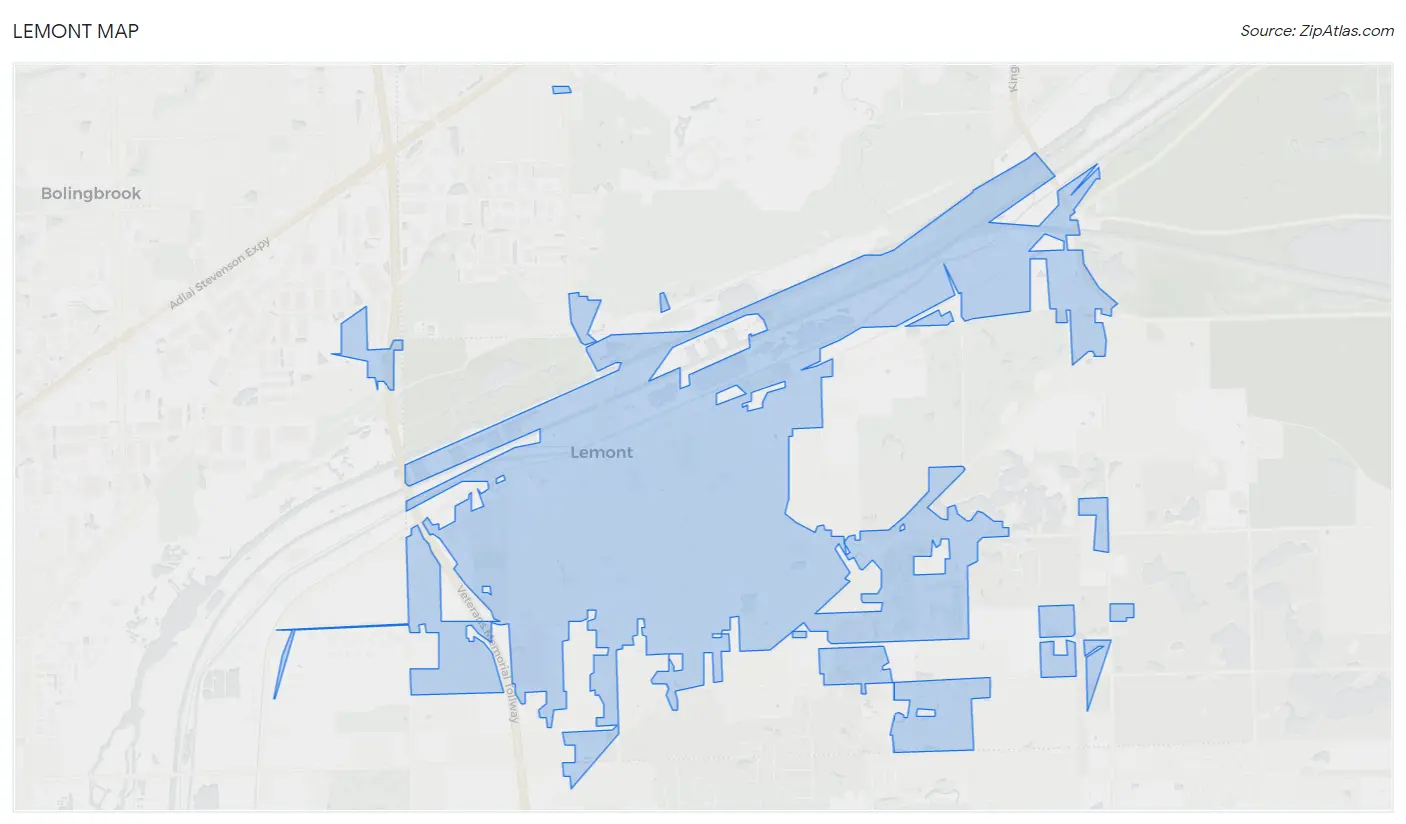
Lemont Map
Lemont Overview
$53,286
PER CAPITA INCOME
$149,003
AVG FAMILY INCOME
$128,694
AVG HOUSEHOLD INCOME
43.3%
WAGE / INCOME GAP [ % ]
56.7¢/ $1
WAGE / INCOME GAP [ $ ]
$5,334
FAMILY INCOME DEFICIT
0.38
INEQUALITY / GINI INDEX
17,558
TOTAL POPULATION
9,102
MALE POPULATION
8,456
FEMALE POPULATION
107.64
MALES / 100 FEMALES
92.90
FEMALES / 100 MALES
44.2
MEDIAN AGE
3.3
AVG FAMILY SIZE
2.8
AVG HOUSEHOLD SIZE
8,949
LABOR FORCE [ PEOPLE ]
64.0%
PERCENT IN LABOR FORCE
3.9%
UNEMPLOYMENT RATE
Lemont Zip Codes
Income in Lemont
Income Overview in Lemont
Per Capita Income in Lemont is $53,286, while median incomes of families and households are $149,003 and $128,694 respectively.
| Characteristic | Number | Measure |
| Per Capita Income | 17,558 | $53,286 |
| Median Family Income | 4,643 | $149,003 |
| Mean Family Income | 4,643 | $168,703 |
| Median Household Income | 6,235 | $128,694 |
| Mean Household Income | 6,235 | $146,880 |
| Income Deficit | 4,643 | $5,334 |
| Wage / Income Gap (%) | 17,558 | 43.30% |
| Wage / Income Gap ($) | 17,558 | 56.70¢ per $1 |
| Gini / Inequality Index | 17,558 | 0.38 |
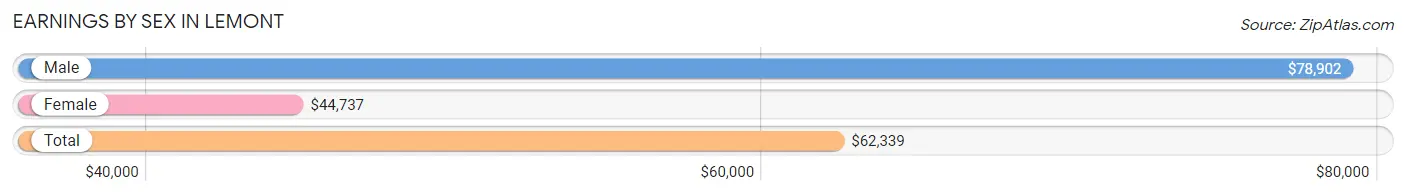
Earnings by Sex in Lemont
Average Earnings in Lemont are $62,339, $78,902 for men and $44,737 for women, a difference of 43.3%.
| Sex | Number | Average Earnings |
| Male | 5,051 (54.6%) | $78,902 |
| Female | 4,202 (45.4%) | $44,737 |
| Total | 9,253 (100.0%) | $62,339 |
Earnings by Sex by Income Bracket in Lemont
The most common earnings brackets in Lemont are $100,000+ for men (1,930 | 38.2%) and $100,000+ for women (635 | 15.1%).
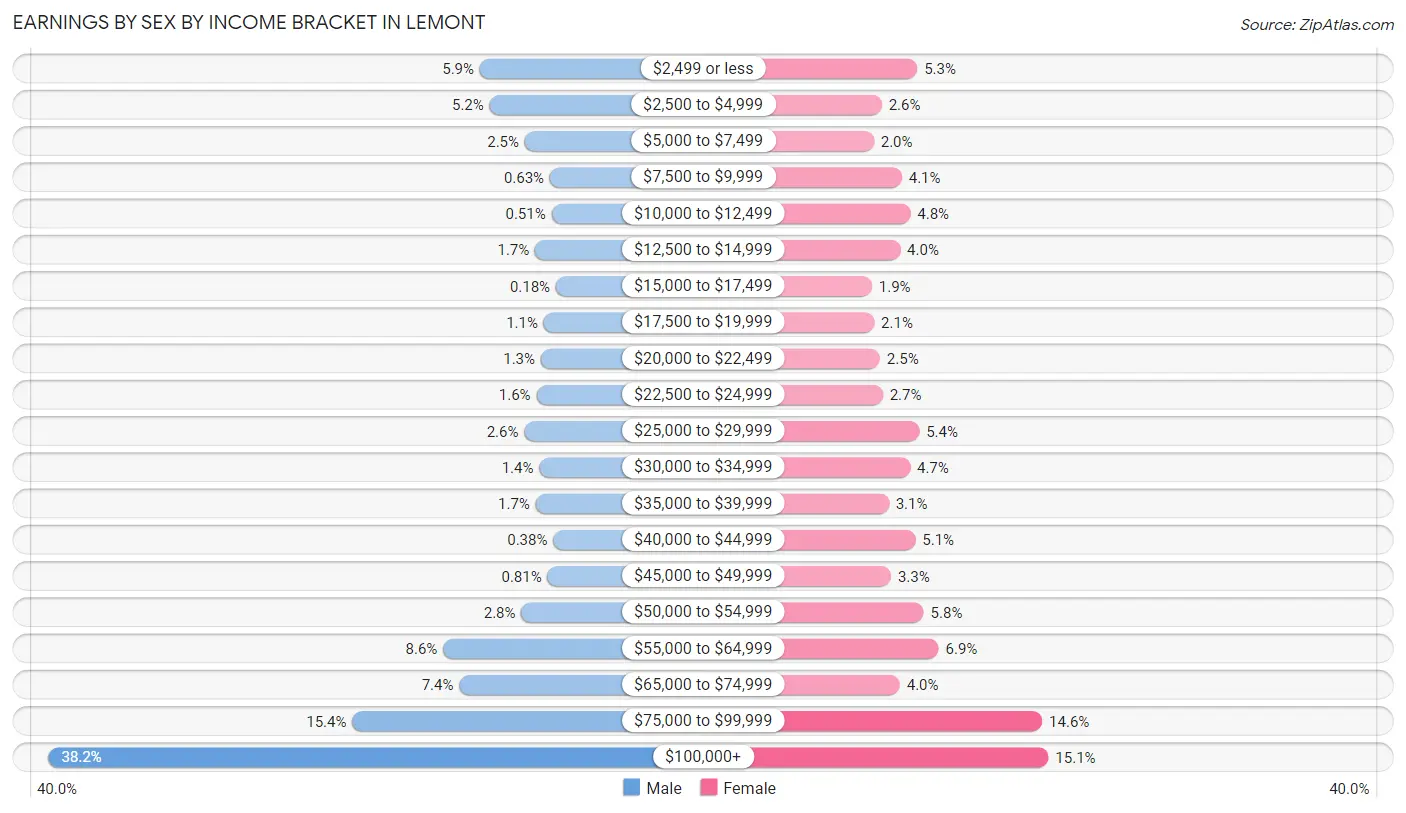
| Income | Male | Female |
| $2,499 or less | 297 (5.9%) | 222 (5.3%) |
| $2,500 to $4,999 | 260 (5.1%) | 110 (2.6%) |
| $5,000 to $7,499 | 127 (2.5%) | 85 (2.0%) |
| $7,500 to $9,999 | 32 (0.6%) | 173 (4.1%) |
| $10,000 to $12,499 | 26 (0.5%) | 200 (4.8%) |
| $12,500 to $14,999 | 88 (1.7%) | 168 (4.0%) |
| $15,000 to $17,499 | 9 (0.2%) | 79 (1.9%) |
| $17,500 to $19,999 | 55 (1.1%) | 86 (2.1%) |
| $20,000 to $22,499 | 66 (1.3%) | 104 (2.5%) |
| $22,500 to $24,999 | 83 (1.6%) | 113 (2.7%) |
| $25,000 to $29,999 | 129 (2.5%) | 228 (5.4%) |
| $30,000 to $34,999 | 72 (1.4%) | 199 (4.7%) |
| $35,000 to $39,999 | 86 (1.7%) | 132 (3.1%) |
| $40,000 to $44,999 | 19 (0.4%) | 216 (5.1%) |
| $45,000 to $49,999 | 41 (0.8%) | 139 (3.3%) |
| $50,000 to $54,999 | 140 (2.8%) | 242 (5.8%) |
| $55,000 to $64,999 | 436 (8.6%) | 289 (6.9%) |
| $65,000 to $74,999 | 375 (7.4%) | 167 (4.0%) |
| $75,000 to $99,999 | 780 (15.4%) | 615 (14.6%) |
| $100,000+ | 1,930 (38.2%) | 635 (15.1%) |
| Total | 5,051 (100.0%) | 4,202 (100.0%) |
Earnings by Sex by Educational Attainment in Lemont
Average earnings in Lemont are $86,563 for men and $53,144 for women, a difference of 38.6%. Men with an educational attainment of graduate degree enjoy the highest average annual earnings of $139,255, while those with college or associate's degree education earn the least with $72,253. Women with an educational attainment of graduate degree earn the most with the average annual earnings of $86,467, while those with high school diploma education have the smallest earnings of $27,992.
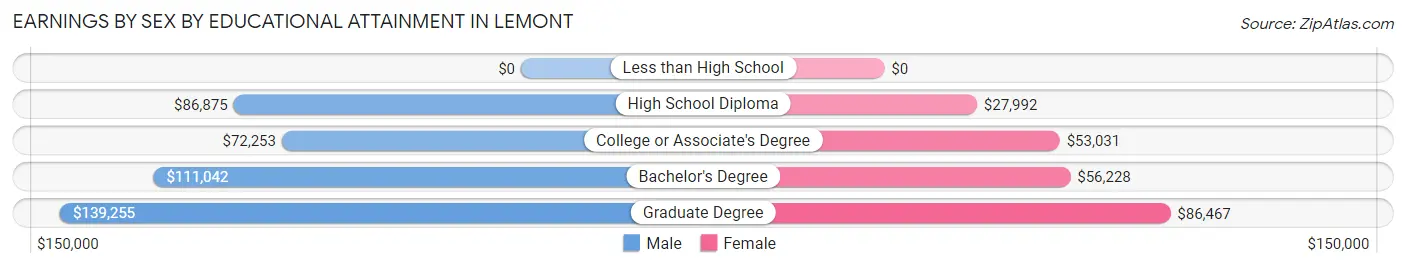
| Educational Attainment | Male Income | Female Income |
| Less than High School | - | - |
| High School Diploma | $86,875 | $27,992 |
| College or Associate's Degree | $72,253 | $53,031 |
| Bachelor's Degree | $111,042 | $56,228 |
| Graduate Degree | $139,255 | $86,467 |
| Total | $86,563 | $53,144 |
Family Income in Lemont
Family Income Brackets in Lemont
According to the Lemont family income data, there are 1,263 families falling into the $200,000+ income range, which is the most common income bracket and makes up 27.2% of all families. Conversely, the less than $10,000 income bracket is the least frequent group with only 14 families (0.3%) belonging to this category.
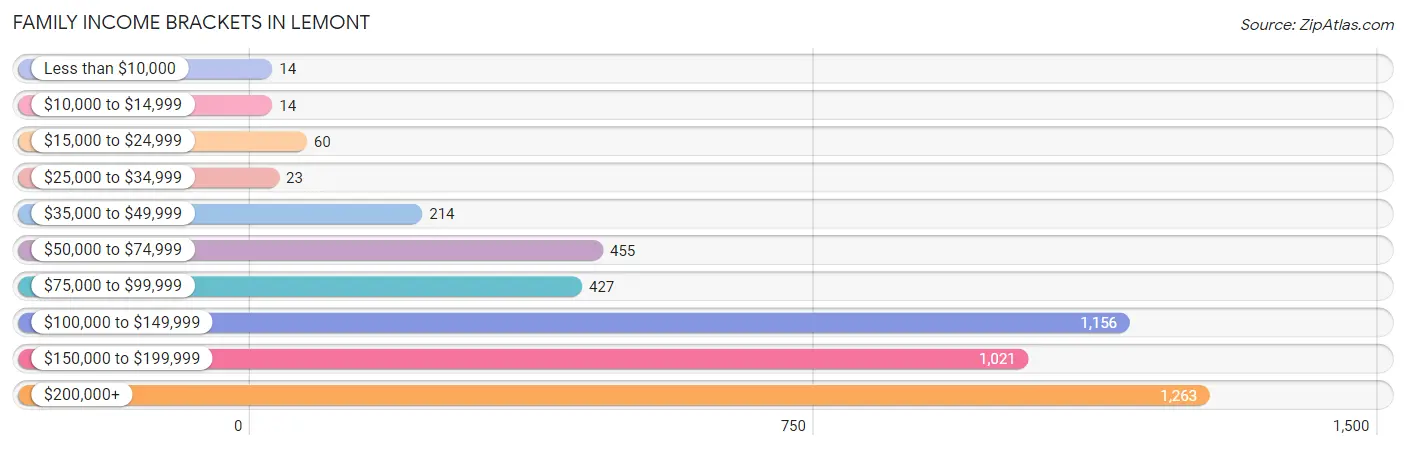
| Income Bracket | # Families | % Families |
| Less than $10,000 | 14 | 0.3% |
| $10,000 to $14,999 | 14 | 0.3% |
| $15,000 to $24,999 | 60 | 1.3% |
| $25,000 to $34,999 | 23 | 0.5% |
| $35,000 to $49,999 | 214 | 4.6% |
| $50,000 to $74,999 | 455 | 9.8% |
| $75,000 to $99,999 | 427 | 9.2% |
| $100,000 to $149,999 | 1,156 | 24.9% |
| $150,000 to $199,999 | 1,021 | 22.0% |
| $200,000+ | 1,263 | 27.2% |
Family Income by Famaliy Size in Lemont
7+ person families (73 | 1.6%) account for the highest median family income in Lemont with $223,750 per family, while 3-person families (970 | 20.9%) have the highest median income of $55,538 per family member.
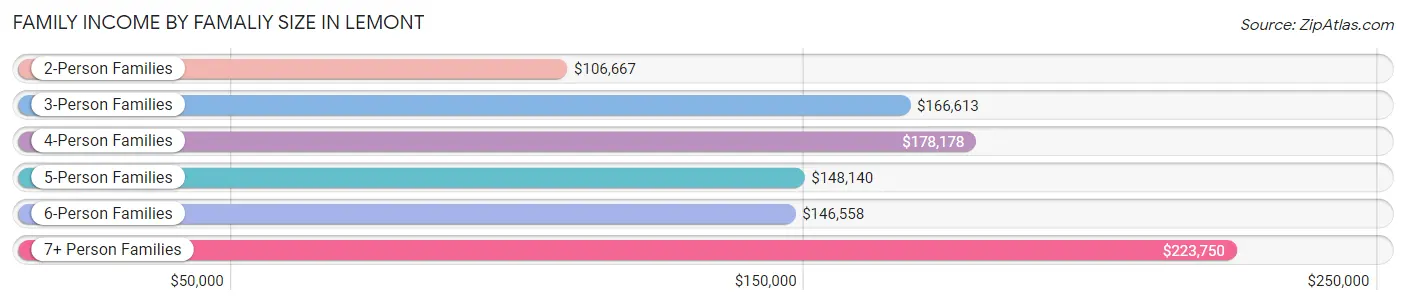
| Income Bracket | # Families | Median Income |
| 2-Person Families | 1,844 (39.7%) | $106,667 |
| 3-Person Families | 970 (20.9%) | $166,613 |
| 4-Person Families | 1,291 (27.8%) | $178,178 |
| 5-Person Families | 374 (8.1%) | $148,140 |
| 6-Person Families | 91 (2.0%) | $146,558 |
| 7+ Person Families | 73 (1.6%) | $223,750 |
| Total | 4,643 (100.0%) | $149,003 |
Family Income by Number of Earners in Lemont
The median family income in Lemont is $149,003, with families comprising 3+ earners (669) having the highest median family income of $175,972, while families with no earners (638) have the lowest median family income of $77,628, accounting for 14.4% and 13.7% of families, respectively.
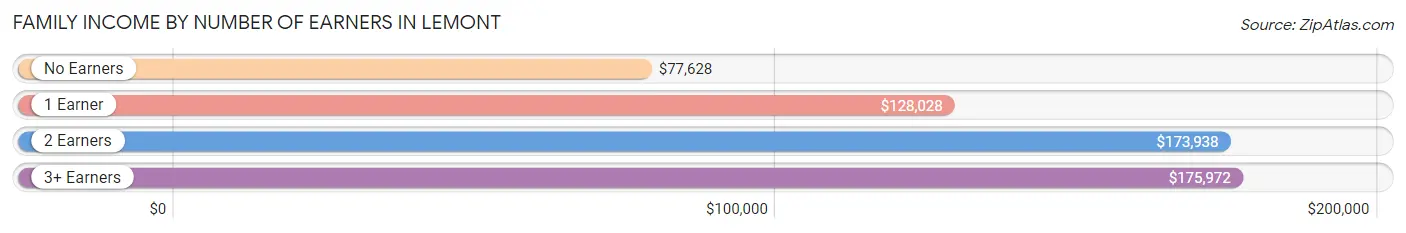
| Number of Earners | # Families | Median Income |
| No Earners | 638 (13.7%) | $77,628 |
| 1 Earner | 1,087 (23.4%) | $128,028 |
| 2 Earners | 2,249 (48.4%) | $173,938 |
| 3+ Earners | 669 (14.4%) | $175,972 |
| Total | 4,643 (100.0%) | $149,003 |
Household Income in Lemont
Household Income Brackets in Lemont
With 1,422 households falling in the category, the $100,000 to $149,999 income range is the most frequent in Lemont, accounting for 22.8% of all households. In contrast, only 19 households (0.3%) fall into the $10,000 to $14,999 income bracket, making it the least populous group.
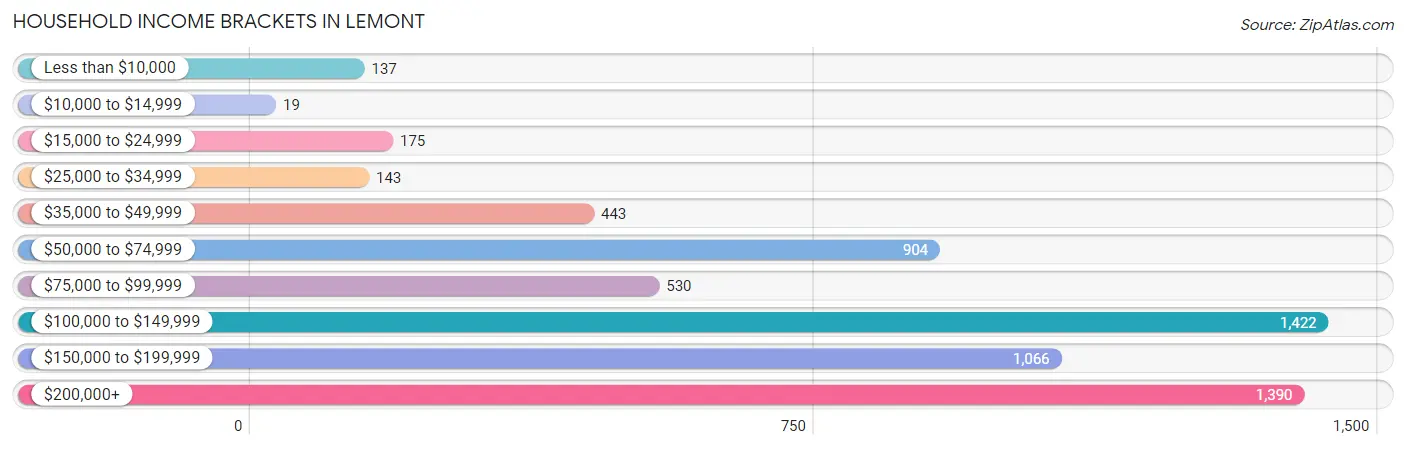
| Income Bracket | # Households | % Households |
| Less than $10,000 | 137 | 2.2% |
| $10,000 to $14,999 | 19 | 0.3% |
| $15,000 to $24,999 | 175 | 2.8% |
| $25,000 to $34,999 | 143 | 2.3% |
| $35,000 to $49,999 | 443 | 7.1% |
| $50,000 to $74,999 | 904 | 14.5% |
| $75,000 to $99,999 | 530 | 8.5% |
| $100,000 to $149,999 | 1,422 | 22.8% |
| $150,000 to $199,999 | 1,066 | 17.1% |
| $200,000+ | 1,390 | 22.3% |
Household Income by Householder Age in Lemont
The median household income in Lemont is $128,694, with the highest median household income of $148,241 found in the 25 to 44 years age bracket for the primary householder. A total of 1,489 households (23.9%) fall into this category. Meanwhile, the 15 to 24 years age bracket for the primary householder has the lowest median household income of $0, with 54 households (0.9%) in this group.
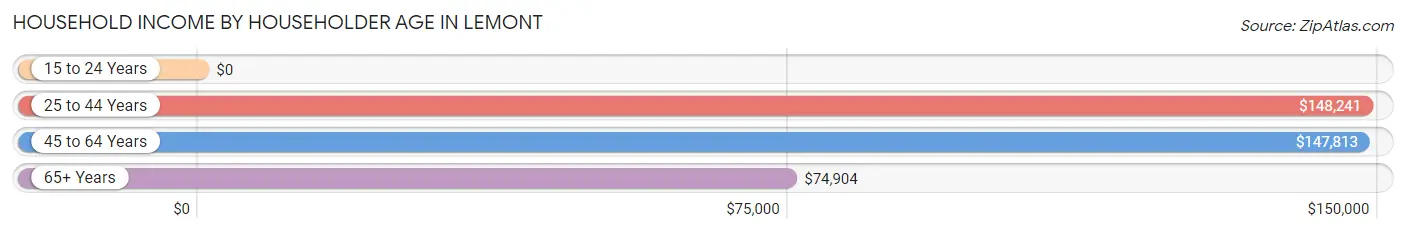
| Income Bracket | # Households | Median Income |
| 15 to 24 Years | 54 (0.9%) | $0 |
| 25 to 44 Years | 1,489 (23.9%) | $148,241 |
| 45 to 64 Years | 2,706 (43.4%) | $147,813 |
| 65+ Years | 1,986 (31.9%) | $74,904 |
| Total | 6,235 (100.0%) | $128,694 |
Poverty in Lemont
Income Below Poverty by Sex and Age in Lemont
With 1.6% poverty level for males and 3.4% for females among the residents of Lemont, 55 to 64 year old males and 55 to 64 year old females are the most vulnerable to poverty, with 60 males (4.3%) and 145 females (10.9%) in their respective age groups living below the poverty level.
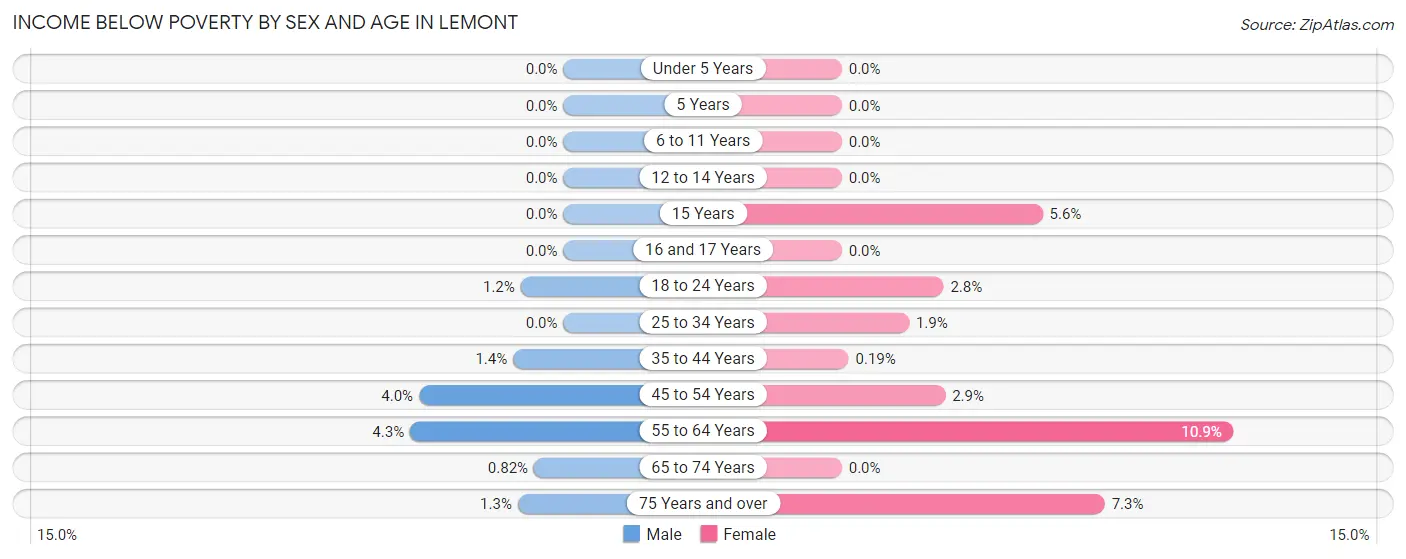
| Age Bracket | Male | Female |
| Under 5 Years | 0 (0.0%) | 0 (0.0%) |
| 5 Years | 0 (0.0%) | 0 (0.0%) |
| 6 to 11 Years | 0 (0.0%) | 0 (0.0%) |
| 12 to 14 Years | 0 (0.0%) | 0 (0.0%) |
| 15 Years | 0 (0.0%) | 8 (5.6%) |
| 16 and 17 Years | 0 (0.0%) | 0 (0.0%) |
| 18 to 24 Years | 8 (1.2%) | 18 (2.8%) |
| 25 to 34 Years | 0 (0.0%) | 13 (1.9%) |
| 35 to 44 Years | 16 (1.4%) | 2 (0.2%) |
| 45 to 54 Years | 46 (4.0%) | 31 (2.9%) |
| 55 to 64 Years | 60 (4.3%) | 145 (10.9%) |
| 65 to 74 Years | 7 (0.8%) | 0 (0.0%) |
| 75 Years and over | 8 (1.3%) | 68 (7.3%) |
| Total | 145 (1.6%) | 285 (3.4%) |
Income Above Poverty by Sex and Age in Lemont
According to the poverty statistics in Lemont, males aged under 5 years and females aged under 5 years are the age groups that are most secure financially, with 100.0% of males and 100.0% of females in these age groups living above the poverty line.
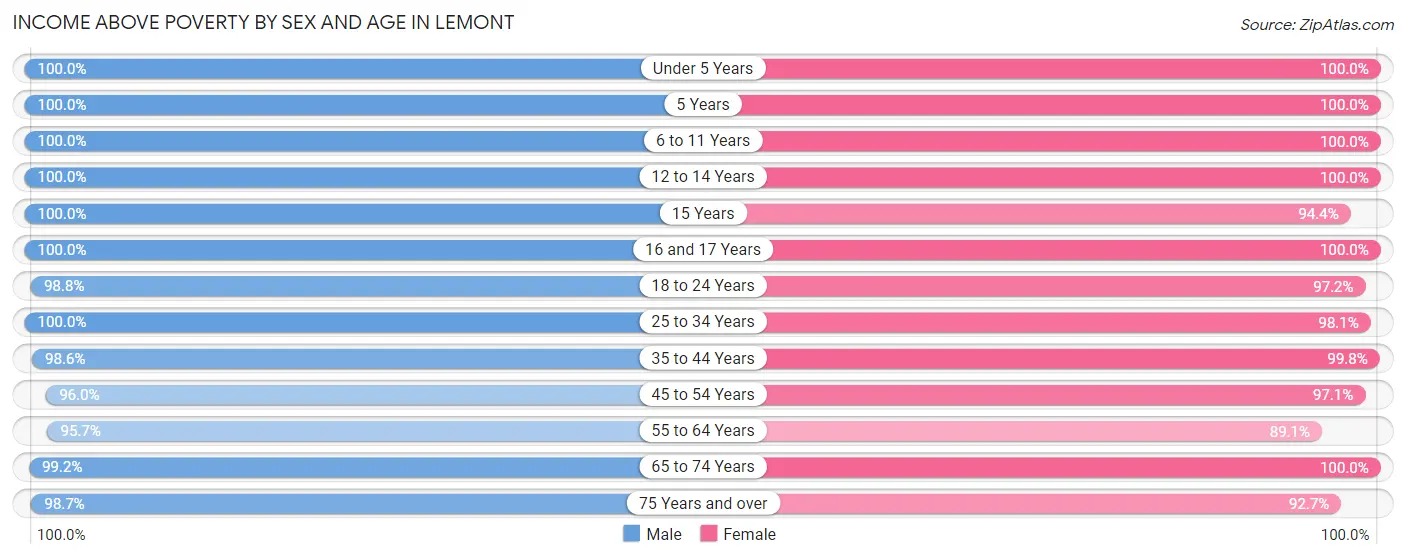
| Age Bracket | Male | Female |
| Under 5 Years | 376 (100.0%) | 428 (100.0%) |
| 5 Years | 134 (100.0%) | 38 (100.0%) |
| 6 to 11 Years | 838 (100.0%) | 768 (100.0%) |
| 12 to 14 Years | 655 (100.0%) | 120 (100.0%) |
| 15 Years | 75 (100.0%) | 135 (94.4%) |
| 16 and 17 Years | 293 (100.0%) | 216 (100.0%) |
| 18 to 24 Years | 664 (98.8%) | 619 (97.2%) |
| 25 to 34 Years | 743 (100.0%) | 684 (98.1%) |
| 35 to 44 Years | 1,125 (98.6%) | 1,055 (99.8%) |
| 45 to 54 Years | 1,098 (96.0%) | 1,045 (97.1%) |
| 55 to 64 Years | 1,346 (95.7%) | 1,184 (89.1%) |
| 65 to 74 Years | 851 (99.2%) | 903 (100.0%) |
| 75 Years and over | 620 (98.7%) | 861 (92.7%) |
| Total | 8,818 (98.4%) | 8,056 (96.6%) |
Income Below Poverty Among Married-Couple Families in Lemont
The poverty statistics for married-couple families in Lemont show that 1.4% or 58 of the total 4,016 families live below the poverty line. Families with no children have the highest poverty rate of 2.7%, comprising of 58 families. On the other hand, families with 1 or 2 children have the lowest poverty rate of 0.0%, which includes 0 families.
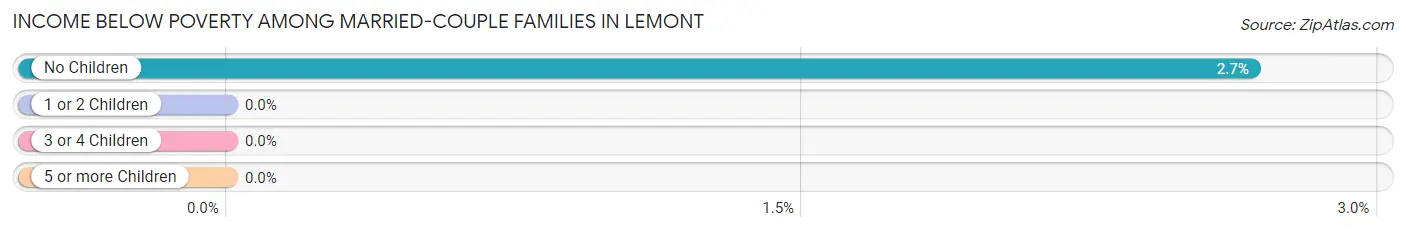
| Children | Above Poverty | Below Poverty |
| No Children | 2,117 (97.3%) | 58 (2.7%) |
| 1 or 2 Children | 1,548 (100.0%) | 0 (0.0%) |
| 3 or 4 Children | 254 (100.0%) | 0 (0.0%) |
| 5 or more Children | 39 (100.0%) | 0 (0.0%) |
| Total | 3,958 (98.6%) | 58 (1.4%) |
Income Below Poverty Among Single-Parent Households in Lemont
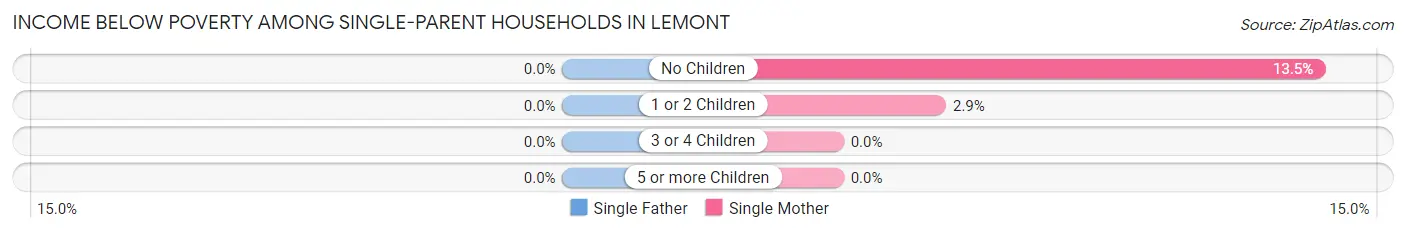
| Children | Single Father | Single Mother |
| No Children | 0 (0.0%) | 23 (13.5%) |
| 1 or 2 Children | 0 (0.0%) | 8 (2.9%) |
| 3 or 4 Children | 0 (0.0%) | 0 (0.0%) |
| 5 or more Children | 0 (0.0%) | 0 (0.0%) |
| Total | 0 (0.0%) | 31 (6.0%) |
Income Below Poverty Among Married-Couple vs Single-Parent Households in Lemont
The poverty data for Lemont shows that 58 of the married-couple family households (1.4%) and 31 of the single-parent households (4.9%) are living below the poverty level. Within the married-couple family households, those with no children have the highest poverty rate, with 58 households (2.7%) falling below the poverty line. Among the single-parent households, those with no children have the highest poverty rate, with 23 household (10.1%) living below poverty.
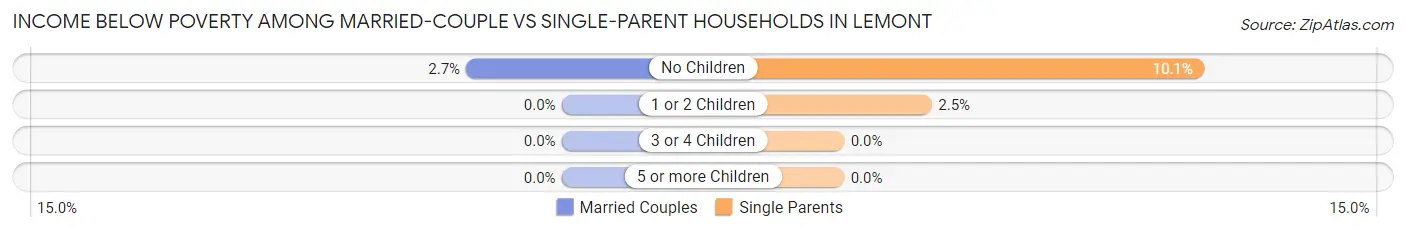
| Children | Married-Couple Families | Single-Parent Households |
| No Children | 58 (2.7%) | 23 (10.1%) |
| 1 or 2 Children | 0 (0.0%) | 8 (2.5%) |
| 3 or 4 Children | 0 (0.0%) | 0 (0.0%) |
| 5 or more Children | 0 (0.0%) | 0 (0.0%) |
| Total | 58 (1.4%) | 31 (4.9%) |
Race in Lemont
The most populous races in Lemont are White / Caucasian (15,946 | 90.8%), Hispanic or Latino (1,222 | 7.0%), and Two or more Races (920 | 5.2%).
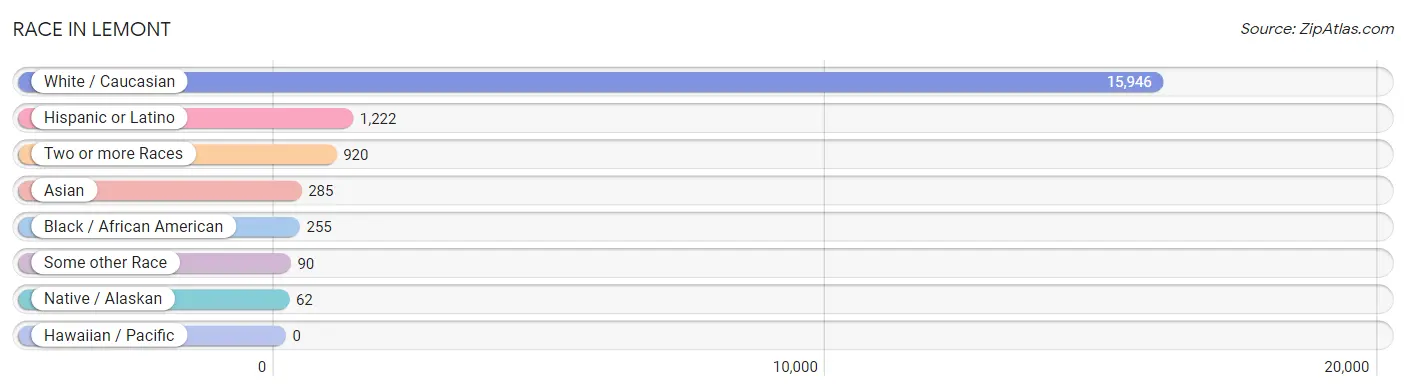
| Race | # Population | % Population |
| Asian | 285 | 1.6% |
| Black / African American | 255 | 1.5% |
| Hawaiian / Pacific | 0 | 0.0% |
| Hispanic or Latino | 1,222 | 7.0% |
| Native / Alaskan | 62 | 0.4% |
| White / Caucasian | 15,946 | 90.8% |
| Two or more Races | 920 | 5.2% |
| Some other Race | 90 | 0.5% |
| Total | 17,558 | 100.0% |
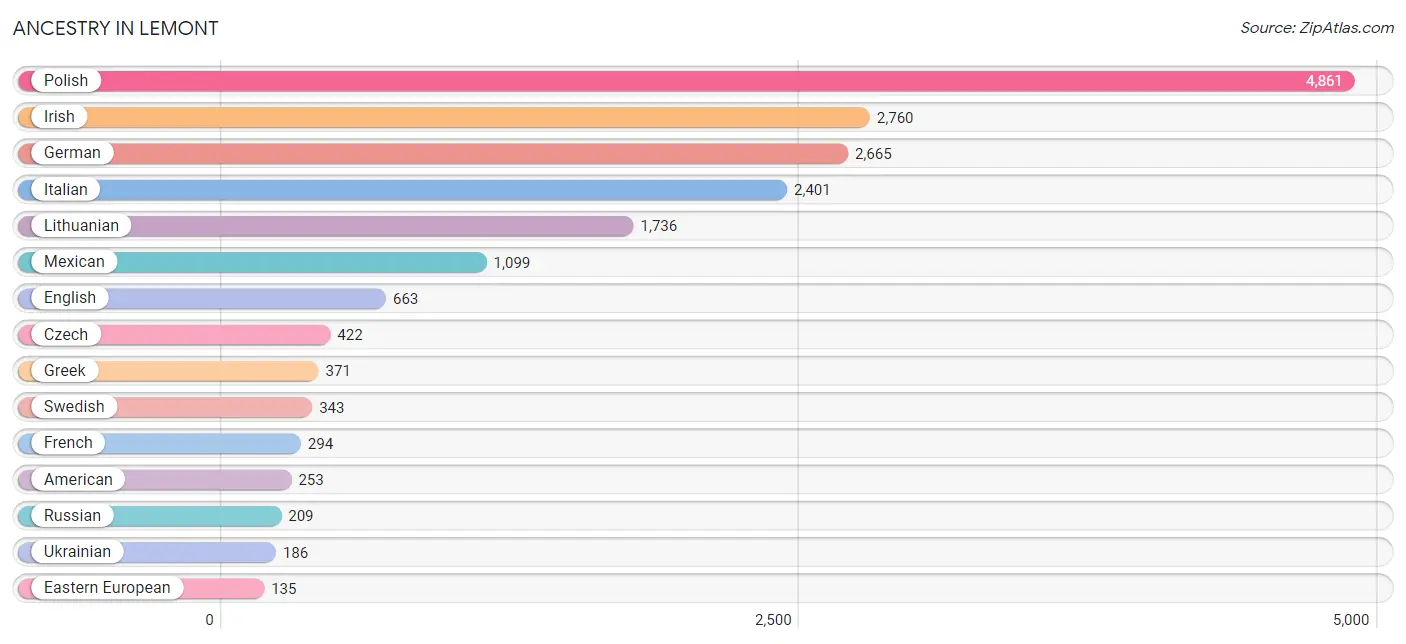
Ancestry in Lemont
The most populous ancestries reported in Lemont are Polish (4,861 | 27.7%), Irish (2,760 | 15.7%), German (2,665 | 15.2%), Italian (2,401 | 13.7%), and Lithuanian (1,736 | 9.9%), together accounting for 82.1% of all Lemont residents.
| Ancestry | # Population | % Population |
| American | 253 | 1.4% |
| Arab | 86 | 0.5% |
| Armenian | 21 | 0.1% |
| Assyrian / Chaldean / Syriac | 4 | 0.0% |
| Austrian | 100 | 0.6% |
| British | 67 | 0.4% |
| Burmese | 41 | 0.2% |
| Cherokee | 50 | 0.3% |
| Choctaw | 4 | 0.0% |
| Croatian | 66 | 0.4% |
| Czech | 422 | 2.4% |
| Czechoslovakian | 36 | 0.2% |
| Danish | 51 | 0.3% |
| Dutch | 125 | 0.7% |
| Eastern European | 135 | 0.8% |
| English | 663 | 3.8% |
| European | 108 | 0.6% |
| French | 294 | 1.7% |
| French Canadian | 37 | 0.2% |
| German | 2,665 | 15.2% |
| Greek | 371 | 2.1% |
| Haitian | 18 | 0.1% |
| Hungarian | 115 | 0.6% |
| Indian (Asian) | 51 | 0.3% |
| Iranian | 20 | 0.1% |
| Irish | 2,760 | 15.7% |
| Italian | 2,401 | 13.7% |
| Jamaican | 44 | 0.3% |
| Korean | 131 | 0.7% |
| Lithuanian | 1,736 | 9.9% |
| Macedonian | 29 | 0.2% |
| Mexican | 1,099 | 6.3% |
| Mexican American Indian | 58 | 0.3% |
| Northern European | 9 | 0.1% |
| Norwegian | 111 | 0.6% |
| Pakistani | 109 | 0.6% |
| Palestinian | 13 | 0.1% |
| Peruvian | 18 | 0.1% |
| Polish | 4,861 | 27.7% |
| Puerto Rican | 50 | 0.3% |
| Romanian | 39 | 0.2% |
| Russian | 209 | 1.2% |
| Scandinavian | 31 | 0.2% |
| Scotch-Irish | 109 | 0.6% |
| Scottish | 52 | 0.3% |
| Serbian | 61 | 0.4% |
| Sioux | 46 | 0.3% |
| Slavic | 30 | 0.2% |
| Slovak | 54 | 0.3% |
| Slovene | 45 | 0.3% |
| South American | 18 | 0.1% |
| Spaniard | 15 | 0.1% |
| Spanish | 40 | 0.2% |
| Swedish | 343 | 1.9% |
| Swiss | 67 | 0.4% |
| Thai | 97 | 0.5% |
| Ukrainian | 186 | 1.1% |
| Welsh | 75 | 0.4% |
| Yugoslavian | 14 | 0.1% | View All 59 Rows |
Immigrants in Lemont
The most numerous immigrant groups reported in Lemont came from Europe (2,363 | 13.5%), Eastern Europe (2,134 | 12.1%), Poland (1,366 | 7.8%), Lithuania (661 | 3.8%), and Asia (211 | 1.2%), together accounting for 38.4% of all Lemont residents.
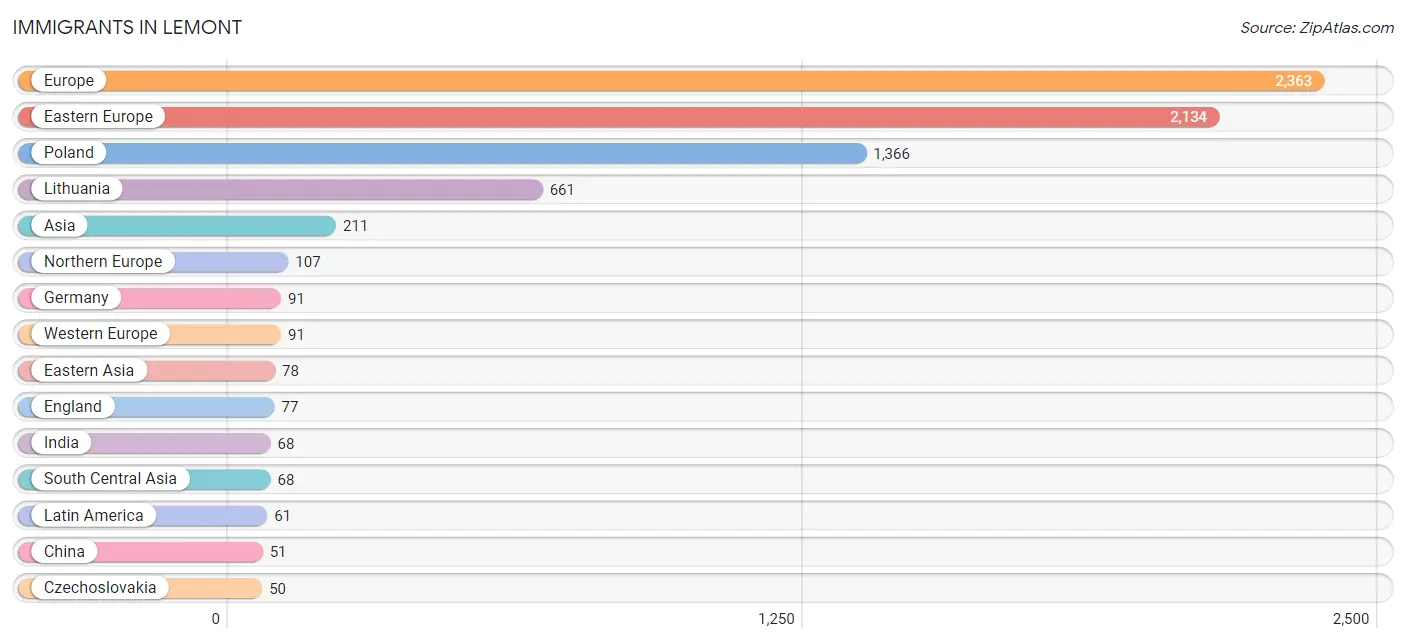
| Immigration Origin | # Population | % Population |
| Asia | 211 | 1.2% |
| Canada | 8 | 0.1% |
| Central America | 43 | 0.2% |
| China | 51 | 0.3% |
| Czechoslovakia | 50 | 0.3% |
| Eastern Asia | 78 | 0.4% |
| Eastern Europe | 2,134 | 12.1% |
| England | 77 | 0.4% |
| Europe | 2,363 | 13.5% |
| Germany | 91 | 0.5% |
| Greece | 9 | 0.1% |
| India | 68 | 0.4% |
| Ireland | 30 | 0.2% |
| Italy | 22 | 0.1% |
| Jordan | 16 | 0.1% |
| Korea | 27 | 0.2% |
| Latin America | 61 | 0.4% |
| Lithuania | 661 | 3.8% |
| Mexico | 43 | 0.2% |
| Moldova | 24 | 0.1% |
| North Macedonia | 19 | 0.1% |
| Northern Europe | 107 | 0.6% |
| Peru | 18 | 0.1% |
| Philippines | 49 | 0.3% |
| Poland | 1,366 | 7.8% |
| Russia | 14 | 0.1% |
| South America | 18 | 0.1% |
| South Central Asia | 68 | 0.4% |
| South Eastern Asia | 49 | 0.3% |
| Southern Europe | 31 | 0.2% |
| Western Asia | 16 | 0.1% |
| Western Europe | 91 | 0.5% | View All 32 Rows |
Sex and Age in Lemont
Sex and Age in Lemont
The most populous age groups in Lemont are 10 to 14 Years (858 | 9.4%) for men and 55 to 59 Years (871 | 10.3%) for women.
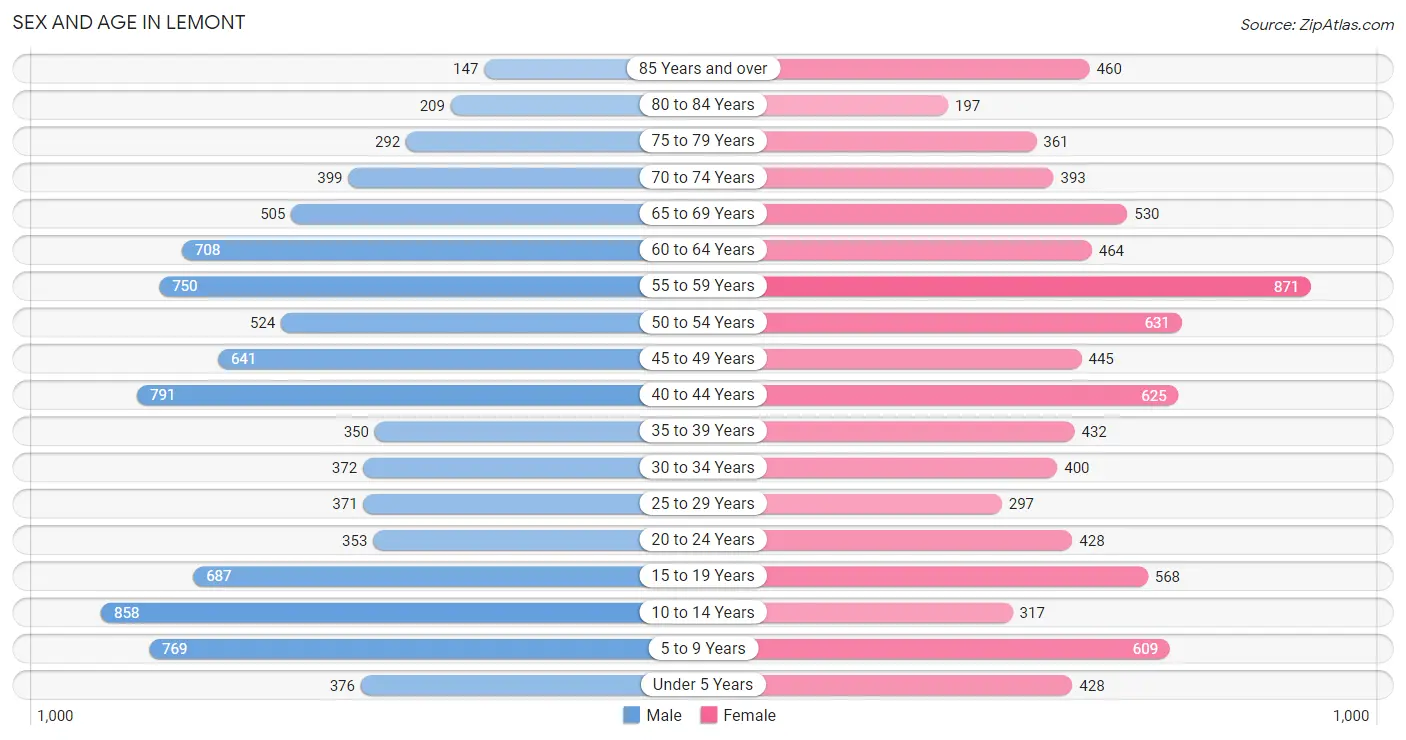
| Age Bracket | Male | Female |
| Under 5 Years | 376 (4.1%) | 428 (5.1%) |
| 5 to 9 Years | 769 (8.5%) | 609 (7.2%) |
| 10 to 14 Years | 858 (9.4%) | 317 (3.7%) |
| 15 to 19 Years | 687 (7.5%) | 568 (6.7%) |
| 20 to 24 Years | 353 (3.9%) | 428 (5.1%) |
| 25 to 29 Years | 371 (4.1%) | 297 (3.5%) |
| 30 to 34 Years | 372 (4.1%) | 400 (4.7%) |
| 35 to 39 Years | 350 (3.8%) | 432 (5.1%) |
| 40 to 44 Years | 791 (8.7%) | 625 (7.4%) |
| 45 to 49 Years | 641 (7.0%) | 445 (5.3%) |
| 50 to 54 Years | 524 (5.8%) | 631 (7.5%) |
| 55 to 59 Years | 750 (8.2%) | 871 (10.3%) |
| 60 to 64 Years | 708 (7.8%) | 464 (5.5%) |
| 65 to 69 Years | 505 (5.6%) | 530 (6.3%) |
| 70 to 74 Years | 399 (4.4%) | 393 (4.6%) |
| 75 to 79 Years | 292 (3.2%) | 361 (4.3%) |
| 80 to 84 Years | 209 (2.3%) | 197 (2.3%) |
| 85 Years and over | 147 (1.6%) | 460 (5.4%) |
| Total | 9,102 (100.0%) | 8,456 (100.0%) |
Families and Households in Lemont
Median Family Size in Lemont
The median family size in Lemont is 3.27 persons per family, with married-couple families (4,016 | 86.5%) accounting for the largest median family size of 3.29 persons per family. On the other hand, single male/father families (114 | 2.5%) represent the smallest median family size with 2.90 persons per family.
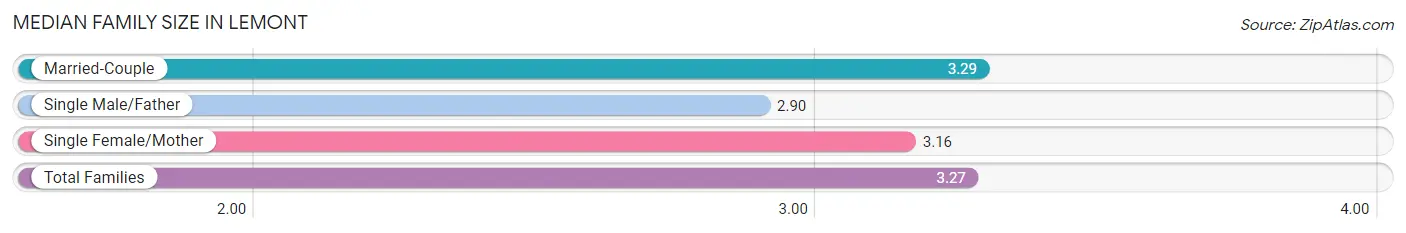
| Family Type | # Families | Family Size |
| Married-Couple | 4,016 (86.5%) | 3.29 |
| Single Male/Father | 114 (2.5%) | 2.90 |
| Single Female/Mother | 513 (11.1%) | 3.16 |
| Total Families | 4,643 (100.0%) | 3.27 |
Median Household Size in Lemont
The median household size in Lemont is 2.77 persons per household, with single female/mother households (513 | 8.2%) accounting for the largest median household size of 3.48 persons per household. non-family households (1,592 | 25.5%) represent the smallest median household size with 1.16 persons per household.
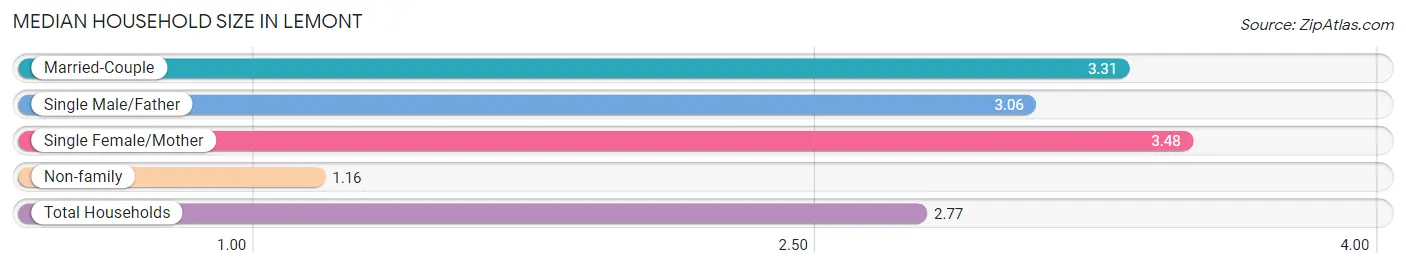
| Household Type | # Households | Household Size |
| Married-Couple | 4,016 (64.4%) | 3.31 |
| Single Male/Father | 114 (1.8%) | 3.06 |
| Single Female/Mother | 513 (8.2%) | 3.48 |
| Non-family | 1,592 (25.5%) | 1.16 |
| Total Households | 6,235 (100.0%) | 2.77 |
Household Size by Marriage Status in Lemont
Out of a total of 6,235 households in Lemont, 4,643 (74.5%) are family households, while 1,592 (25.5%) are nonfamily households. The most numerous type of family households are 2-person households, comprising 1,720, and the most common type of nonfamily households are 1-person households, comprising 1,343.
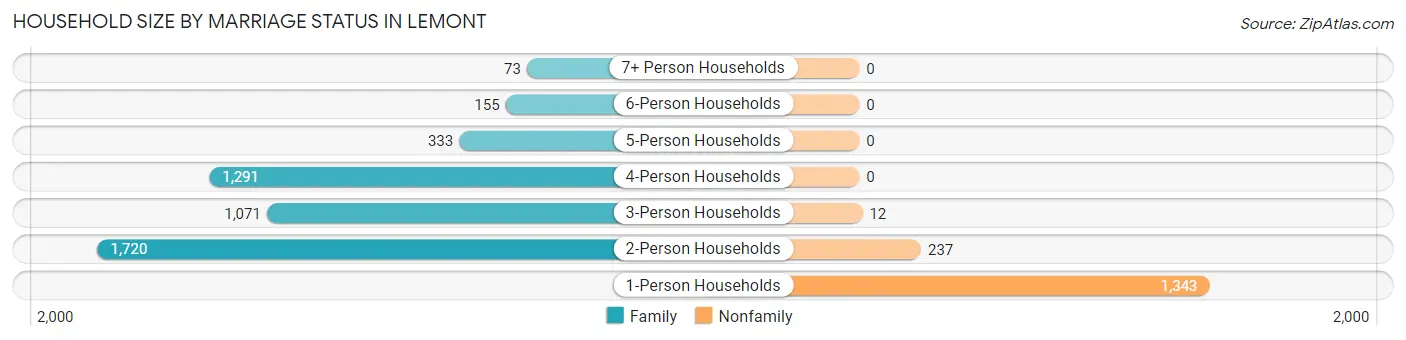
| Household Size | Family Households | Nonfamily Households |
| 1-Person Households | - | 1,343 (21.5%) |
| 2-Person Households | 1,720 (27.6%) | 237 (3.8%) |
| 3-Person Households | 1,071 (17.2%) | 12 (0.2%) |
| 4-Person Households | 1,291 (20.7%) | 0 (0.0%) |
| 5-Person Households | 333 (5.3%) | 0 (0.0%) |
| 6-Person Households | 155 (2.5%) | 0 (0.0%) |
| 7+ Person Households | 73 (1.2%) | 0 (0.0%) |
| Total | 4,643 (74.5%) | 1,592 (25.5%) |
Female Fertility in Lemont
Fertility by Age in Lemont
Average fertility rate in Lemont is 64.0 births per 1,000 women. Women in the age bracket of 20 to 34 years have the highest fertility rate with 105.0 births per 1,000 women. Women in the age bracket of 20 to 34 years acount for 56.2% of all women with births.
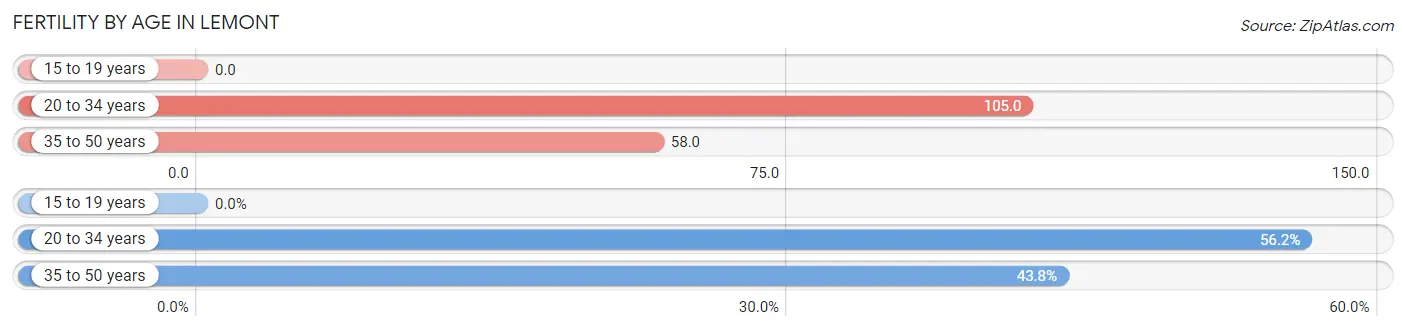
| Age Bracket | Women with Births | Births / 1,000 Women |
| 15 to 19 years | 0 (0.0%) | 0.0 |
| 20 to 34 years | 118 (56.2%) | 105.0 |
| 35 to 50 years | 92 (43.8%) | 58.0 |
| Total | 210 (100.0%) | 64.0 |
Fertility by Age by Marriage Status in Lemont
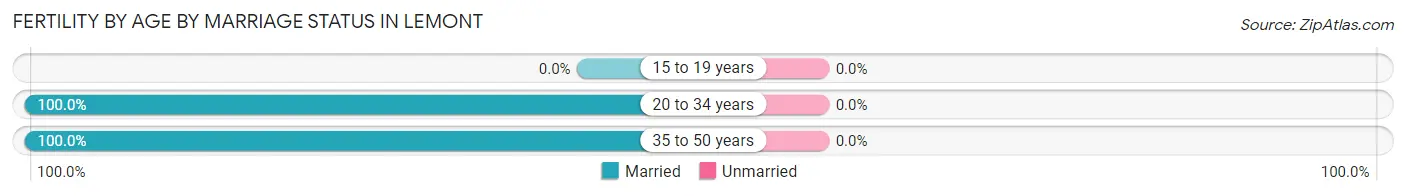
| Age Bracket | Married | Unmarried |
| 15 to 19 years | 0 (0.0%) | 0 (0.0%) |
| 20 to 34 years | 118 (100.0%) | 0 (0.0%) |
| 35 to 50 years | 92 (100.0%) | 0 (0.0%) |
| Total | 210 (100.0%) | 0 (0.0%) |
Fertility by Education in Lemont
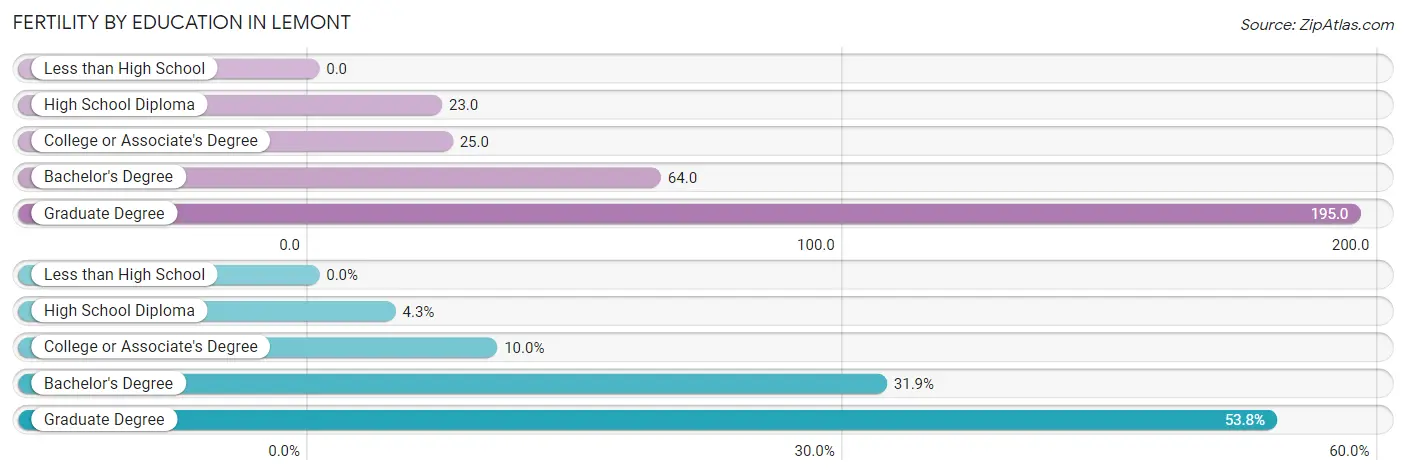
| Educational Attainment | Women with Births | Births / 1,000 Women |
| Less than High School | 0 (0.0%) | 0.0 |
| High School Diploma | 9 (4.3%) | 23.0 |
| College or Associate's Degree | 21 (10.0%) | 25.0 |
| Bachelor's Degree | 67 (31.9%) | 64.0 |
| Graduate Degree | 113 (53.8%) | 195.0 |
| Total | 210 (100.0%) | 64.0 |
Fertility by Education by Marriage Status in Lemont
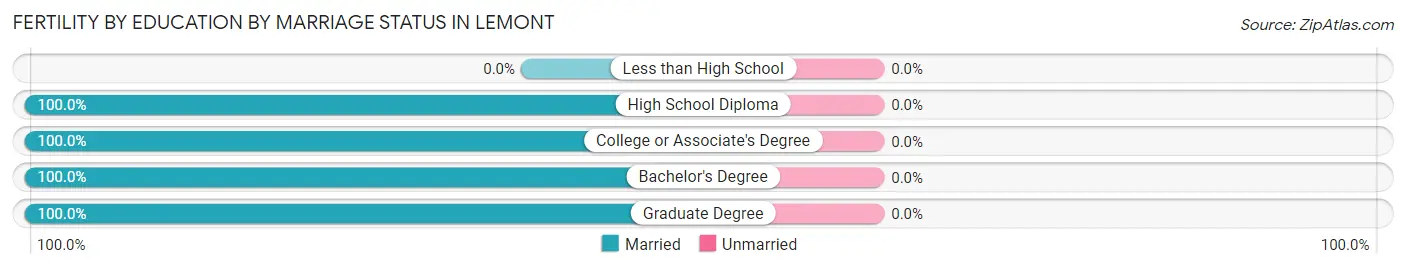
| Educational Attainment | Married | Unmarried |
| Less than High School | 0 (0.0%) | 0 (0.0%) |
| High School Diploma | 9 (100.0%) | 0 (0.0%) |
| College or Associate's Degree | 21 (100.0%) | 0 (0.0%) |
| Bachelor's Degree | 67 (100.0%) | 0 (0.0%) |
| Graduate Degree | 113 (100.0%) | 0 (0.0%) |
| Total | 210 (100.0%) | 0 (0.0%) |
Employment Characteristics in Lemont
Employment by Class of Employer in Lemont
Among the 8,462 employed individuals in Lemont, private company employees (5,373 | 63.5%), not-for-profit organizations (1,028 | 12.1%), and local government employees (917 | 10.8%) make up the most common classes of employment.
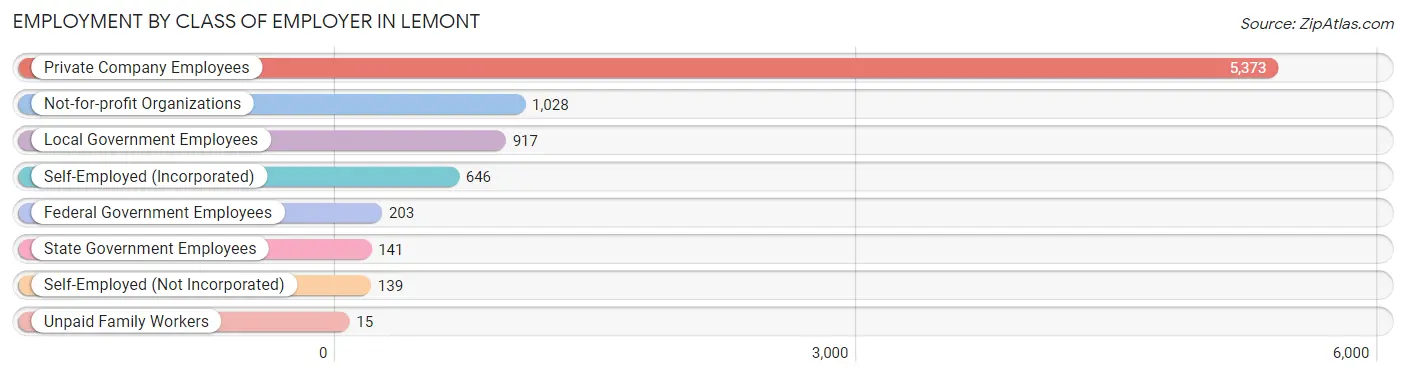
| Employer Class | # Employees | % Employees |
| Private Company Employees | 5,373 | 63.5% |
| Self-Employed (Incorporated) | 646 | 7.6% |
| Self-Employed (Not Incorporated) | 139 | 1.6% |
| Not-for-profit Organizations | 1,028 | 12.1% |
| Local Government Employees | 917 | 10.8% |
| State Government Employees | 141 | 1.7% |
| Federal Government Employees | 203 | 2.4% |
| Unpaid Family Workers | 15 | 0.2% |
| Total | 8,462 | 100.0% |
Employment Status by Age in Lemont
According to the labor force statistics for Lemont, out of the total population over 16 years of age (13,983), 64.0% or 8,949 individuals are in the labor force, with 3.9% or 349 of them unemployed. The age group with the highest labor force participation rate is 35 to 44 years, with 93.9% or 2,064 individuals in the labor force. Within the labor force, the 25 to 29 years age range has the highest percentage of unemployed individuals, with 10.0% or 61 of them being unemployed.
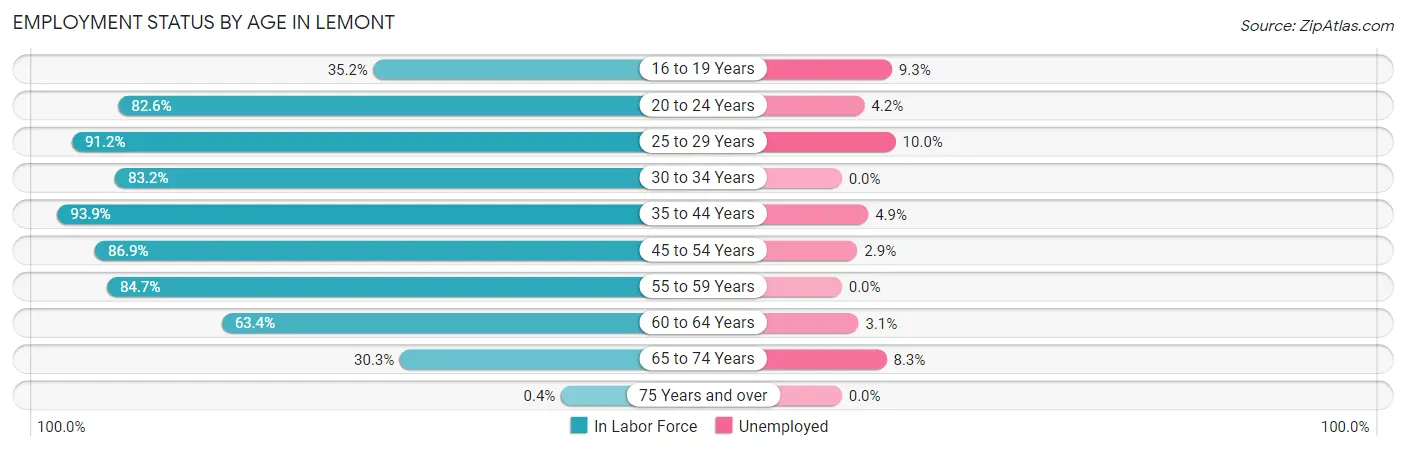
| Age Bracket | In Labor Force | Unemployed |
| 16 to 19 Years | 365 (35.2%) | 34 (9.3%) |
| 20 to 24 Years | 645 (82.6%) | 27 (4.2%) |
| 25 to 29 Years | 609 (91.2%) | 61 (10.0%) |
| 30 to 34 Years | 642 (83.2%) | 0 (0.0%) |
| 35 to 44 Years | 2,064 (93.9%) | 101 (4.9%) |
| 45 to 54 Years | 1,947 (86.9%) | 56 (2.9%) |
| 55 to 59 Years | 1,373 (84.7%) | 0 (0.0%) |
| 60 to 64 Years | 743 (63.4%) | 23 (3.1%) |
| 65 to 74 Years | 554 (30.3%) | 46 (8.3%) |
| 75 Years and over | 7 (0.4%) | 0 (0.0%) |
| Total | 8,949 (64.0%) | 349 (3.9%) |
Employment Status by Educational Attainment in Lemont
According to labor force statistics for Lemont, 85.1% of individuals (7,380) out of the total population between 25 and 64 years of age (8,672) are in the labor force, with 3.3% or 244 of them being unemployed. The group with the highest labor force participation rate are those with the educational attainment of bachelor's degree or higher, with 88.9% or 3,785 individuals in the labor force. Within the labor force, individuals with college / associate degree education have the highest percentage of unemployment, with 5.9% or 129 of them being unemployed.
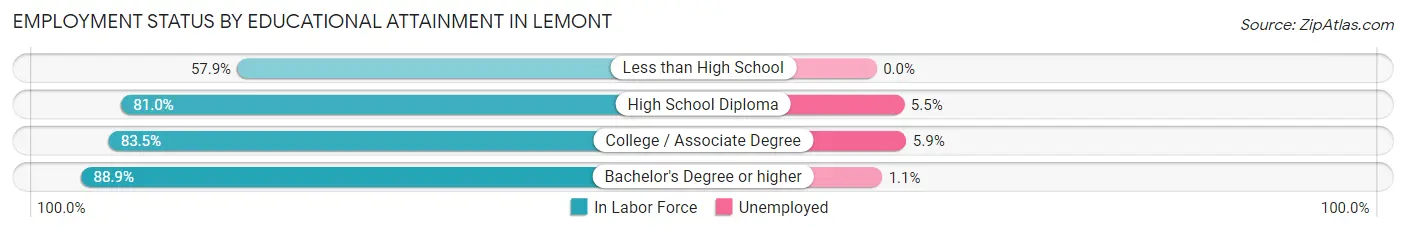
| Educational Attainment | In Labor Force | Unemployed |
| Less than High School | 124 (57.9%) | 0 (0.0%) |
| High School Diploma | 1,281 (81.0%) | 87 (5.5%) |
| College / Associate Degree | 2,187 (83.5%) | 155 (5.9%) |
| Bachelor's Degree or higher | 3,785 (88.9%) | 47 (1.1%) |
| Total | 7,380 (85.1%) | 286 (3.3%) |
Employment Occupations by Sex in Lemont
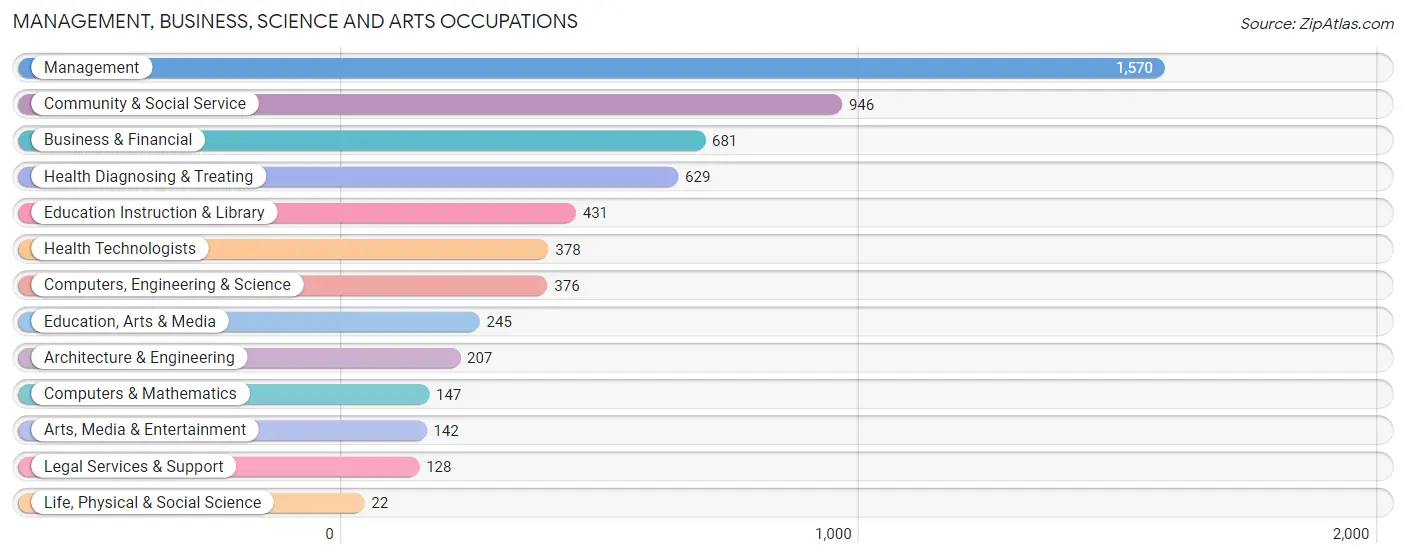
Management, Business, Science and Arts Occupations
The most common Management, Business, Science and Arts occupations in Lemont are Management (1,570 | 18.3%), Community & Social Service (946 | 11.0%), Business & Financial (681 | 7.9%), Health Diagnosing & Treating (629 | 7.3%), and Education Instruction & Library (431 | 5.0%).
Management, Business, Science and Arts Occupations by Sex
Within the Management, Business, Science and Arts occupations in Lemont, the most male-oriented occupations are Arts, Media & Entertainment (92.2%), Architecture & Engineering (85.5%), and Business & Financial (67.8%), while the most female-oriented occupations are Life, Physical & Social Science (100.0%), Education Instruction & Library (93.0%), and Health Diagnosing & Treating (85.9%).
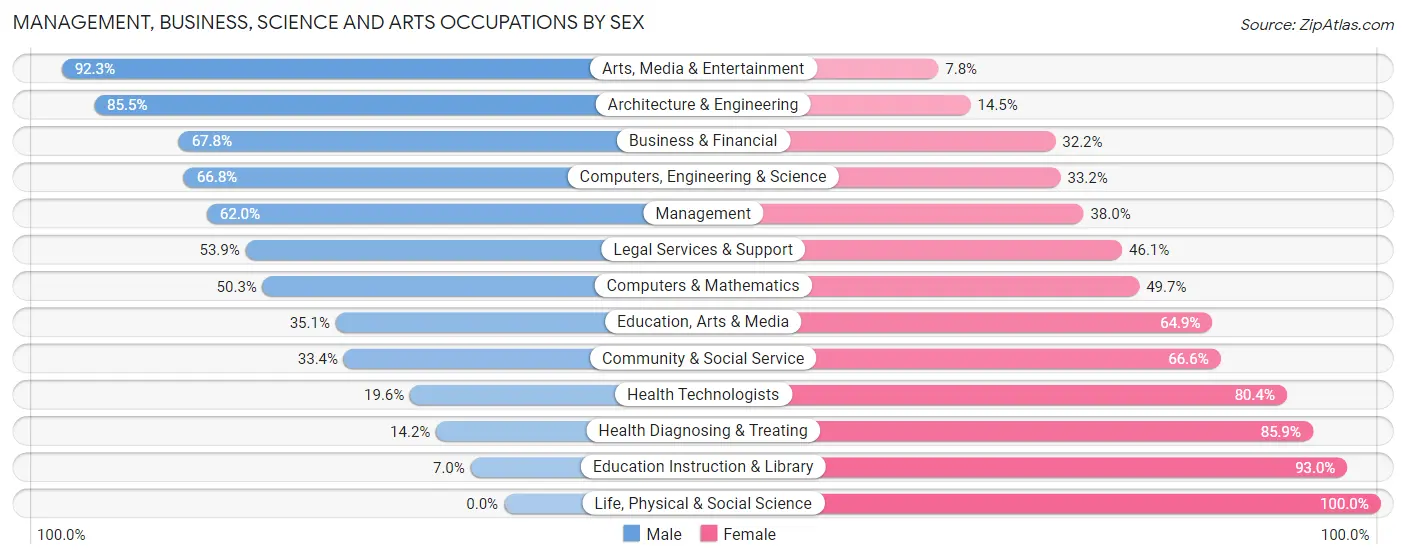
| Occupation | Male | Female |
| Management | 973 (62.0%) | 597 (38.0%) |
| Business & Financial | 462 (67.8%) | 219 (32.2%) |
| Computers, Engineering & Science | 251 (66.8%) | 125 (33.2%) |
| Computers & Mathematics | 74 (50.3%) | 73 (49.7%) |
| Architecture & Engineering | 177 (85.5%) | 30 (14.5%) |
| Life, Physical & Social Science | 0 (0.0%) | 22 (100.0%) |
| Community & Social Service | 316 (33.4%) | 630 (66.6%) |
| Education, Arts & Media | 86 (35.1%) | 159 (64.9%) |
| Legal Services & Support | 69 (53.9%) | 59 (46.1%) |
| Education Instruction & Library | 30 (7.0%) | 401 (93.0%) |
| Arts, Media & Entertainment | 131 (92.2%) | 11 (7.7%) |
| Health Diagnosing & Treating | 89 (14.1%) | 540 (85.9%) |
| Health Technologists | 74 (19.6%) | 304 (80.4%) |
| Total (Category) | 2,091 (49.8%) | 2,111 (50.2%) |
| Total (Overall) | 4,639 (54.0%) | 3,958 (46.0%) |
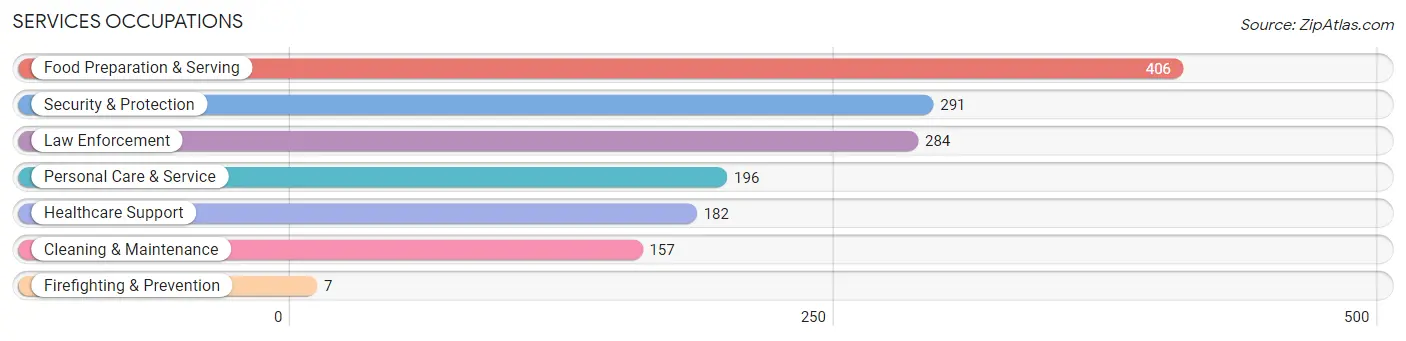
Services Occupations
The most common Services occupations in Lemont are Food Preparation & Serving (406 | 4.7%), Security & Protection (291 | 3.4%), Law Enforcement (284 | 3.3%), Personal Care & Service (196 | 2.3%), and Healthcare Support (182 | 2.1%).
Services Occupations by Sex
Within the Services occupations in Lemont, the most male-oriented occupations are Security & Protection (100.0%), Firefighting & Prevention (100.0%), and Law Enforcement (100.0%), while the most female-oriented occupations are Healthcare Support (95.6%), Personal Care & Service (70.4%), and Food Preparation & Serving (64.0%).
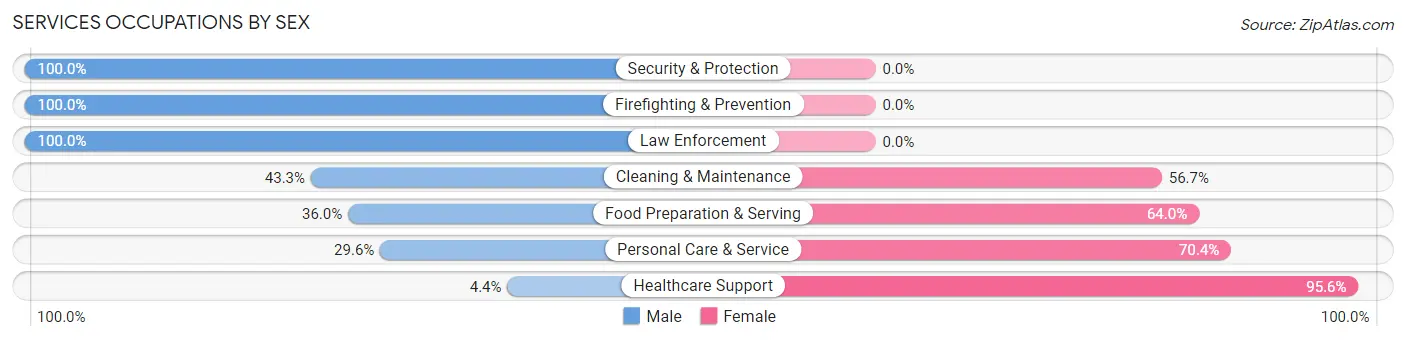
| Occupation | Male | Female |
| Healthcare Support | 8 (4.4%) | 174 (95.6%) |
| Security & Protection | 291 (100.0%) | 0 (0.0%) |
| Firefighting & Prevention | 7 (100.0%) | 0 (0.0%) |
| Law Enforcement | 284 (100.0%) | 0 (0.0%) |
| Food Preparation & Serving | 146 (36.0%) | 260 (64.0%) |
| Cleaning & Maintenance | 68 (43.3%) | 89 (56.7%) |
| Personal Care & Service | 58 (29.6%) | 138 (70.4%) |
| Total (Category) | 571 (46.4%) | 661 (53.6%) |
| Total (Overall) | 4,639 (54.0%) | 3,958 (46.0%) |
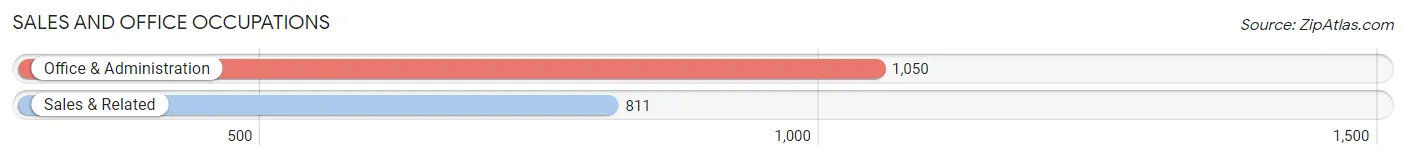
Sales and Office Occupations
The most common Sales and Office occupations in Lemont are Office & Administration (1,050 | 12.2%), and Sales & Related (811 | 9.4%).
Sales and Office Occupations by Sex
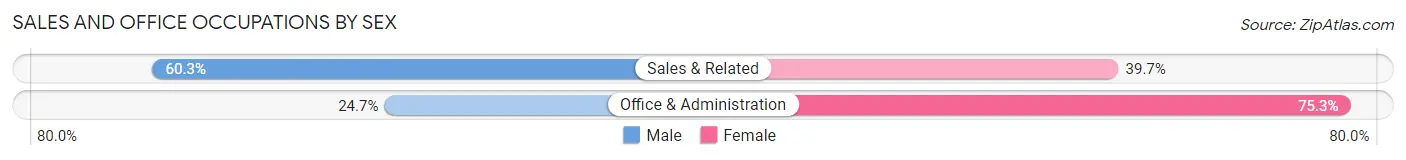
| Occupation | Male | Female |
| Sales & Related | 489 (60.3%) | 322 (39.7%) |
| Office & Administration | 259 (24.7%) | 791 (75.3%) |
| Total (Category) | 748 (40.2%) | 1,113 (59.8%) |
| Total (Overall) | 4,639 (54.0%) | 3,958 (46.0%) |
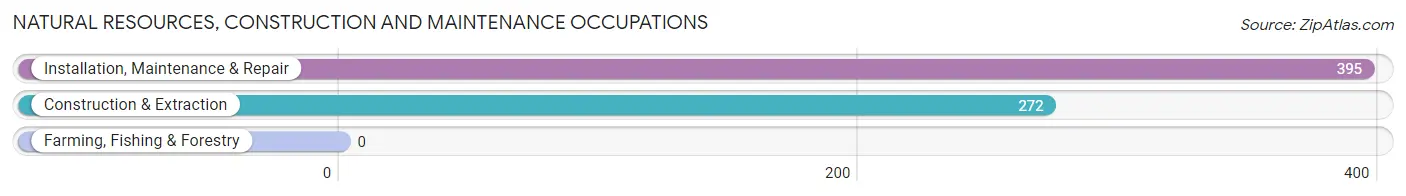
Natural Resources, Construction and Maintenance Occupations
The most common Natural Resources, Construction and Maintenance occupations in Lemont are Installation, Maintenance & Repair (395 | 4.6%), and Construction & Extraction (272 | 3.2%).
Natural Resources, Construction and Maintenance Occupations by Sex
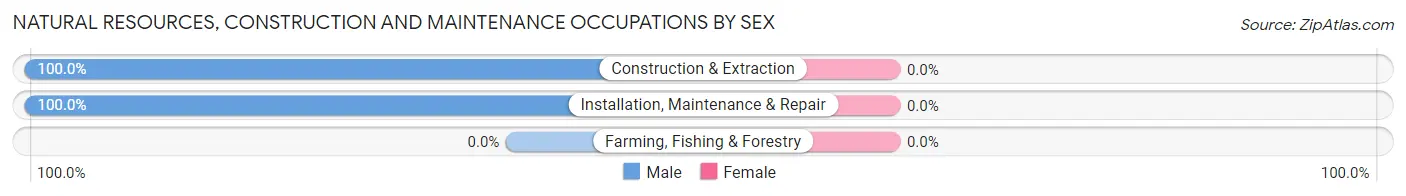
| Occupation | Male | Female |
| Farming, Fishing & Forestry | 0 (0.0%) | 0 (0.0%) |
| Construction & Extraction | 272 (100.0%) | 0 (0.0%) |
| Installation, Maintenance & Repair | 395 (100.0%) | 0 (0.0%) |
| Total (Category) | 667 (100.0%) | 0 (0.0%) |
| Total (Overall) | 4,639 (54.0%) | 3,958 (46.0%) |
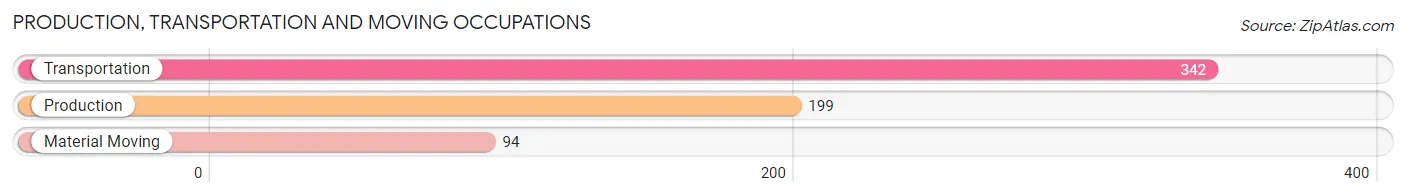
Production, Transportation and Moving Occupations
The most common Production, Transportation and Moving occupations in Lemont are Transportation (342 | 4.0%), Production (199 | 2.3%), and Material Moving (94 | 1.1%).
Production, Transportation and Moving Occupations by Sex
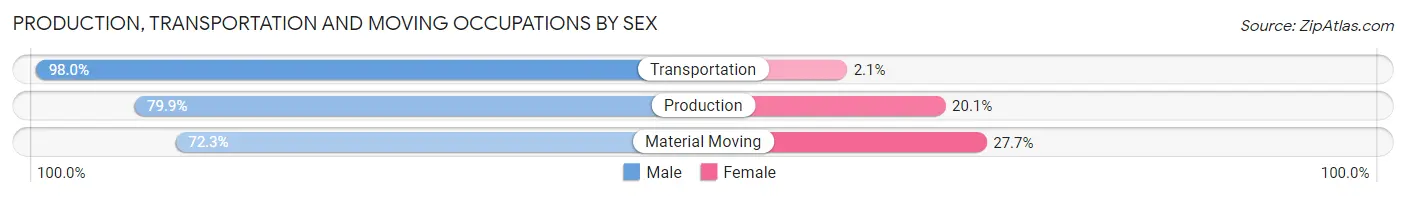
| Occupation | Male | Female |
| Production | 159 (79.9%) | 40 (20.1%) |
| Transportation | 335 (98.0%) | 7 (2.1%) |
| Material Moving | 68 (72.3%) | 26 (27.7%) |
| Total (Category) | 562 (88.5%) | 73 (11.5%) |
| Total (Overall) | 4,639 (54.0%) | 3,958 (46.0%) |
Employment Industries by Sex in Lemont
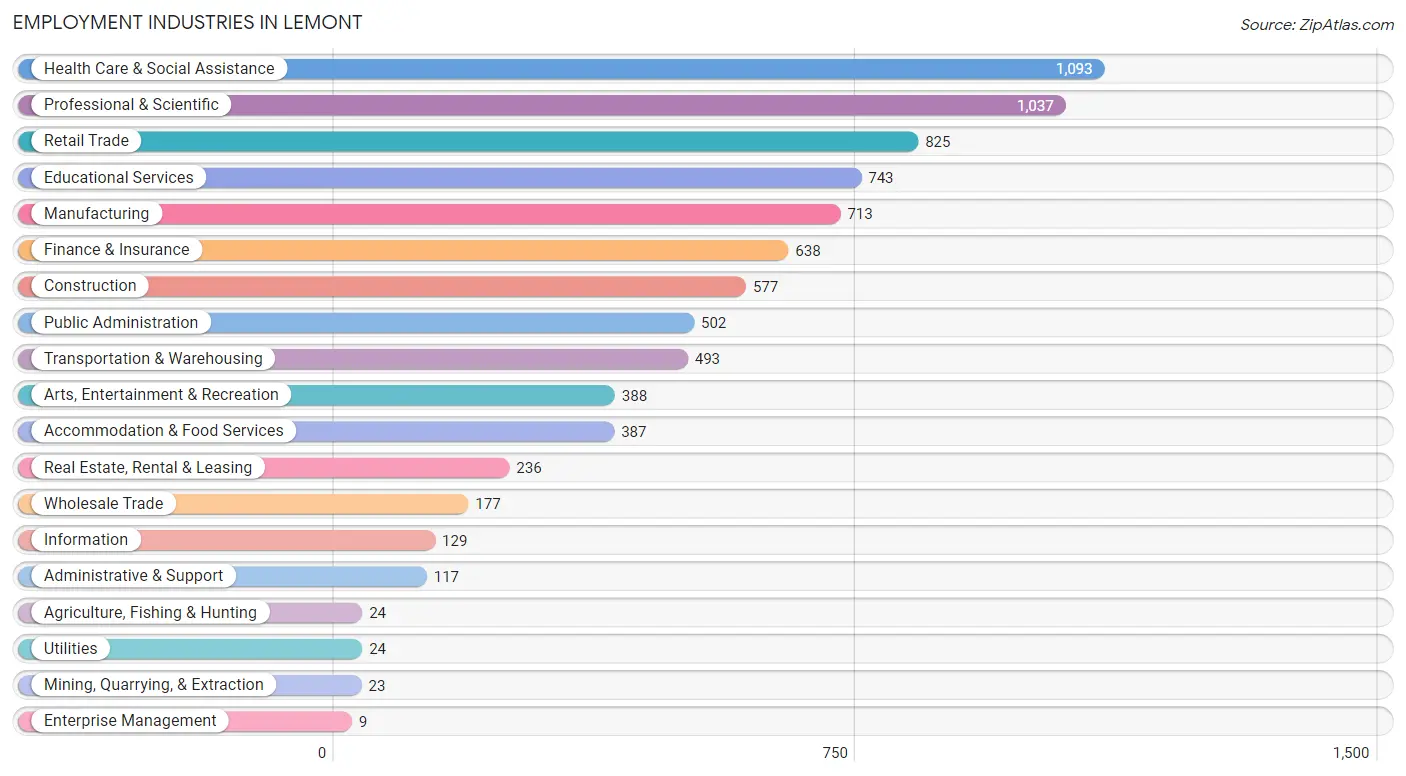
Employment Industries in Lemont
The major employment industries in Lemont include Health Care & Social Assistance (1,093 | 12.7%), Professional & Scientific (1,037 | 12.1%), Retail Trade (825 | 9.6%), Educational Services (743 | 8.6%), and Manufacturing (713 | 8.3%).
Employment Industries by Sex in Lemont
The Lemont industries that see more men than women are Mining, Quarrying, & Extraction (100.0%), Utilities (100.0%), and Real Estate, Rental & Leasing (100.0%), whereas the industries that tend to have a higher number of women are Enterprise Management (100.0%), Health Care & Social Assistance (84.8%), and Educational Services (75.2%).
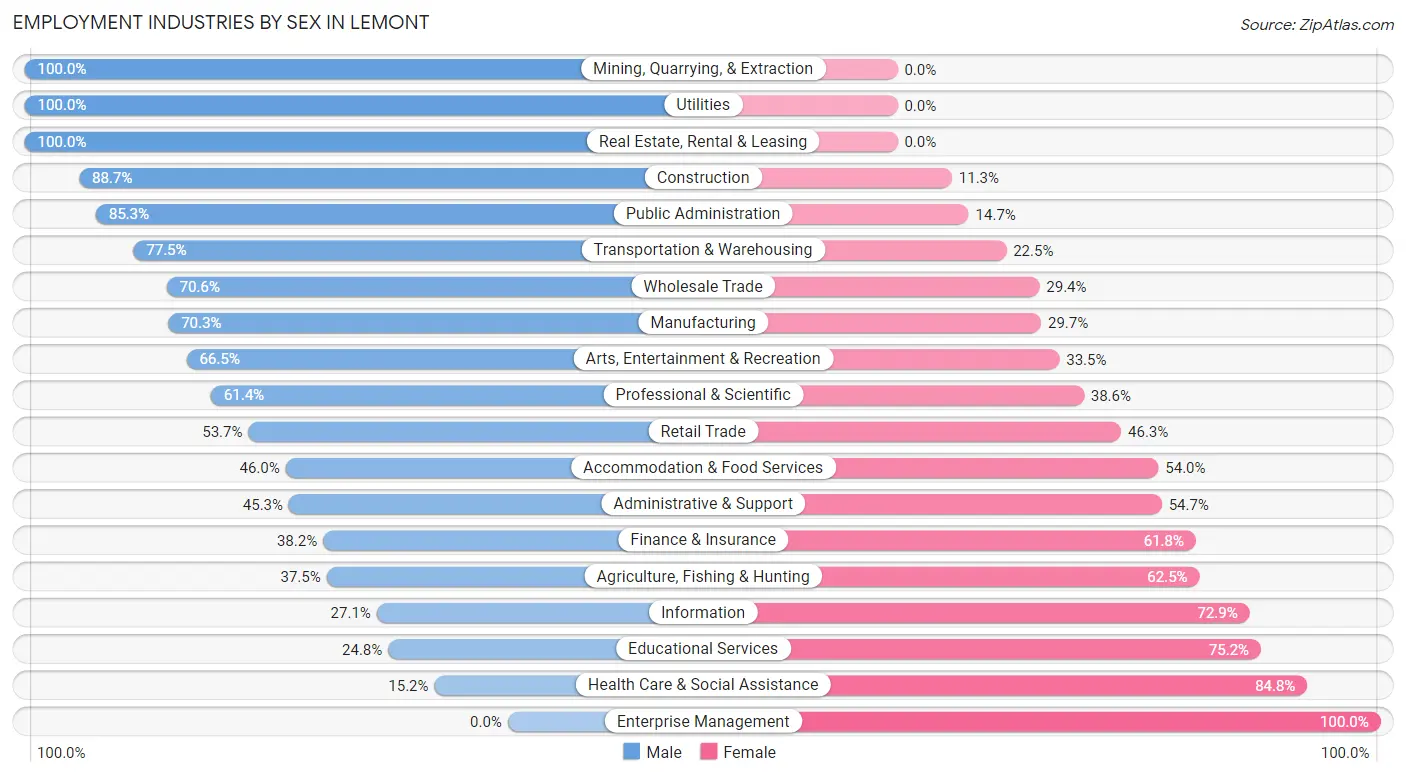
| Industry | Male | Female |
| Agriculture, Fishing & Hunting | 9 (37.5%) | 15 (62.5%) |
| Mining, Quarrying, & Extraction | 23 (100.0%) | 0 (0.0%) |
| Construction | 512 (88.7%) | 65 (11.3%) |
| Manufacturing | 501 (70.3%) | 212 (29.7%) |
| Wholesale Trade | 125 (70.6%) | 52 (29.4%) |
| Retail Trade | 443 (53.7%) | 382 (46.3%) |
| Transportation & Warehousing | 382 (77.5%) | 111 (22.5%) |
| Utilities | 24 (100.0%) | 0 (0.0%) |
| Information | 35 (27.1%) | 94 (72.9%) |
| Finance & Insurance | 244 (38.2%) | 394 (61.8%) |
| Real Estate, Rental & Leasing | 236 (100.0%) | 0 (0.0%) |
| Professional & Scientific | 637 (61.4%) | 400 (38.6%) |
| Enterprise Management | 0 (0.0%) | 9 (100.0%) |
| Administrative & Support | 53 (45.3%) | 64 (54.7%) |
| Educational Services | 184 (24.8%) | 559 (75.2%) |
| Health Care & Social Assistance | 166 (15.2%) | 927 (84.8%) |
| Arts, Entertainment & Recreation | 258 (66.5%) | 130 (33.5%) |
| Accommodation & Food Services | 178 (46.0%) | 209 (54.0%) |
| Public Administration | 428 (85.3%) | 74 (14.7%) |
| Total | 4,639 (54.0%) | 3,958 (46.0%) |
Education in Lemont
School Enrollment in Lemont
The most common levels of schooling among the 4,731 students in Lemont are elementary school (1,199 | 25.3%), middle school (1,016 | 21.5%), and college / undergraduate (888 | 18.8%).
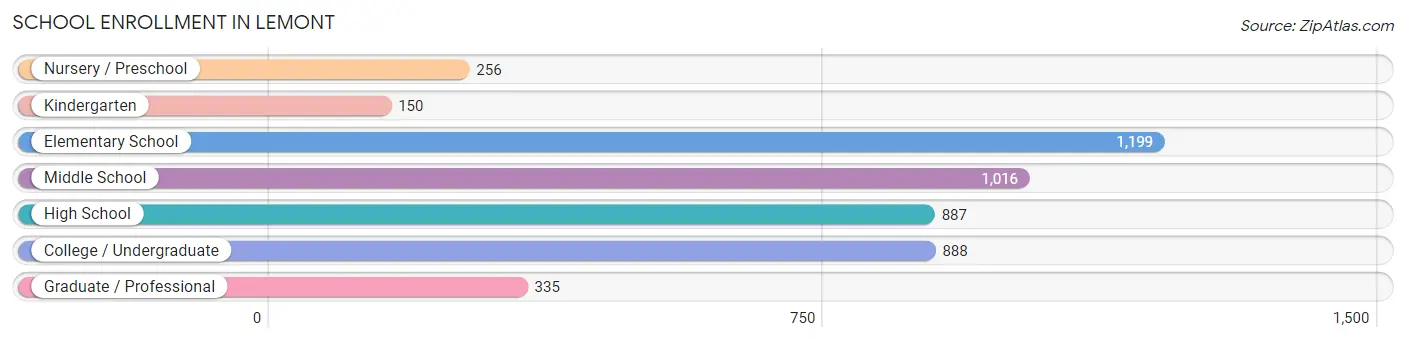
| School Level | # Students | % Students |
| Nursery / Preschool | 256 | 5.4% |
| Kindergarten | 150 | 3.2% |
| Elementary School | 1,199 | 25.3% |
| Middle School | 1,016 | 21.5% |
| High School | 887 | 18.8% |
| College / Undergraduate | 888 | 18.8% |
| Graduate / Professional | 335 | 7.1% |
| Total | 4,731 | 100.0% |
School Enrollment by Age by Funding Source in Lemont
Out of a total of 4,731 students who are enrolled in schools in Lemont, 1,296 (27.4%) attend a private institution, while the remaining 3,435 (72.6%) are enrolled in public schools. The age group of 3 to 4 year olds has the highest likelihood of being enrolled in private schools, with 93 (57.1% in the age bracket) enrolled. Conversely, the age group of 10 to 14 year olds has the lowest likelihood of being enrolled in a private school, with 1,031 (88.3% in the age bracket) attending a public institution.
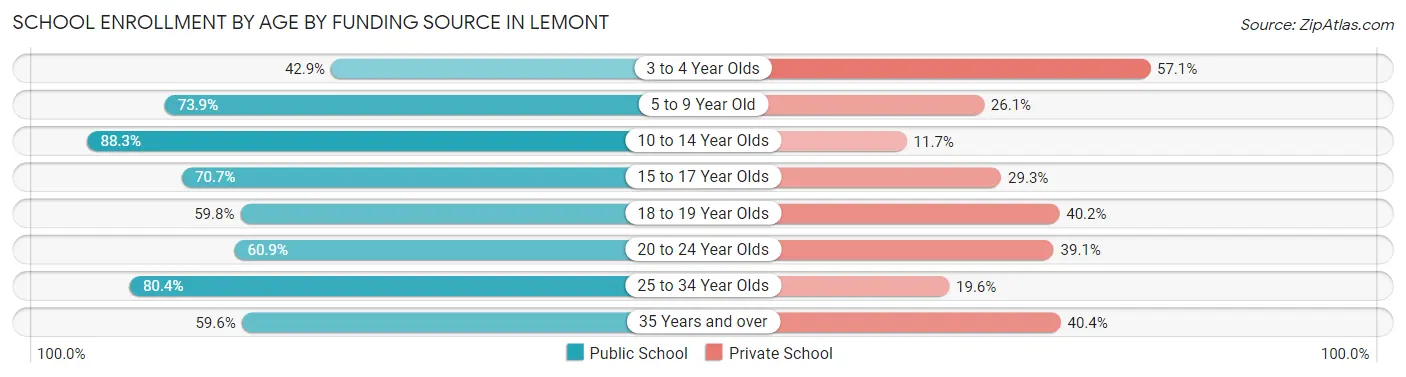
| Age Bracket | Public School | Private School |
| 3 to 4 Year Olds | 70 (42.9%) | 93 (57.1%) |
| 5 to 9 Year Old | 976 (73.9%) | 345 (26.1%) |
| 10 to 14 Year Olds | 1,031 (88.3%) | 137 (11.7%) |
| 15 to 17 Year Olds | 482 (70.7%) | 200 (29.3%) |
| 18 to 19 Year Olds | 289 (59.8%) | 194 (40.2%) |
| 20 to 24 Year Olds | 302 (60.9%) | 194 (39.1%) |
| 25 to 34 Year Olds | 135 (80.4%) | 33 (19.6%) |
| 35 Years and over | 149 (59.6%) | 101 (40.4%) |
| Total | 3,435 (72.6%) | 1,296 (27.4%) |
Educational Attainment by Field of Study in Lemont
Business (1,582 | 27.2%), science & technology (867 | 14.9%), education (778 | 13.4%), engineering (553 | 9.5%), and social sciences (362 | 6.2%) are the most common fields of study among 5,826 individuals in Lemont who have obtained a bachelor's degree or higher.
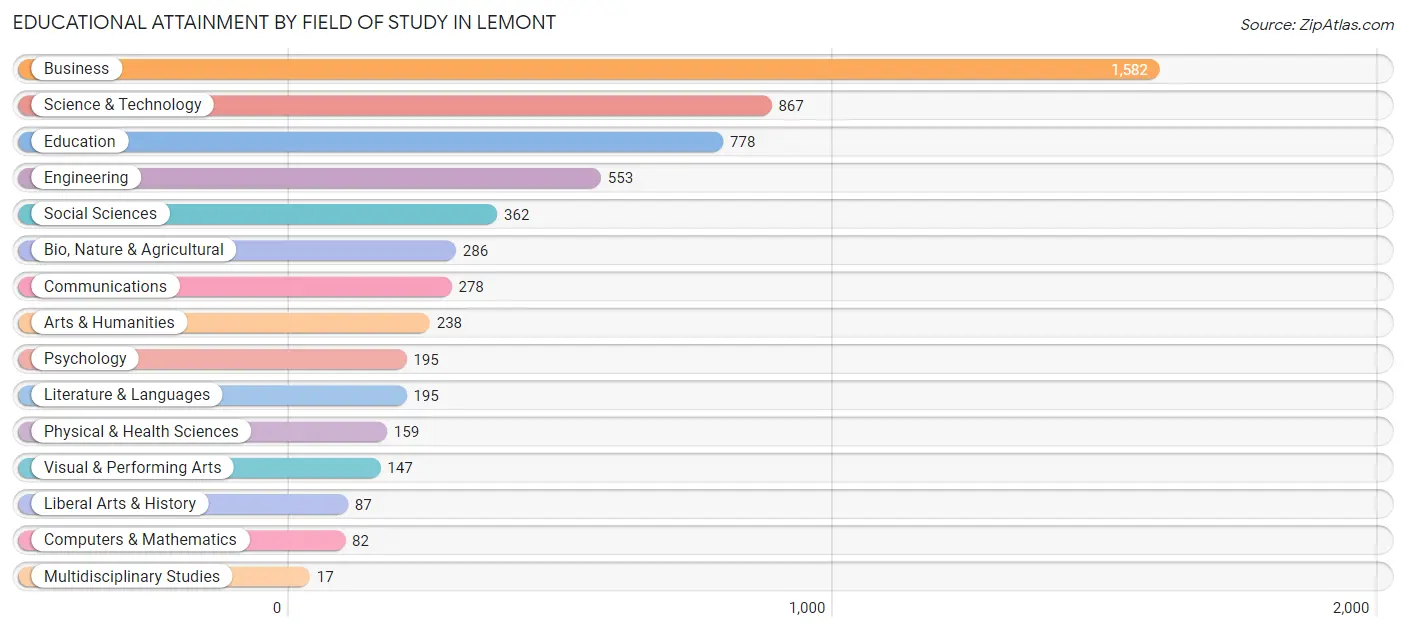
| Field of Study | # Graduates | % Graduates |
| Computers & Mathematics | 82 | 1.4% |
| Bio, Nature & Agricultural | 286 | 4.9% |
| Physical & Health Sciences | 159 | 2.7% |
| Psychology | 195 | 3.4% |
| Social Sciences | 362 | 6.2% |
| Engineering | 553 | 9.5% |
| Multidisciplinary Studies | 17 | 0.3% |
| Science & Technology | 867 | 14.9% |
| Business | 1,582 | 27.2% |
| Education | 778 | 13.4% |
| Literature & Languages | 195 | 3.4% |
| Liberal Arts & History | 87 | 1.5% |
| Visual & Performing Arts | 147 | 2.5% |
| Communications | 278 | 4.8% |
| Arts & Humanities | 238 | 4.1% |
| Total | 5,826 | 100.0% |
Transportation & Commute in Lemont
Vehicle Availability by Sex in Lemont
The most prevalent vehicle ownership categories in Lemont are males with 2 vehicles (1,980, accounting for 43.0%) and females with 2 vehicles (1,668, making up 51.3%).
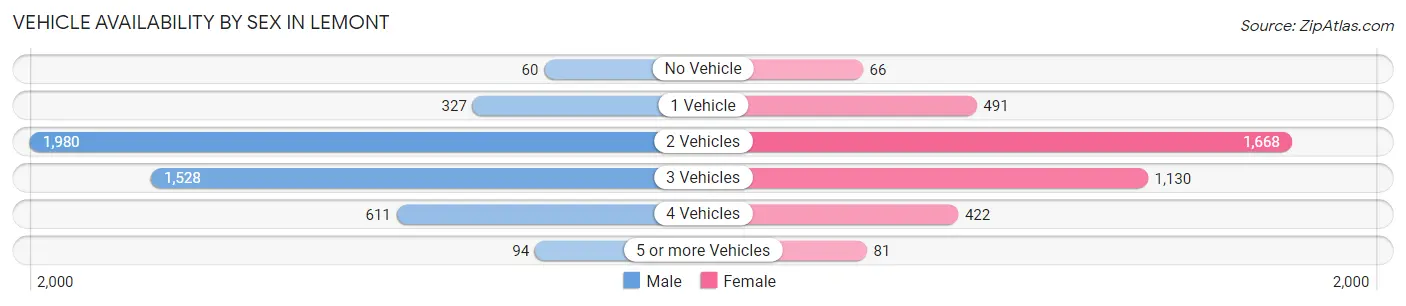
| Vehicles Available | Male | Female |
| No Vehicle | 60 (1.3%) | 66 (1.7%) |
| 1 Vehicle | 327 (7.1%) | 491 (12.7%) |
| 2 Vehicles | 1,980 (43.0%) | 1,668 (43.2%) |
| 3 Vehicles | 1,528 (33.2%) | 1,130 (29.3%) |
| 4 Vehicles | 611 (13.3%) | 422 (10.9%) |
| 5 or more Vehicles | 94 (2.0%) | 81 (2.1%) |
| Total | 4,600 (100.0%) | 3,858 (100.0%) |
Commute Time in Lemont
The most frequently occuring commute durations in Lemont are 30 to 34 minutes (1,398 commuters, 18.8%), 60 to 89 minutes (1,257 commuters, 16.9%), and 20 to 24 minutes (1,028 commuters, 13.8%).
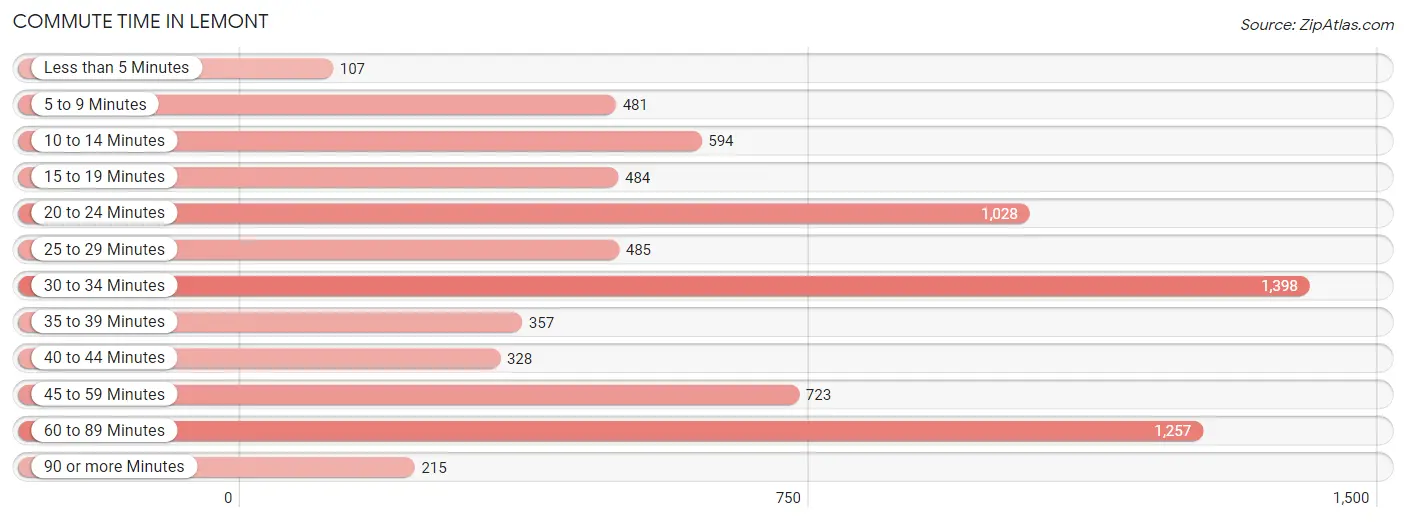
| Commute Time | # Commuters | % Commuters |
| Less than 5 Minutes | 107 | 1.4% |
| 5 to 9 Minutes | 481 | 6.5% |
| 10 to 14 Minutes | 594 | 8.0% |
| 15 to 19 Minutes | 484 | 6.5% |
| 20 to 24 Minutes | 1,028 | 13.8% |
| 25 to 29 Minutes | 485 | 6.5% |
| 30 to 34 Minutes | 1,398 | 18.8% |
| 35 to 39 Minutes | 357 | 4.8% |
| 40 to 44 Minutes | 328 | 4.4% |
| 45 to 59 Minutes | 723 | 9.7% |
| 60 to 89 Minutes | 1,257 | 16.9% |
| 90 or more Minutes | 215 | 2.9% |
Commute Time by Sex in Lemont
The most common commute times in Lemont are 60 to 89 minutes (928 commuters, 22.5%) for males and 30 to 34 minutes (699 commuters, 21.0%) for females.
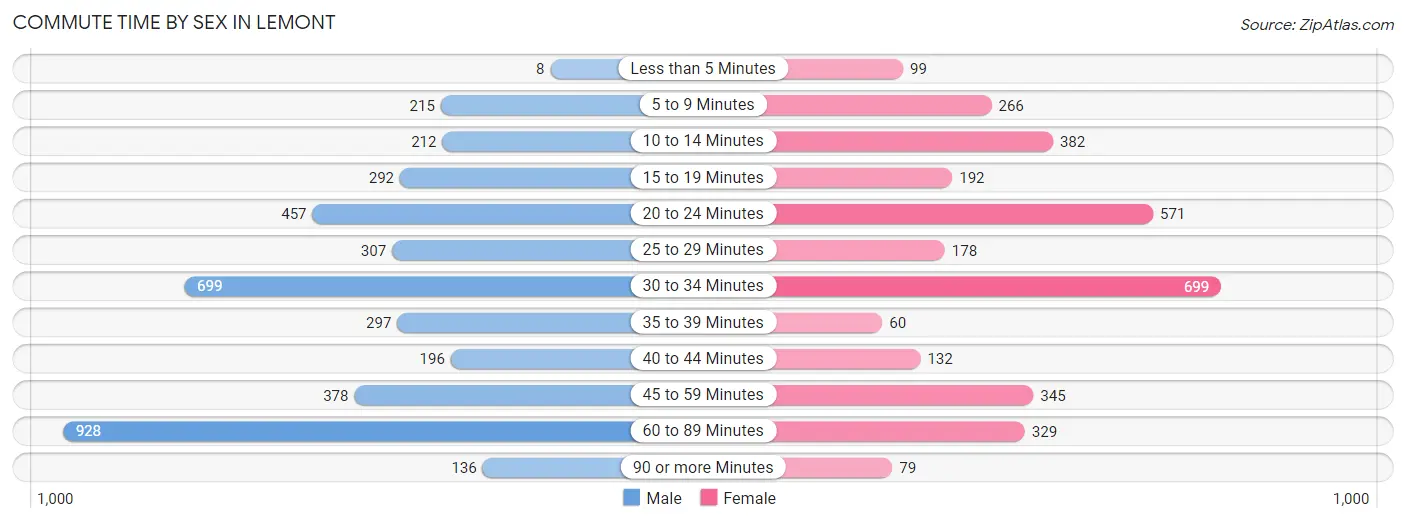
| Commute Time | Male | Female |
| Less than 5 Minutes | 8 (0.2%) | 99 (3.0%) |
| 5 to 9 Minutes | 215 (5.2%) | 266 (8.0%) |
| 10 to 14 Minutes | 212 (5.1%) | 382 (11.5%) |
| 15 to 19 Minutes | 292 (7.1%) | 192 (5.8%) |
| 20 to 24 Minutes | 457 (11.1%) | 571 (17.1%) |
| 25 to 29 Minutes | 307 (7.4%) | 178 (5.3%) |
| 30 to 34 Minutes | 699 (17.0%) | 699 (21.0%) |
| 35 to 39 Minutes | 297 (7.2%) | 60 (1.8%) |
| 40 to 44 Minutes | 196 (4.8%) | 132 (4.0%) |
| 45 to 59 Minutes | 378 (9.2%) | 345 (10.3%) |
| 60 to 89 Minutes | 928 (22.5%) | 329 (9.9%) |
| 90 or more Minutes | 136 (3.3%) | 79 (2.4%) |
Time of Departure to Work by Sex in Lemont
The most frequent times of departure to work in Lemont are 6:00 AM to 6:29 AM (539, 13.1%) for males and 7:00 AM to 7:29 AM (716, 21.5%) for females.
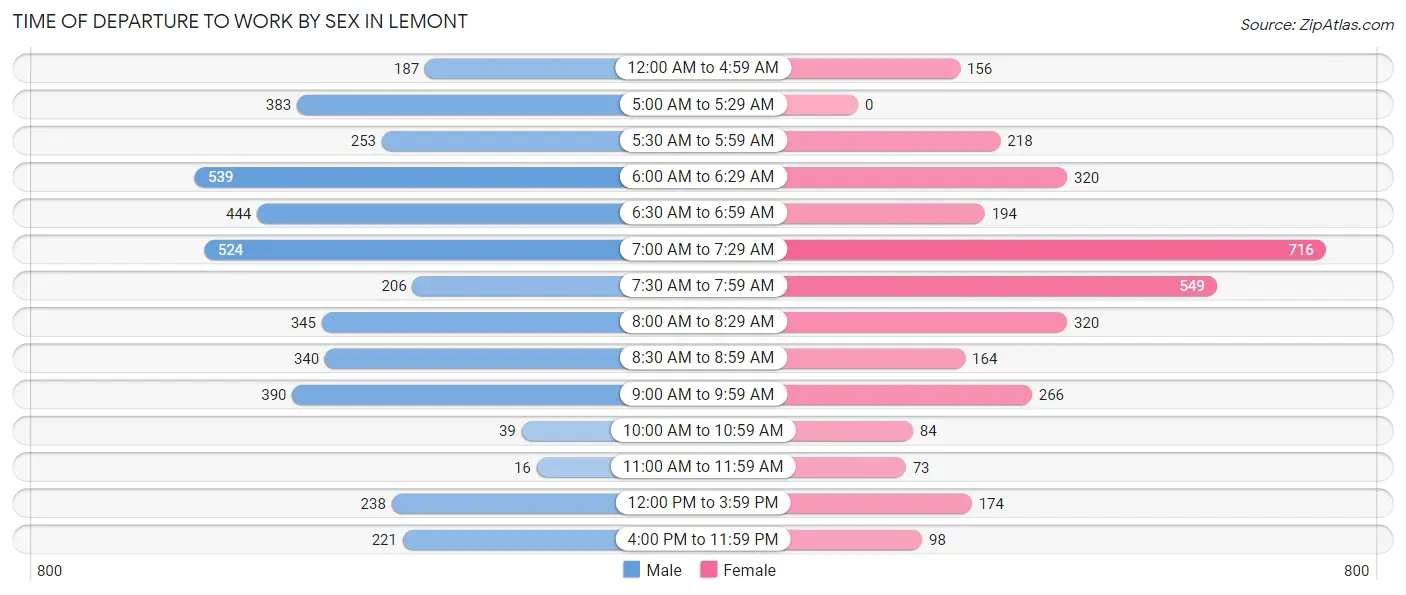
| Time of Departure | Male | Female |
| 12:00 AM to 4:59 AM | 187 (4.5%) | 156 (4.7%) |
| 5:00 AM to 5:29 AM | 383 (9.3%) | 0 (0.0%) |
| 5:30 AM to 5:59 AM | 253 (6.1%) | 218 (6.5%) |
| 6:00 AM to 6:29 AM | 539 (13.1%) | 320 (9.6%) |
| 6:30 AM to 6:59 AM | 444 (10.8%) | 194 (5.8%) |
| 7:00 AM to 7:29 AM | 524 (12.7%) | 716 (21.5%) |
| 7:30 AM to 7:59 AM | 206 (5.0%) | 549 (16.5%) |
| 8:00 AM to 8:29 AM | 345 (8.4%) | 320 (9.6%) |
| 8:30 AM to 8:59 AM | 340 (8.2%) | 164 (4.9%) |
| 9:00 AM to 9:59 AM | 390 (9.5%) | 266 (8.0%) |
| 10:00 AM to 10:59 AM | 39 (0.9%) | 84 (2.5%) |
| 11:00 AM to 11:59 AM | 16 (0.4%) | 73 (2.2%) |
| 12:00 PM to 3:59 PM | 238 (5.8%) | 174 (5.2%) |
| 4:00 PM to 11:59 PM | 221 (5.4%) | 98 (2.9%) |
| Total | 4,125 (100.0%) | 3,332 (100.0%) |
Housing Occupancy in Lemont
Occupancy by Ownership in Lemont
Of the total 6,235 dwellings in Lemont, owner-occupied units account for 5,467 (87.7%), while renter-occupied units make up 768 (12.3%).
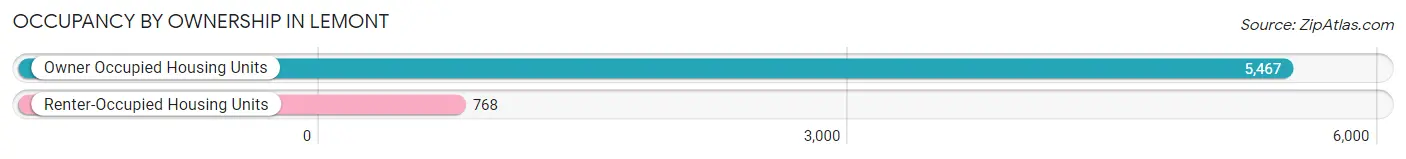
| Occupancy | # Housing Units | % Housing Units |
| Owner Occupied Housing Units | 5,467 | 87.7% |
| Renter-Occupied Housing Units | 768 | 12.3% |
| Total Occupied Housing Units | 6,235 | 100.0% |
Occupancy by Household Size in Lemont
| Household Size | # Housing Units | % Housing Units |
| 1-Person Household | 1,343 | 21.5% |
| 2-Person Household | 1,957 | 31.4% |
| 3-Person Household | 1,083 | 17.4% |
| 4+ Person Household | 1,852 | 29.7% |
| Total Housing Units | 6,235 | 100.0% |
Occupancy by Ownership by Household Size in Lemont
| Household Size | Owner-occupied | Renter-occupied |
| 1-Person Household | 1,009 (75.1%) | 334 (24.9%) |
| 2-Person Household | 1,693 (86.5%) | 264 (13.5%) |
| 3-Person Household | 1,010 (93.3%) | 73 (6.7%) |
| 4+ Person Household | 1,755 (94.8%) | 97 (5.2%) |
| Total Housing Units | 5,467 (87.7%) | 768 (12.3%) |
Occupancy by Educational Attainment in Lemont
| Household Size | Owner-occupied | Renter-occupied |
| Less than High School | 104 (57.5%) | 77 (42.5%) |
| High School Diploma | 843 (84.1%) | 160 (16.0%) |
| College/Associate Degree | 1,612 (83.3%) | 324 (16.7%) |
| Bachelor's Degree or higher | 2,908 (93.3%) | 207 (6.7%) |
Occupancy by Age of Householder in Lemont
| Age Bracket | # Households | % Households |
| Under 35 Years | 541 | 8.7% |
| 35 to 44 Years | 1,002 | 16.1% |
| 45 to 54 Years | 1,340 | 21.5% |
| 55 to 64 Years | 1,366 | 21.9% |
| 65 to 74 Years | 1,024 | 16.4% |
| 75 to 84 Years | 585 | 9.4% |
| 85 Years and Over | 377 | 6.0% |
| Total | 6,235 | 100.0% |
Housing Finances in Lemont
Median Income by Occupancy in Lemont
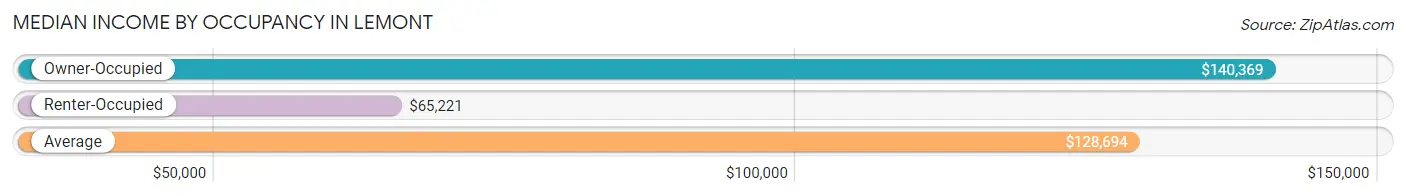
| Occupancy Type | # Households | Median Income |
| Owner-Occupied | 5,467 (87.7%) | $140,369 |
| Renter-Occupied | 768 (12.3%) | $65,221 |
| Average | 6,235 (100.0%) | $128,694 |
Occupancy by Householder Income Bracket in Lemont
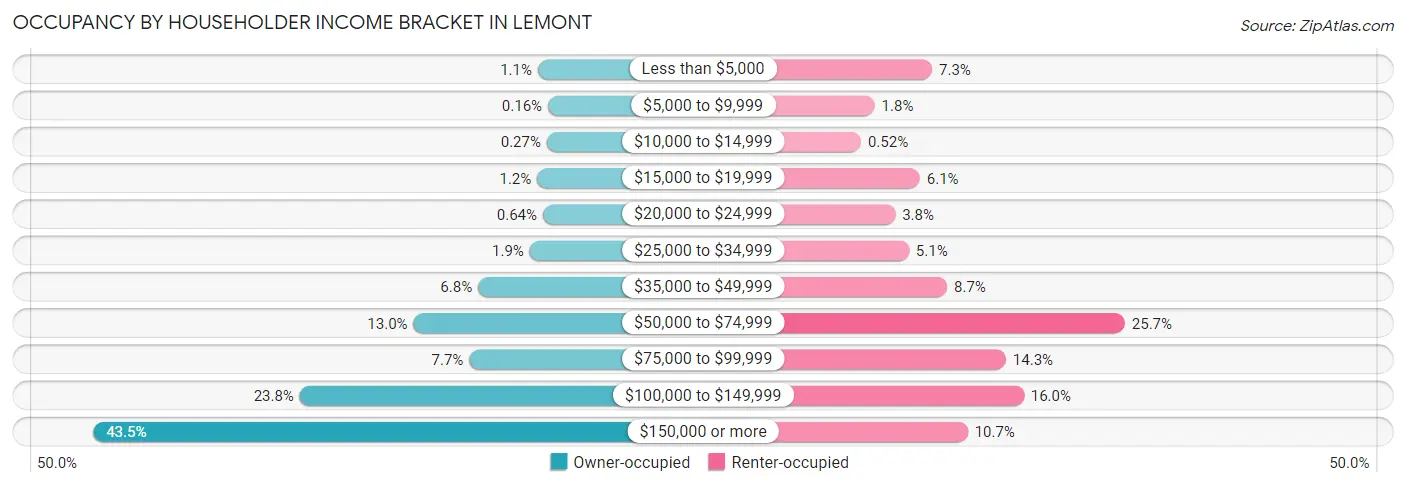
| Income Bracket | Owner-occupied | Renter-occupied |
| Less than $5,000 | 61 (1.1%) | 56 (7.3%) |
| $5,000 to $9,999 | 9 (0.2%) | 14 (1.8%) |
| $10,000 to $14,999 | 15 (0.3%) | 4 (0.5%) |
| $15,000 to $19,999 | 65 (1.2%) | 47 (6.1%) |
| $20,000 to $24,999 | 35 (0.6%) | 29 (3.8%) |
| $25,000 to $34,999 | 104 (1.9%) | 39 (5.1%) |
| $35,000 to $49,999 | 373 (6.8%) | 67 (8.7%) |
| $50,000 to $74,999 | 709 (13.0%) | 197 (25.7%) |
| $75,000 to $99,999 | 419 (7.7%) | 110 (14.3%) |
| $100,000 to $149,999 | 1,301 (23.8%) | 123 (16.0%) |
| $150,000 or more | 2,376 (43.5%) | 82 (10.7%) |
| Total | 5,467 (100.0%) | 768 (100.0%) |
Monthly Housing Cost Tiers in Lemont
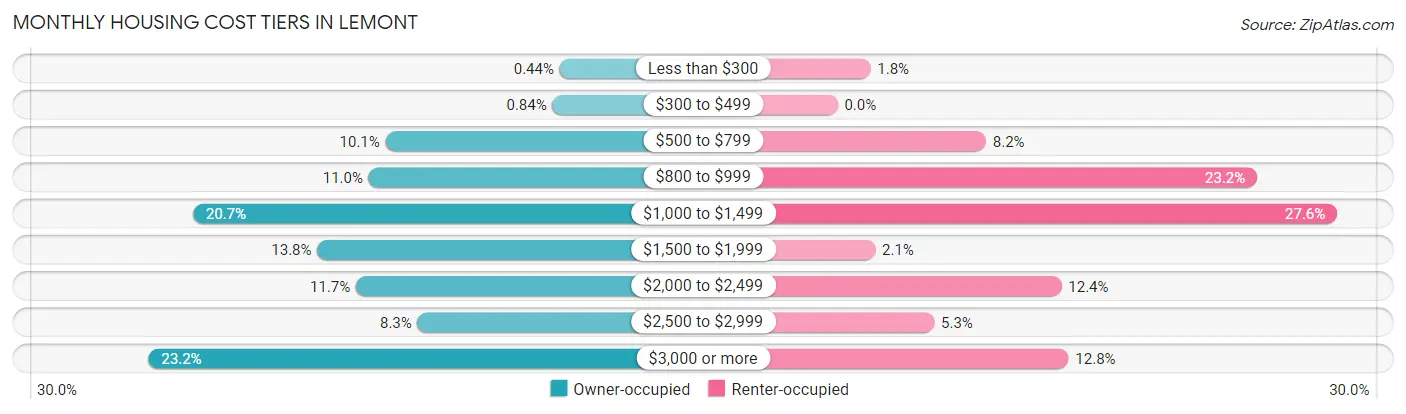
| Monthly Cost | Owner-occupied | Renter-occupied |
| Less than $300 | 24 (0.4%) | 14 (1.8%) |
| $300 to $499 | 46 (0.8%) | 0 (0.0%) |
| $500 to $799 | 550 (10.1%) | 63 (8.2%) |
| $800 to $999 | 601 (11.0%) | 178 (23.2%) |
| $1,000 to $1,499 | 1,132 (20.7%) | 212 (27.6%) |
| $1,500 to $1,999 | 756 (13.8%) | 16 (2.1%) |
| $2,000 to $2,499 | 639 (11.7%) | 95 (12.4%) |
| $2,500 to $2,999 | 453 (8.3%) | 41 (5.3%) |
| $3,000 or more | 1,266 (23.2%) | 98 (12.8%) |
| Total | 5,467 (100.0%) | 768 (100.0%) |
Physical Housing Characteristics in Lemont
Housing Structures in Lemont
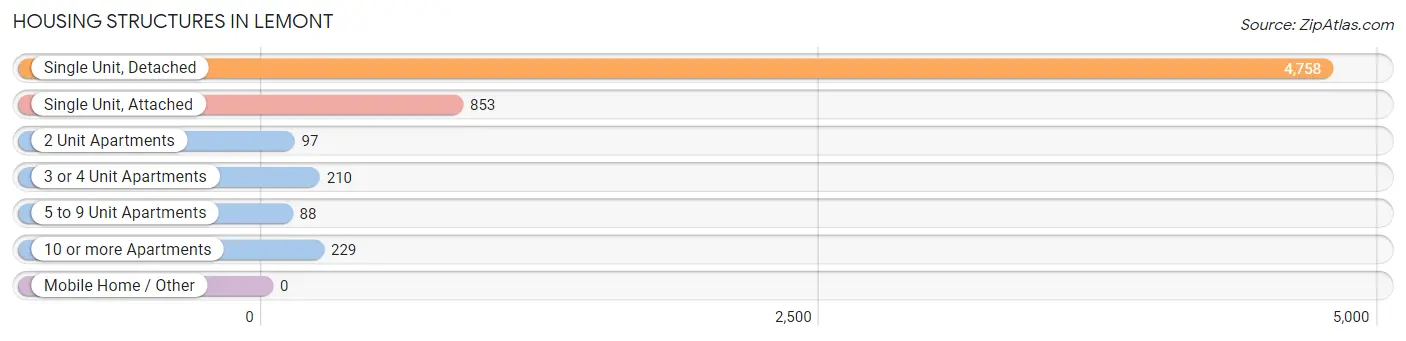
| Structure Type | # Housing Units | % Housing Units |
| Single Unit, Detached | 4,758 | 76.3% |
| Single Unit, Attached | 853 | 13.7% |
| 2 Unit Apartments | 97 | 1.6% |
| 3 or 4 Unit Apartments | 210 | 3.4% |
| 5 to 9 Unit Apartments | 88 | 1.4% |
| 10 or more Apartments | 229 | 3.7% |
| Mobile Home / Other | 0 | 0.0% |
| Total | 6,235 | 100.0% |
Housing Structures by Occupancy in Lemont
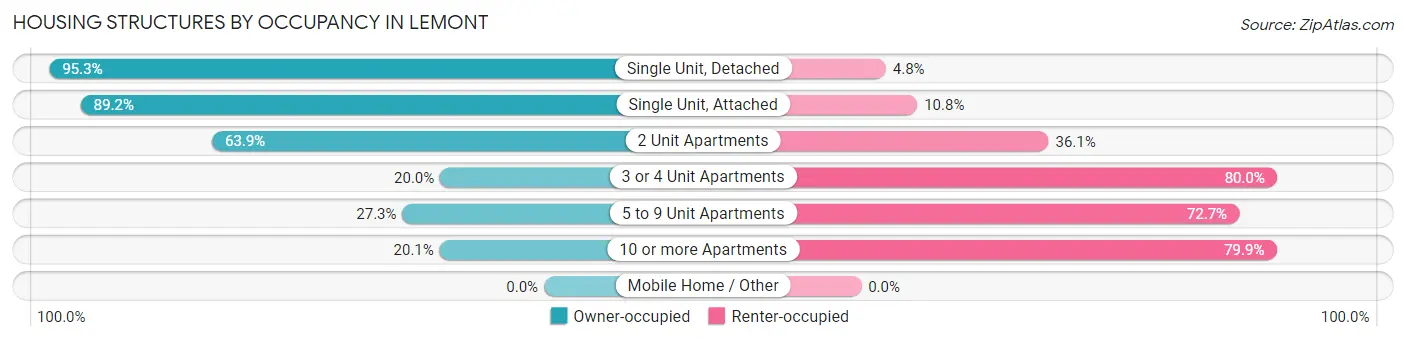
| Structure Type | Owner-occupied | Renter-occupied |
| Single Unit, Detached | 4,532 (95.3%) | 226 (4.8%) |
| Single Unit, Attached | 761 (89.2%) | 92 (10.8%) |
| 2 Unit Apartments | 62 (63.9%) | 35 (36.1%) |
| 3 or 4 Unit Apartments | 42 (20.0%) | 168 (80.0%) |
| 5 to 9 Unit Apartments | 24 (27.3%) | 64 (72.7%) |
| 10 or more Apartments | 46 (20.1%) | 183 (79.9%) |
| Mobile Home / Other | 0 (0.0%) | 0 (0.0%) |
| Total | 5,467 (87.7%) | 768 (12.3%) |
Housing Structures by Number of Rooms in Lemont
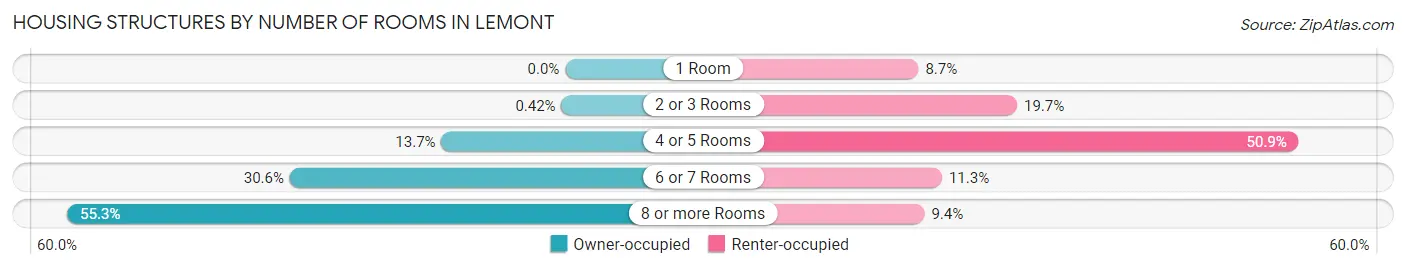
| Number of Rooms | Owner-occupied | Renter-occupied |
| 1 Room | 0 (0.0%) | 67 (8.7%) |
| 2 or 3 Rooms | 23 (0.4%) | 151 (19.7%) |
| 4 or 5 Rooms | 751 (13.7%) | 391 (50.9%) |
| 6 or 7 Rooms | 1,671 (30.6%) | 87 (11.3%) |
| 8 or more Rooms | 3,022 (55.3%) | 72 (9.4%) |
| Total | 5,467 (100.0%) | 768 (100.0%) |
Housing Structure by Heating Type in Lemont
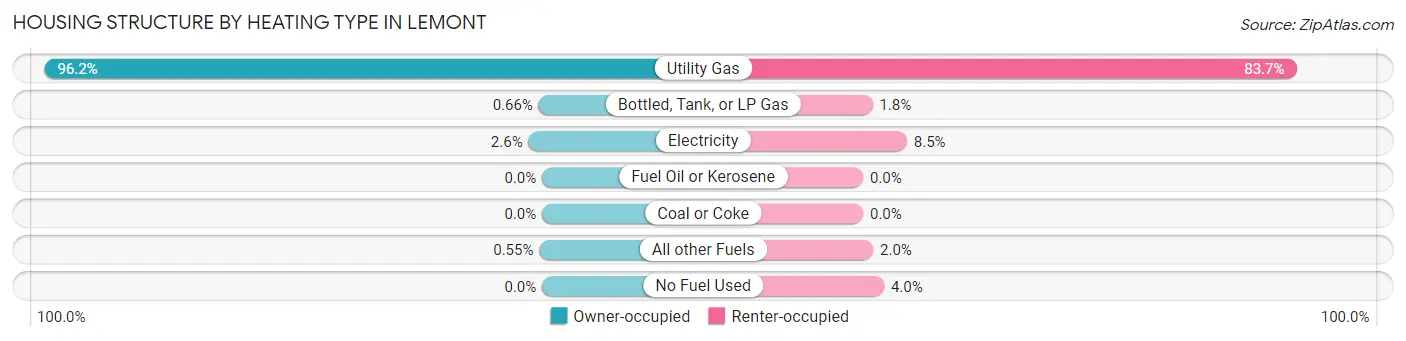
| Heating Type | Owner-occupied | Renter-occupied |
| Utility Gas | 5,257 (96.2%) | 643 (83.7%) |
| Bottled, Tank, or LP Gas | 36 (0.7%) | 14 (1.8%) |
| Electricity | 144 (2.6%) | 65 (8.5%) |
| Fuel Oil or Kerosene | 0 (0.0%) | 0 (0.0%) |
| Coal or Coke | 0 (0.0%) | 0 (0.0%) |
| All other Fuels | 30 (0.5%) | 15 (1.9%) |
| No Fuel Used | 0 (0.0%) | 31 (4.0%) |
| Total | 5,467 (100.0%) | 768 (100.0%) |
Household Vehicle Usage in Lemont
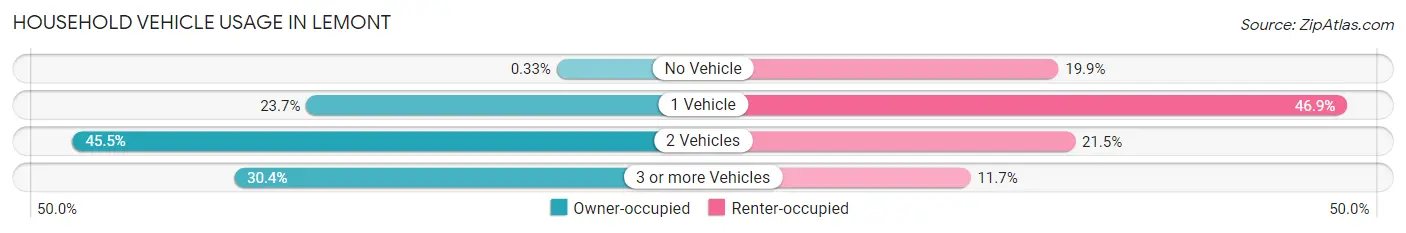
| Vehicles per Household | Owner-occupied | Renter-occupied |
| No Vehicle | 18 (0.3%) | 153 (19.9%) |
| 1 Vehicle | 1,296 (23.7%) | 360 (46.9%) |
| 2 Vehicles | 2,489 (45.5%) | 165 (21.5%) |
| 3 or more Vehicles | 1,664 (30.4%) | 90 (11.7%) |
| Total | 5,467 (100.0%) | 768 (100.0%) |
Real Estate & Mortgages in Lemont
Real Estate and Mortgage Overview in Lemont
| Characteristic | Without Mortgage | With Mortgage |
| Housing Units | 2,433 | 3,034 |
| Median Property Value | $441,900 | $449,200 |
| Median Household Income | $88,808 | $1,634 |
| Monthly Housing Costs | $1,010 | $1,266 |
| Real Estate Taxes | $7,770 | $0 |
Property Value by Mortgage Status in Lemont
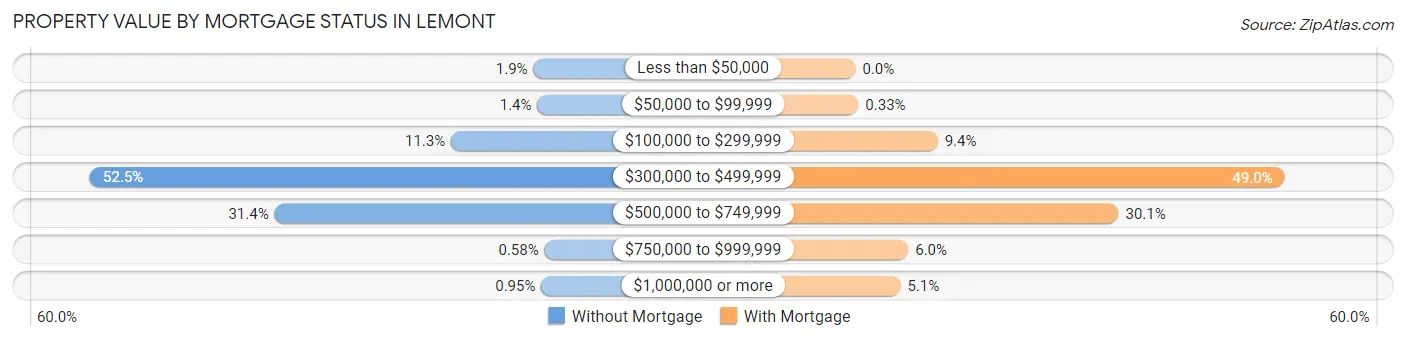
| Property Value | Without Mortgage | With Mortgage |
| Less than $50,000 | 45 (1.8%) | 0 (0.0%) |
| $50,000 to $99,999 | 34 (1.4%) | 10 (0.3%) |
| $100,000 to $299,999 | 274 (11.3%) | 285 (9.4%) |
| $300,000 to $499,999 | 1,278 (52.5%) | 1,488 (49.0%) |
| $500,000 to $749,999 | 765 (31.4%) | 912 (30.1%) |
| $750,000 to $999,999 | 14 (0.6%) | 183 (6.0%) |
| $1,000,000 or more | 23 (0.9%) | 156 (5.1%) |
| Total | 2,433 (100.0%) | 3,034 (100.0%) |
Household Income by Mortgage Status in Lemont
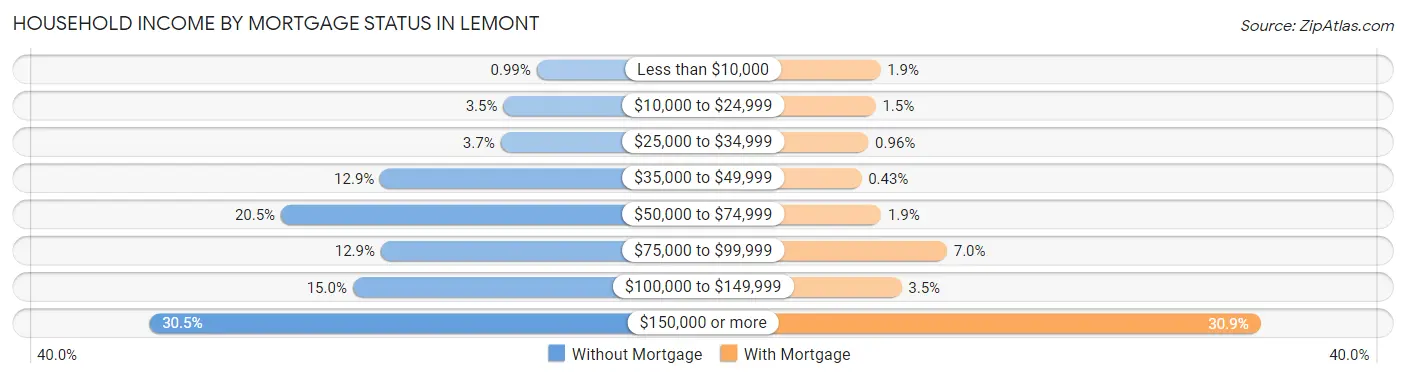
| Household Income | Without Mortgage | With Mortgage |
| Less than $10,000 | 24 (1.0%) | 57 (1.9%) |
| $10,000 to $24,999 | 86 (3.5%) | 46 (1.5%) |
| $25,000 to $34,999 | 91 (3.7%) | 29 (1.0%) |
| $35,000 to $49,999 | 314 (12.9%) | 13 (0.4%) |
| $50,000 to $74,999 | 498 (20.5%) | 59 (1.9%) |
| $75,000 to $99,999 | 313 (12.9%) | 211 (7.0%) |
| $100,000 to $149,999 | 365 (15.0%) | 106 (3.5%) |
| $150,000 or more | 742 (30.5%) | 936 (30.8%) |
| Total | 2,433 (100.0%) | 3,034 (100.0%) |
Property Value to Household Income Ratio in Lemont
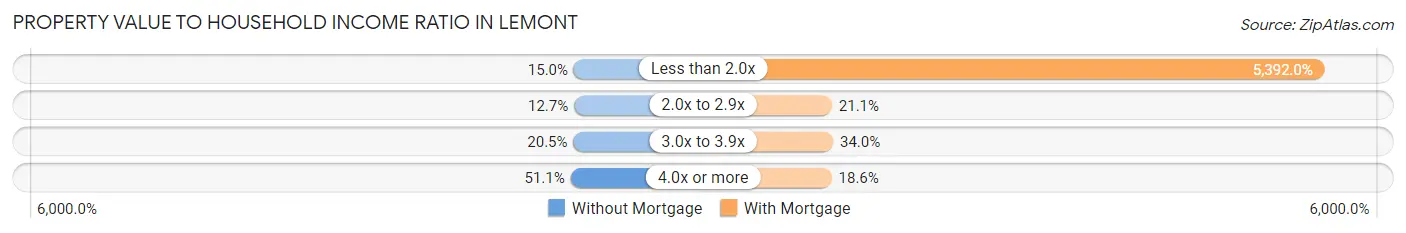
| Value-to-Income Ratio | Without Mortgage | With Mortgage |
| Less than 2.0x | 366 (15.0%) | 163,594 (5,392.0%) |
| 2.0x to 2.9x | 310 (12.7%) | 641 (21.1%) |
| 3.0x to 3.9x | 499 (20.5%) | 1,031 (34.0%) |
| 4.0x or more | 1,243 (51.1%) | 565 (18.6%) |
| Total | 2,433 (100.0%) | 3,034 (100.0%) |
Real Estate Taxes by Mortgage Status in Lemont
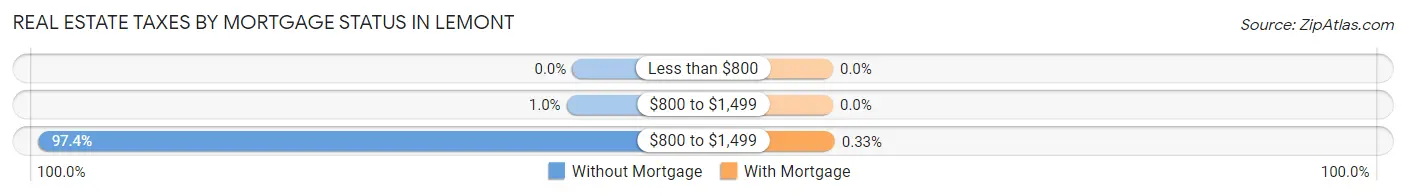
| Property Taxes | Without Mortgage | With Mortgage |
| Less than $800 | 0 (0.0%) | 0 (0.0%) |
| $800 to $1,499 | 25 (1.0%) | 0 (0.0%) |
| $800 to $1,499 | 2,370 (97.4%) | 10 (0.3%) |
| Total | 2,433 (100.0%) | 3,034 (100.0%) |
Health & Disability in Lemont
Health Insurance Coverage by Age in Lemont
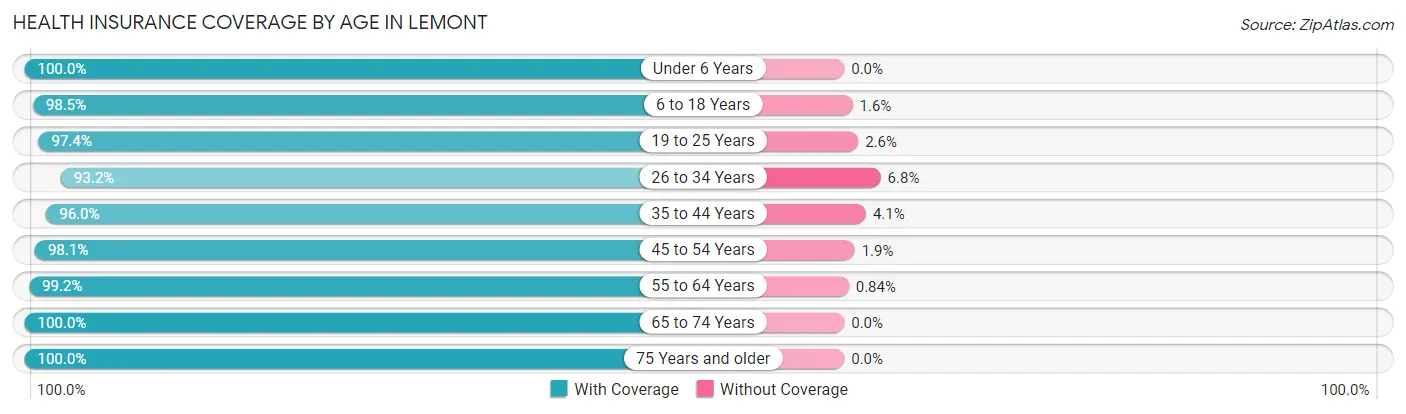
| Age Bracket | With Coverage | Without Coverage |
| Under 6 Years | 976 (100.0%) | 0 (0.0%) |
| 6 to 18 Years | 3,429 (98.5%) | 54 (1.5%) |
| 19 to 25 Years | 1,120 (97.4%) | 30 (2.6%) |
| 26 to 34 Years | 1,141 (93.2%) | 83 (6.8%) |
| 35 to 44 Years | 2,109 (96.0%) | 89 (4.1%) |
| 45 to 54 Years | 2,177 (98.1%) | 43 (1.9%) |
| 55 to 64 Years | 2,712 (99.2%) | 23 (0.8%) |
| 65 to 74 Years | 1,761 (100.0%) | 0 (0.0%) |
| 75 Years and older | 1,557 (100.0%) | 0 (0.0%) |
| Total | 16,982 (98.1%) | 322 (1.9%) |
Health Insurance Coverage by Citizenship Status in Lemont
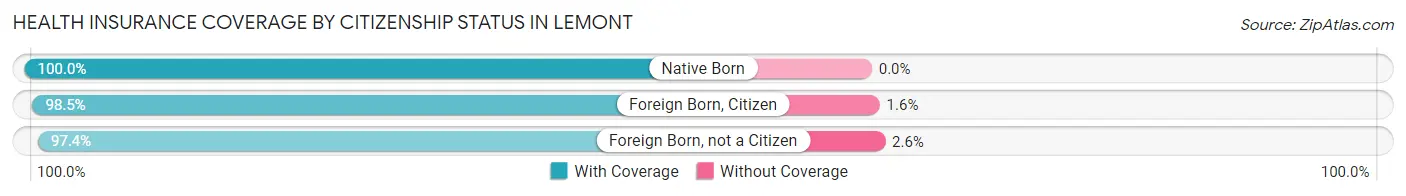
| Citizenship Status | With Coverage | Without Coverage |
| Native Born | 976 (100.0%) | 0 (0.0%) |
| Foreign Born, Citizen | 3,429 (98.5%) | 54 (1.5%) |
| Foreign Born, not a Citizen | 1,120 (97.4%) | 30 (2.6%) |
Health Insurance Coverage by Household Income in Lemont
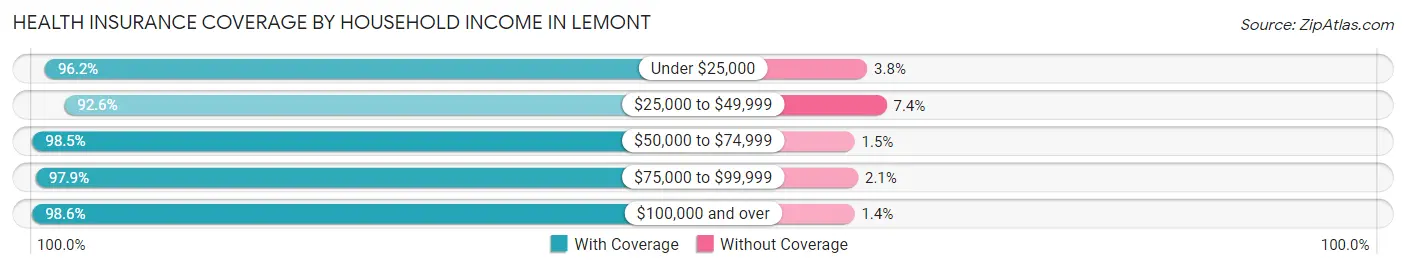
| Household Income | With Coverage | Without Coverage |
| Under $25,000 | 403 (96.2%) | 16 (3.8%) |
| $25,000 to $49,999 | 834 (92.6%) | 67 (7.4%) |
| $50,000 to $74,999 | 1,820 (98.5%) | 27 (1.5%) |
| $75,000 to $99,999 | 1,251 (97.9%) | 27 (2.1%) |
| $100,000 and over | 12,651 (98.6%) | 185 (1.4%) |
Public vs Private Health Insurance Coverage by Age in Lemont
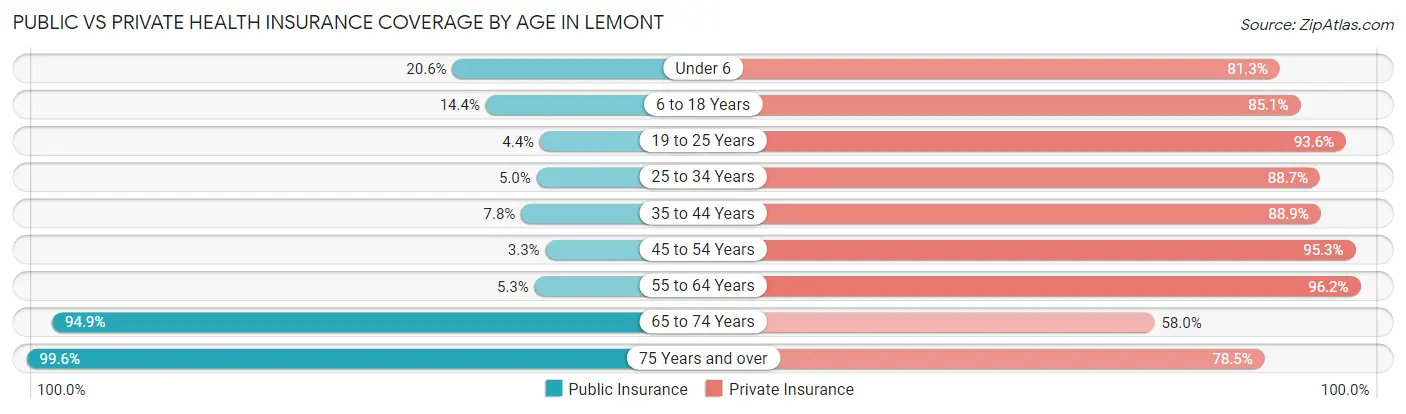
| Age Bracket | Public Insurance | Private Insurance |
| Under 6 | 201 (20.6%) | 793 (81.2%) |
| 6 to 18 Years | 502 (14.4%) | 2,964 (85.1%) |
| 19 to 25 Years | 50 (4.3%) | 1,076 (93.6%) |
| 25 to 34 Years | 61 (5.0%) | 1,086 (88.7%) |
| 35 to 44 Years | 172 (7.8%) | 1,953 (88.8%) |
| 45 to 54 Years | 74 (3.3%) | 2,116 (95.3%) |
| 55 to 64 Years | 146 (5.3%) | 2,632 (96.2%) |
| 65 to 74 Years | 1,671 (94.9%) | 1,022 (58.0%) |
| 75 Years and over | 1,551 (99.6%) | 1,222 (78.5%) |
| Total | 4,428 (25.6%) | 14,864 (85.9%) |
Disability Status by Sex by Age in Lemont
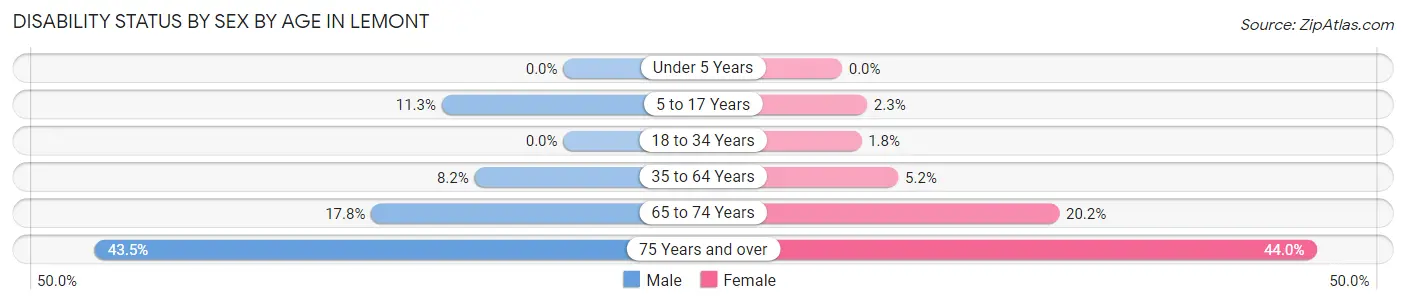
| Age Bracket | Male | Female |
| Under 5 Years | 0 (0.0%) | 0 (0.0%) |
| 5 to 17 Years | 225 (11.3%) | 30 (2.3%) |
| 18 to 34 Years | 0 (0.0%) | 24 (1.8%) |
| 35 to 64 Years | 304 (8.2%) | 181 (5.2%) |
| 65 to 74 Years | 153 (17.8%) | 182 (20.2%) |
| 75 Years and over | 273 (43.5%) | 409 (44.0%) |
Disability Class by Sex by Age in Lemont
Disability Class: Hearing Difficulty
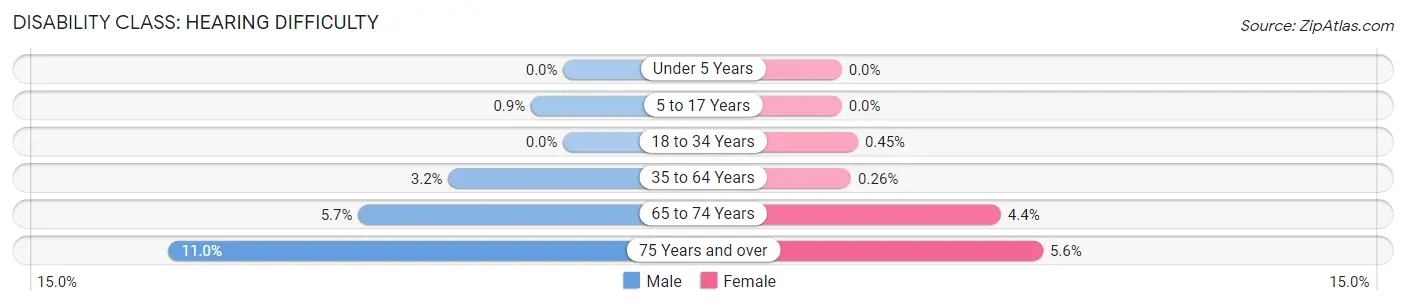
| Age Bracket | Male | Female |
| Under 5 Years | 0 (0.0%) | 0 (0.0%) |
| 5 to 17 Years | 18 (0.9%) | 0 (0.0%) |
| 18 to 34 Years | 0 (0.0%) | 6 (0.4%) |
| 35 to 64 Years | 118 (3.2%) | 9 (0.3%) |
| 65 to 74 Years | 49 (5.7%) | 40 (4.4%) |
| 75 Years and over | 69 (11.0%) | 52 (5.6%) |
Disability Class: Vision Difficulty
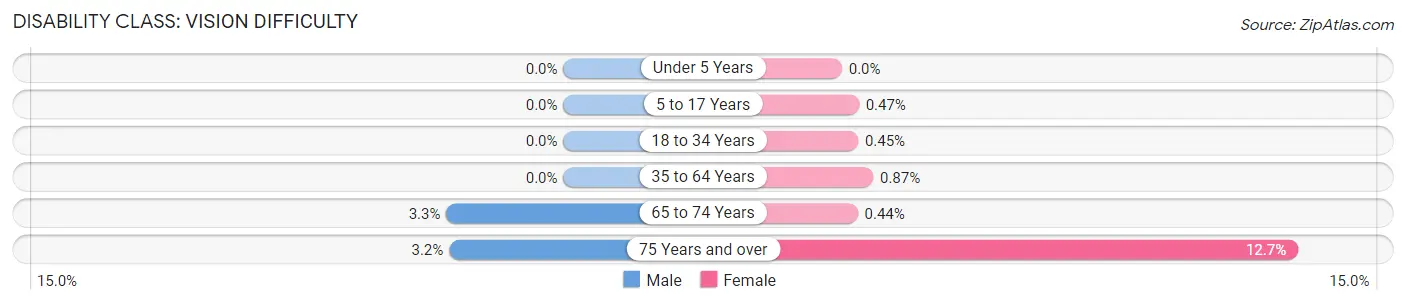
| Age Bracket | Male | Female |
| Under 5 Years | 0 (0.0%) | 0 (0.0%) |
| 5 to 17 Years | 0 (0.0%) | 6 (0.5%) |
| 18 to 34 Years | 0 (0.0%) | 6 (0.4%) |
| 35 to 64 Years | 0 (0.0%) | 30 (0.9%) |
| 65 to 74 Years | 28 (3.3%) | 4 (0.4%) |
| 75 Years and over | 20 (3.2%) | 118 (12.7%) |
Disability Class: Cognitive Difficulty
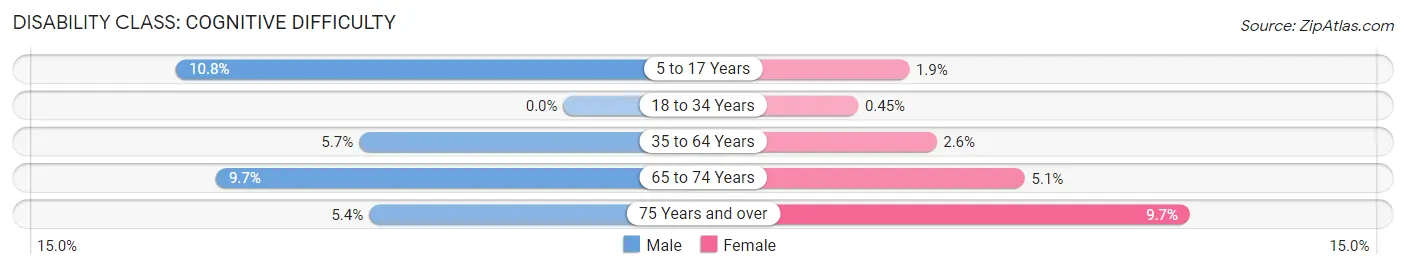
| Age Bracket | Male | Female |
| 5 to 17 Years | 215 (10.8%) | 24 (1.9%) |
| 18 to 34 Years | 0 (0.0%) | 6 (0.4%) |
| 35 to 64 Years | 210 (5.7%) | 91 (2.6%) |
| 65 to 74 Years | 83 (9.7%) | 46 (5.1%) |
| 75 Years and over | 34 (5.4%) | 90 (9.7%) |
Disability Class: Ambulatory Difficulty
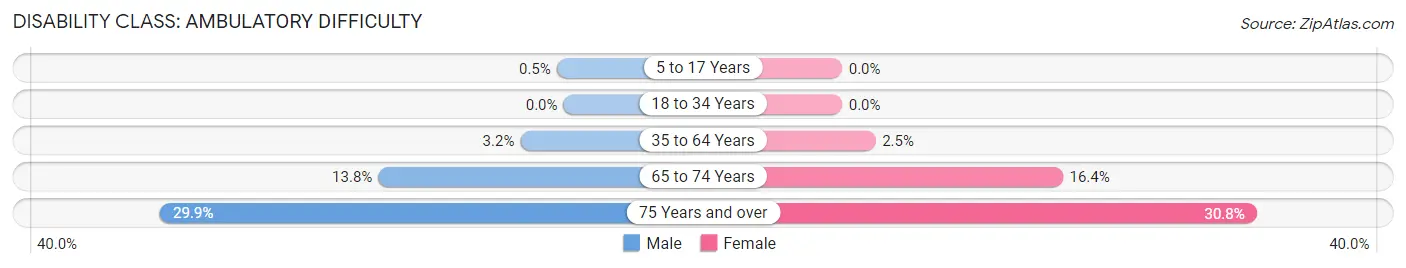
| Age Bracket | Male | Female |
| 5 to 17 Years | 10 (0.5%) | 0 (0.0%) |
| 18 to 34 Years | 0 (0.0%) | 0 (0.0%) |
| 35 to 64 Years | 118 (3.2%) | 86 (2.5%) |
| 65 to 74 Years | 118 (13.8%) | 148 (16.4%) |
| 75 Years and over | 188 (29.9%) | 286 (30.8%) |
Disability Class: Self-Care Difficulty
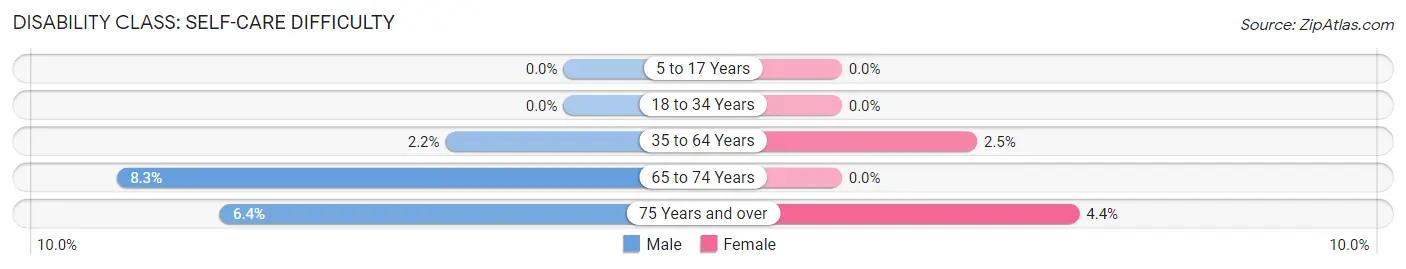
| Age Bracket | Male | Female |
| 5 to 17 Years | 0 (0.0%) | 0 (0.0%) |
| 18 to 34 Years | 0 (0.0%) | 0 (0.0%) |
| 35 to 64 Years | 81 (2.2%) | 87 (2.5%) |
| 65 to 74 Years | 71 (8.3%) | 0 (0.0%) |
| 75 Years and over | 40 (6.4%) | 41 (4.4%) |
Technology Access in Lemont
Computing Device Access in Lemont
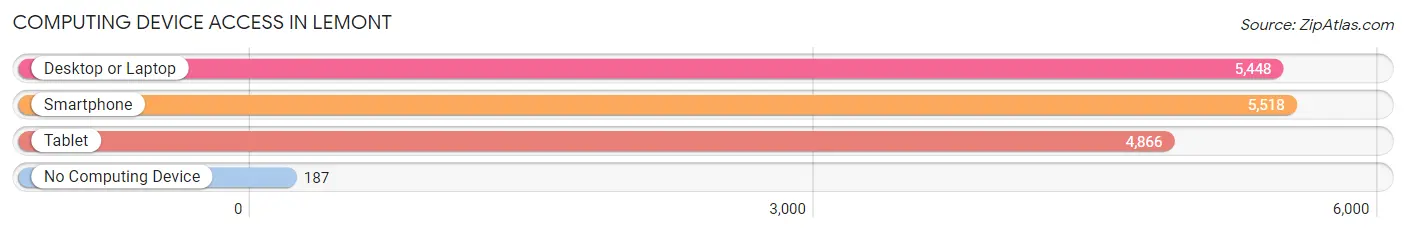
| Device Type | # Households | % Households |
| Desktop or Laptop | 5,448 | 87.4% |
| Smartphone | 5,518 | 88.5% |
| Tablet | 4,866 | 78.0% |
| No Computing Device | 187 | 3.0% |
| Total | 6,235 | 100.0% |
Internet Access in Lemont
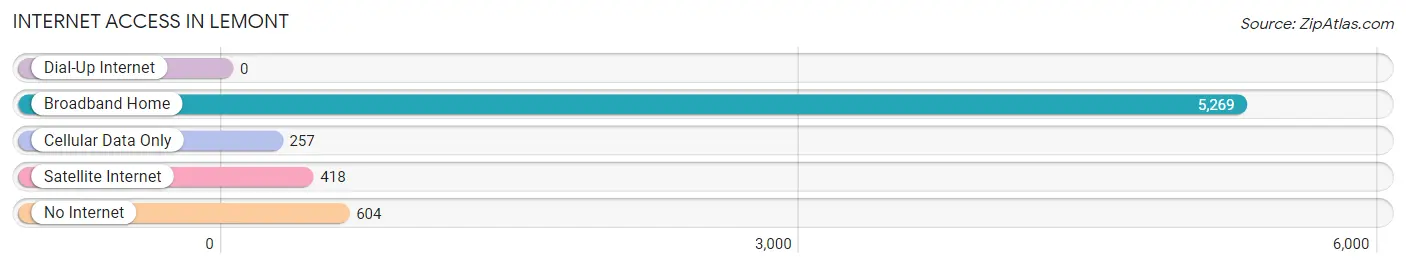
| Internet Type | # Households | % Households |
| Dial-Up Internet | 0 | 0.0% |
| Broadband Home | 5,269 | 84.5% |
| Cellular Data Only | 257 | 4.1% |
| Satellite Internet | 418 | 6.7% |
| No Internet | 604 | 9.7% |
| Total | 6,235 | 100.0% |
Lemont Summary
Lemont is a village located in Cook and DuPage counties in the state of Illinois. It is a suburb of Chicago, located about 25 miles southwest of the city. The population of Lemont was 16,000 as of the 2010 census.
History
Lemont was first settled in the 1830s by German and Irish immigrants. The village was originally known as Keepataw, after the Potawatomi word for “where the road forks”. The name was changed to Lemont in 1873, after the Lemont family, who had purchased the land in 1836. The Lemont family was instrumental in the development of the village, and the family’s name is still prominent in the area.
The village was incorporated in 1867, and the first mayor was John Lemont. The village grew slowly, but steadily, and by the early 1900s, it had become a popular summer resort destination. The village was also known for its limestone quarries, which provided the stone for many of the buildings in Chicago.
Geography
Lemont is located in northeastern Illinois, about 25 miles southwest of Chicago. It is situated on the Des Plaines River, and is bordered by the towns of Lockport, Homer Glen, and Woodridge. The village covers an area of 8.3 square miles, and has a population density of 1,919 people per square mile.
The village is located in a hilly area, with elevations ranging from 600 to 800 feet above sea level. The highest point in the village is located at the intersection of Main Street and Archer Avenue, at an elevation of 810 feet.
Economy
Lemont’s economy is largely based on manufacturing and retail. The village is home to several large companies, including the Argonne National Laboratory, the Lemont Refinery, and the Lemont Quarry. The village also has a number of small businesses, including restaurants, shops, and professional services.
The village is also home to several educational institutions, including the University of Chicago, the Illinois Institute of Technology, and the Lemont High School.
Demographics
As of the 2010 census, the population of Lemont was 16,000. The racial makeup of the village was 87.3% White, 5.2% Asian, 3.2% African American, and 2.3% Hispanic or Latino. The median household income was $76,000, and the median age was 40.
The village is served by the Lemont Public Library, which has a collection of over 100,000 books and other materials. The library also offers a variety of programs and services, including computer classes, book clubs, and story times.
Conclusion
Lemont is a village located in Cook and DuPage counties in the state of Illinois. It is a suburb of Chicago, located about 25 miles southwest of the city. The village was first settled in the 1830s by German and Irish immigrants, and was incorporated in 1867. The village is situated on the Des Plaines River, and is bordered by the towns of Lockport, Homer Glen, and Woodridge. The economy of Lemont is largely based on manufacturing and retail, and the village is home to several large companies and educational institutions. As of the 2010 census, the population of Lemont was 16,000, with a median household income of $76,000 and a median age of 40.
Common Questions
What is Per Capita Income in Lemont?
Per Capita income in Lemont is $53,286.
What is the Median Family Income in Lemont?
Median Family Income in Lemont is $149,003.
What is the Median Household income in Lemont?
Median Household Income in Lemont is $128,694.
What is Income or Wage Gap in Lemont?
Income or Wage Gap in Lemont is 43.3%.
Women in Lemont earn 56.7 cents for every dollar earned by a man.
What is Family Income Deficit in Lemont?
Family Income Deficit in Lemont is $5,334.
Families that are below poverty line in Lemont earn $5,334 less on average than the poverty threshold level.
What is Inequality or Gini Index in Lemont?
Inequality or Gini Index in Lemont is 0.38.
What is the Total Population of Lemont?
Total Population of Lemont is 17,558.
What is the Total Male Population of Lemont?
Total Male Population of Lemont is 9,102.
What is the Total Female Population of Lemont?
Total Female Population of Lemont is 8,456.
What is the Ratio of Males per 100 Females in Lemont?
There are 107.64 Males per 100 Females in Lemont.
What is the Ratio of Females per 100 Males in Lemont?
There are 92.90 Females per 100 Males in Lemont.
What is the Median Population Age in Lemont?
Median Population Age in Lemont is 44.2 Years.
What is the Average Family Size in Lemont
Average Family Size in Lemont is 3.3 People.
What is the Average Household Size in Lemont
Average Household Size in Lemont is 2.8 People.
How Large is the Labor Force in Lemont?
There are 8,949 People in the Labor Forcein in Lemont.
What is the Percentage of People in the Labor Force in Lemont?
64.0% of People are in the Labor Force in Lemont.
What is the Unemployment Rate in Lemont?
Unemployment Rate in Lemont is 3.9%.