Lake Forest, IL Map & Demographics
Lake Forest Map
Lake Forest Overview
$104,341
PER CAPITA INCOME
$240,000
AVG FAMILY INCOME
$202,153
AVG HOUSEHOLD INCOME
65.3%
WAGE / INCOME GAP [ % ]
34.7¢/ $1
WAGE / INCOME GAP [ $ ]
0.49
INEQUALITY / GINI INDEX
19,436
TOTAL POPULATION
9,366
MALE POPULATION
10,070
FEMALE POPULATION
93.01
MALES / 100 FEMALES
107.52
FEMALES / 100 MALES
44.9
MEDIAN AGE
3.1
AVG FAMILY SIZE
2.6
AVG HOUSEHOLD SIZE
8,957
LABOR FORCE [ PEOPLE ]
55.6%
PERCENT IN LABOR FORCE
3.1%
UNEMPLOYMENT RATE
Lake Forest Zip Codes
Income in Lake Forest
Income Overview in Lake Forest
Per Capita Income in Lake Forest is $104,341, while median incomes of families and households are $240,000 and $202,153 respectively.
| Characteristic | Number | Measure |
| Per Capita Income | 19,436 | $104,341 |
| Median Family Income | 5,106 | $240,000 |
| Mean Family Income | 5,106 | $337,110 |
| Median Household Income | 6,959 | $202,153 |
| Mean Household Income | 6,959 | $284,784 |
| Income Deficit | 5,106 | $0 |
| Wage / Income Gap (%) | 19,436 | 65.28% |
| Wage / Income Gap ($) | 19,436 | 34.72¢ per $1 |
| Gini / Inequality Index | 19,436 | 0.49 |
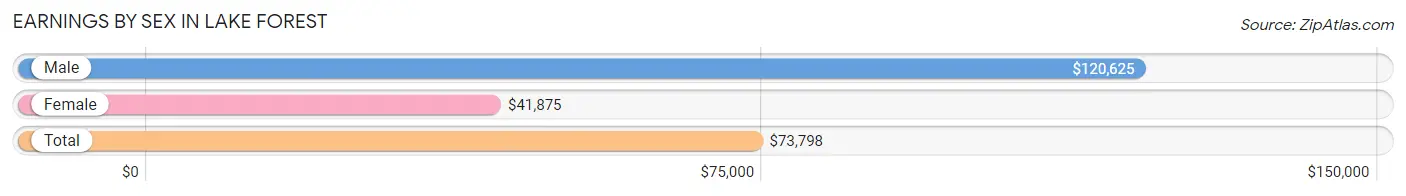
Earnings by Sex in Lake Forest
Average Earnings in Lake Forest are $73,798, $120,625 for men and $41,875 for women, a difference of 65.3%.
| Sex | Number | Average Earnings |
| Male | 5,423 (53.6%) | $120,625 |
| Female | 4,691 (46.4%) | $41,875 |
| Total | 10,114 (100.0%) | $73,798 |
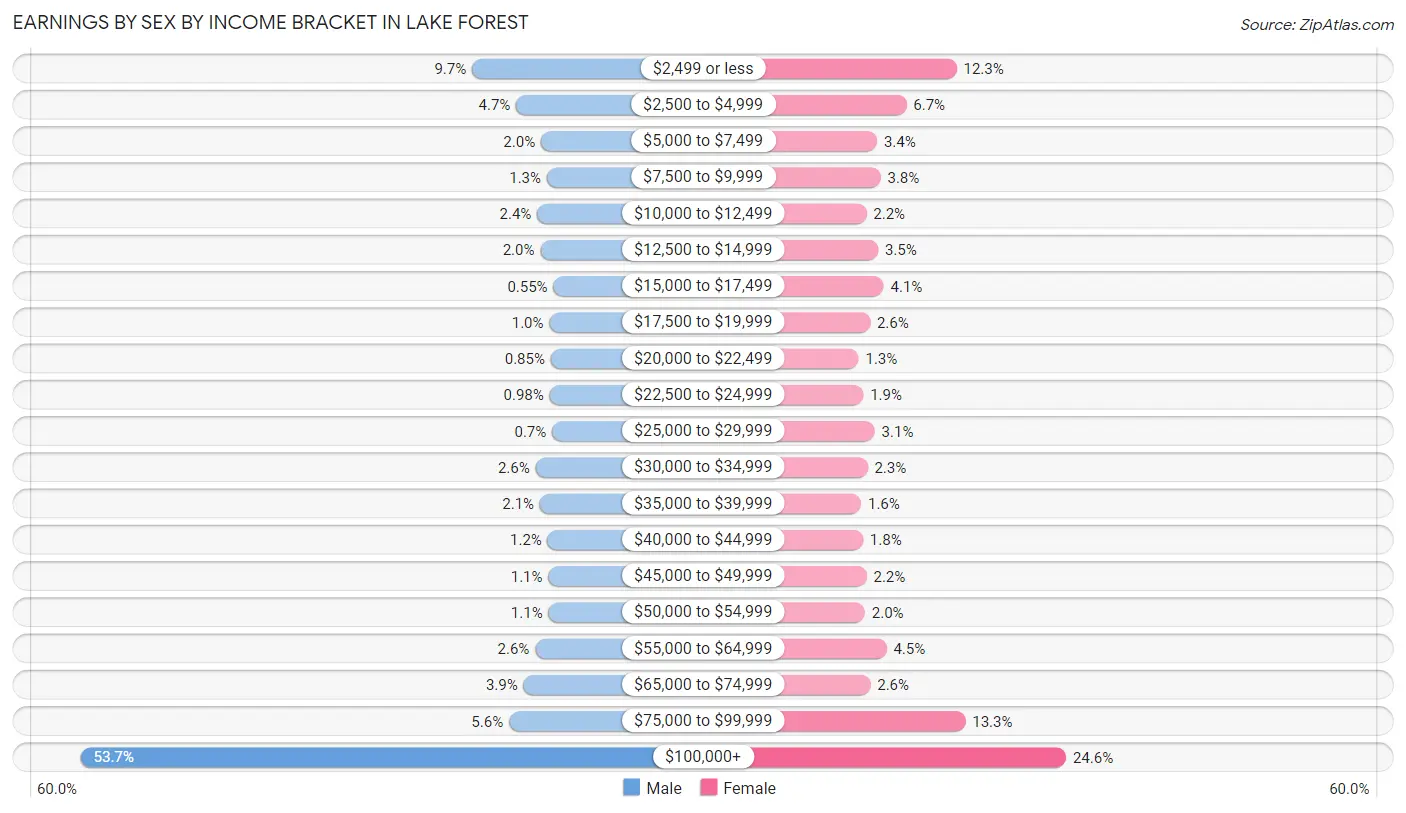
Earnings by Sex by Income Bracket in Lake Forest
The most common earnings brackets in Lake Forest are $100,000+ for men (2,912 | 53.7%) and $100,000+ for women (1,156 | 24.6%).
| Income | Male | Female |
| $2,499 or less | 526 (9.7%) | 579 (12.3%) |
| $2,500 to $4,999 | 257 (4.7%) | 314 (6.7%) |
| $5,000 to $7,499 | 106 (1.9%) | 159 (3.4%) |
| $7,500 to $9,999 | 70 (1.3%) | 178 (3.8%) |
| $10,000 to $12,499 | 129 (2.4%) | 103 (2.2%) |
| $12,500 to $14,999 | 110 (2.0%) | 164 (3.5%) |
| $15,000 to $17,499 | 30 (0.5%) | 194 (4.1%) |
| $17,500 to $19,999 | 55 (1.0%) | 122 (2.6%) |
| $20,000 to $22,499 | 46 (0.9%) | 62 (1.3%) |
| $22,500 to $24,999 | 53 (1.0%) | 87 (1.8%) |
| $25,000 to $29,999 | 38 (0.7%) | 147 (3.1%) |
| $30,000 to $34,999 | 139 (2.6%) | 109 (2.3%) |
| $35,000 to $39,999 | 112 (2.1%) | 75 (1.6%) |
| $40,000 to $44,999 | 65 (1.2%) | 85 (1.8%) |
| $45,000 to $49,999 | 61 (1.1%) | 104 (2.2%) |
| $50,000 to $54,999 | 60 (1.1%) | 95 (2.0%) |
| $55,000 to $64,999 | 141 (2.6%) | 209 (4.5%) |
| $65,000 to $74,999 | 212 (3.9%) | 124 (2.6%) |
| $75,000 to $99,999 | 301 (5.6%) | 625 (13.3%) |
| $100,000+ | 2,912 (53.7%) | 1,156 (24.6%) |
| Total | 5,423 (100.0%) | 4,691 (100.0%) |
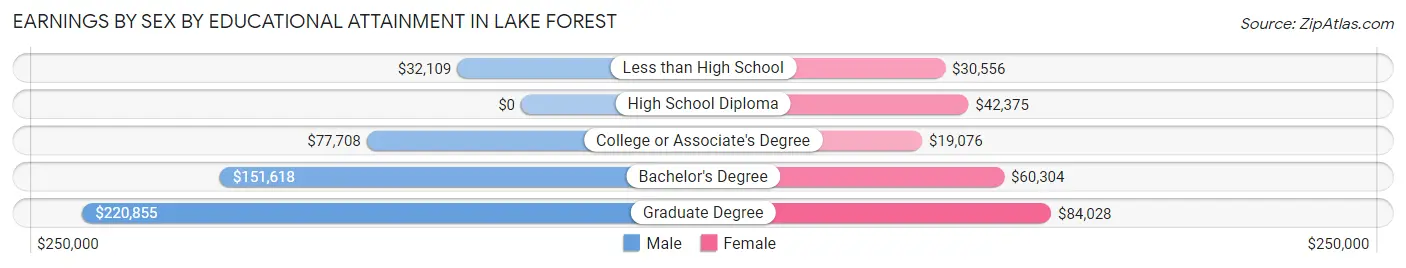
Earnings by Sex by Educational Attainment in Lake Forest
Average earnings in Lake Forest are $154,365 for men and $75,435 for women, a difference of 51.1%. Men with an educational attainment of graduate degree enjoy the highest average annual earnings of $220,855, while those with less than high school education earn the least with $32,109. Women with an educational attainment of graduate degree earn the most with the average annual earnings of $84,028, while those with college or associate's degree education have the smallest earnings of $19,076.
| Educational Attainment | Male Income | Female Income |
| Less than High School | $32,109 | $30,556 |
| High School Diploma | - | - |
| College or Associate's Degree | $77,708 | $19,076 |
| Bachelor's Degree | $151,618 | $60,304 |
| Graduate Degree | $220,855 | $84,028 |
| Total | $154,365 | $75,435 |
Family Income in Lake Forest
Family Income Brackets in Lake Forest
According to the Lake Forest family income data, there are 3,048 families falling into the $200,000+ income range, which is the most common income bracket and makes up 59.7% of all families.
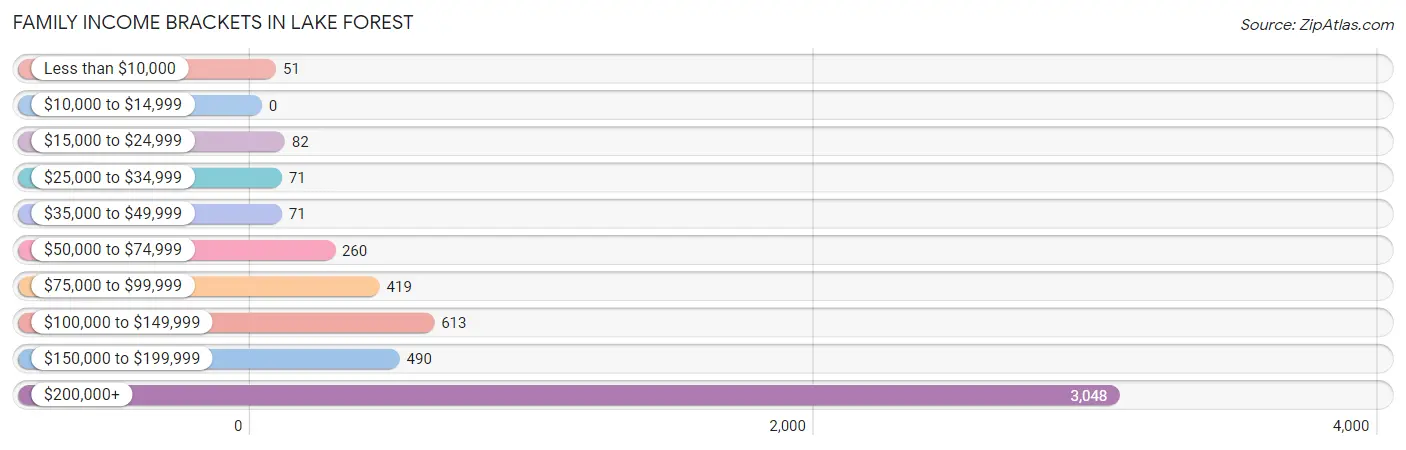
| Income Bracket | # Families | % Families |
| Less than $10,000 | 51 | 1.0% |
| $10,000 to $14,999 | 0 | 0.0% |
| $15,000 to $24,999 | 82 | 1.6% |
| $25,000 to $34,999 | 71 | 1.4% |
| $35,000 to $49,999 | 71 | 1.4% |
| $50,000 to $74,999 | 260 | 5.1% |
| $75,000 to $99,999 | 419 | 8.2% |
| $100,000 to $149,999 | 613 | 12.0% |
| $150,000 to $199,999 | 490 | 9.6% |
| $200,000+ | 3,048 | 59.7% |
Family Income by Famaliy Size in Lake Forest
4-person families (1,301 | 25.5%) account for the highest median family income in Lake Forest with $250,001 per family, while 2-person families (2,403 | 47.1%) have the highest median income of $108,438 per family member.
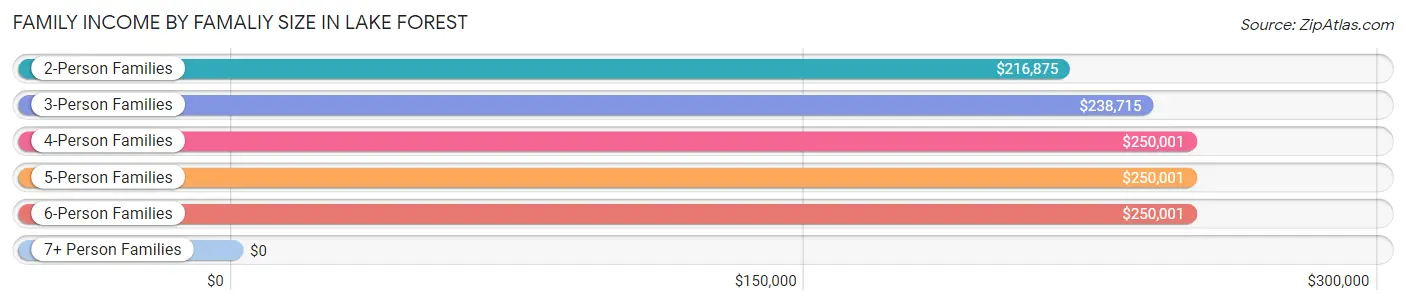
| Income Bracket | # Families | Median Income |
| 2-Person Families | 2,403 (47.1%) | $216,875 |
| 3-Person Families | 1,013 (19.8%) | $238,715 |
| 4-Person Families | 1,301 (25.5%) | $250,001 |
| 5-Person Families | 253 (5.0%) | $250,001 |
| 6-Person Families | 87 (1.7%) | $250,001 |
| 7+ Person Families | 49 (1.0%) | $0 |
| Total | 5,106 (100.0%) | $240,000 |
Family Income by Number of Earners in Lake Forest
The median family income in Lake Forest is $240,000, with families comprising 1 earner (1,680) having the highest median family income of $250,001, while families with no earners (846) have the lowest median family income of $163,625, accounting for 32.9% and 16.6% of families, respectively.
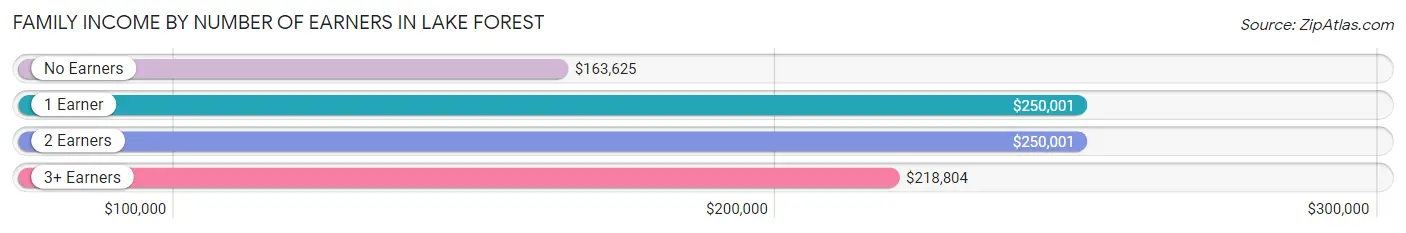
| Number of Earners | # Families | Median Income |
| No Earners | 846 (16.6%) | $163,625 |
| 1 Earner | 1,680 (32.9%) | $250,001 |
| 2 Earners | 2,047 (40.1%) | $250,001 |
| 3+ Earners | 533 (10.4%) | $218,804 |
| Total | 5,106 (100.0%) | $240,000 |
Household Income in Lake Forest
Household Income Brackets in Lake Forest
With 3,556 households falling in the category, the $200,000+ income range is the most frequent in Lake Forest, accounting for 51.1% of all households. In contrast, only 21 households (0.3%) fall into the $10,000 to $14,999 income bracket, making it the least populous group.
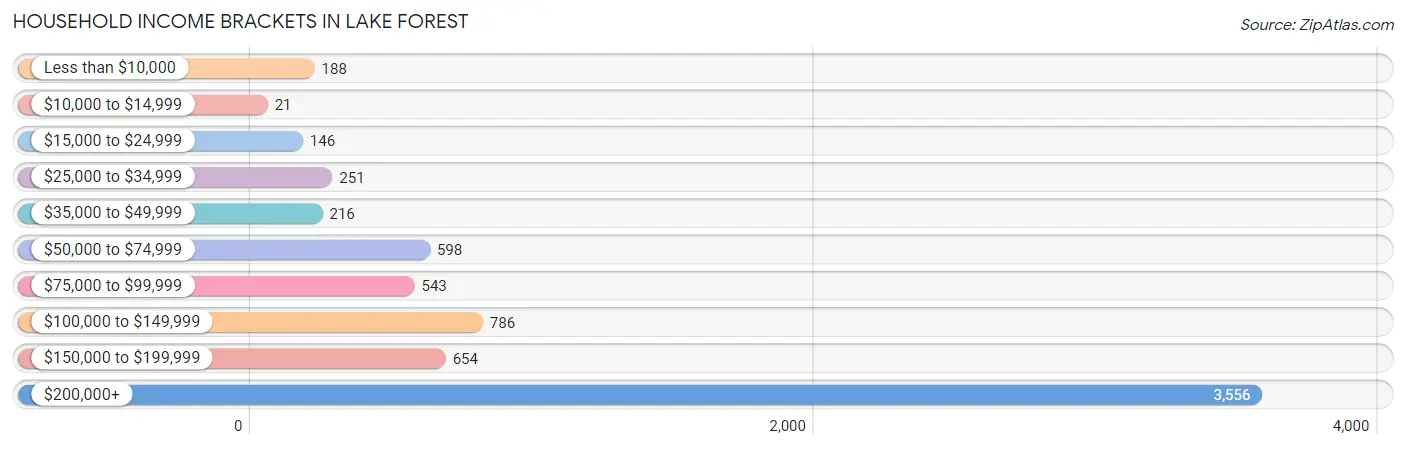
| Income Bracket | # Households | % Households |
| Less than $10,000 | 188 | 2.7% |
| $10,000 to $14,999 | 21 | 0.3% |
| $15,000 to $24,999 | 146 | 2.1% |
| $25,000 to $34,999 | 251 | 3.6% |
| $35,000 to $49,999 | 216 | 3.1% |
| $50,000 to $74,999 | 598 | 8.6% |
| $75,000 to $99,999 | 543 | 7.8% |
| $100,000 to $149,999 | 786 | 11.3% |
| $150,000 to $199,999 | 654 | 9.4% |
| $200,000+ | 3,556 | 51.1% |
Household Income by Householder Age in Lake Forest
The median household income in Lake Forest is $202,153, with the highest median household income of $238,361 found in the 45 to 64 years age bracket for the primary householder. A total of 2,740 households (39.4%) fall into this category. Meanwhile, the 15 to 24 years age bracket for the primary householder has the lowest median household income of $0, with 16 households (0.2%) in this group.
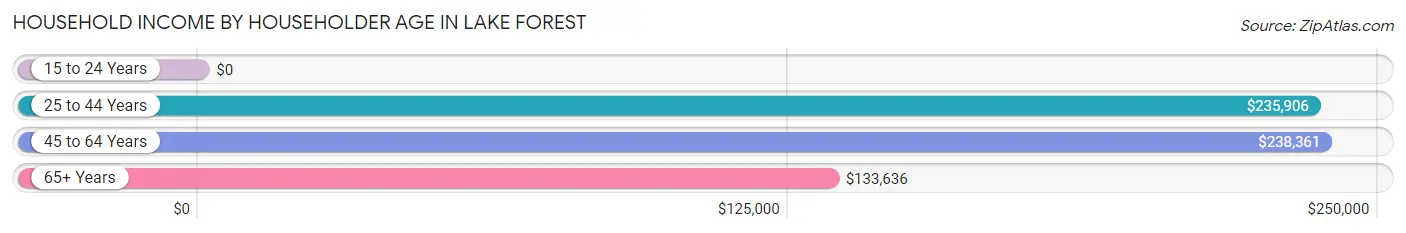
| Income Bracket | # Households | Median Income |
| 15 to 24 Years | 16 (0.2%) | $0 |
| 25 to 44 Years | 1,337 (19.2%) | $235,906 |
| 45 to 64 Years | 2,740 (39.4%) | $238,361 |
| 65+ Years | 2,866 (41.2%) | $133,636 |
| Total | 6,959 (100.0%) | $202,153 |
Poverty in Lake Forest
Income Below Poverty by Sex and Age in Lake Forest
With 3.6% poverty level for males and 4.3% for females among the residents of Lake Forest, 18 to 24 year old males and 6 to 11 year old females are the most vulnerable to poverty, with 52 males (6.2%) and 70 females (10.7%) in their respective age groups living below the poverty level.
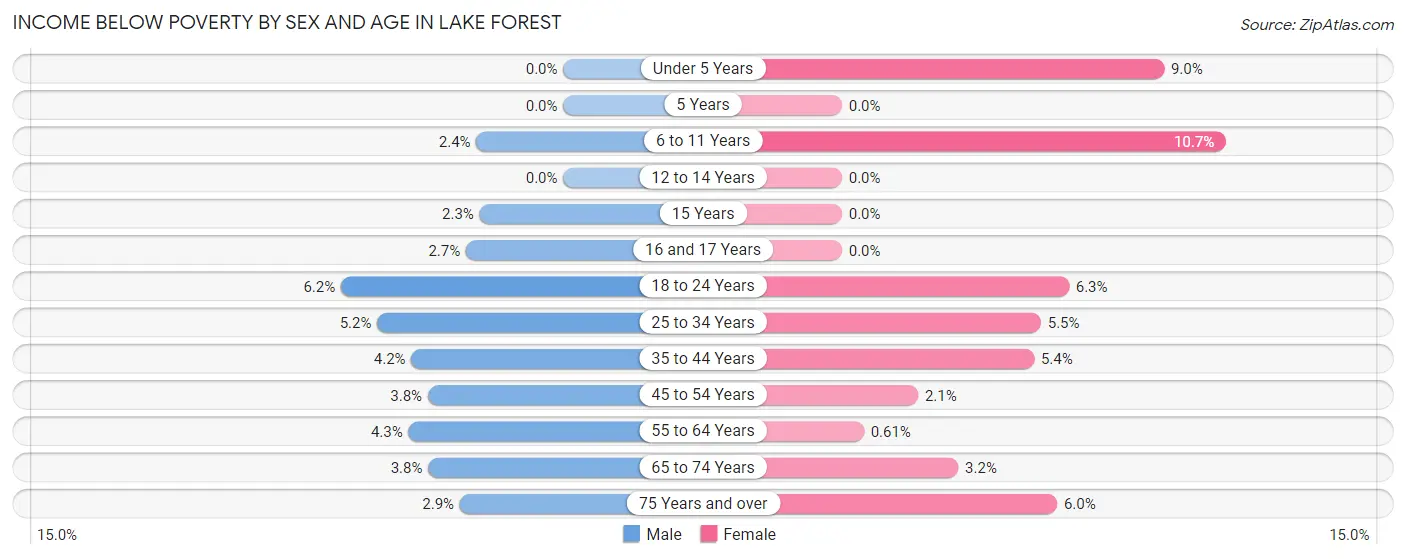
| Age Bracket | Male | Female |
| Under 5 Years | 0 (0.0%) | 39 (9.0%) |
| 5 Years | 0 (0.0%) | 0 (0.0%) |
| 6 to 11 Years | 17 (2.4%) | 70 (10.7%) |
| 12 to 14 Years | 0 (0.0%) | 0 (0.0%) |
| 15 Years | 4 (2.3%) | 0 (0.0%) |
| 16 and 17 Years | 9 (2.7%) | 0 (0.0%) |
| 18 to 24 Years | 52 (6.2%) | 59 (6.3%) |
| 25 to 34 Years | 39 (5.2%) | 37 (5.5%) |
| 35 to 44 Years | 31 (4.2%) | 49 (5.3%) |
| 45 to 54 Years | 45 (3.8%) | 26 (2.1%) |
| 55 to 64 Years | 53 (4.3%) | 8 (0.6%) |
| 65 to 74 Years | 39 (3.8%) | 42 (3.2%) |
| 75 Years and over | 26 (2.9%) | 84 (6.0%) |
| Total | 315 (3.6%) | 414 (4.3%) |
Income Above Poverty by Sex and Age in Lake Forest
According to the poverty statistics in Lake Forest, males aged under 5 years and females aged 5 years are the age groups that are most secure financially, with 100.0% of males and 100.0% of females in these age groups living above the poverty line.
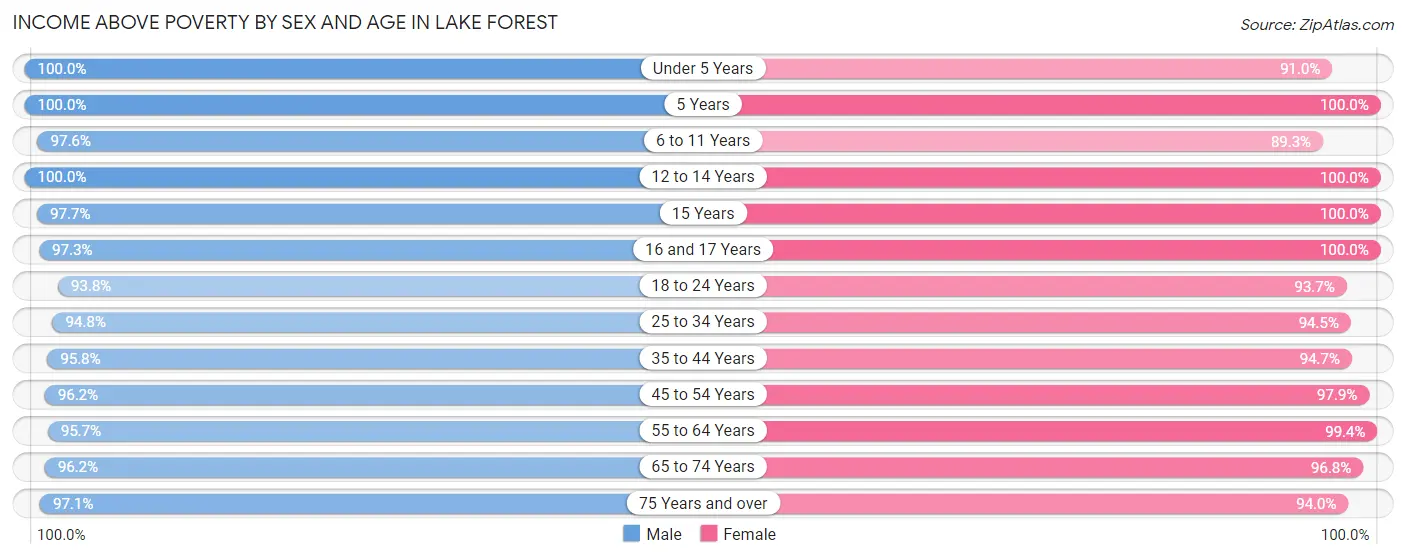
| Age Bracket | Male | Female |
| Under 5 Years | 433 (100.0%) | 396 (91.0%) |
| 5 Years | 76 (100.0%) | 60 (100.0%) |
| 6 to 11 Years | 686 (97.6%) | 584 (89.3%) |
| 12 to 14 Years | 359 (100.0%) | 347 (100.0%) |
| 15 Years | 168 (97.7%) | 88 (100.0%) |
| 16 and 17 Years | 323 (97.3%) | 244 (100.0%) |
| 18 to 24 Years | 788 (93.8%) | 874 (93.7%) |
| 25 to 34 Years | 714 (94.8%) | 631 (94.5%) |
| 35 to 44 Years | 701 (95.8%) | 867 (94.7%) |
| 45 to 54 Years | 1,148 (96.2%) | 1,200 (97.9%) |
| 55 to 64 Years | 1,178 (95.7%) | 1,300 (99.4%) |
| 65 to 74 Years | 998 (96.2%) | 1,256 (96.8%) |
| 75 Years and over | 877 (97.1%) | 1,319 (94.0%) |
| Total | 8,449 (96.4%) | 9,166 (95.7%) |
Income Below Poverty Among Married-Couple Families in Lake Forest
The poverty statistics for married-couple families in Lake Forest show that 2.0% or 88 of the total 4,467 families live below the poverty line. Families with 1 or 2 children have the highest poverty rate of 3.7%, comprising of 56 families. On the other hand, families with no children have the lowest poverty rate of 0.9%, which includes 25 families.
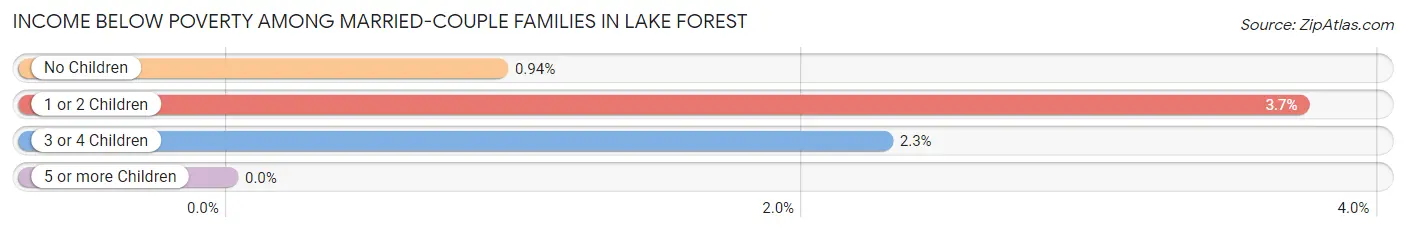
| Children | Above Poverty | Below Poverty |
| No Children | 2,635 (99.1%) | 25 (0.9%) |
| 1 or 2 Children | 1,444 (96.3%) | 56 (3.7%) |
| 3 or 4 Children | 300 (97.7%) | 7 (2.3%) |
| 5 or more Children | 0 (0.0%) | 0 (0.0%) |
| Total | 4,379 (98.0%) | 88 (2.0%) |
Income Below Poverty Among Single-Parent Households in Lake Forest
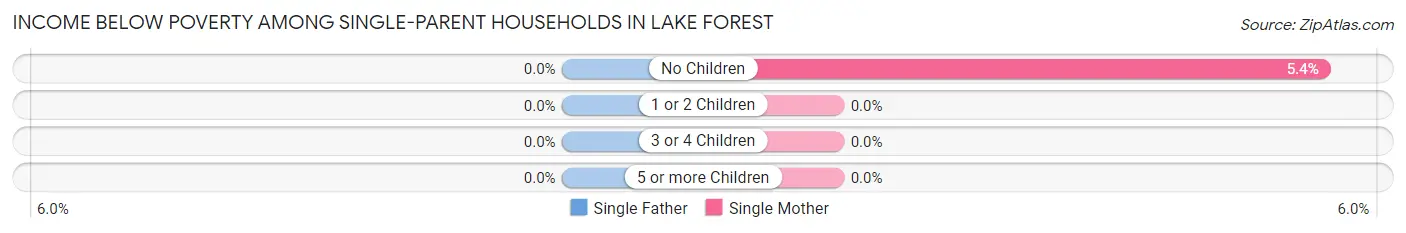
| Children | Single Father | Single Mother |
| No Children | 0 (0.0%) | 16 (5.4%) |
| 1 or 2 Children | 0 (0.0%) | 0 (0.0%) |
| 3 or 4 Children | 0 (0.0%) | 0 (0.0%) |
| 5 or more Children | 0 (0.0%) | 0 (0.0%) |
| Total | 0 (0.0%) | 16 (3.4%) |
Income Below Poverty Among Married-Couple vs Single-Parent Households in Lake Forest
The poverty data for Lake Forest shows that 88 of the married-couple family households (2.0%) and 16 of the single-parent households (2.5%) are living below the poverty level. Within the married-couple family households, those with 1 or 2 children have the highest poverty rate, with 56 households (3.7%) falling below the poverty line. Among the single-parent households, those with no children have the highest poverty rate, with 16 household (4.3%) living below poverty.
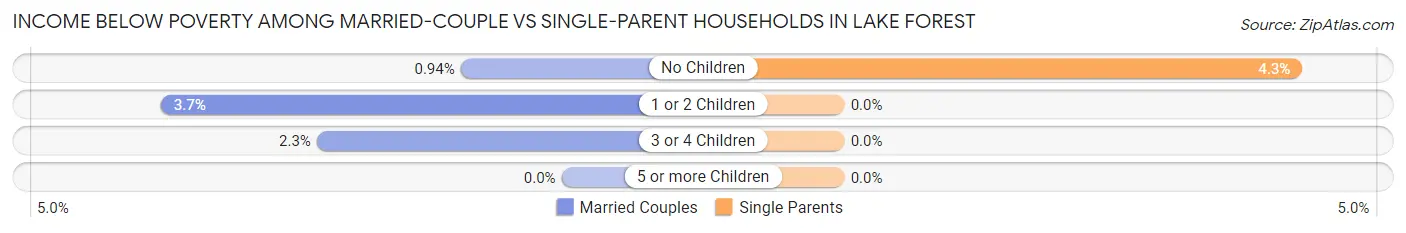
| Children | Married-Couple Families | Single-Parent Households |
| No Children | 25 (0.9%) | 16 (4.3%) |
| 1 or 2 Children | 56 (3.7%) | 0 (0.0%) |
| 3 or 4 Children | 7 (2.3%) | 0 (0.0%) |
| 5 or more Children | 0 (0.0%) | 0 (0.0%) |
| Total | 88 (2.0%) | 16 (2.5%) |
Race in Lake Forest
The most populous races in Lake Forest are White / Caucasian (16,537 | 85.1%), Asian (1,256 | 6.5%), and Two or more Races (1,048 | 5.4%).
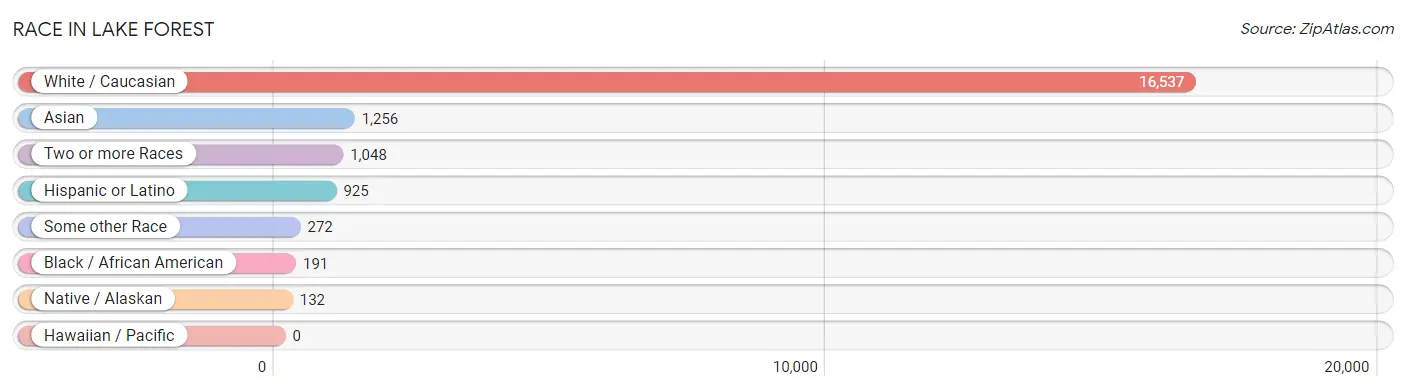
| Race | # Population | % Population |
| Asian | 1,256 | 6.5% |
| Black / African American | 191 | 1.0% |
| Hawaiian / Pacific | 0 | 0.0% |
| Hispanic or Latino | 925 | 4.8% |
| Native / Alaskan | 132 | 0.7% |
| White / Caucasian | 16,537 | 85.1% |
| Two or more Races | 1,048 | 5.4% |
| Some other Race | 272 | 1.4% |
| Total | 19,436 | 100.0% |
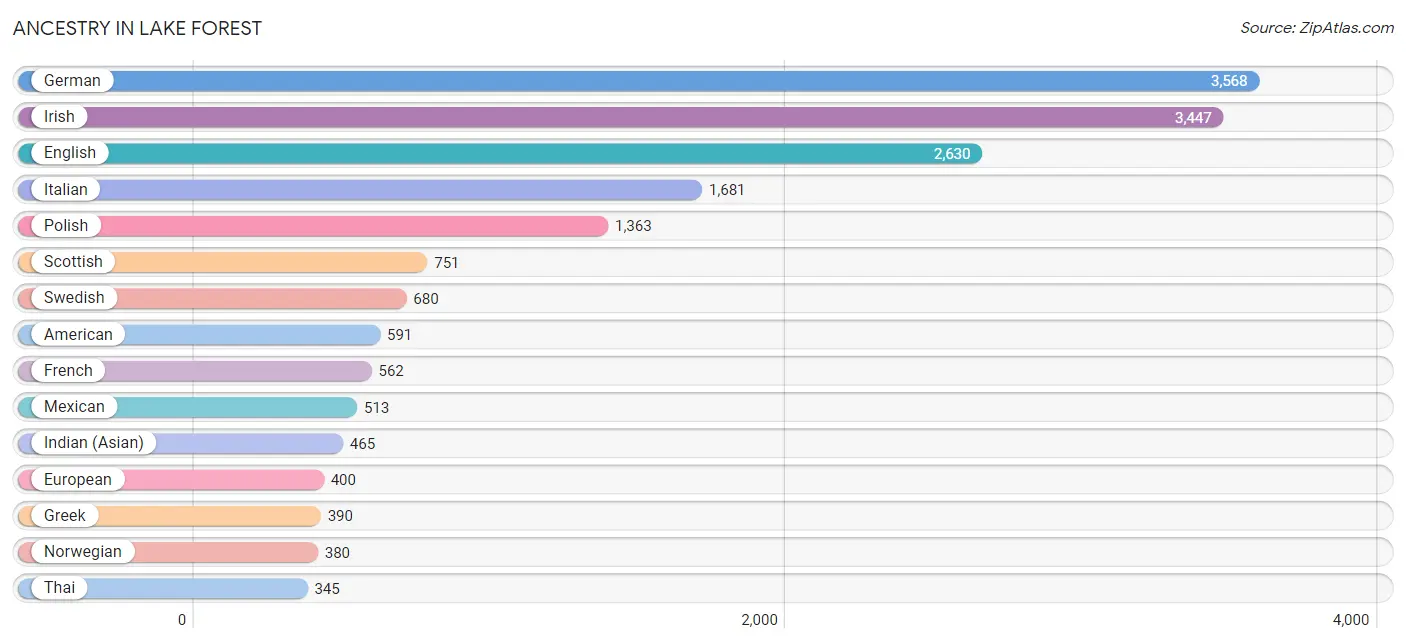
Ancestry in Lake Forest
The most populous ancestries reported in Lake Forest are German (3,568 | 18.4%), Irish (3,447 | 17.7%), English (2,630 | 13.5%), Italian (1,681 | 8.6%), and Polish (1,363 | 7.0%), together accounting for 65.3% of all Lake Forest residents.
| Ancestry | # Population | % Population |
| African | 8 | 0.0% |
| American | 591 | 3.0% |
| Arab | 106 | 0.5% |
| Armenian | 72 | 0.4% |
| Australian | 142 | 0.7% |
| Austrian | 220 | 1.1% |
| Bangladeshi | 13 | 0.1% |
| Barbadian | 4 | 0.0% |
| Belgian | 104 | 0.5% |
| Bhutanese | 33 | 0.2% |
| Brazilian | 33 | 0.2% |
| British | 215 | 1.1% |
| Burmese | 288 | 1.5% |
| Cambodian | 15 | 0.1% |
| Canadian | 74 | 0.4% |
| Cape Verdean | 4 | 0.0% |
| Celtic | 3 | 0.0% |
| Central American | 65 | 0.3% |
| Cherokee | 42 | 0.2% |
| Chilean | 8 | 0.0% |
| Colombian | 17 | 0.1% |
| Costa Rican | 28 | 0.1% |
| Cree | 24 | 0.1% |
| Croatian | 59 | 0.3% |
| Cuban | 12 | 0.1% |
| Czech | 202 | 1.0% |
| Czechoslovakian | 32 | 0.2% |
| Danish | 139 | 0.7% |
| Dutch | 258 | 1.3% |
| Eastern European | 299 | 1.5% |
| Ecuadorian | 49 | 0.3% |
| Egyptian | 5 | 0.0% |
| English | 2,630 | 13.5% |
| Estonian | 8 | 0.0% |
| European | 400 | 2.1% |
| Filipino | 24 | 0.1% |
| Finnish | 10 | 0.1% |
| French | 562 | 2.9% |
| French American Indian | 24 | 0.1% |
| French Canadian | 310 | 1.6% |
| German | 3,568 | 18.4% |
| Greek | 390 | 2.0% |
| Guatemalan | 15 | 0.1% |
| Haitian | 13 | 0.1% |
| Honduran | 22 | 0.1% |
| Hungarian | 67 | 0.3% |
| Indian (Asian) | 465 | 2.4% |
| Iranian | 134 | 0.7% |
| Irish | 3,447 | 17.7% |
| Italian | 1,681 | 8.6% |
| Jamaican | 4 | 0.0% |
| Kenyan | 1 | 0.0% |
| Korean | 64 | 0.3% |
| Lebanese | 8 | 0.0% |
| Lithuanian | 59 | 0.3% |
| Luxembourger | 32 | 0.2% |
| Maltese | 12 | 0.1% |
| Mexican | 513 | 2.6% |
| Moroccan | 10 | 0.1% |
| Native Hawaiian | 11 | 0.1% |
| Nigerian | 4 | 0.0% |
| Northern European | 76 | 0.4% |
| Norwegian | 380 | 2.0% |
| Polish | 1,363 | 7.0% |
| Portuguese | 14 | 0.1% |
| Puerto Rican | 103 | 0.5% |
| Romanian | 34 | 0.2% |
| Russian | 293 | 1.5% |
| Scandinavian | 148 | 0.8% |
| Scotch-Irish | 171 | 0.9% |
| Scottish | 751 | 3.9% |
| Serbian | 24 | 0.1% |
| Slavic | 34 | 0.2% |
| Slovak | 24 | 0.1% |
| South African | 28 | 0.1% |
| South American | 124 | 0.6% |
| Soviet Union | 17 | 0.1% |
| Spaniard | 60 | 0.3% |
| Spanish | 23 | 0.1% |
| Sri Lankan | 71 | 0.4% |
| Subsaharan African | 51 | 0.3% |
| Swedish | 680 | 3.5% |
| Swiss | 123 | 0.6% |
| Thai | 345 | 1.8% |
| Ugandan | 4 | 0.0% |
| Ukrainian | 107 | 0.5% |
| Venezuelan | 50 | 0.3% |
| Welsh | 78 | 0.4% | View All 88 Rows |
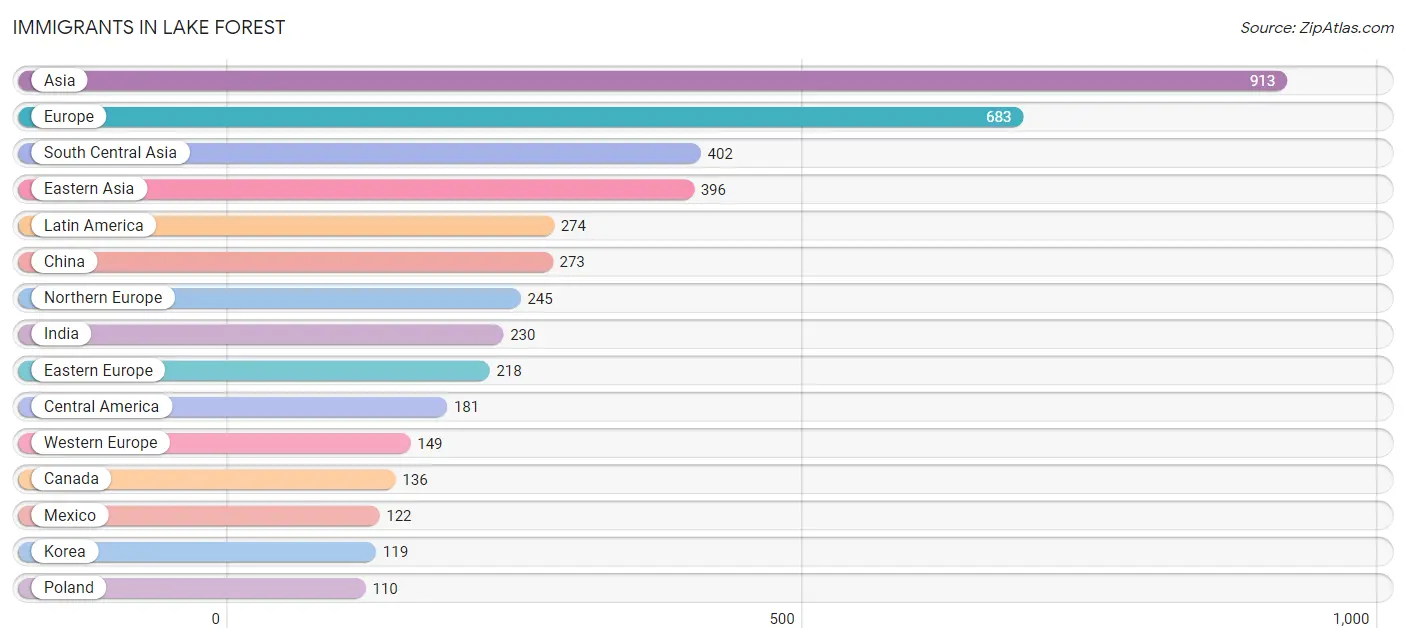
Immigrants in Lake Forest
The most numerous immigrant groups reported in Lake Forest came from Asia (913 | 4.7%), Europe (683 | 3.5%), South Central Asia (402 | 2.1%), Eastern Asia (396 | 2.0%), and Latin America (274 | 1.4%), together accounting for 13.7% of all Lake Forest residents.
| Immigration Origin | # Population | % Population |
| Africa | 51 | 0.3% |
| Asia | 913 | 4.7% |
| Australia | 98 | 0.5% |
| Austria | 12 | 0.1% |
| Bangladesh | 55 | 0.3% |
| Barbados | 4 | 0.0% |
| Belgium | 21 | 0.1% |
| Bosnia and Herzegovina | 8 | 0.0% |
| Brazil | 33 | 0.2% |
| Canada | 136 | 0.7% |
| Caribbean | 13 | 0.1% |
| Central America | 181 | 0.9% |
| Chile | 8 | 0.0% |
| China | 273 | 1.4% |
| Croatia | 5 | 0.0% |
| Cuba | 9 | 0.1% |
| Czechoslovakia | 13 | 0.1% |
| Eastern Africa | 5 | 0.0% |
| Eastern Asia | 396 | 2.0% |
| Eastern Europe | 218 | 1.1% |
| Egypt | 5 | 0.0% |
| England | 32 | 0.2% |
| Europe | 683 | 3.5% |
| France | 24 | 0.1% |
| Germany | 79 | 0.4% |
| Guatemala | 37 | 0.2% |
| Honduras | 22 | 0.1% |
| Hong Kong | 11 | 0.1% |
| India | 230 | 1.2% |
| Iran | 34 | 0.2% |
| Ireland | 10 | 0.1% |
| Italy | 67 | 0.3% |
| Japan | 4 | 0.0% |
| Kenya | 1 | 0.0% |
| Korea | 119 | 0.6% |
| Latin America | 274 | 1.4% |
| Lithuania | 9 | 0.1% |
| Malaysia | 12 | 0.1% |
| Mexico | 122 | 0.6% |
| Morocco | 5 | 0.0% |
| Nepal | 9 | 0.1% |
| Netherlands | 10 | 0.1% |
| Northern Africa | 10 | 0.1% |
| Northern Europe | 245 | 1.3% |
| Norway | 29 | 0.2% |
| Oceania | 98 | 0.5% |
| Pakistan | 62 | 0.3% |
| Philippines | 22 | 0.1% |
| Poland | 110 | 0.6% |
| Russia | 37 | 0.2% |
| Serbia | 8 | 0.0% |
| South Africa | 14 | 0.1% |
| South America | 80 | 0.4% |
| South Central Asia | 402 | 2.1% |
| South Eastern Asia | 94 | 0.5% |
| Southern Europe | 71 | 0.4% |
| Spain | 4 | 0.0% |
| Sweden | 5 | 0.0% |
| Switzerland | 3 | 0.0% |
| Taiwan | 40 | 0.2% |
| Uganda | 4 | 0.0% |
| Uruguay | 4 | 0.0% |
| Venezuela | 35 | 0.2% |
| Vietnam | 60 | 0.3% |
| Western Africa | 4 | 0.0% |
| Western Asia | 21 | 0.1% |
| Western Europe | 149 | 0.8% | View All 67 Rows |
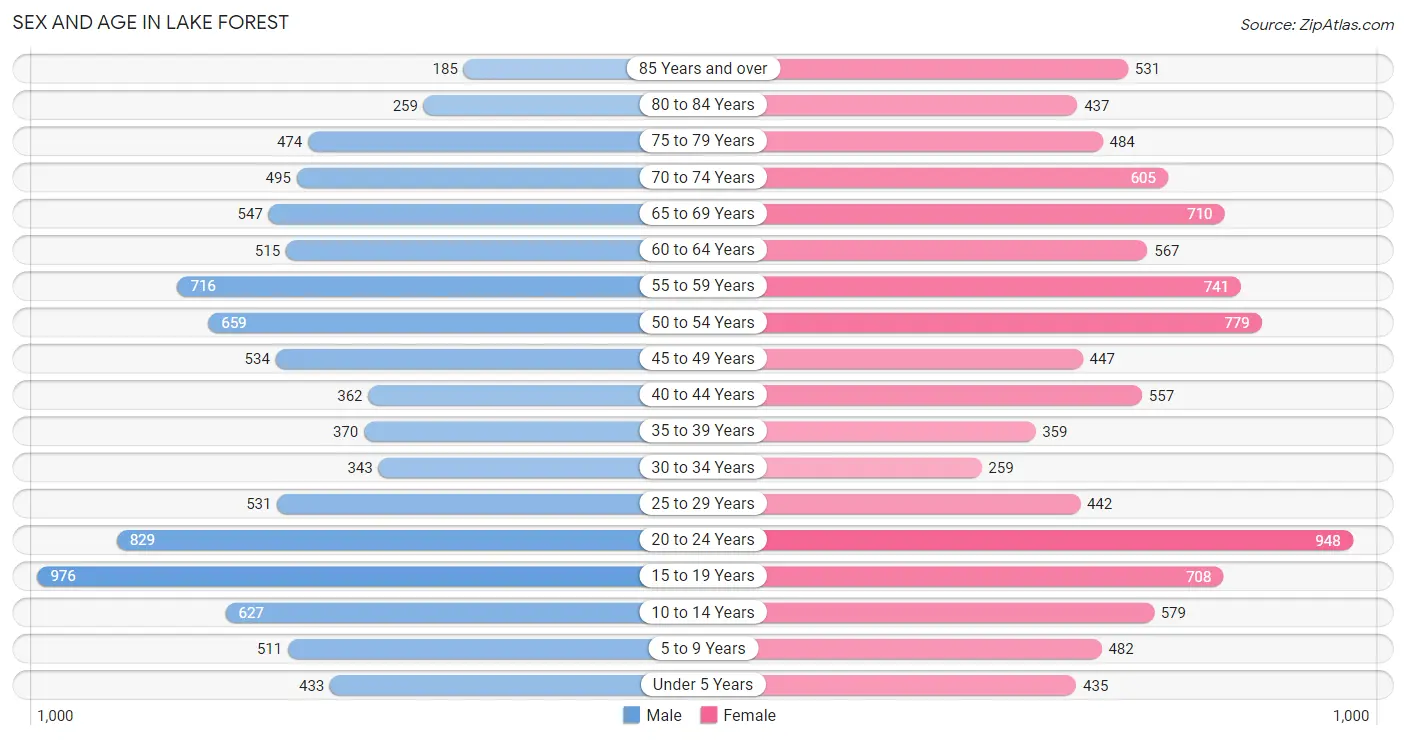
Sex and Age in Lake Forest
Sex and Age in Lake Forest
The most populous age groups in Lake Forest are 15 to 19 Years (976 | 10.4%) for men and 20 to 24 Years (948 | 9.4%) for women.
| Age Bracket | Male | Female |
| Under 5 Years | 433 (4.6%) | 435 (4.3%) |
| 5 to 9 Years | 511 (5.5%) | 482 (4.8%) |
| 10 to 14 Years | 627 (6.7%) | 579 (5.8%) |
| 15 to 19 Years | 976 (10.4%) | 708 (7.0%) |
| 20 to 24 Years | 829 (8.8%) | 948 (9.4%) |
| 25 to 29 Years | 531 (5.7%) | 442 (4.4%) |
| 30 to 34 Years | 343 (3.7%) | 259 (2.6%) |
| 35 to 39 Years | 370 (4.0%) | 359 (3.6%) |
| 40 to 44 Years | 362 (3.9%) | 557 (5.5%) |
| 45 to 49 Years | 534 (5.7%) | 447 (4.4%) |
| 50 to 54 Years | 659 (7.0%) | 779 (7.7%) |
| 55 to 59 Years | 716 (7.6%) | 741 (7.4%) |
| 60 to 64 Years | 515 (5.5%) | 567 (5.6%) |
| 65 to 69 Years | 547 (5.8%) | 710 (7.0%) |
| 70 to 74 Years | 495 (5.3%) | 605 (6.0%) |
| 75 to 79 Years | 474 (5.1%) | 484 (4.8%) |
| 80 to 84 Years | 259 (2.8%) | 437 (4.3%) |
| 85 Years and over | 185 (2.0%) | 531 (5.3%) |
| Total | 9,366 (100.0%) | 10,070 (100.0%) |
Families and Households in Lake Forest
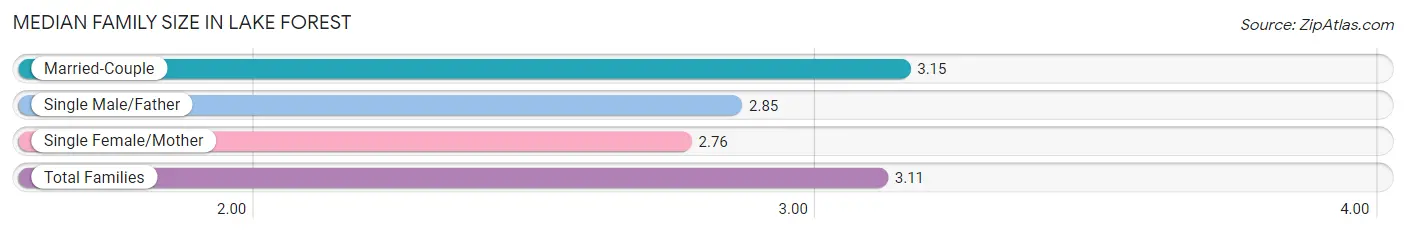
Median Family Size in Lake Forest
The median family size in Lake Forest is 3.11 persons per family, with married-couple families (4,467 | 87.5%) accounting for the largest median family size of 3.15 persons per family. On the other hand, single female/mother families (471 | 9.2%) represent the smallest median family size with 2.76 persons per family.
| Family Type | # Families | Family Size |
| Married-Couple | 4,467 (87.5%) | 3.15 |
| Single Male/Father | 168 (3.3%) | 2.85 |
| Single Female/Mother | 471 (9.2%) | 2.76 |
| Total Families | 5,106 (100.0%) | 3.11 |
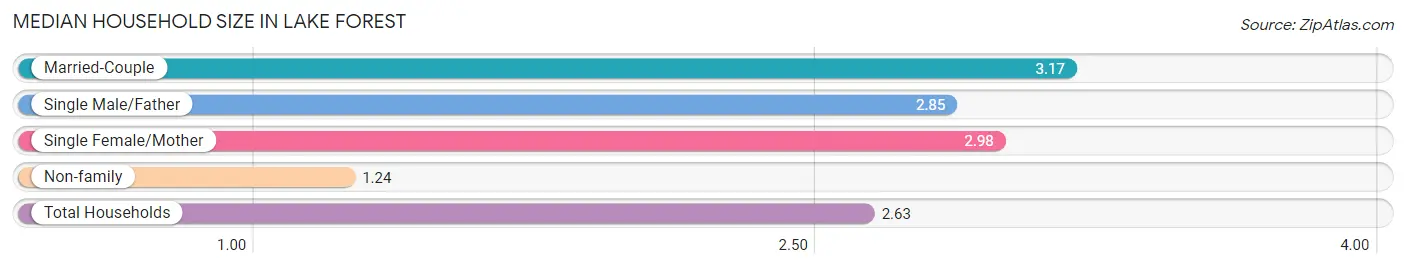
Median Household Size in Lake Forest
The median household size in Lake Forest is 2.63 persons per household, with married-couple households (4,467 | 64.2%) accounting for the largest median household size of 3.17 persons per household. non-family households (1,853 | 26.6%) represent the smallest median household size with 1.24 persons per household.
| Household Type | # Households | Household Size |
| Married-Couple | 4,467 (64.2%) | 3.17 |
| Single Male/Father | 168 (2.4%) | 2.85 |
| Single Female/Mother | 471 (6.8%) | 2.98 |
| Non-family | 1,853 (26.6%) | 1.24 |
| Total Households | 6,959 (100.0%) | 2.63 |
Household Size by Marriage Status in Lake Forest
Out of a total of 6,959 households in Lake Forest, 5,106 (73.4%) are family households, while 1,853 (26.6%) are nonfamily households. The most numerous type of family households are 2-person households, comprising 2,358, and the most common type of nonfamily households are 1-person households, comprising 1,483.
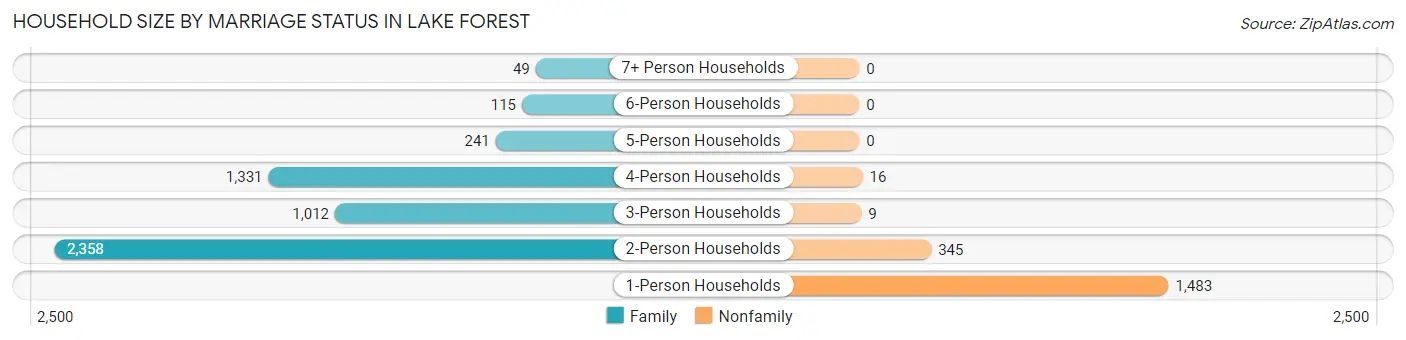
| Household Size | Family Households | Nonfamily Households |
| 1-Person Households | - | 1,483 (21.3%) |
| 2-Person Households | 2,358 (33.9%) | 345 (5.0%) |
| 3-Person Households | 1,012 (14.5%) | 9 (0.1%) |
| 4-Person Households | 1,331 (19.1%) | 16 (0.2%) |
| 5-Person Households | 241 (3.5%) | 0 (0.0%) |
| 6-Person Households | 115 (1.7%) | 0 (0.0%) |
| 7+ Person Households | 49 (0.7%) | 0 (0.0%) |
| Total | 5,106 (73.4%) | 1,853 (26.6%) |
Female Fertility in Lake Forest
Fertility by Age in Lake Forest
Average fertility rate in Lake Forest is 29.0 births per 1,000 women. Women in the age bracket of 35 to 50 years have the highest fertility rate with 43.0 births per 1,000 women. Women in the age bracket of 35 to 50 years acount for 56.2% of all women with births.
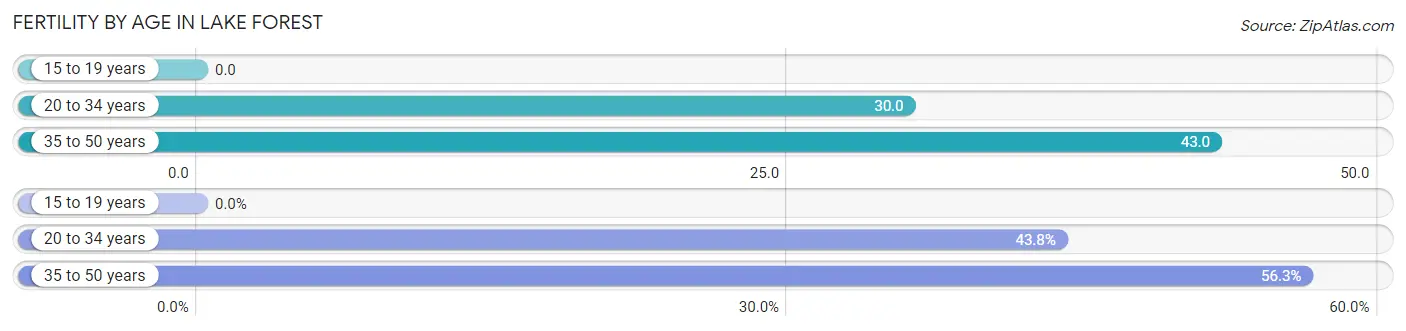
| Age Bracket | Women with Births | Births / 1,000 Women |
| 15 to 19 years | 0 (0.0%) | 0.0 |
| 20 to 34 years | 49 (43.8%) | 30.0 |
| 35 to 50 years | 63 (56.2%) | 43.0 |
| Total | 112 (100.0%) | 29.0 |
Fertility by Age by Marriage Status in Lake Forest
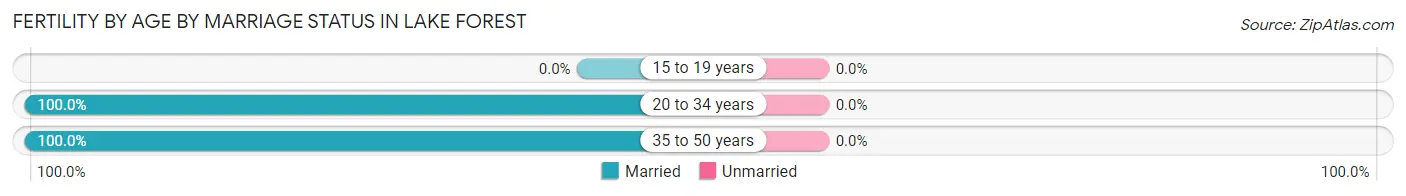
| Age Bracket | Married | Unmarried |
| 15 to 19 years | 0 (0.0%) | 0 (0.0%) |
| 20 to 34 years | 49 (100.0%) | 0 (0.0%) |
| 35 to 50 years | 63 (100.0%) | 0 (0.0%) |
| Total | 112 (100.0%) | 0 (0.0%) |
Fertility by Education in Lake Forest
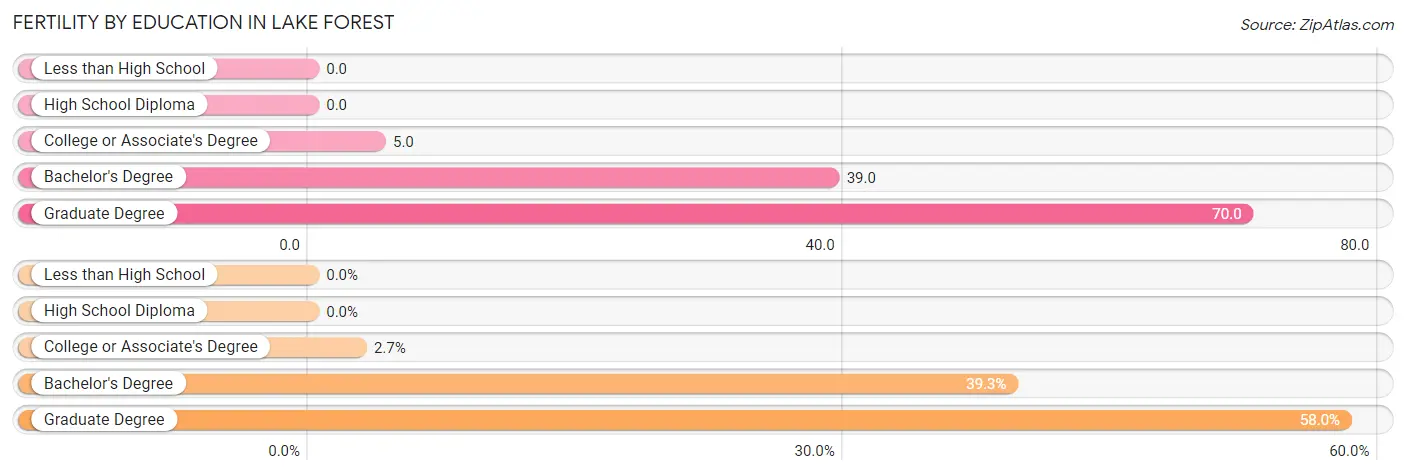
| Educational Attainment | Women with Births | Births / 1,000 Women |
| Less than High School | 0 (0.0%) | 0.0 |
| High School Diploma | 0 (0.0%) | 0.0 |
| College or Associate's Degree | 3 (2.7%) | 5.0 |
| Bachelor's Degree | 44 (39.3%) | 39.0 |
| Graduate Degree | 65 (58.0%) | 70.0 |
| Total | 112 (100.0%) | 29.0 |
Fertility by Education by Marriage Status in Lake Forest
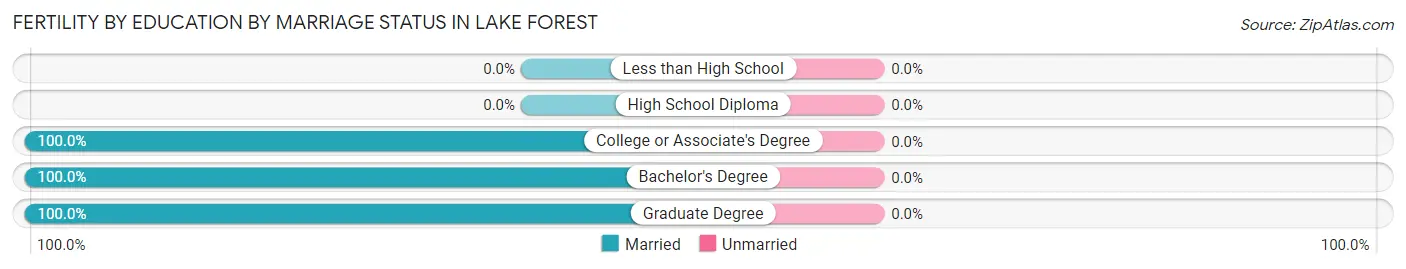
| Educational Attainment | Married | Unmarried |
| Less than High School | 0 (0.0%) | 0 (0.0%) |
| High School Diploma | 0 (0.0%) | 0 (0.0%) |
| College or Associate's Degree | 3 (100.0%) | 0 (0.0%) |
| Bachelor's Degree | 44 (100.0%) | 0 (0.0%) |
| Graduate Degree | 65 (100.0%) | 0 (0.0%) |
| Total | 112 (100.0%) | 0 (0.0%) |
Employment Characteristics in Lake Forest
Employment by Class of Employer in Lake Forest
Among the 8,617 employed individuals in Lake Forest, private company employees (5,715 | 66.3%), self-employed (incorporated) (858 | 10.0%), and not-for-profit organizations (857 | 10.0%) make up the most common classes of employment.
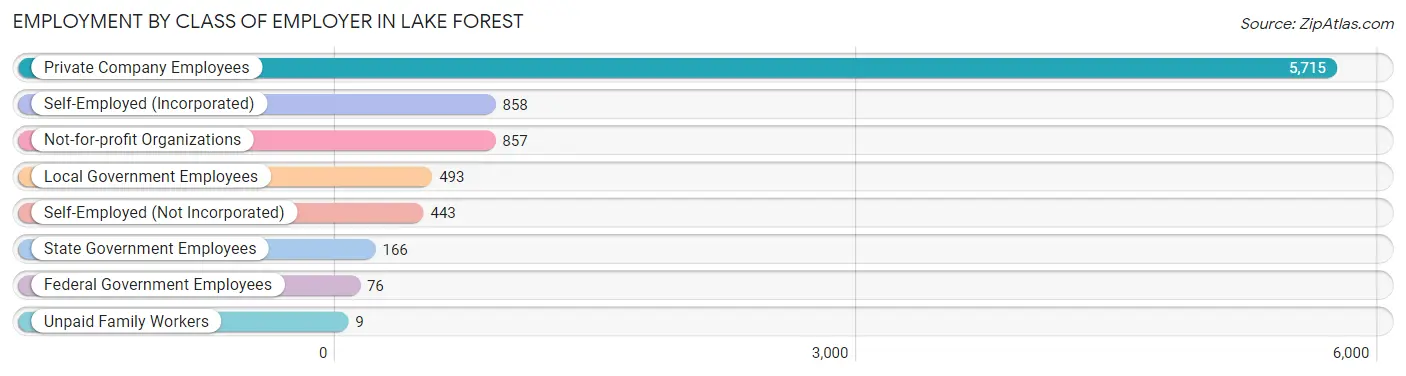
| Employer Class | # Employees | % Employees |
| Private Company Employees | 5,715 | 66.3% |
| Self-Employed (Incorporated) | 858 | 10.0% |
| Self-Employed (Not Incorporated) | 443 | 5.1% |
| Not-for-profit Organizations | 857 | 10.0% |
| Local Government Employees | 493 | 5.7% |
| State Government Employees | 166 | 1.9% |
| Federal Government Employees | 76 | 0.9% |
| Unpaid Family Workers | 9 | 0.1% |
| Total | 8,617 | 100.0% |
Employment Status by Age in Lake Forest
According to the labor force statistics for Lake Forest, out of the total population over 16 years of age (16,109), 55.6% or 8,957 individuals are in the labor force, with 3.1% or 278 of them unemployed. The age group with the highest labor force participation rate is 30 to 34 years, with 84.4% or 508 individuals in the labor force. Within the labor force, the 20 to 24 years age range has the highest percentage of unemployed individuals, with 11.5% or 127 of them being unemployed.
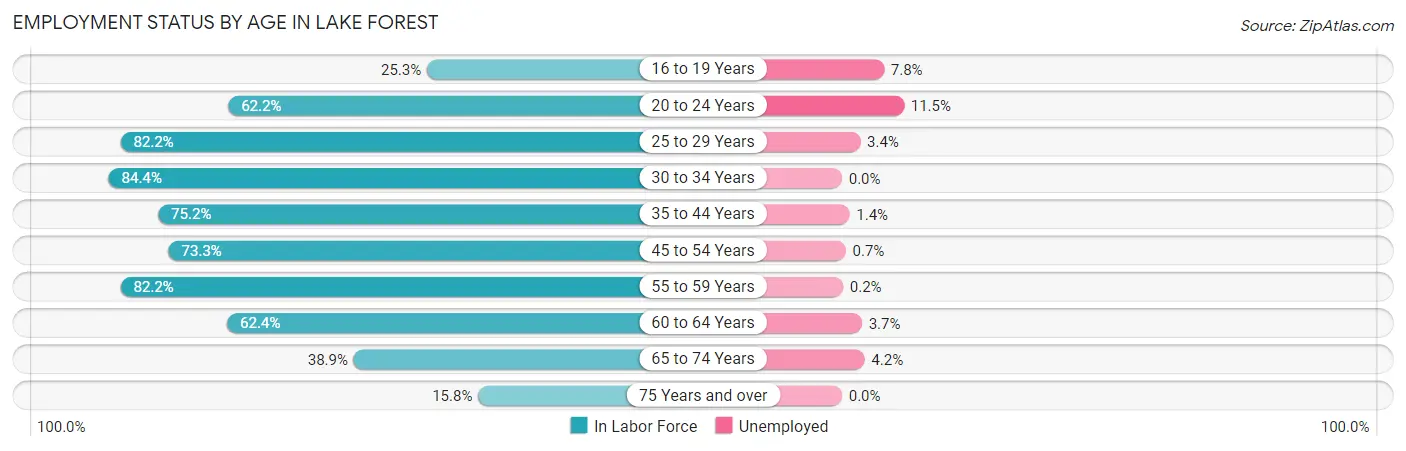
| Age Bracket | In Labor Force | Unemployed |
| 16 to 19 Years | 360 (25.3%) | 28 (7.8%) |
| 20 to 24 Years | 1,105 (62.2%) | 127 (11.5%) |
| 25 to 29 Years | 800 (82.2%) | 27 (3.4%) |
| 30 to 34 Years | 508 (84.4%) | 0 (0.0%) |
| 35 to 44 Years | 1,239 (75.2%) | 17 (1.4%) |
| 45 to 54 Years | 1,773 (73.3%) | 12 (0.7%) |
| 55 to 59 Years | 1,198 (82.2%) | 2 (0.2%) |
| 60 to 64 Years | 675 (62.4%) | 25 (3.7%) |
| 65 to 74 Years | 917 (38.9%) | 39 (4.2%) |
| 75 Years and over | 374 (15.8%) | 0 (0.0%) |
| Total | 8,957 (55.6%) | 278 (3.1%) |
Employment Status by Educational Attainment in Lake Forest
According to labor force statistics for Lake Forest, 75.7% of individuals (6,193) out of the total population between 25 and 64 years of age (8,181) are in the labor force, with 1.4% or 87 of them being unemployed. The group with the highest labor force participation rate are those with the educational attainment of bachelor's degree or higher, with 77.4% or 5,365 individuals in the labor force. Within the labor force, individuals with high school diploma education have the highest percentage of unemployment, with 2.9% or 5 of them being unemployed.
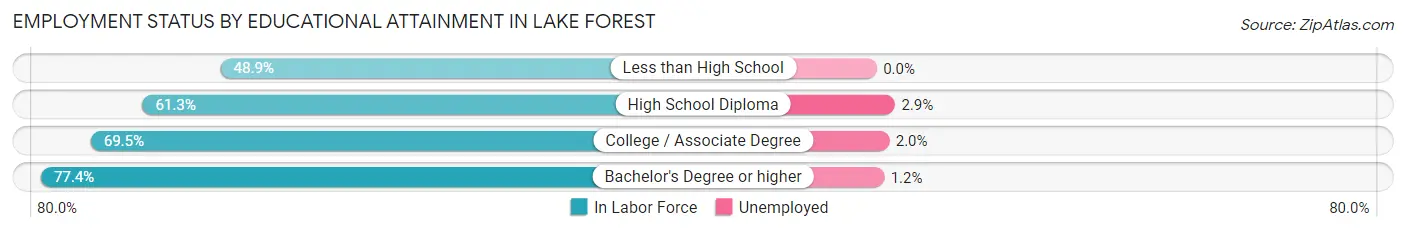
| Educational Attainment | In Labor Force | Unemployed |
| Less than High School | 46 (48.9%) | 0 (0.0%) |
| High School Diploma | 173 (61.3%) | 8 (2.9%) |
| College / Associate Degree | 607 (69.5%) | 17 (2.0%) |
| Bachelor's Degree or higher | 5,365 (77.4%) | 83 (1.2%) |
| Total | 6,193 (75.7%) | 115 (1.4%) |
Employment Occupations by Sex in Lake Forest
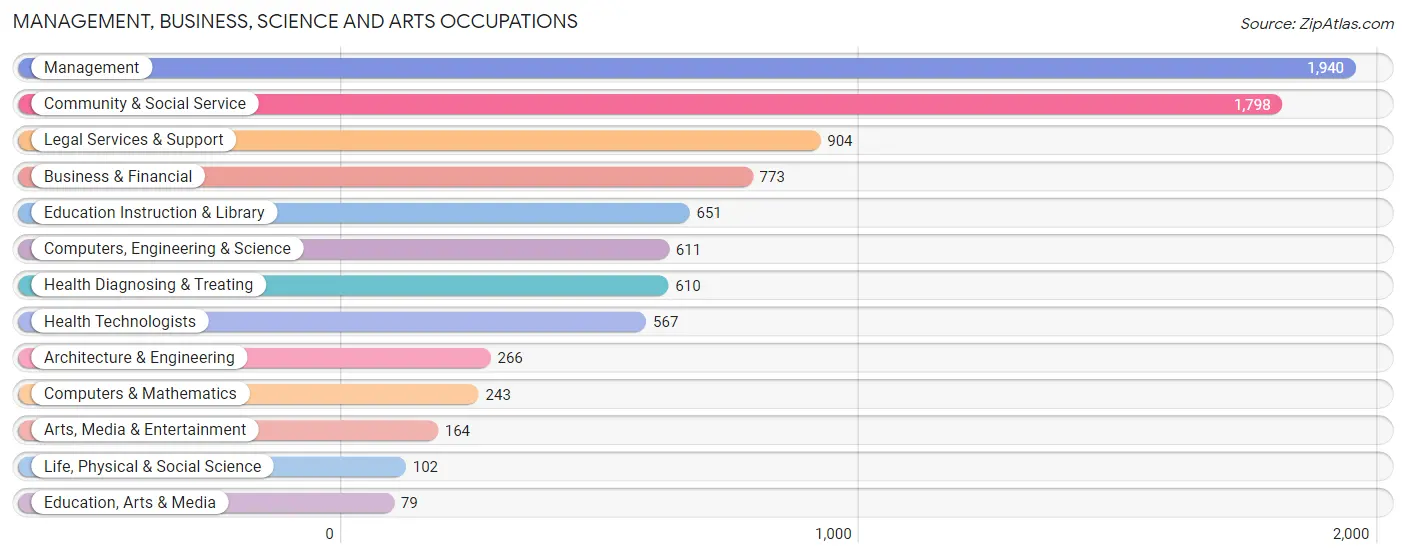
Management, Business, Science and Arts Occupations
The most common Management, Business, Science and Arts occupations in Lake Forest are Management (1,940 | 22.4%), Community & Social Service (1,798 | 20.8%), Legal Services & Support (904 | 10.4%), Business & Financial (773 | 8.9%), and Education Instruction & Library (651 | 7.5%).
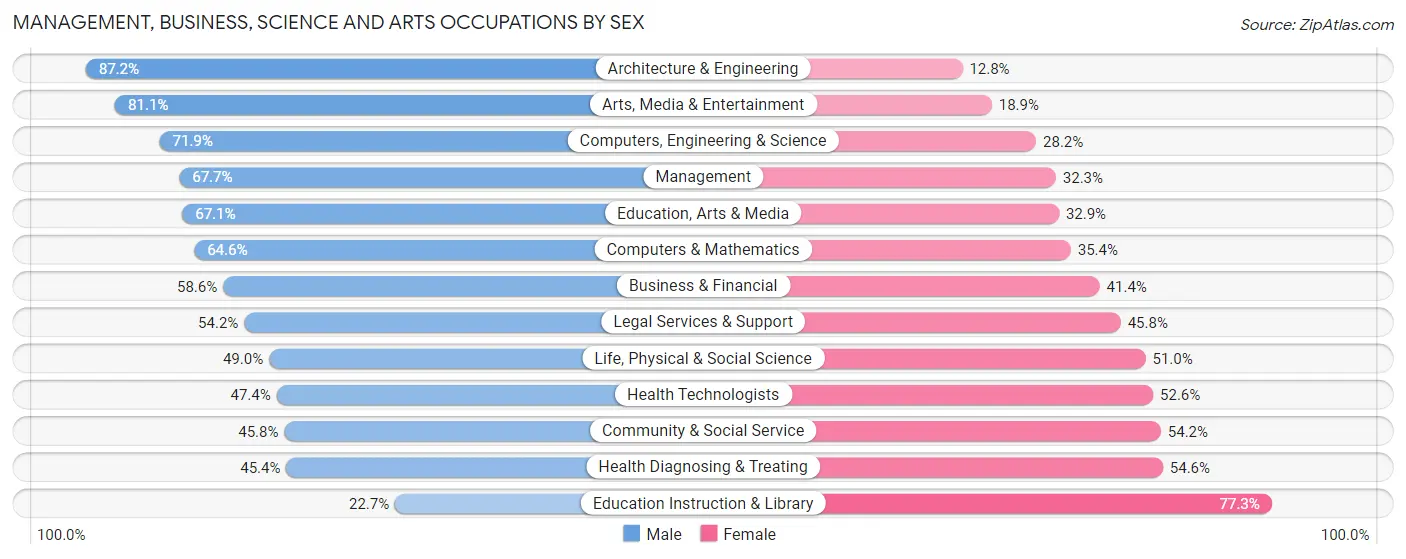
Management, Business, Science and Arts Occupations by Sex
Within the Management, Business, Science and Arts occupations in Lake Forest, the most male-oriented occupations are Architecture & Engineering (87.2%), Arts, Media & Entertainment (81.1%), and Computers, Engineering & Science (71.9%), while the most female-oriented occupations are Education Instruction & Library (77.3%), Health Diagnosing & Treating (54.6%), and Community & Social Service (54.2%).
| Occupation | Male | Female |
| Management | 1,314 (67.7%) | 626 (32.3%) |
| Business & Financial | 453 (58.6%) | 320 (41.4%) |
| Computers, Engineering & Science | 439 (71.9%) | 172 (28.1%) |
| Computers & Mathematics | 157 (64.6%) | 86 (35.4%) |
| Architecture & Engineering | 232 (87.2%) | 34 (12.8%) |
| Life, Physical & Social Science | 50 (49.0%) | 52 (51.0%) |
| Community & Social Service | 824 (45.8%) | 974 (54.2%) |
| Education, Arts & Media | 53 (67.1%) | 26 (32.9%) |
| Legal Services & Support | 490 (54.2%) | 414 (45.8%) |
| Education Instruction & Library | 148 (22.7%) | 503 (77.3%) |
| Arts, Media & Entertainment | 133 (81.1%) | 31 (18.9%) |
| Health Diagnosing & Treating | 277 (45.4%) | 333 (54.6%) |
| Health Technologists | 269 (47.4%) | 298 (52.6%) |
| Total (Category) | 3,307 (57.7%) | 2,425 (42.3%) |
| Total (Overall) | 4,714 (54.4%) | 3,948 (45.6%) |
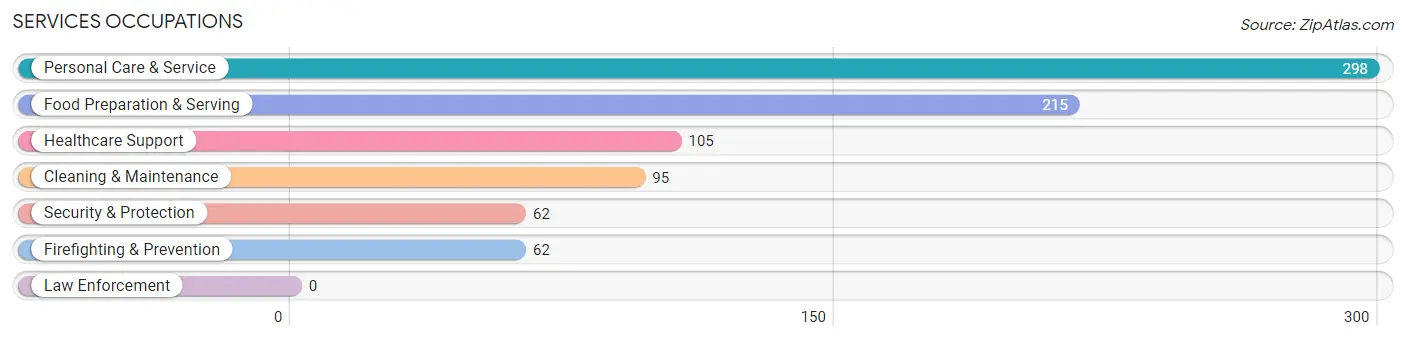
Services Occupations
The most common Services occupations in Lake Forest are Personal Care & Service (298 | 3.4%), Food Preparation & Serving (215 | 2.5%), Healthcare Support (105 | 1.2%), Cleaning & Maintenance (95 | 1.1%), and Security & Protection (62 | 0.7%).
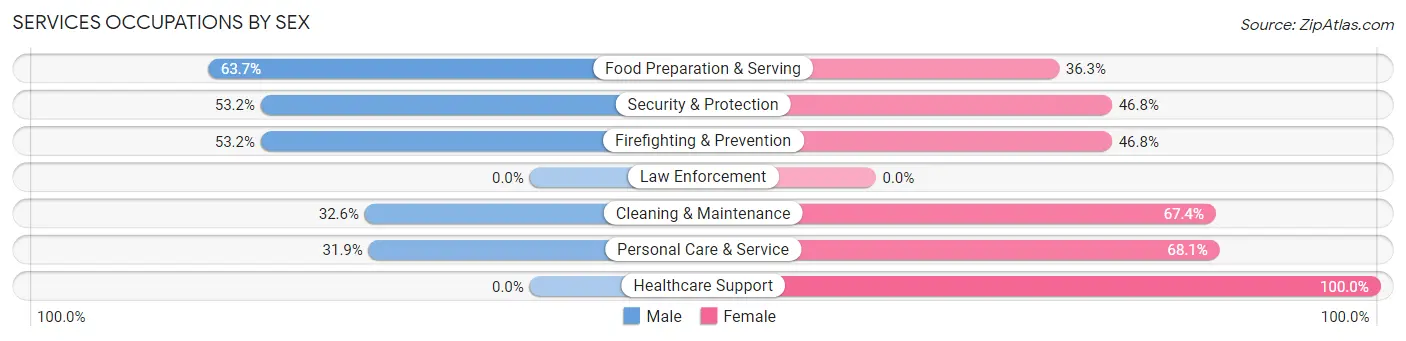
Services Occupations by Sex
Within the Services occupations in Lake Forest, the most male-oriented occupations are Food Preparation & Serving (63.7%), Security & Protection (53.2%), and Firefighting & Prevention (53.2%), while the most female-oriented occupations are Healthcare Support (100.0%), Personal Care & Service (68.1%), and Cleaning & Maintenance (67.4%).
| Occupation | Male | Female |
| Healthcare Support | 0 (0.0%) | 105 (100.0%) |
| Security & Protection | 33 (53.2%) | 29 (46.8%) |
| Firefighting & Prevention | 33 (53.2%) | 29 (46.8%) |
| Law Enforcement | 0 (0.0%) | 0 (0.0%) |
| Food Preparation & Serving | 137 (63.7%) | 78 (36.3%) |
| Cleaning & Maintenance | 31 (32.6%) | 64 (67.4%) |
| Personal Care & Service | 95 (31.9%) | 203 (68.1%) |
| Total (Category) | 296 (38.2%) | 479 (61.8%) |
| Total (Overall) | 4,714 (54.4%) | 3,948 (45.6%) |
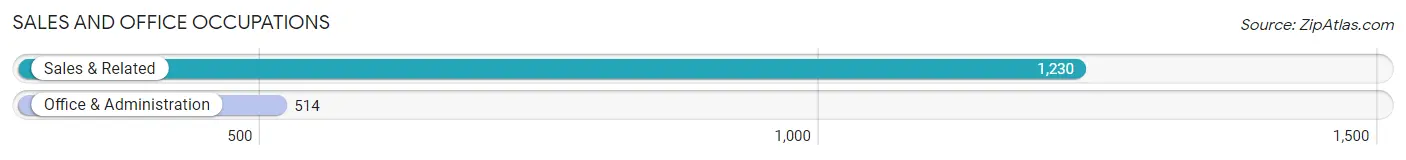
Sales and Office Occupations
The most common Sales and Office occupations in Lake Forest are Sales & Related (1,230 | 14.2%), and Office & Administration (514 | 5.9%).
Sales and Office Occupations by Sex
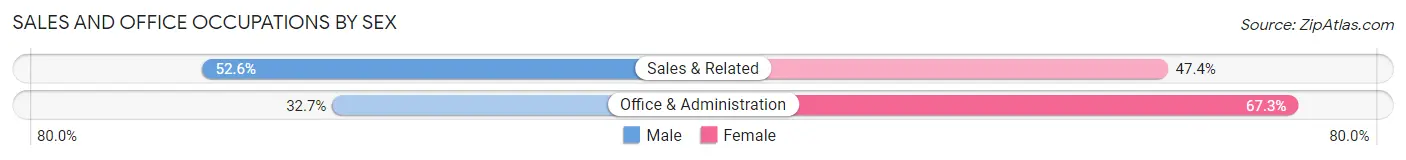
| Occupation | Male | Female |
| Sales & Related | 647 (52.6%) | 583 (47.4%) |
| Office & Administration | 168 (32.7%) | 346 (67.3%) |
| Total (Category) | 815 (46.7%) | 929 (53.3%) |
| Total (Overall) | 4,714 (54.4%) | 3,948 (45.6%) |
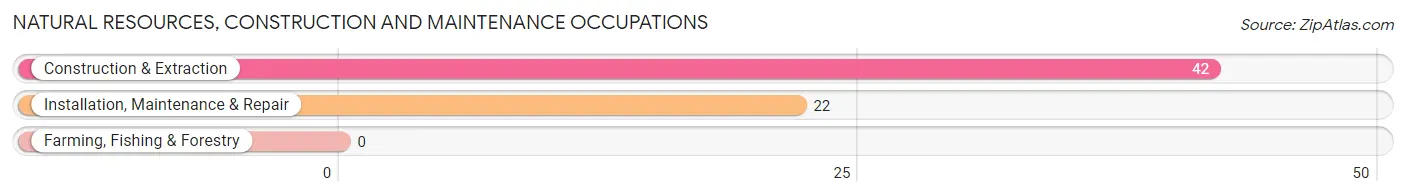
Natural Resources, Construction and Maintenance Occupations
The most common Natural Resources, Construction and Maintenance occupations in Lake Forest are Construction & Extraction (42 | 0.5%), and Installation, Maintenance & Repair (22 | 0.3%).
Natural Resources, Construction and Maintenance Occupations by Sex
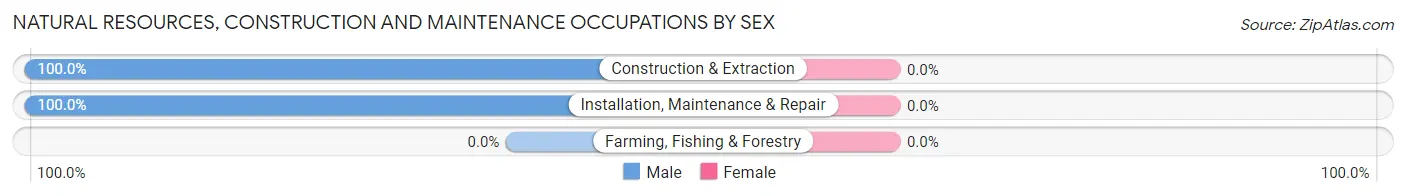
| Occupation | Male | Female |
| Farming, Fishing & Forestry | 0 (0.0%) | 0 (0.0%) |
| Construction & Extraction | 42 (100.0%) | 0 (0.0%) |
| Installation, Maintenance & Repair | 22 (100.0%) | 0 (0.0%) |
| Total (Category) | 64 (100.0%) | 0 (0.0%) |
| Total (Overall) | 4,714 (54.4%) | 3,948 (45.6%) |
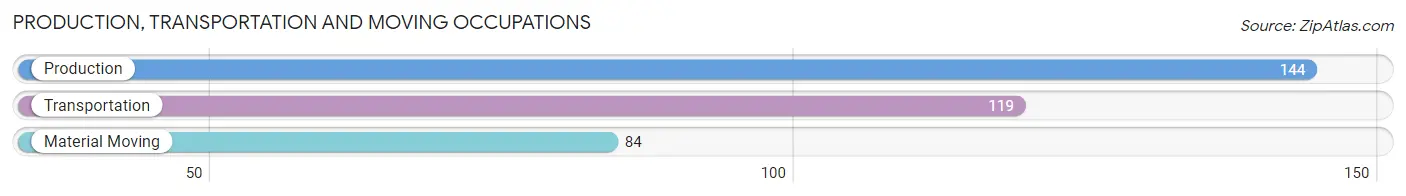
Production, Transportation and Moving Occupations
The most common Production, Transportation and Moving occupations in Lake Forest are Production (144 | 1.7%), Transportation (119 | 1.4%), and Material Moving (84 | 1.0%).
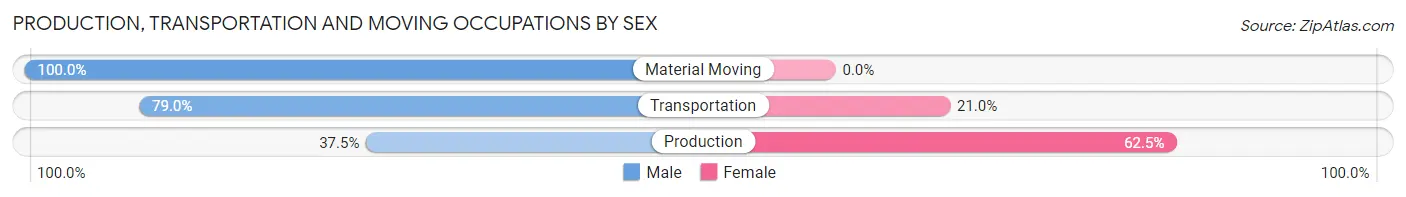
Production, Transportation and Moving Occupations by Sex
| Occupation | Male | Female |
| Production | 54 (37.5%) | 90 (62.5%) |
| Transportation | 94 (79.0%) | 25 (21.0%) |
| Material Moving | 84 (100.0%) | 0 (0.0%) |
| Total (Category) | 232 (66.9%) | 115 (33.1%) |
| Total (Overall) | 4,714 (54.4%) | 3,948 (45.6%) |
Employment Industries by Sex in Lake Forest
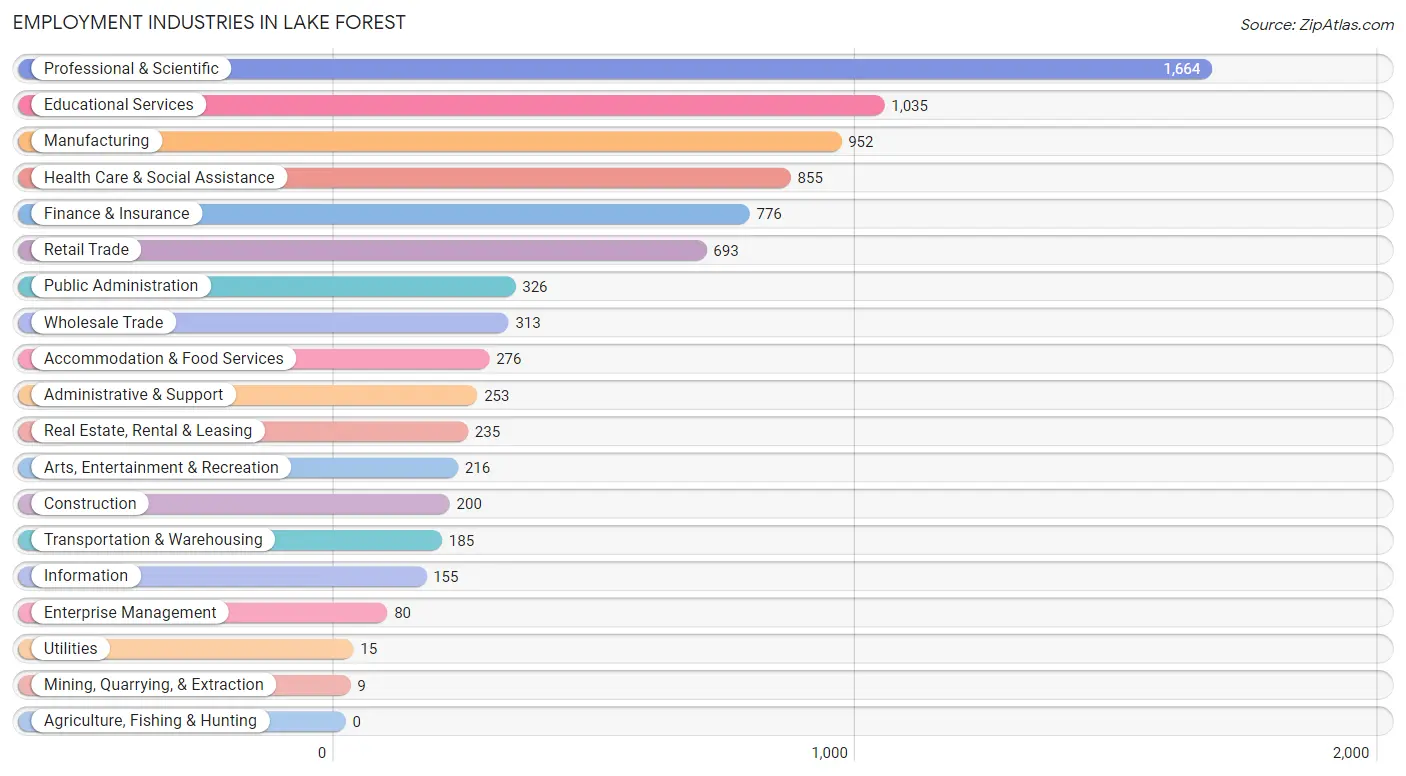
Employment Industries in Lake Forest
The major employment industries in Lake Forest include Professional & Scientific (1,664 | 19.2%), Educational Services (1,035 | 11.9%), Manufacturing (952 | 11.0%), Health Care & Social Assistance (855 | 9.9%), and Finance & Insurance (776 | 9.0%).
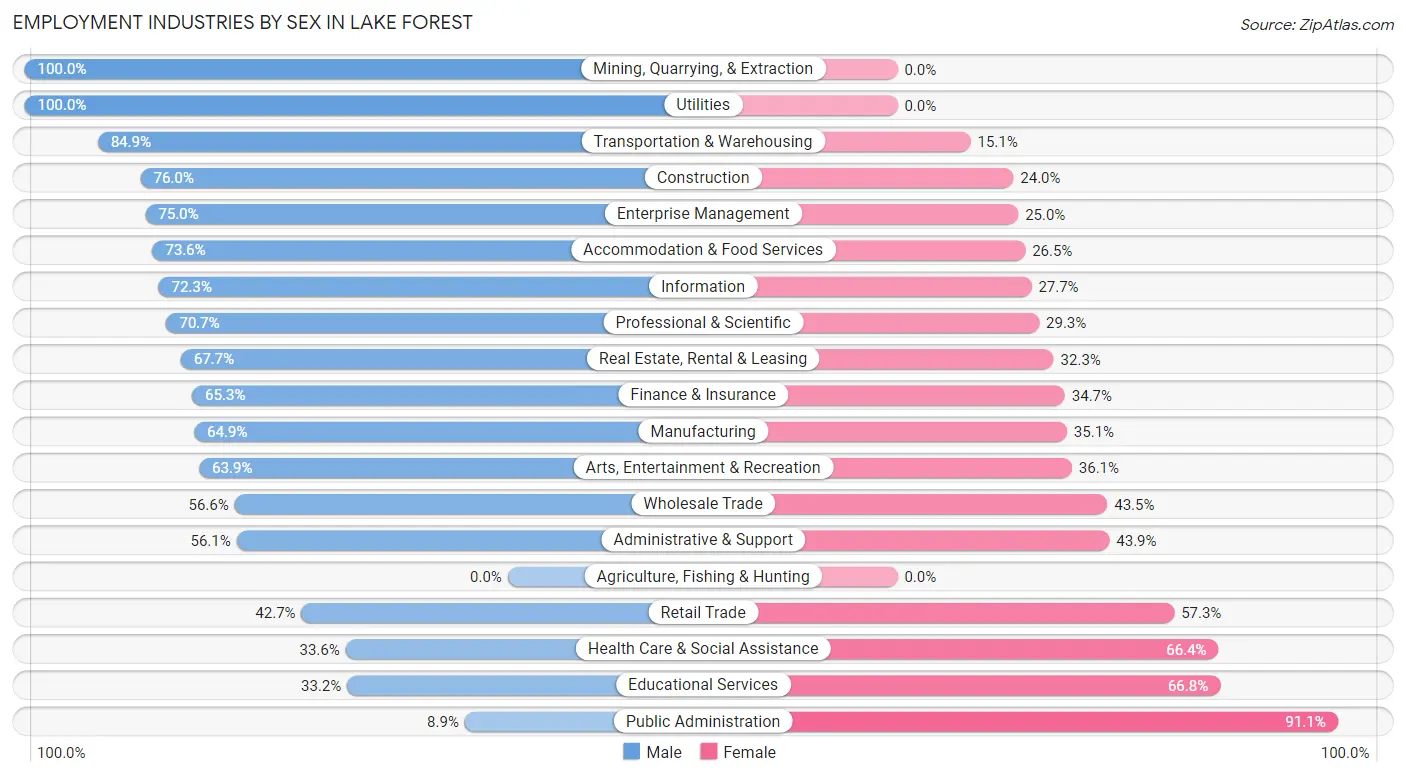
Employment Industries by Sex in Lake Forest
The Lake Forest industries that see more men than women are Mining, Quarrying, & Extraction (100.0%), Utilities (100.0%), and Transportation & Warehousing (84.9%), whereas the industries that tend to have a higher number of women are Public Administration (91.1%), Educational Services (66.8%), and Health Care & Social Assistance (66.4%).
| Industry | Male | Female |
| Agriculture, Fishing & Hunting | 0 (0.0%) | 0 (0.0%) |
| Mining, Quarrying, & Extraction | 9 (100.0%) | 0 (0.0%) |
| Construction | 152 (76.0%) | 48 (24.0%) |
| Manufacturing | 618 (64.9%) | 334 (35.1%) |
| Wholesale Trade | 177 (56.6%) | 136 (43.4%) |
| Retail Trade | 296 (42.7%) | 397 (57.3%) |
| Transportation & Warehousing | 157 (84.9%) | 28 (15.1%) |
| Utilities | 15 (100.0%) | 0 (0.0%) |
| Information | 112 (72.3%) | 43 (27.7%) |
| Finance & Insurance | 507 (65.3%) | 269 (34.7%) |
| Real Estate, Rental & Leasing | 159 (67.7%) | 76 (32.3%) |
| Professional & Scientific | 1,176 (70.7%) | 488 (29.3%) |
| Enterprise Management | 60 (75.0%) | 20 (25.0%) |
| Administrative & Support | 142 (56.1%) | 111 (43.9%) |
| Educational Services | 344 (33.2%) | 691 (66.8%) |
| Health Care & Social Assistance | 287 (33.6%) | 568 (66.4%) |
| Arts, Entertainment & Recreation | 138 (63.9%) | 78 (36.1%) |
| Accommodation & Food Services | 203 (73.6%) | 73 (26.5%) |
| Public Administration | 29 (8.9%) | 297 (91.1%) |
| Total | 4,714 (54.4%) | 3,948 (45.6%) |
Education in Lake Forest
School Enrollment in Lake Forest
The most common levels of schooling among the 5,949 students in Lake Forest are college / undergraduate (1,825 | 30.7%), high school (1,177 | 19.8%), and middle school (985 | 16.6%).
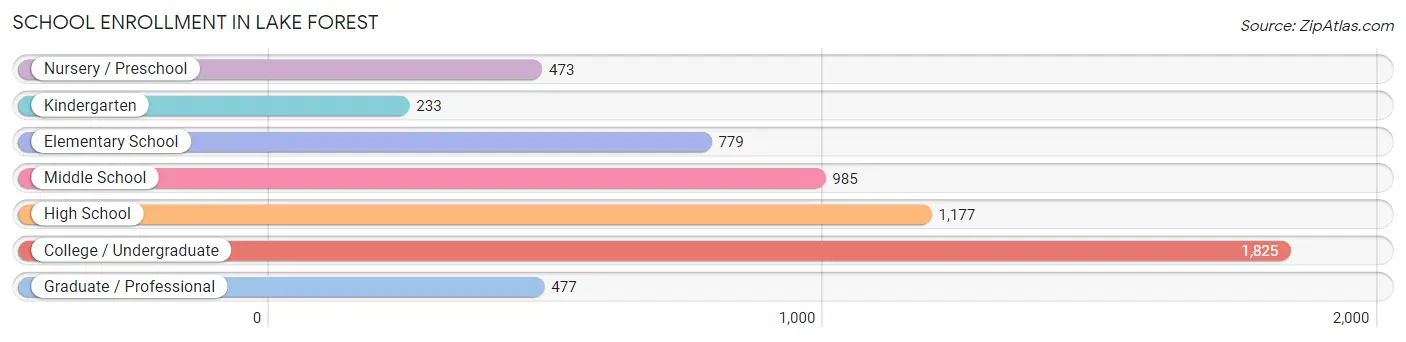
| School Level | # Students | % Students |
| Nursery / Preschool | 473 | 8.0% |
| Kindergarten | 233 | 3.9% |
| Elementary School | 779 | 13.1% |
| Middle School | 985 | 16.6% |
| High School | 1,177 | 19.8% |
| College / Undergraduate | 1,825 | 30.7% |
| Graduate / Professional | 477 | 8.0% |
| Total | 5,949 | 100.0% |
School Enrollment by Age by Funding Source in Lake Forest
Out of a total of 5,949 students who are enrolled in schools in Lake Forest, 2,249 (37.8%) attend a private institution, while the remaining 3,700 (62.2%) are enrolled in public schools. The age group of 35 years and over has the highest likelihood of being enrolled in private schools, with 183 (76.2% in the age bracket) enrolled. Conversely, the age group of 10 to 14 year olds has the lowest likelihood of being enrolled in a private school, with 1,035 (87.4% in the age bracket) attending a public institution.
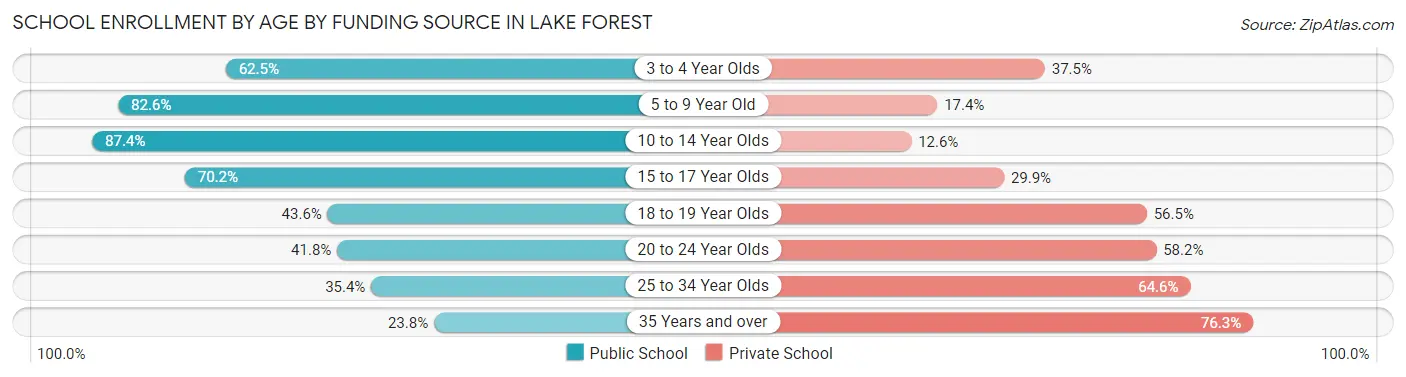
| Age Bracket | Public School | Private School |
| 3 to 4 Year Olds | 247 (62.5%) | 148 (37.5%) |
| 5 to 9 Year Old | 820 (82.6%) | 173 (17.4%) |
| 10 to 14 Year Olds | 1,035 (87.4%) | 149 (12.6%) |
| 15 to 17 Year Olds | 571 (70.2%) | 243 (29.8%) |
| 18 to 19 Year Olds | 331 (43.5%) | 429 (56.5%) |
| 20 to 24 Year Olds | 554 (41.8%) | 772 (58.2%) |
| 25 to 34 Year Olds | 84 (35.4%) | 153 (64.6%) |
| 35 Years and over | 57 (23.7%) | 183 (76.2%) |
| Total | 3,700 (62.2%) | 2,249 (37.8%) |
Educational Attainment by Field of Study in Lake Forest
Business (2,456 | 21.9%), social sciences (1,583 | 14.1%), education (923 | 8.2%), literature & languages (912 | 8.1%), and liberal arts & history (741 | 6.6%) are the most common fields of study among 11,204 individuals in Lake Forest who have obtained a bachelor's degree or higher.
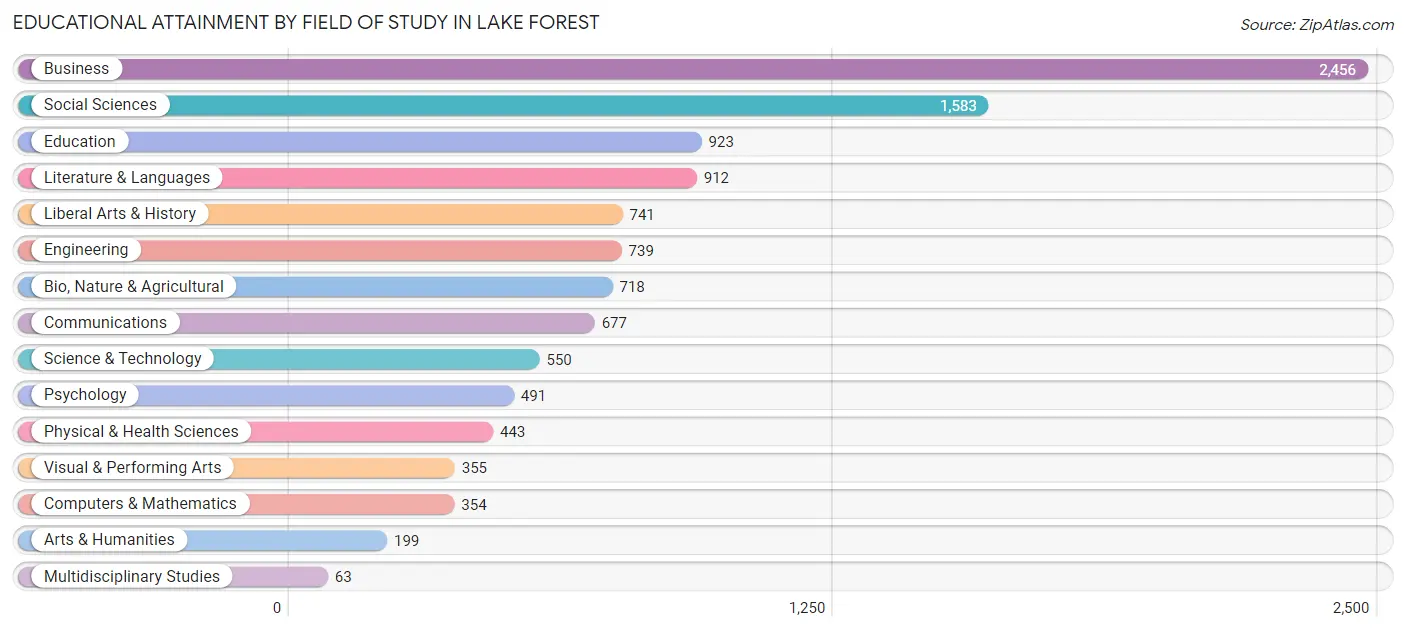
| Field of Study | # Graduates | % Graduates |
| Computers & Mathematics | 354 | 3.2% |
| Bio, Nature & Agricultural | 718 | 6.4% |
| Physical & Health Sciences | 443 | 4.0% |
| Psychology | 491 | 4.4% |
| Social Sciences | 1,583 | 14.1% |
| Engineering | 739 | 6.6% |
| Multidisciplinary Studies | 63 | 0.6% |
| Science & Technology | 550 | 4.9% |
| Business | 2,456 | 21.9% |
| Education | 923 | 8.2% |
| Literature & Languages | 912 | 8.1% |
| Liberal Arts & History | 741 | 6.6% |
| Visual & Performing Arts | 355 | 3.2% |
| Communications | 677 | 6.0% |
| Arts & Humanities | 199 | 1.8% |
| Total | 11,204 | 100.0% |
Transportation & Commute in Lake Forest
Vehicle Availability by Sex in Lake Forest
The most prevalent vehicle ownership categories in Lake Forest are males with 2 vehicles (2,364, accounting for 53.5%) and females with 2 vehicles (1,590, making up 65.4%).
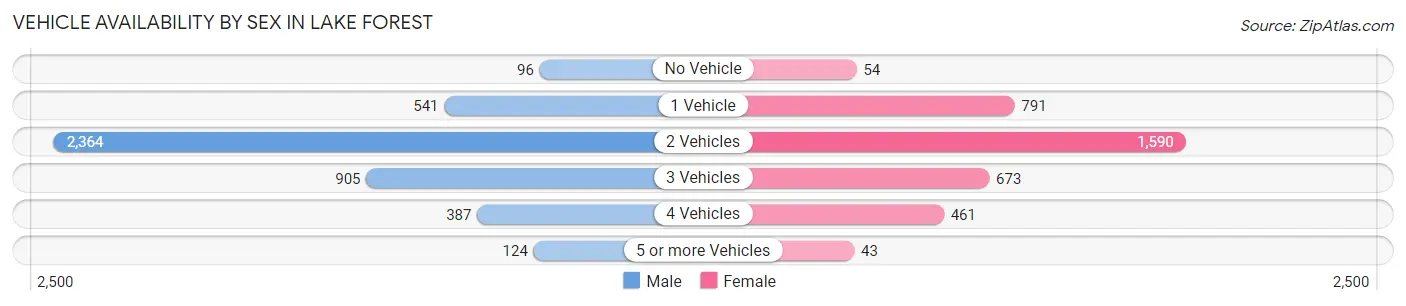
| Vehicles Available | Male | Female |
| No Vehicle | 96 (2.2%) | 54 (1.5%) |
| 1 Vehicle | 541 (12.2%) | 791 (21.9%) |
| 2 Vehicles | 2,364 (53.5%) | 1,590 (44.0%) |
| 3 Vehicles | 905 (20.5%) | 673 (18.6%) |
| 4 Vehicles | 387 (8.8%) | 461 (12.8%) |
| 5 or more Vehicles | 124 (2.8%) | 43 (1.2%) |
| Total | 4,417 (100.0%) | 3,612 (100.0%) |
Commute Time in Lake Forest
The most frequently occuring commute durations in Lake Forest are 60 to 89 minutes (1,268 commuters, 19.8%), 15 to 19 minutes (915 commuters, 14.3%), and 10 to 14 minutes (726 commuters, 11.3%).
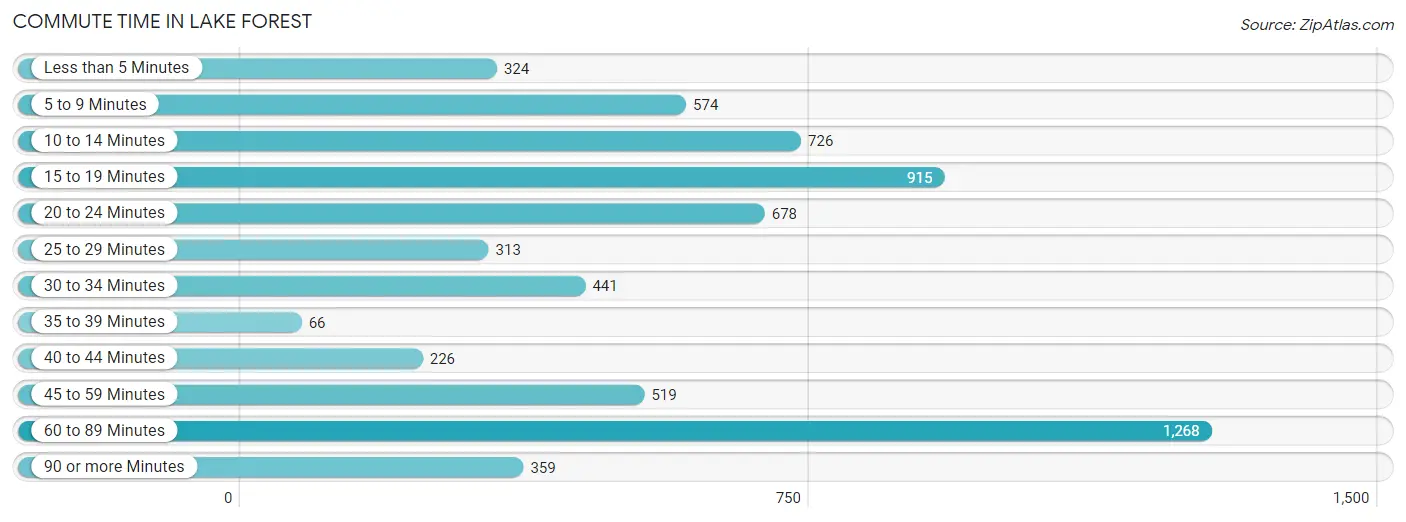
| Commute Time | # Commuters | % Commuters |
| Less than 5 Minutes | 324 | 5.1% |
| 5 to 9 Minutes | 574 | 9.0% |
| 10 to 14 Minutes | 726 | 11.3% |
| 15 to 19 Minutes | 915 | 14.3% |
| 20 to 24 Minutes | 678 | 10.6% |
| 25 to 29 Minutes | 313 | 4.9% |
| 30 to 34 Minutes | 441 | 6.9% |
| 35 to 39 Minutes | 66 | 1.0% |
| 40 to 44 Minutes | 226 | 3.5% |
| 45 to 59 Minutes | 519 | 8.1% |
| 60 to 89 Minutes | 1,268 | 19.8% |
| 90 or more Minutes | 359 | 5.6% |
Commute Time by Sex in Lake Forest
The most common commute times in Lake Forest are 60 to 89 minutes (874 commuters, 24.4%) for males and 15 to 19 minutes (503 commuters, 17.8%) for females.
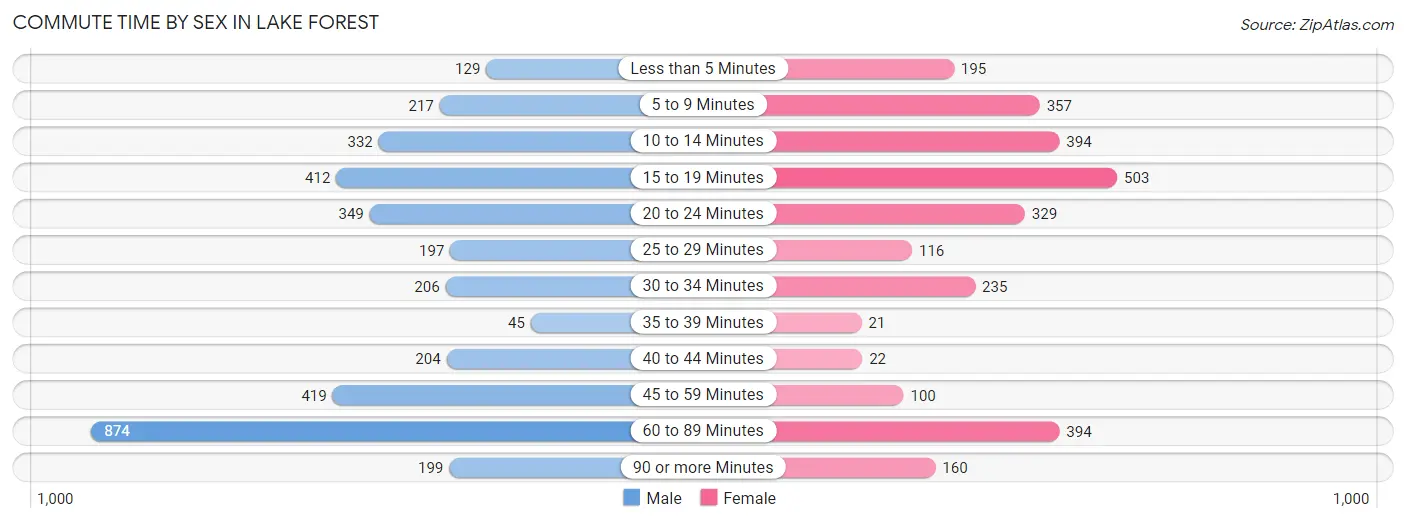
| Commute Time | Male | Female |
| Less than 5 Minutes | 129 (3.6%) | 195 (6.9%) |
| 5 to 9 Minutes | 217 (6.1%) | 357 (12.6%) |
| 10 to 14 Minutes | 332 (9.3%) | 394 (13.9%) |
| 15 to 19 Minutes | 412 (11.5%) | 503 (17.8%) |
| 20 to 24 Minutes | 349 (9.7%) | 329 (11.6%) |
| 25 to 29 Minutes | 197 (5.5%) | 116 (4.1%) |
| 30 to 34 Minutes | 206 (5.8%) | 235 (8.3%) |
| 35 to 39 Minutes | 45 (1.3%) | 21 (0.7%) |
| 40 to 44 Minutes | 204 (5.7%) | 22 (0.8%) |
| 45 to 59 Minutes | 419 (11.7%) | 100 (3.5%) |
| 60 to 89 Minutes | 874 (24.4%) | 394 (13.9%) |
| 90 or more Minutes | 199 (5.6%) | 160 (5.7%) |
Time of Departure to Work by Sex in Lake Forest
The most frequent times of departure to work in Lake Forest are 8:00 AM to 8:29 AM (642, 17.9%) for males and 7:30 AM to 7:59 AM (431, 15.2%) for females.
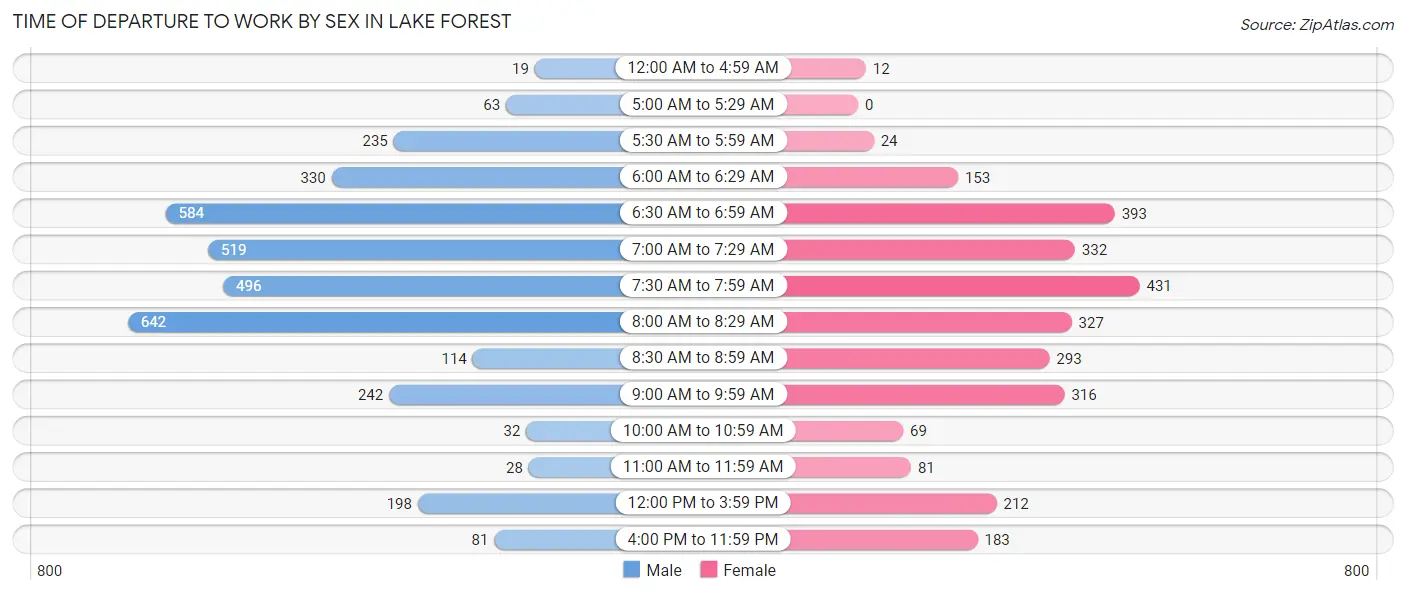
| Time of Departure | Male | Female |
| 12:00 AM to 4:59 AM | 19 (0.5%) | 12 (0.4%) |
| 5:00 AM to 5:29 AM | 63 (1.8%) | 0 (0.0%) |
| 5:30 AM to 5:59 AM | 235 (6.6%) | 24 (0.9%) |
| 6:00 AM to 6:29 AM | 330 (9.2%) | 153 (5.4%) |
| 6:30 AM to 6:59 AM | 584 (16.3%) | 393 (13.9%) |
| 7:00 AM to 7:29 AM | 519 (14.5%) | 332 (11.7%) |
| 7:30 AM to 7:59 AM | 496 (13.8%) | 431 (15.2%) |
| 8:00 AM to 8:29 AM | 642 (17.9%) | 327 (11.6%) |
| 8:30 AM to 8:59 AM | 114 (3.2%) | 293 (10.4%) |
| 9:00 AM to 9:59 AM | 242 (6.8%) | 316 (11.2%) |
| 10:00 AM to 10:59 AM | 32 (0.9%) | 69 (2.4%) |
| 11:00 AM to 11:59 AM | 28 (0.8%) | 81 (2.9%) |
| 12:00 PM to 3:59 PM | 198 (5.5%) | 212 (7.5%) |
| 4:00 PM to 11:59 PM | 81 (2.3%) | 183 (6.5%) |
| Total | 3,583 (100.0%) | 2,826 (100.0%) |
Housing Occupancy in Lake Forest
Occupancy by Ownership in Lake Forest
Of the total 6,959 dwellings in Lake Forest, owner-occupied units account for 6,064 (87.1%), while renter-occupied units make up 895 (12.9%).
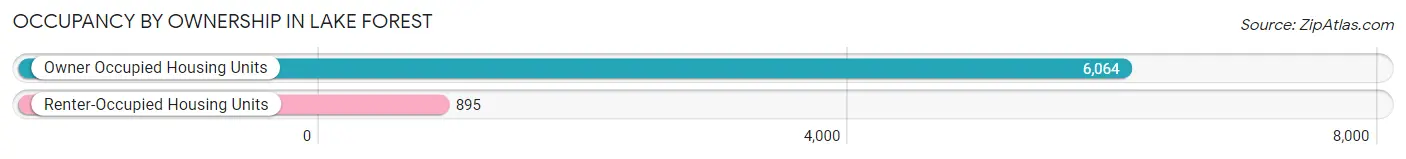
| Occupancy | # Housing Units | % Housing Units |
| Owner Occupied Housing Units | 6,064 | 87.1% |
| Renter-Occupied Housing Units | 895 | 12.9% |
| Total Occupied Housing Units | 6,959 | 100.0% |
Occupancy by Household Size in Lake Forest
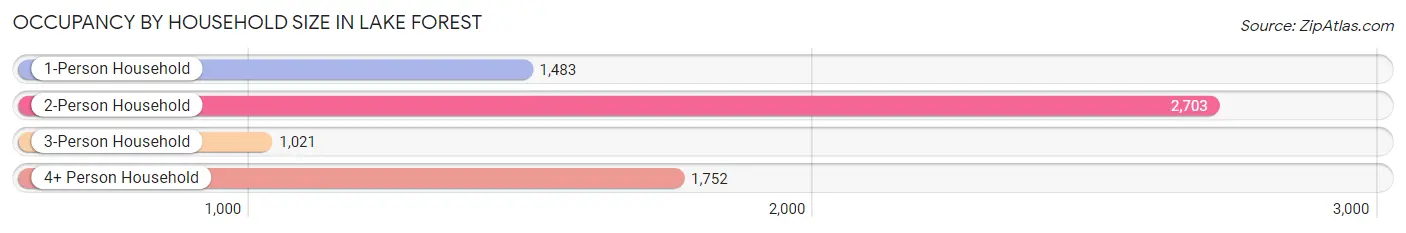
| Household Size | # Housing Units | % Housing Units |
| 1-Person Household | 1,483 | 21.3% |
| 2-Person Household | 2,703 | 38.8% |
| 3-Person Household | 1,021 | 14.7% |
| 4+ Person Household | 1,752 | 25.2% |
| Total Housing Units | 6,959 | 100.0% |
Occupancy by Ownership by Household Size in Lake Forest
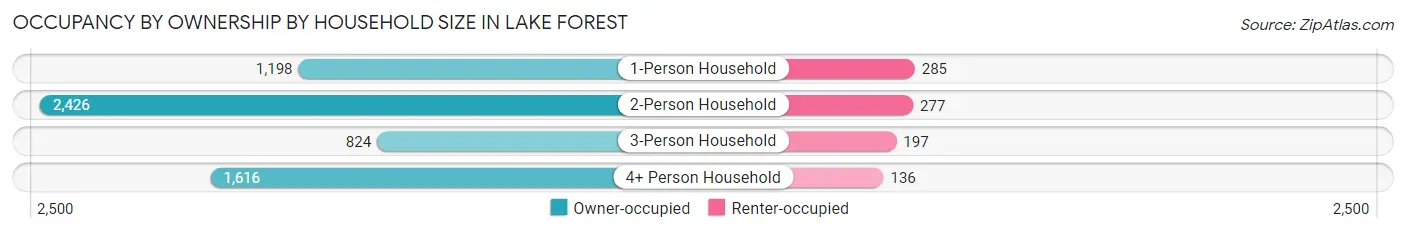
| Household Size | Owner-occupied | Renter-occupied |
| 1-Person Household | 1,198 (80.8%) | 285 (19.2%) |
| 2-Person Household | 2,426 (89.7%) | 277 (10.2%) |
| 3-Person Household | 824 (80.7%) | 197 (19.3%) |
| 4+ Person Household | 1,616 (92.2%) | 136 (7.8%) |
| Total Housing Units | 6,064 (87.1%) | 895 (12.9%) |
Occupancy by Educational Attainment in Lake Forest
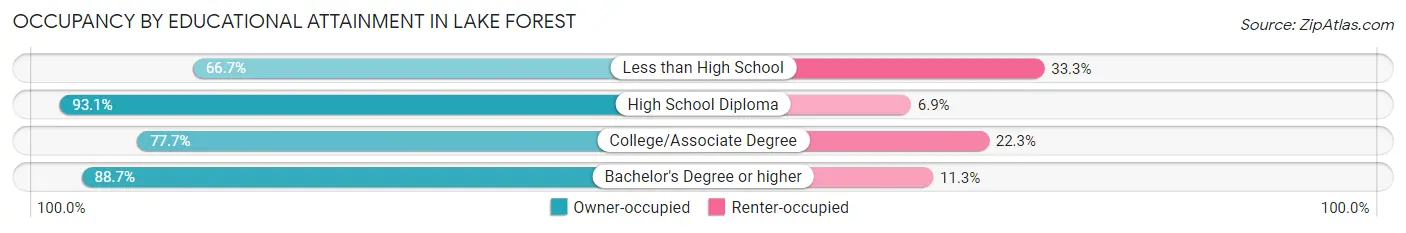
| Household Size | Owner-occupied | Renter-occupied |
| Less than High School | 36 (66.7%) | 18 (33.3%) |
| High School Diploma | 203 (93.1%) | 15 (6.9%) |
| College/Associate Degree | 755 (77.7%) | 217 (22.3%) |
| Bachelor's Degree or higher | 5,070 (88.7%) | 645 (11.3%) |
Occupancy by Age of Householder in Lake Forest
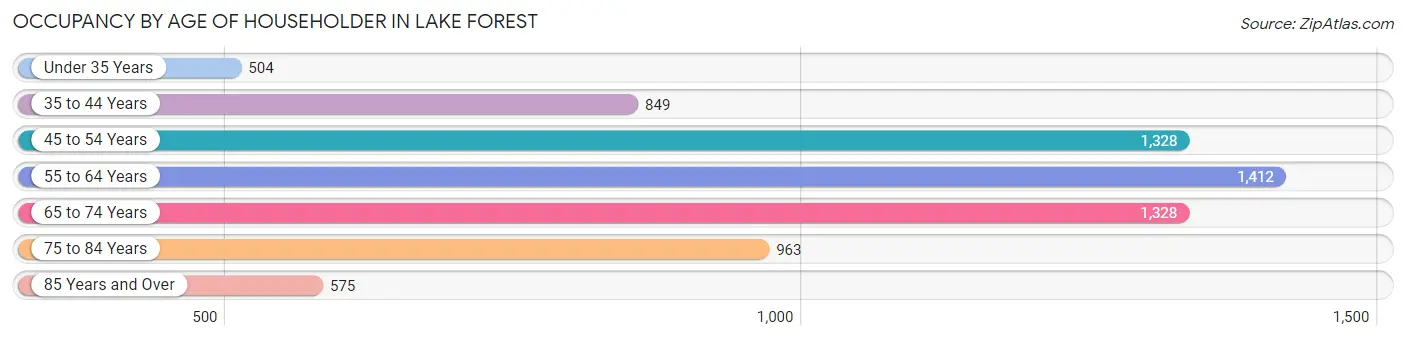
| Age Bracket | # Households | % Households |
| Under 35 Years | 504 | 7.2% |
| 35 to 44 Years | 849 | 12.2% |
| 45 to 54 Years | 1,328 | 19.1% |
| 55 to 64 Years | 1,412 | 20.3% |
| 65 to 74 Years | 1,328 | 19.1% |
| 75 to 84 Years | 963 | 13.8% |
| 85 Years and Over | 575 | 8.3% |
| Total | 6,959 | 100.0% |
Housing Finances in Lake Forest
Median Income by Occupancy in Lake Forest
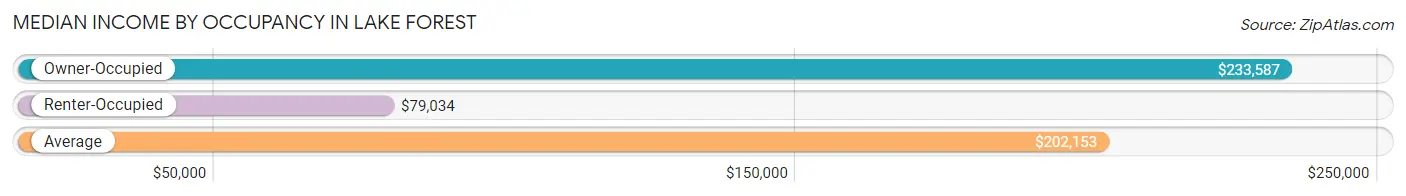
| Occupancy Type | # Households | Median Income |
| Owner-Occupied | 6,064 (87.1%) | $233,587 |
| Renter-Occupied | 895 (12.9%) | $79,034 |
| Average | 6,959 (100.0%) | $202,153 |
Occupancy by Householder Income Bracket in Lake Forest
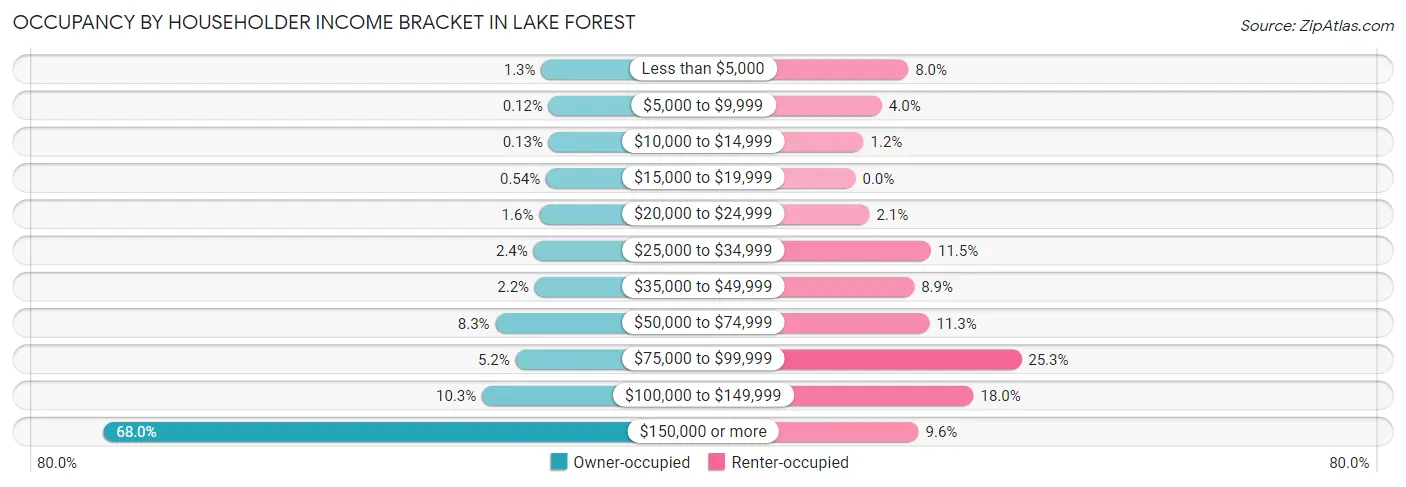
| Income Bracket | Owner-occupied | Renter-occupied |
| Less than $5,000 | 76 (1.3%) | 72 (8.0%) |
| $5,000 to $9,999 | 7 (0.1%) | 36 (4.0%) |
| $10,000 to $14,999 | 8 (0.1%) | 11 (1.2%) |
| $15,000 to $19,999 | 33 (0.5%) | 0 (0.0%) |
| $20,000 to $24,999 | 96 (1.6%) | 19 (2.1%) |
| $25,000 to $34,999 | 148 (2.4%) | 103 (11.5%) |
| $35,000 to $49,999 | 135 (2.2%) | 80 (8.9%) |
| $50,000 to $74,999 | 500 (8.3%) | 101 (11.3%) |
| $75,000 to $99,999 | 314 (5.2%) | 226 (25.3%) |
| $100,000 to $149,999 | 624 (10.3%) | 161 (18.0%) |
| $150,000 or more | 4,123 (68.0%) | 86 (9.6%) |
| Total | 6,064 (100.0%) | 895 (100.0%) |
Monthly Housing Cost Tiers in Lake Forest
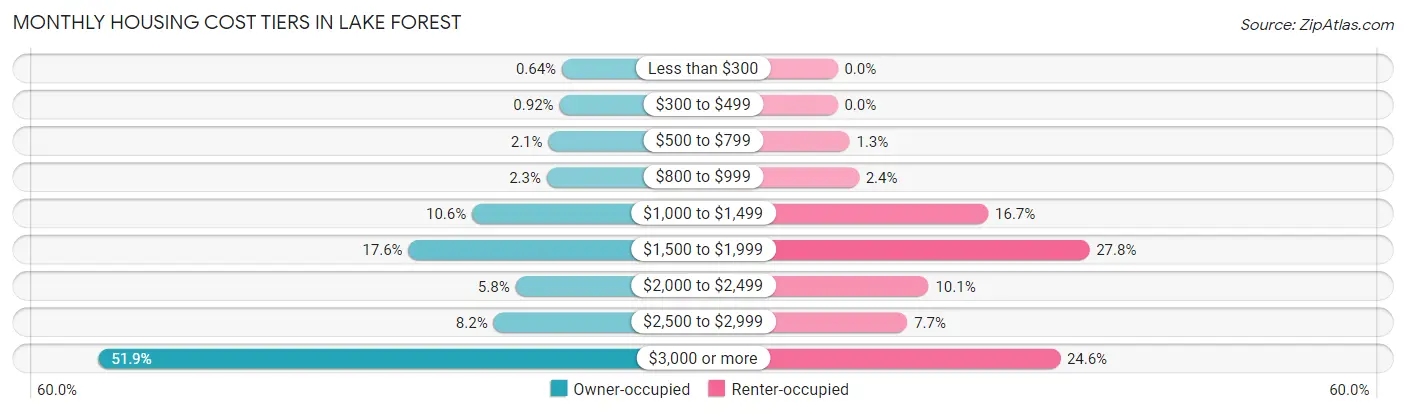
| Monthly Cost | Owner-occupied | Renter-occupied |
| Less than $300 | 39 (0.6%) | 0 (0.0%) |
| $300 to $499 | 56 (0.9%) | 0 (0.0%) |
| $500 to $799 | 130 (2.1%) | 12 (1.3%) |
| $800 to $999 | 140 (2.3%) | 21 (2.4%) |
| $1,000 to $1,499 | 641 (10.6%) | 149 (16.7%) |
| $1,500 to $1,999 | 1,067 (17.6%) | 249 (27.8%) |
| $2,000 to $2,499 | 350 (5.8%) | 90 (10.1%) |
| $2,500 to $2,999 | 497 (8.2%) | 69 (7.7%) |
| $3,000 or more | 3,144 (51.8%) | 220 (24.6%) |
| Total | 6,064 (100.0%) | 895 (100.0%) |
Physical Housing Characteristics in Lake Forest
Housing Structures in Lake Forest
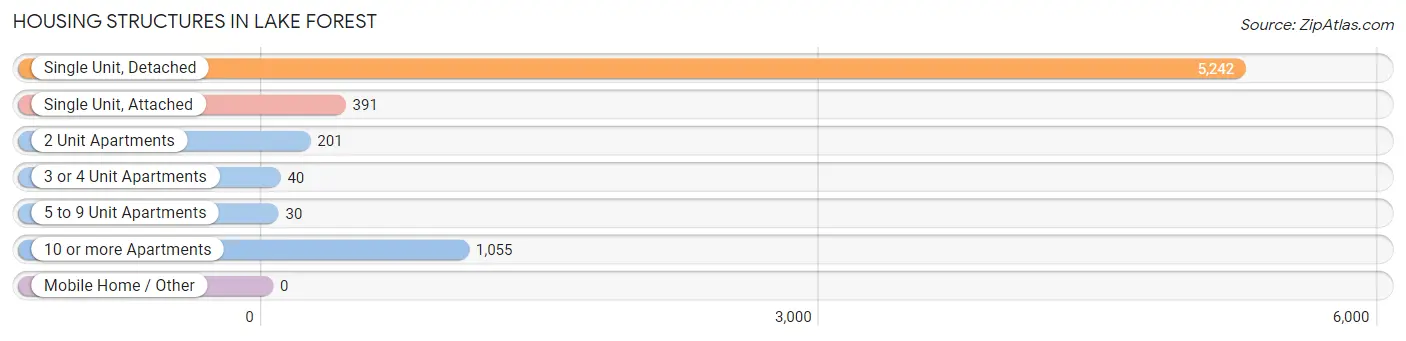
| Structure Type | # Housing Units | % Housing Units |
| Single Unit, Detached | 5,242 | 75.3% |
| Single Unit, Attached | 391 | 5.6% |
| 2 Unit Apartments | 201 | 2.9% |
| 3 or 4 Unit Apartments | 40 | 0.6% |
| 5 to 9 Unit Apartments | 30 | 0.4% |
| 10 or more Apartments | 1,055 | 15.2% |
| Mobile Home / Other | 0 | 0.0% |
| Total | 6,959 | 100.0% |
Housing Structures by Occupancy in Lake Forest
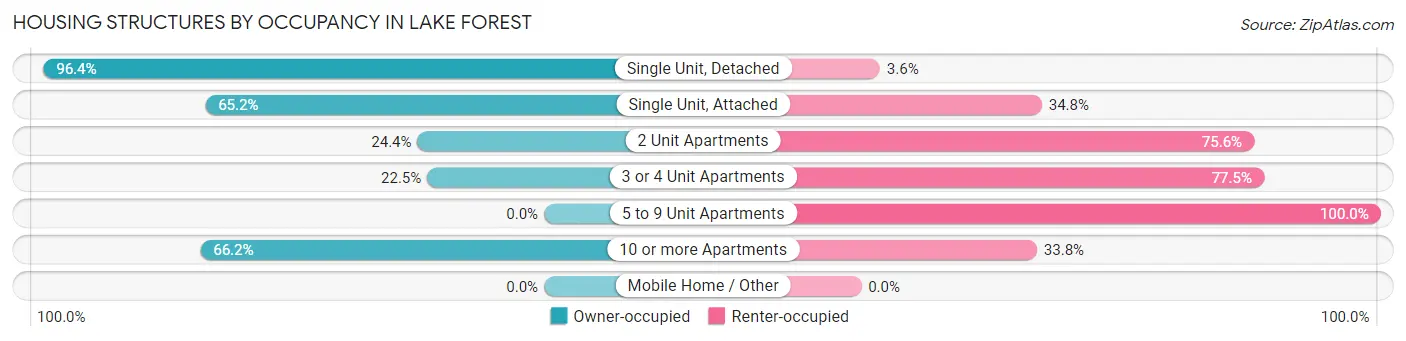
| Structure Type | Owner-occupied | Renter-occupied |
| Single Unit, Detached | 5,053 (96.4%) | 189 (3.6%) |
| Single Unit, Attached | 255 (65.2%) | 136 (34.8%) |
| 2 Unit Apartments | 49 (24.4%) | 152 (75.6%) |
| 3 or 4 Unit Apartments | 9 (22.5%) | 31 (77.5%) |
| 5 to 9 Unit Apartments | 0 (0.0%) | 30 (100.0%) |
| 10 or more Apartments | 698 (66.2%) | 357 (33.8%) |
| Mobile Home / Other | 0 (0.0%) | 0 (0.0%) |
| Total | 6,064 (87.1%) | 895 (12.9%) |
Housing Structures by Number of Rooms in Lake Forest
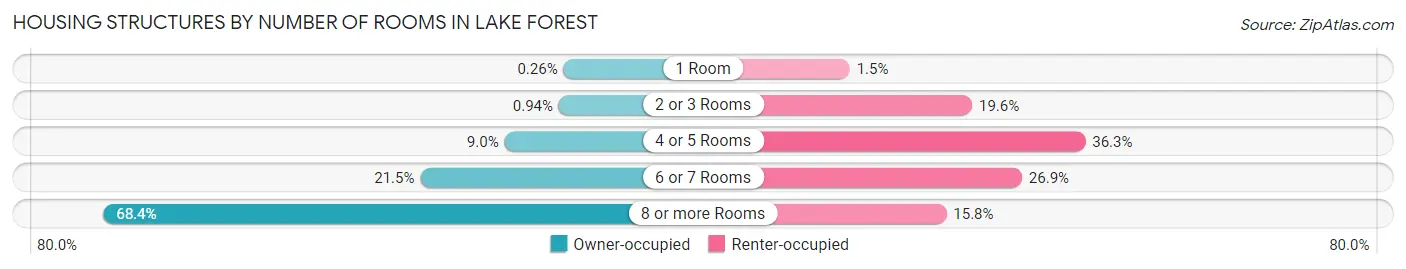
| Number of Rooms | Owner-occupied | Renter-occupied |
| 1 Room | 16 (0.3%) | 13 (1.5%) |
| 2 or 3 Rooms | 57 (0.9%) | 175 (19.6%) |
| 4 or 5 Rooms | 545 (9.0%) | 325 (36.3%) |
| 6 or 7 Rooms | 1,301 (21.4%) | 241 (26.9%) |
| 8 or more Rooms | 4,145 (68.3%) | 141 (15.8%) |
| Total | 6,064 (100.0%) | 895 (100.0%) |
Housing Structure by Heating Type in Lake Forest
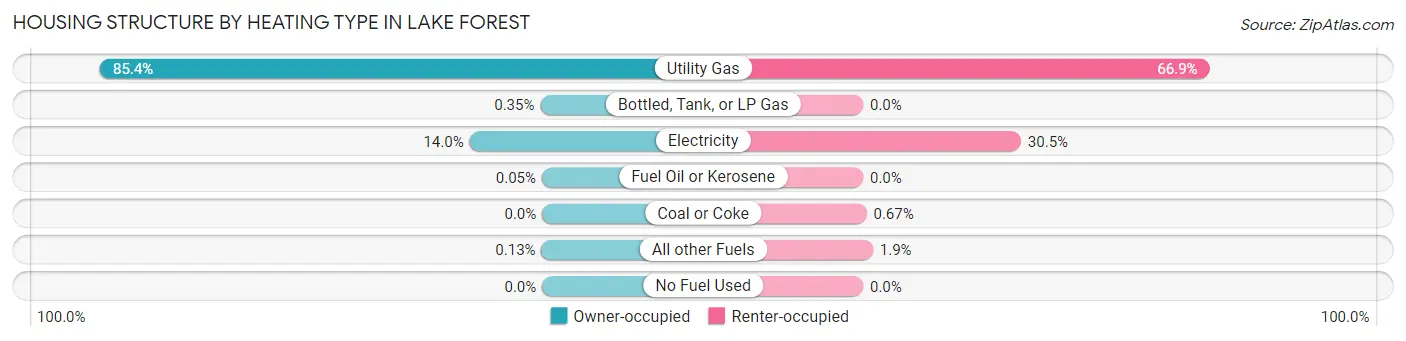
| Heating Type | Owner-occupied | Renter-occupied |
| Utility Gas | 5,181 (85.4%) | 599 (66.9%) |
| Bottled, Tank, or LP Gas | 21 (0.4%) | 0 (0.0%) |
| Electricity | 851 (14.0%) | 273 (30.5%) |
| Fuel Oil or Kerosene | 3 (0.1%) | 0 (0.0%) |
| Coal or Coke | 0 (0.0%) | 6 (0.7%) |
| All other Fuels | 8 (0.1%) | 17 (1.9%) |
| No Fuel Used | 0 (0.0%) | 0 (0.0%) |
| Total | 6,064 (100.0%) | 895 (100.0%) |
Household Vehicle Usage in Lake Forest
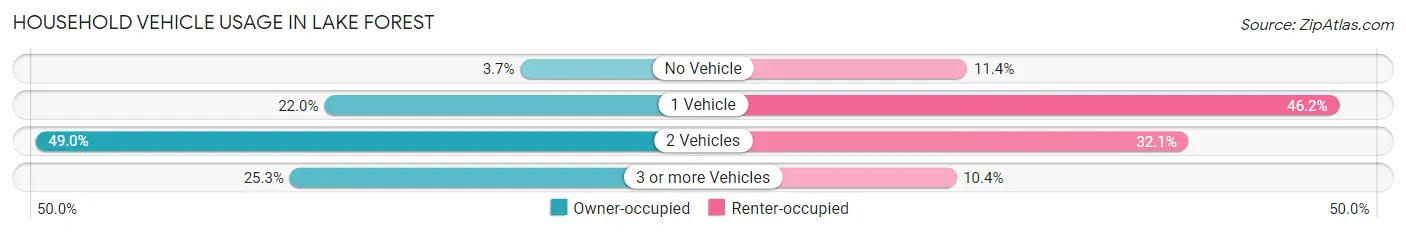
| Vehicles per Household | Owner-occupied | Renter-occupied |
| No Vehicle | 226 (3.7%) | 102 (11.4%) |
| 1 Vehicle | 1,336 (22.0%) | 413 (46.2%) |
| 2 Vehicles | 2,971 (49.0%) | 287 (32.1%) |
| 3 or more Vehicles | 1,531 (25.3%) | 93 (10.4%) |
| Total | 6,064 (100.0%) | 895 (100.0%) |
Real Estate & Mortgages in Lake Forest
Real Estate and Mortgage Overview in Lake Forest
| Characteristic | Without Mortgage | With Mortgage |
| Housing Units | 2,473 | 3,591 |
| Median Property Value | $822,800 | $948,100 |
| Median Household Income | $212,396 | $2,568 |
| Monthly Housing Costs | $1,501 | $2,848 |
| Real Estate Taxes | $10,001 | $0 |
Property Value by Mortgage Status in Lake Forest
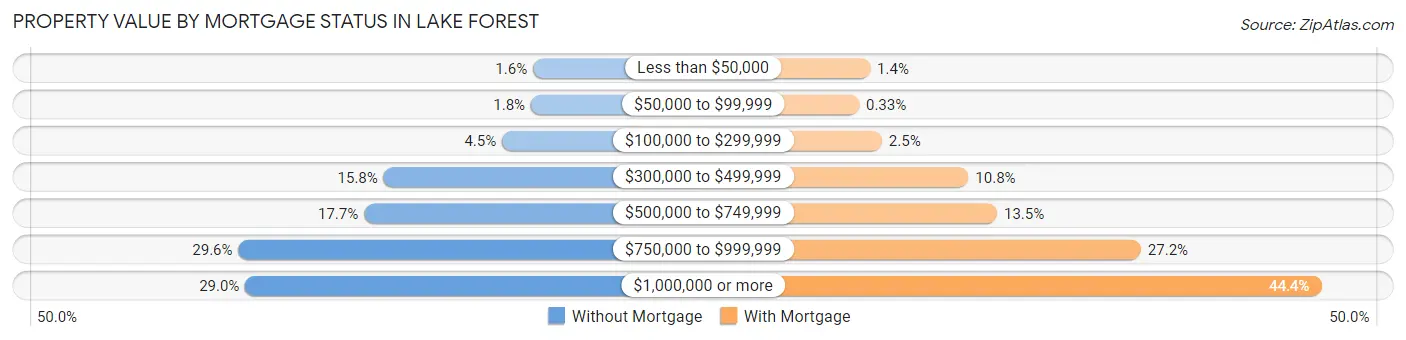
| Property Value | Without Mortgage | With Mortgage |
| Less than $50,000 | 39 (1.6%) | 50 (1.4%) |
| $50,000 to $99,999 | 44 (1.8%) | 12 (0.3%) |
| $100,000 to $299,999 | 112 (4.5%) | 90 (2.5%) |
| $300,000 to $499,999 | 391 (15.8%) | 386 (10.7%) |
| $500,000 to $749,999 | 437 (17.7%) | 484 (13.5%) |
| $750,000 to $999,999 | 733 (29.6%) | 976 (27.2%) |
| $1,000,000 or more | 717 (29.0%) | 1,593 (44.4%) |
| Total | 2,473 (100.0%) | 3,591 (100.0%) |
Household Income by Mortgage Status in Lake Forest
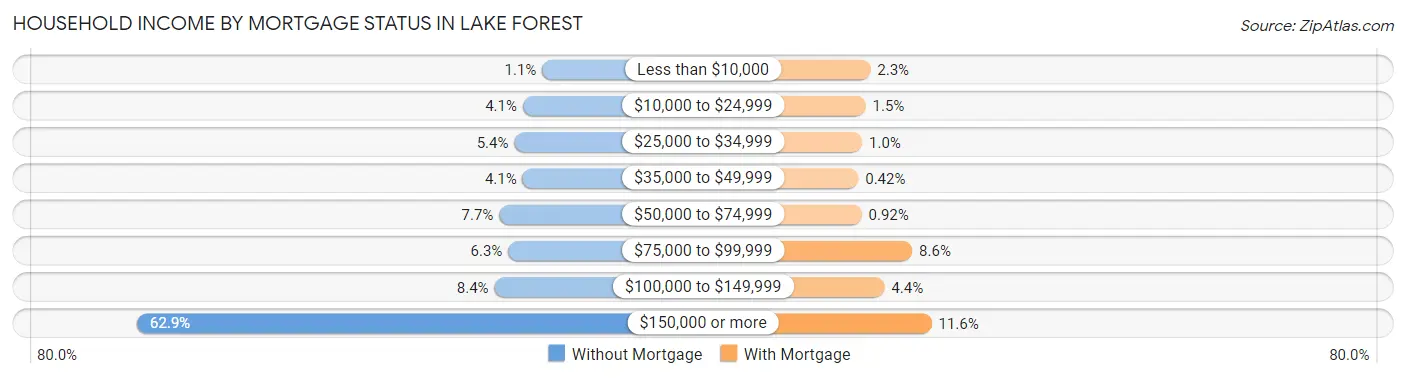
| Household Income | Without Mortgage | With Mortgage |
| Less than $10,000 | 28 (1.1%) | 81 (2.3%) |
| $10,000 to $24,999 | 101 (4.1%) | 55 (1.5%) |
| $25,000 to $34,999 | 133 (5.4%) | 36 (1.0%) |
| $35,000 to $49,999 | 102 (4.1%) | 15 (0.4%) |
| $50,000 to $74,999 | 190 (7.7%) | 33 (0.9%) |
| $75,000 to $99,999 | 156 (6.3%) | 310 (8.6%) |
| $100,000 to $149,999 | 208 (8.4%) | 158 (4.4%) |
| $150,000 or more | 1,555 (62.9%) | 416 (11.6%) |
| Total | 2,473 (100.0%) | 3,591 (100.0%) |
Property Value to Household Income Ratio in Lake Forest
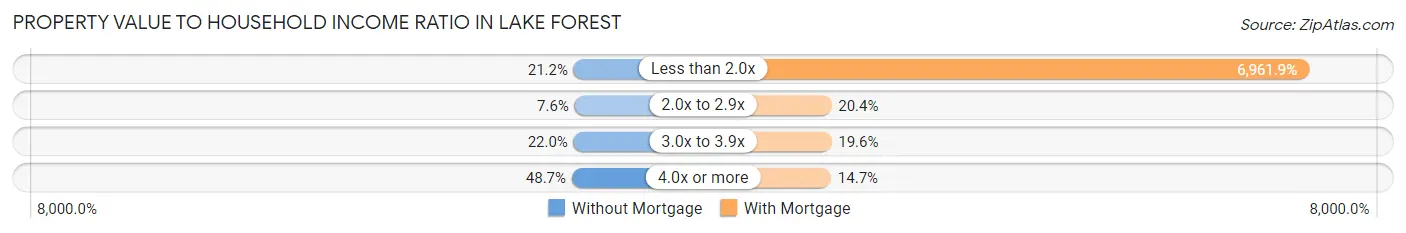
| Value-to-Income Ratio | Without Mortgage | With Mortgage |
| Less than 2.0x | 525 (21.2%) | 250,001 (6,961.9%) |
| 2.0x to 2.9x | 187 (7.6%) | 733 (20.4%) |
| 3.0x to 3.9x | 545 (22.0%) | 704 (19.6%) |
| 4.0x or more | 1,203 (48.6%) | 528 (14.7%) |
| Total | 2,473 (100.0%) | 3,591 (100.0%) |
Real Estate Taxes by Mortgage Status in Lake Forest
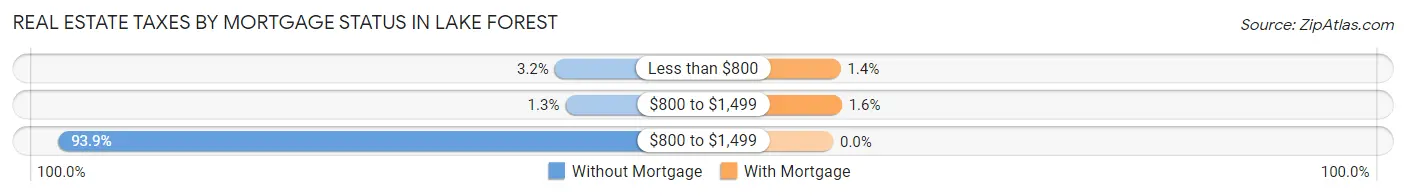
| Property Taxes | Without Mortgage | With Mortgage |
| Less than $800 | 79 (3.2%) | 49 (1.4%) |
| $800 to $1,499 | 31 (1.3%) | 57 (1.6%) |
| $800 to $1,499 | 2,321 (93.9%) | 0 (0.0%) |
| Total | 2,473 (100.0%) | 3,591 (100.0%) |
Health & Disability in Lake Forest
Health Insurance Coverage by Age in Lake Forest
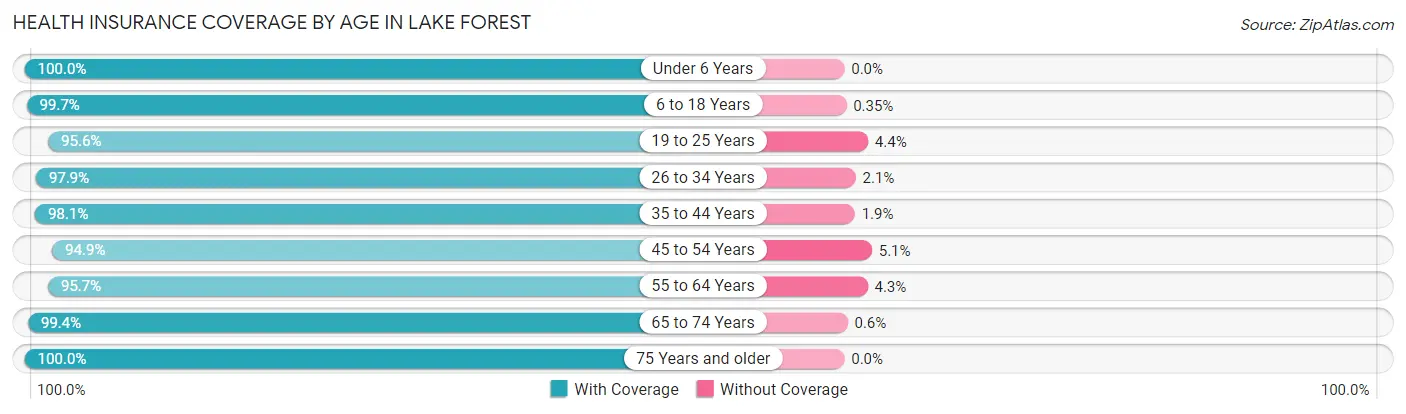
| Age Bracket | With Coverage | Without Coverage |
| Under 6 Years | 1,004 (100.0%) | 0 (0.0%) |
| 6 to 18 Years | 3,376 (99.7%) | 12 (0.4%) |
| 19 to 25 Years | 2,086 (95.6%) | 96 (4.4%) |
| 26 to 34 Years | 1,482 (97.9%) | 32 (2.1%) |
| 35 to 44 Years | 1,616 (98.1%) | 32 (1.9%) |
| 45 to 54 Years | 2,295 (94.9%) | 124 (5.1%) |
| 55 to 64 Years | 2,429 (95.7%) | 110 (4.3%) |
| 65 to 74 Years | 2,321 (99.4%) | 14 (0.6%) |
| 75 Years and older | 2,306 (100.0%) | 0 (0.0%) |
| Total | 18,915 (97.8%) | 420 (2.2%) |
Health Insurance Coverage by Citizenship Status in Lake Forest
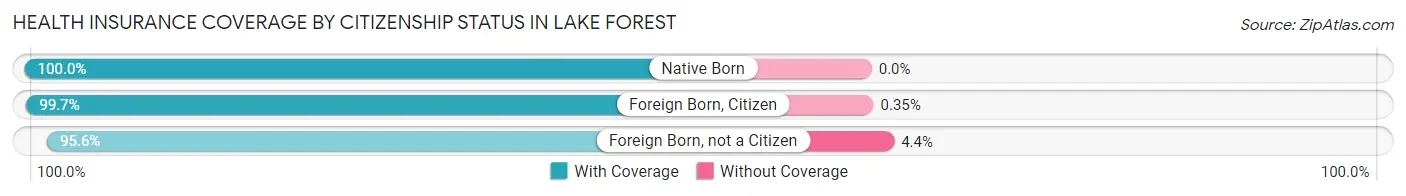
| Citizenship Status | With Coverage | Without Coverage |
| Native Born | 1,004 (100.0%) | 0 (0.0%) |
| Foreign Born, Citizen | 3,376 (99.7%) | 12 (0.4%) |
| Foreign Born, not a Citizen | 2,086 (95.6%) | 96 (4.4%) |
Health Insurance Coverage by Household Income in Lake Forest
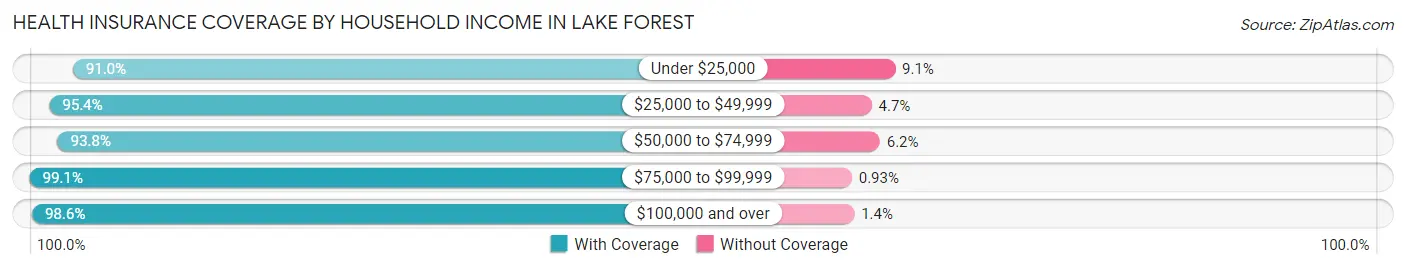
| Household Income | With Coverage | Without Coverage |
| Under $25,000 | 553 (90.9%) | 55 (9.0%) |
| $25,000 to $49,999 | 677 (95.4%) | 33 (4.6%) |
| $50,000 to $74,999 | 1,002 (93.8%) | 66 (6.2%) |
| $75,000 to $99,999 | 1,274 (99.1%) | 12 (0.9%) |
| $100,000 and over | 14,432 (98.6%) | 203 (1.4%) |
Public vs Private Health Insurance Coverage by Age in Lake Forest
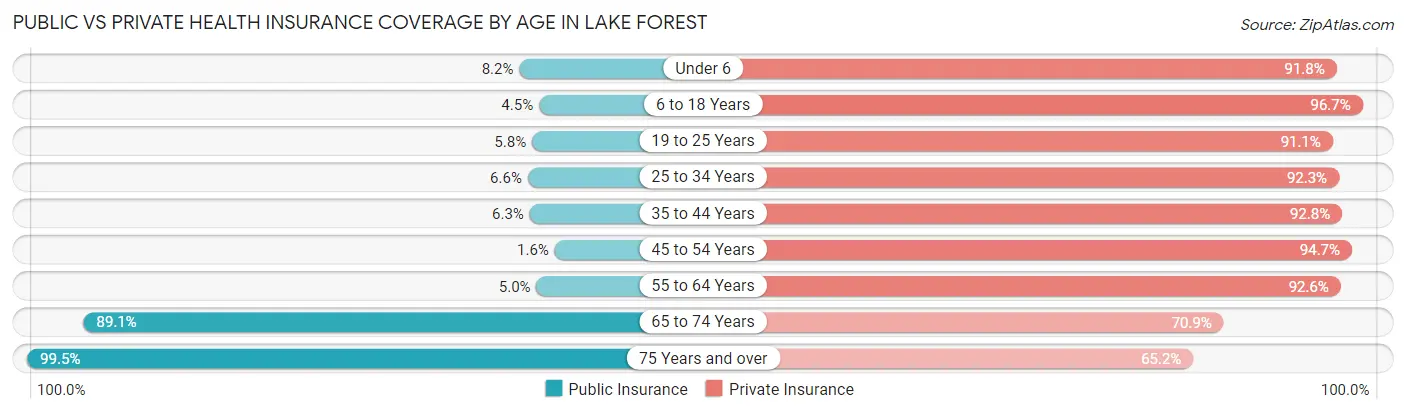
| Age Bracket | Public Insurance | Private Insurance |
| Under 6 | 82 (8.2%) | 922 (91.8%) |
| 6 to 18 Years | 153 (4.5%) | 3,275 (96.7%) |
| 19 to 25 Years | 127 (5.8%) | 1,988 (91.1%) |
| 25 to 34 Years | 100 (6.6%) | 1,397 (92.3%) |
| 35 to 44 Years | 103 (6.2%) | 1,530 (92.8%) |
| 45 to 54 Years | 39 (1.6%) | 2,290 (94.7%) |
| 55 to 64 Years | 127 (5.0%) | 2,351 (92.6%) |
| 65 to 74 Years | 2,080 (89.1%) | 1,655 (70.9%) |
| 75 Years and over | 2,295 (99.5%) | 1,504 (65.2%) |
| Total | 5,106 (26.4%) | 16,912 (87.5%) |
Disability Status by Sex by Age in Lake Forest
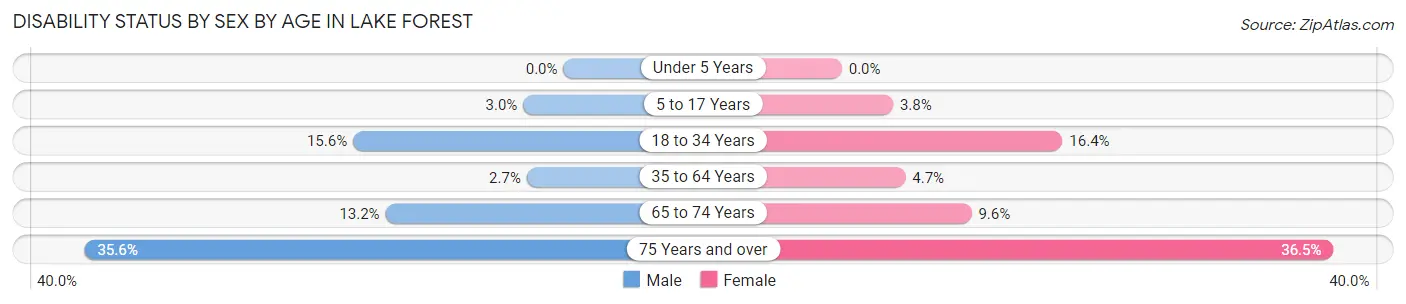
| Age Bracket | Male | Female |
| Under 5 Years | 0 (0.0%) | 0 (0.0%) |
| 5 to 17 Years | 49 (3.0%) | 53 (3.8%) |
| 18 to 34 Years | 338 (15.6%) | 331 (16.4%) |
| 35 to 64 Years | 86 (2.7%) | 163 (4.7%) |
| 65 to 74 Years | 137 (13.2%) | 125 (9.6%) |
| 75 Years and over | 321 (35.5%) | 512 (36.5%) |
Disability Class by Sex by Age in Lake Forest
Disability Class: Hearing Difficulty
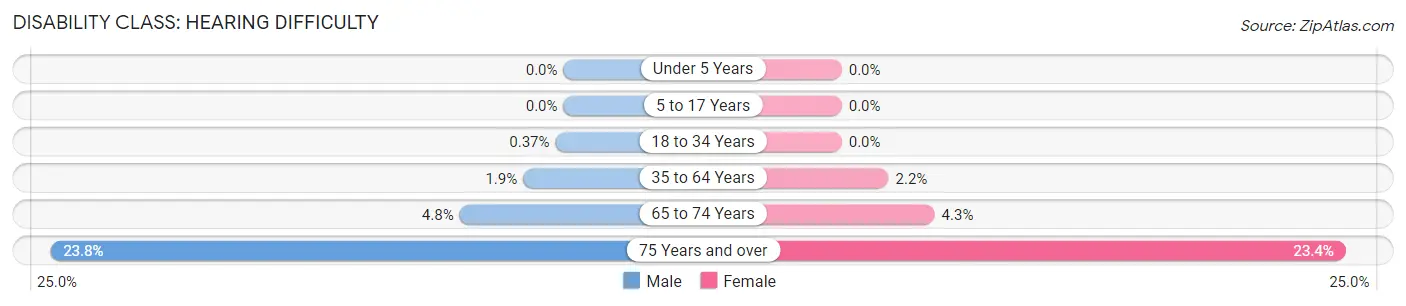
| Age Bracket | Male | Female |
| Under 5 Years | 0 (0.0%) | 0 (0.0%) |
| 5 to 17 Years | 0 (0.0%) | 0 (0.0%) |
| 18 to 34 Years | 8 (0.4%) | 0 (0.0%) |
| 35 to 64 Years | 59 (1.9%) | 75 (2.2%) |
| 65 to 74 Years | 50 (4.8%) | 56 (4.3%) |
| 75 Years and over | 215 (23.8%) | 328 (23.4%) |
Disability Class: Vision Difficulty
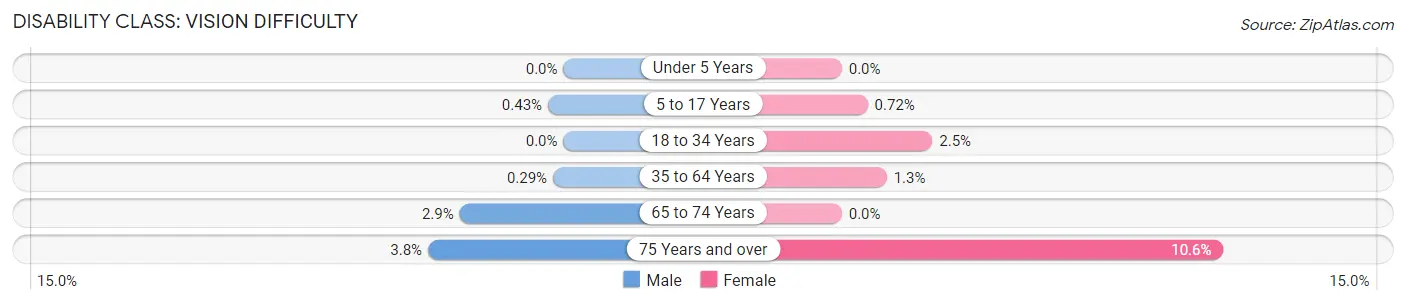
| Age Bracket | Male | Female |
| Under 5 Years | 0 (0.0%) | 0 (0.0%) |
| 5 to 17 Years | 7 (0.4%) | 10 (0.7%) |
| 18 to 34 Years | 0 (0.0%) | 51 (2.5%) |
| 35 to 64 Years | 9 (0.3%) | 43 (1.3%) |
| 65 to 74 Years | 30 (2.9%) | 0 (0.0%) |
| 75 Years and over | 34 (3.8%) | 149 (10.6%) |
Disability Class: Cognitive Difficulty
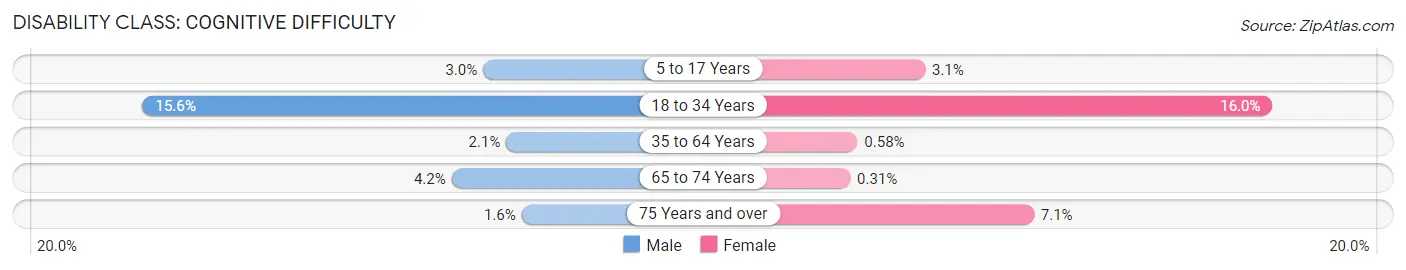
| Age Bracket | Male | Female |
| 5 to 17 Years | 49 (3.0%) | 43 (3.1%) |
| 18 to 34 Years | 338 (15.6%) | 323 (16.0%) |
| 35 to 64 Years | 67 (2.1%) | 20 (0.6%) |
| 65 to 74 Years | 43 (4.2%) | 4 (0.3%) |
| 75 Years and over | 14 (1.5%) | 100 (7.1%) |
Disability Class: Ambulatory Difficulty
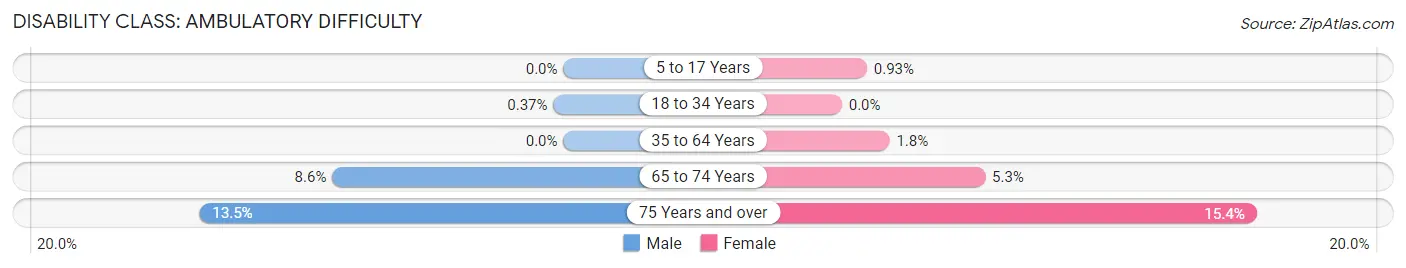
| Age Bracket | Male | Female |
| 5 to 17 Years | 0 (0.0%) | 13 (0.9%) |
| 18 to 34 Years | 8 (0.4%) | 0 (0.0%) |
| 35 to 64 Years | 0 (0.0%) | 61 (1.8%) |
| 65 to 74 Years | 89 (8.6%) | 69 (5.3%) |
| 75 Years and over | 122 (13.5%) | 216 (15.4%) |
Disability Class: Self-Care Difficulty
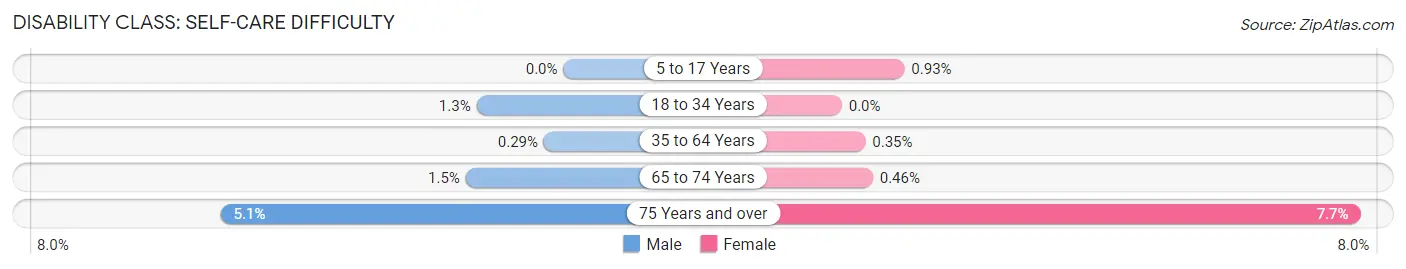
| Age Bracket | Male | Female |
| 5 to 17 Years | 0 (0.0%) | 13 (0.9%) |
| 18 to 34 Years | 28 (1.3%) | 0 (0.0%) |
| 35 to 64 Years | 9 (0.3%) | 12 (0.4%) |
| 65 to 74 Years | 15 (1.5%) | 6 (0.5%) |
| 75 Years and over | 46 (5.1%) | 108 (7.7%) |
Technology Access in Lake Forest
Computing Device Access in Lake Forest
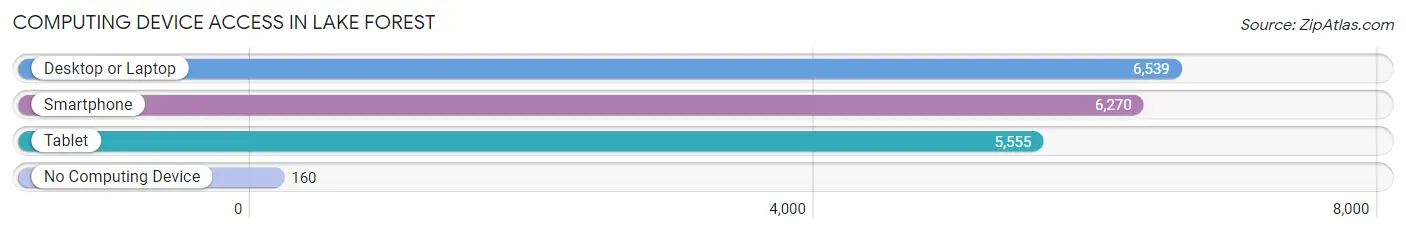
| Device Type | # Households | % Households |
| Desktop or Laptop | 6,539 | 94.0% |
| Smartphone | 6,270 | 90.1% |
| Tablet | 5,555 | 79.8% |
| No Computing Device | 160 | 2.3% |
| Total | 6,959 | 100.0% |
Internet Access in Lake Forest
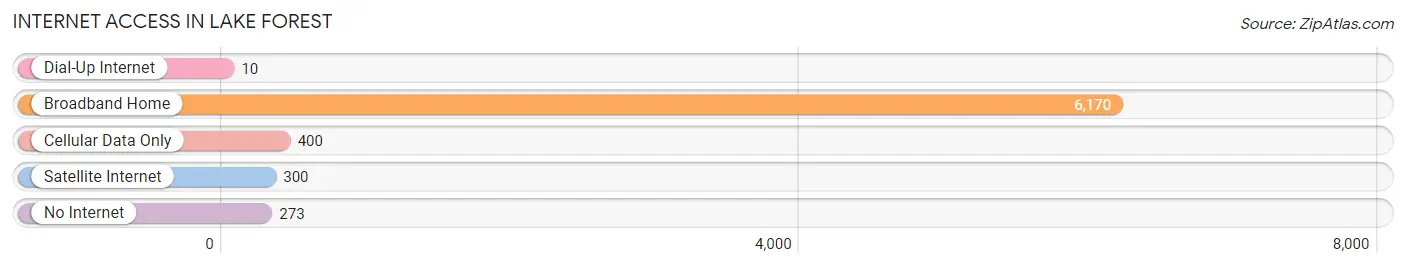
| Internet Type | # Households | % Households |
| Dial-Up Internet | 10 | 0.1% |
| Broadband Home | 6,170 | 88.7% |
| Cellular Data Only | 400 | 5.8% |
| Satellite Internet | 300 | 4.3% |
| No Internet | 273 | 3.9% |
| Total | 6,959 | 100.0% |
Lake Forest Summary
History
The city of Lake Forest, Illinois is located in Lake County, approximately 30 miles north of Chicago. It is a small city with a population of 19,375 as of the 2010 census. The city was founded in 1861 by a group of wealthy Chicagoans who wanted to create a rural retreat from the hustle and bustle of the city. The city was originally named Ela after the nearby Ela Creek, but was later changed to Lake Forest in 1857.
The city was designed to be a planned community with a focus on nature and the outdoors. The city was designed with wide streets, large lots, and plenty of green space. The city was also designed to be a commuter town, with easy access to Chicago via the Chicago and North Western Railway.
The city was home to many prominent Chicagoans, including the Wrigley family, who built their estate in Lake Forest in the late 19th century. The city was also home to the Lake Forest Academy, a prestigious private school, and the Lake Forest College, which was founded in 1857.
The city was also home to the Lake Forest Country Club, which was founded in 1895. The club was a popular destination for wealthy Chicagoans, and was the site of the first U.S. Open golf tournament in 1895.
The city was also home to the Lake Forest Symphony Orchestra, which was founded in 1891. The orchestra was one of the first professional symphony orchestras in the United States.
Geography
Lake Forest is located in Lake County, Illinois, approximately 30 miles north of Chicago. The city is situated on the western shore of Lake Michigan, and is bordered by the cities of Lake Bluff to the north, Libertyville to the east, and Lake Forest to the south. The city covers an area of 8.3 square miles, and has a population of 19,375 as of the 2010 census.
The city is located in a temperate climate zone, with hot summers and cold winters. The average temperature in the summer is around 75 degrees Fahrenheit, and the average temperature in the winter is around 25 degrees Fahrenheit. The city receives an average of 36 inches of precipitation per year.
Economy
The economy of Lake Forest is largely based on the service industry. The city is home to a number of corporate headquarters, including Tenneco, W.W. Grainger, and Brunswick Corporation. The city is also home to a number of retail stores, restaurants, and other businesses.
The city is also home to a number of educational institutions, including Lake Forest College, Lake Forest Academy, and the Lake Forest Graduate School of Management. The city is also home to a number of medical facilities, including Northwestern Lake Forest Hospital and Lake Forest Health and Fitness Center.
Demographics
As of the 2010 census, the population of Lake Forest was 19,375. The racial makeup of the city was 87.3% White, 4.2% African American, 0.3% Native American, 4.2% Asian, 0.1% Pacific Islander, 1.7% from other races, and 2.4% from two or more races. Hispanic or Latino of any race were 5.2% of the population.
The median income for a household in the city was $107,945, and the median income for a family was $133,945. The per capita income for the city was $58,945. About 4.2% of families and 5.7% of the population were below the poverty line, including 6.3% of those under age 18 and 4.2% of those age 65 or over.
Common Questions
What is Per Capita Income in Lake Forest?
Per Capita income in Lake Forest is $104,341.
What is the Median Family Income in Lake Forest?
Median Family Income in Lake Forest is $240,000.
What is the Median Household income in Lake Forest?
Median Household Income in Lake Forest is $202,153.
What is Income or Wage Gap in Lake Forest?
Income or Wage Gap in Lake Forest is 65.3%.
Women in Lake Forest earn 34.7 cents for every dollar earned by a man.
What is Inequality or Gini Index in Lake Forest?
Inequality or Gini Index in Lake Forest is 0.49.
What is the Total Population of Lake Forest?
Total Population of Lake Forest is 19,436.
What is the Total Male Population of Lake Forest?
Total Male Population of Lake Forest is 9,366.
What is the Total Female Population of Lake Forest?
Total Female Population of Lake Forest is 10,070.
What is the Ratio of Males per 100 Females in Lake Forest?
There are 93.01 Males per 100 Females in Lake Forest.
What is the Ratio of Females per 100 Males in Lake Forest?
There are 107.52 Females per 100 Males in Lake Forest.
What is the Median Population Age in Lake Forest?
Median Population Age in Lake Forest is 44.9 Years.
What is the Average Family Size in Lake Forest
Average Family Size in Lake Forest is 3.1 People.
What is the Average Household Size in Lake Forest
Average Household Size in Lake Forest is 2.6 People.
How Large is the Labor Force in Lake Forest?
There are 8,957 People in the Labor Forcein in Lake Forest.
What is the Percentage of People in the Labor Force in Lake Forest?
55.6% of People are in the Labor Force in Lake Forest.
What is the Unemployment Rate in Lake Forest?
Unemployment Rate in Lake Forest is 3.1%.