Kenilworth, IL Map & Demographics
Kenilworth Map
Kenilworth Overview
$137,263
PER CAPITA INCOME
$250,001
AVG FAMILY INCOME
$250,001
AVG HOUSEHOLD INCOME
85.2%
WAGE / INCOME GAP [ % ]
14.8¢/ $1
WAGE / INCOME GAP [ $ ]
0.48
INEQUALITY / GINI INDEX
2,537
TOTAL POPULATION
1,219
MALE POPULATION
1,318
FEMALE POPULATION
92.49
MALES / 100 FEMALES
108.12
FEMALES / 100 MALES
40.5
MEDIAN AGE
3.6
AVG FAMILY SIZE
3.2
AVG HOUSEHOLD SIZE
963
LABOR FORCE [ PEOPLE ]
56.5%
PERCENT IN LABOR FORCE
3.3%
UNEMPLOYMENT RATE
Kenilworth Zip Codes
Income in Kenilworth
Income Overview in Kenilworth
Per Capita Income in Kenilworth is $137,263, while median incomes of families and households are $250,001 and $250,001 respectively.
| Characteristic | Number | Measure |
| Per Capita Income | 2,537 | $137,263 |
| Median Family Income | 660 | $250,001 |
| Mean Family Income | 660 | $499,306 |
| Median Household Income | 789 | $250,001 |
| Mean Household Income | 789 | $437,822 |
| Income Deficit | 660 | $0 |
| Wage / Income Gap (%) | 2,537 | 85.19% |
| Wage / Income Gap ($) | 2,537 | 14.81¢ per $1 |
| Gini / Inequality Index | 2,537 | 0.48 |
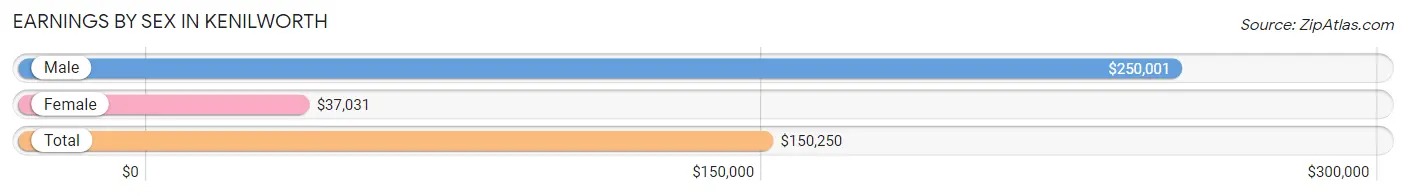
Earnings by Sex in Kenilworth
Average Earnings in Kenilworth are $150,250, $250,001 for men and $37,031 for women, a difference of 85.2%.
| Sex | Number | Average Earnings |
| Male | 576 (56.8%) | $250,001 |
| Female | 439 (43.2%) | $37,031 |
| Total | 1,015 (100.0%) | $150,250 |
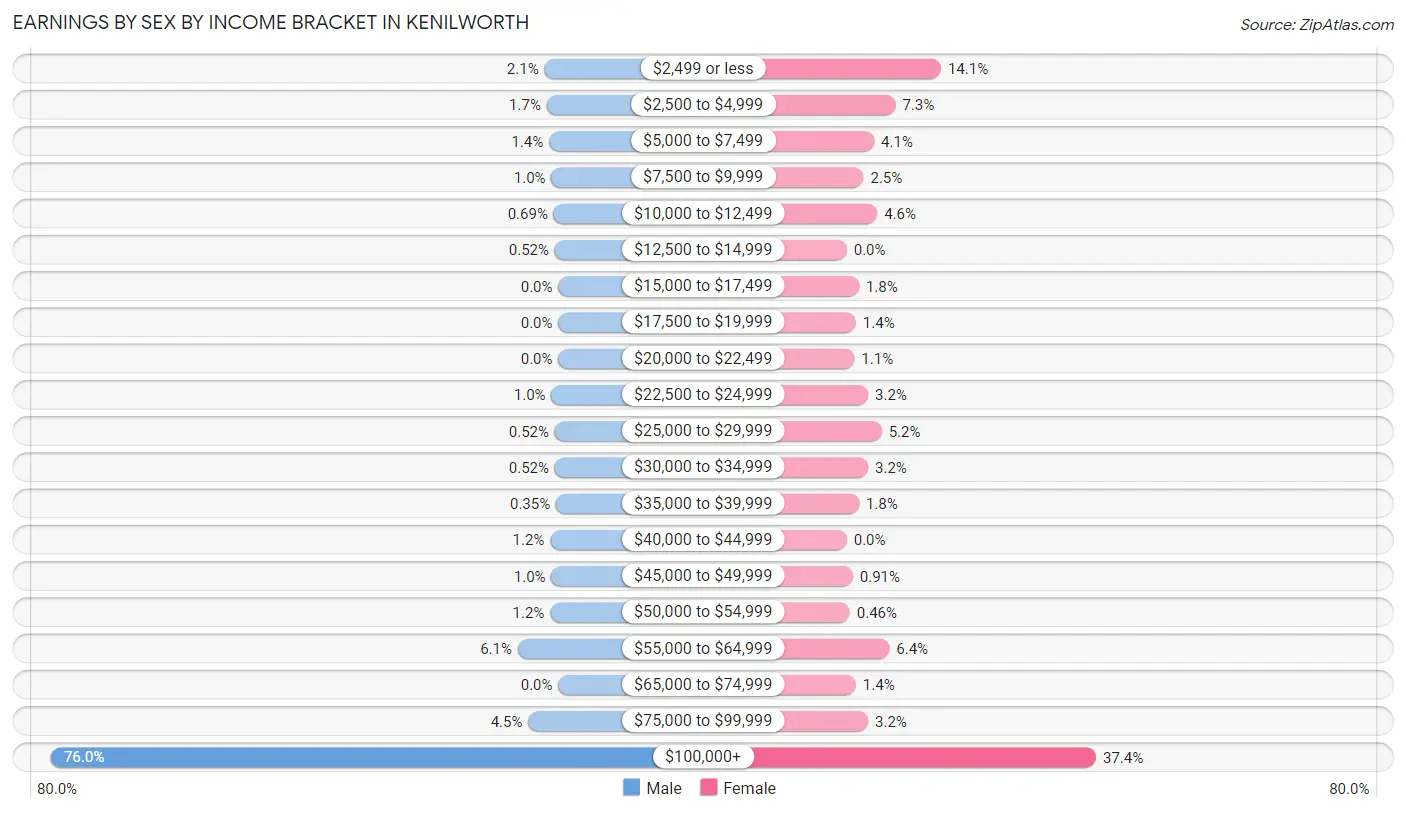
Earnings by Sex by Income Bracket in Kenilworth
The most common earnings brackets in Kenilworth are $100,000+ for men (438 | 76.0%) and $100,000+ for women (164 | 37.4%).
| Income | Male | Female |
| $2,499 or less | 12 (2.1%) | 62 (14.1%) |
| $2,500 to $4,999 | 10 (1.7%) | 32 (7.3%) |
| $5,000 to $7,499 | 8 (1.4%) | 18 (4.1%) |
| $7,500 to $9,999 | 6 (1.0%) | 11 (2.5%) |
| $10,000 to $12,499 | 4 (0.7%) | 20 (4.6%) |
| $12,500 to $14,999 | 3 (0.5%) | 0 (0.0%) |
| $15,000 to $17,499 | 0 (0.0%) | 8 (1.8%) |
| $17,500 to $19,999 | 0 (0.0%) | 6 (1.4%) |
| $20,000 to $22,499 | 0 (0.0%) | 5 (1.1%) |
| $22,500 to $24,999 | 6 (1.0%) | 14 (3.2%) |
| $25,000 to $29,999 | 3 (0.5%) | 23 (5.2%) |
| $30,000 to $34,999 | 3 (0.5%) | 14 (3.2%) |
| $35,000 to $39,999 | 2 (0.4%) | 8 (1.8%) |
| $40,000 to $44,999 | 7 (1.2%) | 0 (0.0%) |
| $45,000 to $49,999 | 6 (1.0%) | 4 (0.9%) |
| $50,000 to $54,999 | 7 (1.2%) | 2 (0.5%) |
| $55,000 to $64,999 | 35 (6.1%) | 28 (6.4%) |
| $65,000 to $74,999 | 0 (0.0%) | 6 (1.4%) |
| $75,000 to $99,999 | 26 (4.5%) | 14 (3.2%) |
| $100,000+ | 438 (76.0%) | 164 (37.4%) |
| Total | 576 (100.0%) | 439 (100.0%) |
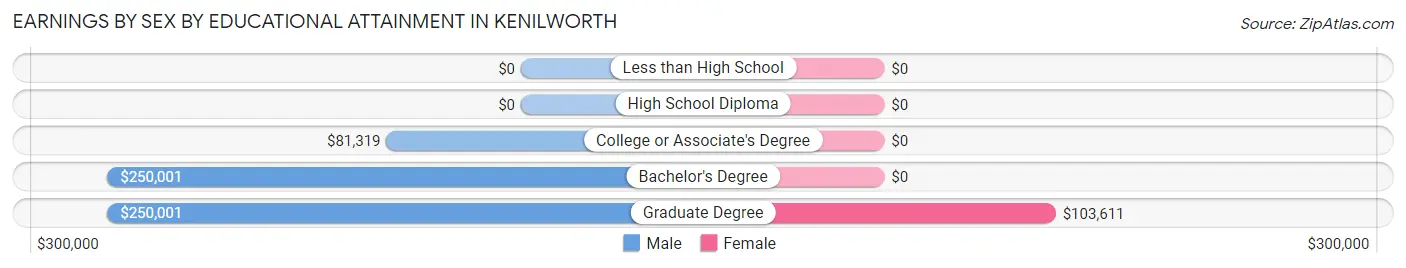
Earnings by Sex by Educational Attainment in Kenilworth
Average earnings in Kenilworth are $250,001 for men and $64,063 for women, a difference of 74.4%. Men with an educational attainment of bachelor's degree enjoy the highest average annual earnings of $250,001, while those with college or associate's degree education earn the least with $81,319. Women with an educational attainment of graduate degree earn the most with the average annual earnings of $103,611, while those with graduate degree education have the smallest earnings of $103,611.
| Educational Attainment | Male Income | Female Income |
| Less than High School | - | - |
| High School Diploma | - | - |
| College or Associate's Degree | $81,319 | $0 |
| Bachelor's Degree | $250,001 | $0 |
| Graduate Degree | $250,001 | $103,611 |
| Total | $250,001 | $64,063 |
Family Income in Kenilworth
Family Income Brackets in Kenilworth
According to the Kenilworth family income data, there are 469 families falling into the $200,000+ income range, which is the most common income bracket and makes up 71.1% of all families.
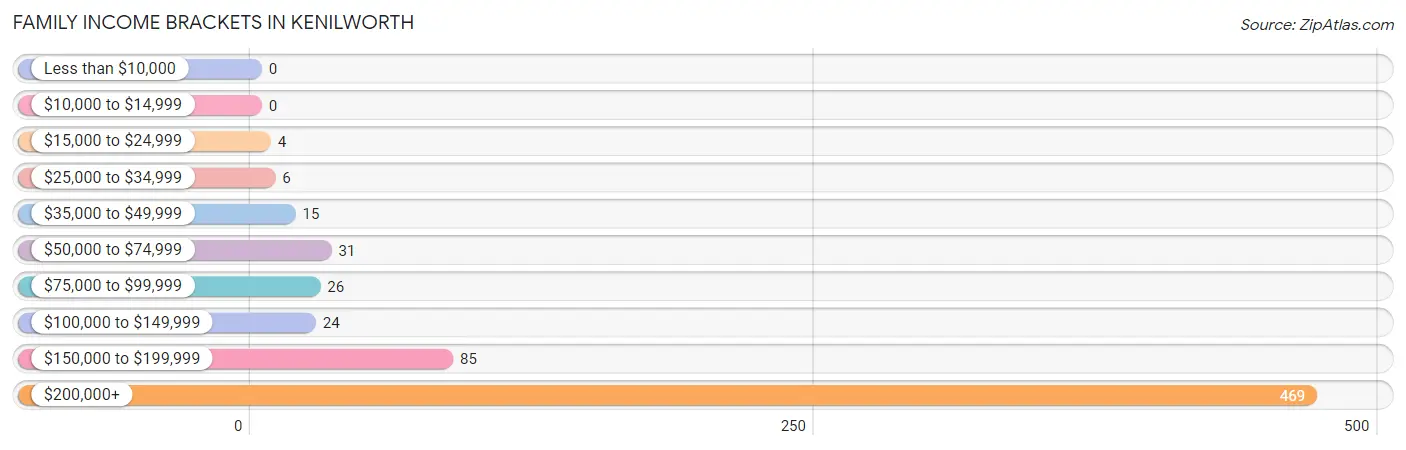
| Income Bracket | # Families | % Families |
| Less than $10,000 | 0 | 0.0% |
| $10,000 to $14,999 | 0 | 0.0% |
| $15,000 to $24,999 | 4 | 0.6% |
| $25,000 to $34,999 | 6 | 0.9% |
| $35,000 to $49,999 | 15 | 2.3% |
| $50,000 to $74,999 | 31 | 4.7% |
| $75,000 to $99,999 | 26 | 3.9% |
| $100,000 to $149,999 | 24 | 3.6% |
| $150,000 to $199,999 | 85 | 12.9% |
| $200,000+ | 469 | 71.1% |
Family Income by Famaliy Size in Kenilworth
3-person families (108 | 16.4%) account for the highest median family income in Kenilworth with $250,001 per family, while 2-person families (223 | 33.8%) have the highest median income of $96,875 per family member.
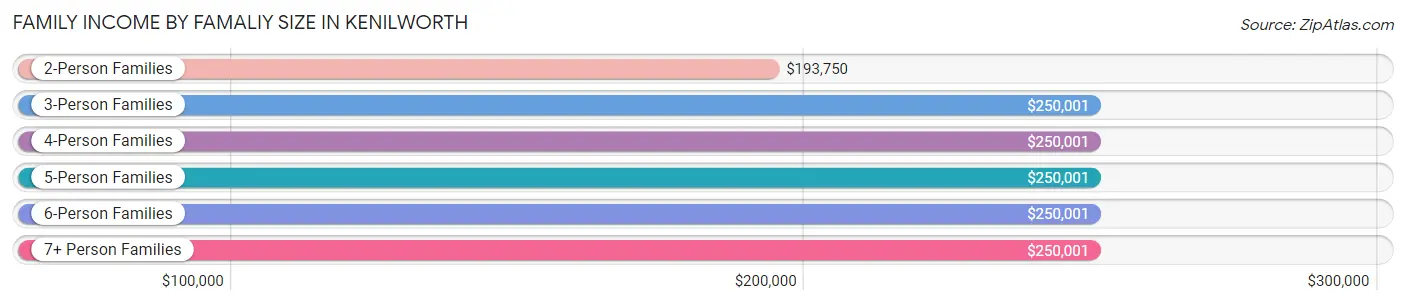
| Income Bracket | # Families | Median Income |
| 2-Person Families | 223 (33.8%) | $193,750 |
| 3-Person Families | 108 (16.4%) | $250,001 |
| 4-Person Families | 148 (22.4%) | $250,001 |
| 5-Person Families | 154 (23.3%) | $250,001 |
| 6-Person Families | 14 (2.1%) | $250,001 |
| 7+ Person Families | 13 (2.0%) | $250,001 |
| Total | 660 (100.0%) | $250,001 |
Family Income by Number of Earners in Kenilworth
The median family income in Kenilworth is $250,001, with families comprising 1 earner (255) having the highest median family income of $250,001, while families with no earners (98) have the lowest median family income of $243,611, accounting for 38.6% and 14.8% of families, respectively.
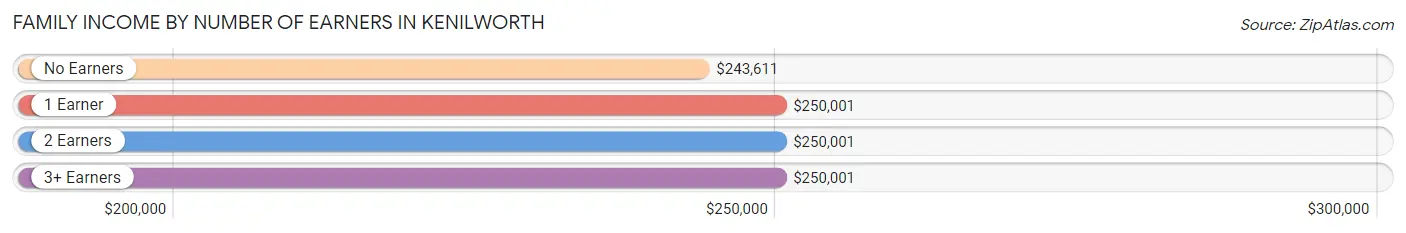
| Number of Earners | # Families | Median Income |
| No Earners | 98 (14.8%) | $243,611 |
| 1 Earner | 255 (38.6%) | $250,001 |
| 2 Earners | 266 (40.3%) | $250,001 |
| 3+ Earners | 41 (6.2%) | $250,001 |
| Total | 660 (100.0%) | $250,001 |
Household Income in Kenilworth
Household Income Brackets in Kenilworth
With 496 households falling in the category, the $200,000+ income range is the most frequent in Kenilworth, accounting for 62.9% of all households.
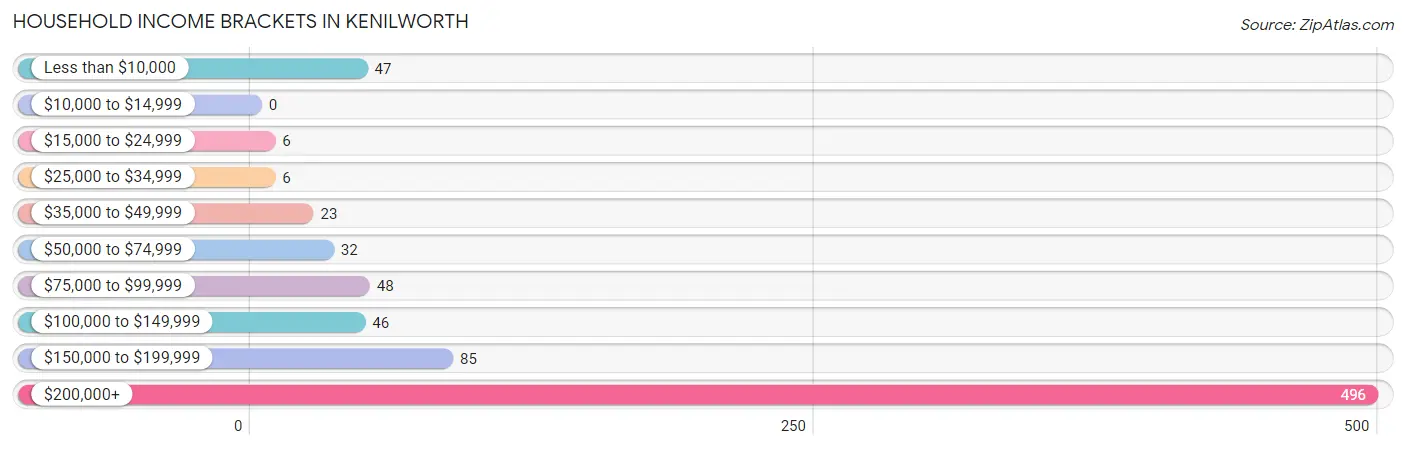
| Income Bracket | # Households | % Households |
| Less than $10,000 | 47 | 6.0% |
| $10,000 to $14,999 | 0 | 0.0% |
| $15,000 to $24,999 | 6 | 0.8% |
| $25,000 to $34,999 | 6 | 0.8% |
| $35,000 to $49,999 | 23 | 2.9% |
| $50,000 to $74,999 | 32 | 4.1% |
| $75,000 to $99,999 | 48 | 6.1% |
| $100,000 to $149,999 | 46 | 5.8% |
| $150,000 to $199,999 | 85 | 10.8% |
| $200,000+ | 496 | 62.9% |
Household Income by Householder Age in Kenilworth
The median household income in Kenilworth is $250,001, with the highest median household income of $250,001 found in the 25 to 44 years age bracket for the primary householder. A total of 187 households (23.7%) fall into this category.
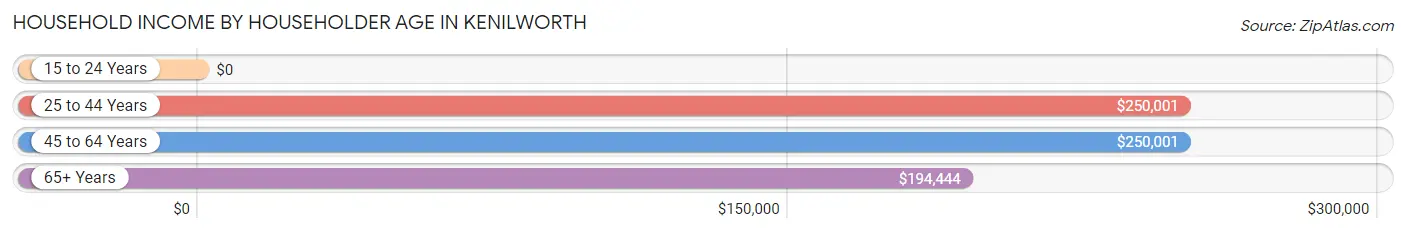
| Income Bracket | # Households | Median Income |
| 15 to 24 Years | 0 (0.0%) | $0 |
| 25 to 44 Years | 187 (23.7%) | $250,001 |
| 45 to 64 Years | 402 (50.9%) | $250,001 |
| 65+ Years | 200 (25.4%) | $194,444 |
| Total | 789 (100.0%) | $250,001 |
Poverty in Kenilworth
Income Below Poverty by Sex and Age in Kenilworth
With 0.6% poverty level for males and 5.6% for females among the residents of Kenilworth, 75 year old and over males and 18 to 24 year old females are the most vulnerable to poverty, with 4 males (6.8%) and 24 females (29.3%) in their respective age groups living below the poverty level.
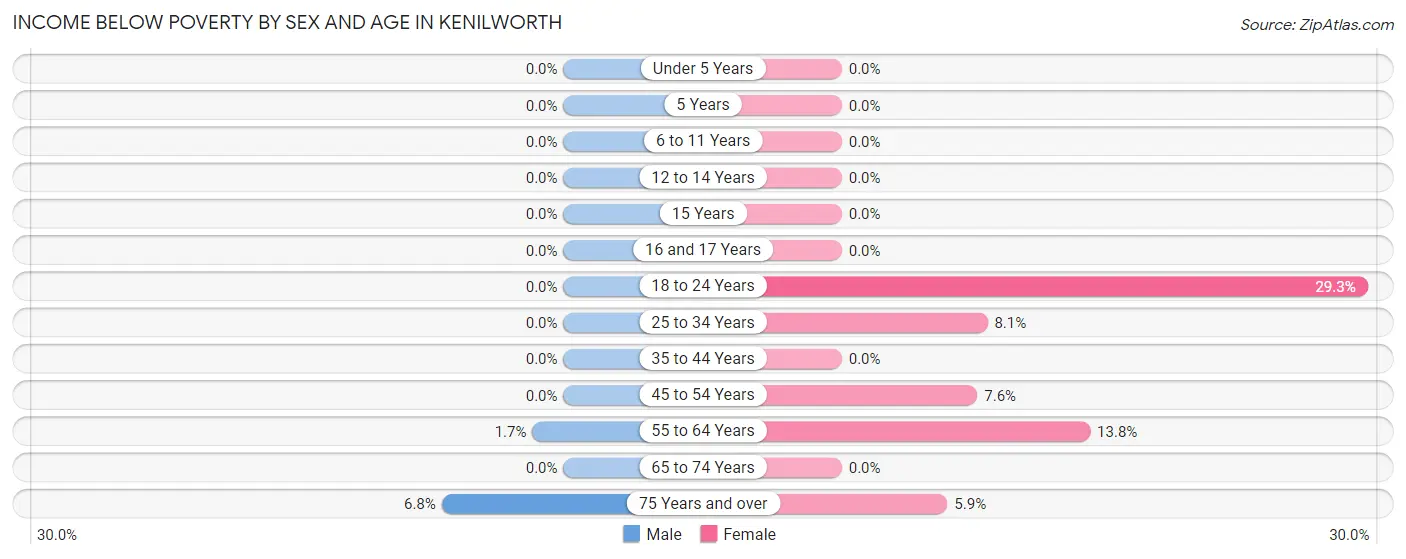
| Age Bracket | Male | Female |
| Under 5 Years | 0 (0.0%) | 0 (0.0%) |
| 5 Years | 0 (0.0%) | 0 (0.0%) |
| 6 to 11 Years | 0 (0.0%) | 0 (0.0%) |
| 12 to 14 Years | 0 (0.0%) | 0 (0.0%) |
| 15 Years | 0 (0.0%) | 0 (0.0%) |
| 16 and 17 Years | 0 (0.0%) | 0 (0.0%) |
| 18 to 24 Years | 0 (0.0%) | 24 (29.3%) |
| 25 to 34 Years | 0 (0.0%) | 3 (8.1%) |
| 35 to 44 Years | 0 (0.0%) | 0 (0.0%) |
| 45 to 54 Years | 0 (0.0%) | 16 (7.5%) |
| 55 to 64 Years | 3 (1.7%) | 26 (13.8%) |
| 65 to 74 Years | 0 (0.0%) | 0 (0.0%) |
| 75 Years and over | 4 (6.8%) | 5 (5.9%) |
| Total | 7 (0.6%) | 74 (5.6%) |
Income Above Poverty by Sex and Age in Kenilworth
According to the poverty statistics in Kenilworth, males aged under 5 years and females aged under 5 years are the age groups that are most secure financially, with 100.0% of males and 100.0% of females in these age groups living above the poverty line.
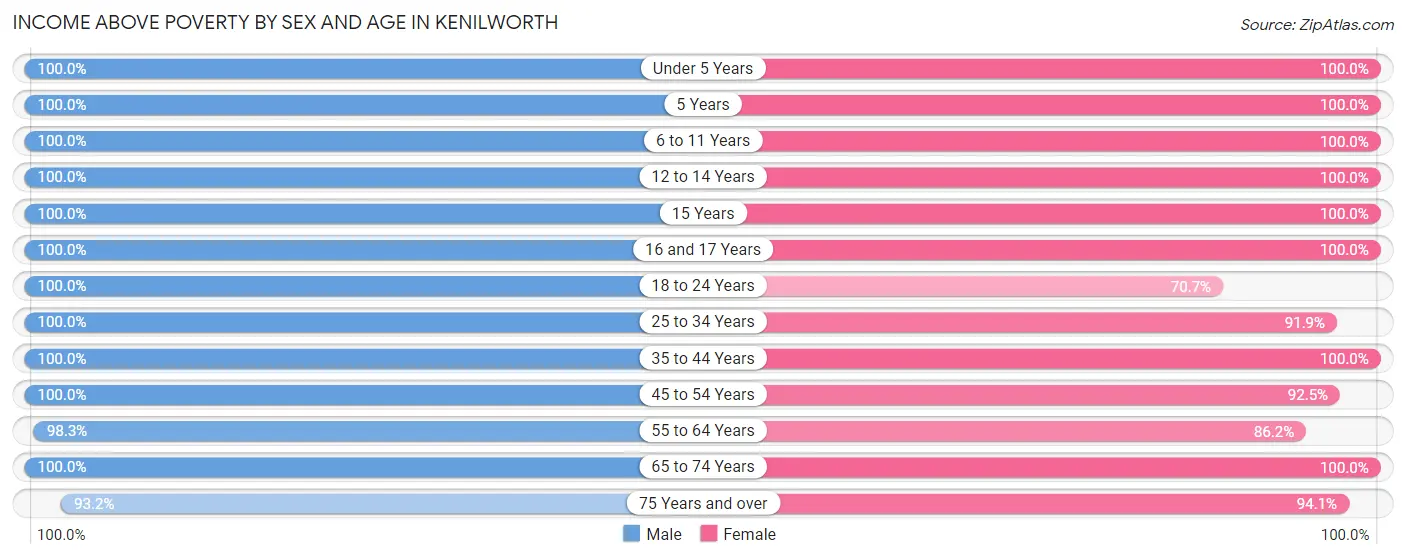
| Age Bracket | Male | Female |
| Under 5 Years | 62 (100.0%) | 157 (100.0%) |
| 5 Years | 20 (100.0%) | 3 (100.0%) |
| 6 to 11 Years | 192 (100.0%) | 187 (100.0%) |
| 12 to 14 Years | 131 (100.0%) | 61 (100.0%) |
| 15 Years | 8 (100.0%) | 11 (100.0%) |
| 16 and 17 Years | 51 (100.0%) | 33 (100.0%) |
| 18 to 24 Years | 64 (100.0%) | 58 (70.7%) |
| 25 to 34 Years | 34 (100.0%) | 34 (91.9%) |
| 35 to 44 Years | 142 (100.0%) | 168 (100.0%) |
| 45 to 54 Years | 180 (100.0%) | 196 (92.4%) |
| 55 to 64 Years | 170 (98.3%) | 162 (86.2%) |
| 65 to 74 Years | 103 (100.0%) | 94 (100.0%) |
| 75 Years and over | 55 (93.2%) | 80 (94.1%) |
| Total | 1,212 (99.4%) | 1,244 (94.4%) |
Income Below Poverty Among Married-Couple Families in Kenilworth
The poverty statistics for married-couple families in Kenilworth show that 0.7% or 4 of the total 605 families live below the poverty line. Families with no children have the highest poverty rate of 1.6%, comprising of 4 families. On the other hand, families with 1 or 2 children have the lowest poverty rate of 0.0%, which includes 0 families.
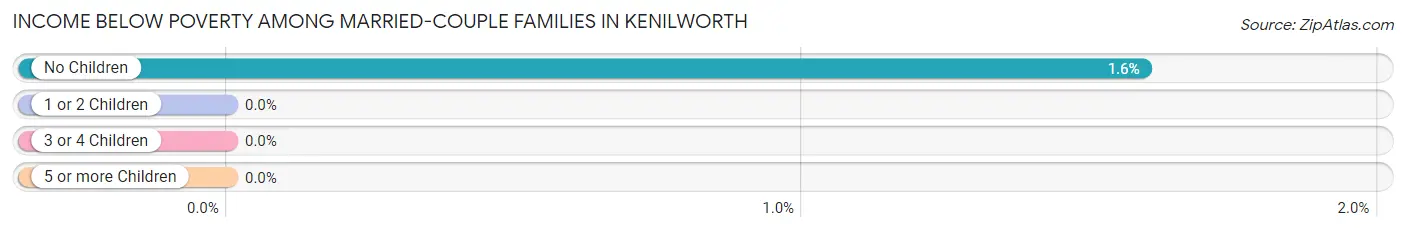
| Children | Above Poverty | Below Poverty |
| No Children | 248 (98.4%) | 4 (1.6%) |
| 1 or 2 Children | 188 (100.0%) | 0 (0.0%) |
| 3 or 4 Children | 162 (100.0%) | 0 (0.0%) |
| 5 or more Children | 3 (100.0%) | 0 (0.0%) |
| Total | 601 (99.3%) | 4 (0.7%) |
Income Below Poverty Among Single-Parent Households in Kenilworth
| Children | Single Father | Single Mother |
| No Children | 0 (0.0%) | 0 (0.0%) |
| 1 or 2 Children | 0 (0.0%) | 0 (0.0%) |
| 3 or 4 Children | 0 (0.0%) | 0 (0.0%) |
| 5 or more Children | 0 (0.0%) | 0 (0.0%) |
| Total | 0 (0.0%) | 0 (0.0%) |
Income Below Poverty Among Married-Couple vs Single-Parent Households in Kenilworth
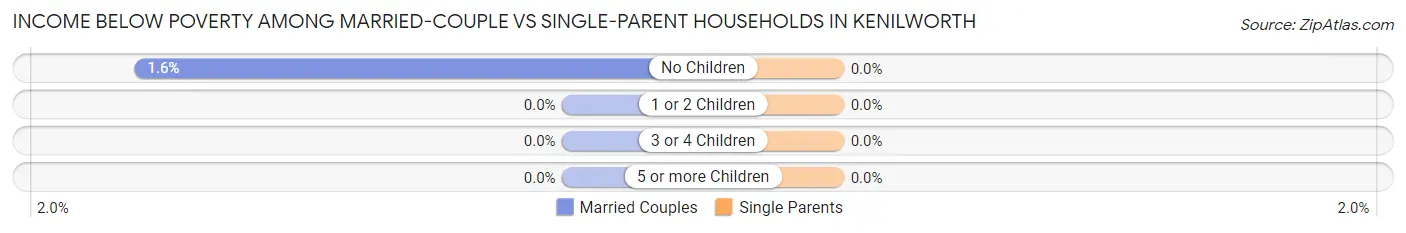
| Children | Married-Couple Families | Single-Parent Households |
| No Children | 4 (1.6%) | 0 (0.0%) |
| 1 or 2 Children | 0 (0.0%) | 0 (0.0%) |
| 3 or 4 Children | 0 (0.0%) | 0 (0.0%) |
| 5 or more Children | 0 (0.0%) | 0 (0.0%) |
| Total | 4 (0.7%) | 0 (0.0%) |
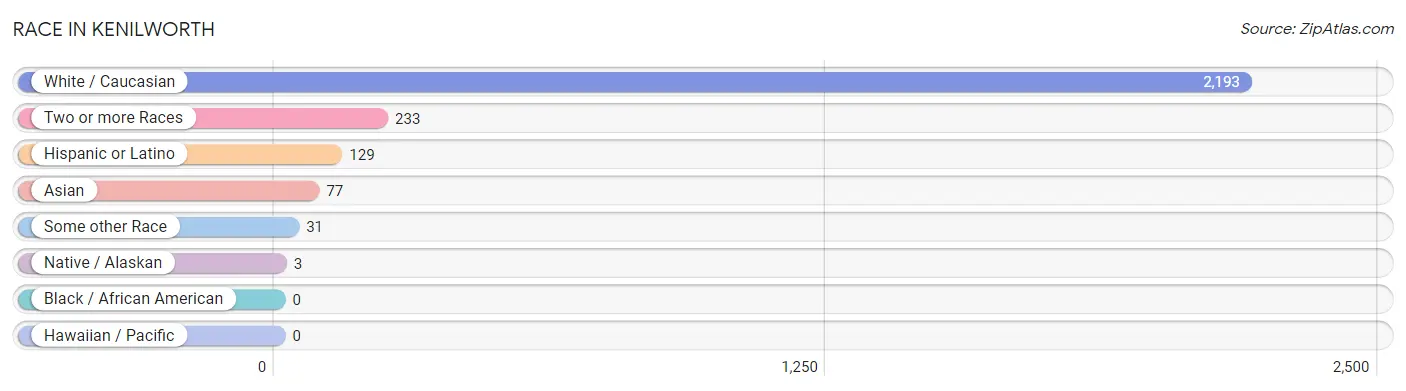
Race in Kenilworth
The most populous races in Kenilworth are White / Caucasian (2,193 | 86.4%), Two or more Races (233 | 9.2%), and Hispanic or Latino (129 | 5.1%).
| Race | # Population | % Population |
| Asian | 77 | 3.0% |
| Black / African American | 0 | 0.0% |
| Hawaiian / Pacific | 0 | 0.0% |
| Hispanic or Latino | 129 | 5.1% |
| Native / Alaskan | 3 | 0.1% |
| White / Caucasian | 2,193 | 86.4% |
| Two or more Races | 233 | 9.2% |
| Some other Race | 31 | 1.2% |
| Total | 2,537 | 100.0% |
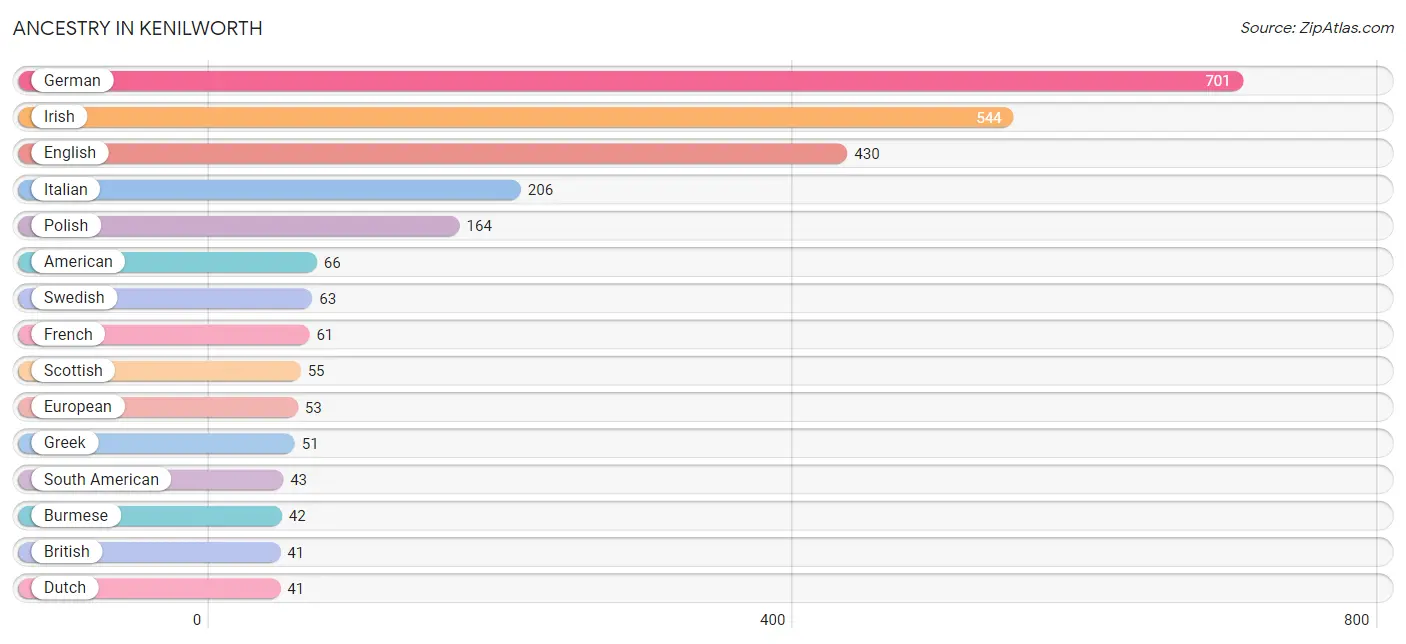
Ancestry in Kenilworth
The most populous ancestries reported in Kenilworth are German (701 | 27.6%), Irish (544 | 21.4%), English (430 | 17.0%), Italian (206 | 8.1%), and Polish (164 | 6.5%), together accounting for 80.6% of all Kenilworth residents.
| Ancestry | # Population | % Population |
| American | 66 | 2.6% |
| Arab | 26 | 1.0% |
| Argentinean | 20 | 0.8% |
| Austrian | 10 | 0.4% |
| Belgian | 6 | 0.2% |
| Bhutanese | 25 | 1.0% |
| British | 41 | 1.6% |
| Bulgarian | 12 | 0.5% |
| Burmese | 42 | 1.7% |
| Canadian | 9 | 0.4% |
| Central American | 18 | 0.7% |
| Central American Indian | 5 | 0.2% |
| Cherokee | 2 | 0.1% |
| Costa Rican | 18 | 0.7% |
| Croatian | 9 | 0.4% |
| Cuban | 9 | 0.4% |
| Czech | 27 | 1.1% |
| Czechoslovakian | 11 | 0.4% |
| Danish | 2 | 0.1% |
| Dutch | 41 | 1.6% |
| Eastern European | 7 | 0.3% |
| English | 430 | 17.0% |
| European | 53 | 2.1% |
| French | 61 | 2.4% |
| French Canadian | 12 | 0.5% |
| German | 701 | 27.6% |
| Greek | 51 | 2.0% |
| Hungarian | 38 | 1.5% |
| Indian (Asian) | 37 | 1.5% |
| Iranian | 5 | 0.2% |
| Irish | 544 | 21.4% |
| Italian | 206 | 8.1% |
| Jordanian | 2 | 0.1% |
| Lithuanian | 9 | 0.4% |
| Macedonian | 4 | 0.2% |
| Mexican | 38 | 1.5% |
| Northern European | 17 | 0.7% |
| Norwegian | 39 | 1.5% |
| Peruvian | 23 | 0.9% |
| Polish | 164 | 6.5% |
| Portuguese | 18 | 0.7% |
| Puerto Rican | 21 | 0.8% |
| Russian | 10 | 0.4% |
| Scandinavian | 24 | 0.9% |
| Scotch-Irish | 4 | 0.2% |
| Scottish | 55 | 2.2% |
| Slovene | 4 | 0.2% |
| South American | 43 | 1.7% |
| Swedish | 63 | 2.5% |
| Swiss | 10 | 0.4% |
| Thai | 30 | 1.2% |
| Turkish | 37 | 1.5% |
| Ukrainian | 15 | 0.6% |
| Welsh | 10 | 0.4% | View All 54 Rows |
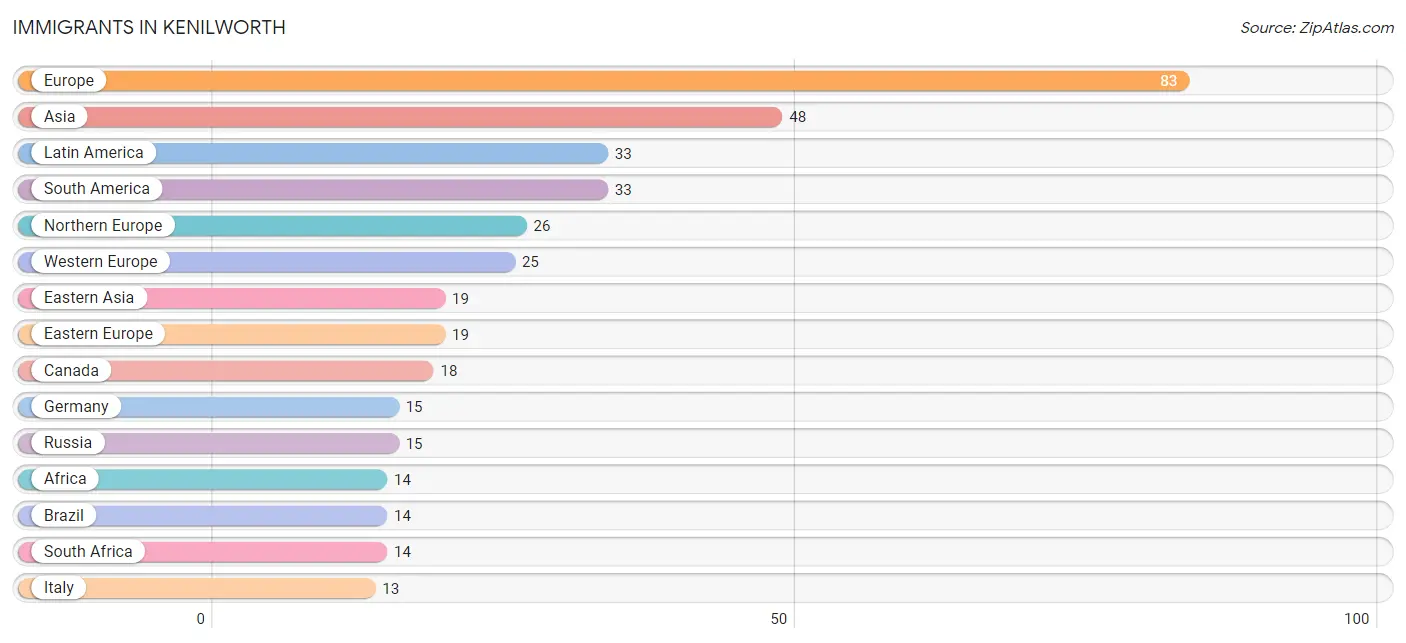
Immigrants in Kenilworth
The most numerous immigrant groups reported in Kenilworth came from Europe (83 | 3.3%), Asia (48 | 1.9%), Latin America (33 | 1.3%), South America (33 | 1.3%), and Northern Europe (26 | 1.0%), together accounting for 8.8% of all Kenilworth residents.
| Immigration Origin | # Population | % Population |
| Africa | 14 | 0.5% |
| Argentina | 4 | 0.2% |
| Asia | 48 | 1.9% |
| Austria | 3 | 0.1% |
| Brazil | 14 | 0.5% |
| Bulgaria | 4 | 0.2% |
| Canada | 18 | 0.7% |
| China | 9 | 0.4% |
| Eastern Asia | 19 | 0.7% |
| Eastern Europe | 19 | 0.7% |
| Ecuador | 2 | 0.1% |
| England | 8 | 0.3% |
| Europe | 83 | 3.3% |
| France | 4 | 0.2% |
| Germany | 15 | 0.6% |
| Iran | 4 | 0.2% |
| Ireland | 5 | 0.2% |
| Israel | 7 | 0.3% |
| Italy | 13 | 0.5% |
| Jordan | 2 | 0.1% |
| Korea | 10 | 0.4% |
| Latin America | 33 | 1.3% |
| Northern Europe | 26 | 1.0% |
| Peru | 13 | 0.5% |
| Russia | 15 | 0.6% |
| South Africa | 14 | 0.5% |
| South America | 33 | 1.3% |
| South Central Asia | 4 | 0.2% |
| South Eastern Asia | 7 | 0.3% |
| Southern Europe | 13 | 0.5% |
| Sweden | 7 | 0.3% |
| Switzerland | 3 | 0.1% |
| Thailand | 7 | 0.3% |
| Western Asia | 9 | 0.4% |
| Western Europe | 25 | 1.0% | View All 35 Rows |
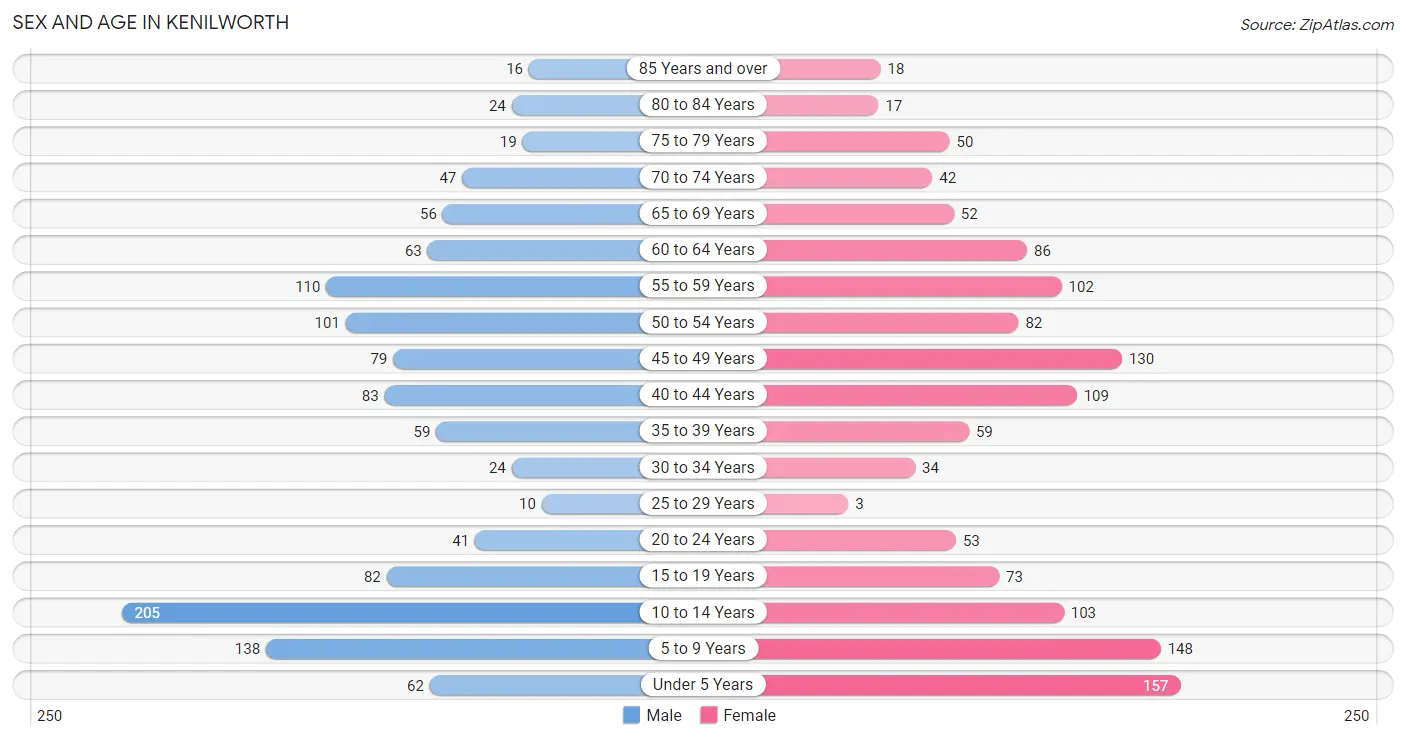
Sex and Age in Kenilworth
Sex and Age in Kenilworth
The most populous age groups in Kenilworth are 10 to 14 Years (205 | 16.8%) for men and Under 5 Years (157 | 11.9%) for women.
| Age Bracket | Male | Female |
| Under 5 Years | 62 (5.1%) | 157 (11.9%) |
| 5 to 9 Years | 138 (11.3%) | 148 (11.2%) |
| 10 to 14 Years | 205 (16.8%) | 103 (7.8%) |
| 15 to 19 Years | 82 (6.7%) | 73 (5.5%) |
| 20 to 24 Years | 41 (3.4%) | 53 (4.0%) |
| 25 to 29 Years | 10 (0.8%) | 3 (0.2%) |
| 30 to 34 Years | 24 (2.0%) | 34 (2.6%) |
| 35 to 39 Years | 59 (4.8%) | 59 (4.5%) |
| 40 to 44 Years | 83 (6.8%) | 109 (8.3%) |
| 45 to 49 Years | 79 (6.5%) | 130 (9.9%) |
| 50 to 54 Years | 101 (8.3%) | 82 (6.2%) |
| 55 to 59 Years | 110 (9.0%) | 102 (7.7%) |
| 60 to 64 Years | 63 (5.2%) | 86 (6.5%) |
| 65 to 69 Years | 56 (4.6%) | 52 (4.0%) |
| 70 to 74 Years | 47 (3.9%) | 42 (3.2%) |
| 75 to 79 Years | 19 (1.6%) | 50 (3.8%) |
| 80 to 84 Years | 24 (2.0%) | 17 (1.3%) |
| 85 Years and over | 16 (1.3%) | 18 (1.4%) |
| Total | 1,219 (100.0%) | 1,318 (100.0%) |
Families and Households in Kenilworth
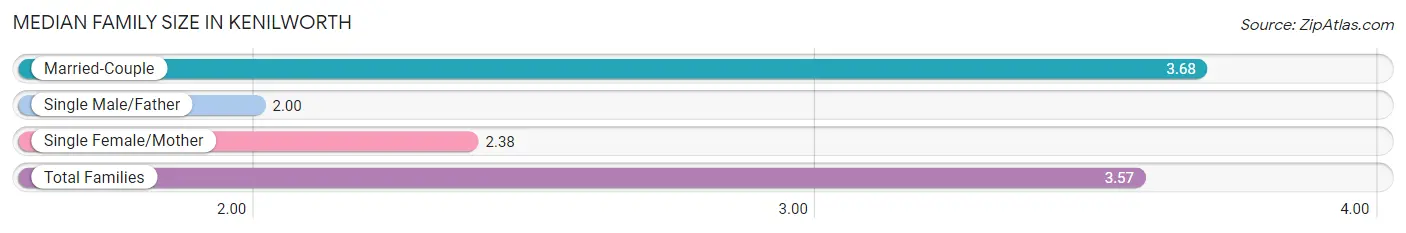
Median Family Size in Kenilworth
The median family size in Kenilworth is 3.57 persons per family, with married-couple families (605 | 91.7%) accounting for the largest median family size of 3.68 persons per family. On the other hand, single male/father families (3 | 0.4%) represent the smallest median family size with 2.00 persons per family.
| Family Type | # Families | Family Size |
| Married-Couple | 605 (91.7%) | 3.68 |
| Single Male/Father | 3 (0.4%) | 2.00 |
| Single Female/Mother | 52 (7.9%) | 2.38 |
| Total Families | 660 (100.0%) | 3.57 |
Median Household Size in Kenilworth
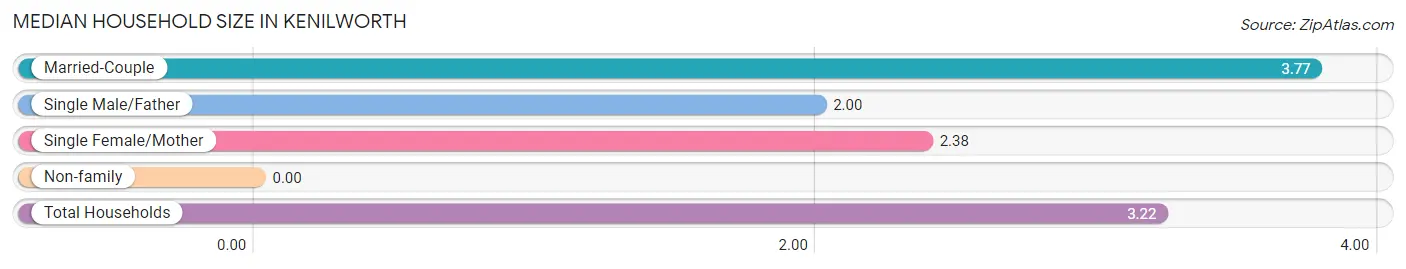
| Household Type | # Households | Household Size |
| Married-Couple | 605 (76.7%) | 3.77 |
| Single Male/Father | 3 (0.4%) | 2.00 |
| Single Female/Mother | 52 (6.6%) | 2.38 |
| Non-family | 129 (16.4%) | - |
| Total Households | 789 (100.0%) | 3.22 |
Household Size by Marriage Status in Kenilworth
Out of a total of 789 households in Kenilworth, 660 (83.7%) are family households, while 129 (16.4%) are nonfamily households. The most numerous type of family households are 2-person households, comprising 223, and the most common type of nonfamily households are 1-person households, comprising 129.
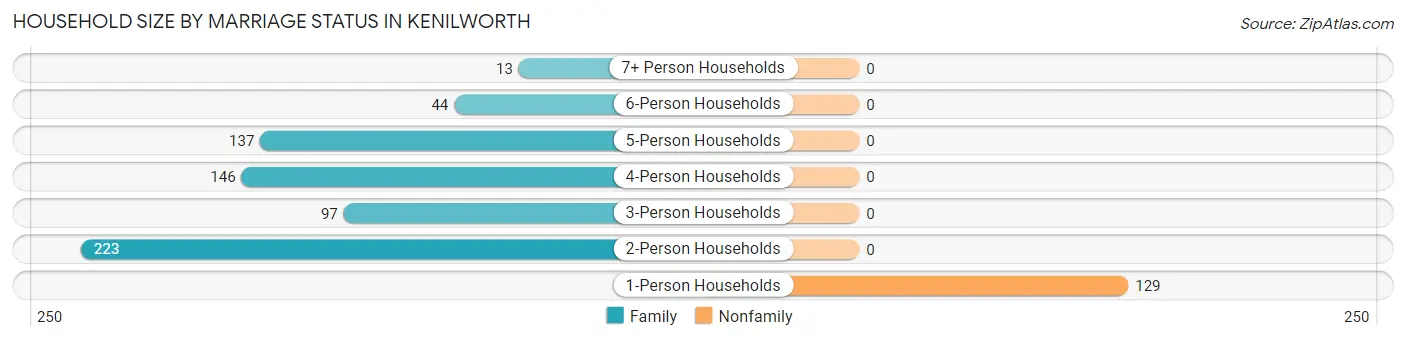
| Household Size | Family Households | Nonfamily Households |
| 1-Person Households | - | 129 (16.4%) |
| 2-Person Households | 223 (28.3%) | 0 (0.0%) |
| 3-Person Households | 97 (12.3%) | 0 (0.0%) |
| 4-Person Households | 146 (18.5%) | 0 (0.0%) |
| 5-Person Households | 137 (17.4%) | 0 (0.0%) |
| 6-Person Households | 44 (5.6%) | 0 (0.0%) |
| 7+ Person Households | 13 (1.7%) | 0 (0.0%) |
| Total | 660 (83.7%) | 129 (16.4%) |
Female Fertility in Kenilworth
Fertility by Age in Kenilworth
Average fertility rate in Kenilworth is 40.0 births per 1,000 women. Women in the age bracket of 20 to 34 years have the highest fertility rate with 122.0 births per 1,000 women. Women in the age bracket of 20 to 34 years acount for 57.9% of all women with births.
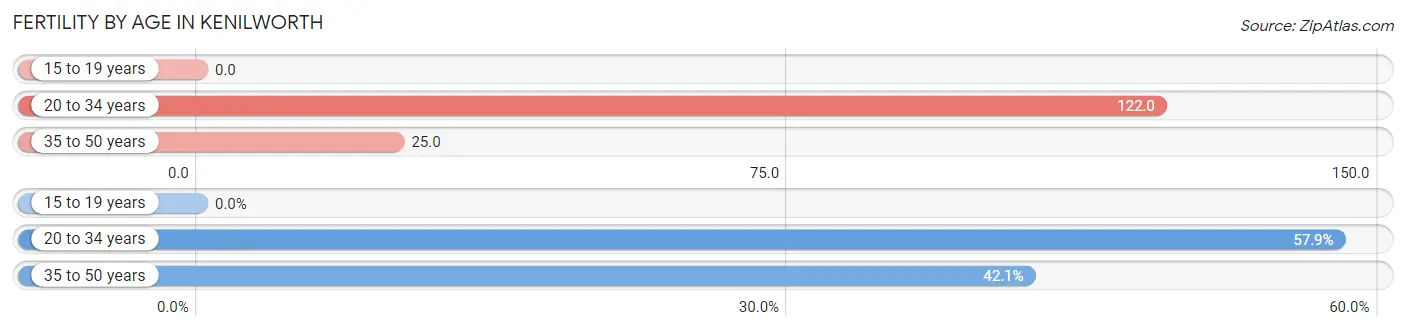
| Age Bracket | Women with Births | Births / 1,000 Women |
| 15 to 19 years | 0 (0.0%) | 0.0 |
| 20 to 34 years | 11 (57.9%) | 122.0 |
| 35 to 50 years | 8 (42.1%) | 25.0 |
| Total | 19 (100.0%) | 40.0 |
Fertility by Age by Marriage Status in Kenilworth
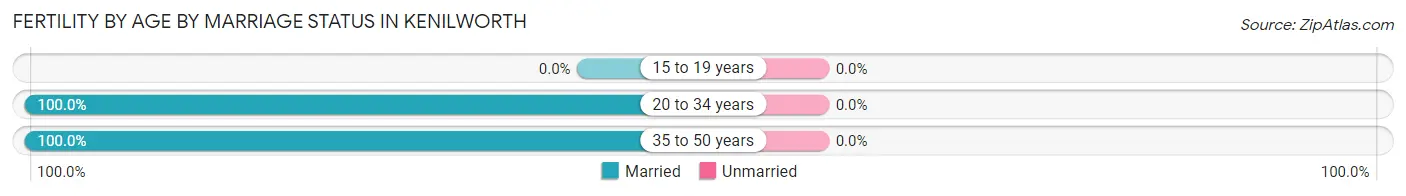
| Age Bracket | Married | Unmarried |
| 15 to 19 years | 0 (0.0%) | 0 (0.0%) |
| 20 to 34 years | 11 (100.0%) | 0 (0.0%) |
| 35 to 50 years | 8 (100.0%) | 0 (0.0%) |
| Total | 19 (100.0%) | 0 (0.0%) |
Fertility by Education in Kenilworth
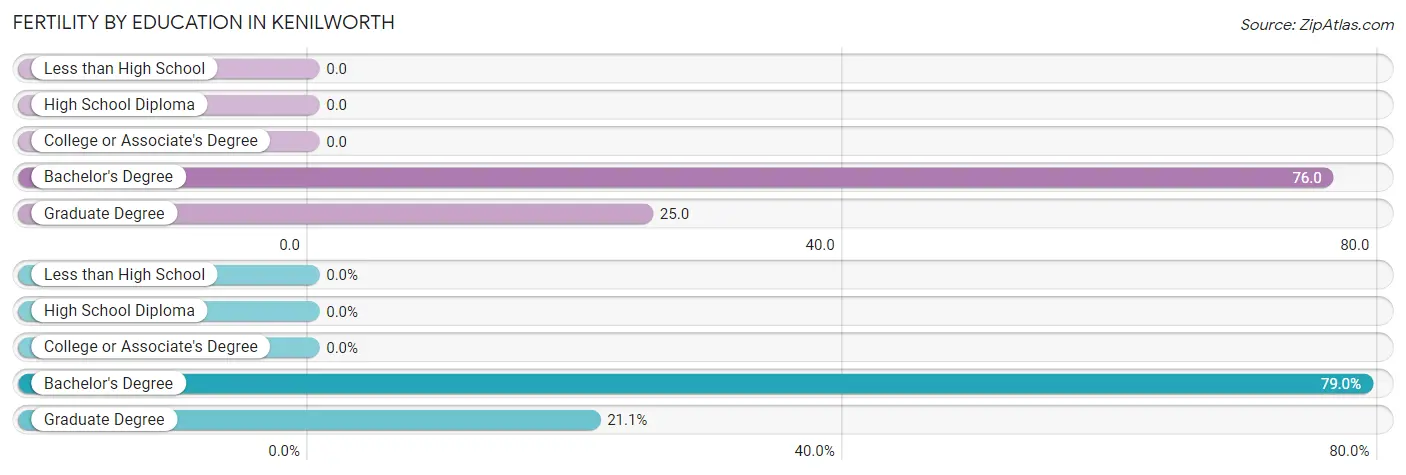
| Educational Attainment | Women with Births | Births / 1,000 Women |
| Less than High School | 0 (0.0%) | 0.0 |
| High School Diploma | 0 (0.0%) | 0.0 |
| College or Associate's Degree | 0 (0.0%) | 0.0 |
| Bachelor's Degree | 15 (78.9%) | 76.0 |
| Graduate Degree | 4 (21.0%) | 25.0 |
| Total | 19 (100.0%) | 40.0 |
Fertility by Education by Marriage Status in Kenilworth
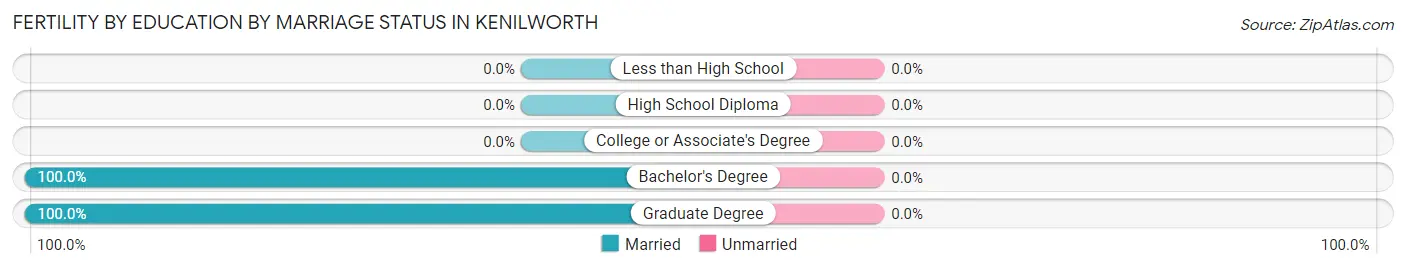
| Educational Attainment | Married | Unmarried |
| Less than High School | 0 (0.0%) | 0 (0.0%) |
| High School Diploma | 0 (0.0%) | 0 (0.0%) |
| College or Associate's Degree | 0 (0.0%) | 0 (0.0%) |
| Bachelor's Degree | 15 (100.0%) | 0 (0.0%) |
| Graduate Degree | 4 (100.0%) | 0 (0.0%) |
| Total | 19 (100.0%) | 0 (0.0%) |
Employment Characteristics in Kenilworth
Employment by Class of Employer in Kenilworth
Among the 917 employed individuals in Kenilworth, private company employees (601 | 65.5%), not-for-profit organizations (114 | 12.4%), and self-employed (incorporated) (106 | 11.6%) make up the most common classes of employment.
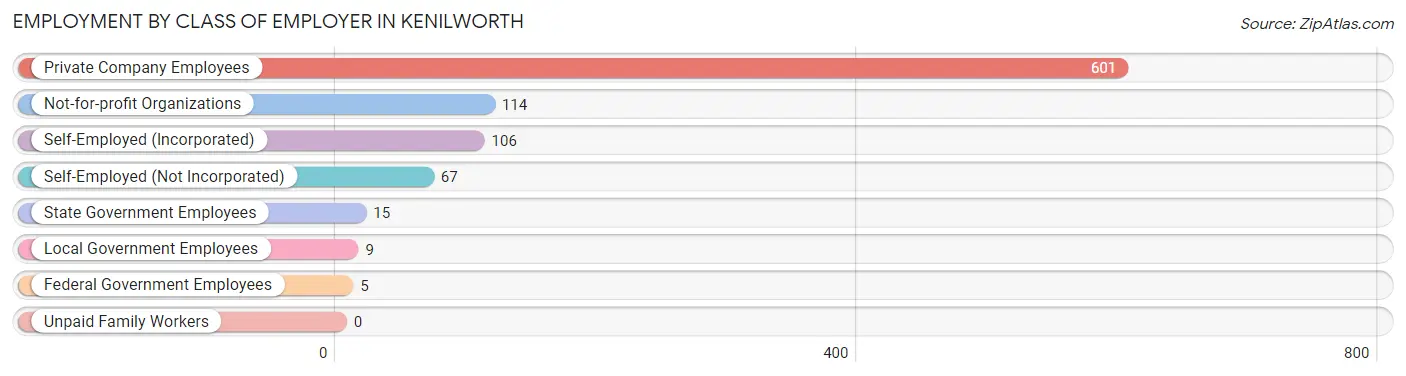
| Employer Class | # Employees | % Employees |
| Private Company Employees | 601 | 65.5% |
| Self-Employed (Incorporated) | 106 | 11.6% |
| Self-Employed (Not Incorporated) | 67 | 7.3% |
| Not-for-profit Organizations | 114 | 12.4% |
| Local Government Employees | 9 | 1.0% |
| State Government Employees | 15 | 1.6% |
| Federal Government Employees | 5 | 0.5% |
| Unpaid Family Workers | 0 | 0.0% |
| Total | 917 | 100.0% |
Employment Status by Age in Kenilworth
According to the labor force statistics for Kenilworth, out of the total population over 16 years of age (1,705), 56.5% or 963 individuals are in the labor force, with 3.3% or 32 of them unemployed. The age group with the highest labor force participation rate is 35 to 44 years, with 88.4% or 274 individuals in the labor force. Within the labor force, the 16 to 19 years age range has the highest percentage of unemployed individuals, with 27.8% or 10 of them being unemployed.
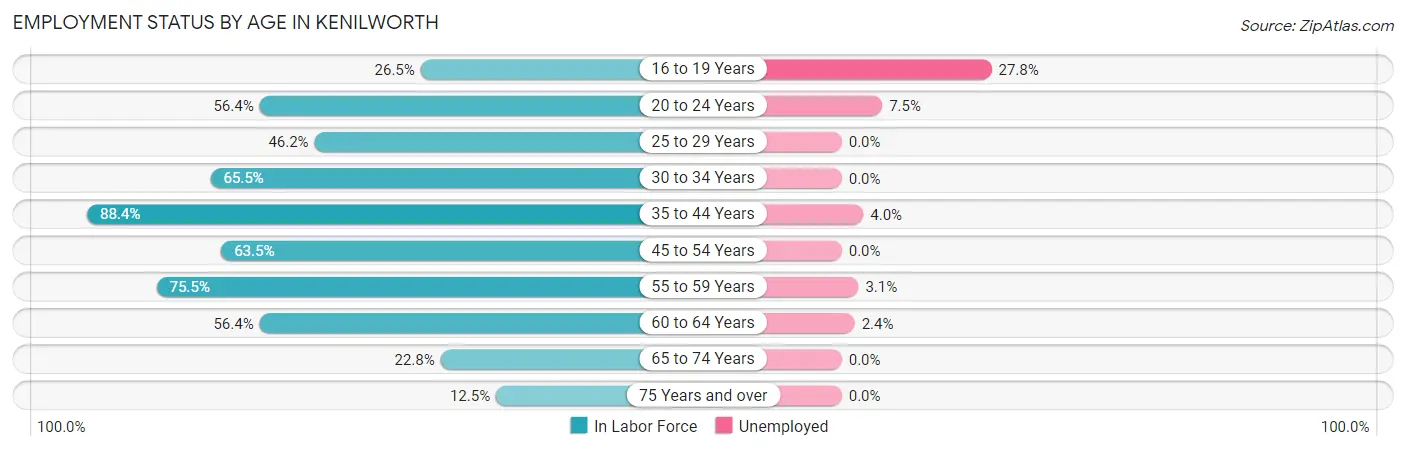
| Age Bracket | In Labor Force | Unemployed |
| 16 to 19 Years | 36 (26.5%) | 10 (27.8%) |
| 20 to 24 Years | 53 (56.4%) | 4 (7.5%) |
| 25 to 29 Years | 6 (46.2%) | 0 (0.0%) |
| 30 to 34 Years | 38 (65.5%) | 0 (0.0%) |
| 35 to 44 Years | 274 (88.4%) | 11 (4.0%) |
| 45 to 54 Years | 249 (63.5%) | 0 (0.0%) |
| 55 to 59 Years | 160 (75.5%) | 5 (3.1%) |
| 60 to 64 Years | 84 (56.4%) | 2 (2.4%) |
| 65 to 74 Years | 45 (22.8%) | 0 (0.0%) |
| 75 Years and over | 18 (12.5%) | 0 (0.0%) |
| Total | 963 (56.5%) | 32 (3.3%) |
Employment Status by Educational Attainment in Kenilworth
According to labor force statistics for Kenilworth, 71.5% of individuals (811) out of the total population between 25 and 64 years of age (1,134) are in the labor force, with 2.2% or 18 of them being unemployed. The group with the highest labor force participation rate are those with the educational attainment of high school diploma, with 100.0% or 19 individuals in the labor force. Within the labor force, individuals with bachelor's degree or higher education have the highest percentage of unemployment, with 2.4% or 18 of them being unemployed.
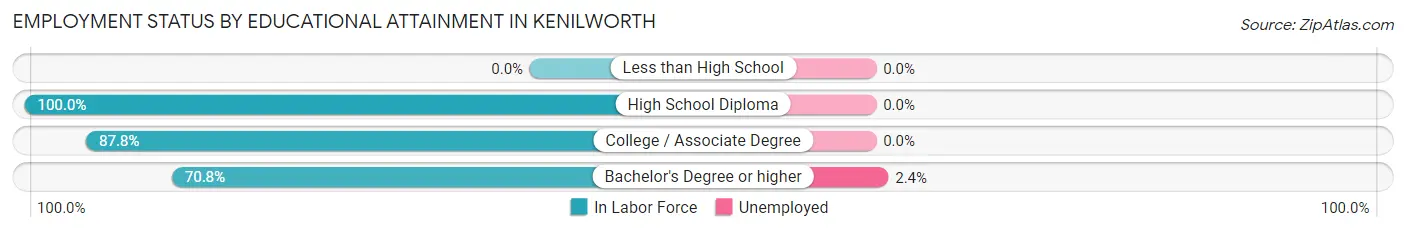
| Educational Attainment | In Labor Force | Unemployed |
| Less than High School | 0 (0.0%) | 0 (0.0%) |
| High School Diploma | 19 (100.0%) | 0 (0.0%) |
| College / Associate Degree | 36 (87.8%) | 0 (0.0%) |
| Bachelor's Degree or higher | 756 (70.8%) | 26 (2.4%) |
| Total | 811 (71.5%) | 25 (2.2%) |
Employment Occupations by Sex in Kenilworth
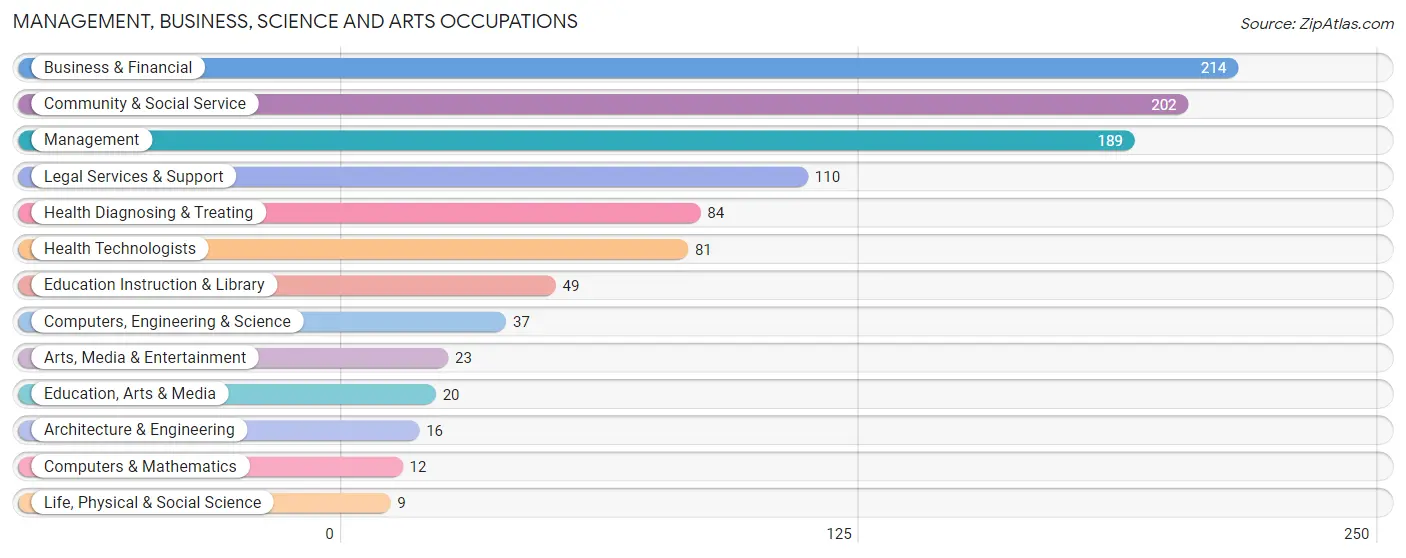
Management, Business, Science and Arts Occupations
The most common Management, Business, Science and Arts occupations in Kenilworth are Business & Financial (214 | 23.0%), Community & Social Service (202 | 21.7%), Management (189 | 20.3%), Legal Services & Support (110 | 11.8%), and Health Diagnosing & Treating (84 | 9.0%).
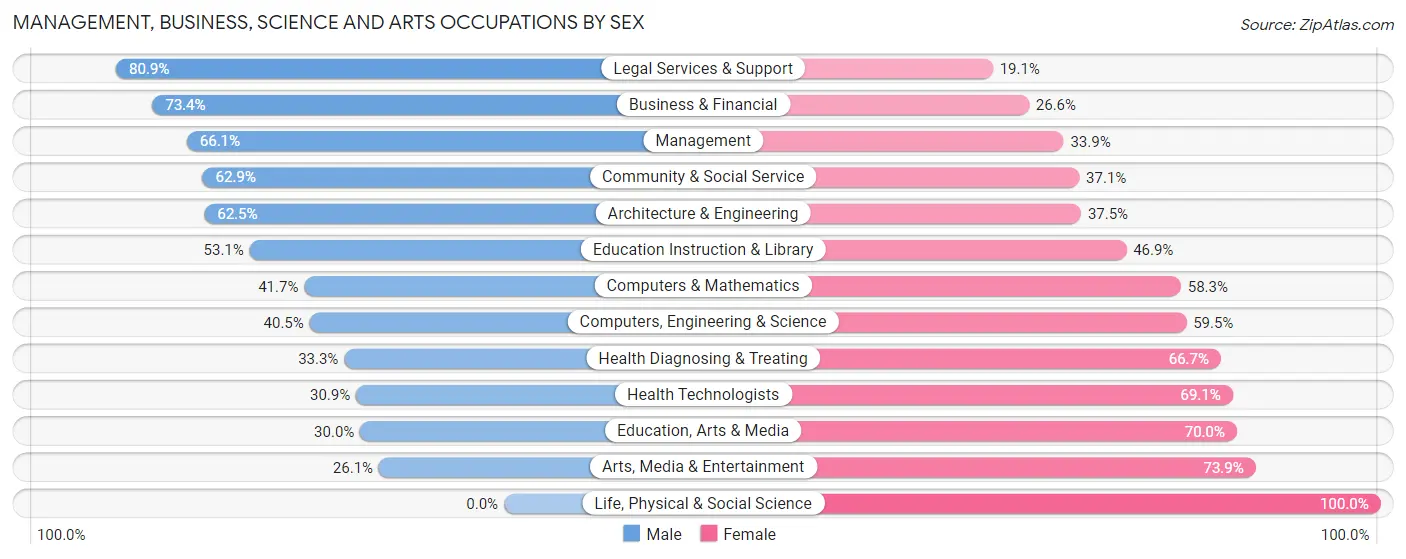
Management, Business, Science and Arts Occupations by Sex
Within the Management, Business, Science and Arts occupations in Kenilworth, the most male-oriented occupations are Legal Services & Support (80.9%), Business & Financial (73.4%), and Management (66.1%), while the most female-oriented occupations are Life, Physical & Social Science (100.0%), Arts, Media & Entertainment (73.9%), and Education, Arts & Media (70.0%).
| Occupation | Male | Female |
| Management | 125 (66.1%) | 64 (33.9%) |
| Business & Financial | 157 (73.4%) | 57 (26.6%) |
| Computers, Engineering & Science | 15 (40.5%) | 22 (59.5%) |
| Computers & Mathematics | 5 (41.7%) | 7 (58.3%) |
| Architecture & Engineering | 10 (62.5%) | 6 (37.5%) |
| Life, Physical & Social Science | 0 (0.0%) | 9 (100.0%) |
| Community & Social Service | 127 (62.9%) | 75 (37.1%) |
| Education, Arts & Media | 6 (30.0%) | 14 (70.0%) |
| Legal Services & Support | 89 (80.9%) | 21 (19.1%) |
| Education Instruction & Library | 26 (53.1%) | 23 (46.9%) |
| Arts, Media & Entertainment | 6 (26.1%) | 17 (73.9%) |
| Health Diagnosing & Treating | 28 (33.3%) | 56 (66.7%) |
| Health Technologists | 25 (30.9%) | 56 (69.1%) |
| Total (Category) | 452 (62.3%) | 274 (37.7%) |
| Total (Overall) | 544 (58.4%) | 387 (41.6%) |
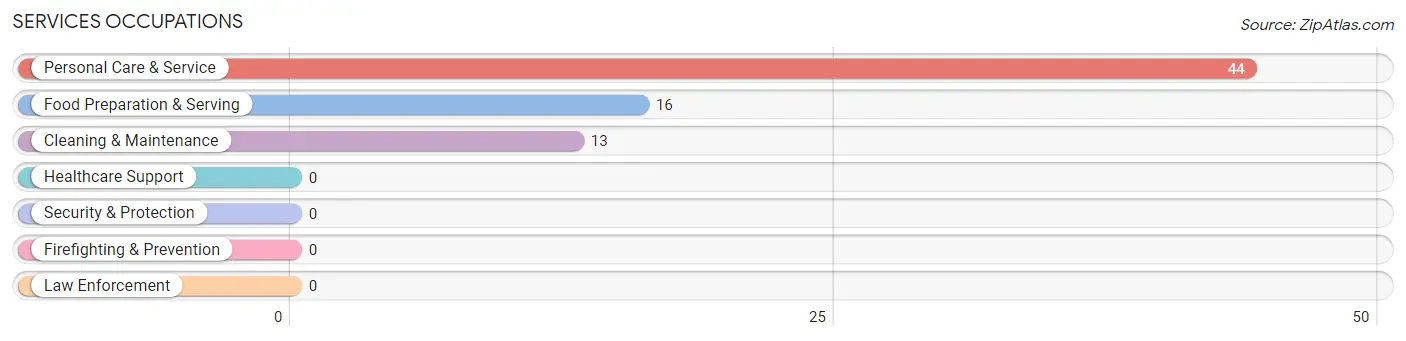
Services Occupations
The most common Services occupations in Kenilworth are Personal Care & Service (44 | 4.7%), Food Preparation & Serving (16 | 1.7%), and Cleaning & Maintenance (13 | 1.4%).
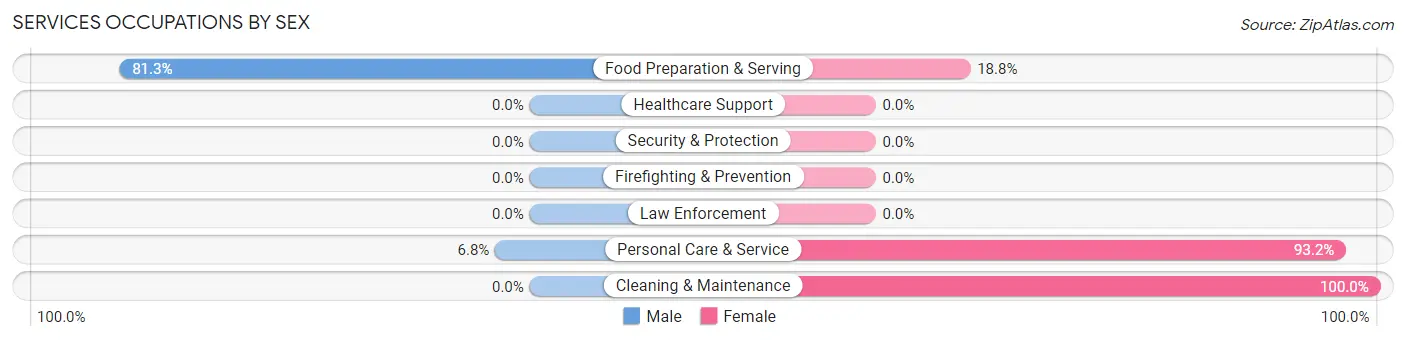
Services Occupations by Sex
Within the Services occupations in Kenilworth, the most male-oriented occupations are Food Preparation & Serving (81.2%), and Personal Care & Service (6.8%), while the most female-oriented occupations are Cleaning & Maintenance (100.0%), Personal Care & Service (93.2%), and Food Preparation & Serving (18.8%).
| Occupation | Male | Female |
| Healthcare Support | 0 (0.0%) | 0 (0.0%) |
| Security & Protection | 0 (0.0%) | 0 (0.0%) |
| Firefighting & Prevention | 0 (0.0%) | 0 (0.0%) |
| Law Enforcement | 0 (0.0%) | 0 (0.0%) |
| Food Preparation & Serving | 13 (81.2%) | 3 (18.8%) |
| Cleaning & Maintenance | 0 (0.0%) | 13 (100.0%) |
| Personal Care & Service | 3 (6.8%) | 41 (93.2%) |
| Total (Category) | 16 (21.9%) | 57 (78.1%) |
| Total (Overall) | 544 (58.4%) | 387 (41.6%) |
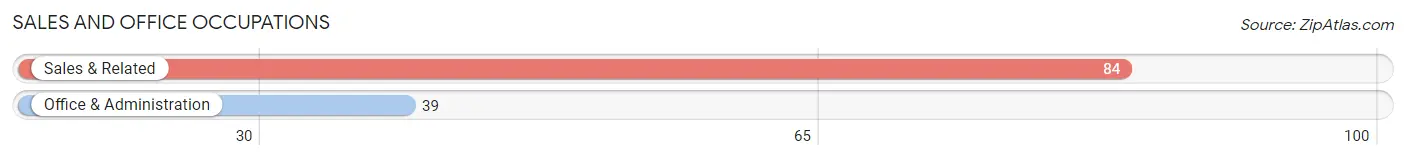
Sales and Office Occupations
The most common Sales and Office occupations in Kenilworth are Sales & Related (84 | 9.0%), and Office & Administration (39 | 4.2%).
Sales and Office Occupations by Sex
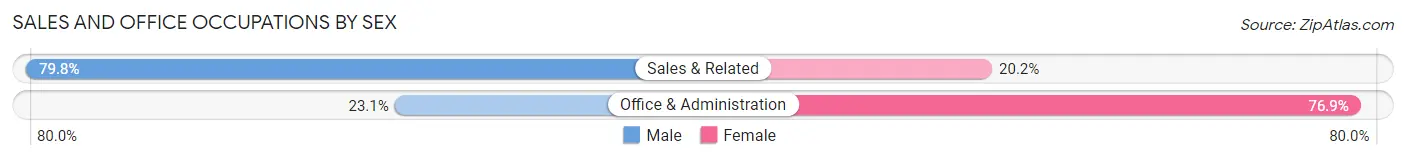
| Occupation | Male | Female |
| Sales & Related | 67 (79.8%) | 17 (20.2%) |
| Office & Administration | 9 (23.1%) | 30 (76.9%) |
| Total (Category) | 76 (61.8%) | 47 (38.2%) |
| Total (Overall) | 544 (58.4%) | 387 (41.6%) |
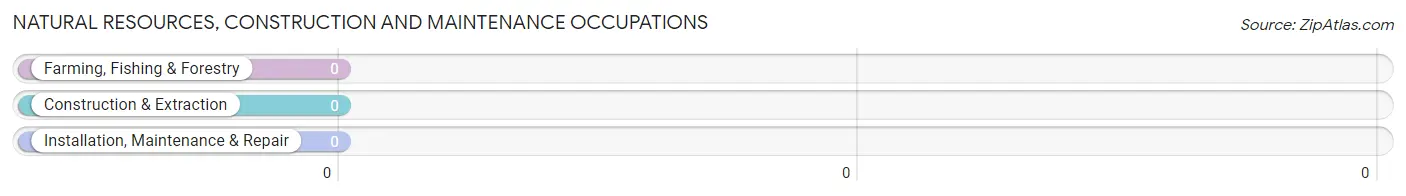
Natural Resources, Construction and Maintenance Occupations
Natural Resources, Construction and Maintenance Occupations by Sex
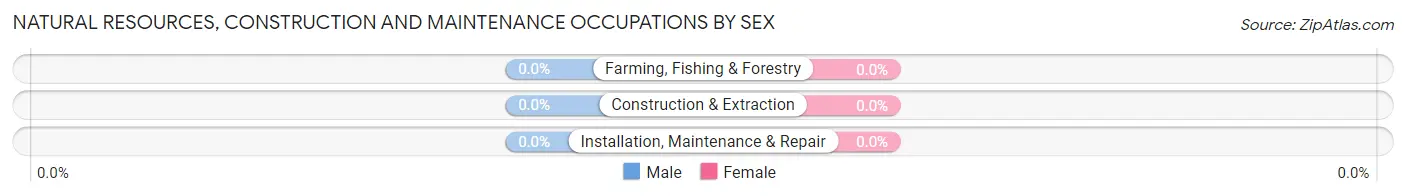
| Occupation | Male | Female |
| Farming, Fishing & Forestry | 0 (0.0%) | 0 (0.0%) |
| Construction & Extraction | 0 (0.0%) | 0 (0.0%) |
| Installation, Maintenance & Repair | 0 (0.0%) | 0 (0.0%) |
| Total (Category) | 0 (0.0%) | 0 (0.0%) |
| Total (Overall) | 544 (58.4%) | 387 (41.6%) |
Production, Transportation and Moving Occupations
The most common Production, Transportation and Moving occupations in Kenilworth are Material Moving (6 | 0.6%), and Production (3 | 0.3%).
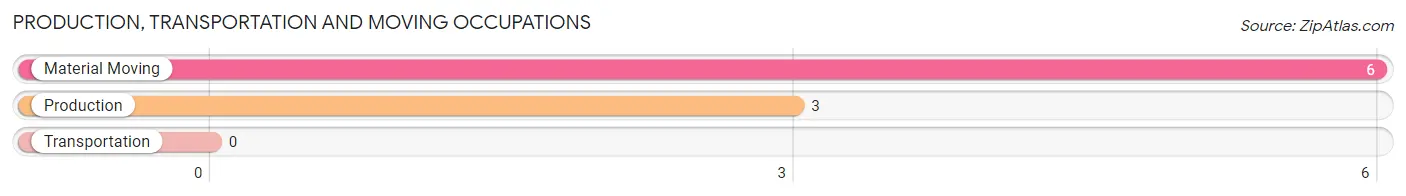
Production, Transportation and Moving Occupations by Sex
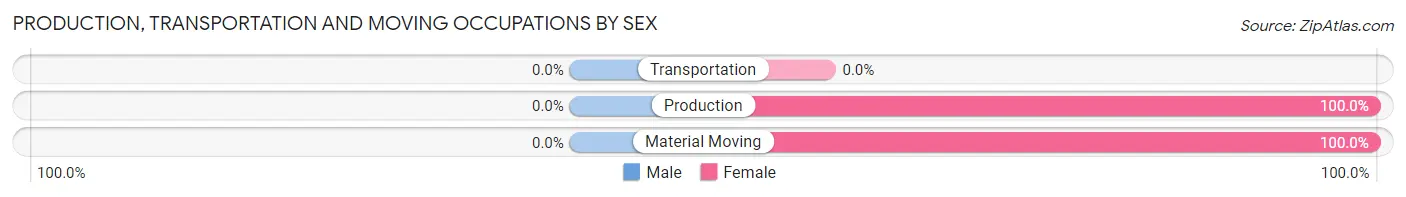
| Occupation | Male | Female |
| Production | 0 (0.0%) | 3 (100.0%) |
| Transportation | 0 (0.0%) | 0 (0.0%) |
| Material Moving | 0 (0.0%) | 6 (100.0%) |
| Total (Category) | 0 (0.0%) | 9 (100.0%) |
| Total (Overall) | 544 (58.4%) | 387 (41.6%) |
Employment Industries by Sex in Kenilworth
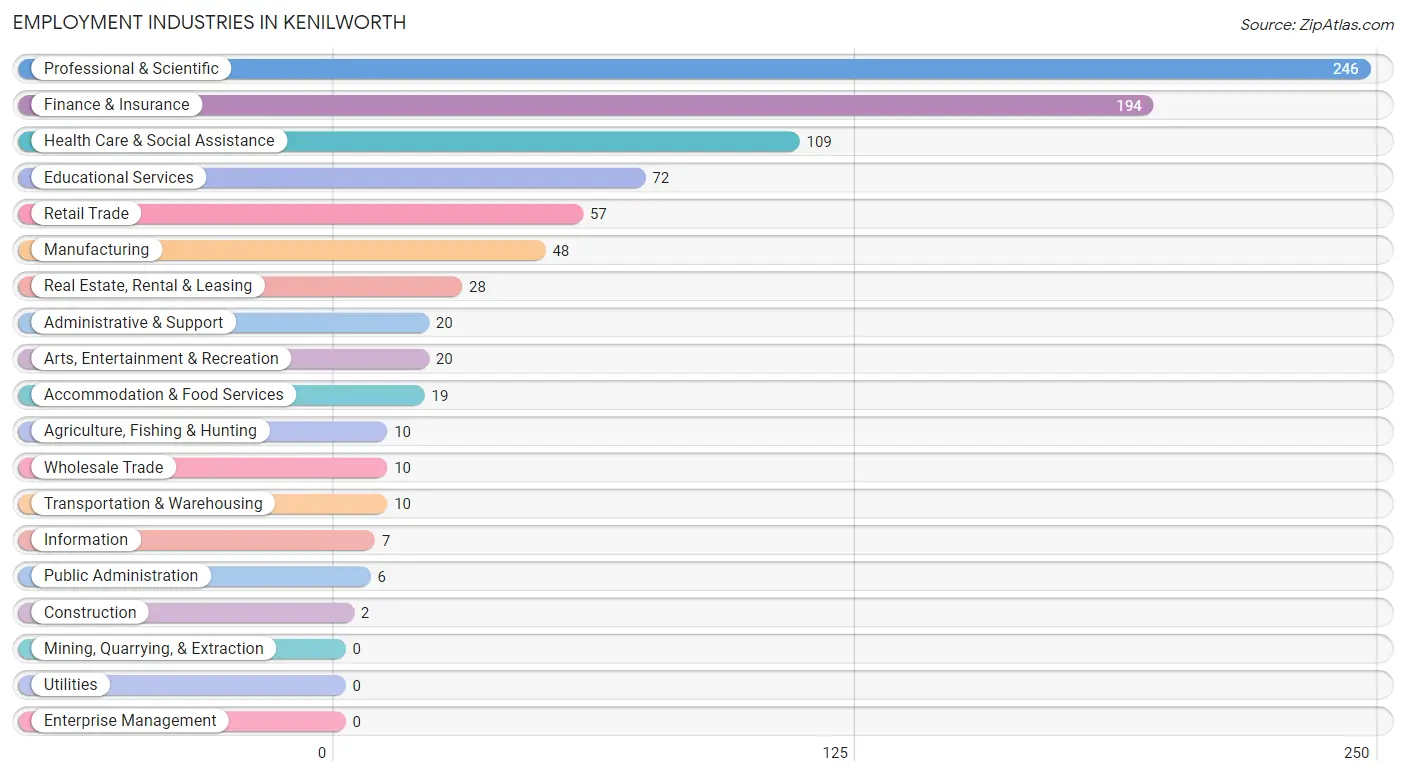
Employment Industries in Kenilworth
The major employment industries in Kenilworth include Professional & Scientific (246 | 26.4%), Finance & Insurance (194 | 20.8%), Health Care & Social Assistance (109 | 11.7%), Educational Services (72 | 7.7%), and Retail Trade (57 | 6.1%).
Employment Industries by Sex in Kenilworth
The Kenilworth industries that see more men than women are Agriculture, Fishing & Hunting (100.0%), Transportation & Warehousing (100.0%), and Finance & Insurance (94.3%), whereas the industries that tend to have a higher number of women are Construction (100.0%), Information (100.0%), and Public Administration (100.0%).
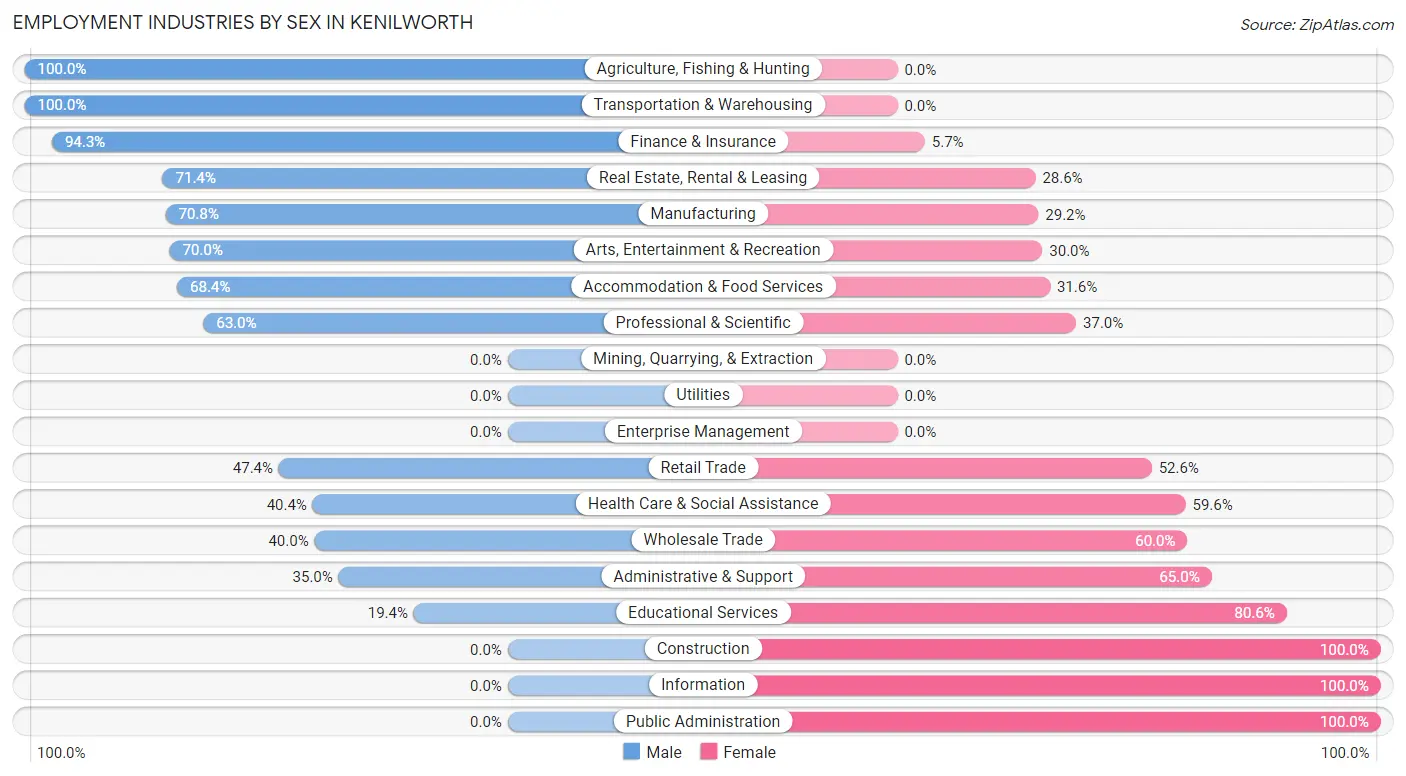
| Industry | Male | Female |
| Agriculture, Fishing & Hunting | 10 (100.0%) | 0 (0.0%) |
| Mining, Quarrying, & Extraction | 0 (0.0%) | 0 (0.0%) |
| Construction | 0 (0.0%) | 2 (100.0%) |
| Manufacturing | 34 (70.8%) | 14 (29.2%) |
| Wholesale Trade | 4 (40.0%) | 6 (60.0%) |
| Retail Trade | 27 (47.4%) | 30 (52.6%) |
| Transportation & Warehousing | 10 (100.0%) | 0 (0.0%) |
| Utilities | 0 (0.0%) | 0 (0.0%) |
| Information | 0 (0.0%) | 7 (100.0%) |
| Finance & Insurance | 183 (94.3%) | 11 (5.7%) |
| Real Estate, Rental & Leasing | 20 (71.4%) | 8 (28.6%) |
| Professional & Scientific | 155 (63.0%) | 91 (37.0%) |
| Enterprise Management | 0 (0.0%) | 0 (0.0%) |
| Administrative & Support | 7 (35.0%) | 13 (65.0%) |
| Educational Services | 14 (19.4%) | 58 (80.6%) |
| Health Care & Social Assistance | 44 (40.4%) | 65 (59.6%) |
| Arts, Entertainment & Recreation | 14 (70.0%) | 6 (30.0%) |
| Accommodation & Food Services | 13 (68.4%) | 6 (31.6%) |
| Public Administration | 0 (0.0%) | 6 (100.0%) |
| Total | 544 (58.4%) | 387 (41.6%) |
Education in Kenilworth
School Enrollment in Kenilworth
The most common levels of schooling among the 977 students in Kenilworth are elementary school (276 | 28.2%), middle school (217 | 22.2%), and high school (194 | 19.9%).
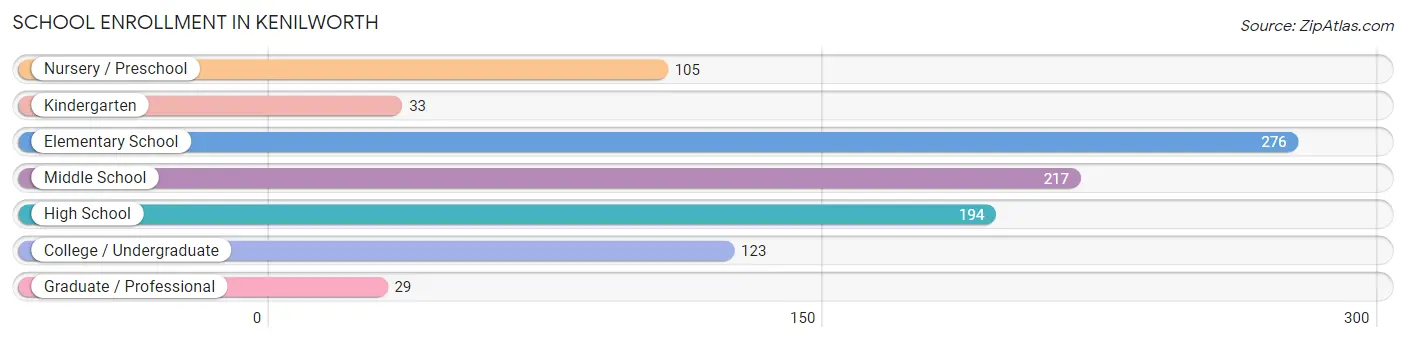
| School Level | # Students | % Students |
| Nursery / Preschool | 105 | 10.7% |
| Kindergarten | 33 | 3.4% |
| Elementary School | 276 | 28.2% |
| Middle School | 217 | 22.2% |
| High School | 194 | 19.9% |
| College / Undergraduate | 123 | 12.6% |
| Graduate / Professional | 29 | 3.0% |
| Total | 977 | 100.0% |
School Enrollment by Age by Funding Source in Kenilworth
Out of a total of 977 students who are enrolled in schools in Kenilworth, 254 (26.0%) attend a private institution, while the remaining 723 (74.0%) are enrolled in public schools. The age group of 3 to 4 year olds has the highest likelihood of being enrolled in private schools, with 90 (90.0% in the age bracket) enrolled. Conversely, the age group of 5 to 9 year old has the lowest likelihood of being enrolled in a private school, with 269 (95.4% in the age bracket) attending a public institution.
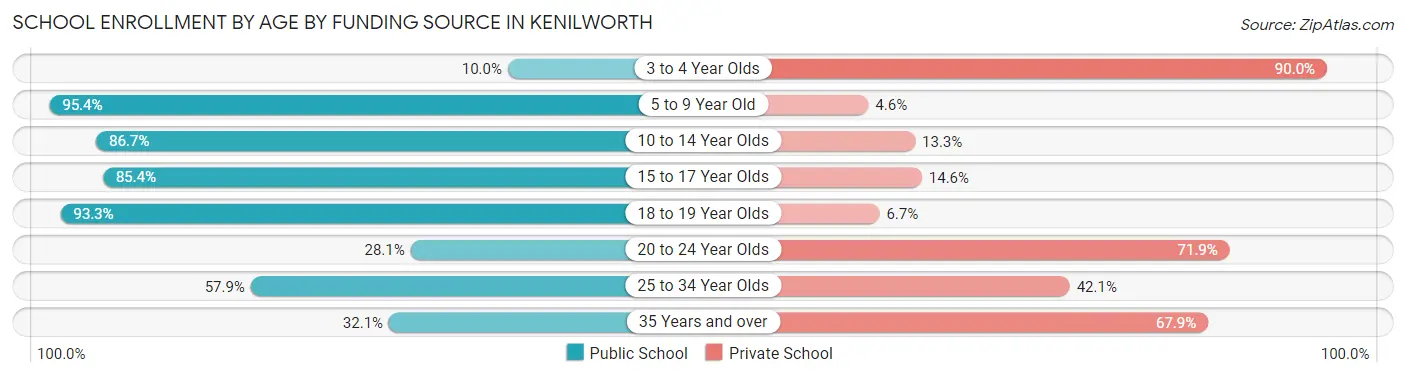
| Age Bracket | Public School | Private School |
| 3 to 4 Year Olds | 10 (10.0%) | 90 (90.0%) |
| 5 to 9 Year Old | 269 (95.4%) | 13 (4.6%) |
| 10 to 14 Year Olds | 267 (86.7%) | 41 (13.3%) |
| 15 to 17 Year Olds | 88 (85.4%) | 15 (14.6%) |
| 18 to 19 Year Olds | 42 (93.3%) | 3 (6.7%) |
| 20 to 24 Year Olds | 18 (28.1%) | 46 (71.9%) |
| 25 to 34 Year Olds | 11 (57.9%) | 8 (42.1%) |
| 35 Years and over | 18 (32.1%) | 38 (67.9%) |
| Total | 723 (74.0%) | 254 (26.0%) |
Educational Attainment by Field of Study in Kenilworth
Business (343 | 23.4%), social sciences (307 | 21.0%), literature & languages (131 | 8.9%), liberal arts & history (95 | 6.5%), and communications (94 | 6.4%) are the most common fields of study among 1,465 individuals in Kenilworth who have obtained a bachelor's degree or higher.
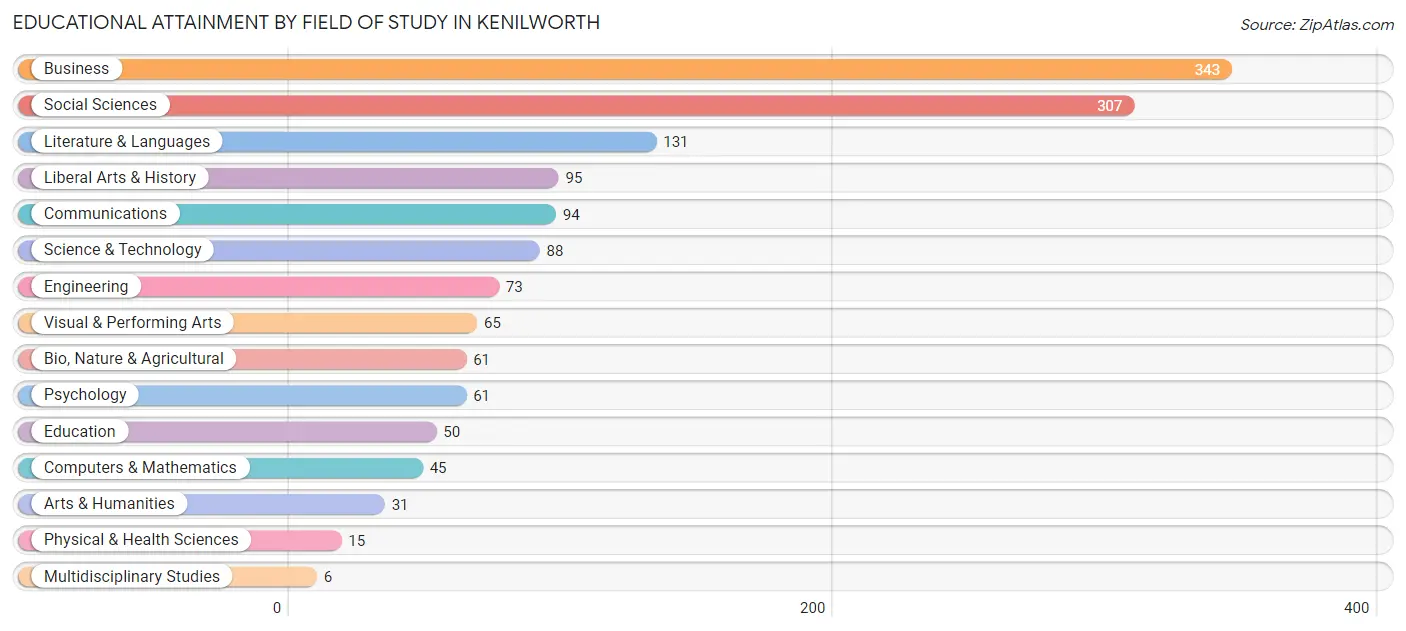
| Field of Study | # Graduates | % Graduates |
| Computers & Mathematics | 45 | 3.1% |
| Bio, Nature & Agricultural | 61 | 4.2% |
| Physical & Health Sciences | 15 | 1.0% |
| Psychology | 61 | 4.2% |
| Social Sciences | 307 | 21.0% |
| Engineering | 73 | 5.0% |
| Multidisciplinary Studies | 6 | 0.4% |
| Science & Technology | 88 | 6.0% |
| Business | 343 | 23.4% |
| Education | 50 | 3.4% |
| Literature & Languages | 131 | 8.9% |
| Liberal Arts & History | 95 | 6.5% |
| Visual & Performing Arts | 65 | 4.4% |
| Communications | 94 | 6.4% |
| Arts & Humanities | 31 | 2.1% |
| Total | 1,465 | 100.0% |
Transportation & Commute in Kenilworth
Vehicle Availability by Sex in Kenilworth
The most prevalent vehicle ownership categories in Kenilworth are males with 2 vehicles (349, accounting for 64.7%) and females with 2 vehicles (222, making up 92.3%).
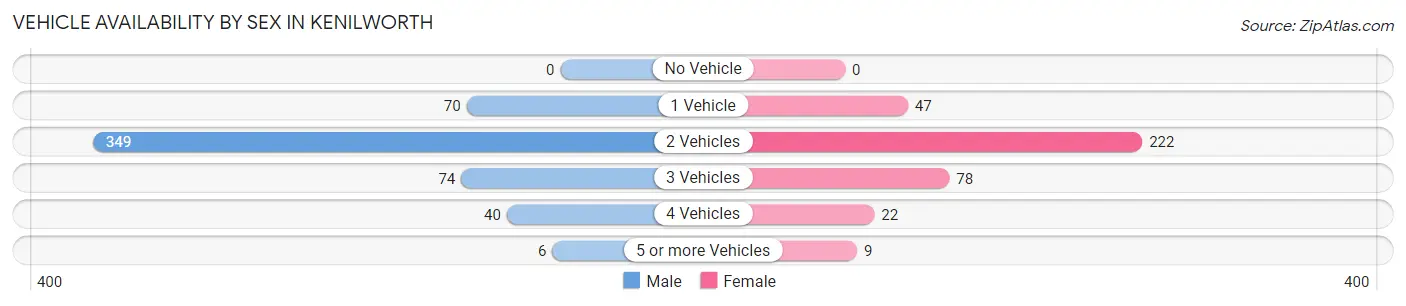
| Vehicles Available | Male | Female |
| No Vehicle | 0 (0.0%) | 0 (0.0%) |
| 1 Vehicle | 70 (13.0%) | 47 (12.4%) |
| 2 Vehicles | 349 (64.7%) | 222 (58.7%) |
| 3 Vehicles | 74 (13.7%) | 78 (20.6%) |
| 4 Vehicles | 40 (7.4%) | 22 (5.8%) |
| 5 or more Vehicles | 6 (1.1%) | 9 (2.4%) |
| Total | 539 (100.0%) | 378 (100.0%) |
Commute Time in Kenilworth
The most frequently occuring commute durations in Kenilworth are 60 to 89 minutes (125 commuters, 19.9%), 45 to 59 minutes (96 commuters, 15.3%), and 30 to 34 minutes (94 commuters, 15.0%).
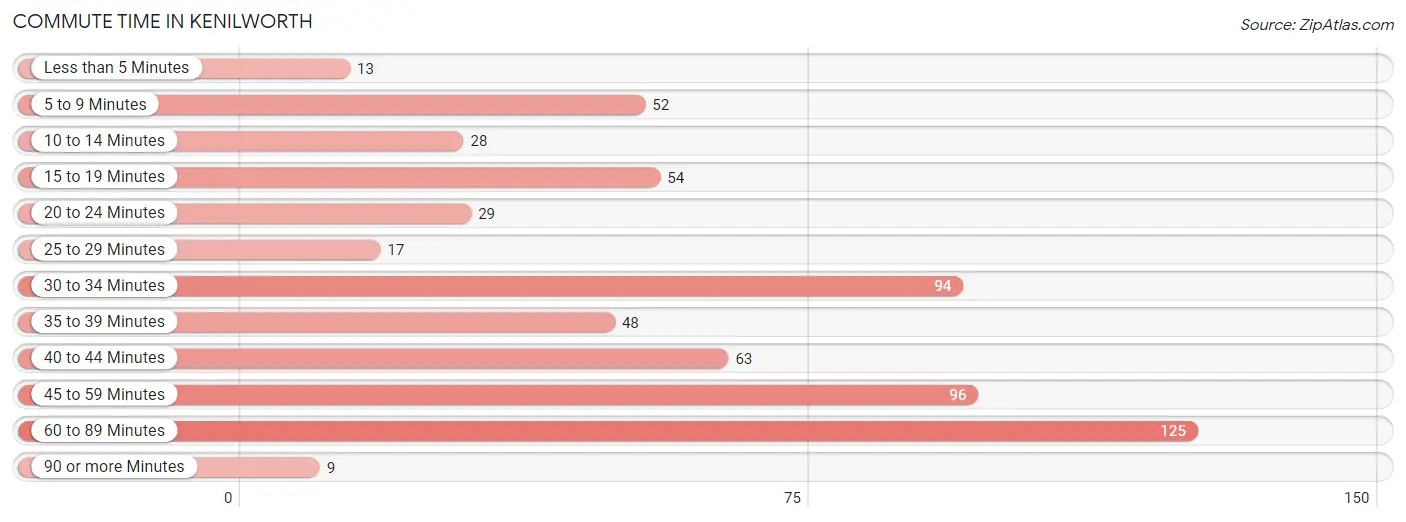
| Commute Time | # Commuters | % Commuters |
| Less than 5 Minutes | 13 | 2.1% |
| 5 to 9 Minutes | 52 | 8.3% |
| 10 to 14 Minutes | 28 | 4.5% |
| 15 to 19 Minutes | 54 | 8.6% |
| 20 to 24 Minutes | 29 | 4.6% |
| 25 to 29 Minutes | 17 | 2.7% |
| 30 to 34 Minutes | 94 | 15.0% |
| 35 to 39 Minutes | 48 | 7.6% |
| 40 to 44 Minutes | 63 | 10.0% |
| 45 to 59 Minutes | 96 | 15.3% |
| 60 to 89 Minutes | 125 | 19.9% |
| 90 or more Minutes | 9 | 1.4% |
Commute Time by Sex in Kenilworth
The most common commute times in Kenilworth are 45 to 59 minutes (72 commuters, 18.2%) for males and 60 to 89 minutes (60 commuters, 25.8%) for females.
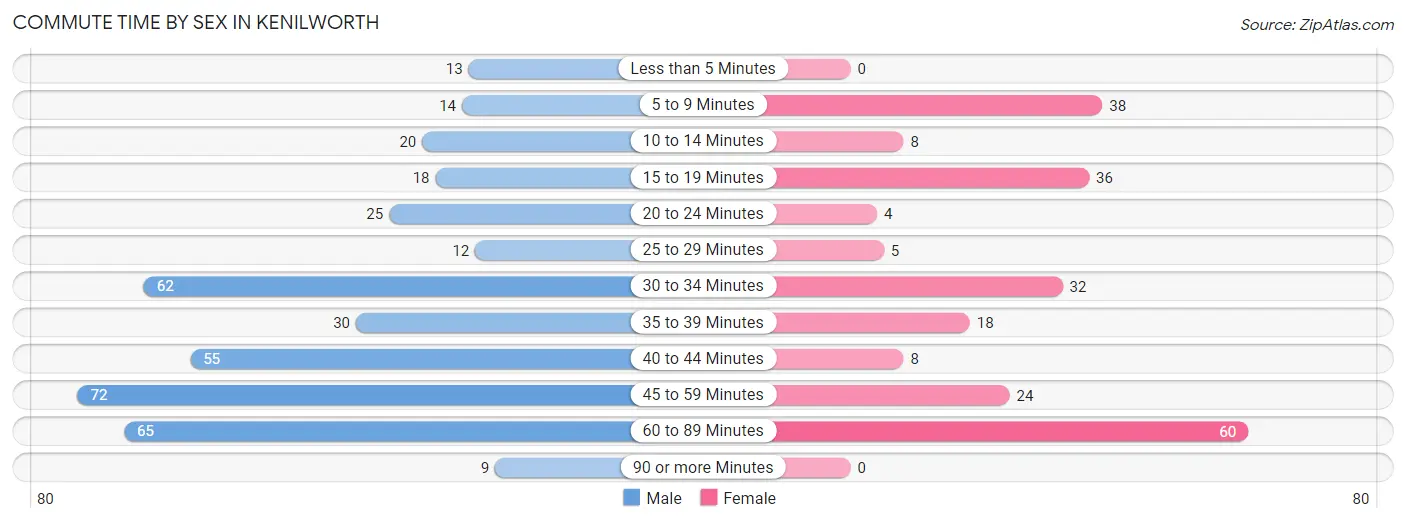
| Commute Time | Male | Female |
| Less than 5 Minutes | 13 (3.3%) | 0 (0.0%) |
| 5 to 9 Minutes | 14 (3.5%) | 38 (16.3%) |
| 10 to 14 Minutes | 20 (5.1%) | 8 (3.4%) |
| 15 to 19 Minutes | 18 (4.6%) | 36 (15.4%) |
| 20 to 24 Minutes | 25 (6.3%) | 4 (1.7%) |
| 25 to 29 Minutes | 12 (3.0%) | 5 (2.1%) |
| 30 to 34 Minutes | 62 (15.7%) | 32 (13.7%) |
| 35 to 39 Minutes | 30 (7.6%) | 18 (7.7%) |
| 40 to 44 Minutes | 55 (13.9%) | 8 (3.4%) |
| 45 to 59 Minutes | 72 (18.2%) | 24 (10.3%) |
| 60 to 89 Minutes | 65 (16.5%) | 60 (25.8%) |
| 90 or more Minutes | 9 (2.3%) | 0 (0.0%) |
Time of Departure to Work by Sex in Kenilworth
The most frequent times of departure to work in Kenilworth are 7:30 AM to 7:59 AM (94, 23.8%) for males and 7:30 AM to 7:59 AM (69, 29.6%) for females.
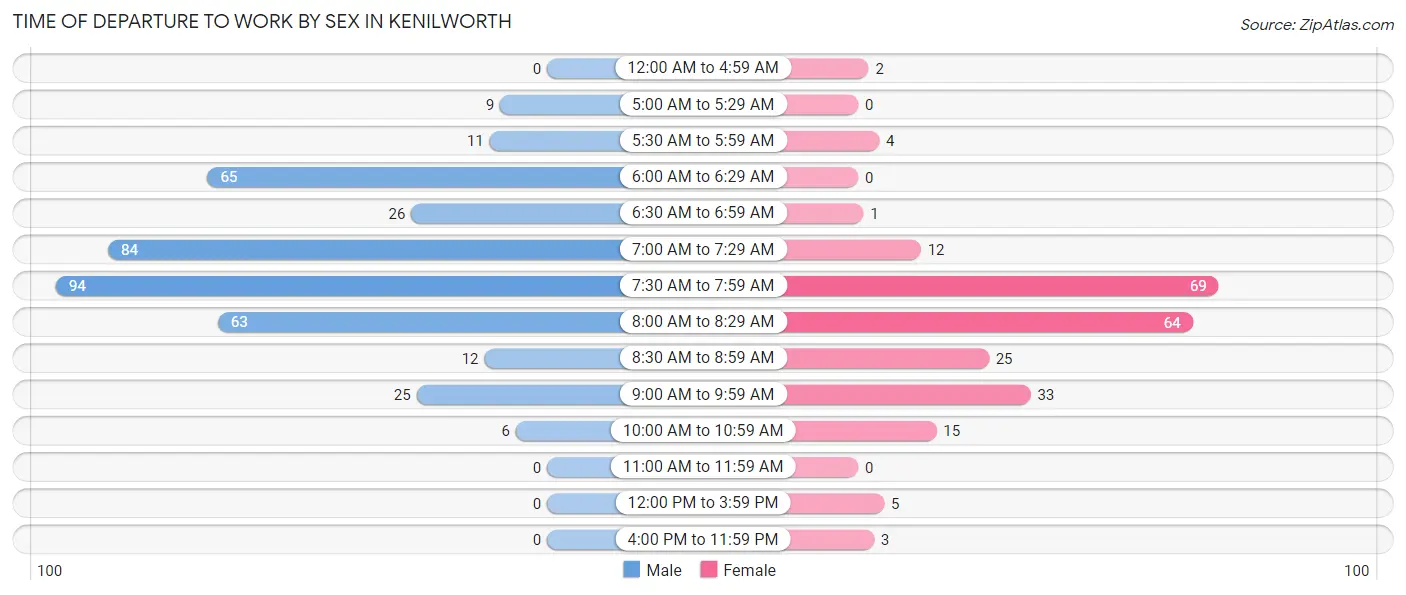
| Time of Departure | Male | Female |
| 12:00 AM to 4:59 AM | 0 (0.0%) | 2 (0.9%) |
| 5:00 AM to 5:29 AM | 9 (2.3%) | 0 (0.0%) |
| 5:30 AM to 5:59 AM | 11 (2.8%) | 4 (1.7%) |
| 6:00 AM to 6:29 AM | 65 (16.5%) | 0 (0.0%) |
| 6:30 AM to 6:59 AM | 26 (6.6%) | 1 (0.4%) |
| 7:00 AM to 7:29 AM | 84 (21.3%) | 12 (5.1%) |
| 7:30 AM to 7:59 AM | 94 (23.8%) | 69 (29.6%) |
| 8:00 AM to 8:29 AM | 63 (16.0%) | 64 (27.5%) |
| 8:30 AM to 8:59 AM | 12 (3.0%) | 25 (10.7%) |
| 9:00 AM to 9:59 AM | 25 (6.3%) | 33 (14.2%) |
| 10:00 AM to 10:59 AM | 6 (1.5%) | 15 (6.4%) |
| 11:00 AM to 11:59 AM | 0 (0.0%) | 0 (0.0%) |
| 12:00 PM to 3:59 PM | 0 (0.0%) | 5 (2.1%) |
| 4:00 PM to 11:59 PM | 0 (0.0%) | 3 (1.3%) |
| Total | 395 (100.0%) | 233 (100.0%) |
Housing Occupancy in Kenilworth
Occupancy by Ownership in Kenilworth
Of the total 789 dwellings in Kenilworth, owner-occupied units account for 759 (96.2%), while renter-occupied units make up 30 (3.8%).
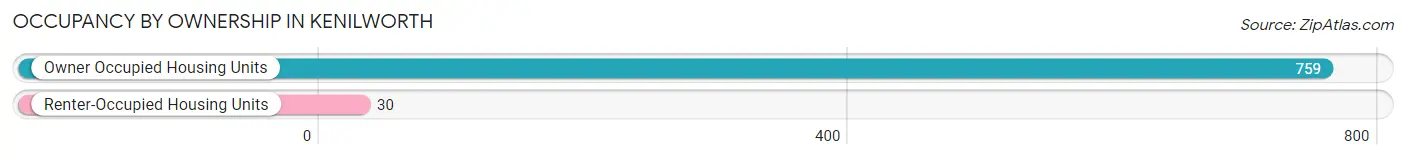
| Occupancy | # Housing Units | % Housing Units |
| Owner Occupied Housing Units | 759 | 96.2% |
| Renter-Occupied Housing Units | 30 | 3.8% |
| Total Occupied Housing Units | 789 | 100.0% |
Occupancy by Household Size in Kenilworth
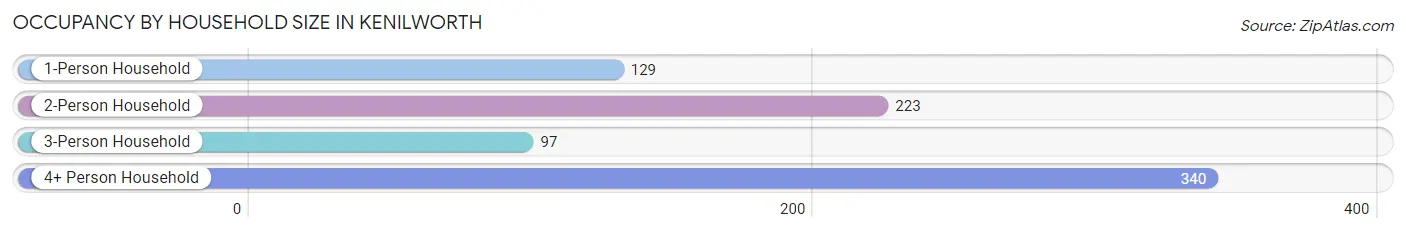
| Household Size | # Housing Units | % Housing Units |
| 1-Person Household | 129 | 16.4% |
| 2-Person Household | 223 | 28.3% |
| 3-Person Household | 97 | 12.3% |
| 4+ Person Household | 340 | 43.1% |
| Total Housing Units | 789 | 100.0% |
Occupancy by Ownership by Household Size in Kenilworth
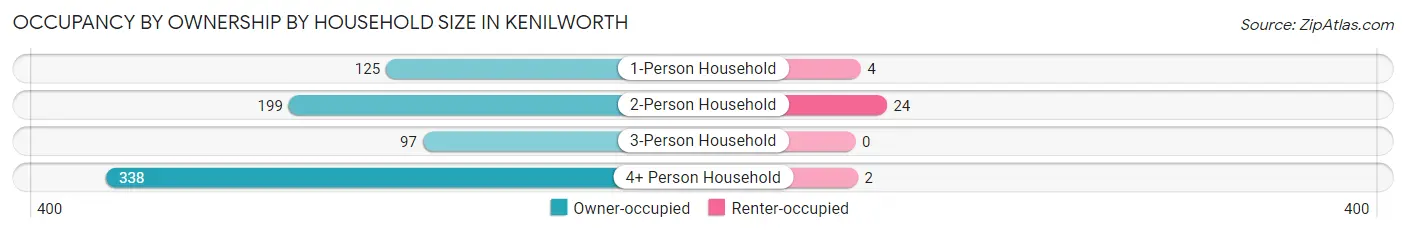
| Household Size | Owner-occupied | Renter-occupied |
| 1-Person Household | 125 (96.9%) | 4 (3.1%) |
| 2-Person Household | 199 (89.2%) | 24 (10.8%) |
| 3-Person Household | 97 (100.0%) | 0 (0.0%) |
| 4+ Person Household | 338 (99.4%) | 2 (0.6%) |
| Total Housing Units | 759 (96.2%) | 30 (3.8%) |
Occupancy by Educational Attainment in Kenilworth
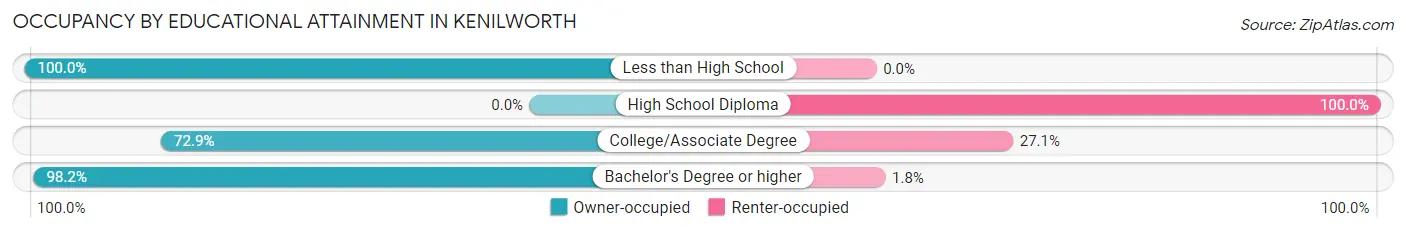
| Household Size | Owner-occupied | Renter-occupied |
| Less than High School | 3 (100.0%) | 0 (0.0%) |
| High School Diploma | 0 (0.0%) | 4 (100.0%) |
| College/Associate Degree | 35 (72.9%) | 13 (27.1%) |
| Bachelor's Degree or higher | 721 (98.2%) | 13 (1.8%) |
Occupancy by Age of Householder in Kenilworth
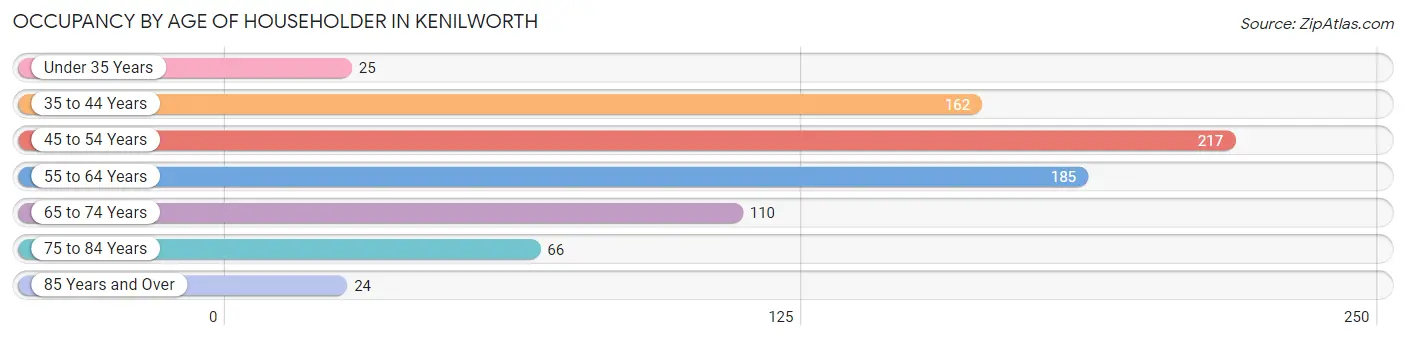
| Age Bracket | # Households | % Households |
| Under 35 Years | 25 | 3.2% |
| 35 to 44 Years | 162 | 20.5% |
| 45 to 54 Years | 217 | 27.5% |
| 55 to 64 Years | 185 | 23.4% |
| 65 to 74 Years | 110 | 13.9% |
| 75 to 84 Years | 66 | 8.4% |
| 85 Years and Over | 24 | 3.0% |
| Total | 789 | 100.0% |
Housing Finances in Kenilworth
Median Income by Occupancy in Kenilworth
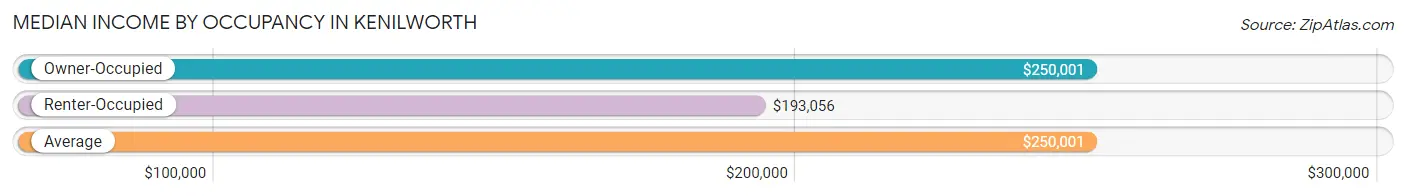
| Occupancy Type | # Households | Median Income |
| Owner-Occupied | 759 (96.2%) | $250,001 |
| Renter-Occupied | 30 (3.8%) | $193,056 |
| Average | 789 (100.0%) | $250,001 |
Occupancy by Householder Income Bracket in Kenilworth
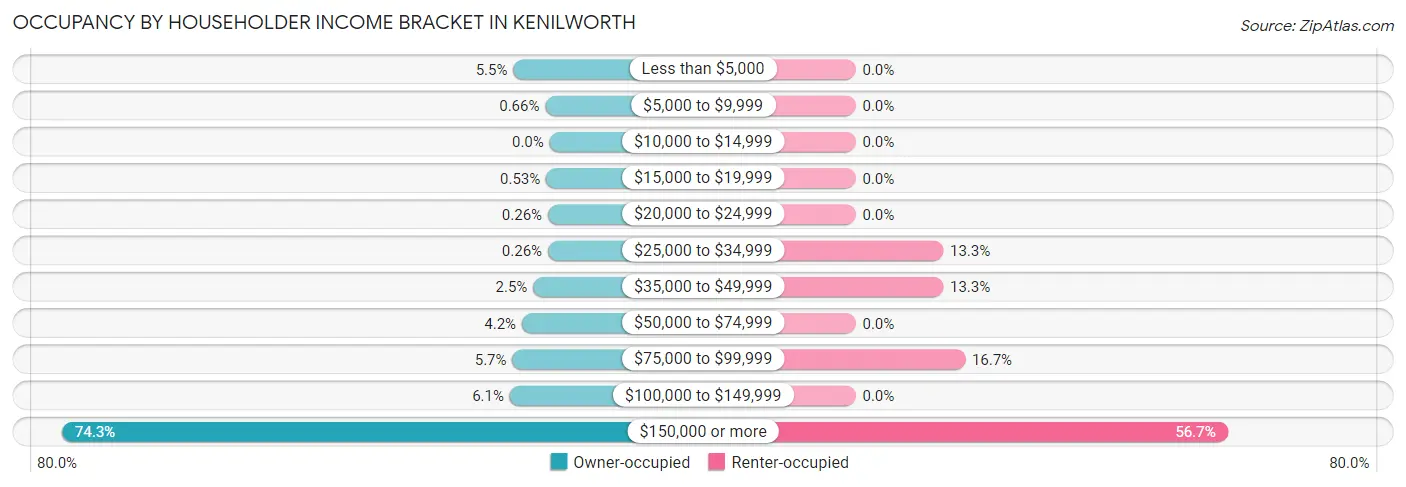
| Income Bracket | Owner-occupied | Renter-occupied |
| Less than $5,000 | 42 (5.5%) | 0 (0.0%) |
| $5,000 to $9,999 | 5 (0.7%) | 0 (0.0%) |
| $10,000 to $14,999 | 0 (0.0%) | 0 (0.0%) |
| $15,000 to $19,999 | 4 (0.5%) | 0 (0.0%) |
| $20,000 to $24,999 | 2 (0.3%) | 0 (0.0%) |
| $25,000 to $34,999 | 2 (0.3%) | 4 (13.3%) |
| $35,000 to $49,999 | 19 (2.5%) | 4 (13.3%) |
| $50,000 to $74,999 | 32 (4.2%) | 0 (0.0%) |
| $75,000 to $99,999 | 43 (5.7%) | 5 (16.7%) |
| $100,000 to $149,999 | 46 (6.1%) | 0 (0.0%) |
| $150,000 or more | 564 (74.3%) | 17 (56.7%) |
| Total | 759 (100.0%) | 30 (100.0%) |
Monthly Housing Cost Tiers in Kenilworth
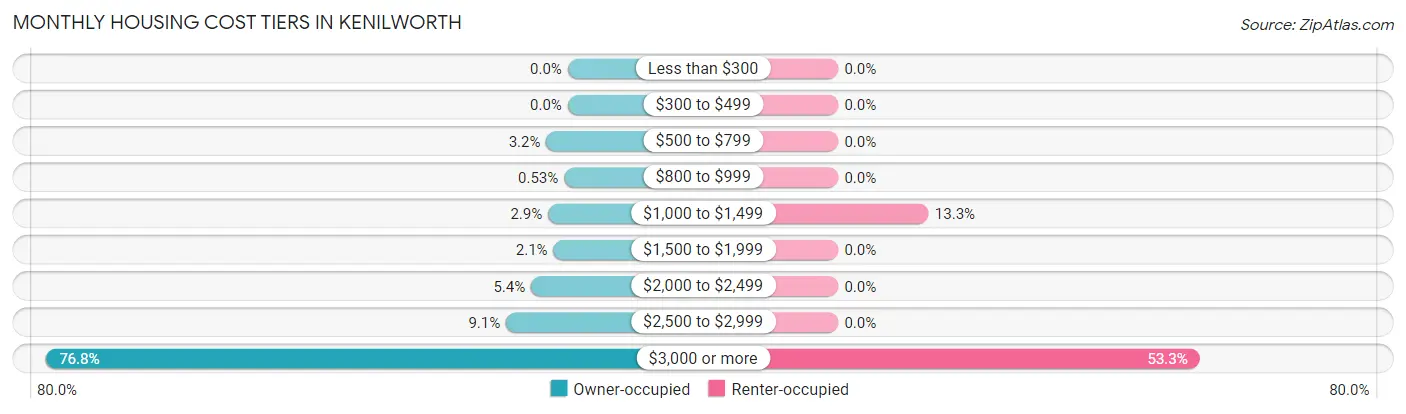
| Monthly Cost | Owner-occupied | Renter-occupied |
| Less than $300 | 0 (0.0%) | 0 (0.0%) |
| $300 to $499 | 0 (0.0%) | 0 (0.0%) |
| $500 to $799 | 24 (3.2%) | 0 (0.0%) |
| $800 to $999 | 4 (0.5%) | 0 (0.0%) |
| $1,000 to $1,499 | 22 (2.9%) | 4 (13.3%) |
| $1,500 to $1,999 | 16 (2.1%) | 0 (0.0%) |
| $2,000 to $2,499 | 41 (5.4%) | 0 (0.0%) |
| $2,500 to $2,999 | 69 (9.1%) | 0 (0.0%) |
| $3,000 or more | 583 (76.8%) | 16 (53.3%) |
| Total | 759 (100.0%) | 30 (100.0%) |
Physical Housing Characteristics in Kenilworth
Housing Structures in Kenilworth
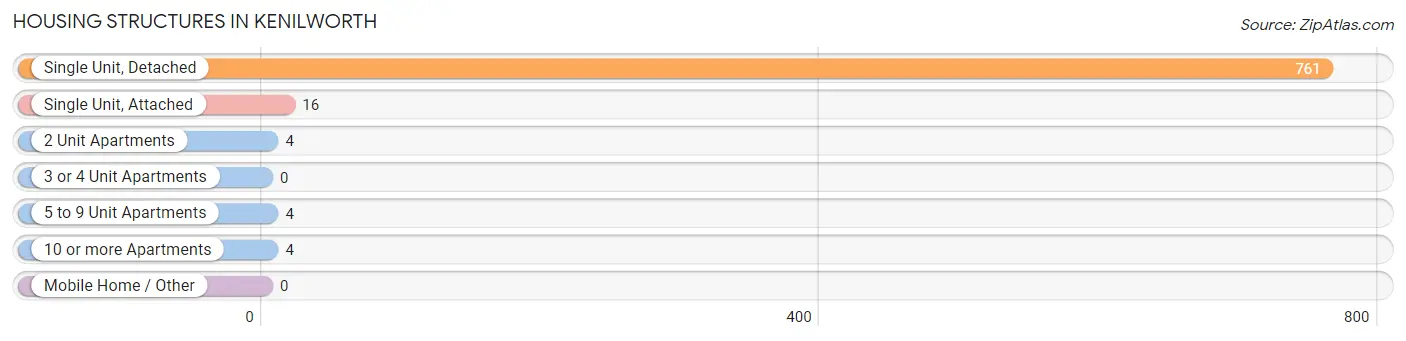
| Structure Type | # Housing Units | % Housing Units |
| Single Unit, Detached | 761 | 96.5% |
| Single Unit, Attached | 16 | 2.0% |
| 2 Unit Apartments | 4 | 0.5% |
| 3 or 4 Unit Apartments | 0 | 0.0% |
| 5 to 9 Unit Apartments | 4 | 0.5% |
| 10 or more Apartments | 4 | 0.5% |
| Mobile Home / Other | 0 | 0.0% |
| Total | 789 | 100.0% |
Housing Structures by Occupancy in Kenilworth
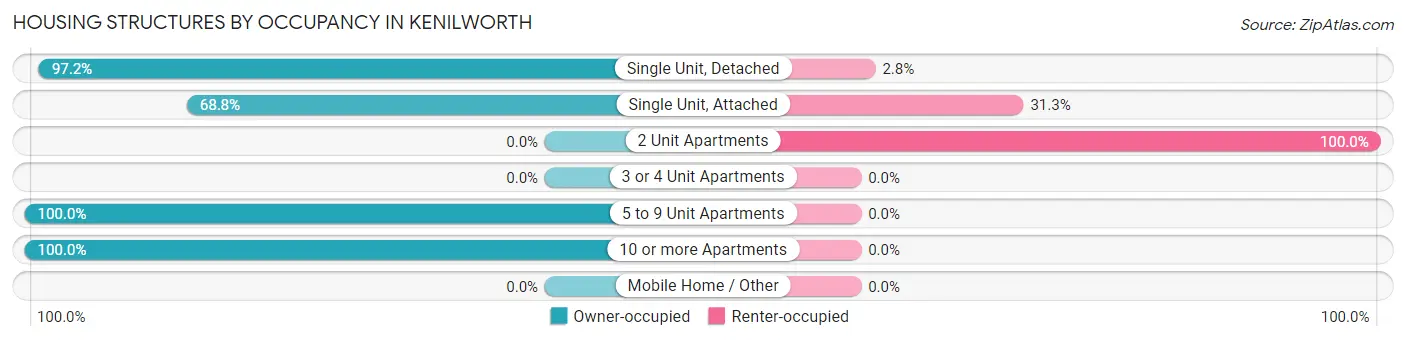
| Structure Type | Owner-occupied | Renter-occupied |
| Single Unit, Detached | 740 (97.2%) | 21 (2.8%) |
| Single Unit, Attached | 11 (68.8%) | 5 (31.2%) |
| 2 Unit Apartments | 0 (0.0%) | 4 (100.0%) |
| 3 or 4 Unit Apartments | 0 (0.0%) | 0 (0.0%) |
| 5 to 9 Unit Apartments | 4 (100.0%) | 0 (0.0%) |
| 10 or more Apartments | 4 (100.0%) | 0 (0.0%) |
| Mobile Home / Other | 0 (0.0%) | 0 (0.0%) |
| Total | 759 (96.2%) | 30 (3.8%) |
Housing Structures by Number of Rooms in Kenilworth
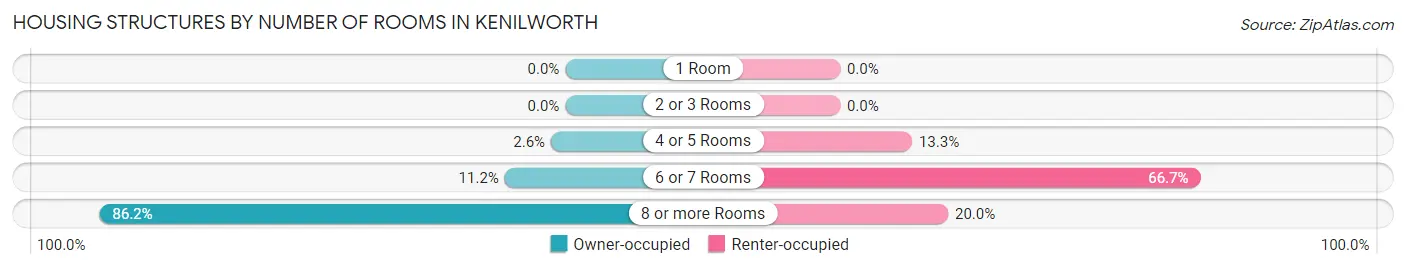
| Number of Rooms | Owner-occupied | Renter-occupied |
| 1 Room | 0 (0.0%) | 0 (0.0%) |
| 2 or 3 Rooms | 0 (0.0%) | 0 (0.0%) |
| 4 or 5 Rooms | 20 (2.6%) | 4 (13.3%) |
| 6 or 7 Rooms | 85 (11.2%) | 20 (66.7%) |
| 8 or more Rooms | 654 (86.2%) | 6 (20.0%) |
| Total | 759 (100.0%) | 30 (100.0%) |
Housing Structure by Heating Type in Kenilworth
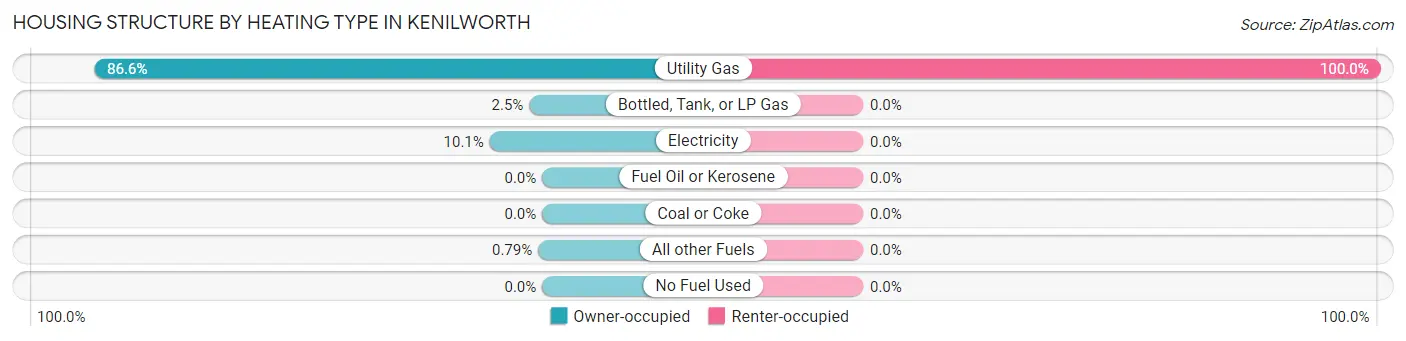
| Heating Type | Owner-occupied | Renter-occupied |
| Utility Gas | 657 (86.6%) | 30 (100.0%) |
| Bottled, Tank, or LP Gas | 19 (2.5%) | 0 (0.0%) |
| Electricity | 77 (10.1%) | 0 (0.0%) |
| Fuel Oil or Kerosene | 0 (0.0%) | 0 (0.0%) |
| Coal or Coke | 0 (0.0%) | 0 (0.0%) |
| All other Fuels | 6 (0.8%) | 0 (0.0%) |
| No Fuel Used | 0 (0.0%) | 0 (0.0%) |
| Total | 759 (100.0%) | 30 (100.0%) |
Household Vehicle Usage in Kenilworth
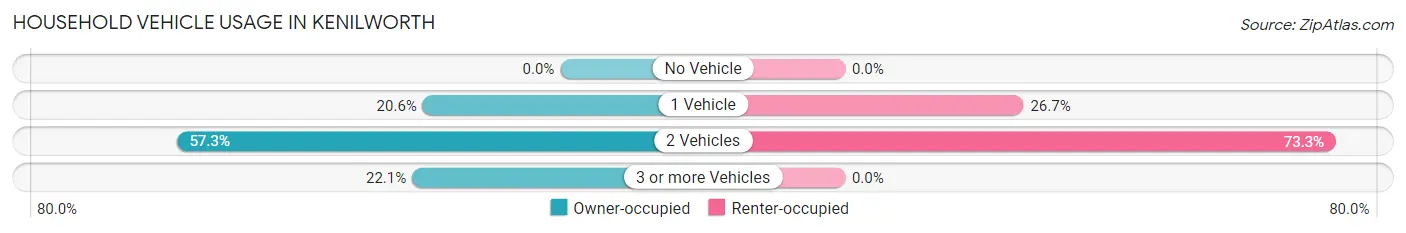
| Vehicles per Household | Owner-occupied | Renter-occupied |
| No Vehicle | 0 (0.0%) | 0 (0.0%) |
| 1 Vehicle | 156 (20.5%) | 8 (26.7%) |
| 2 Vehicles | 435 (57.3%) | 22 (73.3%) |
| 3 or more Vehicles | 168 (22.1%) | 0 (0.0%) |
| Total | 759 (100.0%) | 30 (100.0%) |
Real Estate & Mortgages in Kenilworth
Real Estate and Mortgage Overview in Kenilworth
| Characteristic | Without Mortgage | With Mortgage |
| Housing Units | 274 | 485 |
| Median Property Value | $1,276,300 | $1,405,800 |
| Median Household Income | $243,333 | $403 |
| Monthly Housing Costs | $1,501 | $447 |
| Real Estate Taxes | $10,001 | $0 |
Property Value by Mortgage Status in Kenilworth
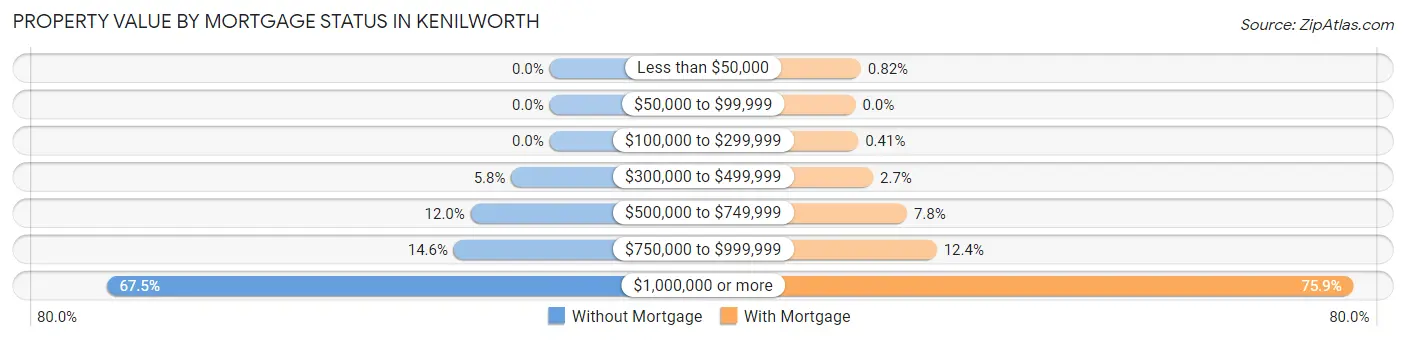
| Property Value | Without Mortgage | With Mortgage |
| Less than $50,000 | 0 (0.0%) | 4 (0.8%) |
| $50,000 to $99,999 | 0 (0.0%) | 0 (0.0%) |
| $100,000 to $299,999 | 0 (0.0%) | 2 (0.4%) |
| $300,000 to $499,999 | 16 (5.8%) | 13 (2.7%) |
| $500,000 to $749,999 | 33 (12.0%) | 38 (7.8%) |
| $750,000 to $999,999 | 40 (14.6%) | 60 (12.4%) |
| $1,000,000 or more | 185 (67.5%) | 368 (75.9%) |
| Total | 274 (100.0%) | 485 (100.0%) |
Household Income by Mortgage Status in Kenilworth
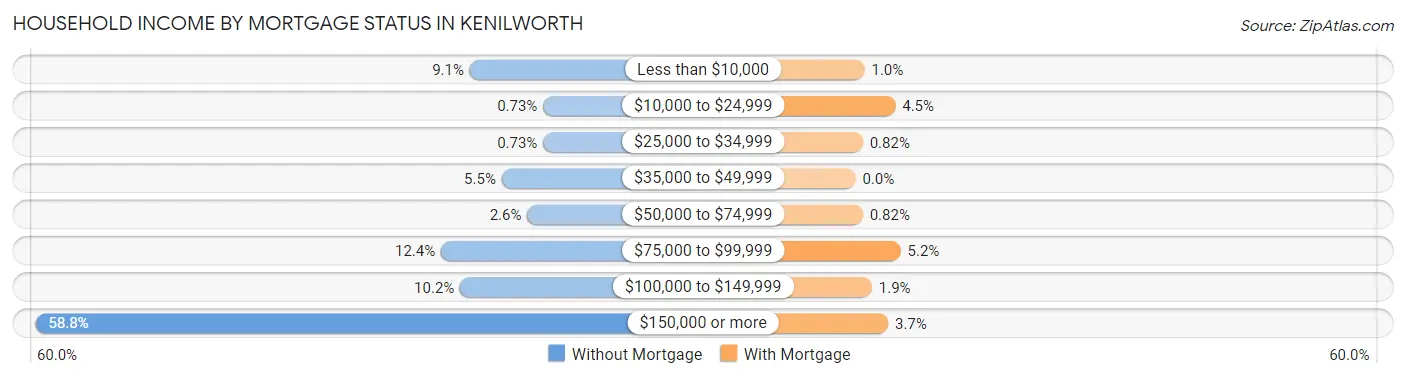
| Household Income | Without Mortgage | With Mortgage |
| Less than $10,000 | 25 (9.1%) | 5 (1.0%) |
| $10,000 to $24,999 | 2 (0.7%) | 22 (4.5%) |
| $25,000 to $34,999 | 2 (0.7%) | 4 (0.8%) |
| $35,000 to $49,999 | 15 (5.5%) | 0 (0.0%) |
| $50,000 to $74,999 | 7 (2.5%) | 4 (0.8%) |
| $75,000 to $99,999 | 34 (12.4%) | 25 (5.1%) |
| $100,000 to $149,999 | 28 (10.2%) | 9 (1.9%) |
| $150,000 or more | 161 (58.8%) | 18 (3.7%) |
| Total | 274 (100.0%) | 485 (100.0%) |
Property Value to Household Income Ratio in Kenilworth
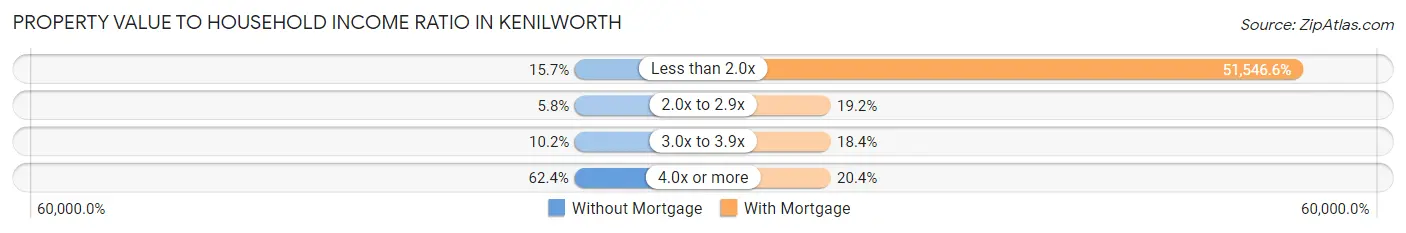
| Value-to-Income Ratio | Without Mortgage | With Mortgage |
| Less than 2.0x | 43 (15.7%) | 250,001 (51,546.6%) |
| 2.0x to 2.9x | 16 (5.8%) | 93 (19.2%) |
| 3.0x to 3.9x | 28 (10.2%) | 89 (18.3%) |
| 4.0x or more | 171 (62.4%) | 99 (20.4%) |
| Total | 274 (100.0%) | 485 (100.0%) |
Real Estate Taxes by Mortgage Status in Kenilworth
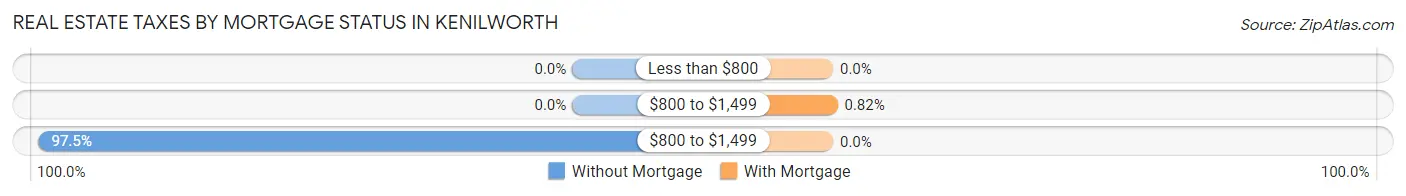
| Property Taxes | Without Mortgage | With Mortgage |
| Less than $800 | 0 (0.0%) | 0 (0.0%) |
| $800 to $1,499 | 0 (0.0%) | 4 (0.8%) |
| $800 to $1,499 | 267 (97.5%) | 0 (0.0%) |
| Total | 274 (100.0%) | 485 (100.0%) |
Health & Disability in Kenilworth
Health Insurance Coverage by Age in Kenilworth
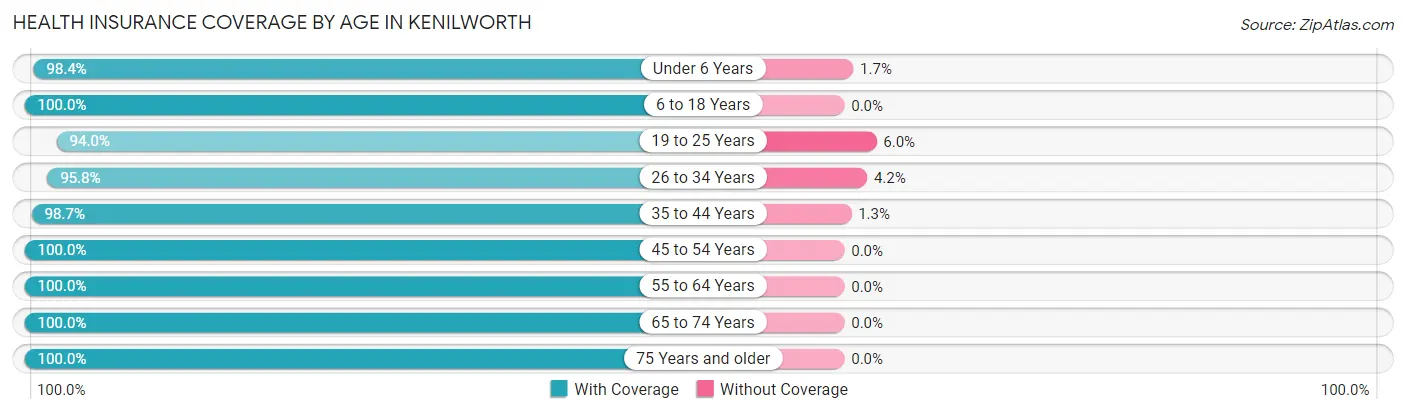
| Age Bracket | With Coverage | Without Coverage |
| Under 6 Years | 238 (98.4%) | 4 (1.7%) |
| 6 to 18 Years | 703 (100.0%) | 0 (0.0%) |
| 19 to 25 Years | 110 (94.0%) | 7 (6.0%) |
| 26 to 34 Years | 68 (95.8%) | 3 (4.2%) |
| 35 to 44 Years | 306 (98.7%) | 4 (1.3%) |
| 45 to 54 Years | 392 (100.0%) | 0 (0.0%) |
| 55 to 64 Years | 361 (100.0%) | 0 (0.0%) |
| 65 to 74 Years | 197 (100.0%) | 0 (0.0%) |
| 75 Years and older | 144 (100.0%) | 0 (0.0%) |
| Total | 2,519 (99.3%) | 18 (0.7%) |
Health Insurance Coverage by Citizenship Status in Kenilworth
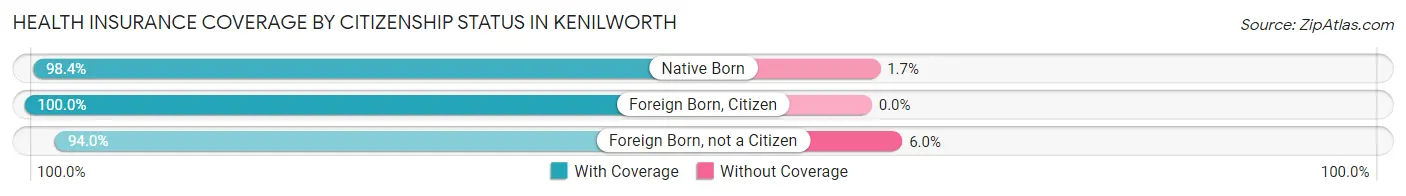
| Citizenship Status | With Coverage | Without Coverage |
| Native Born | 238 (98.4%) | 4 (1.7%) |
| Foreign Born, Citizen | 703 (100.0%) | 0 (0.0%) |
| Foreign Born, not a Citizen | 110 (94.0%) | 7 (6.0%) |
Health Insurance Coverage by Household Income in Kenilworth
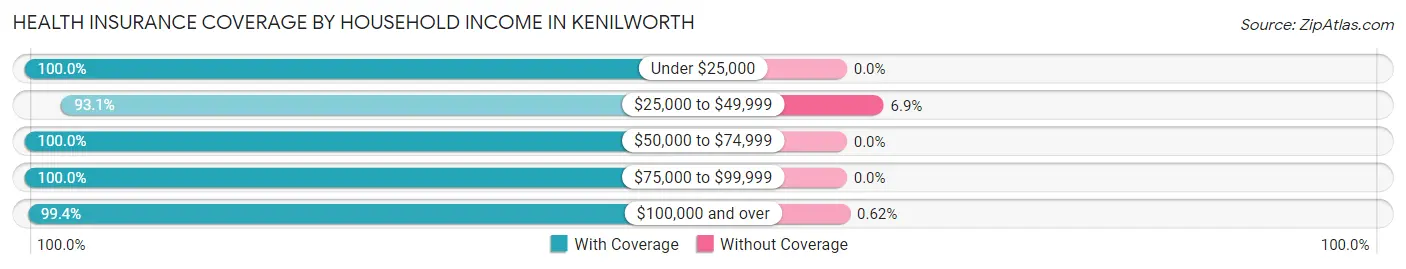
| Household Income | With Coverage | Without Coverage |
| Under $25,000 | 63 (100.0%) | 0 (0.0%) |
| $25,000 to $49,999 | 54 (93.1%) | 4 (6.9%) |
| $50,000 to $74,999 | 67 (100.0%) | 0 (0.0%) |
| $75,000 to $99,999 | 92 (100.0%) | 0 (0.0%) |
| $100,000 and over | 2,243 (99.4%) | 14 (0.6%) |
Public vs Private Health Insurance Coverage by Age in Kenilworth
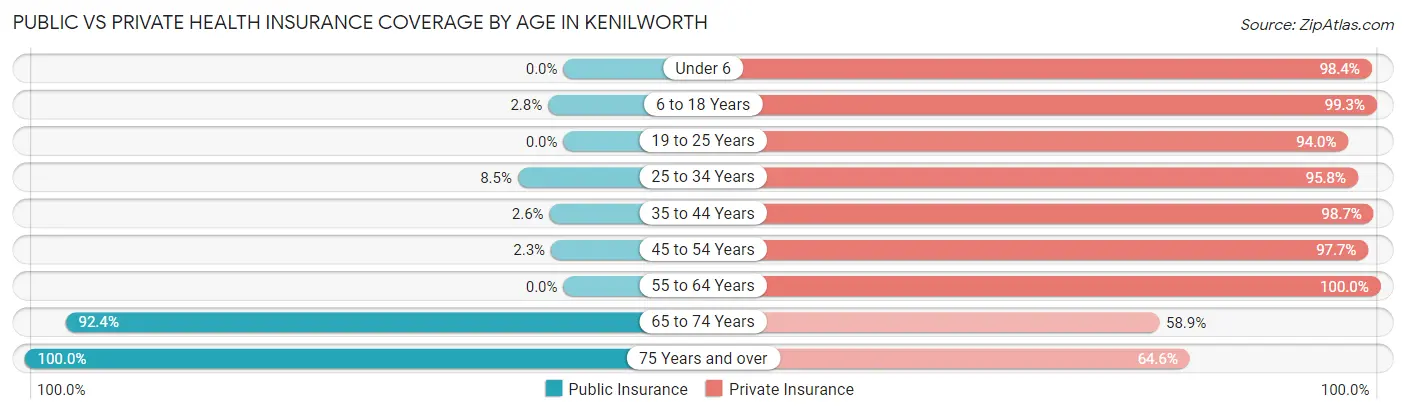
| Age Bracket | Public Insurance | Private Insurance |
| Under 6 | 0 (0.0%) | 238 (98.4%) |
| 6 to 18 Years | 20 (2.8%) | 698 (99.3%) |
| 19 to 25 Years | 0 (0.0%) | 110 (94.0%) |
| 25 to 34 Years | 6 (8.5%) | 68 (95.8%) |
| 35 to 44 Years | 8 (2.6%) | 306 (98.7%) |
| 45 to 54 Years | 9 (2.3%) | 383 (97.7%) |
| 55 to 64 Years | 0 (0.0%) | 361 (100.0%) |
| 65 to 74 Years | 182 (92.4%) | 116 (58.9%) |
| 75 Years and over | 144 (100.0%) | 93 (64.6%) |
| Total | 369 (14.5%) | 2,373 (93.5%) |
Disability Status by Sex by Age in Kenilworth
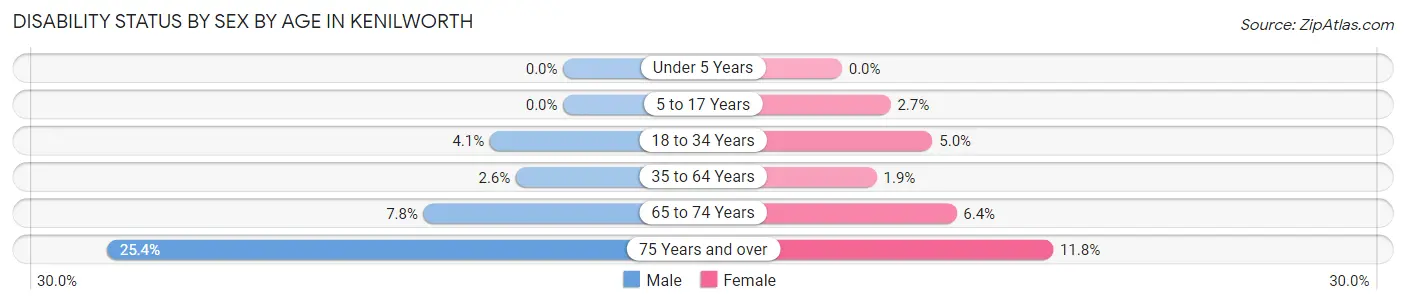
| Age Bracket | Male | Female |
| Under 5 Years | 0 (0.0%) | 0 (0.0%) |
| 5 to 17 Years | 0 (0.0%) | 8 (2.7%) |
| 18 to 34 Years | 4 (4.1%) | 6 (5.0%) |
| 35 to 64 Years | 13 (2.6%) | 11 (1.9%) |
| 65 to 74 Years | 8 (7.8%) | 6 (6.4%) |
| 75 Years and over | 15 (25.4%) | 10 (11.8%) |
Disability Class by Sex by Age in Kenilworth
Disability Class: Hearing Difficulty
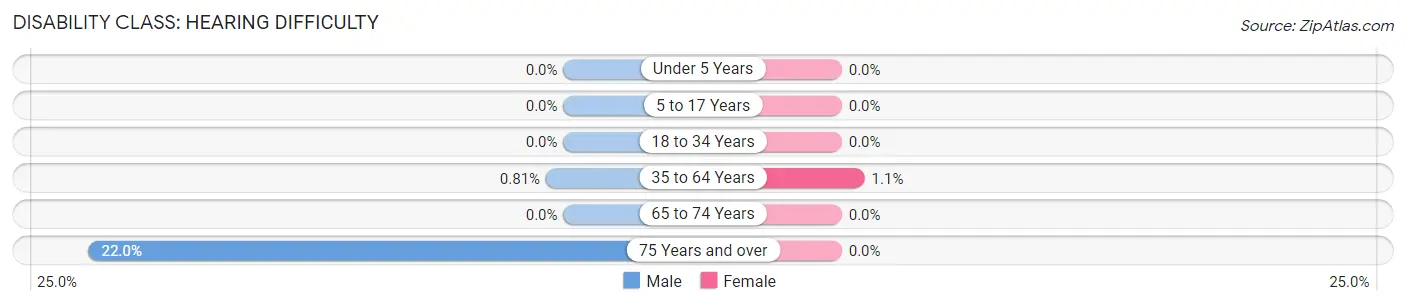
| Age Bracket | Male | Female |
| Under 5 Years | 0 (0.0%) | 0 (0.0%) |
| 5 to 17 Years | 0 (0.0%) | 0 (0.0%) |
| 18 to 34 Years | 0 (0.0%) | 0 (0.0%) |
| 35 to 64 Years | 4 (0.8%) | 6 (1.1%) |
| 65 to 74 Years | 0 (0.0%) | 0 (0.0%) |
| 75 Years and over | 13 (22.0%) | 0 (0.0%) |
Disability Class: Vision Difficulty
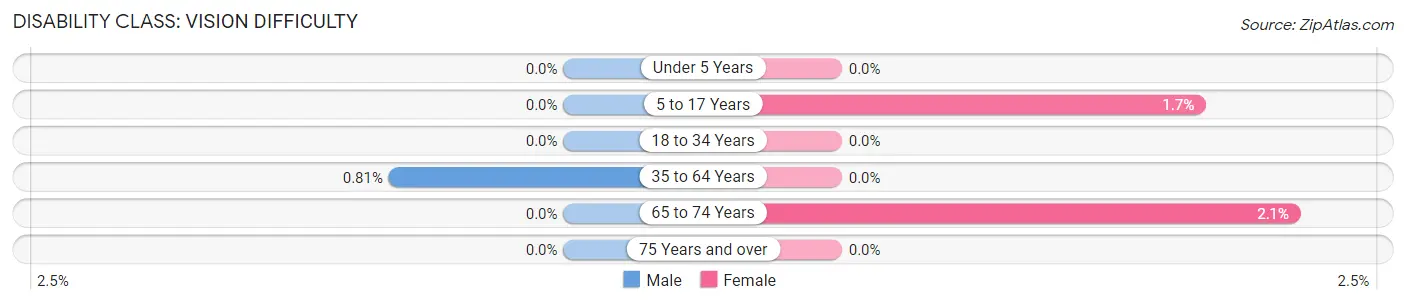
| Age Bracket | Male | Female |
| Under 5 Years | 0 (0.0%) | 0 (0.0%) |
| 5 to 17 Years | 0 (0.0%) | 5 (1.7%) |
| 18 to 34 Years | 0 (0.0%) | 0 (0.0%) |
| 35 to 64 Years | 4 (0.8%) | 0 (0.0%) |
| 65 to 74 Years | 0 (0.0%) | 2 (2.1%) |
| 75 Years and over | 0 (0.0%) | 0 (0.0%) |
Disability Class: Cognitive Difficulty
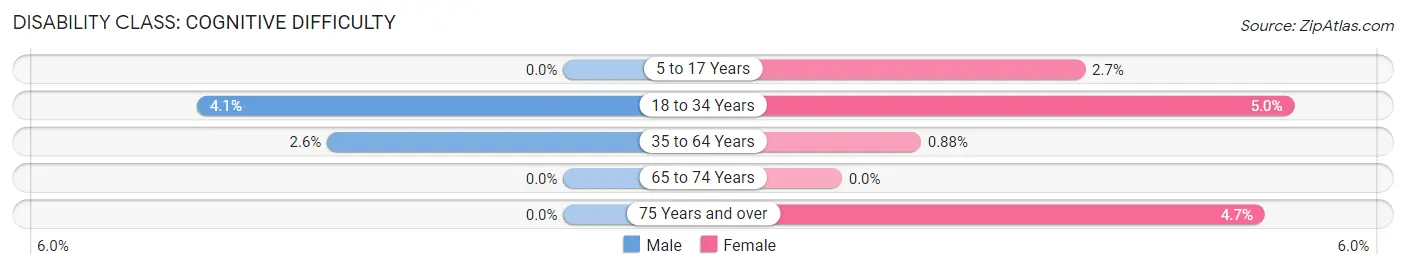
| Age Bracket | Male | Female |
| 5 to 17 Years | 0 (0.0%) | 8 (2.7%) |
| 18 to 34 Years | 4 (4.1%) | 6 (5.0%) |
| 35 to 64 Years | 13 (2.6%) | 5 (0.9%) |
| 65 to 74 Years | 0 (0.0%) | 0 (0.0%) |
| 75 Years and over | 0 (0.0%) | 4 (4.7%) |
Disability Class: Ambulatory Difficulty
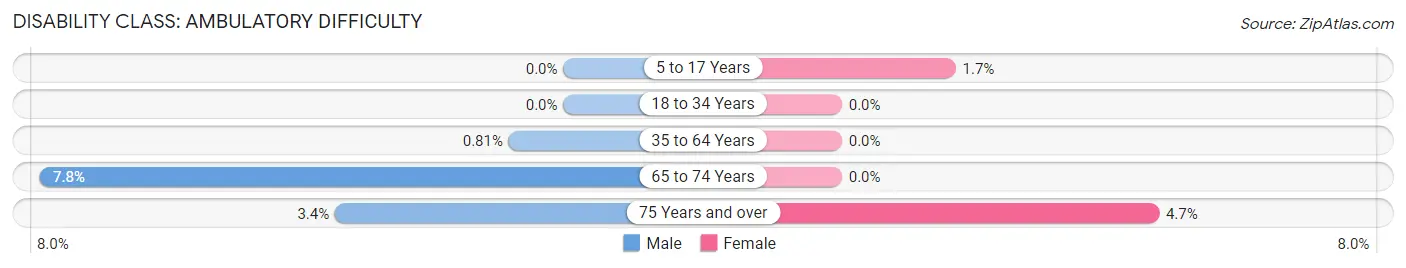
| Age Bracket | Male | Female |
| 5 to 17 Years | 0 (0.0%) | 5 (1.7%) |
| 18 to 34 Years | 0 (0.0%) | 0 (0.0%) |
| 35 to 64 Years | 4 (0.8%) | 0 (0.0%) |
| 65 to 74 Years | 8 (7.8%) | 0 (0.0%) |
| 75 Years and over | 2 (3.4%) | 4 (4.7%) |
Disability Class: Self-Care Difficulty
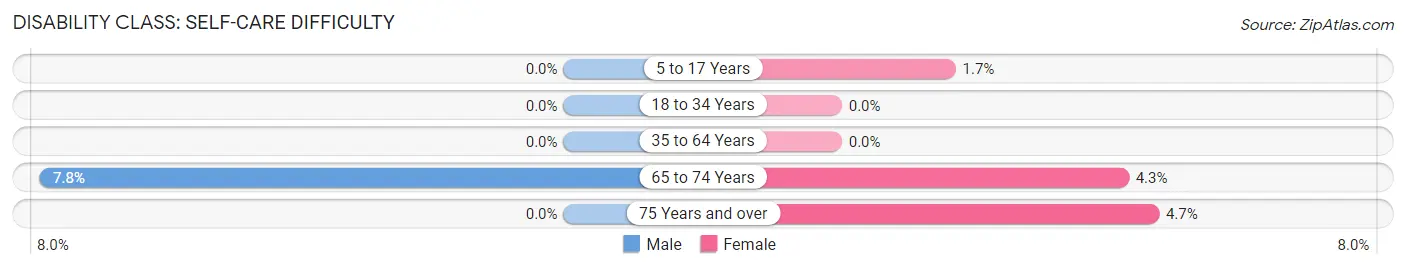
| Age Bracket | Male | Female |
| 5 to 17 Years | 0 (0.0%) | 5 (1.7%) |
| 18 to 34 Years | 0 (0.0%) | 0 (0.0%) |
| 35 to 64 Years | 0 (0.0%) | 0 (0.0%) |
| 65 to 74 Years | 8 (7.8%) | 4 (4.3%) |
| 75 Years and over | 0 (0.0%) | 4 (4.7%) |
Technology Access in Kenilworth
Computing Device Access in Kenilworth
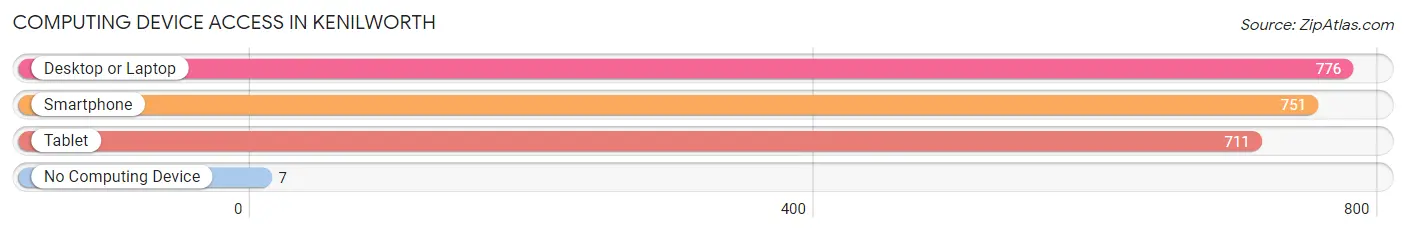
| Device Type | # Households | % Households |
| Desktop or Laptop | 776 | 98.4% |
| Smartphone | 751 | 95.2% |
| Tablet | 711 | 90.1% |
| No Computing Device | 7 | 0.9% |
| Total | 789 | 100.0% |
Internet Access in Kenilworth
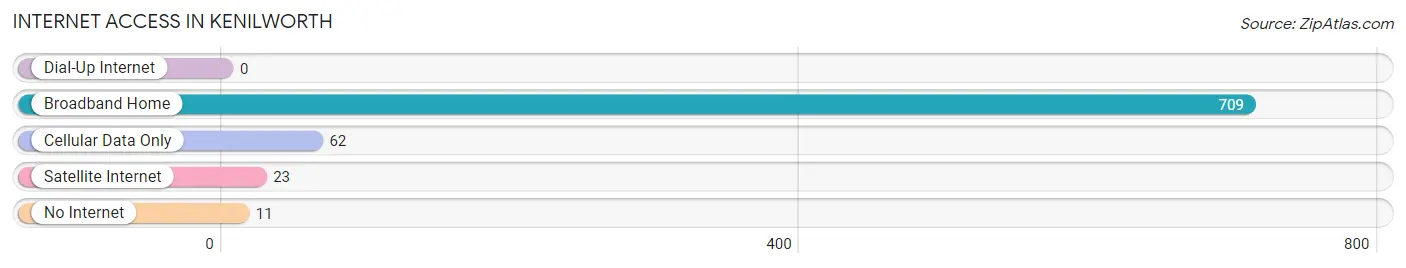
| Internet Type | # Households | % Households |
| Dial-Up Internet | 0 | 0.0% |
| Broadband Home | 709 | 89.9% |
| Cellular Data Only | 62 | 7.9% |
| Satellite Internet | 23 | 2.9% |
| No Internet | 11 | 1.4% |
| Total | 789 | 100.0% |
Kenilworth Summary
Kenilworth, Illinois is a small village located in Cook County, approximately 25 miles north of Chicago. It is a part of the North Shore area, which is known for its affluent communities and high-end shopping. The village has a population of 2,513 people, according to the 2010 census.
History
Kenilworth was founded in 1889 by Joseph Sears, a wealthy Chicago businessman. He purchased the land from the Potawatomi Indians and named the village after his hometown of Kenilworth, England. Sears envisioned a community of wealthy families living in large homes and enjoying the beauty of the area. He built a large estate for himself and his family, which is now a National Historic Landmark.
The village was incorporated in 1891 and the first mayor was elected in 1892. The village was designed to be a residential community and the streets were laid out in a grid pattern. The village was designed to be a quiet, peaceful place and the streets were lined with trees and shrubs.
Geography
Kenilworth is located in Cook County, Illinois, approximately 25 miles north of Chicago. It is bordered by Wilmette to the north, Winnetka to the east, and Skokie to the south. The village is situated on the shores of Lake Michigan and is part of the North Shore area. The village covers an area of 0.8 square miles and has a population of 2,513 people, according to the 2010 census.
The village is located in a temperate climate zone and experiences four distinct seasons. Summers are warm and humid, while winters are cold and snowy. The average annual temperature is around 50 degrees Fahrenheit.
Economy
Kenilworth is a wealthy community and the median household income is $200,000. The village is home to many affluent families and is known for its high-end shopping and dining. The village is also home to several corporate headquarters, including the headquarters of the Wm. Wrigley Jr. Company.
The village is served by the Metra commuter rail line, which provides access to downtown Chicago. The village is also served by several major highways, including Interstate 94 and the Edens Expressway.
Demographics
Kenilworth is a small village with a population of 2,513 people, according to the 2010 census. The population is predominantly white (94.3%) and the median age is 44.7 years. The median household income is $200,000 and the median home value is $1,000,000.
The village is home to many affluent families and is known for its high-end shopping and dining. The village is also home to several corporate headquarters, including the headquarters of the Wm. Wrigley Jr. Company.
Conclusion
Kenilworth, Illinois is a small village located in Cook County, approximately 25 miles north of Chicago. It is a part of the North Shore area, which is known for its affluent communities and high-end shopping. The village has a population of 2,513 people, according to the 2010 census. The village was founded in 1889 by Joseph Sears and was designed to be a residential community. The village is located in a temperate climate zone and experiences four distinct seasons. The village is home to many affluent families and is known for its high-end shopping and dining. The median household income is $200,000 and the median home value is $1,000,000.
Common Questions
What is Per Capita Income in Kenilworth?
Per Capita income in Kenilworth is $137,263.
What is the Median Family Income in Kenilworth?
Median Family Income in Kenilworth is $250,001.
What is the Median Household income in Kenilworth?
Median Household Income in Kenilworth is $250,001.
What is Income or Wage Gap in Kenilworth?
Income or Wage Gap in Kenilworth is 85.2%.
Women in Kenilworth earn 14.8 cents for every dollar earned by a man.
What is Inequality or Gini Index in Kenilworth?
Inequality or Gini Index in Kenilworth is 0.48.
What is the Total Population of Kenilworth?
Total Population of Kenilworth is 2,537.
What is the Total Male Population of Kenilworth?
Total Male Population of Kenilworth is 1,219.
What is the Total Female Population of Kenilworth?
Total Female Population of Kenilworth is 1,318.
What is the Ratio of Males per 100 Females in Kenilworth?
There are 92.49 Males per 100 Females in Kenilworth.
What is the Ratio of Females per 100 Males in Kenilworth?
There are 108.12 Females per 100 Males in Kenilworth.
What is the Median Population Age in Kenilworth?
Median Population Age in Kenilworth is 40.5 Years.
What is the Average Family Size in Kenilworth
Average Family Size in Kenilworth is 3.6 People.
What is the Average Household Size in Kenilworth
Average Household Size in Kenilworth is 3.2 People.
How Large is the Labor Force in Kenilworth?
There are 963 People in the Labor Forcein in Kenilworth.
What is the Percentage of People in the Labor Force in Kenilworth?
56.5% of People are in the Labor Force in Kenilworth.
What is the Unemployment Rate in Kenilworth?
Unemployment Rate in Kenilworth is 3.3%.