Lake Villa, IL Map & Demographics
Lake Villa Map
Lake Villa Overview
$51,329
PER CAPITA INCOME
$149,345
AVG FAMILY INCOME
$126,711
AVG HOUSEHOLD INCOME
28.3%
WAGE / INCOME GAP [ % ]
71.7¢/ $1
WAGE / INCOME GAP [ $ ]
0.38
INEQUALITY / GINI INDEX
8,701
TOTAL POPULATION
4,255
MALE POPULATION
4,446
FEMALE POPULATION
95.70
MALES / 100 FEMALES
104.49
FEMALES / 100 MALES
40.9
MEDIAN AGE
3.2
AVG FAMILY SIZE
2.8
AVG HOUSEHOLD SIZE
4,772
LABOR FORCE [ PEOPLE ]
68.4%
PERCENT IN LABOR FORCE
6.7%
UNEMPLOYMENT RATE
Lake Villa Zip Codes
Income in Lake Villa
Income Overview in Lake Villa
Per Capita Income in Lake Villa is $51,329, while median incomes of families and households are $149,345 and $126,711 respectively.
| Characteristic | Number | Measure |
| Per Capita Income | 8,701 | $51,329 |
| Median Family Income | 2,437 | $149,345 |
| Mean Family Income | 2,437 | $164,647 |
| Median Household Income | 3,078 | $126,711 |
| Mean Household Income | 3,078 | $142,916 |
| Income Deficit | 2,437 | $0 |
| Wage / Income Gap (%) | 8,701 | 28.25% |
| Wage / Income Gap ($) | 8,701 | 71.75¢ per $1 |
| Gini / Inequality Index | 8,701 | 0.38 |
Earnings by Sex in Lake Villa
Average Earnings in Lake Villa are $61,277, $77,802 for men and $55,821 for women, a difference of 28.2%.
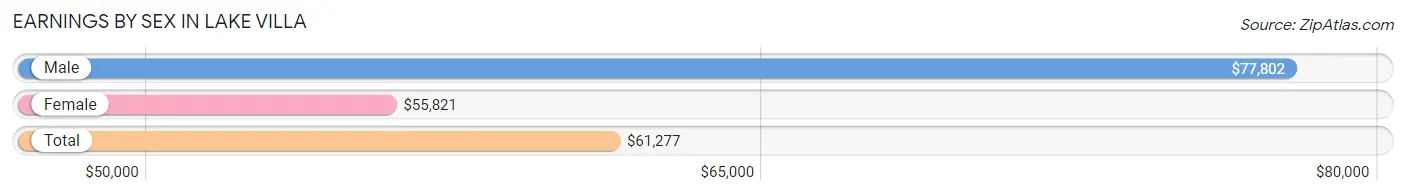
| Sex | Number | Average Earnings |
| Male | 2,567 (52.5%) | $77,802 |
| Female | 2,324 (47.5%) | $55,821 |
| Total | 4,891 (100.0%) | $61,277 |
Earnings by Sex by Income Bracket in Lake Villa
The most common earnings brackets in Lake Villa are $100,000+ for men (884 | 34.4%) and $100,000+ for women (614 | 26.4%).
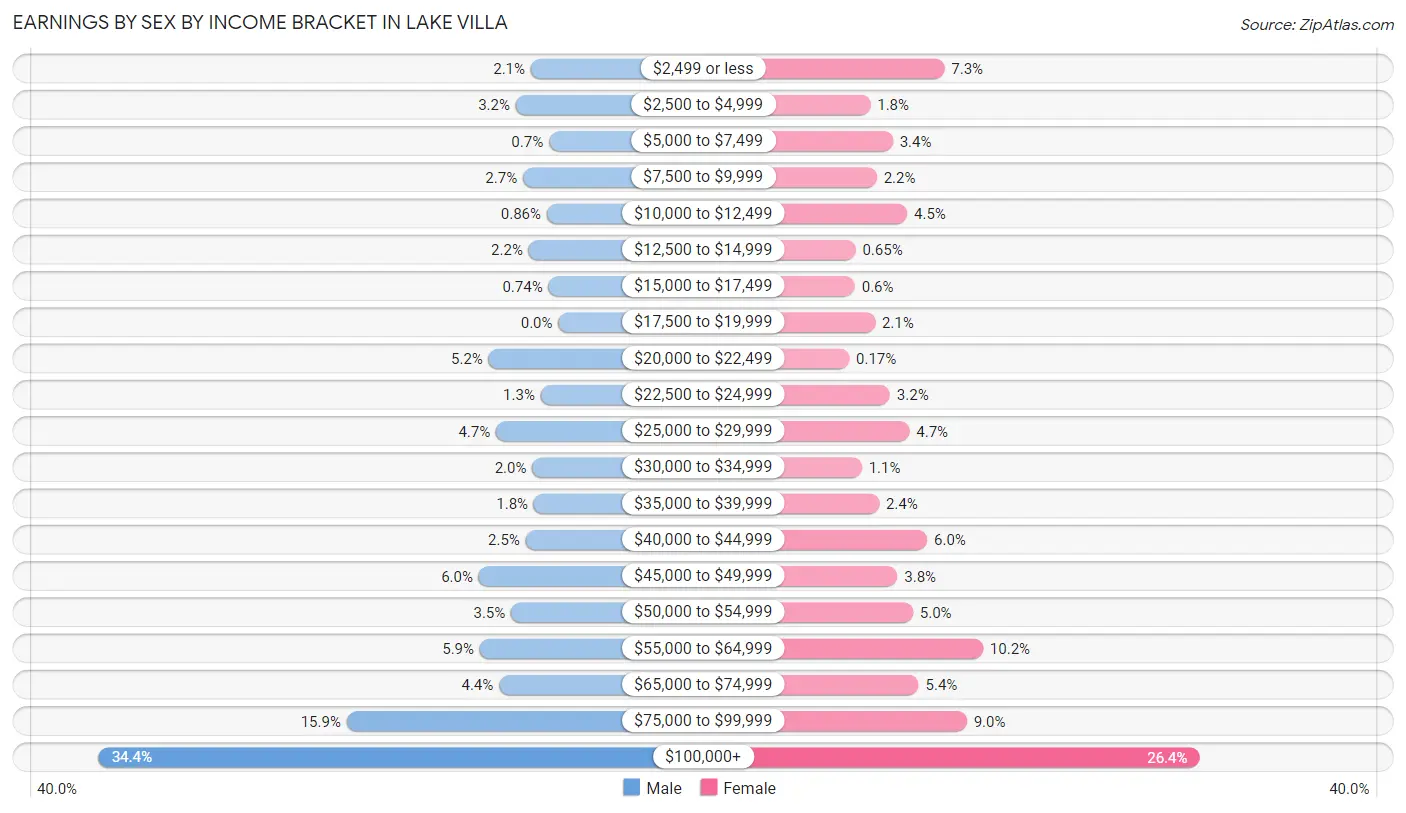
| Income | Male | Female |
| $2,499 or less | 53 (2.1%) | 170 (7.3%) |
| $2,500 to $4,999 | 82 (3.2%) | 41 (1.8%) |
| $5,000 to $7,499 | 18 (0.7%) | 80 (3.4%) |
| $7,500 to $9,999 | 68 (2.6%) | 52 (2.2%) |
| $10,000 to $12,499 | 22 (0.9%) | 105 (4.5%) |
| $12,500 to $14,999 | 57 (2.2%) | 15 (0.6%) |
| $15,000 to $17,499 | 19 (0.7%) | 14 (0.6%) |
| $17,500 to $19,999 | 0 (0.0%) | 49 (2.1%) |
| $20,000 to $22,499 | 134 (5.2%) | 4 (0.2%) |
| $22,500 to $24,999 | 34 (1.3%) | 75 (3.2%) |
| $25,000 to $29,999 | 120 (4.7%) | 109 (4.7%) |
| $30,000 to $34,999 | 50 (1.9%) | 26 (1.1%) |
| $35,000 to $39,999 | 47 (1.8%) | 56 (2.4%) |
| $40,000 to $44,999 | 63 (2.5%) | 140 (6.0%) |
| $45,000 to $49,999 | 153 (6.0%) | 88 (3.8%) |
| $50,000 to $54,999 | 91 (3.5%) | 115 (5.0%) |
| $55,000 to $64,999 | 151 (5.9%) | 237 (10.2%) |
| $65,000 to $74,999 | 114 (4.4%) | 125 (5.4%) |
| $75,000 to $99,999 | 407 (15.9%) | 209 (9.0%) |
| $100,000+ | 884 (34.4%) | 614 (26.4%) |
| Total | 2,567 (100.0%) | 2,324 (100.0%) |
Earnings by Sex by Educational Attainment in Lake Villa
Average earnings in Lake Villa are $90,464 for men and $65,066 for women, a difference of 28.1%. Men with an educational attainment of graduate degree enjoy the highest average annual earnings of $110,313, while those with less than high school education earn the least with $50,125. Women with an educational attainment of bachelor's degree earn the most with the average annual earnings of $101,094, while those with high school diploma education have the smallest earnings of $42,262.
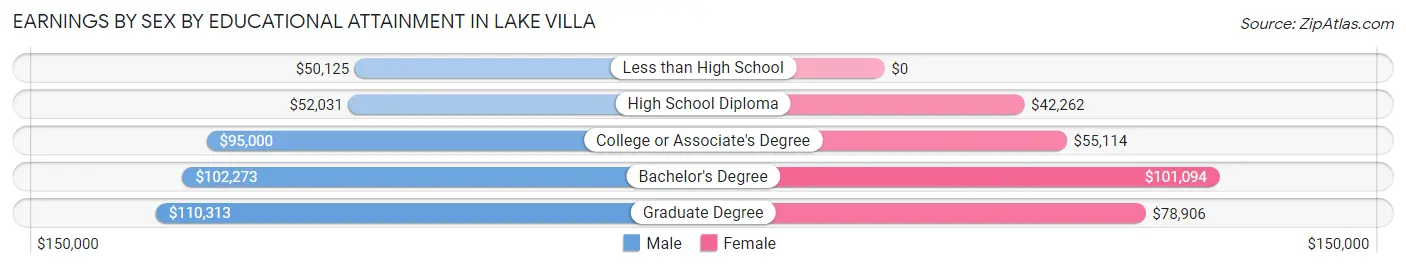
| Educational Attainment | Male Income | Female Income |
| Less than High School | $50,125 | $0 |
| High School Diploma | $52,031 | $42,262 |
| College or Associate's Degree | $95,000 | $55,114 |
| Bachelor's Degree | $102,273 | $101,094 |
| Graduate Degree | $110,313 | $78,906 |
| Total | $90,464 | $65,066 |
Family Income in Lake Villa
Family Income Brackets in Lake Villa
According to the Lake Villa family income data, there are 653 families falling into the $200,000+ income range, which is the most common income bracket and makes up 26.8% of all families. Conversely, the $25,000 to $34,999 income bracket is the least frequent group with only 12 families (0.5%) belonging to this category.
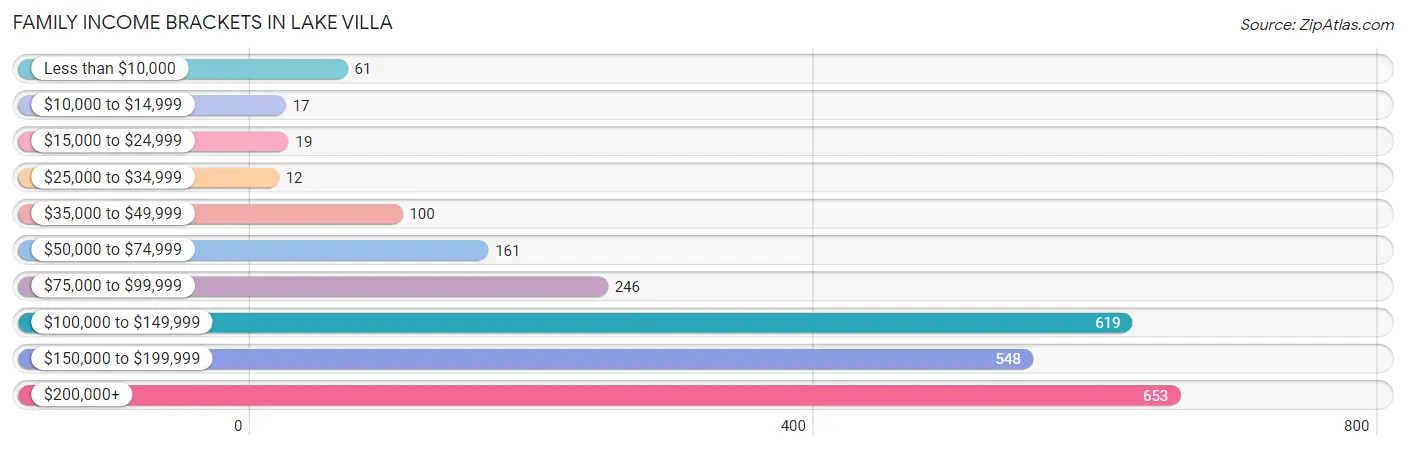
| Income Bracket | # Families | % Families |
| Less than $10,000 | 61 | 2.5% |
| $10,000 to $14,999 | 17 | 0.7% |
| $15,000 to $24,999 | 19 | 0.8% |
| $25,000 to $34,999 | 12 | 0.5% |
| $35,000 to $49,999 | 100 | 4.1% |
| $50,000 to $74,999 | 161 | 6.6% |
| $75,000 to $99,999 | 246 | 10.1% |
| $100,000 to $149,999 | 619 | 25.4% |
| $150,000 to $199,999 | 548 | 22.5% |
| $200,000+ | 653 | 26.8% |
Family Income by Famaliy Size in Lake Villa
7+ person families (32 | 1.3%) account for the highest median family income in Lake Villa with $236,042 per family, while 2-person families (1,087 | 44.6%) have the highest median income of $64,252 per family member.
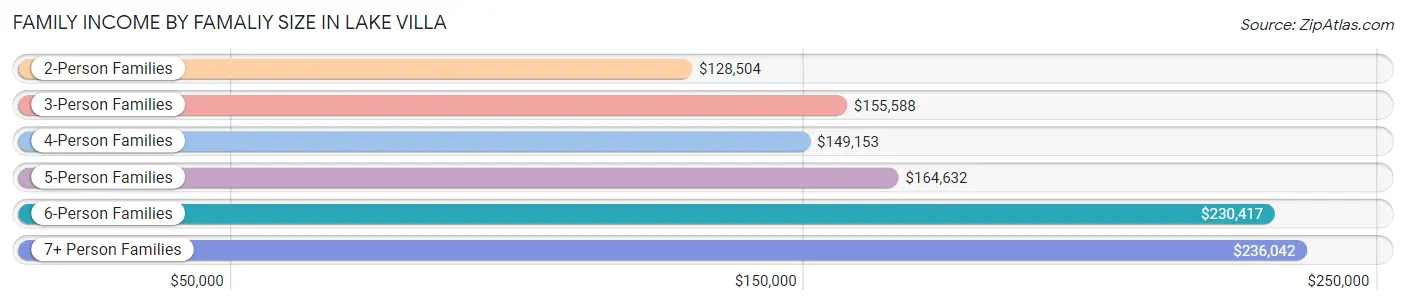
| Income Bracket | # Families | Median Income |
| 2-Person Families | 1,087 (44.6%) | $128,504 |
| 3-Person Families | 393 (16.1%) | $155,588 |
| 4-Person Families | 609 (25.0%) | $149,153 |
| 5-Person Families | 269 (11.0%) | $164,632 |
| 6-Person Families | 47 (1.9%) | $230,417 |
| 7+ Person Families | 32 (1.3%) | $236,042 |
| Total | 2,437 (100.0%) | $149,345 |
Family Income by Number of Earners in Lake Villa
The median family income in Lake Villa is $149,345, with families comprising 2 earners (1,125) having the highest median family income of $175,134, while families with no earners (202) have the lowest median family income of $76,667, accounting for 46.2% and 8.3% of families, respectively.
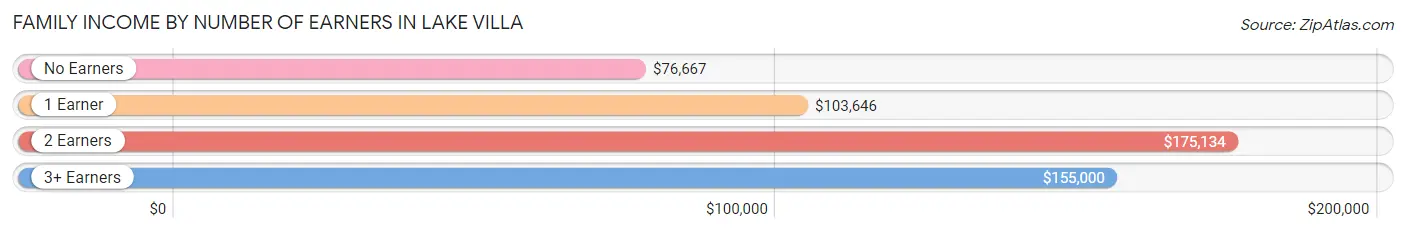
| Number of Earners | # Families | Median Income |
| No Earners | 202 (8.3%) | $76,667 |
| 1 Earner | 722 (29.6%) | $103,646 |
| 2 Earners | 1,125 (46.2%) | $175,134 |
| 3+ Earners | 388 (15.9%) | $155,000 |
| Total | 2,437 (100.0%) | $149,345 |
Household Income in Lake Villa
Household Income Brackets in Lake Villa
With 686 households falling in the category, the $100,000 to $149,999 income range is the most frequent in Lake Villa, accounting for 22.3% of all households. In contrast, only 37 households (1.2%) fall into the $10,000 to $14,999 income bracket, making it the least populous group.
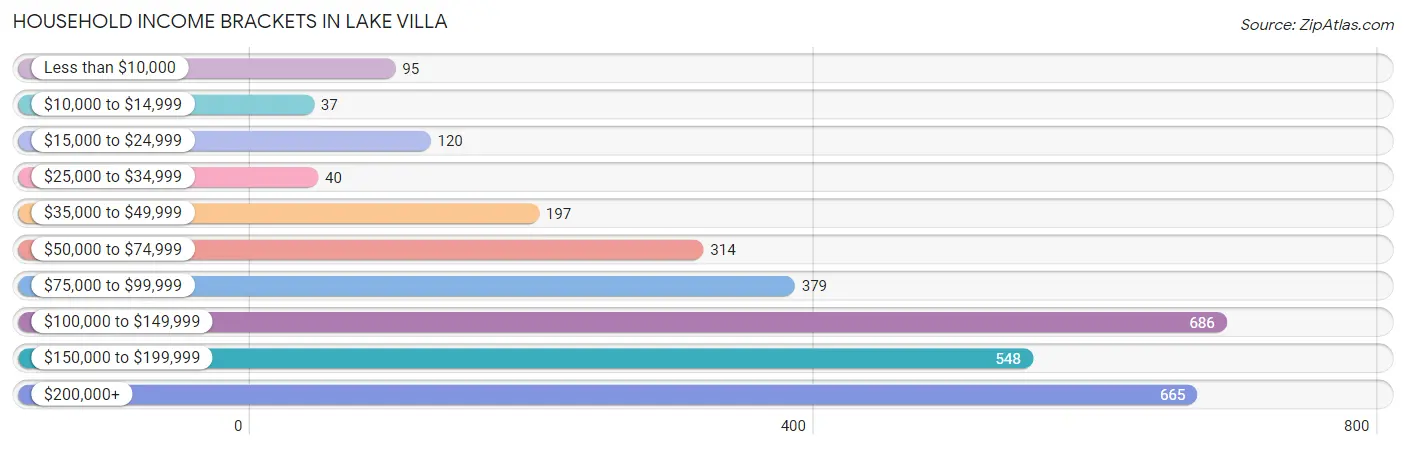
| Income Bracket | # Households | % Households |
| Less than $10,000 | 95 | 3.1% |
| $10,000 to $14,999 | 37 | 1.2% |
| $15,000 to $24,999 | 120 | 3.9% |
| $25,000 to $34,999 | 40 | 1.3% |
| $35,000 to $49,999 | 197 | 6.4% |
| $50,000 to $74,999 | 314 | 10.2% |
| $75,000 to $99,999 | 379 | 12.3% |
| $100,000 to $149,999 | 686 | 22.3% |
| $150,000 to $199,999 | 548 | 17.8% |
| $200,000+ | 665 | 21.6% |
Household Income by Householder Age in Lake Villa
The median household income in Lake Villa is $126,711, with the highest median household income of $149,750 found in the 45 to 64 years age bracket for the primary householder. A total of 1,680 households (54.6%) fall into this category. Meanwhile, the 15 to 24 years age bracket for the primary householder has the lowest median household income of $57,115, with 88 households (2.9%) in this group.
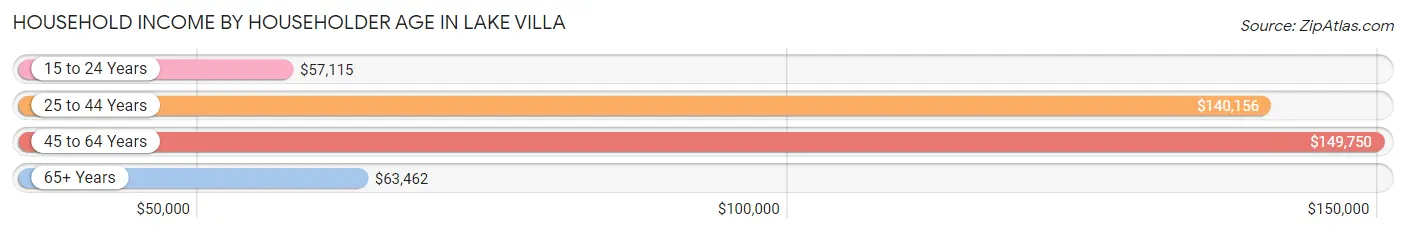
| Income Bracket | # Households | Median Income |
| 15 to 24 Years | 88 (2.9%) | $57,115 |
| 25 to 44 Years | 694 (22.6%) | $140,156 |
| 45 to 64 Years | 1,680 (54.6%) | $149,750 |
| 65+ Years | 616 (20.0%) | $63,462 |
| Total | 3,078 (100.0%) | $126,711 |
Poverty in Lake Villa
Income Below Poverty by Sex and Age in Lake Villa
With 2.9% poverty level for males and 6.0% for females among the residents of Lake Villa, 15 year old males and 18 to 24 year old females are the most vulnerable to poverty, with 19 males (17.0%) and 100 females (21.4%) in their respective age groups living below the poverty level.
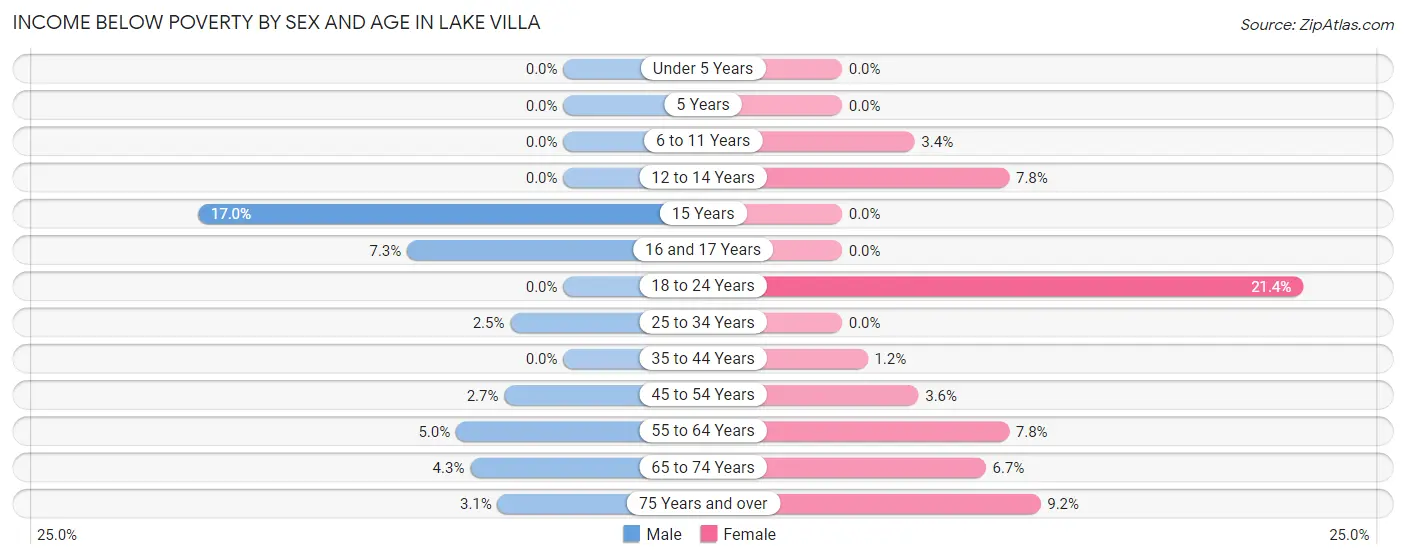
| Age Bracket | Male | Female |
| Under 5 Years | 0 (0.0%) | 0 (0.0%) |
| 5 Years | 0 (0.0%) | 0 (0.0%) |
| 6 to 11 Years | 0 (0.0%) | 13 (3.4%) |
| 12 to 14 Years | 0 (0.0%) | 19 (7.8%) |
| 15 Years | 19 (17.0%) | 0 (0.0%) |
| 16 and 17 Years | 24 (7.2%) | 0 (0.0%) |
| 18 to 24 Years | 0 (0.0%) | 100 (21.4%) |
| 25 to 34 Years | 8 (2.5%) | 0 (0.0%) |
| 35 to 44 Years | 0 (0.0%) | 6 (1.2%) |
| 45 to 54 Years | 20 (2.7%) | 29 (3.5%) |
| 55 to 64 Years | 35 (5.0%) | 55 (7.7%) |
| 65 to 74 Years | 13 (4.3%) | 23 (6.7%) |
| 75 Years and over | 4 (3.0%) | 21 (9.2%) |
| Total | 123 (2.9%) | 266 (6.0%) |
Income Above Poverty by Sex and Age in Lake Villa
According to the poverty statistics in Lake Villa, males aged under 5 years and females aged under 5 years are the age groups that are most secure financially, with 100.0% of males and 100.0% of females in these age groups living above the poverty line.
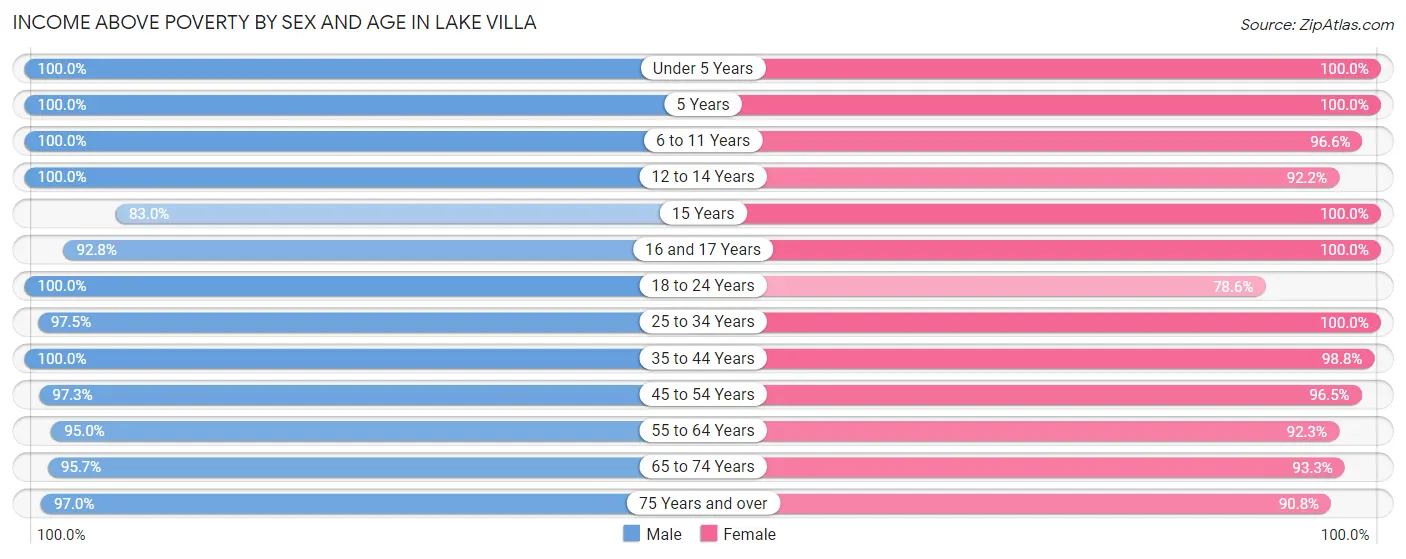
| Age Bracket | Male | Female |
| Under 5 Years | 138 (100.0%) | 187 (100.0%) |
| 5 Years | 28 (100.0%) | 29 (100.0%) |
| 6 to 11 Years | 265 (100.0%) | 373 (96.6%) |
| 12 to 14 Years | 252 (100.0%) | 226 (92.2%) |
| 15 Years | 93 (83.0%) | 70 (100.0%) |
| 16 and 17 Years | 307 (92.7%) | 142 (100.0%) |
| 18 to 24 Years | 477 (100.0%) | 367 (78.6%) |
| 25 to 34 Years | 317 (97.5%) | 317 (100.0%) |
| 35 to 44 Years | 427 (100.0%) | 498 (98.8%) |
| 45 to 54 Years | 711 (97.3%) | 787 (96.5%) |
| 55 to 64 Years | 668 (95.0%) | 655 (92.2%) |
| 65 to 74 Years | 288 (95.7%) | 322 (93.3%) |
| 75 Years and over | 127 (97.0%) | 207 (90.8%) |
| Total | 4,098 (97.1%) | 4,180 (94.0%) |
Income Below Poverty Among Married-Couple Families in Lake Villa
The poverty statistics for married-couple families in Lake Villa show that 3.5% or 72 of the total 2,029 families live below the poverty line. Families with 1 or 2 children have the highest poverty rate of 4.3%, comprising of 35 families. On the other hand, families with 3 or 4 children have the lowest poverty rate of 0.0%, which includes 0 families.
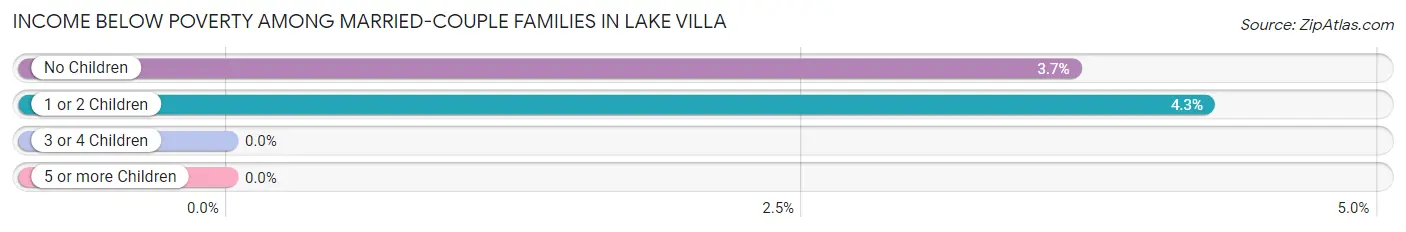
| Children | Above Poverty | Below Poverty |
| No Children | 970 (96.3%) | 37 (3.7%) |
| 1 or 2 Children | 788 (95.8%) | 35 (4.3%) |
| 3 or 4 Children | 199 (100.0%) | 0 (0.0%) |
| 5 or more Children | 0 (0.0%) | 0 (0.0%) |
| Total | 1,957 (96.5%) | 72 (3.5%) |
Income Below Poverty Among Single-Parent Households in Lake Villa
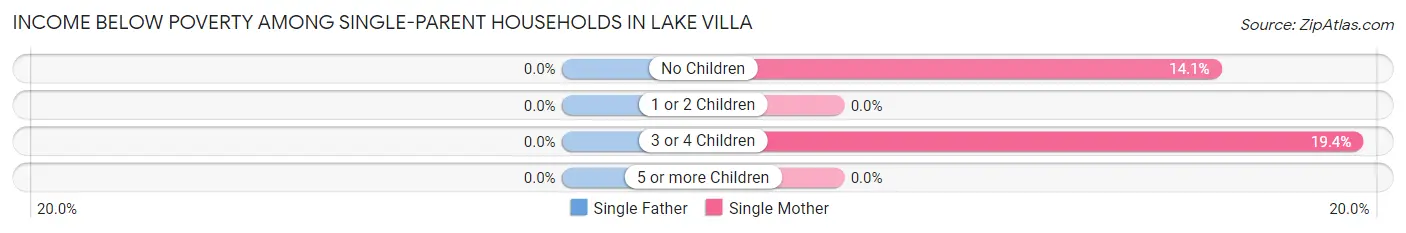
| Children | Single Father | Single Mother |
| No Children | 0 (0.0%) | 19 (14.1%) |
| 1 or 2 Children | 0 (0.0%) | 0 (0.0%) |
| 3 or 4 Children | 0 (0.0%) | 6 (19.4%) |
| 5 or more Children | 0 (0.0%) | 0 (0.0%) |
| Total | 0 (0.0%) | 25 (7.9%) |
Income Below Poverty Among Married-Couple vs Single-Parent Households in Lake Villa
The poverty data for Lake Villa shows that 72 of the married-couple family households (3.5%) and 25 of the single-parent households (6.1%) are living below the poverty level. Within the married-couple family households, those with 1 or 2 children have the highest poverty rate, with 35 households (4.3%) falling below the poverty line. Among the single-parent households, those with 3 or 4 children have the highest poverty rate, with 6 household (19.4%) living below poverty.
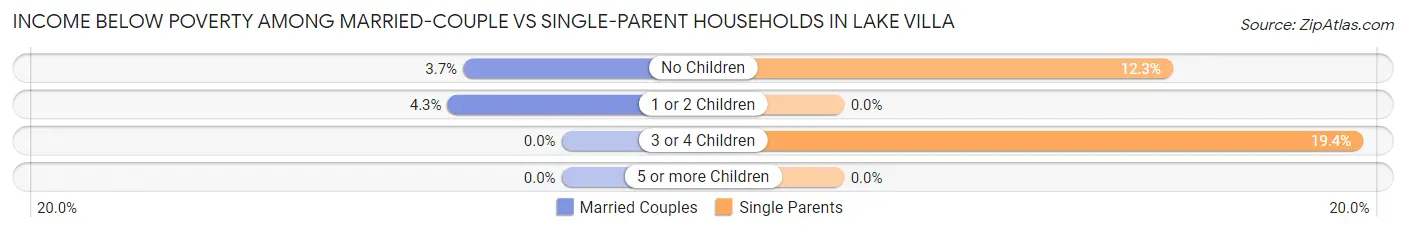
| Children | Married-Couple Families | Single-Parent Households |
| No Children | 37 (3.7%) | 19 (12.3%) |
| 1 or 2 Children | 35 (4.3%) | 0 (0.0%) |
| 3 or 4 Children | 0 (0.0%) | 6 (19.4%) |
| 5 or more Children | 0 (0.0%) | 0 (0.0%) |
| Total | 72 (3.5%) | 25 (6.1%) |
Race in Lake Villa
The most populous races in Lake Villa are White / Caucasian (6,344 | 72.9%), Hispanic or Latino (1,060 | 12.2%), and Two or more Races (910 | 10.5%).
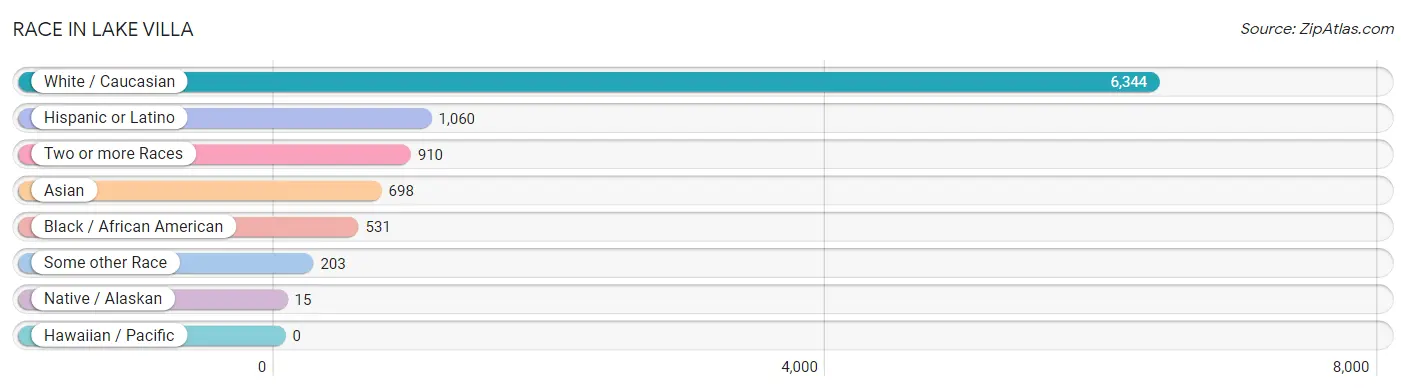
| Race | # Population | % Population |
| Asian | 698 | 8.0% |
| Black / African American | 531 | 6.1% |
| Hawaiian / Pacific | 0 | 0.0% |
| Hispanic or Latino | 1,060 | 12.2% |
| Native / Alaskan | 15 | 0.2% |
| White / Caucasian | 6,344 | 72.9% |
| Two or more Races | 910 | 10.5% |
| Some other Race | 203 | 2.3% |
| Total | 8,701 | 100.0% |
Ancestry in Lake Villa
The most populous ancestries reported in Lake Villa are German (2,380 | 27.4%), Polish (1,198 | 13.8%), Irish (1,009 | 11.6%), Mexican (619 | 7.1%), and Italian (411 | 4.7%), together accounting for 64.6% of all Lake Villa residents.
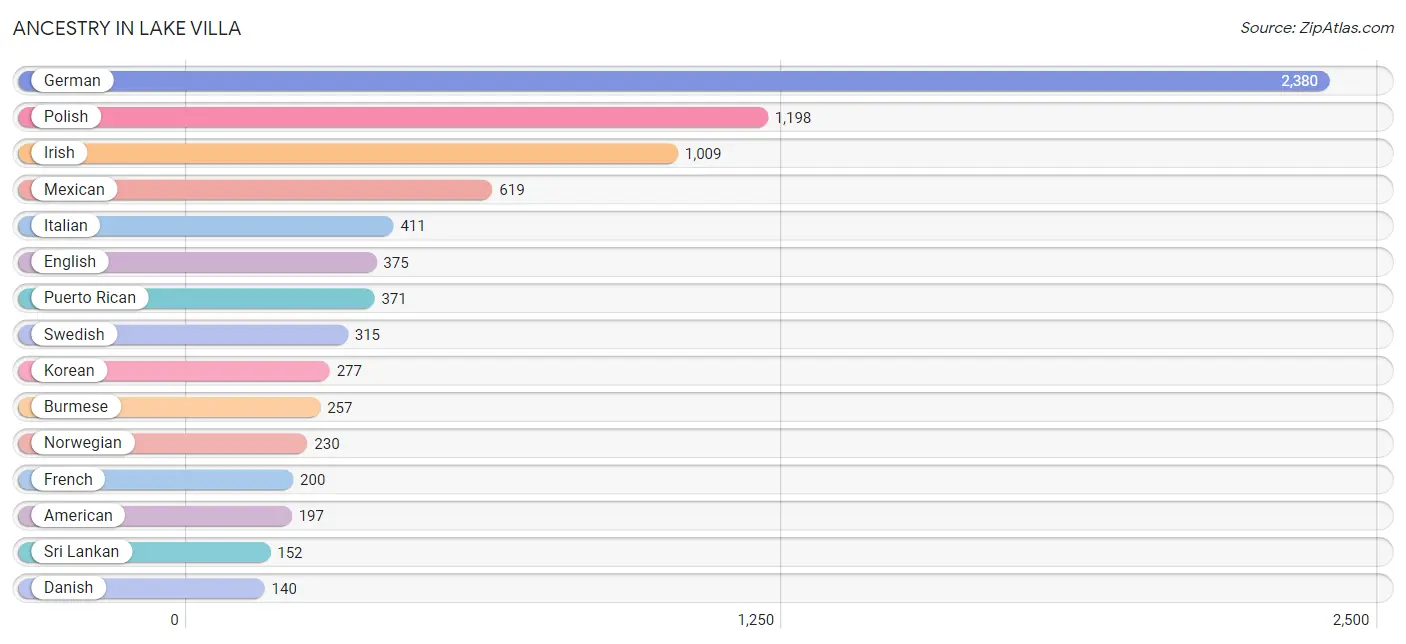
| Ancestry | # Population | % Population |
| African | 41 | 0.5% |
| Albanian | 10 | 0.1% |
| American | 197 | 2.3% |
| Arab | 11 | 0.1% |
| Austrian | 26 | 0.3% |
| Bangladeshi | 67 | 0.8% |
| British | 14 | 0.2% |
| Burmese | 257 | 2.9% |
| Central American | 15 | 0.2% |
| Central American Indian | 14 | 0.2% |
| Cherokee | 30 | 0.3% |
| Chilean | 21 | 0.2% |
| Creek | 11 | 0.1% |
| Czech | 91 | 1.1% |
| Czechoslovakian | 10 | 0.1% |
| Danish | 140 | 1.6% |
| Dutch | 82 | 0.9% |
| Eastern European | 29 | 0.3% |
| English | 375 | 4.3% |
| European | 103 | 1.2% |
| Finnish | 85 | 1.0% |
| French | 200 | 2.3% |
| French Canadian | 67 | 0.8% |
| German | 2,380 | 27.4% |
| Greek | 107 | 1.2% |
| Guamanian / Chamorro | 24 | 0.3% |
| Guatemalan | 15 | 0.2% |
| Hungarian | 49 | 0.6% |
| Indian (Asian) | 96 | 1.1% |
| Irish | 1,009 | 11.6% |
| Italian | 411 | 4.7% |
| Jordanian | 11 | 0.1% |
| Kenyan | 72 | 0.8% |
| Korean | 277 | 3.2% |
| Lithuanian | 27 | 0.3% |
| Mexican | 619 | 7.1% |
| Norwegian | 230 | 2.6% |
| Polish | 1,198 | 13.8% |
| Puerto Rican | 371 | 4.3% |
| Romanian | 48 | 0.5% |
| Russian | 30 | 0.3% |
| Scandinavian | 14 | 0.2% |
| Scotch-Irish | 52 | 0.6% |
| Scottish | 98 | 1.1% |
| Slavic | 7 | 0.1% |
| Slovak | 22 | 0.3% |
| South American | 21 | 0.2% |
| Sri Lankan | 152 | 1.8% |
| Subsaharan African | 113 | 1.3% |
| Swedish | 315 | 3.6% |
| Thai | 138 | 1.6% |
| Ukrainian | 63 | 0.7% |
| Welsh | 48 | 0.5% |
| Yugoslavian | 36 | 0.4% | View All 54 Rows |
Immigrants in Lake Villa
The most numerous immigrant groups reported in Lake Villa came from Europe (504 | 5.8%), Asia (374 | 4.3%), Eastern Europe (314 | 3.6%), Poland (262 | 3.0%), and South Eastern Asia (196 | 2.2%), together accounting for 19.0% of all Lake Villa residents.
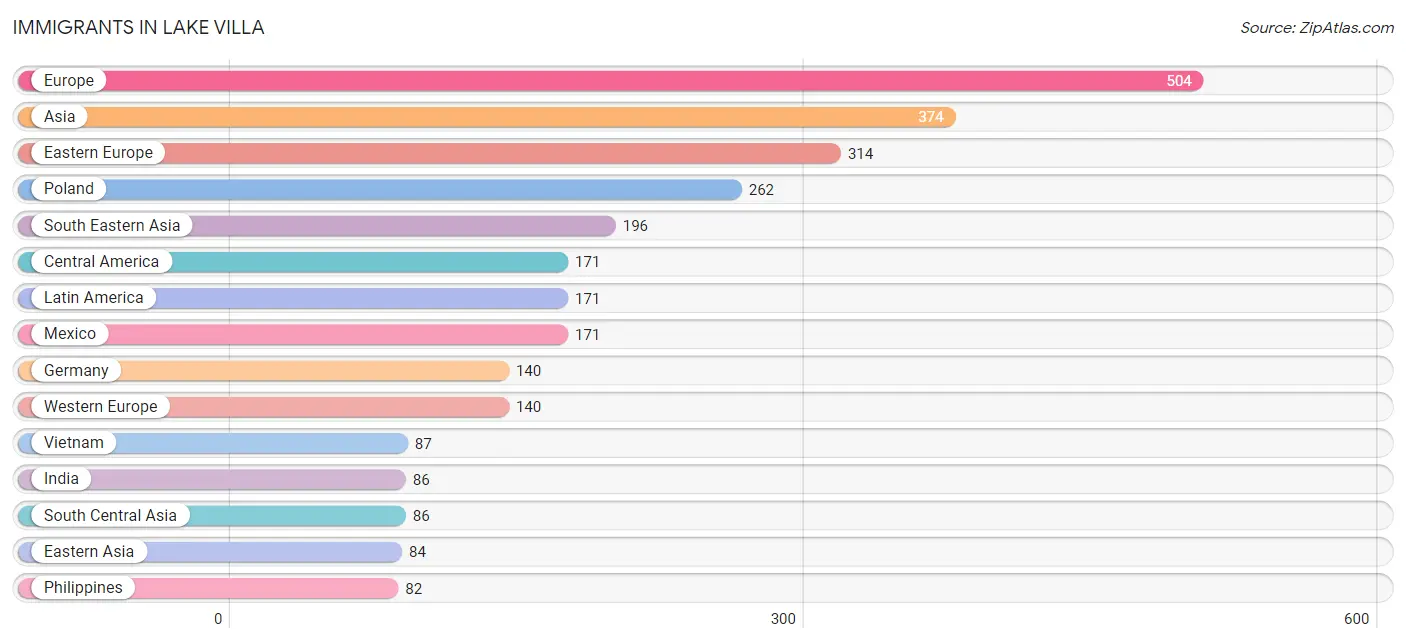
| Immigration Origin | # Population | % Population |
| Africa | 41 | 0.5% |
| Asia | 374 | 4.3% |
| Bosnia and Herzegovina | 16 | 0.2% |
| Canada | 13 | 0.2% |
| Central America | 171 | 2.0% |
| China | 13 | 0.2% |
| Eastern Africa | 41 | 0.5% |
| Eastern Asia | 84 | 1.0% |
| Eastern Europe | 314 | 3.6% |
| Europe | 504 | 5.8% |
| Germany | 140 | 1.6% |
| India | 86 | 1.0% |
| Ireland | 12 | 0.1% |
| Israel | 8 | 0.1% |
| Kenya | 41 | 0.5% |
| Korea | 71 | 0.8% |
| Laos | 27 | 0.3% |
| Latin America | 171 | 2.0% |
| Mexico | 171 | 2.0% |
| Northern Europe | 50 | 0.6% |
| Philippines | 82 | 0.9% |
| Poland | 262 | 3.0% |
| Romania | 20 | 0.2% |
| Scotland | 8 | 0.1% |
| South Central Asia | 86 | 1.0% |
| South Eastern Asia | 196 | 2.2% |
| Ukraine | 16 | 0.2% |
| Vietnam | 87 | 1.0% |
| Western Asia | 8 | 0.1% |
| Western Europe | 140 | 1.6% | View All 30 Rows |
Sex and Age in Lake Villa
Sex and Age in Lake Villa
The most populous age groups in Lake Villa are 15 to 19 Years (579 | 13.6%) for men and 50 to 54 Years (421 | 9.5%) for women.
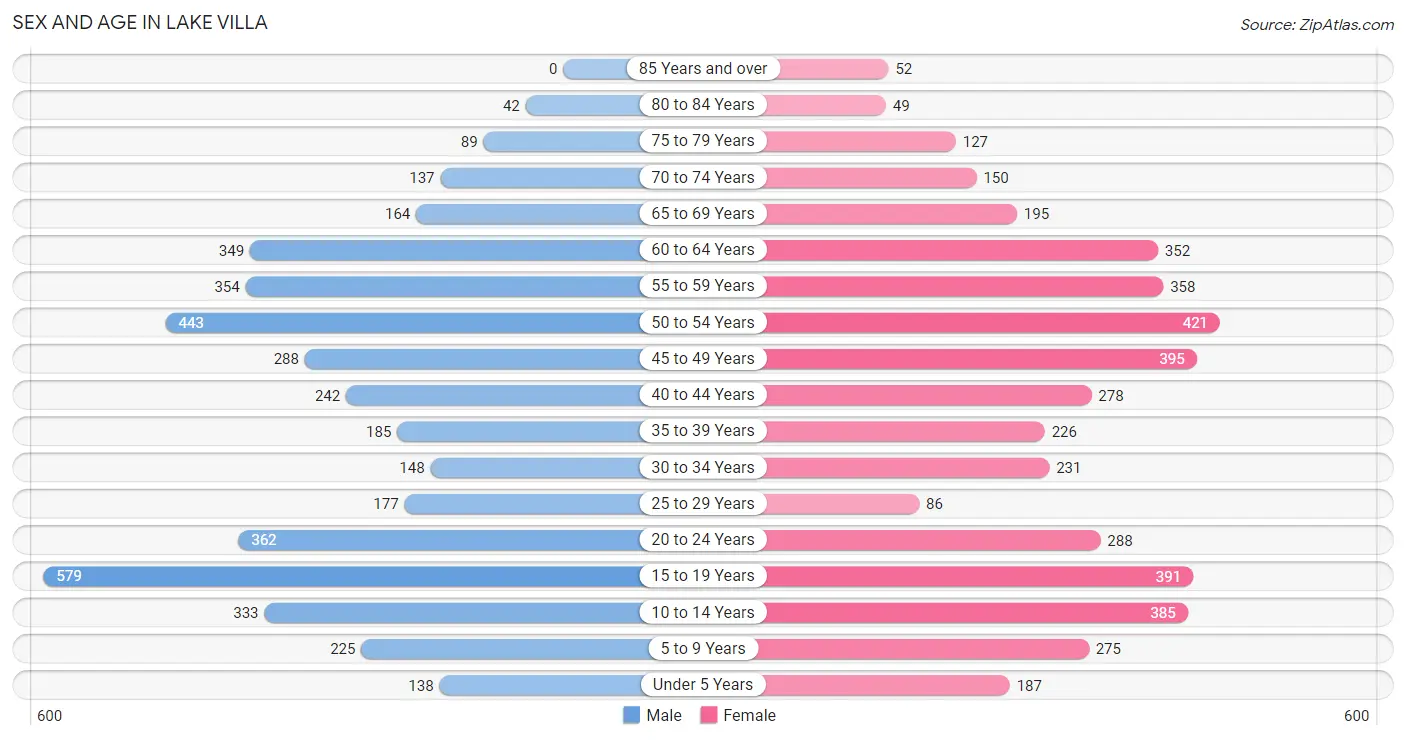
| Age Bracket | Male | Female |
| Under 5 Years | 138 (3.2%) | 187 (4.2%) |
| 5 to 9 Years | 225 (5.3%) | 275 (6.2%) |
| 10 to 14 Years | 333 (7.8%) | 385 (8.7%) |
| 15 to 19 Years | 579 (13.6%) | 391 (8.8%) |
| 20 to 24 Years | 362 (8.5%) | 288 (6.5%) |
| 25 to 29 Years | 177 (4.2%) | 86 (1.9%) |
| 30 to 34 Years | 148 (3.5%) | 231 (5.2%) |
| 35 to 39 Years | 185 (4.3%) | 226 (5.1%) |
| 40 to 44 Years | 242 (5.7%) | 278 (6.2%) |
| 45 to 49 Years | 288 (6.8%) | 395 (8.9%) |
| 50 to 54 Years | 443 (10.4%) | 421 (9.5%) |
| 55 to 59 Years | 354 (8.3%) | 358 (8.1%) |
| 60 to 64 Years | 349 (8.2%) | 352 (7.9%) |
| 65 to 69 Years | 164 (3.8%) | 195 (4.4%) |
| 70 to 74 Years | 137 (3.2%) | 150 (3.4%) |
| 75 to 79 Years | 89 (2.1%) | 127 (2.9%) |
| 80 to 84 Years | 42 (1.0%) | 49 (1.1%) |
| 85 Years and over | 0 (0.0%) | 52 (1.2%) |
| Total | 4,255 (100.0%) | 4,446 (100.0%) |
Families and Households in Lake Villa
Median Family Size in Lake Villa
The median family size in Lake Villa is 3.23 persons per family, with married-couple families (2,029 | 83.3%) accounting for the largest median family size of 3.29 persons per family. On the other hand, single male/father families (92 | 3.8%) represent the smallest median family size with 2.37 persons per family.
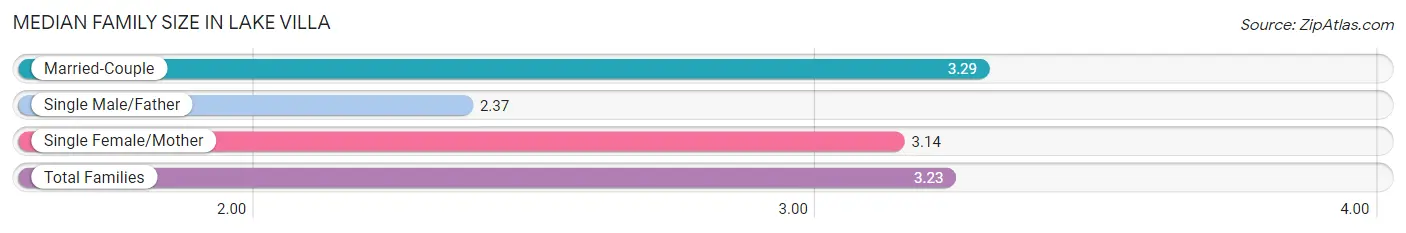
| Family Type | # Families | Family Size |
| Married-Couple | 2,029 (83.3%) | 3.29 |
| Single Male/Father | 92 (3.8%) | 2.37 |
| Single Female/Mother | 316 (13.0%) | 3.14 |
| Total Families | 2,437 (100.0%) | 3.23 |
Median Household Size in Lake Villa
The median household size in Lake Villa is 2.82 persons per household, with married-couple households (2,029 | 65.9%) accounting for the largest median household size of 3.29 persons per household. non-family households (641 | 20.8%) represent the smallest median household size with 1.21 persons per household.
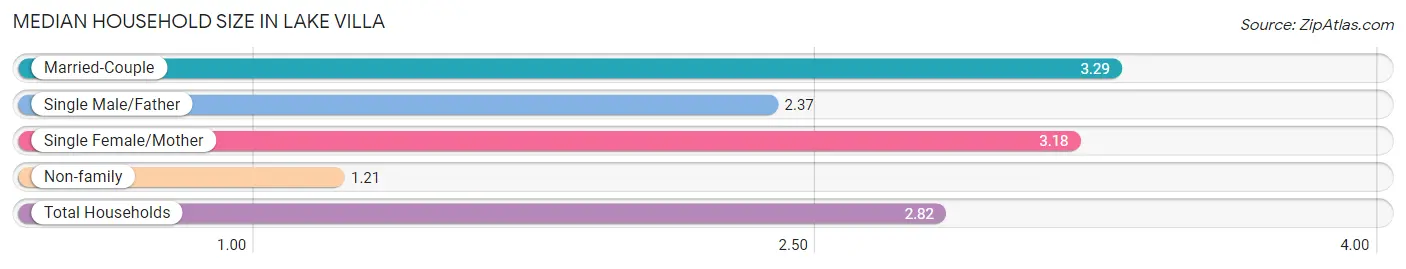
| Household Type | # Households | Household Size |
| Married-Couple | 2,029 (65.9%) | 3.29 |
| Single Male/Father | 92 (3.0%) | 2.37 |
| Single Female/Mother | 316 (10.3%) | 3.18 |
| Non-family | 641 (20.8%) | 1.21 |
| Total Households | 3,078 (100.0%) | 2.82 |
Household Size by Marriage Status in Lake Villa
Out of a total of 3,078 households in Lake Villa, 2,437 (79.2%) are family households, while 641 (20.8%) are nonfamily households. The most numerous type of family households are 2-person households, comprising 1,075, and the most common type of nonfamily households are 1-person households, comprising 514.
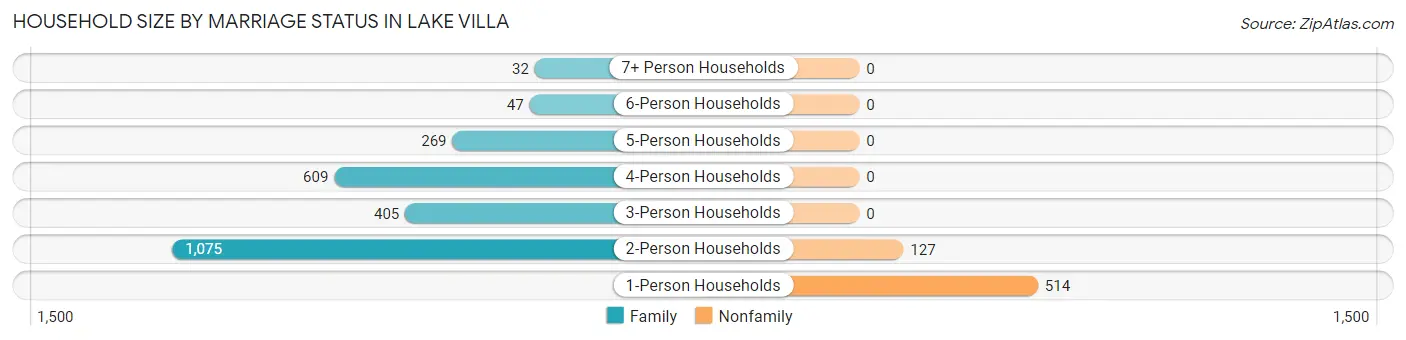
| Household Size | Family Households | Nonfamily Households |
| 1-Person Households | - | 514 (16.7%) |
| 2-Person Households | 1,075 (34.9%) | 127 (4.1%) |
| 3-Person Households | 405 (13.2%) | 0 (0.0%) |
| 4-Person Households | 609 (19.8%) | 0 (0.0%) |
| 5-Person Households | 269 (8.7%) | 0 (0.0%) |
| 6-Person Households | 47 (1.5%) | 0 (0.0%) |
| 7+ Person Households | 32 (1.0%) | 0 (0.0%) |
| Total | 2,437 (79.2%) | 641 (20.8%) |
Female Fertility in Lake Villa
Fertility by Age in Lake Villa
Average fertility rate in Lake Villa is 37.0 births per 1,000 women. Women in the age bracket of 20 to 34 years have the highest fertility rate with 111.0 births per 1,000 women. Women in the age bracket of 20 to 34 years acount for 85.9% of all women with births.
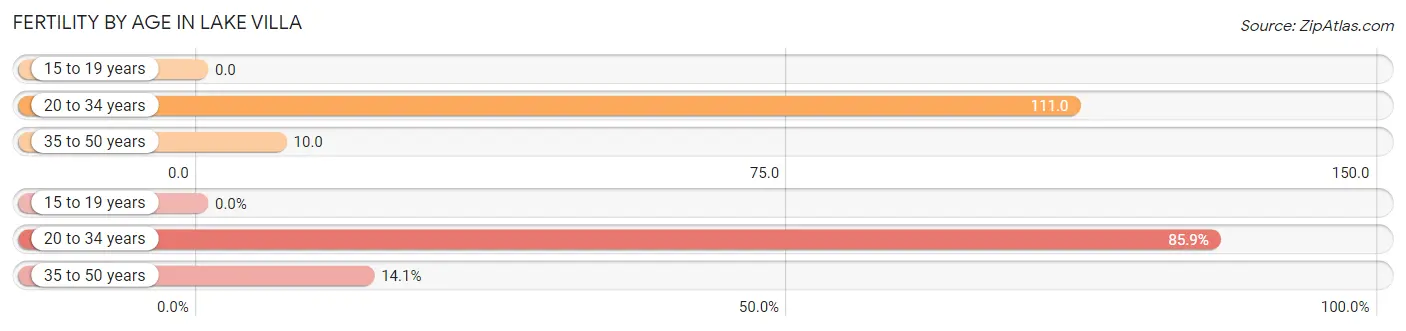
| Age Bracket | Women with Births | Births / 1,000 Women |
| 15 to 19 years | 0 (0.0%) | 0.0 |
| 20 to 34 years | 67 (85.9%) | 111.0 |
| 35 to 50 years | 11 (14.1%) | 10.0 |
| Total | 78 (100.0%) | 37.0 |
Fertility by Age by Marriage Status in Lake Villa
84.6% of women with births (78) in Lake Villa are married. The highest percentage of unmarried women with births falls into 20 to 34 years age bracket with 17.9% of them unmarried at the time of birth, while the lowest percentage of unmarried women with births belong to 35 to 50 years age bracket with 0.0% of them unmarried.
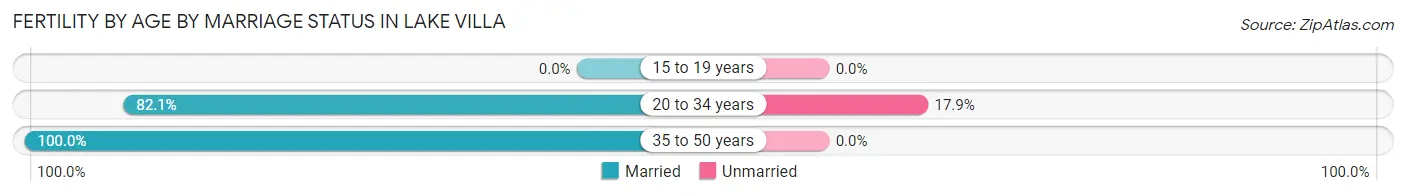
| Age Bracket | Married | Unmarried |
| 15 to 19 years | 0 (0.0%) | 0 (0.0%) |
| 20 to 34 years | 55 (82.1%) | 12 (17.9%) |
| 35 to 50 years | 11 (100.0%) | 0 (0.0%) |
| Total | 66 (84.6%) | 12 (15.4%) |
Fertility by Education in Lake Villa
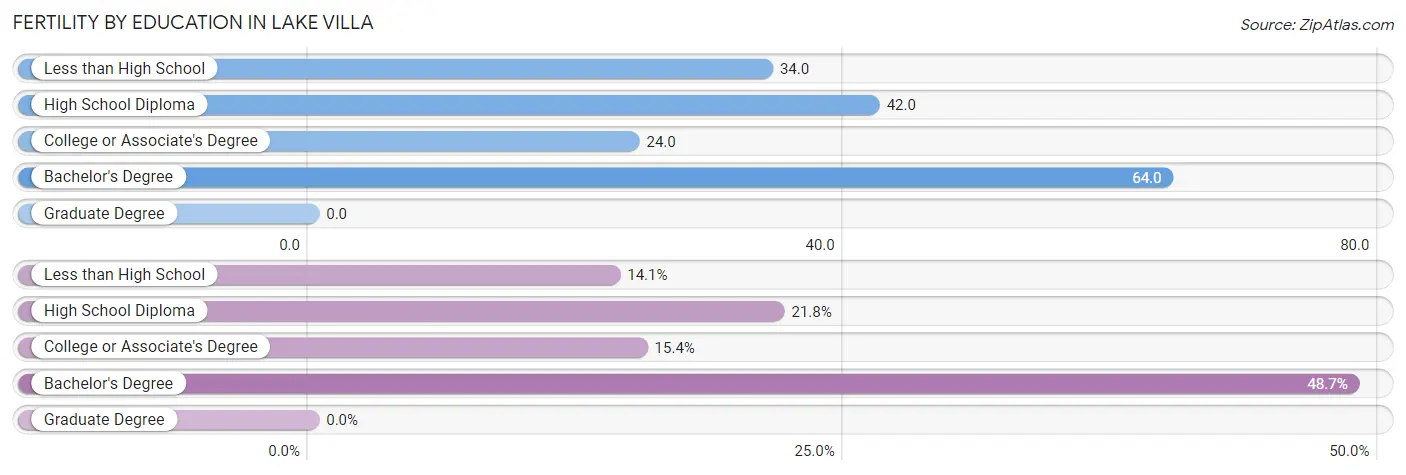
| Educational Attainment | Women with Births | Births / 1,000 Women |
| Less than High School | 11 (14.1%) | 34.0 |
| High School Diploma | 17 (21.8%) | 42.0 |
| College or Associate's Degree | 12 (15.4%) | 24.0 |
| Bachelor's Degree | 38 (48.7%) | 64.0 |
| Graduate Degree | 0 (0.0%) | 0.0 |
| Total | 78 (100.0%) | 37.0 |
Fertility by Education by Marriage Status in Lake Villa
15.4% of women with births in Lake Villa are unmarried. Women with the educational attainment of less than high school are most likely to be married with 100.0% of them married at childbirth, while women with the educational attainment of college or associate's degree are least likely to be married with 100.0% of them unmarried at childbirth.
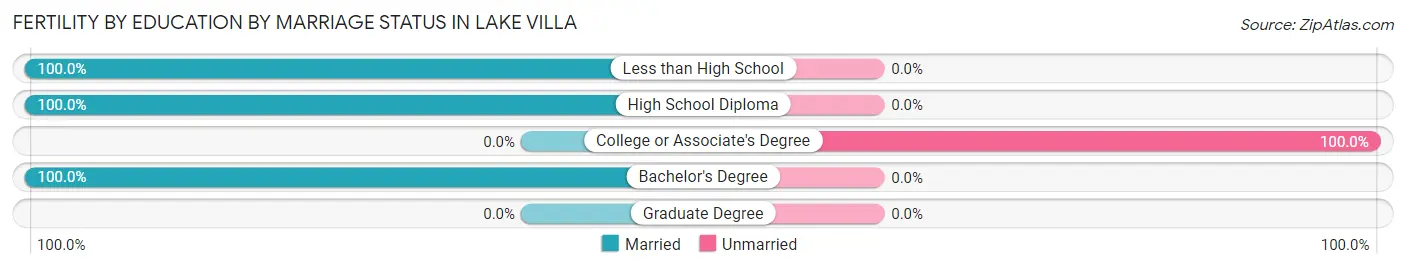
| Educational Attainment | Married | Unmarried |
| Less than High School | 11 (100.0%) | 0 (0.0%) |
| High School Diploma | 17 (100.0%) | 0 (0.0%) |
| College or Associate's Degree | 0 (0.0%) | 12 (100.0%) |
| Bachelor's Degree | 38 (100.0%) | 0 (0.0%) |
| Graduate Degree | 0 (0.0%) | 0 (0.0%) |
| Total | 66 (84.6%) | 12 (15.4%) |
Employment Characteristics in Lake Villa
Employment by Class of Employer in Lake Villa
Among the 4,417 employed individuals in Lake Villa, private company employees (3,250 | 73.6%), local government employees (458 | 10.4%), and not-for-profit organizations (380 | 8.6%) make up the most common classes of employment.
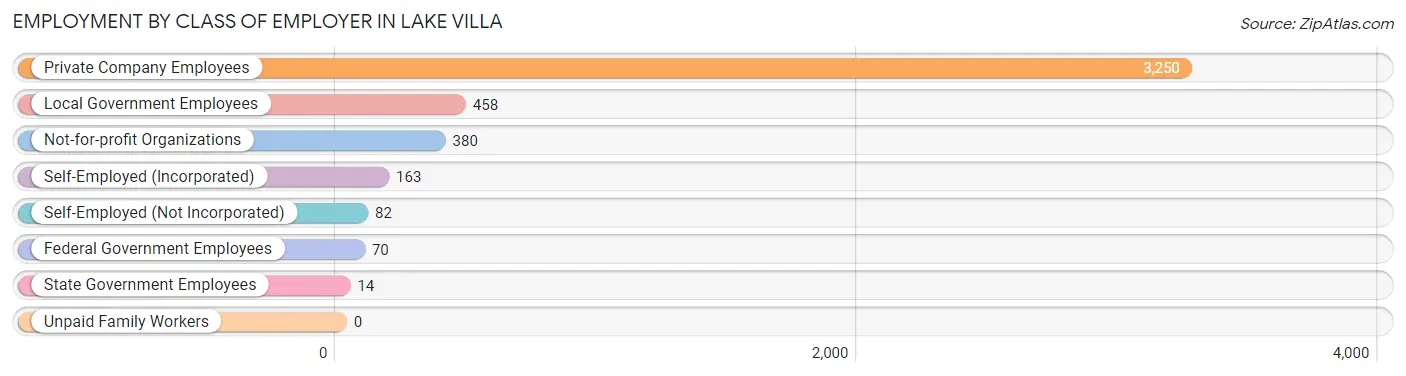
| Employer Class | # Employees | % Employees |
| Private Company Employees | 3,250 | 73.6% |
| Self-Employed (Incorporated) | 163 | 3.7% |
| Self-Employed (Not Incorporated) | 82 | 1.9% |
| Not-for-profit Organizations | 380 | 8.6% |
| Local Government Employees | 458 | 10.4% |
| State Government Employees | 14 | 0.3% |
| Federal Government Employees | 70 | 1.6% |
| Unpaid Family Workers | 0 | 0.0% |
| Total | 4,417 | 100.0% |
Employment Status by Age in Lake Villa
According to the labor force statistics for Lake Villa, out of the total population over 16 years of age (6,976), 68.4% or 4,772 individuals are in the labor force, with 6.7% or 320 of them unemployed. The age group with the highest labor force participation rate is 35 to 44 years, with 89.8% or 836 individuals in the labor force. Within the labor force, the 16 to 19 years age range has the highest percentage of unemployed individuals, with 25.5% or 76 of them being unemployed.
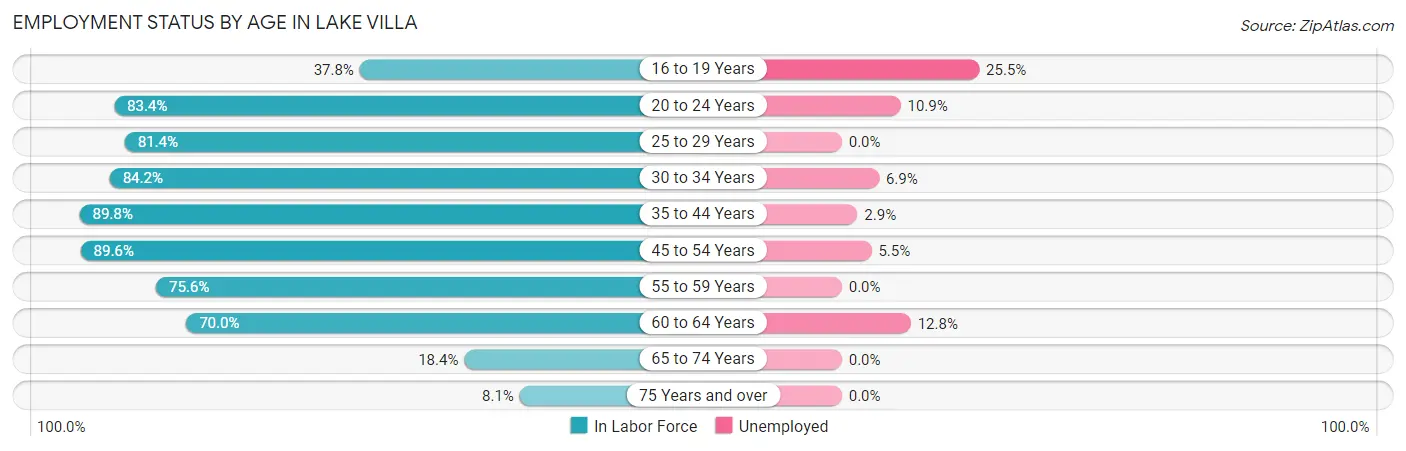
| Age Bracket | In Labor Force | Unemployed |
| 16 to 19 Years | 298 (37.8%) | 76 (25.5%) |
| 20 to 24 Years | 542 (83.4%) | 59 (10.9%) |
| 25 to 29 Years | 214 (81.4%) | 0 (0.0%) |
| 30 to 34 Years | 319 (84.2%) | 22 (6.9%) |
| 35 to 44 Years | 836 (89.8%) | 24 (2.9%) |
| 45 to 54 Years | 1,386 (89.6%) | 76 (5.5%) |
| 55 to 59 Years | 538 (75.6%) | 0 (0.0%) |
| 60 to 64 Years | 491 (70.0%) | 63 (12.8%) |
| 65 to 74 Years | 119 (18.4%) | 0 (0.0%) |
| 75 Years and over | 29 (8.1%) | 0 (0.0%) |
| Total | 4,772 (68.4%) | 320 (6.7%) |
Employment Status by Educational Attainment in Lake Villa
According to labor force statistics for Lake Villa, 83.5% of individuals (3,785) out of the total population between 25 and 64 years of age (4,533) are in the labor force, with 4.9% or 185 of them being unemployed. The group with the highest labor force participation rate are those with the educational attainment of bachelor's degree or higher, with 92.3% or 2,093 individuals in the labor force. Within the labor force, individuals with high school diploma education have the highest percentage of unemployment, with 10.0% or 74 of them being unemployed.
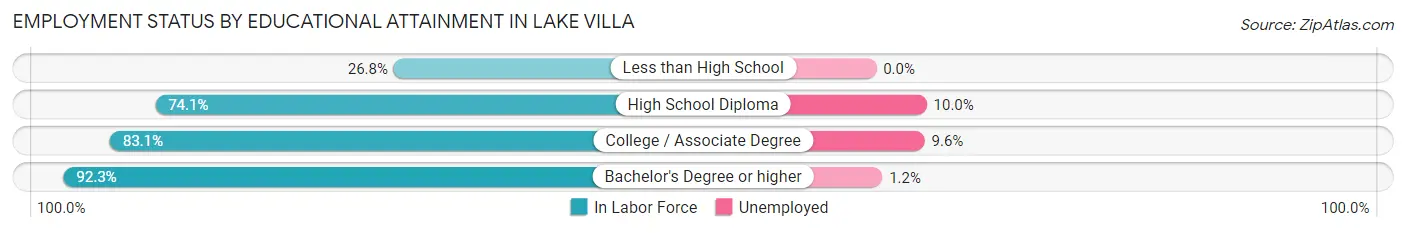
| Educational Attainment | In Labor Force | Unemployed |
| Less than High School | 48 (26.8%) | 0 (0.0%) |
| High School Diploma | 740 (74.1%) | 100 (10.0%) |
| College / Associate Degree | 903 (83.1%) | 104 (9.6%) |
| Bachelor's Degree or higher | 2,093 (92.3%) | 27 (1.2%) |
| Total | 3,785 (83.5%) | 222 (4.9%) |
Employment Occupations by Sex in Lake Villa
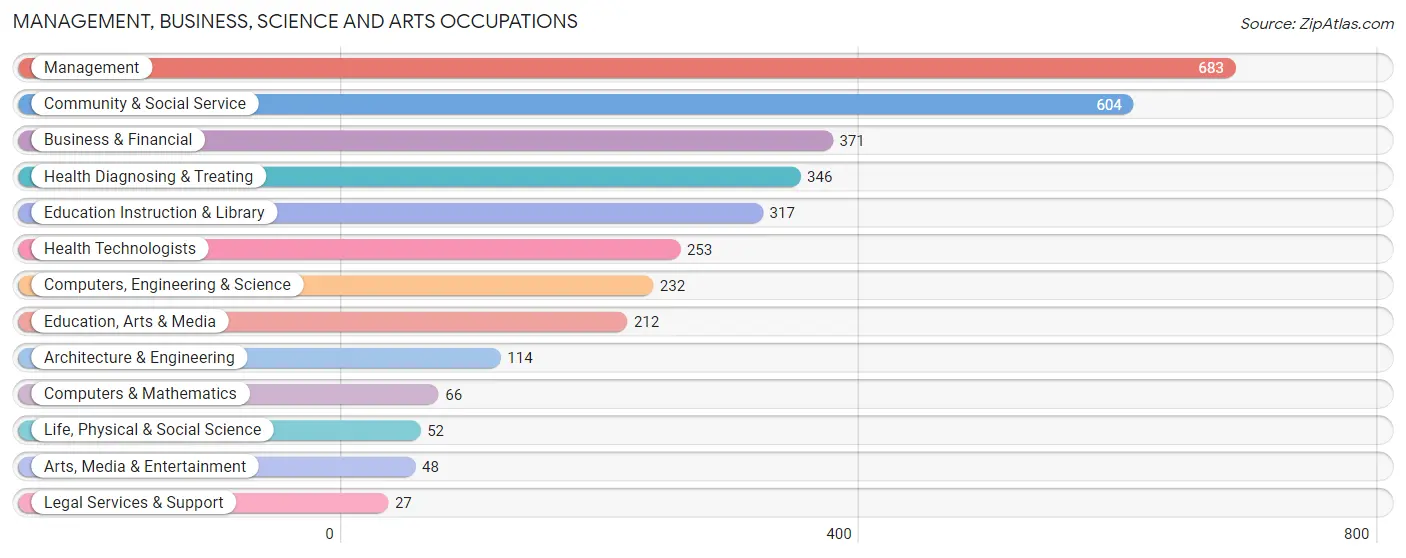
Management, Business, Science and Arts Occupations
The most common Management, Business, Science and Arts occupations in Lake Villa are Management (683 | 15.4%), Community & Social Service (604 | 13.6%), Business & Financial (371 | 8.4%), Health Diagnosing & Treating (346 | 7.8%), and Education Instruction & Library (317 | 7.1%).
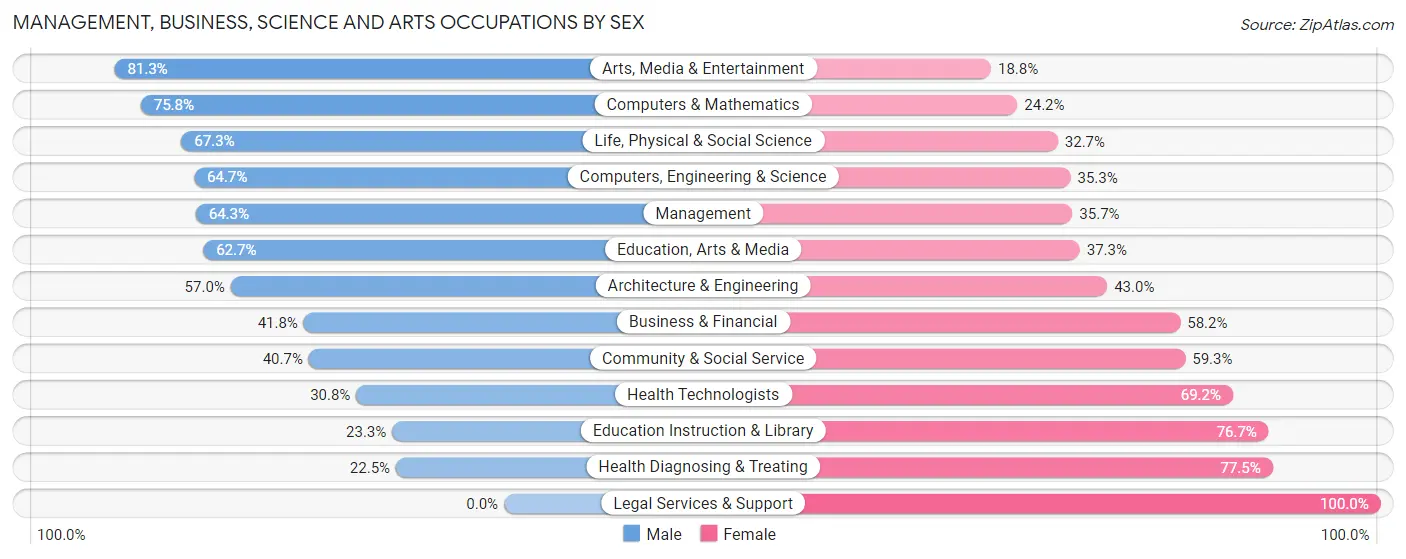
Management, Business, Science and Arts Occupations by Sex
Within the Management, Business, Science and Arts occupations in Lake Villa, the most male-oriented occupations are Arts, Media & Entertainment (81.2%), Computers & Mathematics (75.8%), and Life, Physical & Social Science (67.3%), while the most female-oriented occupations are Legal Services & Support (100.0%), Health Diagnosing & Treating (77.5%), and Education Instruction & Library (76.7%).
| Occupation | Male | Female |
| Management | 439 (64.3%) | 244 (35.7%) |
| Business & Financial | 155 (41.8%) | 216 (58.2%) |
| Computers, Engineering & Science | 150 (64.7%) | 82 (35.3%) |
| Computers & Mathematics | 50 (75.8%) | 16 (24.2%) |
| Architecture & Engineering | 65 (57.0%) | 49 (43.0%) |
| Life, Physical & Social Science | 35 (67.3%) | 17 (32.7%) |
| Community & Social Service | 246 (40.7%) | 358 (59.3%) |
| Education, Arts & Media | 133 (62.7%) | 79 (37.3%) |
| Legal Services & Support | 0 (0.0%) | 27 (100.0%) |
| Education Instruction & Library | 74 (23.3%) | 243 (76.7%) |
| Arts, Media & Entertainment | 39 (81.2%) | 9 (18.8%) |
| Health Diagnosing & Treating | 78 (22.5%) | 268 (77.5%) |
| Health Technologists | 78 (30.8%) | 175 (69.2%) |
| Total (Category) | 1,068 (47.8%) | 1,168 (52.2%) |
| Total (Overall) | 2,370 (53.5%) | 2,061 (46.5%) |
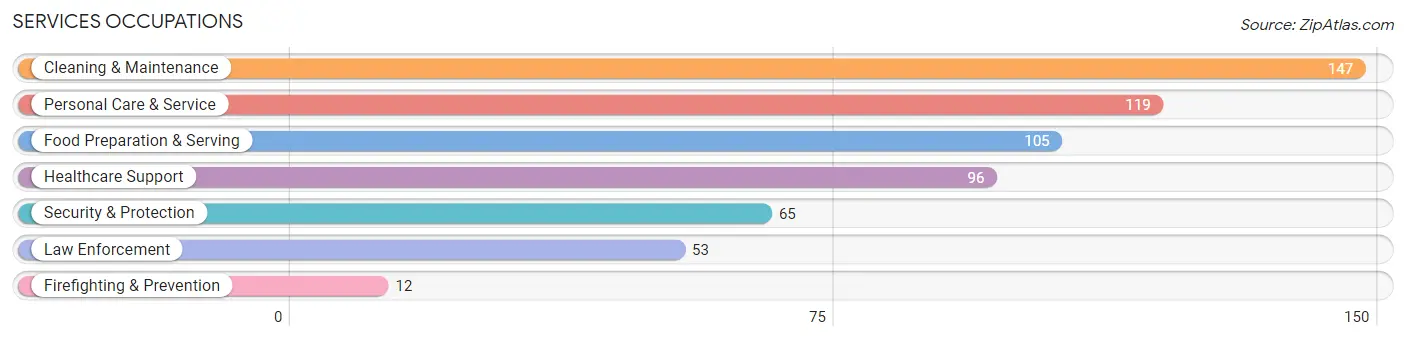
Services Occupations
The most common Services occupations in Lake Villa are Cleaning & Maintenance (147 | 3.3%), Personal Care & Service (119 | 2.7%), Food Preparation & Serving (105 | 2.4%), Healthcare Support (96 | 2.2%), and Security & Protection (65 | 1.5%).
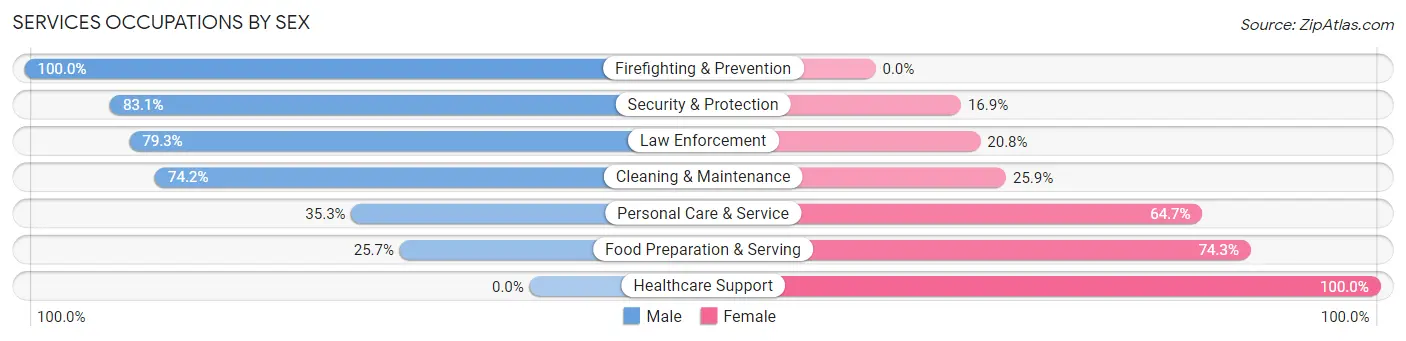
Services Occupations by Sex
Within the Services occupations in Lake Villa, the most male-oriented occupations are Firefighting & Prevention (100.0%), Security & Protection (83.1%), and Law Enforcement (79.2%), while the most female-oriented occupations are Healthcare Support (100.0%), Food Preparation & Serving (74.3%), and Personal Care & Service (64.7%).
| Occupation | Male | Female |
| Healthcare Support | 0 (0.0%) | 96 (100.0%) |
| Security & Protection | 54 (83.1%) | 11 (16.9%) |
| Firefighting & Prevention | 12 (100.0%) | 0 (0.0%) |
| Law Enforcement | 42 (79.2%) | 11 (20.7%) |
| Food Preparation & Serving | 27 (25.7%) | 78 (74.3%) |
| Cleaning & Maintenance | 109 (74.2%) | 38 (25.9%) |
| Personal Care & Service | 42 (35.3%) | 77 (64.7%) |
| Total (Category) | 232 (43.6%) | 300 (56.4%) |
| Total (Overall) | 2,370 (53.5%) | 2,061 (46.5%) |
Sales and Office Occupations
The most common Sales and Office occupations in Lake Villa are Sales & Related (509 | 11.5%), and Office & Administration (488 | 11.0%).
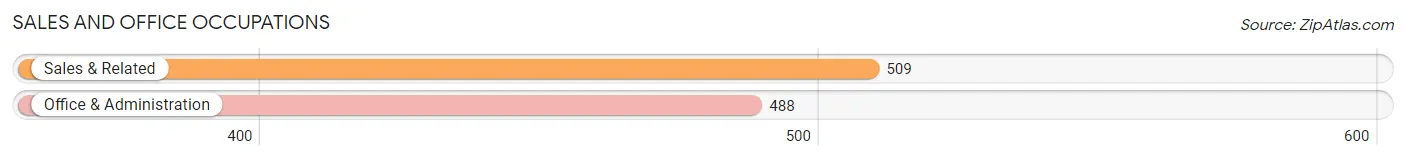
Sales and Office Occupations by Sex

| Occupation | Male | Female |
| Sales & Related | 298 (58.6%) | 211 (41.4%) |
| Office & Administration | 192 (39.3%) | 296 (60.7%) |
| Total (Category) | 490 (49.1%) | 507 (50.8%) |
| Total (Overall) | 2,370 (53.5%) | 2,061 (46.5%) |
Natural Resources, Construction and Maintenance Occupations
The most common Natural Resources, Construction and Maintenance occupations in Lake Villa are Installation, Maintenance & Repair (96 | 2.2%), and Construction & Extraction (89 | 2.0%).
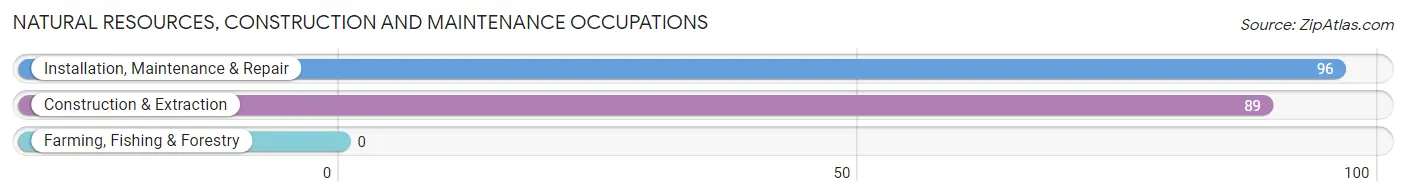
Natural Resources, Construction and Maintenance Occupations by Sex
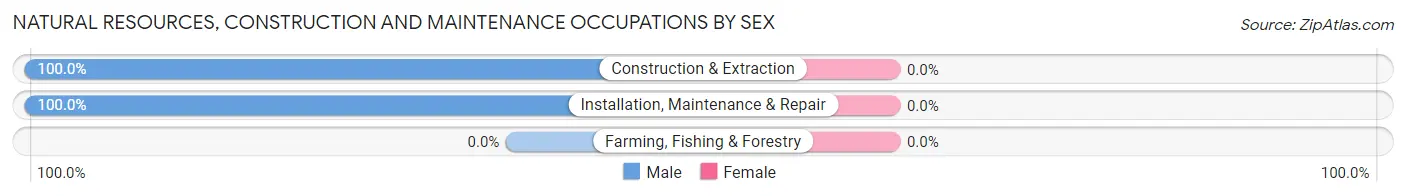
| Occupation | Male | Female |
| Farming, Fishing & Forestry | 0 (0.0%) | 0 (0.0%) |
| Construction & Extraction | 89 (100.0%) | 0 (0.0%) |
| Installation, Maintenance & Repair | 96 (100.0%) | 0 (0.0%) |
| Total (Category) | 185 (100.0%) | 0 (0.0%) |
| Total (Overall) | 2,370 (53.5%) | 2,061 (46.5%) |
Production, Transportation and Moving Occupations
The most common Production, Transportation and Moving occupations in Lake Villa are Production (272 | 6.1%), Material Moving (143 | 3.2%), and Transportation (66 | 1.5%).
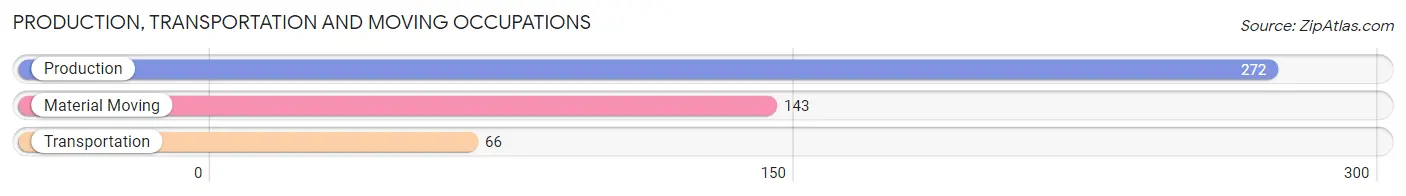
Production, Transportation and Moving Occupations by Sex
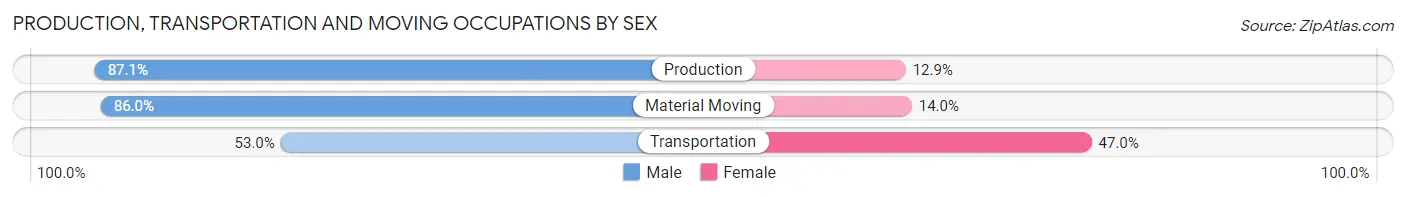
| Occupation | Male | Female |
| Production | 237 (87.1%) | 35 (12.9%) |
| Transportation | 35 (53.0%) | 31 (47.0%) |
| Material Moving | 123 (86.0%) | 20 (14.0%) |
| Total (Category) | 395 (82.1%) | 86 (17.9%) |
| Total (Overall) | 2,370 (53.5%) | 2,061 (46.5%) |
Employment Industries by Sex in Lake Villa
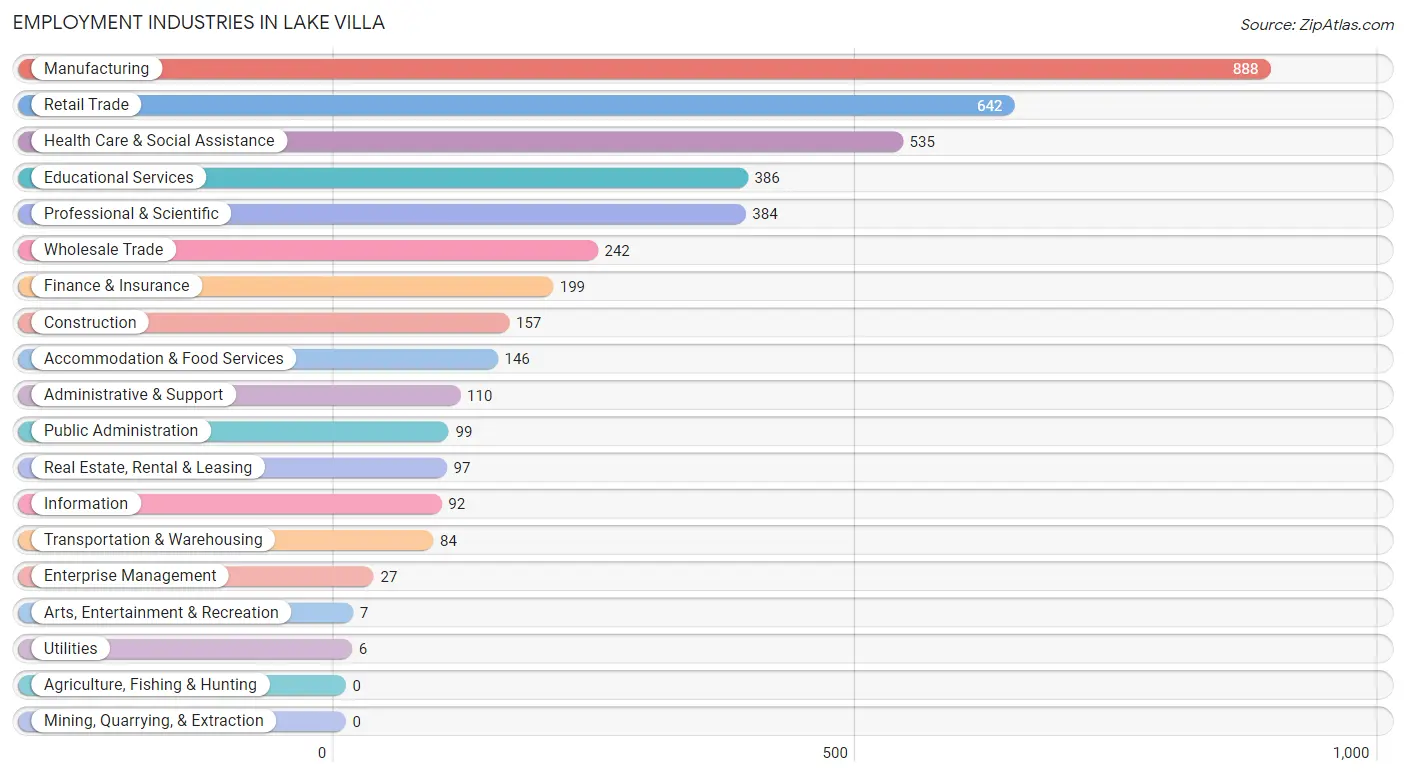
Employment Industries in Lake Villa
The major employment industries in Lake Villa include Manufacturing (888 | 20.0%), Retail Trade (642 | 14.5%), Health Care & Social Assistance (535 | 12.1%), Educational Services (386 | 8.7%), and Professional & Scientific (384 | 8.7%).
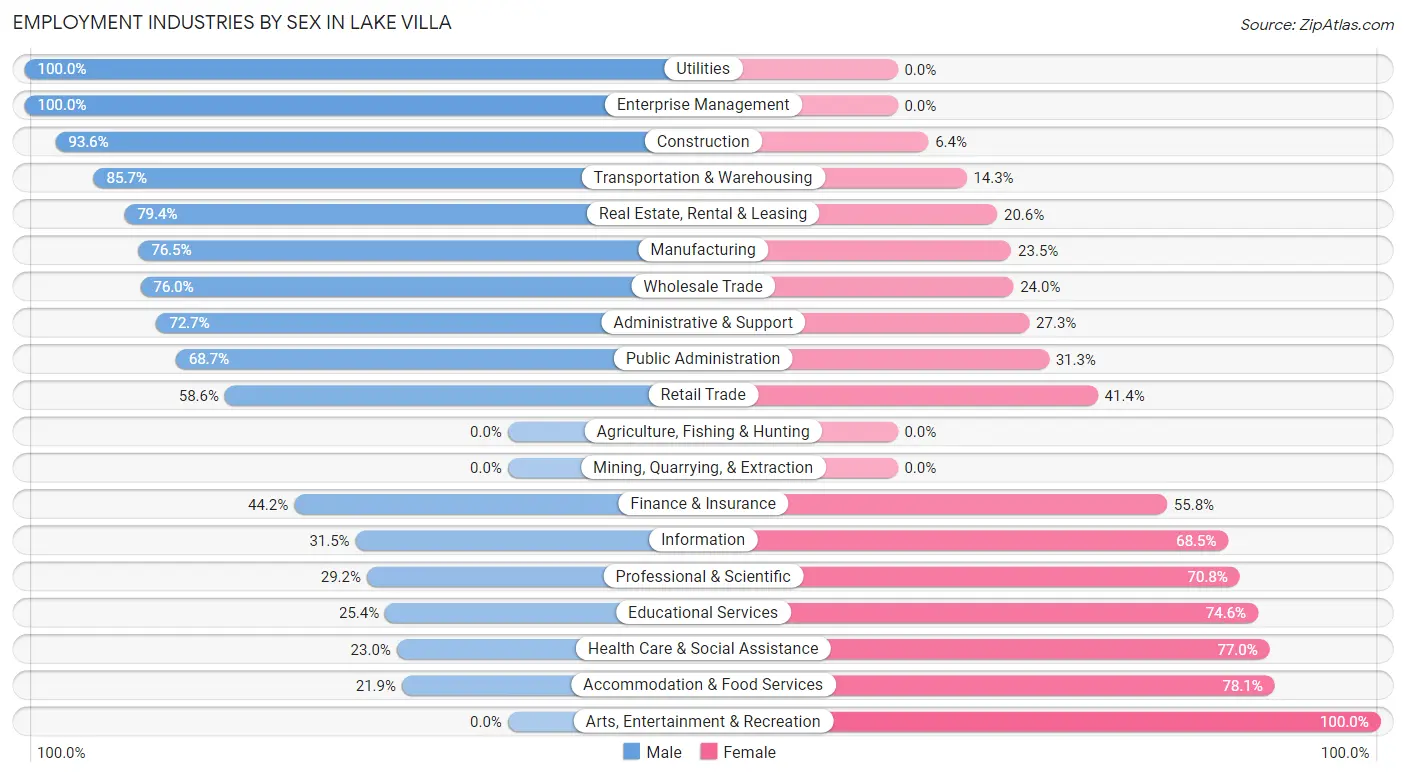
Employment Industries by Sex in Lake Villa
The Lake Villa industries that see more men than women are Utilities (100.0%), Enterprise Management (100.0%), and Construction (93.6%), whereas the industries that tend to have a higher number of women are Arts, Entertainment & Recreation (100.0%), Accommodation & Food Services (78.1%), and Health Care & Social Assistance (77.0%).
| Industry | Male | Female |
| Agriculture, Fishing & Hunting | 0 (0.0%) | 0 (0.0%) |
| Mining, Quarrying, & Extraction | 0 (0.0%) | 0 (0.0%) |
| Construction | 147 (93.6%) | 10 (6.4%) |
| Manufacturing | 679 (76.5%) | 209 (23.5%) |
| Wholesale Trade | 184 (76.0%) | 58 (24.0%) |
| Retail Trade | 376 (58.6%) | 266 (41.4%) |
| Transportation & Warehousing | 72 (85.7%) | 12 (14.3%) |
| Utilities | 6 (100.0%) | 0 (0.0%) |
| Information | 29 (31.5%) | 63 (68.5%) |
| Finance & Insurance | 88 (44.2%) | 111 (55.8%) |
| Real Estate, Rental & Leasing | 77 (79.4%) | 20 (20.6%) |
| Professional & Scientific | 112 (29.2%) | 272 (70.8%) |
| Enterprise Management | 27 (100.0%) | 0 (0.0%) |
| Administrative & Support | 80 (72.7%) | 30 (27.3%) |
| Educational Services | 98 (25.4%) | 288 (74.6%) |
| Health Care & Social Assistance | 123 (23.0%) | 412 (77.0%) |
| Arts, Entertainment & Recreation | 0 (0.0%) | 7 (100.0%) |
| Accommodation & Food Services | 32 (21.9%) | 114 (78.1%) |
| Public Administration | 68 (68.7%) | 31 (31.3%) |
| Total | 2,370 (53.5%) | 2,061 (46.5%) |
Education in Lake Villa
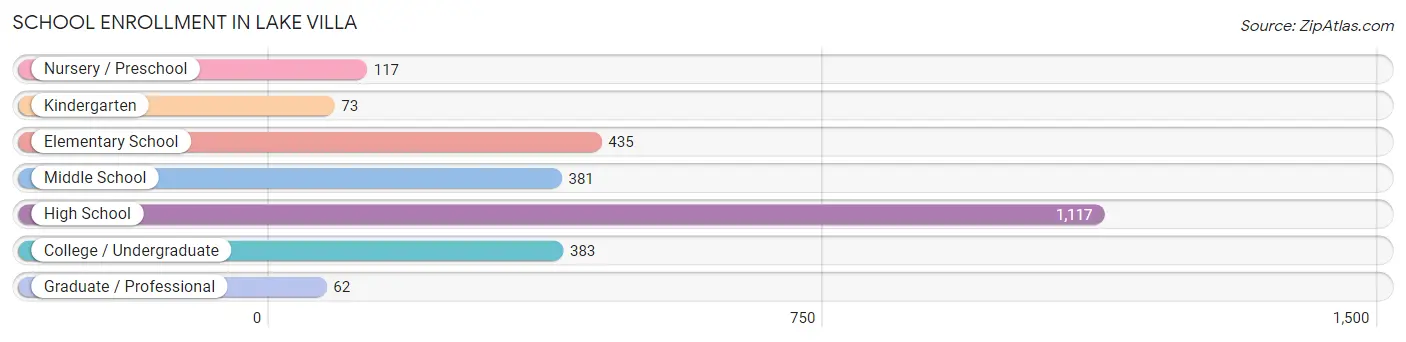
School Enrollment in Lake Villa
The most common levels of schooling among the 2,568 students in Lake Villa are high school (1,117 | 43.5%), elementary school (435 | 16.9%), and college / undergraduate (383 | 14.9%).
| School Level | # Students | % Students |
| Nursery / Preschool | 117 | 4.6% |
| Kindergarten | 73 | 2.8% |
| Elementary School | 435 | 16.9% |
| Middle School | 381 | 14.8% |
| High School | 1,117 | 43.5% |
| College / Undergraduate | 383 | 14.9% |
| Graduate / Professional | 62 | 2.4% |
| Total | 2,568 | 100.0% |
School Enrollment by Age by Funding Source in Lake Villa
Out of a total of 2,568 students who are enrolled in schools in Lake Villa, 380 (14.8%) attend a private institution, while the remaining 2,188 (85.2%) are enrolled in public schools. The age group of 20 to 24 year olds has the highest likelihood of being enrolled in private schools, with 86 (39.6% in the age bracket) enrolled. Conversely, the age group of 10 to 14 year olds has the lowest likelihood of being enrolled in a private school, with 648 (94.9% in the age bracket) attending a public institution.
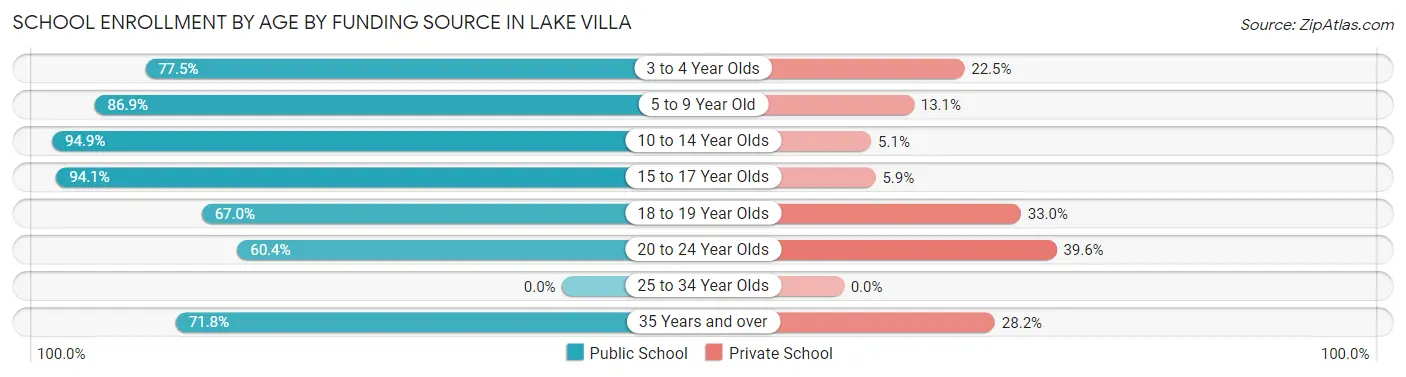
| Age Bracket | Public School | Private School |
| 3 to 4 Year Olds | 69 (77.5%) | 20 (22.5%) |
| 5 to 9 Year Old | 406 (86.9%) | 61 (13.1%) |
| 10 to 14 Year Olds | 648 (94.9%) | 35 (5.1%) |
| 15 to 17 Year Olds | 636 (94.1%) | 40 (5.9%) |
| 18 to 19 Year Olds | 197 (67.0%) | 97 (33.0%) |
| 20 to 24 Year Olds | 131 (60.4%) | 86 (39.6%) |
| 25 to 34 Year Olds | 0 (0.0%) | 0 (0.0%) |
| 35 Years and over | 102 (71.8%) | 40 (28.2%) |
| Total | 2,188 (85.2%) | 380 (14.8%) |
Educational Attainment by Field of Study in Lake Villa
Business (519 | 18.6%), education (396 | 14.2%), science & technology (314 | 11.2%), physical & health sciences (216 | 7.7%), and social sciences (212 | 7.6%) are the most common fields of study among 2,797 individuals in Lake Villa who have obtained a bachelor's degree or higher.
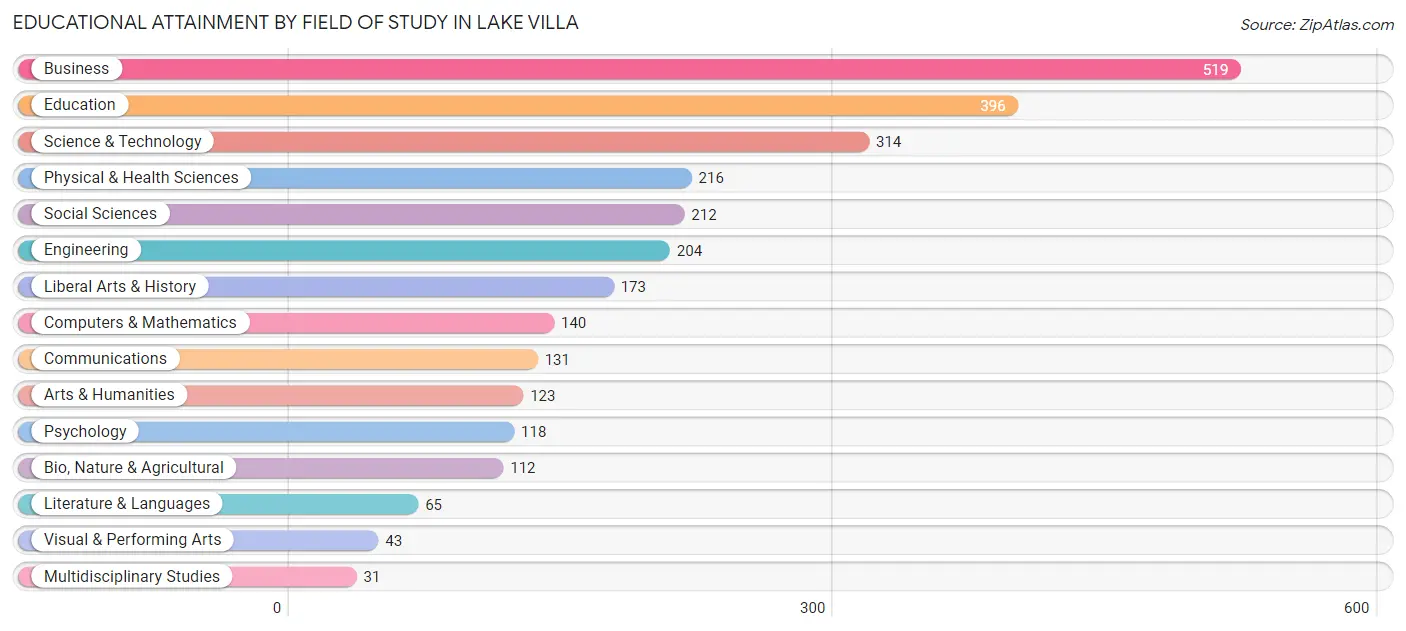
| Field of Study | # Graduates | % Graduates |
| Computers & Mathematics | 140 | 5.0% |
| Bio, Nature & Agricultural | 112 | 4.0% |
| Physical & Health Sciences | 216 | 7.7% |
| Psychology | 118 | 4.2% |
| Social Sciences | 212 | 7.6% |
| Engineering | 204 | 7.3% |
| Multidisciplinary Studies | 31 | 1.1% |
| Science & Technology | 314 | 11.2% |
| Business | 519 | 18.6% |
| Education | 396 | 14.2% |
| Literature & Languages | 65 | 2.3% |
| Liberal Arts & History | 173 | 6.2% |
| Visual & Performing Arts | 43 | 1.5% |
| Communications | 131 | 4.7% |
| Arts & Humanities | 123 | 4.4% |
| Total | 2,797 | 100.0% |
Transportation & Commute in Lake Villa
Vehicle Availability by Sex in Lake Villa
The most prevalent vehicle ownership categories in Lake Villa are males with 2 vehicles (1,099, accounting for 46.7%) and females with 2 vehicles (944, making up 53.3%).
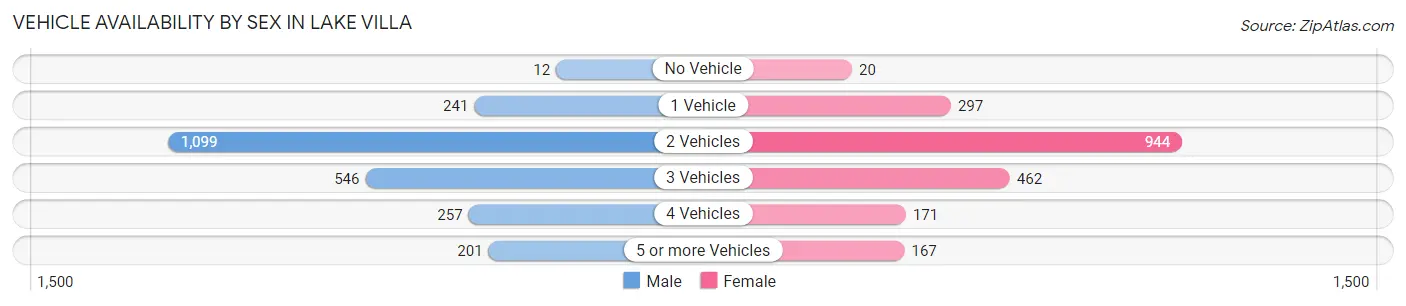
| Vehicles Available | Male | Female |
| No Vehicle | 12 (0.5%) | 20 (1.0%) |
| 1 Vehicle | 241 (10.2%) | 297 (14.4%) |
| 2 Vehicles | 1,099 (46.7%) | 944 (45.8%) |
| 3 Vehicles | 546 (23.2%) | 462 (22.4%) |
| 4 Vehicles | 257 (10.9%) | 171 (8.3%) |
| 5 or more Vehicles | 201 (8.5%) | 167 (8.1%) |
| Total | 2,356 (100.0%) | 2,061 (100.0%) |
Commute Time in Lake Villa
The most frequently occuring commute durations in Lake Villa are 30 to 34 minutes (565 commuters, 14.6%), 45 to 59 minutes (529 commuters, 13.7%), and 60 to 89 minutes (436 commuters, 11.3%).
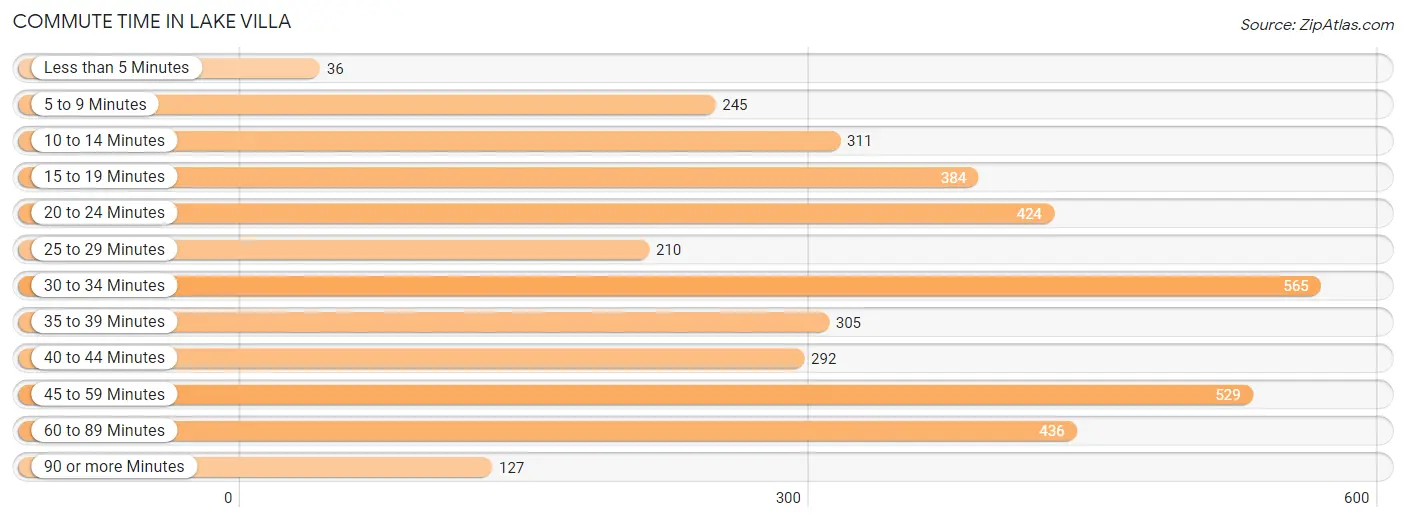
| Commute Time | # Commuters | % Commuters |
| Less than 5 Minutes | 36 | 0.9% |
| 5 to 9 Minutes | 245 | 6.3% |
| 10 to 14 Minutes | 311 | 8.1% |
| 15 to 19 Minutes | 384 | 9.9% |
| 20 to 24 Minutes | 424 | 11.0% |
| 25 to 29 Minutes | 210 | 5.4% |
| 30 to 34 Minutes | 565 | 14.6% |
| 35 to 39 Minutes | 305 | 7.9% |
| 40 to 44 Minutes | 292 | 7.6% |
| 45 to 59 Minutes | 529 | 13.7% |
| 60 to 89 Minutes | 436 | 11.3% |
| 90 or more Minutes | 127 | 3.3% |
Commute Time by Sex in Lake Villa
The most common commute times in Lake Villa are 30 to 34 minutes (388 commuters, 18.5%) for males and 45 to 59 minutes (259 commuters, 14.7%) for females.
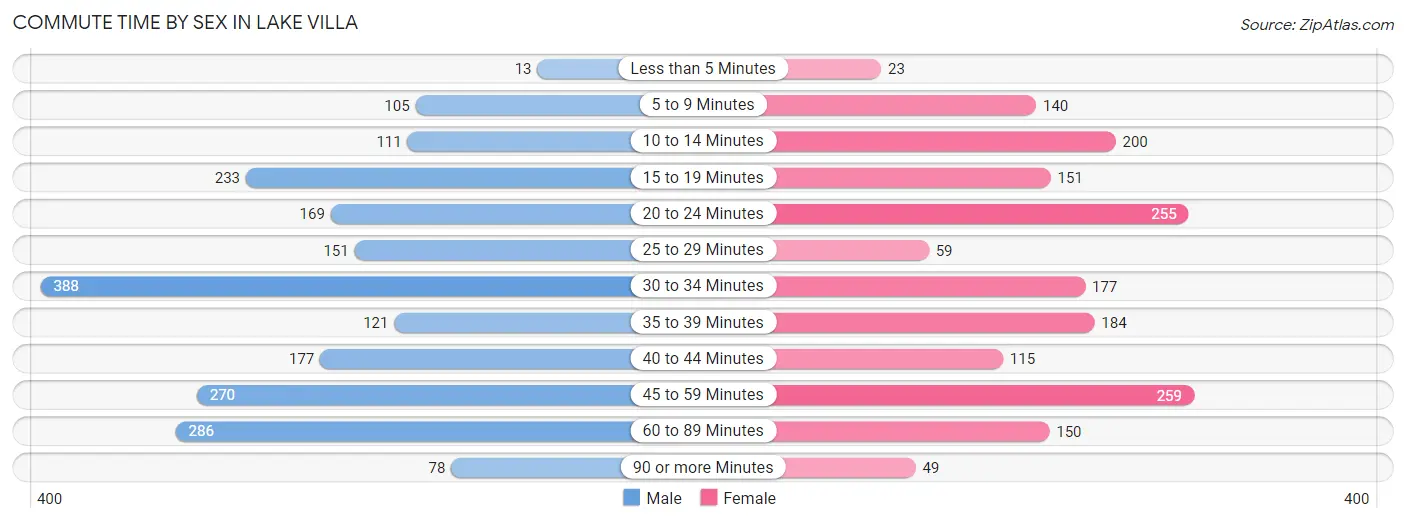
| Commute Time | Male | Female |
| Less than 5 Minutes | 13 (0.6%) | 23 (1.3%) |
| 5 to 9 Minutes | 105 (5.0%) | 140 (8.0%) |
| 10 to 14 Minutes | 111 (5.3%) | 200 (11.4%) |
| 15 to 19 Minutes | 233 (11.1%) | 151 (8.6%) |
| 20 to 24 Minutes | 169 (8.0%) | 255 (14.5%) |
| 25 to 29 Minutes | 151 (7.2%) | 59 (3.4%) |
| 30 to 34 Minutes | 388 (18.5%) | 177 (10.1%) |
| 35 to 39 Minutes | 121 (5.8%) | 184 (10.4%) |
| 40 to 44 Minutes | 177 (8.4%) | 115 (6.5%) |
| 45 to 59 Minutes | 270 (12.8%) | 259 (14.7%) |
| 60 to 89 Minutes | 286 (13.6%) | 150 (8.5%) |
| 90 or more Minutes | 78 (3.7%) | 49 (2.8%) |
Time of Departure to Work by Sex in Lake Villa
The most frequent times of departure to work in Lake Villa are 7:00 AM to 7:29 AM (283, 13.5%) for males and 7:00 AM to 7:29 AM (402, 22.8%) for females.
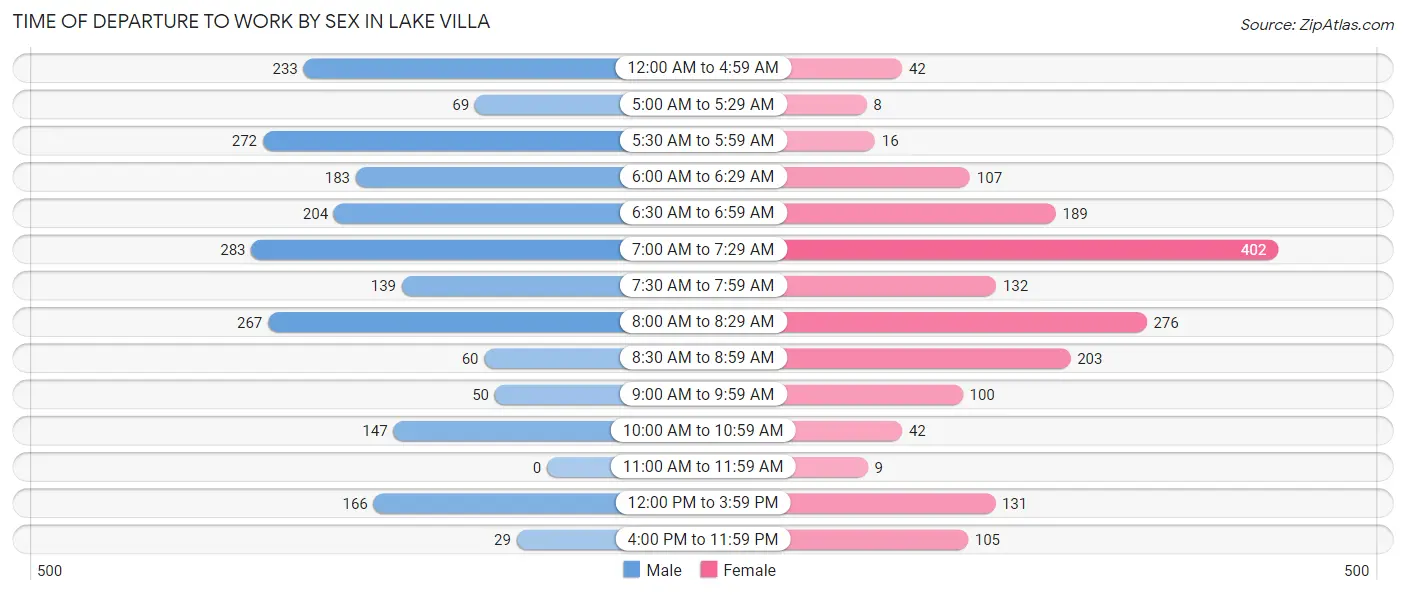
| Time of Departure | Male | Female |
| 12:00 AM to 4:59 AM | 233 (11.1%) | 42 (2.4%) |
| 5:00 AM to 5:29 AM | 69 (3.3%) | 8 (0.4%) |
| 5:30 AM to 5:59 AM | 272 (12.9%) | 16 (0.9%) |
| 6:00 AM to 6:29 AM | 183 (8.7%) | 107 (6.1%) |
| 6:30 AM to 6:59 AM | 204 (9.7%) | 189 (10.7%) |
| 7:00 AM to 7:29 AM | 283 (13.5%) | 402 (22.8%) |
| 7:30 AM to 7:59 AM | 139 (6.6%) | 132 (7.5%) |
| 8:00 AM to 8:29 AM | 267 (12.7%) | 276 (15.7%) |
| 8:30 AM to 8:59 AM | 60 (2.9%) | 203 (11.5%) |
| 9:00 AM to 9:59 AM | 50 (2.4%) | 100 (5.7%) |
| 10:00 AM to 10:59 AM | 147 (7.0%) | 42 (2.4%) |
| 11:00 AM to 11:59 AM | 0 (0.0%) | 9 (0.5%) |
| 12:00 PM to 3:59 PM | 166 (7.9%) | 131 (7.4%) |
| 4:00 PM to 11:59 PM | 29 (1.4%) | 105 (6.0%) |
| Total | 2,102 (100.0%) | 1,762 (100.0%) |
Housing Occupancy in Lake Villa
Occupancy by Ownership in Lake Villa
Of the total 3,078 dwellings in Lake Villa, owner-occupied units account for 2,217 (72.0%), while renter-occupied units make up 861 (28.0%).
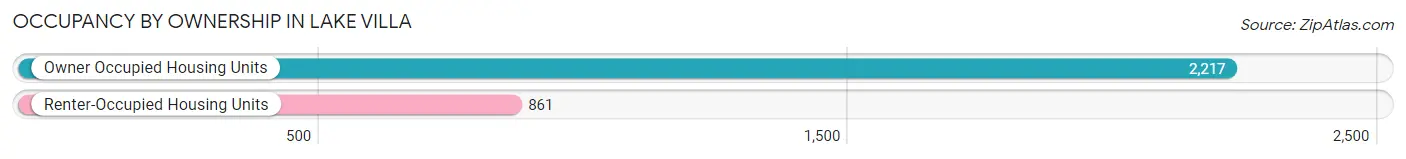
| Occupancy | # Housing Units | % Housing Units |
| Owner Occupied Housing Units | 2,217 | 72.0% |
| Renter-Occupied Housing Units | 861 | 28.0% |
| Total Occupied Housing Units | 3,078 | 100.0% |
Occupancy by Household Size in Lake Villa
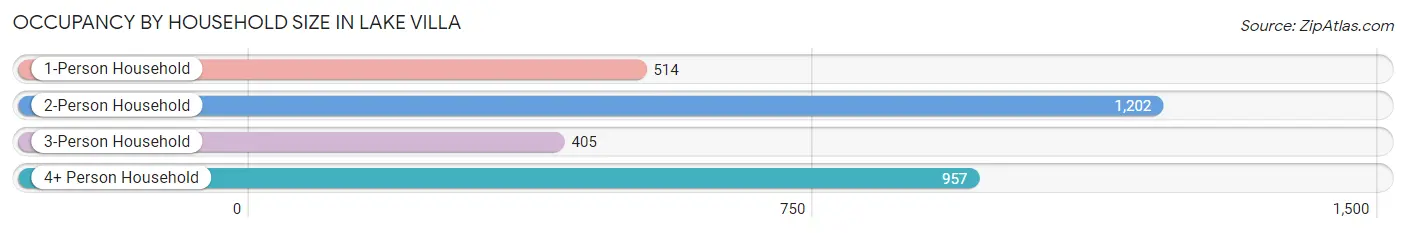
| Household Size | # Housing Units | % Housing Units |
| 1-Person Household | 514 | 16.7% |
| 2-Person Household | 1,202 | 39.1% |
| 3-Person Household | 405 | 13.2% |
| 4+ Person Household | 957 | 31.1% |
| Total Housing Units | 3,078 | 100.0% |
Occupancy by Ownership by Household Size in Lake Villa
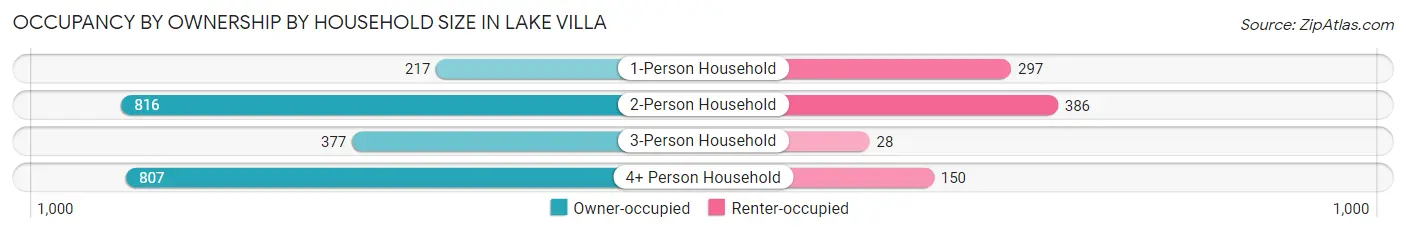
| Household Size | Owner-occupied | Renter-occupied |
| 1-Person Household | 217 (42.2%) | 297 (57.8%) |
| 2-Person Household | 816 (67.9%) | 386 (32.1%) |
| 3-Person Household | 377 (93.1%) | 28 (6.9%) |
| 4+ Person Household | 807 (84.3%) | 150 (15.7%) |
| Total Housing Units | 2,217 (72.0%) | 861 (28.0%) |
Occupancy by Educational Attainment in Lake Villa
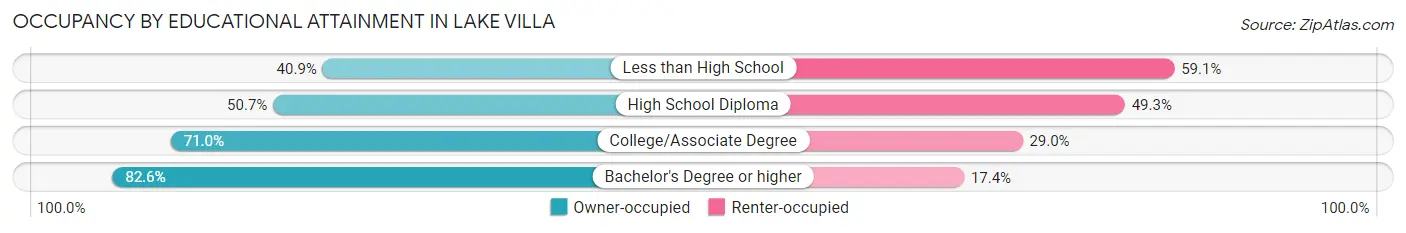
| Household Size | Owner-occupied | Renter-occupied |
| Less than High School | 45 (40.9%) | 65 (59.1%) |
| High School Diploma | 280 (50.7%) | 272 (49.3%) |
| College/Associate Degree | 634 (71.0%) | 259 (29.0%) |
| Bachelor's Degree or higher | 1,258 (82.6%) | 265 (17.4%) |
Occupancy by Age of Householder in Lake Villa
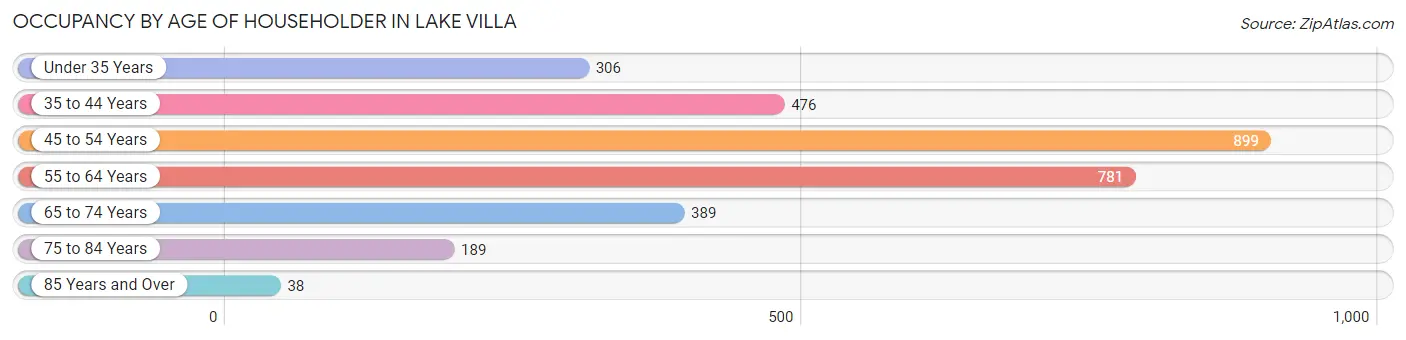
| Age Bracket | # Households | % Households |
| Under 35 Years | 306 | 9.9% |
| 35 to 44 Years | 476 | 15.5% |
| 45 to 54 Years | 899 | 29.2% |
| 55 to 64 Years | 781 | 25.4% |
| 65 to 74 Years | 389 | 12.6% |
| 75 to 84 Years | 189 | 6.1% |
| 85 Years and Over | 38 | 1.2% |
| Total | 3,078 | 100.0% |
Housing Finances in Lake Villa
Median Income by Occupancy in Lake Villa
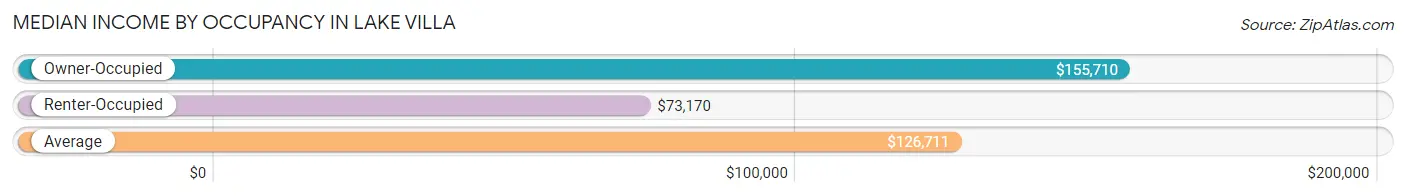
| Occupancy Type | # Households | Median Income |
| Owner-Occupied | 2,217 (72.0%) | $155,710 |
| Renter-Occupied | 861 (28.0%) | $73,170 |
| Average | 3,078 (100.0%) | $126,711 |
Occupancy by Householder Income Bracket in Lake Villa
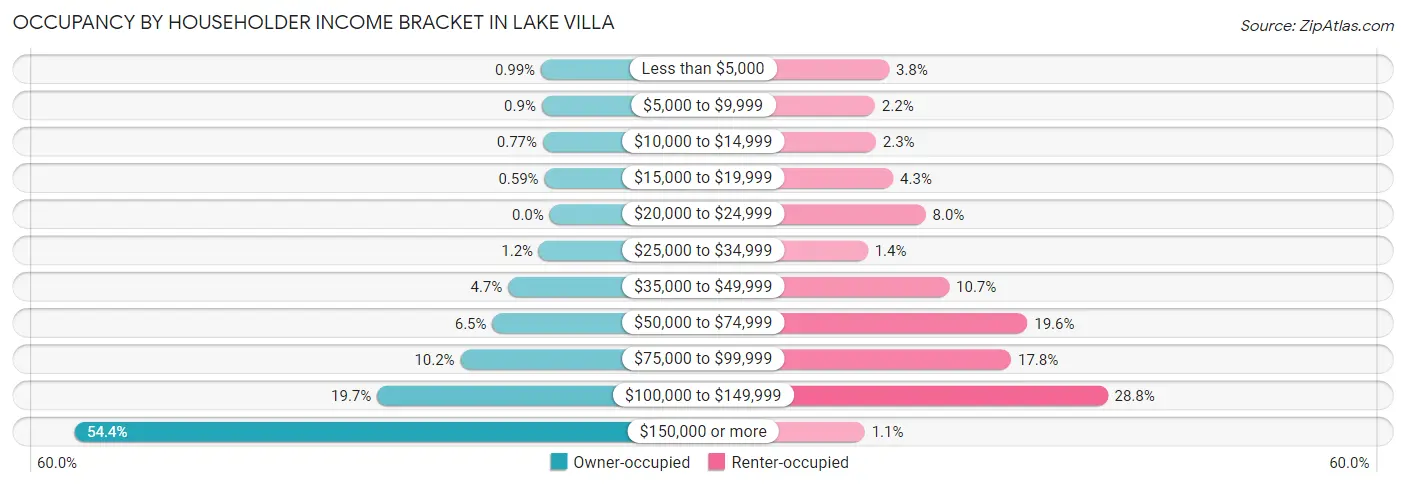
| Income Bracket | Owner-occupied | Renter-occupied |
| Less than $5,000 | 22 (1.0%) | 33 (3.8%) |
| $5,000 to $9,999 | 20 (0.9%) | 19 (2.2%) |
| $10,000 to $14,999 | 17 (0.8%) | 20 (2.3%) |
| $15,000 to $19,999 | 13 (0.6%) | 37 (4.3%) |
| $20,000 to $24,999 | 0 (0.0%) | 69 (8.0%) |
| $25,000 to $34,999 | 27 (1.2%) | 12 (1.4%) |
| $35,000 to $49,999 | 105 (4.7%) | 92 (10.7%) |
| $50,000 to $74,999 | 145 (6.5%) | 169 (19.6%) |
| $75,000 to $99,999 | 226 (10.2%) | 153 (17.8%) |
| $100,000 to $149,999 | 437 (19.7%) | 248 (28.8%) |
| $150,000 or more | 1,205 (54.3%) | 9 (1.1%) |
| Total | 2,217 (100.0%) | 861 (100.0%) |
Monthly Housing Cost Tiers in Lake Villa
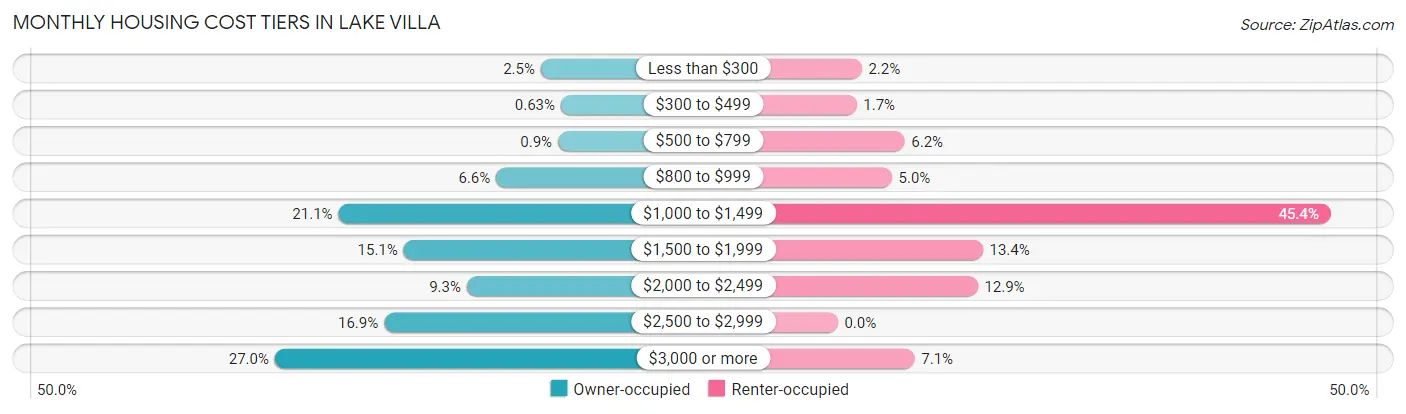
| Monthly Cost | Owner-occupied | Renter-occupied |
| Less than $300 | 55 (2.5%) | 19 (2.2%) |
| $300 to $499 | 14 (0.6%) | 15 (1.7%) |
| $500 to $799 | 20 (0.9%) | 53 (6.2%) |
| $800 to $999 | 146 (6.6%) | 43 (5.0%) |
| $1,000 to $1,499 | 468 (21.1%) | 391 (45.4%) |
| $1,500 to $1,999 | 335 (15.1%) | 115 (13.4%) |
| $2,000 to $2,499 | 206 (9.3%) | 111 (12.9%) |
| $2,500 to $2,999 | 375 (16.9%) | 0 (0.0%) |
| $3,000 or more | 598 (27.0%) | 61 (7.1%) |
| Total | 2,217 (100.0%) | 861 (100.0%) |
Physical Housing Characteristics in Lake Villa
Housing Structures in Lake Villa
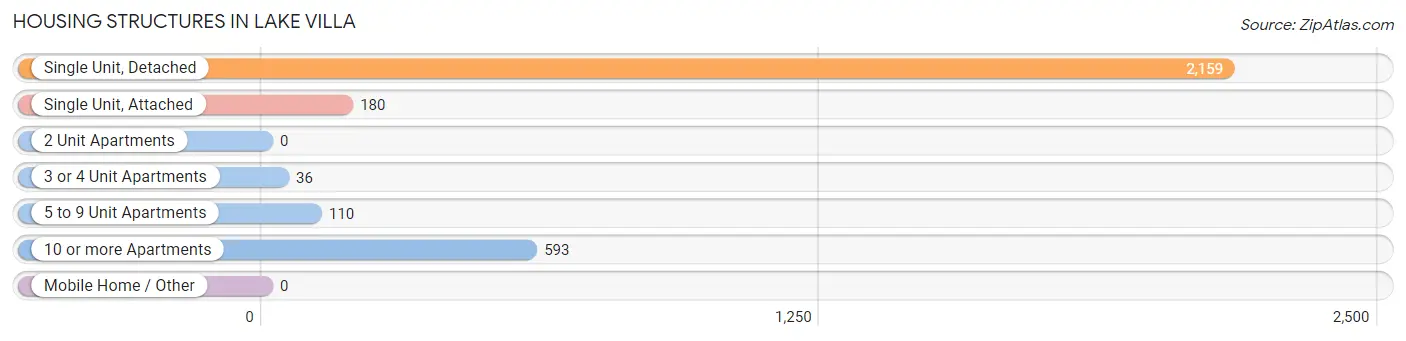
| Structure Type | # Housing Units | % Housing Units |
| Single Unit, Detached | 2,159 | 70.1% |
| Single Unit, Attached | 180 | 5.9% |
| 2 Unit Apartments | 0 | 0.0% |
| 3 or 4 Unit Apartments | 36 | 1.2% |
| 5 to 9 Unit Apartments | 110 | 3.6% |
| 10 or more Apartments | 593 | 19.3% |
| Mobile Home / Other | 0 | 0.0% |
| Total | 3,078 | 100.0% |
Housing Structures by Occupancy in Lake Villa
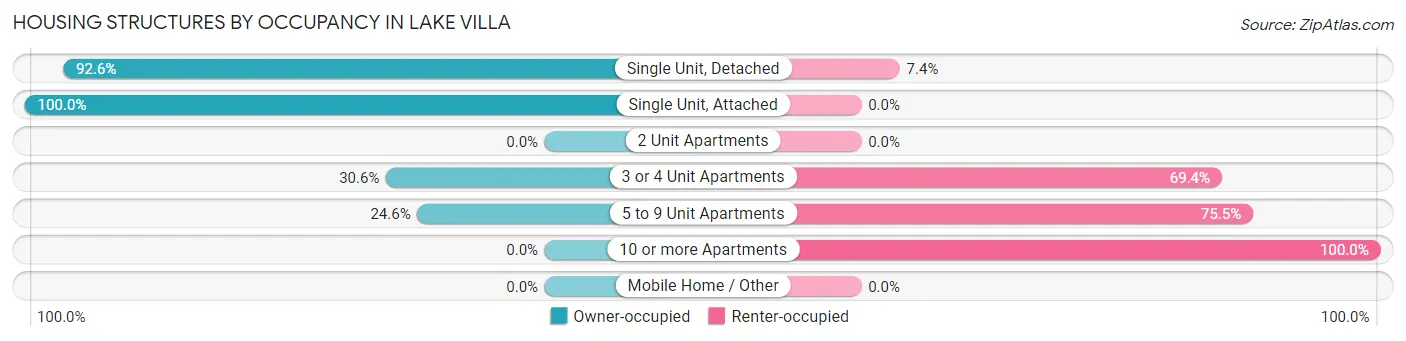
| Structure Type | Owner-occupied | Renter-occupied |
| Single Unit, Detached | 1,999 (92.6%) | 160 (7.4%) |
| Single Unit, Attached | 180 (100.0%) | 0 (0.0%) |
| 2 Unit Apartments | 0 (0.0%) | 0 (0.0%) |
| 3 or 4 Unit Apartments | 11 (30.6%) | 25 (69.4%) |
| 5 to 9 Unit Apartments | 27 (24.5%) | 83 (75.4%) |
| 10 or more Apartments | 0 (0.0%) | 593 (100.0%) |
| Mobile Home / Other | 0 (0.0%) | 0 (0.0%) |
| Total | 2,217 (72.0%) | 861 (28.0%) |
Housing Structures by Number of Rooms in Lake Villa
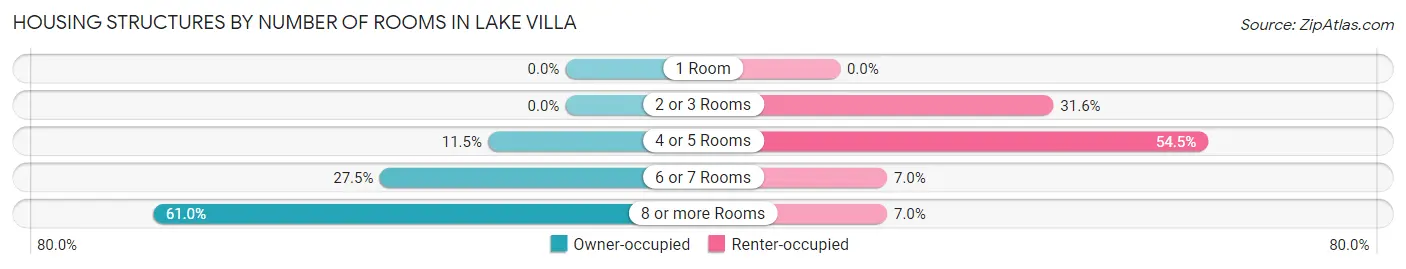
| Number of Rooms | Owner-occupied | Renter-occupied |
| 1 Room | 0 (0.0%) | 0 (0.0%) |
| 2 or 3 Rooms | 0 (0.0%) | 272 (31.6%) |
| 4 or 5 Rooms | 254 (11.5%) | 469 (54.5%) |
| 6 or 7 Rooms | 610 (27.5%) | 60 (7.0%) |
| 8 or more Rooms | 1,353 (61.0%) | 60 (7.0%) |
| Total | 2,217 (100.0%) | 861 (100.0%) |
Housing Structure by Heating Type in Lake Villa
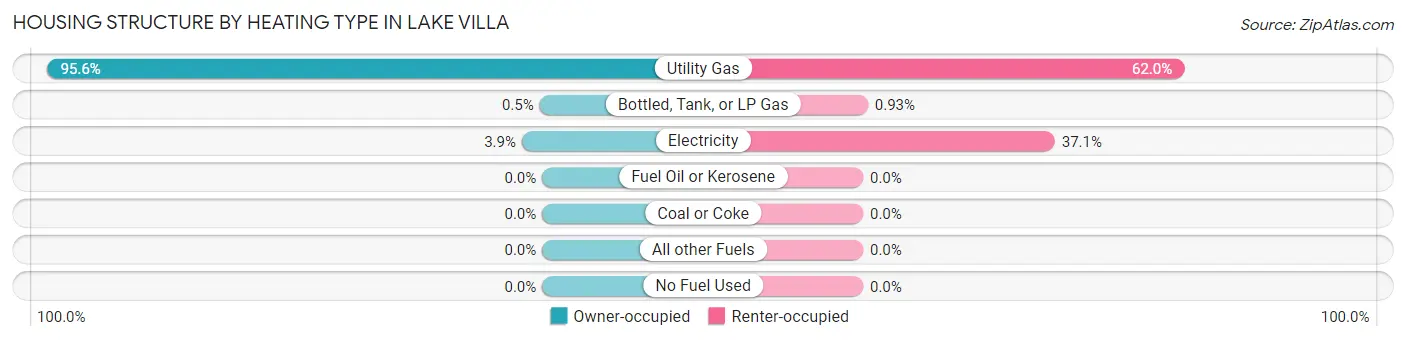
| Heating Type | Owner-occupied | Renter-occupied |
| Utility Gas | 2,119 (95.6%) | 534 (62.0%) |
| Bottled, Tank, or LP Gas | 11 (0.5%) | 8 (0.9%) |
| Electricity | 87 (3.9%) | 319 (37.0%) |
| Fuel Oil or Kerosene | 0 (0.0%) | 0 (0.0%) |
| Coal or Coke | 0 (0.0%) | 0 (0.0%) |
| All other Fuels | 0 (0.0%) | 0 (0.0%) |
| No Fuel Used | 0 (0.0%) | 0 (0.0%) |
| Total | 2,217 (100.0%) | 861 (100.0%) |
Household Vehicle Usage in Lake Villa
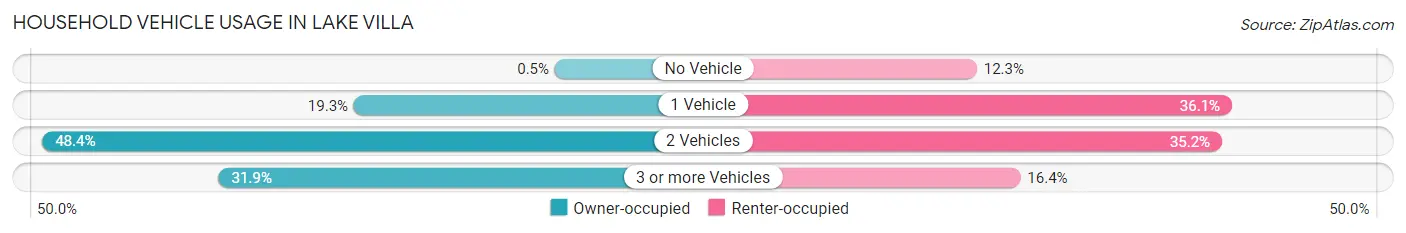
| Vehicles per Household | Owner-occupied | Renter-occupied |
| No Vehicle | 11 (0.5%) | 106 (12.3%) |
| 1 Vehicle | 427 (19.3%) | 311 (36.1%) |
| 2 Vehicles | 1,072 (48.3%) | 303 (35.2%) |
| 3 or more Vehicles | 707 (31.9%) | 141 (16.4%) |
| Total | 2,217 (100.0%) | 861 (100.0%) |
Real Estate & Mortgages in Lake Villa
Real Estate and Mortgage Overview in Lake Villa
| Characteristic | Without Mortgage | With Mortgage |
| Housing Units | 683 | 1,534 |
| Median Property Value | $273,900 | $324,500 |
| Median Household Income | $103,934 | $923 |
| Monthly Housing Costs | $1,185 | $598 |
| Real Estate Taxes | $9,760 | $15 |
Property Value by Mortgage Status in Lake Villa
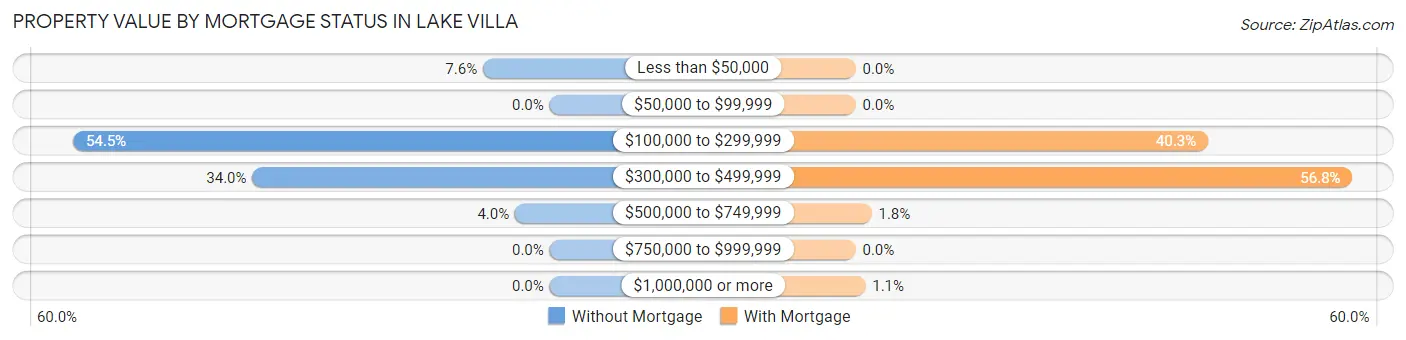
| Property Value | Without Mortgage | With Mortgage |
| Less than $50,000 | 52 (7.6%) | 0 (0.0%) |
| $50,000 to $99,999 | 0 (0.0%) | 0 (0.0%) |
| $100,000 to $299,999 | 372 (54.5%) | 618 (40.3%) |
| $300,000 to $499,999 | 232 (34.0%) | 871 (56.8%) |
| $500,000 to $749,999 | 27 (4.0%) | 28 (1.8%) |
| $750,000 to $999,999 | 0 (0.0%) | 0 (0.0%) |
| $1,000,000 or more | 0 (0.0%) | 17 (1.1%) |
| Total | 683 (100.0%) | 1,534 (100.0%) |
Household Income by Mortgage Status in Lake Villa
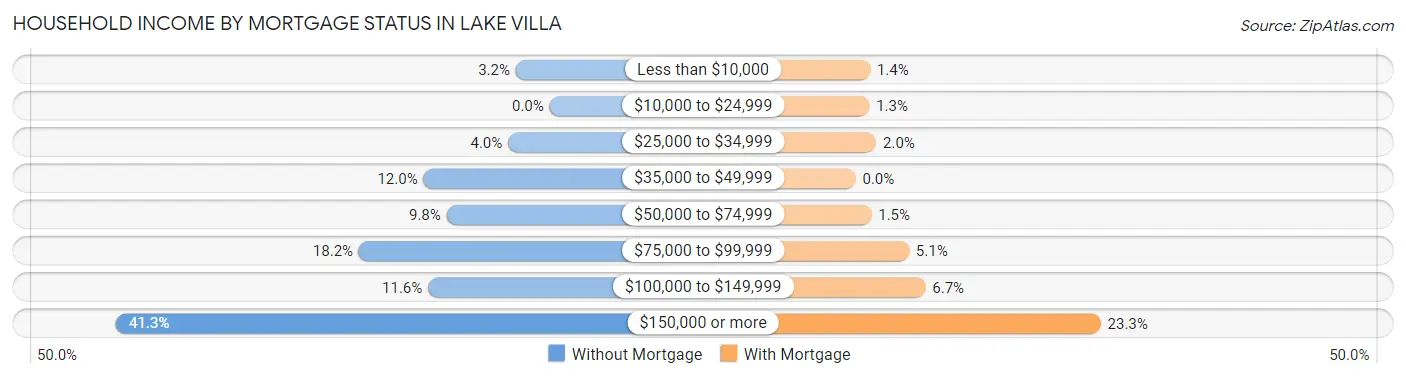
| Household Income | Without Mortgage | With Mortgage |
| Less than $10,000 | 22 (3.2%) | 21 (1.4%) |
| $10,000 to $24,999 | 0 (0.0%) | 20 (1.3%) |
| $25,000 to $34,999 | 27 (4.0%) | 30 (2.0%) |
| $35,000 to $49,999 | 82 (12.0%) | 0 (0.0%) |
| $50,000 to $74,999 | 67 (9.8%) | 23 (1.5%) |
| $75,000 to $99,999 | 124 (18.2%) | 78 (5.1%) |
| $100,000 to $149,999 | 79 (11.6%) | 102 (6.7%) |
| $150,000 or more | 282 (41.3%) | 358 (23.3%) |
| Total | 683 (100.0%) | 1,534 (100.0%) |
Property Value to Household Income Ratio in Lake Villa
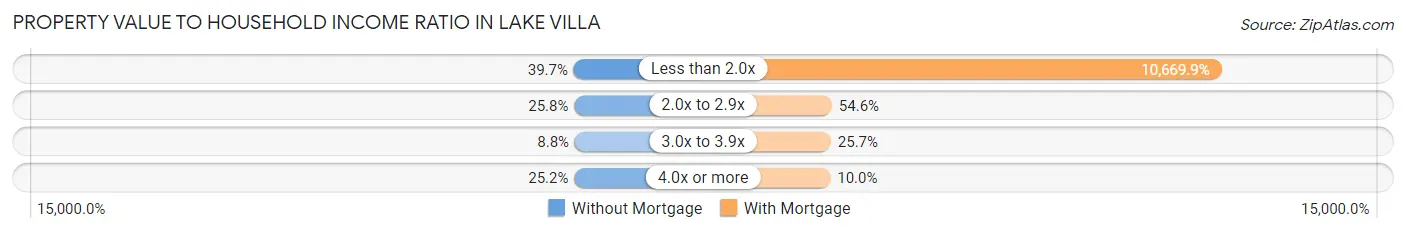
| Value-to-Income Ratio | Without Mortgage | With Mortgage |
| Less than 2.0x | 271 (39.7%) | 163,676 (10,669.9%) |
| 2.0x to 2.9x | 176 (25.8%) | 838 (54.6%) |
| 3.0x to 3.9x | 60 (8.8%) | 394 (25.7%) |
| 4.0x or more | 172 (25.2%) | 154 (10.0%) |
| Total | 683 (100.0%) | 1,534 (100.0%) |
Real Estate Taxes by Mortgage Status in Lake Villa
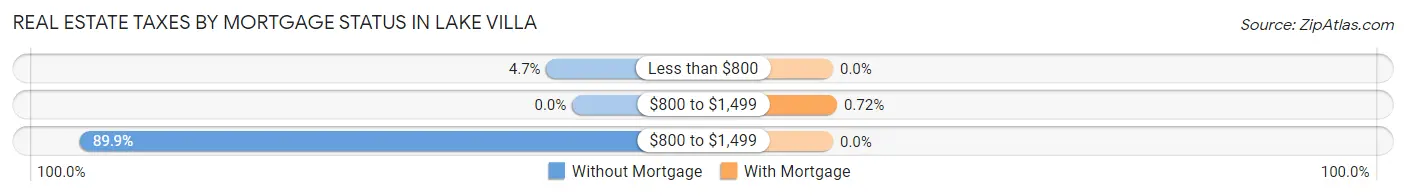
| Property Taxes | Without Mortgage | With Mortgage |
| Less than $800 | 32 (4.7%) | 0 (0.0%) |
| $800 to $1,499 | 0 (0.0%) | 11 (0.7%) |
| $800 to $1,499 | 614 (89.9%) | 0 (0.0%) |
| Total | 683 (100.0%) | 1,534 (100.0%) |
Health & Disability in Lake Villa
Health Insurance Coverage by Age in Lake Villa
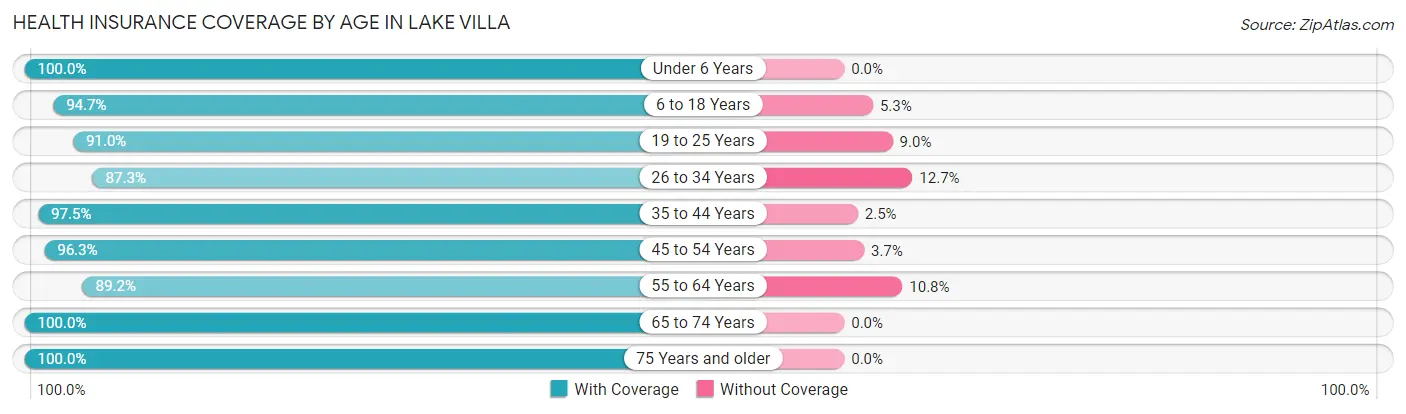
| Age Bracket | With Coverage | Without Coverage |
| Under 6 Years | 382 (100.0%) | 0 (0.0%) |
| 6 to 18 Years | 1,913 (94.7%) | 108 (5.3%) |
| 19 to 25 Years | 686 (91.0%) | 68 (9.0%) |
| 26 to 34 Years | 536 (87.3%) | 78 (12.7%) |
| 35 to 44 Years | 887 (97.5%) | 23 (2.5%) |
| 45 to 54 Years | 1,490 (96.3%) | 57 (3.7%) |
| 55 to 64 Years | 1,260 (89.2%) | 153 (10.8%) |
| 65 to 74 Years | 646 (100.0%) | 0 (0.0%) |
| 75 Years and older | 359 (100.0%) | 0 (0.0%) |
| Total | 8,159 (94.4%) | 487 (5.6%) |
Health Insurance Coverage by Citizenship Status in Lake Villa
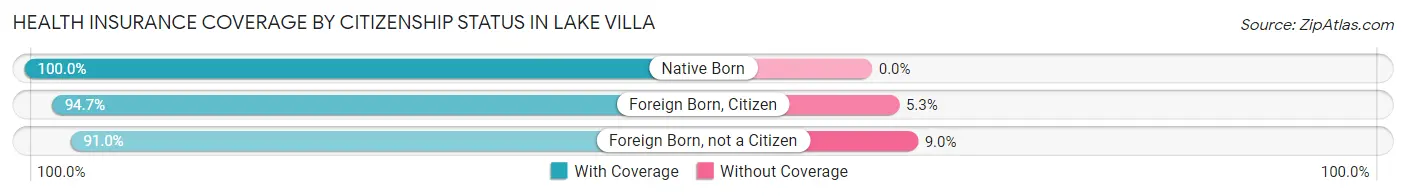
| Citizenship Status | With Coverage | Without Coverage |
| Native Born | 382 (100.0%) | 0 (0.0%) |
| Foreign Born, Citizen | 1,913 (94.7%) | 108 (5.3%) |
| Foreign Born, not a Citizen | 686 (91.0%) | 68 (9.0%) |
Health Insurance Coverage by Household Income in Lake Villa
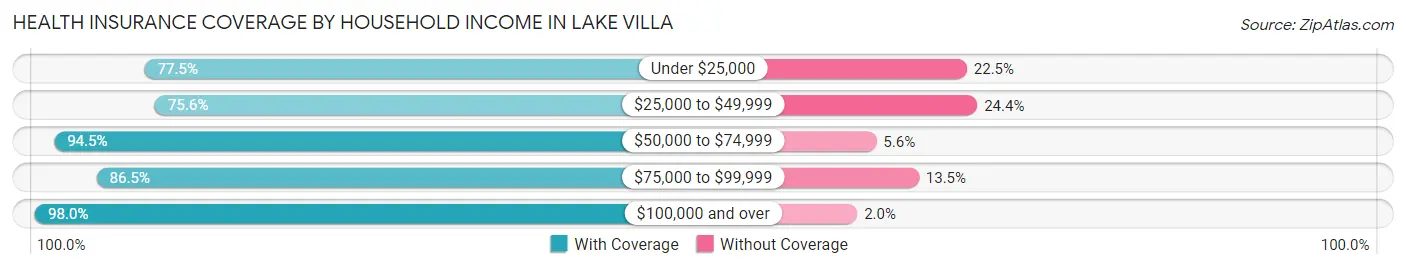
| Household Income | With Coverage | Without Coverage |
| Under $25,000 | 379 (77.5%) | 110 (22.5%) |
| $25,000 to $49,999 | 303 (75.6%) | 98 (24.4%) |
| $50,000 to $74,999 | 647 (94.5%) | 38 (5.6%) |
| $75,000 to $99,999 | 769 (86.5%) | 120 (13.5%) |
| $100,000 and over | 6,061 (98.0%) | 121 (2.0%) |
Public vs Private Health Insurance Coverage by Age in Lake Villa
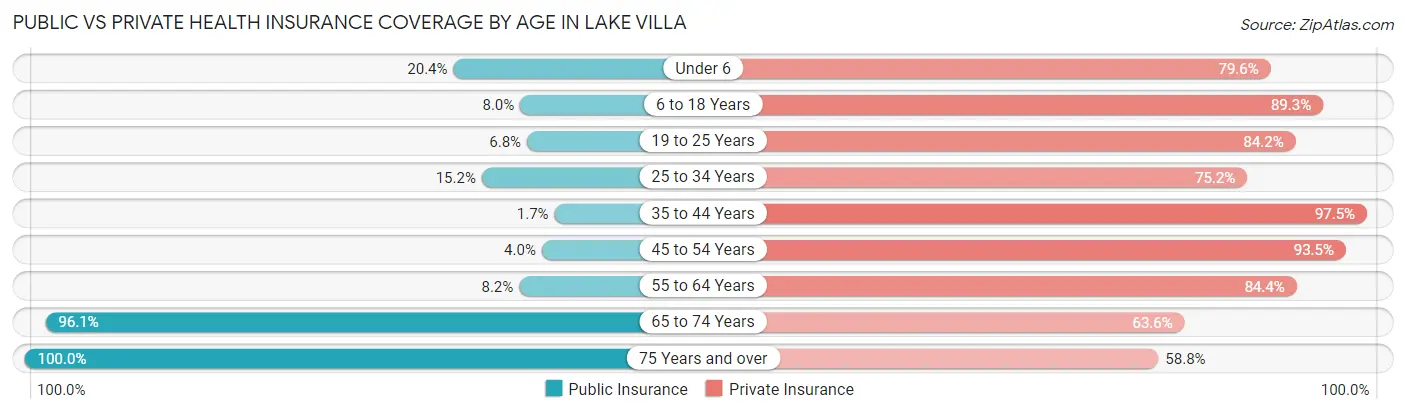
| Age Bracket | Public Insurance | Private Insurance |
| Under 6 | 78 (20.4%) | 304 (79.6%) |
| 6 to 18 Years | 162 (8.0%) | 1,805 (89.3%) |
| 19 to 25 Years | 51 (6.8%) | 635 (84.2%) |
| 25 to 34 Years | 93 (15.1%) | 462 (75.2%) |
| 35 to 44 Years | 15 (1.7%) | 887 (97.5%) |
| 45 to 54 Years | 62 (4.0%) | 1,447 (93.5%) |
| 55 to 64 Years | 116 (8.2%) | 1,193 (84.4%) |
| 65 to 74 Years | 621 (96.1%) | 411 (63.6%) |
| 75 Years and over | 359 (100.0%) | 211 (58.8%) |
| Total | 1,557 (18.0%) | 7,355 (85.1%) |
Disability Status by Sex by Age in Lake Villa
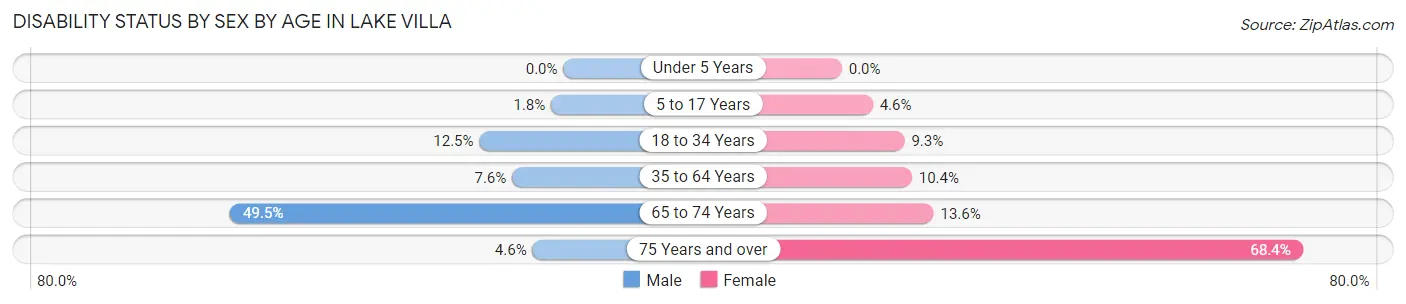
| Age Bracket | Male | Female |
| Under 5 Years | 0 (0.0%) | 0 (0.0%) |
| 5 to 17 Years | 18 (1.8%) | 40 (4.6%) |
| 18 to 34 Years | 100 (12.5%) | 73 (9.3%) |
| 35 to 64 Years | 140 (7.6%) | 211 (10.4%) |
| 65 to 74 Years | 149 (49.5%) | 47 (13.6%) |
| 75 Years and over | 6 (4.6%) | 156 (68.4%) |
Disability Class by Sex by Age in Lake Villa
Disability Class: Hearing Difficulty
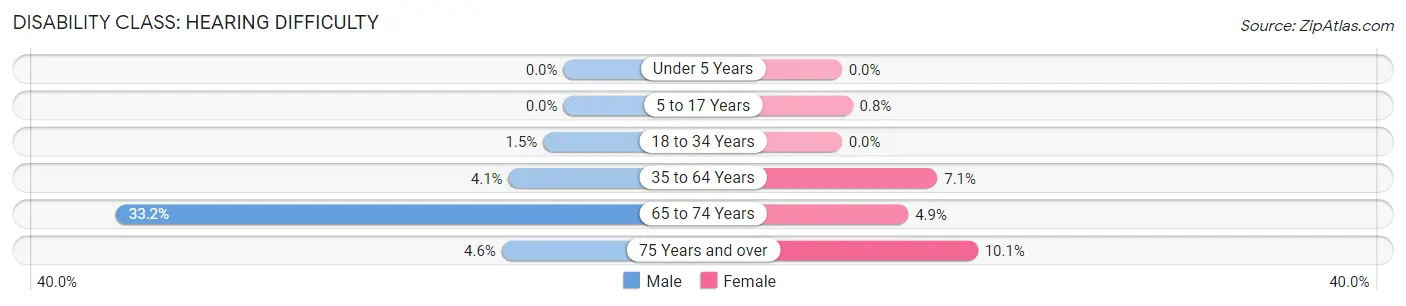
| Age Bracket | Male | Female |
| Under 5 Years | 0 (0.0%) | 0 (0.0%) |
| 5 to 17 Years | 0 (0.0%) | 7 (0.8%) |
| 18 to 34 Years | 12 (1.5%) | 0 (0.0%) |
| 35 to 64 Years | 75 (4.1%) | 144 (7.1%) |
| 65 to 74 Years | 100 (33.2%) | 17 (4.9%) |
| 75 Years and over | 6 (4.6%) | 23 (10.1%) |
Disability Class: Vision Difficulty
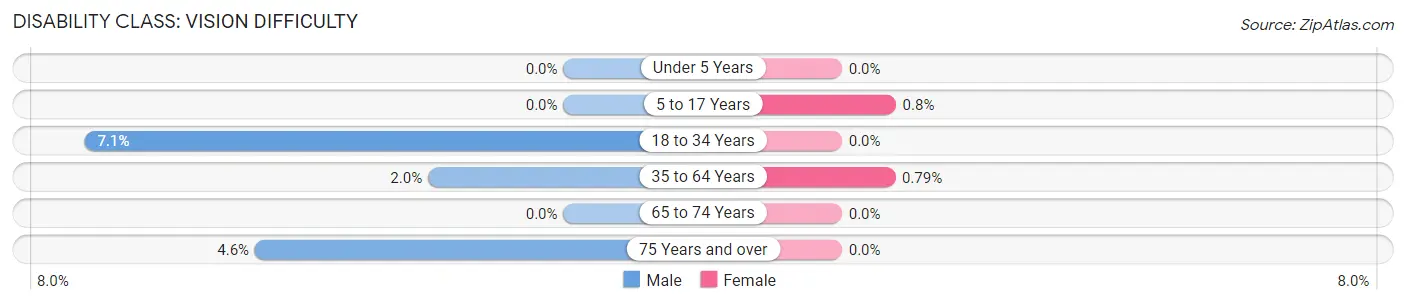
| Age Bracket | Male | Female |
| Under 5 Years | 0 (0.0%) | 0 (0.0%) |
| 5 to 17 Years | 0 (0.0%) | 7 (0.8%) |
| 18 to 34 Years | 57 (7.1%) | 0 (0.0%) |
| 35 to 64 Years | 37 (2.0%) | 16 (0.8%) |
| 65 to 74 Years | 0 (0.0%) | 0 (0.0%) |
| 75 Years and over | 6 (4.6%) | 0 (0.0%) |
Disability Class: Cognitive Difficulty
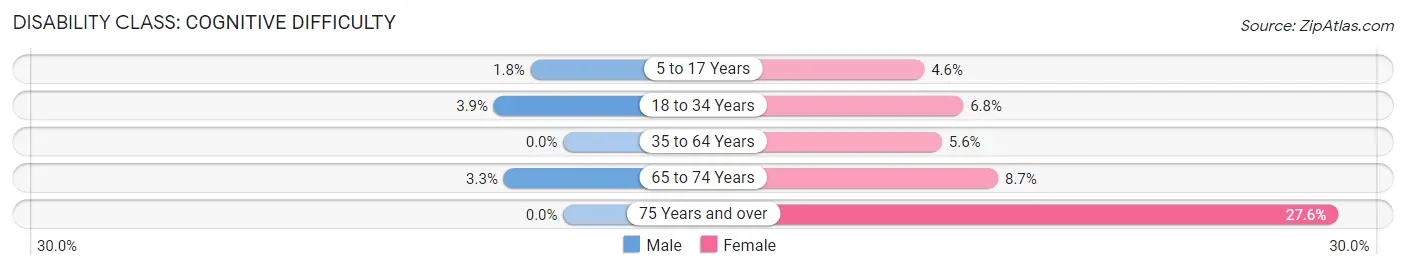
| Age Bracket | Male | Female |
| 5 to 17 Years | 18 (1.8%) | 40 (4.6%) |
| 18 to 34 Years | 31 (3.9%) | 53 (6.8%) |
| 35 to 64 Years | 0 (0.0%) | 113 (5.6%) |
| 65 to 74 Years | 10 (3.3%) | 30 (8.7%) |
| 75 Years and over | 0 (0.0%) | 63 (27.6%) |
Disability Class: Ambulatory Difficulty
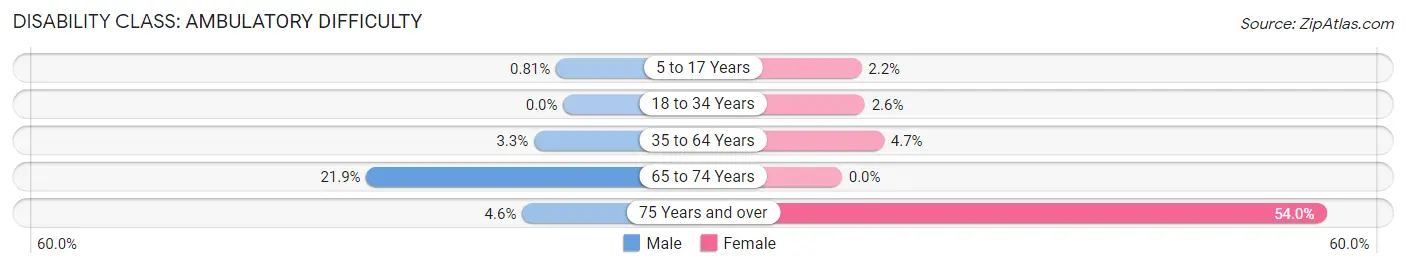
| Age Bracket | Male | Female |
| 5 to 17 Years | 8 (0.8%) | 19 (2.2%) |
| 18 to 34 Years | 0 (0.0%) | 20 (2.5%) |
| 35 to 64 Years | 60 (3.3%) | 95 (4.7%) |
| 65 to 74 Years | 66 (21.9%) | 0 (0.0%) |
| 75 Years and over | 6 (4.6%) | 123 (53.9%) |
Disability Class: Self-Care Difficulty
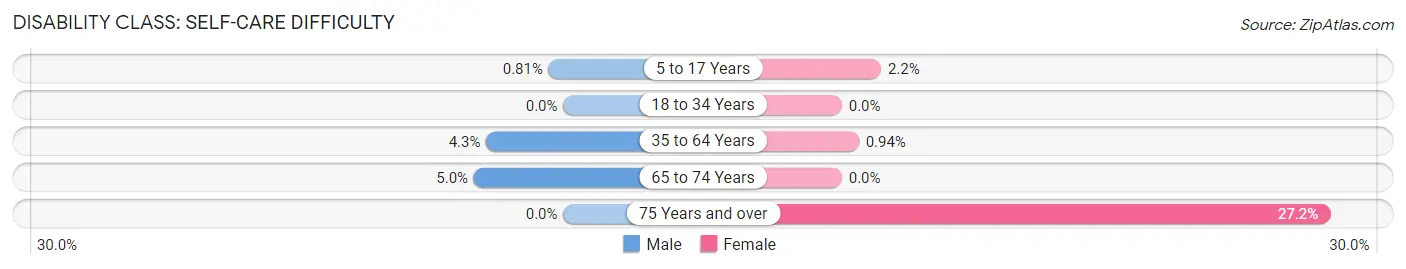
| Age Bracket | Male | Female |
| 5 to 17 Years | 8 (0.8%) | 19 (2.2%) |
| 18 to 34 Years | 0 (0.0%) | 0 (0.0%) |
| 35 to 64 Years | 79 (4.3%) | 19 (0.9%) |
| 65 to 74 Years | 15 (5.0%) | 0 (0.0%) |
| 75 Years and over | 0 (0.0%) | 62 (27.2%) |
Technology Access in Lake Villa
Computing Device Access in Lake Villa
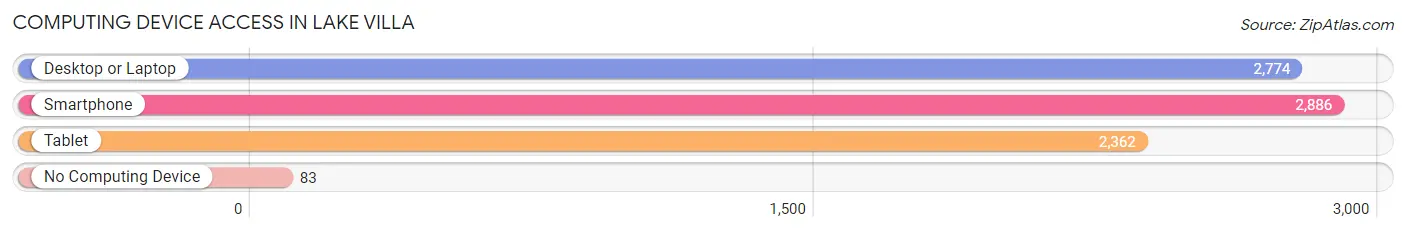
| Device Type | # Households | % Households |
| Desktop or Laptop | 2,774 | 90.1% |
| Smartphone | 2,886 | 93.8% |
| Tablet | 2,362 | 76.7% |
| No Computing Device | 83 | 2.7% |
| Total | 3,078 | 100.0% |
Internet Access in Lake Villa
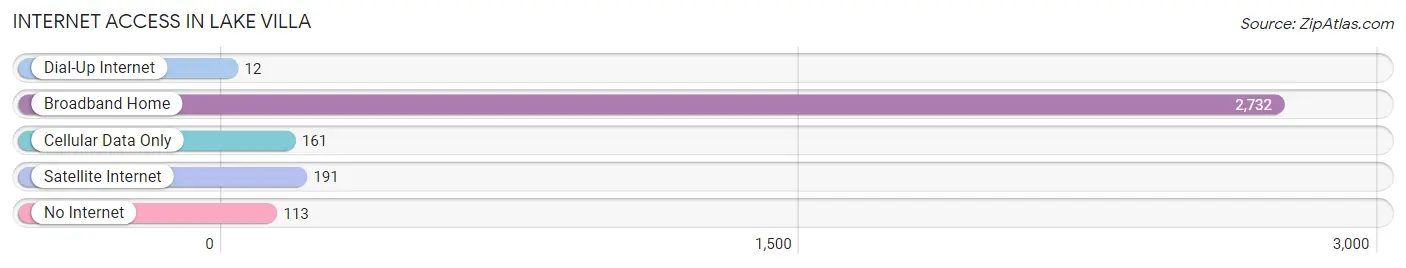
| Internet Type | # Households | % Households |
| Dial-Up Internet | 12 | 0.4% |
| Broadband Home | 2,732 | 88.8% |
| Cellular Data Only | 161 | 5.2% |
| Satellite Internet | 191 | 6.2% |
| No Internet | 113 | 3.7% |
| Total | 3,078 | 100.0% |
Lake Villa Summary
Lake Villa is a village located in Lake County, Illinois, United States. The population was 8,742 at the 2010 census. It is part of the Chicago metropolitan area.
History
The area that is now Lake Villa was first settled in the 1830s by pioneers from New England. The first settler was William H. Blodgett, who arrived in 1836. He built a log cabin and began farming the land. Other settlers soon followed, and the area was known as Blodgett’s Grove.
In 1849, the area was renamed to Lake Villa, after the nearby lake. The village was officially incorporated in 1887.
In the early 1900s, the village was a popular summer resort destination. It was known for its beautiful lakefront and its many resorts and hotels.
In the 1950s, the village began to grow rapidly as more people moved to the area. The population increased from 1,000 in 1950 to 8,742 in 2010.
Geography
Lake Villa is located in northeastern Illinois, about 40 miles north of Chicago. It is situated on the western shore of Lake Michigan.
The village covers an area of 4.2 square miles, of which 0.2 square miles is water. The terrain is mostly flat, with some rolling hills.
Economy
The economy of Lake Villa is largely based on tourism and retail. The village is home to several resorts and hotels, as well as a variety of shops and restaurants.
The village is also home to several manufacturing companies, including a plastics manufacturer and a metal fabrication company.
Demographics
As of the 2010 census, the population of Lake Villa was 8,742. The racial makeup of the village was 94.2% White, 1.2% African American, 0.3% Native American, 1.2% Asian, 0.1% Pacific Islander, 1.7% from other races, and 1.4% from two or more races. Hispanic or Latino of any race were 4.3% of the population.
The median household income in Lake Villa was $68,958, and the median family income was $77,917. The per capita income was $30,945. About 4.2% of families and 5.3% of the population were below the poverty line.
The village is served by two school districts: Lake Villa Community Consolidated School District 41 and Antioch Community High School District 117. The village is also home to several private schools, including Lake Villa Christian Academy and St. Bede Catholic School.
Common Questions
What is Per Capita Income in Lake Villa?
Per Capita income in Lake Villa is $51,329.
What is the Median Family Income in Lake Villa?
Median Family Income in Lake Villa is $149,345.
What is the Median Household income in Lake Villa?
Median Household Income in Lake Villa is $126,711.
What is Income or Wage Gap in Lake Villa?
Income or Wage Gap in Lake Villa is 28.3%.
Women in Lake Villa earn 71.7 cents for every dollar earned by a man.
What is Inequality or Gini Index in Lake Villa?
Inequality or Gini Index in Lake Villa is 0.38.
What is the Total Population of Lake Villa?
Total Population of Lake Villa is 8,701.
What is the Total Male Population of Lake Villa?
Total Male Population of Lake Villa is 4,255.
What is the Total Female Population of Lake Villa?
Total Female Population of Lake Villa is 4,446.
What is the Ratio of Males per 100 Females in Lake Villa?
There are 95.70 Males per 100 Females in Lake Villa.
What is the Ratio of Females per 100 Males in Lake Villa?
There are 104.49 Females per 100 Males in Lake Villa.
What is the Median Population Age in Lake Villa?
Median Population Age in Lake Villa is 40.9 Years.
What is the Average Family Size in Lake Villa
Average Family Size in Lake Villa is 3.2 People.
What is the Average Household Size in Lake Villa
Average Household Size in Lake Villa is 2.8 People.
How Large is the Labor Force in Lake Villa?
There are 4,772 People in the Labor Forcein in Lake Villa.
What is the Percentage of People in the Labor Force in Lake Villa?
68.4% of People are in the Labor Force in Lake Villa.
What is the Unemployment Rate in Lake Villa?
Unemployment Rate in Lake Villa is 6.7%.