Hawthorn Woods, IL Map & Demographics
Hawthorn Woods Map
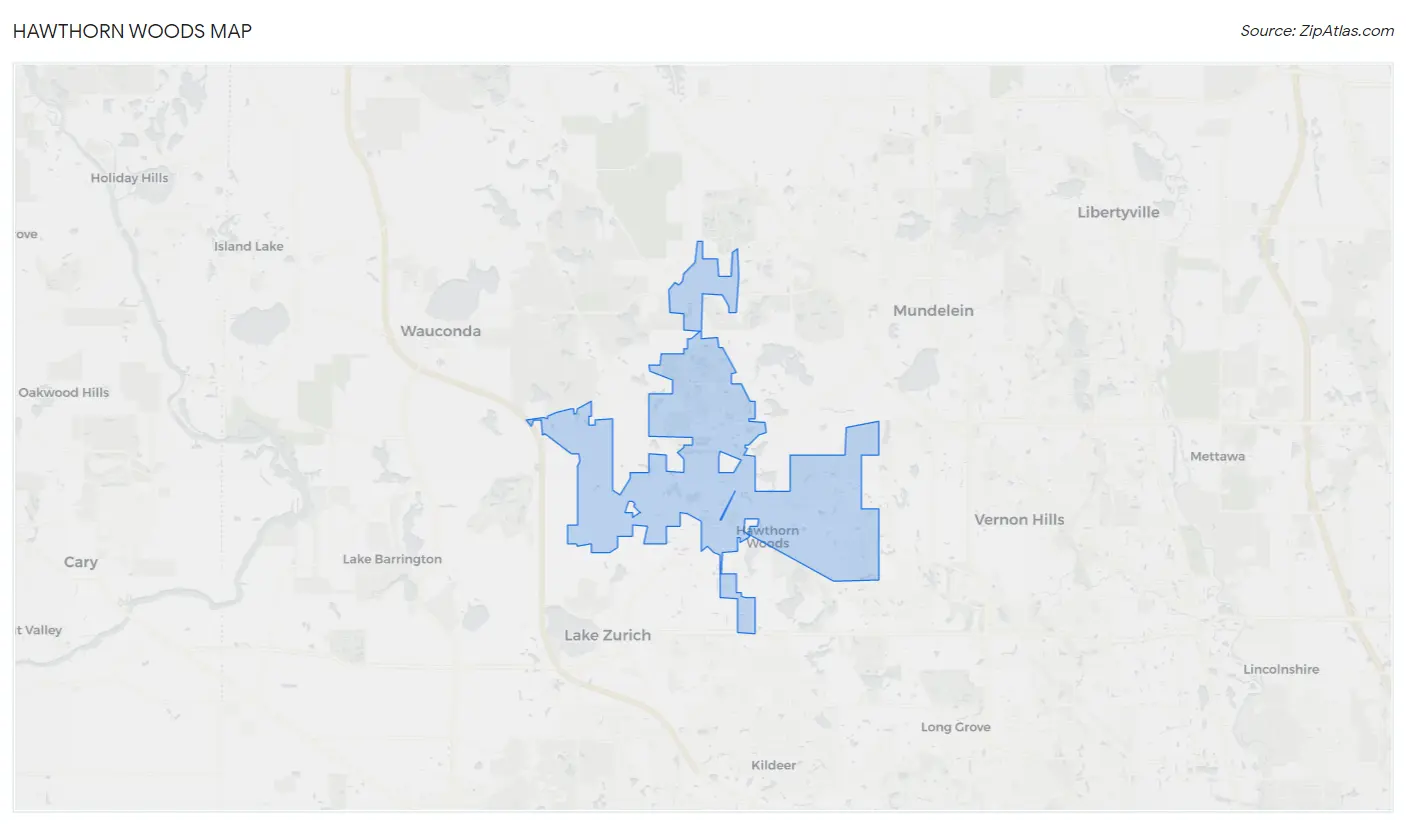
Hawthorn Woods Overview
$73,851
PER CAPITA INCOME
$229,844
AVG FAMILY INCOME
$215,817
AVG HOUSEHOLD INCOME
42.1%
WAGE / INCOME GAP [ % ]
57.9¢/ $1
WAGE / INCOME GAP [ $ ]
0.34
INEQUALITY / GINI INDEX
9,111
TOTAL POPULATION
4,484
MALE POPULATION
4,627
FEMALE POPULATION
96.91
MALES / 100 FEMALES
103.19
FEMALES / 100 MALES
39.6
MEDIAN AGE
3.2
AVG FAMILY SIZE
3.1
AVG HOUSEHOLD SIZE
4,863
LABOR FORCE [ PEOPLE ]
71.9%
PERCENT IN LABOR FORCE
3.5%
UNEMPLOYMENT RATE
Income in Hawthorn Woods
Income Overview in Hawthorn Woods
Per Capita Income in Hawthorn Woods is $73,851, while median incomes of families and households are $229,844 and $215,817 respectively.
| Characteristic | Number | Measure |
| Per Capita Income | 9,111 | $73,851 |
| Median Family Income | 2,684 | $229,844 |
| Mean Family Income | 2,684 | $241,290 |
| Median Household Income | 2,936 | $215,817 |
| Mean Household Income | 2,936 | $227,590 |
| Income Deficit | 2,684 | $0 |
| Wage / Income Gap (%) | 9,111 | 42.08% |
| Wage / Income Gap ($) | 9,111 | 57.92¢ per $1 |
| Gini / Inequality Index | 9,111 | 0.34 |
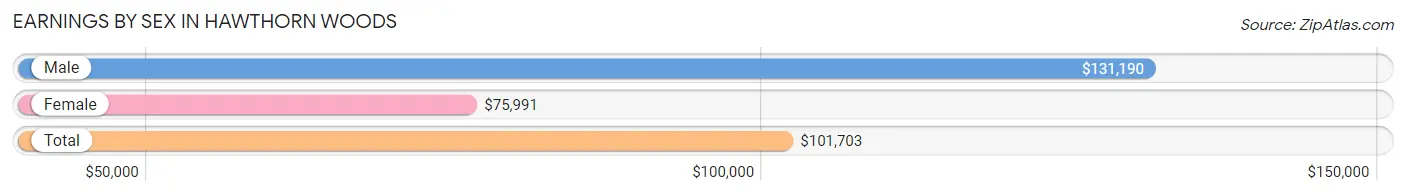
Earnings by Sex in Hawthorn Woods
Average Earnings in Hawthorn Woods are $101,703, $131,190 for men and $75,991 for women, a difference of 42.1%.
| Sex | Number | Average Earnings |
| Male | 2,794 (55.9%) | $131,190 |
| Female | 2,200 (44.1%) | $75,991 |
| Total | 4,994 (100.0%) | $101,703 |
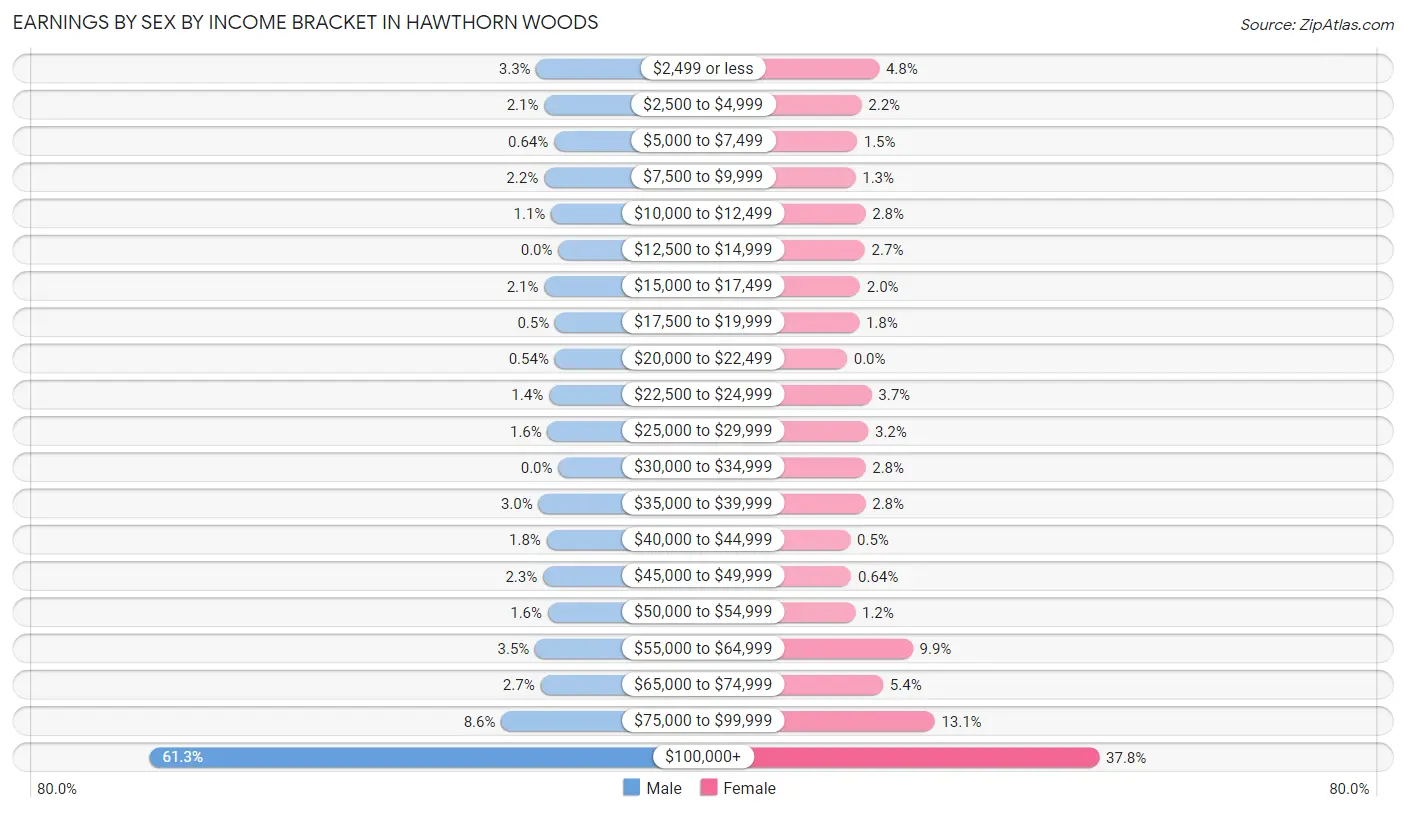
Earnings by Sex by Income Bracket in Hawthorn Woods
The most common earnings brackets in Hawthorn Woods are $100,000+ for men (1,712 | 61.3%) and $100,000+ for women (832 | 37.8%).
| Income | Male | Female |
| $2,499 or less | 92 (3.3%) | 106 (4.8%) |
| $2,500 to $4,999 | 59 (2.1%) | 48 (2.2%) |
| $5,000 to $7,499 | 18 (0.6%) | 33 (1.5%) |
| $7,500 to $9,999 | 60 (2.1%) | 28 (1.3%) |
| $10,000 to $12,499 | 30 (1.1%) | 61 (2.8%) |
| $12,500 to $14,999 | 0 (0.0%) | 59 (2.7%) |
| $15,000 to $17,499 | 59 (2.1%) | 43 (1.9%) |
| $17,500 to $19,999 | 14 (0.5%) | 40 (1.8%) |
| $20,000 to $22,499 | 15 (0.5%) | 0 (0.0%) |
| $22,500 to $24,999 | 39 (1.4%) | 81 (3.7%) |
| $25,000 to $29,999 | 45 (1.6%) | 70 (3.2%) |
| $30,000 to $34,999 | 0 (0.0%) | 61 (2.8%) |
| $35,000 to $39,999 | 83 (3.0%) | 61 (2.8%) |
| $40,000 to $44,999 | 49 (1.8%) | 11 (0.5%) |
| $45,000 to $49,999 | 64 (2.3%) | 14 (0.6%) |
| $50,000 to $54,999 | 44 (1.6%) | 27 (1.2%) |
| $55,000 to $64,999 | 97 (3.5%) | 217 (9.9%) |
| $65,000 to $74,999 | 75 (2.7%) | 119 (5.4%) |
| $75,000 to $99,999 | 239 (8.6%) | 289 (13.1%) |
| $100,000+ | 1,712 (61.3%) | 832 (37.8%) |
| Total | 2,794 (100.0%) | 2,200 (100.0%) |
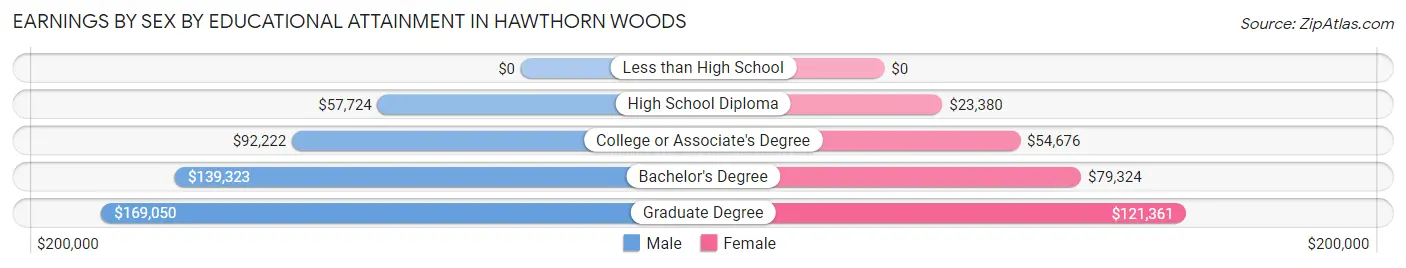
Earnings by Sex by Educational Attainment in Hawthorn Woods
Average earnings in Hawthorn Woods are $138,254 for men and $81,488 for women, a difference of 41.1%. Men with an educational attainment of graduate degree enjoy the highest average annual earnings of $169,050, while those with high school diploma education earn the least with $57,724. Women with an educational attainment of graduate degree earn the most with the average annual earnings of $121,361, while those with high school diploma education have the smallest earnings of $23,380.
| Educational Attainment | Male Income | Female Income |
| Less than High School | - | - |
| High School Diploma | $57,724 | $23,380 |
| College or Associate's Degree | $92,222 | $54,676 |
| Bachelor's Degree | $139,323 | $79,324 |
| Graduate Degree | $169,050 | $121,361 |
| Total | $138,254 | $81,488 |
Family Income in Hawthorn Woods
Family Income Brackets in Hawthorn Woods
According to the Hawthorn Woods family income data, there are 1,605 families falling into the $200,000+ income range, which is the most common income bracket and makes up 59.8% of all families.
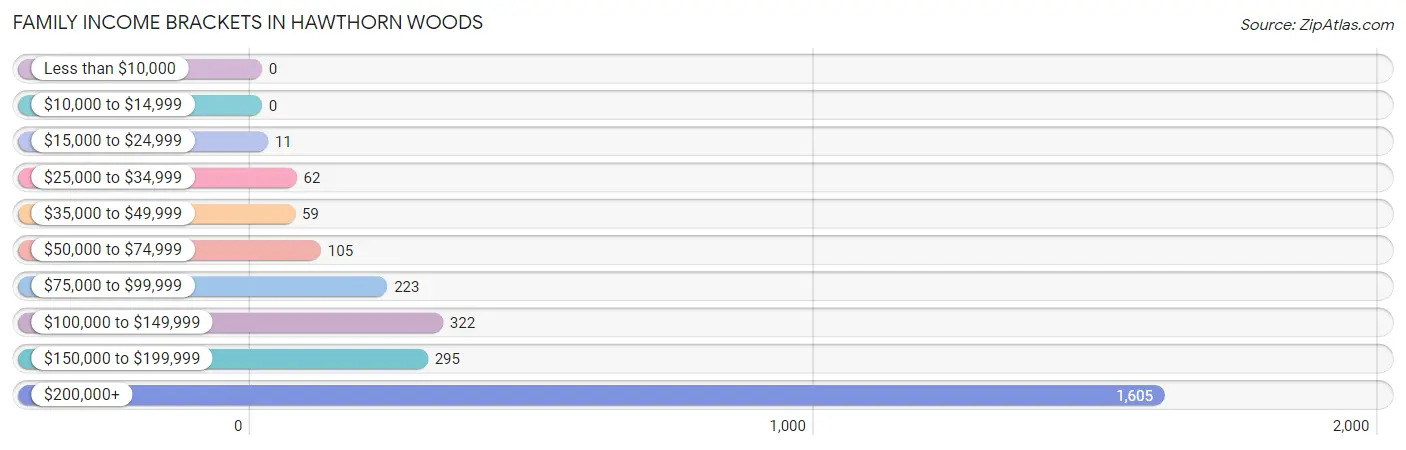
| Income Bracket | # Families | % Families |
| Less than $10,000 | 0 | 0.0% |
| $10,000 to $14,999 | 0 | 0.0% |
| $15,000 to $24,999 | 11 | 0.4% |
| $25,000 to $34,999 | 62 | 2.3% |
| $35,000 to $49,999 | 59 | 2.2% |
| $50,000 to $74,999 | 105 | 3.9% |
| $75,000 to $99,999 | 223 | 8.3% |
| $100,000 to $149,999 | 322 | 12.0% |
| $150,000 to $199,999 | 295 | 11.0% |
| $200,000+ | 1,605 | 59.8% |
Family Income by Famaliy Size in Hawthorn Woods
5-person families (282 | 10.5%) account for the highest median family income in Hawthorn Woods with $250,001 per family, while 2-person families (973 | 36.2%) have the highest median income of $113,998 per family member.
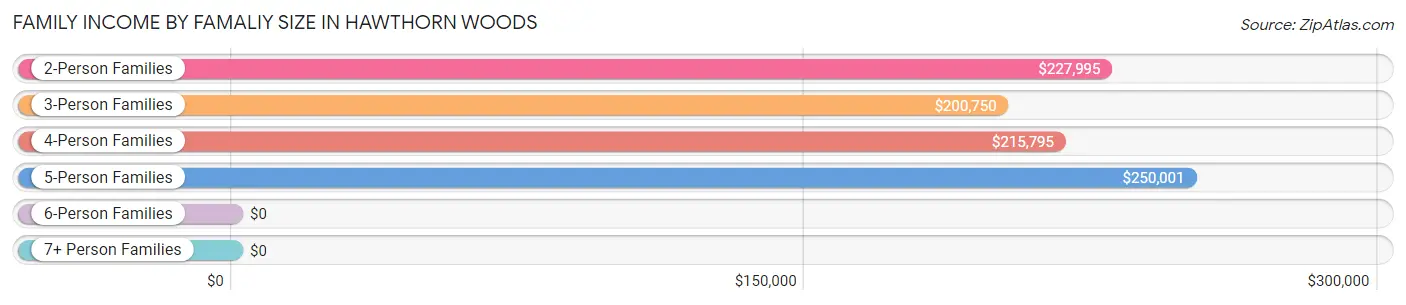
| Income Bracket | # Families | Median Income |
| 2-Person Families | 973 (36.2%) | $227,995 |
| 3-Person Families | 666 (24.8%) | $200,750 |
| 4-Person Families | 707 (26.3%) | $215,795 |
| 5-Person Families | 282 (10.5%) | $250,001 |
| 6-Person Families | 35 (1.3%) | $0 |
| 7+ Person Families | 21 (0.8%) | $0 |
| Total | 2,684 (100.0%) | $229,844 |
Family Income by Number of Earners in Hawthorn Woods
The median family income in Hawthorn Woods is $229,844, with families comprising 3+ earners (180) having the highest median family income of $250,001, while families with no earners (169) have the lowest median family income of $155,417, accounting for 6.7% and 6.3% of families, respectively.
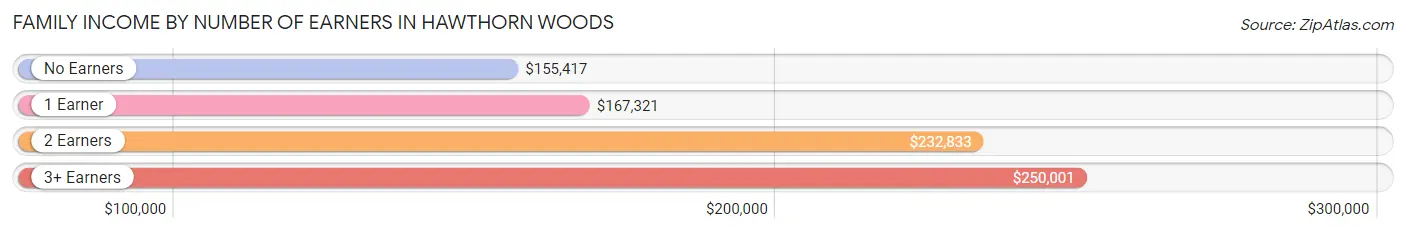
| Number of Earners | # Families | Median Income |
| No Earners | 169 (6.3%) | $155,417 |
| 1 Earner | 643 (24.0%) | $167,321 |
| 2 Earners | 1,692 (63.0%) | $232,833 |
| 3+ Earners | 180 (6.7%) | $250,001 |
| Total | 2,684 (100.0%) | $229,844 |
Household Income in Hawthorn Woods
Household Income Brackets in Hawthorn Woods
With 1,624 households falling in the category, the $200,000+ income range is the most frequent in Hawthorn Woods, accounting for 55.3% of all households. In contrast, only 21 households (0.7%) fall into the $10,000 to $14,999 income bracket, making it the least populous group.
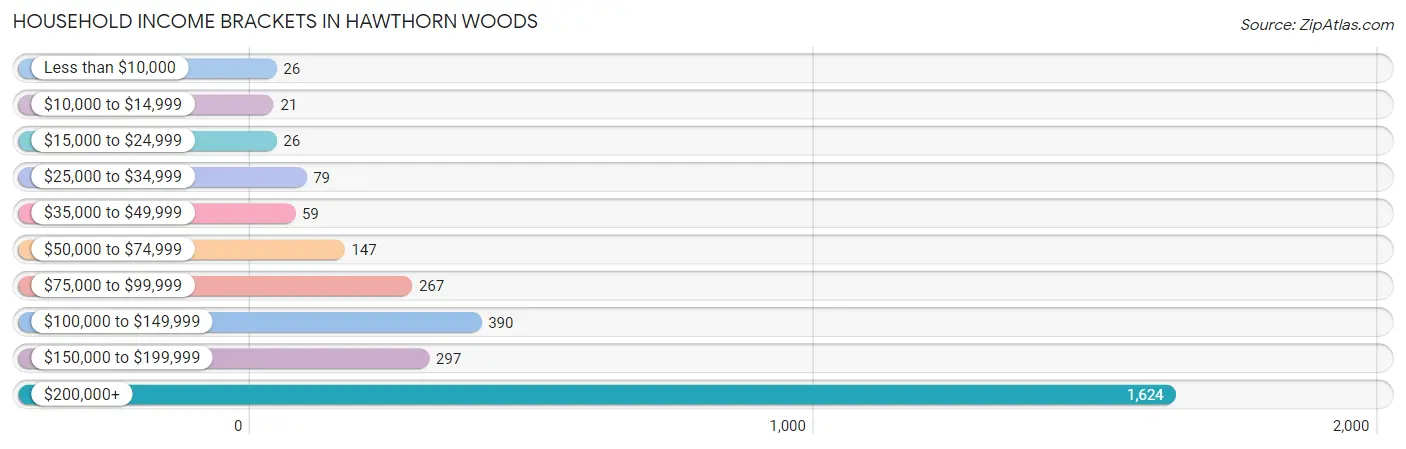
| Income Bracket | # Households | % Households |
| Less than $10,000 | 26 | 0.9% |
| $10,000 to $14,999 | 21 | 0.7% |
| $15,000 to $24,999 | 26 | 0.9% |
| $25,000 to $34,999 | 79 | 2.7% |
| $35,000 to $49,999 | 59 | 2.0% |
| $50,000 to $74,999 | 147 | 5.0% |
| $75,000 to $99,999 | 267 | 9.1% |
| $100,000 to $149,999 | 390 | 13.3% |
| $150,000 to $199,999 | 297 | 10.1% |
| $200,000+ | 1,624 | 55.3% |
Household Income by Householder Age in Hawthorn Woods
The median household income in Hawthorn Woods is $215,817, with the highest median household income of $240,333 found in the 45 to 64 years age bracket for the primary householder. A total of 1,422 households (48.4%) fall into this category. Meanwhile, the 15 to 24 years age bracket for the primary householder has the lowest median household income of $0, with 48 households (1.6%) in this group.
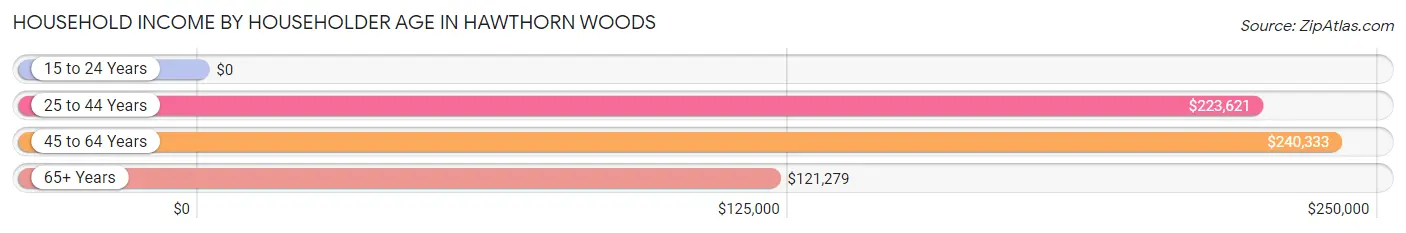
| Income Bracket | # Households | Median Income |
| 15 to 24 Years | 48 (1.6%) | $0 |
| 25 to 44 Years | 968 (33.0%) | $223,621 |
| 45 to 64 Years | 1,422 (48.4%) | $240,333 |
| 65+ Years | 498 (17.0%) | $121,279 |
| Total | 2,936 (100.0%) | $215,817 |
Poverty in Hawthorn Woods
Income Below Poverty by Sex and Age in Hawthorn Woods
With 0.9% poverty level for males and 1.7% for females among the residents of Hawthorn Woods, 65 to 74 year old males and 18 to 24 year old females are the most vulnerable to poverty, with 14 males (3.5%) and 29 females (11.4%) in their respective age groups living below the poverty level.
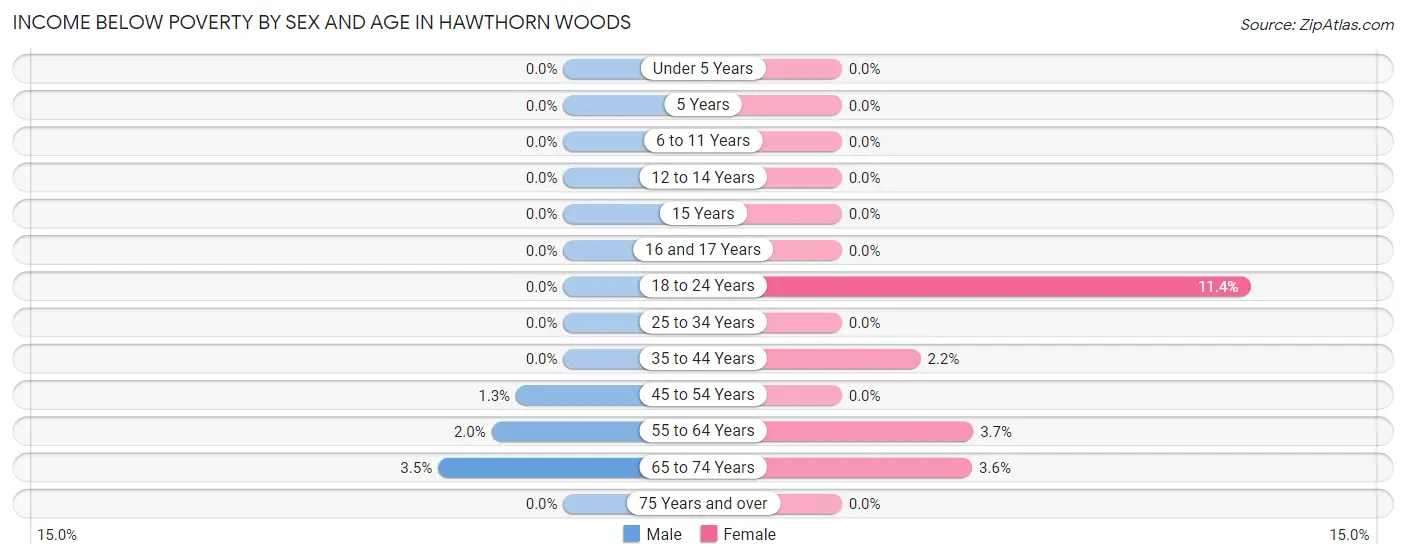
| Age Bracket | Male | Female |
| Under 5 Years | 0 (0.0%) | 0 (0.0%) |
| 5 Years | 0 (0.0%) | 0 (0.0%) |
| 6 to 11 Years | 0 (0.0%) | 0 (0.0%) |
| 12 to 14 Years | 0 (0.0%) | 0 (0.0%) |
| 15 Years | 0 (0.0%) | 0 (0.0%) |
| 16 and 17 Years | 0 (0.0%) | 0 (0.0%) |
| 18 to 24 Years | 0 (0.0%) | 29 (11.4%) |
| 25 to 34 Years | 0 (0.0%) | 0 (0.0%) |
| 35 to 44 Years | 0 (0.0%) | 12 (2.2%) |
| 45 to 54 Years | 10 (1.3%) | 0 (0.0%) |
| 55 to 64 Years | 15 (2.0%) | 26 (3.7%) |
| 65 to 74 Years | 14 (3.5%) | 13 (3.6%) |
| 75 Years and over | 0 (0.0%) | 0 (0.0%) |
| Total | 39 (0.9%) | 80 (1.7%) |
Income Above Poverty by Sex and Age in Hawthorn Woods
According to the poverty statistics in Hawthorn Woods, males aged under 5 years and females aged under 5 years are the age groups that are most secure financially, with 100.0% of males and 100.0% of females in these age groups living above the poverty line.
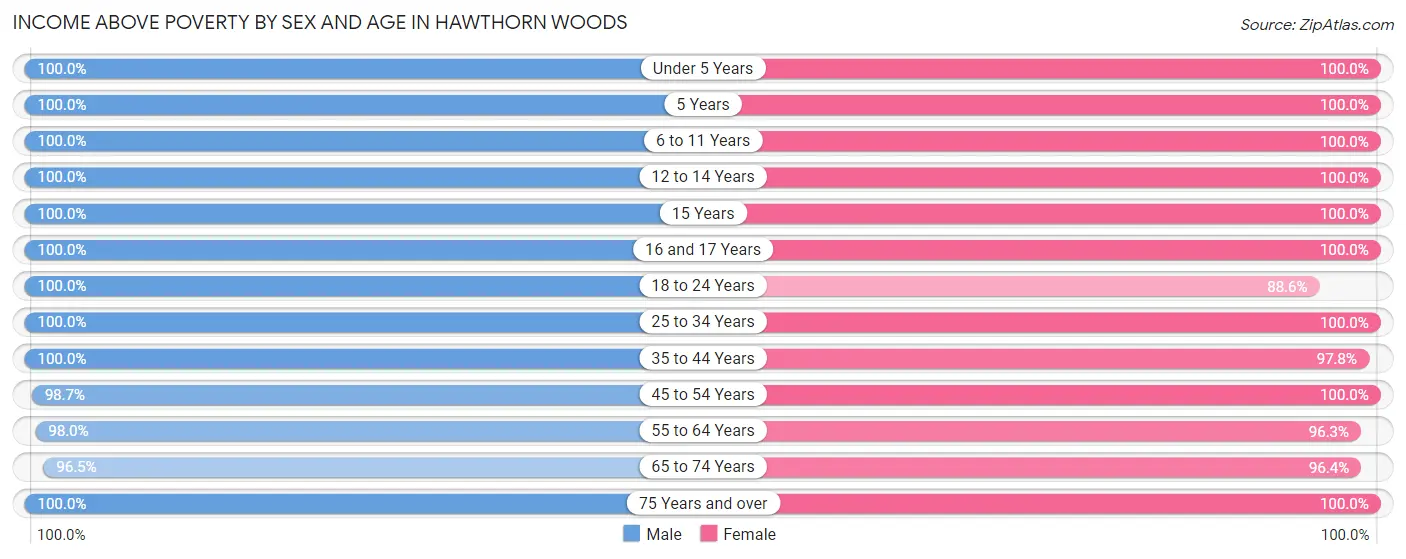
| Age Bracket | Male | Female |
| Under 5 Years | 166 (100.0%) | 310 (100.0%) |
| 5 Years | 107 (100.0%) | 88 (100.0%) |
| 6 to 11 Years | 553 (100.0%) | 462 (100.0%) |
| 12 to 14 Years | 180 (100.0%) | 263 (100.0%) |
| 15 Years | 116 (100.0%) | 102 (100.0%) |
| 16 and 17 Years | 119 (100.0%) | 212 (100.0%) |
| 18 to 24 Years | 308 (100.0%) | 226 (88.6%) |
| 25 to 34 Years | 327 (100.0%) | 426 (100.0%) |
| 35 to 44 Years | 659 (100.0%) | 537 (97.8%) |
| 45 to 54 Years | 747 (98.7%) | 762 (100.0%) |
| 55 to 64 Years | 735 (98.0%) | 685 (96.3%) |
| 65 to 74 Years | 387 (96.5%) | 345 (96.4%) |
| 75 Years and over | 41 (100.0%) | 129 (100.0%) |
| Total | 4,445 (99.1%) | 4,547 (98.3%) |
Income Below Poverty Among Married-Couple Families in Hawthorn Woods
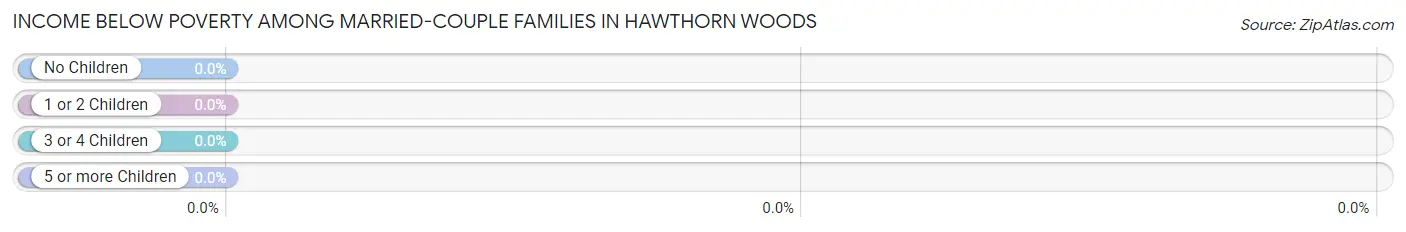
| Children | Above Poverty | Below Poverty |
| No Children | 1,208 (100.0%) | 0 (0.0%) |
| 1 or 2 Children | 993 (100.0%) | 0 (0.0%) |
| 3 or 4 Children | 266 (100.0%) | 0 (0.0%) |
| 5 or more Children | 0 (0.0%) | 0 (0.0%) |
| Total | 2,467 (100.0%) | 0 (0.0%) |
Income Below Poverty Among Single-Parent Households in Hawthorn Woods
| Children | Single Father | Single Mother |
| No Children | 0 (0.0%) | 0 (0.0%) |
| 1 or 2 Children | 0 (0.0%) | 0 (0.0%) |
| 3 or 4 Children | 0 (0.0%) | 0 (0.0%) |
| 5 or more Children | 0 (0.0%) | 0 (0.0%) |
| Total | 0 (0.0%) | 0 (0.0%) |
Income Below Poverty Among Married-Couple vs Single-Parent Households in Hawthorn Woods
| Children | Married-Couple Families | Single-Parent Households |
| No Children | 0 (0.0%) | 0 (0.0%) |
| 1 or 2 Children | 0 (0.0%) | 0 (0.0%) |
| 3 or 4 Children | 0 (0.0%) | 0 (0.0%) |
| 5 or more Children | 0 (0.0%) | 0 (0.0%) |
| Total | 0 (0.0%) | 0 (0.0%) |
Race in Hawthorn Woods
The most populous races in Hawthorn Woods are White / Caucasian (7,330 | 80.4%), Asian (1,306 | 14.3%), and Hispanic or Latino (417 | 4.6%).
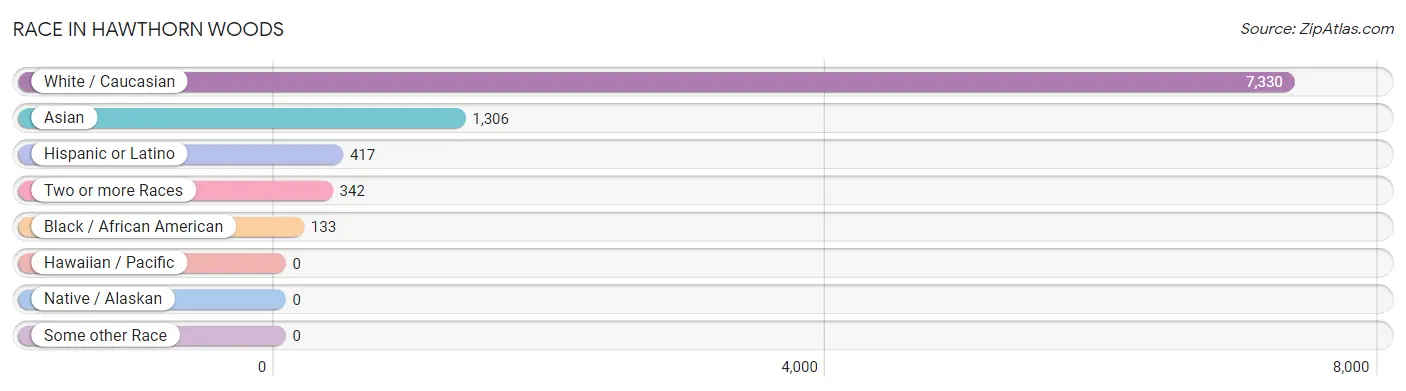
| Race | # Population | % Population |
| Asian | 1,306 | 14.3% |
| Black / African American | 133 | 1.5% |
| Hawaiian / Pacific | 0 | 0.0% |
| Hispanic or Latino | 417 | 4.6% |
| Native / Alaskan | 0 | 0.0% |
| White / Caucasian | 7,330 | 80.4% |
| Two or more Races | 342 | 3.7% |
| Some other Race | 0 | 0.0% |
| Total | 9,111 | 100.0% |
Ancestry in Hawthorn Woods
The most populous ancestries reported in Hawthorn Woods are German (1,785 | 19.6%), Irish (1,309 | 14.4%), Polish (995 | 10.9%), Thai (773 | 8.5%), and Italian (666 | 7.3%), together accounting for 60.7% of all Hawthorn Woods residents.
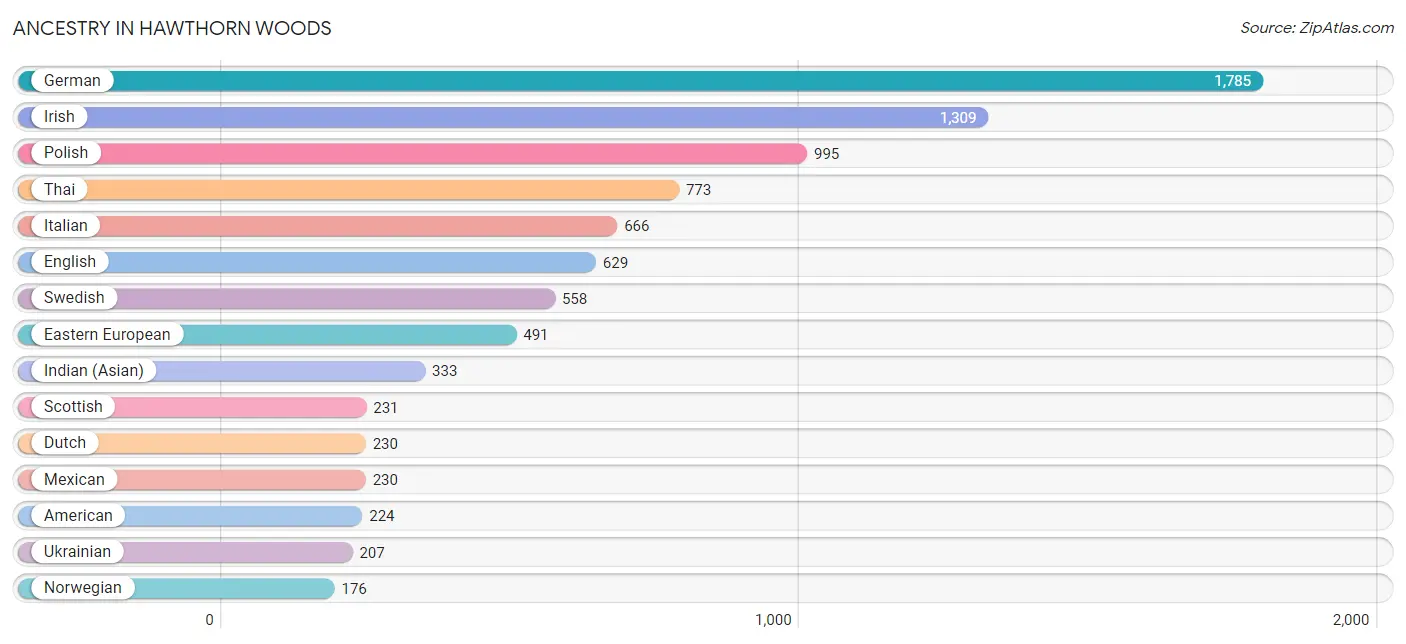
| Ancestry | # Population | % Population |
| American | 224 | 2.5% |
| Arab | 119 | 1.3% |
| Austrian | 75 | 0.8% |
| Bhutanese | 30 | 0.3% |
| British | 10 | 0.1% |
| Burmese | 126 | 1.4% |
| Central American | 175 | 1.9% |
| Cherokee | 17 | 0.2% |
| Chippewa | 13 | 0.1% |
| Croatian | 48 | 0.5% |
| Czech | 70 | 0.8% |
| Czechoslovakian | 147 | 1.6% |
| Dutch | 230 | 2.5% |
| Eastern European | 491 | 5.4% |
| English | 629 | 6.9% |
| European | 113 | 1.2% |
| Finnish | 129 | 1.4% |
| French | 174 | 1.9% |
| French Canadian | 54 | 0.6% |
| German | 1,785 | 19.6% |
| Guatemalan | 10 | 0.1% |
| Honduran | 165 | 1.8% |
| Hungarian | 41 | 0.4% |
| Indian (Asian) | 333 | 3.6% |
| Irish | 1,309 | 14.4% |
| Italian | 666 | 7.3% |
| Korean | 24 | 0.3% |
| Lebanese | 119 | 1.3% |
| Lithuanian | 124 | 1.4% |
| Mexican | 230 | 2.5% |
| Native Hawaiian | 87 | 0.9% |
| Northern European | 8 | 0.1% |
| Norwegian | 176 | 1.9% |
| Polish | 995 | 10.9% |
| Russian | 159 | 1.8% |
| Scotch-Irish | 98 | 1.1% |
| Scottish | 231 | 2.5% |
| Slovak | 19 | 0.2% |
| Slovene | 26 | 0.3% |
| Spaniard | 12 | 0.1% |
| Sri Lankan | 21 | 0.2% |
| Swedish | 558 | 6.1% |
| Swiss | 21 | 0.2% |
| Thai | 773 | 8.5% |
| Ukrainian | 207 | 2.3% |
| Welsh | 56 | 0.6% | View All 46 Rows |
Immigrants in Hawthorn Woods
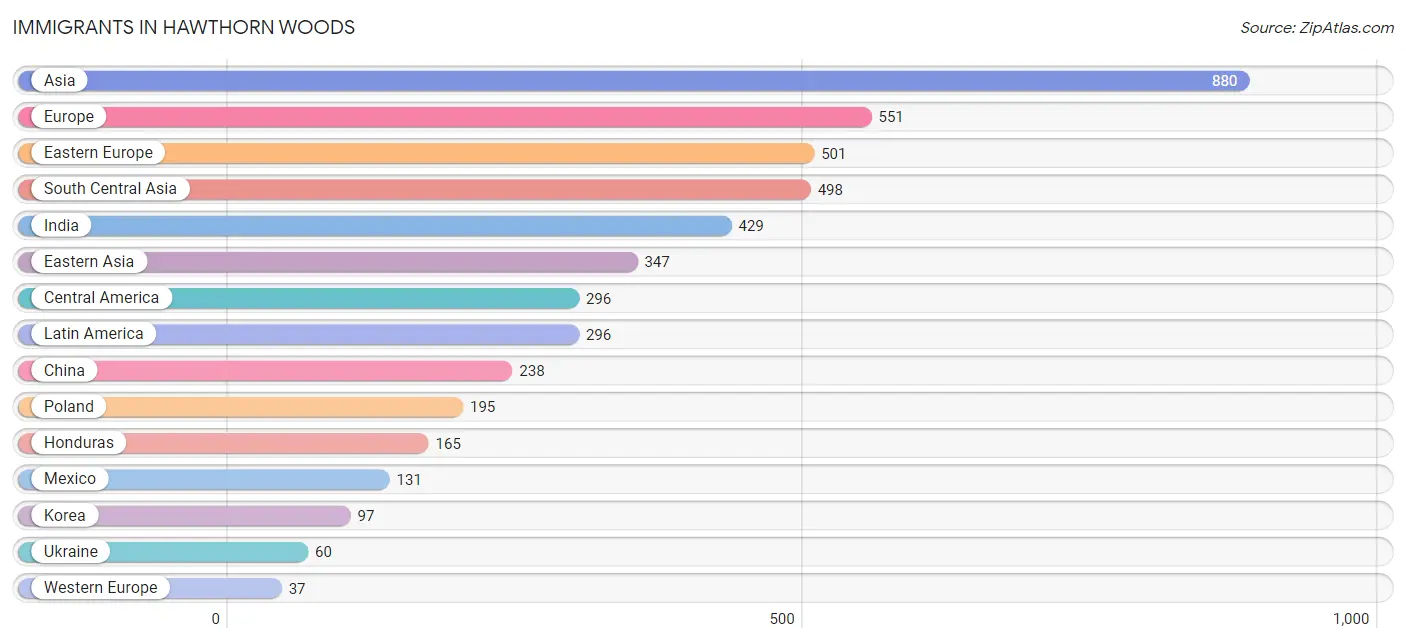
The most numerous immigrant groups reported in Hawthorn Woods came from Asia (880 | 9.7%), Europe (551 | 6.0%), Eastern Europe (501 | 5.5%), South Central Asia (498 | 5.5%), and India (429 | 4.7%), together accounting for 31.4% of all Hawthorn Woods residents.
| Immigration Origin | # Population | % Population |
| Asia | 880 | 9.7% |
| Austria | 16 | 0.2% |
| Canada | 33 | 0.4% |
| Central America | 296 | 3.3% |
| China | 238 | 2.6% |
| Eastern Asia | 347 | 3.8% |
| Eastern Europe | 501 | 5.5% |
| Europe | 551 | 6.0% |
| Germany | 21 | 0.2% |
| Honduras | 165 | 1.8% |
| Hong Kong | 19 | 0.2% |
| India | 429 | 4.7% |
| Italy | 13 | 0.1% |
| Japan | 12 | 0.1% |
| Kazakhstan | 32 | 0.4% |
| Korea | 97 | 1.1% |
| Latin America | 296 | 3.3% |
| Mexico | 131 | 1.4% |
| Pakistan | 24 | 0.3% |
| Philippines | 14 | 0.2% |
| Poland | 195 | 2.1% |
| Russia | 5 | 0.1% |
| South Central Asia | 498 | 5.5% |
| South Eastern Asia | 35 | 0.4% |
| Southern Europe | 13 | 0.1% |
| Sri Lanka | 13 | 0.1% |
| Ukraine | 60 | 0.7% |
| Vietnam | 21 | 0.2% |
| Western Europe | 37 | 0.4% | View All 29 Rows |
Sex and Age in Hawthorn Woods
Sex and Age in Hawthorn Woods
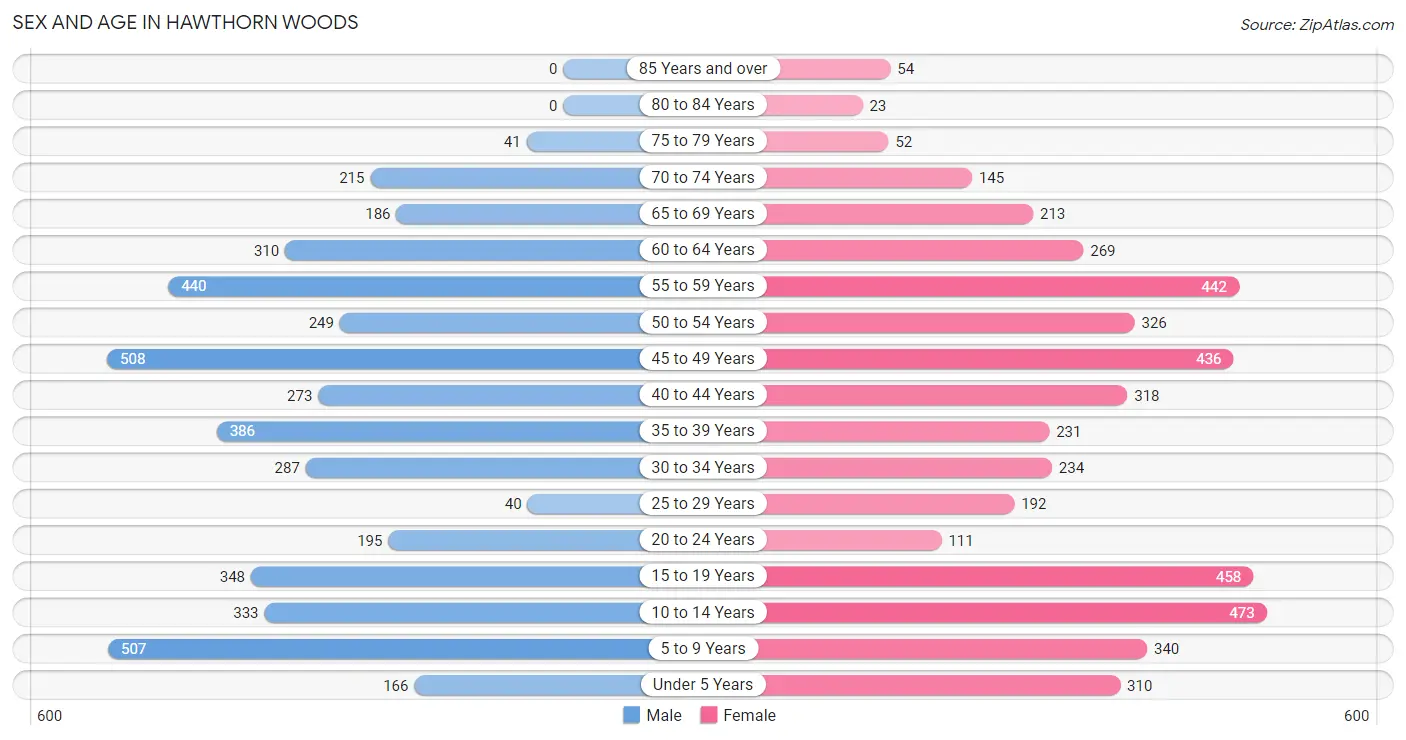
The most populous age groups in Hawthorn Woods are 45 to 49 Years (508 | 11.3%) for men and 10 to 14 Years (473 | 10.2%) for women.
| Age Bracket | Male | Female |
| Under 5 Years | 166 (3.7%) | 310 (6.7%) |
| 5 to 9 Years | 507 (11.3%) | 340 (7.3%) |
| 10 to 14 Years | 333 (7.4%) | 473 (10.2%) |
| 15 to 19 Years | 348 (7.8%) | 458 (9.9%) |
| 20 to 24 Years | 195 (4.3%) | 111 (2.4%) |
| 25 to 29 Years | 40 (0.9%) | 192 (4.2%) |
| 30 to 34 Years | 287 (6.4%) | 234 (5.1%) |
| 35 to 39 Years | 386 (8.6%) | 231 (5.0%) |
| 40 to 44 Years | 273 (6.1%) | 318 (6.9%) |
| 45 to 49 Years | 508 (11.3%) | 436 (9.4%) |
| 50 to 54 Years | 249 (5.6%) | 326 (7.0%) |
| 55 to 59 Years | 440 (9.8%) | 442 (9.6%) |
| 60 to 64 Years | 310 (6.9%) | 269 (5.8%) |
| 65 to 69 Years | 186 (4.2%) | 213 (4.6%) |
| 70 to 74 Years | 215 (4.8%) | 145 (3.1%) |
| 75 to 79 Years | 41 (0.9%) | 52 (1.1%) |
| 80 to 84 Years | 0 (0.0%) | 23 (0.5%) |
| 85 Years and over | 0 (0.0%) | 54 (1.2%) |
| Total | 4,484 (100.0%) | 4,627 (100.0%) |
Families and Households in Hawthorn Woods
Median Family Size in Hawthorn Woods
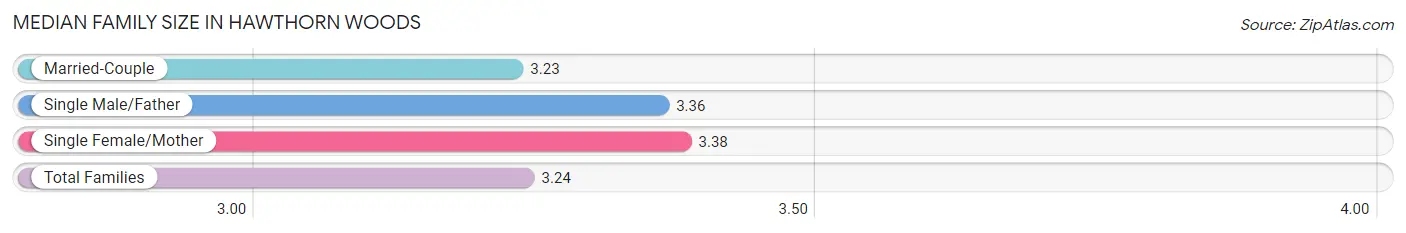
The median family size in Hawthorn Woods is 3.24 persons per family, with single female/mother families (115 | 4.3%) accounting for the largest median family size of 3.38 persons per family. On the other hand, married-couple families (2,467 | 91.9%) represent the smallest median family size with 3.23 persons per family.
| Family Type | # Families | Family Size |
| Married-Couple | 2,467 (91.9%) | 3.23 |
| Single Male/Father | 102 (3.8%) | 3.36 |
| Single Female/Mother | 115 (4.3%) | 3.38 |
| Total Families | 2,684 (100.0%) | 3.24 |
Median Household Size in Hawthorn Woods
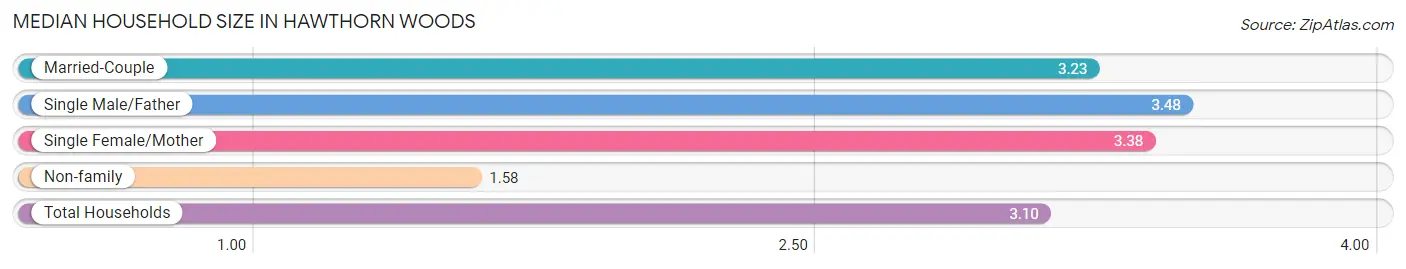
The median household size in Hawthorn Woods is 3.10 persons per household, with single male/father households (102 | 3.5%) accounting for the largest median household size of 3.48 persons per household. non-family households (252 | 8.6%) represent the smallest median household size with 1.58 persons per household.
| Household Type | # Households | Household Size |
| Married-Couple | 2,467 (84.0%) | 3.23 |
| Single Male/Father | 102 (3.5%) | 3.48 |
| Single Female/Mother | 115 (3.9%) | 3.38 |
| Non-family | 252 (8.6%) | 1.58 |
| Total Households | 2,936 (100.0%) | 3.10 |
Household Size by Marriage Status in Hawthorn Woods
Out of a total of 2,936 households in Hawthorn Woods, 2,684 (91.4%) are family households, while 252 (8.6%) are nonfamily households. The most numerous type of family households are 2-person households, comprising 973, and the most common type of nonfamily households are 1-person households, comprising 177.
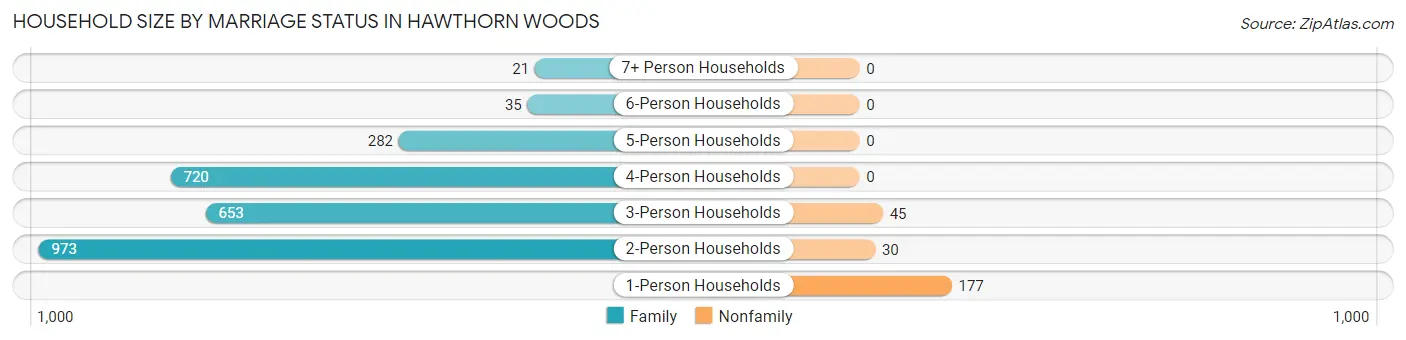
| Household Size | Family Households | Nonfamily Households |
| 1-Person Households | - | 177 (6.0%) |
| 2-Person Households | 973 (33.1%) | 30 (1.0%) |
| 3-Person Households | 653 (22.2%) | 45 (1.5%) |
| 4-Person Households | 720 (24.5%) | 0 (0.0%) |
| 5-Person Households | 282 (9.6%) | 0 (0.0%) |
| 6-Person Households | 35 (1.2%) | 0 (0.0%) |
| 7+ Person Households | 21 (0.7%) | 0 (0.0%) |
| Total | 2,684 (91.4%) | 252 (8.6%) |
Female Fertility in Hawthorn Woods
Fertility by Age in Hawthorn Woods
Average fertility rate in Hawthorn Woods is 43.0 births per 1,000 women. Women in the age bracket of 20 to 34 years have the highest fertility rate with 78.0 births per 1,000 women. Women in the age bracket of 35 to 50 years acount for 52.3% of all women with births.
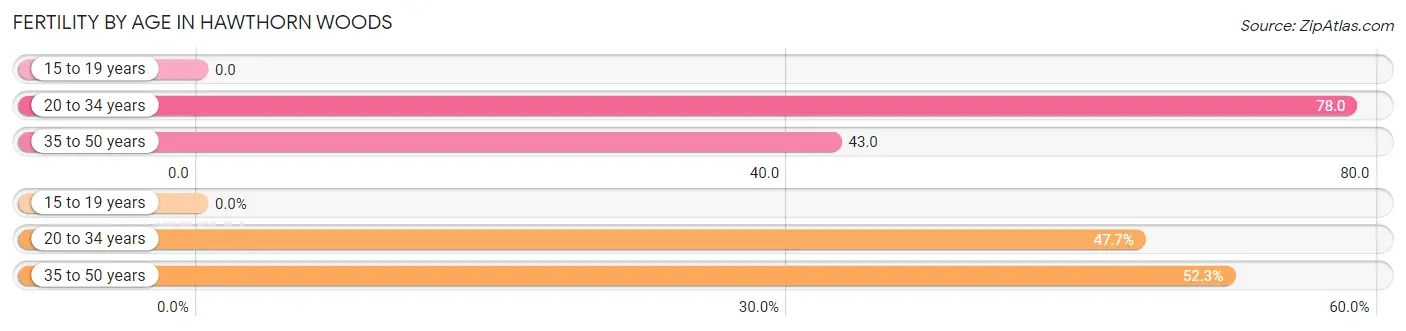
| Age Bracket | Women with Births | Births / 1,000 Women |
| 15 to 19 years | 0 (0.0%) | 0.0 |
| 20 to 34 years | 42 (47.7%) | 78.0 |
| 35 to 50 years | 46 (52.3%) | 43.0 |
| Total | 88 (100.0%) | 43.0 |
Fertility by Age by Marriage Status in Hawthorn Woods
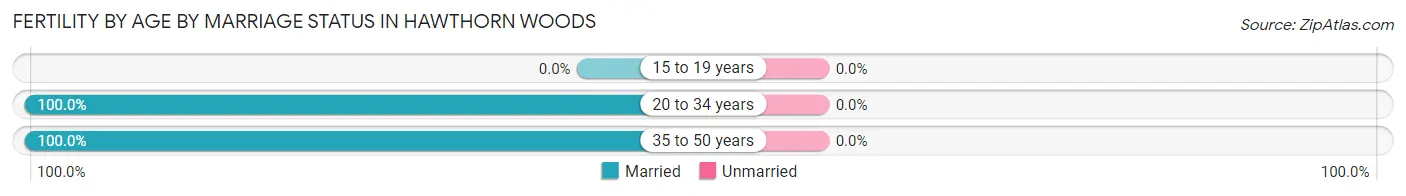
| Age Bracket | Married | Unmarried |
| 15 to 19 years | 0 (0.0%) | 0 (0.0%) |
| 20 to 34 years | 42 (100.0%) | 0 (0.0%) |
| 35 to 50 years | 46 (100.0%) | 0 (0.0%) |
| Total | 88 (100.0%) | 0 (0.0%) |
Fertility by Education in Hawthorn Woods
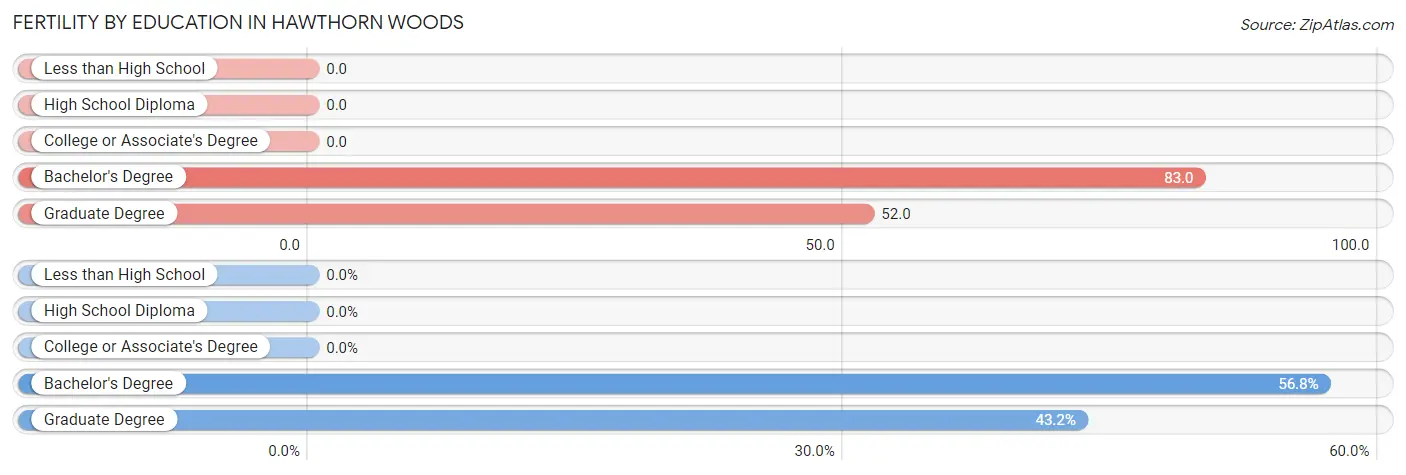
| Educational Attainment | Women with Births | Births / 1,000 Women |
| Less than High School | 0 (0.0%) | 0.0 |
| High School Diploma | 0 (0.0%) | 0.0 |
| College or Associate's Degree | 0 (0.0%) | 0.0 |
| Bachelor's Degree | 50 (56.8%) | 83.0 |
| Graduate Degree | 38 (43.2%) | 52.0 |
| Total | 88 (100.0%) | 43.0 |
Fertility by Education by Marriage Status in Hawthorn Woods
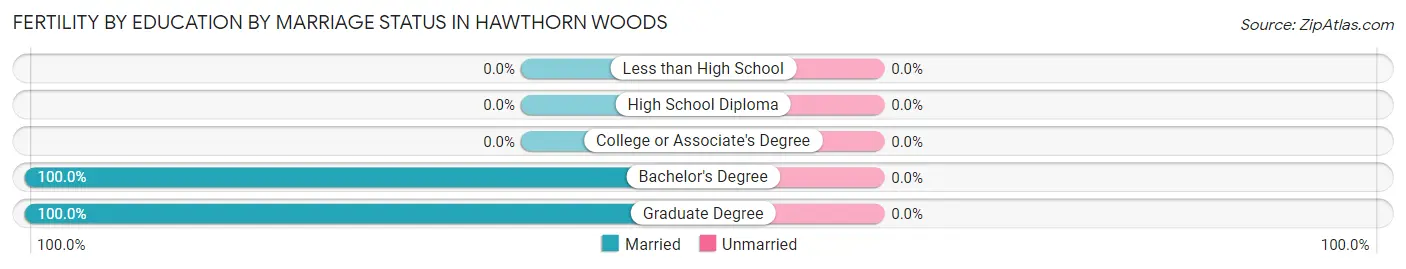
| Educational Attainment | Married | Unmarried |
| Less than High School | 0 (0.0%) | 0 (0.0%) |
| High School Diploma | 0 (0.0%) | 0 (0.0%) |
| College or Associate's Degree | 0 (0.0%) | 0 (0.0%) |
| Bachelor's Degree | 50 (100.0%) | 0 (0.0%) |
| Graduate Degree | 38 (100.0%) | 0 (0.0%) |
| Total | 88 (100.0%) | 0 (0.0%) |
Employment Characteristics in Hawthorn Woods
Employment by Class of Employer in Hawthorn Woods
Among the 4,637 employed individuals in Hawthorn Woods, private company employees (3,283 | 70.8%), self-employed (not incorporated) (372 | 8.0%), and not-for-profit organizations (333 | 7.2%) make up the most common classes of employment.
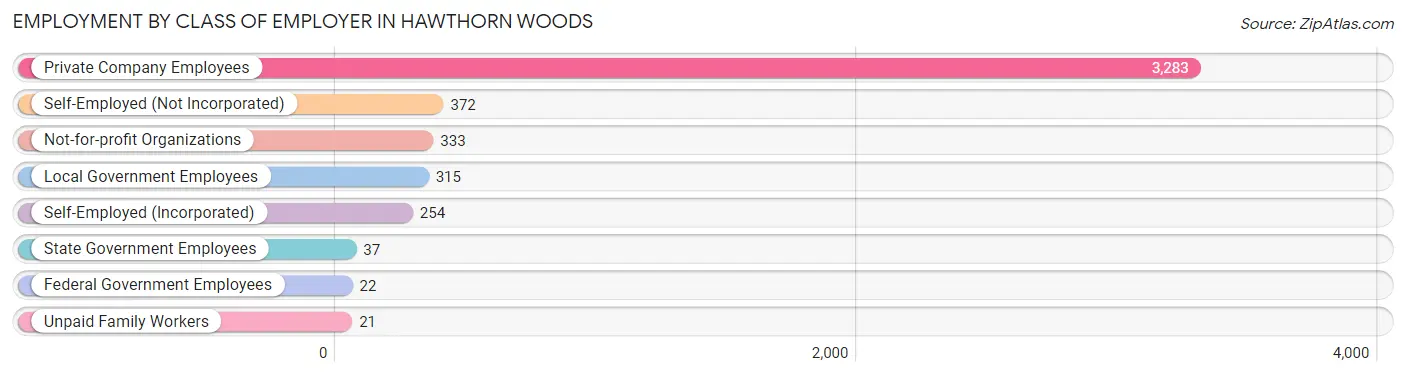
| Employer Class | # Employees | % Employees |
| Private Company Employees | 3,283 | 70.8% |
| Self-Employed (Incorporated) | 254 | 5.5% |
| Self-Employed (Not Incorporated) | 372 | 8.0% |
| Not-for-profit Organizations | 333 | 7.2% |
| Local Government Employees | 315 | 6.8% |
| State Government Employees | 37 | 0.8% |
| Federal Government Employees | 22 | 0.5% |
| Unpaid Family Workers | 21 | 0.4% |
| Total | 4,637 | 100.0% |
Employment Status by Age in Hawthorn Woods
According to the labor force statistics for Hawthorn Woods, out of the total population over 16 years of age (6,764), 71.9% or 4,863 individuals are in the labor force, with 3.5% or 170 of them unemployed. The age group with the highest labor force participation rate is 25 to 29 years, with 100.0% or 232 individuals in the labor force. Within the labor force, the 30 to 34 years age range has the highest percentage of unemployed individuals, with 18.6% or 88 of them being unemployed.
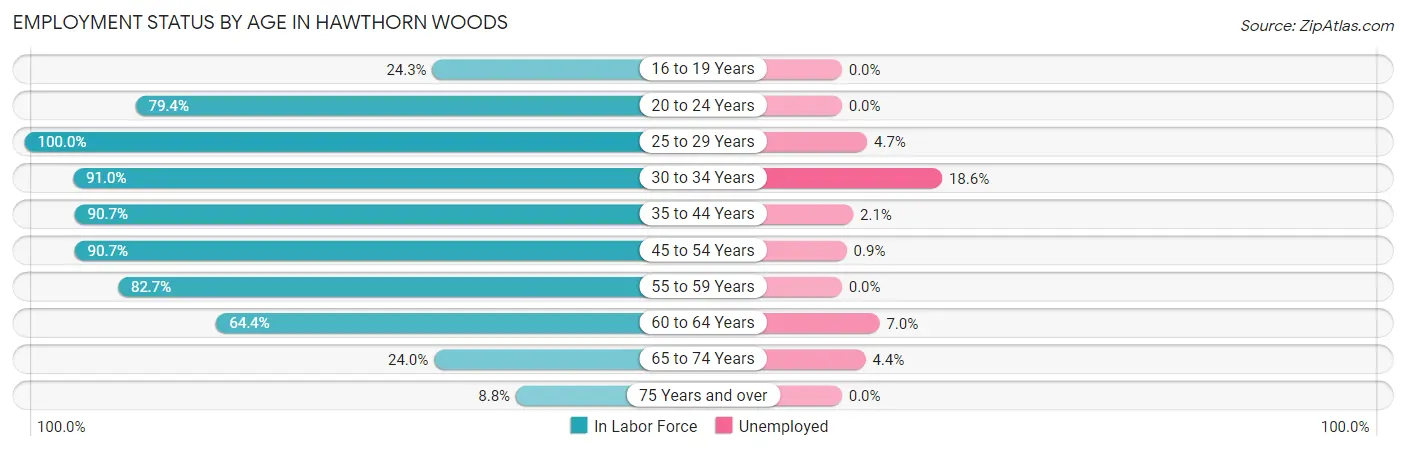
| Age Bracket | In Labor Force | Unemployed |
| 16 to 19 Years | 143 (24.3%) | 0 (0.0%) |
| 20 to 24 Years | 243 (79.4%) | 0 (0.0%) |
| 25 to 29 Years | 232 (100.0%) | 11 (4.7%) |
| 30 to 34 Years | 474 (91.0%) | 88 (18.6%) |
| 35 to 44 Years | 1,096 (90.7%) | 23 (2.1%) |
| 45 to 54 Years | 1,378 (90.7%) | 12 (0.9%) |
| 55 to 59 Years | 729 (82.7%) | 0 (0.0%) |
| 60 to 64 Years | 373 (64.4%) | 26 (7.0%) |
| 65 to 74 Years | 182 (24.0%) | 8 (4.4%) |
| 75 Years and over | 15 (8.8%) | 0 (0.0%) |
| Total | 4,863 (71.9%) | 170 (3.5%) |
Employment Status by Educational Attainment in Hawthorn Woods
According to labor force statistics for Hawthorn Woods, 86.7% of individuals (4,284) out of the total population between 25 and 64 years of age (4,941) are in the labor force, with 3.8% or 163 of them being unemployed. The group with the highest labor force participation rate are those with the educational attainment of bachelor's degree or higher, with 89.7% or 3,337 individuals in the labor force. Within the labor force, individuals with bachelor's degree or higher education have the highest percentage of unemployment, with 4.5% or 150 of them being unemployed.
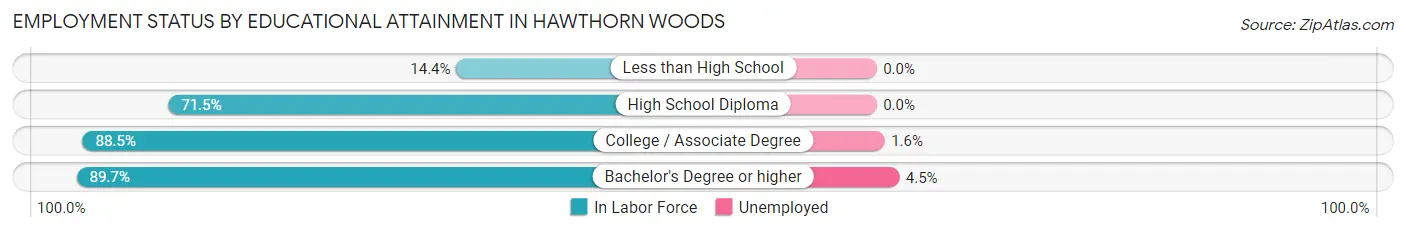
| Educational Attainment | In Labor Force | Unemployed |
| Less than High School | 15 (14.4%) | 0 (0.0%) |
| High School Diploma | 251 (71.5%) | 0 (0.0%) |
| College / Associate Degree | 678 (88.5%) | 12 (1.6%) |
| Bachelor's Degree or higher | 3,337 (89.7%) | 167 (4.5%) |
| Total | 4,284 (86.7%) | 188 (3.8%) |
Employment Occupations by Sex in Hawthorn Woods
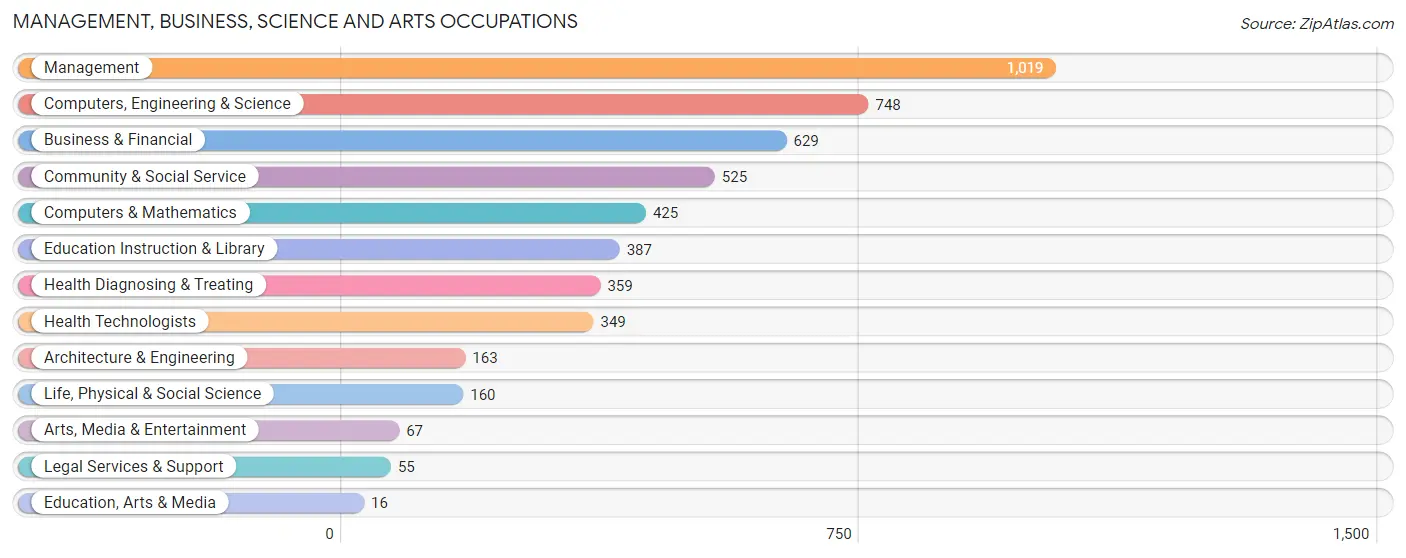
Management, Business, Science and Arts Occupations
The most common Management, Business, Science and Arts occupations in Hawthorn Woods are Management (1,019 | 21.7%), Computers, Engineering & Science (748 | 15.9%), Business & Financial (629 | 13.4%), Community & Social Service (525 | 11.2%), and Computers & Mathematics (425 | 9.0%).
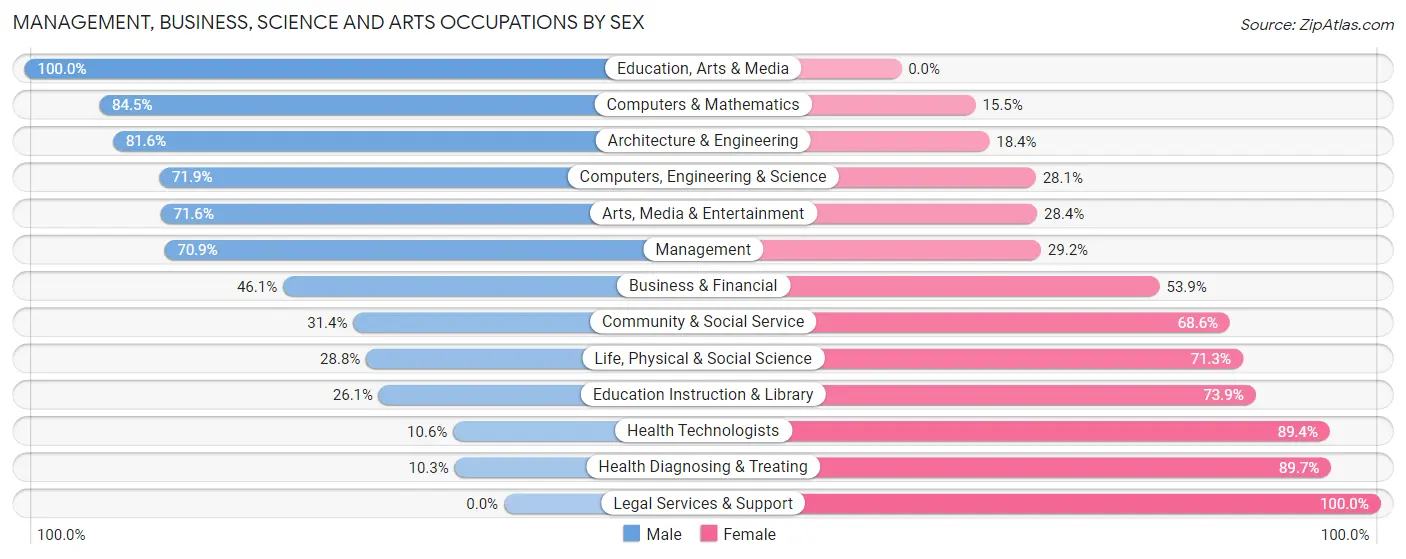
Management, Business, Science and Arts Occupations by Sex
Within the Management, Business, Science and Arts occupations in Hawthorn Woods, the most male-oriented occupations are Education, Arts & Media (100.0%), Computers & Mathematics (84.5%), and Architecture & Engineering (81.6%), while the most female-oriented occupations are Legal Services & Support (100.0%), Health Diagnosing & Treating (89.7%), and Health Technologists (89.4%).
| Occupation | Male | Female |
| Management | 722 (70.9%) | 297 (29.1%) |
| Business & Financial | 290 (46.1%) | 339 (53.9%) |
| Computers, Engineering & Science | 538 (71.9%) | 210 (28.1%) |
| Computers & Mathematics | 359 (84.5%) | 66 (15.5%) |
| Architecture & Engineering | 133 (81.6%) | 30 (18.4%) |
| Life, Physical & Social Science | 46 (28.7%) | 114 (71.3%) |
| Community & Social Service | 165 (31.4%) | 360 (68.6%) |
| Education, Arts & Media | 16 (100.0%) | 0 (0.0%) |
| Legal Services & Support | 0 (0.0%) | 55 (100.0%) |
| Education Instruction & Library | 101 (26.1%) | 286 (73.9%) |
| Arts, Media & Entertainment | 48 (71.6%) | 19 (28.4%) |
| Health Diagnosing & Treating | 37 (10.3%) | 322 (89.7%) |
| Health Technologists | 37 (10.6%) | 312 (89.4%) |
| Total (Category) | 1,752 (53.4%) | 1,528 (46.6%) |
| Total (Overall) | 2,670 (56.9%) | 2,026 (43.1%) |
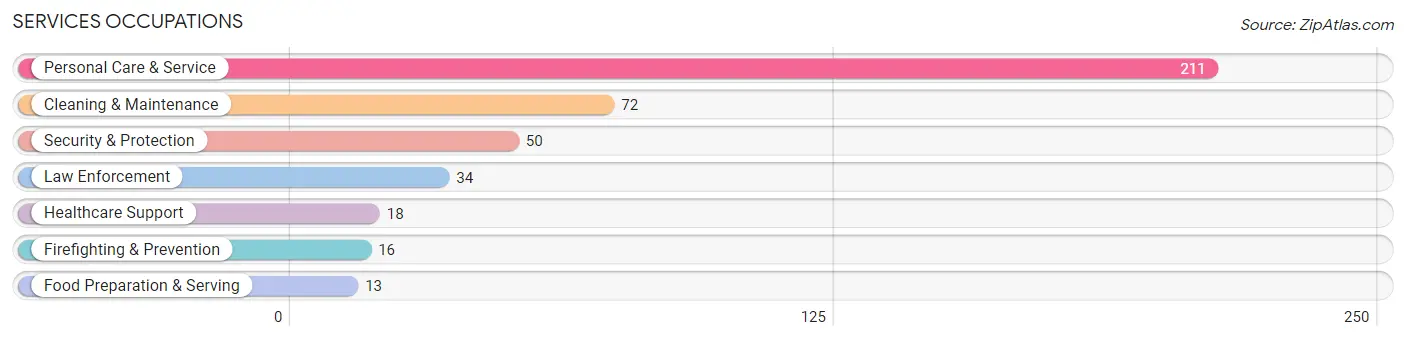
Services Occupations
The most common Services occupations in Hawthorn Woods are Personal Care & Service (211 | 4.5%), Cleaning & Maintenance (72 | 1.5%), Security & Protection (50 | 1.1%), Law Enforcement (34 | 0.7%), and Healthcare Support (18 | 0.4%).
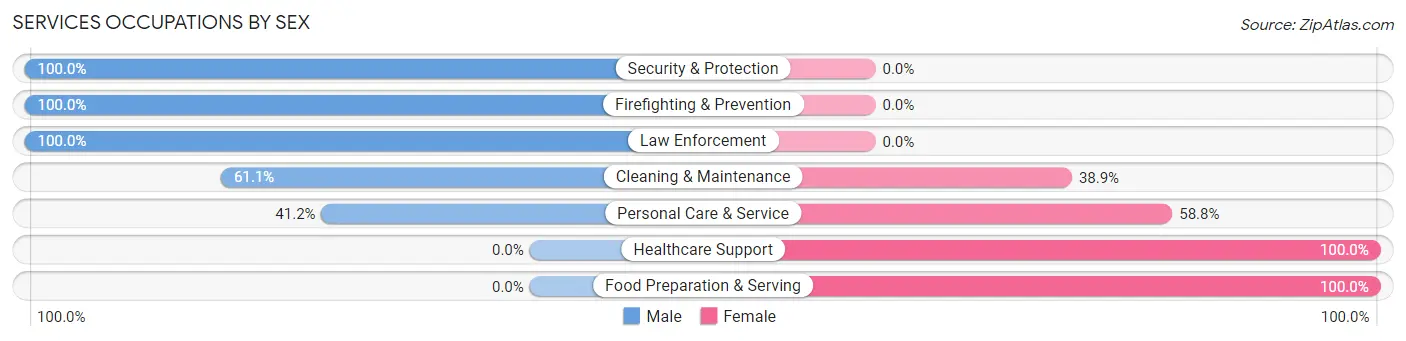
Services Occupations by Sex
Within the Services occupations in Hawthorn Woods, the most male-oriented occupations are Security & Protection (100.0%), Firefighting & Prevention (100.0%), and Law Enforcement (100.0%), while the most female-oriented occupations are Healthcare Support (100.0%), Food Preparation & Serving (100.0%), and Personal Care & Service (58.8%).
| Occupation | Male | Female |
| Healthcare Support | 0 (0.0%) | 18 (100.0%) |
| Security & Protection | 50 (100.0%) | 0 (0.0%) |
| Firefighting & Prevention | 16 (100.0%) | 0 (0.0%) |
| Law Enforcement | 34 (100.0%) | 0 (0.0%) |
| Food Preparation & Serving | 0 (0.0%) | 13 (100.0%) |
| Cleaning & Maintenance | 44 (61.1%) | 28 (38.9%) |
| Personal Care & Service | 87 (41.2%) | 124 (58.8%) |
| Total (Category) | 181 (49.7%) | 183 (50.3%) |
| Total (Overall) | 2,670 (56.9%) | 2,026 (43.1%) |
Sales and Office Occupations
The most common Sales and Office occupations in Hawthorn Woods are Sales & Related (518 | 11.0%), and Office & Administration (167 | 3.6%).
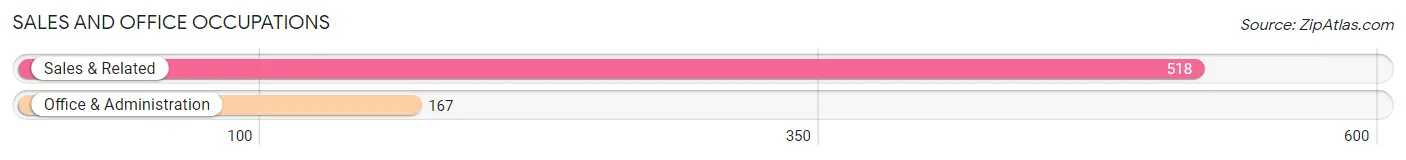
Sales and Office Occupations by Sex
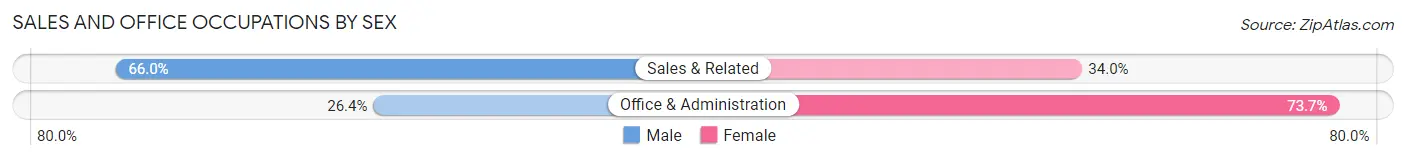
| Occupation | Male | Female |
| Sales & Related | 342 (66.0%) | 176 (34.0%) |
| Office & Administration | 44 (26.4%) | 123 (73.7%) |
| Total (Category) | 386 (56.4%) | 299 (43.6%) |
| Total (Overall) | 2,670 (56.9%) | 2,026 (43.1%) |
Natural Resources, Construction and Maintenance Occupations
The most common Natural Resources, Construction and Maintenance occupations in Hawthorn Woods are Construction & Extraction (141 | 3.0%), and Installation, Maintenance & Repair (37 | 0.8%).
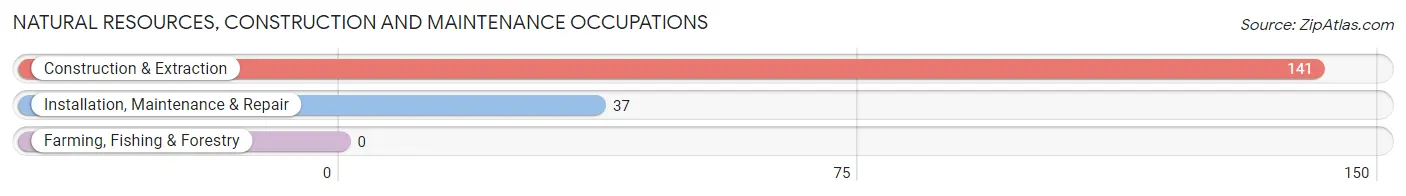
Natural Resources, Construction and Maintenance Occupations by Sex
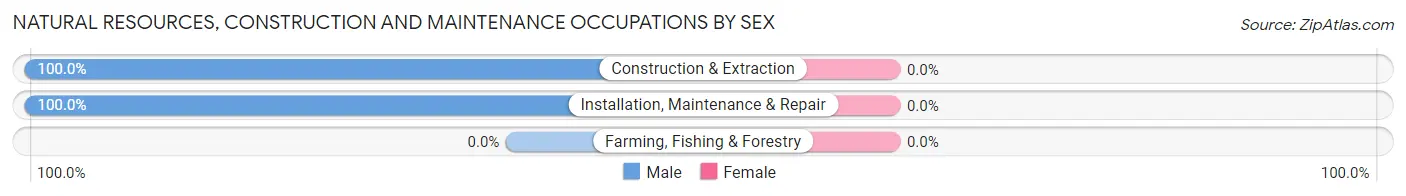
| Occupation | Male | Female |
| Farming, Fishing & Forestry | 0 (0.0%) | 0 (0.0%) |
| Construction & Extraction | 141 (100.0%) | 0 (0.0%) |
| Installation, Maintenance & Repair | 37 (100.0%) | 0 (0.0%) |
| Total (Category) | 178 (100.0%) | 0 (0.0%) |
| Total (Overall) | 2,670 (56.9%) | 2,026 (43.1%) |
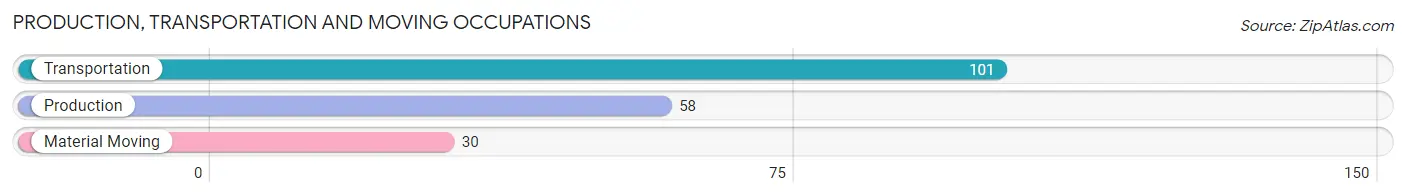
Production, Transportation and Moving Occupations
The most common Production, Transportation and Moving occupations in Hawthorn Woods are Transportation (101 | 2.1%), Production (58 | 1.2%), and Material Moving (30 | 0.6%).
Production, Transportation and Moving Occupations by Sex
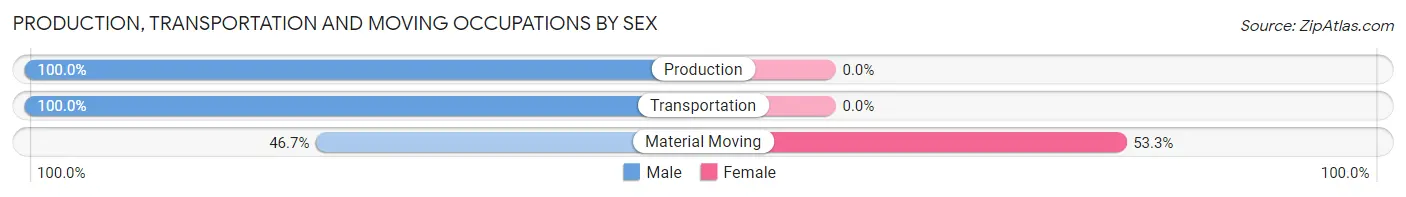
| Occupation | Male | Female |
| Production | 58 (100.0%) | 0 (0.0%) |
| Transportation | 101 (100.0%) | 0 (0.0%) |
| Material Moving | 14 (46.7%) | 16 (53.3%) |
| Total (Category) | 173 (91.5%) | 16 (8.5%) |
| Total (Overall) | 2,670 (56.9%) | 2,026 (43.1%) |
Employment Industries by Sex in Hawthorn Woods
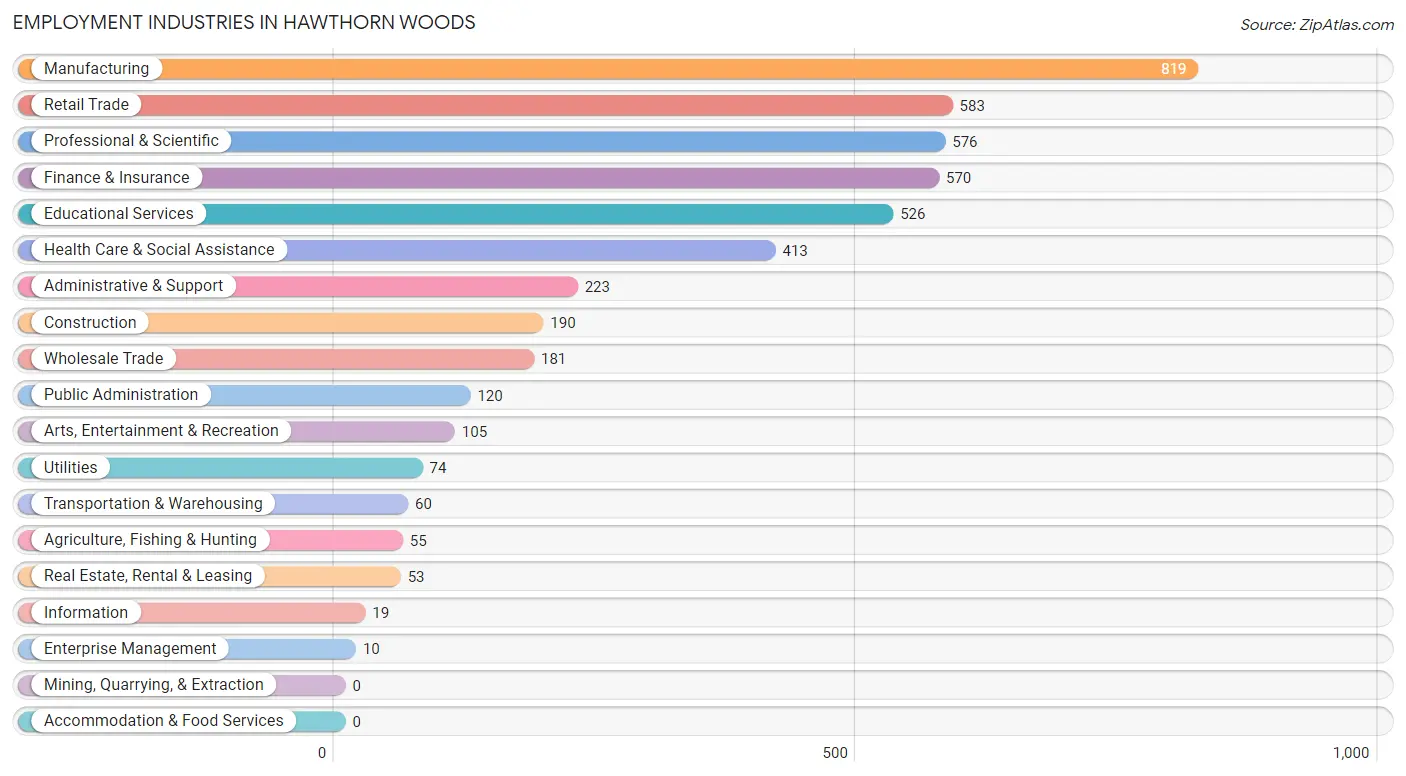
Employment Industries in Hawthorn Woods
The major employment industries in Hawthorn Woods include Manufacturing (819 | 17.4%), Retail Trade (583 | 12.4%), Professional & Scientific (576 | 12.3%), Finance & Insurance (570 | 12.1%), and Educational Services (526 | 11.2%).
Employment Industries by Sex in Hawthorn Woods
The Hawthorn Woods industries that see more men than women are Information (100.0%), Construction (94.2%), and Public Administration (90.0%), whereas the industries that tend to have a higher number of women are Agriculture, Fishing & Hunting (100.0%), Utilities (100.0%), and Enterprise Management (100.0%).
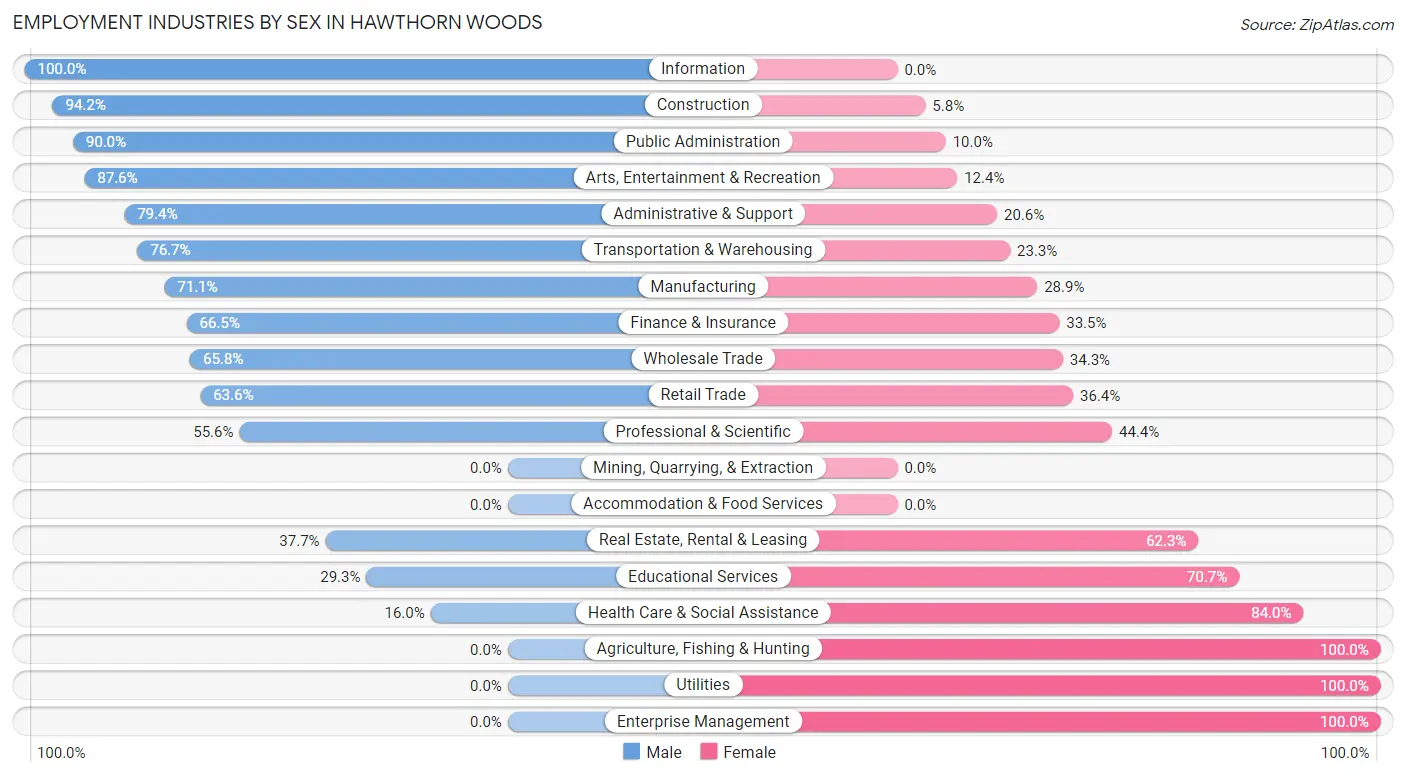
| Industry | Male | Female |
| Agriculture, Fishing & Hunting | 0 (0.0%) | 55 (100.0%) |
| Mining, Quarrying, & Extraction | 0 (0.0%) | 0 (0.0%) |
| Construction | 179 (94.2%) | 11 (5.8%) |
| Manufacturing | 582 (71.1%) | 237 (28.9%) |
| Wholesale Trade | 119 (65.7%) | 62 (34.3%) |
| Retail Trade | 371 (63.6%) | 212 (36.4%) |
| Transportation & Warehousing | 46 (76.7%) | 14 (23.3%) |
| Utilities | 0 (0.0%) | 74 (100.0%) |
| Information | 19 (100.0%) | 0 (0.0%) |
| Finance & Insurance | 379 (66.5%) | 191 (33.5%) |
| Real Estate, Rental & Leasing | 20 (37.7%) | 33 (62.3%) |
| Professional & Scientific | 320 (55.6%) | 256 (44.4%) |
| Enterprise Management | 0 (0.0%) | 10 (100.0%) |
| Administrative & Support | 177 (79.4%) | 46 (20.6%) |
| Educational Services | 154 (29.3%) | 372 (70.7%) |
| Health Care & Social Assistance | 66 (16.0%) | 347 (84.0%) |
| Arts, Entertainment & Recreation | 92 (87.6%) | 13 (12.4%) |
| Accommodation & Food Services | 0 (0.0%) | 0 (0.0%) |
| Public Administration | 108 (90.0%) | 12 (10.0%) |
| Total | 2,670 (56.9%) | 2,026 (43.1%) |
Education in Hawthorn Woods
School Enrollment in Hawthorn Woods
The most common levels of schooling among the 2,795 students in Hawthorn Woods are middle school (734 | 26.3%), high school (668 | 23.9%), and elementary school (546 | 19.5%).
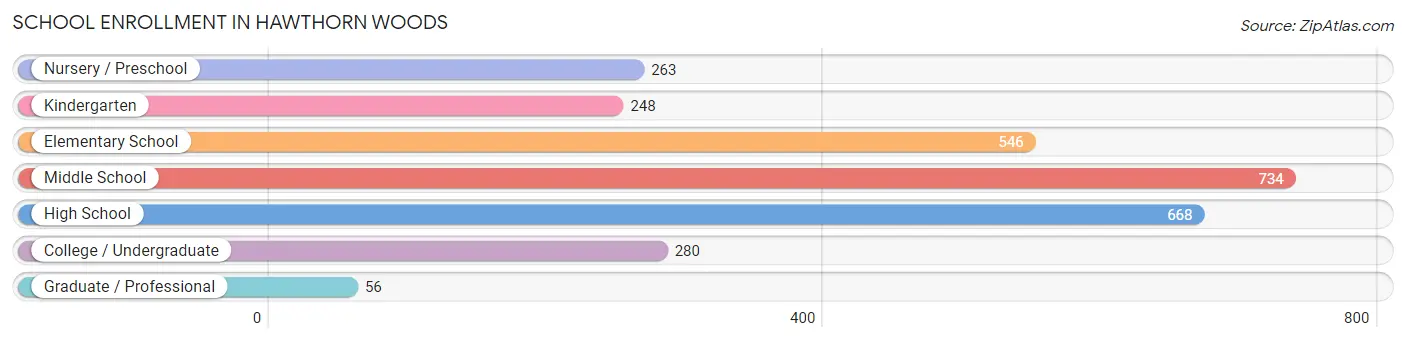
| School Level | # Students | % Students |
| Nursery / Preschool | 263 | 9.4% |
| Kindergarten | 248 | 8.9% |
| Elementary School | 546 | 19.5% |
| Middle School | 734 | 26.3% |
| High School | 668 | 23.9% |
| College / Undergraduate | 280 | 10.0% |
| Graduate / Professional | 56 | 2.0% |
| Total | 2,795 | 100.0% |
School Enrollment by Age by Funding Source in Hawthorn Woods
Out of a total of 2,795 students who are enrolled in schools in Hawthorn Woods, 355 (12.7%) attend a private institution, while the remaining 2,440 (87.3%) are enrolled in public schools. The age group of 3 to 4 year olds has the highest likelihood of being enrolled in private schools, with 163 (67.9% in the age bracket) enrolled. Conversely, the age group of 10 to 14 year olds has the lowest likelihood of being enrolled in a private school, with 773 (100.0% in the age bracket) attending a public institution.
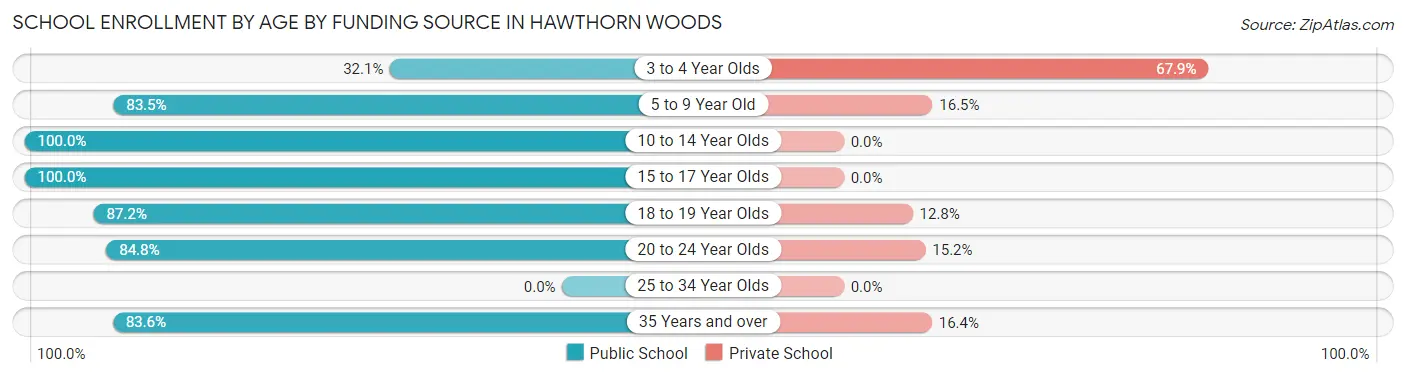
| Age Bracket | Public School | Private School |
| 3 to 4 Year Olds | 77 (32.1%) | 163 (67.9%) |
| 5 to 9 Year Old | 682 (83.5%) | 135 (16.5%) |
| 10 to 14 Year Olds | 773 (100.0%) | 0 (0.0%) |
| 15 to 17 Year Olds | 549 (100.0%) | 0 (0.0%) |
| 18 to 19 Year Olds | 224 (87.2%) | 33 (12.8%) |
| 20 to 24 Year Olds | 78 (84.8%) | 14 (15.2%) |
| 25 to 34 Year Olds | 0 (0.0%) | 0 (0.0%) |
| 35 Years and over | 56 (83.6%) | 11 (16.4%) |
| Total | 2,440 (87.3%) | 355 (12.7%) |
Educational Attainment by Field of Study in Hawthorn Woods
Business (969 | 20.6%), engineering (818 | 17.4%), computers & mathematics (513 | 10.9%), education (359 | 7.6%), and communications (299 | 6.3%) are the most common fields of study among 4,713 individuals in Hawthorn Woods who have obtained a bachelor's degree or higher.
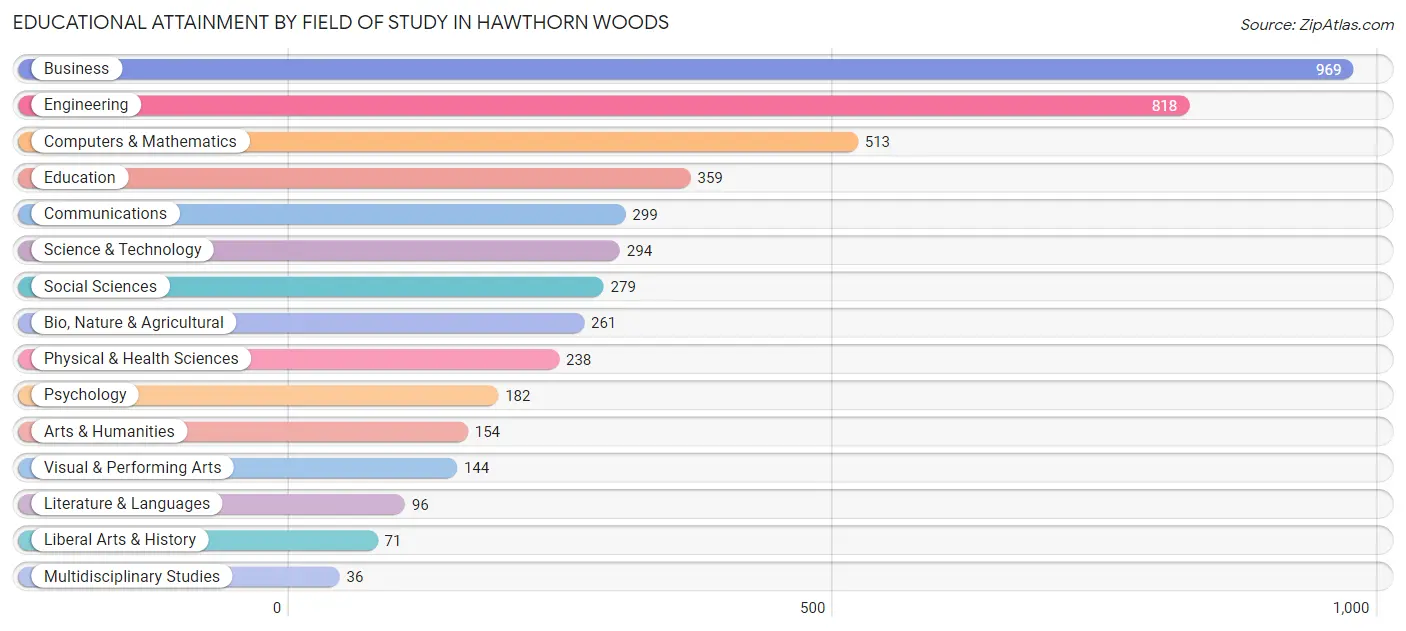
| Field of Study | # Graduates | % Graduates |
| Computers & Mathematics | 513 | 10.9% |
| Bio, Nature & Agricultural | 261 | 5.5% |
| Physical & Health Sciences | 238 | 5.1% |
| Psychology | 182 | 3.9% |
| Social Sciences | 279 | 5.9% |
| Engineering | 818 | 17.4% |
| Multidisciplinary Studies | 36 | 0.8% |
| Science & Technology | 294 | 6.2% |
| Business | 969 | 20.6% |
| Education | 359 | 7.6% |
| Literature & Languages | 96 | 2.0% |
| Liberal Arts & History | 71 | 1.5% |
| Visual & Performing Arts | 144 | 3.1% |
| Communications | 299 | 6.3% |
| Arts & Humanities | 154 | 3.3% |
| Total | 4,713 | 100.0% |
Transportation & Commute in Hawthorn Woods
Vehicle Availability by Sex in Hawthorn Woods
The most prevalent vehicle ownership categories in Hawthorn Woods are males with 2 vehicles (1,275, accounting for 48.3%) and females with 2 vehicles (888, making up 63.8%).
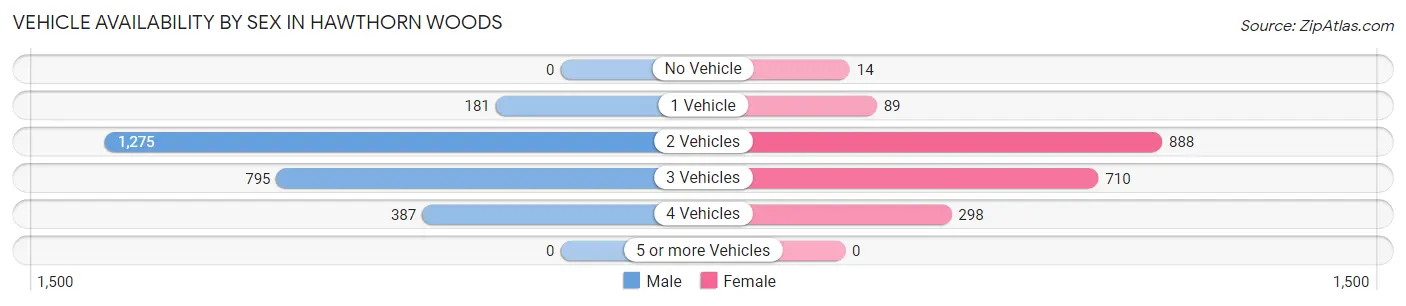
| Vehicles Available | Male | Female |
| No Vehicle | 0 (0.0%) | 14 (0.7%) |
| 1 Vehicle | 181 (6.9%) | 89 (4.4%) |
| 2 Vehicles | 1,275 (48.3%) | 888 (44.4%) |
| 3 Vehicles | 795 (30.1%) | 710 (35.5%) |
| 4 Vehicles | 387 (14.7%) | 298 (14.9%) |
| 5 or more Vehicles | 0 (0.0%) | 0 (0.0%) |
| Total | 2,638 (100.0%) | 1,999 (100.0%) |
Commute Time in Hawthorn Woods
The most frequently occuring commute durations in Hawthorn Woods are 30 to 34 minutes (649 commuters, 17.5%), 45 to 59 minutes (622 commuters, 16.8%), and 20 to 24 minutes (458 commuters, 12.3%).
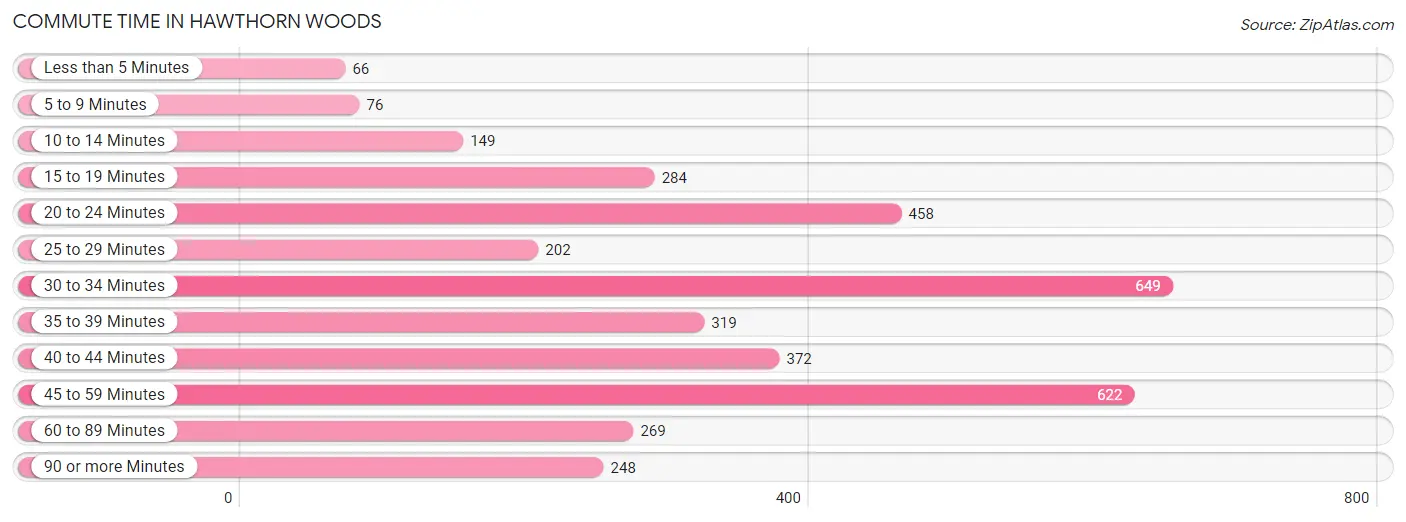
| Commute Time | # Commuters | % Commuters |
| Less than 5 Minutes | 66 | 1.8% |
| 5 to 9 Minutes | 76 | 2.1% |
| 10 to 14 Minutes | 149 | 4.0% |
| 15 to 19 Minutes | 284 | 7.6% |
| 20 to 24 Minutes | 458 | 12.3% |
| 25 to 29 Minutes | 202 | 5.4% |
| 30 to 34 Minutes | 649 | 17.5% |
| 35 to 39 Minutes | 319 | 8.6% |
| 40 to 44 Minutes | 372 | 10.0% |
| 45 to 59 Minutes | 622 | 16.8% |
| 60 to 89 Minutes | 269 | 7.2% |
| 90 or more Minutes | 248 | 6.7% |
Commute Time by Sex in Hawthorn Woods
The most common commute times in Hawthorn Woods are 30 to 34 minutes (400 commuters, 19.5%) for males and 45 to 59 minutes (256 commuters, 15.4%) for females.
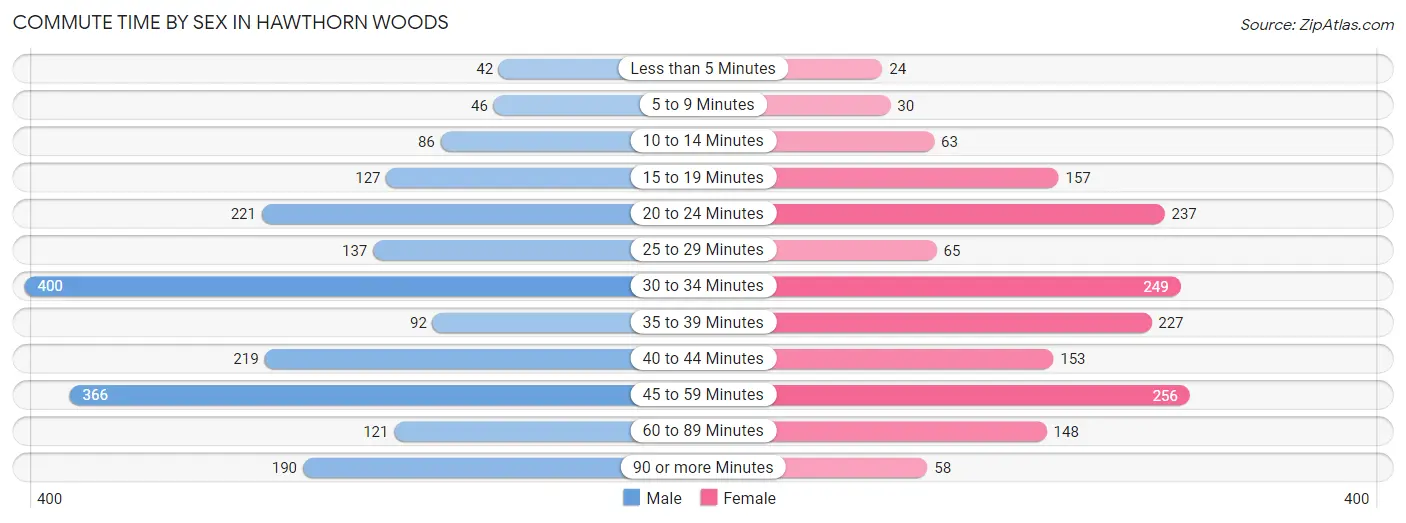
| Commute Time | Male | Female |
| Less than 5 Minutes | 42 (2.1%) | 24 (1.4%) |
| 5 to 9 Minutes | 46 (2.2%) | 30 (1.8%) |
| 10 to 14 Minutes | 86 (4.2%) | 63 (3.8%) |
| 15 to 19 Minutes | 127 (6.2%) | 157 (9.4%) |
| 20 to 24 Minutes | 221 (10.8%) | 237 (14.2%) |
| 25 to 29 Minutes | 137 (6.7%) | 65 (3.9%) |
| 30 to 34 Minutes | 400 (19.5%) | 249 (14.9%) |
| 35 to 39 Minutes | 92 (4.5%) | 227 (13.6%) |
| 40 to 44 Minutes | 219 (10.7%) | 153 (9.2%) |
| 45 to 59 Minutes | 366 (17.9%) | 256 (15.4%) |
| 60 to 89 Minutes | 121 (5.9%) | 148 (8.9%) |
| 90 or more Minutes | 190 (9.3%) | 58 (3.5%) |
Time of Departure to Work by Sex in Hawthorn Woods
The most frequent times of departure to work in Hawthorn Woods are 7:00 AM to 7:29 AM (520, 25.4%) for males and 7:00 AM to 7:29 AM (287, 17.2%) for females.
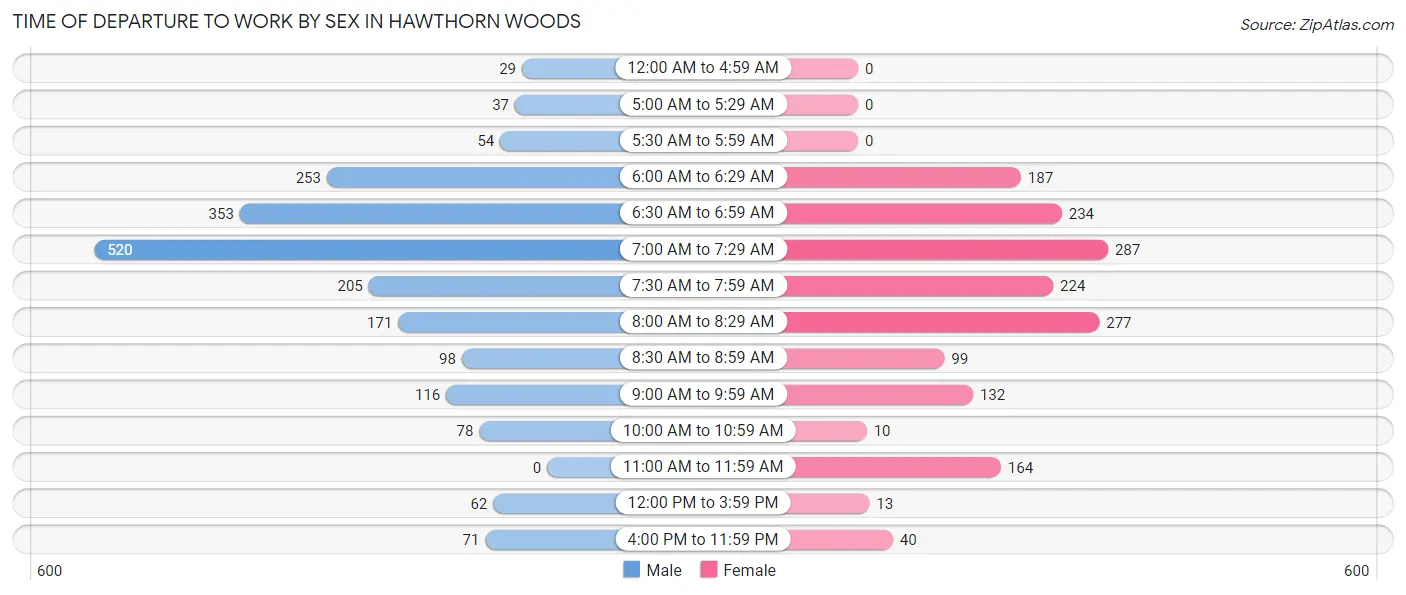
| Time of Departure | Male | Female |
| 12:00 AM to 4:59 AM | 29 (1.4%) | 0 (0.0%) |
| 5:00 AM to 5:29 AM | 37 (1.8%) | 0 (0.0%) |
| 5:30 AM to 5:59 AM | 54 (2.6%) | 0 (0.0%) |
| 6:00 AM to 6:29 AM | 253 (12.4%) | 187 (11.2%) |
| 6:30 AM to 6:59 AM | 353 (17.2%) | 234 (14.0%) |
| 7:00 AM to 7:29 AM | 520 (25.4%) | 287 (17.2%) |
| 7:30 AM to 7:59 AM | 205 (10.0%) | 224 (13.4%) |
| 8:00 AM to 8:29 AM | 171 (8.4%) | 277 (16.6%) |
| 8:30 AM to 8:59 AM | 98 (4.8%) | 99 (5.9%) |
| 9:00 AM to 9:59 AM | 116 (5.7%) | 132 (7.9%) |
| 10:00 AM to 10:59 AM | 78 (3.8%) | 10 (0.6%) |
| 11:00 AM to 11:59 AM | 0 (0.0%) | 164 (9.8%) |
| 12:00 PM to 3:59 PM | 62 (3.0%) | 13 (0.8%) |
| 4:00 PM to 11:59 PM | 71 (3.5%) | 40 (2.4%) |
| Total | 2,047 (100.0%) | 1,667 (100.0%) |
Housing Occupancy in Hawthorn Woods
Occupancy by Ownership in Hawthorn Woods
Of the total 2,936 dwellings in Hawthorn Woods, owner-occupied units account for 2,865 (97.6%), while renter-occupied units make up 71 (2.4%).
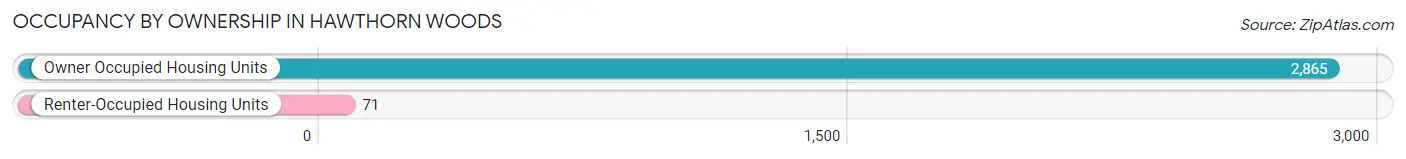
| Occupancy | # Housing Units | % Housing Units |
| Owner Occupied Housing Units | 2,865 | 97.6% |
| Renter-Occupied Housing Units | 71 | 2.4% |
| Total Occupied Housing Units | 2,936 | 100.0% |
Occupancy by Household Size in Hawthorn Woods
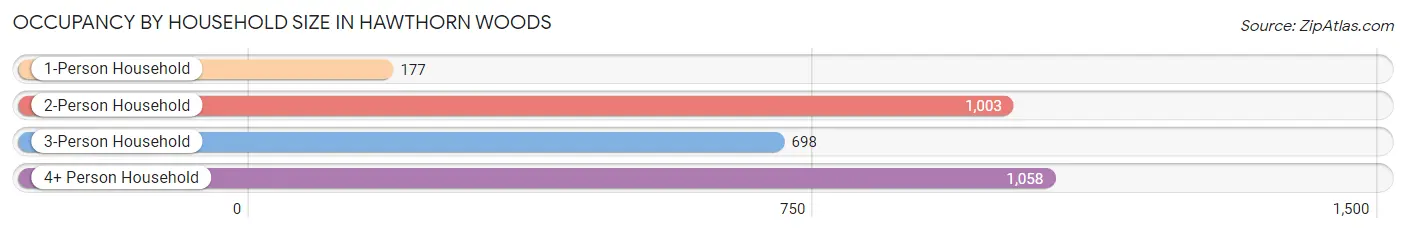
| Household Size | # Housing Units | % Housing Units |
| 1-Person Household | 177 | 6.0% |
| 2-Person Household | 1,003 | 34.2% |
| 3-Person Household | 698 | 23.8% |
| 4+ Person Household | 1,058 | 36.0% |
| Total Housing Units | 2,936 | 100.0% |
Occupancy by Ownership by Household Size in Hawthorn Woods
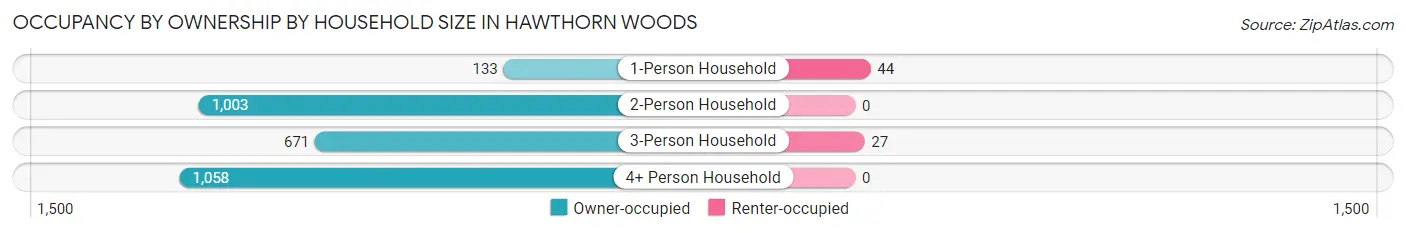
| Household Size | Owner-occupied | Renter-occupied |
| 1-Person Household | 133 (75.1%) | 44 (24.9%) |
| 2-Person Household | 1,003 (100.0%) | 0 (0.0%) |
| 3-Person Household | 671 (96.1%) | 27 (3.9%) |
| 4+ Person Household | 1,058 (100.0%) | 0 (0.0%) |
| Total Housing Units | 2,865 (97.6%) | 71 (2.4%) |
Occupancy by Educational Attainment in Hawthorn Woods
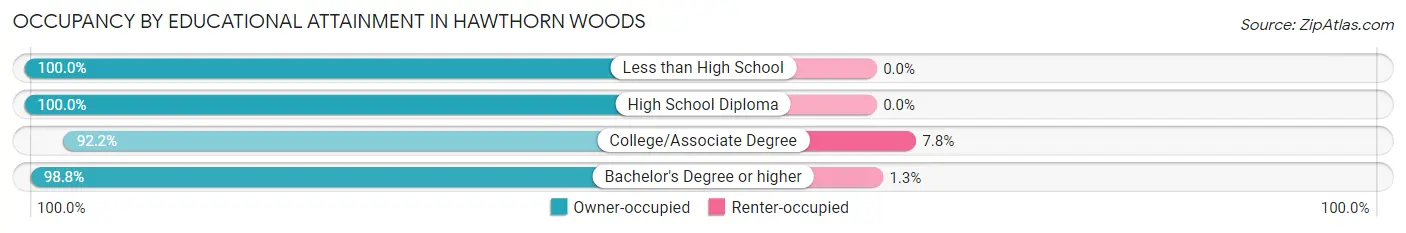
| Household Size | Owner-occupied | Renter-occupied |
| Less than High School | 55 (100.0%) | 0 (0.0%) |
| High School Diploma | 163 (100.0%) | 0 (0.0%) |
| College/Associate Degree | 521 (92.2%) | 44 (7.8%) |
| Bachelor's Degree or higher | 2,126 (98.8%) | 27 (1.3%) |
Occupancy by Age of Householder in Hawthorn Woods
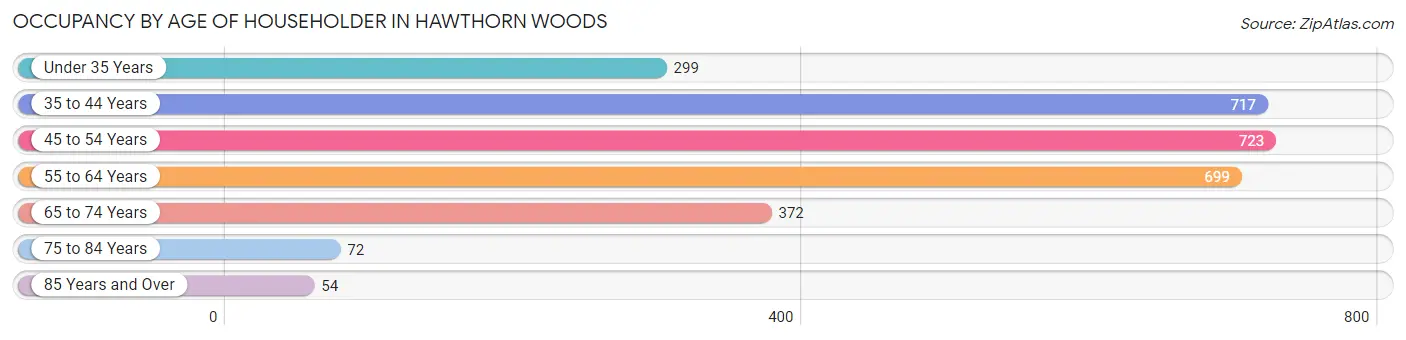
| Age Bracket | # Households | % Households |
| Under 35 Years | 299 | 10.2% |
| 35 to 44 Years | 717 | 24.4% |
| 45 to 54 Years | 723 | 24.6% |
| 55 to 64 Years | 699 | 23.8% |
| 65 to 74 Years | 372 | 12.7% |
| 75 to 84 Years | 72 | 2.5% |
| 85 Years and Over | 54 | 1.8% |
| Total | 2,936 | 100.0% |
Housing Finances in Hawthorn Woods
Median Income by Occupancy in Hawthorn Woods
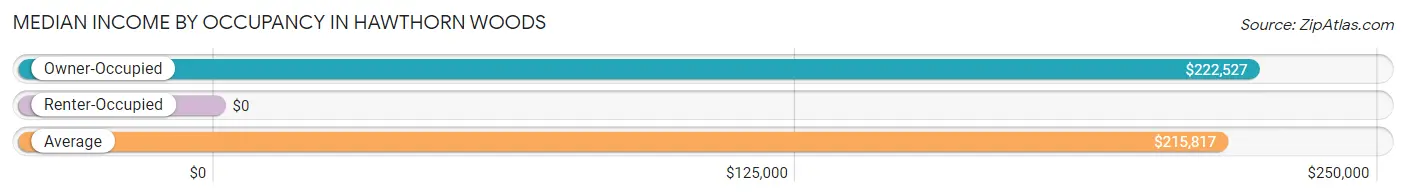
| Occupancy Type | # Households | Median Income |
| Owner-Occupied | 2,865 (97.6%) | $222,527 |
| Renter-Occupied | 71 (2.4%) | $0 |
| Average | 2,936 (100.0%) | $215,817 |
Occupancy by Householder Income Bracket in Hawthorn Woods
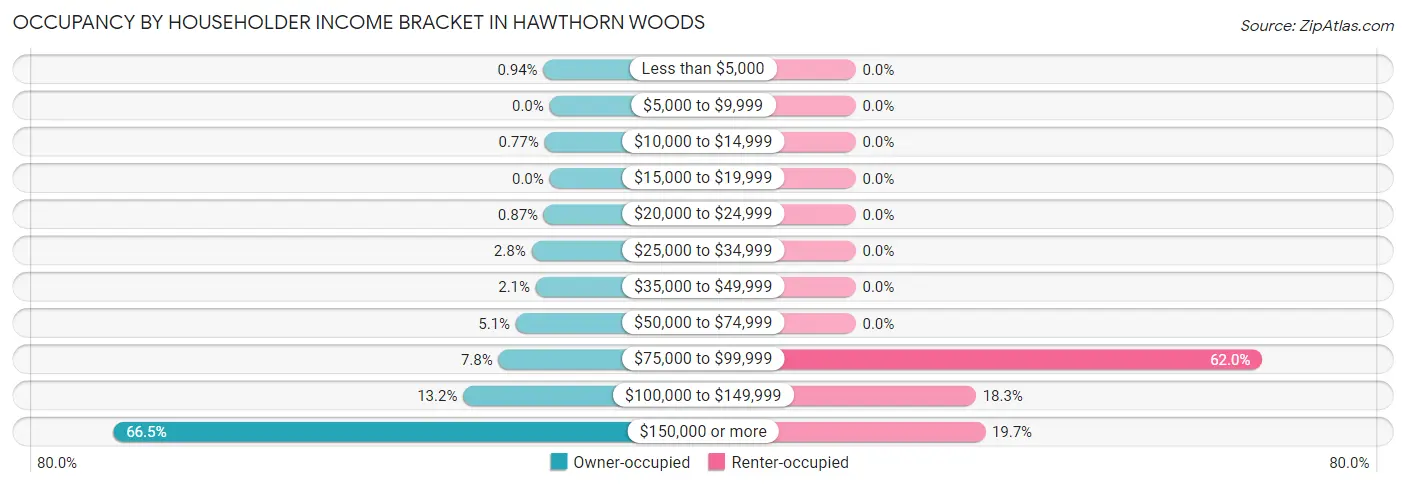
| Income Bracket | Owner-occupied | Renter-occupied |
| Less than $5,000 | 27 (0.9%) | 0 (0.0%) |
| $5,000 to $9,999 | 0 (0.0%) | 0 (0.0%) |
| $10,000 to $14,999 | 22 (0.8%) | 0 (0.0%) |
| $15,000 to $19,999 | 0 (0.0%) | 0 (0.0%) |
| $20,000 to $24,999 | 25 (0.9%) | 0 (0.0%) |
| $25,000 to $34,999 | 79 (2.8%) | 0 (0.0%) |
| $35,000 to $49,999 | 60 (2.1%) | 0 (0.0%) |
| $50,000 to $74,999 | 147 (5.1%) | 0 (0.0%) |
| $75,000 to $99,999 | 223 (7.8%) | 44 (62.0%) |
| $100,000 to $149,999 | 377 (13.2%) | 13 (18.3%) |
| $150,000 or more | 1,905 (66.5%) | 14 (19.7%) |
| Total | 2,865 (100.0%) | 71 (100.0%) |
Monthly Housing Cost Tiers in Hawthorn Woods
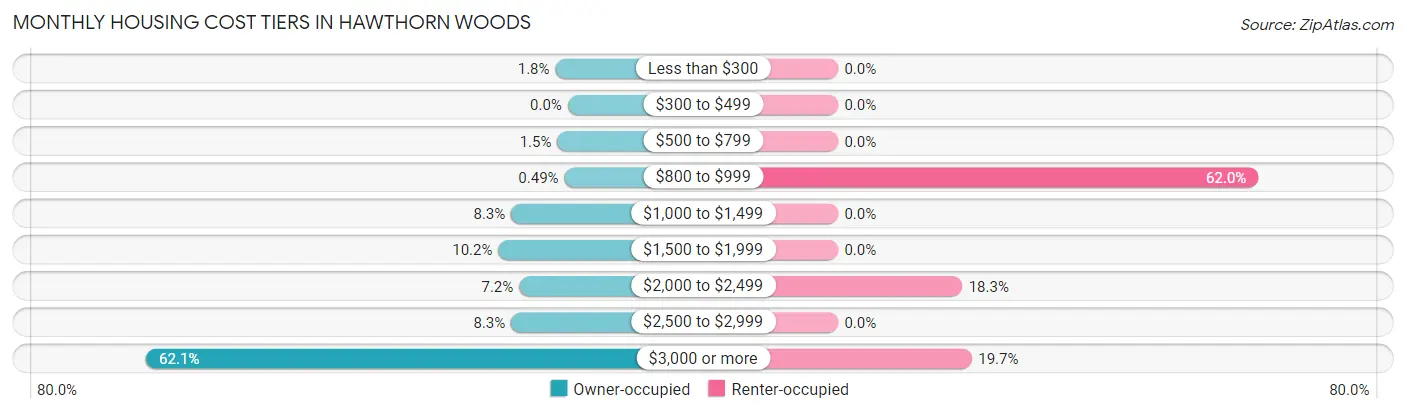
| Monthly Cost | Owner-occupied | Renter-occupied |
| Less than $300 | 52 (1.8%) | 0 (0.0%) |
| $300 to $499 | 0 (0.0%) | 0 (0.0%) |
| $500 to $799 | 44 (1.5%) | 0 (0.0%) |
| $800 to $999 | 14 (0.5%) | 44 (62.0%) |
| $1,000 to $1,499 | 239 (8.3%) | 0 (0.0%) |
| $1,500 to $1,999 | 293 (10.2%) | 0 (0.0%) |
| $2,000 to $2,499 | 205 (7.2%) | 13 (18.3%) |
| $2,500 to $2,999 | 239 (8.3%) | 0 (0.0%) |
| $3,000 or more | 1,779 (62.1%) | 14 (19.7%) |
| Total | 2,865 (100.0%) | 71 (100.0%) |
Physical Housing Characteristics in Hawthorn Woods
Housing Structures in Hawthorn Woods
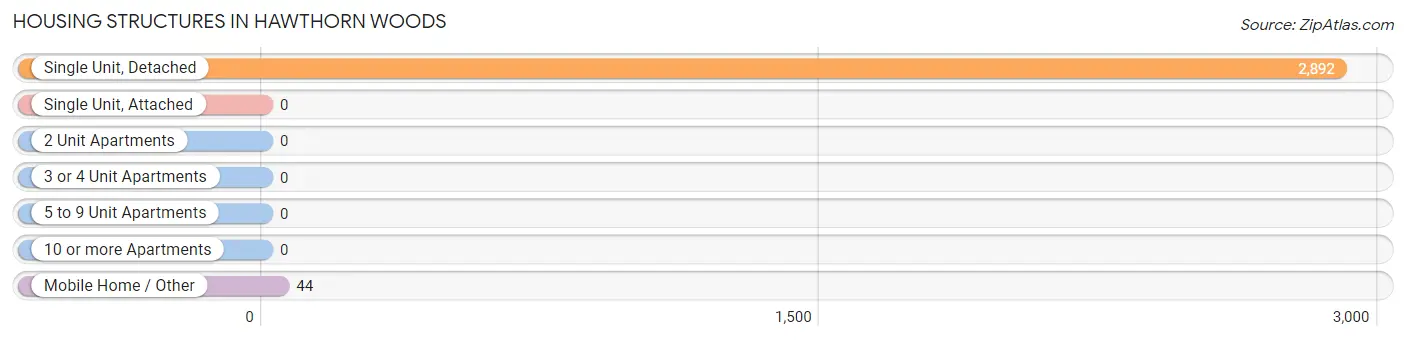
| Structure Type | # Housing Units | % Housing Units |
| Single Unit, Detached | 2,892 | 98.5% |
| Single Unit, Attached | 0 | 0.0% |
| 2 Unit Apartments | 0 | 0.0% |
| 3 or 4 Unit Apartments | 0 | 0.0% |
| 5 to 9 Unit Apartments | 0 | 0.0% |
| 10 or more Apartments | 0 | 0.0% |
| Mobile Home / Other | 44 | 1.5% |
| Total | 2,936 | 100.0% |
Housing Structures by Occupancy in Hawthorn Woods
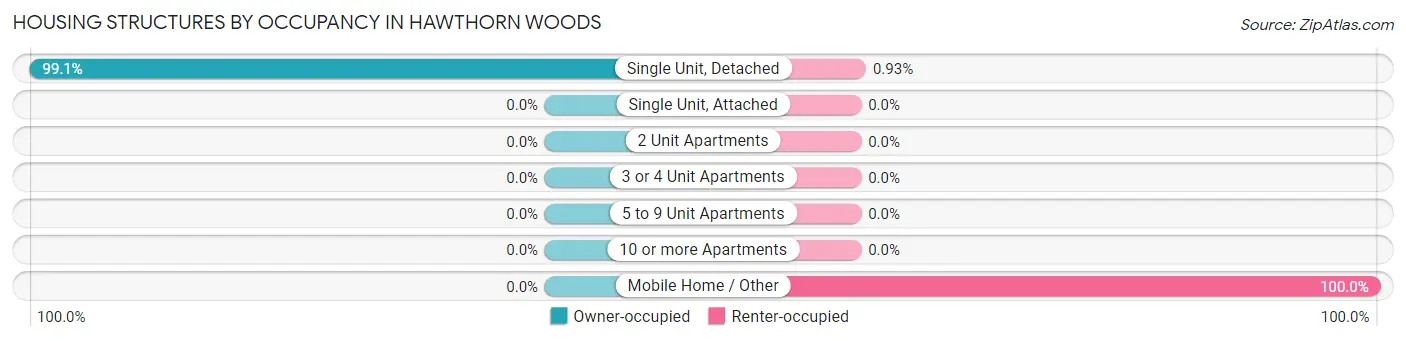
| Structure Type | Owner-occupied | Renter-occupied |
| Single Unit, Detached | 2,865 (99.1%) | 27 (0.9%) |
| Single Unit, Attached | 0 (0.0%) | 0 (0.0%) |
| 2 Unit Apartments | 0 (0.0%) | 0 (0.0%) |
| 3 or 4 Unit Apartments | 0 (0.0%) | 0 (0.0%) |
| 5 to 9 Unit Apartments | 0 (0.0%) | 0 (0.0%) |
| 10 or more Apartments | 0 (0.0%) | 0 (0.0%) |
| Mobile Home / Other | 0 (0.0%) | 44 (100.0%) |
| Total | 2,865 (97.6%) | 71 (2.4%) |
Housing Structures by Number of Rooms in Hawthorn Woods
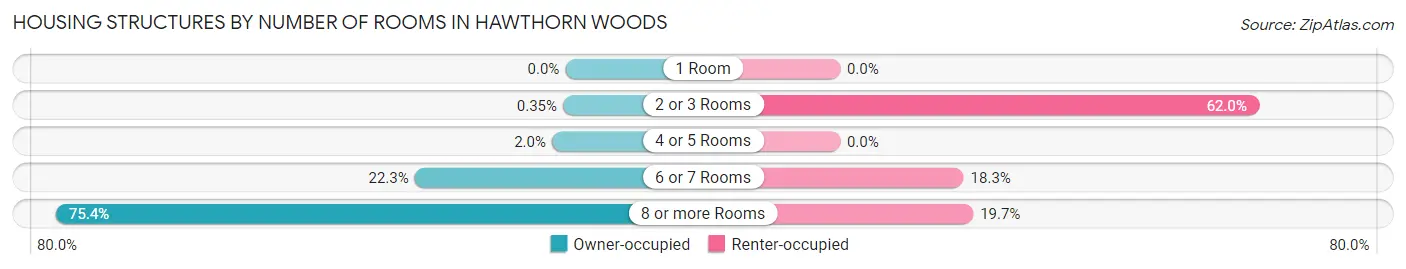
| Number of Rooms | Owner-occupied | Renter-occupied |
| 1 Room | 0 (0.0%) | 0 (0.0%) |
| 2 or 3 Rooms | 10 (0.4%) | 44 (62.0%) |
| 4 or 5 Rooms | 57 (2.0%) | 0 (0.0%) |
| 6 or 7 Rooms | 639 (22.3%) | 13 (18.3%) |
| 8 or more Rooms | 2,159 (75.4%) | 14 (19.7%) |
| Total | 2,865 (100.0%) | 71 (100.0%) |
Housing Structure by Heating Type in Hawthorn Woods
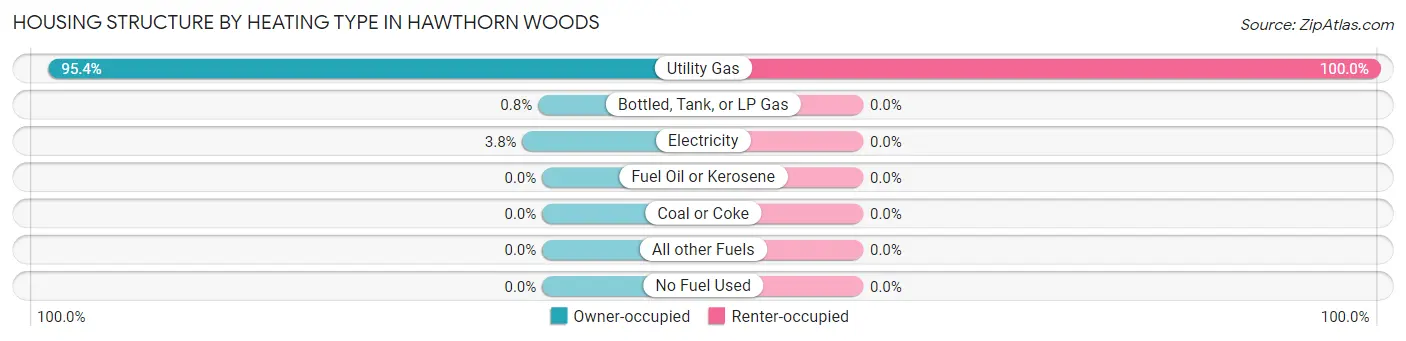
| Heating Type | Owner-occupied | Renter-occupied |
| Utility Gas | 2,733 (95.4%) | 71 (100.0%) |
| Bottled, Tank, or LP Gas | 23 (0.8%) | 0 (0.0%) |
| Electricity | 109 (3.8%) | 0 (0.0%) |
| Fuel Oil or Kerosene | 0 (0.0%) | 0 (0.0%) |
| Coal or Coke | 0 (0.0%) | 0 (0.0%) |
| All other Fuels | 0 (0.0%) | 0 (0.0%) |
| No Fuel Used | 0 (0.0%) | 0 (0.0%) |
| Total | 2,865 (100.0%) | 71 (100.0%) |
Household Vehicle Usage in Hawthorn Woods
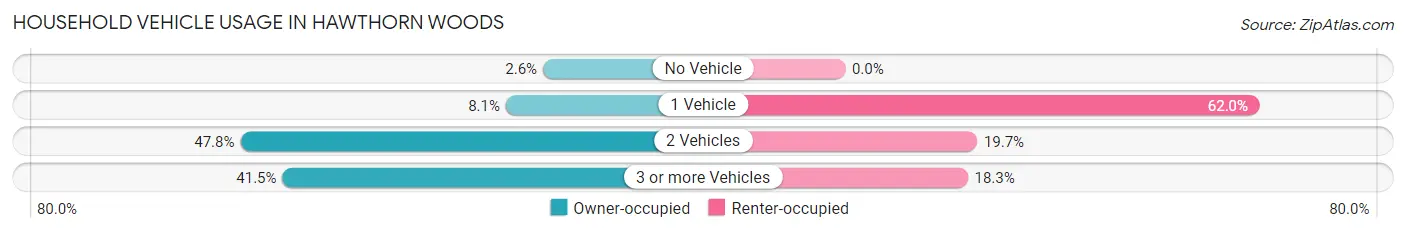
| Vehicles per Household | Owner-occupied | Renter-occupied |
| No Vehicle | 74 (2.6%) | 0 (0.0%) |
| 1 Vehicle | 233 (8.1%) | 44 (62.0%) |
| 2 Vehicles | 1,369 (47.8%) | 14 (19.7%) |
| 3 or more Vehicles | 1,189 (41.5%) | 13 (18.3%) |
| Total | 2,865 (100.0%) | 71 (100.0%) |
Real Estate & Mortgages in Hawthorn Woods
Real Estate and Mortgage Overview in Hawthorn Woods
| Characteristic | Without Mortgage | With Mortgage |
| Housing Units | 678 | 2,187 |
| Median Property Value | $560,400 | $587,200 |
| Median Household Income | $138,646 | $1,594 |
| Monthly Housing Costs | $1,501 | $1,731 |
| Real Estate Taxes | $10,001 | $0 |
Property Value by Mortgage Status in Hawthorn Woods
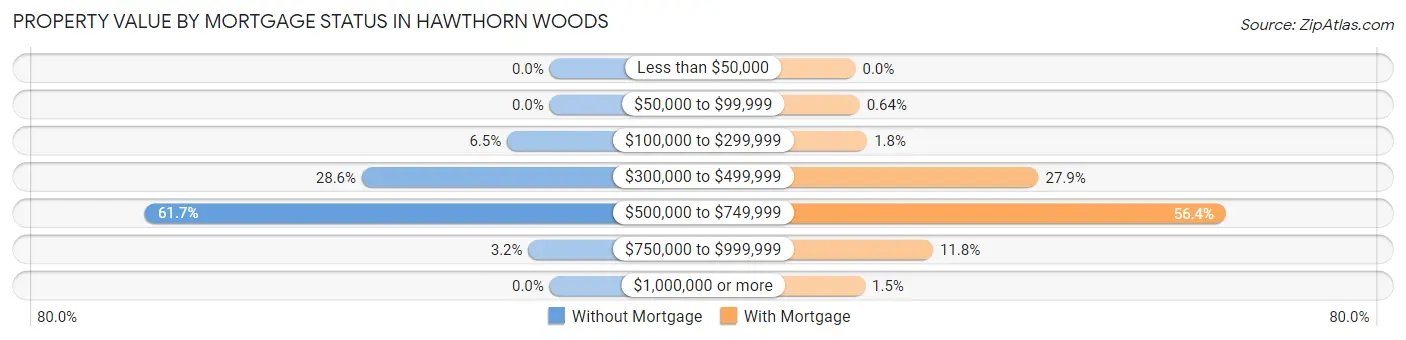
| Property Value | Without Mortgage | With Mortgage |
| Less than $50,000 | 0 (0.0%) | 0 (0.0%) |
| $50,000 to $99,999 | 0 (0.0%) | 14 (0.6%) |
| $100,000 to $299,999 | 44 (6.5%) | 39 (1.8%) |
| $300,000 to $499,999 | 194 (28.6%) | 610 (27.9%) |
| $500,000 to $749,999 | 418 (61.7%) | 1,234 (56.4%) |
| $750,000 to $999,999 | 22 (3.2%) | 258 (11.8%) |
| $1,000,000 or more | 0 (0.0%) | 32 (1.5%) |
| Total | 678 (100.0%) | 2,187 (100.0%) |
Household Income by Mortgage Status in Hawthorn Woods
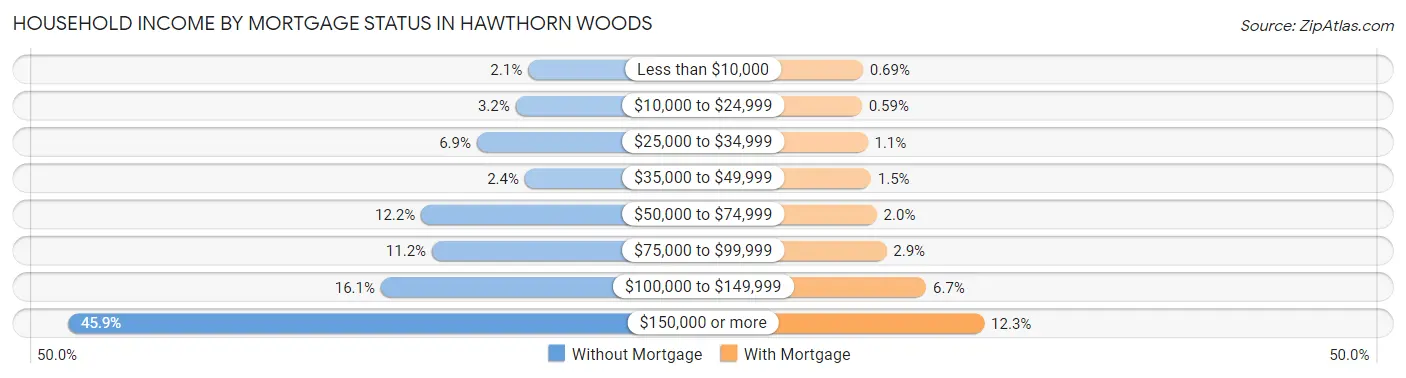
| Household Income | Without Mortgage | With Mortgage |
| Less than $10,000 | 14 (2.1%) | 15 (0.7%) |
| $10,000 to $24,999 | 22 (3.2%) | 13 (0.6%) |
| $25,000 to $34,999 | 47 (6.9%) | 25 (1.1%) |
| $35,000 to $49,999 | 16 (2.4%) | 32 (1.5%) |
| $50,000 to $74,999 | 83 (12.2%) | 44 (2.0%) |
| $75,000 to $99,999 | 76 (11.2%) | 64 (2.9%) |
| $100,000 to $149,999 | 109 (16.1%) | 147 (6.7%) |
| $150,000 or more | 311 (45.9%) | 268 (12.2%) |
| Total | 678 (100.0%) | 2,187 (100.0%) |
Property Value to Household Income Ratio in Hawthorn Woods
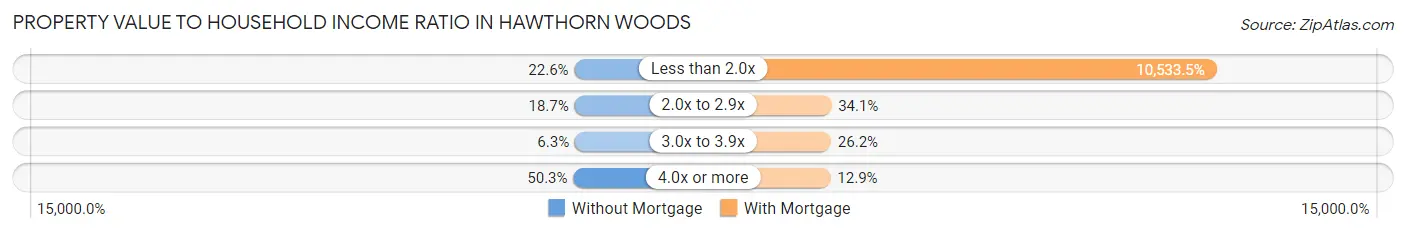
| Value-to-Income Ratio | Without Mortgage | With Mortgage |
| Less than 2.0x | 153 (22.6%) | 230,368 (10,533.5%) |
| 2.0x to 2.9x | 127 (18.7%) | 745 (34.1%) |
| 3.0x to 3.9x | 43 (6.3%) | 573 (26.2%) |
| 4.0x or more | 341 (50.3%) | 282 (12.9%) |
| Total | 678 (100.0%) | 2,187 (100.0%) |
Real Estate Taxes by Mortgage Status in Hawthorn Woods
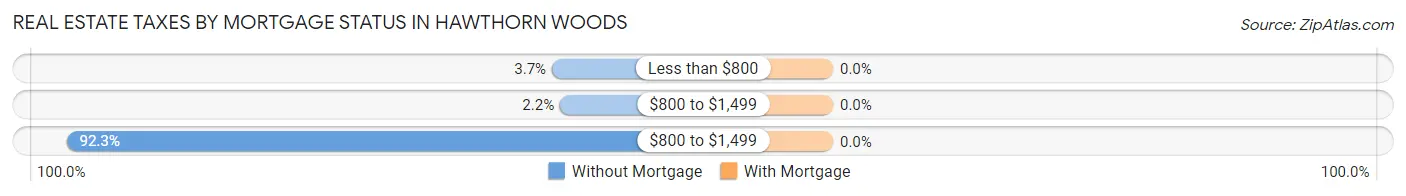
| Property Taxes | Without Mortgage | With Mortgage |
| Less than $800 | 25 (3.7%) | 0 (0.0%) |
| $800 to $1,499 | 15 (2.2%) | 0 (0.0%) |
| $800 to $1,499 | 626 (92.3%) | 0 (0.0%) |
| Total | 678 (100.0%) | 2,187 (100.0%) |
Health & Disability in Hawthorn Woods
Health Insurance Coverage by Age in Hawthorn Woods
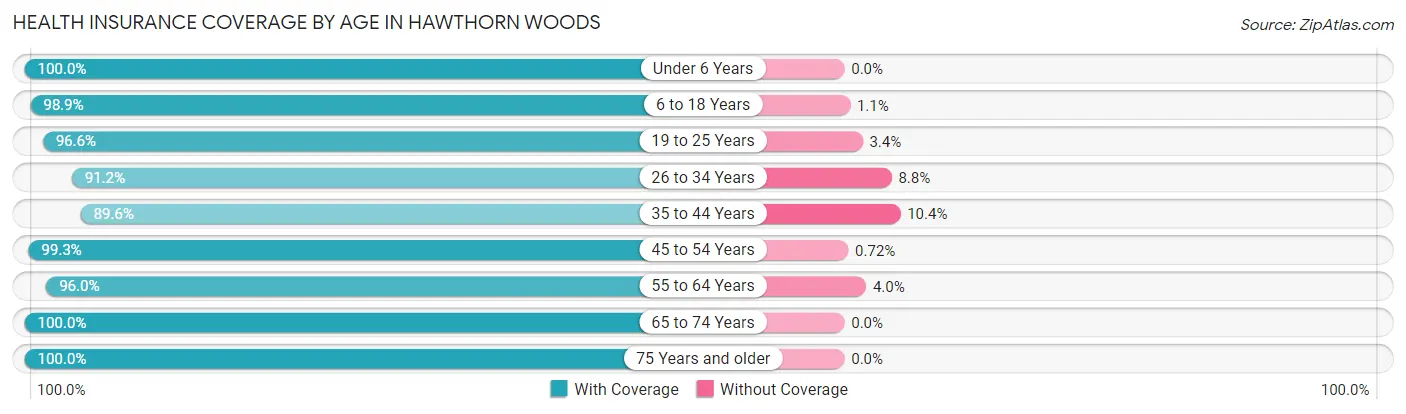
| Age Bracket | With Coverage | Without Coverage |
| Under 6 Years | 671 (100.0%) | 0 (0.0%) |
| 6 to 18 Years | 2,147 (98.9%) | 23 (1.1%) |
| 19 to 25 Years | 400 (96.6%) | 14 (3.4%) |
| 26 to 34 Years | 674 (91.2%) | 65 (8.8%) |
| 35 to 44 Years | 1,082 (89.6%) | 126 (10.4%) |
| 45 to 54 Years | 1,508 (99.3%) | 11 (0.7%) |
| 55 to 64 Years | 1,402 (96.0%) | 59 (4.0%) |
| 65 to 74 Years | 759 (100.0%) | 0 (0.0%) |
| 75 Years and older | 170 (100.0%) | 0 (0.0%) |
| Total | 8,813 (96.7%) | 298 (3.3%) |
Health Insurance Coverage by Citizenship Status in Hawthorn Woods
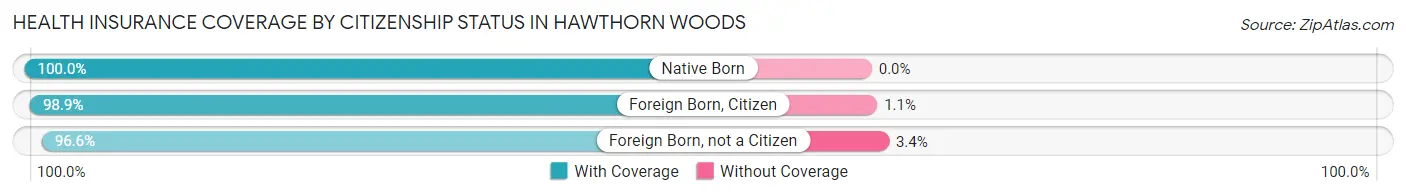
| Citizenship Status | With Coverage | Without Coverage |
| Native Born | 671 (100.0%) | 0 (0.0%) |
| Foreign Born, Citizen | 2,147 (98.9%) | 23 (1.1%) |
| Foreign Born, not a Citizen | 400 (96.6%) | 14 (3.4%) |
Health Insurance Coverage by Household Income in Hawthorn Woods
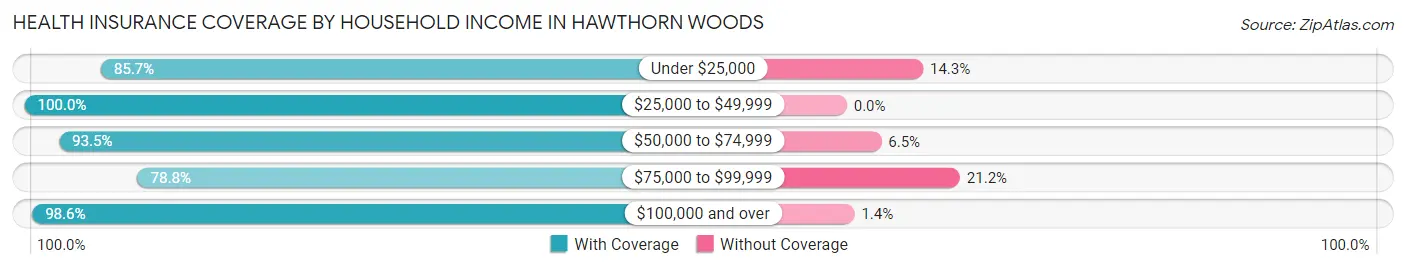
| Household Income | With Coverage | Without Coverage |
| Under $25,000 | 84 (85.7%) | 14 (14.3%) |
| $25,000 to $49,999 | 364 (100.0%) | 0 (0.0%) |
| $50,000 to $74,999 | 375 (93.5%) | 26 (6.5%) |
| $75,000 to $99,999 | 554 (78.8%) | 149 (21.2%) |
| $100,000 and over | 7,436 (98.6%) | 109 (1.4%) |
Public vs Private Health Insurance Coverage by Age in Hawthorn Woods
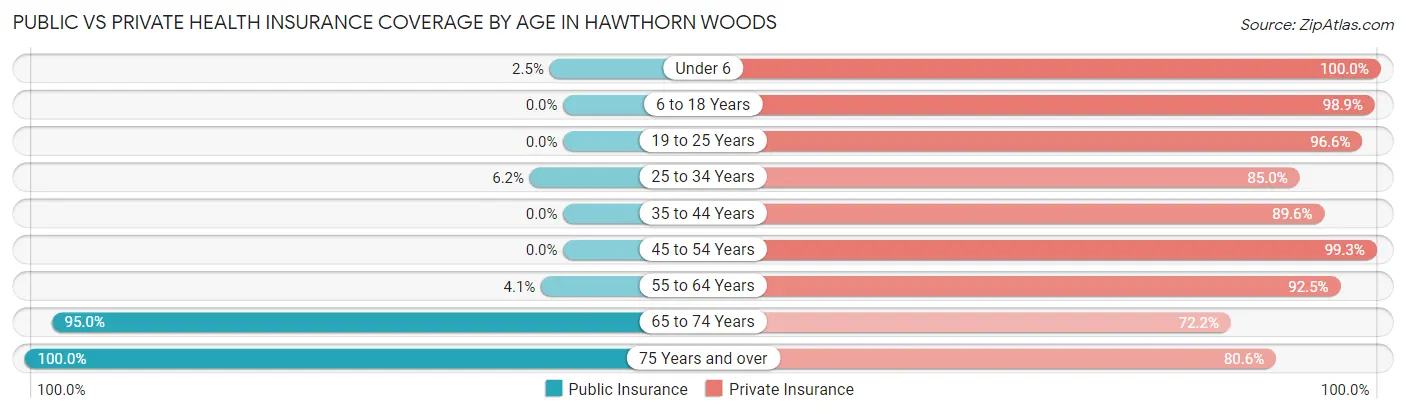
| Age Bracket | Public Insurance | Private Insurance |
| Under 6 | 17 (2.5%) | 671 (100.0%) |
| 6 to 18 Years | 0 (0.0%) | 2,147 (98.9%) |
| 19 to 25 Years | 0 (0.0%) | 400 (96.6%) |
| 25 to 34 Years | 46 (6.2%) | 628 (85.0%) |
| 35 to 44 Years | 0 (0.0%) | 1,082 (89.6%) |
| 45 to 54 Years | 0 (0.0%) | 1,508 (99.3%) |
| 55 to 64 Years | 60 (4.1%) | 1,352 (92.5%) |
| 65 to 74 Years | 721 (95.0%) | 548 (72.2%) |
| 75 Years and over | 170 (100.0%) | 137 (80.6%) |
| Total | 1,014 (11.1%) | 8,473 (93.0%) |
Disability Status by Sex by Age in Hawthorn Woods
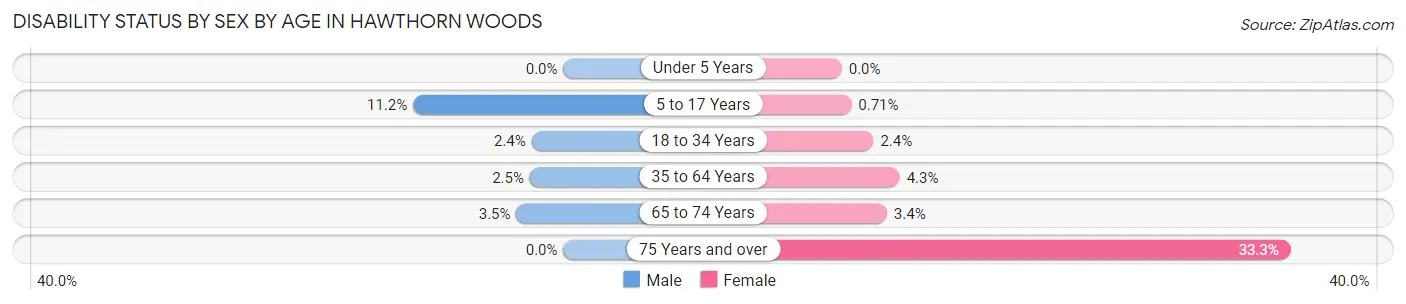
| Age Bracket | Male | Female |
| Under 5 Years | 0 (0.0%) | 0 (0.0%) |
| 5 to 17 Years | 120 (11.2%) | 8 (0.7%) |
| 18 to 34 Years | 15 (2.4%) | 16 (2.4%) |
| 35 to 64 Years | 54 (2.5%) | 87 (4.3%) |
| 65 to 74 Years | 14 (3.5%) | 12 (3.4%) |
| 75 Years and over | 0 (0.0%) | 43 (33.3%) |
Disability Class by Sex by Age in Hawthorn Woods
Disability Class: Hearing Difficulty
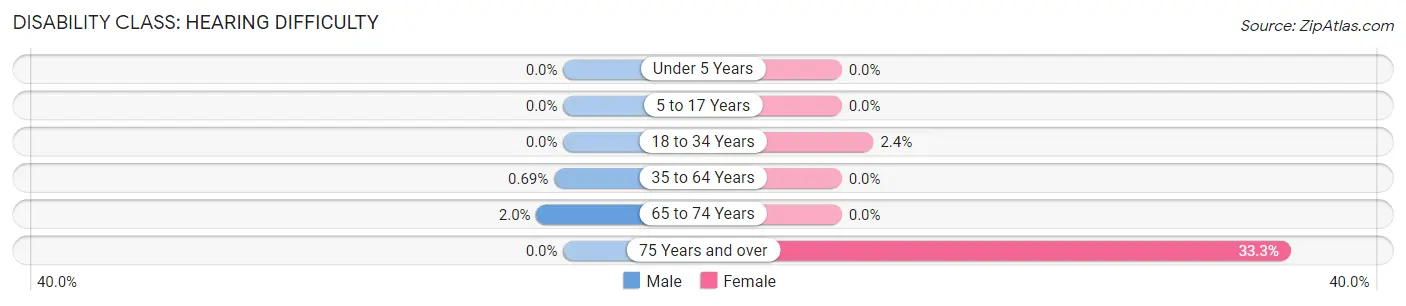
| Age Bracket | Male | Female |
| Under 5 Years | 0 (0.0%) | 0 (0.0%) |
| 5 to 17 Years | 0 (0.0%) | 0 (0.0%) |
| 18 to 34 Years | 0 (0.0%) | 16 (2.4%) |
| 35 to 64 Years | 15 (0.7%) | 0 (0.0%) |
| 65 to 74 Years | 8 (2.0%) | 0 (0.0%) |
| 75 Years and over | 0 (0.0%) | 43 (33.3%) |
Disability Class: Vision Difficulty
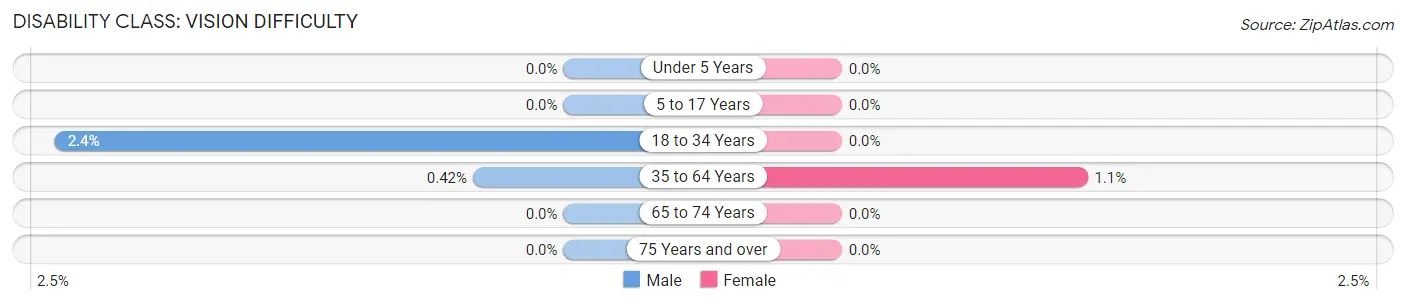
| Age Bracket | Male | Female |
| Under 5 Years | 0 (0.0%) | 0 (0.0%) |
| 5 to 17 Years | 0 (0.0%) | 0 (0.0%) |
| 18 to 34 Years | 15 (2.4%) | 0 (0.0%) |
| 35 to 64 Years | 9 (0.4%) | 23 (1.1%) |
| 65 to 74 Years | 0 (0.0%) | 0 (0.0%) |
| 75 Years and over | 0 (0.0%) | 0 (0.0%) |
Disability Class: Cognitive Difficulty
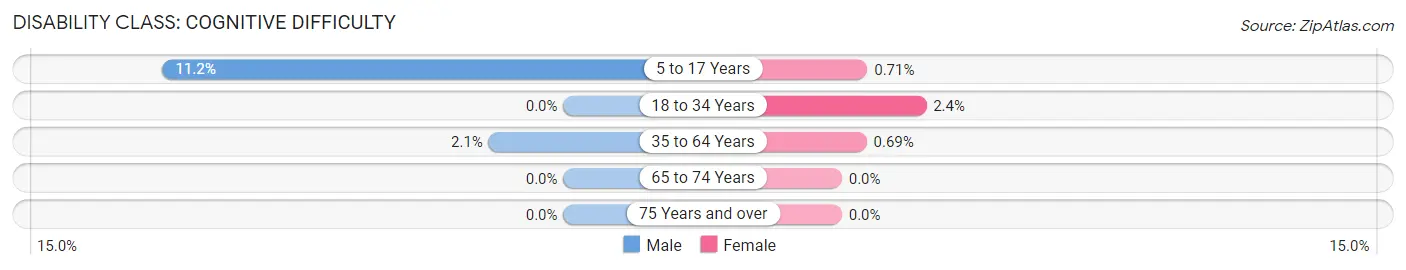
| Age Bracket | Male | Female |
| 5 to 17 Years | 120 (11.2%) | 8 (0.7%) |
| 18 to 34 Years | 0 (0.0%) | 16 (2.4%) |
| 35 to 64 Years | 45 (2.1%) | 14 (0.7%) |
| 65 to 74 Years | 0 (0.0%) | 0 (0.0%) |
| 75 Years and over | 0 (0.0%) | 0 (0.0%) |
Disability Class: Ambulatory Difficulty
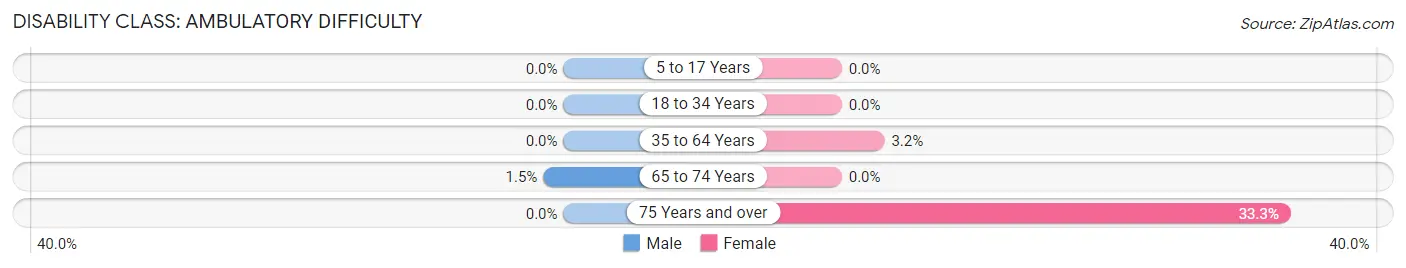
| Age Bracket | Male | Female |
| 5 to 17 Years | 0 (0.0%) | 0 (0.0%) |
| 18 to 34 Years | 0 (0.0%) | 0 (0.0%) |
| 35 to 64 Years | 0 (0.0%) | 64 (3.2%) |
| 65 to 74 Years | 6 (1.5%) | 0 (0.0%) |
| 75 Years and over | 0 (0.0%) | 43 (33.3%) |
Disability Class: Self-Care Difficulty
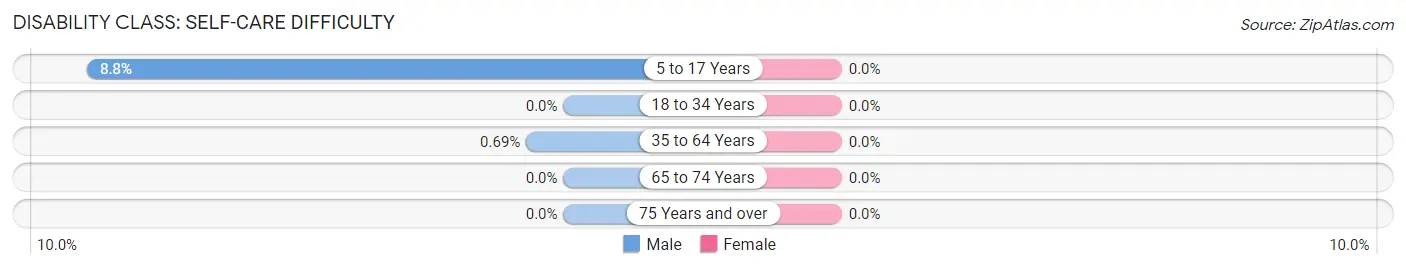
| Age Bracket | Male | Female |
| 5 to 17 Years | 95 (8.8%) | 0 (0.0%) |
| 18 to 34 Years | 0 (0.0%) | 0 (0.0%) |
| 35 to 64 Years | 15 (0.7%) | 0 (0.0%) |
| 65 to 74 Years | 0 (0.0%) | 0 (0.0%) |
| 75 Years and over | 0 (0.0%) | 0 (0.0%) |
Technology Access in Hawthorn Woods
Computing Device Access in Hawthorn Woods
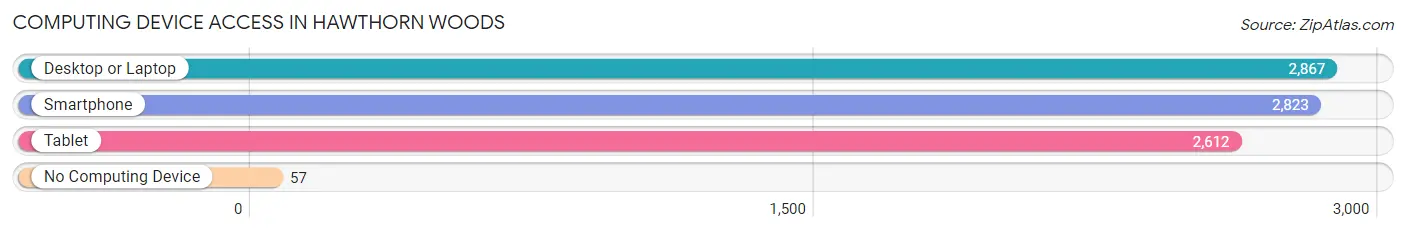
| Device Type | # Households | % Households |
| Desktop or Laptop | 2,867 | 97.7% |
| Smartphone | 2,823 | 96.2% |
| Tablet | 2,612 | 89.0% |
| No Computing Device | 57 | 1.9% |
| Total | 2,936 | 100.0% |
Internet Access in Hawthorn Woods
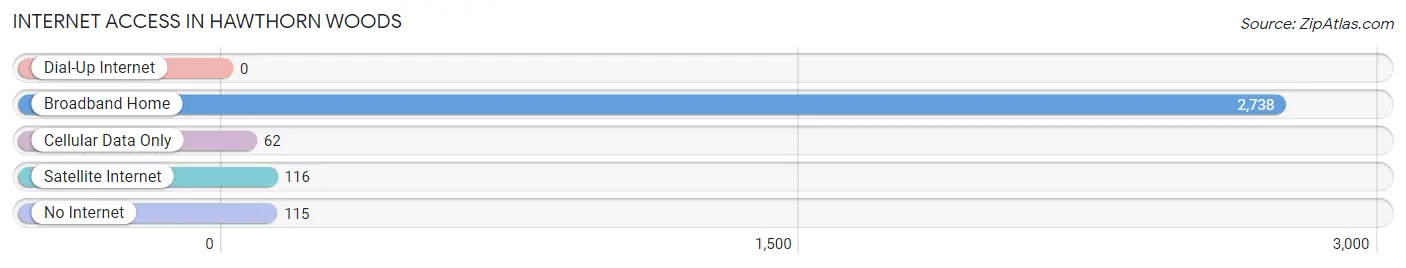
| Internet Type | # Households | % Households |
| Dial-Up Internet | 0 | 0.0% |
| Broadband Home | 2,738 | 93.3% |
| Cellular Data Only | 62 | 2.1% |
| Satellite Internet | 116 | 4.0% |
| No Internet | 115 | 3.9% |
| Total | 2,936 | 100.0% |
Hawthorn Woods Summary
Hawthorn Woods is a village located in Lake County, Illinois, United States. The population was 7,663 at the 2010 census. The village is a northern suburb of Chicago and is located approximately 35 miles northwest of the city's downtown.
History
The area that is now Hawthorn Woods was first settled in the early 19th century. The first settlers were German immigrants who arrived in the area in the 1830s. The village was originally known as "Hainesville" after the first settler, John Haines. The village was later renamed "Hawthorn Woods" in the late 19th century.
The village was officially incorporated in 1958. The village was originally a rural farming community, but has since become a suburban bedroom community for Chicago.
Geography
Hawthorn Woods is located in northeastern Lake County at 42°14′N 88°4′W (42.23, -88.07). It is bordered to the north by Lake County Forest Preserve District land, to the east by the village of Long Grove, to the south by the village of Kildeer, and to the west by the village of Lake Zurich.
According to the 2010 census, Hawthorn Woods has a total area of 8.3 square miles (21.5 km2), of which 8.2 square miles (21.3 km2) is land and 0.1 square miles (0.2 km2) is water.
Economy
Hawthorn Woods is a primarily residential community, with no major employers located within the village. The village is home to several small businesses, including a few restaurants, a golf course, and a few retail stores.
The village is also home to several corporate headquarters, including the headquarters of the American Academy of Pediatrics, the American College of Cardiology, and the American Society of Anesthesiologists.
Demographics
As of the 2010 census, there were 7,663 people, 2,717 households, and 2,220 families residing in the village. The population density was 931.3 people per square mile (359.2/km2). There were 2,845 housing units at an average density of 346.7 per square mile (133.9/km2). The racial makeup of the village was 92.2% White, 1.2% African American, 0.1% Native American, 4.7% Asian, 0.7% from other races, and 1.1% from two or more races. Hispanic or Latino of any race were 3.2% of the population.
There were 2,717 households, out of which 43.2% had children under the age of 18 living with them, 73.2% were married couples living together, 5.7% had a female householder with no husband present, and 18.7% were non-families. 15.2% of all households were made up of individuals, and 5.2% had someone living alone who was 65 years of age or older. The average household size was 2.82 and the average family size was 3.17.
In the village, the population was spread out, with 30.2% under the age of 18, 4.3% from 18 to 24, 28.2% from 25 to 44, 28.2% from 45 to 64, and 9.1% who were 65 years of age or older. The median age was 39 years. For every 100 females, there were 97.2 males. For every 100 females age 18 and over, there were 94.2 males.
The median income for a household in the village was $118,945, and the median income for a family was $128,945. Males had a median income of $90,000 versus $50,000 for females. The per capita income for the village was $50,945. About 1.2% of families and 1.7% of the population were below the poverty line, including 1.7% of those under age 18 and 1.2% of those age 65 or over.
Common Questions
What is Per Capita Income in Hawthorn Woods?
Per Capita income in Hawthorn Woods is $73,851.
What is the Median Family Income in Hawthorn Woods?
Median Family Income in Hawthorn Woods is $229,844.
What is the Median Household income in Hawthorn Woods?
Median Household Income in Hawthorn Woods is $215,817.
What is Income or Wage Gap in Hawthorn Woods?
Income or Wage Gap in Hawthorn Woods is 42.1%.
Women in Hawthorn Woods earn 57.9 cents for every dollar earned by a man.
What is Inequality or Gini Index in Hawthorn Woods?
Inequality or Gini Index in Hawthorn Woods is 0.34.
What is the Total Population of Hawthorn Woods?
Total Population of Hawthorn Woods is 9,111.
What is the Total Male Population of Hawthorn Woods?
Total Male Population of Hawthorn Woods is 4,484.
What is the Total Female Population of Hawthorn Woods?
Total Female Population of Hawthorn Woods is 4,627.
What is the Ratio of Males per 100 Females in Hawthorn Woods?
There are 96.91 Males per 100 Females in Hawthorn Woods.
What is the Ratio of Females per 100 Males in Hawthorn Woods?
There are 103.19 Females per 100 Males in Hawthorn Woods.
What is the Median Population Age in Hawthorn Woods?
Median Population Age in Hawthorn Woods is 39.6 Years.
What is the Average Family Size in Hawthorn Woods
Average Family Size in Hawthorn Woods is 3.2 People.
What is the Average Household Size in Hawthorn Woods
Average Household Size in Hawthorn Woods is 3.1 People.
How Large is the Labor Force in Hawthorn Woods?
There are 4,863 People in the Labor Forcein in Hawthorn Woods.
What is the Percentage of People in the Labor Force in Hawthorn Woods?
71.9% of People are in the Labor Force in Hawthorn Woods.
What is the Unemployment Rate in Hawthorn Woods?
Unemployment Rate in Hawthorn Woods is 3.5%.