Wheaton, IL Map & Demographics
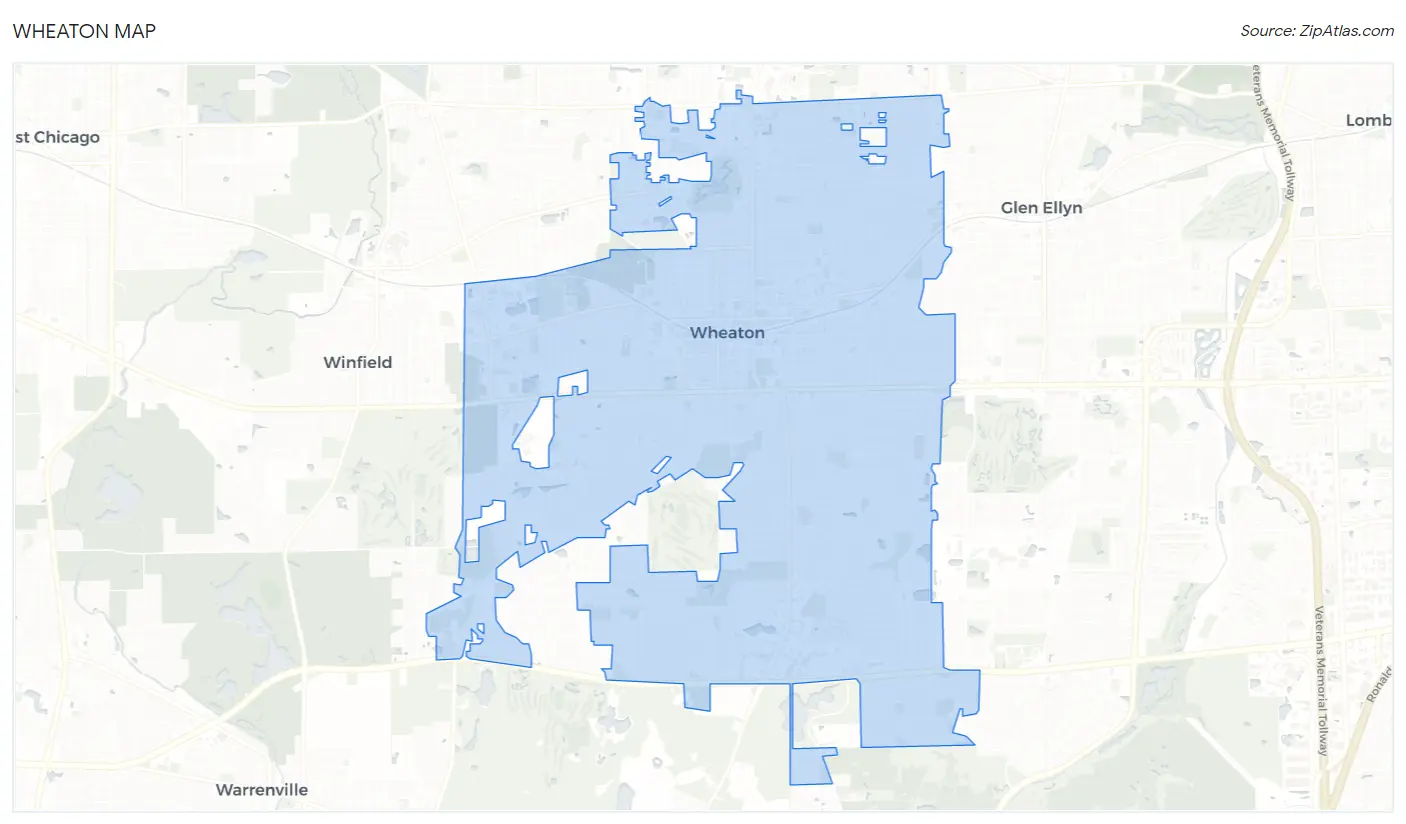
Wheaton Map
Wheaton Overview
$59,538
PER CAPITA INCOME
$144,982
AVG FAMILY INCOME
$113,523
AVG HOUSEHOLD INCOME
42.8%
WAGE / INCOME GAP [ % ]
57.2¢/ $1
WAGE / INCOME GAP [ $ ]
$12,546
FAMILY INCOME DEFICIT
0.45
INEQUALITY / GINI INDEX
53,673
TOTAL POPULATION
26,422
MALE POPULATION
27,251
FEMALE POPULATION
96.96
MALES / 100 FEMALES
103.14
FEMALES / 100 MALES
37.4
MEDIAN AGE
3.2
AVG FAMILY SIZE
2.5
AVG HOUSEHOLD SIZE
27,975
LABOR FORCE [ PEOPLE ]
64.8%
PERCENT IN LABOR FORCE
3.5%
UNEMPLOYMENT RATE
Income in Wheaton
Income Overview in Wheaton
Per Capita Income in Wheaton is $59,538, while median incomes of families and households are $144,982 and $113,523 respectively.
| Characteristic | Number | Measure |
| Per Capita Income | 53,673 | $59,538 |
| Median Family Income | 13,082 | $144,982 |
| Mean Family Income | 13,082 | $192,971 |
| Median Household Income | 19,915 | $113,523 |
| Mean Household Income | 19,915 | $156,664 |
| Income Deficit | 13,082 | $12,546 |
| Wage / Income Gap (%) | 53,673 | 42.85% |
| Wage / Income Gap ($) | 53,673 | 57.15¢ per $1 |
| Gini / Inequality Index | 53,673 | 0.45 |
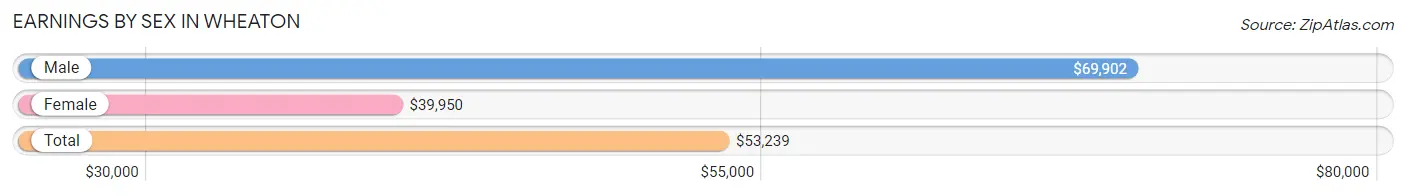
Earnings by Sex in Wheaton
Average Earnings in Wheaton are $53,239, $69,902 for men and $39,950 for women, a difference of 42.8%.
| Sex | Number | Average Earnings |
| Male | 16,286 (52.8%) | $69,902 |
| Female | 14,539 (47.2%) | $39,950 |
| Total | 30,825 (100.0%) | $53,239 |
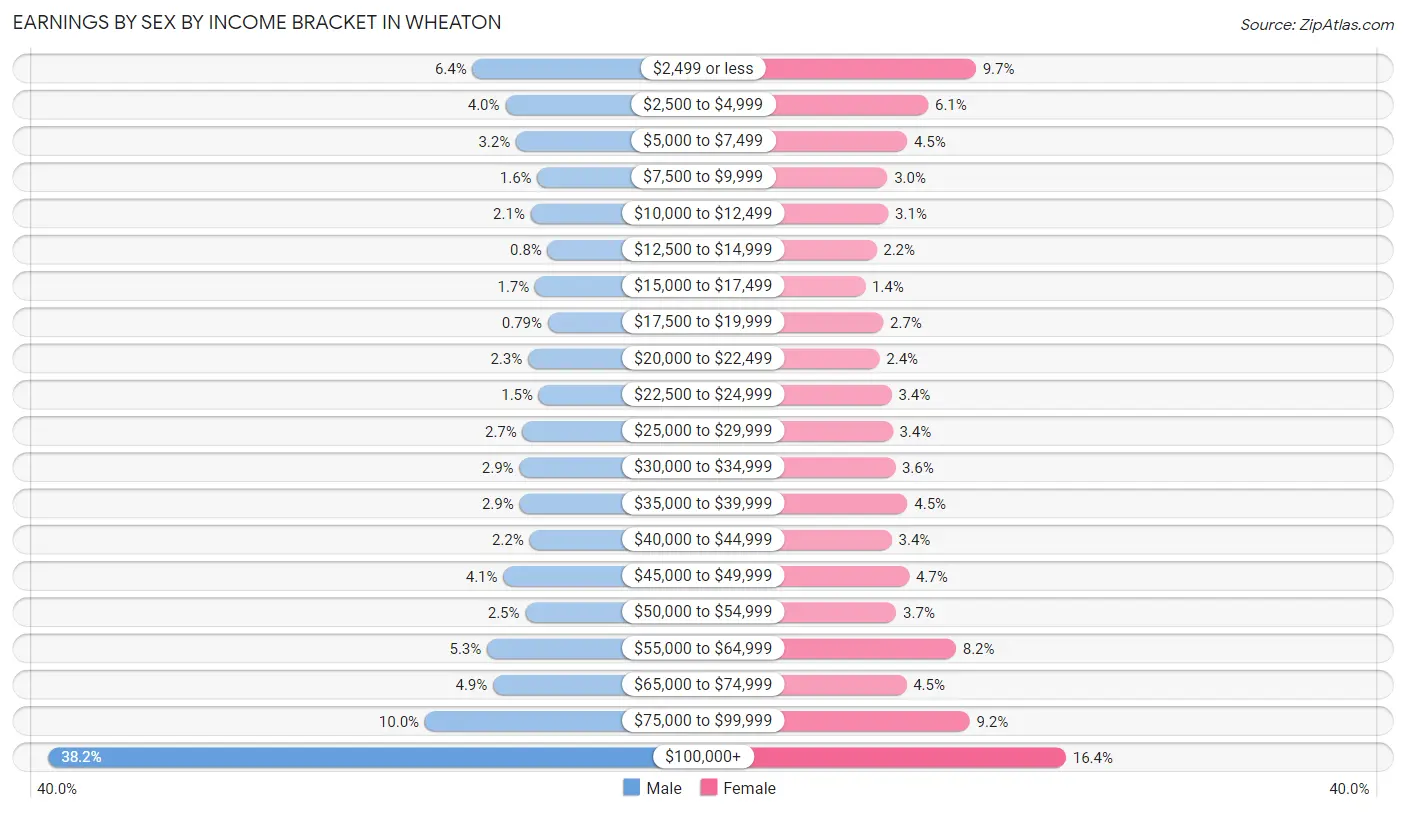
Earnings by Sex by Income Bracket in Wheaton
The most common earnings brackets in Wheaton are $100,000+ for men (6,225 | 38.2%) and $100,000+ for women (2,386 | 16.4%).
| Income | Male | Female |
| $2,499 or less | 1,048 (6.4%) | 1,405 (9.7%) |
| $2,500 to $4,999 | 647 (4.0%) | 885 (6.1%) |
| $5,000 to $7,499 | 517 (3.2%) | 656 (4.5%) |
| $7,500 to $9,999 | 256 (1.6%) | 441 (3.0%) |
| $10,000 to $12,499 | 337 (2.1%) | 450 (3.1%) |
| $12,500 to $14,999 | 131 (0.8%) | 322 (2.2%) |
| $15,000 to $17,499 | 284 (1.7%) | 198 (1.4%) |
| $17,500 to $19,999 | 129 (0.8%) | 396 (2.7%) |
| $20,000 to $22,499 | 369 (2.3%) | 355 (2.4%) |
| $22,500 to $24,999 | 237 (1.5%) | 487 (3.4%) |
| $25,000 to $29,999 | 436 (2.7%) | 497 (3.4%) |
| $30,000 to $34,999 | 476 (2.9%) | 525 (3.6%) |
| $35,000 to $39,999 | 474 (2.9%) | 660 (4.5%) |
| $40,000 to $44,999 | 351 (2.2%) | 488 (3.4%) |
| $45,000 to $49,999 | 671 (4.1%) | 678 (4.7%) |
| $50,000 to $54,999 | 403 (2.5%) | 538 (3.7%) |
| $55,000 to $64,999 | 870 (5.3%) | 1,188 (8.2%) |
| $65,000 to $74,999 | 796 (4.9%) | 647 (4.4%) |
| $75,000 to $99,999 | 1,629 (10.0%) | 1,337 (9.2%) |
| $100,000+ | 6,225 (38.2%) | 2,386 (16.4%) |
| Total | 16,286 (100.0%) | 14,539 (100.0%) |
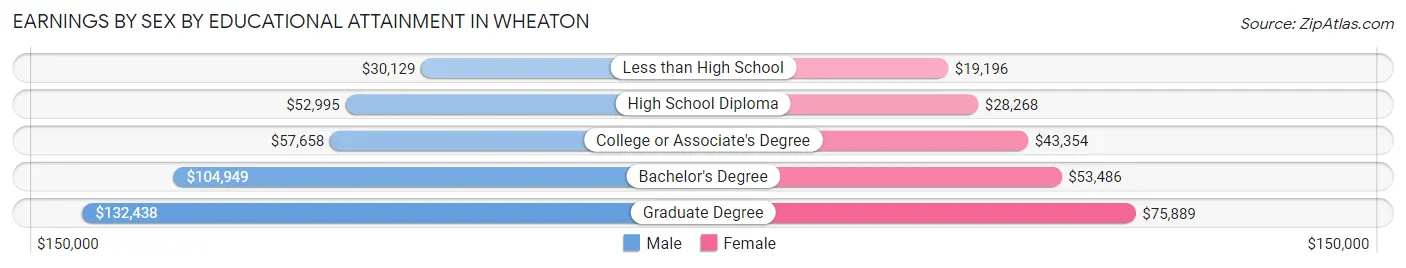
Earnings by Sex by Educational Attainment in Wheaton
Average earnings in Wheaton are $91,197 for men and $52,013 for women, a difference of 43.0%. Men with an educational attainment of graduate degree enjoy the highest average annual earnings of $132,438, while those with less than high school education earn the least with $30,129. Women with an educational attainment of graduate degree earn the most with the average annual earnings of $75,889, while those with less than high school education have the smallest earnings of $19,196.
| Educational Attainment | Male Income | Female Income |
| Less than High School | $30,129 | $19,196 |
| High School Diploma | $52,995 | $28,268 |
| College or Associate's Degree | $57,658 | $43,354 |
| Bachelor's Degree | $104,949 | $53,486 |
| Graduate Degree | $132,438 | $75,889 |
| Total | $91,197 | $52,013 |
Family Income in Wheaton
Family Income Brackets in Wheaton
According to the Wheaton family income data, there are 4,069 families falling into the $200,000+ income range, which is the most common income bracket and makes up 31.1% of all families. Conversely, the $10,000 to $14,999 income bracket is the least frequent group with only 65 families (0.5%) belonging to this category.
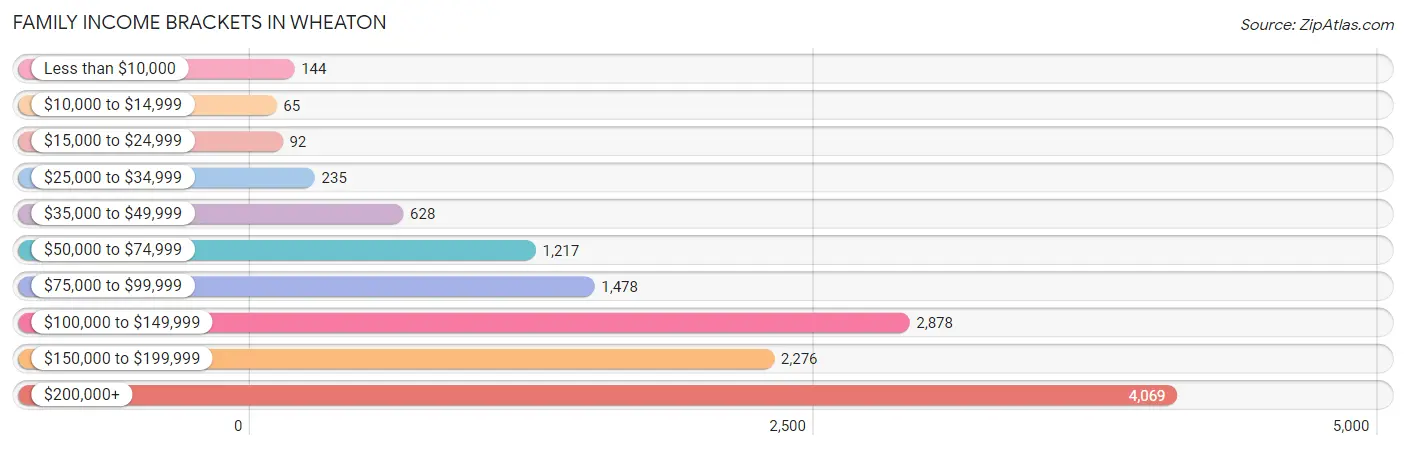
| Income Bracket | # Families | % Families |
| Less than $10,000 | 144 | 1.1% |
| $10,000 to $14,999 | 65 | 0.5% |
| $15,000 to $24,999 | 92 | 0.7% |
| $25,000 to $34,999 | 235 | 1.8% |
| $35,000 to $49,999 | 628 | 4.8% |
| $50,000 to $74,999 | 1,217 | 9.3% |
| $75,000 to $99,999 | 1,478 | 11.3% |
| $100,000 to $149,999 | 2,878 | 22.0% |
| $150,000 to $199,999 | 2,276 | 17.4% |
| $200,000+ | 4,069 | 31.1% |
Family Income by Famaliy Size in Wheaton
5-person families (1,563 | 11.9%) account for the highest median family income in Wheaton with $182,528 per family, while 2-person families (5,904 | 45.1%) have the highest median income of $61,923 per family member.
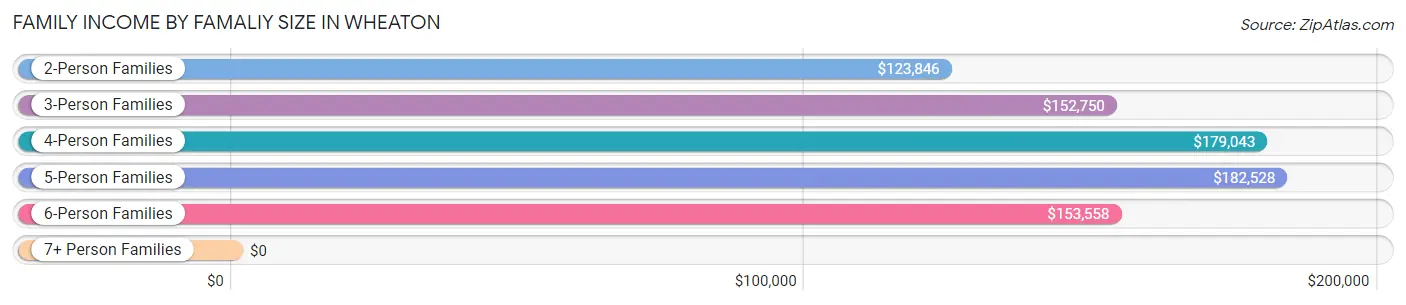
| Income Bracket | # Families | Median Income |
| 2-Person Families | 5,904 (45.1%) | $123,846 |
| 3-Person Families | 2,656 (20.3%) | $152,750 |
| 4-Person Families | 2,538 (19.4%) | $179,043 |
| 5-Person Families | 1,563 (11.9%) | $182,528 |
| 6-Person Families | 279 (2.1%) | $153,558 |
| 7+ Person Families | 142 (1.1%) | $0 |
| Total | 13,082 (100.0%) | $144,982 |
Family Income by Number of Earners in Wheaton
The median family income in Wheaton is $144,982, with families comprising 2 earners (6,295) having the highest median family income of $173,497, while families with no earners (1,363) have the lowest median family income of $95,951, accounting for 48.1% and 10.4% of families, respectively.
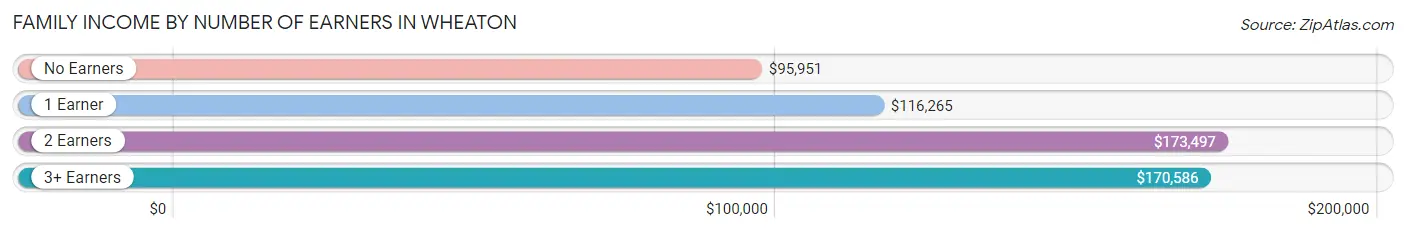
| Number of Earners | # Families | Median Income |
| No Earners | 1,363 (10.4%) | $95,951 |
| 1 Earner | 3,727 (28.5%) | $116,265 |
| 2 Earners | 6,295 (48.1%) | $173,497 |
| 3+ Earners | 1,697 (13.0%) | $170,586 |
| Total | 13,082 (100.0%) | $144,982 |
Household Income in Wheaton
Household Income Brackets in Wheaton
With 4,600 households falling in the category, the $200,000+ income range is the most frequent in Wheaton, accounting for 23.1% of all households. In contrast, only 279 households (1.4%) fall into the $10,000 to $14,999 income bracket, making it the least populous group.
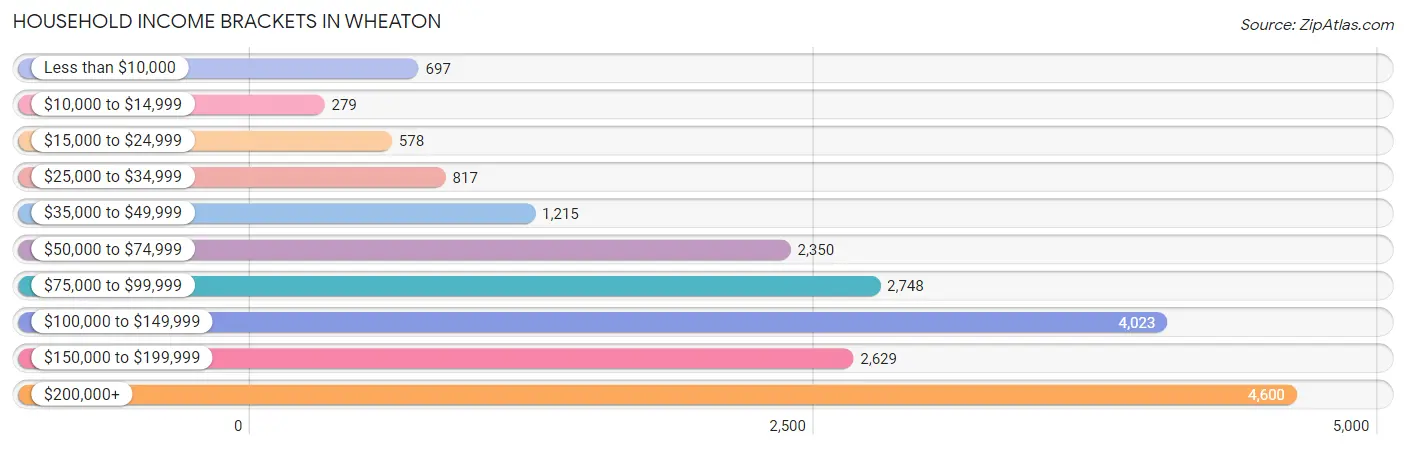
| Income Bracket | # Households | % Households |
| Less than $10,000 | 697 | 3.5% |
| $10,000 to $14,999 | 279 | 1.4% |
| $15,000 to $24,999 | 578 | 2.9% |
| $25,000 to $34,999 | 817 | 4.1% |
| $35,000 to $49,999 | 1,215 | 6.1% |
| $50,000 to $74,999 | 2,350 | 11.8% |
| $75,000 to $99,999 | 2,748 | 13.8% |
| $100,000 to $149,999 | 4,023 | 20.2% |
| $150,000 to $199,999 | 2,629 | 13.2% |
| $200,000+ | 4,600 | 23.1% |
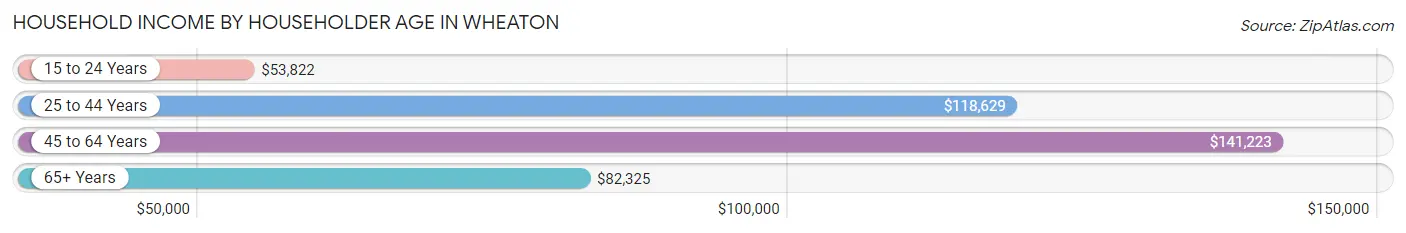
Household Income by Householder Age in Wheaton
The median household income in Wheaton is $113,523, with the highest median household income of $141,223 found in the 45 to 64 years age bracket for the primary householder. A total of 7,458 households (37.4%) fall into this category. Meanwhile, the 15 to 24 years age bracket for the primary householder has the lowest median household income of $53,822, with 537 households (2.7%) in this group.
| Income Bracket | # Households | Median Income |
| 15 to 24 Years | 537 (2.7%) | $53,822 |
| 25 to 44 Years | 6,382 (32.1%) | $118,629 |
| 45 to 64 Years | 7,458 (37.4%) | $141,223 |
| 65+ Years | 5,538 (27.8%) | $82,325 |
| Total | 19,915 (100.0%) | $113,523 |
Poverty in Wheaton
Income Below Poverty by Sex and Age in Wheaton
With 4.4% poverty level for males and 6.8% for females among the residents of Wheaton, 18 to 24 year old males and 18 to 24 year old females are the most vulnerable to poverty, with 186 males (9.6%) and 356 females (16.6%) in their respective age groups living below the poverty level.
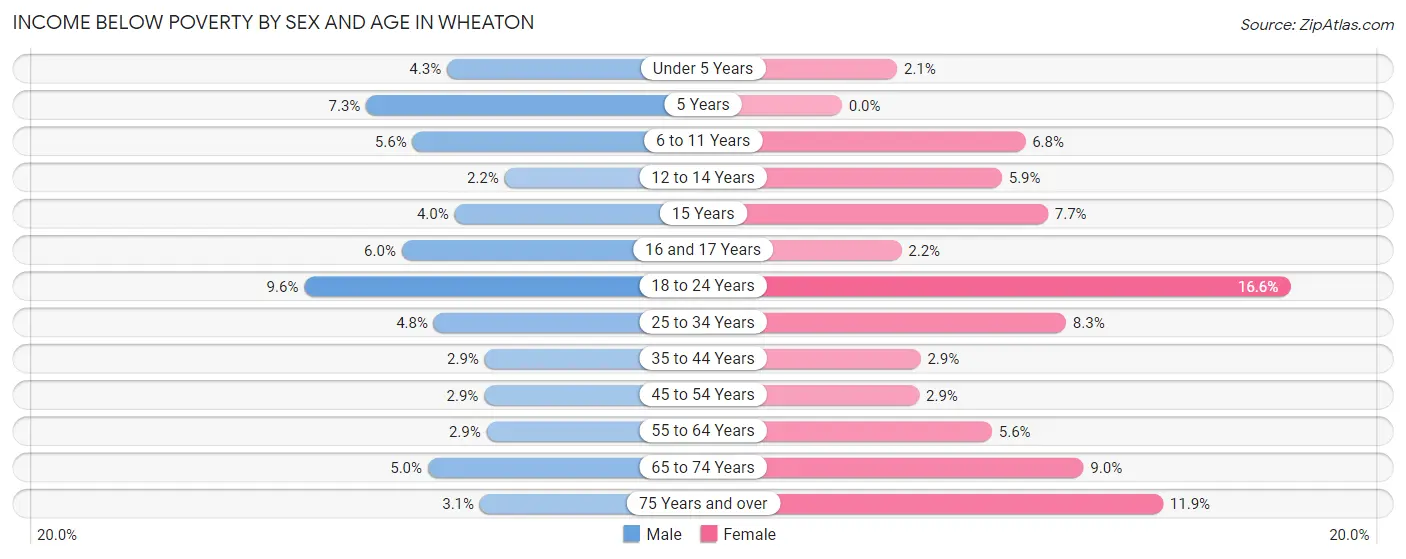
| Age Bracket | Male | Female |
| Under 5 Years | 73 (4.3%) | 30 (2.1%) |
| 5 Years | 23 (7.3%) | 0 (0.0%) |
| 6 to 11 Years | 136 (5.6%) | 120 (6.8%) |
| 12 to 14 Years | 21 (2.2%) | 62 (5.9%) |
| 15 Years | 13 (4.0%) | 15 (7.6%) |
| 16 and 17 Years | 46 (6.0%) | 17 (2.2%) |
| 18 to 24 Years | 186 (9.6%) | 356 (16.6%) |
| 25 to 34 Years | 156 (4.8%) | 286 (8.3%) |
| 35 to 44 Years | 90 (2.9%) | 94 (2.9%) |
| 45 to 54 Years | 92 (2.9%) | 86 (2.9%) |
| 55 to 64 Years | 92 (2.9%) | 208 (5.6%) |
| 65 to 74 Years | 128 (5.0%) | 246 (9.0%) |
| 75 Years and over | 37 (3.1%) | 236 (11.9%) |
| Total | 1,093 (4.4%) | 1,756 (6.8%) |
Income Above Poverty by Sex and Age in Wheaton
According to the poverty statistics in Wheaton, males aged 12 to 14 years and females aged 5 years are the age groups that are most secure financially, with 97.8% of males and 100.0% of females in these age groups living above the poverty line.
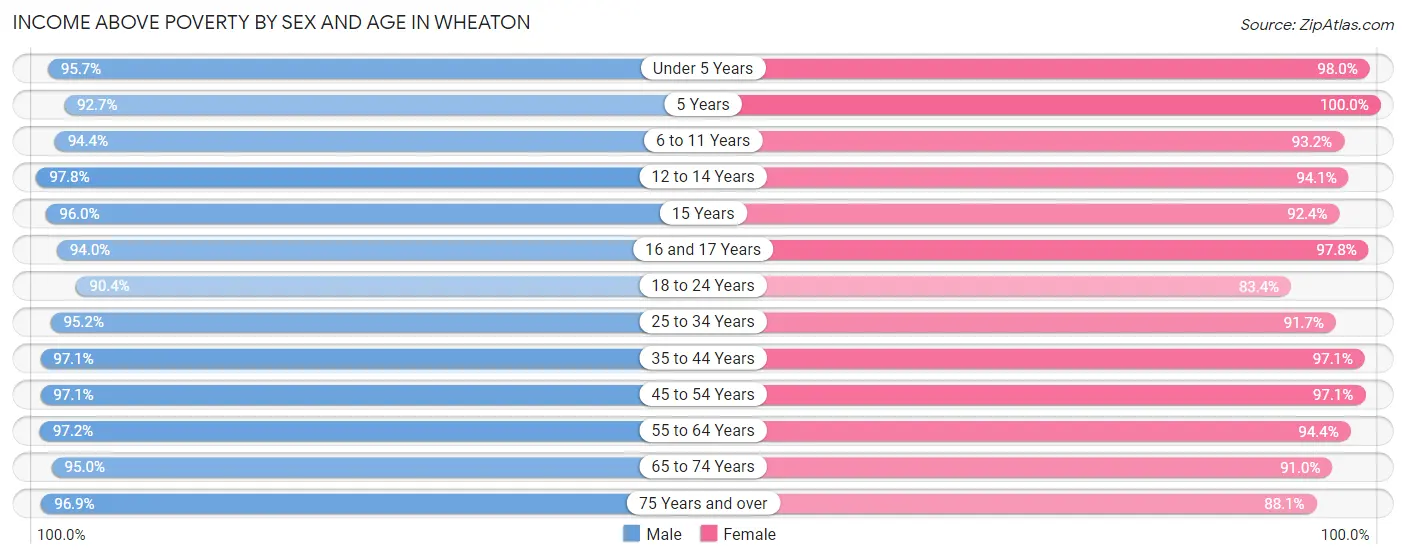
| Age Bracket | Male | Female |
| Under 5 Years | 1,616 (95.7%) | 1,434 (98.0%) |
| 5 Years | 291 (92.7%) | 220 (100.0%) |
| 6 to 11 Years | 2,293 (94.4%) | 1,641 (93.2%) |
| 12 to 14 Years | 943 (97.8%) | 981 (94.1%) |
| 15 Years | 309 (96.0%) | 181 (92.3%) |
| 16 and 17 Years | 721 (94.0%) | 753 (97.8%) |
| 18 to 24 Years | 1,748 (90.4%) | 1,784 (83.4%) |
| 25 to 34 Years | 3,084 (95.2%) | 3,153 (91.7%) |
| 35 to 44 Years | 2,991 (97.1%) | 3,124 (97.1%) |
| 45 to 54 Years | 3,037 (97.1%) | 2,911 (97.1%) |
| 55 to 64 Years | 3,140 (97.2%) | 3,527 (94.4%) |
| 65 to 74 Years | 2,416 (95.0%) | 2,495 (91.0%) |
| 75 Years and over | 1,156 (96.9%) | 1,744 (88.1%) |
| Total | 23,745 (95.6%) | 23,948 (93.2%) |
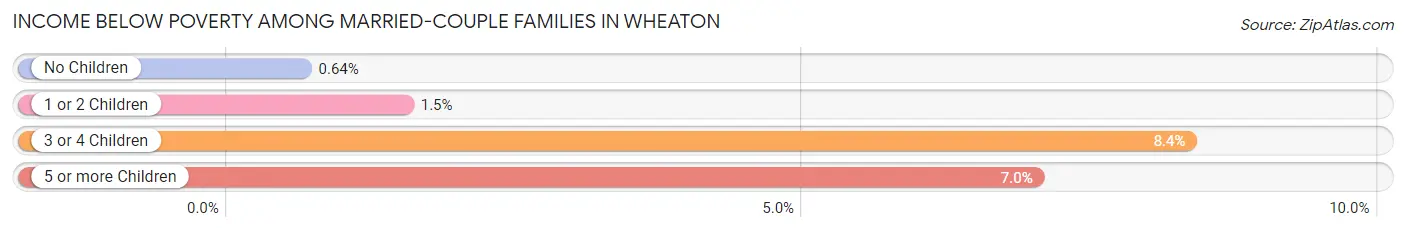
Income Below Poverty Among Married-Couple Families in Wheaton
The poverty statistics for married-couple families in Wheaton show that 1.8% or 209 of the total 11,394 families live below the poverty line. Families with 3 or 4 children have the highest poverty rate of 8.4%, comprising of 102 families. On the other hand, families with no children have the lowest poverty rate of 0.6%, which includes 39 families.
| Children | Above Poverty | Below Poverty |
| No Children | 6,092 (99.4%) | 39 (0.6%) |
| 1 or 2 Children | 3,868 (98.5%) | 60 (1.5%) |
| 3 or 4 Children | 1,119 (91.6%) | 102 (8.4%) |
| 5 or more Children | 106 (93.0%) | 8 (7.0%) |
| Total | 11,185 (98.2%) | 209 (1.8%) |
Income Below Poverty Among Single-Parent Households in Wheaton
According to the poverty data in Wheaton, 11.7% or 56 single-father households and 7.9% or 95 single-mother households are living below the poverty line. Among single-father households, those with 1 or 2 children have the highest poverty rate, with 39 households (23.5%) experiencing poverty. Likewise, among single-mother households, those with 3 or 4 children have the highest poverty rate, with 13 households (11.7%) falling below the poverty line.
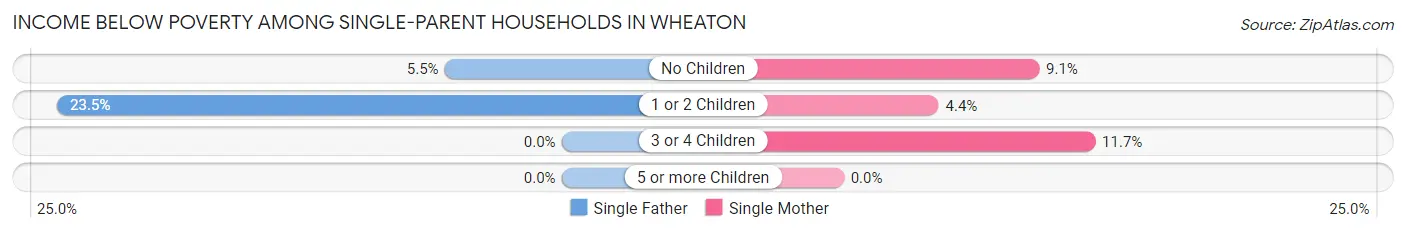
| Children | Single Father | Single Mother |
| No Children | 17 (5.4%) | 65 (9.1%) |
| 1 or 2 Children | 39 (23.5%) | 17 (4.4%) |
| 3 or 4 Children | 0 (0.0%) | 13 (11.7%) |
| 5 or more Children | 0 (0.0%) | 0 (0.0%) |
| Total | 56 (11.7%) | 95 (7.9%) |
Income Below Poverty Among Married-Couple vs Single-Parent Households in Wheaton
The poverty data for Wheaton shows that 209 of the married-couple family households (1.8%) and 151 of the single-parent households (8.9%) are living below the poverty level. Within the married-couple family households, those with 3 or 4 children have the highest poverty rate, with 102 households (8.4%) falling below the poverty line. Among the single-parent households, those with 3 or 4 children have the highest poverty rate, with 13 household (11.7%) living below poverty.
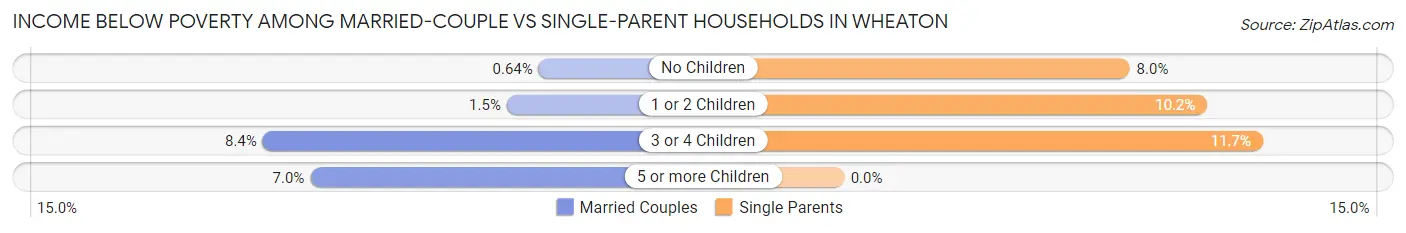
| Children | Married-Couple Families | Single-Parent Households |
| No Children | 39 (0.6%) | 82 (8.0%) |
| 1 or 2 Children | 60 (1.5%) | 56 (10.2%) |
| 3 or 4 Children | 102 (8.4%) | 13 (11.7%) |
| 5 or more Children | 8 (7.0%) | 0 (0.0%) |
| Total | 209 (1.8%) | 151 (8.9%) |
Race in Wheaton
The most populous races in Wheaton are White / Caucasian (43,568 | 81.2%), Hispanic or Latino (4,081 | 7.6%), and Two or more Races (3,731 | 7.0%).
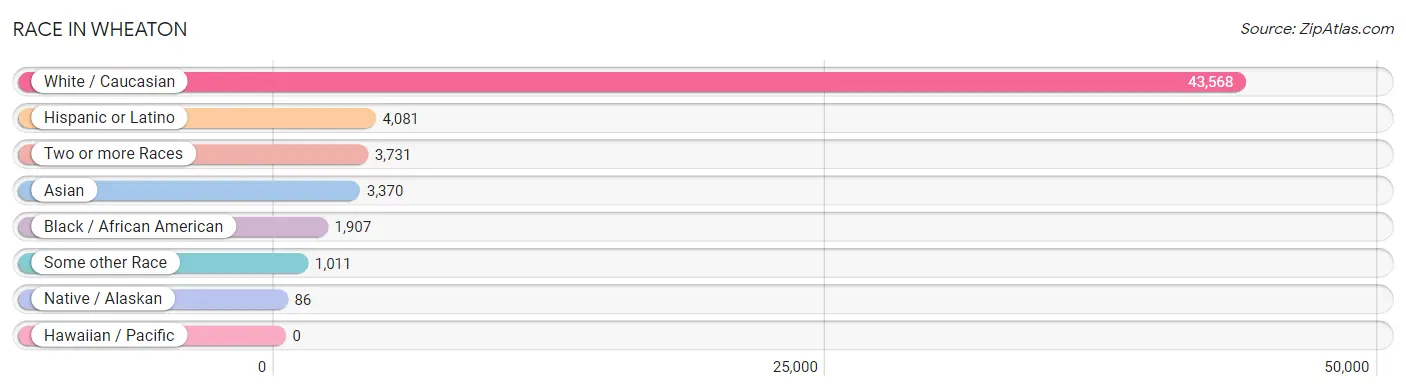
| Race | # Population | % Population |
| Asian | 3,370 | 6.3% |
| Black / African American | 1,907 | 3.5% |
| Hawaiian / Pacific | 0 | 0.0% |
| Hispanic or Latino | 4,081 | 7.6% |
| Native / Alaskan | 86 | 0.2% |
| White / Caucasian | 43,568 | 81.2% |
| Two or more Races | 3,731 | 7.0% |
| Some other Race | 1,011 | 1.9% |
| Total | 53,673 | 100.0% |
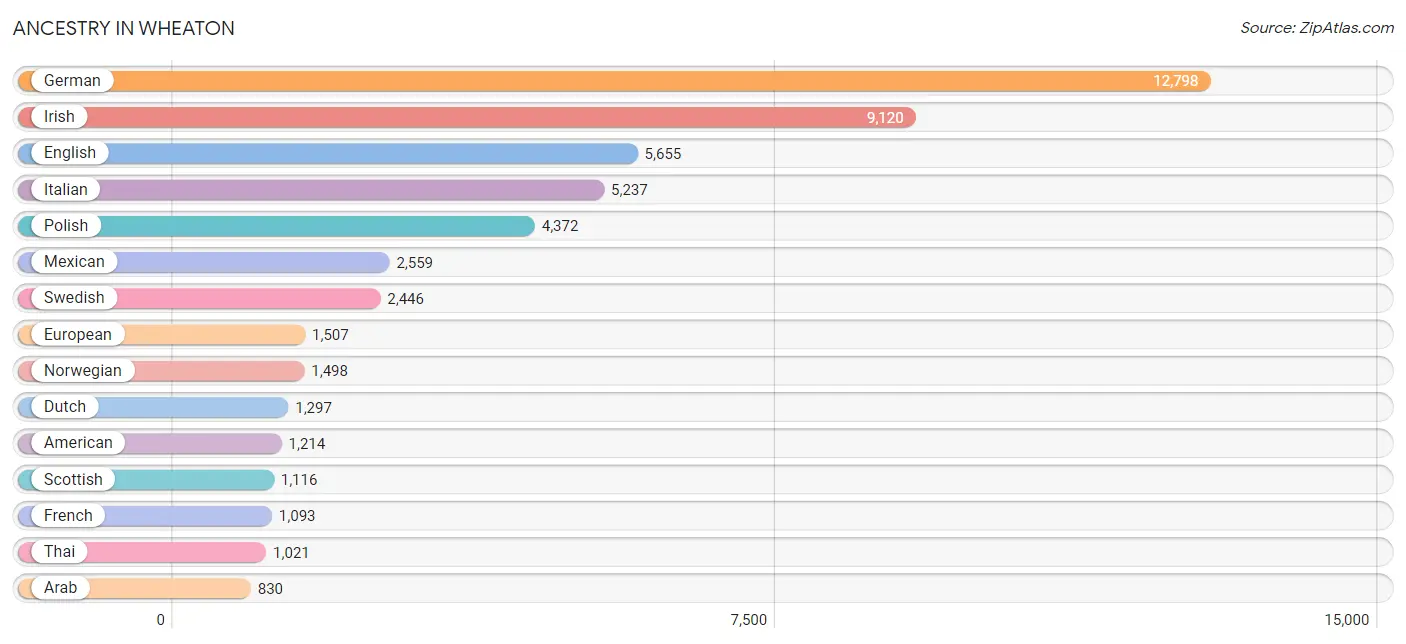
Ancestry in Wheaton
The most populous ancestries reported in Wheaton are German (12,798 | 23.8%), Irish (9,120 | 17.0%), English (5,655 | 10.5%), Italian (5,237 | 9.8%), and Polish (4,372 | 8.2%), together accounting for 69.3% of all Wheaton residents.
| Ancestry | # Population | % Population |
| African | 141 | 0.3% |
| Alaskan Athabascan | 55 | 0.1% |
| Albanian | 257 | 0.5% |
| American | 1,214 | 2.3% |
| Apache | 18 | 0.0% |
| Arab | 830 | 1.5% |
| Argentinean | 8 | 0.0% |
| Armenian | 249 | 0.5% |
| Assyrian / Chaldean / Syriac | 6 | 0.0% |
| Australian | 49 | 0.1% |
| Austrian | 308 | 0.6% |
| Belgian | 96 | 0.2% |
| Bhutanese | 133 | 0.3% |
| Blackfeet | 6 | 0.0% |
| Bolivian | 21 | 0.0% |
| Brazilian | 27 | 0.1% |
| British | 395 | 0.7% |
| Bulgarian | 70 | 0.1% |
| Burmese | 338 | 0.6% |
| Cajun | 4 | 0.0% |
| Canadian | 194 | 0.4% |
| Celtic | 9 | 0.0% |
| Central American | 534 | 1.0% |
| Central American Indian | 23 | 0.0% |
| Cherokee | 98 | 0.2% |
| Chippewa | 22 | 0.0% |
| Colombian | 113 | 0.2% |
| Croatian | 225 | 0.4% |
| Cuban | 96 | 0.2% |
| Czech | 641 | 1.2% |
| Czechoslovakian | 94 | 0.2% |
| Danish | 609 | 1.1% |
| Dominican | 34 | 0.1% |
| Dutch | 1,297 | 2.4% |
| Eastern European | 335 | 0.6% |
| Ecuadorian | 167 | 0.3% |
| Egyptian | 360 | 0.7% |
| English | 5,655 | 10.5% |
| Estonian | 5 | 0.0% |
| Ethiopian | 193 | 0.4% |
| European | 1,507 | 2.8% |
| Filipino | 54 | 0.1% |
| Finnish | 142 | 0.3% |
| French | 1,093 | 2.0% |
| French Canadian | 464 | 0.9% |
| German | 12,798 | 23.8% |
| Ghanaian | 9 | 0.0% |
| Greek | 619 | 1.1% |
| Guatemalan | 196 | 0.4% |
| Guyanese | 14 | 0.0% |
| Haitian | 11 | 0.0% |
| Honduran | 33 | 0.1% |
| Hungarian | 148 | 0.3% |
| Indian (Asian) | 648 | 1.2% |
| Indonesian | 812 | 1.5% |
| Iranian | 85 | 0.2% |
| Iraqi | 178 | 0.3% |
| Irish | 9,120 | 17.0% |
| Iroquois | 7 | 0.0% |
| Italian | 5,237 | 9.8% |
| Jamaican | 48 | 0.1% |
| Japanese | 28 | 0.1% |
| Korean | 526 | 1.0% |
| Latvian | 30 | 0.1% |
| Lebanese | 104 | 0.2% |
| Lithuanian | 420 | 0.8% |
| Luxembourger | 31 | 0.1% |
| Macedonian | 75 | 0.1% |
| Mexican | 2,559 | 4.8% |
| Mexican American Indian | 74 | 0.1% |
| Moroccan | 43 | 0.1% |
| Native Hawaiian | 91 | 0.2% |
| Nicaraguan | 174 | 0.3% |
| Nigerian | 42 | 0.1% |
| Northern European | 125 | 0.2% |
| Norwegian | 1,498 | 2.8% |
| Ottawa | 17 | 0.0% |
| Pakistani | 83 | 0.2% |
| Palestinian | 18 | 0.0% |
| Peruvian | 50 | 0.1% |
| Polish | 4,372 | 8.2% |
| Portuguese | 37 | 0.1% |
| Puerto Rican | 328 | 0.6% |
| Romanian | 96 | 0.2% |
| Russian | 317 | 0.6% |
| Salvadoran | 131 | 0.2% |
| Scandinavian | 150 | 0.3% |
| Scotch-Irish | 482 | 0.9% |
| Scottish | 1,116 | 2.1% |
| Serbian | 150 | 0.3% |
| Slavic | 63 | 0.1% |
| Slovak | 389 | 0.7% |
| Slovene | 52 | 0.1% |
| South African | 10 | 0.0% |
| South American | 413 | 0.8% |
| South American Indian | 23 | 0.0% |
| Soviet Union | 8 | 0.0% |
| Spaniard | 60 | 0.1% |
| Spanish | 17 | 0.0% |
| Sri Lankan | 236 | 0.4% |
| Subsaharan African | 410 | 0.8% |
| Swedish | 2,446 | 4.6% |
| Swiss | 339 | 0.6% |
| Taiwanese | 2 | 0.0% |
| Thai | 1,021 | 1.9% |
| Turkish | 18 | 0.0% |
| Ukrainian | 172 | 0.3% |
| Venezuelan | 54 | 0.1% |
| Welsh | 318 | 0.6% |
| West Indian | 13 | 0.0% |
| Yaqui | 4 | 0.0% |
| Yugoslavian | 70 | 0.1% |
| Zimbabwean | 15 | 0.0% | View All 113 Rows |
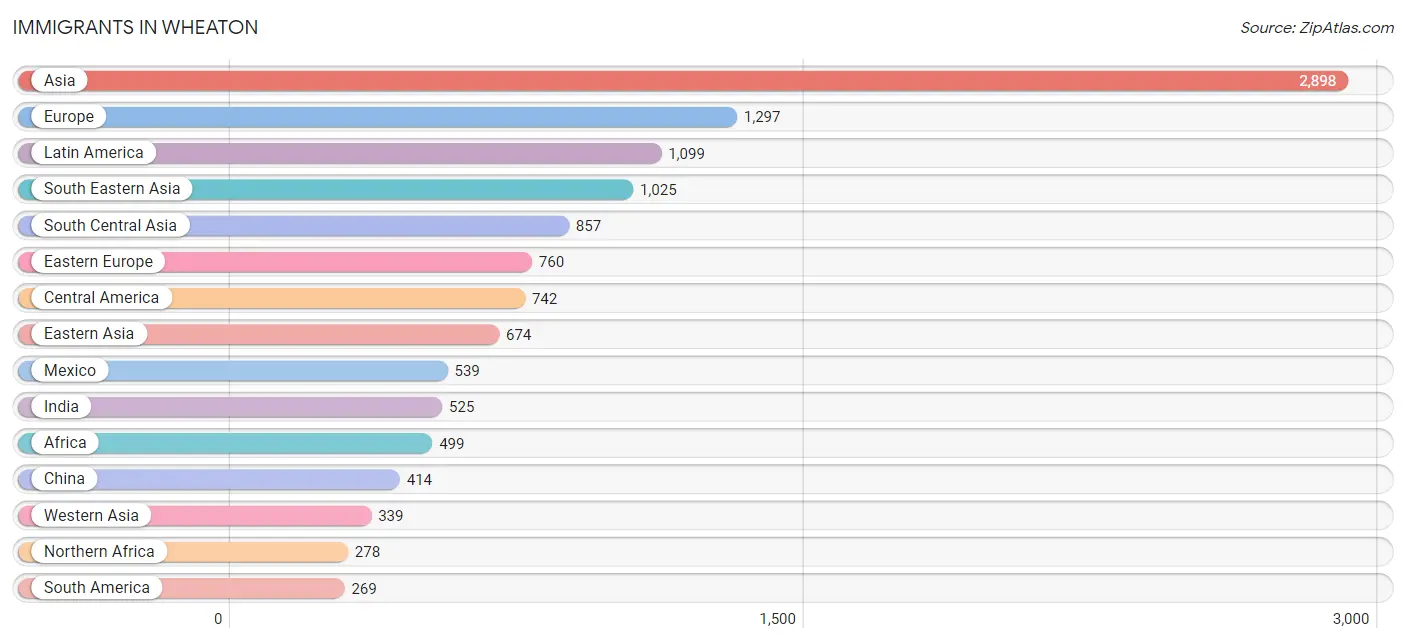
Immigrants in Wheaton
The most numerous immigrant groups reported in Wheaton came from Asia (2,898 | 5.4%), Europe (1,297 | 2.4%), Latin America (1,099 | 2.1%), South Eastern Asia (1,025 | 1.9%), and South Central Asia (857 | 1.6%), together accounting for 13.4% of all Wheaton residents.
| Immigration Origin | # Population | % Population |
| Africa | 499 | 0.9% |
| Albania | 200 | 0.4% |
| Argentina | 8 | 0.0% |
| Asia | 2,898 | 5.4% |
| Australia | 19 | 0.0% |
| Austria | 74 | 0.1% |
| Bosnia and Herzegovina | 42 | 0.1% |
| Brazil | 42 | 0.1% |
| Bulgaria | 48 | 0.1% |
| Cameroon | 9 | 0.0% |
| Canada | 95 | 0.2% |
| Caribbean | 88 | 0.2% |
| Central America | 742 | 1.4% |
| China | 414 | 0.8% |
| Colombia | 92 | 0.2% |
| Cuba | 61 | 0.1% |
| Czechoslovakia | 15 | 0.0% |
| Eastern Africa | 145 | 0.3% |
| Eastern Asia | 674 | 1.3% |
| Eastern Europe | 760 | 1.4% |
| Ecuador | 50 | 0.1% |
| Egypt | 259 | 0.5% |
| El Salvador | 64 | 0.1% |
| England | 129 | 0.2% |
| Ethiopia | 75 | 0.1% |
| Europe | 1,297 | 2.4% |
| France | 15 | 0.0% |
| Germany | 89 | 0.2% |
| Greece | 75 | 0.1% |
| Guatemala | 62 | 0.1% |
| Guyana | 14 | 0.0% |
| Haiti | 12 | 0.0% |
| Honduras | 17 | 0.0% |
| Hong Kong | 9 | 0.0% |
| India | 525 | 1.0% |
| Iran | 85 | 0.2% |
| Iraq | 238 | 0.4% |
| Ireland | 15 | 0.0% |
| Israel | 17 | 0.0% |
| Italy | 22 | 0.0% |
| Jamaica | 15 | 0.0% |
| Japan | 80 | 0.2% |
| Jordan | 6 | 0.0% |
| Kenya | 32 | 0.1% |
| Korea | 180 | 0.3% |
| Latin America | 1,099 | 2.1% |
| Latvia | 34 | 0.1% |
| Lebanon | 14 | 0.0% |
| Lithuania | 27 | 0.1% |
| Malaysia | 77 | 0.1% |
| Mexico | 539 | 1.0% |
| Middle Africa | 9 | 0.0% |
| Moldova | 29 | 0.1% |
| Morocco | 11 | 0.0% |
| Nepal | 19 | 0.0% |
| Netherlands | 18 | 0.0% |
| Nicaragua | 60 | 0.1% |
| Nigeria | 42 | 0.1% |
| North Macedonia | 30 | 0.1% |
| Northern Africa | 278 | 0.5% |
| Northern Europe | 244 | 0.4% |
| Oceania | 28 | 0.1% |
| Pakistan | 51 | 0.1% |
| Peru | 51 | 0.1% |
| Philippines | 109 | 0.2% |
| Poland | 167 | 0.3% |
| Romania | 11 | 0.0% |
| Russia | 43 | 0.1% |
| Saudi Arabia | 64 | 0.1% |
| Scotland | 29 | 0.1% |
| Serbia | 57 | 0.1% |
| South Africa | 25 | 0.1% |
| South America | 269 | 0.5% |
| South Central Asia | 857 | 1.6% |
| South Eastern Asia | 1,025 | 1.9% |
| Southern Europe | 97 | 0.2% |
| Sudan | 8 | 0.0% |
| Taiwan | 75 | 0.1% |
| Thailand | 50 | 0.1% |
| Uganda | 8 | 0.0% |
| Ukraine | 32 | 0.1% |
| Venezuela | 12 | 0.0% |
| Vietnam | 145 | 0.3% |
| Western Africa | 42 | 0.1% |
| Western Asia | 339 | 0.6% |
| Western Europe | 196 | 0.4% |
| Zimbabwe | 15 | 0.0% | View All 87 Rows |
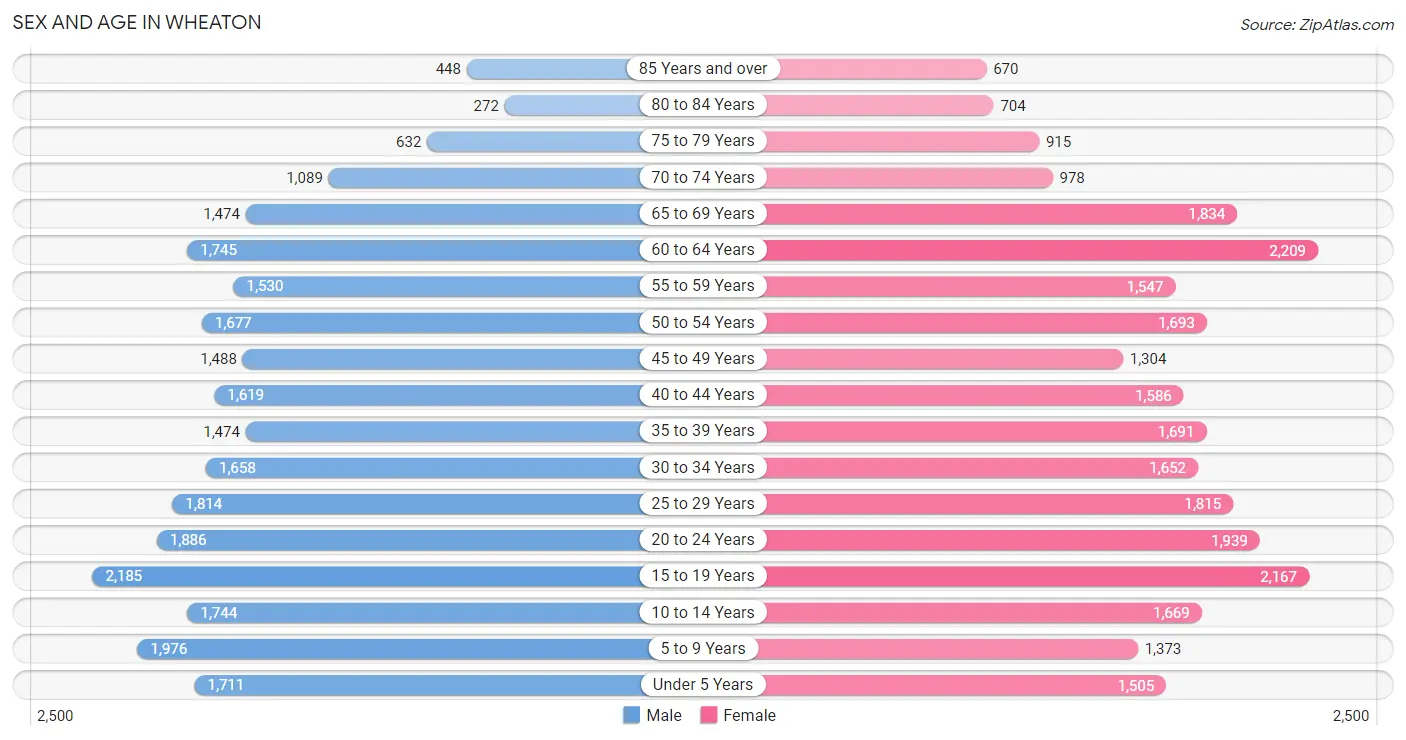
Sex and Age in Wheaton
Sex and Age in Wheaton
The most populous age groups in Wheaton are 15 to 19 Years (2,185 | 8.3%) for men and 60 to 64 Years (2,209 | 8.1%) for women.
| Age Bracket | Male | Female |
| Under 5 Years | 1,711 (6.5%) | 1,505 (5.5%) |
| 5 to 9 Years | 1,976 (7.5%) | 1,373 (5.0%) |
| 10 to 14 Years | 1,744 (6.6%) | 1,669 (6.1%) |
| 15 to 19 Years | 2,185 (8.3%) | 2,167 (8.0%) |
| 20 to 24 Years | 1,886 (7.1%) | 1,939 (7.1%) |
| 25 to 29 Years | 1,814 (6.9%) | 1,815 (6.7%) |
| 30 to 34 Years | 1,658 (6.3%) | 1,652 (6.1%) |
| 35 to 39 Years | 1,474 (5.6%) | 1,691 (6.2%) |
| 40 to 44 Years | 1,619 (6.1%) | 1,586 (5.8%) |
| 45 to 49 Years | 1,488 (5.6%) | 1,304 (4.8%) |
| 50 to 54 Years | 1,677 (6.4%) | 1,693 (6.2%) |
| 55 to 59 Years | 1,530 (5.8%) | 1,547 (5.7%) |
| 60 to 64 Years | 1,745 (6.6%) | 2,209 (8.1%) |
| 65 to 69 Years | 1,474 (5.6%) | 1,834 (6.7%) |
| 70 to 74 Years | 1,089 (4.1%) | 978 (3.6%) |
| 75 to 79 Years | 632 (2.4%) | 915 (3.4%) |
| 80 to 84 Years | 272 (1.0%) | 704 (2.6%) |
| 85 Years and over | 448 (1.7%) | 670 (2.5%) |
| Total | 26,422 (100.0%) | 27,251 (100.0%) |
Families and Households in Wheaton
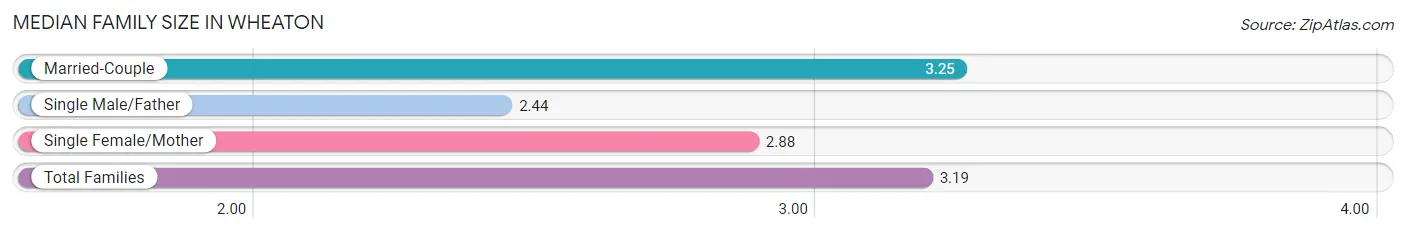
Median Family Size in Wheaton
The median family size in Wheaton is 3.19 persons per family, with married-couple families (11,394 | 87.1%) accounting for the largest median family size of 3.25 persons per family. On the other hand, single male/father families (478 | 3.6%) represent the smallest median family size with 2.44 persons per family.
| Family Type | # Families | Family Size |
| Married-Couple | 11,394 (87.1%) | 3.25 |
| Single Male/Father | 478 (3.6%) | 2.44 |
| Single Female/Mother | 1,210 (9.2%) | 2.88 |
| Total Families | 13,082 (100.0%) | 3.19 |
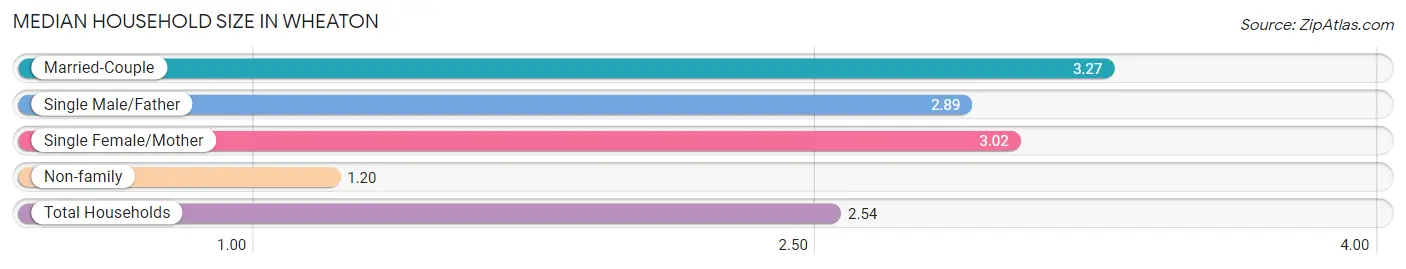
Median Household Size in Wheaton
The median household size in Wheaton is 2.54 persons per household, with married-couple households (11,394 | 57.2%) accounting for the largest median household size of 3.27 persons per household. non-family households (6,833 | 34.3%) represent the smallest median household size with 1.20 persons per household.
| Household Type | # Households | Household Size |
| Married-Couple | 11,394 (57.2%) | 3.27 |
| Single Male/Father | 478 (2.4%) | 2.89 |
| Single Female/Mother | 1,210 (6.1%) | 3.02 |
| Non-family | 6,833 (34.3%) | 1.20 |
| Total Households | 19,915 (100.0%) | 2.54 |
Household Size by Marriage Status in Wheaton
Out of a total of 19,915 households in Wheaton, 13,082 (65.7%) are family households, while 6,833 (34.3%) are nonfamily households. The most numerous type of family households are 2-person households, comprising 5,683, and the most common type of nonfamily households are 1-person households, comprising 5,709.
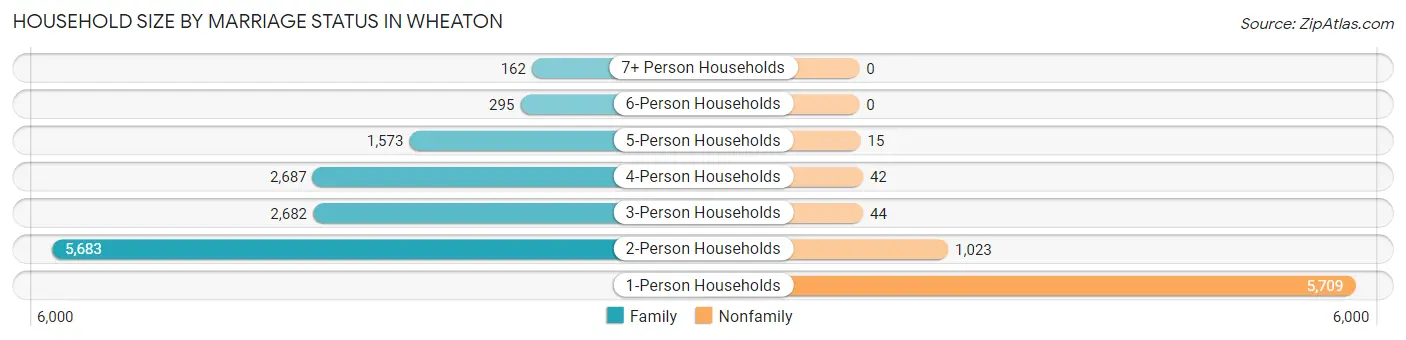
| Household Size | Family Households | Nonfamily Households |
| 1-Person Households | - | 5,709 (28.7%) |
| 2-Person Households | 5,683 (28.5%) | 1,023 (5.1%) |
| 3-Person Households | 2,682 (13.5%) | 44 (0.2%) |
| 4-Person Households | 2,687 (13.5%) | 42 (0.2%) |
| 5-Person Households | 1,573 (7.9%) | 15 (0.1%) |
| 6-Person Households | 295 (1.5%) | 0 (0.0%) |
| 7+ Person Households | 162 (0.8%) | 0 (0.0%) |
| Total | 13,082 (65.7%) | 6,833 (34.3%) |
Female Fertility in Wheaton
Fertility by Age in Wheaton
Average fertility rate in Wheaton is 57.0 births per 1,000 women. Women in the age bracket of 20 to 34 years have the highest fertility rate with 85.0 births per 1,000 women. Women in the age bracket of 20 to 34 years acount for 63.7% of all women with births.
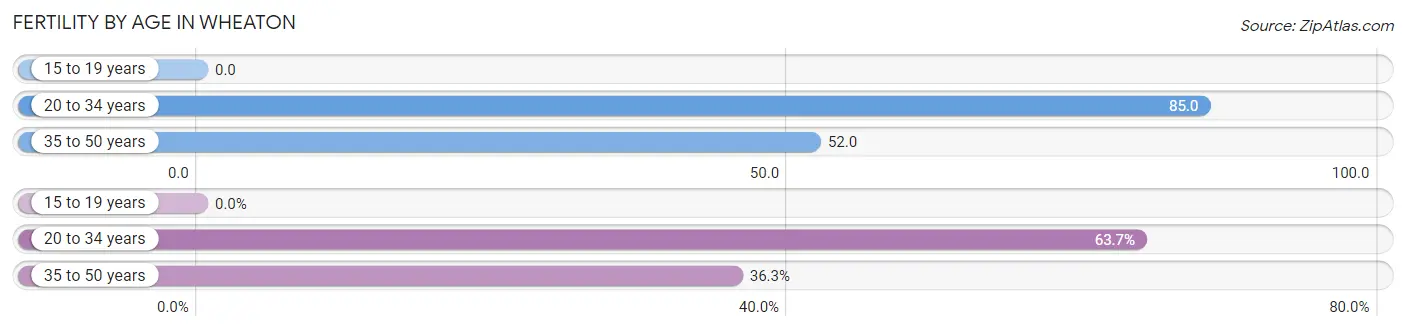
| Age Bracket | Women with Births | Births / 1,000 Women |
| 15 to 19 years | 0 (0.0%) | 0.0 |
| 20 to 34 years | 460 (63.7%) | 85.0 |
| 35 to 50 years | 262 (36.3%) | 52.0 |
| Total | 722 (100.0%) | 57.0 |
Fertility by Age by Marriage Status in Wheaton
84.3% of women with births (722) in Wheaton are married. The highest percentage of unmarried women with births falls into 20 to 34 years age bracket with 18.0% of them unmarried at the time of birth, while the lowest percentage of unmarried women with births belong to 35 to 50 years age bracket with 11.5% of them unmarried.
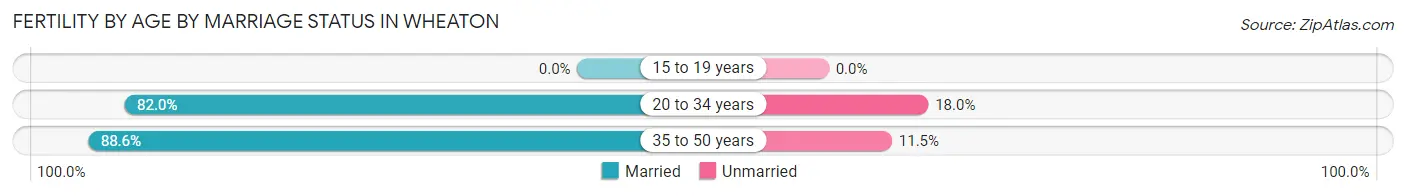
| Age Bracket | Married | Unmarried |
| 15 to 19 years | 0 (0.0%) | 0 (0.0%) |
| 20 to 34 years | 377 (82.0%) | 83 (18.0%) |
| 35 to 50 years | 232 (88.5%) | 30 (11.5%) |
| Total | 609 (84.4%) | 113 (15.7%) |
Fertility by Education in Wheaton
Average fertility rate in Wheaton is 57.0 births per 1,000 women. Women with the education attainment of high school diploma have the highest fertility rate of 113.0 births per 1,000 women, while women with the education attainment of less than high school have the lowest fertility at 8.0 births per 1,000 women. Women with the education attainment of graduate degree represent 36.6% of all women with births.
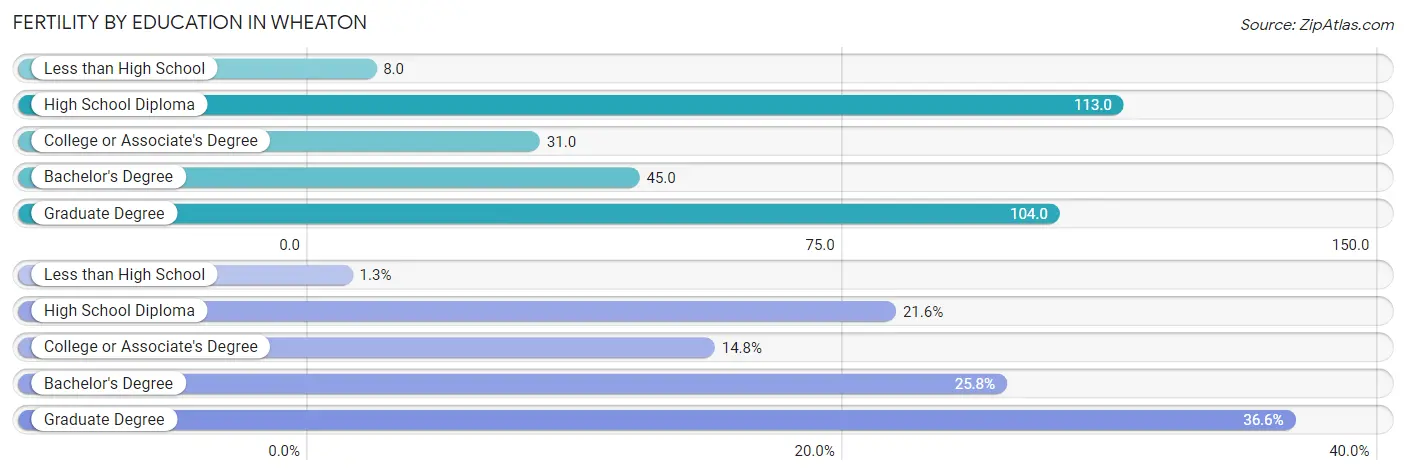
| Educational Attainment | Women with Births | Births / 1,000 Women |
| Less than High School | 9 (1.3%) | 8.0 |
| High School Diploma | 156 (21.6%) | 113.0 |
| College or Associate's Degree | 107 (14.8%) | 31.0 |
| Bachelor's Degree | 186 (25.8%) | 45.0 |
| Graduate Degree | 264 (36.6%) | 104.0 |
| Total | 722 (100.0%) | 57.0 |
Fertility by Education by Marriage Status in Wheaton
15.7% of women with births in Wheaton are unmarried. Women with the educational attainment of less than high school are most likely to be married with 100.0% of them married at childbirth, while women with the educational attainment of high school diploma are least likely to be married with 35.9% of them unmarried at childbirth.
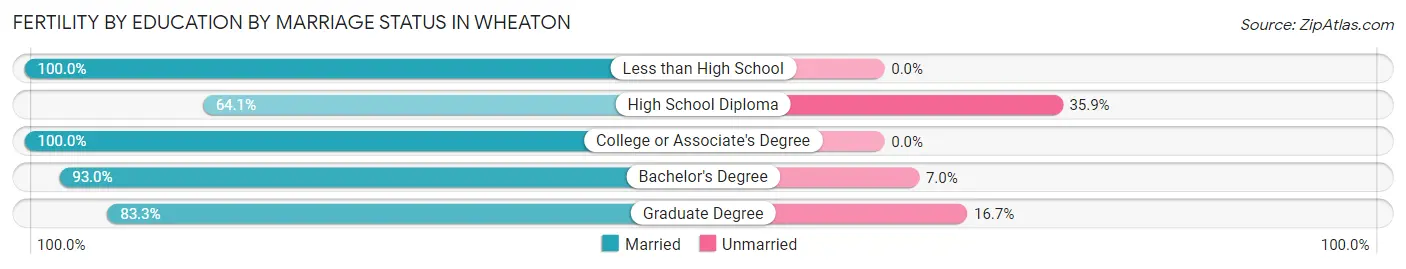
| Educational Attainment | Married | Unmarried |
| Less than High School | 9 (100.0%) | 0 (0.0%) |
| High School Diploma | 100 (64.1%) | 56 (35.9%) |
| College or Associate's Degree | 107 (100.0%) | 0 (0.0%) |
| Bachelor's Degree | 173 (93.0%) | 13 (7.0%) |
| Graduate Degree | 220 (83.3%) | 44 (16.7%) |
| Total | 609 (84.4%) | 113 (15.7%) |
Employment Characteristics in Wheaton
Employment by Class of Employer in Wheaton
Among the 26,346 employed individuals in Wheaton, private company employees (18,222 | 69.2%), not-for-profit organizations (2,784 | 10.6%), and local government employees (2,154 | 8.2%) make up the most common classes of employment.
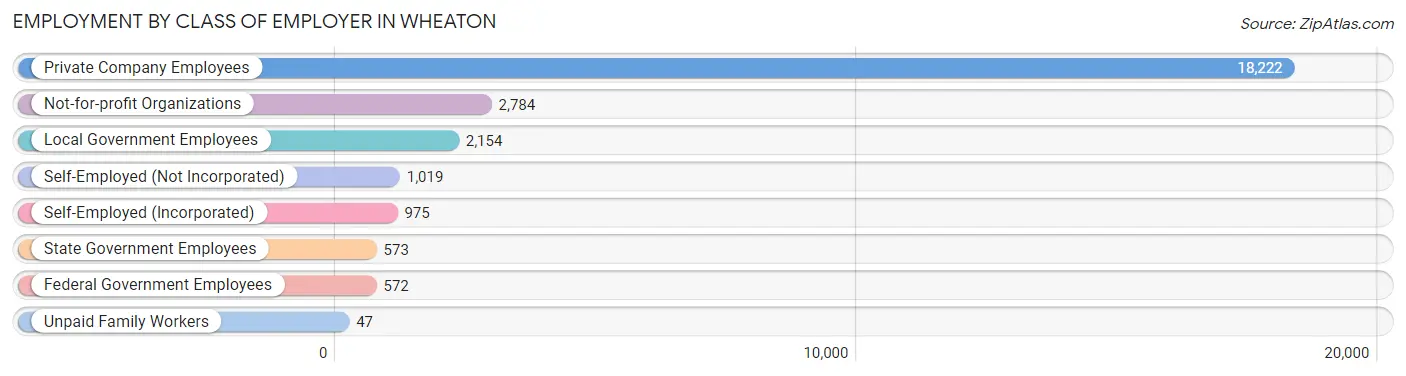
| Employer Class | # Employees | % Employees |
| Private Company Employees | 18,222 | 69.2% |
| Self-Employed (Incorporated) | 975 | 3.7% |
| Self-Employed (Not Incorporated) | 1,019 | 3.9% |
| Not-for-profit Organizations | 2,784 | 10.6% |
| Local Government Employees | 2,154 | 8.2% |
| State Government Employees | 573 | 2.2% |
| Federal Government Employees | 572 | 2.2% |
| Unpaid Family Workers | 47 | 0.2% |
| Total | 26,346 | 100.0% |
Employment Status by Age in Wheaton
According to the labor force statistics for Wheaton, out of the total population over 16 years of age (43,172), 64.8% or 27,975 individuals are in the labor force, with 3.5% or 979 of them unemployed. The age group with the highest labor force participation rate is 35 to 44 years, with 88.4% or 5,631 individuals in the labor force. Within the labor force, the 25 to 29 years age range has the highest percentage of unemployed individuals, with 6.7% or 205 of them being unemployed.
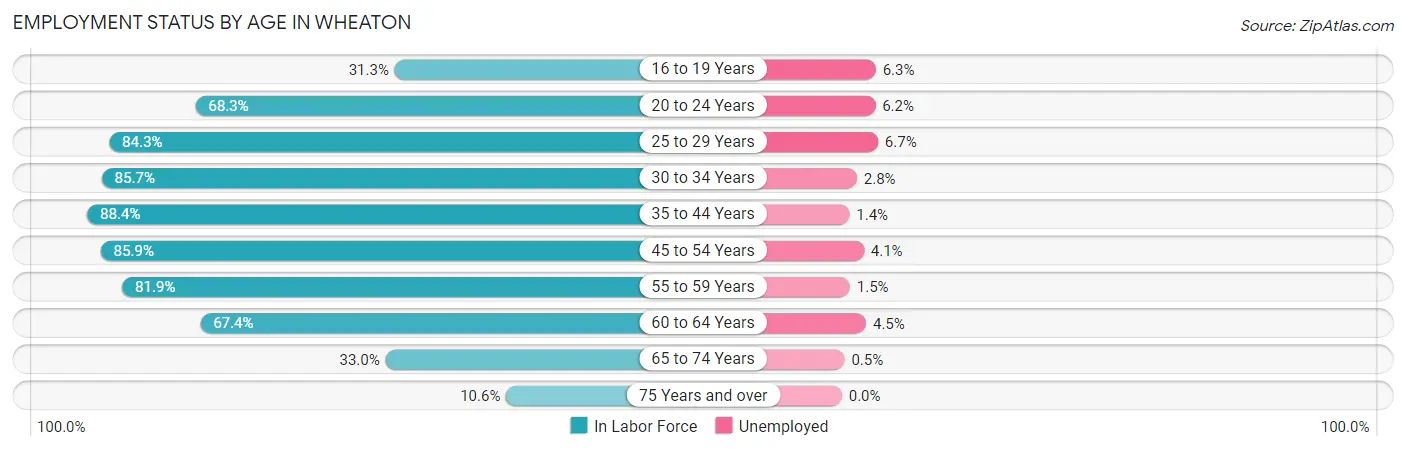
| Age Bracket | In Labor Force | Unemployed |
| 16 to 19 Years | 1,198 (31.3%) | 75 (6.3%) |
| 20 to 24 Years | 2,612 (68.3%) | 162 (6.2%) |
| 25 to 29 Years | 3,059 (84.3%) | 205 (6.7%) |
| 30 to 34 Years | 2,837 (85.7%) | 79 (2.8%) |
| 35 to 44 Years | 5,631 (88.4%) | 79 (1.4%) |
| 45 to 54 Years | 5,293 (85.9%) | 217 (4.1%) |
| 55 to 59 Years | 2,520 (81.9%) | 38 (1.5%) |
| 60 to 64 Years | 2,665 (67.4%) | 120 (4.5%) |
| 65 to 74 Years | 1,774 (33.0%) | 9 (0.5%) |
| 75 Years and over | 386 (10.6%) | 0 (0.0%) |
| Total | 27,975 (64.8%) | 979 (3.5%) |
Employment Status by Educational Attainment in Wheaton
According to labor force statistics for Wheaton, 83.0% of individuals (21,997) out of the total population between 25 and 64 years of age (26,502) are in the labor force, with 3.3% or 726 of them being unemployed. The group with the highest labor force participation rate are those with the educational attainment of college / associate degree, with 86.4% or 4,819 individuals in the labor force. Within the labor force, individuals with less than high school education have the highest percentage of unemployment, with 7.3% or 42 of them being unemployed.
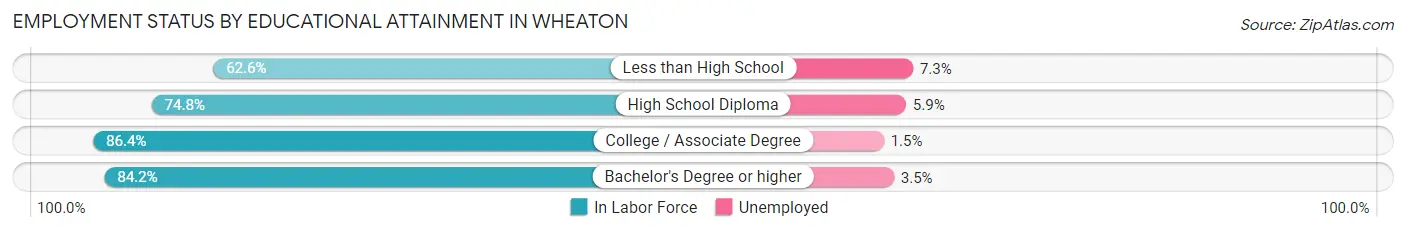
| Educational Attainment | In Labor Force | Unemployed |
| Less than High School | 579 (62.6%) | 68 (7.3%) |
| High School Diploma | 1,800 (74.8%) | 142 (5.9%) |
| College / Associate Degree | 4,819 (86.4%) | 84 (1.5%) |
| Bachelor's Degree or higher | 14,813 (84.2%) | 616 (3.5%) |
| Total | 21,997 (83.0%) | 875 (3.3%) |
Employment Occupations by Sex in Wheaton
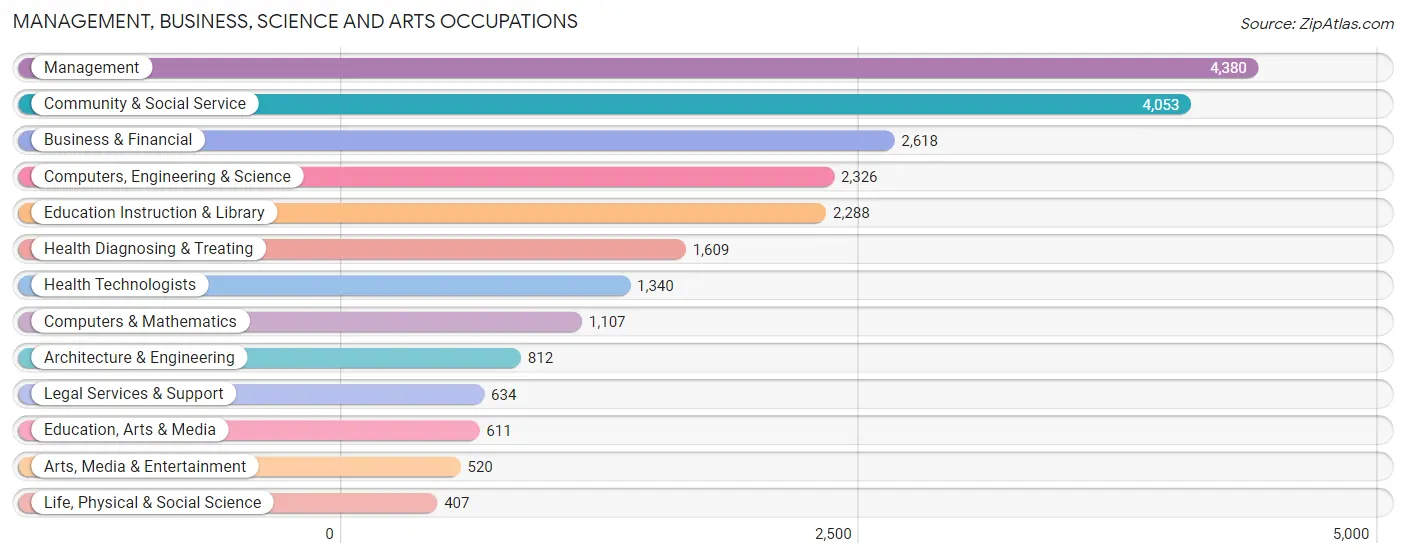
Management, Business, Science and Arts Occupations
The most common Management, Business, Science and Arts occupations in Wheaton are Management (4,380 | 16.2%), Community & Social Service (4,053 | 15.0%), Business & Financial (2,618 | 9.7%), Computers, Engineering & Science (2,326 | 8.6%), and Education Instruction & Library (2,288 | 8.5%).
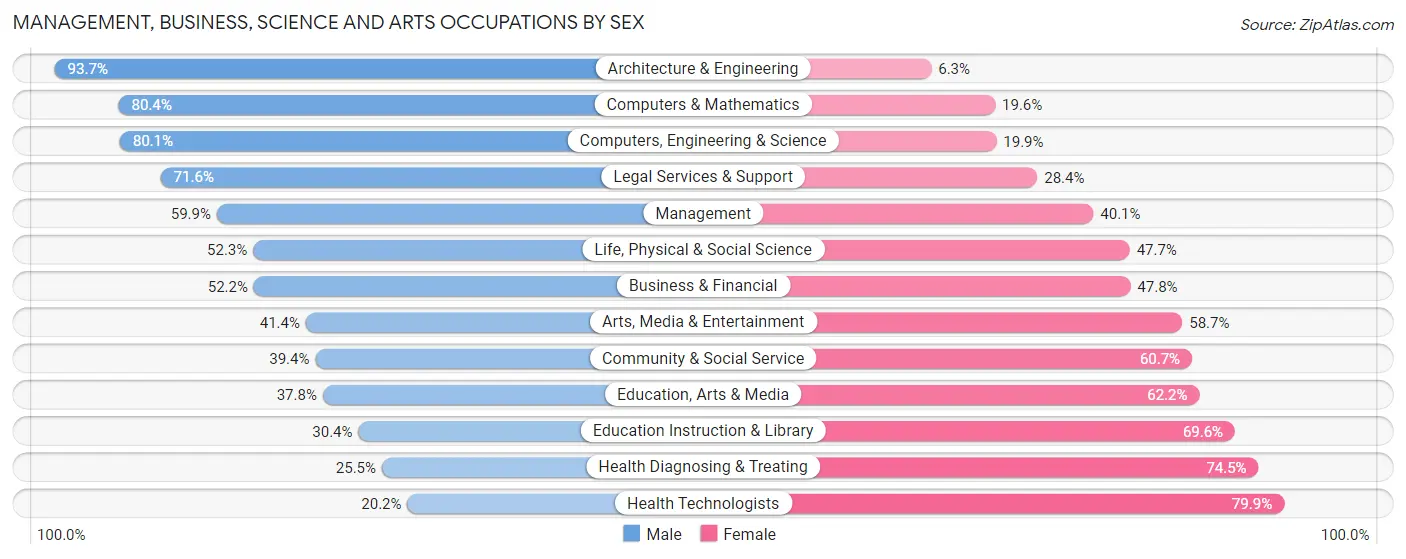
Management, Business, Science and Arts Occupations by Sex
Within the Management, Business, Science and Arts occupations in Wheaton, the most male-oriented occupations are Architecture & Engineering (93.7%), Computers & Mathematics (80.4%), and Computers, Engineering & Science (80.1%), while the most female-oriented occupations are Health Technologists (79.8%), Health Diagnosing & Treating (74.5%), and Education Instruction & Library (69.6%).
| Occupation | Male | Female |
| Management | 2,624 (59.9%) | 1,756 (40.1%) |
| Business & Financial | 1,366 (52.2%) | 1,252 (47.8%) |
| Computers, Engineering & Science | 1,864 (80.1%) | 462 (19.9%) |
| Computers & Mathematics | 890 (80.4%) | 217 (19.6%) |
| Architecture & Engineering | 761 (93.7%) | 51 (6.3%) |
| Life, Physical & Social Science | 213 (52.3%) | 194 (47.7%) |
| Community & Social Service | 1,595 (39.4%) | 2,458 (60.7%) |
| Education, Arts & Media | 231 (37.8%) | 380 (62.2%) |
| Legal Services & Support | 454 (71.6%) | 180 (28.4%) |
| Education Instruction & Library | 695 (30.4%) | 1,593 (69.6%) |
| Arts, Media & Entertainment | 215 (41.3%) | 305 (58.7%) |
| Health Diagnosing & Treating | 410 (25.5%) | 1,199 (74.5%) |
| Health Technologists | 270 (20.2%) | 1,070 (79.8%) |
| Total (Category) | 7,859 (52.4%) | 7,127 (47.6%) |
| Total (Overall) | 14,590 (54.0%) | 12,403 (46.0%) |
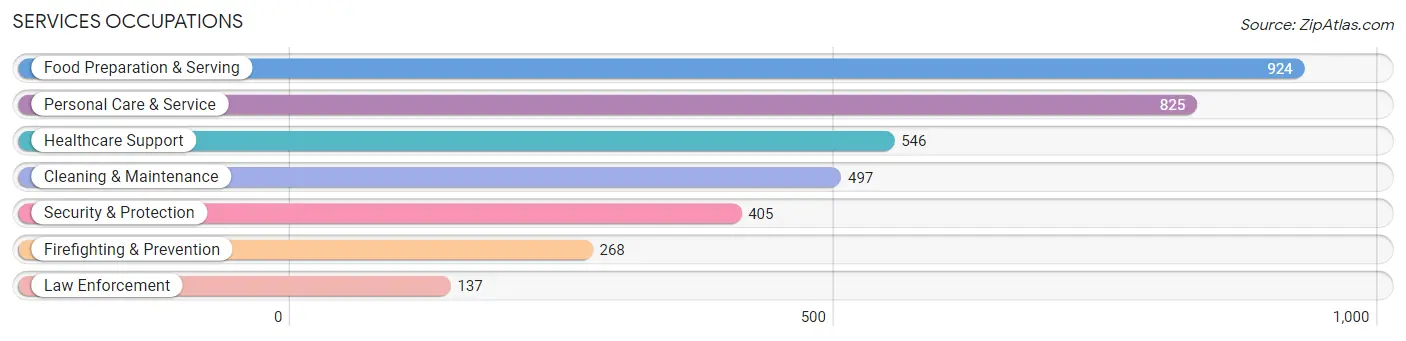
Services Occupations
The most common Services occupations in Wheaton are Food Preparation & Serving (924 | 3.4%), Personal Care & Service (825 | 3.1%), Healthcare Support (546 | 2.0%), Cleaning & Maintenance (497 | 1.8%), and Security & Protection (405 | 1.5%).
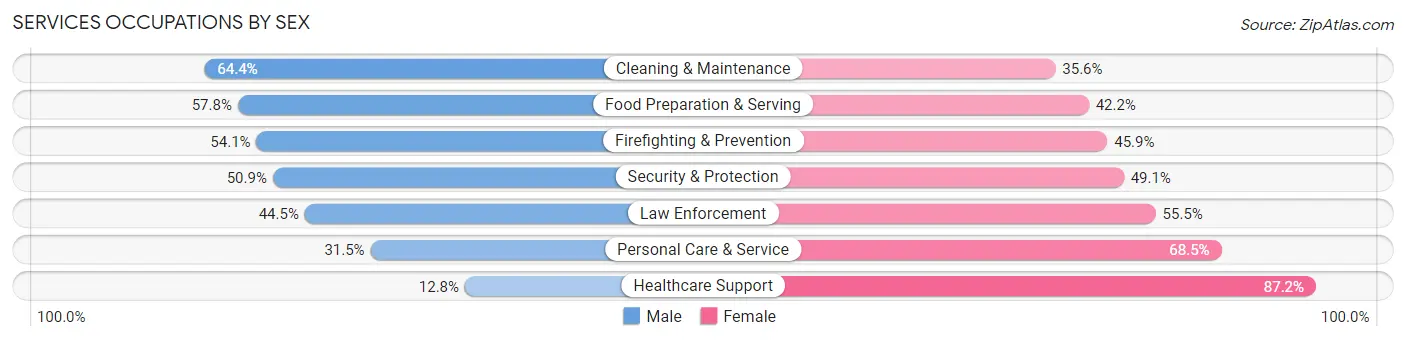
Services Occupations by Sex
Within the Services occupations in Wheaton, the most male-oriented occupations are Cleaning & Maintenance (64.4%), Food Preparation & Serving (57.8%), and Firefighting & Prevention (54.1%), while the most female-oriented occupations are Healthcare Support (87.2%), Personal Care & Service (68.5%), and Law Enforcement (55.5%).
| Occupation | Male | Female |
| Healthcare Support | 70 (12.8%) | 476 (87.2%) |
| Security & Protection | 206 (50.9%) | 199 (49.1%) |
| Firefighting & Prevention | 145 (54.1%) | 123 (45.9%) |
| Law Enforcement | 61 (44.5%) | 76 (55.5%) |
| Food Preparation & Serving | 534 (57.8%) | 390 (42.2%) |
| Cleaning & Maintenance | 320 (64.4%) | 177 (35.6%) |
| Personal Care & Service | 260 (31.5%) | 565 (68.5%) |
| Total (Category) | 1,390 (43.5%) | 1,807 (56.5%) |
| Total (Overall) | 14,590 (54.0%) | 12,403 (46.0%) |
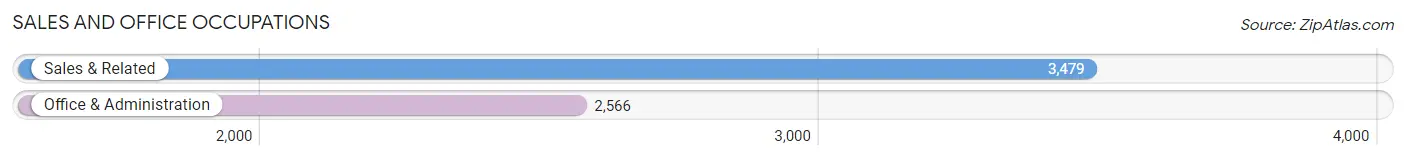
Sales and Office Occupations
The most common Sales and Office occupations in Wheaton are Sales & Related (3,479 | 12.9%), and Office & Administration (2,566 | 9.5%).
Sales and Office Occupations by Sex
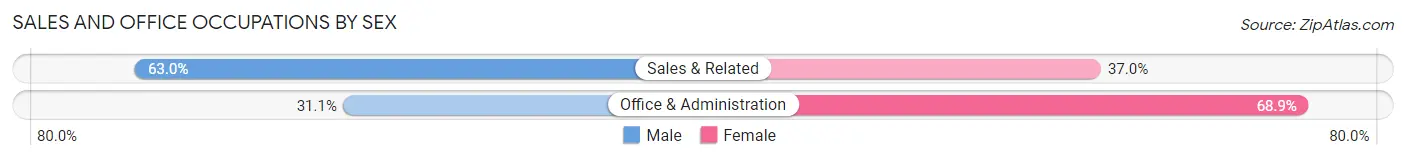
| Occupation | Male | Female |
| Sales & Related | 2,192 (63.0%) | 1,287 (37.0%) |
| Office & Administration | 797 (31.1%) | 1,769 (68.9%) |
| Total (Category) | 2,989 (49.4%) | 3,056 (50.5%) |
| Total (Overall) | 14,590 (54.0%) | 12,403 (46.0%) |
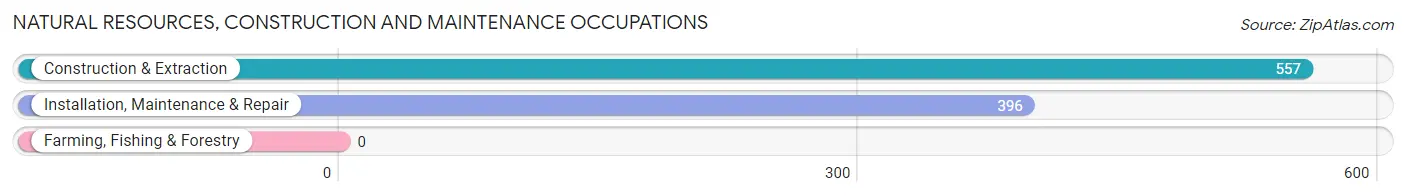
Natural Resources, Construction and Maintenance Occupations
The most common Natural Resources, Construction and Maintenance occupations in Wheaton are Construction & Extraction (557 | 2.1%), and Installation, Maintenance & Repair (396 | 1.5%).
Natural Resources, Construction and Maintenance Occupations by Sex
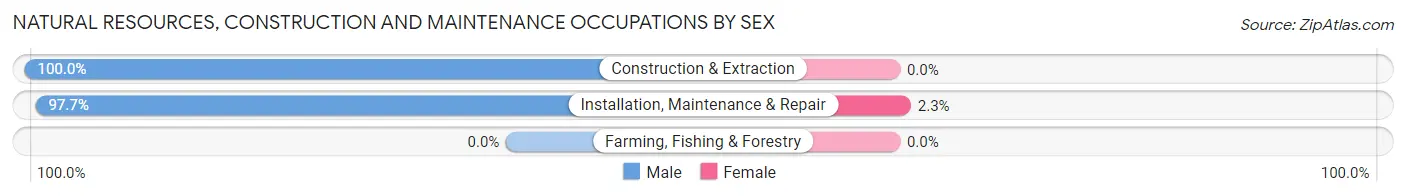
| Occupation | Male | Female |
| Farming, Fishing & Forestry | 0 (0.0%) | 0 (0.0%) |
| Construction & Extraction | 557 (100.0%) | 0 (0.0%) |
| Installation, Maintenance & Repair | 387 (97.7%) | 9 (2.3%) |
| Total (Category) | 944 (99.1%) | 9 (0.9%) |
| Total (Overall) | 14,590 (54.0%) | 12,403 (46.0%) |
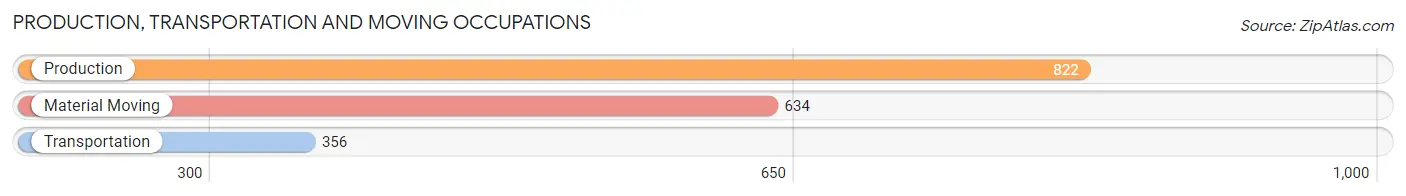
Production, Transportation and Moving Occupations
The most common Production, Transportation and Moving occupations in Wheaton are Production (822 | 3.0%), Material Moving (634 | 2.4%), and Transportation (356 | 1.3%).
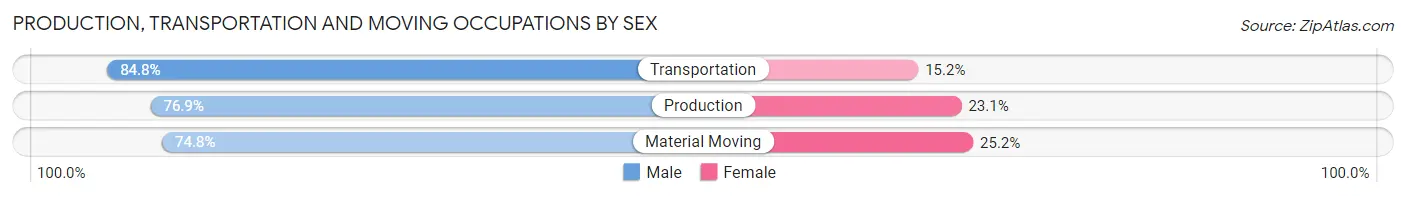
Production, Transportation and Moving Occupations by Sex
| Occupation | Male | Female |
| Production | 632 (76.9%) | 190 (23.1%) |
| Transportation | 302 (84.8%) | 54 (15.2%) |
| Material Moving | 474 (74.8%) | 160 (25.2%) |
| Total (Category) | 1,408 (77.7%) | 404 (22.3%) |
| Total (Overall) | 14,590 (54.0%) | 12,403 (46.0%) |
Employment Industries by Sex in Wheaton
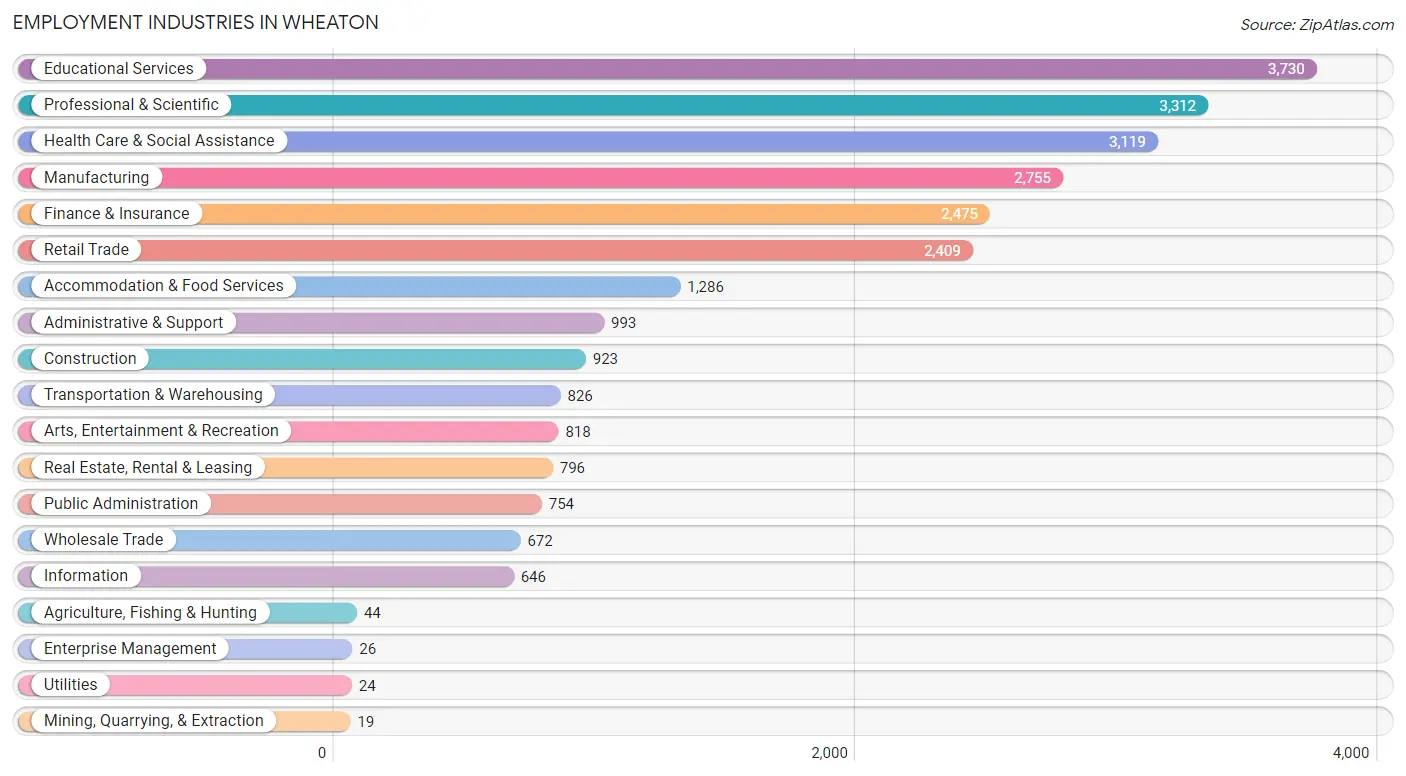
Employment Industries in Wheaton
The major employment industries in Wheaton include Educational Services (3,730 | 13.8%), Professional & Scientific (3,312 | 12.3%), Health Care & Social Assistance (3,119 | 11.6%), Manufacturing (2,755 | 10.2%), and Finance & Insurance (2,475 | 9.2%).
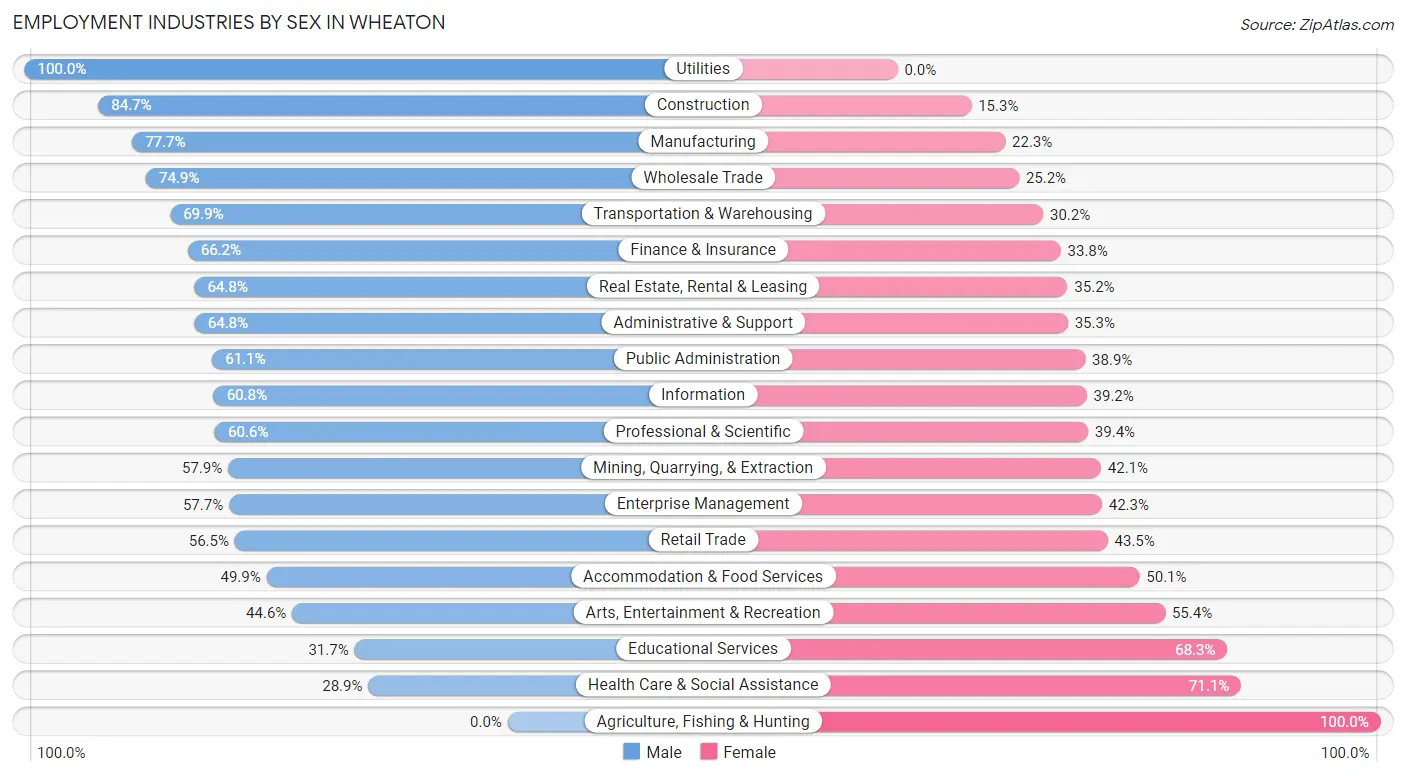
Employment Industries by Sex in Wheaton
The Wheaton industries that see more men than women are Utilities (100.0%), Construction (84.7%), and Manufacturing (77.7%), whereas the industries that tend to have a higher number of women are Agriculture, Fishing & Hunting (100.0%), Health Care & Social Assistance (71.1%), and Educational Services (68.3%).
| Industry | Male | Female |
| Agriculture, Fishing & Hunting | 0 (0.0%) | 44 (100.0%) |
| Mining, Quarrying, & Extraction | 11 (57.9%) | 8 (42.1%) |
| Construction | 782 (84.7%) | 141 (15.3%) |
| Manufacturing | 2,141 (77.7%) | 614 (22.3%) |
| Wholesale Trade | 503 (74.9%) | 169 (25.2%) |
| Retail Trade | 1,361 (56.5%) | 1,048 (43.5%) |
| Transportation & Warehousing | 577 (69.9%) | 249 (30.1%) |
| Utilities | 24 (100.0%) | 0 (0.0%) |
| Information | 393 (60.8%) | 253 (39.2%) |
| Finance & Insurance | 1,639 (66.2%) | 836 (33.8%) |
| Real Estate, Rental & Leasing | 516 (64.8%) | 280 (35.2%) |
| Professional & Scientific | 2,006 (60.6%) | 1,306 (39.4%) |
| Enterprise Management | 15 (57.7%) | 11 (42.3%) |
| Administrative & Support | 643 (64.7%) | 350 (35.2%) |
| Educational Services | 1,183 (31.7%) | 2,547 (68.3%) |
| Health Care & Social Assistance | 900 (28.9%) | 2,219 (71.1%) |
| Arts, Entertainment & Recreation | 365 (44.6%) | 453 (55.4%) |
| Accommodation & Food Services | 642 (49.9%) | 644 (50.1%) |
| Public Administration | 461 (61.1%) | 293 (38.9%) |
| Total | 14,590 (54.0%) | 12,403 (46.0%) |
Education in Wheaton
School Enrollment in Wheaton
The most common levels of schooling among the 15,446 students in Wheaton are college / undergraduate (4,790 | 31.0%), elementary school (2,847 | 18.4%), and high school (2,663 | 17.2%).
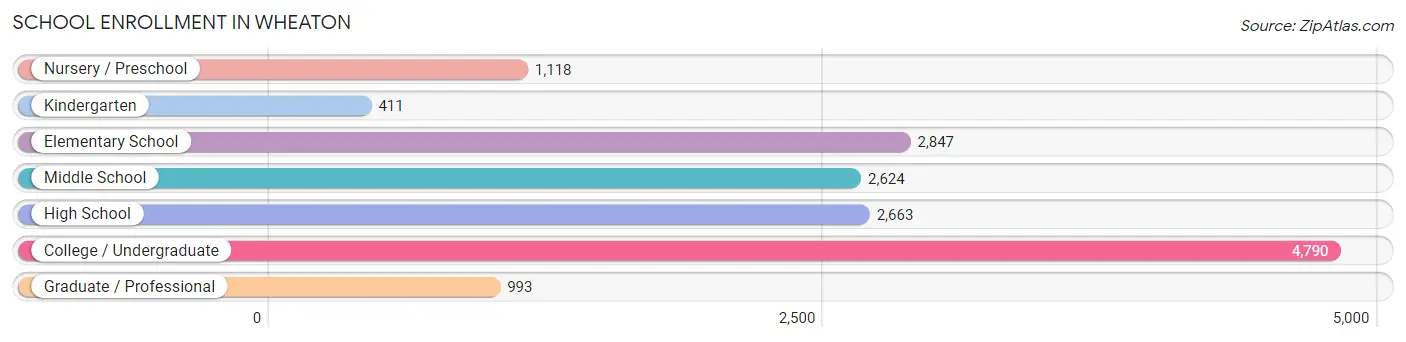
| School Level | # Students | % Students |
| Nursery / Preschool | 1,118 | 7.2% |
| Kindergarten | 411 | 2.7% |
| Elementary School | 2,847 | 18.4% |
| Middle School | 2,624 | 17.0% |
| High School | 2,663 | 17.2% |
| College / Undergraduate | 4,790 | 31.0% |
| Graduate / Professional | 993 | 6.4% |
| Total | 15,446 | 100.0% |
School Enrollment by Age by Funding Source in Wheaton
Out of a total of 15,446 students who are enrolled in schools in Wheaton, 5,638 (36.5%) attend a private institution, while the remaining 9,808 (63.5%) are enrolled in public schools. The age group of 3 to 4 year olds has the highest likelihood of being enrolled in private schools, with 645 (77.8% in the age bracket) enrolled. Conversely, the age group of 15 to 17 year olds has the lowest likelihood of being enrolled in a private school, with 1,793 (86.4% in the age bracket) attending a public institution.
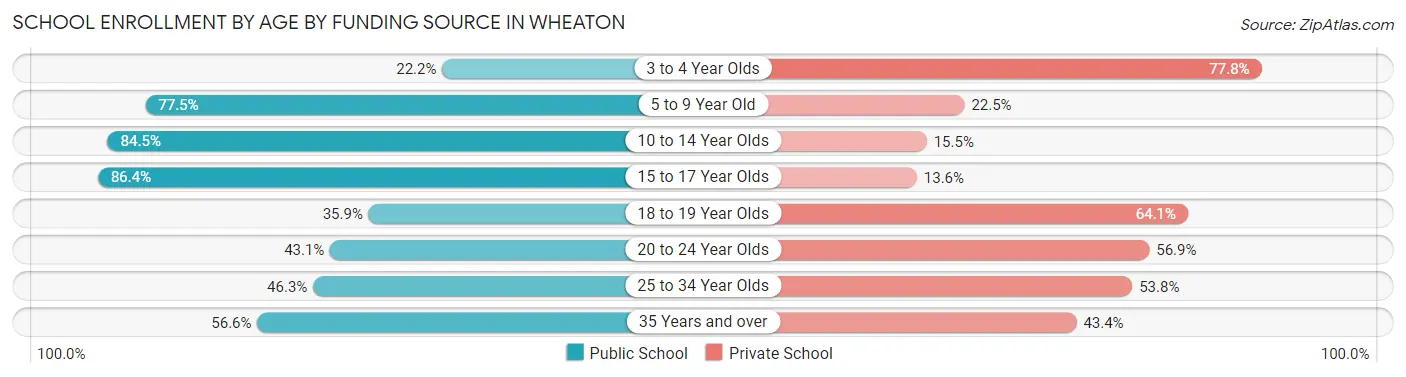
| Age Bracket | Public School | Private School |
| 3 to 4 Year Olds | 184 (22.2%) | 645 (77.8%) |
| 5 to 9 Year Old | 2,473 (77.5%) | 718 (22.5%) |
| 10 to 14 Year Olds | 2,853 (84.5%) | 522 (15.5%) |
| 15 to 17 Year Olds | 1,793 (86.4%) | 283 (13.6%) |
| 18 to 19 Year Olds | 775 (35.9%) | 1,384 (64.1%) |
| 20 to 24 Year Olds | 1,014 (43.1%) | 1,340 (56.9%) |
| 25 to 34 Year Olds | 481 (46.3%) | 559 (53.7%) |
| 35 Years and over | 239 (56.6%) | 183 (43.4%) |
| Total | 9,808 (63.5%) | 5,638 (36.5%) |
Educational Attainment by Field of Study in Wheaton
Business (5,550 | 22.7%), education (3,031 | 12.4%), science & technology (2,120 | 8.7%), social sciences (1,872 | 7.6%), and engineering (1,591 | 6.5%) are the most common fields of study among 24,492 individuals in Wheaton who have obtained a bachelor's degree or higher.
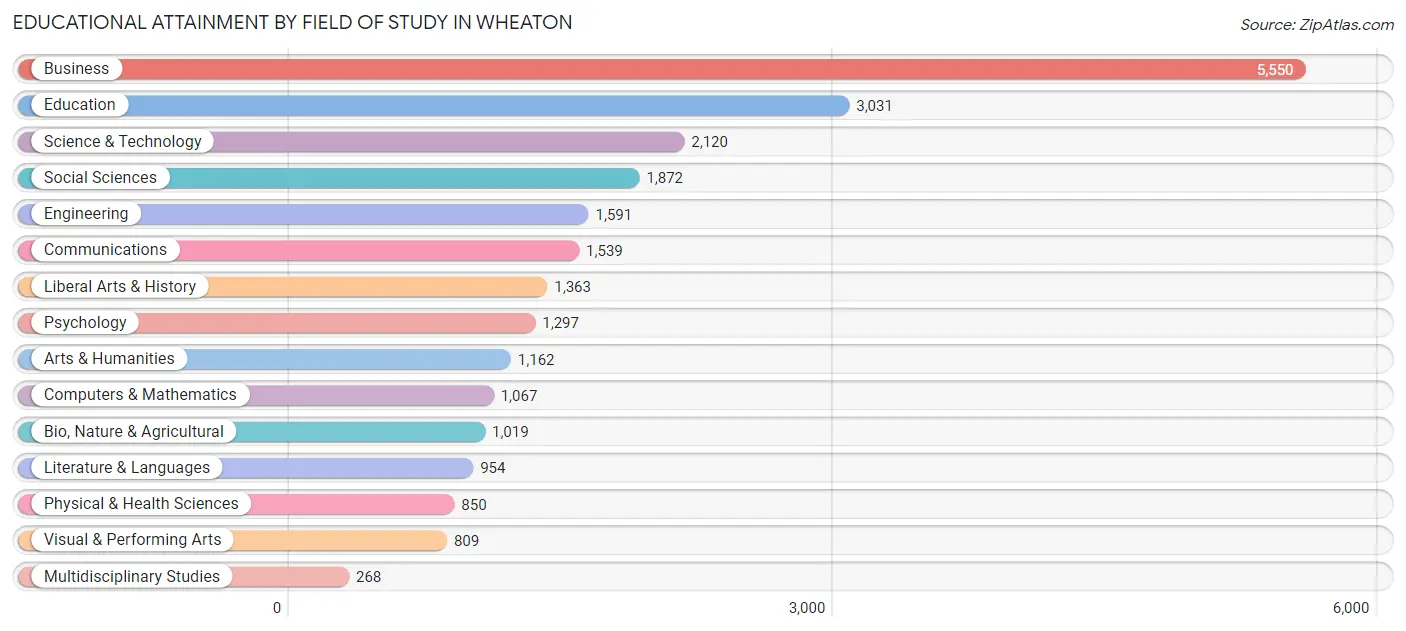
| Field of Study | # Graduates | % Graduates |
| Computers & Mathematics | 1,067 | 4.4% |
| Bio, Nature & Agricultural | 1,019 | 4.2% |
| Physical & Health Sciences | 850 | 3.5% |
| Psychology | 1,297 | 5.3% |
| Social Sciences | 1,872 | 7.6% |
| Engineering | 1,591 | 6.5% |
| Multidisciplinary Studies | 268 | 1.1% |
| Science & Technology | 2,120 | 8.7% |
| Business | 5,550 | 22.7% |
| Education | 3,031 | 12.4% |
| Literature & Languages | 954 | 3.9% |
| Liberal Arts & History | 1,363 | 5.6% |
| Visual & Performing Arts | 809 | 3.3% |
| Communications | 1,539 | 6.3% |
| Arts & Humanities | 1,162 | 4.7% |
| Total | 24,492 | 100.0% |
Transportation & Commute in Wheaton
Vehicle Availability by Sex in Wheaton
The most prevalent vehicle ownership categories in Wheaton are males with 2 vehicles (7,523, accounting for 53.8%) and females with 2 vehicles (6,047, making up 64.4%).
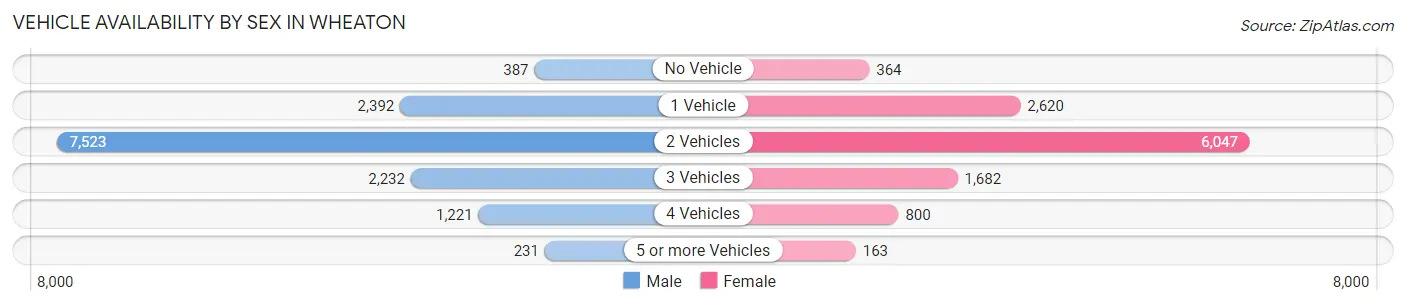
| Vehicles Available | Male | Female |
| No Vehicle | 387 (2.8%) | 364 (3.1%) |
| 1 Vehicle | 2,392 (17.1%) | 2,620 (22.4%) |
| 2 Vehicles | 7,523 (53.8%) | 6,047 (51.8%) |
| 3 Vehicles | 2,232 (16.0%) | 1,682 (14.4%) |
| 4 Vehicles | 1,221 (8.7%) | 800 (6.9%) |
| 5 or more Vehicles | 231 (1.7%) | 163 (1.4%) |
| Total | 13,986 (100.0%) | 11,676 (100.0%) |
Commute Time in Wheaton
The most frequently occuring commute durations in Wheaton are 15 to 19 minutes (3,197 commuters, 15.3%), 10 to 14 minutes (2,873 commuters, 13.8%), and 20 to 24 minutes (2,731 commuters, 13.1%).
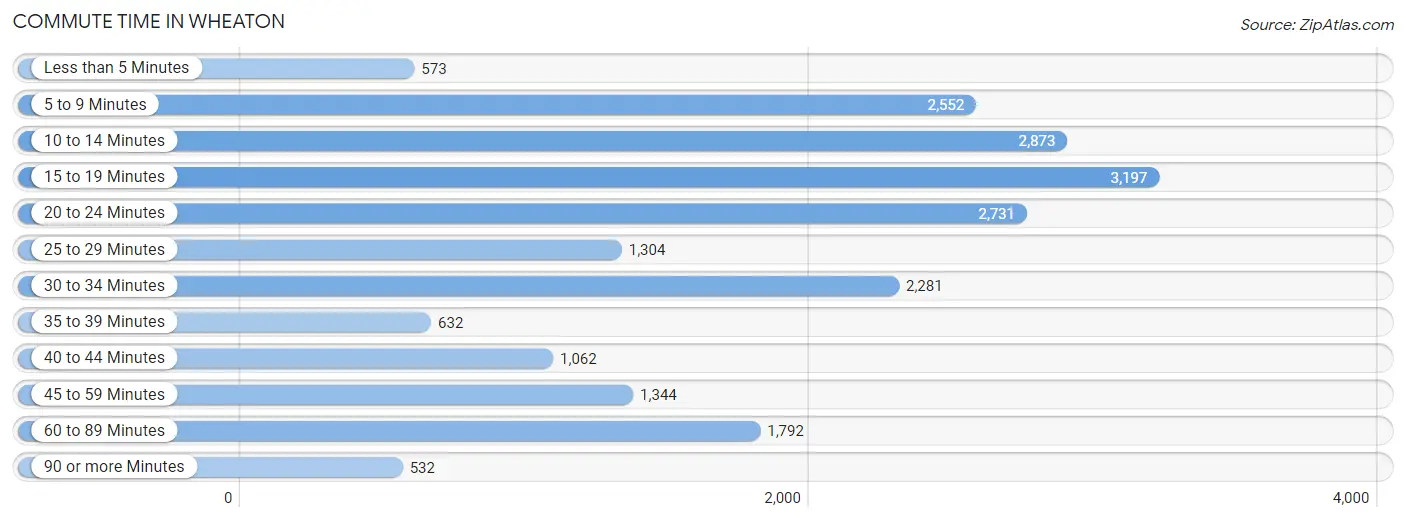
| Commute Time | # Commuters | % Commuters |
| Less than 5 Minutes | 573 | 2.8% |
| 5 to 9 Minutes | 2,552 | 12.2% |
| 10 to 14 Minutes | 2,873 | 13.8% |
| 15 to 19 Minutes | 3,197 | 15.3% |
| 20 to 24 Minutes | 2,731 | 13.1% |
| 25 to 29 Minutes | 1,304 | 6.2% |
| 30 to 34 Minutes | 2,281 | 10.9% |
| 35 to 39 Minutes | 632 | 3.0% |
| 40 to 44 Minutes | 1,062 | 5.1% |
| 45 to 59 Minutes | 1,344 | 6.4% |
| 60 to 89 Minutes | 1,792 | 8.6% |
| 90 or more Minutes | 532 | 2.5% |
Commute Time by Sex in Wheaton
The most common commute times in Wheaton are 15 to 19 minutes (1,648 commuters, 14.5%) for males and 10 to 14 minutes (1,584 commuters, 16.6%) for females.
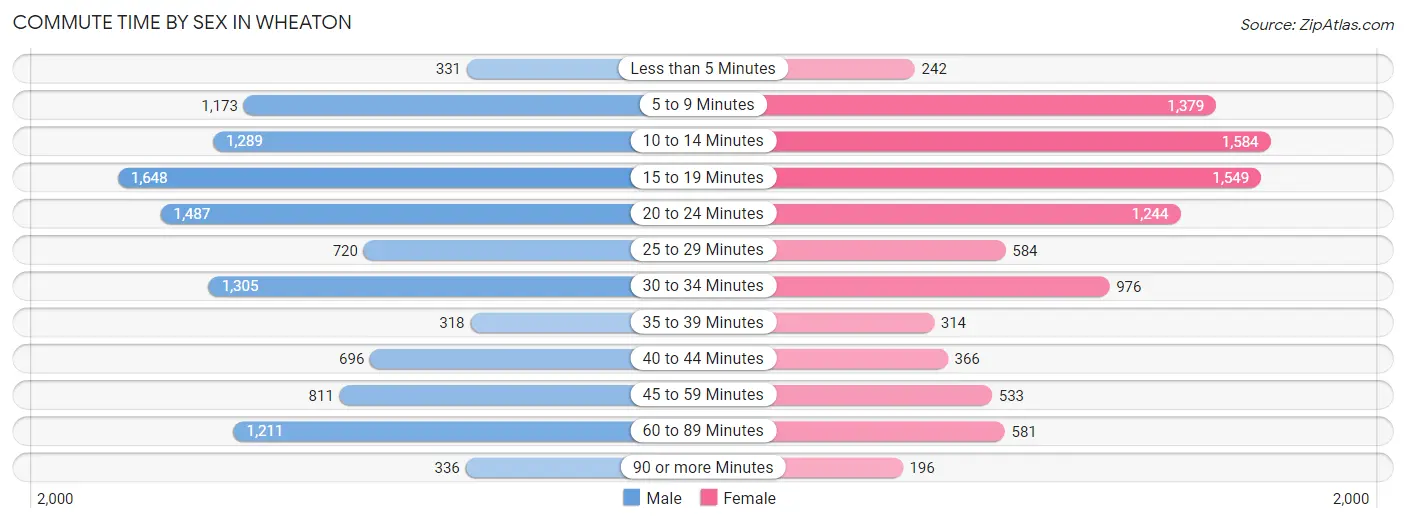
| Commute Time | Male | Female |
| Less than 5 Minutes | 331 (2.9%) | 242 (2.5%) |
| 5 to 9 Minutes | 1,173 (10.4%) | 1,379 (14.4%) |
| 10 to 14 Minutes | 1,289 (11.4%) | 1,584 (16.6%) |
| 15 to 19 Minutes | 1,648 (14.5%) | 1,549 (16.2%) |
| 20 to 24 Minutes | 1,487 (13.1%) | 1,244 (13.0%) |
| 25 to 29 Minutes | 720 (6.4%) | 584 (6.1%) |
| 30 to 34 Minutes | 1,305 (11.5%) | 976 (10.2%) |
| 35 to 39 Minutes | 318 (2.8%) | 314 (3.3%) |
| 40 to 44 Minutes | 696 (6.1%) | 366 (3.8%) |
| 45 to 59 Minutes | 811 (7.2%) | 533 (5.6%) |
| 60 to 89 Minutes | 1,211 (10.7%) | 581 (6.1%) |
| 90 or more Minutes | 336 (3.0%) | 196 (2.1%) |
Time of Departure to Work by Sex in Wheaton
The most frequent times of departure to work in Wheaton are 7:00 AM to 7:29 AM (1,790, 15.8%) for males and 7:00 AM to 7:29 AM (1,826, 19.1%) for females.
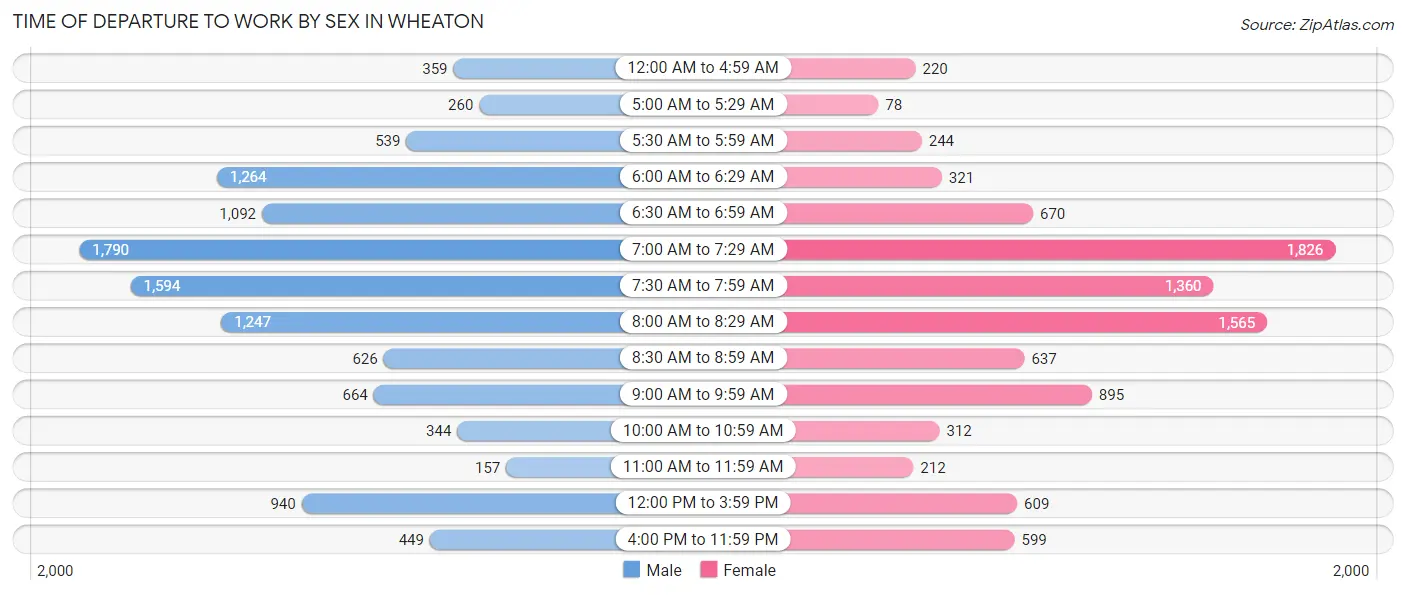
| Time of Departure | Male | Female |
| 12:00 AM to 4:59 AM | 359 (3.2%) | 220 (2.3%) |
| 5:00 AM to 5:29 AM | 260 (2.3%) | 78 (0.8%) |
| 5:30 AM to 5:59 AM | 539 (4.8%) | 244 (2.6%) |
| 6:00 AM to 6:29 AM | 1,264 (11.2%) | 321 (3.4%) |
| 6:30 AM to 6:59 AM | 1,092 (9.6%) | 670 (7.0%) |
| 7:00 AM to 7:29 AM | 1,790 (15.8%) | 1,826 (19.1%) |
| 7:30 AM to 7:59 AM | 1,594 (14.1%) | 1,360 (14.2%) |
| 8:00 AM to 8:29 AM | 1,247 (11.0%) | 1,565 (16.4%) |
| 8:30 AM to 8:59 AM | 626 (5.5%) | 637 (6.7%) |
| 9:00 AM to 9:59 AM | 664 (5.9%) | 895 (9.4%) |
| 10:00 AM to 10:59 AM | 344 (3.0%) | 312 (3.3%) |
| 11:00 AM to 11:59 AM | 157 (1.4%) | 212 (2.2%) |
| 12:00 PM to 3:59 PM | 940 (8.3%) | 609 (6.4%) |
| 4:00 PM to 11:59 PM | 449 (4.0%) | 599 (6.3%) |
| Total | 11,325 (100.0%) | 9,548 (100.0%) |
Housing Occupancy in Wheaton
Occupancy by Ownership in Wheaton
Of the total 19,915 dwellings in Wheaton, owner-occupied units account for 14,467 (72.6%), while renter-occupied units make up 5,448 (27.4%).
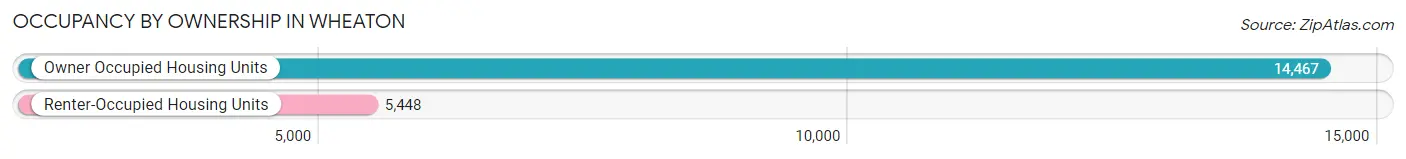
| Occupancy | # Housing Units | % Housing Units |
| Owner Occupied Housing Units | 14,467 | 72.6% |
| Renter-Occupied Housing Units | 5,448 | 27.4% |
| Total Occupied Housing Units | 19,915 | 100.0% |
Occupancy by Household Size in Wheaton
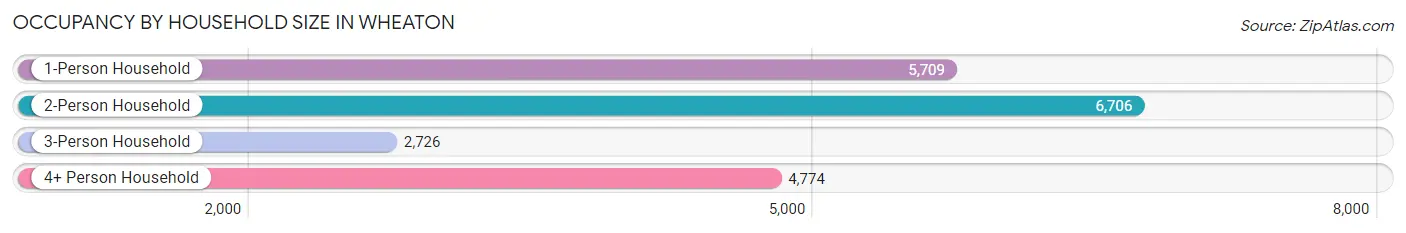
| Household Size | # Housing Units | % Housing Units |
| 1-Person Household | 5,709 | 28.7% |
| 2-Person Household | 6,706 | 33.7% |
| 3-Person Household | 2,726 | 13.7% |
| 4+ Person Household | 4,774 | 24.0% |
| Total Housing Units | 19,915 | 100.0% |
Occupancy by Ownership by Household Size in Wheaton
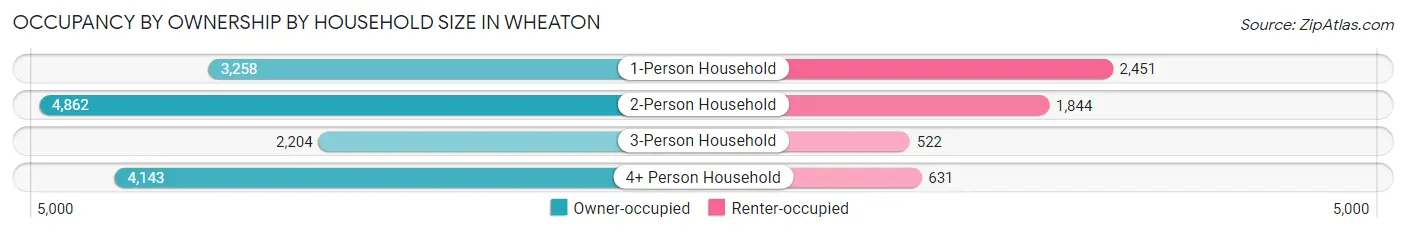
| Household Size | Owner-occupied | Renter-occupied |
| 1-Person Household | 3,258 (57.1%) | 2,451 (42.9%) |
| 2-Person Household | 4,862 (72.5%) | 1,844 (27.5%) |
| 3-Person Household | 2,204 (80.8%) | 522 (19.2%) |
| 4+ Person Household | 4,143 (86.8%) | 631 (13.2%) |
| Total Housing Units | 14,467 (72.6%) | 5,448 (27.4%) |
Occupancy by Educational Attainment in Wheaton
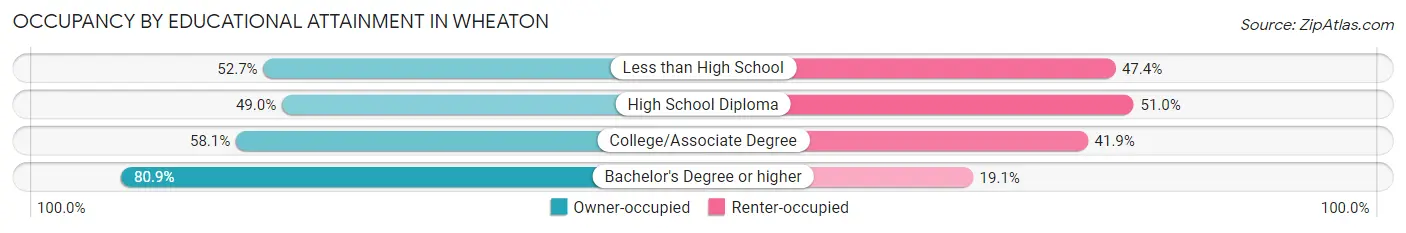
| Household Size | Owner-occupied | Renter-occupied |
| Less than High School | 268 (52.6%) | 241 (47.3%) |
| High School Diploma | 853 (49.0%) | 889 (51.0%) |
| College/Associate Degree | 2,394 (58.1%) | 1,728 (41.9%) |
| Bachelor's Degree or higher | 10,952 (80.9%) | 2,590 (19.1%) |
Occupancy by Age of Householder in Wheaton
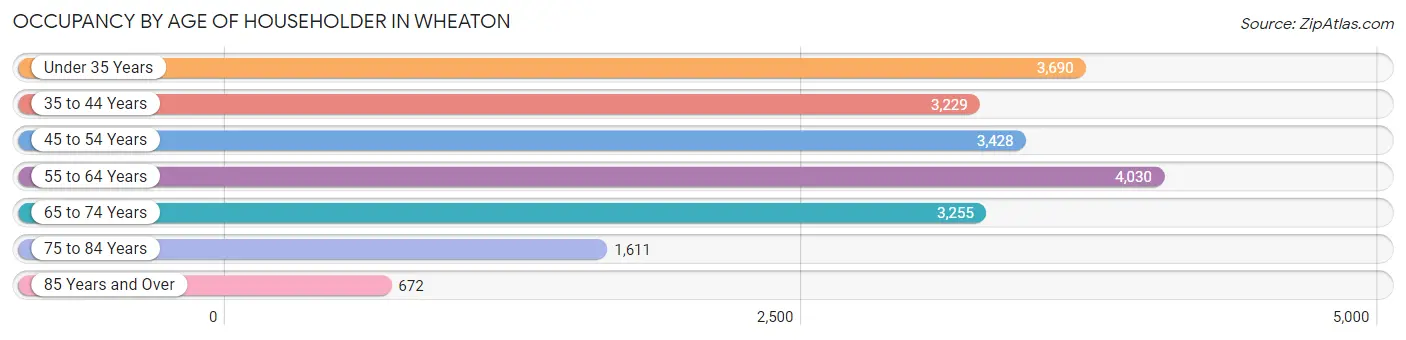
| Age Bracket | # Households | % Households |
| Under 35 Years | 3,690 | 18.5% |
| 35 to 44 Years | 3,229 | 16.2% |
| 45 to 54 Years | 3,428 | 17.2% |
| 55 to 64 Years | 4,030 | 20.2% |
| 65 to 74 Years | 3,255 | 16.3% |
| 75 to 84 Years | 1,611 | 8.1% |
| 85 Years and Over | 672 | 3.4% |
| Total | 19,915 | 100.0% |
Housing Finances in Wheaton
Median Income by Occupancy in Wheaton
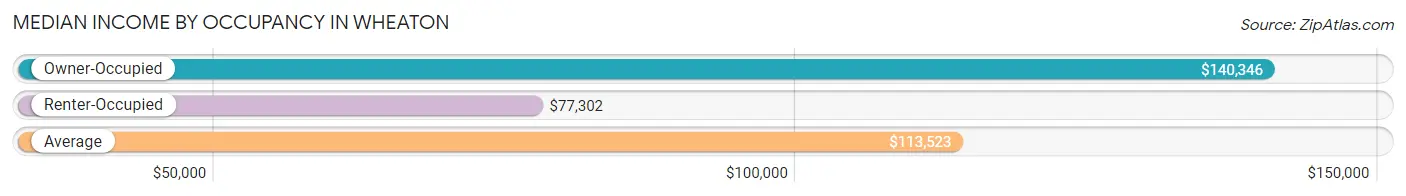
| Occupancy Type | # Households | Median Income |
| Owner-Occupied | 14,467 (72.6%) | $140,346 |
| Renter-Occupied | 5,448 (27.4%) | $77,302 |
| Average | 19,915 (100.0%) | $113,523 |
Occupancy by Householder Income Bracket in Wheaton
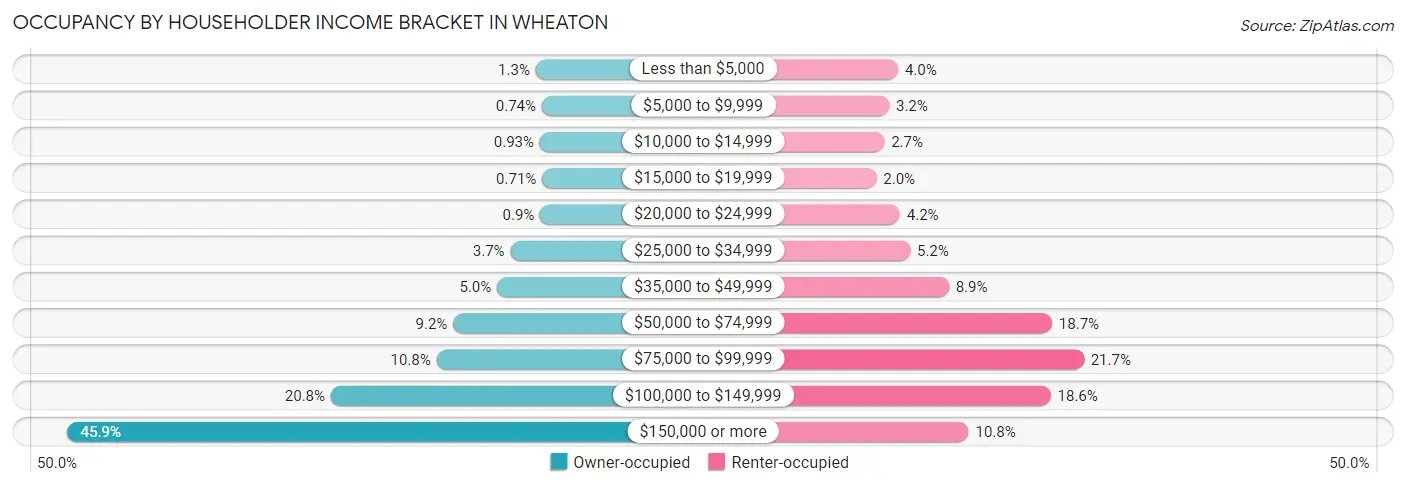
| Income Bracket | Owner-occupied | Renter-occupied |
| Less than $5,000 | 191 (1.3%) | 220 (4.0%) |
| $5,000 to $9,999 | 107 (0.7%) | 174 (3.2%) |
| $10,000 to $14,999 | 134 (0.9%) | 149 (2.7%) |
| $15,000 to $19,999 | 103 (0.7%) | 108 (2.0%) |
| $20,000 to $24,999 | 130 (0.9%) | 230 (4.2%) |
| $25,000 to $34,999 | 539 (3.7%) | 283 (5.2%) |
| $35,000 to $49,999 | 723 (5.0%) | 483 (8.9%) |
| $50,000 to $74,999 | 1,328 (9.2%) | 1,019 (18.7%) |
| $75,000 to $99,999 | 1,558 (10.8%) | 1,184 (21.7%) |
| $100,000 to $149,999 | 3,014 (20.8%) | 1,012 (18.6%) |
| $150,000 or more | 6,640 (45.9%) | 586 (10.8%) |
| Total | 14,467 (100.0%) | 5,448 (100.0%) |
Monthly Housing Cost Tiers in Wheaton
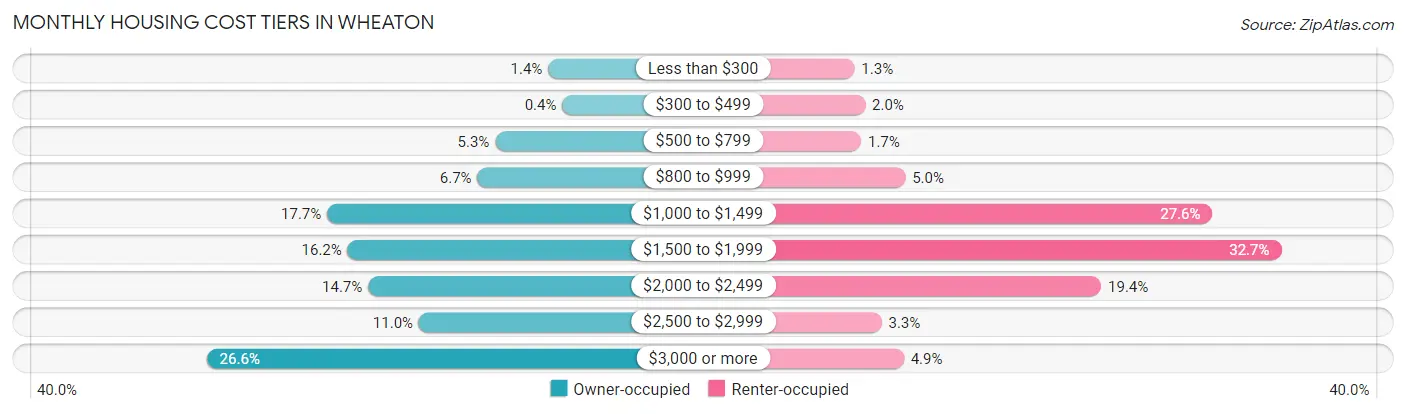
| Monthly Cost | Owner-occupied | Renter-occupied |
| Less than $300 | 208 (1.4%) | 68 (1.3%) |
| $300 to $499 | 58 (0.4%) | 111 (2.0%) |
| $500 to $799 | 772 (5.3%) | 95 (1.7%) |
| $800 to $999 | 962 (6.7%) | 272 (5.0%) |
| $1,000 to $1,499 | 2,564 (17.7%) | 1,504 (27.6%) |
| $1,500 to $1,999 | 2,345 (16.2%) | 1,781 (32.7%) |
| $2,000 to $2,499 | 2,126 (14.7%) | 1,058 (19.4%) |
| $2,500 to $2,999 | 1,585 (11.0%) | 177 (3.3%) |
| $3,000 or more | 3,847 (26.6%) | 266 (4.9%) |
| Total | 14,467 (100.0%) | 5,448 (100.0%) |
Physical Housing Characteristics in Wheaton
Housing Structures in Wheaton
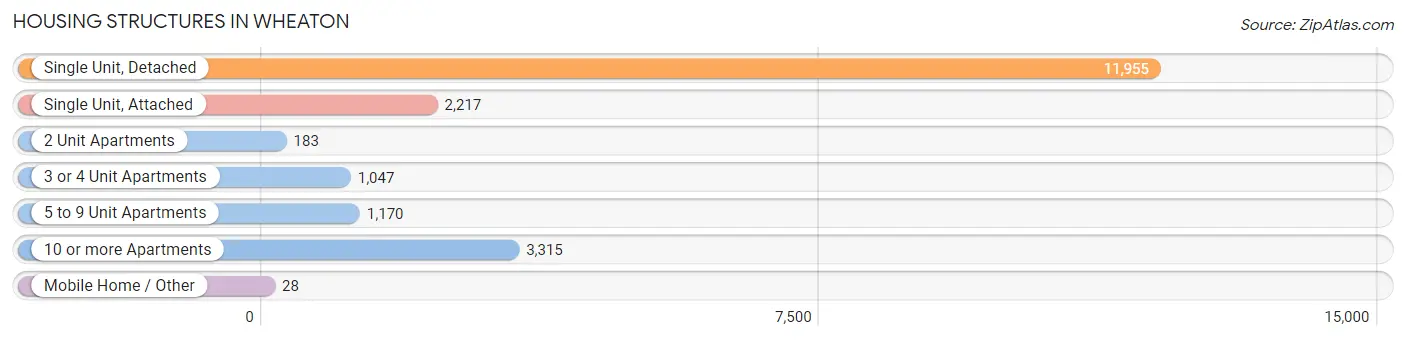
| Structure Type | # Housing Units | % Housing Units |
| Single Unit, Detached | 11,955 | 60.0% |
| Single Unit, Attached | 2,217 | 11.1% |
| 2 Unit Apartments | 183 | 0.9% |
| 3 or 4 Unit Apartments | 1,047 | 5.3% |
| 5 to 9 Unit Apartments | 1,170 | 5.9% |
| 10 or more Apartments | 3,315 | 16.7% |
| Mobile Home / Other | 28 | 0.1% |
| Total | 19,915 | 100.0% |
Housing Structures by Occupancy in Wheaton
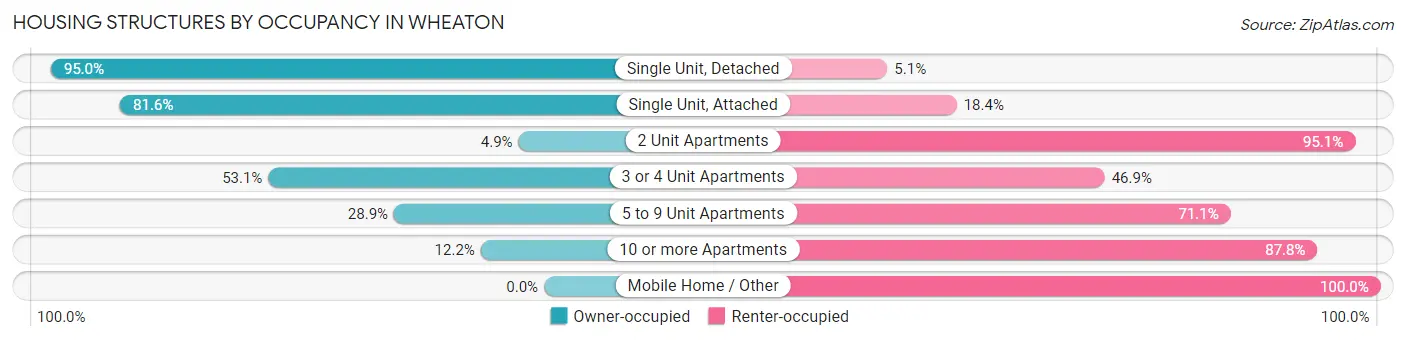
| Structure Type | Owner-occupied | Renter-occupied |
| Single Unit, Detached | 11,351 (95.0%) | 604 (5.1%) |
| Single Unit, Attached | 1,809 (81.6%) | 408 (18.4%) |
| 2 Unit Apartments | 9 (4.9%) | 174 (95.1%) |
| 3 or 4 Unit Apartments | 556 (53.1%) | 491 (46.9%) |
| 5 to 9 Unit Apartments | 338 (28.9%) | 832 (71.1%) |
| 10 or more Apartments | 404 (12.2%) | 2,911 (87.8%) |
| Mobile Home / Other | 0 (0.0%) | 28 (100.0%) |
| Total | 14,467 (72.6%) | 5,448 (27.4%) |
Housing Structures by Number of Rooms in Wheaton
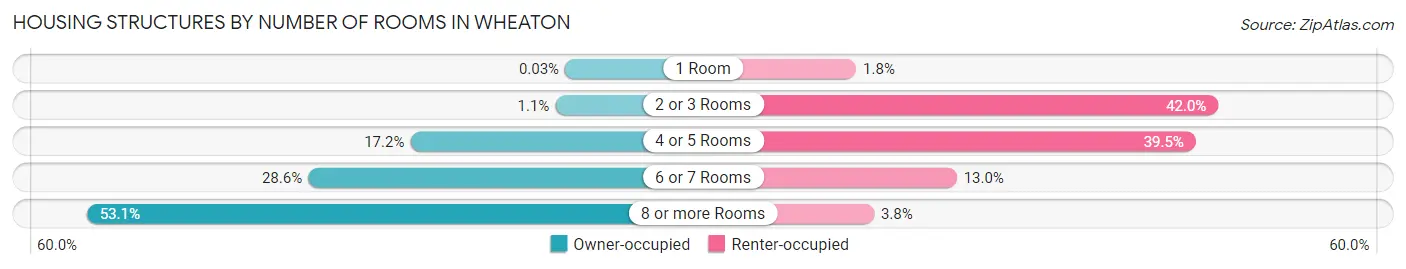
| Number of Rooms | Owner-occupied | Renter-occupied |
| 1 Room | 5 (0.0%) | 98 (1.8%) |
| 2 or 3 Rooms | 161 (1.1%) | 2,287 (42.0%) |
| 4 or 5 Rooms | 2,489 (17.2%) | 2,151 (39.5%) |
| 6 or 7 Rooms | 4,130 (28.5%) | 706 (13.0%) |
| 8 or more Rooms | 7,682 (53.1%) | 206 (3.8%) |
| Total | 14,467 (100.0%) | 5,448 (100.0%) |
Housing Structure by Heating Type in Wheaton
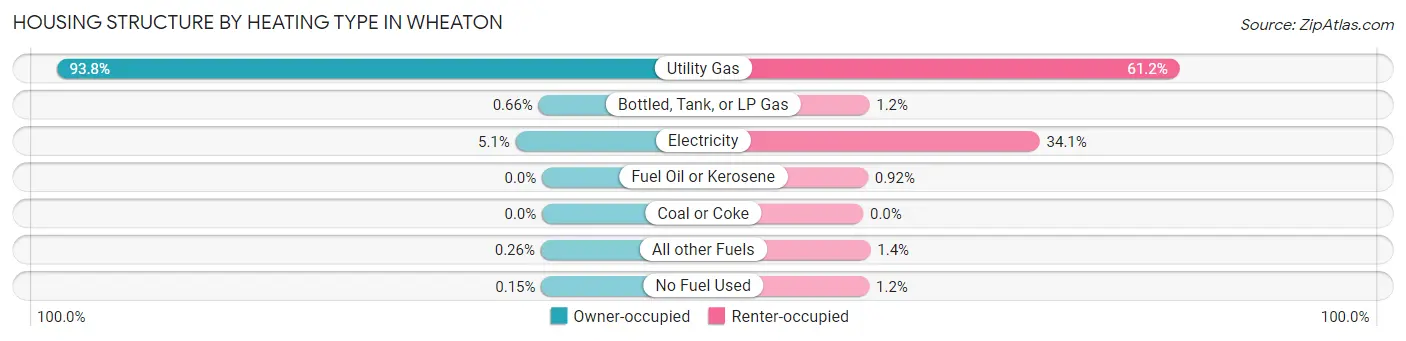
| Heating Type | Owner-occupied | Renter-occupied |
| Utility Gas | 13,572 (93.8%) | 3,332 (61.2%) |
| Bottled, Tank, or LP Gas | 96 (0.7%) | 66 (1.2%) |
| Electricity | 740 (5.1%) | 1,859 (34.1%) |
| Fuel Oil or Kerosene | 0 (0.0%) | 50 (0.9%) |
| Coal or Coke | 0 (0.0%) | 0 (0.0%) |
| All other Fuels | 38 (0.3%) | 77 (1.4%) |
| No Fuel Used | 21 (0.2%) | 64 (1.2%) |
| Total | 14,467 (100.0%) | 5,448 (100.0%) |
Household Vehicle Usage in Wheaton
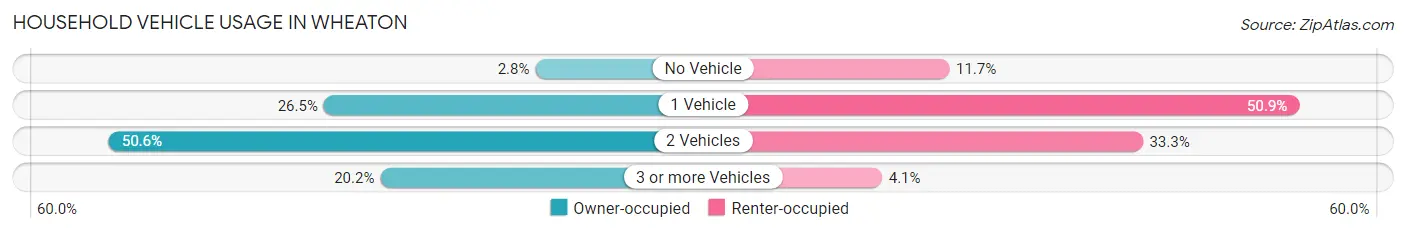
| Vehicles per Household | Owner-occupied | Renter-occupied |
| No Vehicle | 404 (2.8%) | 635 (11.7%) |
| 1 Vehicle | 3,833 (26.5%) | 2,772 (50.9%) |
| 2 Vehicles | 7,314 (50.6%) | 1,816 (33.3%) |
| 3 or more Vehicles | 2,916 (20.2%) | 225 (4.1%) |
| Total | 14,467 (100.0%) | 5,448 (100.0%) |
Real Estate & Mortgages in Wheaton
Real Estate and Mortgage Overview in Wheaton
| Characteristic | Without Mortgage | With Mortgage |
| Housing Units | 4,684 | 9,783 |
| Median Property Value | $393,400 | $446,500 |
| Median Household Income | $107,065 | $5,043 |
| Monthly Housing Costs | $1,091 | $3,803 |
| Real Estate Taxes | $8,628 | $51 |
Property Value by Mortgage Status in Wheaton
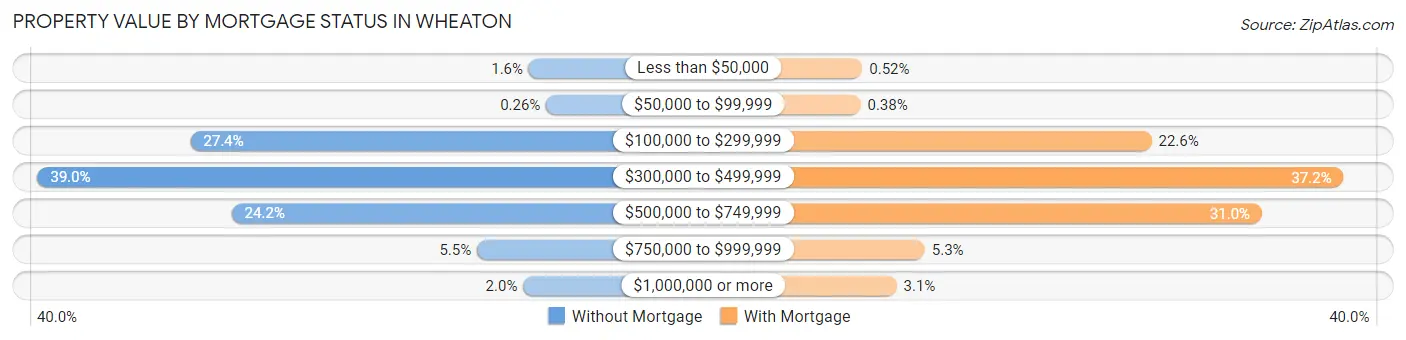
| Property Value | Without Mortgage | With Mortgage |
| Less than $50,000 | 74 (1.6%) | 51 (0.5%) |
| $50,000 to $99,999 | 12 (0.3%) | 37 (0.4%) |
| $100,000 to $299,999 | 1,282 (27.4%) | 2,206 (22.6%) |
| $300,000 to $499,999 | 1,828 (39.0%) | 3,637 (37.2%) |
| $500,000 to $749,999 | 1,135 (24.2%) | 3,029 (31.0%) |
| $750,000 to $999,999 | 259 (5.5%) | 517 (5.3%) |
| $1,000,000 or more | 94 (2.0%) | 306 (3.1%) |
| Total | 4,684 (100.0%) | 9,783 (100.0%) |
Household Income by Mortgage Status in Wheaton
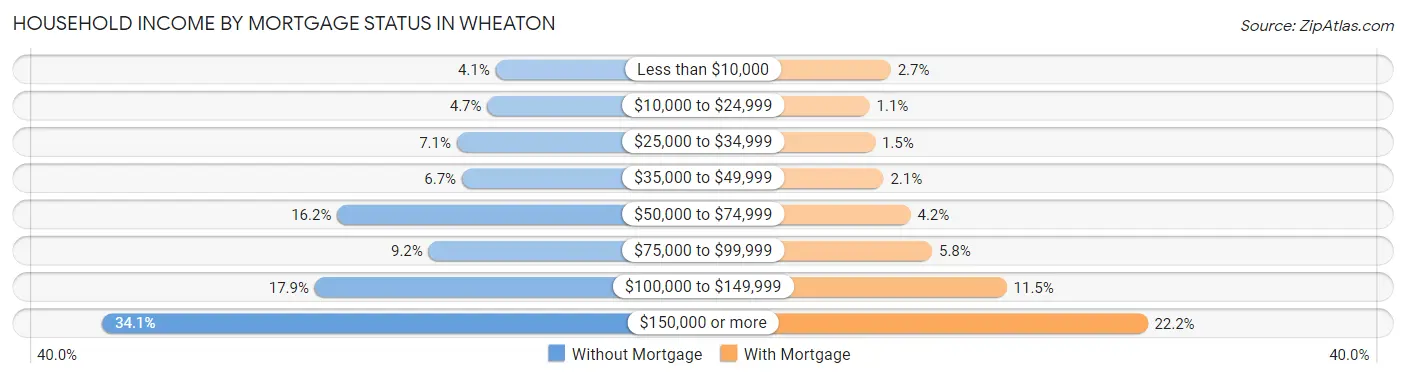
| Household Income | Without Mortgage | With Mortgage |
| Less than $10,000 | 193 (4.1%) | 262 (2.7%) |
| $10,000 to $24,999 | 222 (4.7%) | 105 (1.1%) |
| $25,000 to $34,999 | 331 (7.1%) | 145 (1.5%) |
| $35,000 to $49,999 | 313 (6.7%) | 208 (2.1%) |
| $50,000 to $74,999 | 758 (16.2%) | 410 (4.2%) |
| $75,000 to $99,999 | 432 (9.2%) | 570 (5.8%) |
| $100,000 to $149,999 | 838 (17.9%) | 1,126 (11.5%) |
| $150,000 or more | 1,597 (34.1%) | 2,176 (22.2%) |
| Total | 4,684 (100.0%) | 9,783 (100.0%) |
Property Value to Household Income Ratio in Wheaton
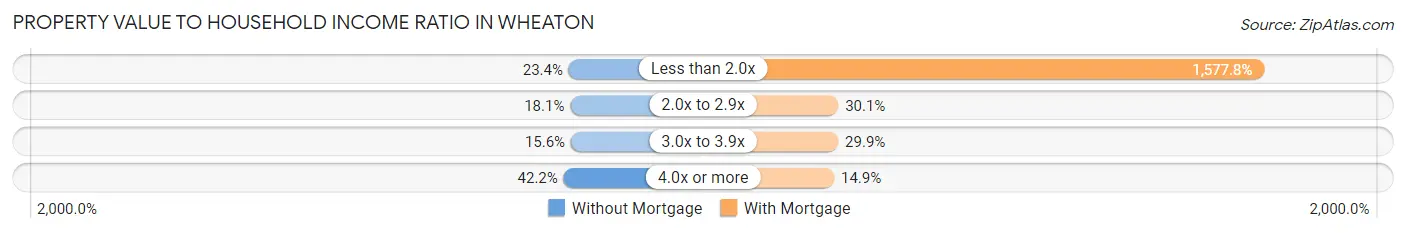
| Value-to-Income Ratio | Without Mortgage | With Mortgage |
| Less than 2.0x | 1,095 (23.4%) | 154,354 (1,577.8%) |
| 2.0x to 2.9x | 849 (18.1%) | 2,949 (30.1%) |
| 3.0x to 3.9x | 729 (15.6%) | 2,925 (29.9%) |
| 4.0x or more | 1,977 (42.2%) | 1,458 (14.9%) |
| Total | 4,684 (100.0%) | 9,783 (100.0%) |
Real Estate Taxes by Mortgage Status in Wheaton
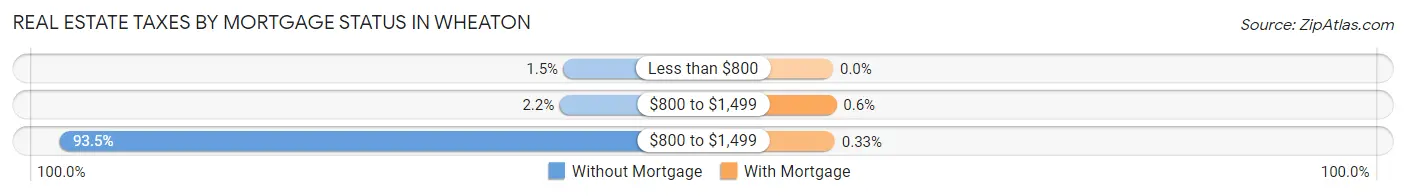
| Property Taxes | Without Mortgage | With Mortgage |
| Less than $800 | 70 (1.5%) | 0 (0.0%) |
| $800 to $1,499 | 103 (2.2%) | 59 (0.6%) |
| $800 to $1,499 | 4,381 (93.5%) | 32 (0.3%) |
| Total | 4,684 (100.0%) | 9,783 (100.0%) |
Health & Disability in Wheaton
Health Insurance Coverage by Age in Wheaton

| Age Bracket | With Coverage | Without Coverage |
| Under 6 Years | 3,716 (99.1%) | 34 (0.9%) |
| 6 to 18 Years | 9,146 (98.4%) | 151 (1.6%) |
| 19 to 25 Years | 5,728 (96.0%) | 238 (4.0%) |
| 26 to 34 Years | 5,600 (94.3%) | 338 (5.7%) |
| 35 to 44 Years | 6,209 (98.5%) | 95 (1.5%) |
| 45 to 54 Years | 5,995 (97.9%) | 131 (2.1%) |
| 55 to 64 Years | 6,833 (98.1%) | 134 (1.9%) |
| 65 to 74 Years | 5,251 (99.4%) | 34 (0.6%) |
| 75 Years and older | 3,167 (99.8%) | 6 (0.2%) |
| Total | 51,645 (97.8%) | 1,161 (2.2%) |
Health Insurance Coverage by Citizenship Status in Wheaton
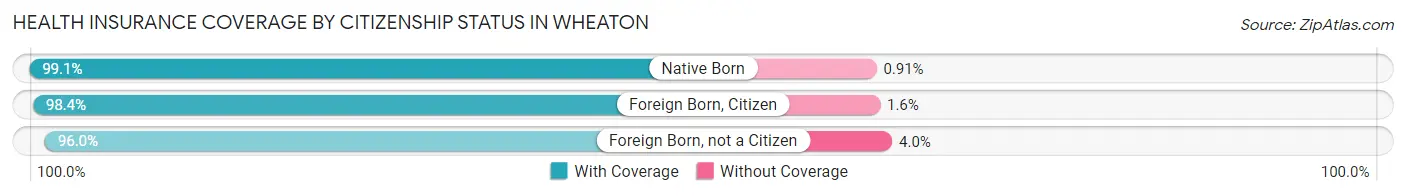
| Citizenship Status | With Coverage | Without Coverage |
| Native Born | 3,716 (99.1%) | 34 (0.9%) |
| Foreign Born, Citizen | 9,146 (98.4%) | 151 (1.6%) |
| Foreign Born, not a Citizen | 5,728 (96.0%) | 238 (4.0%) |
Health Insurance Coverage by Household Income in Wheaton
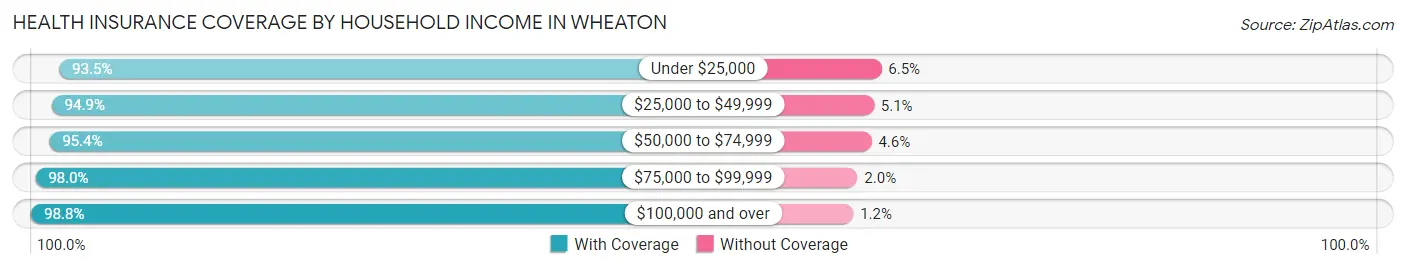
| Household Income | With Coverage | Without Coverage |
| Under $25,000 | 2,226 (93.5%) | 154 (6.5%) |
| $25,000 to $49,999 | 3,560 (94.9%) | 190 (5.1%) |
| $50,000 to $74,999 | 4,504 (95.4%) | 218 (4.6%) |
| $75,000 to $99,999 | 5,950 (98.0%) | 121 (2.0%) |
| $100,000 and over | 33,177 (98.8%) | 408 (1.2%) |
Public vs Private Health Insurance Coverage by Age in Wheaton
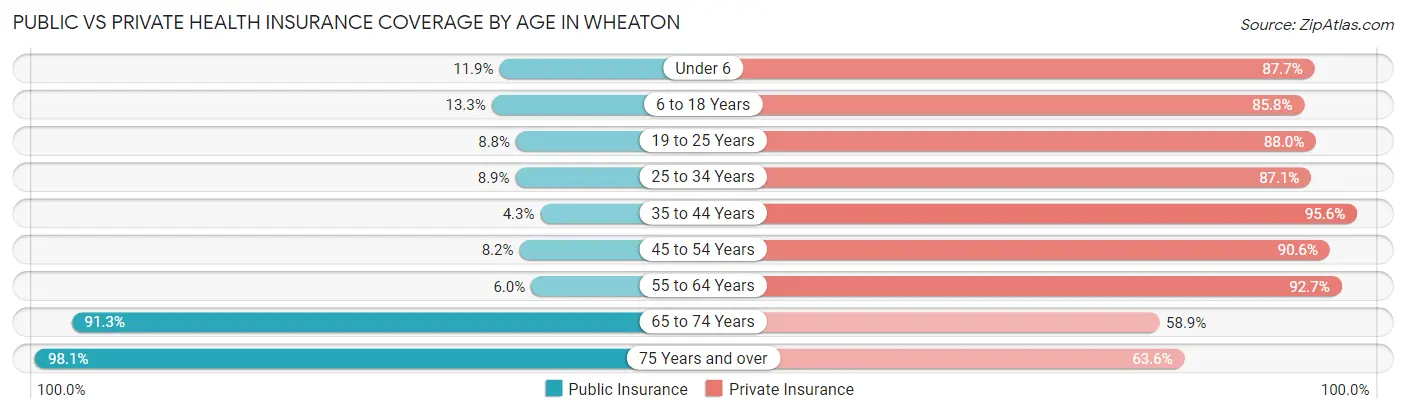
| Age Bracket | Public Insurance | Private Insurance |
| Under 6 | 446 (11.9%) | 3,290 (87.7%) |
| 6 to 18 Years | 1,239 (13.3%) | 7,981 (85.8%) |
| 19 to 25 Years | 526 (8.8%) | 5,252 (88.0%) |
| 25 to 34 Years | 529 (8.9%) | 5,173 (87.1%) |
| 35 to 44 Years | 270 (4.3%) | 6,028 (95.6%) |
| 45 to 54 Years | 501 (8.2%) | 5,549 (90.6%) |
| 55 to 64 Years | 418 (6.0%) | 6,461 (92.7%) |
| 65 to 74 Years | 4,824 (91.3%) | 3,113 (58.9%) |
| 75 Years and over | 3,111 (98.1%) | 2,018 (63.6%) |
| Total | 11,864 (22.5%) | 44,865 (85.0%) |
Disability Status by Sex by Age in Wheaton
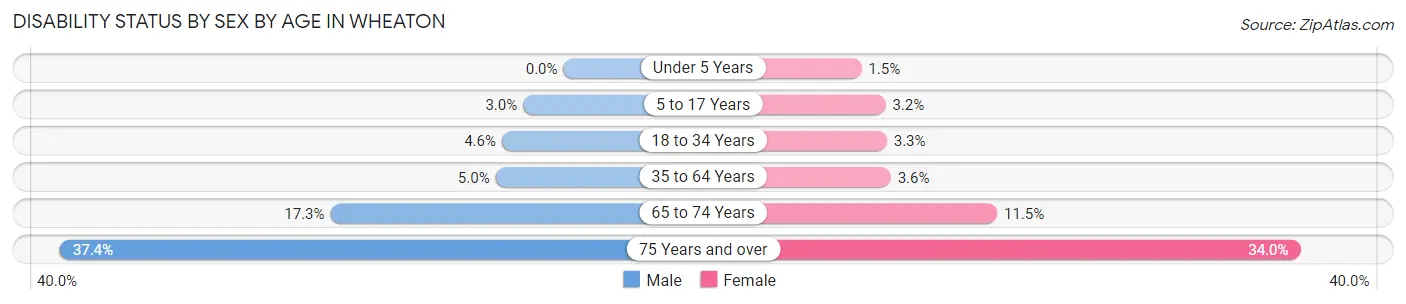
| Age Bracket | Male | Female |
| Under 5 Years | 0 (0.0%) | 22 (1.5%) |
| 5 to 17 Years | 144 (3.0%) | 130 (3.2%) |
| 18 to 34 Years | 289 (4.6%) | 220 (3.3%) |
| 35 to 64 Years | 476 (5.0%) | 361 (3.6%) |
| 65 to 74 Years | 440 (17.3%) | 316 (11.5%) |
| 75 Years and over | 446 (37.4%) | 674 (34.0%) |
Disability Class by Sex by Age in Wheaton
Disability Class: Hearing Difficulty
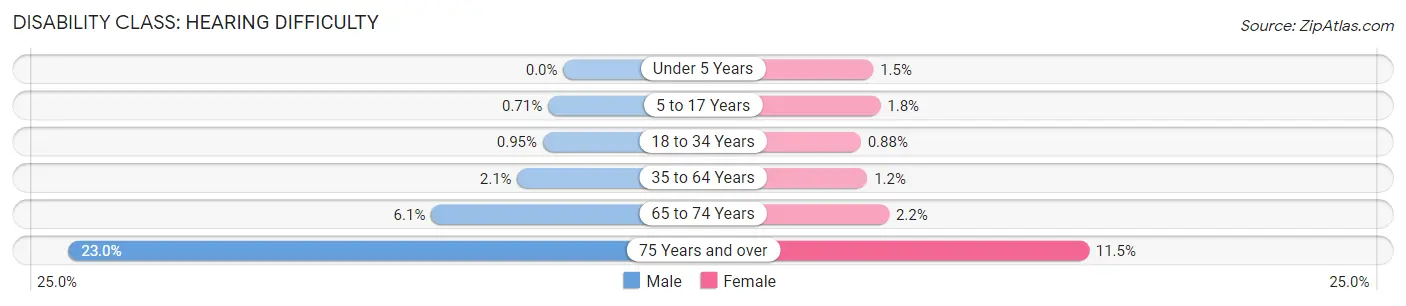
| Age Bracket | Male | Female |
| Under 5 Years | 0 (0.0%) | 22 (1.5%) |
| 5 to 17 Years | 34 (0.7%) | 72 (1.8%) |
| 18 to 34 Years | 60 (0.9%) | 58 (0.9%) |
| 35 to 64 Years | 201 (2.1%) | 117 (1.2%) |
| 65 to 74 Years | 156 (6.1%) | 60 (2.2%) |
| 75 Years and over | 274 (23.0%) | 227 (11.5%) |
Disability Class: Vision Difficulty
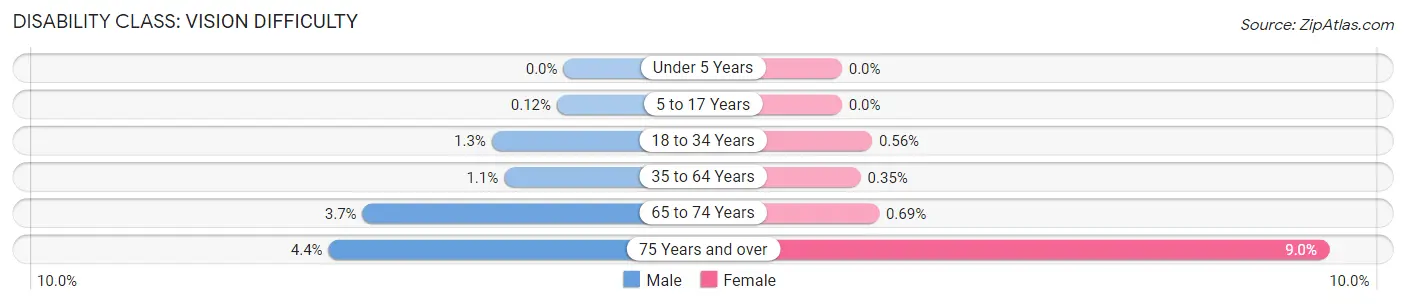
| Age Bracket | Male | Female |
| Under 5 Years | 0 (0.0%) | 0 (0.0%) |
| 5 to 17 Years | 6 (0.1%) | 0 (0.0%) |
| 18 to 34 Years | 84 (1.3%) | 37 (0.6%) |
| 35 to 64 Years | 104 (1.1%) | 35 (0.4%) |
| 65 to 74 Years | 95 (3.7%) | 19 (0.7%) |
| 75 Years and over | 52 (4.4%) | 179 (9.0%) |
Disability Class: Cognitive Difficulty
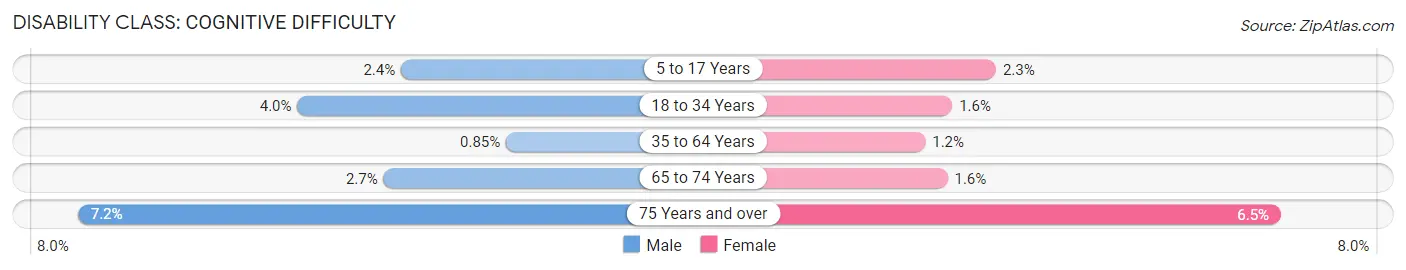
| Age Bracket | Male | Female |
| 5 to 17 Years | 116 (2.4%) | 92 (2.3%) |
| 18 to 34 Years | 250 (4.0%) | 108 (1.6%) |
| 35 to 64 Years | 80 (0.9%) | 123 (1.2%) |
| 65 to 74 Years | 68 (2.7%) | 43 (1.6%) |
| 75 Years and over | 86 (7.2%) | 129 (6.5%) |
Disability Class: Ambulatory Difficulty
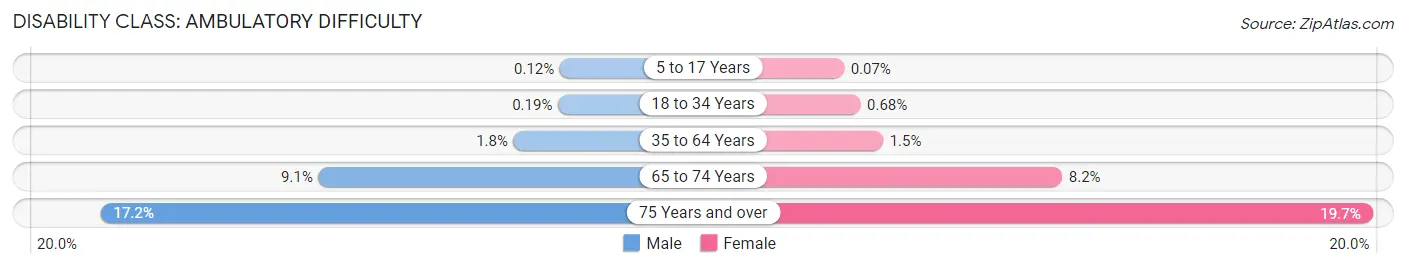
| Age Bracket | Male | Female |
| 5 to 17 Years | 6 (0.1%) | 3 (0.1%) |
| 18 to 34 Years | 12 (0.2%) | 45 (0.7%) |
| 35 to 64 Years | 174 (1.8%) | 151 (1.5%) |
| 65 to 74 Years | 231 (9.1%) | 224 (8.2%) |
| 75 Years and over | 205 (17.2%) | 390 (19.7%) |
Disability Class: Self-Care Difficulty
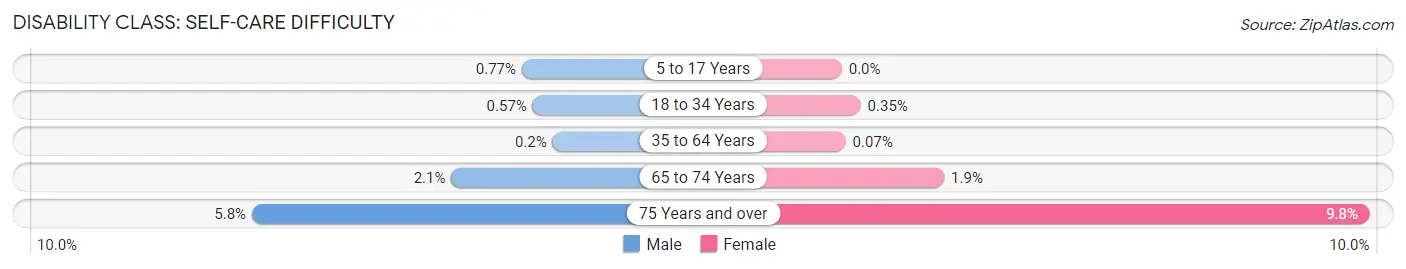
| Age Bracket | Male | Female |
| 5 to 17 Years | 37 (0.8%) | 0 (0.0%) |
| 18 to 34 Years | 36 (0.6%) | 23 (0.4%) |
| 35 to 64 Years | 19 (0.2%) | 7 (0.1%) |
| 65 to 74 Years | 53 (2.1%) | 52 (1.9%) |
| 75 Years and over | 69 (5.8%) | 194 (9.8%) |
Technology Access in Wheaton
Computing Device Access in Wheaton
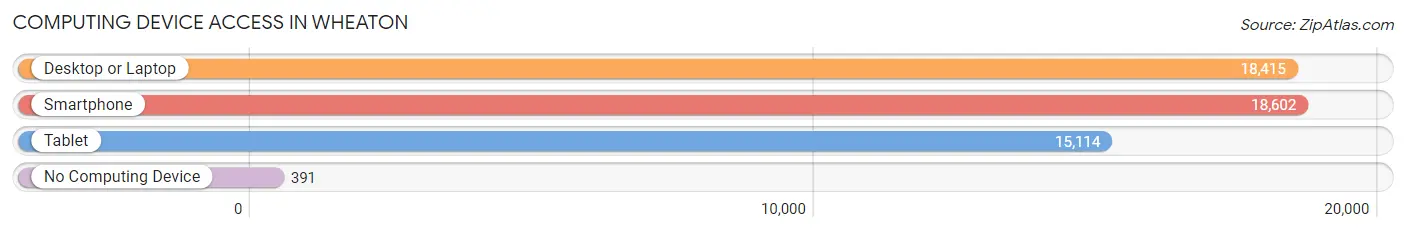
| Device Type | # Households | % Households |
| Desktop or Laptop | 18,415 | 92.5% |
| Smartphone | 18,602 | 93.4% |
| Tablet | 15,114 | 75.9% |
| No Computing Device | 391 | 2.0% |
| Total | 19,915 | 100.0% |
Internet Access in Wheaton
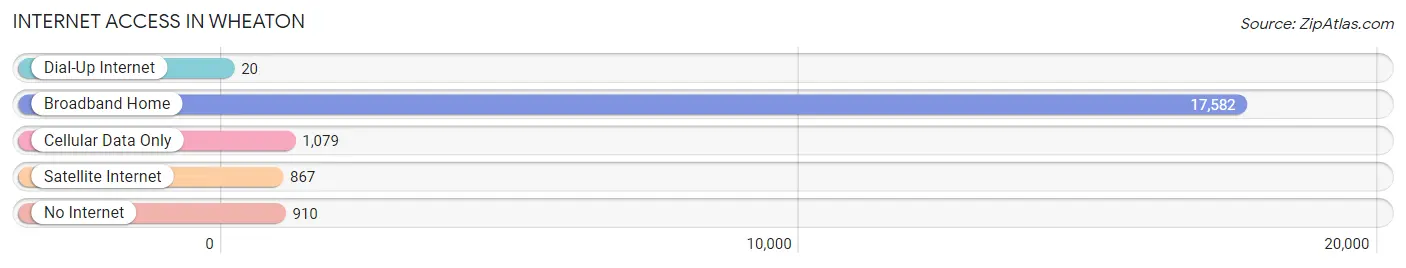
| Internet Type | # Households | % Households |
| Dial-Up Internet | 20 | 0.1% |
| Broadband Home | 17,582 | 88.3% |
| Cellular Data Only | 1,079 | 5.4% |
| Satellite Internet | 867 | 4.3% |
| No Internet | 910 | 4.6% |
| Total | 19,915 | 100.0% |
Wheaton Summary
History
Wheaton, Illinois is a city located in DuPage County, approximately 25 miles west of Chicago. It is a part of the Chicago metropolitan area and is home to a population of over 53,000 people. The city was first settled in 1837 by Erastus Gary, a pioneer from New York. Gary purchased a large tract of land in the area and began to develop it for farming. He named the area after his hometown of Wheaton, New York.
The city of Wheaton was officially incorporated in 1859. During the late 19th century, the city experienced a period of rapid growth and development. The Chicago & Northwestern Railroad arrived in 1864, connecting the city to Chicago and other nearby towns. This allowed for the growth of industry and commerce in the area. The city also became a popular destination for wealthy Chicagoans looking to escape the hustle and bustle of the city.
In the early 20th century, Wheaton continued to grow and develop. The city was home to a number of prominent businesses, including the Wheaton Glass Company, which produced glassware for the home. The city also became a popular destination for tourists, who were drawn to its picturesque downtown area and its many parks and recreational areas.
Geography
Wheaton is located in DuPage County, approximately 25 miles west of Chicago. The city is situated on the western edge of the Chicago metropolitan area. It is bordered by the cities of Carol Stream, Winfield, Warrenville, and West Chicago. The city is located on the DuPage River, which flows through the city from north to south.
The city has a total area of 8.7 square miles, of which 8.3 square miles is land and 0.4 square miles is water. The city is located at an elevation of 645 feet above sea level. The climate in Wheaton is classified as humid continental, with hot, humid summers and cold, snowy winters.
Economy
Wheaton is a major economic center in the Chicago metropolitan area. The city is home to a number of large corporations, including the Wheaton Glass Company, which produces glassware for the home. Other major employers in the city include the Wheaton College, the Wheaton Public Library, and the Wheaton Park District.
The city is also home to a number of retail and dining establishments, as well as a number of small businesses. The city is served by two major highways, Interstate 88 and Interstate 355, which provide access to the city and the surrounding area.
Demographics
As of the 2010 census, the population of Wheaton was 53,469. The racial makeup of the city was 79.2% White, 8.2% African American, 0.3% Native American, 6.2% Asian, and 4.7% from other races. Hispanic or Latino of any race were 11.7% of the population.
The median household income in Wheaton was $76,837, and the median family income was $93,837. The per capita income in the city was $37,945. About 5.2% of families and 7.3% of the population were below the poverty line.
Wheaton is served by two school districts, Wheaton Warrenville Community Unit School District 200 and Community Unit School District 200. The city is also home to Wheaton College, a private liberal arts college.
Common Questions
What is Per Capita Income in Wheaton?
Per Capita income in Wheaton is $59,538.
What is the Median Family Income in Wheaton?
Median Family Income in Wheaton is $144,982.
What is the Median Household income in Wheaton?
Median Household Income in Wheaton is $113,523.
What is Income or Wage Gap in Wheaton?
Income or Wage Gap in Wheaton is 42.8%.
Women in Wheaton earn 57.2 cents for every dollar earned by a man.
What is Family Income Deficit in Wheaton?
Family Income Deficit in Wheaton is $12,546.
Families that are below poverty line in Wheaton earn $12,546 less on average than the poverty threshold level.
What is Inequality or Gini Index in Wheaton?
Inequality or Gini Index in Wheaton is 0.45.
What is the Total Population of Wheaton?
Total Population of Wheaton is 53,673.
What is the Total Male Population of Wheaton?
Total Male Population of Wheaton is 26,422.
What is the Total Female Population of Wheaton?
Total Female Population of Wheaton is 27,251.
What is the Ratio of Males per 100 Females in Wheaton?
There are 96.96 Males per 100 Females in Wheaton.
What is the Ratio of Females per 100 Males in Wheaton?
There are 103.14 Females per 100 Males in Wheaton.
What is the Median Population Age in Wheaton?
Median Population Age in Wheaton is 37.4 Years.
What is the Average Family Size in Wheaton
Average Family Size in Wheaton is 3.2 People.
What is the Average Household Size in Wheaton
Average Household Size in Wheaton is 2.5 People.
How Large is the Labor Force in Wheaton?
There are 27,975 People in the Labor Forcein in Wheaton.
What is the Percentage of People in the Labor Force in Wheaton?
64.8% of People are in the Labor Force in Wheaton.
What is the Unemployment Rate in Wheaton?
Unemployment Rate in Wheaton is 3.5%.